Embed Size (px)
Citation preview
1 23
Journal of Ornithology ISSN 0021-8375 J OrnitholDOI 10.1007/s10336-011-0803-1
Breeding land birds across the Greekislands: a biogeographic study withemphasis on faunal similarity, species–arearelationships and nestedness
Stylianos Michail Simaiakis, MichailDretakis, Christos Barboutis, ThanosKatritis, Danae Portolou & StavrosXirouchakis

1 23
Your article is protected by copyright
and all rights are held exclusively by Dt.
Ornithologen-Gesellschaft e.V.. This e-offprint
is for personal use only and shall not be self-
archived in electronic repositories. If you
wish to self-archive your work, please use the
accepted author’s version for posting to your
own website or your institution’s repository.
You may further deposit the accepted author’s
version on a funder’s repository at a funder’s
request, provided it is not made publicly
available until 12 months after publication.
ORIGINAL ARTICLE
Breeding land birds across the Greek islands: a biogeographicstudy with emphasis on faunal similarity, species–arearelationships and nestedness
Stylianos Michail Simaiakis • Michail Dretakis •
Christos Barboutis • Thanos Katritis •
Danae Portolou • Stavros Xirouchakis
Received: 8 June 2011 / Revised: 28 October 2011 / Accepted: 16 December 2011
� Dt. Ornithologen-Gesellschaft e.V. 2012
Abstract We investigated the biogeography of 102
breeding land bird species reported on 77 islands in the
Aegean archipelago. For the first time, we prepared a
complete as possible dataset concerning the land birds of
the Aegean islands. The overall insular avifauna has been
treated as a unit to find out certain ecological patterns. We
examined the faunal similarity using recent distribution
data, studied the species–area relationships (SARs) and
tested land bird biotas for nested patterns. A significant
SAR was identified for land bird species richness of the
Aegean islands and for most of the island subdivisions. The
surface area of the available Aegean islands explained 79%
of the variance in species richness and the overall z value
was 0.305, in general suggesting a high degree of island
isolation. The z values of the log–log species–area
regression varied significantly among island groups and
ranged between 0.100 and 0.329. We found that the overall
slope of the species–area curve was steeper than those of
terrestrial invertebrates (i.e., centipedes, darkling beetles).
The land bird fauna on the Aegean islands was nested,
whereas Crete and its satellite islands was the least-nested
island group. Insectivores and seedeaters contributed dif-
ferently to land bird assemblages with the former showing
a more reliable nested arrangement than the latter. In most
cases, the rank of breeding bird species, as determined by
the nestedness metric, was negatively correlated with
island area and/or maximum altitude.
Keywords Aegean archipelago � Crete � Insectivores �Nested assemblages � Seedeaters � Singletons
Zusammenfassung
Brutende Landvogel auf den griechischen Inseln: eine
biogeografische Studie mit Schwerpunkten auf Fau-
nenahnlichkeit, Arten-Areal-Beziehungen und gehauf-
tem Auftreten
Wir haben die Biogeografie von 102 Landvogelarten
untersucht, die auf 77 Inseln des agaischen Archipels
nachgewiesen wurden. Zum ersten Mal haben wir ein
moglichst vollstandiges Inventar der Landvogel der agai-
schen Inseln erstellt. Die Gesamt-Avifauna aller Inseln
zusammen war als eine Einheit betrachtet worden, um
bestimmte okologische Muster zu finden. Wir untersuchten
die Faunenahnlichkeit unter Verwendung aktueller
Verbreitungsdaten sowie die Arten-Areal-Beziehungen
(AAB) und testeten Landvogelgemeinschaften auf Kon-
zentrationen in ihren Auftretungsmustern. Sowohl fur den
Communicated by T. Gottschalk.
Electronic supplementary material The online version of thisarticle (doi:10.1007/s10336-011-0803-1) contains supplementarymaterial, which is available to authorized users.
S. M. Simaiakis (&) � M. Dretakis � C. Barboutis �S. Xirouchakis
Natural History Museum of Crete, University of Crete,
Knossos Av., P.O. Box 2208, 714 09 Heraklion, Crete, Greece
e-mail: [email protected]
Present Address:S. M. Simaiakis
Natural History Museum of Crete, University of Crete,
Knossos Av., P.O. Box 2208, 714 09 Heraklion, Crete, Greece
S. M. Simaiakis
Department of Biological Sciences, University of Cyprus,
New Campus, P.O. Box 20537, 1678 Nicosia, Cyprus
T. Katritis � D. Portolou
Hellenic Ornithological Society, Kastritsiou 8,
546 23 Thessaloniki, Greece
123
J Ornithol
DOI 10.1007/s10336-011-0803-1
Author's personal copy
Landvogelartenreichtum der Agaischen Inseln insgesamt,
als auch fur den der meisten Insel-Untergruppen konnten
signifikante AAB identifiziert werden. 79% der Varianz im
Artenreichtum wurde uber die Oberflache der verfugbaren
Agaisinseln erklart und der Gesamt-z-Wert lag bei 0.305,
was generell einen hohen Isolationsgrad der Inseln nahe-
legt. Die z-Werte der doppelt logarithmischen Arten-Areal-
Regression variierten signifikant uber die Inselgruppen und
reichten von 0.100 bis 0.329. Wir fanden heraus, dass die
Steigung der Arten-Areal-Kurve steiler war, als die terrest-
rischer Evertebraten (d.h. Tausendfusser, Schwarzkafer).
Die Landvogelfauna der agaischen Inseln zeigte Konzent-
rationen im Auftreten, wahrend Kreta und seine Satelliten-
inseln die Inselgruppe mit der geringsten Konzentrierung
war. Insektivore und granivore Vogelarten trugen
unterschiedlich zu den Landvogelgemeinschaften bei,
wobei erstere verlasslicher ein Konzentration in ihrem
Auftreten zeigten als letztere. In den meisten Fallen war
der Rang an Brutvogelarten, bestimmt durch das Maß der
Konzentrierung, negativ mit der Inselflache und/oder der
Maximalhohe uber Null korreliert.
Introduction
The Mediterranean basin shows a wide range of habitats
(e.g., maquis and phrygana formations) determined by
climatic features and modified by human activities
(Margaris 1981; Rackham and Moody 1997; Blondel and
Aronson 1999). Palaeogeographic events contributed to the
progressive fragmentation of coastal landscapes of Greece
(Dermitzakis and Papanikolaou 1981; Anastasakis and
Dermitzakis 1990; Dermitzakis 1990) into the present-day
landbridge islands of the Aegean archipelago. Researchers
have shown that the species communities on the Aegean
islands have been shaped not only by the geotectonic his-
tory of the area (e.g., Beerli et al. 1996; Douris et al. 1998;
Trichas et al. 2008) but also through more recent eustatic
sea level changes (e.g., Bittkau and Comes 2005). More-
over, humans have modified the natural ecosystems
resulting in increased fragmentation of habitats.
The Aegean archipelago is characterized by high envi-
ronmental and topographical heterogeneity (Dafis et al.
1996; Blondel et al. 2010), long-term isolation of many
islands (Triantis et al. 2008), high levels of species diver-
sity, high percentage of endemism (Sfenthourakis and
Legakis 2001), and a complex geological and geographic
history (Anastasakis and Dermitzakis 1990). It comprises
floral and faunal species with different biogeographic
affinities originating from Asia, Europe, and Africa
(Triantis et al. 2008). Numerous biogeographic studies on
vertebrate and invertebrate terrestrial taxa (Foufopoulos
and Ives 1999; Sfenthourakis et al. 1999; Dennis et al.
2000; Parmakelis et al. 2006; Triantis et al. 2008) have
contributed significantly to the investigation of the evolu-
tionary history of the area. However, there are many dis-
crepancies among them due to taxon-orientated biological
attributes (see Parmakelis et al. 2006). Consequently, more
thorough studies are needed for a number of unexplored
taxonomic groups (e.g., land birds), and that makes the
Aegean archipelago an excellent geographic region for
studying biogeographic patterns.
Despite the high ornithological value (i.e., numerous
islands, heterogeneity of habitats, idiosyncratic island his-
tories) of the Mediterranean basin (Covas and Blondel
1998), studies of avian ecology in the region generally, and
Greece especially, are relatively few (e.g., Sgardelis and
Margaris 1992; Katsimanis et al. 2006) when compared to
studies of other taxa and their distribution (Sfenthourakis
1996; Panitsa et al. 2006). Nevertheless, Watson (1964),
based on three scientific excursions from 1954 to 1961,
presented a monograph on the distribution, habitat prefer-
ences, and systematics of the land birds of the Aegean
archipelago and discussed the effects of area, habitat
diversity, and geological history on bird assemblages. He
also attempted to enrich the knowledge of breeding passe-
rines in the Aegean islands, to determine the origin of the
avifauna, and to detect factors that influence passerine
distribution. Although Watson (1964) included a large
number of islands in his dissertation, breeding passerines
were occasionally not determined precisely due to scattered
visits on many islands over a long period of time. Moreover,
the total insular avifauna was not treated as a unit or as part
of smaller island subsets (e.g., the Cyclades island group),
small islands (less than 5 km2) were excluded from species–
area relationship (SAR) analyses, and most islets lying off
the coast of large islands were not studied, underestimating
the species richness of the region (e.g., Crete).
This research aimed to improve our understanding of the
biogeography of the Aegean islands by focusing on the
patterns or mechanisms that underlie land bird species
distributions. We selected breeding land birds because (1)
the majority of species have similar ecological require-
ments, (2) many species are quite philopatric and are related
to particular island sites for breeding (Watson 1964), (3)
species mostly depend on the islands for feeding, and (4)
due to their small size, most species have relatively low
dispersal ability. Therefore, breeding land birds are a group
of great interest in biogeography.
This is the first time that we have indexed a large dataset
of land birds coming from numerous scientific sources (e.g.,
the recent catalogue of the Hellenic Ornithological Society,
see ‘‘Methods’’). Furthermore, the total insular avifauna has
been treated as a unit in order to correct previous scientific
inconsistencies and reveal patterns that land birds present in
J Ornithol
123
Author's personal copy
this area. To address this challenge, we used modern
methodological approaches (for further details, see
‘‘Methods’’), and we tried to answer three critical issues in
relevance to biogeographic theory and community ecology.
1. We wanted to know if the land bird fauna shows
biogeographic relationships relevant to the geological
history of the Aegean archipelago. To achieve this
goal, we investigated the faunal similarity within and
between island groups, and we explained clusters of
islands with respect to the geography and the palae-
ogeography of the Aegean region (for further discus-
sion, see Dermitzakis and Papanikolaou 1981;
Dermitzakis 1990; Anastasakis and Dermitzakis 1990).
2. There are currently many candidate models to describe
the species–area relationship (Tjørve 2009 for review).
We used the logarithmically transformed equation of
the power model S = c Az (see Arrhenius 1921), where
S is the number of species, A is the surface area (km2),
and z and c are model parameters. The power model,
proposed by Arrhenius (1921), is the most frequently
applied, mainly due to the fact that it consists of
parameters with biological meaning (see Brown and
Lomolino 1998). Parameter c reflects the patterns of the
species richness in the study area and varies with taxon,
climate, and biogeographical region (MacArthur and
Wilson 1967; Whittaker and Fernandez-Palacios 2007),
whereas z is the slope of the straight line reflecting the
degree of isolation for each island group (MacArthur
and Wilson 1967; Connor and McCoy 1979). Accord-
ing to their predictions, the slope of the species–area
curve would be higher for distant or isolated archipel-
agoes (MacArthur and Wilson 1967). In addition, a low
slope means that there is less sensitivity to island area
than for a group of islands of high slope (Whittaker and
Fernandez-Palacios 2007). To search these assump-
tions, we calculated regression slopes (z values) and
intercepts (c values) for land birds and we compared
slopes with other taxa from the same region.
3. In natural ecosystems, species assemblages among true
islands often show a nested pattern (Lomolino et al.
2006) in which biotas of islands with low species
richness are nonrandom subsets of biotas of richer sites
(Patterson and Atmar 2000). In a nested geographic
system, isolates are ranked in order of decreasing
species richness and species are sorted in order of
decreasing occurrence with some deviations from
perfect nestedness (e.g., unexpected presences or
absences) (Patterson and Atmar 1986). Regarding the
biology of land birds and the history of the Aegean
islands, what does a nested assemblage imply about the
evolutionary and ecological processes (e.g., immigra-
tion, extinction) generating this pattern? A substantial
fraction of land bird species are singletons (rare species
only known from a single island). How can singletons
affect nestedness? Moreover, to figure out the causality
of nestedness we investigated the effect of area,
elevation, and degree of isolation in the study islands.
We also analyzed the insectivores and seedeaters guilds
to detect idiosyncratic similarities or differences and
look for characteristic species assemblages.
Methods
Study area
Data sources and summary geographic data for the Aegean
area are given in Fig. 1 and Table 1. The total insular
avifauna has been divided into four separate geographic
sectors according to the geography and the palaeogeo-
graphic history of the Aegean region: (1) North Aegean
island group (NA), with Lesvos being the largest out of 12
islands, (2) Crete and its satellite islets (CR), consisting of
19 islands, with Crete being the largest, (3) Cyclades island
group (CY), with Naxos being the largest out of 27 islands,
and (4) Dodecanese island group (DO), with 17 islands,
with Rhodes being the largest (see Table 1).
Sources of data
Island features (e.g., size, elevation, distance from main-
land) were calculated using the ESRI ArcGis Desktop
(Redlands, CA, USA) and the Google Earth platform. We
used the presence/absence of breeding land bird species
occurring on the 77 islands rather than island population
size. We determined the current distribution of land birds
of the Aegean islands from the existing literature (Watson
1964; Spinthakis et al. 1993; Papakonstantinou et al. 1999;
Handrinos and Akriotis 1997) and the Standard Data Forms
of the updated inventory of the important bird areas (IBAs)
of Greece (HOS 2010). This dataset was further refined by
mining the databases of the Hellenic Ornithological Soci-
ety (HOS) and the Natural History Museum of Crete
(NHMC) for bird records from field expeditions carried out
in the Aegean archipelago during the last two decades and
by evaluating all unpublished reports. Relevant information
from the latest edition of the Greek Red Data Book of
threatened animals (Legakis and Maragkou 2009) and the
Fauna Europaea (v.2.2, 2010) were also included. In total,
we constructed a checklist of 102 breeding land bird spe-
cies distributed throughout 77 Aegean islands (Appendix 1
in Supplementary 1 v1). Moreover, we studied the species
composition of the insectivores and seedeaters guilds (see
also Appendix 1 in Supplementary 1 v1).
J Ornithol
123
Author's personal copy
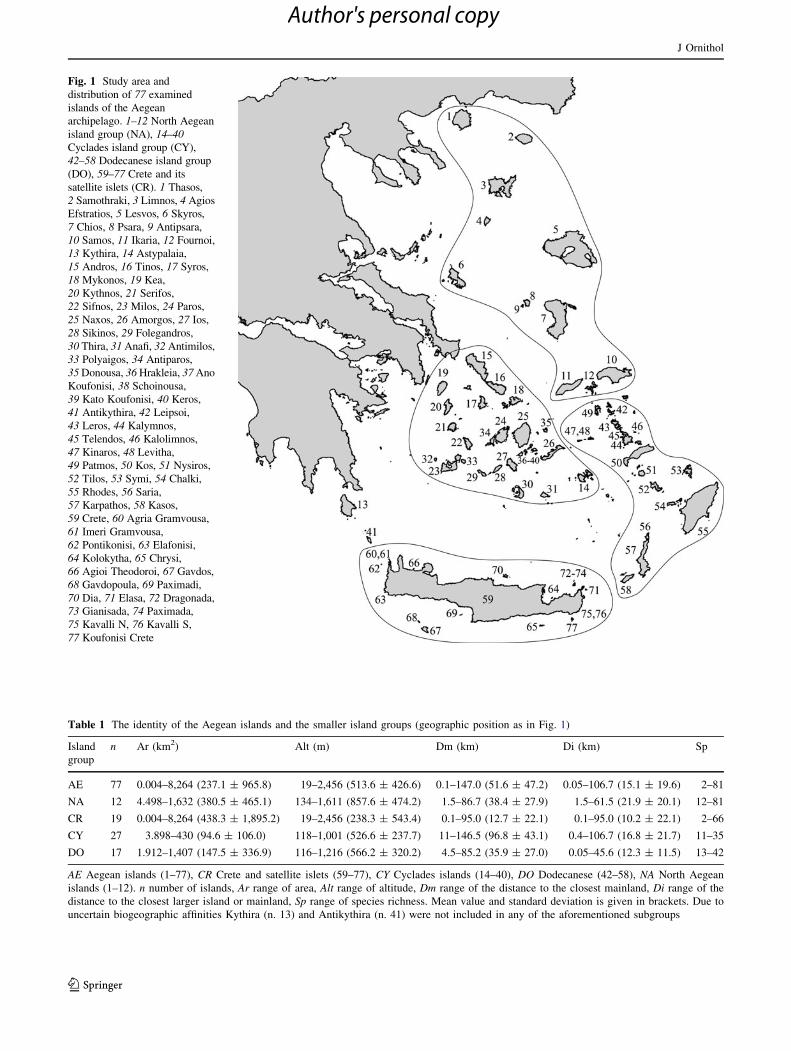
Fig. 1 Study area and
distribution of 77 examined
islands of the Aegean
archipelago. 1–12 North Aegean
island group (NA), 14–40Cyclades island group (CY),
42–58 Dodecanese island group
(DO), 59–77 Crete and its
satellite islets (CR). 1 Thasos,
2 Samothraki, 3 Limnos, 4 Agios
Efstratios, 5 Lesvos, 6 Skyros,
7 Chios, 8 Psara, 9 Antipsara,
10 Samos, 11 Ikaria, 12 Fournoi,
13 Kythira, 14 Astypalaia,
15 Andros, 16 Tinos, 17 Syros,
18 Mykonos, 19 Kea,
20 Kythnos, 21 Serifos,
22 Sifnos, 23 Milos, 24 Paros,
25 Naxos, 26 Amorgos, 27 Ios,
28 Sikinos, 29 Folegandros,
30 Thira, 31 Anafi, 32 Antimilos,
33 Polyaigos, 34 Antiparos,
35 Donousa, 36 Hrakleia, 37 Ano
Koufonisi, 38 Schoinousa,
39 Kato Koufonisi, 40 Keros,
41 Antikythira, 42 Leipsoi,
43 Leros, 44 Kalymnos,
45 Telendos, 46 Kalolimnos,
47 Kinaros, 48 Levitha,
49 Patmos, 50 Kos, 51 Nysiros,
52 Tilos, 53 Symi, 54 Chalki,
55 Rhodes, 56 Saria,
57 Karpathos, 58 Kasos,
59 Crete, 60 Agria Gramvousa,
61 Imeri Gramvousa,
62 Pontikonisi, 63 Elafonisi,
64 Kolokytha, 65 Chrysi,
66 Agioi Theodoroi, 67 Gavdos,
68 Gavdopoula, 69 Paximadi,
70 Dia, 71 Elasa, 72 Dragonada,
73 Gianisada, 74 Paximada,
75 Kavalli N, 76 Kavalli S,
77 Koufonisi Crete
Table 1 The identity of the Aegean islands and the smaller island groups (geographic position as in Fig. 1)
Island
group
n Ar (km2) Alt (m) Dm (km) Di (km) Sp
AE 77 0.004–8,264 (237.1 ± 965.8) 19–2,456 (513.6 ± 426.6) 0.1–147.0 (51.6 ± 47.2) 0.05–106.7 (15.1 ± 19.6) 2–81
NA 12 4.498–1,632 (380.5 ± 465.1) 134–1,611 (857.6 ± 474.2) 1.5–86.7 (38.4 ± 27.9) 1.5–61.5 (21.9 ± 20.1) 12–81
CR 19 0.004–8,264 (438.3 ± 1,895.2) 19–2,456 (238.3 ± 543.4) 0.1–95.0 (12.7 ± 22.1) 0.1–95.0 (10.2 ± 22.1) 2–66
CY 27 3.898–430 (94.6 ± 106.0) 118–1,001 (526.6 ± 237.7) 11–146.5 (96.8 ± 43.1) 0.4–106.7 (16.8 ± 21.7) 11–35
DO 17 1.912–1,407 (147.5 ± 336.9) 116–1,216 (566.2 ± 320.2) 4.5–85.2 (35.9 ± 27.0) 0.05–45.6 (12.3 ± 11.5) 13–42
AE Aegean islands (1–77), CR Crete and satellite islets (59–77), CY Cyclades islands (14–40), DO Dodecanese (42–58), NA North Aegean
islands (1–12). n number of islands, Ar range of area, Alt range of altitude, Dm range of the distance to the closest mainland, Di range of the
distance to the closest larger island or mainland, Sp range of species richness. Mean value and standard deviation is given in brackets. Due to
uncertain biogeographic affinities Kythira (n. 13) and Antikythira (n. 41) were not included in any of the aforementioned subgroups
J Ornithol
123
Author's personal copy
Data analysis
Faunal similarity
A binary matrix was created for the land bird species
occurring on each island. Phi’s similarity coefficient was
used to investigate faunal similarity among islands. Phi’s
euclidean coefficient of association is a non-metric formula
(range -1.0 to 1.0) and is not influenced by frequency of
occurrence (Jackson et al. 1989). Multivariate analyses
were conducted using NTSYS numerical taxonomy pack-
age (Rohlf 1993). We used the unweighted pair group
method with arithmetic mean (UPGMA) to construct
dendrograms (Sneath and Sokal 1973). It is a simple
agglomerative clustering technique for the creation of
phenograms.
Species-area relationship (SAR)
We applied the commonly used power model, log S = log
c ? z log A (Arrhenius 1921; Preston 1962), where S is the
species richness (number of species in a given sample), A is
the sample area, z is the slope of the line, and c is the
intercept. We made all regression tests with Statistica 6
(StatSoft 2001). For the comparison of slopes (z value) and
intercepts (c), we followed the basic statistical tests pro-
posed by Gould (1979) and Zar (2009).
Measure of nestedness
We used the nestedness metric based on overlap and
decreasing fill, hereafter NODF to measure the total pres-
ence-absence matrix nestedness (Almeida-Neto et al.
2008). NODF is well suited to check separately nestedness
between islands (Nrow) or species (Ncolumn). We used the
ANINHADO C?? program (see Guimaraes and Guimar-
aes 2006 for review) to compute the degree of nestedness.
Nestedness causality was explored based on the rank of
islands produced by NODF and its correlation with certain
parameters such as area, altitude range, distance to the
closest mainland, and distance to the nearest larger island
(see Appendix 2 in Supplementary 2 v1). We carefully
addressed singletons (species only known from a single
island) that are often considered to be evenly dispersed
between islands. We used the software package R 2.8.0
(R Development Core Team 2008) to calculate the Pearson
product-moment correlation coefficients and checked for
any colinearity effect among independent variables by
using VIF (variation inflation factor). In all other tests, we
used SPSS v.15 (SPSS, 1989–2006). Measurements are
presented as mean ± standard deviation.
Results
Species richness and faunal similarity
The study area consisted of 77 islands supporting 102 land
bird species, belonging to 60 genera (Fig. 1; Appendix 1 in
Supplementary 1 v1). Concerning each individual island
group, North Aegean islands support 91 species belonging
to 56 genera, of which 15 are singletons (16%). The
Cyclades islands support 48 species belonging to 30 gen-
era, of which 11 are singletons (23%). Dodecanese islands
have 61 species belonging to 39 genera, of which 17 are
singletons (28%). Crete and its surrounding islands have 66
species belonging to 41 genera, of which 53 are singletons
(80%) (see Appendix 1 in Supplementary 1 v1).
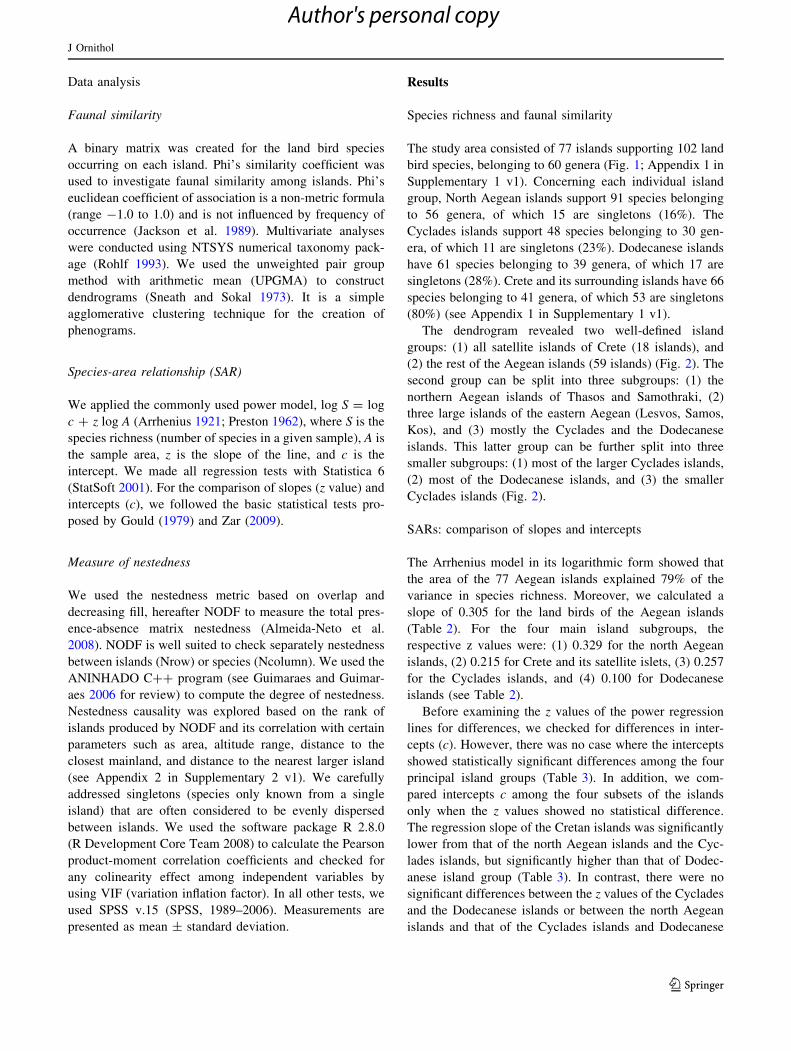
The dendrogram revealed two well-defined island
groups: (1) all satellite islands of Crete (18 islands), and
(2) the rest of the Aegean islands (59 islands) (Fig. 2). The
second group can be split into three subgroups: (1) the
northern Aegean islands of Thasos and Samothraki, (2)
three large islands of the eastern Aegean (Lesvos, Samos,
Kos), and (3) mostly the Cyclades and the Dodecanese
islands. This latter group can be further split into three
smaller subgroups: (1) most of the larger Cyclades islands,
(2) most of the Dodecanese islands, and (3) the smaller
Cyclades islands (Fig. 2).
SARs: comparison of slopes and intercepts
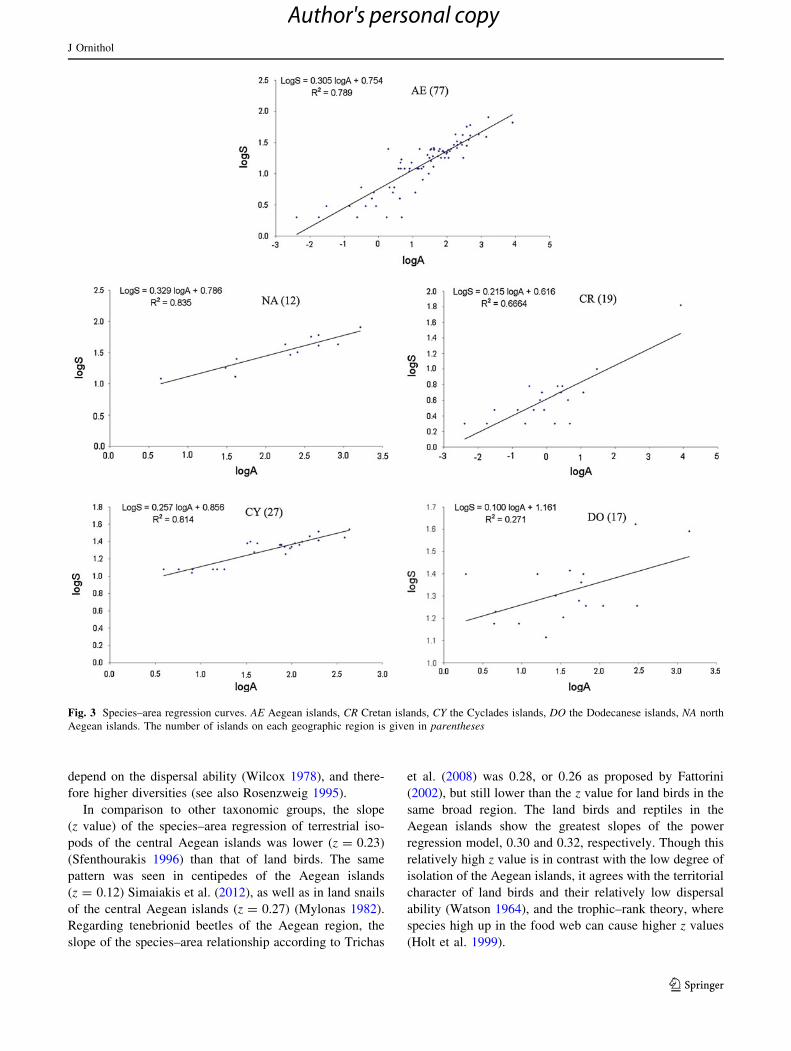
The Arrhenius model in its logarithmic form showed that
the area of the 77 Aegean islands explained 79% of the
variance in species richness. Moreover, we calculated a
slope of 0.305 for the land birds of the Aegean islands
(Table 2). For the four main island subgroups, the
respective z values were: (1) 0.329 for the north Aegean
islands, (2) 0.215 for Crete and its satellite islets, (3) 0.257
for the Cyclades islands, and (4) 0.100 for Dodecanese
islands (see Table 2).
Before examining the z values of the power regression
lines for differences, we checked for differences in inter-
cepts (c). However, there was no case where the intercepts
showed statistically significant differences among the four
principal island groups (Table 3). In addition, we com-
pared intercepts c among the four subsets of the islands
only when the z values showed no statistical difference.
The regression slope of the Cretan islands was significantly
lower from that of the north Aegean islands and the Cyc-
lades islands, but significantly higher than that of Dodec-
anese island group (Table 3). In contrast, there were no
significant differences between the z values of the Cyclades
and the Dodecanese islands or between the north Aegean
islands and that of the Cyclades islands and Dodecanese
J Ornithol
123
Author's personal copy
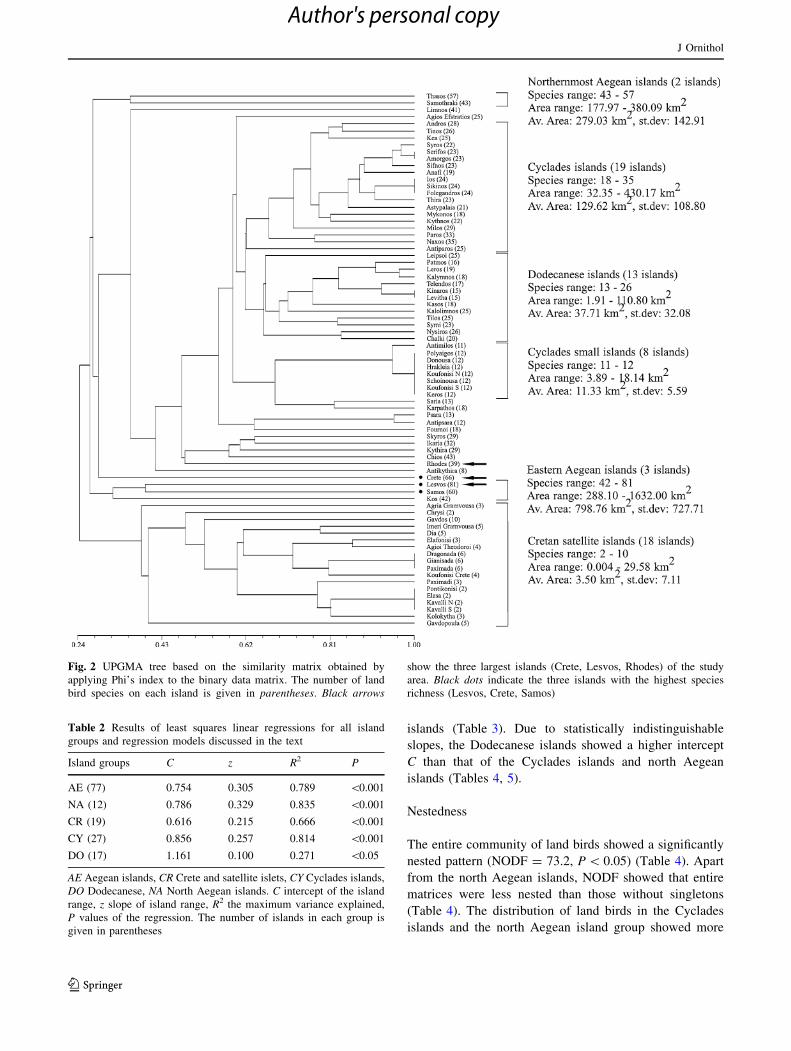
islands (Table 3). Due to statistically indistinguishable
slopes, the Dodecanese islands showed a higher intercept
C than that of the Cyclades islands and north Aegean
islands (Tables 4, 5).
Nestedness
The entire community of land birds showed a significantly
nested pattern (NODF = 73.2, P \ 0.05) (Table 4). Apart
from the north Aegean islands, NODF showed that entire
matrices were less nested than those without singletons
(Table 4). The distribution of land birds in the Cyclades
islands and the north Aegean island group showed more
Fig. 2 UPGMA tree based on the similarity matrix obtained by
applying Phi’s index to the binary data matrix. The number of land
bird species on each island is given in parentheses. Black arrows
show the three largest islands (Crete, Lesvos, Rhodes) of the study
area. Black dots indicate the three islands with the highest species
richness (Lesvos, Crete, Samos)
Table 2 Results of least squares linear regressions for all island
groups and regression models discussed in the text
Island groups C z R2 P
AE (77) 0.754 0.305 0.789 \0.001
NA (12) 0.786 0.329 0.835 \0.001
CR (19) 0.616 0.215 0.666 \0.001
CY (27) 0.856 0.257 0.814 \0.001
DO (17) 1.161 0.100 0.271 \0.05
AE Aegean islands, CR Crete and satellite islets, CY Cyclades islands,
DO Dodecanese, NA North Aegean islands. C intercept of the island
range, z slope of island range, R2 the maximum variance explained,
P values of the regression. The number of islands in each group is
given in parentheses
J Ornithol
123
Author's personal copy
nested assemblages than Crete and Dodecanese. Crete with
its satellite islands showed the lowest NODF value with the
highest increase when singletons where excluded from the
analysis. The degree of nestedness between the islands of
the north Aegean, the Cyclades, and Dodecanese was
higher than the Cretan island group.
Insectivores and seedeaters across the Aegean islands
were strongly nested according to NODF (Table 5).
Insectivores showed slightly higher degrees of nestedness
than seedeaters in the Aegean islands. When we separately
calculated the degree of nestedness between insectivores
and seedeaters for the four island subgroups, insectivores
were less nested in the north Aegean islands, Crete, and
Dodecanese islands (Table 5).
Regarding the causality of nestedness, the pearson
product-moment coefficient indicated that the island order,
as determined by NODF metric for all the 77 Aegean
islands, was strongly correlated with the logarithm of area
Table 3 Test for difference in
regression coefficients (z slope
and intercept C) among the four
island subgroups
CR Crete and satellite islets,
CY the Cyclades, DO the
Dodecanese, NA north Aegean
islands. P \ 0.05 represents
significant difference
Island groups t test for slope z P t test for intercept C P
NA—CR t = 3.470 [ t0.05(2),27 = 2.052 \0.05 t = 0.750 \ t0.05(2),28 = 2.048 [0.05
NA—CY t = 1.295 \ t0.05(2),35 = 2.030 [0.05 t = 1.277 \ t0.05(2),36 = 2.028 [0.05
NA—DO t = 0.710 \ t0.05(2),25 = 2.060 [0.05 t = 1.381 \ t0.05(2),26 = 2.056 [0.05
CR—CY t = 4.862 [ t0.05(2),42 = 2.018 \0.05 t = 1.470 \ t0.05(2),43 = 2.017 [0.05
CR—DO t = 3.526 [ t0.05(2),32 = 2.037 \0.05 t = 0.426 \ t0.05(2),33 = 2.035 [0.05
CY—DO t = 0.016 \ t0.05(2),40 = 2.021 [0.05 t = 0.947 \ t0.05(2),41 = 2.020 [0.05
Table 4 Measure of nestedness for the Aegean islands and all four smaller Island groups
Matrix NODF Er P(Er) Ce P(Ce) S n
AE 73.19 20.90 \0.001 32.07 \0.001 102 77
AEsing 75.47 25.12 \0.001 36.81 \0.001 83 77
NA 76.80 42.72 \0.001 52.21 \0.001 91 12
NAsing 75.16 55.92 \0.001 63.79 \0.001 76 12
CR 37.51 12.56 \0.001 25.58 \0.001 66 19
CRsing 72.18 36.60 \0.001 46.90 \0.001 13 19
CY 76.32 43.25 \0.001 54.67 \0.001 49 27
CYsing 82.01 53.38 \0.001 64.30 \0.001 38 27
DO 66.06 37.42 \0.001 46.96 \0.001 61 17
DOsing 72.49 47.91 \0.001 57.72 \0.001 44 17
AE Aegean islands, NA north Aegean islands, CR Crete and its satellite islands, CY Cyclades islands, DO Dodecanese islands, sing without
singletons
NODF total matrix nestedness, Er nestedness of null model where presences are randomly assigned to any cell within the matrix, P(Er)
significance of NODF based on this null model, Ce nestedness of null model where the probability of a cell aij show a presence is (Pi/C ? Pj/R)/
2, in which Pi is the number of presences in the row i, Pj is the number of presences in the column j, C is the number of columns and R is the
number of rows, P(Ce) significance of NODF based on this null model, S species richness, In number of islands, sign without singletons
Table 5 Measure of nestedness
for insectivores and seedeaters
across the Aegean islands
Abbreviations follow Table 4
Matrix NODF Er P(Er) Ce P(Ce) S n
Insectivores AE 80.49 22.65 \0.001 35.45 \0.001 35 71
Insectivores NA 78.66 43.76 \0.001 53.50 \0.001 30 12
Insectivores CR 41.07 15.89 \0.001 28.39 \0.05 26 13
Insectivores CY 81.31 44.07 \0.001 55.60 \0.001 16 27
Insectivores DO 70.19 34.17 \0.001 44.05 \0.001 23 17
Seedeaters AE 77.00 32.40 \0.001 44.22 \0.001 24 76
Seedeaters NA 83.71 52.94 \0.001 61.65 \0.001 22 12
Seedeaters CR 51.62 14.96 \0.001 27.20 \0.001 19 18
Seedeaters CY 70.27 55.74 \0.001 64.58 \0.05 15 27
Seedeaters DO 74.55 51.97 \0.001 61.44 \0.001 15 17
J Ornithol
123
Author's personal copy
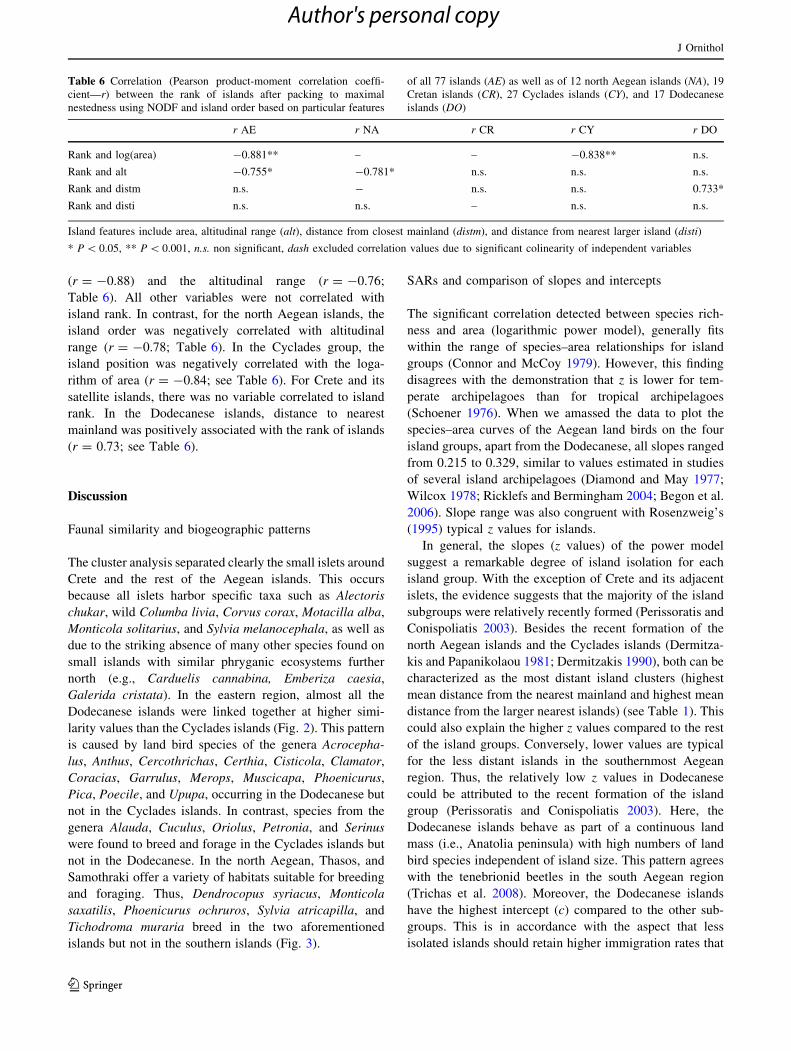
(r = -0.88) and the altitudinal range (r = -0.76;
Table 6). All other variables were not correlated with
island rank. In contrast, for the north Aegean islands, the
island order was negatively correlated with altitudinal
range (r = -0.78; Table 6). In the Cyclades group, the
island position was negatively correlated with the loga-
rithm of area (r = -0.84; see Table 6). For Crete and its
satellite islands, there was no variable correlated to island
rank. In the Dodecanese islands, distance to nearest
mainland was positively associated with the rank of islands
(r = 0.73; see Table 6).
Discussion
Faunal similarity and biogeographic patterns
The cluster analysis separated clearly the small islets around
Crete and the rest of the Aegean islands. This occurs
because all islets harbor specific taxa such as Alectoris
chukar, wild Columba livia, Corvus corax, Motacilla alba,
Monticola solitarius, and Sylvia melanocephala, as well as
due to the striking absence of many other species found on
small islands with similar phryganic ecosystems further
north (e.g., Carduelis cannabina, Emberiza caesia,
Galerida cristata). In the eastern region, almost all the
Dodecanese islands were linked together at higher simi-
larity values than the Cyclades islands (Fig. 2). This pattern
is caused by land bird species of the genera Acrocepha-
lus, Anthus, Cercothrichas, Certhia, Cisticola, Clamator,
Coracias, Garrulus, Merops, Muscicapa, Phoenicurus,
Pica, Poecile, and Upupa, occurring in the Dodecanese but
not in the Cyclades islands. In contrast, species from the
genera Alauda, Cuculus, Oriolus, Petronia, and Serinus
were found to breed and forage in the Cyclades islands but
not in the Dodecanese. In the north Aegean, Thasos, and
Samothraki offer a variety of habitats suitable for breeding
and foraging. Thus, Dendrocopus syriacus, Monticola
saxatilis, Phoenicurus ochruros, Sylvia atricapilla, and
Tichodroma muraria breed in the two aforementioned
islands but not in the southern islands (Fig. 3).
SARs and comparison of slopes and intercepts
The significant correlation detected between species rich-
ness and area (logarithmic power model), generally fits
within the range of species–area relationships for island
groups (Connor and McCoy 1979). However, this finding
disagrees with the demonstration that z is lower for tem-
perate archipelagoes than for tropical archipelagoes
(Schoener 1976). When we amassed the data to plot the
species–area curves of the Aegean land birds on the four
island groups, apart from the Dodecanese, all slopes ranged
from 0.215 to 0.329, similar to values estimated in studies
of several island archipelagoes (Diamond and May 1977;
Wilcox 1978; Ricklefs and Bermingham 2004; Begon et al.
2006). Slope range was also congruent with Rosenzweig’s
(1995) typical z values for islands.
In general, the slopes (z values) of the power model
suggest a remarkable degree of island isolation for each
island group. With the exception of Crete and its adjacent
islets, the evidence suggests that the majority of the island
subgroups were relatively recently formed (Perissoratis and
Conispoliatis 2003). Besides the recent formation of the
north Aegean islands and the Cyclades islands (Dermitza-
kis and Papanikolaou 1981; Dermitzakis 1990), both can be
characterized as the most distant island clusters (highest
mean distance from the nearest mainland and highest mean
distance from the larger nearest islands) (see Table 1). This
could also explain the higher z values compared to the rest
of the island groups. Conversely, lower values are typical
for the less distant islands in the southernmost Aegean
region. Thus, the relatively low z values in Dodecanese
could be attributed to the recent formation of the island
group (Perissoratis and Conispoliatis 2003). Here, the
Dodecanese islands behave as part of a continuous land
mass (i.e., Anatolia peninsula) with high numbers of land
bird species independent of island size. This pattern agrees
with the tenebrionid beetles in the south Aegean region
(Trichas et al. 2008). Moreover, the Dodecanese islands
have the highest intercept (c) compared to the other sub-
groups. This is in accordance with the aspect that less
isolated islands should retain higher immigration rates that
Table 6 Correlation (Pearson product-moment correlation coeffi-
cient—r) between the rank of islands after packing to maximal
nestedness using NODF and island order based on particular features
of all 77 islands (AE) as well as of 12 north Aegean islands (NA), 19
Cretan islands (CR), 27 Cyclades islands (CY), and 17 Dodecanese
islands (DO)
r AE r NA r CR r CY r DO
Rank and log(area) -0.881** – – -0.838** n.s.
Rank and alt -0.755* -0.781* n.s. n.s. n.s.
Rank and distm n.s. - n.s. n.s. 0.733*
Rank and disti n.s. n.s. – n.s. n.s.
Island features include area, altitudinal range (alt), distance from closest mainland (distm), and distance from nearest larger island (disti)
* P \ 0.05, ** P \ 0.001, n.s. non significant, dash excluded correlation values due to significant colinearity of independent variables
J Ornithol
123
Author's personal copy
depend on the dispersal ability (Wilcox 1978), and there-
fore higher diversities (see also Rosenzweig 1995).
In comparison to other taxonomic groups, the slope
(z value) of the species–area regression of terrestrial iso-
pods of the central Aegean islands was lower (z = 0.23)
(Sfenthourakis 1996) than that of land birds. The same
pattern was seen in centipedes of the Aegean islands
(z = 0.12) Simaiakis et al. (2012), as well as in land snails
of the central Aegean islands (z = 0.27) (Mylonas 1982).
Regarding tenebrionid beetles of the Aegean region, the
slope of the species–area relationship according to Trichas
et al. (2008) was 0.28, or 0.26 as proposed by Fattorini
(2002), but still lower than the z value for land birds in the
same broad region. The land birds and reptiles in the
Aegean islands show the greatest slopes of the power
regression model, 0.30 and 0.32, respectively. Though this
relatively high z value is in contrast with the low degree of
isolation of the Aegean islands, it agrees with the territorial
character of land birds and their relatively low dispersal
ability (Watson 1964), and the trophic–rank theory, where
species high up in the food web can cause higher z values
(Holt et al. 1999).
Fig. 3 Species–area regression curves. AE Aegean islands, CR Cretan islands, CY the Cyclades islands, DO the Dodecanese islands, NA north
Aegean islands. The number of islands on each geographic region is given in parentheses
J Ornithol
123
Author's personal copy
Nestedness
Islands have often been found to exhibit highly nested set
of species assemblages (Fischer and Lindenmayer 2002).
NODF metric found a high degree of nestedness for the
land birds of all the 77 Aegean islands (see Table 4). The
large number of singletons in Crete might explain the low
degree of nestedness. The paradigm of Crete has been
described by Almeida-Neto et al. (2008) as ‘‘nested pattern
minimally filled’’, in which there is only one fully filled
row (Crete) and numerous fully filled columns (land bird
species such as Motacilla alba, Columba livia, and Mon-
ticola solitarius). For the Dodecanese islands, the prox-
imity to Turkey and the recent geological formation
(Perissoratis and Conispoliatis 2003) result in higher
disorder, because colonization by particular species (e.g.,
Oenanthe oenanthe, Sylvia cantillans, Sylvia atricapilla,
Lanius collurio, Emberiza hortulana, Upupa epops) seems
to be a stochastic process compared to more distant island
groups.
When we excluded singletons, all subgroups except the
north Aegean islands were more nested. In most island
assemblages, singletons do not significantly decrease
nestedness because land bird species with single presence
tend to occur on higher ranked islands (see Appendix 1 in
Supplementary 1 v1). Instead of this, unexpected land bird
singletons (e.g., Prunella collaris and Pyrrhocorax pyr-
rhocorax) tend to occur on medium ranked islands, such as
Samothraki and Chios in the northernmost Aegean islands
(see Appendix 1 in Supplementary 1 v1). Whether or not
singletons are excluded, the Cyclades islands and the north
Aegean islands showed the highest degree of nestedness
(Table 4), and this pattern fits with the remote character of
these two groups. Both aforementioned geographic subdi-
visions showed the highest mean distance from the closest
mainland and the highest mean distance from the nearest
larger island, respectively (see Table 1). Hence, the
movement of land birds from nearby continents to the north
Aegean islands or the Cyclades islands, and vice versa,
may be more limited than that in the Cretan and Dodeca-
nese islands. Abbott (1978) stressed the idea that a stretch
of water could be a barrier or a filter to the dispersal of land
birds to islands.
Regarding nestedness, there are congruencies and dif-
ferences between the two major land bird guilds, namely
insectivores and seedeaters. Both insectivores and seed-
eaters showed a considerable degree of nestedness (see
Table 5). Matrices remained highly ordered with signifi-
cant nested patterns in all island groups, with the exception
of Crete. Overall, while it is suggested that the effect of
species exchange between any adjacent continental region
(pool of species) and the islands tends to weaken the effect
of extinction in producing a nested structure (Wright et al.
1998), this does not agree with the present study. Insecti-
vores and seedeaters proved to be less vagile than expec-
ted, provoking a kind of faunal relaxation in several island
sectors (e.g., the north Aegean islands and the Cyclades
islands) and showing a considerable degree of nestedness.
The Aegean islands have varied in size, elevation, and
proximity since isolation from the two distinct continental
areas (the Balkan peninsula and the Anatolian peninsula),
and present an ideal study area to detect factors that affect
faunal composition (see Foufopoulos and Mayer 2007) (see
also Table 1). Our results showed that for the Aegean
islands the higher the altitudinal range, the richer the island
land bird fauna, and the greater the island surface, the
higher the species richness. As long as elevation can be
viewed as a metric of island size, larger and higher islands
are first in sight from a distance and provide a larger variety
of environmental heterogeneity (Foufopoulos and Mayer
2007). A similar pattern has been observed in the study of
Watson (1964). In regard to the importance of vegetation
structural complexity, Watson (1964) pointed out for the
first time the importance of habitat heterogeneity in
determining avian diversity on the Aegean islands (e.g.,
islands with more complex vegetation harbor more spe-
cies). Hence, in consensus with Watson (1964), there is a
rationale why area and altitude were detected to explain
nested patterns on three out of the four main island groups
studied. Particularly, the area significantly explained nested
patterns in the Cyclades islands. With regard to the cause
of nestedness within the north Aegean islands, only ele-
vation could explain the order in which islands were ranked
by NODF. Regarding the Dodecanese islands, many
islands have been separated from Asia Minor no longer
than 21,000 years (Perissoratis and Conispoliatis 2003).
Fattorini (2002) suggested that the south-eastern islands
(Dodecanese) behave as parts of the Anatolia landmass.
This could explain why the distance to the nearest main-
land identified as the only factor to affect nestedness pat-
tern and support the high numbers of land bird species in
the Dodecanese compared to the other island assemblages.
Unsurprisingly, therefore, the further the distance to the
closest mainland (i.e., Turkey), the lower species richness
on an island.
Although area could explain nonrandom patterns in land
birds, this was not the case for several invertebrate biotas
across the Aegean islands (results not shown) (Sfentho-
urakis et al. 1999; Triantis and Mylonas 2009; Simaiakis
and Martınez-Morales 2010). For the Cyclades islands,
where adequate data were available to calculate nestedness,
terrestrial isopods, land snails, and centipedes showed
considerable similarities in the degree of nestedness, even
though different reasons may account for the causality of
nestedness (for further details, see Hausdorf and Hennig
2005; Simaiakis and Martınez-Morales 2010). Nested
J Ornithol
123
Author's personal copy
assemblages of isopods, land snails, and centipedes were
better explained by distance from continental Greece and by
absolute shorter distance from the mainland, and by dis-
tance to the closest continent (degree of isolation), respec-
tively (Sfenthourakis et al. 1999; Simaiakis and Martınez-
Morales 2010). With respect to the ground beetle fauna
from the Cyclades islands, Trichas et al. (2008) found
evidence that nestedness was significantly explained by the
palaeogeography of the area and the degree of isolation.
In conclusion, the results of the biogeographic study
suggest that certain northeastern Aegean islands (e.g.,
Thasos, Samothraki, Lesvos, Samos, Kos), due to their
geographic affinities with major continents (e.g., south-
eastern Europe and Turkey), and their high environmental
heterogeneity, retain idiosyncratic land bird assemblages
compared to southernmost islands. With a few exceptions,
the number of land bird species is better described by the
species–area relationship, whereas the power model
explains the variation of species richness compared to area.
Although we were not able to detect a common factor to
infer causality of nestedness in every group of islands, we
found that area and elevation were mainly related to the
ranking of islands. Here, land birds, both seedeaters and
insectivores, have been identified as an informative taxon
to study biogeographic patterns in the Aegean islands. But
still, there is much work to be done in order to define
habitats based on the biology of the land birds and to
unravel their role in determining the species richness in
highly fragmented environments, such as the Aegean
archipelago with the numerous islands and islets.
Acknowledgments We thank our colleagues, S. Adamandopoulou,
H. Alivizatos, G. Andreou, S. Bourdakis, D. Bousbouras, A. Christidis,
M. Dimaki, T. Dimalexis, P. Dragoumis, A. Evangelidis, J. Fric,
M. Gaetlich, K. Gaganis, A. Galanaki, E. Galinou, Y. Gavalas,
B. Hallmann, Y. Ioannidis, E. Kakalis, N. Kardakari, G. Karris,
T. Kominos, P. Latsoudis, A. Manolopoulos, K. Misiakos,
M. Moschovis, M. Panagiotopoulou, N. Probonas, Y. Rousopoulos,
A. Sakoulis, V. Saravia Mullin, T. Skartsi, K. Stara, R. Tsiakiris,
Y. Tsougrakis, and S. Zogaris, who significantly contributed to the
study of the Important Bird Areas of Greece. We are grateful to
Alexandra Manousaki and Maria Plataki for their valuable contribution
to shape the primary dataset for land birds. We also thank Ian Henshaw
for his critical comments on the manuscript and all linguistic remarks.
References
Abbott I (1978) Factors determining the number of land bird species in
islands around south-western Australia. Oecologia 33:221–233
Almeida-Neto M, Guimaraes P, Guimaraes PR Jr, Loyola RD, Ulrich
W (2008) A consistent metric for nestedness analysis in
ecological systems: reconciling concept and measurement. Oikos
117:1227–1239
Anastasakis GC, Dermitzakis M (1990) Post-Middle-Miocene paleo-
geographic evolution of the Central Aegean Sea and detailed
Quaternary reconstruction of the region. Its possible influence on
the distribution of the Quaternary mammals of the Cyclades
Islands. N Jahr Geol Palaeont Mon 1:1–16
Arrhenius O (1921) Species and area. J Ecol 9:95–99
Beerli P, Hotz H, Uzzell T (1996) Geologically dated sea barriers
calibrate a protein clock for Aegean water frogs. Evolution
50:1676–1687
Begon M, Harper JL, Townsend CR (2006) Ecology, 4th edn.
Blackwell, Oxford
Bittkau C, Comes HP (2005) Evolutionary processes in a continental
island system: molecular phylogeography of the Aegean Nigellaarvensis alliance (Ranunculaceae) inferred from chloroplast
DNA. Mol Ecol 14:4065–4083
Blondel J, Aronson J (1999) Biology and wildlife of the Mediterra-
nean region. Oxford University Press, Oxford
Blondel J, Aronson J, Bodiou J-Y, Boeuf G (2010) The Mediterranean
basin—biological diversity in space and time. Oxford University
Press, Oxford
Brown JH, Lomolino MV (1998) Biogeography, 2nd edn. Sinauer,
Sunderland
Connor EF, McCoy ED (1979) The statistics and biology of the
species—area relationship. Am Nat 113:791–833
Covas R, Blondel J (1998) Biogeography and history of the
Mediterranean bird fauna. Ibis 140:395–407
Dafis S, Papastergiadou E, Georghiou K, Babalonas D, Georgiadis T,
Papageorgiou M, Lazaridou T, Tsiaoussi V (1996) Directive
92/43/EEC. The Greek ‘Habitat’ Project NATURA 2000: an
overview. Life contract B4-3200/84/756, commission of the
European Communities DG XI, the Goulandris Natural History
Museum—Greek Biotope/Wetland Centre. University of Athens,
Aristotle University of Thessaloniki, University of Patras
Dennis RLH, Shreeve TG, Olivier A, Coutsis JG (2000) Contempo-
rary geography dominates butterfly diversity gradients within
Aegean archipelago (Lepidoptera: Papilionoidea, Hesperioidea).
J Biogeogr 27:1365–1383
Dermitzakis MD (1990) Paleogeography, geodynamic processes and
event stratigraphy during the late Cenozoic of the Aegean area.
In: Azzaroli A (ed) Biogeographical aspects of insularity. Att
Con Lin 85:263–288
Dermitzakis MD, Papanikolaou D (1981) Palaeogeography and
geodynamics of the Aegean region during the Neogene. In:
Proceedings of the 7th international congress on Mediterranean
Neogene. Ann Geol Pays Hell, pp 245–289
Diamond JM, May RM (1977) Species turnover rates on islands:
dependence on census interval. Science 197:266–270
Douris V, Cameron RAD, Rodakis GC, Lecanidou R (1998)
Mitochondrial phylogeography of the land snail Albinaria.
Crete: long-term geological and short-term vicariance effects.
Evolution 52:116–125
Fattorini S (2002) Biogeography of the tenebrionid beetles (Coleop-
tera, Tenebrionidae) on the Aegean Islands (Greece). J Biogeogr
29:49–67
Fischer J, Lindenmayer DB (2002) Treating the nestedness temper-
ature calculator as a ‘black box’ can lead to false conclusions.
Oikos 99:193–199
Foufopoulos J, Ives AR (1999) Reptile extinctions on land-bridge
islands: life-history attributes and vulnerability to extinction. Am
Nat 153:1–25
Foufopoulos J, Mayer GC (2007) Turnover of passerine birds on
islands in the Aegean Sea (Greece). J Biogeogr 34:1113–1123
Gould SJ (1979) An allometric interpretation of species-area curves:
the meaning of the coefficient. Am Nat 111(3):335–343
Guimaraes PR, Guimaraes P (2006) Improving the analyses of
nestedness for large sets of matrices. Environ Model Soft
21:1512–1513
Handrinos G, Akriotis T (1997) The birds of Greece. Christopher
Helm, London
J Ornithol
123
Author's personal copy
Hausdorf B, Hennig C (2005) The influence of recent geography,
palaeogeography and climate on the composition of the fauna of
the central Aegean Islands. Biol J Linn Soc 84:785–795
Hellenic Ornithological Society (HOS) (2010) Data on Greek
important bird areas. World bird data base, Bird life interna-
tional, Cambridge
Holt RD, Lawton JH, Polis GA, Martinez ND (1999) Trophic rank
and the species-area relationship. Ecology 80:1495–1504
Jackson AA, Somers KM, Harvey HH (1989) Similarity coefficients:
measures for co-occurrence and association or simply measures
of occurrence. Am Nat 133:436–453
Katsimanis N, Dretakis M, Akriotis T, Mylonas M (2006) Breeding bird
assemblages of eastern Mediterranean scrublands: composition,
organisation and patterns of diversity. J Ornithol 147:419–427
Legakis A, Maragkou P (eds) (2009) The Red Data Book of the
threatened species of Greece. Hellenic Zoological Society,
Athens (in Greek)
Lomolino MV, Riddle BR, Brown JH (2006) Biogeography, 3rd edn.
Sinauer, Sunderland
MacArthur RH, Wilson EO (1967) The theory of Island biogeogra-
phy. Princeton University Press, Princeton
Margaris N (1981) Adaptive strategies in plants dominating Medi-
terranean- type ecosystems. In: Di Castri F, Goodall D, Sprecht
R (eds) Mediterranean type shrublands. Collection ecosystems of
the World, vol 11. Elsevier, Amsterdam, pp 309–316
Mylonas MA (1982) Meleti pano sti zoogeografıa ke ikologıaton
cherseon malakıon ton Kikladon. PhD thesis, Universityof
Athens, Greece
Panitsa M, Tzanoudakis D, Triantis KA, Sfenthourakis S (2006)
Patterns of species richness on very small islands: the plants of
the Aegean archipelago. J Biogeogr 33:1223–1234
Papakonstantinou K, Oikonomidou E, Bousbouras D et al (1999)
Ecological investigation in the northern Dodecanese, HOS
expedition to the islands and the islets of the north of nomos
of Dodekanisos. HOS, Athens (in Greek)
Parmakelis A, Stathi I, Chatzaki M, Simaiakis S, Spanos L, Louis C,
Mylonas M (2006) Evolution of Mesobuthus gibbosus (Brulle,
1832) (Scorpiones: Buthidae) in the northeastern Mediterranean
region. Mol Ecol 15(10):2883–2894
Patterson BD, Atmar W (1986) Nested subsets and the structure of
insular mammalian faunas and archipelagos. Biol J Linn Soc
28:65–82
Patterson BD, Atmar W (2000) Analyzing species composition in
fragments. In: Rheinwald G (ed) Isolated vertebrate communities
in the tropics. Bonn Zoological Monographs 46. Alexander
Koening Zoological Research Institute and Zoological Museum,
pp 9–24
Perissoratis C, Conispoliatis N (2003) The impacts of sea-level
changes during the latest Pleistocene and Holocene times on the
morphology of Ionian and Aegean seas (SE Alpine Europe). Mar
Geol 196:145–156
Preston FW (1962) The canonical distribution of commonness and
rarity: part 1. Ecology 43:185–215
Rackham O, Moody J (1997) The making of the Cretan landscape.
Manchester University Press, Manchester
Ricklefs RE, Bermingham E (2004) History and the species-area
relationship in the lesser Antillean birds. Am Nat 163:227–239
Rohlf FJ (1993) NTSYSpc, numerical taxonomy and multivariate
analysis system, ver. 1.80. Applied Biostatistics, New York
Rosenzweig ML (1995) Species diversity in space and time.
Cambridge University Press, Cambridge
Schoener TW (1976) The species-area relation within archipelagoes:
models and evidence from island land birds. In: Proc Int Ornithol
Congr 16:629–642
Sfenthourakis S (1996) The species-area relationship of terrestrial
isopods (Isopoda; Oniscidea) from the Aegean Archipelago
(Greece): a comparative study. Glob Ecol Biogeogr Lett 5:149–
157
Sfenthourakis S, Legakis A (2001) Hotspots of endemic terrestrial
invertebrates in southern Greece. Biodiv Conserv 10:1387–1417
Sfenthourakis S, Giokas S, Mylonas M (1999) Testing for nestedness
in the terrestrial isopods and snails of Kyklades islands (Aegean
archipelago, Greece). Ecography 22:384–395
Sgardelis S, Margaris N (1992) Effects of fire on birds and rodents of
a phryganic (East Mediterranean) ecosystem. Isr J Zool 38:1–8
Simaiakis SM, Martınez-Morales MA (2010) Nestedness in centipede
(Chilopoda) assemblages on continental islands (Aegean,
Greece). Acta Oecol 36:282–290
Simaiakis SM, Tjørve E, Gentile G, Minelli A, Mylonas M (2012)
The species-area relationship of centipedes (Myriapoda: Chilo-
poda): a comparison between Mediterranean island groups. Biol
J Linn Soc (in press)
Sneath PHA, Sokal RR (1973) Numerical taxonomy. Freeman, San
Francisco
Spinthakis E, Choulis D, Choremi J (1993) The birds of Chios island.
Municipality of Homeroupolis
StatSoft (2001) Statistica, ver. 6.0. StatSoft, Tulsa
Tjørve E (2009) Shapes and functions of species-area curves (II): a
review of new models and parameterizations. J Biog 36:1435–
1445
Triantis K, Mylonas M (2009) Greek Islands, biology. In: Gillespie R,
Glague DA (eds) Encyclopedia of Islands. University of
California Press, Berkeley, pp 388–392
Triantis K, Sfenthourakis S, Mylonas M (2008) Biodiversity patterns
of terrestrial isopods from two island groups in the Aegean Sea
(Greece): species–area relationship, small island effect, and
nestedness. Ecoscience 15(2):169–181
Trichas A, Lagkis A, Triantis K, Poulakakis N, Chatzaki M (2008)
Biogeographic patterns of tenebrionid beetles (Coleoptera,
Tenebrionidae) on four island groups in the south Aegean Sea.
J Nat Hist 42(5):491–511
Watson GE (1964) Ecology and evolution of passerine birds on the
Islands of the Aegean Sea. PhD thesis, Yale University
Whittaker RJ, Fernandez-Palacios JM (2007) Island biogeography:
ecology, evolution, and conservation, 2nd edn. Oxford Univer-
sity Press, Oxford
Wilcox BA (1978) Supersaturated island faunas: a species-area
relationship for lizards on post-Pleistocene land-bridge islands.
Science 199:996–998
Wright DH, Patterson BD, Mikkelson GM et al (1998) A comparative
analysis of nested subset patterns of species composition.
Oecologia 113:1–20
Zar HJ (2009) Biostatistical analysis, 5th edn. Prentice Hall, NJ
J Ornithol
123
Author's personal copy


