Embed Size (px)
Citation preview
http://ips.sagepub.com/International Political Science Review
http://ips.sagepub.com/content/27/4/359The online version of this article can be found at:
DOI: 10.1177/0192512106067358
2006 27: 359International Political Science ReviewAndré Freire
Bringing Social Identities Back In: The Social Anchors of Left-Right Orientation in Western Europe
Published by:
http://www.sagepublications.com
On behalf of:
International Political Science Association (IPSA)
can be found at:International Political Science ReviewAdditional services and information for
http://ips.sagepub.com/cgi/alertsEmail Alerts:
http://ips.sagepub.com/subscriptionsSubscriptions:
http://www.sagepub.com/journalsReprints.navReprints:
http://www.sagepub.com/journalsPermissions.navPermissions:
http://ips.sagepub.com/content/27/4/359.refs.htmlCitations:
What is This?
- Oct 25, 2006Version of Record >>
at Chongqing Library on October 11, 2013ips.sagepub.comDownloaded from at Chongqing Library on October 11, 2013ips.sagepub.comDownloaded from at Chongqing Library on October 11, 2013ips.sagepub.comDownloaded from at Chongqing Library on October 11, 2013ips.sagepub.comDownloaded from at Chongqing Library on October 11, 2013ips.sagepub.comDownloaded from at Chongqing Library on October 11, 2013ips.sagepub.comDownloaded from at Chongqing Library on October 11, 2013ips.sagepub.comDownloaded from at Chongqing Library on October 11, 2013ips.sagepub.comDownloaded from at Chongqing Library on October 11, 2013ips.sagepub.comDownloaded from at Chongqing Library on October 11, 2013ips.sagepub.comDownloaded from at Chongqing Library on October 11, 2013ips.sagepub.comDownloaded from at Chongqing Library on October 11, 2013ips.sagepub.comDownloaded from at Chongqing Library on October 11, 2013ips.sagepub.comDownloaded from at Chongqing Library on October 11, 2013ips.sagepub.comDownloaded from at Chongqing Library on October 11, 2013ips.sagepub.comDownloaded from at Chongqing Library on October 11, 2013ips.sagepub.comDownloaded from at Chongqing Library on October 11, 2013ips.sagepub.comDownloaded from at Chongqing Library on October 11, 2013ips.sagepub.comDownloaded from at Chongqing Library on October 11, 2013ips.sagepub.comDownloaded from at Chongqing Library on October 11, 2013ips.sagepub.comDownloaded from at Chongqing Library on October 11, 2013ips.sagepub.comDownloaded from
Bringing Social Identities Back In: The Social Anchors of Left–Right Orientation
in Western Europe
ANDRÉ FREIRE
ABSTRACT. This article seeks to show that the relative weight of socialfactors in explaining individual left–right self-placement, vis-a-vis valuesand partisan loyalties, is very important, contrary to the poor resultsshown by prior studies. The bias in previous literature was due to the factthat the models used for social factors were underspecified: they includedonly structural and organizational dimensions and ignored social identity.However, when the model was correctly specified by adding indicators ofsocial identity, it was possible to reach an opposite conclusion. The casesstudied were 12 western European countries (Portugal, Spain, France,Great Britain, Germany, Austria, Italy, the Netherlands, Denmark,Belgium, Sweden, and Ireland) in 1990 and 1999.
Keywords: • Europe • Left–right orientation • Social identities
The Importance and Meaning of the Left–Right Divide in Mass PoliticsSince the French Revolution, the idea of a left–right divide has gained greatimportance in modern mass politics. Indeed, Jean Laponce (1981: 56) views it as atype of “political Esperanto” (see also Fuchs and Klingemann, 1990: 205).
Since the 1950s, various authors have argued that we are witnessing “the end ofideology” (Bell, 2000; Lipset, 1987) or, more recently, “the end of history”(Fukuyama, 1989). However, it has been argued that these theses are themselvesideological and, more importantly, have been at least partly falsified by theemergence of the “new left” and “new right” since the 1960s and, more recently,by the revival of fundamentalism and nationalism (Eatwell, 2003: 279–90;Heywood, 2003: 319–23).
Applying a more philosophical approach, Giddens (1996, 2000) has contendedthat in recent times the major differences between left and right have been
International Political Science Review (2006), Vol 27, No. 4, 359–378
DOI: 10.1177/0192512106067358 © 2006 International Political Science AssociationSAGE Publications (London, Thousand Oaks, CA and New Delhi)
overcome. On the other hand, Norberto Bobbio (1995: 95–101) has argued thatsocial inequalities remain a very important political issue, although now more at aworld level (separating the North and the South), thus providing a renewed basefor the left–right factor to maintain its prominence.
At an empirical level, Peter Mair (1998: 131–6) has demonstrated the decline ofideological polarization between the major political parties in the westernEuropean democracies during the 1980s and the 1990s. However, studies with alonger time perspective have shown that, in many countries, the decline inideological polarization is not a linear phenomenon (Budge and Klingemann,2001: 19–50; Gunther and Diamond, 2003: 187, 191–3).
Finally, studies of electoral behavior have shown that individuals’ left–right self-placement is a major predictor of their voting choices, and that its importance hasbeen increasing in many countries over recent decades (Franklin et al., 1992;Gunther and Montero, 2001). Consequently, there is considerable evidence tosuggest that there is little empirical support for the “end of ideology” thesis, andthat, particularly at the individual level, the left–right divide is still a veryimportant information-economizing device, enabling electors to cope withpolitical complexities, at least in western Europe.
Ever since Inglehart and Klingemann’s seminal work (1976), there has been aconsensus that individuals’ self-placement on the left–right axis has three majorcomponents: social, value, and partisan. The social component refers to theconnections between citizens’ locations in the social structure, plus theircorresponding social identities, and their left–right orientation (Inglehart andKlingemann, 1976: 245). The value or ideological component refers to the linkbetween an individual’s left–right self-placement and his attitude toward the majorvalue conflicts in western democratic mass politics, be they socioeconomic,religious, or the “new politics” (Huber, 1989; Inglehart and Klingemann, 1976:244; Knutsen, 1995, 1997). Finally, the partisan component of left–right self-placement refers to the part of any individual’s ideological orientation reflectingmainly partisan loyalties (Fuchs and Klingemann, 1990: 207; Huber, 1989;Inglehart and Klingemann, 1976: 244; Knutsen, 1997).
Inglehart and Klingemann (1976: 264–9) argue that the impact of the socialcomponent is rather small, especially when compared to the partisan dimension.Perhaps it is because of Inglehart and Klingemann’s poor results for the impact ofsocial factors on individuals’ left–right self-placement that that dimension hasbeen largely neglected (Borre, 2001: 83–98; Huber, 1989; Knutsen, 1995, 1997,2002) or only marginally considered since (Inglehart, 1984, 1990, 1991). Thisarticle seeks to show that the relative weight of social factors in explainingindividual left–right self-placement is very important (both per se and vis-à-visvalues and partisan loyalties) and that the poor results of prior studies are duelargely to problems in model specification. Additionally, it will be shown that,when correctly specified, the impact of social factors on left–right orientation isgreater among the younger generation in many countries than among theirelders. For both these reasons, this article will argue that the social anchors of leftand right are elements that should no longer be ignored by future studies. Thecountries under consideration (Portugal, Spain, France, Great Britain, Germany,Austria, Italy, the Netherlands, Denmark, Belgium, Sweden, and Ireland) arethose western European states that fielded both the World Values Survey 1990(WVS 1990) and the European Value Study 1999 (EVS 1999). We will return tothis subject later.
360 International Political Science Review 27(4)
Defining Social Factors and Measuring their Impact on the Left–Right Divide
This article argues that in order for the social anchors of citizens’ left–rightorientations to be properly assessed, they must be correctly specified, that is,measured using three dimensions: socio-structural divisions and their organiza-tional and identity expressions.1 For this definition of social factors, we have beeninspired by cleavage theory (Bartolini, 2000: 15–25; Bartolini and Mair, 1990: 215).However, our definition of social factors and of their impact on political attitudesand behavior is significantly different from that of cleavages (as defined byBartolini and Mair), as will be seen below.
According to Stefano Bartolini (2000: 16), “the concept of cleavage has beenregarded as a link between social structure and political order, and – in much thesame way as the Marxist concept of class – it should not be considered as adescriptive concept aimed at the identification of a particular reality.” There aremany different definitions of cleavage (Lane and Ersson, 1999: 37–44). From ourstandpoint, the best systematic definition of cleavage is the one proposed byBartolini and Mair (1990: 215) and Bartolini (2000: 15–25). According toBartolini (2000: 16–17):
the concept of cleavage can be seen to incorporate three dimensions: anempirical element, which identifies the empirical referent of the concept andwhich we can define in sociostructural terms; a normative element, that is, theset of values and beliefs that provides a sense of identity and role to theempirical element and reflects the self-awareness of the social group(s)involved; and an organizational/behavioural element, that is, the set ofindividual interactions, institutions, and organizations, such as political parties,that develop as part of the factor.
This definition stresses the necessary sociopolitical articulation of social divisionsin order for them to become relevant for the political realm.
Basically, in our definition of social factors, we will follow that tripartitespecification, and consider that the social factors that are relevant for the politicalarena have three fundamental dimensions: socio-structural, organizational, andnormative/identity. However, our definition of social factors (or social anchors) isdifferent from that of cleavage proposed by the authors mentioned above in atleast two ways. First, we will exclude parties from the social factors’ organizationalcomponent and consider only those organized interests (churches, trade unions,employers’ associations, and so on) that articulate the social divisions in asociopolitical (that is, pre-political) fashion.
Second, Bartolini (2000: 17) considers that “the term ‘cleavage’ should . . . berestricted to the indication of a dividing line in a polity that refers to andcombines all three aspects, and alternative terms should be adopted whenreferring to objective social distinctions or to ideological, political, andorganizational divisions per se.” Knutsen and Scarbrough (1995: 500) follow asimilar line of argument when they refer to “cleavage voting” (in a similar vein, seealso Kriesi, 1998: 167). Our definition of social factors (or social anchors) isdifferent from that of cleavage because it assumes that the three aspects of socialfactors (structural, organizational, and normative/identity) do not all need to bepresent at the same time, especially in terms of their effects upon politicalattitudes and behavior at the individual level. Thus, we will not restrict the effects
FREIRE: Bringing Social Identities Back In 361
of social factors upon citizens’ left–right orientations to the impact of socialstructure mediated through the organizational and identity components. On thecontrary, we argue that the independent impacts of the organizational and theidentity components vis-a-vis social structure should also be considered as effectsof social factors. For example, we consider that, even without being a manualworker or a member of a trade union, an individual who identifies himself withtrade unions will be more prone to place himself on the left (than an individualwho does not identify himself with trade unions), and we consider that that is aneffect of social factors (exclusively through social identity, however) uponleft–right attitudes. At least, this is a sociopsychological effect (Campbell et al.,1980) with a social factor (group polarization) at its very root.
Moreover, the “new politics” hypothesis insists that the erosion of the impact ofsocial cleavages upon electoral behavior characteristic of the “old politics” isassociated with the increasing impact of values on voting preferences (Inglehart,1984: 32; 1991: 279–85; see also Knutsen and Scarbrough, 1995: 496). Thisrationale can be expanded to predict that the effects of individuals’ positionswithin the social structure on their left–right attitudes are eroding, but that aconcomitant increase in the importance of (subjective) social identity for theirleft–right orientations can be expected also. If these expectations do hold, wecould say that we are in the presence of a kind of “new politics” syndrome.
Let us pass to the operationalization of social factors, following the above-mentioned definition and using the data available in the World Values Survey1990 and the European Value Study 1999. First, we have the dimension that refersto the “structural component” of social factors. The indicators for this areoccupation (for social class) and church attendance (for the religious factor) (seethe Appendix for all operational definitions of concepts). Some might say thatchurch attendance is not the best index for the structural dimension of thereligious divide, namely because it has been said to be a good surrogate forreligious values (Jagodzinski and Dobbelaere, 1995: 87–91). Although we mustrecognize that this is true, there are also good reasons for the use of churchattendance. First, many previous studies have also used the indicator in this way,and thus, by using it, we augment the possibility of longitudinal comparisons.Second, church attendance is a good surrogate for religious values, but it is, firstand foremost, a direct indicator of religious practice, and thus of the structuraldimension of the religious divide. Third, the use of the best alternative indicatorfor this dimension (that is, “religious belonging [to any denomination],” forwhich, see the Appendix) might not be well suited to measure “church religiosity”in at least some of the Catholic countries studied (where religion is, or was, a veryimportant cleavage) because there is hardly any variance in that indicator there(in many of these countries the percentage of Roman Catholics in the populationis around 80–90 percent or more, and the electorate without religious belonging israther small). Nevertheless, we will test all our models using “church attendance”and, alternatively, using “religious belonging (to any denomination).”
In terms of the second dimension of social factors, which we shall call the“organizational component,” the indicators are union membership (for socialclass) and membership in religious organizations (for the clerical–secular divide).Note that in this case we are talking about formal membership in professional(trade unions) or religious associations (religious organizations). The latterindicator is different from “religious belonging,” that is, belonging to any religiousdenomination (see Appendix).
362 International Political Science Review 27(4)
Finally, a third dimension, which we will refer to as the “identity component” ofsocial factors, is supposed to tap social identity. Social identity is measuredthrough individual attitudes toward the social groups, interest organizations, andinstitutions that represent them: “trust in unions” and “trust in major companies”(for the opposite poles of the social class divide) and “trust in the church” (for thereligious divide). These indicators of “social identity” are far from perfect, but theyare the best available in the two surveys (World Values Survey 1990 and EuropeanValue Study 1999). Moreover, we believe that these items can be said to be goodsurrogates for the “identity component” of social factors.2
DataAs already mentioned, the three sets of social bases indicators are present in thesurveys that will be used in this article: the World Values Survey 1990 and theEuropean Value Study 1999. These surveys allow the use of extensive batteries ofitems for the value component, enabling a comparison of the relative weight ofthe social, value, and partisan dimensions of individual left–right self-placementwith a good specification for each of these components. Moreover, practically allthe items chosen were repeated in the questionnaires for the 1990 and 1999surveys, and, when they were not, there are good substitutes. The 1980 WorldValues Survey was not used because many of the items contained in the 1990 and1999 surveys were not present. Only those western European democracies thatparticipated in both the 1990 and 1999 surveys were included.3
Social Factors and Left–Right OrientationBased on data from the WVS 1990 and EVS 1999 surveys, Table 1 presents theimpact of the structural, organizational, and identity components of social factorson individual left–right orientation. These data are presented by country and byyear. The dependent variable is individual left–right self-placement, while theindependent variables are the different sets of indicators for each dimension ofthe social factors, introduced in steps. The introduction of each set of variables inthe Ordinary Least Squares (OLS) regression equations by blocks allows us toestimate the variance of left–right orientations explained by each dimension ofthe social factors.4 The use of regression models by blocks has a major short-coming, however (Gunther and Montero, 2001: 113–4). It overestimates theeffects of the independent variables introduced in step one, because in this caseboth absolute and relative impacts on the dependent variable are being estimatedwith no control variables being introduced. The effects of the independentvariables introduced in the next steps, on the other hand, can be said to beunderestimated because only the relative effects (vis-a-vis all indicators introducedin previous steps) are being considered. That is to say that in the present analysis,the model overestimates the impact of the structural component of social factorson individual left–right self-placement and underestimates the effects of both theorganizational and the identity components. Since the same procedure is used indifferent years and countries, however, the approach is perfectly suited to bothlongitudinal and comparative analyses.
From the analysis of Table 1 it is possible to conclude that, with a saturatedmodel for the “social factors,” the effects of “social factors” on individual self-placement along the left–right scale are now much more important than with a
FREIRE: Bringing Social Identities Back In 363
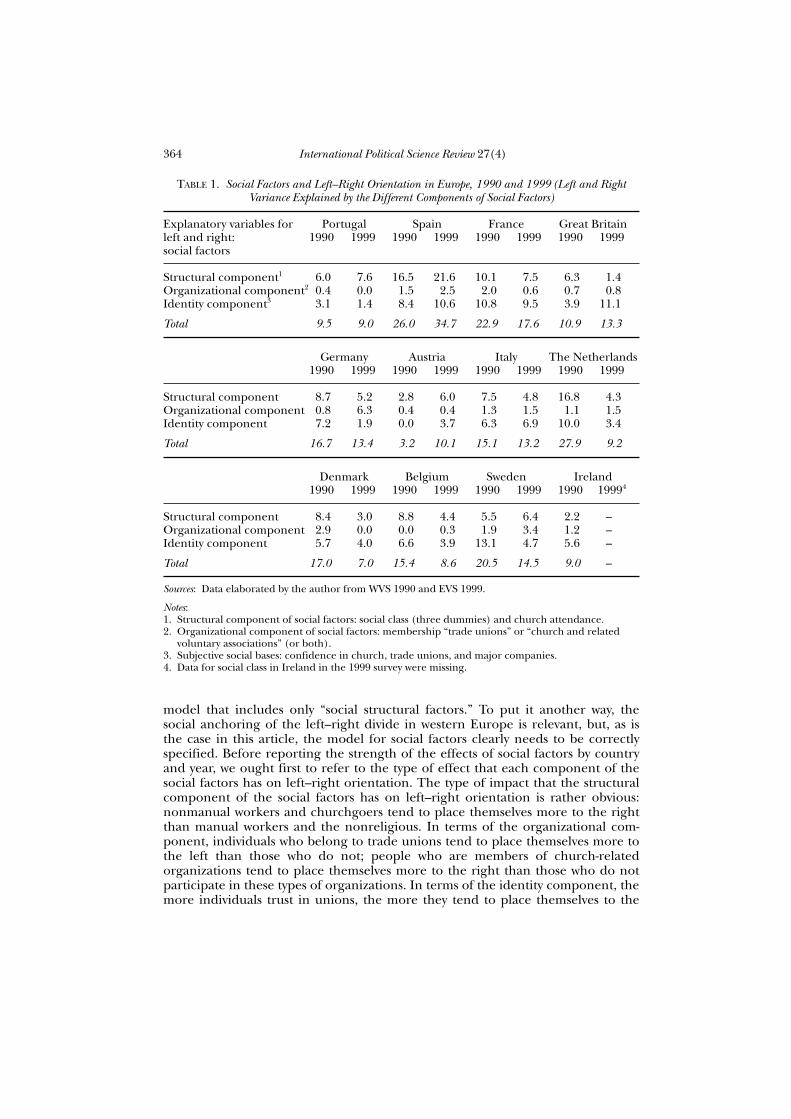
model that includes only “social structural factors.” To put it another way, thesocial anchoring of the left–right divide in western Europe is relevant, but, as isthe case in this article, the model for social factors clearly needs to be correctlyspecified. Before reporting the strength of the effects of social factors by countryand year, we ought first to refer to the type of effect that each component of thesocial factors has on left–right orientation. The type of impact that the structuralcomponent of the social factors has on left–right orientation is rather obvious:nonmanual workers and churchgoers tend to place themselves more to the rightthan manual workers and the nonreligious. In terms of the organizational com-ponent, individuals who belong to trade unions tend to place themselves more tothe left than those who do not; people who are members of church-relatedorganizations tend to place themselves more to the right than those who do notparticipate in these types of organizations. In terms of the identity component, themore individuals trust in unions, the more they tend to place themselves to the
364 International Political Science Review 27(4)
TABLE 1. Social Factors and Left–Right Orientation in Europe, 1990 and 1999 (Left and RightVariance Explained by the Different Components of Social Factors)
Explanatory variables for Portugal Spain France Great Britainleft and right: 1990 1999 1990 1999 1990 1999 1990 1999social factors
Structural component1 6.0 7.6 16.5 21.6 10.1 7.5 6.3 1.4Organizational component2 0.4 0.0 1.5 2.5 2.0 0.6 0.7 0.8Identity component3 3.1 1.4 8.4 10.6 10.8 9.5 3.9 11.1
Total 9.5 9.0 26.0 34.7 22.9 17.6 10.9 13.3
Germany Austria Italy The Netherlands1990 1999 1990 1999 1990 1999 1990 1999
Structural component 8.7 5.2 2.8 6.0 7.5 4.8 16.8 4.3Organizational component 0.8 6.3 0.4 0.4 1.3 1.5 1.1 1.5Identity component 7.2 1.9 0.0 3.7 6.3 6.9 10.0 3.4
Total 16.7 13.4 3.2 10.1 15.1 13.2 27.9 9.2
Denmark Belgium Sweden Ireland1990 1999 1990 1999 1990 1999 1990 19994
Structural component 8.4 3.0 8.8 4.4 5.5 6.4 2.2 –Organizational component 2.9 0.0 0.0 0.3 1.9 3.4 1.2 –Identity component 5.7 4.0 6.6 3.9 13.1 4.7 5.6 –
Total 17.0 7.0 15.4 8.6 20.5 14.5 9.0 –
Sources: Data elaborated by the author from WVS 1990 and EVS 1999.
Notes: 1. Structural component of social factors: social class (three dummies) and church attendance.2. Organizational component of social factors: membership “trade unions” or “church and related
voluntary associations” (or both).3. Subjective social bases: confidence in church, trade unions, and major companies.4. Data for social class in Ireland in the 1999 survey were missing.
left; while the more individuals trust in church organizations or in major com-panies (or both), the more they tend to place themselves to the right.
The strength of left–right social anchoring is as follows (and is significant, atleast compared to previous studies of this subject). In five out of 23 cases, theleft–right variance explained by social factors was more than 20 percent; this istrue of Spain (1990 and 1999), France (1990), the Netherlands (1990), andSweden (1990). Some six countries had variance values explained by social factorsof 14–19 percent: France (1999), Germany (1990), Italy (1990), Denmark (1990),Belgium (1990), and Sweden (1999). A total of 11 cases had a left–right varianceexplained by social factors of 14 percent or greater. Moreover, of the 12 remainingcases, only three had values of less than 9 percent.
Another conclusion that can be derived from an analysis of Table 1 is that the“organizational” dimension of the social factors has the least impact on individualleft–right self-placement. The only exceptions to this are the cases of Germany(1999) and Austria (1990), where the organizational element is stronger than thesubjective. Usually, the structural dimension is more important in explainingindividual left–right orientation, but, as we have seen, the procedures used for thestatistical model also contribute to these results. Taking this technical shortcominginto consideration means that it is significant that in seven of the 23 cases (Francein 1990 and 1999, Great Britain in 1999, Italy in 1999, Denmark in 1999, Swedenin 1990, and Ireland in 1990) the attitudinal element of the social factors is moreimportant than the structural in explaining individuals’ left–right self-placement.
We also tested the model using “religious belonging” instead of “churchattendance” as the indicator of the structural dimension of the religious divide.Although these results are not shown due to spatial limitations, they are rathersimilar to those presented in Table 1 in terms of the levels of variance in left–rightorientation explained by social factors in the different countries. However, there isa major difference: when using “religious belonging” instead of “church atten-dance,” we see that in 10 out of 22 cases (45 percent) the structural component ofsocial factors is more important than the identity component in explainingleft–right orientation; in 12 out of 22 cases (55 percent) it is exactly the other wayaround. On the contrary, Table 1 shows that in only six out of 23 cases (26percent) was the identity component of social factors more important than thestructural component in explaining left–right orientation. This is, of course, whatwas expected (that is, that the use of “religious belonging” instead of “churchattendance” would depress the weight of the structural component). However, theoverall impact of social factors on the left–right divide does not change muchbecause the impact of the identity component somehow compensates for thedecline in the weight of the structural factors.
The OLS regression model relies on the assumption that the independentvariables in the equation are not a linear combination of each other (that is, thereis no multicollinearity between them) (Gujarati, 1995: 319–22). If there ismulticollinearity (perfect or high), it is either impossible or very difficult todisentangle the effects of each independent variable. However, we should bear inmind that “the meaningful distinction is not between the presence and theabsence of multicollinearity, but between its various degrees” (Gujarati, 1995:335). Using the “tolerance index” for multicollinearity diagnosis in multiple OLSregression (Gujarati, 1995: Ch. 10, 335–9),5 we conclude the following: thediagnosis based on the “tolerance index” indicates that multicollinearity is not asevere problem in our data; on the contrary, only some low (“tolerance index”
FREIRE: Bringing Social Identities Back In 365
equal to or greater than 0.6) to moderate (“tolerance index” lower than 0.6; innone of the cases is the measure less than 0.455) multicollinearity exists (data notshown). Moreover, we can say that, at least in terms of the social anchors ofcitizens’ left and right orientations, moderate multicollinearity refers to only fourcountries from the set of 12.
The Evolving Effects of Social Factors on Left–Right OrientationIn a recent study (Freire, 2006), which considered individual self-placement alongthe left–right scale as the dependent variable and “occupation” and “churchattendance” as independent variables, OLS regression was used to estimate theimpact of the latter on the former across countries (the 12 nations considered inthe present article, plus Greece) and across time (1976–2002). The author usedcomparative survey data from several sources. Two major conclusions werereached. First, the joint impact of occupation and church attendance (which herewe have called the “structural component” of social factors) on left–right orien-tation is, and always has been, rather weak: in only three nations was the left–rightvariance that can be explained by the structural component greater than 10percent; for all other countries, the level of ideological anchoring in the socialstructure has always been between 4 percent and 6 percent, or even less. Second,the variations in left–right variance (explained by class and religion) in eachcountry across time are usually not high, but they do show that a general trendtoward the erosion of the (already low) socio-structural bases of left–right orien-tations seems to have been taking place between 1976 and 2002. The findings ofVan der Eijk et al. (2005: 167–74) are in a similar vein, although for a muchsmaller subset of countries.
As we have already shown, the model containing only the structural componentof social factors is rather underspecified. We can rely on only two surveys (WVS1990 and EVS 1999) to test the full model. Under these limited conditions, theusual approach to the study of social change is to compare the attitudes andbehavior of a younger group with those of an older group. If a long-term struc-tural change is taking place, then systematic differences between the generationsshould be evident (Taris, 2000: 12–14). In terms of political attitudes and behavior,the dividing line is normally considered to be between those individuals who wereborn before 1945 and those born after that year – those born before and thoseborn since the end of the Second World War (Inglehart, 1990: 73–101). Thus, inTable 2, the variance in individual left–right self-placement that can be explainedby the completely specified model for social factors (that is, with all three dimen-sions included) is compared across the generations. Following Knutsen (1995: 75),only differences between the two groups exceeding 3 percent are consideredstatistically relevant.
As we said before, the “new politics” hypothesis argues that the erosion of theimpact of social cleavages upon political behavior characteristic of the “old politics”is associated with the increasing impact of values on voting preferences (Inglehart,1984: 32; 1991: 279–85; see also Knutsen and Scarbrough, 1995: 496). Thisrationale can be expanded so as to consider not only that the effects of individuals’positions within the social structure on their left–right attitudes are eroding (as wesaw above), but that a concomitant increase in the importance of (subjective) socialidentities for left–right orientations can be expected. To confirm this hypothesis, agreater degree of social anchoring of left–right attitudes in those born since 1945
366 International Political Science Review 27(4)
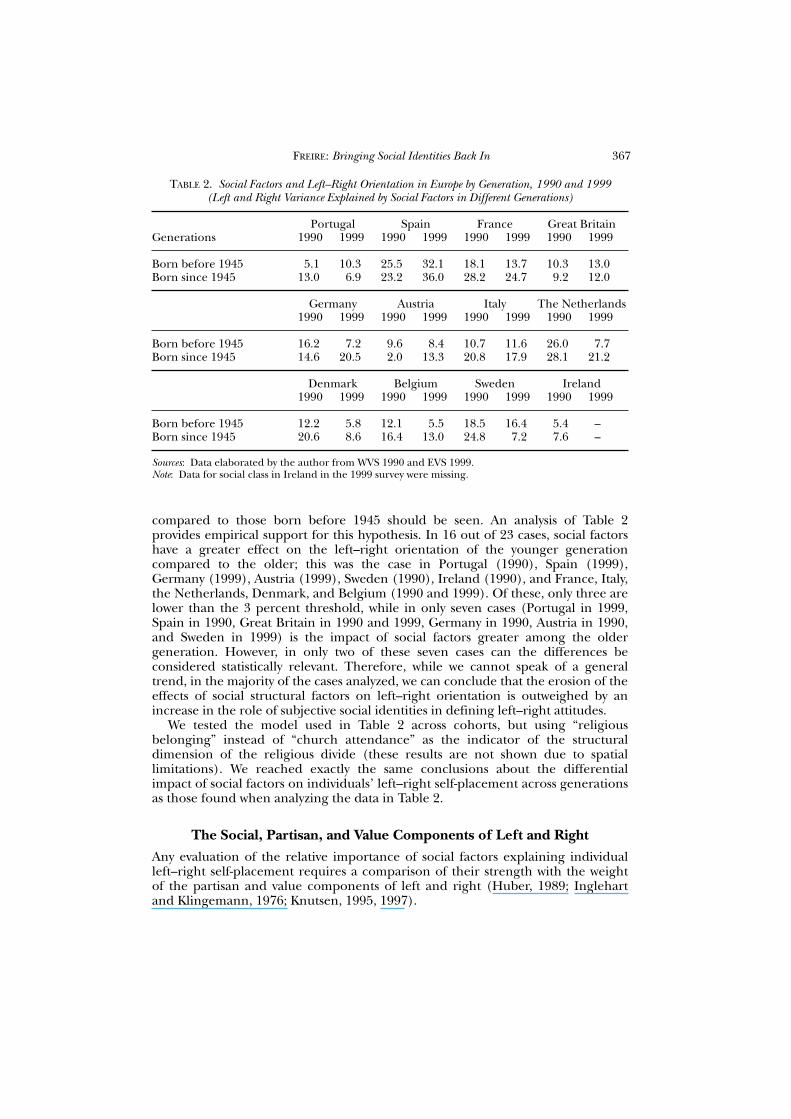
compared to those born before 1945 should be seen. An analysis of Table 2provides empirical support for this hypothesis. In 16 out of 23 cases, social factorshave a greater effect on the left–right orientation of the younger generationcompared to the older; this was the case in Portugal (1990), Spain (1999),Germany (1999), Austria (1999), Sweden (1990), Ireland (1990), and France, Italy,the Netherlands, Denmark, and Belgium (1990 and 1999). Of these, only three arelower than the 3 percent threshold, while in only seven cases (Portugal in 1999,Spain in 1990, Great Britain in 1990 and 1999, Germany in 1990, Austria in 1990,and Sweden in 1999) is the impact of social factors greater among the oldergeneration. However, in only two of these seven cases can the differences beconsidered statistically relevant. Therefore, while we cannot speak of a generaltrend, in the majority of the cases analyzed, we can conclude that the erosion of theeffects of social structural factors on left–right orientation is outweighed by anincrease in the role of subjective social identities in defining left–right attitudes.
We tested the model used in Table 2 across cohorts, but using “religiousbelonging” instead of “church attendance” as the indicator of the structuraldimension of the religious divide (these results are not shown due to spatiallimitations). We reached exactly the same conclusions about the differentialimpact of social factors on individuals’ left–right self-placement across generationsas those found when analyzing the data in Table 2.
The Social, Partisan, and Value Components of Left and RightAny evaluation of the relative importance of social factors explaining individualleft–right self-placement requires a comparison of their strength with the weightof the partisan and value components of left and right (Huber, 1989; Inglehartand Klingemann, 1976; Knutsen, 1995, 1997).
FREIRE: Bringing Social Identities Back In 367
TABLE 2. Social Factors and Left–Right Orientation in Europe by Generation, 1990 and 1999 (Left and Right Variance Explained by Social Factors in Different Generations)
Portugal Spain France Great BritainGenerations 1990 1999 1990 1999 1990 1999 1990 1999
Born before 1945 5.1 10.3 25.5 32.1 18.1 13.7 10.3 13.0Born since 1945 13.0 6.9 23.2 36.0 28.2 24.7 9.2 12.0
Germany Austria Italy The Netherlands1990 1999 1990 1999 1990 1999 1990 1999
Born before 1945 16.2 7.2 9.6 8.4 10.7 11.6 26.0 7.7Born since 1945 14.6 20.5 2.0 13.3 20.8 17.9 28.1 21.2
Denmark Belgium Sweden Ireland1990 1999 1990 1999 1990 1999 1990 1999
Born before 1945 12.2 5.8 12.1 5.5 18.5 16.4 5.4 –Born since 1945 20.6 8.6 16.4 13.0 24.8 7.2 7.6 –
Sources: Data elaborated by the author from WVS 1990 and EVS 1999. Note: Data for social class in Ireland in the 1999 survey were missing.
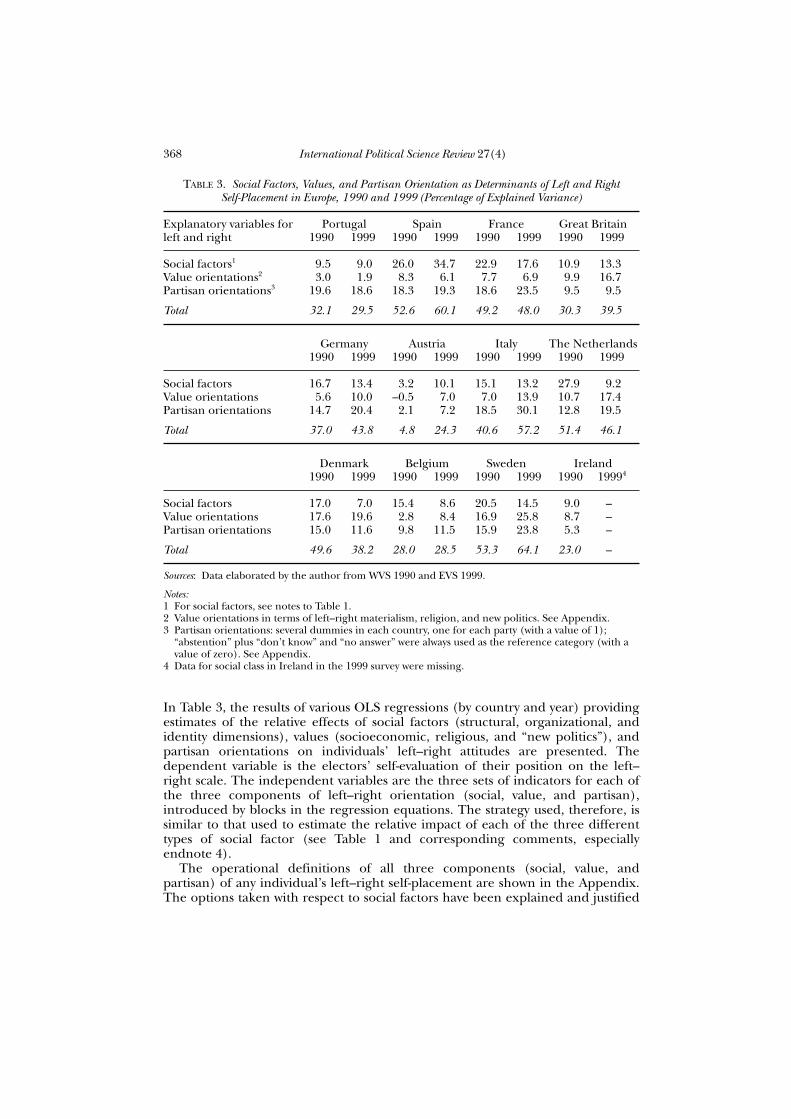
In Table 3, the results of various OLS regressions (by country and year) providingestimates of the relative effects of social factors (structural, organizational, andidentity dimensions), values (socioeconomic, religious, and “new politics”), andpartisan orientations on individuals’ left–right attitudes are presented. Thedependent variable is the electors’ self-evaluation of their position on the left–right scale. The independent variables are the three sets of indicators for each ofthe three components of left–right orientation (social, value, and partisan),introduced by blocks in the regression equations. The strategy used, therefore, issimilar to that used to estimate the relative impact of each of the three differenttypes of social factor (see Table 1 and corresponding comments, especiallyendnote 4).
The operational definitions of all three components (social, value, andpartisan) of any individual’s left–right self-placement are shown in the Appendix.The options taken with respect to social factors have been explained and justified
368 International Political Science Review 27(4)
TABLE 3. Social Factors, Values, and Partisan Orientation as Determinants of Left and Right Self-Placement in Europe, 1990 and 1999 (Percentage of Explained Variance)
Explanatory variables for Portugal Spain France Great Britainleft and right 1990 1999 1990 1999 1990 1999 1990 1999
Social factors1 9.5 9.0 26.0 34.7 22.9 17.6 10.9 13.3Value orientations2 3.0 1.9 8.3 6.1 7.7 6.9 9.9 16.7Partisan orientations3 19.6 18.6 18.3 19.3 18.6 23.5 9.5 9.5
Total 32.1 29.5 52.6 60.1 49.2 48.0 30.3 39.5
Germany Austria Italy The Netherlands1990 1999 1990 1999 1990 1999 1990 1999
Social factors 16.7 13.4 3.2 10.1 15.1 13.2 27.9 9.2Value orientations 5.6 10.0 –0.5 7.0 7.0 13.9 10.7 17.4Partisan orientations 14.7 20.4 2.1 7.2 18.5 30.1 12.8 19.5
Total 37.0 43.8 4.8 24.3 40.6 57.2 51.4 46.1
Denmark Belgium Sweden Ireland1990 1999 1990 1999 1990 1999 1990 19994
Social factors 17.0 7.0 15.4 8.6 20.5 14.5 9.0 –Value orientations 17.6 19.6 2.8 8.4 16.9 25.8 8.7 –Partisan orientations 15.0 11.6 9.8 11.5 15.9 23.8 5.3 –
Total 49.6 38.2 28.0 28.5 53.3 64.1 23.0 –
Sources: Data elaborated by the author from WVS 1990 and EVS 1999.
Notes:1 For social factors, see notes to Table 1.2 Value orientations in terms of left–right materialism, religion, and new politics. See Appendix.3 Partisan orientations: several dummies in each country, one for each party (with a value of 1);
“abstention” plus “don’t know” and “no answer” were always used as the reference category (with avalue of zero). See Appendix.
4 Data for social class in Ireland in the 1999 survey were missing.
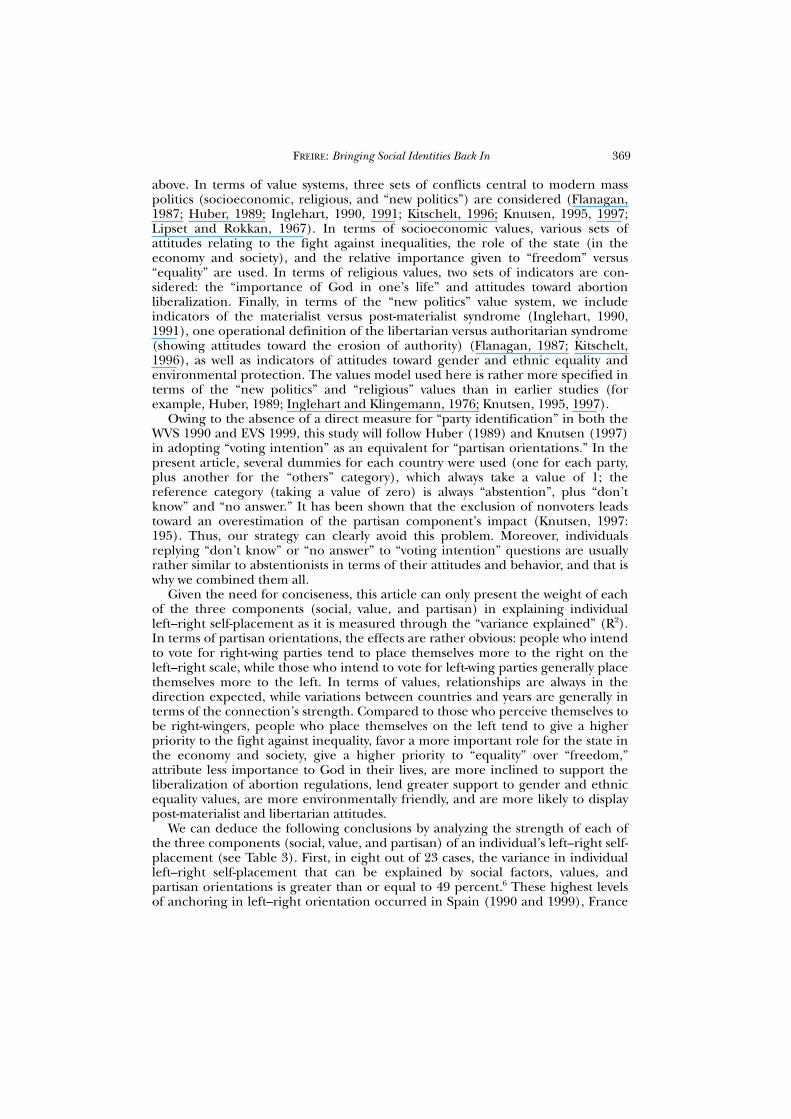
above. In terms of value systems, three sets of conflicts central to modern masspolitics (socioeconomic, religious, and “new politics”) are considered (Flanagan,1987; Huber, 1989; Inglehart, 1990, 1991; Kitschelt, 1996; Knutsen, 1995, 1997;Lipset and Rokkan, 1967). In terms of socioeconomic values, various sets ofattitudes relating to the fight against inequalities, the role of the state (in theeconomy and society), and the relative importance given to “freedom” versus“equality” are used. In terms of religious values, two sets of indicators are con-sidered: the “importance of God in one’s life” and attitudes toward abortionliberalization. Finally, in terms of the “new politics” value system, we includeindicators of the materialist versus post-materialist syndrome (Inglehart, 1990,1991), one operational definition of the libertarian versus authoritarian syndrome(showing attitudes toward the erosion of authority) (Flanagan, 1987; Kitschelt,1996), as well as indicators of attitudes toward gender and ethnic equality andenvironmental protection. The values model used here is rather more specified interms of the “new politics” and “religious” values than in earlier studies (forexample, Huber, 1989; Inglehart and Klingemann, 1976; Knutsen, 1995, 1997).
Owing to the absence of a direct measure for “party identification” in both theWVS 1990 and EVS 1999, this study will follow Huber (1989) and Knutsen (1997)in adopting “voting intention” as an equivalent for “partisan orientations.” In thepresent article, several dummies for each country were used (one for each party,plus another for the “others” category), which always take a value of 1; thereference category (taking a value of zero) is always “abstention”, plus “don’tknow” and “no answer.” It has been shown that the exclusion of nonvoters leadstoward an overestimation of the partisan component’s impact (Knutsen, 1997:195). Thus, our strategy can clearly avoid this problem. Moreover, individualsreplying “don’t know” or “no answer” to “voting intention” questions are usuallyrather similar to abstentionists in terms of their attitudes and behavior, and that iswhy we combined them all.
Given the need for conciseness, this article can only present the weight of eachof the three components (social, value, and partisan) in explaining individualleft–right self-placement as it is measured through the “variance explained” (R2).In terms of partisan orientations, the effects are rather obvious: people who intendto vote for right-wing parties tend to place themselves more to the right on theleft–right scale, while those who intend to vote for left-wing parties generally placethemselves more to the left. In terms of values, relationships are always in thedirection expected, while variations between countries and years are generally interms of the connection’s strength. Compared to those who perceive themselves tobe right-wingers, people who place themselves on the left tend to give a higherpriority to the fight against inequality, favor a more important role for the state inthe economy and society, give a higher priority to “equality” over “freedom,”attribute less importance to God in their lives, are more inclined to support theliberalization of abortion regulations, lend greater support to gender and ethnicequality values, are more environmentally friendly, and are more likely to displaypost-materialist and libertarian attitudes.
We can deduce the following conclusions by analyzing the strength of each ofthe three components (social, value, and partisan) of an individual’s left–right self-placement (see Table 3). First, in eight out of 23 cases, the variance in individualleft–right self-placement that can be explained by social factors, values, andpartisan orientations is greater than or equal to 49 percent.6 These highest levelsof anchoring in left–right orientation occurred in Spain (1990 and 1999), France
FREIRE: Bringing Social Identities Back In 369
(1990), Italy (1999), the Netherlands (1990), Denmark (1990), and Sweden (1990and 1999). Seven cases have variance levels between 35 percent and 48 percent:France (1999), Great Britain (1999), Germany (1990 and 1999), Italy (1990), theNetherlands (1999), and Denmark (1999). The remaining cases (Portugal, GreatBritain, Austria, Belgium, and Ireland) all had values of less than 35 percent.However, only Austria and Ireland had levels which were less than 28 percent.
Second, we may conclude that in eight of the 23 cases, “partisan orientation” isthe most important element in explaining left–right orientation. Countries wherethis is true are Portugal (1990 and 1999), France (1999), Germany (1999), Italy(1990 and 1999), the Netherlands (1999), and Belgium (1999). In seven of theseeight cases, the 3 percent threshold was surpassed. In 12 cases, “social factors” arethe most important in explaining left–right self-placement: Spain (1990 and1999), France (1990), Great Britain (1990 and 1999), Germany (1990), Austria(1990 and 1999), the Netherlands (1990), Belgium (1990), Sweden (1990), andIreland (1990). The 3 percent threshold was surpassed in eight out of these 12cases. In only three cases were values most important in explaining left–right self-placement: Denmark (1990 and 1999) and Sweden (1999). However, only the1999 Danish case surpassed the 3 percent threshold. In western Europe, therefore,social factors are usually the most important element in explaining an individual’sleft–right orientation (eight cases above the 3 percent threshold), although insome cases with a weight that is close to that of “partisan orientation.” Additionally,in a similar (albeit lower) number of cases (seven cases above the 3 percentthreshold), “partisan orientations” are the single most important explanatoryfactor of left–right attitudes. However, we ought to bear in mind that, in the caseof the impact of social factors on left–right orientation, both absolute and relativeeffects are being considered here, while in the case of the impact of partisanorientations, we are only considering relative effects. Nevertheless, given thecausal sequence of the explanatory factors, this approach can be consideredadequate.
We tested the same model as that in Table 3 but using “religious belonging”instead of “church attendance” as the indicator of the structural component of thereligious divide (these results are not shown due to spatial limitations). We reachrather similar conclusions to those found when analyzing Table 3. That is, socialfactors are usually the most important element in explaining an individual’sleft–right orientation (in 12 cases, of which only seven surpassed the 3 percentthreshold). “Partisan orientations” are the most important element in explainingan individual’s left–right orientation in nine cases (of which only eight surpassedthe 3 percent threshold).
Again, in order to evaluate the degree of multicollinearity in the regressionequations behind the data presented in Table 3, we used the “tolerance index.”The diagnosis based on “tolerance indices” indicates that only some low (greateror equal to 0.6) to moderate (less than 0.6) multicollinearity exists in our data.Moreover, this moderate multicollinearity relates to only five countries (Germany,Italy, Spain, Portugal, and Ireland) out of 12, and the tolerance index is never lessthan 0.404.
To estimate the impact of social factors, values, and partisan orientations uponcitizens’ left–right orientations, we used multiple regressions (OLS). Namely, wealways compared the adjusted R2 (left–right variance explained by social factors,values, and party loyalties) across nations, points in time, and cohorts. By using theadjusted R2 instead of the non-adjusted R2, we are already correcting for differ-
370 International Political Science Review 27(4)
ences in sample size and in the number of predictors in each case that can distortthe results. However, in the context of studies about “political representation,”Achen (1977) has argued that the heterogeneity that exists across samplesintroduces severe limitations for cross-sample comparisons using correlationalmeasures (Pearson r, R2, Eta correlation, and so on). According to this author,“two correlations can differ because the variances in the sample differ, not becausethe underlying relationship has changed” (Achen, 1977: 807). To solve thisproblem, Achen (1977: 813) proposes the following: “correlation measures oughtto be replaced by unstandardized regression coefficients plus the variance of theresiduals.” However, the author is not very happy with the alternative solution hehimself has proposed (Achen, 1977: 813–14). Accordingly, he concludes: “nosimple solutions will be forthcoming; certainly none will be attempted here. Buteven the modest results presented above – the frailties of the correlationcoefficient – should serve to remind us that no data are ever naked facts: theyarrive packaged in the concepts and categories we have used to collect them”(Achen, 1977: 814).
The alternative (to the adjusted R2) proposed by Achen is not well suited to thepresent study. Recall that we wanted to estimate the relative weight of each one ofthe three sets of independent variables (social factors, values, and partisanloyalties) in order to explain citizens’ left–right orientations in each country,period, and cohort; we used the same methodology to evaluate the relative weightof each component of the social factors (structural, organizational, and identity)in order to estimate electors’ left–right attitudes. We could have used the standard-ized regression coefficients (beta weights) instead, but not the unstandardizedregression coefficients, because using the latter measures we cannot compare therelative weight of predictors that are measured using different scales or havedifferent means, or both. Indeed, the beta weights are designed for theseconditions.
Perhaps because of the weakness of the alternative measures proposed byAchen, in the field of citizens’ left–right attitudes, we found only one study usingalternatives to correlational measures (unstandardized regression coefficients anddistance measures) (see Huber, 1989). Moreover, at least in this field, the morerecent studies by eminent political scientists and methodologists (and publishedin often-quoted journals) have used correlational measures (and beta weights) toestimate the impact of social structure, values, and partisan loyalties upon citizens’left–right orientations, and these measures were used to make comparisons acrosssamples, periods, and cohorts (see Knutsen, 1995, 1997; Van der Eijk et al., 2005).
Concluding RemarksPrevious studies of the individual correlates of left and right in western Europehave either revealed that the social anchoring of individuals’ ideological orien-tations was low or have only studied the value and partisan dimensions of electors’left–right self-placement. In this article, we have demonstrated that social factorsare a very important dimension in explaining individual left–right orientation.The bias in previous literature was due to the fact that the models for socialanchors were underspecified: they included only the structural and organizationaldimensions of social factors. However, when the model was correctly specified withthe addition of indicators of social identity (the “identity” dimension of socialfactors), it was possible to reach the following conclusions. First, social factors are
FREIRE: Bringing Social Identities Back In 371
a very important element in explaining left–right orientation, both in absoluteand in relative terms (compared to the partisan and value dimensions). In themajority of cases, social factors are the single most important predictor ofindividual left–right orientation.
Second, although in a longitudinal perspective the effects of the structuraldimension of social factors on individual left–right self-placement are eroded,when the full model for social factors is considered, the reverse is true in themajority of the cases analyzed here.
It must be concluded that while individuals’ positions within the social structurehave been, at least since the 1970s, of decreasing importance in the explanation oftheir left–right political orientations, “social identities” are gaining ground,particularly among the younger generations. Probably as part of a “new politics”syndrome, while social structure is losing ground, social identity is becoming moreimportant, and this latter trend outweighs the former. Considering this, we believethat future studies of political attitudes (and electoral behavior), especiallyregarding questionnaire design, should pay more attention to “social identities,”and introduce items that uncover subjective identifications with social groups,social movements, and interest organizations.
What, then, explains the differences in the effects of the social, value, andpartisan dimensions on individuals’ left–right orientations between countries?Well, this is clearly a subject for another article. However, one clue might besuggested. The countries with low (social, value, and partisan) anchoring ofcitizens’ left–right attitudes (Austria, Belgium, Ireland, and Portugal) have verydifferent socioeconomic and cultural structures and levels of development, as wellas different historical traditions. But they share a common political feature: partysystems that present low levels of ideological polarization along the left–rightspectrum. So, perhaps the level of ideological polarization in the party systemmight help us to understand the differences between countries in terms ofcitizens’ left–right orientations.
Some may raise doubts about the use of correlational measures to makecomparisons across nations, time periods, and cohorts. However, the alternativesthat have been proposed are not entirely satisfactory. Perhaps because of theweakness and lack of flexibility of such alternatives, the more recent literatureabout citizens’ left–right orientations has relied extensively on correlationalmeasures. Thus, future research should look for more flexible and reliablemeasures (to function as alternatives to correlational measures) so that we cancross-validate the results found in the present study, as well as in other studiesabout the same subject.
Appendix
Operational Definition of Concepts Used1. Social Factors
1.A. Social Factors: Structural Component
1.A.i Social Class Typology
Social class typology is based on occupation and number of employees.
(1) Bourgeoisie and petite bourgeoisie (employers and self-employed).
372 International Political Science Review 27(4)
(2) Service class (salaried higher- and middle-level professionals).(3) Routine nonmanual workers (clerks and so on).(4) Manual workers (industry and agriculture).
In regression analysis, three dummies were used; the reference group was alwaysthe “manual workers” category (0).
1.A.ii Religious Belonging
Do you belong to a religious denomination?
(1) Yes; (0) No.
1.A.iii Church Attendance
Apart from weddings, funerals, and christenings, about how often do you attendreligious services?
(8) More than once a week . . . (1) Never, practically never.
1.B. Social Factors: Organizational Component
Please look carefully at the following list of voluntary organizations and activitiesand indicate . . . in which, if any, are you a member?
1.B.i Trade Unions and Religious or Church Organizations
(1) Member; (0) Nonmember.
1.C. Social Factors: Identity Component
Please look at this card and, for each item listed, indicate how much confidenceyou have in it. Is it (4) a great deal, (3) quite a lot, (2) not very much, (1) none atall?
Confidence (1) in trade unions, (2) in major companies,7 and (3) in theChurch.
2. Value Orientations
2.A. Left and Right Materialism
2.A.i. Attitudes Toward Inequalities
WVS 1990: Now I’d like you to tell me your views on various issues. How would youplace your views on this scale? (1) means you agree completely with the statementon the left, (10) means you agree completely with the statement on the right, oryou can choose any number in between. (Ten-point scale from 1–10.)
(a) (1) Incomes should be made more equal; (10) There should be greaterincentives for individual effort.8
EVS 1999: In order to be considered “just,” what should a society provide? Pleasetell me for each statement if it is important or unimportant to you. (5) means veryimportant; (1) means not important at all. (Five-point scale from 1–5.)
(b) Eliminating big inequalities in income between citizens.
FREIRE: Bringing Social Identities Back In 373
2.A.ii. Index for the Role of the State and Competition
Now I’d like you to tell me your views on various issues. How would you place yourviews on this scale? (1) means you agree completely with the statement on the left,(10) means you agree completely with the statement on the right, or you canchoose any number in between. (Ten-point scale from 1–10.)
(a) (1) Private ownership of business and industry should be increased; (10)Government ownership of business and industry should be increased.9
(b) (1) Individuals should take more responsibility for providing forthemselves; (10) The state should take more responsibility to ensurethat everyone is provided for.
(c) (1) Competition is good. It stimulates people to work hard and develop newideas; (10) Competition is harmful. It brings out the worst in people.
Additive Index (a + b + c): (3) Minimum role for the state; good role forcompetition; (30) Maximum role for the state; bad role for competition.
2.A.iii. Equality Versus Freedom
Which of these two statements comes closest to your own opinion?
A. I find that both freedom and equality are important. But if I were to chooseone or the other, I would consider personal freedom more important, that is,everyone can live in freedom and develop without hindrance.B. Certainly both freedom and equality are important. But if I were to chooseone or the other, I would consider equality more important, that is, that nobodyis underprivileged and that social class differences are not so strong.
(1) Agree with statement A; (2) Agree with neither/depends; (3) Agree withstatement B.
2.B. Religious Values
2.B.i. Importance of God in One’s Life
How important is God in your life? Please use this card to indicate – 10 means veryimportant and 1 means not at all important. (Ten-point scale from 1–10).
2.B.ii. Index of Attitudes Toward Abortion
Do you approve or disapprove of abortion under the following circumstances?Approve (2); Disapprove (1).
(a) Where the woman is not married; (b) Where a married couple do not wantto have any more children.
Additive Index (a + b): (2) Total disapproval; (4) Total approval.
2.C. Values of the New Politics
2.C.i. Index of Environmental Attitudes
I am now going to read out some statements about the environment. For each oneI read out, can you tell me whether you agree strongly (4), agree (3), disagree (2)or strongly disagree (1)?
374 International Political Science Review 27(4)

(a) I would give part of my income if I were certain that the money would beused to prevent environmental pollution.
(b) I would agree to an increase in taxes if the extra money is used to preventenvironmental pollution.
Additive Index (a + b): (2) No own money to protect the environment; (8)Maximum availability to contribute money to protecting the environment.
2.C.ii. Libertarian Versus Authoritarian Attitudes
Do you agree or disagree with the following statements?
Agree (3), Neither (2), Disagree (1).
(a) When jobs are scarce, men have more right to jobs than women.(b) When jobs are scarce, employers should give priority to British people over
immigrants (countries other than the UK: please substitute yournationality).
Here is a list of various changes in our way of life that might take place in the nearfuture. Please tell me for each one, if it were to happen, whether you think itwould be a good thing (3), a bad thing (1), or don’t you mind (2)?
(c) Greater respect for authority.
2.C.iii. Materialism Versus Post-Materialism Index
There is a lot of talk these days about what the aims of this country should be forthe next 10 years. On this card are listed some of the goals which different peoplewould give top priority. Would you please say which one of these you yourselfconsider the most important? And which would be the next most important?
(1) Maintaining order in the nation.(2) Giving people more say in important government decisions.(3) Fighting rising prices.(4) Protecting freedom of speech.
Following usual procedures, an index was constructed with the following values:(1) post-materialism; (2) mixed; (3) materialism. In regression analysis, twodummies were used, with “materialism” as the reference group (0).
3. Partisan Orientations
3.i. Voting Intention Recoded as Several Dummy Variables
For each country, several dummies were created (one for each party, plus anotherfor the “others” category) that always assume the value 1.
The reference category (0) is always “abstention,” plus “don’t know” and “noanswer.”
4. Dependent Variable: Left–Right Self-Placement
In political matters, people talk of “the left” and “the right.” How would you placeyour views on this scale, generally speaking? The 10-point scale goes from 1 (left)to 10 (right).
FREIRE: Bringing Social Identities Back In 375
Notes1. The indicators of social class used by Inglehart and Klingemann (1976) were “family
income,” “respondents’ education,” and “union membership.” For the religious factor,the operational definitions were “religious denomination” (Catholic or Protestant) and“church attendance” (Inglehart and Klingemann, 1976: 264–9). The value componentwas measured by a four-item battery that supposedly tapped the respondents’ pre-dominant orientation toward socioeconomic and political equality or the preservationof the existing hierarchical order (Inglehart and Klingemann, 1976: 258). Finally, usingthe combined information relating to individual party identification and left–right self-placement, the partisan component was assessed as an interval variable (Inglehart andKlingemann, 1976: 256).
2. For the use of “social identity” to explain political attitudes and behavior, see alsoCampbell et al. (1980: 222–50, especially 223); Converse (1964: 234); Franklin et al.(1992); and Inglehart (1984: 57–62).
3. For sample size, see the codebooks that accompany the data in the following sources:for WVS 1990, see the Inter-university Consortium for Political and Social Research(ICPSR), study number 6160 and for EVS 1999, see European Values Study 1999/2000.A Third Wave: Data, Documentation and Database on CDROM, Central Archive forEmpirical Social Research (ZA), University of Cologne and the Netherlands Institutefor Scientific Information Services (NIWI), Amsterdam.
4. Thus, in step one, only indicators of the “structural” component were introduced intothe equations, and in Table 1 the correspondent variance explained in line with therespective label is presented. In step two, both the “structural” and “organizational”components of social factors were introduced into the equations. If we subtract thevariance explained in step one from the total variance explained in step two, we obtainthe independent effect of the “organizational” component on left–right attitudes aftercontrolling for the “structural” component. The latter variance is also presented inTable 1, in line with the corresponding label. In step three of the regression equations,the three sets of indicators for social factors were introduced. The variance explained instep three gives us the total level of left–right social anchoring (that is, the “total”).However, if this latter value is subtracted from the variance explained in step two, and socontrol is introduced for the “structural” and “organizational” dimensions, theindependent effect of the “identity” component of social factors on left–right attitudesis obtained. The latter value is also shown in Table 1.
5. The measure of tolerance is 1 – R2j and it should not be smaller than 0.1 (very highmulticollinearity).
6. The Austrian data for 1999 are of questionable quality, nevertheless, we kept the case.For 1999, missing data for Ireland do not allow us to consider this case (see note 4 toTable 3).
7. This variable was optional in EVS 1999, and was not asked in the following countries:the Netherlands, Denmark, Belgium, Sweden, and Ireland.
8. Since this variable was optional in EVS 1999, an equivalent question dealing with“inequality” was used (see below in the text).
9. This variable was optional in EVS 1999, and was not asked in the following countries:Spain, Greece, Denmark, Belgium, and Sweden. For this year, then, the index does notinclude this variable for these countries.
ReferencesAchen, C.H. (1977). “Measuring Representation: Perils of the Correlation Coefficient,”
American Journal of Political Science 21(4): 805–15.Bartolini, S. (2000). The Political Mobilization of the European Left, 1860–1980. Cambridge:
Cambridge University Press.
376 International Political Science Review 27(4)
Bartolini, S. and Mair, P. (1990). Identity, Competition and Electoral Availability: The Stabilisationof European Electorates, 1885–1985. Cambridge: Cambridge University Press.
Bell, D. (2000) [1960]. The End of Ideology: On the Exhaustion of Political Ideas in the ‘50s.Cambridge, MA: Harvard University Press.
Bobbio, N. (1995) [1994]. Direita e Esquerda. Lisbon: Presença.Borre, O. (2001). Issue Voting. Oxford: Aarhus University Press.Budge, I. and Klingemann, H.-D. (2001). “Finally! Comparative Over-time Mapping of Party
Policy Movement,” in I. Budge, H.-D. Klingemann, J. Bara, and E. Tanenbaum. (eds),Mapping Policy Preferences: Estimates for Parties, Electors and Governments 1945–1998. Oxford:Oxford University Press.
Campbell, A., P. Converse, W. Miller, and D. Stokes, (1980) [1960]. The American Voter.Chicago, IL: Chicago University Press.
Converse, P. (1964). “The Nature of Belief Systems in Mass Publics,” in D.E. Apter (ed.),Ideology and Discontent. New York: Free Press.
Eatwell, R. (2003) [1999]. “Conclusion: The ‘End of Ideology,’” in R. Eatwell and A. Wright(eds), Contemporary Political Ideologies. London: Continuum.
Flanagan, S. (1987). “Value Change in Industrial Societies,” American Political Science Review81(4): 1303–19.
Franklin, M. (1992). Electoral Change: Responses to Evolving Social and Attitudinal Structures inWestern Countries. Cambridge: Cambridge University Press.
Freire, A. (2006). Esquerda e Direita na Política Europeia. Portugal, Espanha e Grécia emPerspectiva Comparada. Lisbon: Imprensa de Ciências Sociais.
Fuchs, D. and Klingemann, H. D. (1990). “The Left-Right Schema,” in M.K. Jennings et al.(eds), Continuities in Political Action. Berlin: De Gruyter.
Fukuyama, F. (1989). “The End of History,” The National Interest 16.Giddens, A. (1996) [1994]. Más allá de la Izquierda y la Derecha. Madrid: Ediciones Cátedra.Giddens, A. (2000). The Third Way and Its Critics. Cambridge: Polity Press.Gujarati, D.N. (1995). Basic Econometrics. New York: McGraw Hill.Gunther, R. and Diamond, L. (2003). “Species of Political Parties: A New Typology,” Party
Politics 9(2): 167–99.Gunther, R. and Montero, J.R. (2001). “The Anchors of Partisanship: A Comparative
Analysis of Voting Behavior in Four Southern European Countries,” in N.Diamandouros and R. Gunther (eds), Parties, Politics, and Democracy in new SouthernEurope. Baltimore, MD: Johns Hopkins University Press.
Heywood, A. (2003) [1992]. Political Ideologies: An Introduction. Basingstoke: PalgraveMacmillan.
Huber, J. (1989). “Values and Partisanship in Left-Right Orientations: Measuring Ideology,”European Journal of Political Research 17: 599–621.
Inglehart, R. (1984). “The Changing Structure of Political Cleavages in Western Society,” inR. Dalton, S.C. Flanagan and P.E. Beck (eds), Electoral Change in Advanced IndustrialDemocracies: Realignment or Dealignment? Princeton, NJ: Princeton University Press.
Inglehart, R. (1990). “Values, Ideology and Cognitive Mobilization in New SocialMovements,” in R.J. Dalton and M. Kuechler (eds), Challenging the Political Order: New Social and Political Movements in Western Democracies. Oxford: Oxford University Press.
Inglehart, R. (1991) [1990]. El Cambio Cultural en las Sociedades Industriales Avanzadas.Madrid: CIS/Siglo XXI.
Inglehart, R. and Klingemann, H.-D. (1976). “Party Identification, Ideological Preferenceand the Left-Right Dimension among Western Mass Publics,” in I. Budge H.-D.Klingemann, J. Bara, and E. Tenenbaum. (eds), Party Identification and Beyond:Representations of Voting and Party Competition. London: Wiley.
Jagodzinski, W. and Dobbelaere, K. (1995). “Secularization and Church Religiosity,” in J.W.van Deth and E. Scarbrough (eds), The Impact of Values. Oxford: Oxford University Press.
Kitschelt, H. (1996) [1994]. The Transformation of European Social Democracy. Cambridge:Cambridge University Press.
FREIRE: Bringing Social Identities Back In 377
Knutsen, O. (1995). “Value Orientations, Political Conflicts and Left-Right Identification: AComparative Study,” European Journal of Political Research 28: 63–93.
Knutsen, O. (1997). “The Partisan and the Value-Based Components of Left-Right Self-Placement: A Comparative Study,” International Political Science Review 18: 191–225.
Knutsen, O. (2002). “The Left-Right Dimension in West European Politics: Stable, inTransition or Increasingly Irrelevant?” Central European Political Science Review 3(7):31–63.
Knutsen, O. and Scarbrough, E. (1995). “Cleavage Politics,” in J.W. van Deth and E.Scarbrough (eds), The Impact of Values. Oxford: Oxford University Press.
Kriesi, H. (1998). “The Transformation of Cleavage Politics – The 1997 Stein RokkanLecture,” European Journal of Political Research 33(2): 165–85.
Lane, J.E. and Ersson, S. (1999). Politics and Society in Western Europe. London: Sage.Laponce, J.A. (1981). Left and Right: The Topography of Political Perceptions. Toronto:
University of Toronto Press.Lipset, S.M. (1987) [1981]. “El fin de toda ideología?” and “Un concepto y su historia: el fin
de la ideología,” in S.M. Lipset (ed.), El Hombre Político: las Bases Sociales de la Política.Madrid: Editorial Tecnos.
Lipset, S.M. and Rokkan, S. (1967). “Cleavage Structures, Party Systems, and VoterAlignments: An Introduction,” in S.M. Lipset and S. Rokkan (eds), Party Systems and VoterAlignments: Cross-National Perspectives. New York: Free Press.
Mair, P. (1998) [1997]. Party System Change: Approaches and Interpretations. Oxford: OxfordUniversity Press.
Taris, Toon W. (2000). A Primer in Longitudinal Data Analysis. London: Sage.Van der Eijk, C., Schmitt, H. and Binder, T. (2005). “Left-Right Orientations and Party
Choice,” in Jacques Thomassen (ed.), The European Voter. A Comparative Study of ModernDemocracies. Oxford: Oxford University Press.
Biographical NoteANDRÉ FREIRE is Assistant Professor at the Higher Institute of Social Sciences andBusiness Studies (ISCTE), Lisbon, Portugal. His research interests focus onelectoral behavior, left–right orientation, electoral systems, party systems, andpolitical elites. He is codirector of the Portuguese National Election Study (since2001) and has published several articles and books. ADDRESS: ISCTE, Avenida dasForças Armadas, 1649-026 Lisboa, Portugal [email: [email protected]].
Acknowledgments. The author would like to thank the anonymous referees as well asProfessor Manuela Magalhães Hill for their very insightful and useful criticisms andsuggestions which helped to improve the article.
378 International Political Science Review 27(4)