Embed Size (px)
Citation preview

B
JI
a
ARR2A
KBNSC
1
sTgtcdnassmgnam(chttvts
0d
J. Non-Newtonian Fluid Mech. 166 (2011) 32–41
Contents lists available at ScienceDirect
Journal of Non-Newtonian Fluid Mechanics
journa l homepage: www.e lsev ier .com/ locate / jnnfm
ubble cluster formation in shear-thinning inelastic bubbly columns
. Rodrigo Vélez-Cordero, Roberto Zenit ∗
nstituto de Investigaciones en Materiales, Universidad Nacional Autónoma de México, Circuito Exterior s/n, Apdo. Postal 70-360 México D.F. 04510, Mexico
r t i c l e i n f o
rticle history:eceived 13 July 2010eceived in revised form7 September 2010ccepted 8 October 2010
a b s t r a c t
The mean rise velocity of bubble swarms ascending in shear-thinning fluids was experimentally measuredin a rectangular bubble column. Great care was taken to produce nearly mono-dispersed bubble swarmsand to use shear-thinning fluids with negligible elastic effects. In this manner, it was possible to isolate theeffect of the hydrodynamic interaction between bubbles in the column caused by the thinning behavior
eywords:ubbly flowson-Newtonianhear-thinning
of the liquid. It was found that the mean rise velocity of the bubbles was larger than that of an individualbubble, in accordance with previous studies. The magnitude of the swarm velocity was found to be greatlyinfluenced by the appearance of bubble clusters. The bubble clusters, which appeared for certain values ofthe flow index and bubble diameter, were found to have a very different structure from those observedin Newtonian liquids. Furthermore, it was found that the appearance of clusters produced a dramaticincrease of the agitation within the column. A set of conditions was identified for the appearance of
hinn
lusters bubble clusters in shear-t. Introduction
One of the greatest challenges in fluid dynamics is to under-tand and predict the behavior of multiphase flow systems.his is a task that is widely justified due to the occurrence ofas–liquid/gas–liquid–solid contactors in almost every branch ofhe chemical and metallurgical industries. In particular, bubbleolumns are used in many chemical processes which involve oxi-ation, chlorination, polymerization and hydrogenation [1–3], toame a few. Bubble columns are also used as a central unit oper-tion for primary and secondary metabolites production and foreveral downstream processes for product recovery such as theeparation by adsorption in bubble flows [1,4,5]. In spite of theechanical simplicity that characterizes bubble columns, which
rant them with operative and cost benefits [6], their basic engi-eering design is not a simple task. Given a certain chemical processnd liquid phase properties, an engineer has to implement the opti-um column geometry, sparger configuration and power input
superficial gas velocity Ug) to satisfy the uptake rate of the ongoinghemical reaction, in addition to achieving the optimum mixing andeat transfer properties between phases. Such estimations requirehe knowledge of functional relations among the central opera-
ional variables such as the mean bubble diameter db, mean bubbleelocity USW and gas fraction ˚g. Some authors have also studiedhe development of the liquid velocity and its variance as a mea-ure of the amount of agitation or pseudo-turbulence conferred by∗ Corresponding author. Tel.: +52 55 5622 4593; fax: +52 55 5622 4602.E-mail address: [email protected] (R. Zenit).
377-0257/$ – see front matter © 2010 Elsevier B.V. All rights reserved.oi:10.1016/j.jnnfm.2010.10.003
ing inelastic bubbly columns.© 2010 Elsevier B.V. All rights reserved.
the dispersed phase [7,8]. Deeper understanding of bubble–bubbleand bubble–liquid interactions require the use of computationalfluid dynamics in which one can easily choose and manipulate thefield variables [9–11].
Although many industrial liquids which comprise solutions oflow molecular weight can be considered Newtonian-like fluids, anincreasing number of solutions with high molecular weights andinternal structure are being used that have non-Newtonian behav-ior such as variable viscosity and memory effects. Polymer solutionsand melts, liquid crystals, gels, suspensions, emulsions, micellarsolutions, slurries and foams enter into this non-Newtonian cate-gory [10,12]. The study of non-Newtonian effects in the behaviorof bubble flows is, therefore, of fundamental importance.
Experimental and numerical studies in two phase flows (includ-ing sedimentation and bubble flows) have shown that a group ofbodies moving through a non-Newtonian fluid tend to form aggre-gates or clusters [11,13–15]. Such aggregates are more dense interms of the number of bubbles embedded in the bubble cloudthan the clusters that have been described in Newtonian flows athigh Reynolds numbers [16,17]; actually, we will show in this studythat bubbles rising in shear-thinning fluids group with each otherforming aggregates of a certain size. Bubble clustering cause bub-ble coalescence and a premature transition to the heterogeneousor churn-turbulent flow in non-Newtonian fluids [18,19]. Althoughthere has been a number of studies of particle clustering and orien-
tation of lengthened bodies in sedimentation [15,14,22], little hasbeen reported for the case of bubbly flows. The aim of the presentwork is to study the formation of clusters of mono-disperse bub-bles in power-law shear-thinning fluids, leaving aside, as muchas possible, the elastic effects. We support the discussion of our
n-Newtonian Fluid Mech. 166 (2011) 32–41 33
e[pn
2
ctM(wig
iswtSrbetvtbnttbt
nvinsHbtrdsAdito1ii0fTsioAiTn[R
5.0cm10.0cm
upper capillary
lower capillary
J. Rodrigo Vélez-Cordero, R. Zenit / J. No
xperimental observations with the results of a companion paper23] which analyzes the hydrodynamic interaction between bubbleairs ascending in shear-thinning fluids, both experimentally andumerically.
. Background
Most of the published papers on non-Newtonian bubbleolumns have focused their attention on the development ofhe gas fraction, ˚g, in terms of the superficial gas velocity, Ug.
any authors have used CMC (carboxymethylcellulose) solutionsflow index n > 0.5) [18,19,24–27] in coalescence conditions andorked with relatively large values of the superficial gas veloc-
ty (Ug > 2 cm/s) [25–27] such that the churn-turbulent flow wasenerally achieved.
Buchholz et al. [18] reported that the mean bubble rise veloc-ty USW measured in a single stage column was higher than theingle bubble velocity USI. Additionally, this difference increasedith the thinning behavior of the fluid. However, the changes of
he USW/USI ratio with the gas fraction were not reported explicitly.chumpe and Deckwer [19] found that the homogeneous bubbleegime in CMC solutions could only be achieved having Ug valueselow a critical one (∼0.5 cm/s), this value being a function of theffective viscosity. Haque et al. [26,27] reported an estimation ofhe mean bubble diameter and velocity of bubble swarms rising iniscoelastic fluids. One of the key assumptions in this estimation ishat the mean bubble velocity values are equal to the single bub-le velocity, which is not always true. As far as we know, there areo previous studies of mono-dispersed bubble swarms in shear-hinning fluids at low superficial gas velocities (Ug < 1 cm/s) wherehe bubbly flow regime can be observed. Having a monodispersedubble distribution allows us to isolate the effects caused solely byhe hydrodynamic interaction among bubbles.
Many relevant contributions to the subject have arisen fromumerical and analytical studies. Several methods such asariational principles [28], perturbation methods [29] and approx-mations to the Newtonian behavior [30] have been used to solveumerically the rising of a bubble or bubble swarms throughhear-thinning fluids. Bubble interactions were simplified using theappel cell model [31], hence no direct bubble interactions haveeen studied previously. Only Radl et al. [11] have fully resolvedhe flow field around a group of bubbles. Bhavaraju et al. [29]eported that for creeping flow conditions the drag coefficient Cdecreased with the increase of the thinning behavior for bubblewarms, which is the opposite of what happens for single bubbles.scending isolated bubbles have a larger Cd as the thinning con-ition increases [27,30,32,33]. In more recent studies, which took
nto account the inertial forces in the momentum equation [10,34],his increase in the drag force for the single bubble cases occurrednly below a critical Reynolds number (approximately from 3 to0). Gummalam and Chhabra [28,35] reported that for the creep-
ng and high Re numbers (100 < Re < 300) flows, the USW/USI rationcreases for gas fractions below 0.3 and flow index values below.5. Above this gas fraction value the velocity ratio decreases. There-ore, a maximum in the velocity ratio was observed for ˚g ≈ 0.3.hese authors explained that such behavior is due to the con-train of the flow lines (as the effective volume for each bubbles decreased as the gas fraction increases) resulting in an increasef the shear rate which in turn results in lower apparent viscosities.positive slope of the velocities ratio curve means that the viscos-
ty gradients effects surpass the hydrodynamic hindrance effects.he slope of the USW/USI curve is commonly negative in Newto-ian bubbly liquids with large Reynolds and small Weber numbers17,36]. It is important to point out that the theoretical results ofefs. [28,29,35] have not been compared with experiments yet.
(gas chamber side)
Fig. 1. Scheme of a capillary bank.
Radl et al. [11] directly simulated the interactions of bubbles (up to9) rising in shear-thinning conditions. They showed that the bubbleinteractions are significantly enhanced when viscosity gradientsare present. They also identified “mini-bubble” clusters that travelfaster than the single bubble cases. This feature will be discussedin depth in the present investigation.
In this work, we compared the USW/USI values obtained in thebubble column at different gas fractions and thinning conditionswith the theoretical ones [28,35]. We also conducted an analysisof the size of bubble clusters and of the bubble velocity variance.Finally, we identified the hydrodynamic conditions for which bub-ble clusters are formed.
3. Experimental setup
3.1. Bubble column and capillary banks
A rectangular channel with 5 × 10 × 160 cm3 equipped with agas chamber (7.5% of the channel height) was used, similar tothat used by Martínez-Mercado et al. [8]. Pure nitrogen was intro-duced to the bubble column using a needle valve (Cole-Palmer1682 ml/min MAX, stainless steel ball). The superficial gas velocity Ug
range was between 0.09 and 0.6 cm/s. The gas volume fraction, ˚g,was obtained using the relation ˚g = �H/H, where H is the liquidheight without gas (140 cm) and �H the height difference producedby the introduction of the gas in the column.
Three capillary banks were constructed in order to produce dif-ferent bubble sizes (db). The internal diameter of the capillaries(Dcap) was selected considering the equilibrium condition betweenbuoyancy and surface tension forces:
Dcap = db3�g
6�(1)
where � is the liquid density, g the gravity and � the surface tension.In order to avoid the generation of gas jets with variable volume,
the hydraulic resistance through the capillaries should be largesuch that the bubble volume depends mainly on the buoyancy andsurface forces and lesser in the gas flow rate [37]. The equivalentcapillary lengths necessary to achieve such hydraulic resistance aresometimes of the order of meters; instead of installing long capil-laries, a second capillary with a smaller inner diameter was insertedto the main capillary but the bubble formed on the larger diameterend. This arrangement provides the sufficient pressure drop to pro-duce individual bubbles. As we can see in Fig. 1, identical capillarieswere placed in an acrylic perforated plate ordered in an hexago-nal arrange. The design parameters of the three capillary banks aresummarized in Table 1.
3.2. Fluids
The fluids used in this study fulfilled two conditions: (1) show ashear-thinning power-law behavior with negligible elastic proper-

34 J. Rodrigo Vélez-Cordero, R. Zenit / J. Non-Newtonian Fluid Mech. 166 (2011) 32–41
Table 1Design parameters of the capillary banks. Dcap, internal diameter of the capillaries; N, number of capillaries; db , experimental mean bubble diameter; �, spacing betweencapillaries; �wall, spacing between capillaries and the wall; L, capillary length.
Dcap (mm) N db (mm) �/db �wall/db L (cm)
tt
mslp(tti(gwstsip
oaptirGGrstaroc
F(
where dMAX is the larger bubble diameter and dMIN the shorter
1 0.2 63 2.152 0.6 27 3.153 1.6 16 4.20
ies and (2) allow the formation of mono-dispersed bubbly flows,hat is, with a narrow dispersion of db.
It was found that xanthan gum solutions in a water/glycerinixture fulfilled the above conditions. These solutions are more
table in the presence of MgSO4 (which was added to delay coa-escence [38]) than carbopol, CMC or guar gum solutions. Thereparation of the solutions was as follows: first the xanthan gumKeltrol E 415, KELCO, USA) was dissolved in water (at 55 ◦C), thenhe salt (0.04 M of MgSO4, 2500-01 J.T. Baker) was added and finallyhe glycerin. The solutions were left in repose for 24 h before exper-ments. The rheological measurements were done in a rheometerTA Instruments AR1000N) with a cone-plate geometry (60 mm, 2 ◦, aap of 65 �m). The surface tension measurements were performedith a DuNouy ring (diameter of 19.4 mm, KSV Sigma 70). All the
olutions were stirred before the surface tension measurement. Theemperature of the room was 23 ◦C. The physical properties of theolutions are summarized in Table 2; the flow curves are shownn Fig. 2. The data contained in this figure includes measurementserformed one and two weeks after the preparation of the fluids.
At a shear rate of 10 s−1 all the fluids have a viscosity of aroundne hundred times that of water. The shear-thinning fluids havepower-law behavior in almost all the shear rate interval; a mildlateau can be observed for shear rates below 0.1 s−1. This indicateshat the polymer chains are gently stretched by a flow field, hav-ng a short range of linear viscoelasticity. Within this short linearange, the elastic modulus G′ becomes bigger than the loss modulus′′ only at high frequencies (>100 s−1) as can be seen in Fig. 3. Both′ and G′′ were obtained by a Fourier Transform (FT) of the stresselaxation curves measured with an ARG2 rheometer of controlledtress [39]. The normal forces (first normal stress difference) of
he thinning fluids, measured with the cone-plate geometry, reachmaximum value of 7 Pa at 100 s−1 but decreased as the shearate increased (data not shown). This behavior contrasts with thene shown by a viscoelastic fluid (a 0.2% polyacrylamide solutionan reach a normal stress value of 100 Pa for the same range of
10−1
100
101
102
103
101
102
103
104
shear rate (1/s)
η (m
Pa⋅
s)
ig. 2. Flow curves of the test fluids. �: apparent viscosity, (– –) Newtonian fluid,◦) n = 0.85, (�) n = 0.76, (♦) n = 0.55, (�) n = 0.32.
2.8 6.7 4.32.7 4.9 8.02.7 3.7 8.0
shear rates) or an upper-convected Maxwell fluid where the nor-mal stress grows as a function of �2; clearly the behavior of ourfluids is very different. With these fluids (and with their rheologi-cal characterization) we were able to isolate, as much as possible,the thinning effects from the elastic ones over a wide range of char-acteristic flow times. We can expect then that the hydrodynamicbehavior of bubble–bubble interactions is mainly attributed to theshear-thinning behavior.
3.3. Bubble diameters and velocities measurements
For the measurements of the mean bubble diameters, db, andthe mean bubble velocities, USW, a high speed camera (MotionScopePCI 8000s) was used. A recording rate of 500 frames/s and a shutterspeed of 1/1000 was used. The camera was positioned 20 cm belowthe liquid surface facing the larger side of the bubble column. Twodifferent videos were obtained per experiment: one for the db mea-surements, where the camera was placed 120 cm from the bubblecolumn (using a 105 mm objective lens) and another for the bub-ble velocity measurements, where the camera was placed a littlebit farther, 180 cm from the bubble column (using a 60 mm objec-tive lens). Diffuse back light was used, with a light source placedat 90 ◦ from the camera direction and reflected by a panel. Thevideo frames were converted to binary format and analyzed using aconventional image processor software (Matlab©). The equivalentmean bubble diameter db was calculated using the measurementof the short and long diameters of the elliptic bubble projections:
db = (d2MAXdMIN)
1/3(2)
bubble diameter. In some bubbly flows an equivalent mean clusterdiameter was also measured. Although clusters shapes are highlyirregular, an estimation of its size was made using Eq. (2), now tak-
10−1
100
101
102
103
10−2
100
102
104
frequency (1/s)
G’,G
’’(P
a)
Fig. 3. Dynamic moduli of three shear thinning solutions. Filled symbols: elasticmodulus G′; empty symbols: loss modulus G′′; (◦) n = 0.85, (♦) n = 0.55, (�) n = 0.32,(�) a polyacrylamide reference solution (0.04% in 80% glycerin/water with 0.04 MMgSO4). For the estimation of G′ and G′′ the procedure followed by Calderas et al.[39] was used.

J. Rodrigo Vélez-Cordero, R. Zenit / J. Non-Newtonian Fluid Mech. 166 (2011) 32–41 35
Table 2Physical properties of the fluids: �, density; �, surface tension; �, viscosity; k, consistency index; n, flow index. The percentages of liquid mixtures are given in volume terms,the percentages of the xanthan gum solutions in weight terms. In all the fluids 0.04 M of MgSO4 was added to delay bubble coalescence.
Fluids � (kg/m3) � (mN/m) � or k (mPa sn) n
Newtonian: 83% glycerin/water 1214.6 61.9 104.2 1.0
iUvemebcw
cmdo
4
4
aR
R
w
�
F(pC
0.02% Xanthan gum in 75% glycerin/water 1193.10.035% Xanthan gum in 70% glycerin/water 1179.50.1% Xanthan gum in 60% glycerin/water 1152.10.23% Xanthan gum in water 997.5
ng the longer and shorter diameters of the cluster. The reported¯ SW values were the average of the vertical component of theelocity vector. At least 100 measurements were done for eachxperimental condition. When bubble aggregates appeared, weeasured the velocity of individual bubbles located at the periph-
ry of the clusters; these were more easy to recognize than theubbles located in the interior of the cluster. The fluids were dis-arded after one week of experimental work. The whole columnas disassembled and cleaned at the end of the day.
The velocity and size of isolated bubbles were also measuredovering a bubble volume range from 0.1 to 100 mm3. Sucheasurements were done in a cylindrical column with an inner
iameter of 9 cm equipped with a bubble dispenser similar to thene used by Soto et al. [40].
. Experimental results
.1. Single bubbles
The values of the drag coefficient, Cd, of the individual bubbless a function of the Reynolds number, Re, are shown in Fig. 4. Theeynolds number and drag coefficient were defined as:
e = �USIdb
�(3)
here
= k(
2USI
db
)n−1(4)
10−1
100
101
102
100
101
102
103
Reynolds
Cd
ig. 4. Drag coefficient as a function of the Reynolds number for the single bubbles.+) Newtonian fluid, (◦) n = 0.85, (�) n = 0.76, (♦) n = 0.55, (�) n = 0.32, (−) Stokesrediction, (– –) Hadamard prediction, (. . .) Oseen correction for a fluid sphered = 16/Re + 2.
63.0 118.7 0.8562.0 143.4 0.7665.0 360.0 0.5566.5 574.9 0.32
and
Cd = 43
dbg
U2SI
(5)
In addition to the common functional dependence of the drag coef-ficient on the Reynolds number in the laminar flow regime, we canalso observe that the Cd values found for the thinning fluids arehigher than those found for the Newtonian fluid. This increase ofthe drag coefficient with the thinning behavior has been alreadyreported by theoretical [30,29], experimental [29,27] and numer-ical [23] studies for the creeping and small but finite Reynoldsregimes. Note that for the Newtonian fluid the Oseen wake isalready seen at Re ∼ 7. With these measurements, the accuracy ofour experimental results was verified. Although we cannot statethat our fluids are totally free from elastic effects, i.e. the flowaround a bubble is complex so memory effects can rise from exten-sional flow; the fact that we did not observe any signal of a velocityjump discontinuity supports the statement that the elastic effectswere very small indeed.
4.2. Bubbly flow regime and cluster formation
As pointed out by other authors [18,19] the transition from bub-bly to the heterogeneous regime, which is characterized by thepresence of multi-dispersed bubble swarms, can be identified bya change in the slope of the gas volume fraction as a function of thesuperficial gas velocity. The slope of the curve changes (decreases)
as a consequence of the change of the bubble volume. In Fig. 5the gas fraction value is shown as a function of the superficial gasvelocity for the Newtonian and a thinning fluid (n = 0.85) for severalbubble diameters. For both cases the mean bubble size producedby each capillary bank was practically the same.0.05 0.1 0.15 0.2 0.25 0.30
0.5
1
1.5
2
2.5
3
3.5
4
superficial gas velocity Ug (cm/s)
Φg
(%)
2.1mm
3.1mm
4.2mm
Fig. 5. Gas fraction values as a function of the superficial gas velocity. Filled symbols:Newtonian fluid, empty symbols: n = 0.85 fluid, (◦) db = 2.1 mm, (♦) db = 3.1 mm, (�)db = 4.2 mm.
36 J. Rodrigo Vélez-Cordero, R. Zenit / J. Non-Newtonian Fluid Mech. 166 (2011) 32–41
F fluid as e oneu mber
sttetstawgttr
ptTlc
swtctcsa
i[
4.3. Bubble size distribution
Fig. 7 shows the histogram of the bubble diameter for the New-tonian fluid and the n = 0.76 fluid; the plot shows data taken for each
1 1.5 2 2.5 3 3.5 4 4.5 50
5
10
15
20
25
30
354.2mm 3.1mm 2.1mm
freq
uenc
y
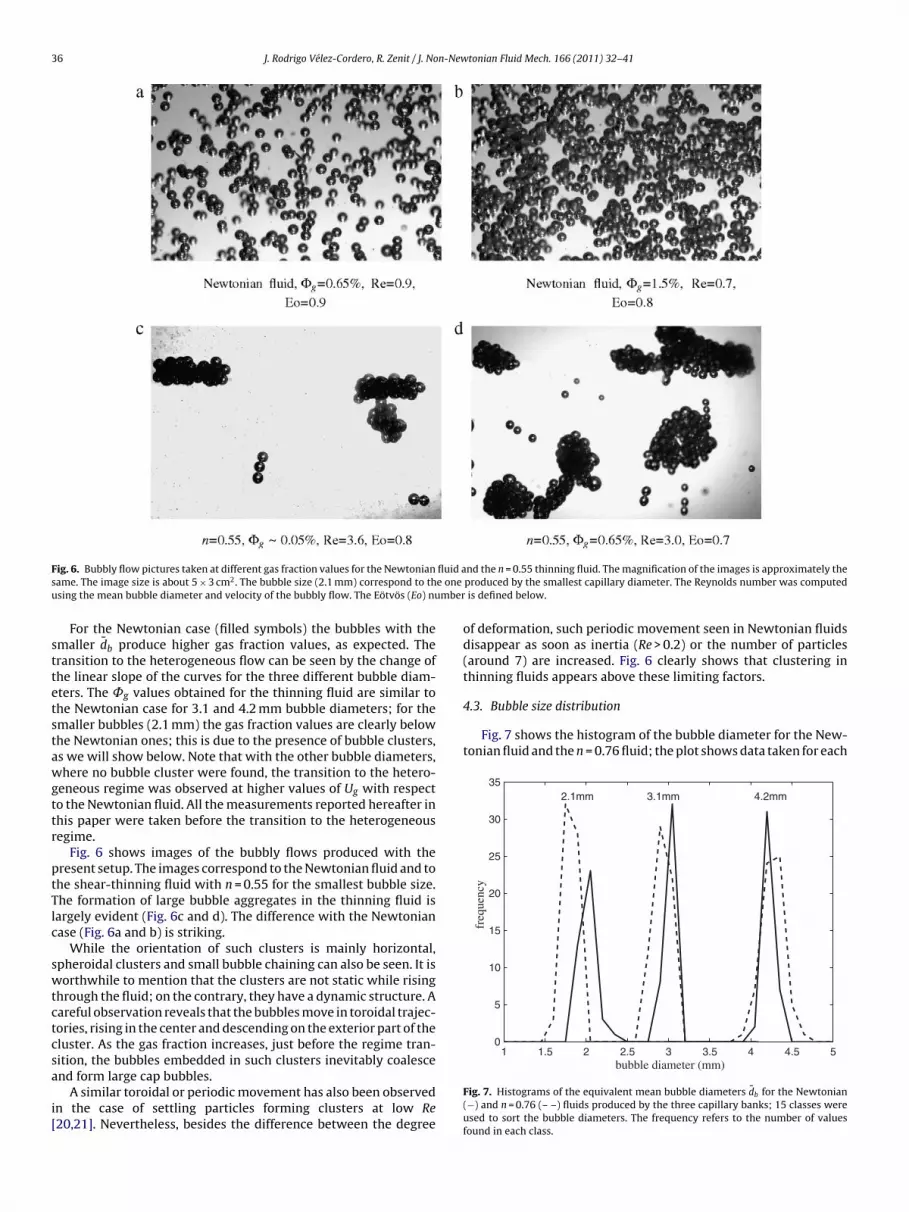
ig. 6. Bubbly flow pictures taken at different gas fraction values for the Newtonianame. The image size is about 5 × 3 cm2. The bubble size (2.1 mm) correspond to thsing the mean bubble diameter and velocity of the bubbly flow. The Eötvös (Eo) nu
For the Newtonian case (filled symbols) the bubbles with themaller db produce higher gas fraction values, as expected. Theransition to the heterogeneous flow can be seen by the change ofhe linear slope of the curves for the three different bubble diam-ters. The ˚g values obtained for the thinning fluid are similar tohe Newtonian case for 3.1 and 4.2 mm bubble diameters; for themaller bubbles (2.1 mm) the gas fraction values are clearly belowhe Newtonian ones; this is due to the presence of bubble clusters,s we will show below. Note that with the other bubble diameters,here no bubble cluster were found, the transition to the hetero-
eneous regime was observed at higher values of Ug with respecto the Newtonian fluid. All the measurements reported hereafter inhis paper were taken before the transition to the heterogeneousegime.
Fig. 6 shows images of the bubbly flows produced with theresent setup. The images correspond to the Newtonian fluid and tohe shear-thinning fluid with n = 0.55 for the smallest bubble size.he formation of large bubble aggregates in the thinning fluid isargely evident (Fig. 6c and d). The difference with the Newtonianase (Fig. 6a and b) is striking.
While the orientation of such clusters is mainly horizontal,pheroidal clusters and small bubble chaining can also be seen. It isorthwhile to mention that the clusters are not static while rising
hrough the fluid; on the contrary, they have a dynamic structure. Aareful observation reveals that the bubbles move in toroidal trajec-ories, rising in the center and descending on the exterior part of theluster. As the gas fraction increases, just before the regime tran-
ition, the bubbles embedded in such clusters inevitably coalescend form large cap bubbles.A similar toroidal or periodic movement has also been observedn the case of settling particles forming clusters at low Re20,21]. Nevertheless, besides the difference between the degree
nd the n = 0.55 thinning fluid. The magnification of the images is approximately theproduced by the smallest capillary diameter. The Reynolds number was computedis defined below.
of deformation, such periodic movement seen in Newtonian fluidsdisappear as soon as inertia (Re > 0.2) or the number of particles(around 7) are increased. Fig. 6 clearly shows that clustering inthinning fluids appears above these limiting factors.
bubble diameter (mm)
Fig. 7. Histograms of the equivalent mean bubble diameters db for the Newtonian(−) and n = 0.76 (– –) fluids produced by the three capillary banks; 15 classes wereused to sort the bubble diameters. The frequency refers to the number of valuesfound in each class.

n-Newtonian Fluid Mech. 166 (2011) 32–41 37
coiadestwd
4
bsvafl
UttiwtrCf
ottama
wbenfia(fts
rnratf
toioCtttts˚
Fig. 8. USW/USI ratio as a function of the gas hold up ˚g for the three mean bub-ble diameters. (•) n = 0.85, (�) n = 0.76, (�) n = 0.55, (�) n = 0.32, theoretical values
J. Rodrigo Vélez-Cordero, R. Zenit / J. No
apillary bank. In both cases the curves show a narrow distributionf the bubbles diameters produced by the capillary banks indicat-ng that the formation of nearly mono-dispersed bubbly flows wasccomplished. In addition, it can be seen that the bubble diameteristributions are similar for both cases, indicating that the differ-nt fluids used in this work allowed the formation of bubbles withimilar mean bubble diameters. The same behavior was observed inhe other thinning fluids; the only exception was the n = 0.32 fluidith the smallest capillary diameter for which the mean bubbleiameter was 36% higher than all the other cases.
.4. Mean bubble velocity and drag coefficient
Fig. 8 shows the ratio of the mean bubble velocity with the singleubble velocity as a function of the gas fraction; the three bubbleizes produced in the bubble column are included. The theoreticalalues reported by Gummalam and Chhabra [28,35] for creepingnd high Re flows (100 < Re < 300) are also shown for their lowestow index values and for their Newtonian results.
The experimental and theoretical results agree in that the¯ SW/USI curve has a positive slope for small gas fraction, in contrasto the result in Newtonian fluids. This means that, unlike the New-onian flows, the hydrodynamic hindrance produced by bubblesnteractions does not produce a reduction of the bubble velocity
ith ˚g; in the shear-thinning cases this effect is compensated byhe reduction of the apparent viscosity produced by the local shearate values. Hence, the Happel cell model used by Gummalam andhhabra [28,35] captures the basic nature of these flow types. This
act also agrees with the early results of Buchholz et al. [18].The values of the gas volume fraction for which the maximum
f the USW/USI value was observed in the experiments were, never-heless, much smaller than the theoretical ones. In fact for ˚g > 1%he heterogeneous regime is observed, that is why measurementst higher volumetric flow rates or gas fractions (where the maxi-um theoretical values were found) are practically impossible to
ttain in a bubbly flow regime.Additionally, the experimental values of the velocities ratios
ere found to be much larger than the theoretical ones. As theubble size decreases, the difference between the theoretical andxperimental values increases (up to nine times for the case of the= 0.57 fluid, see Fig. 8c). Hence, the Happel cell model is not suf-cient to explain the whole phenomenon. The effect which is notccounted for in this model is the appearance of bubble clusterslike those shown in Fig. 6c and d). These clusters are responsibleor the high USW/USI values found in the experiments. The shape ofhe curves in Fig. 8 indicates that the clusters grow up to a certainize just before the transition to the heterogeneous regime.
The last important difference is that while in the theoreticalesults the velocity ratio increases monotonically with the thin-ing behavior (decreasing the flow index value), the experimentalesults do not necessarily follow this trend. For instance, in Fig. 8and b the curves of the fluids with n = 0.85 and 0.32 are closed tohe theoretical ones while the fluids with n = 0.55 and 0.76 are farrom them due to the formation of clusters.
The values of the drag coefficient (in terms of a drag correc-ion factor X = CdRe/24) were also reported in the theoretical workf Gummalam and Chhabra [28]. Their results showed that the Cdncreases with the gas volume fraction for n > 0.4, as is commonlybserved, but decrease for index flow values below 0.4. In [35] thed values for Re = 50 were also reported. These authors mentionedhat the Cd increases with the gas volume fraction, obtaining again
he common trend found in [28]. In a recent numerical work ofhe same group [10], where the Happel cell model was also used,he Cd values were found to increase with the gas fraction at theame n value although such increase was found to be negligible forg < 0.001. In the present work an estimation of the Cd values of the
[28,35]: (−) creeping flow n = 1.0, (· · ·) creeping flow n = 0.3, (-·-) 100 < Re < 300n = 1.0, (– –) 100 < Re < 300 n = 0.2. The dotted horizontal line at 1.5 divides the freebubble and cluster formation regimes.
bubbly flows were also obtained for low gas volume fractions. We
computed the Cd values using Eq. (5) with the values of the meanbubble diameter and velocity of the flow. For comparison, we alsocalculated the Cd using the constitutive equation proposed by Ishii
38 J. Rodrigo Vélez-Cordero, R. Zenit / J. Non-Newtonian Fluid Mech. 166 (2011) 32–41
Table 3Drag coefficient values for different thinning fluids and gas volume fractions. Inorder to calculate Cd(ReSI) of Eq. (6) the respective bubble diameter obtained in thebubble column was used. The data of Kishore et al. [10] corresponds to the Cd valuesfound for n = 0.6 and 0.8 and a gas fraction of 0.001.
n ˚g Re Cd Cd Eq. (6) Cd Ref. [10]
0.32 0.001 10.3 3.9 4.20.002 10.9 3.6 3.90.003 10.9 2.8 3.6
0.55 0.001 5.2 2.6 6.0 4.00.003 5.8 2.3 5.3
a
C
wsci
tuoti(ma
4
ifl
luitmohtorscwcot±tm
4
twfm
0.76 0.001 3.6 4.2 8.0 5.50.002 4.2 3.3 6.50.007 4.3 2.8 6.0
nd Zuber [41]:
d = Cd(ReSI)(
USI
USW
)2 (1 − ˚g
)(6)
here the functional dependance of Cd(ReSI) was obtained using theingle bubble data for each fluid (Fig. 4). This equation was proposedonsidering a multiparticle system moving in one dimension in annfinite medium (absence of walls). The results are shown in Table 3.
It can be observed that the drag coefficient actually decreases ashe gas volume fraction increases for the same fluid and Re number,nlike the general trend found by Kishore et al. [10]. Such decreasef the Cd is directly related to cluster formation and growth. Unlikehe Newtonian fluids, where the Cd increases with the gas fraction,n bubbly shear-thinning fluids it decreases. It can be seen that Eq.6) and the numerical results of Kishore et al. [10] both overesti-
ate the values of Cd because they do not consider interactions orssociations between bubbles.
.5. Cluster size
The equivalent cluster diameter dc for one of the thinning flu-ds (n = 0.76) is presented in Fig. 9 as a function of the gas volumeraction. In this plot the dc values produced by the smallest andargest capillaries are shown both in dimensional and dimension-
ess form (scaled by the bubble diameter db). The ratio (dc/db)3
wassed because it is directly proportional to the number of bubbles
n a cluster. In this particular fluid clusters were observed for thehree bubble sizes tested, that is, bubble clusters are formed no
atter what the value of the db is. Also in this fluid we had thepportunity to take more data of the cluster diameters before theeterogeneous regime occurred. For the n = 0.55 fluid the transi-ion to this regime occurs at lower gas volume fractions. On thene hand we can observe in Fig. 9a that the cluster size and growthate is the same for the two bubble diameters, suggesting that theize of the clusters is mainly determined by the fluid properties,hannel width and the amount of available gas. On the other hand,e verified (Fig. 9b) that the number of bubbles embedded in the
luster is larger for the case of the small bubbles than the largernes. Additionally, we found that the normalized standard devia-ion of the cluster size (�/db) is larger for the small bubble (up to123) in comparison to the large bubble case (up to ±5), indicating
hat the clusters made with the small bubbles interchange bubblesore often with their surroundings.
.6. Bubble velocity variance
We can expect that bubble cluster formation will affect the agi-ation levels in the liquid; hence, a larger bubble velocity varianceill be present in comparison with flows where no clusters are
ound. To verify this argument the bubble velocity variance waseasured. The normalized values of the variance (Tb/U2
SW ) for the
Fig. 9. Mean equivalent cluster diameter dc as a function of ˚g for the n = 0.76 fluid.In (b) the values are divided by the mean equivalent bubble diameter db and elevatedto the third power. (•) db = 2.1 mm, (�) db = 4.2 mm. The lines are only visual aids.
thinning fluid with n = 0.85 were determined for the three bubblediameters; these results are shown in Fig. 10. For this fluid no clusterformation was observed for the medium and large bubbles; clus-ters appeared only with the smaller bubble size (see Fig. 8). As canbe observed in Fig. 10, the normalized bubble velocity variances forthe medium and large bubbles (4 < Re < 14) are in agreement withthe values obtained by Martínez-Mercado et al. [8] for a Newtonianfluid with similar Re values (10 < Re < 30). In the case of the smallerbubbles (2.1 mm, with 1.7 < Re < 3.4), where clusters are formed,the Tb/U2
SW values surpass by nearly one order of magnitude thevalues achieved by the unclustered cases. This cluster-fluctuationrelation seen at low Re numbers is very different from that expectedin potential flows [36]. A common feature in high Re flows is thatclustering is suppressed by bubble velocity fluctuations [16]. Inthe present study, fluctuations are enhanced by the clusters. Suchdifference adds to the already large list of the contrasting behav-ior between inertial and viscous dominated flows. Similar Tb/U2
SWvalues and behavior were obtained for the other thinning fluids.
It is interesting to note that the values of the bubble velocity vari-
ance found here for a range of 1.7 < Re < 3.4 and thinning conditionsare of the same magnitude as the liquid velocity variance found byCartellier and Rivière [42] for similar Re values (0.66 < Re < 1.48) andgas fractions in Newtonian fluids, although in their experiments the
J. Rodrigo Vélez-Cordero, R. Zenit / J. Non-New
F
v4d
lgctcmgbplrbgatflo(
bibsopscldotnWtae
5
Uv
ig. 10. Bubble velocity variance Tb divided by U2SW
as a function of ˚g . Experimental
alues of this work: (•) db = 2.1 mm, n = 0.85; (�) db = 3.1 mm, n = 0.85; (�) db =.2 mm, n = 0.85; (�) db = 2.1 mm, Newtonian fluid. Other experimental values: (×)ata taken from [8] with Newtonian fluids, (– –) data taken from [17].
iquid phase was forced to flow in a co-current manner with theas phase. Cartellier et al. [43] observed that the dispersion wasomposed by free bubbles, bubble pairs, some triplets and clus-ers composed by more than five bubbles, and also reported a gasoncentration increase at the center of the column. As the volu-etric gas flow rate was further increased, the gas fraction profile
ained the classical saddle shape, that is, with wall peaked distri-utions, and bubble aggregates were dissociated. Although in theresent work the types of bubble associations mentioned by Cartel-
ier et al. [43] in a Newtonian fluid was not observed, the USW/USIatios obtained with this fluid with the smallest and medium bub-le diameters were higher than one (up to 1.3) in the limit of zeroas fraction, contrary to that observed by Zenit et al.[17], revelingkind of long distance interaction between bubbles. In addition
o this, the bubble velocity variance measured for the Newtonianuid at low Re numbers (0.6 < Re < 1.1) also surpassed by nearly onerder of magnitude the values of more inertia dominated flows [8]see Fig. 10).
From all this evidence we can argue that in viscous dominatedubbly flows (in both Newtonian and thinning fluids) the long range
nteractions promote the increase of the rise velocity of the bub-les comparing with the single bubble value. This kind of behavior isimilar to the one seen with settling particles [20,21]. Other effectsf these viscous flows could be the increase of bubble fluctuations,recisely due to the long range bubble interactions, and a net repul-ion force between the bubbles and the column walls [44], whichould explain the abnormal gas fraction profiles obtained by Cartel-ier et al. [43]. Clustering in thinning fluids has, however, importantifferences with the one observed in Newtonian fluids: the numberf bubbles embedded in the cluster is higher in comparison withhe number of bubbles found in the Newtonian case; the compact-ess of the clusters is also higher in the case of the thinning fluids.e think that cluster growth in thinning fluids is a mechanism
hat reduces the spatial viscosity differences in the flow leading to‘Newtonian-like’ state as the gas fraction is increased. This idea isxplained in the companion paper [23].
. Conditions for cluster formation
As we saw in Section 4.4, the increase of the velocity ratio¯ SW/USI, due to bubble clustering, does not depend directly on thealue of the flow index n. This means that a more thinning fluid does
tonian Fluid Mech. 166 (2011) 32–41 39
not necessarily induces bubble clustering. We found that a combi-nation of the values of the Reynolds and Eötvös numbers give theconditions for cluster formation. The value of the flow index is takeninto account in the apparent viscosity included in the Re number.This kind of dependence of the forces acting on the bubbles withthe flow index is in agreement with the results of Zhu et al. [34],who work with thinning fluids that were forced to pass through afixed arrangement of rigid spheres. They found that the drag forceexperimented on a test particle does not depend on the values ofthe flow index but in the Reynolds number and the spacing betweenparticles.
To identify the hydrodynamic conditions for which bubble clus-ters are formed we show our results in terms of the Reynolds andEötvös numbers for the single bubble cases (using Fig. 4), the Eo(also known as Bond) number being defined as:
Eo = �gd2b
�(7)
For the case of isolated bubbles the Eo–Re plot is often used toidentify the shapes of the bubbles [45]. Cluster formation can beidentified by direct observation of the bubbly flow and also by eval-uating the change of USW/USI with the gas volume fraction. Whenthe velocity ratio is larger than 1.5, cluster formation was observed.In Fig. 8a, for example, bubble clusters are formed in the n = 0.5 and0.7 fluids; in Fig. 8c all the thinning fluids formed bubble clusterssince db was small. The relation USW/USI = 1.5 only serves as a dis-tinction between the condition where the velocity of the bubbleswarms was higher than the single velocity but without the for-mation of clusters, as in the Newtonian fluid. We identified clusterformation mainly by simple observation. In the case of the n = 0.32fluid with the smaller bubbles (2.9 mm), cluster identification wasnot easy at gas fractions around 0.4%. At this value clusters becomeprogressively diluted by the whole flow. Nevertheless, we recog-nized these flows as part of the clustering condition since the valuesof USW/USI were above 1.5.
Another parameter that can be used to recognize bubble cluster-ing is the bubble velocity variance. As shown in Section 4.6, bubbleclustering increases considerably the velocity variance of the liquidand bubbles. In our bubbly flows the normalized standard deviation√
Tb/U2SW was about ±0.4 in unclustered flows while it reached up
to ±5.0 when clusters were formed.The result of this mapping is shown in Fig. 11; it includes the
five fluids used in this work. We can describe this plot as follows:the data is separated according to the clustering behavior, filledand empty symbols show flow conditions where clustering was orwas not detected, respectively. For instance, a filled symbol wasassigned to a Eo–Re point if for the same bubble diameter and liq-uid properties the bubbles clustered for a particular gas volumefraction. This mapping is easy to do because the gradual increase ofthe gas fraction produce only a slight increase of db. A separation ofthe two regimes can be observed. Clearly, the clustering is observedwhen the viscous effects are more important than the inertial ones(small Re). Hence, as inertia increases it is possible to break the clus-tering behavior. Additionally, the deformability of the bubbles isalso important. For a given value of Re, a flow with more deformablebubbles will tend to cluster more easily (as the Eo increases). Theseparation between the two regimes is given approximately by theiso-Morton line of 1 × 10⁻³, the Morton number being defined as:
Mo = g�4
��3(8)
Previously, a Morton value of 4 × 10⁻⁴ was proposed [9,46] asa transition indicator from non-coalescing flows to coalescingflows in Newtonian fluids. This suggest that the transition of non-interacting to interacting bubbles is a general condition for inelasticfluids, including the Newtonian and shear-thinning fluids. In this

40 J. Rodrigo Vélez-Cordero, R. Zenit / J. Non-New
10−1
100
101
10−1
100
101
102
Rey
nold
s
FREE BUBBLES
CLUSTERING
Mo=10−4
Mo=10−3n=0.5
n=0.7
n=0.8n=0.3
sovtoE
Fig. 11. Cluster condition formation mapped in a Eo–Re curve of the single bubbles.(fl
wNcid
Tnhfl
ttflMobnt(b[IMefl
dsplct
6
mwev
Acknowledgements
•) hydrodynamic conditions for bubble clustering, (◦) hydrodynamic conditions forree bubbles, (– –) Mo = 10−3, (. . .) Mo = 10−4, (×) Newtonian values. The iso-Mortonines were taken from [45].
ork no clustering was seen at first glance in the Newtonian fluid.evertheless, a pair of bubbles rising in a viscous Newtonian fluidan form a stable doublet (see the companion paper [23]). Thisndicates that the gas fraction has an important role in clusteresegregation in Newtonian fluids, as seen by Cartellier et al. [43].
The Mo number increases from top to bottom in a Eo–Re plot.he tendency to form bubble clusters increases with the Mortonumber. That is why the n = 0.55 fluid, with the highest Mo number,as the biggest USW/USI values (see Fig. 8) followed by the n = 0.76uid and finally by the n = 0.85 and 0.32 fluids.
We could infer from Fig. 11 that at very low Re numbers, inhe creeping flow regime, the curves displayed in Fig. 8 will havehe same trend as the theoretical ones, that is to say, the n = 0.32uid will have the highest USW/USI values, as it will have the highestorton number, followed by the n = 0.55 and so on. As discussed by
ther authors [47,46], bubble interaction strongly depends on theubbles wake and vortices structure, which in turn evolve as the Reumber is increased or the bubble shape is changed. Additionally,he degree of deformation of a bubble, measured with the Eötvösor Bond) number is another important factor that enhance bub-le alignment and coalescence, as explained by Manga and Stone48,49]. In this work a maximum Eo number of 10 was reached.t would be interesting to investigate if bubbles with Eo > 40 and
o > 1 × 10⁻³, in which according to [45] the skirted and dimpledllipsoidal-cap bubbles are observed, also form clusters in thinninguids.
In the companion paper of this investigation [23] we present aetailed study of the interaction of two bubbles rising in the samehear-thinning fluids employed in this work. The results, whichointed out the importance of the shear-thinning wake formed by a
eading bubble, complement and explain the appearance of bubblelusters in thinning fluids whose structure differs significantly fromhe ones observed in Newtonian bubbly flows.
. Conclusions
In this work experiments were conducted to study cluster for-ation in bubbly flows with shear-thinning fluids. Special careas taken to produce nearly mono-dispersed bubbly flows and to
mploy thinning fluids with negligible elasticity. The visual obser-ation of the flow revealed the formation of dense bubble clusters
tonian Fluid Mech. 166 (2011) 32–41
in the thinning fluids which grow with the gas fraction and increasethe mean bubble velocity with respect to the velocity achievedby single bubbles. Such clusters, which actually lead to contactbetween bubbles, have larger dimensions and lifetime than theones observed in Newtonian potential flows [16,17]. By measur-ing the mean rise velocity of the bubble swarms USW at differentgas fractions, and non-dimensionalized them with the single bub-ble velocities USI, comparison with previous theoretical data couldbe conducted. The main conclusions of this investigation are:
1. Qualitative agreement of the velocities ratio USW/USI as a func-tion of the gas volume fraction was found with the theoreticalstudies [28,35]. Therefore, the Happel cell model can predict theeffects of the reduction of the local viscosity together with thehydrodynamic hindrance provoked by bubble interactions.
2. Quantitative agreement with the velocities ratio was not foundbetween the experiments of this work and the theoretical pre-dictions since the maximum of the velocity ratio USW/USI wasfound at lower gas fractions than the ones predicted by the the-ory, which this work revealed that is was incomplete. In fact,the permissible experimental gas fraction values are much lowerthan the theoretical ones for the cases of mono-dispersed bub-bly flows. The heterogeneous or churn-turbulent regime hasinteresting issues by itself but cannot be used to compare exper-imental results with the available theoretical data.
3. The magnitude of the velocity ratio USW/USI was higher than thetheoretical one even at low values of the gas fraction. The differ-ence is attributed to the formation of clusters which the Happelcell model does not account for.
4. The ratio of the mean bubble velocity and the single bubblevelocity did not follow an orderly correspondence with the flowindex values, as seen in the theoretical works. Instead of this,the USW/USI values could be related to the values of the Reynoldsand Eötvös numbers of the single bubbles. Moreover, the bubbleclustering condition was mapped in a Eo–Re plot. Two regimeswere identified: a free bubble regime and a cluster formationregime. The limit between one and the other is close to a criticalMorton number (4 × 10⁻⁴) which has been identified as a tran-sition indicator from non-coalescing flows to coalescing flows inNewtonian fluids.
We should mention that although the Eo–Re plot proved to beuseful in predicting bubble clustering using single bubble data, itcould underestimate the roll that the gas fraction has on clustergrowth. The influence of the gas fraction, which seems to be impor-tant in Newtonian fluids and lesser in shear-thinning fluids, shouldbe clarified in the future.
Measurements were also conducted to obtain the equivalentdiameter of the bubble cluster and bubble velocity variance. Theseresults suggest that the cluster growth is not related to the sizeof individual bubbles and that the dimensionless bubble velocityvariance Tb/U2
SW increases significantly when bubble clusters areformed.
It is our hope that this work will contribute to the understandingof the formation of bubble clusters in shear-thinning fluids, whichis an important issue in multiphase flows as well as a precursor tobubble coalescence and change of regime in bubble flows.
The authors will like to thank the support of G. Sánchez, F.Calderas and L. Medina for their help in the rheological measure-ments. R. Vélez acknowledges CONACyT-México for its financialsupport during his doctoral studies.

n-New
R
[
[
[
[
[
[
[
[
[
[
[
[
[
[
[
[
[
[
[
[
[
[
[
[
[
[
[
[
[
[
[
[
[
[
[
[
[
[
J. Rodrigo Vélez-Cordero, R. Zenit / J. No
eferences
[1] N. Kantarci, F. Borak, K.O. Ulgen, Bubble column reactors, Proc. Biochem. 40(2005) 2263.
[2] W.-D. Deckwer, Bubble Column Reactors, Wiley, NY, 1992.[3] Y.T. Shah, B.G. Kelkar, S.P. Godbole, W.-D. Deckwer, Design parameters estima-
tion for bubble column reactors, A. I. Ch. E. J. 28 (1982) 353.[4] M. Zlokarnik, Trends and needs in bioprocess engineering, Chem. Eng. Prog. 86
(1990) 62.[5] H.W. Blanch, S.M. Bhavaraju, Rheology of fermentation broths, Biotechnol. Bio-
eng. 18 (1976) 745.[6] P.M. Kilonzo, A. Margaritis, The effects of non-Newtonian fermentation broth
viscosity and small bubble segregation on oxygen mass transfer in gas-liftbioreactors: a critical review, Biochem. Eng. J. 17 (2004) 27.
[7] L. van Wijngaarden, On pseudo turbulence, Theor. Comput. Fluid Dynam. 10(1998) 449.
[8] J. Martínez-Mercado, C.A. Palacios-Morales, R. Zenit, Measurement of pseudo-turbulence intensity in monodispersed bubbly liquids for 10 < Re < 500, Phys.Fluids 19 (2007) 103302.
[9] A. Smolianski, H. Haario, P. Luukka, Numerical study of dynamics of a singlebubbles and bubbles swarm, Appl. Math. Model. 23 (2008) 641.
10] N. Kishore, R.P. Chhabra, V. Eswaran, Drag on ensembles of fluid spheres trans-lating in a power-law liquid at moderate Reynolds numbers, Chem. Eng. J. 139(2008) 224.
11] S. Radl, G. Tryggvason, J.G. Khinast, Flow and mass transfer of fully resolvedbubble in non-Newtonian fluids, A. I. Ch. E. J. 53 (2007) 1861.
12] R.G. Larson, The Structure and Rheology of Complex Fluids, Oxford UniversityPress, 1999.
13] H.H. Hu, N.A. Patankar, M.Y. Zhu, Direct numerical simulations of fluid–solidsystems using the arbitrary Lagrangian–Eulerian technique, J. Comput. Phys.169 (2001) 427.
14] G. Gheissary, B.H.A.A. van den Brule, Unexpected phenomena observed in par-ticle settling in non-Newtonian media, J. Non-Newton. Fluid Mech. 67 (1996)1.
15] D.D. Joseph, Y.J. Liu, M. Poletto, J. Feng, Aggregation and dispersion of spheresfalling in viscoelastic liquids, J. Non-Newton. Fluid Mech. 54 (1994) 45.
16] B. Figueroa-Espinoza, R. Zenit, Clustering in high Re monodispersed bubblyflows, Phys. Fluids 17 (2005) 091701.
17] R. Zenit, D.L. Koch, A.S. Sangani, Measurements of the average properties of asuspension of bubbles rising in a vertical channel, J. Fluid Mech. 429 (2001)307.
18] H. Buchholz, R. Buchholz, J. Lücke, K. Schügerl, Bubble swarm behavior andgas absortion in non-Newtonian fluids in sparged columns, Chem. Eng. Sci. 33(1978) 1061.
19] A. Schumpe, W.-D. Deckwer, Gas holdups, specific interfacial areas, and masstransfer coefficients of aerated carboxymethyl cellulose solutions in a bubblecolumn, Ind. Eng. Chem. Proc. Des. Dev. 21 (1982) 706.
20] K.O.L.F. Jayaweera, B.J. Mason, G.W. Slack, The behavior of cluster of spheresfalling in a viscous fluid, J. Fluid Mech. 20 (1964) 121.
21] L.M. Hocking, The behavior of clusters of spheres falling in a viscous fluid, J.Fluid Mech. 20 (1964) 129.
22] D.D. Joseph, Y.J. Liu, Orientation of long bodies falling in a viscoelastic liquid, J.Rheol. 37 (1993) 961.
23] J.R. Vélez-Cordero, D. Samano, P. Yue, J.J. Feng, R. Zenit, Hydrodynamic inter-action between a pair of bubbles ascending in shear-thinning inelastic fluids, J.Non-Newton. Fluid Mech., submitted for publication.
24] W.-D. Deckwer, K. Nguyen-tien, A. Schumpe, Y. Serpemen, Oxygen mass trans-fer into aerated CMC solutions in a bubble column, Biotechol. Bioeng. 24 (1982)461.
[
[
tonian Fluid Mech. 166 (2011) 32–41 41
25] S.P. Godbole, A. Schumpe, Y.T. Shah, N.L. Carr, Hydrodynamics and mass trans-fer in non-Newtonian solutions in a bubble column, A. I. Ch. E. J. 30 (1984)213.
26] N.W. Haque, K.D.P. Nigam, K. Viswanathan, J.B. Joshi, Studies on gas holdupand bubble parameters in bubble columns with (carboxymethyl)cellulose solu-tions, Ind. Eng. Chem. Res. 26 (1987) 86.
27] N.W. Haque, K.D.P. Nigam, K. Viswanathan, J.B. Joshi, Studies on bubble risevelocity in bubble columns employing non-Newtonian solutions, Chem. Eng.Commun. 73 (1988) 31.
28] S. Gummalam, R.P. Chhabra, Rising velocity of a swarm of spherical bubbles ina power law non-Newtonian liquid, Can. J. Chem. Eng. 65 (1987) 1004.
29] S.M. Bhavaraju, R.A. Mashelkar, H.W. Blanch, Bubble motion and mass transferin non-newtonian fluids: Part II. Swarm of bubbles in a power law fluid, A. I.Ch. E. J. 24 (1978) 1070.
30] T. Hirose, M. Moo-Young, Bubble Drag and Mass Transfer in non-NewtonianFluids: Creeping Flow with Power-law Fluids, Can. J. Chem. Eng. 47 (1969) 265.
31] J. Happel, Viscous flow in multiparticle systems: slow motion of fluids relativeto beds of spherical particles, A. I. Ch. E. J. 4 (1958) 197.
32] D. Rodrigue, D. De Kee, C.F. Chan Man Fong, A note on the drag coefficient of asingle gas bubble in a power-law fluid, Can. J. Chem. Eng. 77 (1999) 766.
33] A. Acharya, R.A. Mashelkar, J. Ulbrecht, Mechanics of bubble motion and defor-mation in non-newtonian media, Chem. Eng. Sci. 32 (1977) 863.
34] C. Zhu, K. Lam, H.-H. Chu, X.-D. Tang, G. Liu, Drag forces of interacting spheresin power-law fluids, Mech. Res. Commun. 30 (2003) 651.
35] R.P. Chhabra, Rising velocity of a swarm of spherical bubbles in power law fluidsat high Reynolds numbers, Can. J. Chem. Eng. 76 (1998) 137.
36] P.D.M. Spelt, A.S. Sangani, Properties and averaged equations for flows of bubblyliquids, Appl. Sci. Res. 58 (1998) 337.
37] H.N. Oguz, A. Prosperetti, Dynamics of bubble growth and detachment from aneedle, J. Fluid Mech. 257 (1993) 111.
38] R.R. Lessard, S.A. Zieminski, Bubble coalescence and gas transfer in aqueouselectrolytic solutions, Ind. Eng. Chem. Fundam. 10 (1971) 260.
39] F. Calderas, A. Sanchez-Solis, A. Maciel, O. Manero, The transient flow of the PET-PEN-montmorillonite clay nanocomposite, Macromol. Symp. 283–284 (2009)354.
40] E. Soto, C. Goujon, R. Zenit, O. Manero, A study of velocity discontinuity for singleair bubbles rising in an associative polymer, Phys. Fluids 18 (2006) 121510.
41] M. Ishii, N. Zuber, Drag coefficient and relative velocity in bubbly, droplet orparticulate flows, A. I. Ch. E. J. 25 (1979) 843.
42] A. Cartellier, N. Rivière, Bubble-induced agitation and microstructure in uni-form bubbly flows at small to moderate particle Reynolds numbers, Phys. Fluids13 (2001) 2165.
43] A. Cartellier, L. Timkin, N. Rivière, New structures of Poiseuille bubbly flows dueto clustering, in: Proc. ASME-FEDSM’ 97, paper 3528, Vancouver, June 22–26,1997.
44] P. Vasseur, R.G. Cox, The lateral migration of spherical particles sedimenting ina stagnant bounded fluid, J. Fluid Mech. 80 (1977) 561.
45] R. Clift, J.R. Grace, M.E. Weber, Bubbles, Drops, and Particles, Academic Press,NY, 1978.
46] C.W. Stewart, Bubble interaction in low-viscosity liquids, Int. J. Multiphase Flow21 (1995) 1037.
47] D. Legendre, J. Magnaudet, G. Mougin, Hydrodynamic interactions betweentwo spherical bubbles rising side by side in a viscous liquid, J. Fluid Mech. 497
(2003) 133.48] M. Manga, H.A. Stone, Buoyancy-driven interactions between two deformableviscous drops, J. Fluid Mech. 256 (1993) 647.
49] M. Manga, H.A. Stone, Collective hydrodynamics of deformable drops and bub-bles in dilute low Reynolds number suspensions, J. Fluid Mech. 300 (1995)231.


