Embed Size (px)
Citation preview
ZE WANG, STEVEN J. OSTERLIND and DAVID A. BERGIN
BUILDING MATHEMATICS ACHIEVEMENT MODELS IN FOURCOUNTRIES USING TIMSS 2003
Received: 30 January 2011; Accepted: 20 December 2011
ABSTRACT. Using the Trends in International Mathematics and Science Study 2003data, this study built mathematics achievement models of 8th graders in four countries: theUSA, Russia, Singapore and South Africa. These 4 countries represent the full spectrumof mathematics achievement. In addition, they represent 4 continents, and they include 2countries hugely influential in world events (the USA and Russia). In each country,students’ self-concept of ability in mathematics, mathematics values, perception of school,teachers’ and principals’ perceptions of school and other characteristics related to theclassroom and school were incorporated to build an achievement model throughhierarchical linear modelling. The final achievement models suggested that amongstudent variables, self-concept of ability in mathematics had the highest relation to 8thgraders’ mathematics achievement in all 4 countries. The relation between mathematicsachievement and other student characteristics, along with the family, teacher and schoolvariables, differed across the 4 countries. This suggests that self-concept of ability is a keyvariable for understanding achievement in high and low achieving countries and that othercontextual variables vary in the magnitude of relations to mathematics achievement acrosscountries.
KEY WORDS: mathematics achievement, school climate, self-concept of ability, taskvalues, TIMSS 2003
INTRODUCTION
The impact of mathematics proficiency can be viewed from varyingperspectives, ranging from likelihood of a student’s pursuing post-secondary education to a family’s standard of living and income, to anation’s ability to compete in the global economy (Baker & LeTendre,2005). From these perspectives, then, it is important to understandmathematics achievement, both within and across countries. The purposeof this article is to compare prediction of mathematics achievement infour different countries using large-scale data in order to test whether amodel of motivation works in the same way across countries. The data setwas from the Trends in International Mathematics and Science Study(TIMSS) 2003. We used a model building and model trimming approachto study relationships between student mathematics achievement and
International Journal of Science and Mathematics Education (2012) 10: 1215Y1242# National Science Council, Taiwan 2012
personal and environmental variables with a focus on motivationalvariables.
THEORETICAL BACKGROUND
Expectancy-Value Model
Mathematics achievement is closely related to students’ academicmotivation, which is shaped by the cultural, familial and societal contextin which students live. Many motivation constructs have been proposedthat refer to people’s beliefs in their own ability and competence; theseinclude self-concept, self-efficacy, perceptions of competence andperceptions of ability (Bandura, 1997; Deci & Ryan, 1985; Harter,1998; Marsh, 1990; Wigfield & Eccles, 2000). While there are differencesamong these constructs, in general they refer to persons’ confidence thatthey can carry out certain behaviours and perceptions that they haverelevant abilities. The expectancy-value model elaborated by Wigfield &Eccles (2000) is one achievement model that focuses on people’s beliefsin their own ability and competence. In the expectancy-value model, twokey predictors of achievement are self-concept of ability and subjectivetask values.
Self-concept of ability in the academic domain, or academic self-concept, refers to individuals’ perceptions or beliefs in their ability to dowell in the academic domain. Academic self-concepts are hierarchical,multidimensional and subject-specific (Marsh, 1990; Shavelson & Marsh,1986). That is, students tend to have different self-concepts for differentschool subjects like language arts, mathematics and science. Meta-analysis indicates that self-concept of domain-specific ability is amoderate but systematic predictor of later academic achievement,controlling for initial achievement (Valentine, DuBois & Cooper, 2004).While the meta-analysis is congruent with the supposition that self-beliefsaffect achievement, it is also plausible that achievement affects self-beliefs. In fact, Valentine, DuBois and Cooper state that “our resultsshould not be taken as proof that self-beliefs have a causal relation to laterachievement” (p. 128). Self-concept of ability is particularly important forunderstanding mathematics achievement because it has been demonstrat-ed to explain variance in mathematics achievement, course choices inhigh school and career aspirations (Greene, DeBacker, Ravindran &Krows, 1999; Marsh & Yeung, 1997b; Stevens, Wang, Olivarez &Hamman, 2007). In addition, mathematics self-concept explains variance
ZE WANG, STEVEN J. OSTERLIND AND DAVID A. BERGIN1216
in mathematics achievement with greater magnitude than science orEnglish self-concept predicts science or English achievement (Marsh &Yeung, 1997a).
The other key predictor of achievement in the expectancy-value model,subjective task values, includes interest enjoyment, utility value andattainment value. Students who value a school subject are more likely tochoose to pursue it, to put effort into the pursuit and to experience successthan those who do not. Prior research on achievement task values revealsthat utility value and attainment value are highly correlated, and someresearchers have combined them, applying the term “task importance” torefer to the summated construct (Durik, Vida & Eccles, 2006). Studieshave shown that students’ subjective task values predict academicoutcomes above and beyond self-concept of ability (Eccles, 2005; Gainor& Lent, 1998; Meece, Wigfield & Eccles, 1990). In general, abilityperceptions are stronger predictors of achievement than task values, whiletask values are better predictors of choices like intentions to take mathcourses (Wigfield & Eccles, 2000).
Learning Environment
In addition to motivational constructs, students develop perceptions oftheir learning environment. These perceptions influence how studentsmake meaning of the schooling experience and the way they relate to theschool community. Students’ perceptions of their relations with teachersare especially important, and positive perceptions are associated withpositive academic, social and psychological outcomes at differentschooling stages (Bergin & Bergin, 2009; Davis, 2003). Positiverelationships with teachers may satisfy students’ needs for competenceand relatedness and affect their academic achievement through mediatorssuch as students’ sense of belonging (Roeser, Midgley & Urdan, 1996).
Besides student–teacher relationships, Lee & Shute (2010) identified twocategories of social–contextual factors that are related to K–12 academicachievement. The first category is school climate, which includes academicemphasis, classroom management and principal leadership. Each of thesehas been demonstrated to correlate with achievement (Freiberg, Huzinec &Templeton, 2009; Lee & Smith, 1999; Leitwood & Hallinger, 2002). In ourstudy, we used the following variables: teacher’s perception of schoolclimate, principal’s perception of school climate, teacher’s perception ofschool safety, classroom management challenges, number of mathematicstopics taught, school and class attendance and school resources. Note thatour data included teacher and administrator perceptions. Studies have found
BUILDING MATHEMATICS ACHIEVEMENT MODELS 1217
that teacher, student and administrator perceptions are largely independent ofeach other (Walberg, 1979).
The second category of social–contextual factors related to K–12academic achievement is social–familial influences, which includeparental involvement (Lee & Shute, 2010). A growing body of researchshows that students perform better academically when their parents areinvolved with their schooling (e.g. Astone & McLanahan, 1991;Coleman, 1990; Feuerstein, 2000; Rumberger & Palardy, 2005). Parentalaspirations for children and socialization of achievement values areparticularly important. In a meta-analysis, Fan & Chen (2001) found anaverage correlation of 0.40 between parent aspirations for the student’seducation and student’s academic achievement. In another meta-analysis,Hill & Tyson (2009) found an effect size of 0.39 between parentalsocialization of academic values and achievement. In addition, parents’participation in school activities shows associations with their children’sacademic achievement (Hill & Craft, 2003; Keith & Keith, 1993; Parcel& Dufur, 2001).
Model Building
In this study, we used a model building and model trimming approach tostudy the aforementioned constructs in predicting student mathematicsachievement. We built the models by employing multilevel modellingtechniques to derive efficient mathematics achievement models. Our dataare from TIMSS 2003. For analysis, we selected eighth grade mathemat-ics achievement scores along with student background, motivationalvariables and school contextual information in four countries. Specifical-ly, we focused on the student motivational constructs of self-concept ofability in mathematics and subjective task values for mathematics andtheir relations to student mathematics achievement. For contextualvariables, we used data indicating parent, teacher, classroom and schoolcharacteristics. Including these allowed us to comprehensively compareboth the overall and incremental effects of student motivation onmathematics achievement, both within our selected countries as well asacross the borders.
CULTURAL VARIATION: COMPARISON OF FOUR COUNTRIES
Differences in education systems across countries, together with culturaland societal influences, likely play a role in the formation of both
ZE WANG, STEVEN J. OSTERLIND AND DAVID A. BERGIN1218
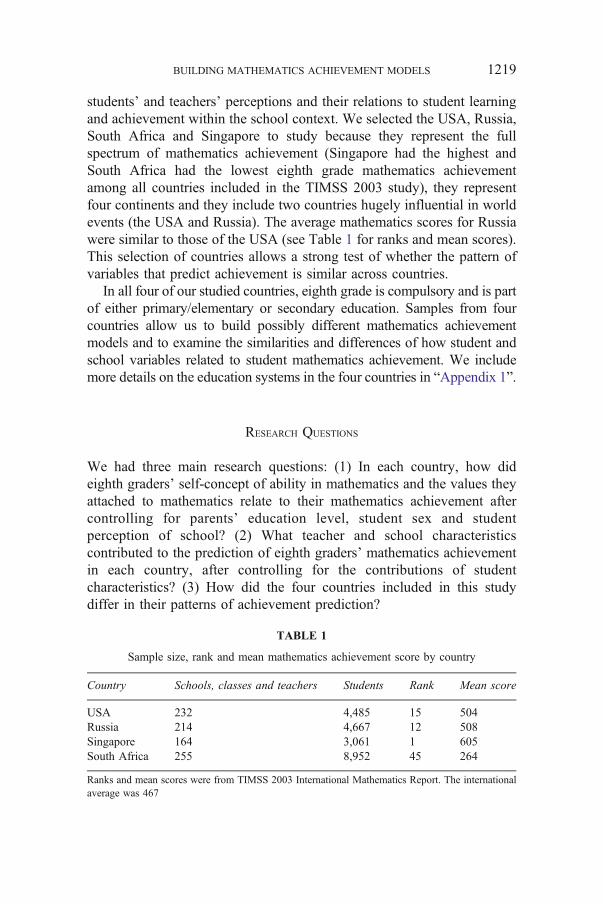
students’ and teachers’ perceptions and their relations to student learningand achievement within the school context. We selected the USA, Russia,South Africa and Singapore to study because they represent the fullspectrum of mathematics achievement (Singapore had the highest andSouth Africa had the lowest eighth grade mathematics achievementamong all countries included in the TIMSS 2003 study), they representfour continents and they include two countries hugely influential in worldevents (the USA and Russia). The average mathematics scores for Russiawere similar to those of the USA (see Table 1 for ranks and mean scores).This selection of countries allows a strong test of whether the pattern ofvariables that predict achievement is similar across countries.
In all four of our studied countries, eighth grade is compulsory and is partof either primary/elementary or secondary education. Samples from fourcountries allow us to build possibly different mathematics achievementmodels and to examine the similarities and differences of how student andschool variables related to student mathematics achievement. We includemore details on the education systems in the four countries in “Appendix 1”.
RESEARCH QUESTIONS
We had three main research questions: (1) In each country, how dideighth graders’ self-concept of ability in mathematics and the values theyattached to mathematics relate to their mathematics achievement aftercontrolling for parents’ education level, student sex and studentperception of school? (2) What teacher and school characteristicscontributed to the prediction of eighth graders’ mathematics achievementin each country, after controlling for the contributions of studentcharacteristics? (3) How did the four countries included in this studydiffer in their patterns of achievement prediction?
TABLE 1
Sample size, rank and mean mathematics achievement score by country
Country Schools, classes and teachers Students Rank Mean score
USA 232 4,485 15 504Russia 214 4,667 12 508Singapore 164 3,061 1 605South Africa 255 8,952 45 264
Ranks and mean scores were from TIMSS 2003 International Mathematics Report. The internationalaverage was 467
BUILDING MATHEMATICS ACHIEVEMENT MODELS 1219
METHOD
Data Source and Sample
TIMSS is one of the largest and most complex cross-national datacollection efforts of educational achievement. In addition to assessingstudents’ mathematics and science proficiency, TIMSS also collects a vastamount of information from students, their parents, teachers andprincipals. For TIMSS 2003, in each country, representative samples ofstudents were selected using a two-stage sampling design. At the firststage, schools were selected using probability-proportional-to-size sam-pling; at the second stage, one or two classes were randomly sampled ineach school. When TIMSS data are analysed, it is important to include aweight variable reflecting the sampling scheme (Joncas, 2004; Martin,2005). Our consideration of this TIMSS feature is discussed below.
In Russia and South Africa, one class was selected from each participatingschool; in Singapore, two classes were selected from each participatingschool and in the USA, one or two classes were selected from eachparticipating school. To accommodate this sampling feature and to beconsistent across the analyses for all the four countries, the data from a classwere used if that class was the only one from its school, and we randomlyselected one class from a school if two classes from that school wereincluded in the TIMSS database. Countries were not modelled as anadditional level but were treated as fixed groups for which mathematicsachievement models were built. This is because we sought differencesamong them in their mathematics achievement models rather than to findhow much variation existed between countries. The numbers of schools/classes, students and mathematics teachers used in our study are given inTable 1. The data used in our study were of two levels in each country. Atlevel 1, variables were from students, and at level 2, variables were related toschools and classes (which were confounded).
Measures and Preparation of Variables
The TIMSS 2003 database includes many individual items. We examinedthe items and developed measures that were useful to investigating ourhypotheses. Details of scale development are included in “Appendix 2”.At the student level, we built measures of student self-concept of abilityin mathematics, the values students attached to mathematics and students’perception of school. At the school/class level, scales were created tomeasure mathematics teachers’ and school principals’ perceptions ofschool climate, teachers’ perception of school safety and teacher’s
ZE WANG, STEVEN J. OSTERLIND AND DAVID A. BERGIN1220
perceptions of classroom management challenges. The particular TIMSSitems used to construct the scales are included in “Appendix 2”.
In terms of demographic measures, student and mathematics teacher’ssex was coded as dummy variables (0 = female, 1 = male). Parent’shighest education level was coded as one of five levels: 1 = no more thanprimary schooling, 2 = lower secondary schooling, 3 = upper secondaryschooling, 4 = post-secondary vocational/technical education but notuniversity and 5 = university or equivalent or higher.
At the school/class level, we also included the number of years of teachingexperience of the mathematics teacher, whether the mathematics teacher hada full licence or certificate (0 = no, 1 = yes), number of mathematics topicsincluded in TIMSS assessment that had been taught (this was the number ofTIMSS framework topics with a maximum of 44; see Cogan & Schmidt,2002 for another way of defining broader topic levels), an index variable ofschool and class attendance (1 = low, 2 = medium, 3 = high) and an indexvariable of school resources (1 = low, 2 = medium, 3 = high). In addition,expected parental involvement was the number of activities that the principalreported he or she expected of parents and ranged from zero to five.
In the hierarchical linear modelling (HLM) analyses within eachcountry, dummy/dichotomous variables were not centred; consequently,the coefficients for those variables are interpreted as the mean differencebetween the two groups. All scale variables were transformed into zscores across schools but within each country so that results could bereported as standard deviation units within each country.
For student-level variables, the number of cases with incomplete dataof each variable was calculated. The highest percentage of cases withincomplete data of all student-level variables was 15.52%, 3.27%, 3.05%and 18.04% for the USA, Russia, Singapore and South Africa,respectively (however, all values of the variable “number of mathematicstopics taught” were missing in the Russia sample, and therefore, thevariable was not included when analysing data from Russia). For theschool/class level variables, the highest percentage of cases withincomplete data was 19.39%, 10.37%, 16.72% and 26.18% for theUSA, Russia, Singapore and South Africa, respectively. We used theexpectation maximization method to impute missing data on continuousvariables. In our HLM analyses, we used the reported school weights atlevel 2 (school/class level) and did not use any weight at level 1 (studentlevel) because we did not use all the student data (we selected one classfrom each school instead). This would not distort our results because onlyat the stage of sampling schools did TIMSS use probability-proportional-to-size sampling (for discussion of sample weights in complex data, see
BUILDING MATHEMATICS ACHIEVEMENT MODELS 1221
Kaplan & Ferguson, 1999; Pfeffermann, Skinner, Holmes, Goldstein &Rasbash, 1998; Stapleton, 2002).
The measure of student mathematics achievement was from the TIMSS2003 database. TIMSS 2003 used a matrix-sampling technique such that astudent would only answer questions included in certain subsets of items,called “item blocks”. Students’ mathematics proficiency was estimatedthrough item response theory, together with a multiple imputation technique(this procedure has been used for other large-scale projects such as theNational Assessment of Educational Progress; for a more technical descriptionof the procedure, see von Davier & Sinharay, 2007). By matrix sampling andmultiple imputation, each student’s mathematics achievement is representedwith five plausible values, enough to allow for imputation error (Mislevy,1991; Schafer, 1997) (however, also see Graham, Olchowski & Gilreath,2007). The plausible values are not appropriate for use as individual studentscores for reporting to the students; however, they can be used to estimatepopulation characteristics, with better performance than point estimates (Wu,2005). Our data analysis follows usual procedures for analysing multipleimputed datasets, with each set of plausible values analysed separately, andresults from the five sets combined to allow for multiple imputation errors(Enders, 2010).
Statistical Analyses
We applied a model building process using HLM (Raudenbush & Bryk,2002) to study the incremental contribution of variables in predictingstudent mathematics achievement, as appropriate to our hypotheses.Specifically, student, teacher and school variables were used to build amathematics achievement model for eighth graders in each of the fourselected countries. In each country, the level 1 unit of analysis wasstudents and the level 2 unit of analysis was schools/classes. The modelbuilding process was first conducted at level 1 and then at level 2. Level 1main effects, cross-level interactions and level 2 main effects wereexamined. At each step in our model building, we also employed a modeltrimming procedure to achieve parsimony.
In each country, three sets of HLM models were analysed and modified inthe modelling process. We first looked at the variation of student mathematicsachievement and examined how much of this variation was at the student orclass/school levels (i.e. fully unconditional model—model a). Next, studentvariables were added to the model as level 1 predictors, and nonsignificantpredictors were removed (model trimming). This resultant model (model b)answers the question to what extent the considered student variables predict
ZE WANG, STEVEN J. OSTERLIND AND DAVID A. BERGIN1222
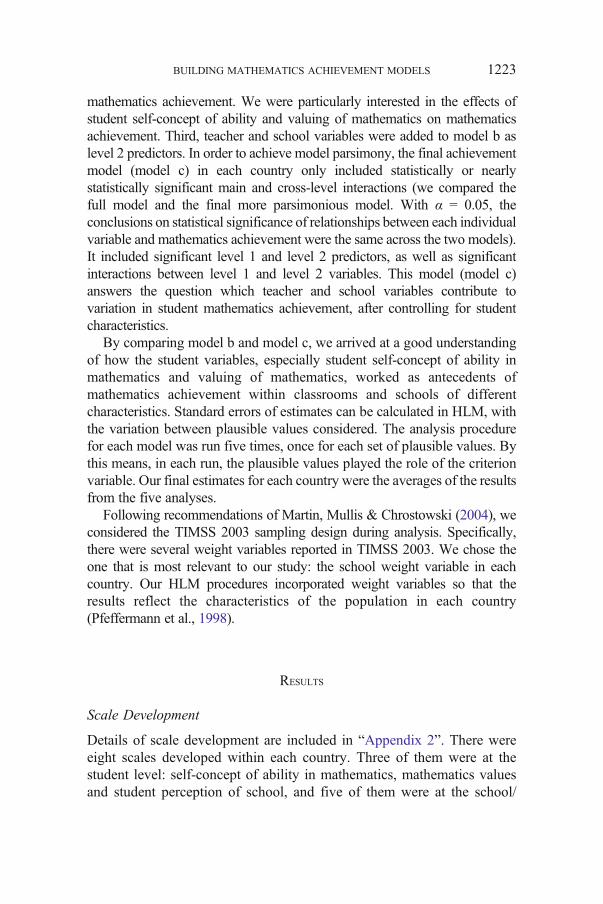
mathematics achievement. We were particularly interested in the effects ofstudent self-concept of ability and valuing of mathematics on mathematicsachievement. Third, teacher and school variables were added to model b aslevel 2 predictors. In order to achieve model parsimony, the final achievementmodel (model c) in each country only included statistically or nearlystatistically significant main and cross-level interactions (we compared thefull model and the final more parsimonious model. With α = 0.05, theconclusions on statistical significance of relationships between each individualvariable and mathematics achievement were the same across the two models).It included significant level 1 and level 2 predictors, as well as significantinteractions between level 1 and level 2 variables. This model (model c)answers the question which teacher and school variables contribute tovariation in student mathematics achievement, after controlling for studentcharacteristics.
By comparing model b and model c, we arrived at a good understandingof how the student variables, especially student self-concept of ability inmathematics and valuing of mathematics, worked as antecedents ofmathematics achievement within classrooms and schools of differentcharacteristics. Standard errors of estimates can be calculated in HLM, withthe variation between plausible values considered. The analysis procedurefor each model was run five times, once for each set of plausible values. Bythis means, in each run, the plausible values played the role of the criterionvariable. Our final estimates for each country were the averages of the resultsfrom the five analyses.
Following recommendations of Martin, Mullis & Chrostowski (2004), weconsidered the TIMSS 2003 sampling design during analysis. Specifically,there were several weight variables reported in TIMSS 2003. We chose theone that is most relevant to our study: the school weight variable in eachcountry. Our HLM procedures incorporated weight variables so that theresults reflect the characteristics of the population in each country(Pfeffermann et al., 1998).
RESULTS
Scale Development
Details of scale development are included in “Appendix 2”. There wereeight scales developed within each country. Three of them were at thestudent level: self-concept of ability in mathematics, mathematics valuesand student perception of school, and five of them were at the school/
BUILDING MATHEMATICS ACHIEVEMENT MODELS 1223
class level: principal’s perception of school climate, mathematicsteacher’s perception of school climate, mathematics teacher’s perception ofschool safety, classroom management challenge due to diversity of studentsand classroom management challenge due to student misbehaviours.
HLM Analyses
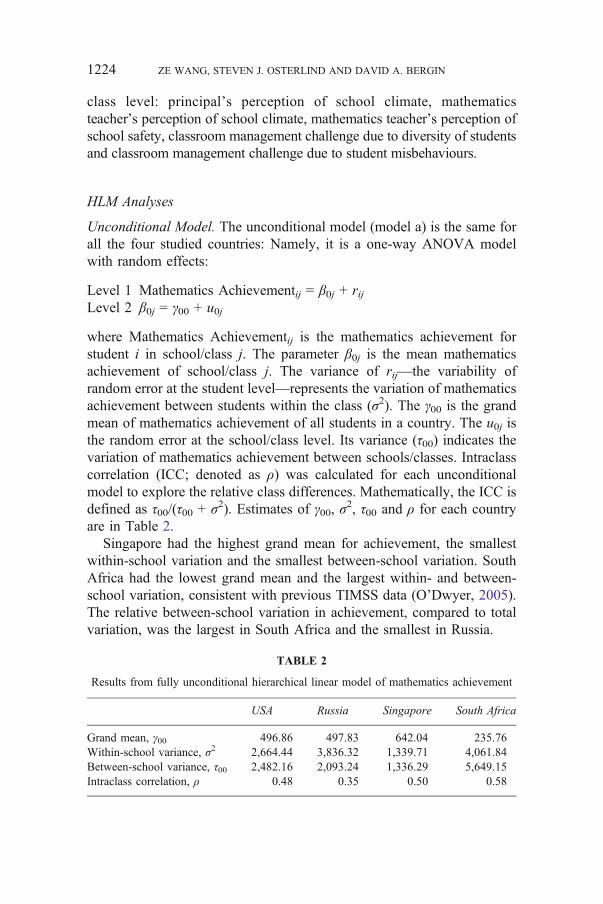
Unconditional Model. The unconditional model (model a) is the same forall the four studied countries: Namely, it is a one-way ANOVA modelwith random effects:
Level 1 Mathematics Achievementij = β0j + rijLevel 2 β0j = γ00 + u0j
where Mathematics Achievementij is the mathematics achievement forstudent i in school/class j. The parameter β0j is the mean mathematicsachievement of school/class j. The variance of rij—the variability ofrandom error at the student level—represents the variation of mathematicsachievement between students within the class (σ2). The γ00 is the grandmean of mathematics achievement of all students in a country. The u0j isthe random error at the school/class level. Its variance (τ00) indicates thevariation of mathematics achievement between schools/classes. Intraclasscorrelation (ICC; denoted as ρ) was calculated for each unconditionalmodel to explore the relative class differences. Mathematically, the ICC isdefined as τ00/(τ00 + σ2). Estimates of γ00, σ
2, τ00 and ρ for each countryare in Table 2.
Singapore had the highest grand mean for achievement, the smallestwithin-school variation and the smallest between-school variation. SouthAfrica had the lowest grand mean and the largest within- and between-school variation, consistent with previous TIMSS data (O’Dwyer, 2005).The relative between-school variation in achievement, compared to totalvariation, was the largest in South Africa and the smallest in Russia.
TABLE 2
Results from fully unconditional hierarchical linear model of mathematics achievement
USA Russia Singapore South Africa
Grand mean, γ00 496.86 497.83 642.04 235.76Within-school variance, σ2 2,664.44 3,836.32 1,339.71 4,061.84Between-school variance, τ00 2,482.16 2,093.24 1,336.29 5,649.15Intraclass correlation, ρ 0.48 0.35 0.50 0.58
ZE WANG, STEVEN J. OSTERLIND AND DAVID A. BERGIN1224
Model Building at Student Level. Model building at the student level(level 1) in each country began by adding all student-level predictors.This initial model was the same for all four countries. Specifically, thefive student-level variables (parents’ highest education level, student sex,student self-concept of ability in mathematics, mathematics values andstudent perception of school) were modelled as predictors of mathematicsachievement. The effects of those predictors, together with the school/class mean mathematics achievement, were modelled as randomcoefficients.
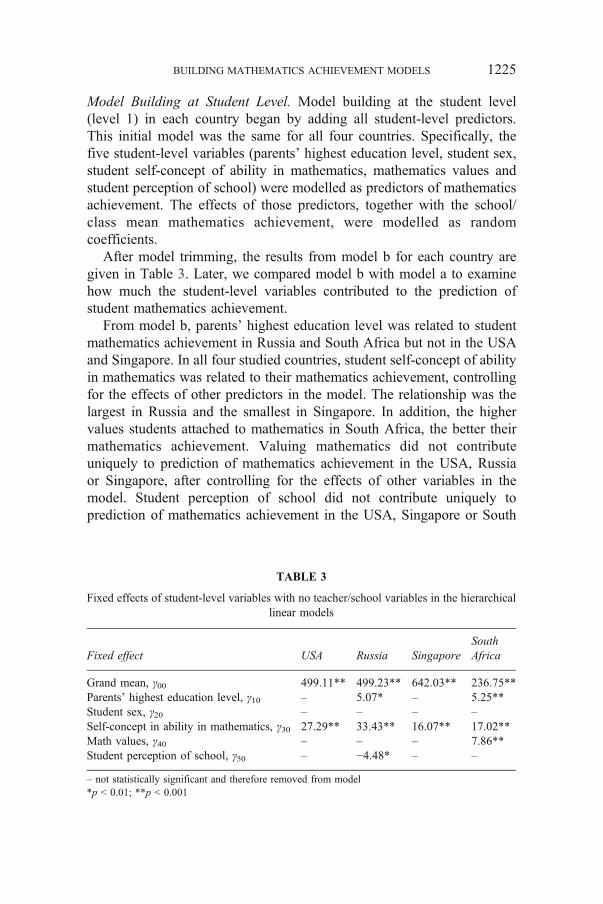
After model trimming, the results from model b for each country aregiven in Table 3. Later, we compared model b with model a to examinehow much the student-level variables contributed to the prediction ofstudent mathematics achievement.
From model b, parents’ highest education level was related to studentmathematics achievement in Russia and South Africa but not in the USAand Singapore. In all four studied countries, student self-concept of abilityin mathematics was related to their mathematics achievement, controllingfor the effects of other predictors in the model. The relationship was thelargest in Russia and the smallest in Singapore. In addition, the highervalues students attached to mathematics in South Africa, the better theirmathematics achievement. Valuing mathematics did not contributeuniquely to prediction of mathematics achievement in the USA, Russiaor Singapore, after controlling for the effects of other variables in themodel. Student perception of school did not contribute uniquely toprediction of mathematics achievement in the USA, Singapore or South
TABLE 3
Fixed effects of student-level variables with no teacher/school variables in the hierarchicallinear models
Fixed effect USA Russia SingaporeSouthAfrica
Grand mean, γ00 499.11** 499.23** 642.03** 236.75**Parents’ highest education level, γ10 – 5.07* – 5.25**Student sex, γ20 – – – –Self-concept in ability in mathematics, γ30 27.29** 33.43** 16.07** 17.02**Math values, γ40 – – – 7.86**Student perception of school, γ50 – −4.48* – –
– not statistically significant and therefore removed from model*p G 0.01; **p G 0.001
BUILDING MATHEMATICS ACHIEVEMENT MODELS 1225
Africa. Surprisingly, student perception of school was negatively relatedto their mathematics achievement in Russia.
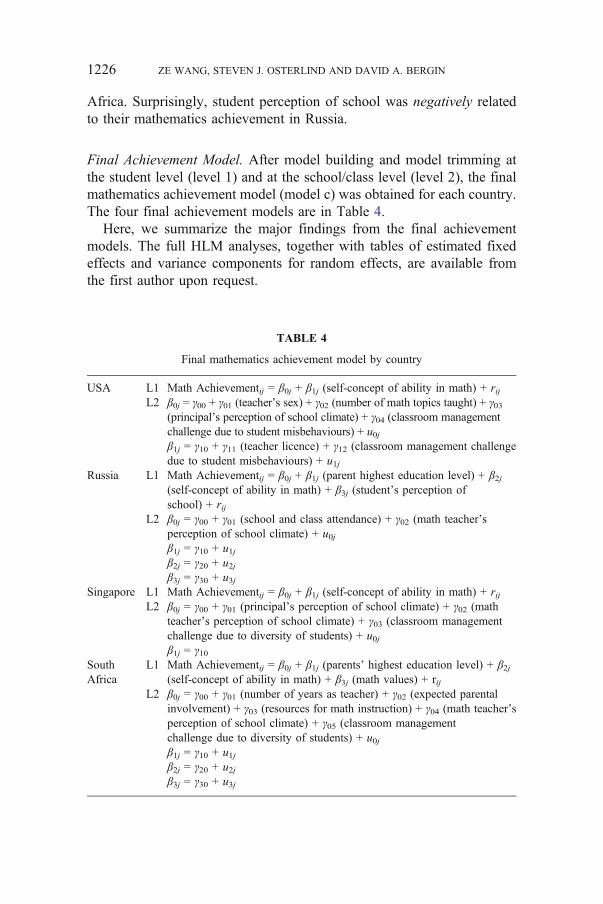
Final Achievement Model. After model building and model trimming atthe student level (level 1) and at the school/class level (level 2), the finalmathematics achievement model (model c) was obtained for each country.The four final achievement models are in Table 4.
Here, we summarize the major findings from the final achievementmodels. The full HLM analyses, together with tables of estimated fixedeffects and variance components for random effects, are available fromthe first author upon request.
TABLE 4
Final mathematics achievement model by country
USA L1 Math Achievementij = β0j + β1j (self-concept of ability in math) + rijL2 β0j = γ00 + γ01 (teacher’s sex) + γ02 (number of math topics taught) + γ03
(principal’s perception of school climate) + γ04 (classroom managementchallenge due to student misbehaviours) + u0jβ1j = γ10 + γ11 (teacher licence) + γ12 (classroom management challengedue to student misbehaviours) + u1j
Russia L1 Math Achievementij = β0j + β1j (parent highest education level) + β2j(self-concept of ability in math) + β3j (student’s perception ofschool) + rij
L2 β0j = γ00 + γ01 (school and class attendance) + γ02 (math teacher’sperception of school climate) + u0jβ1j = γ10 + u1jβ2j = γ20 + u2jβ3j = γ30 + u3j
Singapore L1 Math Achievementij = β0j + β1j (self-concept of ability in math) + rijL2 β0j = γ00 + γ01 (principal’s perception of school climate) + γ02 (math
teacher’s perception of school climate) + γ03 (classroom managementchallenge due to diversity of students) + u0jβ1j = γ10
SouthAfrica
L1 Math Achievementij = β0j + β1j (parents’ highest education level) + β2j(self-concept of ability in math) + β3j (math values) + rij
L2 β0j = γ00 + γ01 (number of years as teacher) + γ02 (expected parentalinvolvement) + γ03 (resources for math instruction) + γ04 (math teacher’sperception of school climate) + γ05 (classroom managementchallenge due to diversity of students) + u0jβ1j = γ10 + u1jβ2j = γ20 + u2jβ3j = γ30 + u3j
ZE WANG, STEVEN J. OSTERLIND AND DAVID A. BERGIN1226
For the USA, student self-concept of ability in mathematics was astrong predictor of mathematics achievement. This effect was nothomogenous across schools/classes. For those in a class taught by a fullycertified teacher, a 1 standard deviation increase in self-concept of abilityin mathematics was related to mathematics achievement increase of 27.94points, controlling for the other predictors; for those in a class taught by anot fully licenced teacher, the effect was only 13.08. The more classroommanagement challenges due to student misbehaviours, the less thepositive relationship between student self-concept of ability in mathemat-ics and mathematics achievement and the lower the mathematicsachievement. In the USA, students on average scored 26.92 points higherif the mathematics teacher was male rather than female, for both boys andgirls. One might wonder if the higher scores were due to higher levels ofmathematics knowledge among the male teachers. However, the data setdoes not contain variables that describe levels of teachers’ mathematicsknowledge, so this hypothesis cannot be tested with the current data.Also, in the USA, the greater the number of TIMSS mathematics topicsthat had been taught, the lower the student mathematics achievement,with an effect of 1.19 points. Students from schools with morepositive principal’s perception of school climate had higher mathematicsachievement.
For Russia, like the USA, student self-concept of ability in mathemat-ics was a strong predictor of mathematics achievement. A one standarddeviation increase in student self-concept of ability in mathematics wasrelated to mathematics achievement increase of 33.44 points, with otherpredictors controlled. The higher their parents’ education level, the highertheir mathematics achievement. The more negative their perception ofschool, the higher students’ mathematics achievement. Good school andclass attendance and positive mathematics teachers’ perception of schoolclimate were positively related to students’ mathematics achievement inRussia.
For Singapore, student self-concept of ability in mathematics predictedmathematics achievement, but not as strongly as in Russia aftercontrolling for other variables. A 1 standard deviation increase in studentself-concept of ability in mathematics was related to mathematicsachievement increase of 16.03 points. This effect was homogenousacross schools. Positive perception of school climate from both schoolprincipals’ and mathematics teachers’ perspectives was positively relatedto student mathematics achievement. The more classroom managementchallenges due to diversity of students, the lower students’ mathematicsachievement.
BUILDING MATHEMATICS ACHIEVEMENT MODELS 1227
In South Africa, student self-concept of ability in mathematicspredicted mathematics achievement at a level similar to Singapore. A 1standard deviation increase in student self-concept of ability in mathe-matics was related to mathematics achievement increase of 16.96 points,after controlling for other predictors. Parents’ highest education level andstudent mathematics values were also positively related to studentmathematics achievement. With 1 standard deviation increase inmathematics values, student mathematics achievement would be 7.96points higher, after controlling for other predictors. The mathematicsteacher’s teaching experience and perception of school climate werepositively related to student mathematics achievement, controlling forother predictors. Students from schools with better instructional resourcesand from classes with fewer classroom management challenges due tostudent misbehaviours displayed higher mathematics achievement. Per-haps surprisingly, expected parental involvement in school activities wasnegatively related to student mathematics achievement when otherpredictors were controlled.
The proportion of variance explained by adding level 1 and level 2predictors was obtained by comparing the σ2 (between students, withinschools/classes variance) and τ00 (between-schools/classes variance)estimates from the unconditional model, the model with only student-level variables and the final achievement model. Adding student variablesresulted in a 27% reduction in the variance of mathematics achievementbetween students within each school/class in the USA (32% in Russia,18% in Singapore and 12% in South Africa). Including school and teachervariables reduced the variance between schools by 60% in the USA (19%in Russia, 42% in Singapore and 34% in South Africa).
DISCUSSION AND CONCLUSION
Student self-concept of ability in mathematics had a positive relationshipwith mathematics achievement in all four selected countries. Thisrelationship was the highest in Russia and the lowest in the USAmathematics classrooms that lacked a fully licenced teacher, whilecontrolling for other variables. The magnitude was similar in SouthAfrica and Singapore when other variables were controlled.
In contrast, mathematics value was related to mathematics achievementonly in South Africa, and this relationship was less than half that of self-concept of ability in mathematics. This finding is not surprising because
ZE WANG, STEVEN J. OSTERLIND AND DAVID A. BERGIN1228
in general, ability perceptions are stronger predictors of achievementperformance than task values (Wigfield & Eccles, 2000).
More positive school climate, perceived by school principals (USA),mathematics teachers (Russia and South Africa) or both (Singapore),predicted higher student mathematics achievement. Classroom manage-ment challenges due to student misbehaviours (USA) or due to studentdiversity (Singapore and South Africa) were negatively related to studentmathematics achievement. Better school and class attendance wereassociated with higher mathematics achievement in Russia only. Schoolresources had a positive relationship only in South Africa.
In the USA, a noticeable association with mathematics achievement isthe teacher’s sex. Students who had a male mathematics teacher onaverage scored 26.92 points higher in than those who had a femalemathematics teacher, after controlling for the other variables included inthe model. The differences in mathematics achievement between studentsof male and female mathematics teachers may arise from culturalexpectations that mathematics is a male subject and that males shouldperform better than females in mathematics, and if females do teachmathematics, they will be less successful than their male counterparts(Warwick & Jatoi, 1994). It is possible that female mathematics teachersexpect less from their students than male mathematics teachers. It is alsopossible that weaker students tend to choose female teachers. We couldnot test whether male mathematics teachers were more knowledgeableabout mathematics than female teachers due to a lack of relevant variablesin the data set. In the future, it is worthwhile to explore potentialmediating variables that may help explain the mechanism of the relationbetween teacher’s sex and student mathematics achievement.
On the other hand, this study found no gender differences between boys’and girls’ mathematics achievement in the four studied countries, aftercontrolling for the other variables included in the models. However, it ispossible that the other predictors may serve as mediating variables betweenstudent gender and mathematics achievement. For example, girls’ self-concept of ability in mathematics may be lower than that of boys although nogender gap existed when putting both gender groups on the same standing ofself-concept of ability in mathematics. Wilkins (2004) conducted a studyusing HLM to predict student mathematics and science self-concepts fromachievement across countries and found that on average male students hadhigher academic self-concept than female students although the gender gapwas minimal or slightly reversed in some countries.
In the USA, the greater the number of TIMSS mathematics topics thathad been taught at the eighth grade, the lower the student mathematics
BUILDING MATHEMATICS ACHIEVEMENT MODELS 1229
achievement. Cogan & Schmidt (2002) reported the numbers of TIMSSmathematics topics that could be found in official content standards,represented in textbooks or taught by teachers in each of 36 countries.Compared to the other countries, the USA had more teachers teachingmore topics. In the USA, all 44 mathematics topics were in the contentstandards, 41 topics were represented in the textbooks and all the 21broader mathematics topics were taught by at least one teacher at theeighth grade. In addition, every topic had at least half of teachers coveringit. Cogan & Schmidt (2002) referred to this as the “mile wide, inch deep”nature of the US curriculum. In contrast, as a top-performing country inTIMSS mathematics, Japan only had 12 TIMSS mathematics topics foundin content standards and 15 represented in textbooks at the eighth grade.It is likely that for some countries, different mathematics topics are taughtand emphasized in different academic years. Trying to cover manymathematics topics in 1 year could be the cause of lower studentmathematics achievement; we argue that curriculum and mathematicsinstruction should focus on deeper understanding of topics.
In Russia, the more negative their perception of school, the higherstudents’ mathematics achievement. A one standard deviation increase instudents’ perception of school was related to mathematics achievementdecrease of 4.67 points, with other predictors controlled. While thisrelationship was statistically significant when the other predictors werecontrolled, with p = 0.002, the zero-order correlation between students’perception of school and their mathematics achievement was minimal(about 0.002) and not statistically significant. In addition, there was asmall yet statistically significant positive correlation (0.09) betweenstudents’ perception of school and student self-concept of ability. Thissuggests that students’ perception of school was a suppressor variable,and we should not expect such a negative relationship in general betweenstudents’ perception of school and student mathematics achievement inRussia (Maassen & Bakker, 2001).
Expected parent involvement in school activities did not have astatistically significant effect on student mathematics achievement in theUSA, Russia or Singapore, but was negatively related to student mathematicsachievement in South Africa when other predictors were controlled. Thiscould be because principals in the participating South African schools expectparents to become involved mainly in cases of low achievement. In ourstudy, expected parental involvement in school activities was reported by theschool principal rather than by the parents. School principals may expectparental involvement for many different reasons, but actual parentinvolvement (e.g. parental aspirations and socialization of achievement
ZE WANG, STEVEN J. OSTERLIND AND DAVID A. BERGIN1230
values) might have a more direct effect on student mathematics achievement(Fan & Chen, 2001; Hill & Tyson, 2009).
We tested cross-level interactions during our model building andmodel trimming process. This allows us to look into the differences in theeffects of student motivational constructs on mathematics achievement.We only found two statistically significant cross-level interactions in theUSA. While having fully licenced teachers did not have a direct effect oneighth graders’ mathematics achievement, it did strengthen the relation-ship between students’ self-concept of ability in mathematics and theirmathematics achievement. Classroom management can be challenging.Those classroom management challenges due to student misbehavioursnot only directly affected eighth graders’ mathematics achievementnegatively in the USA but also weakened the relationship betweenstudents’ self-concept of ability in mathematics and their mathematicsachievement.
A summary of statistical significance of predictors on student mathemat-ics achievement is displayed in Table 5. It can be seen that the only identicalpatterns of prediction of eighth grade students’ mathematics achievementacross the four countries were the statistical significance of self-concept ofability in mathematics, the statistical nonsignificance of student sex and thestatistical nonsignificance of mathematics teacher’s perception of schoolsafety. Although teacher licence was statistically nonsignificant in all fourcountries, its interaction with self-concept of ability was statisticallysignificant in the USA. More variables were statistically significantly relatedto student mathematics achievement in South Africa, the lowest-achievingcountry than in Singapore, the highest achieving country. Those significantpredictors in South Africa may reflect the poor education conditions for themajority of learners (UNESCO International Bureau of Education, 2006/2007). While the national average of TIMSS mathematics was comparablebetween USA and Russia, different predictors were related to mathematicsachievement in those two countries. While it is difficult to group thevariables that were statistically significant in each country, it seems that inthe USA, compared to Russia, variables more directly related to instruction(e.g. teacher’s sex, mathematics topics, classroom management) hadstatistically significant relationships with mathematics achievement.
Within each country, the predictions by student variables when teacherand school variables are considered (model c) are similar to thecorresponding predictions when teacher and school variables are notconsidered (model b). For example, in Russia, the prediction of studentself-concept of ability on student mathematics achievement was 33.43(Table 3) when the school context was not considered; the corresponding
BUILDING MATHEMATICS ACHIEVEMENT MODELS 1231
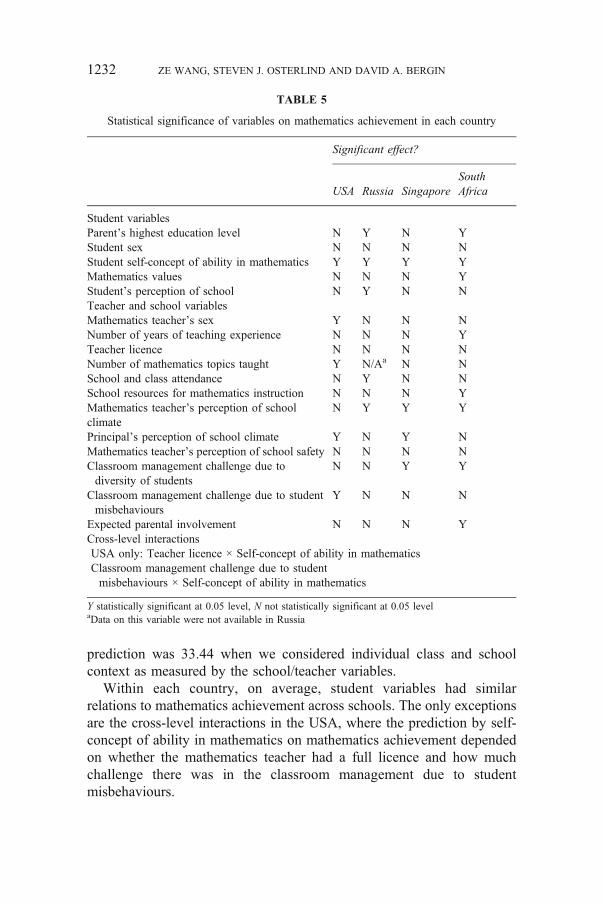
prediction was 33.44 when we considered individual class and schoolcontext as measured by the school/teacher variables.
Within each country, on average, student variables had similarrelations to mathematics achievement across schools. The only exceptionsare the cross-level interactions in the USA, where the prediction by self-concept of ability in mathematics on mathematics achievement dependedon whether the mathematics teacher had a full licence and how muchchallenge there was in the classroom management due to studentmisbehaviours.
TABLE 5
Statistical significance of variables on mathematics achievement in each country
Significant effect?
USA Russia SingaporeSouthAfrica
Student variablesParent’s highest education level N Y N YStudent sex N N N NStudent self-concept of ability in mathematics Y Y Y YMathematics values N N N YStudent’s perception of school N Y N NTeacher and school variablesMathematics teacher’s sex Y N N NNumber of years of teaching experience N N N YTeacher licence N N N NNumber of mathematics topics taught Y N/Aa N NSchool and class attendance N Y N NSchool resources for mathematics instruction N N N YMathematics teacher’s perception of schoolclimate
N Y Y Y
Principal’s perception of school climate Y N Y NMathematics teacher’s perception of school safety N N N NClassroom management challenge due todiversity of students
N N Y Y
Classroom management challenge due to studentmisbehaviours
Y N N N
Expected parental involvement N N N YCross-level interactionsUSA only: Teacher licence × Self-concept of ability in mathematicsClassroom management challenge due to studentmisbehaviours × Self-concept of ability in mathematics
Y statistically significant at 0.05 level, N not statistically significant at 0.05 levelaData on this variable were not available in Russia
ZE WANG, STEVEN J. OSTERLIND AND DAVID A. BERGIN1232
The school context seems to matter the most in the USA, followedby Singapore and South Africa. In the US, about 60% of thebetween-school variance in eighth graders’ mathematics achievementwas reduced by modelling school context variables. In contrast, theschool context contributed to only 19% of the between-schoolvariance in Russia.
The largest proportion of variance reduced by adding studentcharacteristics was 32% in Russia, where student self-concept of abilityin mathematics had the largest prediction effect. In contrast, only 12% ofthe variance in eighth graders’ mathematics achievement was reduced byadding student-level predictors in South Africa.
Our study has several strengths. First, our study incorporatedappropriate design weight, and as a consequence, the results aregeneralizable to the full populations of eighth graders in the four studiedcountries. Second, our study used appropriate statistical techniques(HLM) to examine the contributions of school and teacher variables onstudent mathematics achievement and on the motivation–achievementrelationship. Third, our study indicates that studies of student mathemat-ics achievement must acknowledge the influences of the school context,although the significant contextual influences vary across countries.
However, due to the characteristics of the data, this study also has somelimitations. First, this study used cross-sectional observational data. The dataare correlational and do not support causal claims. This limited us inexploring the direction of the influence of students’ perceptions and theiracademic achievement. Therefore, our results are preliminary and correla-tional, and further investigation is needed to fully understand theirimplications. Although this study does not provide evidence of a causalrelationship between student self-concept of ability in mathematics andmathematics achievement, it does provide evidence of a strong associationbetween them. This significant association was found in all four selectedcountries. Some studies have shown that students’ perceptions, especiallyself-concept of ability, and their academic achievement are reciprocallyrelated (e.g. Guay, Marsh & Boivin, 2003; Marsh & Craven, 2006; Marsh,Trautwein, Lüdtke, Koller & Baumert, 2005). In this study, we put students’perceptions as antecedents of their mathematics achievement but at the sametime point out that students’ prior mathematics achievement may have aneffect on their perceptions and current mathematics achievement. In a recentstudy with a sample of Australian students, Hemmings, Grootenboer & Kay(2010) found that both prior achievement and mathematics attitudes weresignificant predictors of mathematics achievement and that prior achieve-ment and attitudes were moderately correlated. Without longitudinal data, it
BUILDING MATHEMATICS ACHIEVEMENT MODELS 1233
is not possible to fully model the reciprocal relationship between academicoutcomes and students’ perceptions. Second, there are potential variablesthat are not included in this study that may contribute to the prediction ofstudents’ mathematics achievement. For example, Lee & Shute (2010)identified two large categories of social–contextual factors that are related toK–12 academic achievement. Some of those factors such as peer influencewere not available in TIMSS 2003. Third, although we built mathematicsachievement models for four countries, we did not try to model whydifferences existed between countries; that is, we did not include cultural andcountry variables. The purpose of this study was not to find out howdifferences in mathematics achievement between countries were due todifferent country characteristics, although we believe that those character-istics very likely contribute to those differences.
Results from our study offer several implications for practitioners inthe USA. Although the study was not experimental, it appears that teacherqualifications might have a causal effect on achievement. It might beuseful to establish standards for teacher qualifications and enforce thosestandards. Due to the interaction effect on mathematics achievementbetween teacher licence and student self-concept of ability, a qualified/certified mathematics teacher may indirectly affect student mathematicsachievement through student self-concept of ability. Second, it isimportant to consider the role model of the mathematics teacher.Mathematics may still be considered as a “male” subject. Whereas themathematics achievement of girls is comparable to that of boys at eighthgrade in the USA, having a male mathematics teacher was associated withhigher average mathematics achievement of the class. It would beimportant to investigate why. It is possible that male teachers were morecompetent and knew more mathematics than females, or that morefemales were teaching mathematics outside of their area of expertise andknew less mathematics than the males, or that the results reflect sexistattitudes of students who expect to learn less from female teachers. Futureresearch should investigate these possibilities. Third, consistent with theexpectancy-value model, students’ self-concept of ability in mathematicsexhibited a strong relation with mathematics achievement. This can serveas a central piece for understanding how students learn. For example, howteachers deal with frustration and how they address mistakes in theclassroom may affect students’ self-concept of ability in mathematicsdirectly and mathematics achievement directly and/or indirectly. Fourth,the “mile wide, inch deep” type of curriculum may hinder students’ deepunderstanding of mathematics topics. In the USA, it would be useful tofocus more on fewer topics.
ZE WANG, STEVEN J. OSTERLIND AND DAVID A. BERGIN1234
APPENDIX 1Education Systems in the USA, Russia, Singapore and South Africa
In the USA, education is provided mainly by the government. At the primaryand secondary school levels, curricula, teaching and other policies are setthrough locally elected school boards with jurisdiction over the schooldistricts. Schooling is compulsory for all children in the USA, andapproximately 85% of the US students enter the public schools largelybecause they are free (Wieczorek, 2008). Funds for education comeprimarily from taxes collected by state, local and federal governments. By2003, student–teacher ratio of primary and secondary schools was about16.5:1 (UNESCO International Bureau of Education, 2006/2007).
In Russia, education is provided mainly by the state and is regulated bythe federal Ministry of Education. Eleven years of general education inRussia is compulsory since September 1, 2007, but the data reported in thisarticle were gathered before that date. Until 2007, compulsory education waslimited to 9 years with grades 10 – 11 optional. General education schools(covering grades 1 – 11) are the most common type of schools (80% of allschools). An additional 15% of general education schools offer intensivelearning programmes in specific fields (languages, science, sports etc.)(UNESCO International Bureau of Education, 2006/2007).
In Singapore, the Ministry of Education directs formulation andimplementation of education policies. It has control of the developmentand administration of the government and government-aided primaryschools, secondary schools and junior colleges. It also supervises privateschools. The enrolment at the primary and secondary levels was high (94% atthe primary level and 93% at the secondary level in 2001). After finishing6 years of primary schooling, students are placed in the Special, Express,Normal (Academic) or Normal (Technical) courses according to how theyperform at the Primary School Leaving Examination; the different curricularemphases are designed to match students’ learning abilities and interests(UNESCO International Bureau of Education, 2006/2007).
In South Africa, the vast majority of learners continue to be educatedin conditions of neglect of infrastructure, services, equipment, learningenvironment and quality of teaching. Using unqualified and under-qualified primary school educators is a common phenomenon, particu-larly in rural schools. In government-funded public schools, the averageratio of students to teachers is 32.6:1, while private schools on averagehave one teacher for every 17.5 students (UNESCO International Bureauof Education, 2006/2007). Note that apartheid policies in South Africa didnot end until 1994, and the data reported in this article were gathered only9 years later. There are large disparities between advantaged and
BUILDING MATHEMATICS ACHIEVEMENT MODELS 1235
disadvantaged students, and many of the Black students are not nativespeakers of the language of the TIMSS test (Howie, Scherman & Venter,2008). South Africa showed by far the greatest variability in TIMSSmathematics scores in the 1995 and 1999 administrations (O’Dwyer, 2005).
APPENDIX 2Scale Development
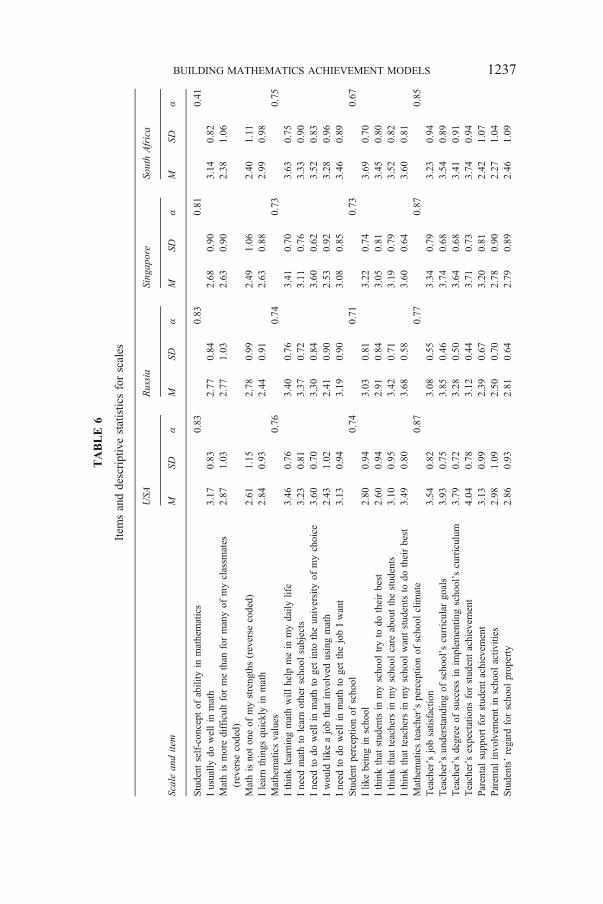
Within each country, the 15 items measuring students’ self-perceptionsand their perceptions of school were analysed using EFA with varimaxrotation after appropriately reverse coding some items. We also comparedEFA results with those from oblique rotation methods. Decisions on thenumber of factors to be extracted were based on scree plots of eigenvaluesas well as checking loadings and the interpretability of results (Costello &Osborne, 2005). Results from EFA in the four countries were consistent.Three student factors were extracted for each country: self-concept ofability in mathematics, mathematics values and student perception ofschool. Two items (“I would like to take more math” and “I enjoylearning math”) cross-loaded on two factors and were dropped. The itemsand descriptive statistics are presented in Table 6. Each of the threefactors displayed acceptable internal consistency, except the measureof student self-concept of ability in mathematics in South Africa(Cronbach’s α = 0.41). We retained this scale despite its low internalconsistency in order to maintain the same set of variables in eachanalysis. The mean of items under each factor was calculated andfurther standardized within each country. The resultant z scores wereused as factor scores (see DiStefano, Zhu & Mindrila, 2009 for adiscussion of using factor scores).
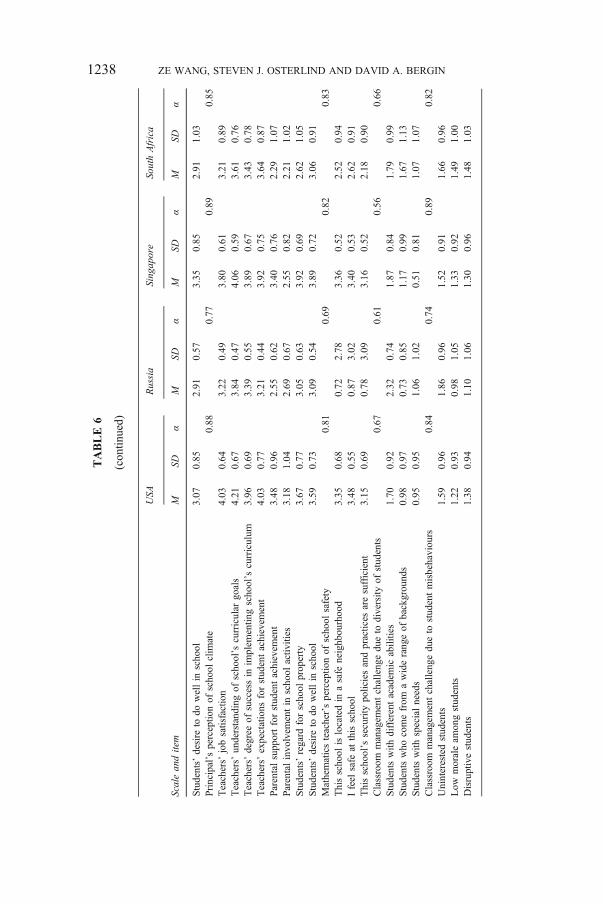
Within each country, the 16 items measuring school climate (eightitems from the school principal questionnaire and eight items from themathematics teacher questionnaire) were analysed using EFA. Resultsfrom EFA in the four countries were consistent. Within each country, twofactors were extracted, one consisting of the eight items measuring schoolprincipal’s perception and the other the eight items measuring mathemat-ics teacher’s perception, suggesting that school principals’ perception wasa different dimension than mathematics teachers’ perception (Walberg,1979). The mean of items under each factor was calculated and furtherstandardized within each country. The resultant z scores were used asfactor scores.
ZE WANG, STEVEN J. OSTERLIND AND DAVID A. BERGIN1236
TABLE
6
Item
sanddescriptivestatisticsforscales
USA
Russia
Sing
apore
SouthAfrica
Scaleanditem
MSD
αM
SDα
MSD
αM
SDα
Student
self-concept
ofability
inmathematics
0.83
0.83
0.81
0.41
Iusually
dowellin
math
3.17
0.83
2.77
0.84
2.68
0.90
3.14
0.82
Mathismoredifficultformethan
formanyof
myclassm
ates
(reverse
coded)
2.87
1.03
2.77
1.03
2.63
0.90
2.38
1.06
Mathisnotoneof
mystreng
ths(reverse
coded)
2.61
1.15
2.78
0.99
2.49
1.06
2.40
1.11
Ilearnthings
quicklyin
math
2.84
0.93
2.44
0.91
2.63
0.88
2.99
0.98
Mathematicsvalues
0.76
0.74
0.73
0.75
Ithinklearning
mathwill
help
mein
mydaily
life
3.46
0.76
3.40
0.76
3.41
0.70
3.63
0.75
Ineed
mathto
learnotherscho
olsubjects
3.23
0.81
3.37
0.72
3.11
0.76
3.33
0.90
Ineed
todo
wellin
mathto
getinto
theun
iversity
ofmychoice
3.60
0.70
3.30
0.84
3.60
0.62
3.52
0.83
Iwould
likeajobthat
invo
lved
usingmath
2.43
1.02
2.41
0.90
2.53
0.92
3.28
0.96
Ineed
todo
wellin
mathto
getthejobIwant
3.13
0.94
3.19
0.90
3.08
0.85
3.46
0.89
Student
perceptio
nof
scho
ol0.74
0.71
0.73
0.67
Ilik
ebeingin
scho
ol2.80
0.94
3.03
0.81
3.22
0.74
3.69
0.70
Ithinkthat
stud
entsin
myscho
oltryto
dotheirbest
2.60
0.94
2.91
0.84
3.05
0.81
3.45
0.80
Ithinkthat
teachers
inmyscho
olcare
abou
tthestud
ents
3.10
0.95
3.42
0.71
3.19
0.79
3.52
0.82
Ithinkthat
teachers
inmyscho
olwantstud
entsto
dotheirbest
3.49
0.80
3.68
0.58
3.60
0.64
3.60
0.81
Mathematicsteacher’sperceptio
nof
scho
olclim
ate
0.87
0.77
0.87
0.85
Teacher’s
jobsatisfaction
3.54
0.82
3.08
0.55
3.34
0.79
3.23
0.94
Teacher’s
understand
ingof
scho
ol’s
curricular
goals
3.93
0.75
3.85
0.46
3.74
0.68
3.54
0.89
Teacher’s
degree
ofsuccessin
implem
entin
gscho
ol’s
curriculum
3.79
0.72
3.28
0.50
3.64
0.68
3.41
0.91
Teacher’s
expectations
forstud
entachievem
ent
4.04
0.78
3.12
0.44
3.71
0.73
3.74
0.94
Parentalsupportforstud
entachievem
ent
3.13
0.99
2.39
0.67
3.20
0.81
2.42
1.07
Parentalinvolvem
entin
scho
olactiv
ities
2.98
1.09
2.50
0.70
2.78
0.90
2.27
1.04
Students’
regard
forscho
olprop
erty
2.86
0.93
2.81
0.64
2.79
0.89
2.46
1.09
BUILDING MATHEMATICS ACHIEVEMENT MODELS 1237
Students’
desire
todo
wellin
scho
ol3.07
0.85
2.91
0.57
3.35
0.85
2.91
1.03
Principal’s
perceptio
nof
scho
olclim
ate
0.88
0.77
0.89
0.85
Teachers’
jobsatisfaction
4.03
0.64
3.22
0.49
3.80
0.61
3.21
0.89
Teachers’
understand
ingof
scho
ol’s
curricular
goals
4.21
0.67
3.84
0.47
4.06
0.59
3.61
0.76
Teachers’
degree
ofsuccessin
implem
entin
gscho
ol’s
curriculum
3.96
0.69
3.39
0.55
3.89
0.67
3.43
0.78
Teachers’
expectations
forstud
entachievem
ent
4.03
0.77
3.21
0.44
3.92
0.75
3.64
0.87
Parentalsupportforstud
entachievem
ent
3.48
0.96
2.55
0.62
3.40
0.76
2.29
1.07
Parentalinvolvem
entin
scho
olactiv
ities
3.18
1.04
2.69
0.67
2.55
0.82
2.21
1.02
Students’
regard
forscho
olprop
erty
3.67
0.77
3.05
0.63
3.92
0.69
2.62
1.05
Students’
desire
todo
wellin
scho
ol3.59
0.73
3.09
0.54
3.89
0.72
3.06
0.91
Mathematicsteacher’sperceptio
nof
scho
olsafety
0.81
0.69
0.82
0.83
Thisschool
islocatedin
asafe
neighb
ourhoo
d3.35
0.68
0.72
2.78
3.36
0.52
2.52
0.94
Ifeel
safe
atthisscho
ol3.48
0.55
0.87
3.02
3.40
0.53
2.62
0.91
Thisschool’s
security
policiesandpractices
aresufficient
3.15
0.69
0.78
3.09
3.16
0.52
2.18
0.90
Classroom
managem
entchalleng
edu
eto
diversity
ofstudents
0.67
0.61
0.56
0.66
Studentswith
differentacadem
icabilities
1.70
0.92
2.32
0.74
1.87
0.84
1.79
0.99
Studentswho
comefrom
awiderang
eof
backgrou
nds
0.98
0.97
0.73
0.85
1.17
0.99
1.67
1.13
Studentswith
specialneeds
0.95
0.95
1.06
1.02
0.51
0.81
1.07
1.07
Classroom
managem
entchalleng
edu
eto
stud
entmisbehaviou
rs0.84
0.74
0.89
0.82
Uninterestedstud
ents
1.59
0.96
1.86
0.96
1.52
0.91
1.66
0.96
Low
moraleam
ongstud
ents
1.22
0.93
0.98
1.05
1.33
0.92
1.49
1.00
Disruptivestudents
1.38
0.94
1.10
1.06
1.30
0.96
1.48
1.03
TABLE6
(con
tinued)
USA
Russia
Sing
apore
SouthAfrica
Scaleanditem
MSD
αM
SDα
MSD
αM
SDα
ZE WANG, STEVEN J. OSTERLIND AND DAVID A. BERGIN1238
Within each country, four items from the mathematics teacher question-naire measuring teachers’ perception of school facility and safety wereanalysed using EFA. One item (“School facility needs significant repair”)did not load on the factor in Russia or South Africa and was dropped fromfurther analysis in all four countries. Within each country, the other threeitems loaded on a factor that was labelled school safety. The scale displayedgood internal consistency in each country. The mean of the three itemsmeasuring school safety was calculated and further standardized within eachcountry. The resultant z scores were used as factor scores.
Within each country, EFA was also used to analyse the six itemsmeasuring mathematics teachers’ responses regarding classroom manage-ment. The results from the four countries were consistent. Two factorswere extracted, the first one a measure of challenge of classroommanagement due to diversity of students and the second one a measureof challenge of classroom management due to student misbehaviours.Each factor had three items. The mean of items under each factor wascalculated and further standardized within each country. The resultant zscores were used as factor scores.
REFERENCES
Astone, N. M. & McLanahan, S. S. (1991). Family structure, parental practices and highschool completion. American Sociological Review, 56, 309–320.
Baker, D. P. & LeTendre, G. K. (2005). National differences, global similarities: Worldculture and the future of schooling. Stanford, CA: Stanford University Press.
Bandura, A. (1997). Self-efficacy: The exercise of control. New York: Freeman.Bergin, C. & Bergin, D. (2009). Attachment in the classroom. Educational PsychologyReview, 21, 141–170.
Cogan, L. S. & Schmidt, W. H. (2002). “Culture shock”—eighth-grade mathematics froman international perspective. Educational Research and Evaluation, 8, 13–39.
Coleman, J. S. (1990). Equality and achievement in education. San Francisco: WestviewPress.
Costello, A. B. & Osborne, J. W. (2005). Best practices in exploratory factor analysis:Four recommendations for getting the most from your analysis. Practical Assessment,Research and Evaluation, 10, 173–178.
Davis, H. A. (2003). Conceptualizing the role and influence of student–teacherrelationships on children’s social and cognitive development. Educational Psychologist,38, 207–234.
Deci, E. L. & Ryan, R. M. (1985). Intrinsic motivation and self-determination in humanbehavior. New York: Plenum.
DiStefano, C., Zhu, M. & Mindrila, D. (2009). Understanding and using factor scores:Considerations for the applied researcher. Practical Assessment, Research andEvaluation, 14(20), 1–11.
BUILDING MATHEMATICS ACHIEVEMENT MODELS 1239
Durik, A. M., Vida, M. & Eccles, J. S. (2006). Task values and ability beliefs as predictorsof high school literacy choices: A development analysis. Journal of EducationalPsychology, 98, 382–393.
Eccles, J. S. (2005). Subjective task value and the Eccles et al. model of achievement-related choices. In A. J. Elliot & C. S. Dweck (Eds.), Handbook of competence andmotivation (pp. 105–121). New York: Guilford.
Enders, C. K. (2010). Applied missing data analysis. New York: Guilford.Fan, X. & Chen, M. (2001). Parental Involvement and students’ academic achievement: Ameta-analysis. Educational Psychology Review, 13, 1–22.
Feuerstein, A. (2000). School characteristics and parent involvement: Influences onparticipation in children’s schools. The Journal of Educational Research, 94, 29–39.
Freiberg, H. J., Huzinec, C. A. & Templeton, S. M. (2009). Classroom management—apathway to student achievement: A study of fourteen inner-city elementary schools. TheElementary School Journal, 110(1), 63–80.
Gainor, K. A. & Lent, R. W. (1998). Social cognitive expectations and racial identityattitudes in predicting the math choice intentions of Black college students. Journal ofCounseling Psychology, 45, 403–413.
Graham, J., Olchowski, A. & Gilreath, T. (2007). How many imputations are really needed?Some practical clarifications of multiple imputation theory. Prevention Science, 8, 206–213.
Greene, B. A., DeBacker, T. K., Ravindran, B. & Krows, A. J. (1999). Goals, values, andbeliefs as predictors of achievement and effort in high school mathematics classes. SexRoles, 40, 421–458.
Guay, F., Marsh, H. W. & Boivin, M. (2003). Academic self-concept and academicachievement: Developmental perspectives on their causal ordering. Journal ofEducational Psychology, 95, 124–136.
Harter, S. (1998). The development of self-representations. In N. Eisenberg (Ed.), Social,emotional, and personality development (5th ed., Vol. 3, pp. 553–617). New York: Wiley.
Hemmings, B., Grootenboer, P. & Kay, R. (2010). Predicting mathematics achievement:The influence of prior achievement and attitudes. International Journal of Science andMathematics Education, 9, 691–705.
Hill, N. E. & Craft, S. A. (2003). Parent–school involvement and school performance:Mediated pathways among socioeconomically comparable African American and Euro-American families. Journal of Educational Psychology, 95, 74–83.
Hill, N. E. & Tyson, D. F. (2009). Parental involvement in middle school: A meta-analyticassessment of the strategies that promote achievement. Developmental Psychology, 45,740–763.
Howie, S., Scherman, V. & Venter, E. (2008). The gap between advantaged anddisadvantaged students in science achievement in South African secondary schools.Educational Research and Evaluation, 14, 29–46.
Joncas, M. (2004). TIMSS 2003 sampling weights and participation rates. In M. O.Martin, I. V. S. Mullis & S. J. Chrostowski (Eds.), TIMSS 2003 technical report.Chestnut Hill, MA: Boston College.
Kaplan, D. & Ferguson, A. J. (1999). On the utilization of sample weights in latentvariable models. Structural Equation Modeling, 6, 305.
Keith, T. Z. & Keith, P. B. (1993). Does parental involvement affect eighth-grade studentachievement? Structural analysis of national data. School Psychology Review, 22, 474.
ZE WANG, STEVEN J. OSTERLIND AND DAVID A. BERGIN1240
Lee, J. & Shute, V. J. (2010). Personal and social–contextual factors in K–12 academicperformance: An integrative perspective on student learning. Educational Psychologist,45, 185–202.
Lee, V. & Smith, J. B. (1999). Social support and achievement for young adolescents inChicago: The role of school academic press. American Educational Research Journal,36, 907–945.
Leithwood, K. & Hallinger, P. (Eds.). (2002). Second international handbook ofeducational leadership and administration. London: Kluwer Academic.
Maassen, G. H. & Bakker, A. B. (2001). Suppressor variables in path models: Definitionsand interpretations. Sociological Methods & Research, 30(2), 241–270.
Marsh, H. W. (1990). A multidimensional, hierarchical model of self-concept: Theoreticaland empirical justification. Educational Psychology Review, 2, 77–172.
Marsh, H. W. & Craven, R. G. (2006). Reciprocal effects of self-concept and performancefrom a multidimensional perspective: Beyond seductive pleasure and unidimensionalperspectives. Perspectives on Psychological Science, 1, 133–163.
Marsh, H. W., Trautwein, U., Lüdtke, O., Koller, O. & Baumert, J. (2005). Academic self-concept, interest, grades, and standardized test scores: Reciprocal effects models ofcausal ordering. Child Development, 76, 397–416.
Marsh, H. W. & Yeung, A. S. (1997a). Causal effects of academic self-concept onacademic achievement: Structural equation models of longitudinal data. Journal ofEducational Psychology, 89, 41–54.
Marsh, H. W. & Yeung, A. S. (1997b). Coursework selection: Relations to academic self-concept and achievement. American Educational Research Journal, 34, 691–720.
Martin, M. O. (Ed.). (2005). TIMSS 2003 user guide for the international database.Chestnut Hill, MA: Boston College.
Martin, M. O., Mullis, I. V. S. & Chrostowski, S. J. (Eds.). (2004). TIMSS 2003 technicalreport. Chestnut Hill, MA: Boston College.
Meece, J. L., Wigfield, A. & Eccles, J. S. (1990). Predictors of math anxiety and itsinfluence on young adolescents’ course enrollment intentions and performance inmathematics. Journal of Educational Psychology, 82, 60–70.
Mislevy, R. J. (1991). Randomization-based inference about latent variables fromcomplex samples. Psychometrika, 56, 177–196.
O’Dwyer, L. M. (2005). Examining the variability of mathematics performance and itscorrelates using data from TIMSS ’95 and TIMSS ’99. Educational Research andEvaluation, 11, 155–177.
Parcel, T. L. & Dufur, M. J. (2001). Capital at home and at school: Effects on studentachievement. Social Forces, 79, 881–991.
Pfeffermann, D., Skinner, C. J., Holmes, D. J., Goldstein, H. & Rasbash, J. (1998).Weighting for unequal selection probabilities in multilevel models. Journal of the RoyalStatistical Society. Series B (Statistical Methodology), 60, 23–40.
Raudenbush, S. W. & Bryk, A. S. (2002). Hierarchical linear models: Applications anddata analysis methods (2nd ed.). Newbury Park, CA: Sage.
Roeser, R. W., Midgley, C. & Urdan, T. C. (1996). Perceptions of the schoolpsychological environment and early adolescents’ psychological and behavioralfunctioning in school: The mediating role of goals and belonging. Journal ofEducational Psychology, 88, 408–422.
BUILDING MATHEMATICS ACHIEVEMENT MODELS 1241
Rumberger, R. W. & Palardy, G. J. (2005). Test scores, dropout rates, and transfer rates asalternative indicators of high school performance. American Educational ResearchJournal, 42, 3–42.
Schafer, J. L. (1997). Analysis of incomplete multivariate data. London: Chapman andHall.
Shavelson, R. J. & Marsh, H. W. (1986). On the structure of self-concept. In R. Schwarzer(Ed.), Anxiety and cognitions. Hillsdale, NJ: Erlbaum.
Stapleton, L. M. (2002). The incorporation of sample weights into multilevel structuralequation models. Structural Equation Modeling, 9, 475–502.
Stevens, T., Wang, K., Olivarez, A. & Hamman, D. (2007). Use of self-perspectives andtheir sources to predict the mathematics enrollment intentions of girls and boys. SexRoles, 56, 351–363.
UNESCO International Bureau of Education (2006/2007). World data on education, 6thed. http://www.ibe.unesco.org/Countries/WDE/2006/index.html
Valentine, J. C., DuBois, D. L. & Cooper, H. (2004). The relation between self-beliefs andacademic achievement: A meta-analytic review. Educational Psychologist, 39, 111–133.
von Davier, M. & Sinharay, S. (2007). An importance sampling EM algorithm for latentregression models. Journal of Educational and Behavioral Statistics, 32, 233–251.
Walberg, H. J. (1979). Educational environments and effects: Evaluation, policy, andproductivity. Berkeley, CA: McCutchan.
Warwick, D. P. & Jatoi, H. (1994). Teacher gender and student achievement in Pakistan.Comparative Education Review, 38, 377–399.
Wieczorek, C. C. (2008). Comparative analysis of educational systems of American andJapanese schools: Views and visions. Educational Horizons, 86, 99–111.
Wigfield, A. & Eccles, J. S. (2000). Expectancy-value theory of achievement motivation.Contemporary Educational Psychology, 25, 68–81.
Wilkins, J. L. M. (2004). Mathematics and science self-concept: An internationalinvestigation. The Journal of Experimental Education, 72, 331–346.
Wu, M. (2005). The role of plausible values in large-scale surveys. Studies in EducationalEvaluation, 31, 114–128.
Department of Educational, School and Counseling PsychologyUniversity of Missouri16 Hill Hall, Columbia, MO 65211, USAE-mail: [email protected]
ZE WANG, STEVEN J. OSTERLIND AND DAVID A. BERGIN1242


