Embed Size (px)
Citation preview
PROJECT REPORT
ON
ENERGY COST REDUCTION WITH ENERGY EFFI.IENT
MR
(ALWMILL CLUSTER
Bureau of Energy Efficiency (BEE)
Prepared By Reviewed By
DETAILED PROJECT REPORT
ON
ENERGY COST REDUCTION BY INSTALLLING GASIFIER
FOR KILNS
STUDY FOR: 30T/DAY CAPACITY KILN
(JODHPUR LIMESTONE CLUSTER)

INSTALLATION OF GASIFIER UNITS

JODHPUR LIMESTONE CLUSTER
BEE, 2011 Detailed Project Report on installing gasifier units for Kilns Limestone SME Cluster, Jodhpur (Rajasthan) (India) New Delhi: Bureau of Energy Efficiency Detail Project Report No.: JDP/EEKG/02
For more information please contact
Bureau of Energy Efficiency (BEE) Telephone +91-11-26179699
(Ministry of Power, Government of India) Fax +91-11-26178352
4th Floor, Sewa Bhawan Websites: www.bee-india.nic.in
R. K. Puram, New Delhi – 110066
Email:
Acknowledgement
We sincerely appreciate the efforts of industry, energy auditors, equipment manufacturers,
technology providers, consultants and other experts in the area of energy conservation for
joining hands with Bureau of Energy Efficiency (BEE), Ministry of Power, and Government of
India for preparing the Detailed Project Report (DPR) under BEE SME Program in SMEs
clusters. We appreciate the support of suppliers/vendors for providing the adoptable energy
efficient equipments/technical details to the SMEs.
We have received very encouraging feedback for the BEE SME Program in various SME
Clusters. Therefore, it was decided to bring out the DPR for the benefits of SMEs. We
sincerely thank the officials of BEE, Executing Agencies and ISTSL for all the support and
cooperation extended for preparation of the DPR. We gracefully acknowledge the diligent
efforts and commitments of all those who have contributed in preparation of the DPR.
iii
Contents List of Annexure................................................................................................................................ vii List of Tables .................................................................................................................................... vii List of Figures ................................................................................................................................... viii List of Abbreviations ........................................................................................................................ viii EXECUTIVE SUMMARY ................................................................................................................... ix ABOUT BEE’S SME PROGRAM ..........................................................................................................x
1 INTRODUCTION ................................................................................................. 7
1.1 Brief introduction about Cluster ............................................................................ 7
1.2 Energy Performance in Jodhpur Limestone cluster ............................................ 10
1.2.1 Average Production ........................................................................................... 10
1.2.2 Energy Consumption ......................................................................................... 11
1.2.3 Specific Energy Consumption ........................................................................... 11
1.3 Proposed Technology ....................................................................................... 11
1.3.1 Description About Existing Technology ............................................................. 11
1.4 Establishing the Baseline for Proposed Technology .......................................... 12
1.5 Barriers in Adoption of Proposed Technology ................................................... 13
1.5.1 Technological Barriers ....................................................................................... 13
2 PROPOSED TECHNOLOGY ............................................................................ 14
2.1 Detailed Description of Technology ................................................................... 14
2.1.1 Description of Technology ................................................................................. 14
2.1.2 Technology Specification ................................................................................... 15
2.1.3 Suitability or Integration with Existing Process & Reasons ................................ 15
2.1.4 Availability of Technology .................................................................................. 15
2.1.5 Source of Technology ....................................................................................... 16
2.1.6 Terms & condition after sales ............................................................................ 16
2.1.7 Process Downtime during Implementation ......................................................... 17
2.1.8 Life Cycle Assessment ...................................................................................... 17
2.1.9 Suitable Unit for Implementation of the Identified Technology............................ 17
3 ECONOMIC BENEFITS FROM PROPOSED TECHNOLOGY .......................... 18
3.1 Technical Benefits ............................................................................................. 18
3.2 Monetary Benefit ............................................................................................... 18
3.3 Social Benefit .................................................................................................... 19
3.4 Environmental Benefit ....................................................................................... 20
4 INSTALLATION OF THE PROPOSED TECHNOLOGY ................................... 21
4.1 Cost of Technology Implementation................................................................... 21
4.2 Arangements of Funds ...................................................................................... 22
4.3 Financial Indicators ........................................................................................... 22
4.4 Sensitivity Analysis in Realistic, Pessimistic & Optimistic Scenarios .................. 23
4.5 Procurement & Implementation Schedule ......................................................... 23
vi
1
List of Annexure
Annexure-1 Energy Audit Data used for Baseline Establishment ..................................... 24
Annexure 2 Detailed Technology Assessment Report ..................................................... 25
Annexure-3 Detailed Financial Calculation ....................................................................... 26
Annexure-4 Procurement & Implementation Schedule ..................................................... 26
Annexure-5 Breakup of Process Downtime ...................................................................... 30
Annexure-6 Details of Technology Service Providers ....................................................... 31
Annexure-7 Quotation for Energy Efficient Motors............................................................ 32
Annexure-8 Loan Application Form .................................................................................. 33
List of Tables
Table 1.1 Details of Energy Consumption at Jodhpur Cluster ............................................ 7
Table 1.2 Production wise Unit breakups ........................................................................... 8
Table 1.3 Products Manufactured .................................................................................... 10
Table 1.4 Annual productions from a typical unit .............................................................. 12
Table 1.5 Energy Consumption for Kiln............................................................................ 13
Table 1.6 Energy Consumption for Crushing and Hyderation motors ............................... 14
Table 3.1 Energy and Monetary Benefit due to Project Implementation ........................... 18
Table 4.1 Details of Proposed Equipment Installation cost............................................... 21
Table 4.2 Financial Indicators of Proposed Technology ................................................... 22
Table 4.3 Sensitivity Analysis in Different Scenarios ........................................................ 22
List of Figures Figure 1.1 Process Flow Diagram .................................................................................................3
2
List of Abbreviations BEE Bureau of Energy Efficiency SME Small and Medium Enterprises DPR Detailed Project Report GHG Green House Gases NG Natural Gas CDM Clean Development Mechanism DSCR Debt Service Coverage Ratio NPV Net Present Value IRR Internal Rate of Return ROI Return on Investment WHR Waste Heat Recovery SCM Standard Cubic Meter MT Metric Tonne SIDBI Small Industries Development Bank of India
3
EXECUTIVE SUMMARY
CII – AVANTHA Centre for Competitiveness for SMEs, one of the Centre of Excellence of
Confederation of Indian Industry (CII) is executing BEE - SME Program in Jodhpur Lime Stone
Cluster, supported by Bureau of Energy Efficiency (BEE) with an overall objective of improving
the energy efficiency in cluster units.
Jodhpur Lime Stone cluster is one of the largest Lime clusters in India; accordingly this cluster
was chosen for energy efficiency improvements by implementing energy efficient measures /
technologies, so as to facilitate maximum replication in other Lime Stone units in India.
The production process of lime, like cement production, is highly energy-intensive, but energy
requirements in lime production are lower than cement and the types of fuels required could be
a variety of low-grade fuels.
Quicklime is manufactured by calcination of limestone at temperatures around 900°C which is
almost 35 per cent lower than the heat required for cement clinker production. A high proportion
of the total energy requirement in lime production is used in kiln for calcinating the limestone.
Thus, as in the case of cement, the principal means of achieving energy-efficiency lies in
improving the performance of the kilns. In industrialized countries, production of quicklime is
done by burning the limestone in large and fully automated rotary kilns. However, in most
developing countries, a vertical shaft kiln, using simple masonry for the wall of the kiln is more
common.
Brief introduction to Vertical-shaft kilns
Vertical-shaft lime kilns, however, have, proved to be one of the most suitable and economical
method of small-scale lime production in many developing countries (3 to 10 t/d capacity). For
example, a vertical-shaft lime kiln can burn lime on a continuous basis resulting in considerable
savings in heat losses. The kiln, having three distinct zones of operations (preheating, calcining
and cooling), is attractive and efficient in terms of use of fuel. Further efficiency can be achieved
by incorporating insulation in the wall of the kiln. These are only a few characteristics that make
the use of the vertical-shaft lime-kiln technology more advantageous than the other traditional
methods.
Energy-saving opportunities
For any given kiln, the flame length and heat transfer are determined by the fuel characteristics,
4
the fuel to air ratio and the quantity of excess air. The fuel to air ratio is primarily dependent on
the ratio of the burner momentum and that of the secondary air.
Due to above mentioned parameters lime recovery kilns present a significant challenge to burn
pet coke or other solid fuels. Due to the low volatile content of the pet coke, the distinct flame
characteristics and the need for NOx control, the combustion designing of kiln is very critical.
Considering above mentioned combustion characteristic Produce gas based Gasifier for
combustion in Lime kiln is an energy efficient technology.
The producer gas based Lime calcinations Kilns are designed to enhance product throughput,
quality, to reduce production cost and to eliminate dependency on single fuel. This technology has been selected for the following reasons:
Optimum combustion of fuel to ensure better combustion efficiency.
Due to proper combustion lower emission of CO.
mproved Calcinations Quality of Lime stone.
Completely environment friendly system.
Elimination of single fuel dependency. Using of proposed technology reduce combustion losses. This will results in decrease in the fuel
consumption in Kiln. Thus it improves performance of existing system.
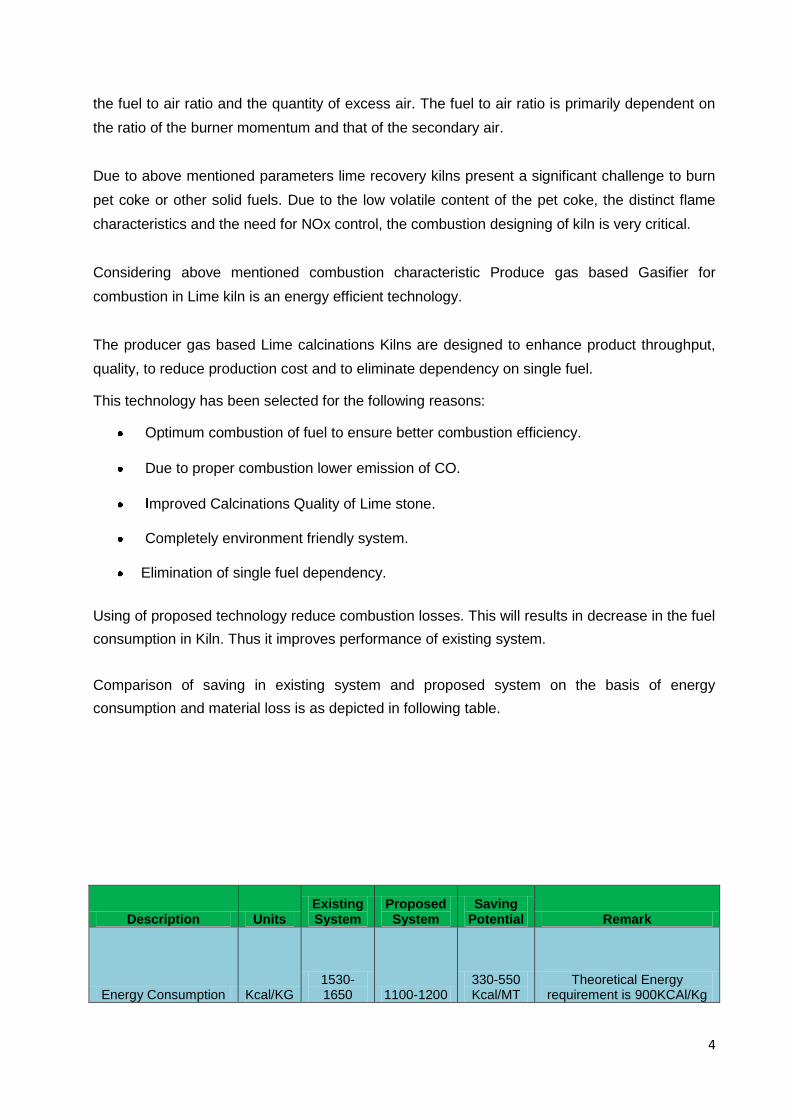
Comparison of saving in existing system and proposed system on the basis of energy
consumption and material loss is as depicted in following table.
Description Units Existing System
Proposed System
Saving Potential Remark
Energy Consumption Kcal/KG 1530-1650 1100-1200
330-550 Kcal/MT
Theoretical Energy requirement is 900KCAl/Kg
5
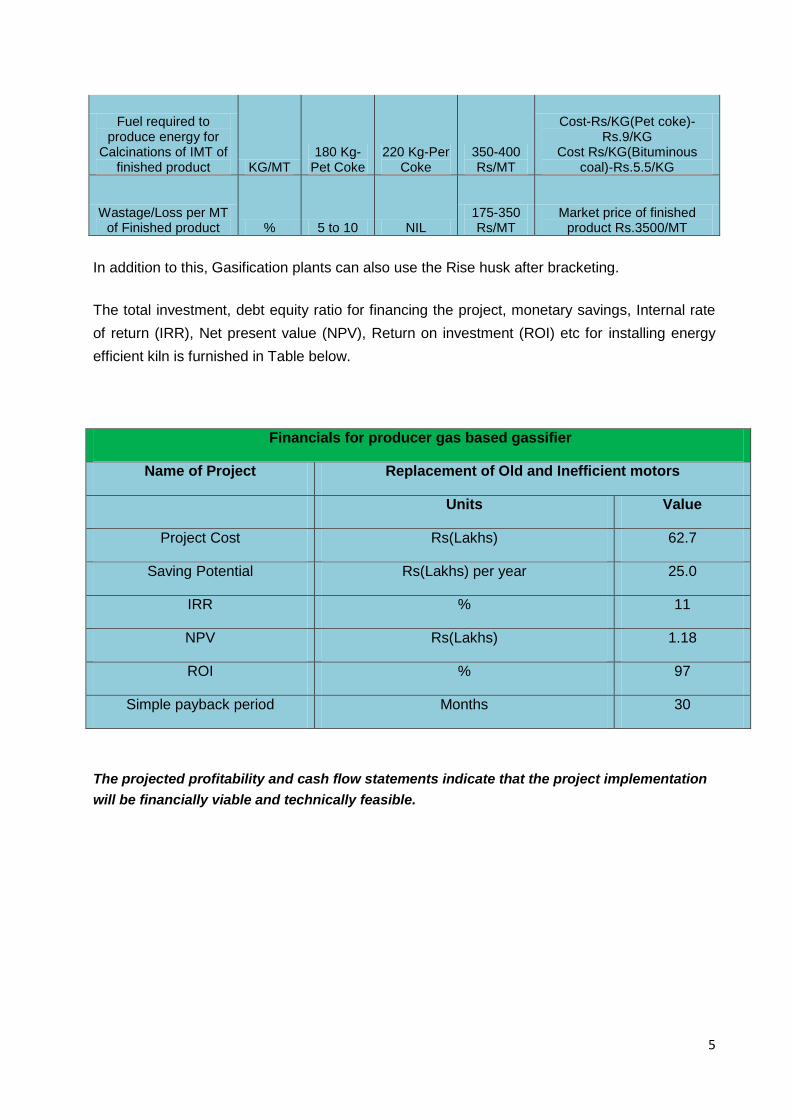
Fuel required to produce energy for
Calcinations of IMT of finished product KG/MT
180 Kg-Pet Coke
220 Kg-Per Coke
350-400 Rs/MT
Cost-Rs/KG(Pet coke)-Rs.9/KG
Cost Rs/KG(Bituminous coal)-Rs.5.5/KG
Wastage/Loss per MT of Finished product % 5 to 10 NIL
175-350 Rs/MT
Market price of finished product Rs.3500/MT
In addition to this, Gasification plants can also use the Rise husk after bracketing.
The total investment, debt equity ratio for financing the project, monetary savings, Internal rate
of return (IRR), Net present value (NPV), Return on investment (ROI) etc for installing energy
efficient kiln is furnished in Table below.
The projected profitability and cash flow statements indicate that the project implementation
will be financially viable and technically feasible.
Financials for producer gas based gassifier
Name of Project Replacement of Old and Inefficient motors
Units Value
Project Cost Rs(Lakhs) 62.7
Saving Potential Rs(Lakhs) per year 25.0
IRR % 11
NPV Rs(Lakhs) 1.18
ROI % 97
Simple payback period Months 30
6
ABOUT BEE’S SME PROGRAM
Bureau of Energy Efficiency (BEE) is implementing a BEE-SME Program to improve the energy
performance in 25 selected SMEs clusters. Jodhpur Lime Stone Cluster is one of them. The
BEE’s SME Programme intends to enhance the energy efficiency awareness by
funding/subsidizing need based studies in SME clusters and giving energy conservation
recommendations. For addressing the specific problems of these SMEs and enhancing energy
efficiency in the clusters, BEE will be focusing on energy efficiency, energy conservation and
technology up gradation through studies and pilot projects in these SMEs clusters.
Major activities in the BEE -SME program are furnished below: Energy Use and Technology Audit
The energy use technology studies would provide information on technology status, best
operating practices, gaps in skills and knowledge on energy conservation opportunities, energy
saving potential and new energy efficient technologies, etc for each of the sub sector in SMEs.
Capacity Building of Stake Holders in Cluster on Energy Efficiency In most of the cases SME entrepreneurs are dependent on the locally available technologies,
service providers for various reasons. To address this issue BEE has also undertaken capacity
building of local service providers and entrepreneurs/ managers of SMEs on energy efficiency
improvement in their units as well as clusters. The local service providers will be trained in order
to be able to provide the local services in setting of energy efficiency projects in the clusters
Implementation of Energy Efficiency Measures
To implement the technology up gradation projects in clusters, BEE has proposed to prepare
the technology based detailed project reports (DPRs) for a minimum of five technologies in
three capacities for each technology.
Facilitation of Innovative Financing Mechanisms for Implementation of Energy
Efficiency Projects
The objective of this activity is to facilitate the uptake of energy efficiency measures through
innovative financing mechanisms without creating market distortion.
7
1 INTRODUCTION 1.1 Brief Introduction about Cluster
Jodhpur SME Cluster is one of the largest Lime stone clusters in India, which is famous for
manufacturing of hydrated lime. Jodhpur limestone cluster is well connected by rail, road and
air ways. The nearest airport is at Jodhpur, which is 15 KM from Jodhpur by road.
There are approximately 100 lime stone units in this cluster which are engaged in
manufacturing of hydrated lime.
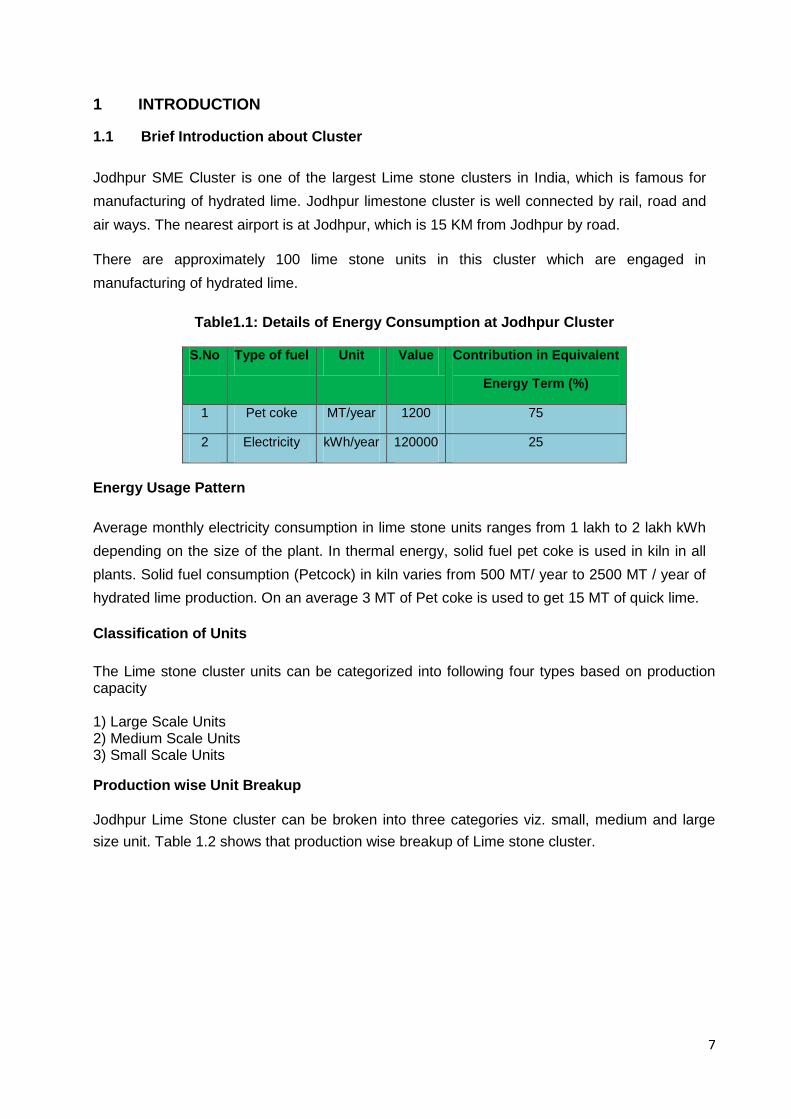
Table1.1: Details of Energy Consumption at Jodhpur Cluster
S.No Type of fuel Unit Value Contribution in Equivalent
Energy Term (%)
1 Pet coke MT/year 1200 75
2 Electricity kWh/year 120000 25
Energy Usage Pattern
Average monthly electricity consumption in lime stone units ranges from 1 lakh to 2 lakh kWh
depending on the size of the plant. In thermal energy, solid fuel pet coke is used in kiln in all
plants. Solid fuel consumption (Petcock) in kiln varies from 500 MT/ year to 2500 MT / year of
hydrated lime production. On an average 3 MT of Pet coke is used to get 15 MT of quick lime.
Classification of Units
The Lime stone cluster units can be categorized into following four types based on production capacity 1) Large Scale Units 2) Medium Scale Units 3) Small Scale Units Production wise Unit Breakup
Jodhpur Lime Stone cluster can be broken into three categories viz. small, medium and large
size unit. Table 1.2 shows that production wise breakup of Lime stone cluster.
8
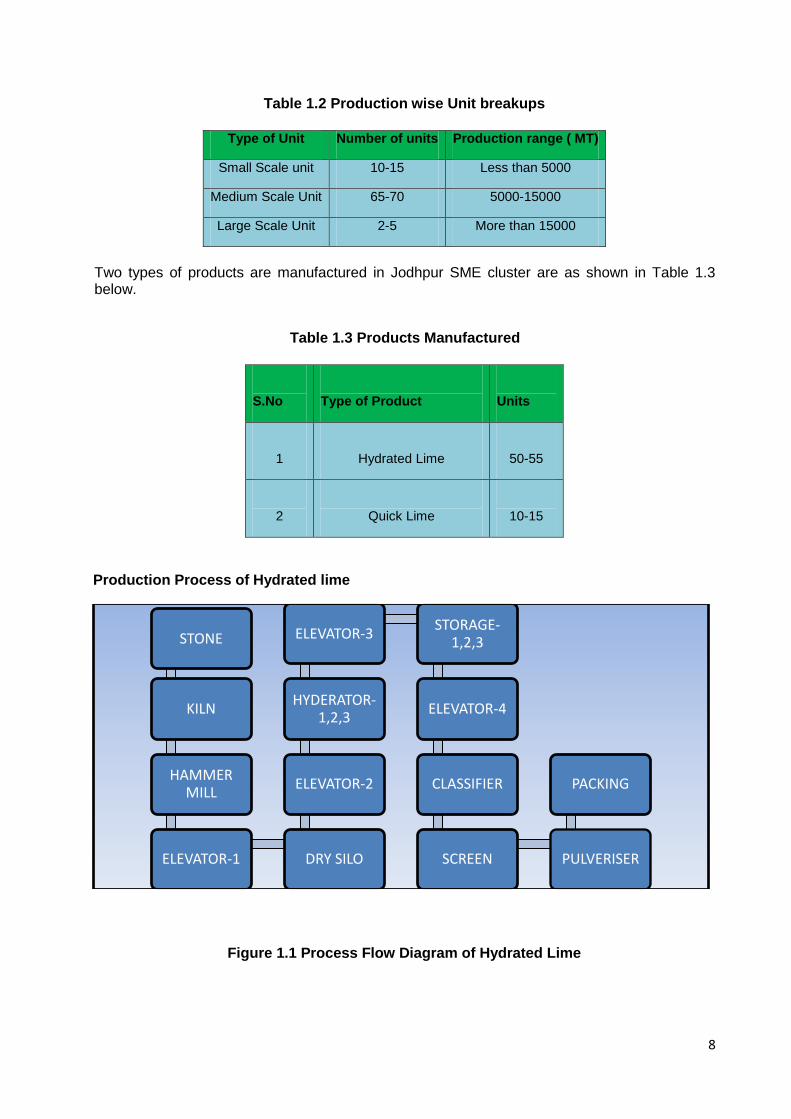
Table 1.2 Production wise Unit breakups
Type of Unit Number of units Production range ( MT)
Small Scale unit 10-15 Less than 5000
Medium Scale Unit 65-70 5000-15000
Large Scale Unit 2-5 More than 15000
Two types of products are manufactured in Jodhpur SME cluster are as shown in Table 1.3 below.
Table 1.3 Products Manufactured
S.No
Type of Product
Units
1
Hydrated Lime
50-55
2
Quick Lime
10-15
Production Process of Hydrated lime
Figure 1.1 Process Flow Diagram of Hydrated Lime
STONE
KILN
HAMMER MILL
ELEVATOR-1 DRY SILO
ELEVATOR-2
HYDERATOR-1,2,3
ELEVATOR-3 STORAGE-
1,2,3
ELEVATOR-4
CLASSIFIER
SCREEN PULVERISER
PACKING
9
Hydrated Lime Production
In lime stone industry kiln is major consumer of energy. Conventionally it is done in direct heat treatment to the products. Kiln is batch type kiln, where raw material is fed from top side and at bottom after 12-13 hrs finished product (quick lime) is taken out. Raw product undergoes loading section, combustion zone, cooling zone and then under loading section. Material movement is by gravity. Kiln is constructed with refractory and insulating bricks. Lime Stone cluster units in Jodhpur region producing large quantity of quick lime and hydrated lime. Lime stone cluster in Jodhpur is spread across a large number of small companies, each company comprises of about 1 to 5 number of production units. Capacity of company varies from 15TPD to about 75TPD. A Kiln is major energy consumer in the process of Hyderated lime production. A 30TPD capacity kiln is of following dimensions. Internal Diameter : 1850 mm Outer Diameter : 2950 mm Internal Height : 16600 mm Overall Height : 23000 mm In traditional Kiln insulation is provided by fire bricks lining. The heat losses from fire bricks lining is around 40 to 45% causing substantial heat losses.
10
1.2 Energy Performance in Existing Situation 1.2.1 Average Production Annual production in typical unit in Jodhpur Lime Stone cluster is given in Table 1.4 below:
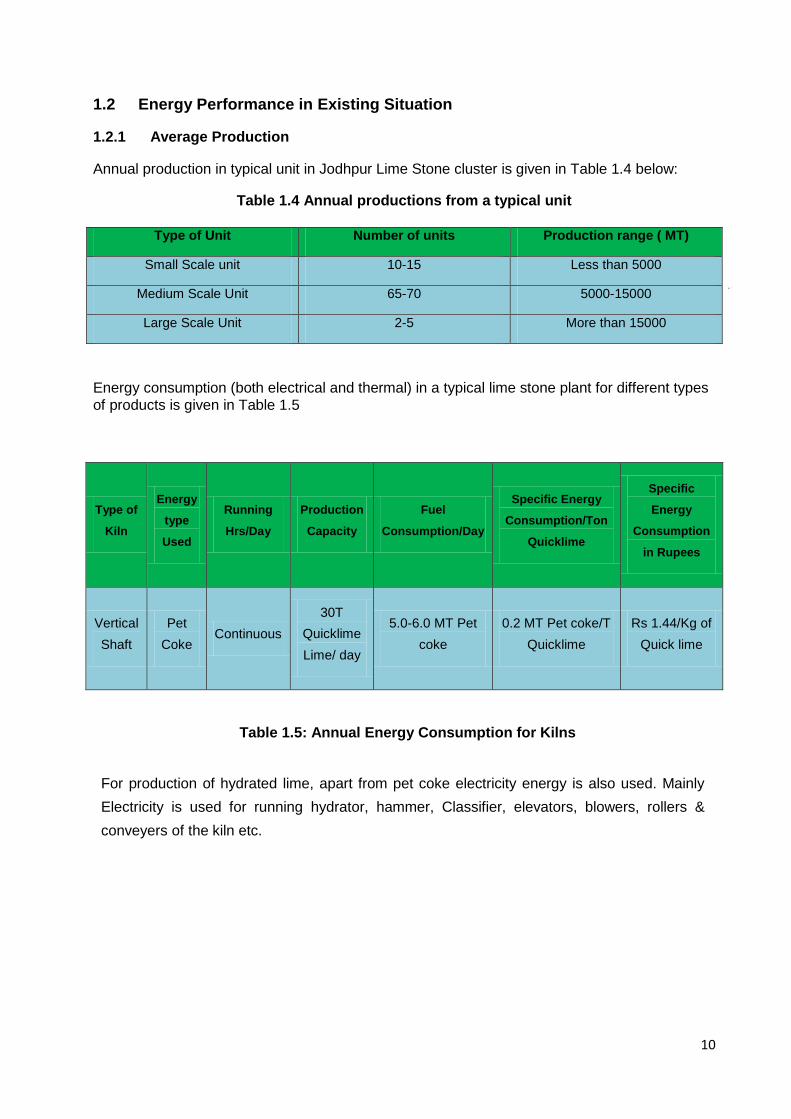
Table 1.4 Annual productions from a typical unit
Type of Unit Number of units Production range ( MT)
Small Scale unit 10-15 Less than 5000
Medium Scale Unit 65-70 5000-15000
Large Scale Unit 2-5 More than 15000
Energy consumption (both electrical and thermal) in a typical lime stone plant for different types
of products is given in Table 1.5
Type of
Kiln
Energy
type
Used
Running
Hrs/Day
Production
Capacity
Fuel
Consumption/Day
Specific Energy
Consumption/Ton
Quicklime
Specific
Energy
Consumption
in Rupees
Vertical
Shaft
Pet
Coke Continuous
30T
Quicklime
Lime/ day
5.0-6.0 MT Pet
coke
0.2 MT Pet coke/T
Quicklime
Rs 1.44/Kg of
Quick lime
Table 1.5: Annual Energy Consumption for Kilns
For production of hydrated lime, apart from pet coke electricity energy is also used. Mainly
Electricity is used for running hydrator, hammer, Classifier, elevators, blowers, rollers &
conveyers of the kiln etc.
11
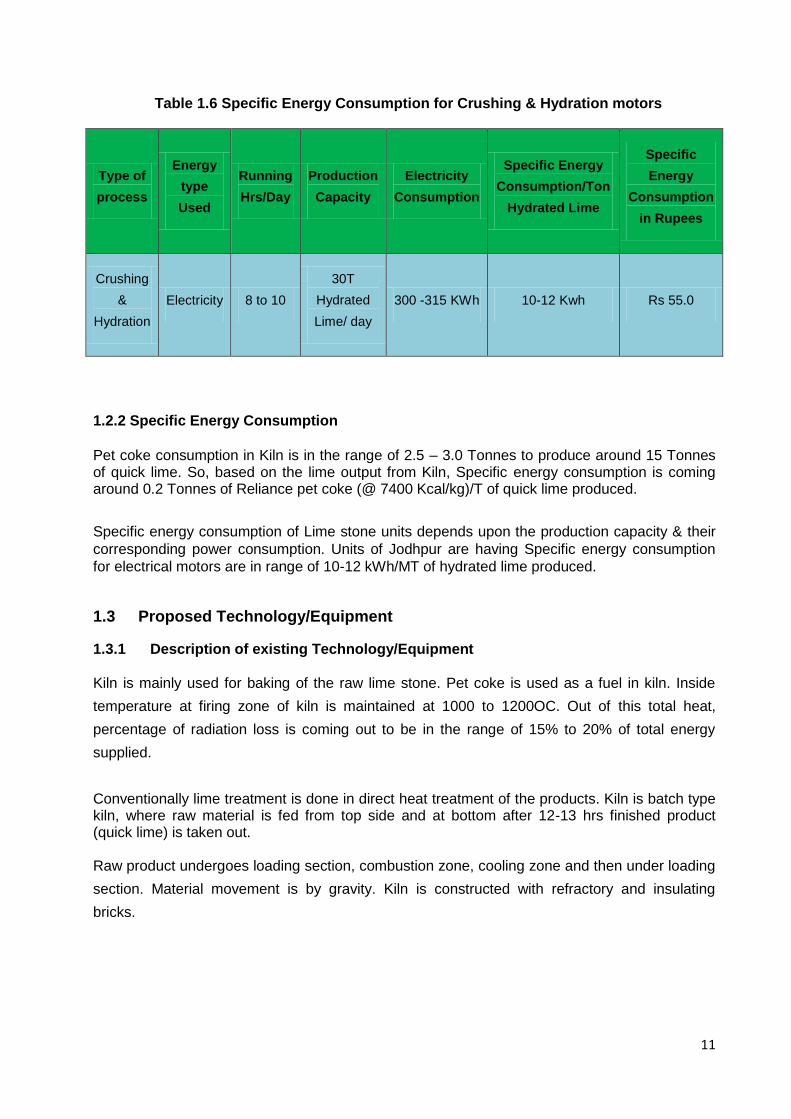
Table 1.6 Specific Energy Consumption for Crushing & Hydration motors
Type of
process
Energy
type
Used
Running
Hrs/Day
Production
Capacity
Electricity
Consumption
Specific Energy
Consumption/Ton
Hydrated Lime
Specific
Energy
Consumption
in Rupees
Crushing
&
Hydration
Electricity 8 to 10
30T
Hydrated
Lime/ day
300 -315 KWh 10-12 Kwh Rs 55.0
1.2.2 Specific Energy Consumption
Pet coke consumption in Kiln is in the range of 2.5 – 3.0 Tonnes to produce around 15 Tonnes of quick lime. So, based on the lime output from Kiln, Specific energy consumption is coming around 0.2 Tonnes of Reliance pet coke (@ 7400 Kcal/kg)/T of quick lime produced.
Specific energy consumption of Lime stone units depends upon the production capacity & their
corresponding power consumption. Units of Jodhpur are having Specific energy consumption
for electrical motors are in range of 10-12 kWh/MT of hydrated lime produced.
1.3 Proposed Technology/Equipment 1.3.1 Description of existing Technology/Equipment
Kiln is mainly used for baking of the raw lime stone. Pet coke is used as a fuel in kiln. Inside
temperature at firing zone of kiln is maintained at 1000 to 1200OC. Out of this total heat,
percentage of radiation loss is coming out to be in the range of 15% to 20% of total energy
supplied.
Conventionally lime treatment is done in direct heat treatment of the products. Kiln is batch type kiln, where raw material is fed from top side and at bottom after 12-13 hrs finished product (quick lime) is taken out. Raw product undergoes loading section, combustion zone, cooling zone and then under loading
section. Material movement is by gravity. Kiln is constructed with refractory and insulating
bricks.
12
1.3.2 Role in Process
Role of Kiln is to bake the lime stone, to get quick lime products and deliver the finished
products. Final quality of product depends on the firing temperature and cycle time of kiln. In
kiln, final moisture is removed and heating at higher temperature imparts strength to the quick
lime. 1.4 Benchmarking for Existing Specific Energy Consumption Energy Consumption in kiln depends upon following parameters.
Heating temperature which depends on the type of product to be fired
Operational & maintenance practices
Type of fuel and its calorific value
Quantity of product to be heated
Amount of air supplied for fuel combustion
Length of Kiln
Insulation level & its condition
Energy use and technology audit studies were conducted in various units of Jodhpur Lime
Stone cluster, the baseline energy consumption of present Kiln and the performance of the
same is carried out and attached in Annexure 1. 1.4.1 Energy Audit Methodology The following methodology was adopted to evaluate the performance of Kiln.
Monitoring of fuel
Identification of various points for thermal measurement
Analysis of critical parameter affecting kiln operation
1.4.2 Design and operation parameters specification
In all Lime stone units, Pet coke is used as a fuel. Kiln is divided into different zones
depending upon zonal temperature. The zones are loading zone, Combustion zone, Cooling
zone & Unloading Zone. Major role of the kiln is for heat treatment of lime stone a
temperature of about 1200OC.
13
Operating efficiency Analysis
Operating efficiency of kilns is found to be in the range of 30% to 40%. Detailed parameters
and calculations used for operating efficiency evaluation of kiln and heat loss calculations are
given in the Annexure 1.
1.5 Barriers in Adoption of Product Technology/Equipment 1.5.1 Technological Barrier
In Jodhpur Lime Stone cluster, overall technical understanding on lime stone
manufacturing is good and rapidly increasing, however awareness and information
about the new and emerging energy efficiency technologies available in market is less.
In this cluster there is lack of leadership to take up the energy efficiency projects.
The majority of the limestone plant owners are only concern about their production
instead on efficiency improvement.
Dependence on local equipment suppliers for uninterrupted after sales service
1.5.2 Financial Barrier
Implementation of the proposed project activity requires considerable investment of
57.00 lakh, which is a significant investment and not commonly seen in the cluster for
energy efficiency.
The majority of the unit owners are of the view that it makes business sense for them to
invest in enhancing production capacity rather than making investment in energy
efficiency.
The unit owners in the cluster are wary of approaching banks for financial assistance
due to their old perception that getting loan sanctioned from Banks involves lot of paper
work / documentation and needs collateral security.
1.5.3 Skilled Manpower
In Jodhpur Lime Stone cluster, the availability of skilled manpower is one of the limitations, this
issue gets further aggravated due to more number of lime stone units as compared to the
availability of skilled manpower. One local technical person available at lime stone unit takes
care of about 5 to 10 lime stone units. For major equipments of lime stone units like kiln,
hammer mill, hydrator Machine etc.

14
2 PROPOSED TECHNOLOGY 2.1 Detailed Description of Technology 2.1.1 Description of Technology
For any given kiln, the flame length and heat transfer are determined by the fuel characteristics,
the fuel to air ratio and the quantity of excess air. The fuel to air ratio is primarily dependent on
the ratio of the burner momentum and that of the secondary air.
Due to above mentioned parameters lime recovery kilns present a significant challenge to burn
pet coke or other solid fuels. Due to the low volatile content of the pet coke, the distinct flame
characteristics and the need for NOx control, the combustion designing of kiln is very critical.
Considering above mentioned combustion characteristic Produce gas based Gasifier for
combustion in Lime kiln is an energy efficient technology.
Specification for 15 to 30TPD lime kiln producer gas unit is as follows.
Description Specification
Kcal/Hr 1000000
Coal Consumption 4750Kg/Day
Calorific Value of gas 1250-1350 Kcal/Nm3
Feed material Coal
Gas pressure 150-200mmWC
Gas temperature 200-250 0C
Calorific value of coal 5200-5500 Kcal/Kg
Required size of coal 15 -70 mm
Ash fusion temperature of coal 1400 0C
Table: Specification for 15 to 30TPD lime kiln producer gas unit
15
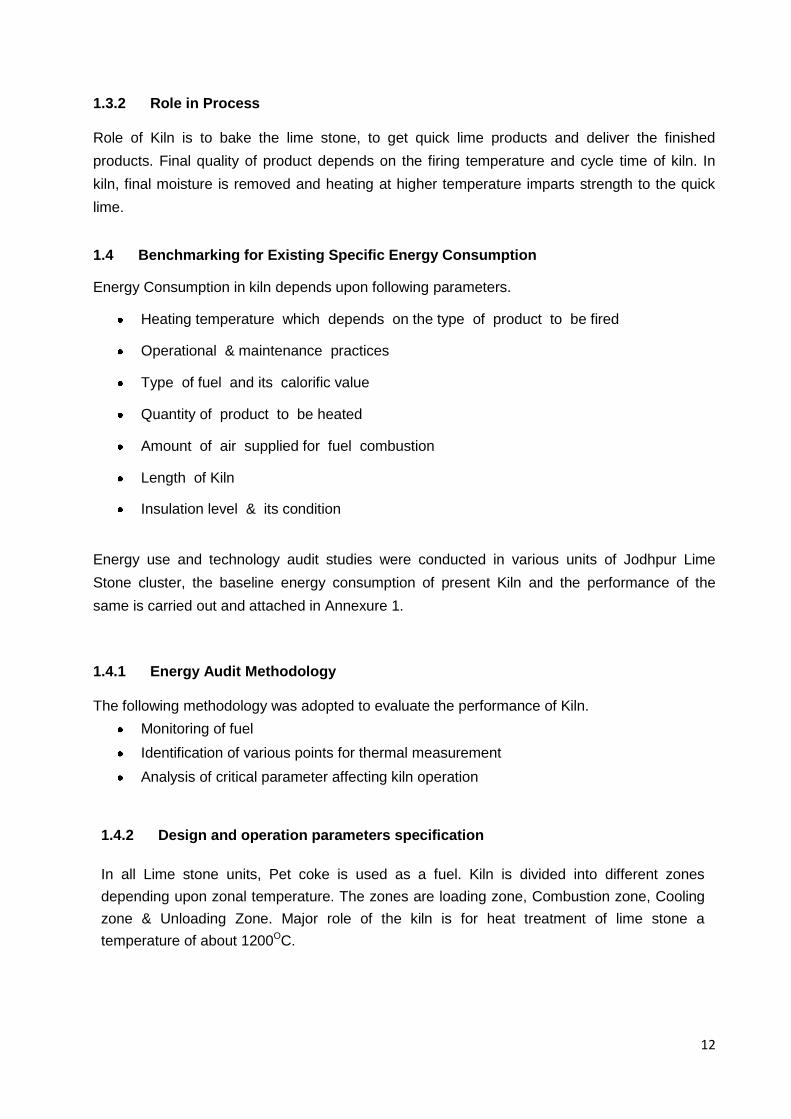
Table: Figure for 25TPD lime kiln with producer gas unit
2.1.2 Suitability of Existing Technology
The producer gas based Lime calcinations Kilns are designed to enhance product throughput,
quality, to reduce production cost and to eliminate dependency on single fuel.. This technology has been selected for the following reasons:
Optimum combustion of fuel to ensure better combustion efficiency.
Due to proper combustion lower emission of CO.
mproved Calcinations Quality of Lime stone.
Completely environment friendly system.
Elimination of single fuel dependency.
Optimum utilization of manpower to improve productivity.
16
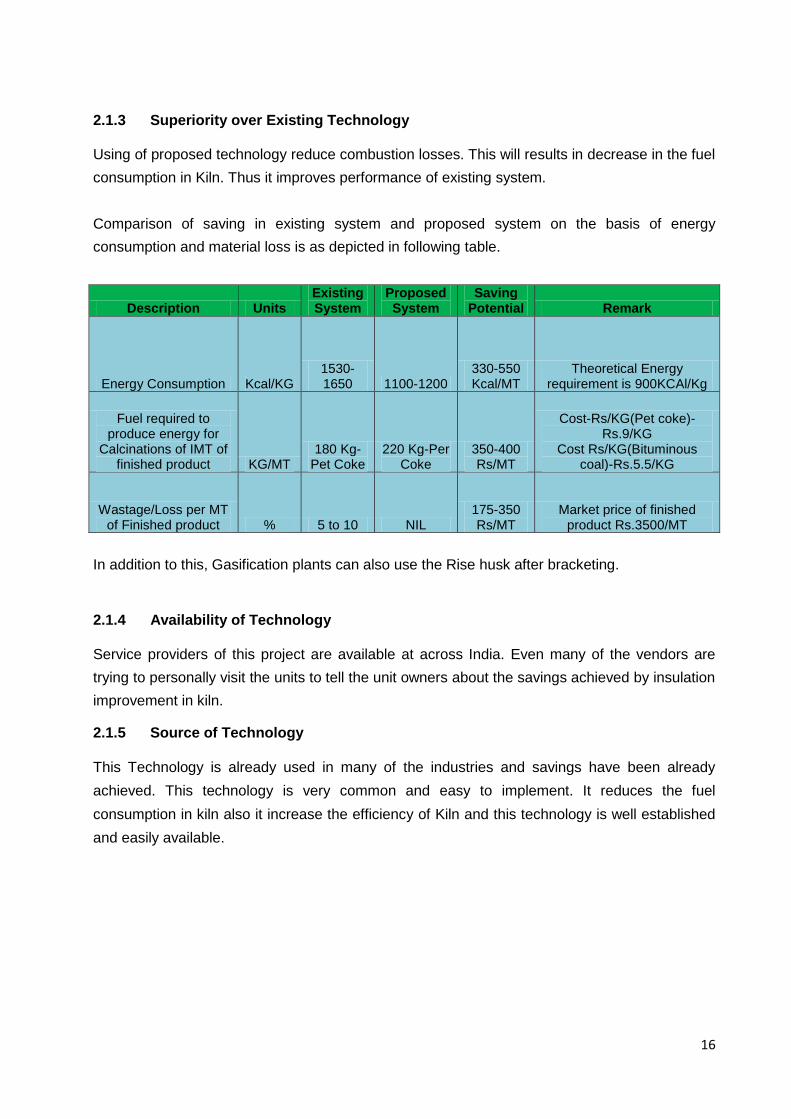
2.1.3 Superiority over Existing Technology
Using of proposed technology reduce combustion losses. This will results in decrease in the fuel
consumption in Kiln. Thus it improves performance of existing system.
Comparison of saving in existing system and proposed system on the basis of energy
consumption and material loss is as depicted in following table.
Description Units Existing System
Proposed System
Saving Potential Remark
Energy Consumption Kcal/KG 1530-1650 1100-1200
330-550 Kcal/MT
Theoretical Energy requirement is 900KCAl/Kg
Fuel required to produce energy for
Calcinations of IMT of finished product KG/MT
180 Kg-Pet Coke
220 Kg-Per Coke
350-400 Rs/MT
Cost-Rs/KG(Pet coke)-Rs.9/KG
Cost Rs/KG(Bituminous coal)-Rs.5.5/KG
Wastage/Loss per MT of Finished product % 5 to 10 NIL
175-350 Rs/MT
Market price of finished product Rs.3500/MT
In addition to this, Gasification plants can also use the Rise husk after bracketing.
2.1.4 Availability of Technology
Service providers of this project are available at across India. Even many of the vendors are
trying to personally visit the units to tell the unit owners about the savings achieved by insulation
improvement in kiln. 2.1.5 Source of Technology
This Technology is already used in many of the industries and savings have been already
achieved. This technology is very common and easy to implement. It reduces the fuel
consumption in kiln also it increase the efficiency of Kiln and this technology is well established
and easily available.
17
2.1.6 Terms and Conditions in Sales of Equipment
The Technology supplier shall give guarantee for proper performance after implementation of
this project. 2.1.7 Process down Time during Implementation
Process down time requirement will be of one month for implementation of this project. Week
wise break up of one month is shown in Annexure-6. 2.1.8 Life Cycle Assessment
Life cycle of this proposed technology improvement project is about 10 to 12 years provided it
requires periodic repair and maintenance work of damaged insulation spots over the period. 2.1.9 Suitable Unit for Implementation of Proposed Technology
In Jodhpur, there are around 100 Lime stone units. Nearly 60% of the units have potential of
implementing new technology to achieve a better competitive position in industry.
18
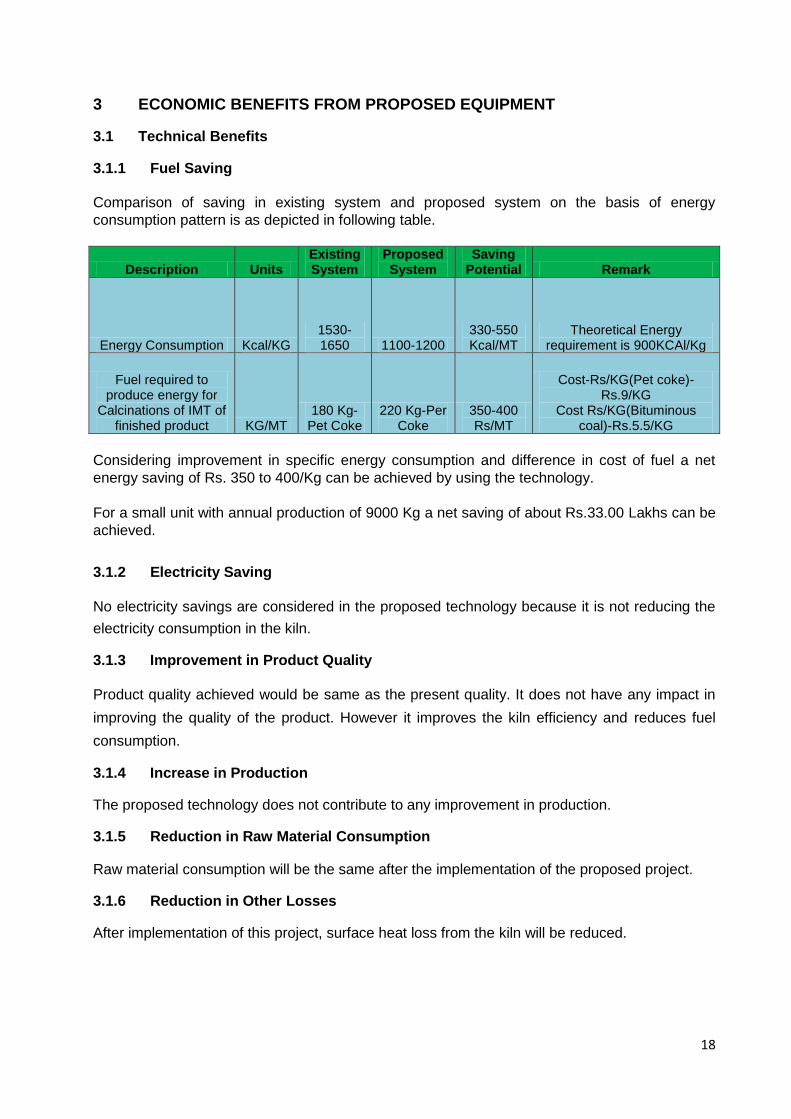
3 ECONOMIC BENEFITS FROM PROPOSED EQUIPMENT 3.1 Technical Benefits 3.1.1 Fuel Saving
Comparison of saving in existing system and proposed system on the basis of energy
consumption pattern is as depicted in following table.
Description Units Existing System
Proposed System
Saving Potential Remark
Energy Consumption Kcal/KG 1530-1650 1100-1200
330-550 Kcal/MT
Theoretical Energy requirement is 900KCAl/Kg
Fuel required to produce energy for
Calcinations of IMT of finished product KG/MT
180 Kg-Pet Coke
220 Kg-Per Coke
350-400 Rs/MT
Cost-Rs/KG(Pet coke)-Rs.9/KG
Cost Rs/KG(Bituminous coal)-Rs.5.5/KG
Considering improvement in specific energy consumption and difference in cost of fuel a net
energy saving of Rs. 350 to 400/Kg can be achieved by using the technology.
For a small unit with annual production of 9000 Kg a net saving of about Rs.33.00 Lakhs can be
achieved.
3.1.2 Electricity Saving
No electricity savings are considered in the proposed technology because it is not reducing the
electricity consumption in the kiln. 3.1.3 Improvement in Product Quality
Product quality achieved would be same as the present quality. It does not have any impact in
improving the quality of the product. However it improves the kiln efficiency and reduces fuel
consumption. 3.1.4 Increase in Production The proposed technology does not contribute to any improvement in production. 3.1.5 Reduction in Raw Material Consumption
Raw material consumption will be the same after the implementation of the proposed project. 3.1.6 Reduction in Other Losses After implementation of this project, surface heat loss from the kiln will be reduced.
19
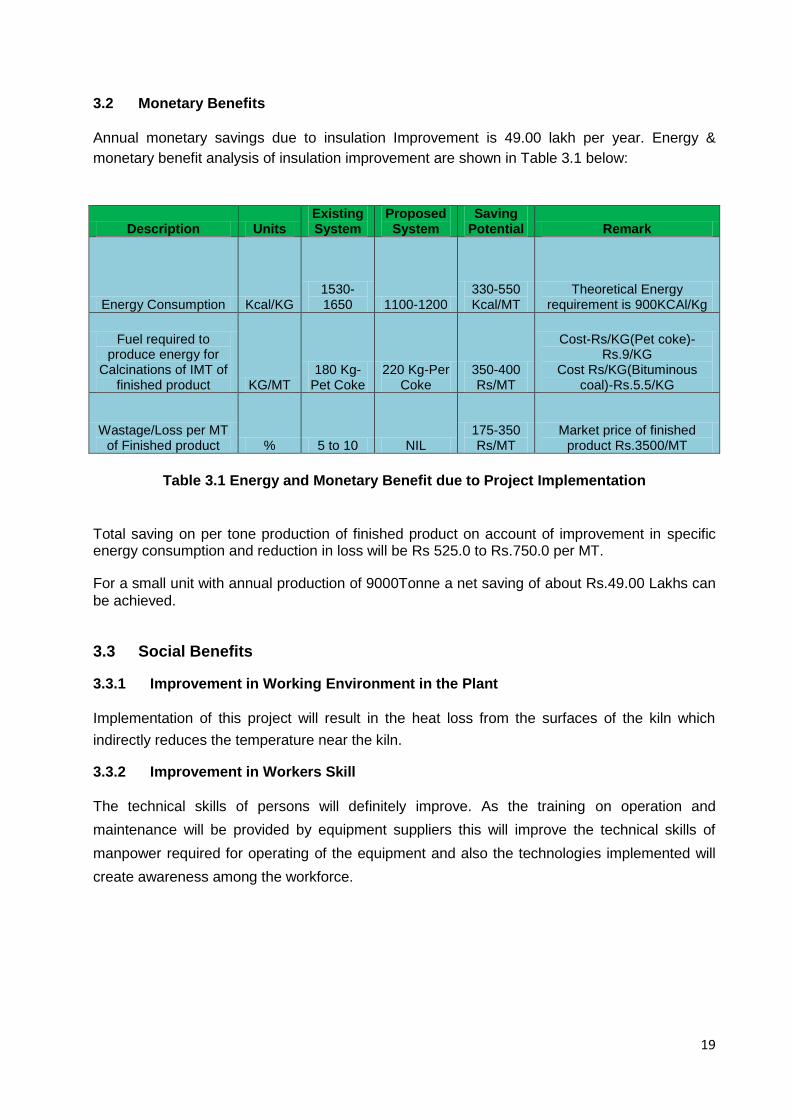
3.2 Monetary Benefits
Annual monetary savings due to insulation Improvement is 49.00 lakh per year. Energy &
monetary benefit analysis of insulation improvement are shown in Table 3.1 below:
Description Units Existing System
Proposed System
Saving Potential Remark
Energy Consumption Kcal/KG 1530-1650 1100-1200
330-550 Kcal/MT
Theoretical Energy requirement is 900KCAl/Kg
Fuel required to produce energy for
Calcinations of IMT of finished product KG/MT
180 Kg-Pet Coke
220 Kg-Per Coke
350-400 Rs/MT
Cost-Rs/KG(Pet coke)-Rs.9/KG
Cost Rs/KG(Bituminous coal)-Rs.5.5/KG
Wastage/Loss per MT of Finished product % 5 to 10 NIL
175-350 Rs/MT
Market price of finished product Rs.3500/MT
Table 3.1 Energy and Monetary Benefit due to Project Implementation
Total saving on per tone production of finished product on account of improvement in specific energy consumption and reduction in loss will be Rs 525.0 to Rs.750.0 per MT.
For a small unit with annual production of 9000Tonne a net saving of about Rs.49.00 Lakhs can
be achieved.
3.3 Social Benefits 3.3.1 Improvement in Working Environment in the Plant
Implementation of this project will result in the heat loss from the surfaces of the kiln which
indirectly reduces the temperature near the kiln. 3.3.2 Improvement in Workers Skill
The technical skills of persons will definitely improve. As the training on operation and
maintenance will be provided by equipment suppliers this will improve the technical skills of
manpower required for operating of the equipment and also the technologies implemented will
create awareness among the workforce.
20
3.4 Environmental Benefits 3.4.1 Reduction in Flue Gas Generation
By implementing this project there is definitely reduction in pet coke consumption which leads to
reduction in flue gas generation. 3.4.2 Reduction in GHG Emission Implementation of this technology will results in reduction in CO2 emissions due to reduction in
overall fuel consumption.
21
4 IMPLEMENTATION OF PROPOSED EQUIPMENT 4.1 Cost of Equipment Implementation 4.1.1 Equipments Cost
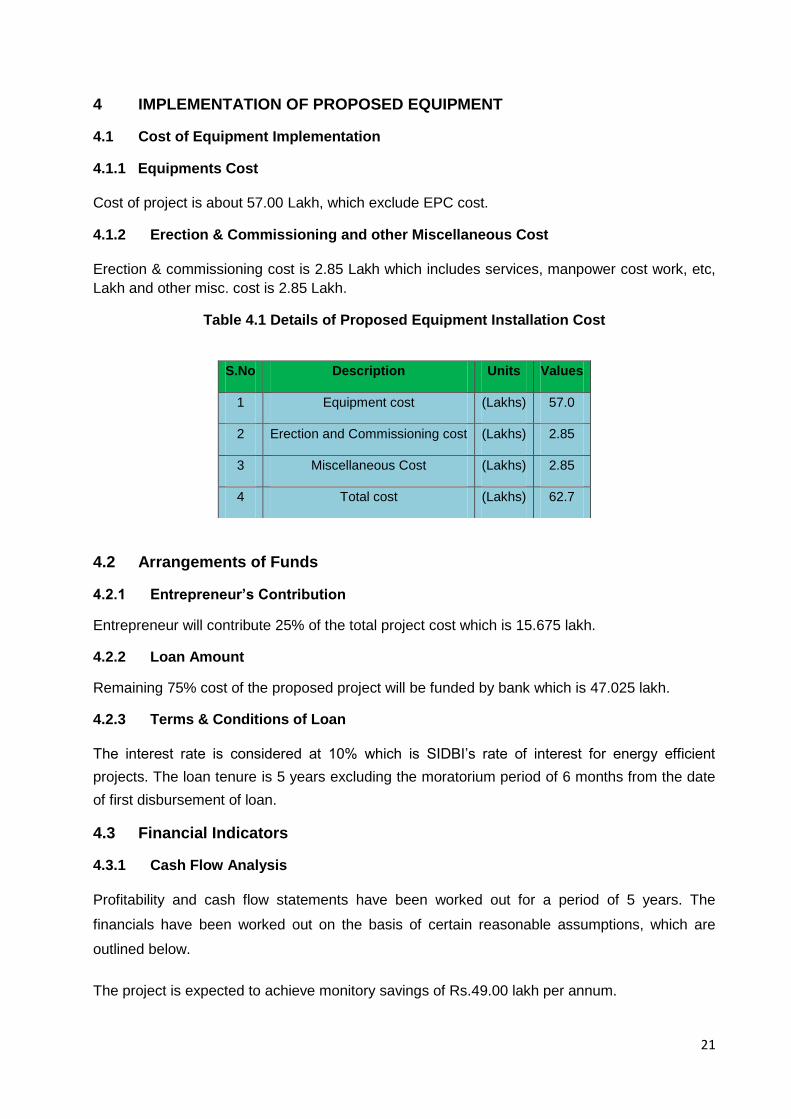
Cost of project is about 57.00 Lakh, which exclude EPC cost. 4.1.2 Erection & Commissioning and other Miscellaneous Cost
Erection & commissioning cost is 2.85 Lakh which includes services, manpower cost work, etc,
Lakh and other misc. cost is 2.85 Lakh.
Table 4.1 Details of Proposed Equipment Installation Cost
4.2 Arrangements of Funds 4.2.1 Entrepreneur’s Contribution Entrepreneur will contribute 25% of the total project cost which is 15.675 lakh. 4.2.2 Loan Amount Remaining 75% cost of the proposed project will be funded by bank which is 47.025 lakh. 4.2.3 Terms & Conditions of Loan
The interest rate is considered at 10% which is SIDBI’s rate of interest for energy efficient
projects. The loan tenure is 5 years excluding the moratorium period of 6 months from the date
of first disbursement of loan. 4.3 Financial Indicators 4.3.1 Cash Flow Analysis
Profitability and cash flow statements have been worked out for a period of 5 years. The
financials have been worked out on the basis of certain reasonable assumptions, which are
outlined below.
The project is expected to achieve monitory savings of Rs.49.00 lakh per annum.
S.No Description Units Values
1 Equipment cost (Lakhs) 57.0
2 Erection and Commissioning cost (Lakhs) 2.85
3 Miscellaneous Cost (Lakhs) 2.85
4 Total cost (Lakhs) 62.7
22
The Repair and Maintenance cost is estimated at 5% of cost of total project with 5%
increase in every year as escalations.
Interest on term loan is estimated at 10%.
Depreciation is provided as per the rates provided in the companies act. Based on the above assumptions, profitability and cash flow statements have been prepared
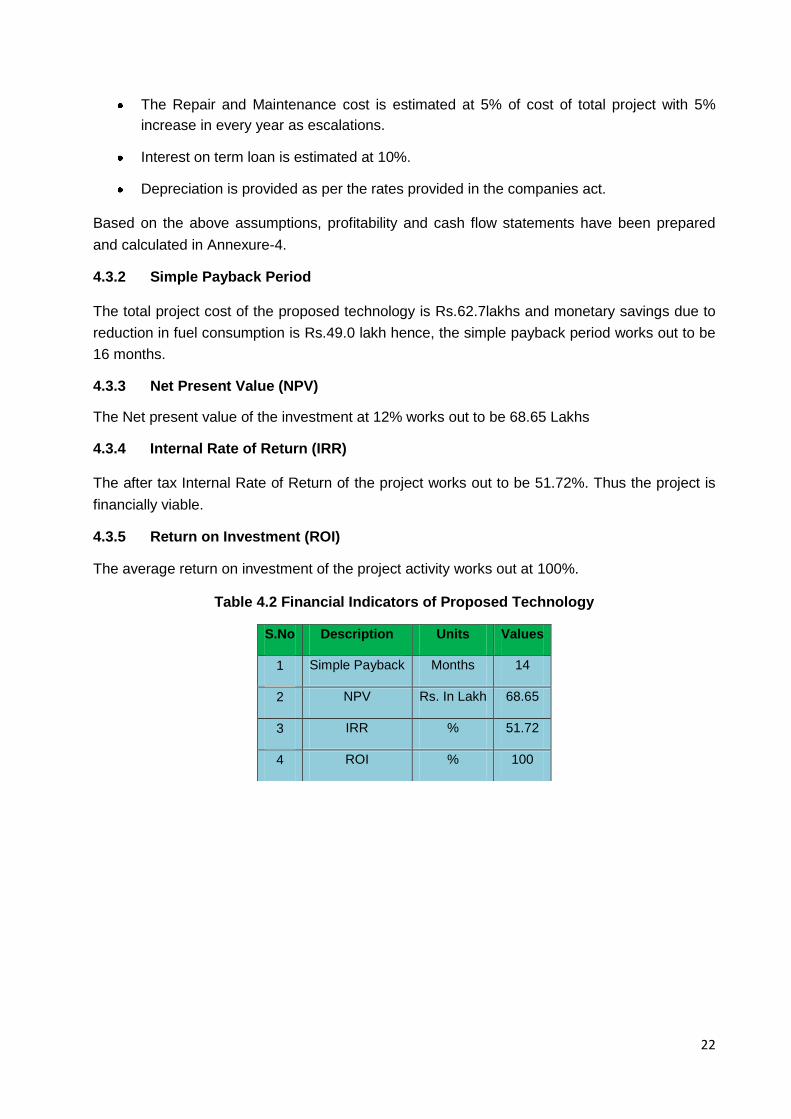
and calculated in Annexure-4. 4.3.2 Simple Payback Period
The total project cost of the proposed technology is Rs.62.7lakhs and monetary savings due to
reduction in fuel consumption is Rs.49.0 lakh hence, the simple payback period works out to be
16 months. 4.3.3 Net Present Value (NPV) The Net present value of the investment at 12% works out to be 68.65 Lakhs 4.3.4 Internal Rate of Return (IRR)
The after tax Internal Rate of Return of the project works out to be 51.72%. Thus the project is
financially viable. 4.3.5 Return on Investment (ROI) The average return on investment of the project activity works out at 100%.
Table 4.2 Financial Indicators of Proposed Technology
S.No Description Units Values
1 Simple Payback Months 14
2 NPV Rs. In Lakh 68.65
3 IRR % 51.72
4 ROI % 100
23
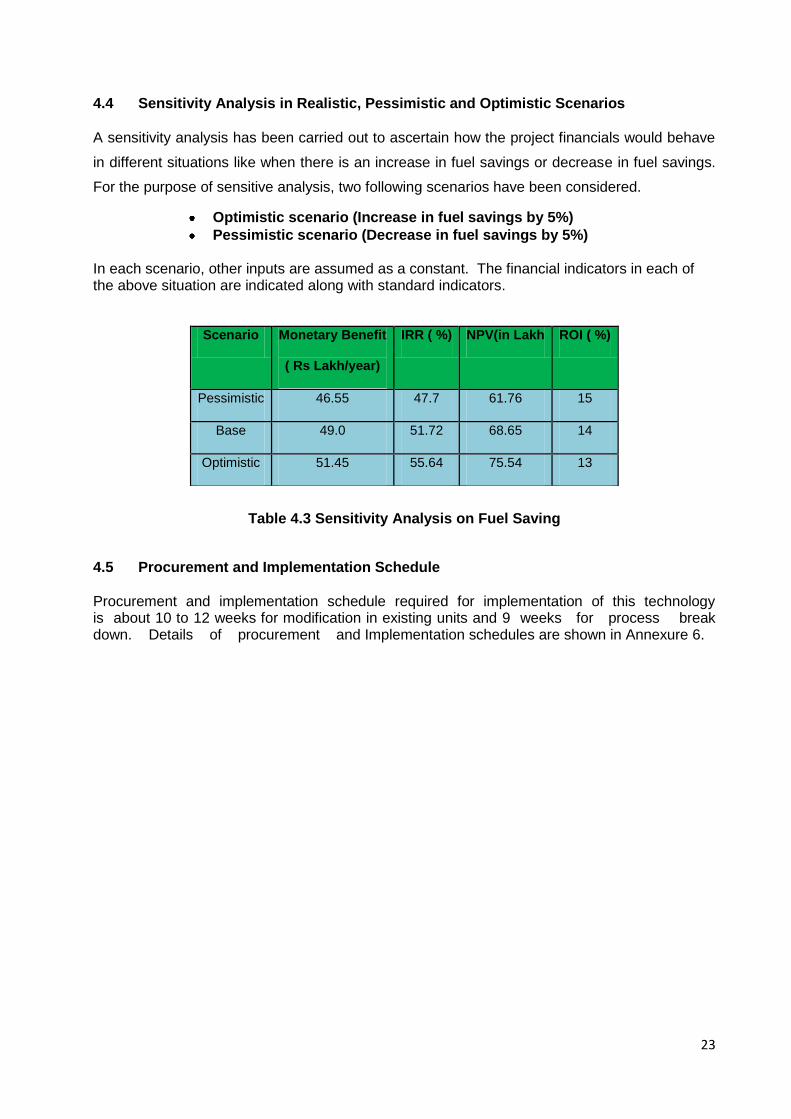
4.4 Sensitivity Analysis in Realistic, Pessimistic and Optimistic Scenarios
A sensitivity analysis has been carried out to ascertain how the project financials would behave
in different situations like when there is an increase in fuel savings or decrease in fuel savings.
For the purpose of sensitive analysis, two following scenarios have been considered.
Optimistic scenario (Increase in fuel savings by 5%)
Pessimistic scenario (Decrease in fuel savings by 5%) In each scenario, other inputs are assumed as a constant. The financial indicators in each of the above situation are indicated along with standard indicators.
Table 4.3 Sensitivity Analysis on Fuel Saving
4.5 Procurement and Implementation Schedule
Procurement and implementation schedule required for implementation of this technology is about 10 to 12 weeks for modification in existing units and 9 weeks for process break down. Details of procurement and Implementation schedules are shown in Annexure 6.
Scenario Monetary Benefit
( Rs Lakh/year)
IRR ( %) NPV(in Lakh ROI ( %)
Pessimistic 46.55 47.7 61.76 15
Base 49.0 51.72 68.65 14
Optimistic 51.45 55.64 75.54 13
24
ANNEXURES
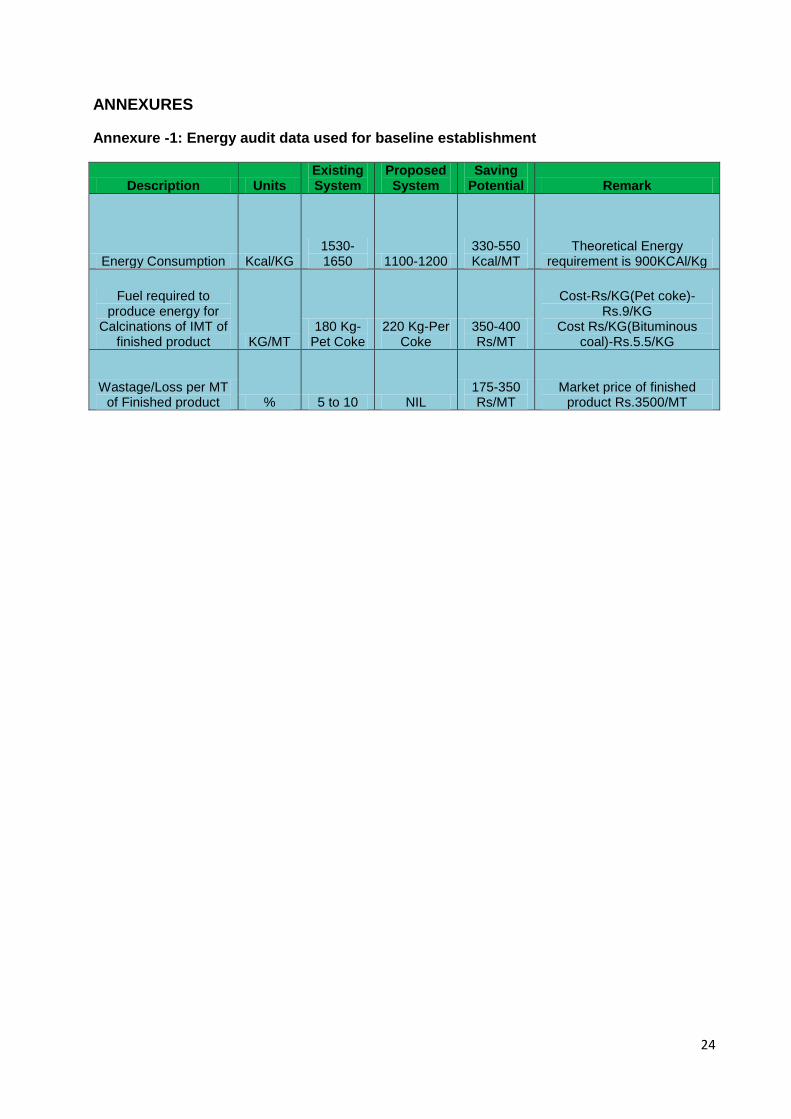
Annexure -1: Energy audit data used for baseline establishment
Description Units Existing System
Proposed System
Saving Potential Remark
Energy Consumption Kcal/KG 1530-1650 1100-1200
330-550 Kcal/MT
Theoretical Energy requirement is 900KCAl/Kg
Fuel required to produce energy for
Calcinations of IMT of finished product KG/MT
180 Kg-Pet Coke
220 Kg-Per Coke
350-400 Rs/MT
Cost-Rs/KG(Pet coke)-Rs.9/KG
Cost Rs/KG(Bituminous coal)-Rs.5.5/KG
Wastage/Loss per MT of Finished product % 5 to 10 NIL
175-350 Rs/MT
Market price of finished product Rs.3500/MT
25
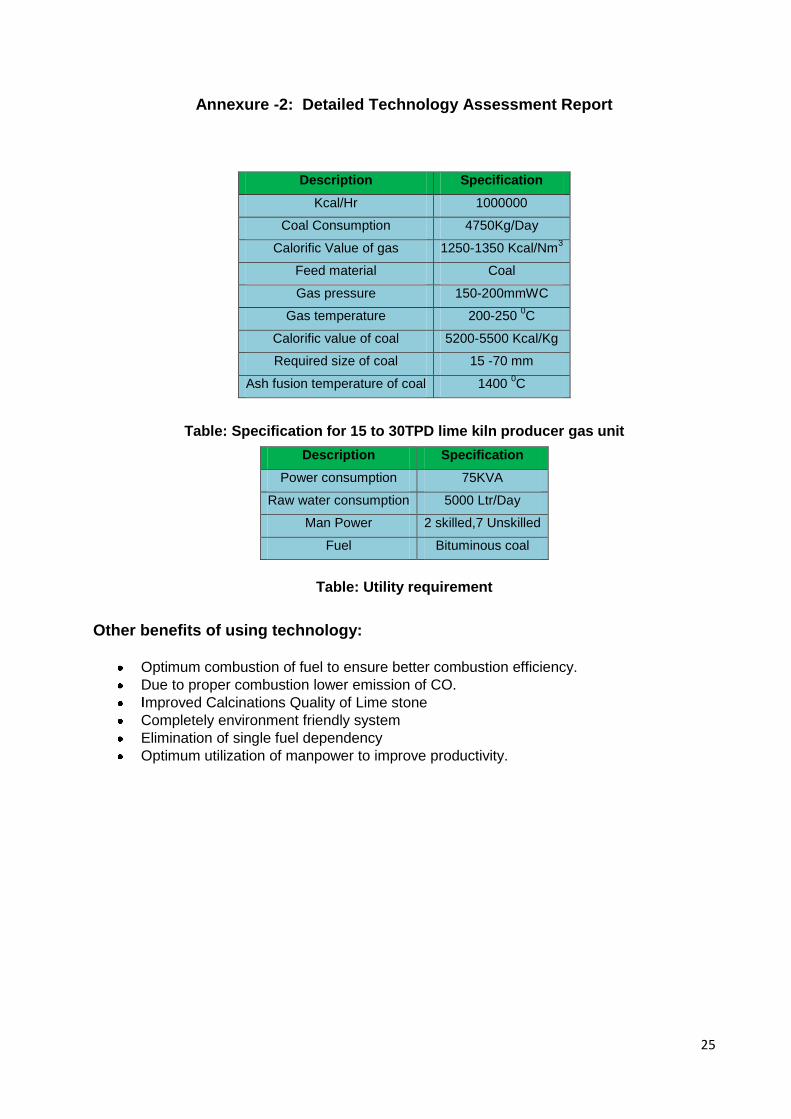
Annexure -2: Detailed Technology Assessment Report
Description Specification
Kcal/Hr 1000000
Coal Consumption 4750Kg/Day
Calorific Value of gas 1250-1350 Kcal/Nm3
Feed material Coal
Gas pressure 150-200mmWC
Gas temperature 200-250 0C
Calorific value of coal 5200-5500 Kcal/Kg
Required size of coal 15 -70 mm
Ash fusion temperature of coal 1400 0C
Table: Specification for 15 to 30TPD lime kiln producer gas unit
Description Specification
Power consumption 75KVA
Raw water consumption 5000 Ltr/Day
Man Power 2 skilled,7 Unskilled
Fuel Bituminous coal
Table: Utility requirement
Other benefits of using technology:
Optimum combustion of fuel to ensure better combustion efficiency.
Due to proper combustion lower emission of CO.
mproved Calcinations Quality of Lime stone
Completely environment friendly system
Elimination of single fuel dependency
Optimum utilization of manpower to improve productivity.
26
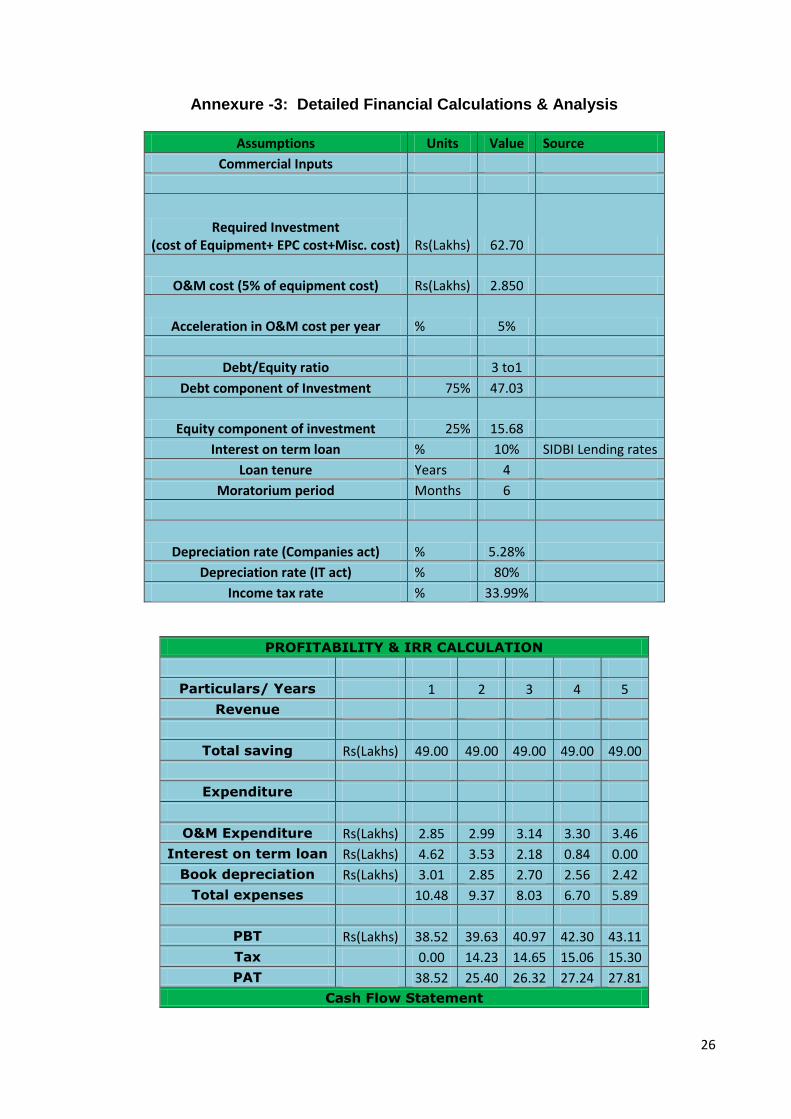
Annexure -3: Detailed Financial Calculations & Analysis
Assumptions Units Value Source
Commercial Inputs
Required Investment (cost of Equipment+ EPC cost+Misc. cost) Rs(Lakhs) 62.70
O&M cost (5% of equipment cost) Rs(Lakhs) 2.850
Acceleration in O&M cost per year % 5%
Debt/Equity ratio 3 to1
Debt component of Investment 75% 47.03
Equity component of investment 25% 15.68
Interest on term loan % 10% SIDBI Lending rates
Loan tenure Years 4
Moratorium period Months 6
Depreciation rate (Companies act) % 5.28%
Depreciation rate (IT act) % 80%
Income tax rate % 33.99%
PROFITABILITY & IRR CALCULATION
Particulars/ Years 1 2 3 4 5
Revenue
Total saving Rs(Lakhs) 49.00 49.00 49.00 49.00 49.00
Expenditure
O&M Expenditure Rs(Lakhs) 2.85 2.99 3.14 3.30 3.46
Interest on term loan Rs(Lakhs) 4.62 3.53 2.18 0.84 0.00
Book depreciation Rs(Lakhs) 3.01 2.85 2.70 2.56 2.42
Total expenses 10.48 9.37 8.03 6.70 5.89
PBT Rs(Lakhs) 38.52 39.63 40.97 42.30 43.11
Tax 0.00 14.23 14.65 15.06 15.30
PAT 38.52 25.40 26.32 27.24 27.81
Cash Flow Statement
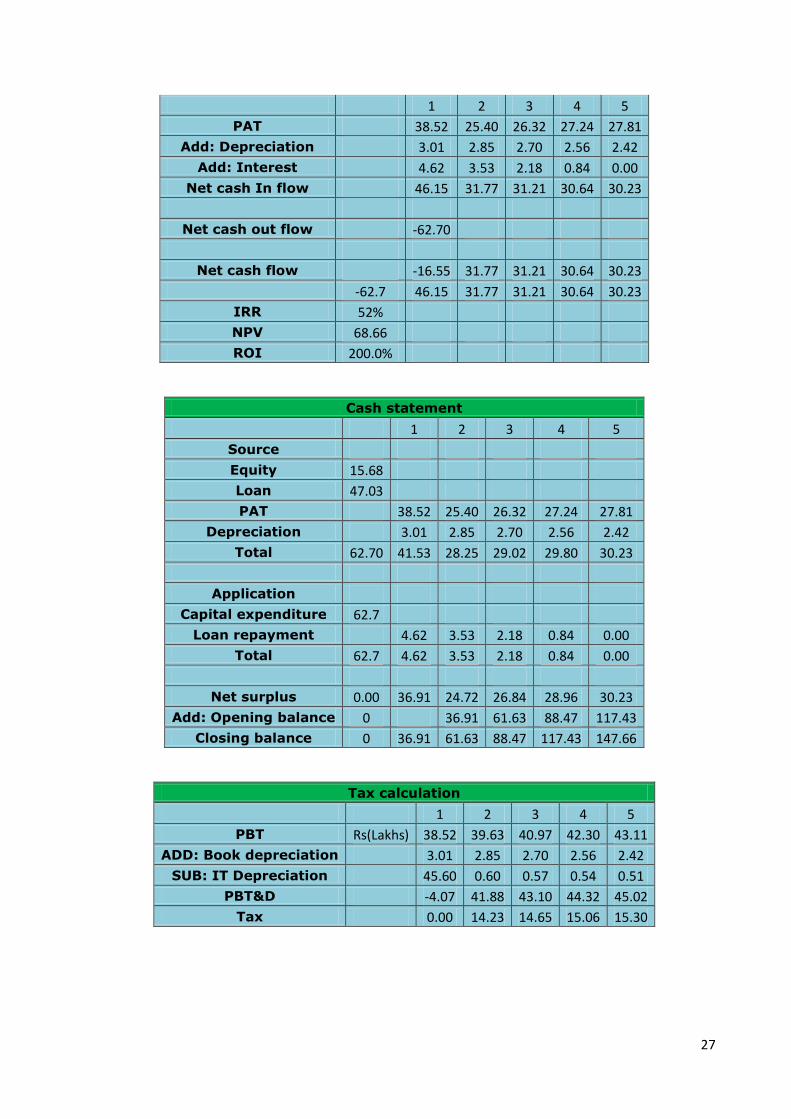
27
1 2 3 4 5
PAT 38.52 25.40 26.32 27.24 27.81
Add: Depreciation 3.01 2.85 2.70 2.56 2.42
Add: Interest 4.62 3.53 2.18 0.84 0.00
Net cash In flow 46.15 31.77 31.21 30.64 30.23
Net cash out flow -62.70
Net cash flow -16.55 31.77 31.21 30.64 30.23
-62.7 46.15 31.77 31.21 30.64 30.23
IRR 52%
NPV 68.66
ROI 200.0%
Cash statement
1 2 3 4 5
Source
Equity 15.68
Loan 47.03
PAT 38.52 25.40 26.32 27.24 27.81
Depreciation 3.01 2.85 2.70 2.56 2.42
Total 62.70 41.53 28.25 29.02 29.80 30.23
Application
Capital expenditure 62.7
Loan repayment 4.62 3.53 2.18 0.84 0.00
Total 62.7 4.62 3.53 2.18 0.84 0.00
Net surplus 0.00 36.91 24.72 26.84 28.96 30.23
Add: Opening balance 0 36.91 61.63 88.47 117.43
Closing balance 0 36.91 61.63 88.47 117.43 147.66
Tax calculation
1 2 3 4 5
PBT Rs(Lakhs) 38.52 39.63 40.97 42.30 43.11
ADD: Book depreciation 3.01 2.85 2.70 2.56 2.42
SUB: IT Depreciation 45.60 0.60 0.57 0.54 0.51
PBT&D -4.07 41.88 43.10 44.32 45.02
Tax 0.00 14.23 14.65 15.06 15.30
28
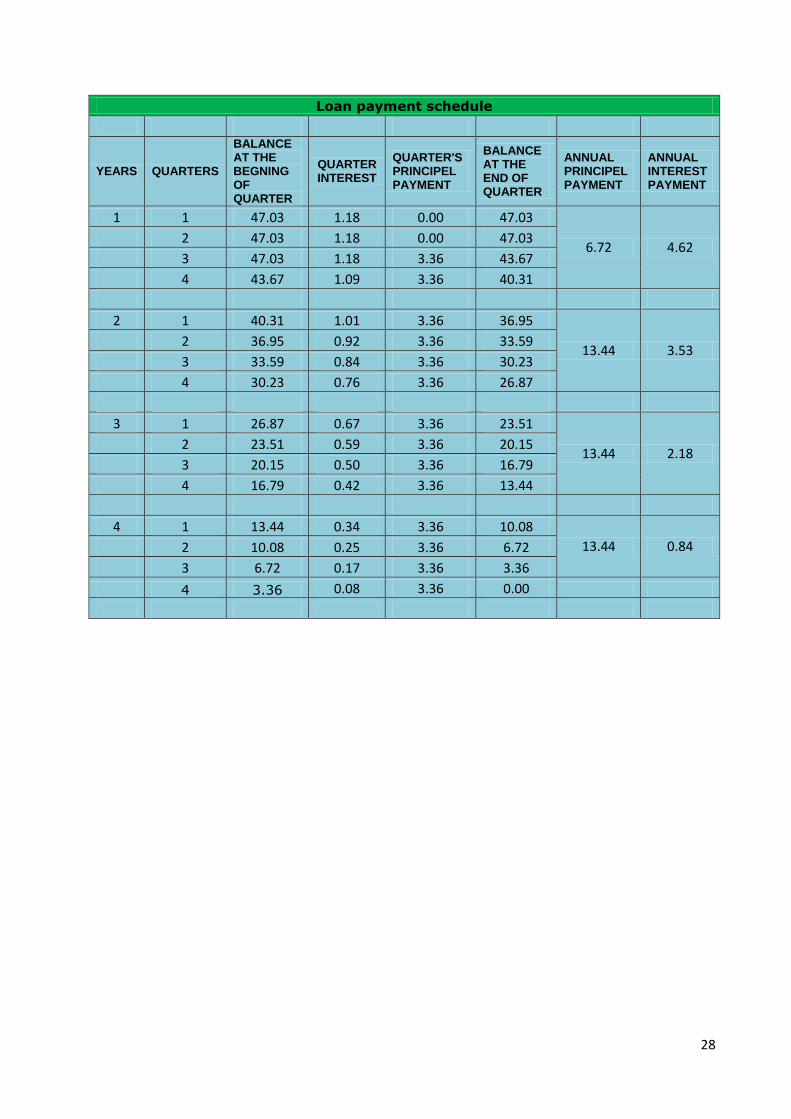
Loan payment schedule
YEARS QUARTERS
BALANCE AT THE BEGNING OF QUARTER
QUARTER INTEREST
QUARTER'S PRINCIPEL PAYMENT
BALANCE AT THE END OF QUARTER
ANNUAL PRINCIPEL PAYMENT
ANNUAL INTEREST PAYMENT
1 1 47.03 1.18 0.00 47.03
6.72 4.62 2 47.03 1.18 0.00 47.03
3 47.03 1.18 3.36 43.67
4 43.67 1.09 3.36 40.31
2 1 40.31 1.01 3.36 36.95
13.44 3.53 2 36.95 0.92 3.36 33.59
3 33.59 0.84 3.36 30.23
4 30.23 0.76 3.36 26.87
3 1 26.87 0.67 3.36 23.51
13.44 2.18 2 23.51 0.59 3.36 20.15
3 20.15 0.50 3.36 16.79
4 16.79 0.42 3.36 13.44
4 1 13.44 0.34 3.36 10.08
13.44 0.84 2 10.08 0.25 3.36 6.72
3 6.72 0.17 3.36 3.36
4 3.36 0.08 3.36 0.00
29
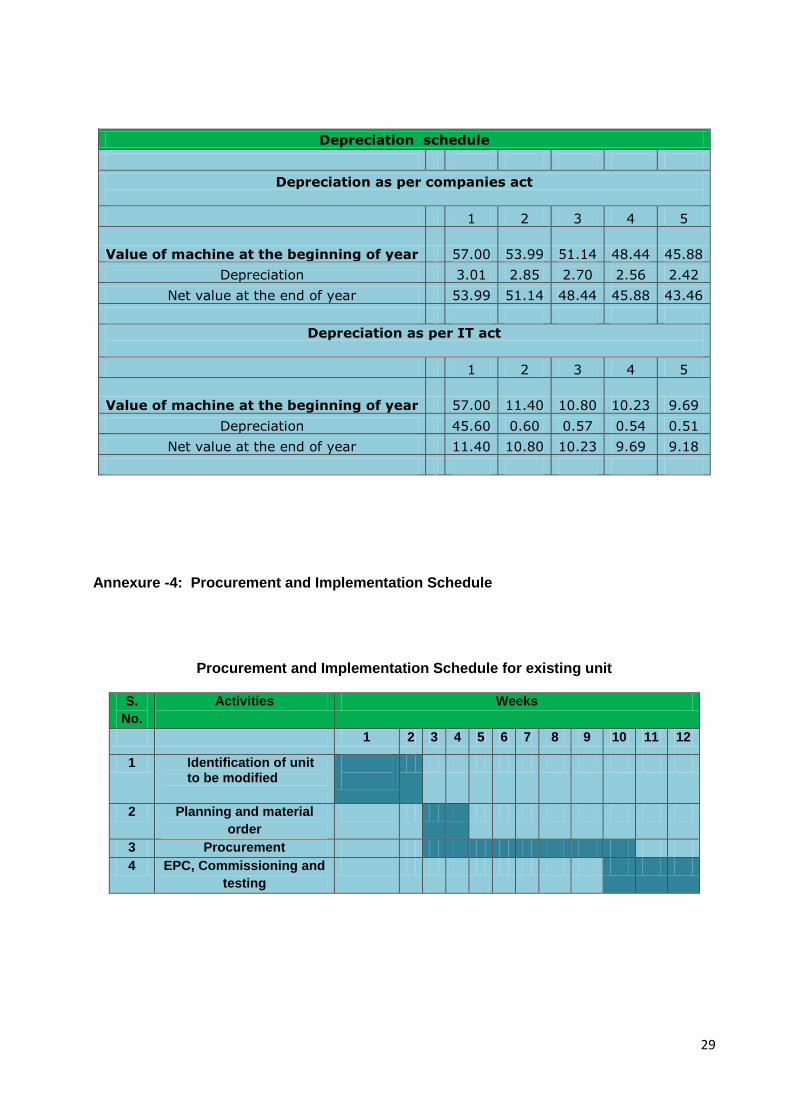
Depreciation schedule
Depreciation as per companies act
1 2 3 4 5
Value of machine at the beginning of year 57.00 53.99 51.14 48.44 45.88
Depreciation 3.01 2.85 2.70 2.56 2.42
Net value at the end of year 53.99 51.14 48.44 45.88 43.46
Depreciation as per IT act
1 2 3 4 5
Value of machine at the beginning of year 57.00 11.40 10.80 10.23 9.69
Depreciation 45.60 0.60 0.57 0.54 0.51
Net value at the end of year 11.40 10.80 10.23 9.69 9.18
Annexure -4: Procurement and Implementation Schedule
Procurement and Implementation Schedule for existing unit
S.
No.
Activities Weeks
1 2 3 4 5 6 7 8 9 10 11 12
1 Identification of unit to be modified
2 Planning and material
order
3 Procurement
4 EPC, Commissioning and
testing
30
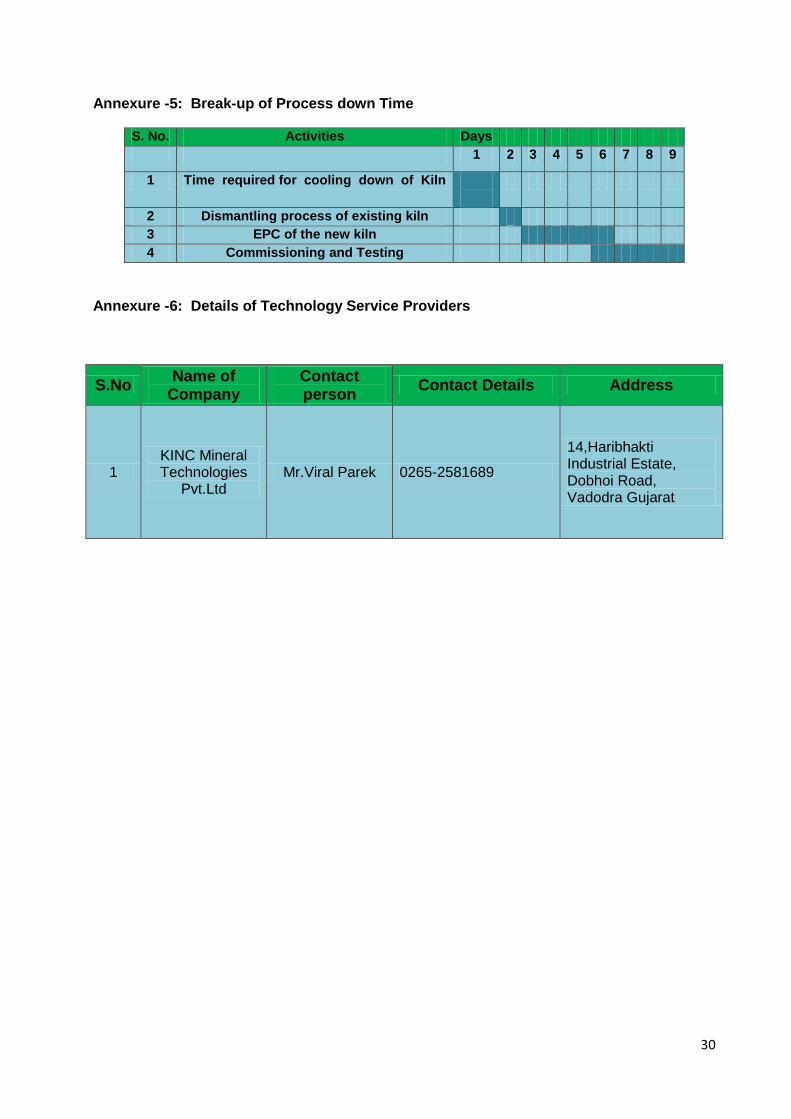
Annexure -5: Break-up of Process down Time
S. No. Activities Days
1 2 3 4 5 6 7 8 9
1 Time required for cooling down of Kiln
2 Dismantling process of existing kiln
3 EPC of the new kiln
4 Commissioning and Testing
Annexure -6: Details of Technology Service Providers
S.No Name of
Company Contact person
Contact Details Address
1 KINC Mineral Technologies
Pvt.Ltd Mr.Viral Parek 0265-2581689
14,Haribhakti Industrial Estate, Dobhoi Road, Vadodra Gujarat
31
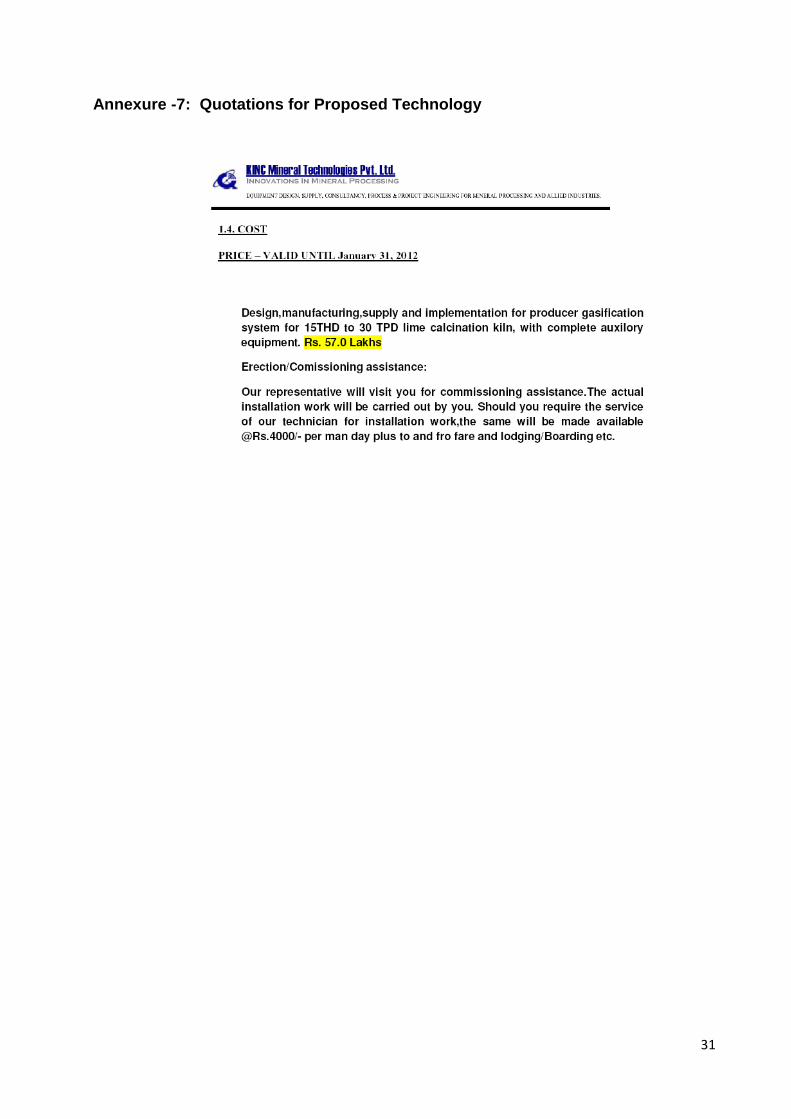
Annexure -7: Quotations for Proposed Technology
32
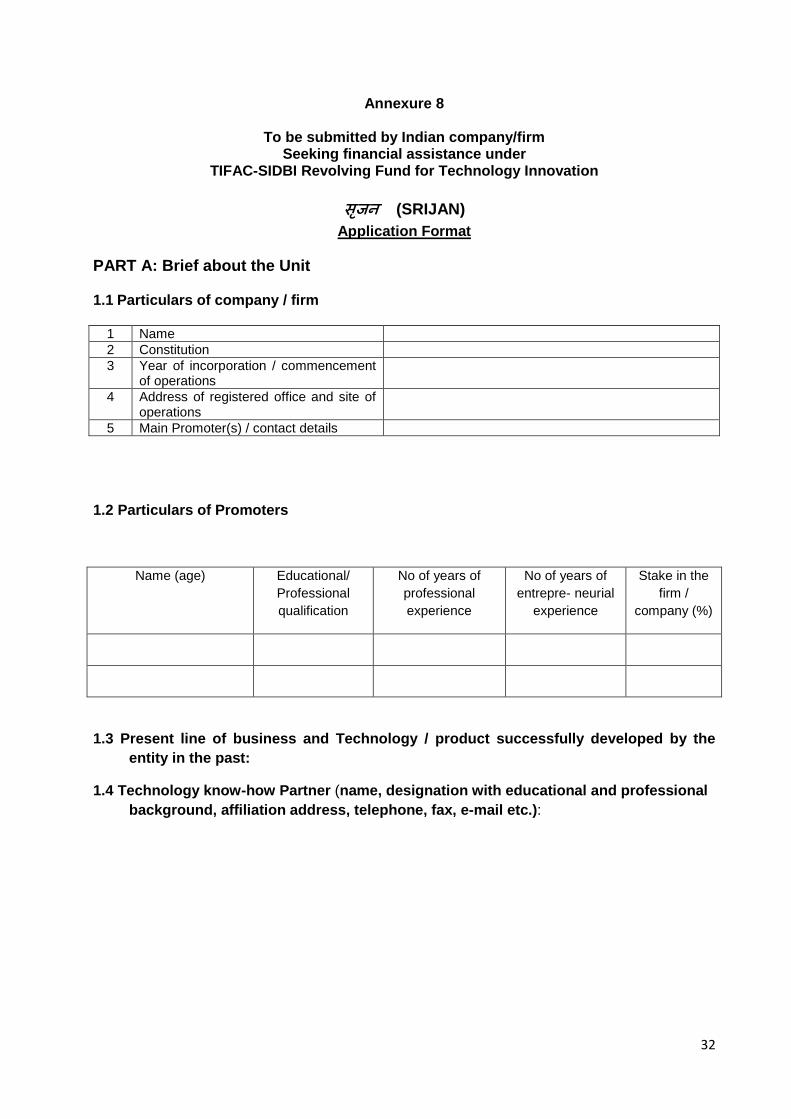
Annexure 8
To be submitted by Indian company/firm Seeking financial assistance under
TIFAC-SIDBI Revolving Fund for Technology Innovation
(SRIJAN)
Application Format
PART A: Brief about the Unit 1.1 Particulars of company / firm
1 Name
2 Constitution
3 Year of incorporation / commencement of operations
4 Address of registered office and site of operations
5 Main Promoter(s) / contact details
1.2 Particulars of Promoters
Name (age) Educational/
Professional
qualification
No of years of
professional
experience
No of years of
entrepre- neurial
experience
Stake in the
firm /
company (%)
1.3 Present line of business and Technology / product successfully developed by the
entity in the past:
1.4 Technology know-how Partner (name, designation with educational and professional
background, affiliation address, telephone, fax, e-mail etc.):
33
PART B: Technical Information
2 Project title:
2.1 Background:
2.2 Project objectives :
2.3 Major Targets :
2.4 Process / Products proposed to be developed under the project along with specifications etc.:
2.5 Technology development/demonstration in Product/Process
Technology development:
(i) Process:
(ii) Product:
2.5.1 Detailed technology description:
2.6 What is the specialty / novelty / uniqueness / innovation about the technology:
2.7 Work already carried out for proof of concept / technology validation:
2.8 Whether the technology has been already patented. If yes, provide the details:
2.9 Process flow-charts / schematic diagram etc.:
2.10 Raw materials and their availability:
2.11 Comparative advantages / disadvantages over the conventional/ emerging technologies and brief comments on competitions / challenges:
34
2.12 Techno-economics, cost benefit analysis and demand statistics in next 2/3 years:
2.13 Environmental Impact, if any:
2.14 Work Plan:
2.14.1 Project Duration (in months):
2.14.2 Time schedule indicating important activities/milestones & duration (bar-chart):
2.15 Deliverables of the project:
2.16 List of existing facilities already available for the proposed project (land, building, machinery, software, manpower, utilities etc.)
35
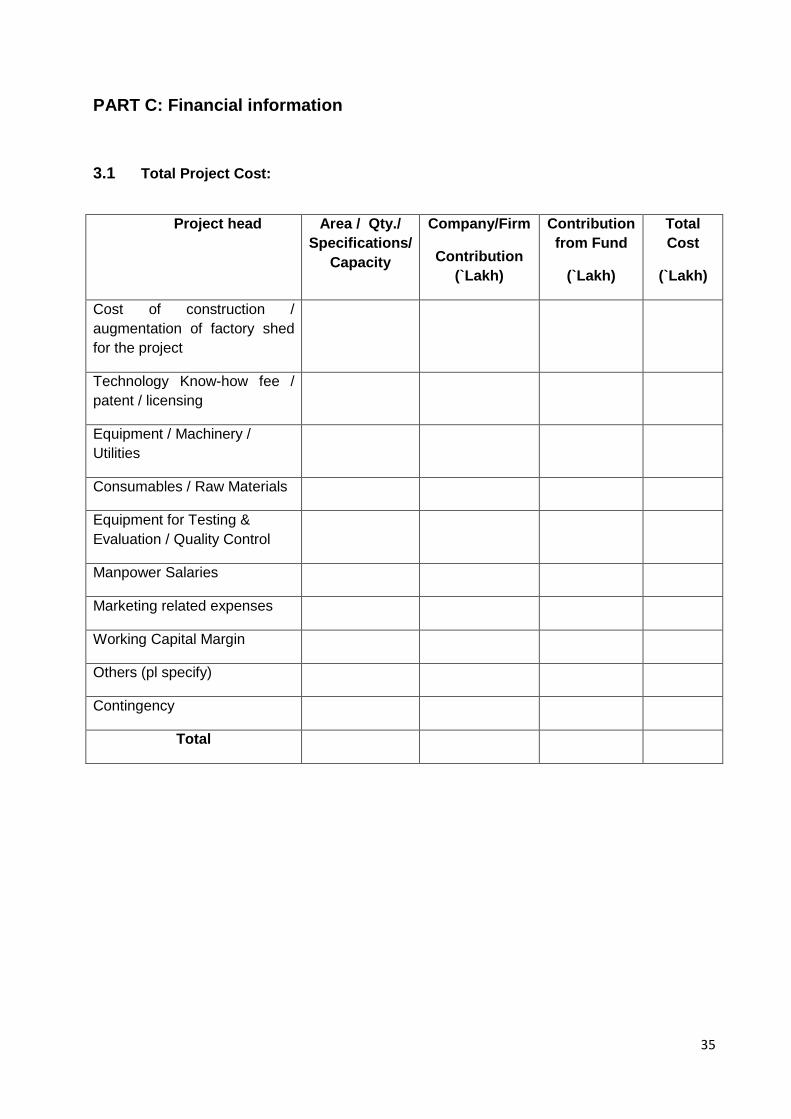
PART C: Financial information
3.1 Total Project Cost:
Project head Area / Qty./
Specifications/
Capacity
Company/Firm
Contribution
(`Lakh)
Contribution
from Fund
(`Lakh)
Total
Cost
(`Lakh)
Cost of construction /
augmentation of factory shed
for the project
Technology Know-how fee /
patent / licensing
Equipment / Machinery /
Utilities
Consumables / Raw Materials
Equipment for Testing &
Evaluation / Quality Control
Manpower Salaries
Marketing related expenses
Working Capital Margin
Others (pl specify)
Contingency
Total

36
3.2 Means of Finance:
Means of finance Amount
(`lakh)
Additional Share capital
Unsecured loans from …..
SIDBI Assistance
Assistance sought from the Fund
Others (pl specify)
Total
3.3 Detailed Break-up of following Heads of Project Cost with equipment details (in tabular form):
3.3.1 Capital Equipment / plants & machinery 3.3.2 Testing & Laboratory Equipment 3.3.3 Manpower Salaries 3.3.4 Consumables/Raw Materials
3.4 What makes the technology different from existing ones and advantage in terms of
business opportunities?
3.5 Whether this proposal has been submitted to any other agency for funding support (if
yes, give details)
37
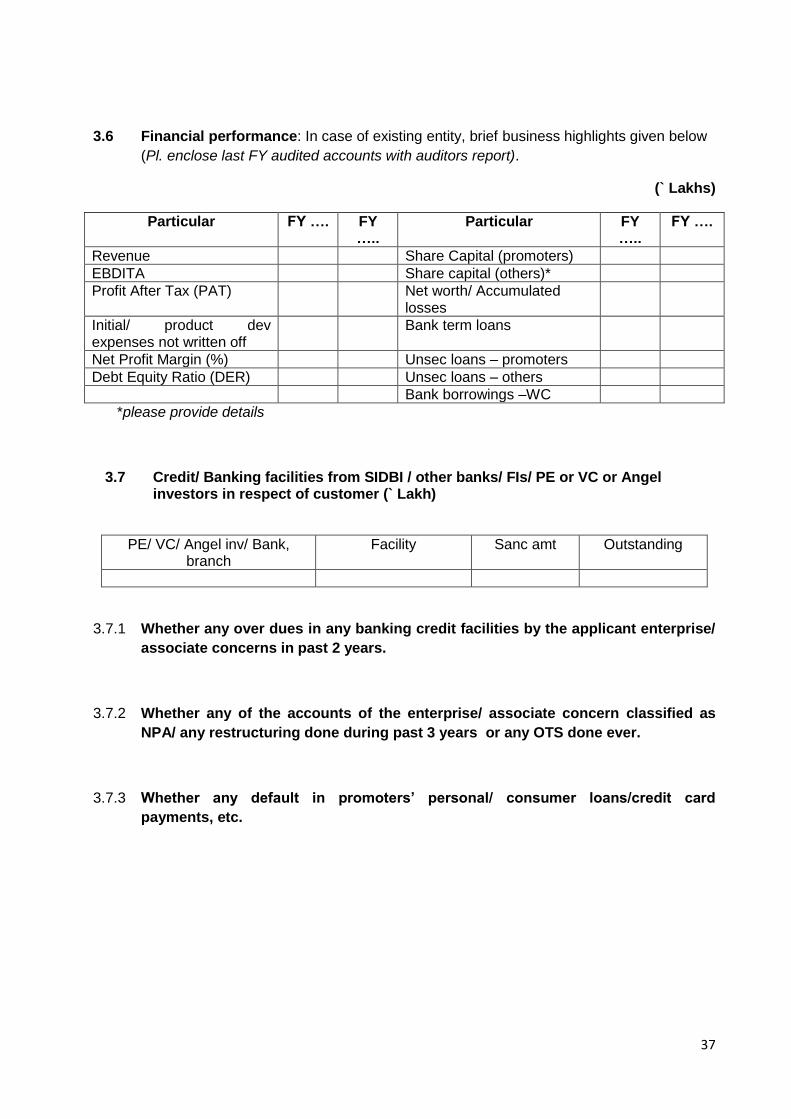
3.6 Financial performance: In case of existing entity, brief business highlights given below
(Pl. enclose last FY audited accounts with auditors report).
(` Lakhs)
Particular FY …. FY …..
Particular FY …..
FY ….
Revenue Share Capital (promoters)
EBDITA Share capital (others)*
Profit After Tax (PAT) Net worth/ Accumulated losses
Initial/ product dev expenses not written off
Bank term loans
Net Profit Margin (%) Unsec loans – promoters
Debt Equity Ratio (DER) Unsec loans – others
Bank borrowings –WC
*please provide details
3.7 Credit/ Banking facilities from SIDBI / other banks/ FIs/ PE or VC or Angel investors in respect of customer (` Lakh)
PE/ VC/ Angel inv/ Bank, branch
Facility Sanc amt Outstanding
3.7.1 Whether any over dues in any banking credit facilities by the applicant enterprise/
associate concerns in past 2 years.
3.7.2 Whether any of the accounts of the enterprise/ associate concern classified as
NPA/ any restructuring done during past 3 years or any OTS done ever.
3.7.3 Whether any default in promoters’ personal/ consumer loans/credit card
payments, etc.
38
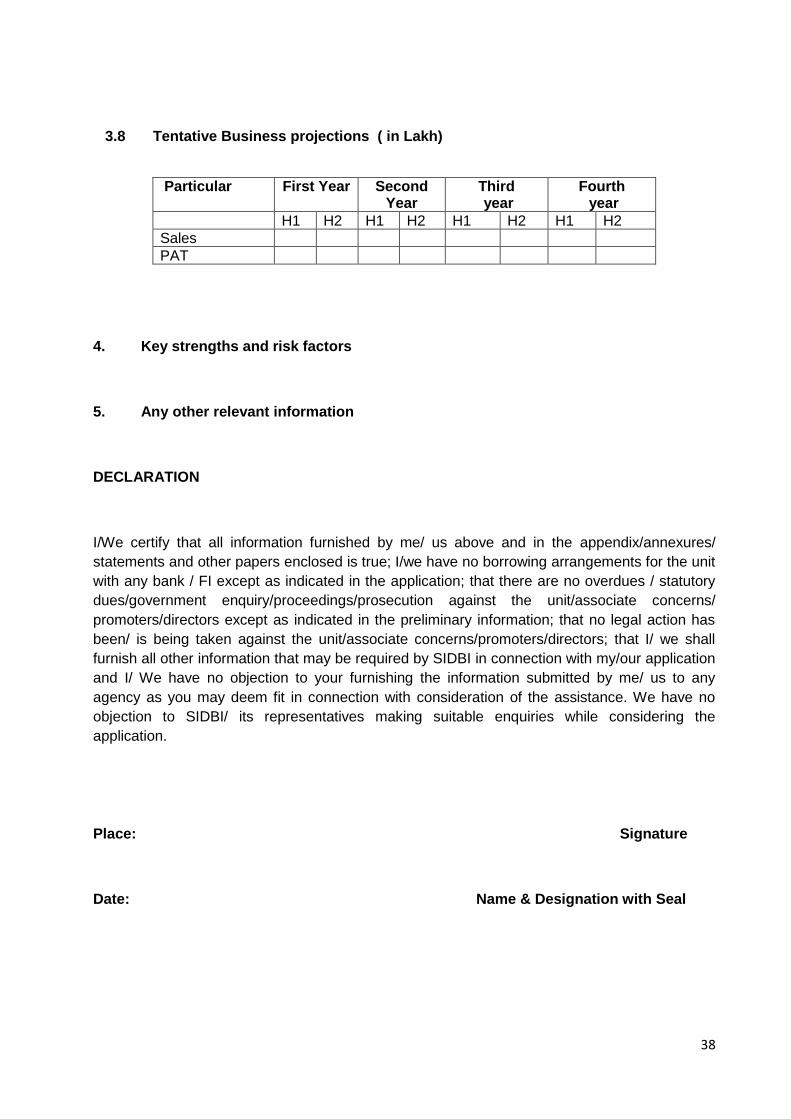
3.8 Tentative Business projections ( in Lakh)
Particular First Year Second Year
Third year
Fourth year
H1 H2 H1 H2 H1 H2 H1 H2
Sales
PAT
4. Key strengths and risk factors
5. Any other relevant information
DECLARATION
I/We certify that all information furnished by me/ us above and in the appendix/annexures/
statements and other papers enclosed is true; I/we have no borrowing arrangements for the unit
with any bank / FI except as indicated in the application; that there are no overdues / statutory
dues/government enquiry/proceedings/prosecution against the unit/associate concerns/
promoters/directors except as indicated in the preliminary information; that no legal action has
been/ is being taken against the unit/associate concerns/promoters/directors; that I/ we shall
furnish all other information that may be required by SIDBI in connection with my/our application
and I/ We have no objection to your furnishing the information submitted by me/ us to any
agency as you may deem fit in connection with consideration of the assistance. We have no
objection to SIDBI/ its representatives making suitable enquiries while considering the
application.
Place: Signature
Date: Name & Designation with Seal
39
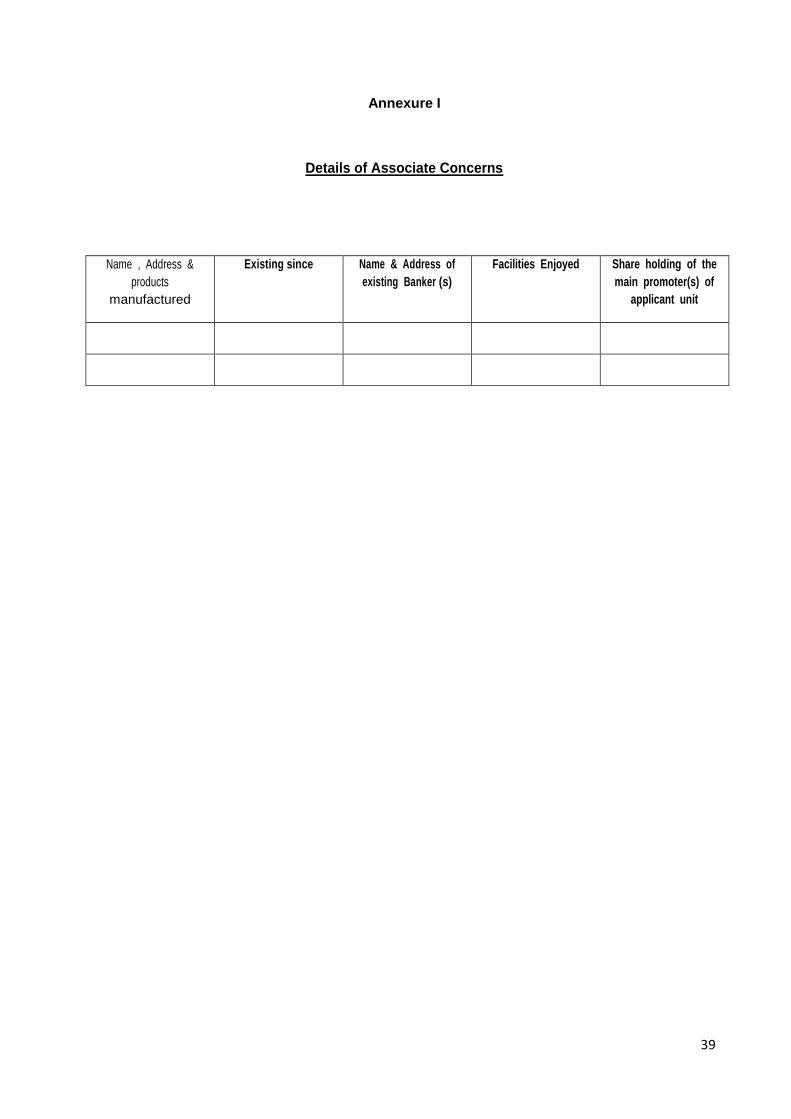
Annexure I
Details of Associate Concerns
Name , Address &
products
manufactured
Existing since Name & Address of
existing Banker (s)
Facilities Enjoyed Share holding of the
main promoter(s) of
applicant unit

40
Annexure II
Particulars of machinery proposed for the project
Name of
machinery,
(model /
specification)
Name of
manufacturer,
contact person,
e-mail address
telephone no
Lead time for
delivery Of
machinery
Invoice price
(for Indigenous
machinery) /
CIF price (for
imported) (Rs.
lakh)
Purpose /use
of machine.
Basis of selection
of supplier
Remark s
reg. After
Sale Service
etc.
Producer
gas based
gasifier
system
Attached
Doc.
2 Month 57.0 To Improve
energy
Efficiency
Techno-
commercial
competitiveness.
Annexure III
Details of Misc. Assets / equipment Proposed
S.No. Name of item Supplier Cost (Rs. lakh) Purpose/ use of
MFA
Remarks
41
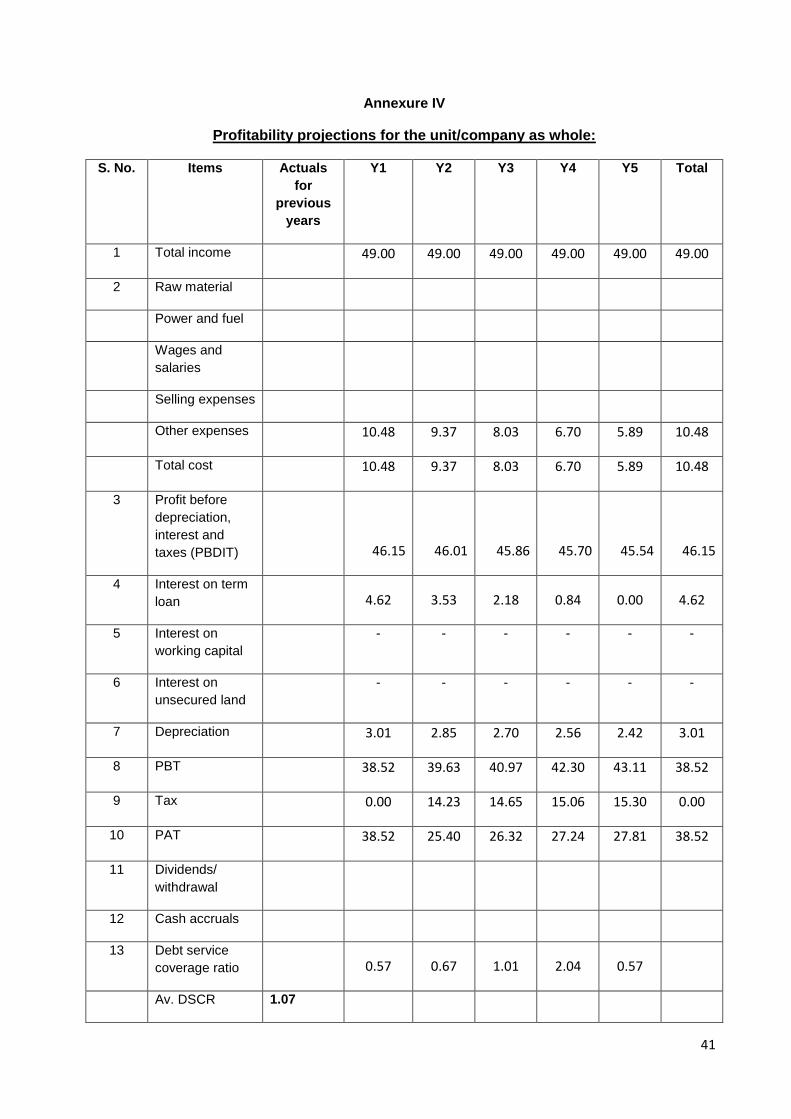
Annexure IV
Profitability projections for the unit/company as whole:
S. No. Items Actuals
for
previous
years
Y1 Y2 Y3 Y4 Y5 Total
1 Total income 49.00 49.00 49.00 49.00 49.00 49.00
2 Raw material
Power and fuel
Wages and
salaries
Selling expenses
Other expenses 10.48 9.37 8.03 6.70 5.89 10.48
Total cost 10.48 9.37 8.03 6.70 5.89 10.48
3 Profit before
depreciation,
interest and
taxes (PBDIT)
46.15 46.01 45.86 45.70 45.54 46.15
4 Interest on term
loan
4.62 3.53 2.18 0.84 0.00 4.62
5 Interest on
working capital
- - - - - -
6 Interest on
unsecured land
- - - - - -
7 Depreciation 3.01 2.85 2.70 2.56 2.42 3.01
8 PBT 38.52 39.63 40.97 42.30 43.11 38.52
9 Tax 0.00 14.23 14.65 15.06 15.30 0.00
10 PAT 38.52 25.40 26.32 27.24 27.81 38.52
11 Dividends/
withdrawal
12 Cash accruals
13 Debt service
coverage ratio
0.57 0.67 1.01 2.04 0.57
Av. DSCR 1.07
42
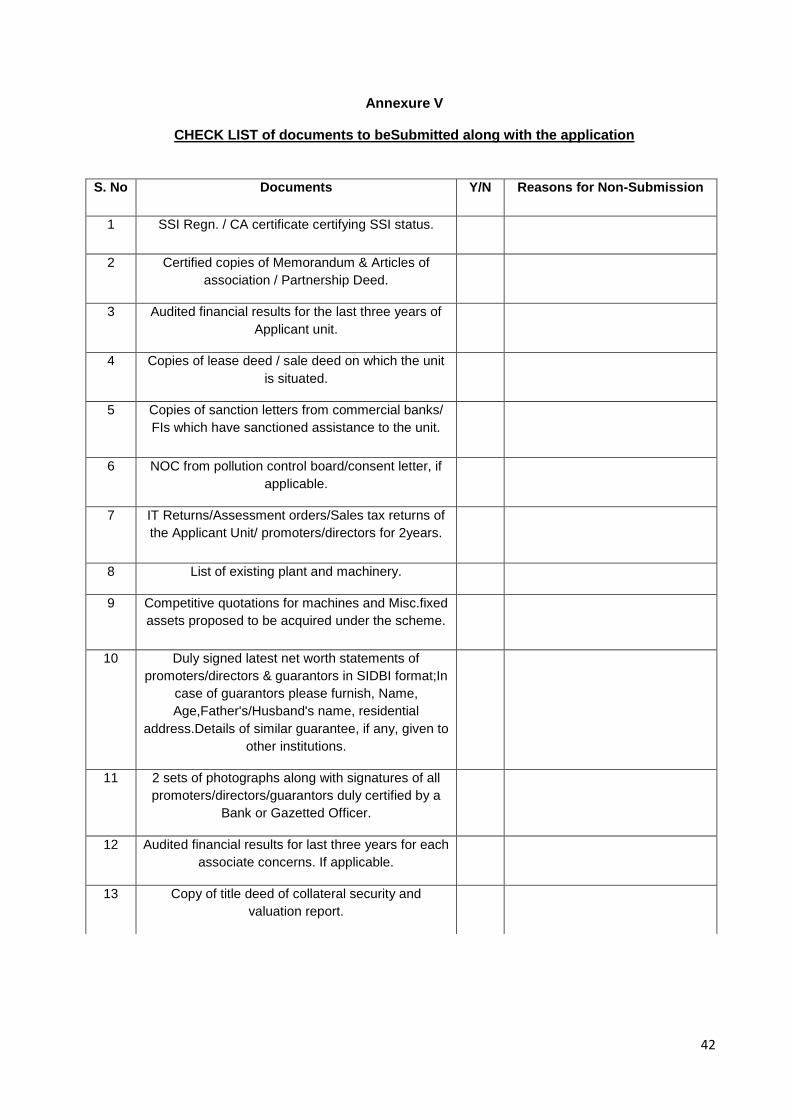
Annexure V
CHECK LIST of documents to beSubmitted along with the application
S. No Documents Y/N Reasons for Non-Submission
1 SSI Regn. / CA certificate certifying SSI status.
2 Certified copies of Memorandum & Articles of
association / Partnership Deed.
3 Audited financial results for the last three years of
Applicant unit.
4 Copies of lease deed / sale deed on which the unit
is situated.
5 Copies of sanction letters from commercial banks/
FIs which have sanctioned assistance to the unit.
6 NOC from pollution control board/consent letter, if
applicable.
7 IT Returns/Assessment orders/Sales tax returns of
the Applicant Unit/ promoters/directors for 2years.
8 List of existing plant and machinery.
9 Competitive quotations for machines and Misc.fixed
assets proposed to be acquired under the scheme.
10 Duly signed latest net worth statements of
promoters/directors & guarantors in SIDBI format;In
case of guarantors please furnish, Name,
Age,Father's/Husband's name, residential
address.Details of similar guarantee, if any, given to
other institutions.
11 2 sets of photographs along with signatures of all
promoters/directors/guarantors duly certified by a
Bank or Gazetted Officer.
12 Audited financial results for last three years for each
associate concerns. If applicable.
13 Copy of title deed of collateral security and
valuation report.
43
Bureau of Energy Efficiency (BEE)
(Ministry of Power, Government of India)
4th Floor, Sewa Bhawan, R. K. Puram, New Delhi – 110066
Ph.: +91 – 11 – 26179699 (5 Lines), Fax: +91 – 11 – 26178352
Websites: www.bee-india.nic.in, www.energymanagertraining.com India SME Technology Services Ltd
DFC Building, Plot No.37-38,
D-Block, Pankha Road,
Institutional Area, Janakpuri, New Delhi-110058
Tel: +91-11-28525534, Fax: +91-11-28525535
Website: www.techsmall.com
Confederation of Indian Industry
CII – AVANTHA Centre for Competitiveness
Block No.3, Dakshin Marg
Sector 31-A, Chandigarh - 160030
Tel: 0172-5080784 (D) / 2666517-19
Fax: 0172-2606259 / 2614974
E-mail: [email protected]
Website: www.ciicfc.org
44
Bureau of Energy Efficiency (BEE) (Ministry of Power, Government of India) 4th Floor, Sewa Bhawan, R. K. Puram, New Delhi – 110066 Ph.: +91 – 11 – 26179699 (5 Lines), Fax: +91 – 11 – 26178352 Websites: www.bee-india.nic.in, www.energymanagertraining.com
SEE-Tech Solutions Pvt. Ltd India SME Technology Services Ltd
11/5, MIDC, Infotech Park,
DFC Building, Plot No.37-38,
Near VRCE Telephone Exchange,
D-Block, Pankha Road,
South Ambazari Road,
Institutional Area, Janakpuri, New Delhi-110058
Nagpur – 440022
Tel: +91-11-28525534, Fax: +91-11-28525535
Website: www.letsconserve.org
Website: www.techsmall.com
PDF to Word