Embed Size (px)
Citation preview
Page i
Business Process Review Methodology Bureau for Management
June 2019
Page ii
Table of Contents Scope and Disclaimer 1
Introduction: Business Process Review Methodology 1
How to Choose BPR Topics 2
Key Factors for BPR Success 3
Note on Planning for Implementation, Performance Management, and Sustainability 3
BPR Major Process Steps of the Diagnosis and Optimization Phases 4
BPR Timeline 5
Prepare for BPR 5
A. Informal Kick-Off and Fostering Buy-In 5
B. Scope of Work and Performance Metrics 6
C. Determine Research Questions: Grounded Theory 7
D. Identify Data Needs and Methodological Tools 8
E. File Structure 10
F. Timeline, Work Plan, and Communications 10
G. Data Sources and Subject Matter Experts from Partners 10
H. Formal Launch of BPR 11
Conduct Desk Review 11
A. Bibliography of Sources 11
B. Glossary 12
C. Benchmarks and Best Practices 12
D. Protocols for Gathering Data from People 13
Document and Validate As-Is Processes 14
A. Interviewing and Interview Notes 14
B. As-Is Process Map 15
C. Customer Experience Map 15
Conduct Synthesis and Analysis 16
A. To-Be Process Map 16
B. Other Survey, Graphing, or Analytic Product 16
C. Synthesis of Key Findings 16
Draft Reports 17
A. Draft the Report 17
B. Peer Review 17
Page iii
C. Finalize Draft Report 18
Issue Report and Present at Management Operations Council 18
A. Create MOC Presentation Within Six Week Timeframe 18
B. Gather Stakeholder Feedback 18
C. Respond to Feedback, Receive Management Response, and Internally Publish Final BPR Report 19
D. Deliver Presentation to the MOC 19
Wrap-Up 20
A. Executive Sponsor Clearance and Externally Post BPR Report 20
B. After-Action Review 20
C. Communications of Findings 20
D. Implementation, Performance Management, and Sustainability Actions 21
Annex A: Scope of Work Template A - 1
Annex B: Resource and Estimator Tools from M/CIO B - 1
Annex C: BPR Timeline C - 1
Annex D: Business Process Mapping Methodology D - 1
Annex E: Customer Experience Mapping Methodology E - 1
Annex F: Mixed Methods, Coding, Interviews, Surveys and Questionnaires Methodology Mixed Methods Approach F - 1
Annex G: Protocol Guide for Interview, Focus Group, and Case Study G - 1
Annex H: Types of Business Analysis H - 1
Annex I: Business Process Review Work Plan Template I - 1
Annex J: Business Process Review Fact Sheet Template J - 1
Annex K: Business Process Review Report Template K - 1
Page 1
Scope and Disclaimer The Bureau for Management (M Bureau) wrote this Business Process Review Methodology for use by its staff, to review enterprise-wide business processes and functions. If using this methodology for review of smaller scale topics or by staff outside the Bureau for Management, the user must adapt the methodology appropriately by making case-specific decisions, paying particular attention to aspects such as: defining study scope and length, building partnership, tracking recommendations, and reporting to the Management Operations Council (MOC). While Business Process Reviews (BPRs) and Business Function Reviews (BFRs) have distinct needs, the methodological approach for both at USAID is similar. This paper will only use the term BPR but the approaches covered apply to both BPRs and BFRs. Details on roles and responsibilities among M Bureau and stakeholder Bureaus and Independent Offices (B/IOs) are listed in the “BPR Scope of Work (SOW)” (See Annex A). Roles and responsibilities among the BPR Team are detailed in the course of the BPR methodology that follows. Introduction: Business Process Review Methodology The purpose of this paper is to provide a high-level overview of USAID’s BPR methodology, associated tools, and how to use these to conduct a BPR. At USAID, a BPR is a systematic approach to improving processes using action research methods to more effectively and efficiently achieve results. The USAID approach for business process improvement consists of four phases:
● Diagnosis—Identify stakeholder needs, determine whether a BPR is the correct approach, review end-to-end processes, and seek inefficient or ineffective practices;
● Optimization—Make recommendations for process, structure, policy, technology, and/or staff skills and training changes to achieve desired outcomes based on empirical evidence about performance;
● Implementation—Act on opportunities to improve current processes and ensure they are standardized and socialized; and
● Assessment—Monitor progress ensuring transparency and sustainability, and use data to inform continuing process improvement iterations and broader institutional reforms.
BPR focuses on the diagnosis and optimization phases of process improvement, but with an eye to future implementation and assessment. Through BPR teams identify ways to eliminate waste – such as unnecessary handoffs, rework, and delays – that slow down and complicate processes. BPR goes beyond identification of issues and lays out recommendations for how to implement improvements and measure both progress and performance excellence after the BPR concludes.
Page 2
BPRs can drive dramatic improvements in services. However, despite best intentions, it is all too easy to go back to the way things were before. This BPR methodology will help BPR Analysts think proactively about the implementation phase and provides step-by-step guidance and tools to make sure the Agency realizes potential gains from the BPR effort. How to Choose BPR Topics USAID employs both a top-down and bottom-up model for identifying topics for BPR. The top-down component is based on organization-level concerns and relies on input from senior officials employing a strategy-driven process selection so BPRs support improvements aligned to the strategic direction the Agency is taking such as agency priorities, reorganizations, new initiatives, or other organizational changes. A strategy-driven approach also reacts to the USAID environment, such as new challenges, regulatory requirements, and budget or workload changes. USAID uses the MOC as a key venue for soliciting input from across all constituent B/IOs about issues to address from a strategy-driven perspective. The bottom-up component relies on a pain-driven approach to process selection taking input from across all levels of the Agency but especially from internal customers and front-line staff. In this scenario, customers and operations staff identify pain points and elevate them for consideration of whether a BPR is an appropriate response. USAID employs the annual Customer Service Survey as one venue for gathering direct input from customers about pain points where improvement could directly improve their ability to deliver foreign assistance and pursue the Agency’s development mission of empowering countries on their Journey to Self-Reliance. Metrics on process efficiency and effectiveness also inform what topics might benefit from BPR. However, four factors should drive decision-making about what topics to choose for a BPR:
● value to USAID, ● effort required, ● commitment to implementation, and ● probability of success.
BPRs should not be undertaken lightly as BPRs and subsequent implementation require significant time, effort, and change management. The balance of the three factors above serve as the Agency’s guide for determining go or no-go status for any topic being considered for BPR.
Cost-benefit and cost-savings analysis are beyond the scope of this BPR methodology. However, resources are available for those interested, including courses available through USAID University and resources and estimator tools available from M/CIO (See Annex B). This M/CIO Productivity and Efficiency Estimator tool is particularly suited to estimating potential cost savings and cost avoidance of BPR projects and benchmarking estimates against actual savings post-implementation. This methodology recommends using the tools above or similar approaches to track the impact of implementation.
Cost-Benefit and Cost-Savings Analysis
Page 3
Key Factors for BPR Success BPRs have many components and vary by topic, audience, purpose, and over time. However, a few key factors commonly distinguish more successful efforts from others:
● Determining a clear vision; ● Targeting processes where improvement will create a significant benefit for the Agency; ● Gaining commitment from the relevant operating unit’s top leadership and the
management team sand front-line staff of the targeted process or function, including a clearly identified Process Champion1 who will champion both the assessment and subsequent implementation of recommendations;
● Identifying a clear scope of work for specific targeted processes or functions; ● Communicating to affected staff and associated stakeholders the rationale and need for
business process review and the importance of their cooperation and participation; ● Integrating both customers and implementing staff perspectives; ● Planning analysis adequately before starting; ● Choosing a BPR Team with knowledge of reengineering techniques; ● Planning ahead for change management with a focus on recommendations that are both
impactful, feasible for implementation, and will improve felt experience; and ● Developing overarching performance metrics to track change and enable continuous
improvement, impact, and sustainability moving forward. A common mistake is to jump right into collecting and analyzing data or even formulating solutions. Planning a methodological process and adapting relevant tools to the needs of the study BEFORE collecting data is vitally important. Strong planning of methodology and process help lead to a well-designed study, solid data collection that informs the research questions, and ultimately making a well-documented and defended case to improve business processes and functions. The best process improvement methodologies are ones that are tailored to the end goal. Take time to really think out what the Agency wants to achieve in the study, what data is needed, and available data sources. It will save time and maximize effectiveness in the analytic phase. Note on Planning for Implementation, Performance Management, and Sustainability The importance and value of stakeholder buy-in and input to all parts of the BPR process cannot be stressed enough. Several aspects of the BPR methodology presented here seek to engage stakeholders in various ways throughout key stages of the BPR process. Implementing and leveraging these practices, particularly increased use of a Process Champion, Subject Matter Experts (SMEs), and predetermined check-ins, will enable better analysis, implementation, and results. This methodology recommends a check-in meeting with Subject Matter Experts (SMEs)
1 See Annex A for details on all roles and responsibilities.
Avoid Pitfalls: Planning
Page 4
at the end of each of the BPR Major Process Steps identified below. The BPR Team should also leverage stakeholder engagement to better tailor recommendations and overarching performance metrics for the implementation and assessment phases. Performance metrics should align to both B/IO input and key drivers of performance found during the diagnosis phase. For purposes of enhancing impact and ensuring sustainability, this BPR methodology and the accompanying SOW template allow for a BPR Analyst to support stakeholder B/IOs during implementation. Such support can last for up to six months post-BPR at approximately 10-25 percent level of effort. This role can include:
● supporting strategy and action plan development for implementing recommendations; ● providing technical guidance, outreach, and training; ● supporting monitoring and measurement of key performance indicators to compare
process performance to targets and determine BPR impact; ● developing countermeasures to address any issues found during implementation; and ● further sharing and standardizing successful practices.
In past experience, lack of timely acceptance of recommendations, timely action on the recommendations, and formal closure of implementation were relative weaknesses of BPRs at USAID. This methodology and SOW template now give implementing stakeholders of enterprise-wide processes and functions a period of up to two weeks from issuance of the draft report to formally accept recommendations and provide a Management Response indicating whether they accept each recommendation - see the Report Template. Next, the implementing B/IO must provide a first report back on implementation to the MOC aligned to the MOC calendar and then every six months afterwards. The exact timing will vary as to when a BPR concludes and when the recurring six month status check-ins happen based on when a BPR concludes and when the initial MOC report back occurs based on the MOC schedule, but after that all others will occur in six month intervals. In general, the participating B/IOs can think of having two weeks to formally accept recommendations. Implementing B/IOs can request optional technical assistance for six months from a member of the BPR Analyst Team, after which time the M Bureau only provides coordination of reporting back to the MOC of implementing B/IOs implementation tracking for enterprise-wide BPRs every six months. At the end of two years, a final report back will officially close the externally MOC tracked implementation phase and the implementing B/IOs must update on progress thus far, plan for implementing remaining items, identify performance metrics for continuous monitoring, and plan for engaging collaborating partners. The final check-in at MOC can consist partly of reporting back and partly celebrating successes of implementation and impact via partnership around the Agency. BPR Major Process Steps of the Diagnosis and Optimization Phases BPR Major Process Steps identified in the SOW and detailed in this methodology include:
● Prepare for BPR ● Conduct Desk Review ● Document and Validate Processes
Page 5
● Conduct Synthesis and Analysis ● Draft Report ● Issue Report and Present to MOC ● Wrap-Up
BPR Timeline Refer to Annex C, the “BPR Timeline”, for details on Major Process Steps’ durations. Prepare for BPR The purpose of the “Prepare for BPR” stage is to develop review scope and parameters, foster stakeholder buy-in, conduct stakeholder analysis through initial meetings and key informant interviews, and select methodology tools. Key deliverables include:
● Informal Kick-Off and Foster Buy-In ● SOW ● Research Questions ● Data Needs and Methodological Tools ● File Structure ● Timeline, Work Plan, and Fact Sheet ● Data Sources and Subject Matter Experts from Partners ● Formal Launch of BPR
A. Informal Kick-Off and Fostering Buy-In Given the resource demands of doing a BPR, especially time demands, leadership should not officially launch a BPR until a clear SOW, provision of data sources, and stakeholder buy-in reach completion or at least a critical level. To achieve this standard for official launch, the BPR Team must schedule an informal kick-off and subsequent meetings with participating B/IOs. The meetings between M Bureau and leadership from stakeholder B/IOs must discuss the review scope and parameters and planning for the BPR. While Analyst roles in facilitating this early engagement, scoping, and relationship building are important, M Bureau senior leadership, and the Team Leader in particular, must engage with stakeholder B/IO leadership to navigate this phase successfully. The informal kick-off should set a broad scope and parameters for the BPR. Partner B/IO leadership should commit to making their staff, systems, processes, and data available for the BPR Team. Partner B/IOs should also identify a Process Champion that will serve as the main POC for the BPR Team and subsequently take point on implementing change in line with the BPR recommendations. Analysts should update the “BPR SOW Template”, share it with all partners at the kick-off, and solicit feedback to foster buy-in and trust. After the kick-off meeting, the BPR Team must coordinate with the Process Champion to consistently engage the operational staff of the partner B/IOs. This entails a series of subsequent meetings to finalize the BPR SOW, identify additional subject matter experts (SMEs) and their
Page 6
roles, and schedule a series of check-in meetings with Executive Sponsors and senior B/IO leadership approximately every four weeks aligned to the end of each BPR phase.2 The Executive Sponsor from the M Bureau will typically be the Performance Improvement Officer (PIO) or the Assistant Administrator (AA/M), as appropriate, and stakeholder B/IOs should designate their Executive Sponsors at a similar level. These meetings will also serve for scheduling interviews with operations staff, planning initial gathering and sharing of process data with the BPR Team, and giving the BPR Team access to relevant systems, policies, and Standard Operations Procedures (SOPs).
B. Scope of Work and Performance Metrics The BPR Team will document scope, parameters, key metrics to track progress and document improvement against, provision of resources by both M Bureau and the stakeholder B/IOs, and expected timeframe in the SOW. Use the “BPR SOW Template” (See Annex A) provided as a reference. In addition to a descriptive statement of scope and parameters, the BPR Team should coordinate with the Process Champion(s) and the Executive Sponsors to identify performance metrics that identify in what areas the BPR Team should seek improvement in the process or function under study. Performance metrics can and typically should include both efficiency (for example, actions per unit of time) and effectiveness (for example, customer satisfaction, error rate) metrics. The metrics give pointed focus to the areas where leadership seeks improvement and gives concrete ways to measure post-BPR how much impact is achieved. Once the metrics are identified, baseline data gathering can begin as outlined below in subsection G: “Data Sources and Subject Matter Experts from Partners.” B/IO key resources to document in the SOW include:
● Process Champion for assessment and implementation, ● SMEs, ● Planning, and commitment to make their staff available to contribute to focus groups,
surveys, interviews, or other data gathering efforts, and ● Provision of data sources, benchmarking opportunities, key documents, policies, guides
and SOPs for desk review. In addition to meetings, the BPR Team may need to conduct stakeholder analysis via key informant interviews with senior and operational leadership from the stakeholder B/IOs to determine key issues, foster buy-in, and determine key data sets to explore further. The BPR Team should conduct these interviews with a clear eye to gathering resources and leads to pursue during the Desk Review phase.
2 Check-ins with senior B/IO leadership and executive sponsors on a schedule of every 4 weeks assumes a 20-week BPR schedule. If the anticipated BPR length is longer or shorter, the BPR team must adjust the scheduled periodicity of check-ins accordingly.
Page 7
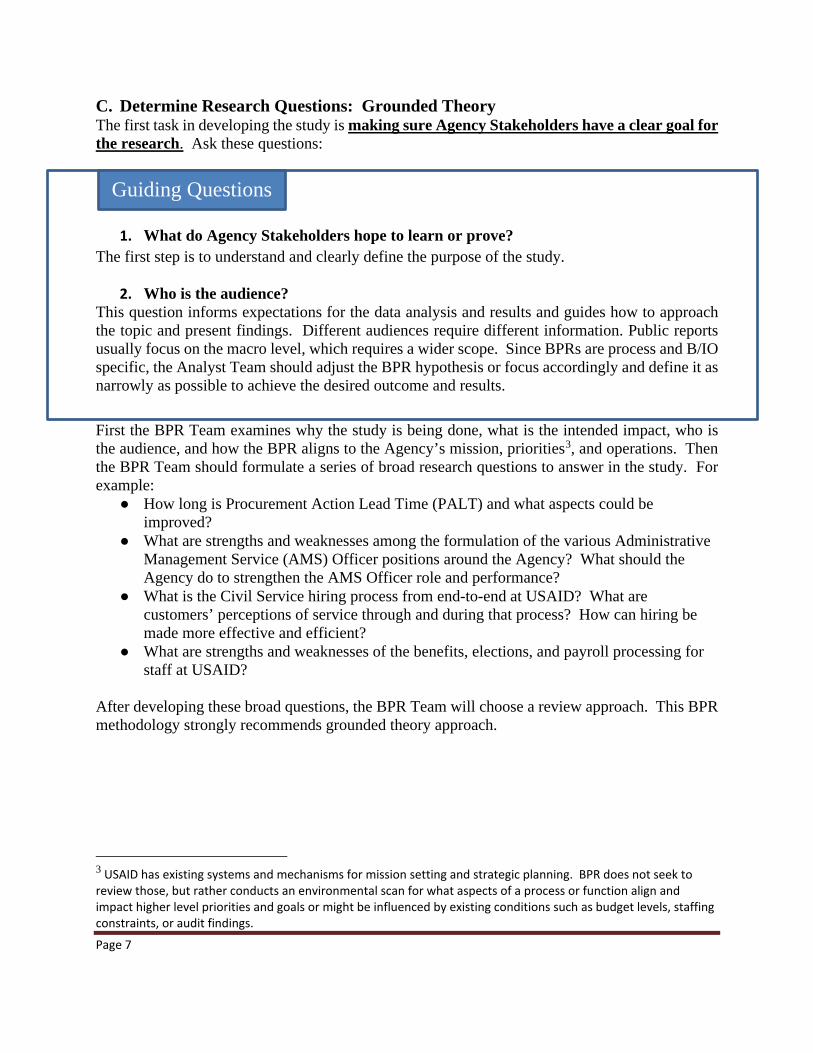
C. Determine Research Questions: Grounded Theory The first task in developing the study is making sure Agency Stakeholders have a clear goal for the research. Ask these questions:
1. What do Agency Stakeholders hope to learn or prove? The first step is to understand and clearly define the purpose of the study.
2. Who is the audience? This question informs expectations for the data analysis and results and guides how to approach the topic and present findings. Different audiences require different information. Public reports usually focus on the macro level, which requires a wider scope. Since BPRs are process and B/IO specific, the Analyst Team should adjust the BPR hypothesis or focus accordingly and define it as narrowly as possible to achieve the desired outcome and results. First the BPR Team examines why the study is being done, what is the intended impact, who is the audience, and how the BPR aligns to the Agency’s mission, priorities3, and operations. Then the BPR Team should formulate a series of broad research questions to answer in the study. For example:
● How long is Procurement Action Lead Time (PALT) and what aspects could be improved?
● What are strengths and weaknesses among the formulation of the various Administrative Management Service (AMS) Officer positions around the Agency? What should the Agency do to strengthen the AMS Officer role and performance?
● What is the Civil Service hiring process from end-to-end at USAID? What are customers’ perceptions of service through and during that process? How can hiring be made more effective and efficient?
● What are strengths and weaknesses of the benefits, elections, and payroll processing for staff at USAID?
After developing these broad questions, the BPR Team will choose a review approach. This BPR methodology strongly recommends grounded theory approach.
3 USAID has existing systems and mechanisms for mission setting and strategic planning. BPR does not seek to review those, but rather conducts an environmental scan for what aspects of a process or function align and impact higher level priorities and goals or might be influenced by existing conditions such as budget levels, staffing constraints, or audit findings.
Guiding Questions
Page 8
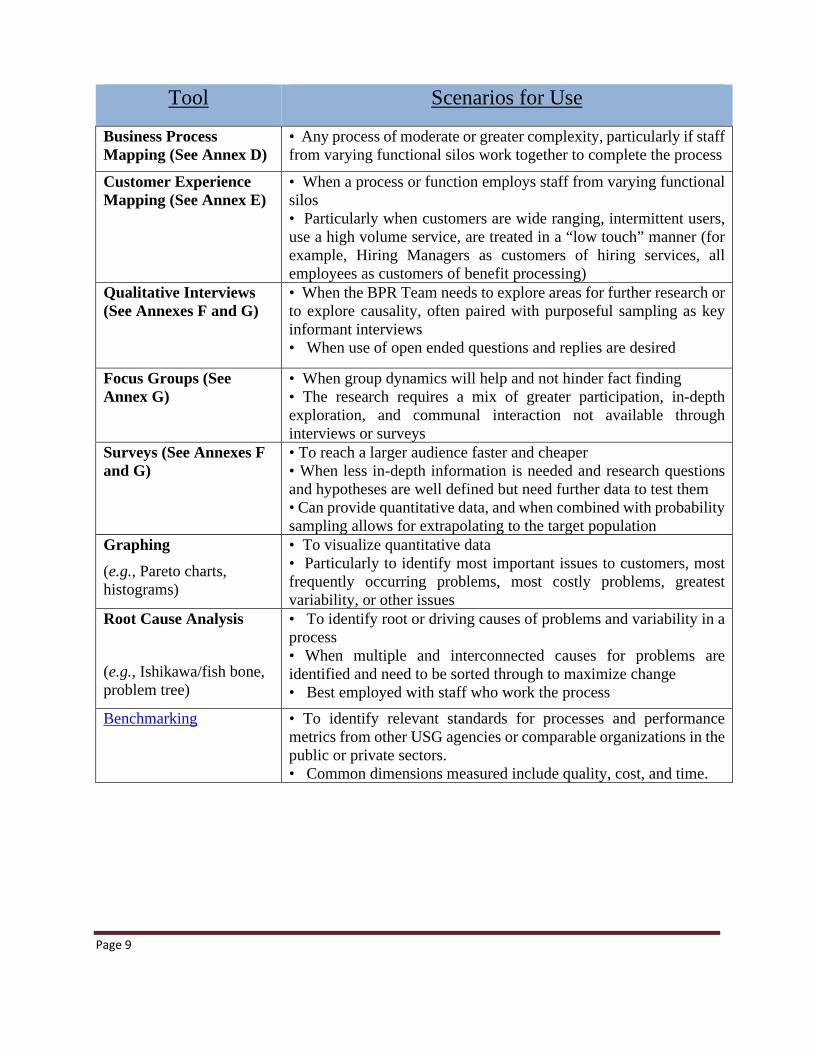
If the BPR Team has enough information already on a subject or know suitable sources exist, it can undertake an approach called hypothesis testing.4 However, formulating a hypothesis in the beginning stage will not be possible or appropriate for all studies. Most enterprise-wide BPRs at USAID have used grounded theory approach instead and it is the focus of this methodology and described in detail below. When there is limited understanding of the issues, minimal research or data on the issues, or multiple stakeholders and components to consider, the BPR Team will want to employ an inductive method based on grounded theory5 which utilizes data collection and analysis to explore hypotheses or phenomena as informed by the research. As the BPR Team collects data, it will identify common themes and topics, group those findings, and produce findings and theories. The BPR Team can apply this approach in an iterative manner, so initial data collection or qualitative interviews can help to develop further research questions to study.6 USAID has employed grounded theory successfully for a number of BPRs since 2011. D. Identify Data Needs and Methodological Tools Once the BPR Team has defined the goals of the research, identified issues to explore and related study questions, and selected a study method - hypothesis testing or grounded theory - it will need to examine what kind of data to collect to achieve the purpose of the study and what methodological tools to employ. There are many different methods to collect data. In general, research goals and study questions should drive design. The BPR Team should review the associated resources on various methodological tools to explore each in more detail. Below is a summary of methodological tools, selected based on use and applicability to other BPRs conducted at USAID since 2011, and links on each tool’s name provide more detail:
4 United States General Accounting Office. June 1991. Using Structural Interviewing Techniques. 5 Trochim, William M.K. “Qualitative Measures”. Research Methods Knowledge Base. http://www.socialresearchmethods.net/kb/qual.php 6 Ambert, Anne Marie, Patricia Alder, Peter Alder and Daniel Detzner. November 1995. “Understanding and Evaluating Qualitative Research.” Journal of Marriage and Family; 57.
Page 9
Tool Scenarios for Use
Business Process Mapping (See Annex D)
• Any process of moderate or greater complexity, particularly if staff from varying functional silos work together to complete the process
Customer Experience Mapping (See Annex E)
• When a process or function employs staff from varying functional silos • Particularly when customers are wide ranging, intermittent users, use a high volume service, are treated in a “low touch” manner (for example, Hiring Managers as customers of hiring services, all employees as customers of benefit processing)
Qualitative Interviews (See Annexes F and G)
• When the BPR Team needs to explore areas for further research or to explore causality, often paired with purposeful sampling as key informant interviews • When use of open ended questions and replies are desired
Focus Groups (See Annex G)
• When group dynamics will help and not hinder fact finding • The research requires a mix of greater participation, in-depth exploration, and communal interaction not available through interviews or surveys
Surveys (See Annexes F and G)
• To reach a larger audience faster and cheaper • When less in-depth information is needed and research questions and hypotheses are well defined but need further data to test them • Can provide quantitative data, and when combined with probability sampling allows for extrapolating to the target population
Graphing (e.g., Pareto charts, histograms)
• To visualize quantitative data • Particularly to identify most important issues to customers, most frequently occurring problems, most costly problems, greatest variability, or other issues
Root Cause Analysis (e.g., Ishikawa/fish bone, problem tree)
• To identify root or driving causes of problems and variability in a process • When multiple and interconnected causes for problems are identified and need to be sorted through to maximize change • Best employed with staff who work the process
Benchmarking • To identify relevant standards for processes and performance metrics from other USG agencies or comparable organizations in the public or private sectors. • Common dimensions measured include quality, cost, and time.
Page 10
E. File Structure File structure for the BPR should follow the BPR Major Process Steps. Consideration must be given to the team nature of the work, the need to ensure access for leadership, and the flexibility to share with stakeholders. Past BPRs have found success using the MyUSAID Workspaces7 due to its collaboration functions and file structure. F. Timeline, Work Plan, and Communications The BPR Team should start this substep by taking the BPR Timeline template (See Annex C) and updating it for the specific BPR and dates. Then create a Work Plan for the BPR as an extension of the Timeline and BPR Major Process Steps. The Work Plan must take the BPR Major Process Steps, methodological tools selected, and key deliverables and define what BPR Team members are responsible for them and in what timeframe. Unlike the Timeline and SOW which are explicitly for sharing with stakeholders, the Work Plan is an internal M Bureau and BPR Team document for managing workflow, team assignments, and deliverables. While there is some flexibility to adjust timelines, the Work Plan ensures prerequisite activities happen in time to meet deliverable deadlines. Refer to the “BPR Work Plan” template (See Annex I) and update it per the “Methodology” section of the “BPR SOW” (See Annex A) and the Timeline to create a Work Plan for the BPR Team to track progress against. Finally, the BPR Team should consider and develop communication tools tailored to the BPR audience of stakeholders and participants. The BPR Team should develop a BPR Fact Sheet to communicate to staff the BPR’s purpose, scope, methodology, timeline, and the value of staff contributions to the effort. The BPR Team should develop this document with input and contributions from stakeholder SMEs. A “BPR Fact Sheet” template (See Annex J) is provided and the BPR Team can create other documents as needed. G. Data Sources and Subject Matter Experts from Partners Already discussed in part earlier and detailed in the BPR SOW and Timeline, partner B/IOs must provide existing data sources to the BPR Team before the official start of the BPR. Data sources could include systems or manual process data, business process maps, key documents, baseline data for performance metrics, policies, guides, and SOPs for desk review. Desk review is on a timeframe that spans the official start of the BPR, and thus, stakeholder B/IOs must provide these data in advance for the BPR Team to meet timeframes and interview their staff in the window identified. These data sources should be stored using the previously determined file structure.
7 The workspace are provided through and sometimes referred to as Huddle®.
Page 11
Furthermore, as detailed in the BPR SOW, key stakeholders should identify necessary SMEs in advance and make them available to the BPR Team throughout the BPR. SMEs can expect to spend about 10 percent level of effort on the BPR, though the time required will vary from week to week. Like having data sources in advance, identifying SMEs in advance greatly helps keep the BPR on schedule. Implementing B/IOs must be aware that, for enterprise-wide BPRs, they will have a period of two weeks from issuance of the draft report to formally accept recommendations and complete their Management Response in time for presentation to the MOC. H. Formal Launch of BPR Once the key deliverables in the Prepare for BPR phase are finalized, including obtaining partner buy-in and leadership support and stakeholders providing a critical mass of existing data sources, then the BPR Team is ready for leadership to officially announce the BPR and announce that interviews will start in two weeks. The BPR Team will then proceed to finalize desk review and development of protocols for data gathering methods. Conduct Desk Review The purpose of the desk review is to become familiar with existing data and information related to the BPR issue. Key deliverables include:
● Bibliography of Sources ● Benchmarks and Best Practices ● Glossary ● Protocols for Data Gathering
At this point the BPR Team has already gathered data sources during the Prepare for BPR stage, so now it will start reviewing and analyzing. In practical application, Desk Review may overlap slightly with selecting methodological tools. That is fine as Desk Review and associated findings can help inform study questions and identification of issues to explore and additional data to gather. The BPR Team can find further details on Desk Review in ADS 597sah “Types of Business Analysis” and the sections below highlight how to provide the key deliverables. A. Bibliography of Sources Compiling and writing the bibliography is best managed by a Junior Analyst but with input from all team members. The Junior Analyst should complete the bulk of bibliography work during desk review and initial analysis, though the Junior Analyst will likely need to do some final additions and clean-up at the report drafting stage as additional references may be added then. The Junior Analyst should create a bibliography document and regularly prompt team members during meetings and during other exchanges to ensure they add newly referenced materials to the bibliography list. The team should mostly have reviewed all sources by the end of the desk review, initial data analysis, and interviews. At this stage, the Junior Analyst should go through and ensure all bibliography entries have a common style and format and are complete. The Junior Analyst will clarify entries or prompt other team members to make improvements as needed. All bibliography entries should include the full title, author, place of publication, publisher, and date
Page 12
of publication for each source. Online or internal USAID sources should also include the web address, date of access, and any other pertinent details. Finally, as the team creates the draft report the Junior Analyst should remind team members to update the bibliography if they use any new sources. The Junior Analyst will also finalize the formatting and structure of the bibliography for publishing at this time. B. Glossary Compiling and writing the glossary is best managed by a Junior Analyst but with input from all team members. The Junior Analyst should complete the bulk of glossary work during desk review and initial analysis as the analysis team identifies key and common terms, concepts, acronyms, and references. The Junior Analyst should create a glossary document and regularly prompt team members during meetings and during other exchanges to ensure they add important terms to the glossary. The team should know all important terms by the end of desk review, initial data analysis, and interviews. At this stage, the Junior Analyst should go through and ensure all glossary entries have a common style and format. The Junior Analyst should also clarify entries or prompt other team members to make improvements if needed. Tips for a strong glossary include:
● Focus on terms with which the analysis team and readers around the Agency are not already familiar;
● Focus on ensuring terms are understandable in the context of the report and issue papers; ● If the term is defined by a specific source (for example, OPM, OMB, Congress) then cite
the source; ● Any time a team member asks for a description or definition of a term during a team
meeting or conversation, that term should be added to the glossary; and ● Bold the term and follow it with unbolded description for ease of readability.
C. Benchmarks and Best Practices A BPR uses benchmarking to identify relevant standards for processes and performance metrics from other USG agencies or comparable organizations in the public or private sectors. Common dimensions measured include quality, cost, and time. A Junior Analyst should complete the bulk of benchmarking work, though all Analysts should consider taking part and definitely pay close attention to data gathered and benchmarks established. Steps to benchmarking include:
1. Identify peer groups: set criteria for peer groupings, often done as a series of concentric circles with the inner circle based on peers most alike USAID and the farthest circle filled only with “best-in-class” examples but not necessarily similar to USAID.
2. Collect and analyze data: conduct desk research and occasionally interviews on the practices of the comparable groups identified in step 1 above. Then analyze and validate the information collected to identify performance levels, leading practices, enablers, proven approaches or templates, and other tools.
Page 13
3. Report: develop a benchmarking document which briefly summarizes findings with links to additional information.
4. Adapt and apply: all Analysts working together should apply the information to USAID. Consider such questions as:
a. Are there “better practices” to consider? b. Are there performance metrics to compare USAID performance against? c. How should USAID apply these findings?
Analysts will document the answers to these questions in the BPR report issue papers and recommendations. D. Protocols for Gathering Data from People See the “Mixed Methods, Coding, Interviews, Surveys, and Questionnaires Methodology” (See Annex F) document for details and best practices on mixed methods protocols, designing questionnaires and surveys, developing protocols, and coding and presenting data including software currently available. For help in developing a protocol for interviews please see the “Protocol Guide for Interview, Focus Group, and Case Study” (See Annex G). The information presented here is only a high-level overview. Mixed Methods Approach: BPRs at USAID will generally require collecting data directly from people via surveys, interviews, focus groups, or other means. In these cases, BPRs typically use a mixed methods approach which works well when the BPR Team needs to answer both broad research questions such as “why” and “how” as well as “what” and “how much” based on information collected directly from people. In mixed methods the BPR Team will mix both qualitative and quantitative data collection methods. This approach works well when the BPR intends to influence policy and decision making on a macro level. It provides in-depth analysis coupled with quantitative data to legitimize and support recommendations.8 Quantitative Data: Answers the “what” and the “how much.” It is also often used to collect a large amount of data (think breadth, not depth). Examples of quantitative information collection include process data from a system or tracker, and survey results with a quantitative component such as respondents selecting a number on a scale or coding of their responses by data collectors. Qualitative Data: If the BPR Team is trying to explore areas for initial research to answer “why” and “how”, then intensive qualitative work is needed. Qualitative data allows more open ended questions and is good for getting to a deeper level of causalities. Examples of qualitative information include unstructured interviews where the respondent answers questions freely or surveys with open response blocks. The BPR Team’s selection of methodological tools, and use of surveys and interviews in particular, will partly depend on the respondent groups that the Team targets for data collection. To better identify target respondents and guide choice of tools, think through the questions in the chart below.
8 Bamberger, Michael (ed). Integrating Quantitative and Qualitative Research in Development Projects: Directions in Development. The World Bank, Washington, D.C.
Page 14
1. How many people are targeted for data collection? There are several factors to think about when thinking about sample interview sizes including need, time, and other resource constraints. Interviewing people takes considerable time and analytical commitment. Make sure to identify the research purpose for every person or group selected and the data sought from them. If there are less than 30 people to interview, the BPR Team could use intensive qualitative methods. If the number is much larger, the BPR Team can use mixed methods and surveys to supplement a smaller group of qualitative interviews.
2. Probability sampling or purposeful sampling? A probability sampling means subjects have an equal probability of being selected. This type of sampling allows for quantitative findings or to determine statistically significant differences between subgroups. Purposeful sampling involves selecting representatives of each category/stakeholder of interest for the study. This purposeful selection is usually paired with qualitative interviewing. A common term used at USAID for this is “key informant interviews.”
Document and Validate As-Is Processes The purpose of this step is to explore and document the current as-is reality at USAID of the end-to-end process, function, or issue under review including stakeholder and customer perspectives. Key deliverables include:
● As-Is process map ● Customer experience map ● Interviewing and interview notes
At this point the BPR Team has reviewed relevant background material and developed data gathering protocols during Desk Review, so now the Team can begin to interview operational staff in earnest. A. Interviewing and Interview Notes The BPR Team will now put into use the protocols and questions it developed earlier to gather data from people. The purpose of this step is to gather data via interviews, case studies, and focus groups, mostly of front line staff and customers, and to document findings, questions and issues, as-is processes, and other evidence discovered. During all interviews and focus groups, there should be at least two Analysts present. The ideal state is at least one Lead Analyst facilitating the interview and at least one Junior Analyst taking detailed notes. The Lead Analyst will take notes on key points raised, questions, or issues discovered with a focus on the advancement of the BPR. The Junior Analyst will take
Guiding Questions
Page 15
comprehensive notes on all items of discussion. This process results in the desired key deliverables of a set of key points notes and a set of comprehensive notes from every interview, case study, or focus group undertaken. This both allows for quick review of session notes for key items and permits precise clarification via detailed notes if needed. All BPR Team members, especially note takers, must plan ahead for coding for later analysis and possibly quantification of note findings. Planning for coding may involve using preparatory coding during initial notetaking to avoid having to code retrospectively. Refer to the “Protocol Guide and Template for Interview, Focus Group, and Case Study” (See Annex G) and “Mixed Methods, Coding, Interviews, Surveys, and Questionnaires Methodology” (See Annex F) for detailed instructions. *In addition to notes, the BPR Team may also want to record interviews, case studies, and focus groups. This methodology recommends a case-by-case decision based on Analysts’ familiarity and grasp of the subject matter and expected need to repeatedly review comments. In most of the recently conducted BPRs, the Analysts produced high-quality work without recording. B. As-Is Process Map The purpose and key deliverable of this step is to document the current process in a map. This creates an as-is baseline of current operations including roles, responsibilities, timelines, and actions. The “Business Process Mapping Methodology” (See Annex D) provides detailed guidance on nomenclature and procedure for creating process maps.
C. Customer Experience Map The purpose and key deliverable of this step is to document in a map the current customer experience reality. This creates an as-is baseline of current operations specifically from the perspective of internal USAID customers. The separate “Customer Experience Mapping Methodology” (See Annex E) provides detailed guidance on nomenclature and procedure for creating customer experience maps.
Page 16
Conduct Synthesis and Analysis The purpose of conducting synthesis and analysis of findings is to examine for inefficient or ineffective practices and find opportunities to improve and optimize the process or function under review. Key deliverables of this step include:
● To-Be process maps ● Any product from “Identify Data Needs and Methodological Tools” in this methodology ● Synthesis of key findings in preparation for writing issue papers
A. To-Be Process Map The purpose and key deliverable of this step is to create a to-be process map to illustrate recommendations for an improved process. This to-be map may be draft pending further input from stakeholders after the BPR concludes. Nonetheless, it should document key findings and any recommendations for improving the process that will be presented in the BPR Issue Papers and Recommendations. The “Business Process Mapping Methodology” (See Annex D) provides detailed guidance on nomenclature and procedure for creating process maps including documenting roles, responsibilities, timelines, and actions. B. Other Survey, Graphing, or Analytic Product The purpose and key deliverable of this step is to document any other analytic products, surveys, or graphs. The BPR Team should finalize products for any tool or approach that the BPR Team decided to use during the “Prepare for BPR: Identify Data Needs and Methodological Tools” section of this BPR methodology. C. Synthesis of Key Findings The purpose of this step is to document key issues and findings and begin to group them for write-up in the proceeding Draft Reports section. Lead Analysts should produce this synthesis document and populate it, though all Junior Analysts will contribute with details and findings from various analytic products such as benchmarking, mapping, interviews, survey analysis, and any other analytic tool used in the BPR. As discussed earlier in the “Grounded Theory” section, as the BPR Team collects data it will identify common themes and topics, group those findings, and produce findings and theories. The BPR Team will apply this approach in an iterative manner, so initial data collection or qualitative interviews can help to develop further research questions to study. The BPR Team must fully engage SMEs in this part of the process to validate findings and provide perspective of whether the BPR Team has identified the core issues. Iterative application of the principle, informed by the findings from research will lead to a data-driven set of findings and conclusions. While the BPR Team should keep stakeholder B/IO leadership aware of progress via the periodic check-ins after each BPR stage, this is not the time to validate findings or synthesized issues. While leadership has input in the scope setting period, findings and issues are driven by data and research once the BPR begins. Leaders will have a chance later in the Draft Report Review period to validate whether proposed recommendations are viable.
Page 17
Draft Reports A draft report should document major issues and make recommendations to achieve desired outcomes. These recommendations could be in the areas such as structure, process, systems, training, technology, and performance metrics. Substeps of this section include:
● Drafting the BPR Report including issues papers with recommendations ● Conducting peer review and editing
The key deliverable of this step is a draft report, including Issue Papers and Recommendations, which meet style and quality guidelines and have passed peer review. A. Draft the Report The purpose and key deliverable of this step is to draft the entire body of the BPR report. The BPR report body will include the following sections:
● Executive Summary ● Recommendations At-a-Glance ● Issue Papers ● Mapping and analytic products
At the beginning of this step, the BPR Team should coordinate with M/MPBP leadership to identify a Quality Check Lead Reviewer. The BPR Team will notify the Quality Check Lead Reviewer to anticipate receiving a draft report in approximately two weeks requiring review within a three-week period. See the following Peer Review section for further details. While the BPR Team is not yet at the stage of a final report, the Team must keep the ultimate audiences in mind as it prepares the report. Specifically, the BPR Team will deliver the final BPR Report to the relevant Executive Sponsors from both M Bureau and all major stakeholder B/IOs. The BPR Team will also subsequently present the report to the MOC and make it available internally within USAID. Finally, operational staff from relevant stakeholder B/IOs will need a report from which they can actively learn and recommendations to implement. The BPR Team will categorize recommendations in the report by: owner, impact on efficiency and/or effectiveness, timeframe, and feasibility. The BPR Analyst team must include appropriate reporting on data collected in annexes to the BPR report. In drafting the report, the BPR Team should use the BPR Report template (See Annex K). B. Peer Review After selection of a Quality Check Lead Reviewer by the BPR Team and M/MPBP leadership, that Quality Check Lead Reviewer takes responsibility for coordinating all major aspects of peer review. They identify peer reviewers for content, analysis quality, and style to ensure consistency with the M/MPBP/PERF Publication Standards, Agency Style Guide, and also across the various sections of the paper. Each Report section should have at least two peer reviewers and a check by the Quality Check Lead Reviewer. Content and analytic aspects of peer review should be completed within seven
Page 18
working days, so the Quality Check Lead Reviewer must identify candidates that, with their supervisor’s approval, can meet that timetable. The Quality Check Lead Reviewer will then have a final three working days to coordinate style, comments, and other review feedback and elements across the draft report before returning it to the BPR Team. C. Finalize Draft Report After receiving the peer reviewed draft back from the Quality Check Lead Reviewer, the BPR Team will have one week to finalize the draft report incorporating feedback received. Upon receiving feedback and edits from the peer review, the BPR Team should also proceed to notify stakeholder bureaus and offices to anticipate receiving a draft report within a week, at which time they will have two weeks to review and provide feedback. As timeliness is of utmost concern and extensive effort has been made throughout the process to keep stakeholders engaged and aware of issues, should feedback include significant issues or push back, then the BPR Team should elevate those concerns to M Bureau leadership promptly for engagement and resolution. Issue Report and Present at Management Operations Council Following draft report completion, the BPR Team gathers feedback from key stakeholders and then produces a final BPR report and presentation to the MOC. Key deliverables of this step include:
● A final USAID-internally shared BPR Report ● A presentation to the MOC
A. Create MOC Presentation Within Six Week Timeframe To start this step, the BPR Team will set a deadline for the MOC presentation to occur six weeks later. This timeframe allows for two weeks to receive stakeholder feedback on the draft report and their management response. Following stakeholder review, the BPR Team will have two weeks to submit a MOC presentation on the BPR and an additional week to finalize the BPR report. B. Gather Stakeholder Feedback The purpose of this step is to ensure that the BPR issues, findings, and recommendations do not have any significant factual errors or major impediments to action. This BPR methodology was designed to solicit and incorporate input from key stakeholders throughout the conduct of the BPR. However, the finalization of the BPR Report requires specific input gathering and response. This is an important time for the BPR Team to seek mutual understanding with key stakeholders. Maintaining such understanding and collaboration can pay dividends later in the post-BPR implementation coordination period. At a minimum, the BPR Team must send the draft report to all Executive Sponsors and Process Champions. To start this step, the BPR Team will provide stakeholders with the draft BPR Report and remind
Page 19
them they have a maximum of two weeks to provide feedback on the draft report – per the terms of the SOW template. The BPR Team should provide the draft report in full when possible, but at a minimum, it should include the Executive Summary, all Issue Papers, the Recommendations At-a-Glance, and any business process mapping, customer experience mapping, or other major analysis or component. While it may not always be necessary, the BPR Team should offer to meet with stakeholders to share key findings and recommendations. As discussed earlier in the “Synthesis of Key Findings” section, now is the time for the BPR Team to explicitly engage Executive Sponsors, B/IO leadership, and the Process Champion on the proposed recommendations. These stakeholders and leaders need to validate whether the proposed recommendations are both viable and appropriate for resolving the issues found. C. Respond to Feedback, Receive Management Response, and Internally Publish
Final BPR Report To keep the flow of the BPR process moving toward completion and implementation, the BPR Team will accept written feedback on the report and, if desired by the stakeholder B/IOs, organize a meeting to discuss further or resolve any issues. Well-documented findings always stand as-is. However, there is the possibility, especially with large and complex processes or issues, for misunderstandings during the conduct of the BPR analysis. Additionally, since leadership may not maintain high levels of engagement during the entire course of a BPR, the feedback period allows for leadership to process findings and recommendations within the practical context of all mandates, regulations, and laws within which their organizations work. Therefore, fact verification and technical clarifications are appropriate. Existing data should not be changed or tweaked, but clarification and additional data may be added. The BPR Team will respond to stakeholder input and update the report as appropriate. The BPR Team then prepares a final BPR Report and publishes it internally to USAID. M/MPBP publishes BPR Reports that it conducts via the MOC and on its MyUSAID Pages site.9 D. Deliver Presentation to the MOC After gathering and responding to all key stakeholder feedback, it’s now time to deliver the BPR presentation to the MOC. The MOC presentation is a unique opportunity for the BPR Team to present major findings and draw out important details for leadership across the Agency. Elements requiring collaboration and coordination deserve special attention. The BPR Team will develop the presentation during the first four weeks of the “Issue Report and Present at MOC” step, with the last week or two set aside for tweaks and preparing for the verbal presentation. Once the BPR Team has finished the BPR Report and presentation to the MOC, the formal period of the BPR analysis comes to a close. However, the BPR Team still has a few more weeks of behind the scenes work to complete to draw the overall process to a close.
9 While no formal clearance or external reporting happens now, later in the “Wrap-Up Phase” the BPR Team will coordinate external publishing on the Development Experience Clearinghouse or similar site.
Page 20
Wrap-Up The BPR timeframe formally ends with the presentation to the MOC. However, we recommend an additional three weeks to do post-BPR wrap-up, clearance and publication, communications on the BPR results and implementation next steps, and capture of lessons learned. A. Executive Sponsor Clearance and Externally Post BPR Report While the BPR Team has already published the BPR Report internally at the Agency, USAID also desires to post significant management efforts externally. The Agency currently utilizes the Development Experience Clearinghouse (DEC)10 as the platform for publishing externally. With the BPR complete, fully vetted and briefed internally, and stakeholder B/IOs moving towards implementation, now is the time to get the BPR Report formally cleared by the relevant stakeholder B/IOs for external publishing. The BPR Team will create clearance memoranda and coordinate their distribution to the relevant stakeholder B/IOs using SMEs and Process Champions to help move the process along. Upon receipt of all approved clearances, the BPR Team will publish the BPR report externally. If B/IOs have concerns about sensitive information in the BPR Report, the Agency may wish to create a public version without such information for posting while keeping all BPR Report content on the internal site. B. After-Action Review When conditions warrant, such as when the BPR Team overcame particular challenges, the BPR Team should conduct a quick After-Action Review (AAR). The purpose of this step is to gather lessons learned from the BPR implementation to inform future analyses. C. Communications of Findings The final Wrap-Up step is to conduct further targeted communications in support of implementation coordination. Per the SOW template, responsibility for implementation of BPR findings and recommendations lies with the respective offices identified in the BPR. However, the SOW template also permits Analyst staff from the BPR to provide coordination and support for implementation – effectively serving as a BPR SME helping communicate back to the implementing offices findings from the BPR. The communications at this point are two-fold. First, the Analyst may need to coordinate messaging to the Agency writ-large about BPR finding and recommendations. The Analyst may also need to work with implementing stakeholders to communicate findings and recommendations to front line staff for implementation. These communications in particular should support implementation coordination among various stakeholders and ensure timely actions on recommendations. Per the SOW template and this methodology, this communications and coordination role should last a maximum of 6 months at 10-25 percent level of effort. Finally, M Bureau summarizes B/IO tracking of BPR recommendation status for enterprise-wide reporting at the MOC. The Analyst will help coordinate tracking of implementation status. One
10 Current location for the DEC is https://dec.usaid.gov/dec/home/Default.aspx. Instructions for submitting documents to the DEC are on the website.
Page 21
of their initial tasks is to determine when the next status update is required – status updates for the MOC occur on a calendar basis, not necessarily six months from the close of the BPR. Once the Analyst determines the date, the Analyst should coordinate with the participating B/IOs on collecting status updates. D. Implementation, Performance Management, and Sustainability Actions11 For purposes of enhancing impact and ensuring sustainability, this BPR methodology and the accompanying SOW template allow for a BPR Analyst to support stakeholder B/IOs during implementation. Such support can last for up to six months post-BPR at approximately 15-25 percent level of effort and include:
● coordinating and supporting strategy development and action planning for implementing recommendations;
● providing technical guidance, outreach, and training; ● supporting monitoring and measurement of key performance indicators to compare
process performance to targets and determine BPR impact; ● developing countermeasures to address any issues found during implementation; and ● further sharing and standardizing successful practices.
In past experience, lack of timely acceptance of recommendations, timely action on the recommendations, and formal closure of implementation were relative weaknesses of BPRs at USAID. This methodology and SOW template now give implementing stakeholders of enterprise-wide processes and functions a period of up to two weeks from issuance of the draft report to formally accept recommendations and provide a Management Response indicating whether they accept each recommendation - see the Report Template. Next, the implementing B/IO must provide a first report back on implementation to the MOC aligned to the MOC calendar and then every six months afterwards. The exact timing will vary as to when a BPR concludes and when the recurring six month status check-ins happen based on when a BPR concludes and when the initial MOC report back occurs based on the MOC schedule, but after that all others will occur in six month intervals. In general, the participating B/IOs can think of having two weeks to formally accept recommendations. Implementing B/IOs can request optional technical assistance for six months from a member of the BPR Analyst Team, after which time the M Bureau only provides coordination of reporting back to the MOC of implementing B/IOs implementation tracking for enterprise-wide BPRs every six months. At the end of two years, a final report back will officially close the externally MOC tracked implementation phase and the implementing B/IOs must update on progress thus far, plan for implementing remaining items, identify performance metrics for continuous monitoring, and plan for engaging collaborating partners. The final check-in at MOC can consist partly of reporting back and partly celebrating successes of implementation and impact via partnership around the Agency.
11 This section was discussed earlier in “Note on Planning for Implementation, Performance Management, and Sustainability” section of this methodology.
A - 1
Annex A: Scope of Work Template
Bureau for Management
Business Process/Function Review on
XXMonth Date, YearXX
Scope of Work TEMPLATE
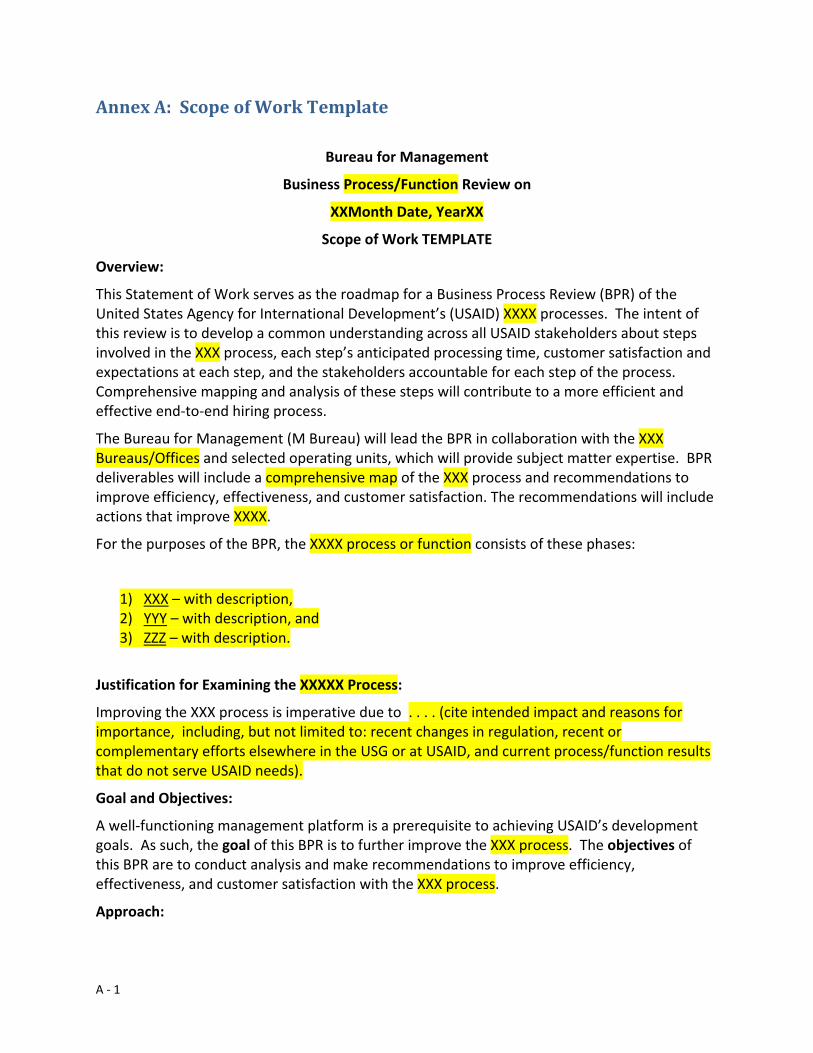
Overview:
This Statement of Work serves as the roadmap for a Business Process Review (BPR) of the United States Agency for International Development’s (USAID) XXXX processes. The intent of this review is to develop a common understanding across all USAID stakeholders about steps involved in the XXX process, each step’s anticipated processing time, customer satisfaction and expectations at each step, and the stakeholders accountable for each step of the process. Comprehensive mapping and analysis of these steps will contribute to a more efficient and effective end-to-end hiring process.
The Bureau for Management (M Bureau) will lead the BPR in collaboration with the XXX Bureaus/Offices and selected operating units, which will provide subject matter expertise. BPR deliverables will include a comprehensive map of the XXX process and recommendations to improve efficiency, effectiveness, and customer satisfaction. The recommendations will include actions that improve XXXX.
For the purposes of the BPR, the XXXX process or function consists of these phases:
1) XXX – with description, 2) YYY – with description, and 3) ZZZ – with description.
Justification for Examining the XXXXX Process:
Improving the XXX process is imperative due to . . . . (cite intended impact and reasons for importance, including, but not limited to: recent changes in regulation, recent or complementary efforts elsewhere in the USG or at USAID, and current process/function results that do not serve USAID needs).
Goal and Objectives:
A well-functioning management platform is a prerequisite to achieving USAID’s development goals. As such, the goal of this BPR is to further improve the XXX process. The objectives of this BPR are to conduct analysis and make recommendations to improve efficiency, effectiveness, and customer satisfaction with the XXX process.
Approach:
A - 2
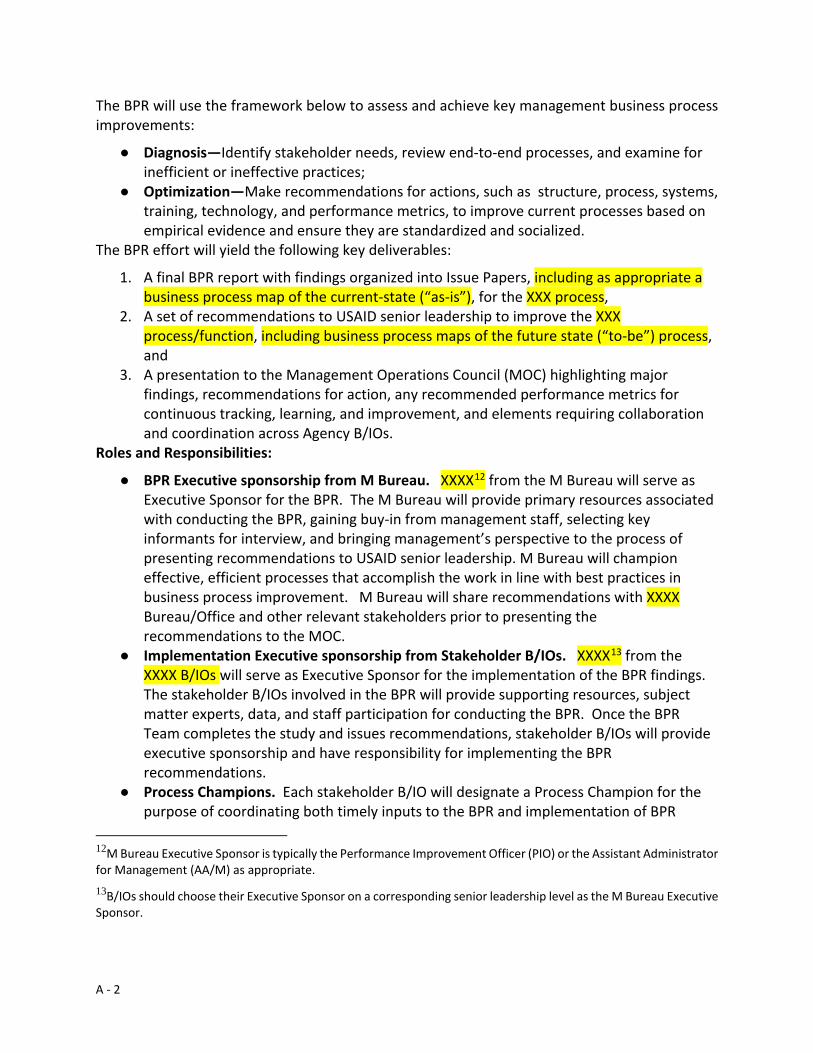
The BPR will use the framework below to assess and achieve key management business process improvements:
● Diagnosis—Identify stakeholder needs, review end-to-end processes, and examine for inefficient or ineffective practices;
● Optimization—Make recommendations for actions, such as structure, process, systems, training, technology, and performance metrics, to improve current processes based on empirical evidence and ensure they are standardized and socialized.
The BPR effort will yield the following key deliverables:
1. A final BPR report with findings organized into Issue Papers, including as appropriate a business process map of the current-state (“as-is”), for the XXX process,
2. A set of recommendations to USAID senior leadership to improve the XXX process/function, including business process maps of the future state (“to-be”) process, and
3. A presentation to the Management Operations Council (MOC) highlighting major findings, recommendations for action, any recommended performance metrics for continuous tracking, learning, and improvement, and elements requiring collaboration and coordination across Agency B/IOs.
Roles and Responsibilities:
● BPR Executive sponsorship from M Bureau. XXXX12 from the M Bureau will serve as Executive Sponsor for the BPR. The M Bureau will provide primary resources associated with conducting the BPR, gaining buy-in from management staff, selecting key informants for interview, and bringing management’s perspective to the process of presenting recommendations to USAID senior leadership. M Bureau will champion effective, efficient processes that accomplish the work in line with best practices in business process improvement. M Bureau will share recommendations with XXXX Bureau/Office and other relevant stakeholders prior to presenting the recommendations to the MOC.
● Implementation Executive sponsorship from Stakeholder B/IOs. XXXX13 from the XXXX B/IOs will serve as Executive Sponsor for the implementation of the BPR findings. The stakeholder B/IOs involved in the BPR will provide supporting resources, subject matter experts, data, and staff participation for conducting the BPR. Once the BPR Team completes the study and issues recommendations, stakeholder B/IOs will provide executive sponsorship and have responsibility for implementing the BPR recommendations.
● Process Champions. Each stakeholder B/IO will designate a Process Champion for the purpose of coordinating both timely inputs to the BPR and implementation of BPR
12M Bureau Executive Sponsor is typically the Performance Improvement Officer (PIO) or the Assistant Administrator for Management (AA/M) as appropriate. 13B/IOs should choose their Executive Sponsor on a corresponding senior leadership level as the M Bureau Executive Sponsor.
A - 3
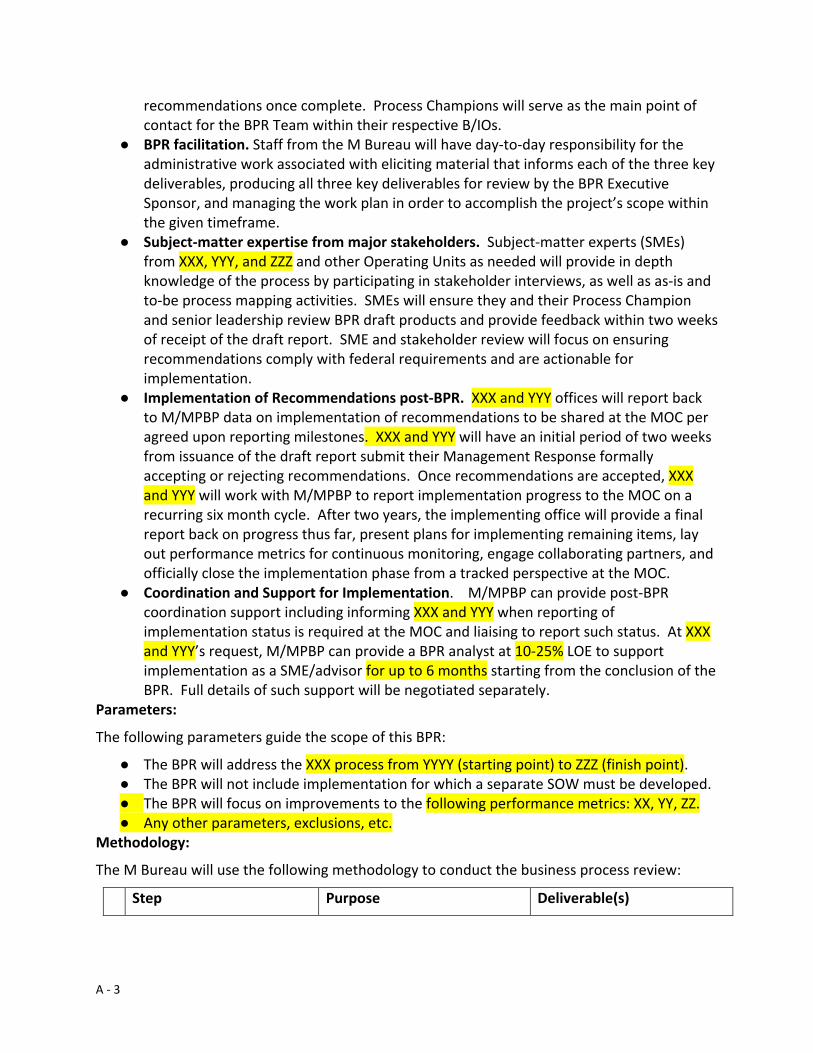
recommendations once complete. Process Champions will serve as the main point of contact for the BPR Team within their respective B/IOs.
● BPR facilitation. Staff from the M Bureau will have day-to-day responsibility for the administrative work associated with eliciting material that informs each of the three key deliverables, producing all three key deliverables for review by the BPR Executive Sponsor, and managing the work plan in order to accomplish the project’s scope within the given timeframe.
● Subject-matter expertise from major stakeholders. Subject-matter experts (SMEs) from XXX, YYY, and ZZZ and other Operating Units as needed will provide in depth knowledge of the process by participating in stakeholder interviews, as well as as-is and to-be process mapping activities. SMEs will ensure they and their Process Champion and senior leadership review BPR draft products and provide feedback within two weeks of receipt of the draft report. SME and stakeholder review will focus on ensuring recommendations comply with federal requirements and are actionable for implementation.
● Implementation of Recommendations post-BPR. XXX and YYY offices will report back to M/MPBP data on implementation of recommendations to be shared at the MOC per agreed upon reporting milestones. XXX and YYY will have an initial period of two weeks from issuance of the draft report submit their Management Response formally accepting or rejecting recommendations. Once recommendations are accepted, XXX and YYY will work with M/MPBP to report implementation progress to the MOC on a recurring six month cycle. After two years, the implementing office will provide a final report back on progress thus far, present plans for implementing remaining items, lay out performance metrics for continuous monitoring, engage collaborating partners, and officially close the implementation phase from a tracked perspective at the MOC.
● Coordination and Support for Implementation. M/MPBP can provide post-BPR coordination support including informing XXX and YYY when reporting of implementation status is required at the MOC and liaising to report such status. At XXX and YYY’s request, M/MPBP can provide a BPR analyst at 10-25% LOE to support implementation as a SME/advisor for up to 6 months starting from the conclusion of the BPR. Full details of such support will be negotiated separately.
Parameters:
The following parameters guide the scope of this BPR:
● The BPR will address the XXX process from YYYY (starting point) to ZZZ (finish point). ● The BPR will not include implementation for which a separate SOW must be developed. ● The BPR will focus on improvements to the following performance metrics: XX, YY, ZZ. ● Any other parameters, exclusions, etc.
Methodology:
The M Bureau will use the following methodology to conduct the business process review:
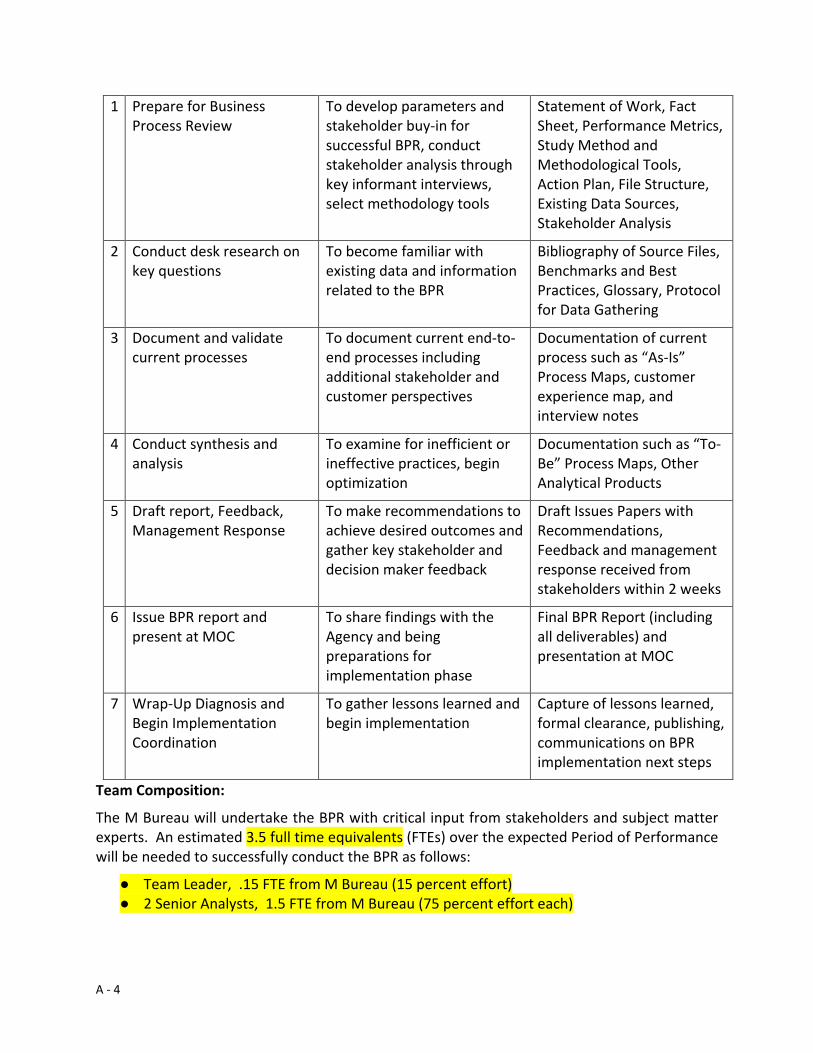
Step Purpose Deliverable(s)
A - 4
1 Prepare for Business Process Review
To develop parameters and stakeholder buy-in for successful BPR, conduct stakeholder analysis through key informant interviews, select methodology tools
Statement of Work, Fact Sheet, Performance Metrics, Study Method and Methodological Tools, Action Plan, File Structure, Existing Data Sources, Stakeholder Analysis
2 Conduct desk research on key questions
To become familiar with existing data and information related to the BPR
Bibliography of Source Files, Benchmarks and Best Practices, Glossary, Protocol for Data Gathering
3 Document and validate current processes
To document current end-to-end processes including additional stakeholder and customer perspectives
Documentation of current process such as “As-Is” Process Maps, customer experience map, and interview notes
4 Conduct synthesis and analysis
To examine for inefficient or ineffective practices, begin optimization
Documentation such as “To-Be” Process Maps, Other Analytical Products
5 Draft report, Feedback, Management Response
To make recommendations to achieve desired outcomes and gather key stakeholder and decision maker feedback
Draft Issues Papers with Recommendations, Feedback and management response received from stakeholders within 2 weeks
6 Issue BPR report and present at MOC
To share findings with the Agency and being preparations for implementation phase
Final BPR Report (including all deliverables) and presentation at MOC
7 Wrap-Up Diagnosis and Begin Implementation Coordination
To gather lessons learned and begin implementation
Capture of lessons learned, formal clearance, publishing, communications on BPR implementation next steps
Team Composition:
The M Bureau will undertake the BPR with critical input from stakeholders and subject matter experts. An estimated 3.5 full time equivalents (FTEs) over the expected Period of Performance will be needed to successfully conduct the BPR as follows:
● Team Leader, .15 FTE from M Bureau (15 percent effort) ● 2 Senior Analysts, 1.5 FTE from M Bureau (75 percent effort each)
A - 5
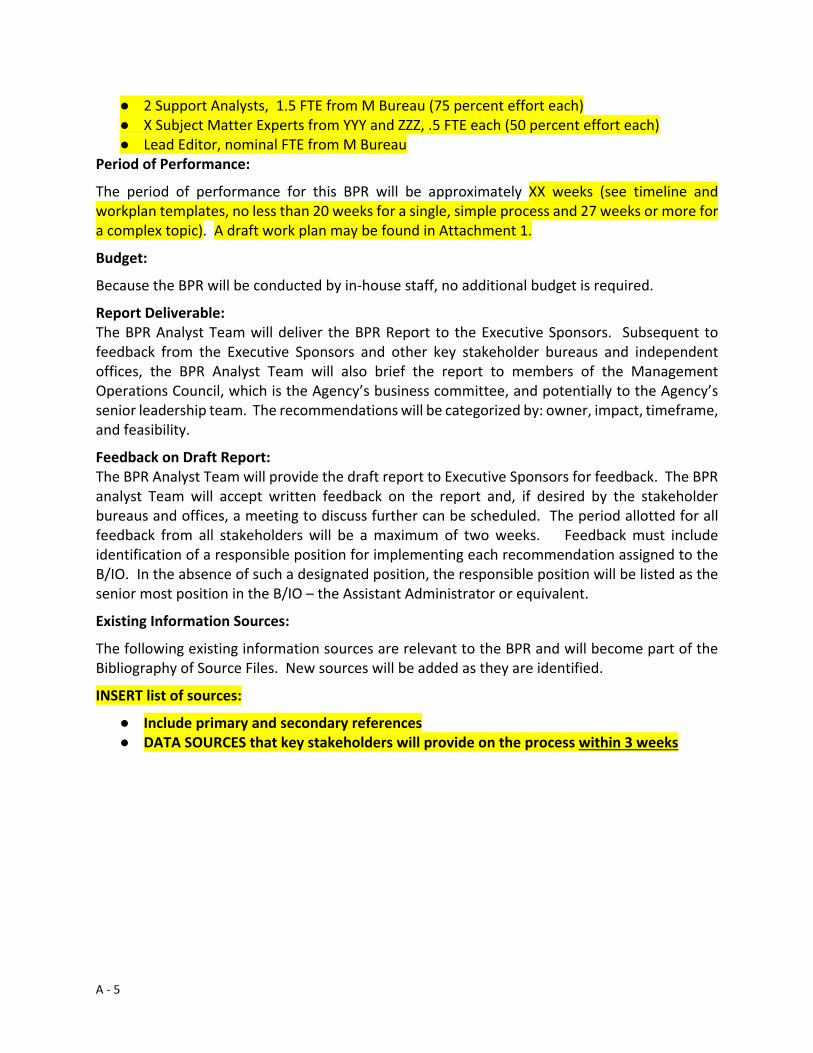
● 2 Support Analysts, 1.5 FTE from M Bureau (75 percent effort each) ● X Subject Matter Experts from YYY and ZZZ, .5 FTE each (50 percent effort each) ● Lead Editor, nominal FTE from M Bureau
Period of Performance:
The period of performance for this BPR will be approximately XX weeks (see timeline and workplan templates, no less than 20 weeks for a single, simple process and 27 weeks or more for a complex topic). A draft work plan may be found in Attachment 1.
Budget:
Because the BPR will be conducted by in-house staff, no additional budget is required.
Report Deliverable: The BPR Analyst Team will deliver the BPR Report to the Executive Sponsors. Subsequent to feedback from the Executive Sponsors and other key stakeholder bureaus and independent offices, the BPR Analyst Team will also brief the report to members of the Management Operations Council, which is the Agency’s business committee, and potentially to the Agency’s senior leadership team. The recommendations will be categorized by: owner, impact, timeframe, and feasibility.
Feedback on Draft Report: The BPR Analyst Team will provide the draft report to Executive Sponsors for feedback. The BPR analyst Team will accept written feedback on the report and, if desired by the stakeholder bureaus and offices, a meeting to discuss further can be scheduled. The period allotted for all feedback from all stakeholders will be a maximum of two weeks. Feedback must include identification of a responsible position for implementing each recommendation assigned to the B/IO. In the absence of such a designated position, the responsible position will be listed as the senior most position in the B/IO – the Assistant Administrator or equivalent.
Existing Information Sources:
The following existing information sources are relevant to the BPR and will become part of the Bibliography of Source Files. New sources will be added as they are identified.
INSERT list of sources:
● Include primary and secondary references ● DATA SOURCES that key stakeholders will provide on the process within 3 weeks
B - 1
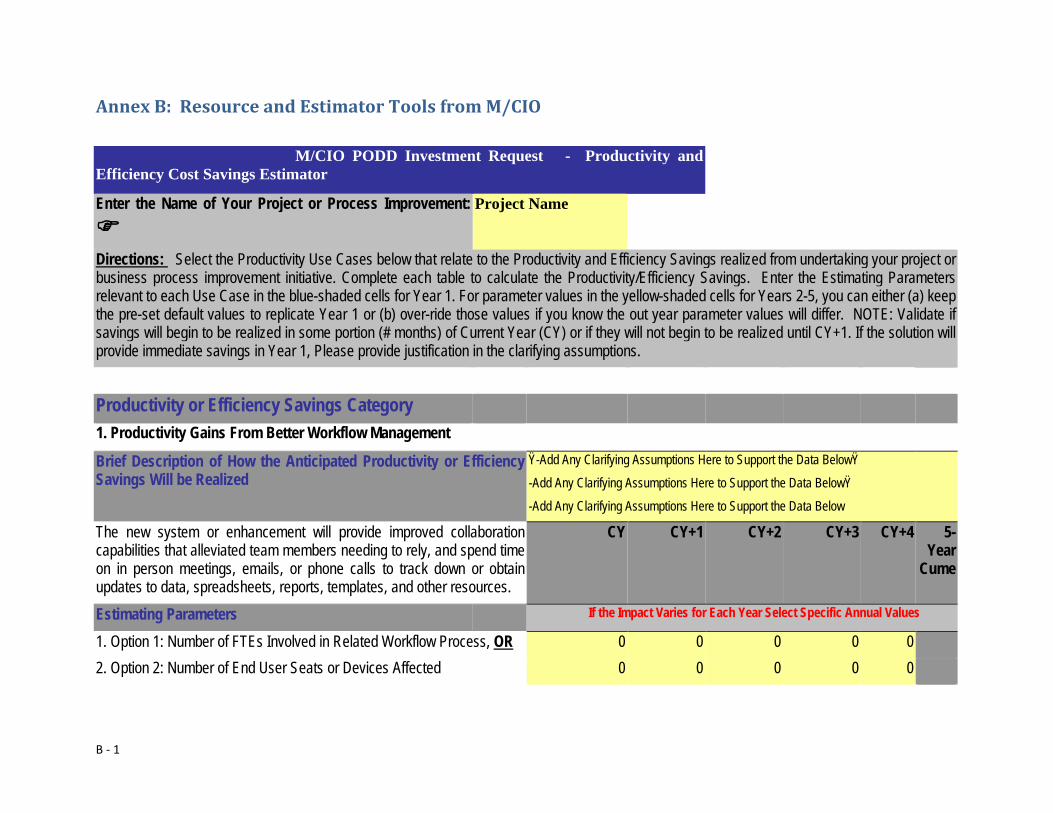
Annex B: Resource and Estimator Tools from M/CIO M/CIO PODD Investment Request - Productivity and Efficiency Cost Savings Estimator
Enter the Name of Your Project or Process Improvement:
Project Name
Directions: Select the Productivity Use Cases below that relate to the Productivity and Efficiency Savings realized from undertaking your project or business process improvement initiative. Complete each table to calculate the Productivity/Efficiency Savings. Enter the Estimating Parameters relevant to each Use Case in the blue-shaded cells for Year 1. For parameter values in the yellow-shaded cells for Years 2-5, you can either (a) keep the pre-set default values to replicate Year 1 or (b) over-ride those values if you know the out year parameter values will differ. NOTE: Validate if savings will begin to be realized in some portion (# months) of Current Year (CY) or if they will not begin to be realized until CY+1. If the solution will provide immediate savings in Year 1, Please provide justification in the clarifying assumptions.
Productivity or Efficiency Savings Category
1. Productivity Gains From Better Workflow Management
Brief Description of How the Anticipated Productivity or Efficiency Savings Will be Realized
Ÿ-Add Any Clarifying Assumptions Here to Support the Data BelowŸ
-Add Any Clarifying Assumptions Here to Support the Data BelowŸ
-Add Any Clarifying Assumptions Here to Support the Data Below
The new system or enhancement will provide improved collaboration capabilities that alleviated team members needing to rely, and spend time on in person meetings, emails, or phone calls to track down or obtain updates to data, spreadsheets, reports, templates, and other resources.
CY CY+1 CY+2 CY+3 CY+4 5-Year
Cume
Estimating Parameters If the Impact Varies for Each Year Select Specific Annual Values
1. Option 1: Number of FTEs Involved in Related Workflow Process, OR 0 0 0 0 0 2. Option 2: Number of End User Seats or Devices Affected 0 0 0 0 0
B - 2
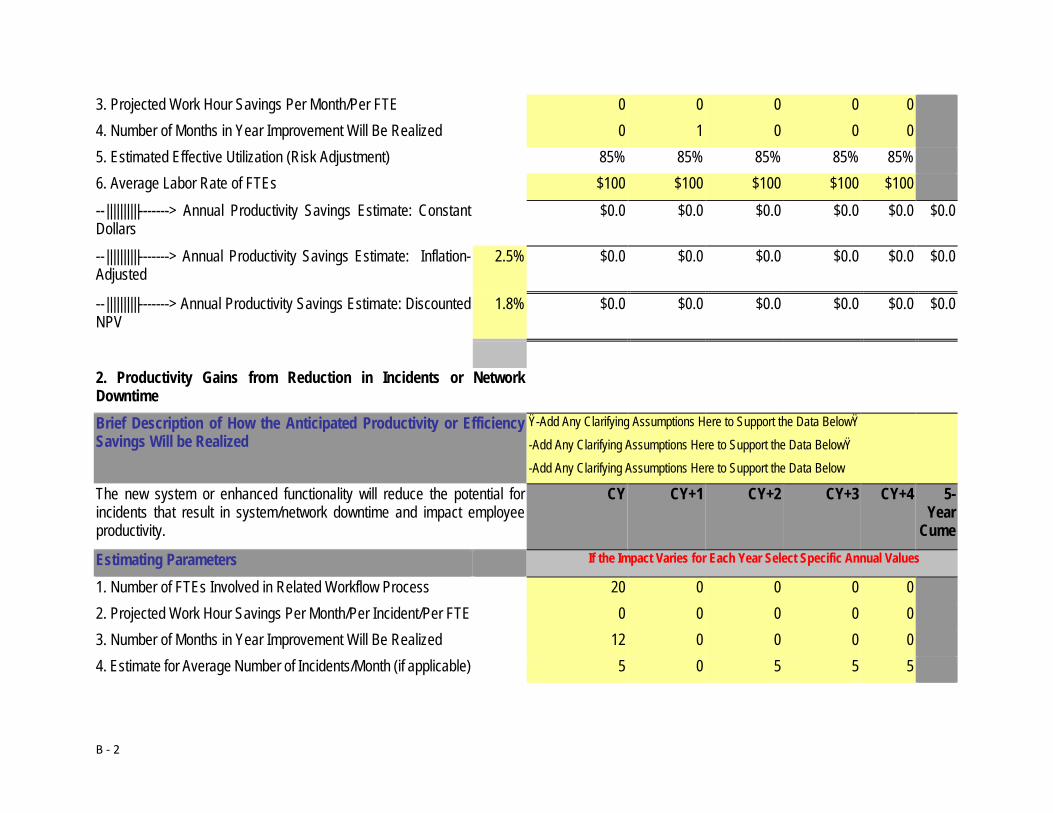
3. Projected Work Hour Savings Per Month/Per FTE 0 0 0 0 0 4. Number of Months in Year Improvement Will Be Realized 0 1 0 0 0 5. Estimated Effective Utilization (Risk Adjustment) 85% 85% 85% 85% 85% 6. Average Labor Rate of FTEs $100 $100 $100 $100 $100 --||||||||||-------> Annual Productivity Savings Estimate: Constant Dollars
$0.0 $0.0 $0.0 $0.0 $0.0 $0.0
--||||||||||-------> Annual Productivity Savings Estimate: Inflation-Adjusted
2.5% $0.0 $0.0 $0.0 $0.0 $0.0 $0.0
--||||||||||-------> Annual Productivity Savings Estimate: Discounted NPV
1.8% $0.0 $0.0 $0.0 $0.0 $0.0 $0.0
2. Productivity Gains from Reduction in Incidents or Network Downtime
Brief Description of How the Anticipated Productivity or Efficiency Savings Will be Realized
Ÿ-Add Any Clarifying Assumptions Here to Support the Data BelowŸ
-Add Any Clarifying Assumptions Here to Support the Data BelowŸ
-Add Any Clarifying Assumptions Here to Support the Data Below
The new system or enhanced functionality will reduce the potential for incidents that result in system/network downtime and impact employee productivity.
CY CY+1 CY+2 CY+3 CY+4 5-Year
Cume
Estimating Parameters If the Impact Varies for Each Year Select Specific Annual Values
1. Number of FTEs Involved in Related Workflow Process 20 0 0 0 0 2. Projected Work Hour Savings Per Month/Per Incident/Per FTE 0 0 0 0 0 3. Number of Months in Year Improvement Will Be Realized 12 0 0 0 0 4. Estimate for Average Number of Incidents/Month (if applicable) 5 0 5 5 5
B - 3
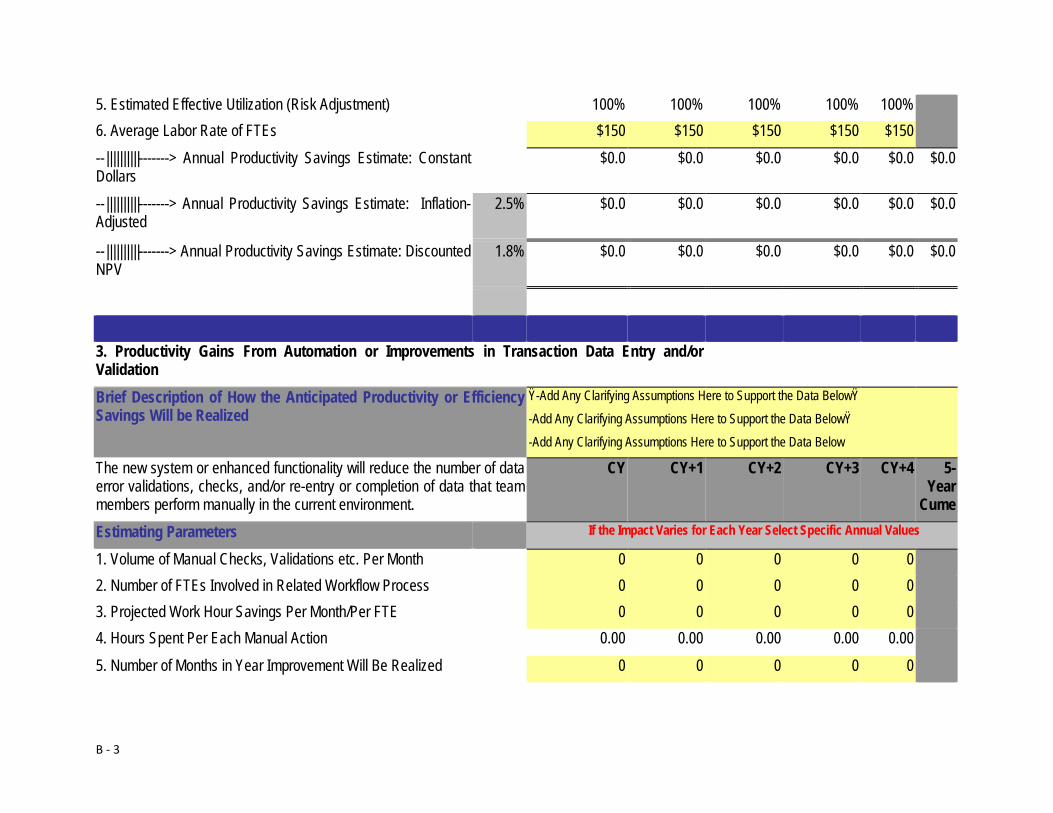
5. Estimated Effective Utilization (Risk Adjustment) 100% 100% 100% 100% 100% 6. Average Labor Rate of FTEs $150 $150 $150 $150 $150 --||||||||||-------> Annual Productivity Savings Estimate: Constant Dollars
$0.0 $0.0 $0.0 $0.0 $0.0 $0.0
--||||||||||-------> Annual Productivity Savings Estimate: Inflation-Adjusted
2.5% $0.0 $0.0 $0.0 $0.0 $0.0 $0.0
--||||||||||-------> Annual Productivity Savings Estimate: Discounted NPV
1.8% $0.0 $0.0 $0.0 $0.0 $0.0 $0.0
3. Productivity Gains From Automation or Improvements in Transaction Data Entry and/or Validation
Brief Description of How the Anticipated Productivity or Efficiency Savings Will be Realized
Ÿ-Add Any Clarifying Assumptions Here to Support the Data BelowŸ
-Add Any Clarifying Assumptions Here to Support the Data BelowŸ
-Add Any Clarifying Assumptions Here to Support the Data Below
The new system or enhanced functionality will reduce the number of data error validations, checks, and/or re-entry or completion of data that team members perform manually in the current environment.
CY CY+1 CY+2 CY+3 CY+4 5-Year
Cume Estimating Parameters If the Impact Varies for Each Year Select Specific Annual Values
1. Volume of Manual Checks, Validations etc. Per Month 0 0 0 0 0 2. Number of FTEs Involved in Related Workflow Process 0 0 0 0 0 3. Projected Work Hour Savings Per Month/Per FTE 0 0 0 0 0 4. Hours Spent Per Each Manual Action 0.00 0.00 0.00 0.00 0.00 5. Number of Months in Year Improvement Will Be Realized 0 0 0 0 0
B - 4
6. Estimated Effective Utilization (Risk Adjustment) 85% 85% 85% 85% 85% 7. Average Labor Rate of FTEs $0 $0 $0 $0 $0 --||||||||||-------> Annual Productivity Savings Estimate: Constant Dollars
$0.0 $0.0 $0.0 $0.0 $0.0 $0.0
--||||||||||-------> Annual Productivity Savings Estimate: Inflation-Adjusted
2.5% $0.0 $0.0 $0.0 $0.0 $0.0 $0.0
--||||||||||-------> Annual Productivity Savings Estimate: Discounted NPV
1.8% $0.0 $0.0 $0.0 $0.0 $0.0 $0.0
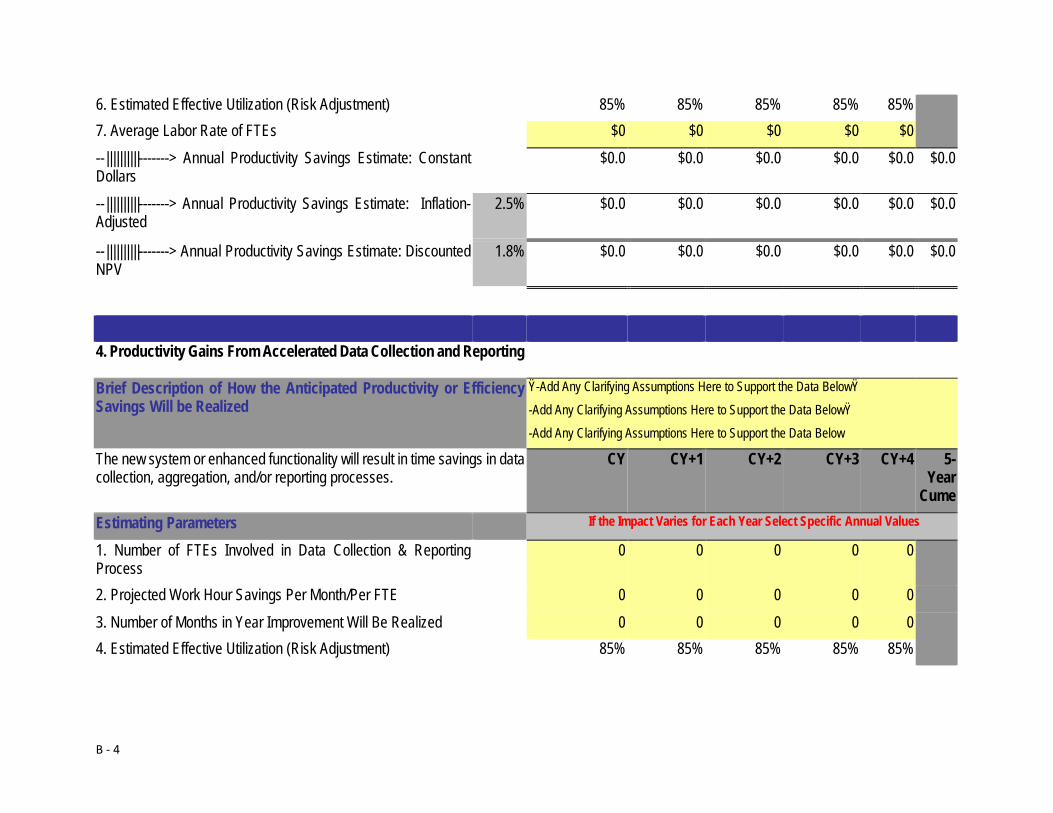
4. Productivity Gains From Accelerated Data Collection and Reporting
Brief Description of How the Anticipated Productivity or Efficiency Savings Will be Realized
Ÿ-Add Any Clarifying Assumptions Here to Support the Data BelowŸ
-Add Any Clarifying Assumptions Here to Support the Data BelowŸ
-Add Any Clarifying Assumptions Here to Support the Data Below
The new system or enhanced functionality will result in time savings in data collection, aggregation, and/or reporting processes.
CY CY+1 CY+2 CY+3 CY+4 5-Year
Cume Estimating Parameters If the Impact Varies for Each Year Select Specific Annual Values
1. Number of FTEs Involved in Data Collection & Reporting Process
0 0 0 0 0
2. Projected Work Hour Savings Per Month/Per FTE 0 0 0 0 0 3. Number of Months in Year Improvement Will Be Realized 0 0 0 0 0 4. Estimated Effective Utilization (Risk Adjustment) 85% 85% 85% 85% 85%
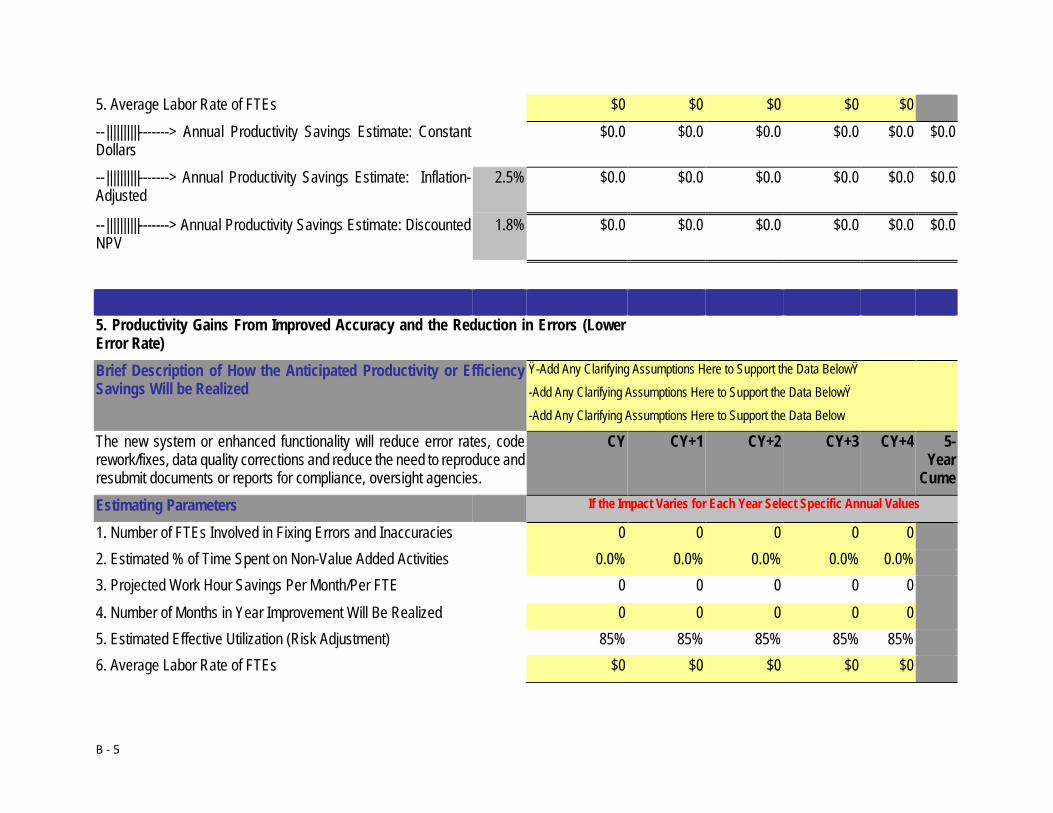
B - 5
5. Average Labor Rate of FTEs $0 $0 $0 $0 $0 --||||||||||-------> Annual Productivity Savings Estimate: Constant Dollars
$0.0 $0.0 $0.0 $0.0 $0.0 $0.0
--||||||||||-------> Annual Productivity Savings Estimate: Inflation-Adjusted
2.5% $0.0 $0.0 $0.0 $0.0 $0.0 $0.0
--||||||||||-------> Annual Productivity Savings Estimate: Discounted NPV
1.8% $0.0 $0.0 $0.0 $0.0 $0.0 $0.0
5. Productivity Gains From Improved Accuracy and the Reduction in Errors (Lower Error Rate)
Brief Description of How the Anticipated Productivity or Efficiency Savings Will be Realized
Ÿ-Add Any Clarifying Assumptions Here to Support the Data BelowŸ
-Add Any Clarifying Assumptions Here to Support the Data BelowŸ
-Add Any Clarifying Assumptions Here to Support the Data Below
The new system or enhanced functionality will reduce error rates, code rework/fixes, data quality corrections and reduce the need to reproduce and resubmit documents or reports for compliance, oversight agencies.
CY CY+1 CY+2 CY+3 CY+4 5-Year
Cume Estimating Parameters If the Impact Varies for Each Year Select Specific Annual Values
1. Number of FTEs Involved in Fixing Errors and Inaccuracies 0 0 0 0 0 2. Estimated % of Time Spent on Non-Value Added Activities 0.0% 0.0% 0.0% 0.0% 0.0% 3. Projected Work Hour Savings Per Month/Per FTE 0 0 0 0 0 4. Number of Months in Year Improvement Will Be Realized 0 0 0 0 0 5. Estimated Effective Utilization (Risk Adjustment) 85% 85% 85% 85% 85% 6. Average Labor Rate of FTEs $0 $0 $0 $0 $0
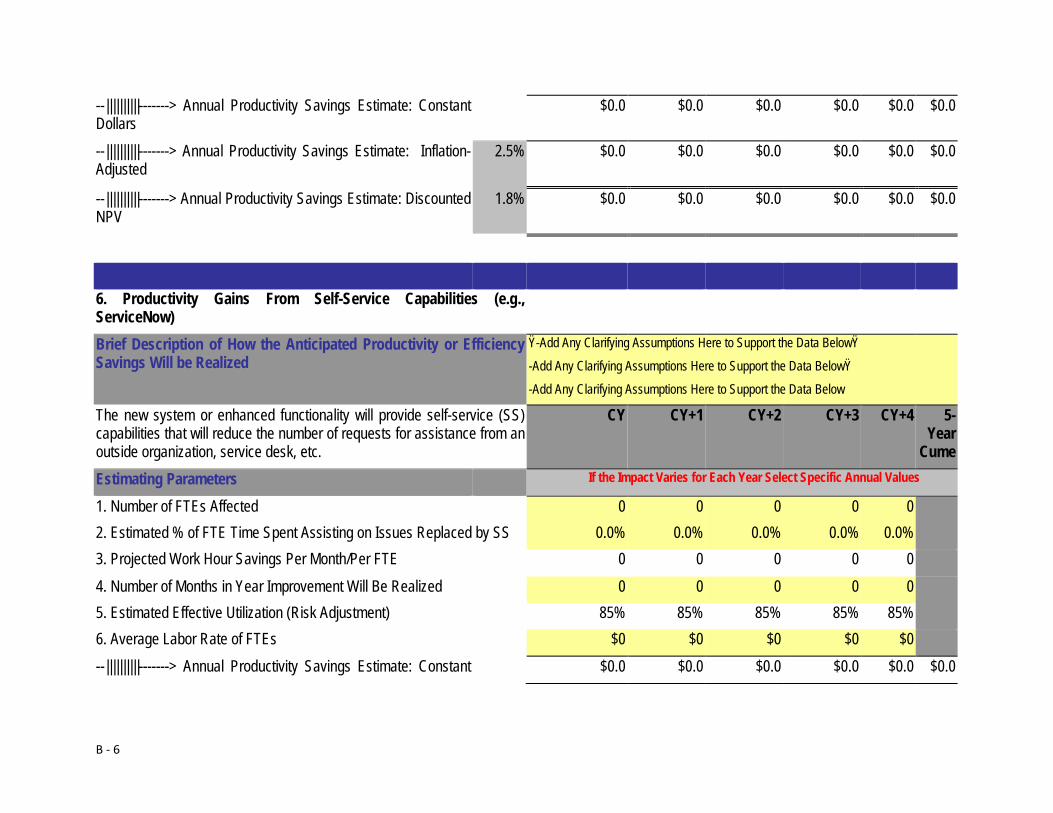
B - 6
--||||||||||-------> Annual Productivity Savings Estimate: Constant Dollars
$0.0 $0.0 $0.0 $0.0 $0.0 $0.0
--||||||||||-------> Annual Productivity Savings Estimate: Inflation-Adjusted
2.5% $0.0 $0.0 $0.0 $0.0 $0.0 $0.0
--||||||||||-------> Annual Productivity Savings Estimate: Discounted NPV
1.8% $0.0 $0.0 $0.0 $0.0 $0.0 $0.0
6. Productivity Gains From Self-Service Capabilities (e.g., ServiceNow)
Brief Description of How the Anticipated Productivity or Efficiency Savings Will be Realized
Ÿ-Add Any Clarifying Assumptions Here to Support the Data BelowŸ
-Add Any Clarifying Assumptions Here to Support the Data BelowŸ
-Add Any Clarifying Assumptions Here to Support the Data Below
The new system or enhanced functionality will provide self-service (SS) capabilities that will reduce the number of requests for assistance from an outside organization, service desk, etc.
CY CY+1 CY+2 CY+3 CY+4 5-Year
Cume Estimating Parameters If the Impact Varies for Each Year Select Specific Annual Values
1. Number of FTEs Affected 0 0 0 0 0 2. Estimated % of FTE Time Spent Assisting on Issues Replaced by SS 0.0% 0.0% 0.0% 0.0% 0.0% 3. Projected Work Hour Savings Per Month/Per FTE 0 0 0 0 0 4. Number of Months in Year Improvement Will Be Realized 0 0 0 0 0 5. Estimated Effective Utilization (Risk Adjustment) 85% 85% 85% 85% 85% 6. Average Labor Rate of FTEs $0 $0 $0 $0 $0 --||||||||||-------> Annual Productivity Savings Estimate: Constant $0.0 $0.0 $0.0 $0.0 $0.0 $0.0
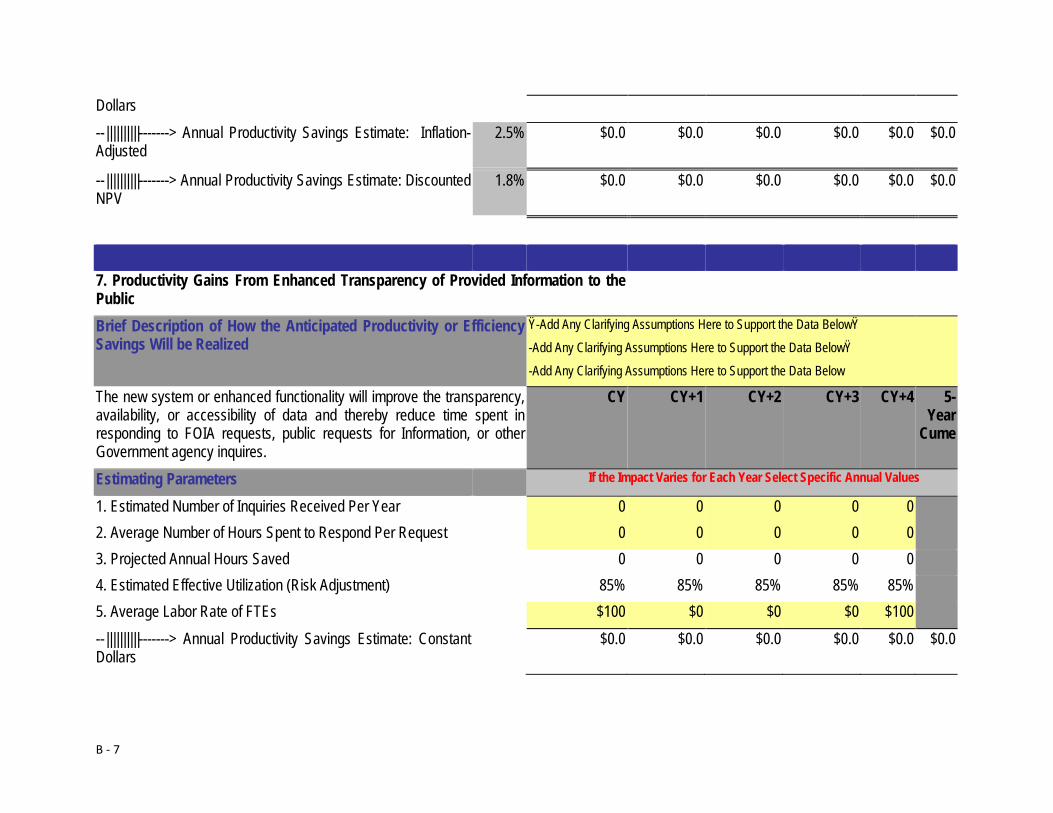
B - 7
Dollars --||||||||||-------> Annual Productivity Savings Estimate: Inflation-Adjusted
2.5% $0.0 $0.0 $0.0 $0.0 $0.0 $0.0
--||||||||||-------> Annual Productivity Savings Estimate: Discounted NPV
1.8% $0.0 $0.0 $0.0 $0.0 $0.0 $0.0
7. Productivity Gains From Enhanced Transparency of Provided Information to the Public
Brief Description of How the Anticipated Productivity or Efficiency Savings Will be Realized
Ÿ-Add Any Clarifying Assumptions Here to Support the Data BelowŸ
-Add Any Clarifying Assumptions Here to Support the Data BelowŸ
-Add Any Clarifying Assumptions Here to Support the Data Below
The new system or enhanced functionality will improve the transparency, availability, or accessibility of data and thereby reduce time spent in responding to FOIA requests, public requests for Information, or other Government agency inquires.
CY CY+1 CY+2 CY+3 CY+4 5-Year
Cume
Estimating Parameters If the Impact Varies for Each Year Select Specific Annual Values
1. Estimated Number of Inquiries Received Per Year 0 0 0 0 0 2. Average Number of Hours Spent to Respond Per Request 0 0 0 0 0 3. Projected Annual Hours Saved 0 0 0 0 0 4. Estimated Effective Utilization (Risk Adjustment) 85% 85% 85% 85% 85% 5. Average Labor Rate of FTEs $100 $0 $0 $0 $100 --||||||||||-------> Annual Productivity Savings Estimate: Constant Dollars
$0.0 $0.0 $0.0 $0.0 $0.0 $0.0
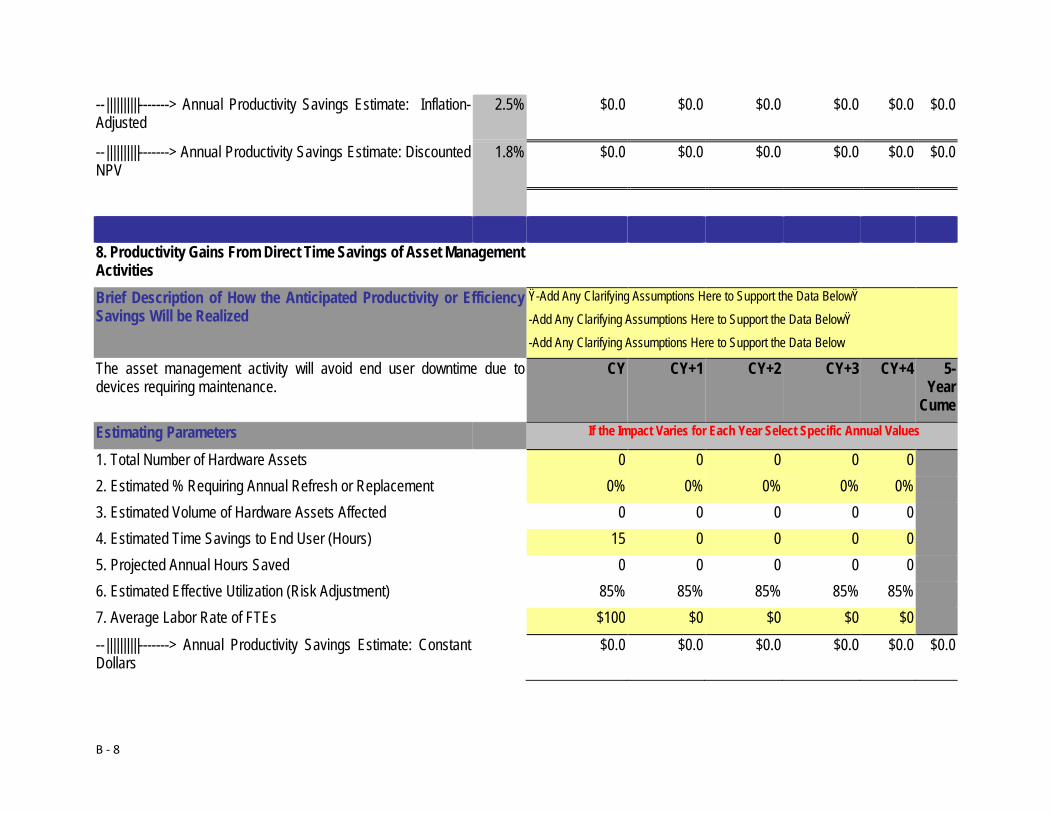
B - 8
--||||||||||-------> Annual Productivity Savings Estimate: Inflation-Adjusted
2.5% $0.0 $0.0 $0.0 $0.0 $0.0 $0.0
--||||||||||-------> Annual Productivity Savings Estimate: Discounted NPV
1.8% $0.0 $0.0 $0.0 $0.0 $0.0 $0.0
8. Productivity Gains From Direct Time Savings of Asset Management Activities
Brief Description of How the Anticipated Productivity or Efficiency Savings Will be Realized
Ÿ-Add Any Clarifying Assumptions Here to Support the Data BelowŸ
-Add Any Clarifying Assumptions Here to Support the Data BelowŸ
-Add Any Clarifying Assumptions Here to Support the Data Below
The asset management activity will avoid end user downtime due to devices requiring maintenance.
CY CY+1 CY+2 CY+3 CY+4 5-Year
Cume Estimating Parameters If the Impact Varies for Each Year Select Specific Annual Values
1. Total Number of Hardware Assets 0 0 0 0 0 2. Estimated % Requiring Annual Refresh or Replacement 0% 0% 0% 0% 0% 3. Estimated Volume of Hardware Assets Affected 0 0 0 0 0 4. Estimated Time Savings to End User (Hours) 15 0 0 0 0 5. Projected Annual Hours Saved 0 0 0 0 0 6. Estimated Effective Utilization (Risk Adjustment) 85% 85% 85% 85% 85% 7. Average Labor Rate of FTEs $100 $0 $0 $0 $0 --||||||||||-------> Annual Productivity Savings Estimate: Constant Dollars
$0.0 $0.0 $0.0 $0.0 $0.0 $0.0
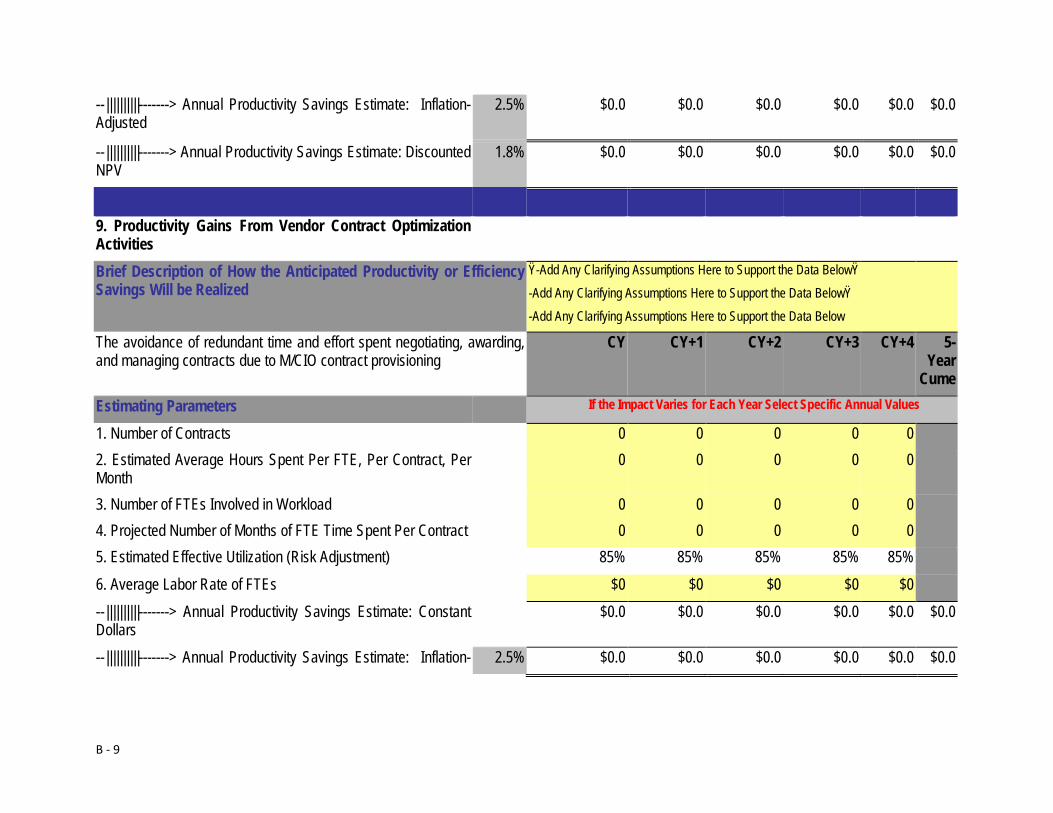
B - 9
--||||||||||-------> Annual Productivity Savings Estimate: Inflation-Adjusted
2.5% $0.0 $0.0 $0.0 $0.0 $0.0 $0.0
--||||||||||-------> Annual Productivity Savings Estimate: Discounted NPV
1.8% $0.0 $0.0 $0.0 $0.0 $0.0 $0.0
9. Productivity Gains From Vendor Contract Optimization Activities
Brief Description of How the Anticipated Productivity or Efficiency Savings Will be Realized
Ÿ-Add Any Clarifying Assumptions Here to Support the Data BelowŸ
-Add Any Clarifying Assumptions Here to Support the Data BelowŸ
-Add Any Clarifying Assumptions Here to Support the Data Below
The avoidance of redundant time and effort spent negotiating, awarding, and managing contracts due to M/CIO contract provisioning
CY CY+1 CY+2 CY+3 CY+4 5-Year
Cume Estimating Parameters If the Impact Varies for Each Year Select Specific Annual Values
1. Number of Contracts 0 0 0 0 0 2. Estimated Average Hours Spent Per FTE, Per Contract, Per Month
0 0 0 0 0
3. Number of FTEs Involved in Workload 0 0 0 0 0 4. Projected Number of Months of FTE Time Spent Per Contract 0 0 0 0 0 5. Estimated Effective Utilization (Risk Adjustment) 85% 85% 85% 85% 85% 6. Average Labor Rate of FTEs $0 $0 $0 $0 $0 --||||||||||-------> Annual Productivity Savings Estimate: Constant Dollars
$0.0 $0.0 $0.0 $0.0 $0.0 $0.0
--||||||||||-------> Annual Productivity Savings Estimate: Inflation- 2.5% $0.0 $0.0 $0.0 $0.0 $0.0 $0.0
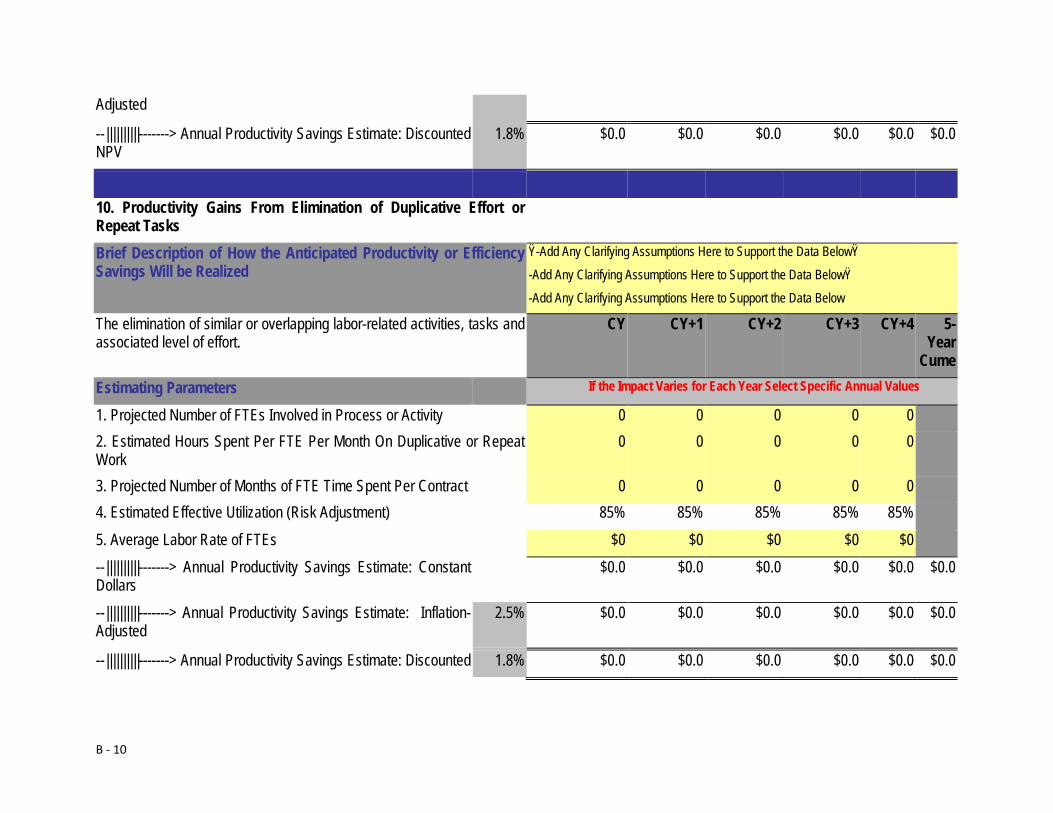
B - 10
Adjusted
--||||||||||-------> Annual Productivity Savings Estimate: Discounted NPV
1.8% $0.0 $0.0 $0.0 $0.0 $0.0 $0.0
10. Productivity Gains From Elimination of Duplicative Effort or Repeat Tasks
Brief Description of How the Anticipated Productivity or Efficiency Savings Will be Realized
Ÿ-Add Any Clarifying Assumptions Here to Support the Data BelowŸ
-Add Any Clarifying Assumptions Here to Support the Data BelowŸ
-Add Any Clarifying Assumptions Here to Support the Data Below
The elimination of similar or overlapping labor-related activities, tasks and associated level of effort.
CY CY+1 CY+2 CY+3 CY+4 5-Year
Cume Estimating Parameters If the Impact Varies for Each Year Select Specific Annual Values
1. Projected Number of FTEs Involved in Process or Activity 0 0 0 0 0 2. Estimated Hours Spent Per FTE Per Month On Duplicative or Repeat Work
0 0 0 0 0
3. Projected Number of Months of FTE Time Spent Per Contract 0 0 0 0 0 4. Estimated Effective Utilization (Risk Adjustment) 85% 85% 85% 85% 85% 5. Average Labor Rate of FTEs $0 $0 $0 $0 $0 --||||||||||-------> Annual Productivity Savings Estimate: Constant Dollars
$0.0 $0.0 $0.0 $0.0 $0.0 $0.0
--||||||||||-------> Annual Productivity Savings Estimate: Inflation-Adjusted
2.5% $0.0 $0.0 $0.0 $0.0 $0.0 $0.0
--||||||||||-------> Annual Productivity Savings Estimate: Discounted 1.8% $0.0 $0.0 $0.0 $0.0 $0.0 $0.0
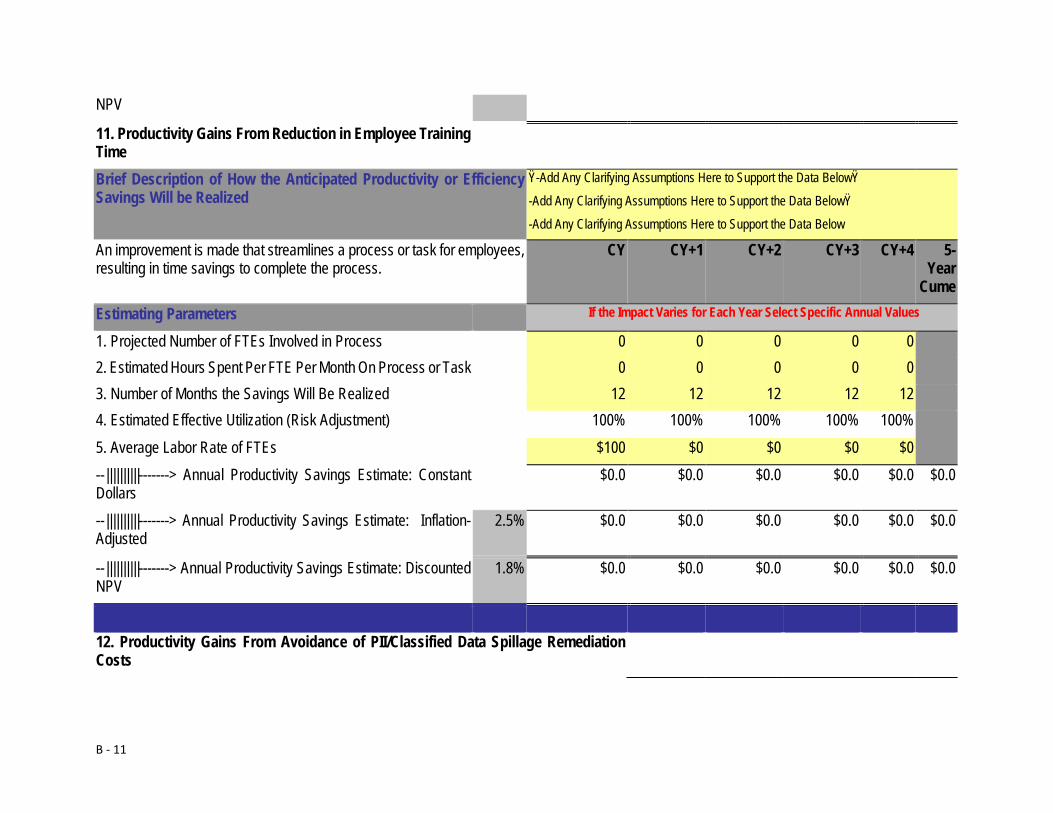
B - 11
NPV
11. Productivity Gains From Reduction in Employee Training Time
Brief Description of How the Anticipated Productivity or Efficiency Savings Will be Realized
Ÿ-Add Any Clarifying Assumptions Here to Support the Data BelowŸ
-Add Any Clarifying Assumptions Here to Support the Data BelowŸ
-Add Any Clarifying Assumptions Here to Support the Data Below
An improvement is made that streamlines a process or task for employees, resulting in time savings to complete the process.
CY CY+1 CY+2 CY+3 CY+4 5-Year
Cume Estimating Parameters If the Impact Varies for Each Year Select Specific Annual Values
1. Projected Number of FTEs Involved in Process 0 0 0 0 0 2. Estimated Hours Spent Per FTE Per Month On Process or Task 0 0 0 0 0 3. Number of Months the Savings Will Be Realized 12 12 12 12 12 4. Estimated Effective Utilization (Risk Adjustment) 100% 100% 100% 100% 100% 5. Average Labor Rate of FTEs $100 $0 $0 $0 $0 --||||||||||-------> Annual Productivity Savings Estimate: Constant Dollars
$0.0 $0.0 $0.0 $0.0 $0.0 $0.0
--||||||||||-------> Annual Productivity Savings Estimate: Inflation-Adjusted
2.5% $0.0 $0.0 $0.0 $0.0 $0.0 $0.0
--||||||||||-------> Annual Productivity Savings Estimate: Discounted NPV
1.8% $0.0 $0.0 $0.0 $0.0 $0.0 $0.0
12. Productivity Gains From Avoidance of PII/Classified Data Spillage Remediation Costs
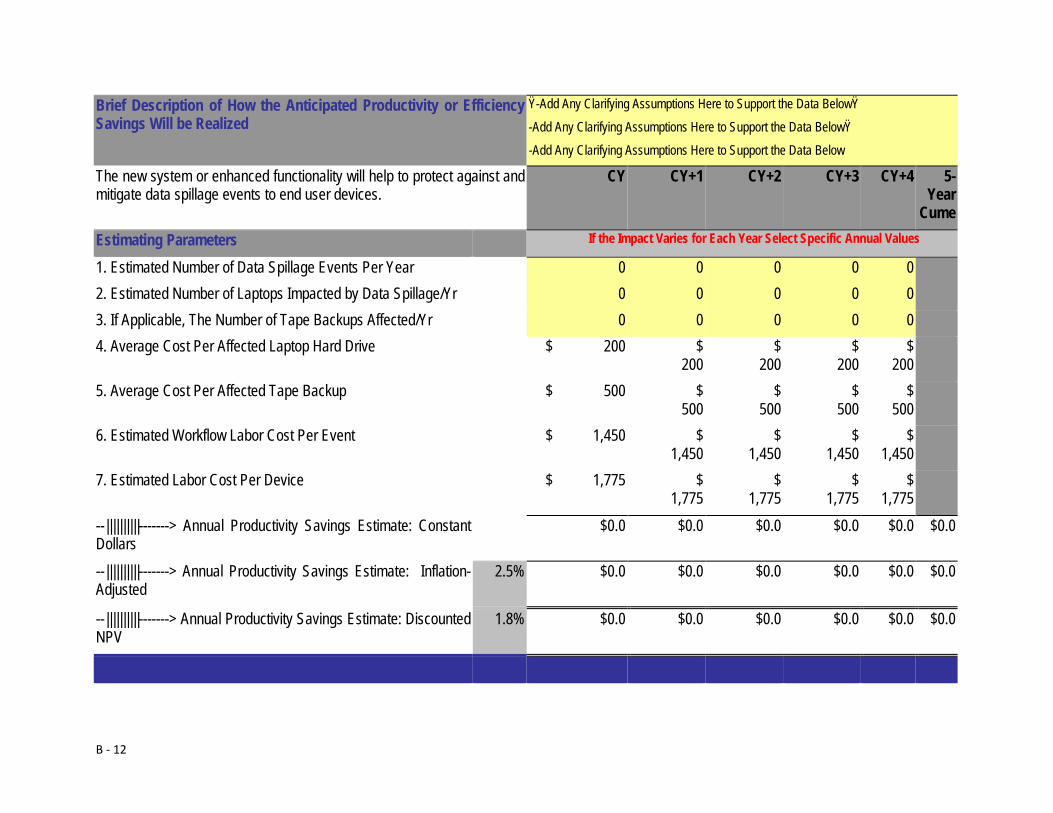
B - 12
Brief Description of How the Anticipated Productivity or Efficiency Savings Will be Realized
Ÿ-Add Any Clarifying Assumptions Here to Support the Data BelowŸ
-Add Any Clarifying Assumptions Here to Support the Data BelowŸ
-Add Any Clarifying Assumptions Here to Support the Data Below
The new system or enhanced functionality will help to protect against and mitigate data spillage events to end user devices.
CY CY+1 CY+2 CY+3 CY+4 5-Year
Cume Estimating Parameters If the Impact Varies for Each Year Select Specific Annual Values
1. Estimated Number of Data Spillage Events Per Year 0 0 0 0 0 2. Estimated Number of Laptops Impacted by Data Spillage/Yr 0 0 0 0 0 3. If Applicable, The Number of Tape Backups Affected/Yr 0 0 0 0 0 4. Average Cost Per Affected Laptop Hard Drive $ 200 $
200 $
200 $
200 $
200
5. Average Cost Per Affected Tape Backup $ 500 $ 500
$ 500
$ 500
$ 500
6. Estimated Workflow Labor Cost Per Event $ 1,450 $ 1,450
$ 1,450
$ 1,450
$ 1,450
7. Estimated Labor Cost Per Device $ 1,775 $ 1,775
$ 1,775
$ 1,775
$ 1,775
--||||||||||-------> Annual Productivity Savings Estimate: Constant Dollars
$0.0 $0.0 $0.0 $0.0 $0.0 $0.0
--||||||||||-------> Annual Productivity Savings Estimate: Inflation-Adjusted
2.5% $0.0 $0.0 $0.0 $0.0 $0.0 $0.0
--||||||||||-------> Annual Productivity Savings Estimate: Discounted NPV
1.8% $0.0 $0.0 $0.0 $0.0 $0.0 $0.0
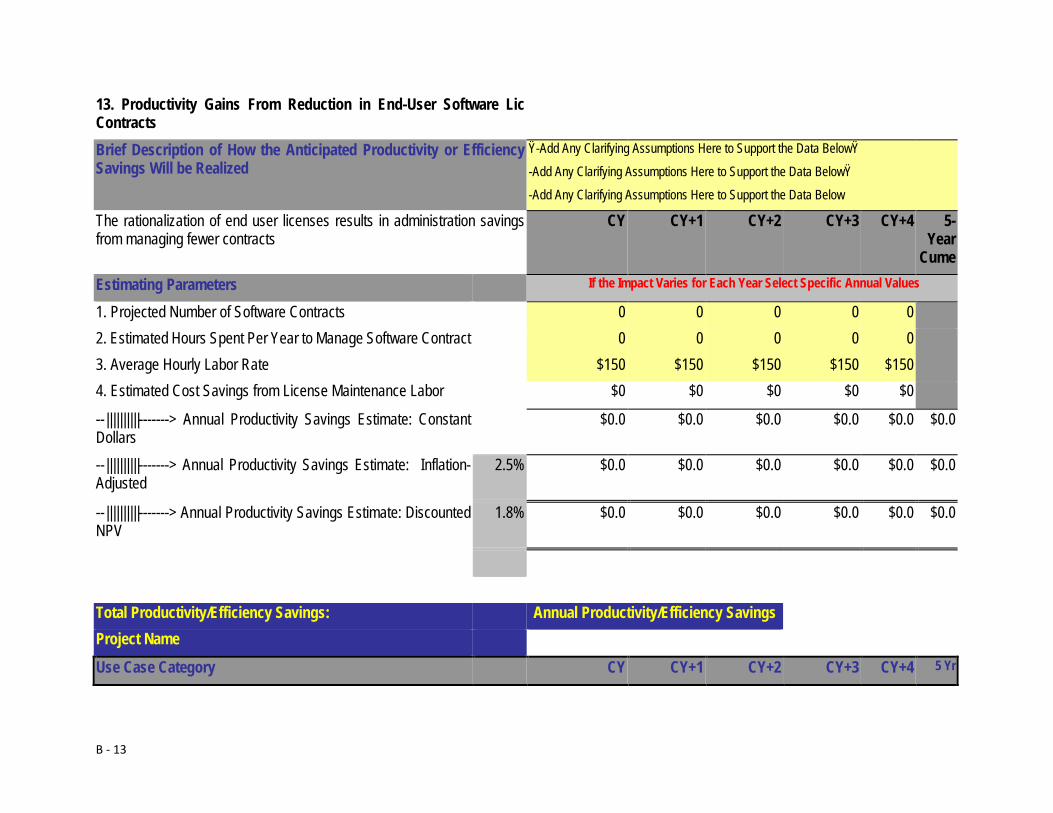
B - 13
13. Productivity Gains From Reduction in End-User Software Lic Contracts
Brief Description of How the Anticipated Productivity or Efficiency Savings Will be Realized
Ÿ-Add Any Clarifying Assumptions Here to Support the Data BelowŸ
-Add Any Clarifying Assumptions Here to Support the Data BelowŸ
-Add Any Clarifying Assumptions Here to Support the Data Below
The rationalization of end user licenses results in administration savings from managing fewer contracts
CY CY+1 CY+2 CY+3 CY+4 5-Year
Cume Estimating Parameters If the Impact Varies for Each Year Select Specific Annual Values
1. Projected Number of Software Contracts 0 0 0 0 0 2. Estimated Hours Spent Per Year to Manage Software Contract 0 0 0 0 0 3. Average Hourly Labor Rate $150 $150 $150 $150 $150 4. Estimated Cost Savings from License Maintenance Labor $0 $0 $0 $0 $0
--||||||||||-------> Annual Productivity Savings Estimate: Constant Dollars
$0.0 $0.0 $0.0 $0.0 $0.0 $0.0
--||||||||||-------> Annual Productivity Savings Estimate: Inflation-Adjusted
2.5% $0.0 $0.0 $0.0 $0.0 $0.0 $0.0
--||||||||||-------> Annual Productivity Savings Estimate: Discounted NPV
1.8% $0.0 $0.0 $0.0 $0.0 $0.0 $0.0
Total Productivity/Efficiency Savings: Annual Productivity/Efficiency Savings Project Name
Use Case Category CY CY+1 CY+2 CY+3 CY+4 5 Yr
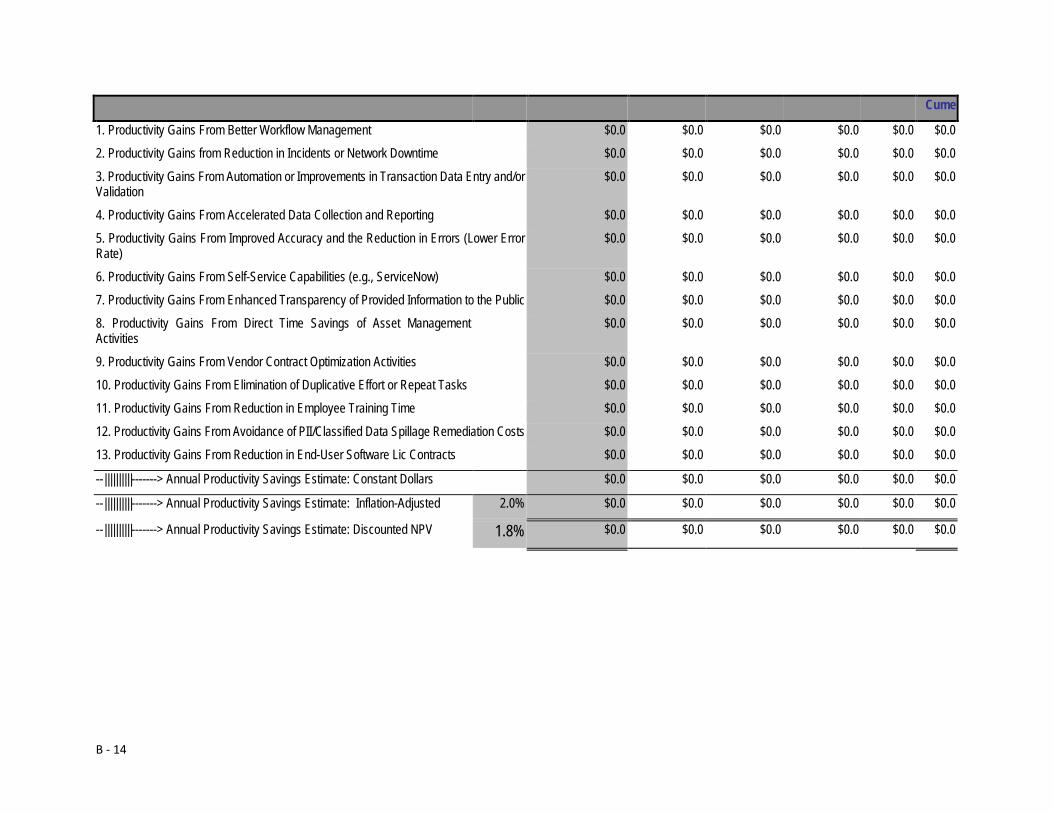
B - 14
Cume
1. Productivity Gains From Better Workflow Management $0.0 $0.0 $0.0 $0.0 $0.0 $0.0
2. Productivity Gains from Reduction in Incidents or Network Downtime $0.0 $0.0 $0.0 $0.0 $0.0 $0.0
3. Productivity Gains From Automation or Improvements in Transaction Data Entry and/or Validation
$0.0 $0.0 $0.0 $0.0 $0.0 $0.0
4. Productivity Gains From Accelerated Data Collection and Reporting $0.0 $0.0 $0.0 $0.0 $0.0 $0.0
5. Productivity Gains From Improved Accuracy and the Reduction in Errors (Lower Error Rate)
$0.0 $0.0 $0.0 $0.0 $0.0 $0.0
6. Productivity Gains From Self-Service Capabilities (e.g., ServiceNow) $0.0 $0.0 $0.0 $0.0 $0.0 $0.0
7. Productivity Gains From Enhanced Transparency of Provided Information to the Public $0.0 $0.0 $0.0 $0.0 $0.0 $0.0
8. Productivity Gains From Direct Time Savings of Asset Management Activities
$0.0 $0.0 $0.0 $0.0 $0.0 $0.0
9. Productivity Gains From Vendor Contract Optimization Activities $0.0 $0.0 $0.0 $0.0 $0.0 $0.0
10. Productivity Gains From Elimination of Duplicative Effort or Repeat Tasks $0.0 $0.0 $0.0 $0.0 $0.0 $0.0
11. Productivity Gains From Reduction in Employee Training Time $0.0 $0.0 $0.0 $0.0 $0.0 $0.0
12. Productivity Gains From Avoidance of PII/Classified Data Spillage Remediation Costs $0.0 $0.0 $0.0 $0.0 $0.0 $0.0
13. Productivity Gains From Reduction in End-User Software Lic Contracts $0.0 $0.0 $0.0 $0.0 $0.0 $0.0
--||||||||||-------> Annual Productivity Savings Estimate: Constant Dollars $0.0 $0.0 $0.0 $0.0 $0.0 $0.0
--||||||||||-------> Annual Productivity Savings Estimate: Inflation-Adjusted 2.0% $0.0 $0.0 $0.0 $0.0 $0.0 $0.0
--||||||||||-------> Annual Productivity Savings Estimate: Discounted NPV 1.8% $0.0 $0.0 $0.0 $0.0 $0.0 $0.0
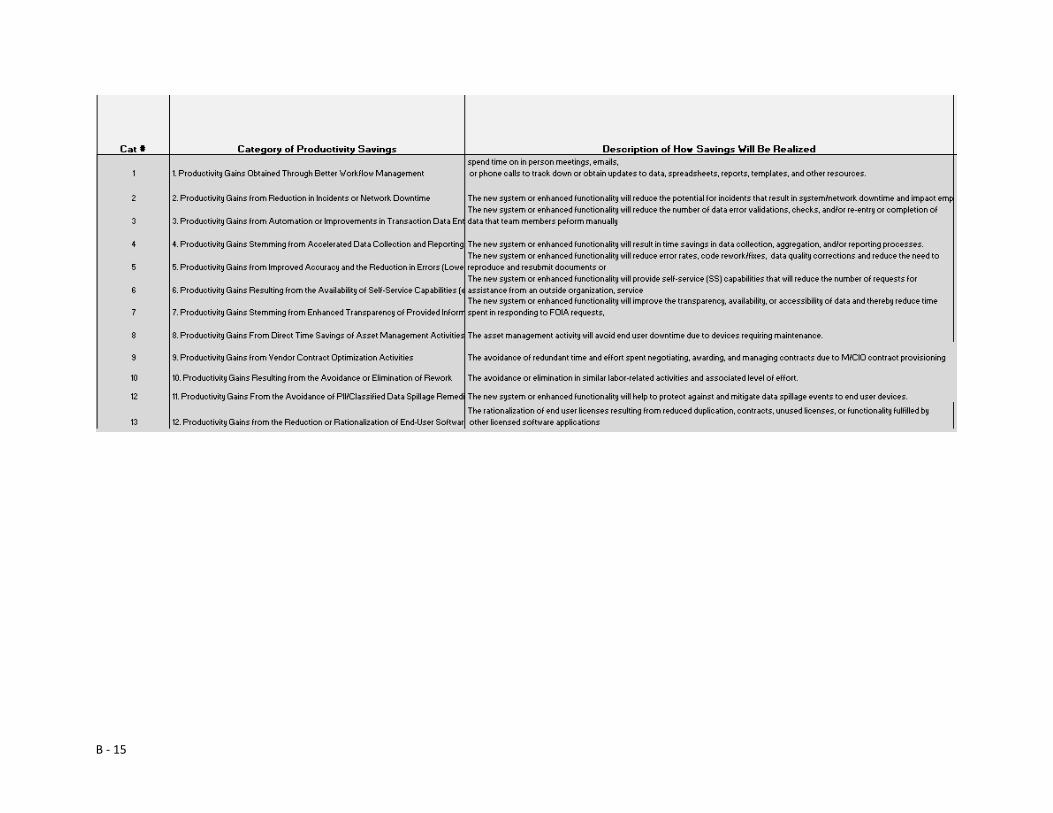
B - 15
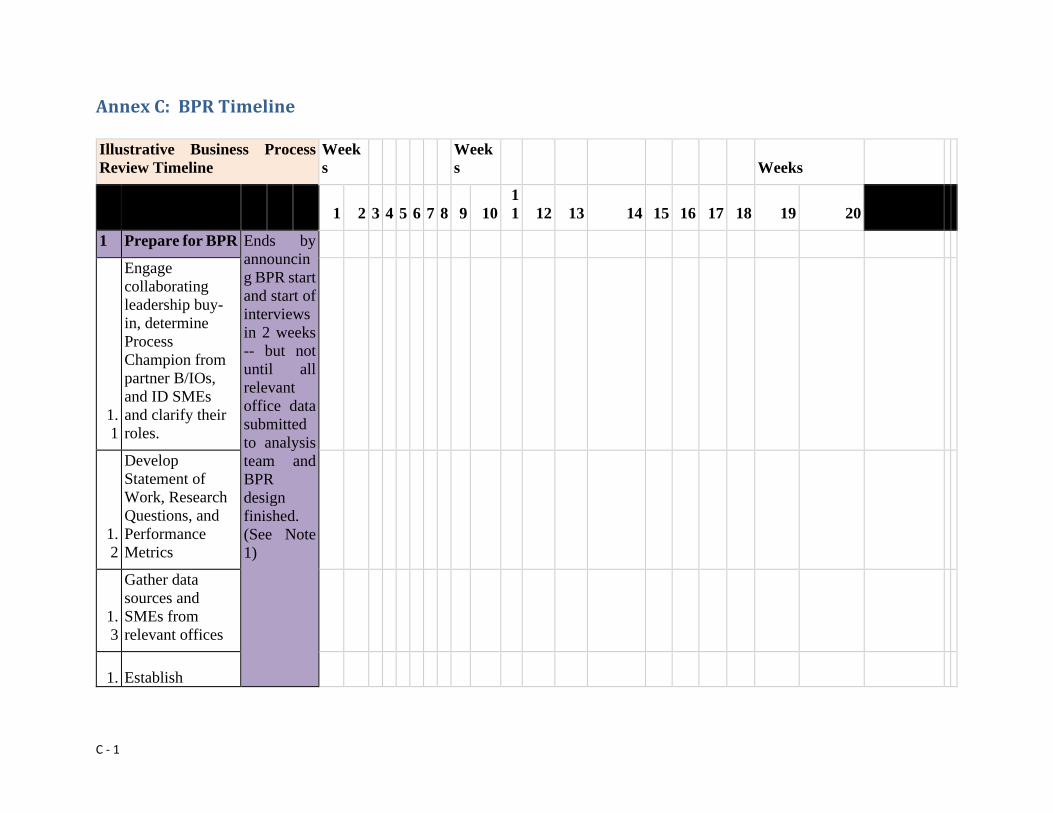
C - 1
Annex C: BPR Timeline Illustrative Business Process Review Timeline
Weeks
Weeks
Weeks
1 2 3 4 5 6 7 8 9 10
11 12 13 14 15 16 17 18 19 20
1 Prepare for BPR Ends by
announcing BPR start and start of interviews in 2 weeks -- but not until all relevant office data submitted to analysis team and BPR design finished. (See Note 1)
1.1
Engage collaborating leadership buy-in, determine Process Champion from partner B/IOs, and ID SMEs and clarify their roles.
1.2
Develop Statement of Work, Research Questions, and Performance Metrics
1.3
Gather data sources and SMEs from relevant offices
1. Establish
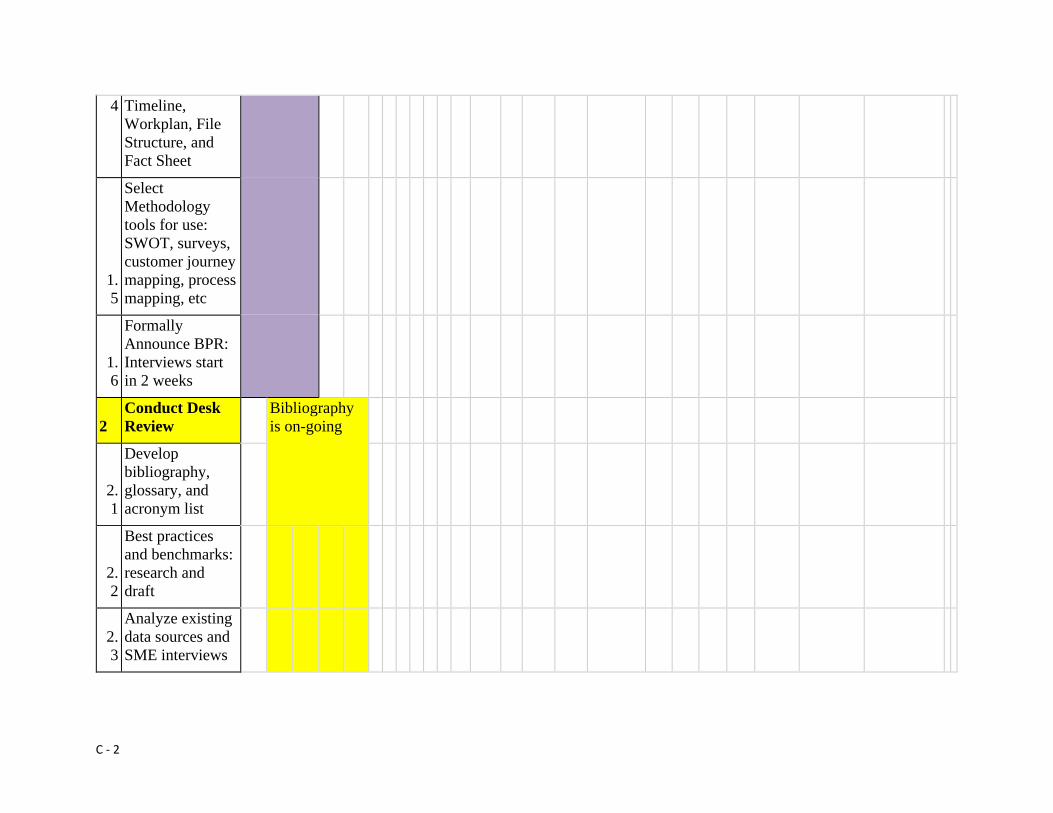
C - 2
4 Timeline, Workplan, File Structure, and Fact Sheet
1.5
Select Methodology tools for use: SWOT, surveys, customer journey mapping, process mapping, etc
1.6
Formally Announce BPR: Interviews start in 2 weeks
2 Conduct Desk Review
Bibliography is on-going
2.1
Develop bibliography, glossary, and acronym list
2.2
Best practices and benchmarks: research and draft
2.3
Analyze existing data sources and SME interviews
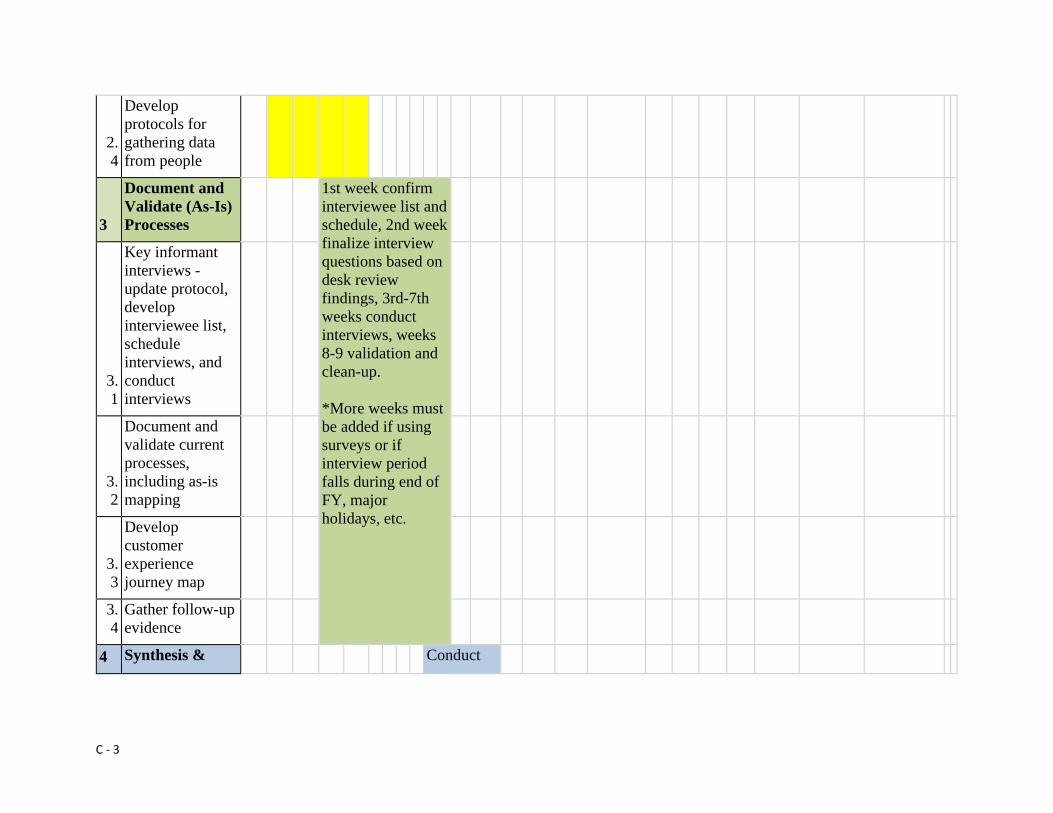
C - 3
2.4
Develop protocols for gathering data from people
3
Document and Validate (As-Is) Processes
1st week confirm interviewee list and schedule, 2nd week finalize interview questions based on desk review findings, 3rd-7th weeks conduct interviews, weeks 8-9 validation and clean-up. *More weeks must be added if using surveys or if interview period falls during end of FY, major holidays, etc.
3.1
Key informant interviews - update protocol, develop interviewee list, schedule interviews, and conduct interviews
3.2
Document and validate current processes, including as-is mapping
3.3
Develop customer experience journey map
3.4
Gather follow-up evidence
4 Synthesis &
Conduct
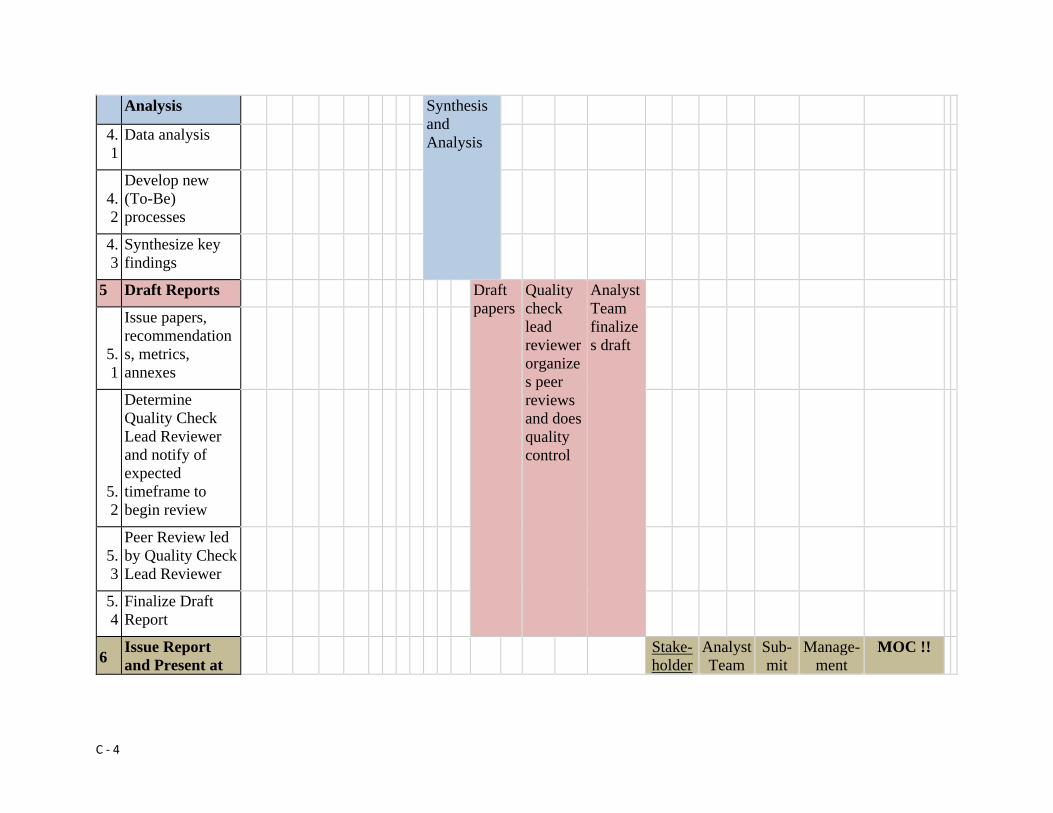
C - 4
Analysis Synthesis and Analysis 4.
1 Data analysis
4.2
Develop new (To-Be) processes
4.3
Synthesize key findings
5 Draft Reports
Draft papers
Quality check lead reviewer organizes peer reviews and does quality control
Analyst Team finalizes draft
5.1
Issue papers, recommendations, metrics, annexes
5.2
Determine Quality Check Lead Reviewer and notify of expected timeframe to begin review
5.3
Peer Review led by Quality Check Lead Reviewer
5.4
Finalize Draft Report
6 Issue Report and Present at
Stake-holder
Analyst Team
Sub- mit
Manage-ment
MOC !!
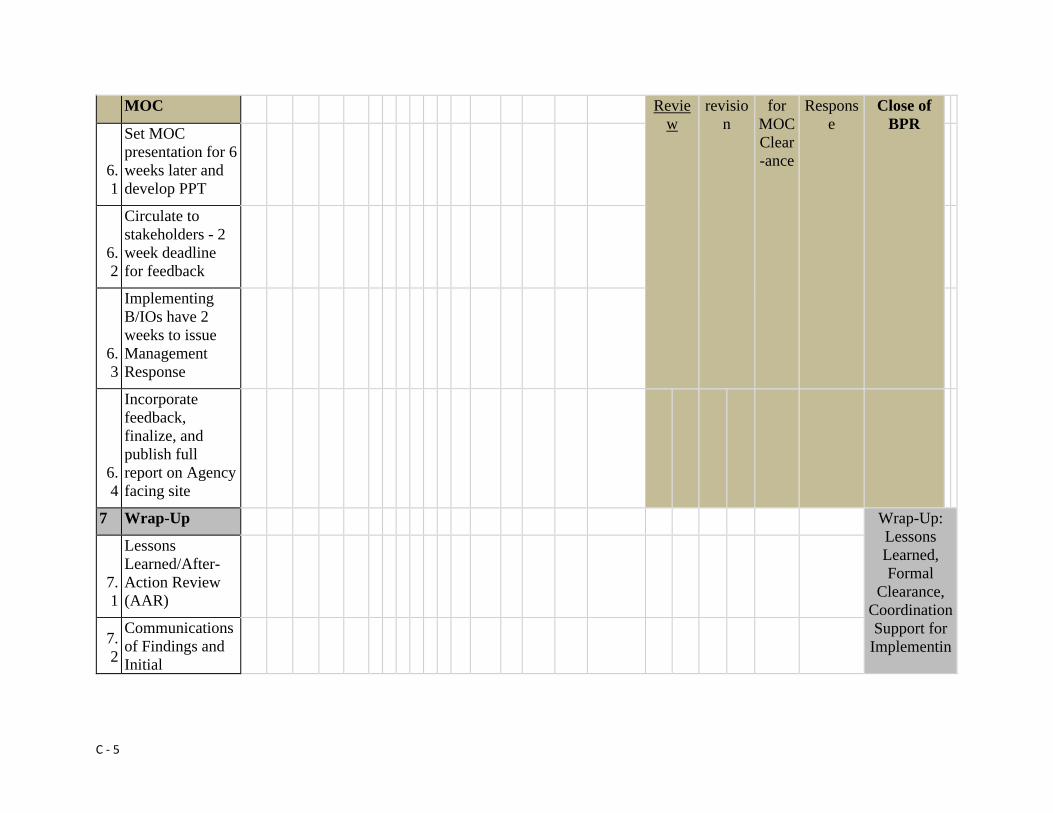
C - 5
MOC Review
revision
for MOC Clear-ance
Response
Close of BPR
6.1
Set MOC presentation for 6 weeks later and develop PPT
6.2
Circulate to stakeholders - 2 week deadline for feedback
6.3
Implementing B/IOs have 2 weeks to issue Management Response
6.4
Incorporate feedback, finalize, and publish full report on Agency facing site
7 Wrap-Up
Wrap-Up: Lessons Learned, Formal
Clearance, Coordination Support for
Implementin
7.1
Lessons Learned/After-Action Review (AAR)
7.2
Communications of Findings and Initial
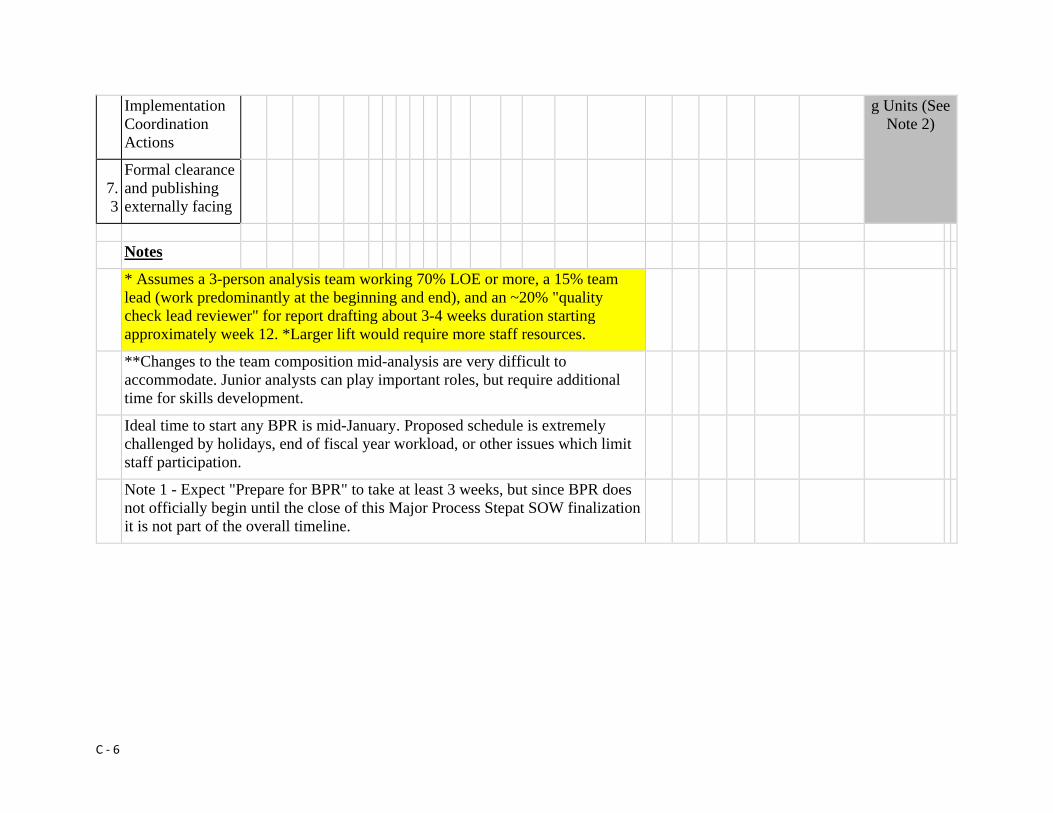
C - 6
Implementation Coordination Actions
g Units (See Note 2)
7.3
Formal clearance and publishing externally facing
Notes
* Assumes a 3-person analysis team working 70% LOE or more, a 15% team lead (work predominantly at the beginning and end), and an ~20% "quality check lead reviewer" for report drafting about 3-4 weeks duration starting approximately week 12. *Larger lift would require more staff resources.
**Changes to the team composition mid-analysis are very difficult to accommodate. Junior analysts can play important roles, but require additional time for skills development.
Ideal time to start any BPR is mid-January. Proposed schedule is extremely challenged by holidays, end of fiscal year workload, or other issues which limit staff participation.
Note 1 - Expect "Prepare for BPR" to take at least 3 weeks, but since BPR does not officially begin until the close of this Major Process Stepat SOW finalization it is not part of the overall timeline.
D - 1
Annex D: Business Process Mapping Methodology
What: Business process mapping involves graphically defining what an organization does, who is responsible for each step, and how long each step takes.
When to Use: You should consider using business process mapping when trying to identify specific pain-points and areas where the organization can gain efficiencies in a process or function. Depending on the situation, there may be no recognized process map often accompanied by staff performing the process with great variability or there may be a map which is no longer used, has become obsolete due to changes, or otherwise changed over time.
“As-Is” and “To-Be” Maps: When conducting business process mapping at USAID, we typically create two maps – an “as-is” and a “to-be” state.
The “as-is” map documents the current reality and serves as a baseline for measuring change under proposed recommended changes. It is best created as directly as possible by or with the input of staff that actually work the process. When conducting “as-is” mapping directly with staff, it is a great learning tool as staff see and hear the variability in process and outcomes that each other follows. Analyzing the “as-is” map leads to findings of processes and subprocesses for improvement.
“To-be” maps project a future, recommended process flow to improve efficiency and effectiveness and includes benchmarks for performance. Insights found during “as-is” mapping, areas of waste or redundancy identified for removal, and other data gathered during the BPR inform creation of the “to-be” map. Staff that work a process should at least partially inform a “to-be” map and they must be able to easily understand and follow the “to-be” map. However, the “to-be” map may be created directly by the BPR team based on accumulated insights learned over the course of the BPR.
How: Guidelines for process mapping
For “as-is” mapping: 1. Assemble the core process team – every actor who contributes or works a part of the process; 2. Distribute “sticky notes” to all participants which can represent processes or decision points; 3. To keep the mapping visual and inclusive, walk through the process with ample space such as a large whiteboard and instruct all participants that anyone can add “sticky notes” to indicate a process step they use; 4. Discuss each step in the process and come to an agreement on: a) who is responsible, and b) in what time frame or time variation; and 5. Document the final map using diagramming software such as Microsoft Visio.
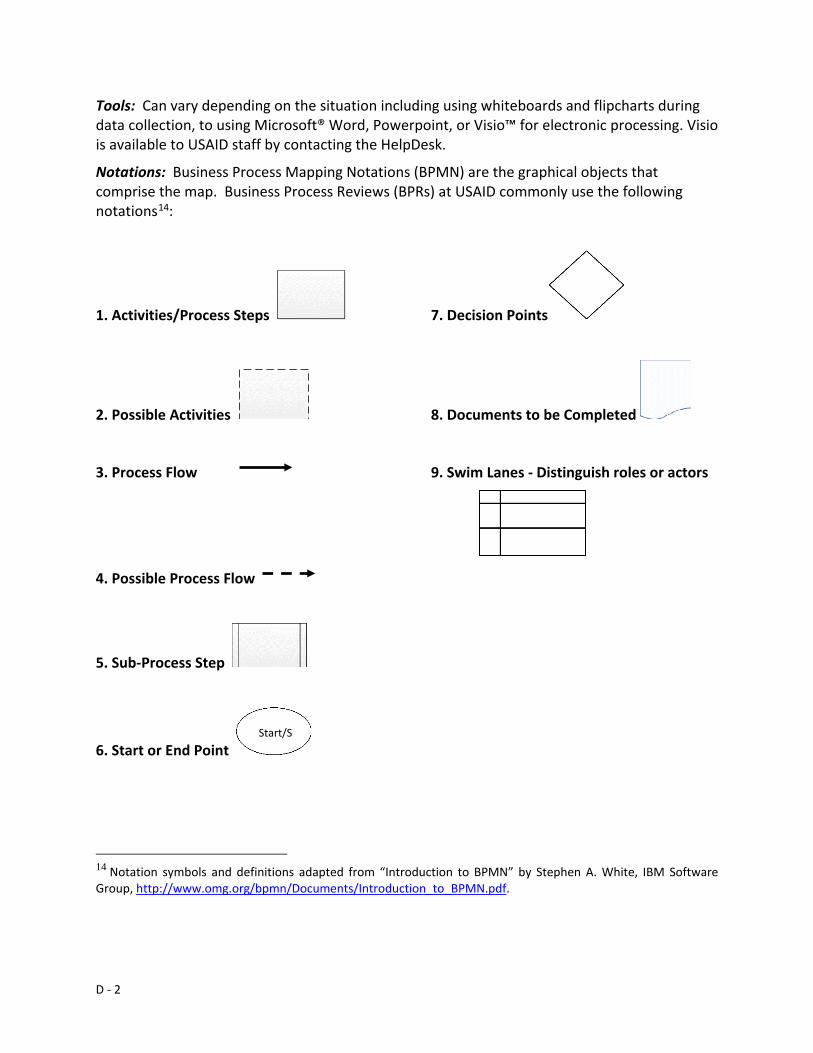
D - 2
Tools: Can vary depending on the situation including using whiteboards and flipcharts during data collection, to using Microsoft® Word, Powerpoint, or Visio™ for electronic processing. Visio is available to USAID staff by contacting the HelpDesk.
Notations: Business Process Mapping Notations (BPMN) are the graphical objects that comprise the map. Business Process Reviews (BPRs) at USAID commonly use the following notations14:
1. Activities/Process Steps 7. Decision Points
2. Possible Activities 8. Documents to be Completed
3. Process Flow 9. Swim Lanes - Distinguish roles or actors
4. Possible Process Flow
5. Sub-Process Step
6. Start or End Point
14 Notation symbols and definitions adapted from “Introduction to BPMN” by Stephen A. White, IBM Software Group, http://www.omg.org/bpmn/Documents/Introduction_to_BPMN.pdf.
Start/S
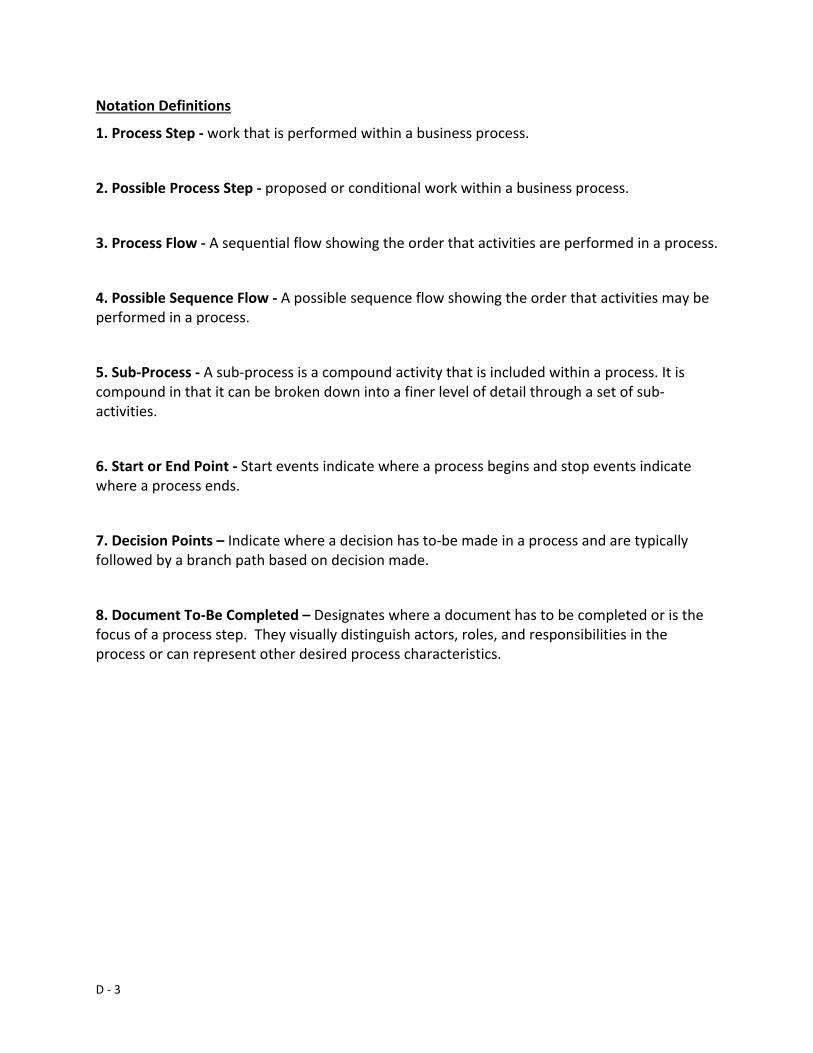
D - 3
Notation Definitions
1. Process Step - work that is performed within a business process.
2. Possible Process Step - proposed or conditional work within a business process.
3. Process Flow - A sequential flow showing the order that activities are performed in a process.
4. Possible Sequence Flow - A possible sequence flow showing the order that activities may be performed in a process.
5. Sub-Process - A sub-process is a compound activity that is included within a process. It is compound in that it can be broken down into a finer level of detail through a set of sub-activities.
6. Start or End Point - Start events indicate where a process begins and stop events indicate where a process ends.
7. Decision Points – Indicate where a decision has to-be made in a process and are typically followed by a branch path based on decision made.
8. Document To-Be Completed – Designates where a document has to be completed or is the focus of a process step. They visually distinguish actors, roles, and responsibilities in the process or can represent other desired process characteristics.
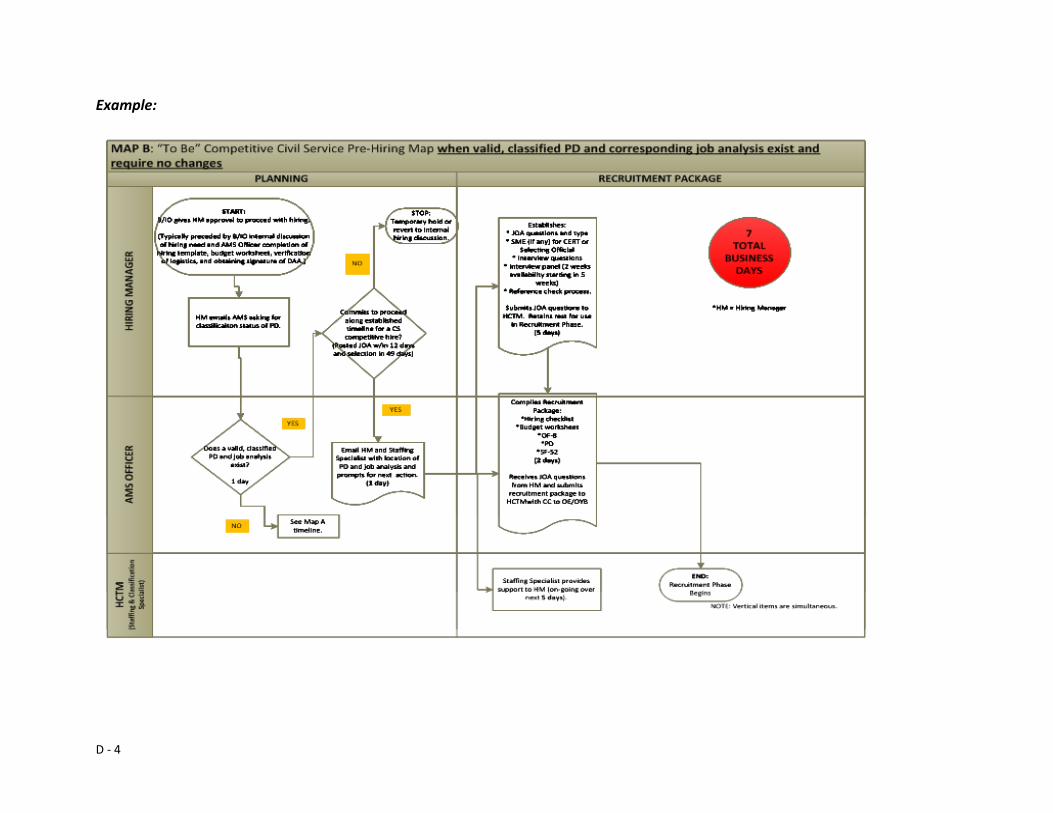
D - 4
Example:
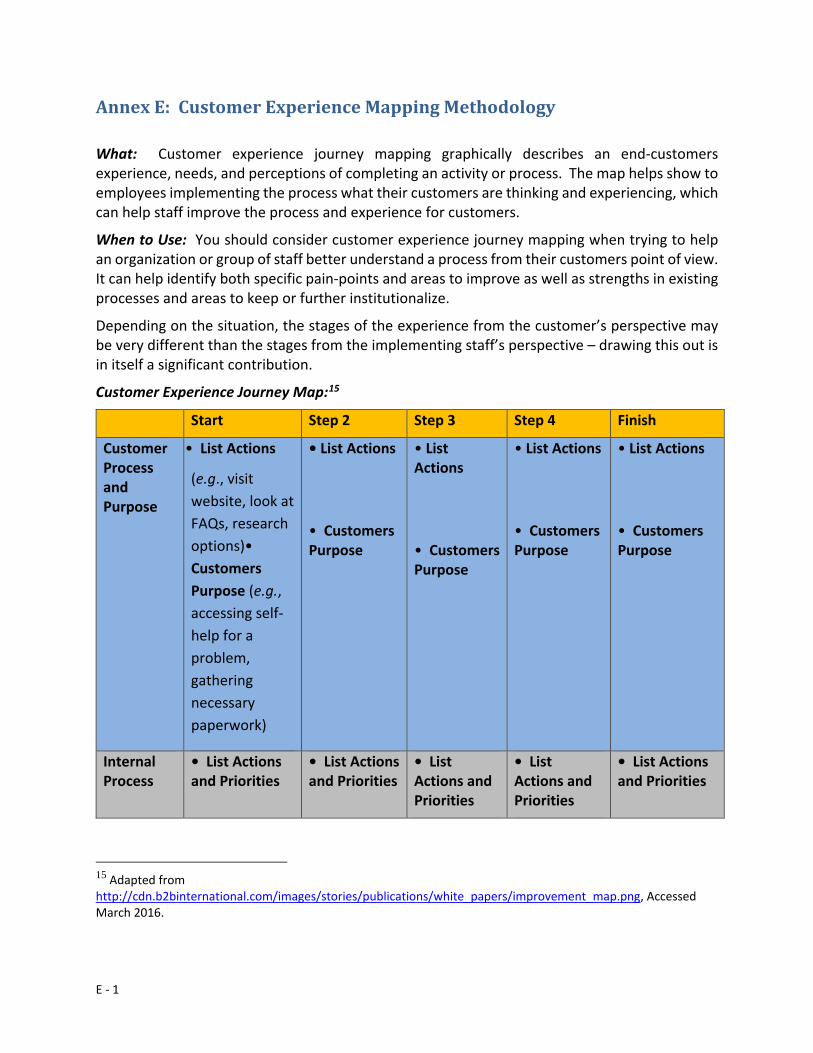
E - 1
Annex E: Customer Experience Mapping Methodology
What: Customer experience journey mapping graphically describes an end-customers experience, needs, and perceptions of completing an activity or process. The map helps show to employees implementing the process what their customers are thinking and experiencing, which can help staff improve the process and experience for customers.
When to Use: You should consider customer experience journey mapping when trying to help an organization or group of staff better understand a process from their customers point of view. It can help identify both specific pain-points and areas to improve as well as strengths in existing processes and areas to keep or further institutionalize.
Depending on the situation, the stages of the experience from the customer’s perspective may be very different than the stages from the implementing staff’s perspective – drawing this out is in itself a significant contribution.
Customer Experience Journey Map:15 Start Step 2 Step 3 Step 4 Finish
Customer Process and Purpose
• List Actions
(e.g., visit website, look at FAQs, research options)• Customers Purpose (e.g., accessing self-help for a problem, gathering necessary paperwork)
• List Actions
• Customers Purpose
• List Actions
• Customers Purpose
• List Actions
• Customers Purpose
• List Actions
• Customers Purpose
Internal Process
• List Actions and Priorities
• List Actions and Priorities
• List Actions and Priorities
• List Actions and Priorities
• List Actions and Priorities
15 Adapted from http://cdn.b2binternational.com/images/stories/publications/white_papers/improvement_map.png, Accessed March 2016.
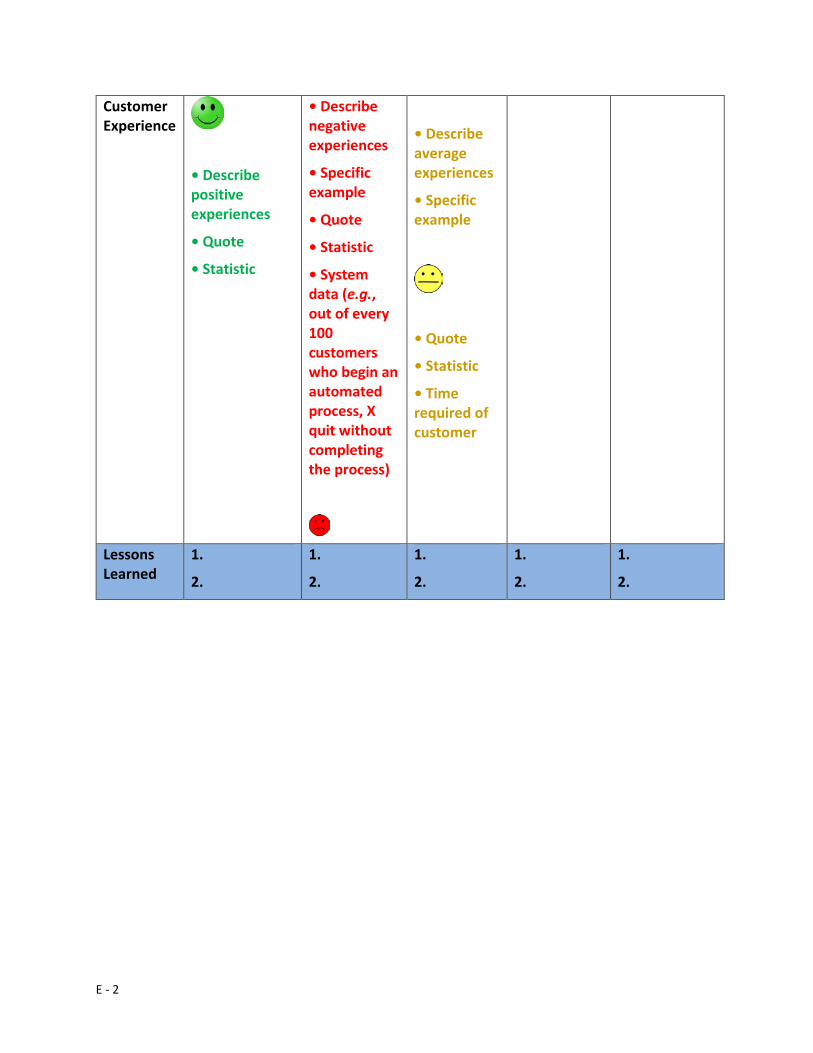
E - 2
Customer Experience
• Describe positive experiences
• Quote
• Statistic
• Describe negative experiences
• Specific example
• Quote
• Statistic
• System data (e.g., out of every 100 customers who begin an automated process, X quit without completing the process)
• Describe average experiences
• Specific example
• Quote
• Statistic
• Time required of customer
Lessons Learned
1.
2.
1.
2.
1.
2.
1.
2.
1.
2.
E - 3
How: Guidelines for customer experience journey mapping 1. Label customer experience stages across the top row of the chart. Focus on “touch
points” where the customer interacts with staff or the process. These are “process steps” from the customer’s perspective and experience, and typically do not match the experience of the staff implementing the process and may completely skip over steps that implementing staff complete.
2. On the “Customer Process” row, identify actions the customer takes at this stage. Also identify the goal or purpose of what the customer is trying to achieve at this stage. For instance, are they gathering data to make a decision, seeking assistance with a problem, or submitting a request, or finalizing a transaction.
3. On the Internal Process row, describe the stage the customer is in from the perspective of the employees completing the process. For example, if the employee is trying to resolve a problem or get answers, the internal process may focus on supplying self-help information on a website, or it may direct them via a helpdesk that triage’s callers among specific technical expertise who can answer their questions. If the action is starting a Civil Service hire, the internal process might be a combination of a website with CS hiring documents, specialist help developing a recruitment strategy, and further specialist help getting a new position classified.
4. On the Customer Experience row, categorize and describe the customer’s reported experience. Depending on information available from surveys, interviews, and other mechanisms you may list representative quotes, summary of comments, rankings on a scale, data from a system, or other sources. The reported experience should primarily represent norms and commonalities.
5. On the final Lessons Learned row, provide references and insights drawn. These could be opportunities to improve (e.g., simplify a form with plain language, provide higher touch customer service at a specific stage), lessons learned about service (e.g., customers appreciate self-help on simple topics like X but prefer personal guidance on Y), or opportunities to maintain high performance (ie opportunity for staff from unit X to cross-train staff from unit Y on customer service).
* Note 1: Focus on and represent customer emotions in the map. Emotions best capture customer experience and quickly inform us how they see a process.
* Note 2: The maps should typically present norms and averages of experience, rather than outliers. However, at times, showing outliers of experience can help. For instance, if a process step generally receives positive ratings and comments, but some individuals report a common but very negative experience. Capturing this sort of outlier can allow for significant improvement. The opposite is also true: if a process step generally receives very negative ratings, but some customers rate it very positively then exploring and presenting the reasons for the difference can help significantly. Analysts must use discretion, but could report such outliers as part of the experience row or as part of lessons learned.
* Note 3: The maps usually focus on end-customers experience of a process. However, many functions in government have multiple customers. For instance in hiring, the hiring manager
E - 4
needing to fill a position is the end-customer. However, the principles of competitive hiring are also a “customer” as required by Congress and implemented through the Office of Personnel Management (OPM). While not as common or straight-forward to show on a customer experience map, capturing aspects of these alternate customers may further the effort at times. Analysts must use discretion as to if and how to capture such aspects.
Additional Information and Resources
● “Customer Journey Mapping”, B2B International, https://www.b2binternational.com/publications/customer-journey-mapping/
● “Customer Journey Map – Top 10 Requirements”, Jim Tincher, Heart of the Customer, http://www.heartofthecustomer.com/customer-experience-journey-map-the-top-10-requirements/
● “Anatomy of an Experience Map” by Chris Risdon, November 30, 2011, http://adaptivepath.org/ideas/the-anatomy-of-an-experience-map/
● “The Truth about Customer Experience” by Alex Rawson, Ewan Duncan, and Conor Jones. HBR.com, September 2013, https://hbr.org/2013/09/the-truth-about-customer-experience
F - 1
Annex F: Mixed Methods, Coding, Interviews, Surveys and Questionnaires Methodology Mixed Methods Approach For the purpose of Business Process Reviews (BPRs), this methodology will focus on the mixed methods approach as most BPRs and other research involving interviews result in suggested process or policy changes for the Agency.
A. Combine Qualitative Key Informant Interviews with Quantitative Surveys
You can combine qualitative research and key informant interviews with already collected quantitative data, or collect survey data. This approach helps to triangulate data and test the validity of your sources. It also allows for diversity of data- a way to get detailed descriptive information in the key informant interviews, while also casting a wider net for a bigger representation of people who you want to poll.
There are many different ways to integrate survey data collection with qualitative interviews:
● As mentioned before in grounded theory, you could also use qualitative data to develop a hypothesis that is then tested out via survey (aka use qualitative to identify key issues to discuss on the survey).
● You can perform a quantitative survey, analyze data and then conduct qualitative interviews to confirm hypothesis/results from the survey.
B. Structured Interviews
Although broad based qualitative interpretations are usually used for the analysis of key informant interviews it is often possible to conduct analysis using a mixed method of qualitative and quantitative content analysis. This is probably one of the best methodologies for business process reviews.
A structured interview16 is a method in interviews in which the same questions are asked in the same order. This allows for answers to be more easily aggregated and compared. Highly structured questionnaires or interviews are arranged by topics, and attempt to predict answers by narrowing the number of answers to the question. This allows for data from the interviews to be collected quickly but still have sufficient rigor.
16 Frankfort-Nachmias, Chava and Nachmias David. 2008. Research Methods in the Social Sciences. Seventh edition. Worth publishers. USA
F - 2
C. Surveys
Surveys are a data collection technique for gathering input from a much larger group of people than is possible through an interview or focus group. They have the advantage of gathering a much wider spectrum of input, but at a lower level of depth. When developing a survey it is important to keep these strengths and limits of surveys in mine, while also pursuing both the highest possible response rate and highest level of accuracy to help answer your study questions. When applying representational sampling and statistics, surveys also allow for inference to what a larger population experiences or thinks about a subject.
However, while inferential statistics, sampling, and question construction are all important aspects of a successful survey, they are beyond the scope of this methodology. If not already familiar with these, this methodology recommends you find expertise or seek training elsewhere. Instead, this methodology addresses practical aspects of developing surveys for business process reviews.
Note: Surveys can and have been used successfully in BPRs at USAID. However, two common concerns are often raised. They are noted below as well as the information you need to proceed with administering a survey:
● Paperwork Reduction Act and need to submit surveys to OMB for a six month period of review – the Act and requirement to submit surveys to OMB does not apply when collecting data from current Federal employees17. A BPR survey would only have to go through OMB clearance if it were collecting data from persons not currently employed by the Federal government.
● Survey Clearance through USAID Unions – when administering surveys to USAID staff as part of a BPR, you must submit the survey to the appropriate employee unions, the American Federation of Government Employees (AFGE) on the Civil Service side and/or American Foreign Service Association (AFSA) on the Foreign Service side. The review period for the unions as of the time of this writing was 10 working days for AFGE and 7 calendar days for AFSA. If the unions don’t respond in that time period, survey administration can proceed. If they do respond within the timeframe, you will have to consult with them to address any concerns – and you should seek additional counsel in such a situation from M Bureau leadership. To submit to the unions, send the draft survey to the Employee and Labor Relations (ELR) Office in Human Capital and Talent Management (HCTM). Implementing a survey before the opportunity for the unions to
17 Code of Federal Regulations, Title 5 Chapter III, Subchapter B, Part 1320.3, accessed December 7, 2016, http://www.ecfr.gov/cgi-bin/text-idx?c=ecfr&rgn=div5&view=text&node=5:3.0.2.3.9&idno=5#5:3.0.2.3.9.0.48.3
F - 3
review within the required timeframe could incur an unfair labor practice change from the unions.
Using Questionnaires, Surveys, and Interviews A. Developing Questions
Once you have picked your approach you will need to develop a pool of questions. If you’ve determined a hypothesis to test, then the questions will help gather data on the variables you need to measure to prove or disprove your hypothesis. As discussed in the previous section, if you used the structured interview approach you will need to make sure your questions are either pre-coded or coded afterwards, and that you also have sufficient open ended questions to cross-walk with your quantifiable results.
Below are a few best practices when choosing your questions based on coding:
● For inductive and deductive coding, a closed question can be asked as if it were an open question. You can prepare a list of potential answers and check them off as the interviewee is speaking.
● For inductive coding if you need to figure out the distance between items- use a rating question ( ex. on a scale from 1-5 tell me how relevant X is to your everyday work).
● For deductive coding if you are looking for association responses use an un-scaled responses approach in which the interviewer can ask questions and ask the interviewee to say all that apply.
General best practices for questionnaires, surveys, and interviews include:
● Always use plain language; ● Cut down on the length, complexity, and clutter of a question (if a question
includes more than one thought put it in separate sentences, or separate questions);
● Avoid extreme words: ie “all” and “none”; ● Define key words and definitions in questions; ● Avoid bias - look out for questions phrased with unequal choices, trigger words,
or a lack of balance of different perspectives; ● Only ask questions about issues you expect to analyze and use for the study; and ● Test questions to ensure you get the data desired.
F - 4
B. Pre-Testing
One of the most important steps of interview or survey development is pre-testing. Pretesting makes sure that questions are:
o phrased properly to gain the information you need; o relevant to the respondent; o easy to understand o easy to answer the information respondents have at the time of the interview;
and o have a limited set of answers (if coded)
Pretested interviewees should be selected from the pool of interviewees that you have identified at the beginning of your study. There should be continuity in the interviewers at the pre-test phase and those who will be conducting the actual interviews.
The interviewer should debrief both with the interviewee to see how the interview went, and later debrief with the evaluator to identify problems with the interviewer. Once the problems are identified the interview will be redesigned to address the problems identified.
If there are only minor changes the interviews can go ahead without another pretest, if the changes are substantial then the interviewee and evaluator should have a second stage of pretests.
C. Conducting Interviews
The person(s) who designed the interview should train interviewers to make sure they are aware of:
o What an adequate answer to a question is; o How to ask the questions correctly (know the question well enough to slightly re-
word it in an accurate way if they need to explain it to the respondent); o Not omitting questions they think that are answered by other questions; and o Not introducing bias.
D. Summarizing Interviews
Once the interviews are completed the interviewee should provide a few paragraph summaries of the interview, and log answers to coded questions the day of the interview. This will prevent later subjectivity and allow for context to remind the interviewer of discussion had before the analysis phase.
F - 5
Coding Data
Note: While this methodology outlines coding as a practice, this is not a comprehensive training. Anyone undertaking coding for the first time should seek additional training or find a colleague with experience to assist.
Coding data is done in many areas, though at USAID the most common occurrences are when taking data from people, such as survey responses or interview answers. Coding data facilitates analysis by taking both quantitative data such as survey results and qualitative data such as interview responses and categorizing them. Classifying information by coding allows for analysis of the data on an aggregate level through computer software such as spreadsheets and statistical software. Classifying information in this way is an important step in preparation of data for computer processing with statistical software.
Key aspects of coding include:
● ensuring that each code is mutually exclusive – ie a code applies to only one category/topic and do not overlap,
● making sure all data points collected receive at least one code to ensure all data is represented in the analysis, and
● having clear and repeatedly implementable guidelines for coding so that coding is consistent over time and across all coders.
Additionally, successful coding saves time and aids analysis considerably. Depending on the data to be coded, you may want to use multiple coders working independently to reduce errors and increase reliability of data coding. Furthermore, while coding data helps to aggregate data, you should also analyze qualitative answers for contextual or illustrative supporting evidence. Contact M/CIO via the Help Desk to learn what types of software are currently available to support coding. Currently, M/CIO has approved Tableau® and NVivo® which can support coding and presentation needs.
A. Types of Coding
There are numerous coding techniques and approaches depending on data collection method, whether quantitative or qualitative analysis is desired, and other factors. This methodology covers two types of coding: deductive coding and inductive coding:
DEDUCTIVE CODING determine codes before collecting data and is also known as pre-coding.18 Deductive coding is best used when you already have an idea of possible responses, such as when you already know a subject reasonably well, have existing knowledge frameworks to develop a coding system from, or can ask pointed questions with expected answers.
18 Frankfort-Nachmias, Chava and Nachmias David. 2008. Research Methods in the Social Sciences. Seventh edition. Worth publishers. USA
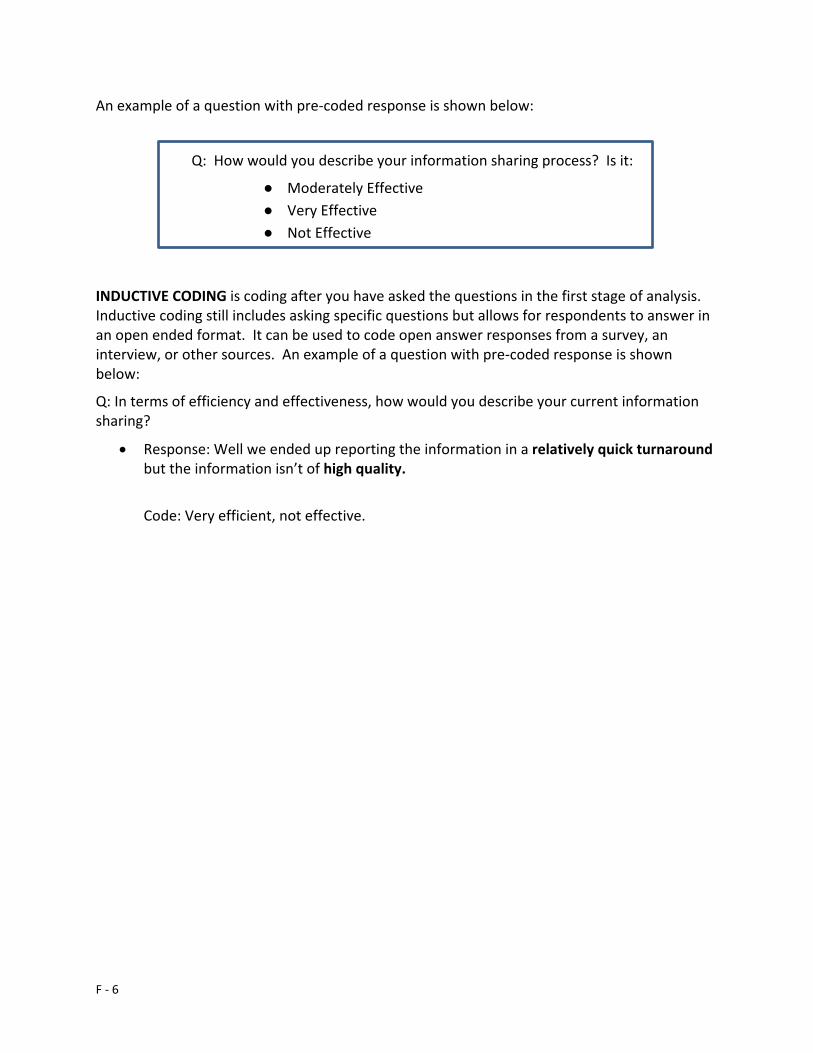
F - 6
An example of a question with pre-coded response is shown below:
Q: How would you describe your information sharing process? Is it:
● Moderately Effective ● Very Effective ● Not Effective
INDUCTIVE CODING is coding after you have asked the questions in the first stage of analysis. Inductive coding still includes asking specific questions but allows for respondents to answer in an open ended format. It can be used to code open answer responses from a survey, an interview, or other sources. An example of a question with pre-coded response is shown below:
Q: In terms of efficiency and effectiveness, how would you describe your current information sharing?
• Response: Well we ended up reporting the information in a relatively quick turnaround but the information isn’t of high quality.
Code: Very efficient, not effective.
F - 7
B. How to Code
If you use deductive coding when setting up your interview questions, the codes are already pre-set and you will be able to aggregate your data almost instantly after an interview is completed. Inductive coding, as mentioned above, allows for a diversity of responses but requires more time to determine the codes and analyze after collection. Due to the greater knowledge gap to fill and greater time involved in inductive coding, this methodology will predominantly focus on coding by induction. Below are the steps to follow to make sure inductive coding is accurate and will aggregate the data for meaningful results. As mentioned above, code the data both during and after the interview as an analytic tactic.
The following example is based on an after-action interview with a stakeholder discussing the Acquisition and Assistance Review Approval Document (AARAD) and the process associated with this document. The AARAD study used grounded theory and developed the following working hypothesis which was studied during the review:
“The AARAD process will increase senior leadership accountability, but will also increase workloads and procurement timelines for operating units.”
1. Identify the “lens” to code through
As discussed in the beginning of this methodology piece, you develop study questions based on the information you need to gather. It is equally important to keep study questions in mind as you code responses both during and after data collection. This will allow for improved aggregation of responses and meaningful analysis that answers the study questions.
For example, business process reviews usually want to determine if a process is efficient or effective, and why (lack of a role identification, too many steps in a process, etc). Based on contextual materials and associated study questions, you should narrow study questions further:
AARAD Example: The AARAD hypothesis is testing several statements. The first part of the hypothesis queries whether or not the ARAARD increases accountability. So we are looking for key words such as transparency, leadership, communication etc.
The second part of the statement queries components of time in several dimensions including both workloads and in the procurement timeline. So we are looking for words like “burdened”, “lengthened timeline” etc. We are also assuming there are problems with this process, which means we are focusing on elements that may need to change.
However, we are also interested in why timelines and workloads are increased, so we need to pay close attention to process related items such as “too many clearances” etc. Below is a sample of the interview notes, highlighted with preliminary codes.
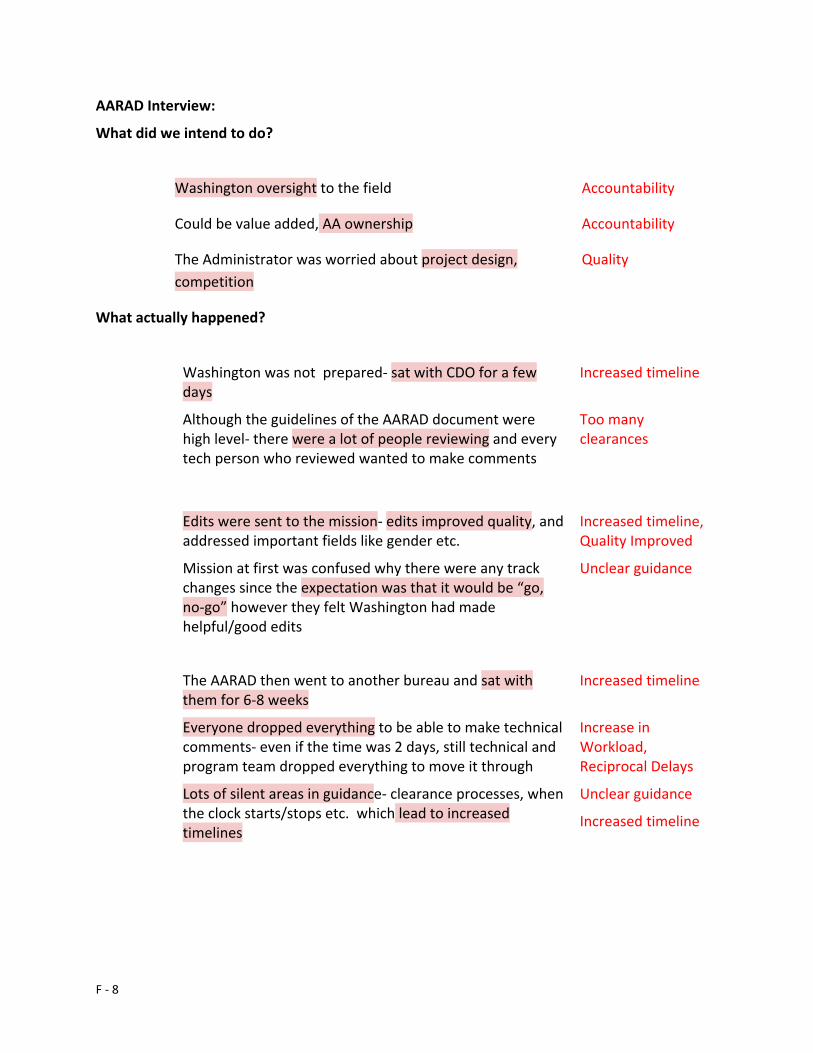
F - 8
AARAD Interview:
What did we intend to do?
Washington oversight to the field Accountability
Could be value added, AA ownership Accountability
The Administrator was worried about project design, competition
Quality
What actually happened?
Washington was not prepared- sat with CDO for a few days
Increased timeline
Although the guidelines of the AARAD document were high level- there were a lot of people reviewing and every tech person who reviewed wanted to make comments
Too many clearances
Edits were sent to the mission- edits improved quality, and addressed important fields like gender etc.
Increased timeline, Quality Improved
Mission at first was confused why there were any track changes since the expectation was that it would be “go, no-go” however they felt Washington had made helpful/good edits
Unclear guidance
The AARAD then went to another bureau and sat with them for 6-8 weeks
Increased timeline
Everyone dropped everything to be able to make technical comments- even if the time was 2 days, still technical and program team dropped everything to move it through
Increase in Workload, Reciprocal Delays
Lots of silent areas in guidance- clearance processes, when the clock starts/stops etc. which lead to increased timelines
Unclear guidance
Increased timeline
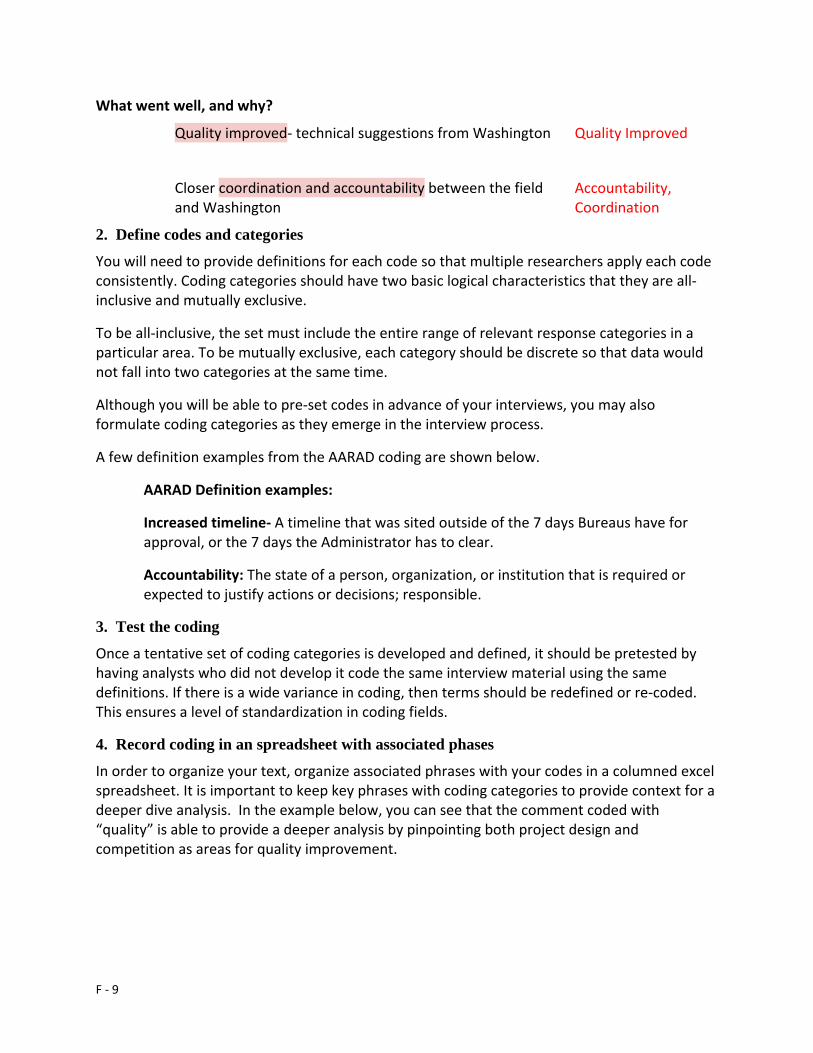
F - 9
What went well, and why?
Quality improved- technical suggestions from Washington
Quality Improved
Closer coordination and accountability between the field and Washington
Accountability, Coordination
2. Define codes and categories
You will need to provide definitions for each code so that multiple researchers apply each code consistently. Coding categories should have two basic logical characteristics that they are all-inclusive and mutually exclusive.
To be all-inclusive, the set must include the entire range of relevant response categories in a particular area. To be mutually exclusive, each category should be discrete so that data would not fall into two categories at the same time.
Although you will be able to pre-set codes in advance of your interviews, you may also formulate coding categories as they emerge in the interview process.
A few definition examples from the AARAD coding are shown below.
AARAD Definition examples:
Increased timeline- A timeline that was sited outside of the 7 days Bureaus have for approval, or the 7 days the Administrator has to clear.
Accountability: The state of a person, organization, or institution that is required or expected to justify actions or decisions; responsible.
3. Test the coding
Once a tentative set of coding categories is developed and defined, it should be pretested by having analysts who did not develop it code the same interview material using the same definitions. If there is a wide variance in coding, then terms should be redefined or re-coded. This ensures a level of standardization in coding fields.
4. Record coding in an spreadsheet with associated phases
In order to organize your text, organize associated phrases with your codes in a columned excel spreadsheet. It is important to keep key phrases with coding categories to provide context for a deeper dive analysis. In the example below, you can see that the comment coded with “quality” is able to provide a deeper analysis by pinpointing both project design and competition as areas for quality improvement.
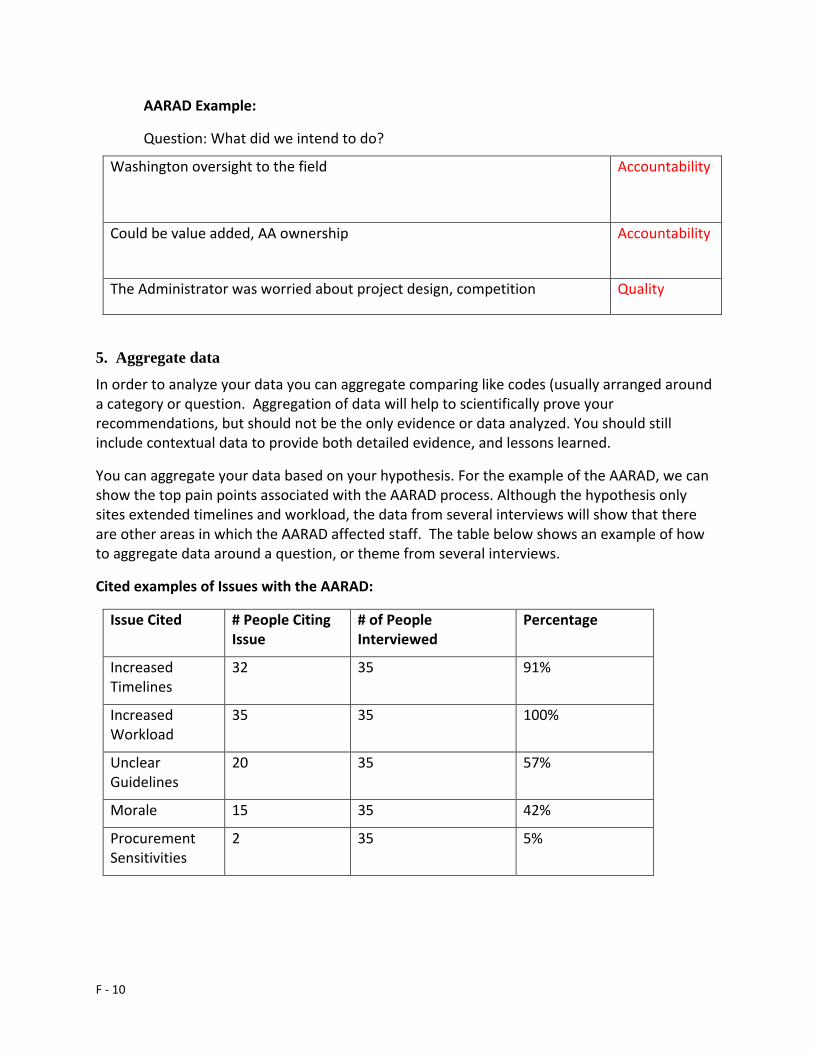
F - 10
AARAD Example:
Question: What did we intend to do?
Washington oversight to the field
Accountability
Could be value added, AA ownership
Accountability
The Administrator was worried about project design, competition Quality
5. Aggregate data
In order to analyze your data you can aggregate comparing like codes (usually arranged around a category or question. Aggregation of data will help to scientifically prove your recommendations, but should not be the only evidence or data analyzed. You should still include contextual data to provide both detailed evidence, and lessons learned.
You can aggregate your data based on your hypothesis. For the example of the AARAD, we can show the top pain points associated with the AARAD process. Although the hypothesis only sites extended timelines and workload, the data from several interviews will show that there are other areas in which the AARAD affected staff. The table below shows an example of how to aggregate data around a question, or theme from several interviews.
Cited examples of Issues with the AARAD:
Issue Cited # People Citing Issue
# of People Interviewed
Percentage
Increased Timelines
32 35 91%
Increased Workload
35 35 100%
Unclear Guidelines
20 35 57%
Morale 15 35 42%
Procurement Sensitivities
2 35 5%
G - 1
Annex G: Protocol Guide for Interview, Focus Group, and Case Study Protocol Guide for Interviews, Case Studies, Focus Groups During Business Process Reviews at USAID Interviews, focus groups, and case studies are all facilitated discussions guided by questions. Successful interviews require preparatory documents, guiding questions, and facilitator skill to ensure the greatest success. Protocol
● Identify number of participants in advance – may be just 1 for an interview, up to 5-8 for a focus group.
● Give participants any topic specific references in advance. ● Note-takers (2 per case interview) should take highly detailed running notes of participants
discussion and comments. If only 2 note-takers, the facilitator may take “summary notes” but the other must be detailed.
● Determine process in advance for finalizing notes post-interview, coding, and saving. ● Maximum of 1½ hour session (requires reserving a room for 2 hours)
Preparation 1. Facilitator(s) and note-takers meet to establish readiness
a. Articulate goals of the session b. Prepare standard and supplemental questions c. Prepare responses to questions interviewees may ask d. Prepare any materials including handouts, flipcharts, etc
2. Schedule the session: Call or send email invitation to participants (include purpose, scope, discussion guide, and any items to bring) <<See below>>
a. A good practice has been use of a shared sign-up sheet, such as in Google® Email Invitation:
Dear [title] [last name], The Bureau for Management (M Bureau) is conducting a Business Process Review (BPR) of the Agency’s XXXX process. The BPR is being carried out in collaboration with the Office of XXX and XXXX, which are providing important subject matter expertise. Attached you will find a fact sheet on the BPR.
G - 2
The objective of the business process review is to identify improvements to the XXXXXX process that will help ensure a more efficient and effective process. As the ROLE/FUNCTION involved, we want to gather your perspective and hear your experience of the hiring process. Purpose: To gather feedback on our XXXX business process model. We will ask you to walk us through the entire process. Format: The interview will include, XXX, YYY, and ZZZ. What to Bring: Please bring with you a copy of any standard operating procedures, trackers, or other documentation used to facilitate the process. Any Personally Identifiable Information can be redacted. We propose to meet at the following dates/times. If this time is not convenient, please contact XXXX by phone at X-XXXX to reschedule or propose an alternate. We have only a few weeks to gather your input and appreciate your quick response and flexibility. Please reply to confirm your availability. If you have any questions or would like additional information before we meet please contact me directly at [email protected] or 2-XXXX. Sincerely, [Scheduler Name] Attachments: BPR Fact Sheet and any other documents
Conduct the Session
1. Print out copies of Fact Sheet and any reference documents for all participants 2. Before participants arrive: have flipchart/whiteboard or other resources ready
G - 3
3. Introduction <<<See below>>> 4. Clarify for participants that BPRs are not audits or evaluations of individual staff 5. Follow questionnaire 6. Record information – at least 2 note-takers, one of whom is not actively facilitating 7. Allow any concluding feedback from participants 8. Conclude interview with THANK YOU
Interview Format: Thank you for taking your time today to meet with us as part of the Business Process Review (BPR) on USAID’s XXXXXXX process. I’m ____________ and this is _____________. We’re from M Bureau—the unit conducting the review. I’ll be the one primarily asking the questions while my colleague(s) will be taking detailed notes. Today, we’d like to specifically discuss your experiences with XXX process. We’ve already done XXX to prepare. Now, we want to hear your perspective. Your input around this process will help further the review and strengthen the final product. This is a safe space to talk candidly. The BPR focuses on process, it is not an audit or evaluation of individual staff member. Comments are for the review and improvement of the process only and not attribution. We want to focus on what is and opportunities for improved efficiency and effectiveness of XXXXXX process. During this interview, we want to accomplish: 1) LIST ITEMS Do you have any questions before we get started?
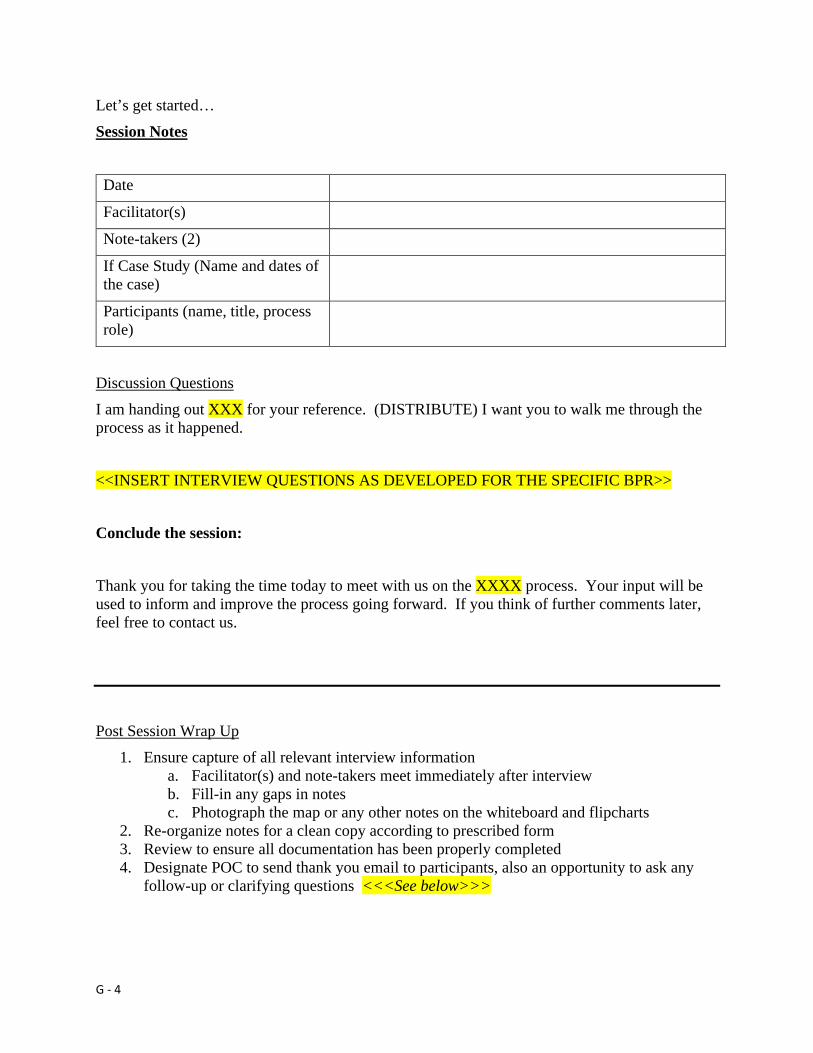
G - 4
Let’s get started… Session Notes
Date
Facilitator(s)
Note-takers (2)
If Case Study (Name and dates of the case)
Participants (name, title, process role)
Discussion Questions I am handing out XXX for your reference. (DISTRIBUTE) I want you to walk me through the process as it happened. <<INSERT INTERVIEW QUESTIONS AS DEVELOPED FOR THE SPECIFIC BPR>> Conclude the session: Thank you for taking the time today to meet with us on the XXXX process. Your input will be used to inform and improve the process going forward. If you think of further comments later, feel free to contact us.
Post Session Wrap Up
1. Ensure capture of all relevant interview information a. Facilitator(s) and note-takers meet immediately after interview b. Fill-in any gaps in notes c. Photograph the map or any other notes on the whiteboard and flipcharts
2. Re-organize notes for a clean copy according to prescribed form 3. Review to ensure all documentation has been properly completed 4. Designate POC to send thank you email to participants, also an opportunity to ask any
follow-up or clarifying questions <<<See below>>>
G - 5
E-mail to follow-up on the interview: Thank you for taking your time to meet with M Bureau on the Business Process Review of XXX process. We really appreciate you sharing your experience and recommendations for improvement. During the meeting, I noted the following items for follow-up:
● LIST Please provide the requested materials by ____________ (a date one week after the e-mail is sent). Thanks, [Name]
H - 1
Annex H: Types of Business Analysis
Types of Business Analysis Appreciative Inquiry
What: Appreciative Inquiry (AI) is a process oriented method for studying and changing social systems organizations that promotes collective inquiry into the best of what is in order to imagine what could be. AI looks at what is going right to improve an organization. The process involves an analysis of the organization, examining its culture, environment, and relationships, to identify and build on existing strengths rather than scrutinizing problems and deficiencies. The differences between AI and a problem-based approach are highlighted below.
Problem Solving Appreciative Inquiry
∙ Felt need, identification of problem(s)
∙ Appreciating, valuing the Best of What Is
∙ Analysis of Causes
∙ Envisioning what might be
∙ Analysis of possible solutions
∙ Engaging in dialogue about what should be
∙ Action Planning (treatment)
∙ Innovating, what will be
How: There are five phases or steps to guide the process of AI. The aim of these processes is to build (or rebuild) organizations around what works, rather than trying to fix what does not.
1. Define “the what”-identifying the focus of your study. In order to set the tone for the study, the focus should not be worded as a problem, but on how to expand on strength. For example, a focus could be “ways to accelerate staffing” rather than “ways to fix staffing problems.” Although this may seem like semantics, it will influence both the character of the questions and the respondents’ answers.
2. Discover "the best of what is" by identifying where the organization’s processes worked perfectly. This phase is done through interviews and focus groups to identify past best practices and what is currently working well. Questions are open ended and written in the affirmative so that people can provide wide-ranging answers and stories about what they find to be valuable. Once the data is collected from the interviews, categorize the responses to determine what was most valued and motivating among respondents. Using this data, you will be able to map the positive core of an organization and gain insight into best practices and
H - 2
innovative ideas and experience.
3. Dream "what might be” by envisioning processes that are effective every time. This phase builds on the organization’s positive processes and maps how they may be used constructively. In addition to the interview analysis (which should yield best practices) the team also sets up a brainstorming session with a diverse group of stakeholders for additional creative ideas when moving forward. This is often a large conference or workshop for the organization to talk about successful moments within the organization and what the organization would look like if these were the ongoing norms. The facilitator can break the organization into smaller working groups to expand on the organizational vision. This is a collaborative process that is meant to encourage positive interaction among staff. Once a vision is agreed upon the design phase begins.
4. Design “what will be" by refining processes and best practices for future use. Once ideas from the interviews and the brainstorming session begin to solidify, you will need to examine how these ideas are implemented. This occurs in a selected working group from the brainstorming session or is explored in breakout groups at the conference or workshop.
You may choose to implement this in a larger group by designing a “possibilities map” which contains concentric circles of: the dream of an organization; the key relationships that have impact on this dream, and the key organizational design elements that will be needed to deliver the dream. In smaller groups, members can discuss these design elements. The smaller group maps the best practices identified and explores innovative ideas to existing systems, processes, and strategies. It also looks at how systems can be tweaked to incorporate the changes needed.
5. Deliver “The Plan” by Implementing the Path Forward. The final phase is the largest level of effort for an organization, and it takes a lot of planning and preparation. It is helpful to have smaller working groups to follow up on elements and applicable processes identified within the design phase. The key to success in executing the plan forward is to make sure the vision from phase three, is the focal point for progress. Each member within the organization has their own processes to complete and modify, but true success occurs when all of member provide changes at the same time, thus using positive energy within the study to focus on the vision forward.
When to Use: Appreciative Inquiry’s focus on the positive can be useful in helping teams create a safe environment to delve into difficult issues and build group cohesion. It is best used when there is a need to change group dynamics. The approach is highly collaborative and creates energy to enhance teamwork and motivation within an organization.
AI works well when members can identify and link best practices that are already in existence in an organization. New practices are discussed, but the process usually focuses on what already works. AI should be used when members of the organization are aware of best practices and historically successful decisions and can use them to influence future work.
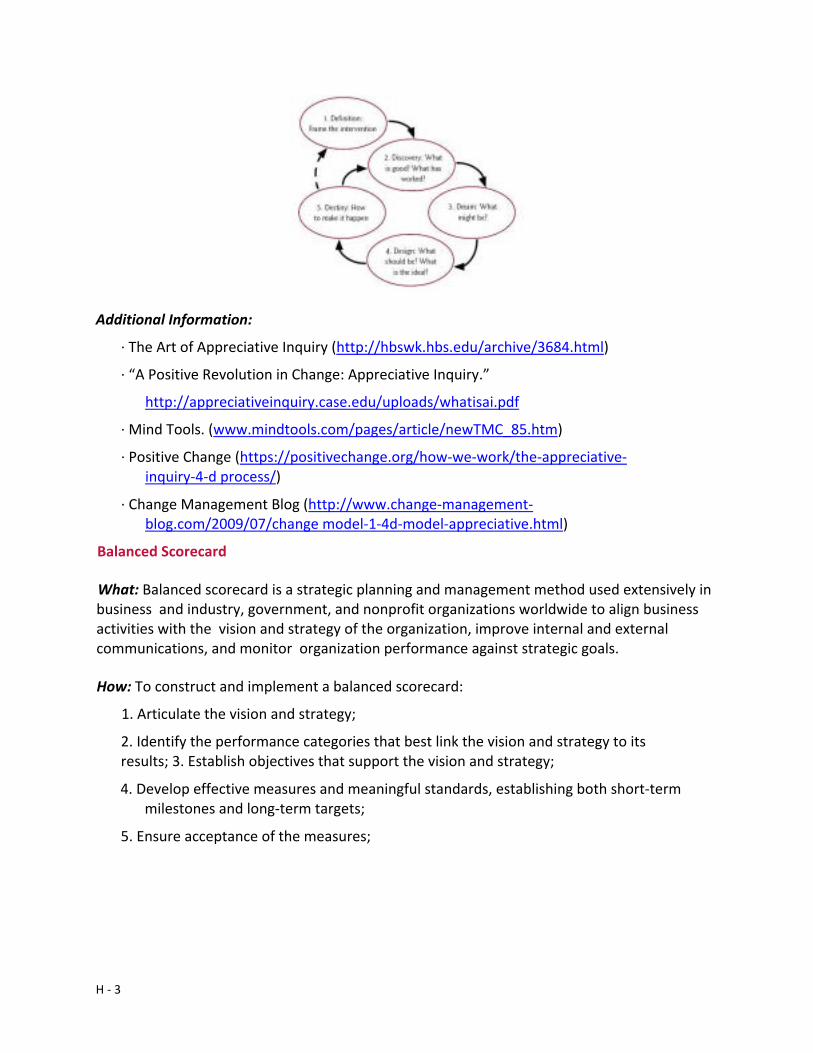
H - 3
Additional Information:
∙ The Art of Appreciative Inquiry (http://hbswk.hbs.edu/archive/3684.html)
∙ “A Positive Revolution in Change: Appreciative Inquiry.”
http://appreciativeinquiry.case.edu/uploads/whatisai.pdf
∙ Mind Tools. (www.mindtools.com/pages/article/newTMC_85.htm)
∙ Positive Change (https://positivechange.org/how-we-work/the-appreciative-inquiry-4-d process/)
∙ Change Management Blog (http://www.change-management-blog.com/2009/07/change model-1-4d-model-appreciative.html)
Balanced Scorecard
What: Balanced scorecard is a strategic planning and management method used extensively in business and industry, government, and nonprofit organizations worldwide to align business activities with the vision and strategy of the organization, improve internal and external communications, and monitor organization performance against strategic goals.
How: To construct and implement a balanced scorecard:
1. Articulate the vision and strategy;
2. Identify the performance categories that best link the vision and strategy to its results; 3. Establish objectives that support the vision and strategy;
4. Develop effective measures and meaningful standards, establishing both short-term milestones and long-term targets;
5. Ensure acceptance of the measures;
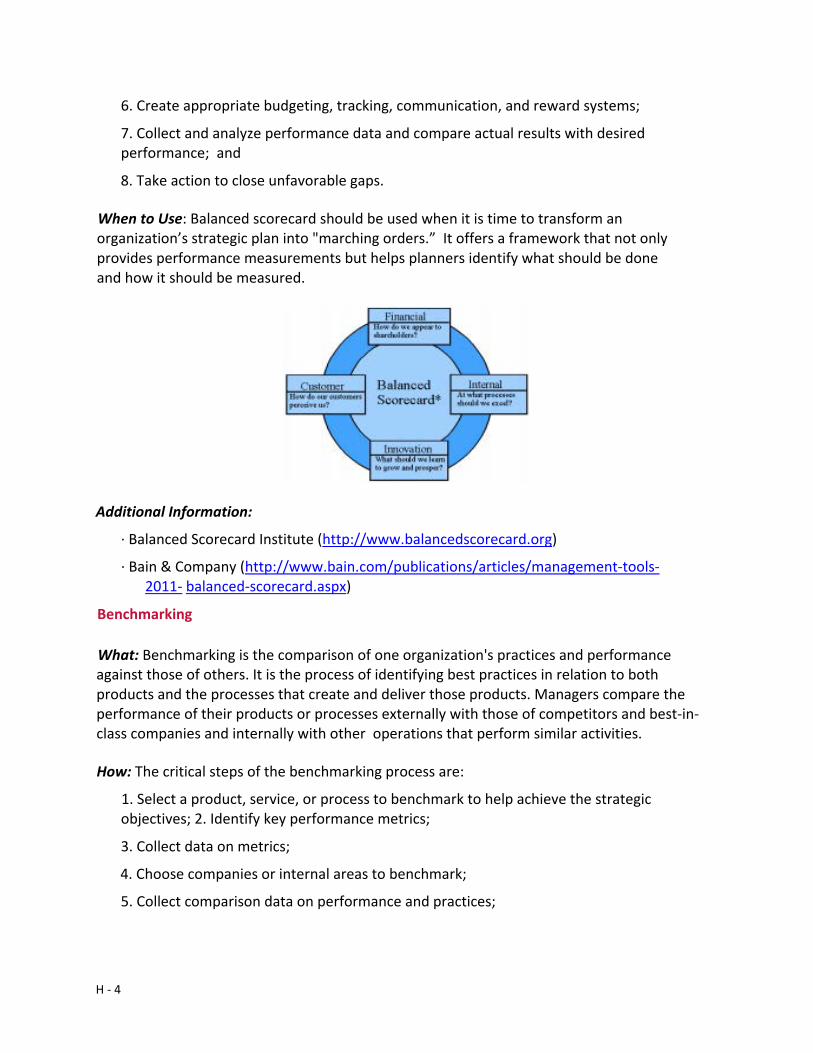
H - 4
6. Create appropriate budgeting, tracking, communication, and reward systems;
7. Collect and analyze performance data and compare actual results with desired performance; and
8. Take action to close unfavorable gaps.
When to Use: Balanced scorecard should be used when it is time to transform an organization’s strategic plan into "marching orders.” It offers a framework that not only provides performance measurements but helps planners identify what should be done and how it should be measured.
Additional Information:
∙ Balanced Scorecard Institute (http://www.balancedscorecard.org)
∙ Bain & Company (http://www.bain.com/publications/articles/management-tools-2011- balanced-scorecard.aspx)
Benchmarking
What: Benchmarking is the comparison of one organization's practices and performance against those of others. It is the process of identifying best practices in relation to both products and the processes that create and deliver those products. Managers compare the performance of their products or processes externally with those of competitors and best-in-class companies and internally with other operations that perform similar activities.
How: The critical steps of the benchmarking process are:
1. Select a product, service, or process to benchmark to help achieve the strategic objectives; 2. Identify key performance metrics;
3. Collect data on metrics;
4. Choose companies or internal areas to benchmark;
5. Collect comparison data on performance and practices;
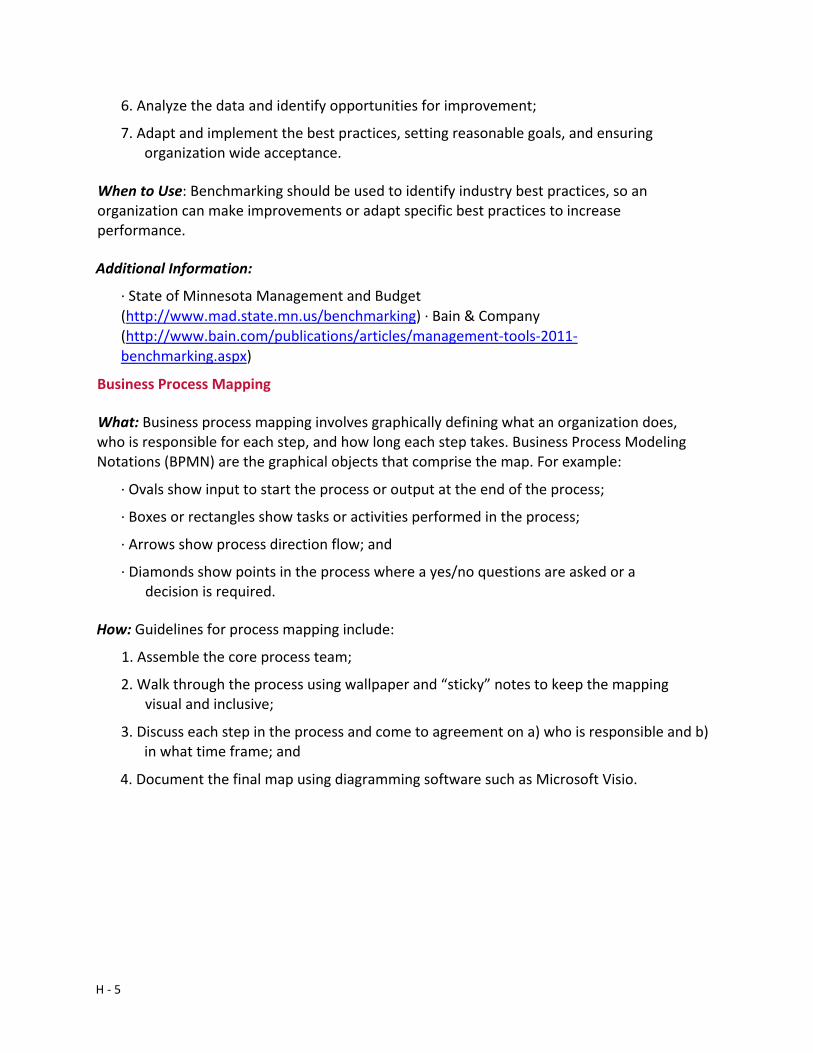
H - 5
6. Analyze the data and identify opportunities for improvement;
7. Adapt and implement the best practices, setting reasonable goals, and ensuring organization wide acceptance.
When to Use: Benchmarking should be used to identify industry best practices, so an organization can make improvements or adapt specific best practices to increase performance.
Additional Information:
∙ State of Minnesota Management and Budget (http://www.mad.state.mn.us/benchmarking) ∙ Bain & Company (http://www.bain.com/publications/articles/management-tools-2011- benchmarking.aspx)
Business Process Mapping
What: Business process mapping involves graphically defining what an organization does, who is responsible for each step, and how long each step takes. Business Process Modeling Notations (BPMN) are the graphical objects that comprise the map. For example:
∙ Ovals show input to start the process or output at the end of the process;
∙ Boxes or rectangles show tasks or activities performed in the process;
∙ Arrows show process direction flow; and
∙ Diamonds show points in the process where a yes/no questions are asked or a decision is required.
How: Guidelines for process mapping include:
1. Assemble the core process team;
2. Walk through the process using wallpaper and “sticky” notes to keep the mapping visual and inclusive;
3. Discuss each step in the process and come to agreement on a) who is responsible and b) in what time frame; and
4. Document the final map using diagramming software such as Microsoft Visio.
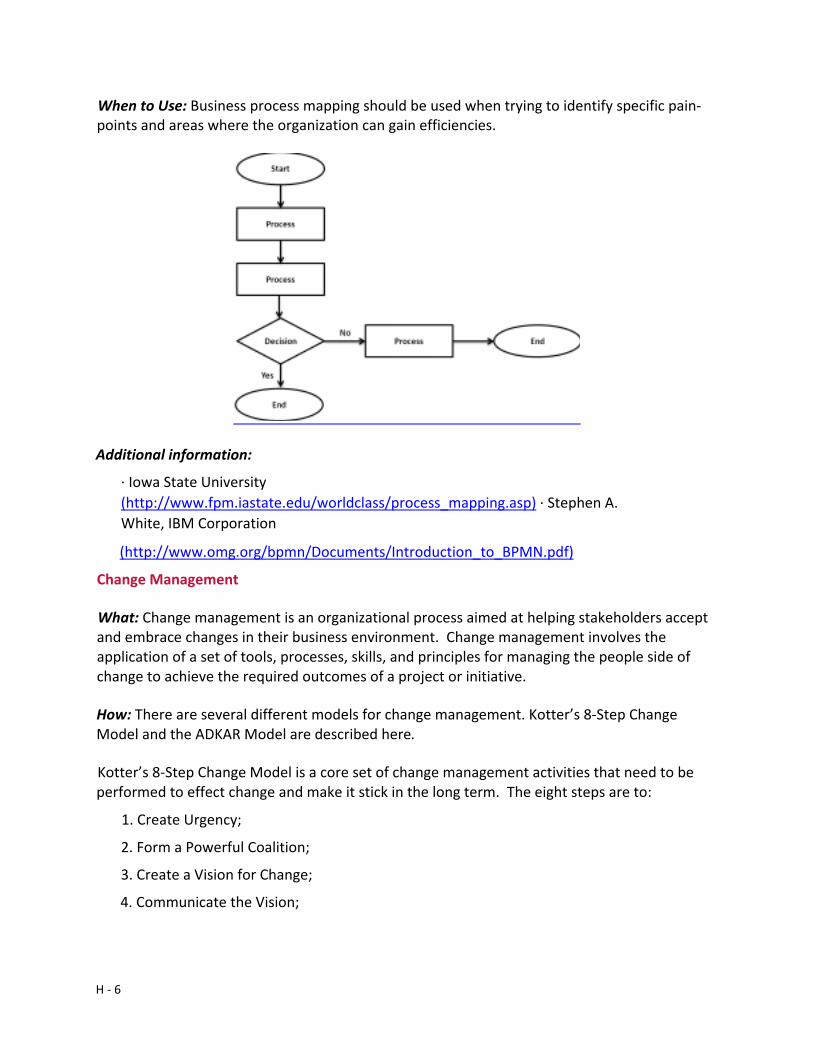
H - 6
When to Use: Business process mapping should be used when trying to identify specific pain-points and areas where the organization can gain efficiencies.
Additional information:
∙ Iowa State University (http://www.fpm.iastate.edu/worldclass/process_mapping.asp) ∙ Stephen A. White, IBM Corporation
(http://www.omg.org/bpmn/Documents/Introduction_to_BPMN.pdf)
Change Management
What: Change management is an organizational process aimed at helping stakeholders accept and embrace changes in their business environment. Change management involves the application of a set of tools, processes, skills, and principles for managing the people side of change to achieve the required outcomes of a project or initiative.
How: There are several different models for change management. Kotter’s 8-Step Change Model and the ADKAR Model are described here.
Kotter’s 8-Step Change Model is a core set of change management activities that need to be performed to effect change and make it stick in the long term. The eight steps are to:
1. Create Urgency;
2. Form a Powerful Coalition;
3. Create a Vision for Change;
4. Communicate the Vision;
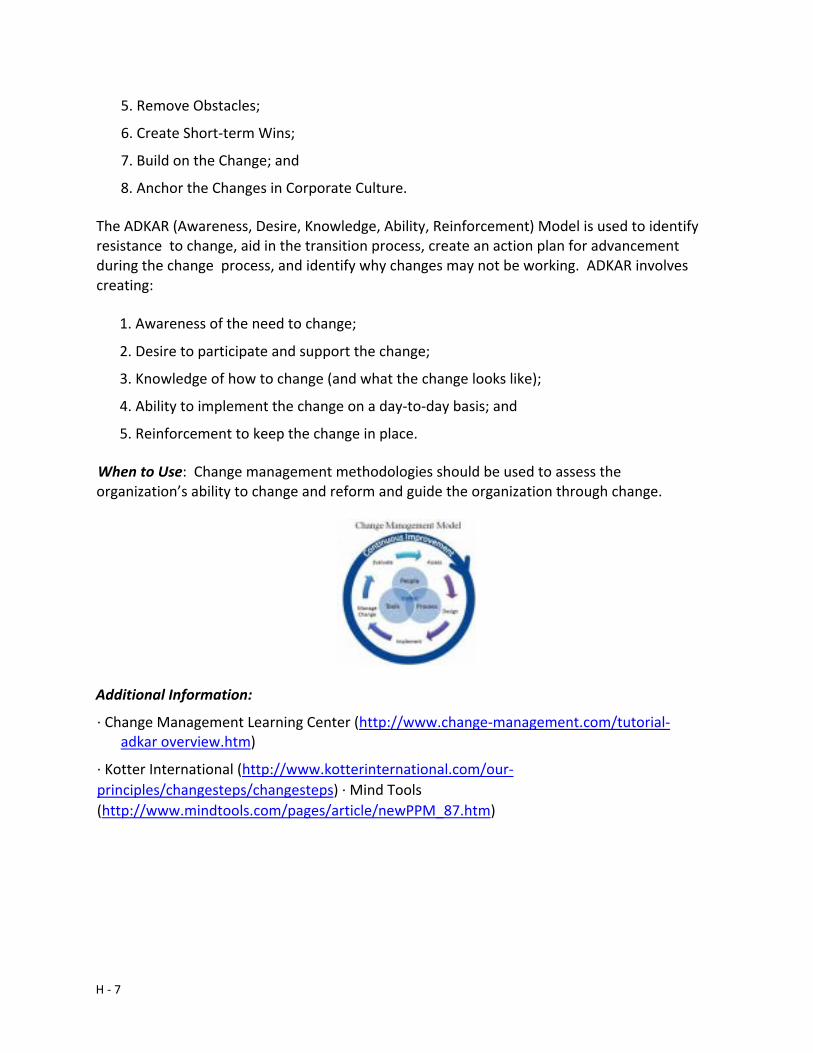
H - 7
5. Remove Obstacles;
6. Create Short-term Wins;
7. Build on the Change; and
8. Anchor the Changes in Corporate Culture.
The ADKAR (Awareness, Desire, Knowledge, Ability, Reinforcement) Model is used to identify resistance to change, aid in the transition process, create an action plan for advancement during the change process, and identify why changes may not be working. ADKAR involves creating:
1. Awareness of the need to change;
2. Desire to participate and support the change;
3. Knowledge of how to change (and what the change looks like);
4. Ability to implement the change on a day-to-day basis; and
5. Reinforcement to keep the change in place.
When to Use: Change management methodologies should be used to assess the organization’s ability to change and reform and guide the organization through change.
Additional Information:
∙ Change Management Learning Center (http://www.change-management.com/tutorial-adkar overview.htm)
∙ Kotter International (http://www.kotterinternational.com/our-principles/changesteps/changesteps) ∙ Mind Tools (http://www.mindtools.com/pages/article/newPPM_87.htm)
H - 8
Cost-Effectiveness Analysis
What: Cost-Effectiveness Analysis (CEA) is a formal process for organizing information so that the cost of alternatives and their relative effectiveness in meeting a given objective can be compared systematically.
How: CEA involves three processes:
1. An analysis of the cost of each alternative;
2. An analysis of the effectiveness of each alternative; and
3. An analysis of the relationship between the cost and effectiveness of each of alternative, usually expressed as a ratio.
Operating units should use cost-effectiveness as a criterion in comparing alternatives and decision making. A strategic option is cost-effective when it achieves the objective with the minimum expenditure of resources.
When to Use: Similar to a trade-off analysis, CEA should be used when there are multiple options up for consideration with multiple decision makers, stakeholders, and other interested parties making inputs to the decision making process. However, the only two decision criteria used are cost and effectiveness.
Additional Information:
∙ World Health Organization (http://www.who.int/choice/publications/p_2003_generalised_cea.pdf)
∙ Department of Veteran Affairs
Desk Review
What: Desk reviews, or secondary research, involve the summary, collation, and/or synthesis of existing research and documentation. In contrast, primary research involves data collection from, for example, research subjects or experiments. Secondary sources could include agency policy, previous research reports, documented business processes, databases, and government and nongovernmental organization statistics.
H - 9
How: Steps for a desk review include:
1. Develop a list of sources, a list of good starting points promises more than just looking at one particular source;
2. Document, organize, and file key information gleaned from research; and
3. Document the full citation of original sources, usually in the form of a complete listing or annotated listing.
When to Use: Desk reviews should be completed at the beginning of a business analysis to determine what is already known, what new data are required, and to inform research design.
Fishbone Analysis
What: Fishbone analysis is a graphic tool to explore effects and the causes that create or contribute to those effects. These causes can then be targeted for improvement.
How: Steps for creating a fishbone analysis include:
1. Develop a problem statement: Place the problem statement at the head of the "fish." This is the end effect from which causes will be mapped. Draw a line toward the head of the fish. This is the fish's "backbone."
2. Begin to categorize: Start listing major steps in the business or service process, and connect them to the backbone in "ribs." There is no specific number of steps or categories needed to describe the problem.
3. List contributing factors: Brainstorm possible problem causes, and attach each to the appropriate rib. When brainstorming, it might be helpful to place ideas on category ribs as they are generated, or to brainstorm an entire list of ideas and then place them on ribs all at once.
4. Ask why for each factor: Repeatedly ask why that factor is present.
5. Look for deeper causes: There could be multiple branches off each successively smaller
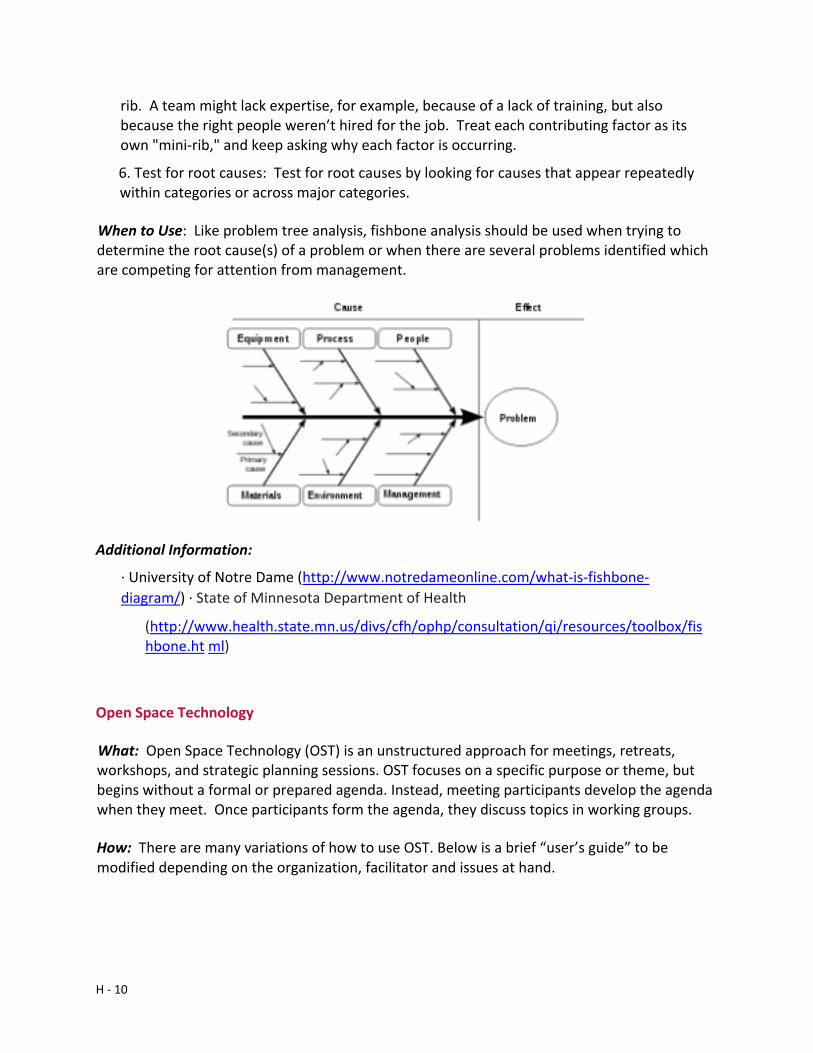
H - 10
rib. A team might lack expertise, for example, because of a lack of training, but also because the right people weren’t hired for the job. Treat each contributing factor as its own "mini-rib," and keep asking why each factor is occurring.
6. Test for root causes: Test for root causes by looking for causes that appear repeatedly within categories or across major categories.
When to Use: Like problem tree analysis, fishbone analysis should be used when trying to determine the root cause(s) of a problem or when there are several problems identified which are competing for attention from management.
Additional Information:
∙ University of Notre Dame (http://www.notredameonline.com/what-is-fishbone-diagram/) ∙ State of Minnesota Department of Health
(http://www.health.state.mn.us/divs/cfh/ophp/consultation/qi/resources/toolbox/fishbone.ht ml)
Open Space Technology
What: Open Space Technology (OST) is an unstructured approach for meetings, retreats, workshops, and strategic planning sessions. OST focuses on a specific purpose or theme, but begins without a formal or prepared agenda. Instead, meeting participants develop the agenda when they meet. Once participants form the agenda, they discuss topics in working groups.
How: There are many variations of how to use OST. Below is a brief “user’s guide” to be modified depending on the organization, facilitator and issues at hand.
H - 11
∙ Invitations: Keep invitations short and non-prescriptive. Include important details, such as the time and place of the meeting, and clearly explain the theme of the event. Attendance should not be mandatory. You only want participants who are passionate and interested in the theme. However, you should explain the meeting theme and the implications of not attending (For example, if you attend, you will be able to influence the future strategy of USAID, while not attending will signal a lack of interest in doing so). The invitation should also explain that the meeting will be unstructured until participants arrive. Let participants know that they are the ones driving the conversation. Most importantly, keep the invite intriguing and exciting—OST relies on positive “safe space” for dynamic discussions and participation.
∙ Facilitator: OST uses only one facilitator. It is important that that person does not instruct or control the day—rather he or she should help the group manage their own space and time. The facilitator should encourage, engage and empower participants and should not have “all the answers”.
∙ Logistics:
o Materials: A matrix with sticky notes (to display times for two-hour breakout sessions), markers, flip charts, tape, and paper.
o Room: The main room should big enough to allow all attendees to sit in a circle. There should be one unobstructed wall to tape the group schedule and key concepts. There should be additional rooms for the workgroups. Around five breakout rooms should be available for a group of 100 people.
o Time: Events should usually last at least a day. If you want a higher level of reporting out, they should last two days. Make sure people are clear that they need to participate fully and not drop in and out of the meeting. Lunch should be eaten when the
participants want to and people should be allowed to take self-selected breaks. Working groups may begin later or finish earlier than the allotted time. Once the Facilitator develops the approximate times for break out groups, time should flow organically without constraints from the Facilitator or other members.
∙ Introduction: Everyone should sit in a circle. The Facilitator should explain the theme of the day, expectations of what people and the group will produce, and the “rules” of OST. The theme should be explained in an evocative, not descriptive or prescriptive, manner. Within the first hour, the group should know what they are doing, have created agendas (task groups, discussion groups etc.) and be ready to work. Introductions must be energetic and short. As introductions are made, the wall behind the facilitator should have
H - 12
an “important concepts” poster (described below) and space for a bulletin board where people can post ideas.
∙ Bulletin Board: After explaining the theme, the facilitator should introduce the concept of the bulletin board. The bulletin board should be a space where people can put their topics for working group discussions with an associated breakout room and time. Invite people to the middle of the circle, to state their name and present their idea for discussion. Participants should write both on a piece of paper and post it on the wall. Once they have placed it on the wall they will need to take a sticky from the room schedule matrix (which has room availabilities with a time on each sticky) and put the sticky on their idea. Each session should be around two hours. Once people are done posting their ideas and corresponding times for their breakout groups the facilitator should help organize each group by putting morning session on the far left, noon sessions in the middle, and afternoon session’s on the far right.
∙ Market Space: The facilitator should then “open the market space,” where participants sign up for the groups they are interested in. If someone wants to combine groups, the author of the group can decide whether or not to.
∙ Important Concepts: Once everyone has signed up for their groups, the facilitator needs to explain important concepts for the day (these should be already hanging on the wall).
o The Four Principles 1. Whoever comes are the right people. If no one comes to a working group, that issue
may not be relevant or important to the overall group. 2. Whatever happens is the only thing that could have. 3. Whenever it starts is the right time. If a discussion takes a while to be
productive that it is okay. 4. When it is over it’s over. If an issue is solved in 20 minutes, and it is a 2 hour block
participants can move to another group.
o The Law of Two Feet
If anyone finds themselves in a place where they are not learning or contributing they can use their feet to go to another group. This can apply to participants who want to drift from meeting to meeting
∙ “Afternoon News” After discussions in each group the group should be called back into the main room. People should once again sit in a circle. The group should have an open
H - 13
mike so members can voluntarily share any positive or interesting stories that have emerged from the group.
∙ Reporting out If possible, throughout the day people should record important points within the ongoing discussion. An easy way to organize reporting is to have one Google doc where people can insert their notes and thoughts into throughout the day.
∙ Closing The day should end naturally. It is up to the facilitator to “feel” the group’s energy and the best way to close the day. One suggestion is to use the Native American tradition of a talking stick. Have each member pass around a stick. Once in his or her possession the participant should be able to speak freely about events or issues from throughout the day.
∙ Follow up is important to use the energy and progress made from the retreat and parlay it into after action working groups. Allow a space in the office for people to post their ideas and sign up for after action groups once the retreat is over. The role of leadership should be to send a message of encouragement to post ideas and join working groups, while not being prescriptive. Leadership should listen to results and recommendations from these groups and act on them as appropriate.
When to Use: OST works best when there is a complex issue that leadership does not have an answer to. OST can be used in groups with 5 to 500 participants and should take place over a one to three day period.
OST relies on people’s interest in the theme of the workshop or meeting to produce effective, frank, and useful discussion and action items. It is most effective when leadership takes a back seat, and there is a non-hierarchical approach and discussion of issues and interests. This allows people to raise relevant issues that are important to the group and important to them. Focusing on issues that people are invested in encourages energetic discussion and problem solving. This process empowers people to take initiative, responsibility, and follow up actions for their own ideas. It also highlights issues that would not be raised in a more formal setting.
Due to its structure as an open forum event, it will not be effective when there are issues with team dynamics, or tension with leadership.
Additional Information:
∙ Open Space World (http://www.openspaceworld.org/cgi/wiki.cgi?WorkingInOpenSpace)
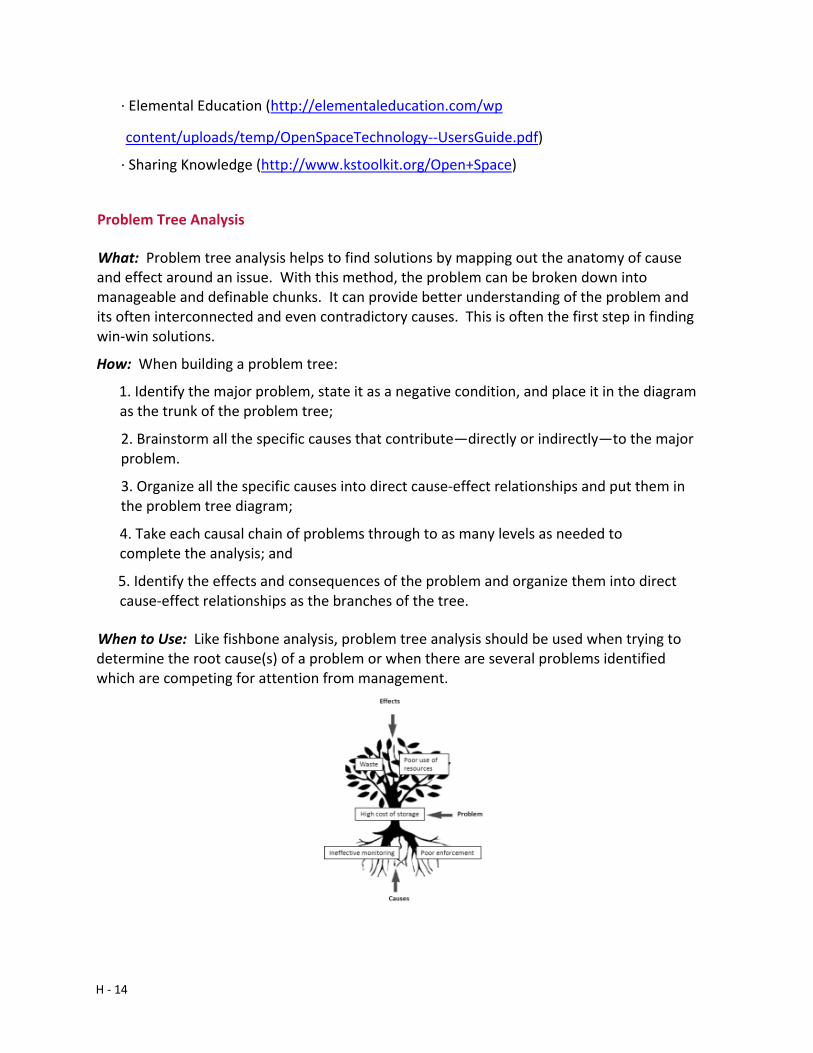
H - 14
∙ Elemental Education (http://elementaleducation.com/wp
content/uploads/temp/OpenSpaceTechnology--UsersGuide.pdf)
∙ Sharing Knowledge (http://www.kstoolkit.org/Open+Space)
Problem Tree Analysis
What: Problem tree analysis helps to find solutions by mapping out the anatomy of cause and effect around an issue. With this method, the problem can be broken down into manageable and definable chunks. It can provide better understanding of the problem and its often interconnected and even contradictory causes. This is often the first step in finding win-win solutions.
How: When building a problem tree:
1. Identify the major problem, state it as a negative condition, and place it in the diagram as the trunk of the problem tree;
2. Brainstorm all the specific causes that contribute—directly or indirectly—to the major problem.
3. Organize all the specific causes into direct cause-effect relationships and put them in the problem tree diagram;
4. Take each causal chain of problems through to as many levels as needed to complete the analysis; and
5. Identify the effects and consequences of the problem and organize them into direct cause-effect relationships as the branches of the tree.
When to Use: Like fishbone analysis, problem tree analysis should be used when trying to determine the root cause(s) of a problem or when there are several problems identified which are competing for attention from management.
H - 15
Additional Information:
∙ The Overseas Development Institute (http://www.odi.org.uk/publications/5258-problem-tree analysis)
∙ Massachusetts Institute of Technology (http://web.mit.edu/urbanupgrading/upgrading/issues tools/tools/problem-tree.html)
SWOT Analysis
What: A SWOT analysis is a business tool used to identify strategic issues within an organization by analyzing the Strengths, Weaknesses, Opportunities, and Threats of the organization. SWOT analysis can: 1) help a new group to focus on developing its mission and important strategies; 2) enable a group that has not been functioning as effectively as they could be to refocus their efforts and get on track; and 3) assist an organization to periodically renew its priorities in a systematic fashion.
How: The key steps in conducting a SWOT analysis include:
1. Brainstorming lists of strengths, weaknesses, opportunities and threats (remembering to keep the focus internal for strengths and weaknesses and external for opportunities and threats);
2. Taking the laundry-list of ideas within each category and reduce them to the top 5 to 10 ideas (per category);
3. Reviewing each category separately and discuss each of these ideas and the potential implications to the organization;
4. Remembering that the idea with SWOT analysis is to gain a better understanding of how the organization can relate to its external environment. As such, the next step is to look at the internal strengths and weaknesses of the organization and see how they relate to the opportunities and threats external to the organization; and
5. Looking at the following areas:
a. Those factors that represent both strengths of the organization and opportunities in the external environment. These represent potential areas for growth.
b. Those factors that represent weaknesses of the organization and threats in the external environment. These represent areas that need to be addressed.
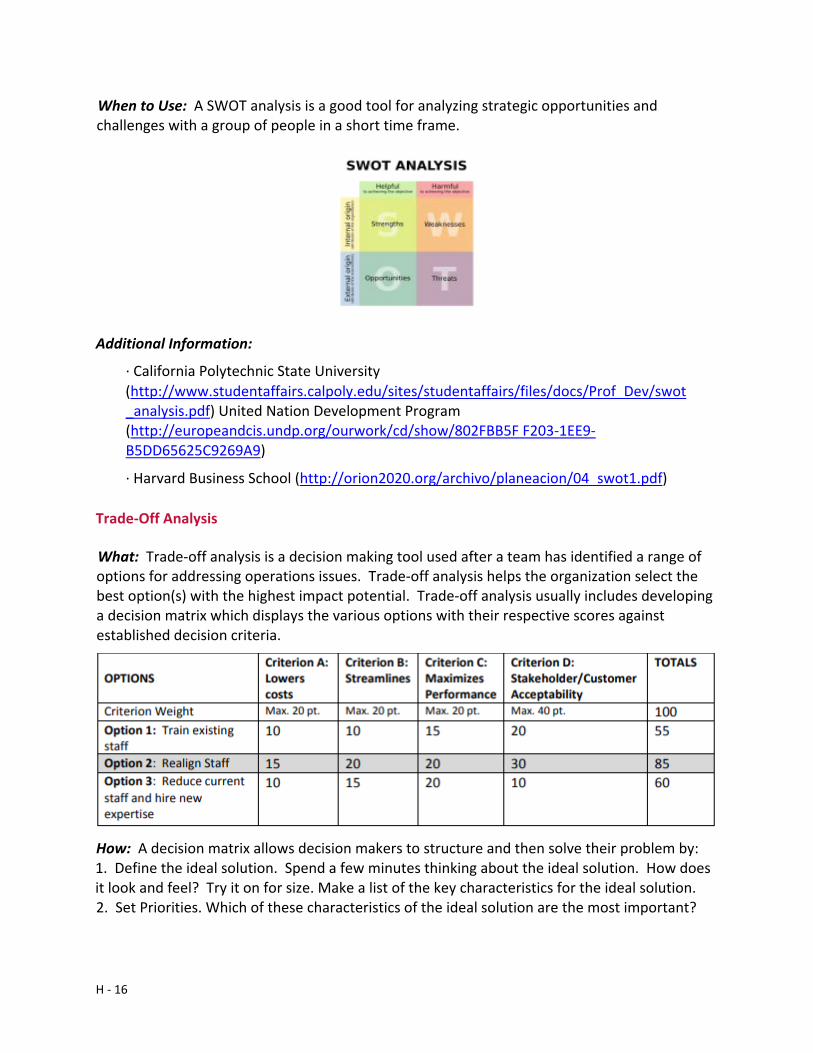
H - 16
When to Use: A SWOT analysis is a good tool for analyzing strategic opportunities and challenges with a group of people in a short time frame.
Additional Information:
∙ California Polytechnic State University (http://www.studentaffairs.calpoly.edu/sites/studentaffairs/files/docs/Prof_Dev/swot_analysis.pdf) United Nation Development Program (http://europeandcis.undp.org/ourwork/cd/show/802FBB5F F203-1EE9-B5DD65625C9269A9)
∙ Harvard Business School (http://orion2020.org/archivo/planeacion/04_swot1.pdf)
Trade-Off Analysis
What: Trade-off analysis is a decision making tool used after a team has identified a range of options for addressing operations issues. Trade-off analysis helps the organization select the best option(s) with the highest impact potential. Trade-off analysis usually includes developing a decision matrix which displays the various options with their respective scores against established decision criteria.
How: A decision matrix allows decision makers to structure and then solve their problem by: 1. Define the ideal solution. Spend a few minutes thinking about the ideal solution. How does it look and feel? Try it on for size. Make a list of the key characteristics for the ideal solution. 2. Set Priorities. Which of these characteristics of the ideal solution are the most important?
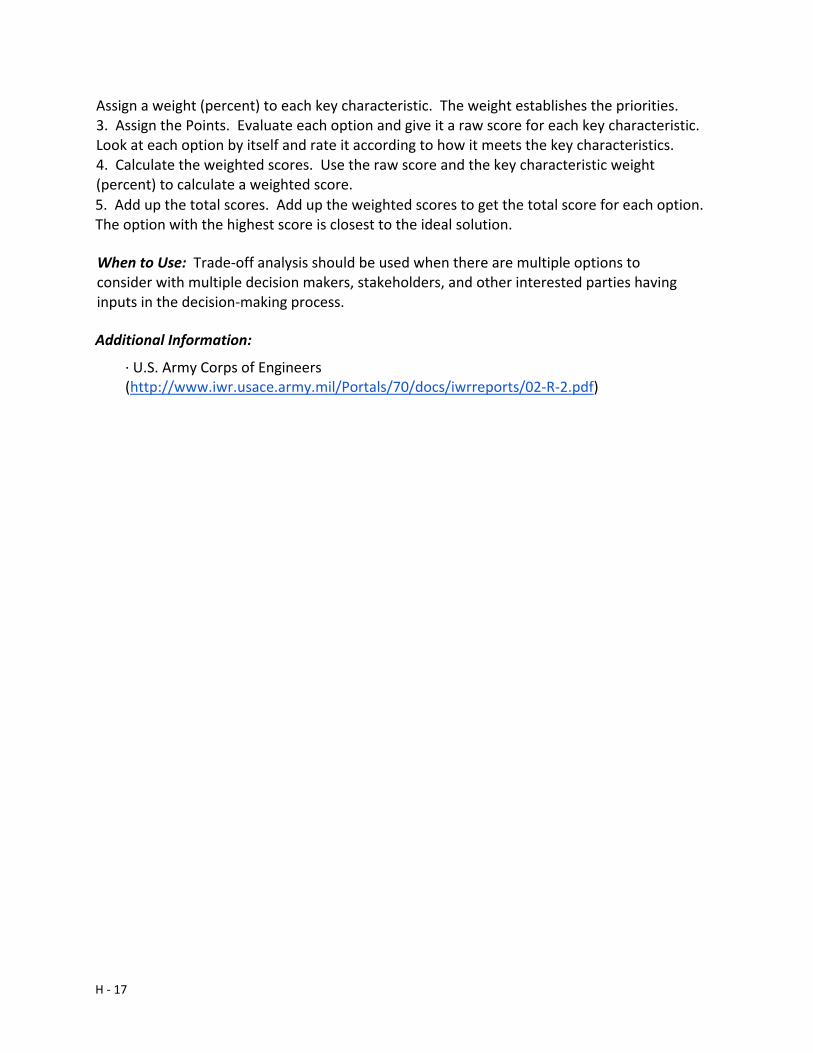
H - 17
Assign a weight (percent) to each key characteristic. The weight establishes the priorities. 3. Assign the Points. Evaluate each option and give it a raw score for each key characteristic. Look at each option by itself and rate it according to how it meets the key characteristics. 4. Calculate the weighted scores. Use the raw score and the key characteristic weight (percent) to calculate a weighted score. 5. Add up the total scores. Add up the weighted scores to get the total score for each option. The option with the highest score is closest to the ideal solution.
When to Use: Trade-off analysis should be used when there are multiple options to consider with multiple decision makers, stakeholders, and other interested parties having inputs in the decision-making process.
Additional Information:
∙ U.S. Army Corps of Engineers (http://www.iwr.usace.army.mil/Portals/70/docs/iwrreports/02-R-2.pdf)
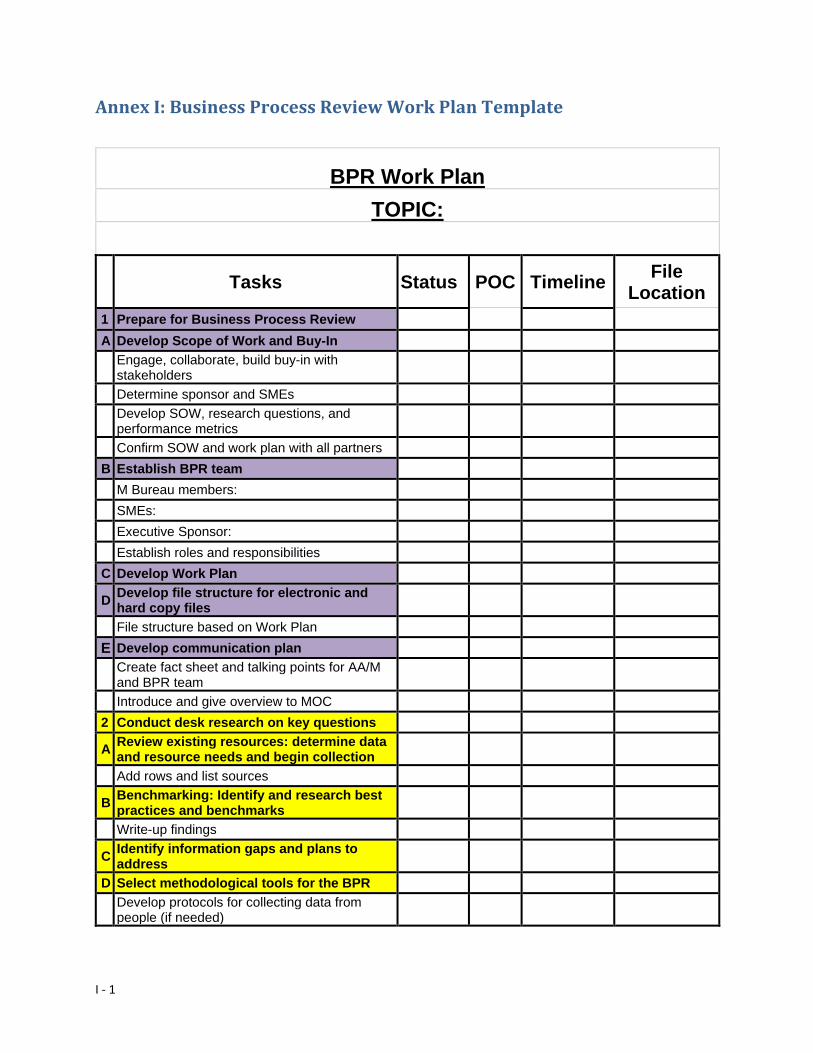
I - 1
Annex I: Business Process Review Work Plan Template
BPR Work Plan TOPIC:
Tasks Status POC Timeline File
Location 1 Prepare for Business Process Review
A Develop Scope of Work and Buy-In
Engage, collaborate, build buy-in with stakeholders
Determine sponsor and SMEs
Develop SOW, research questions, and performance metrics
Confirm SOW and work plan with all partners
B Establish BPR team M Bureau members: SMEs: Executive Sponsor: Establish roles and responsibilities
C Develop Work Plan
D Develop file structure for electronic and hard copy files
File structure based on Work Plan
E Develop communication plan
Create fact sheet and talking points for AA/M and BPR team
Introduce and give overview to MOC
2 Conduct desk research on key questions
A Review existing resources: determine data and resource needs and begin collection
Add rows and list sources
B Benchmarking: Identify and research best practices and benchmarks
Write-up findings
C Identify information gaps and plans to address
D Select methodological tools for the BPR
Develop protocols for collecting data from people (if needed)
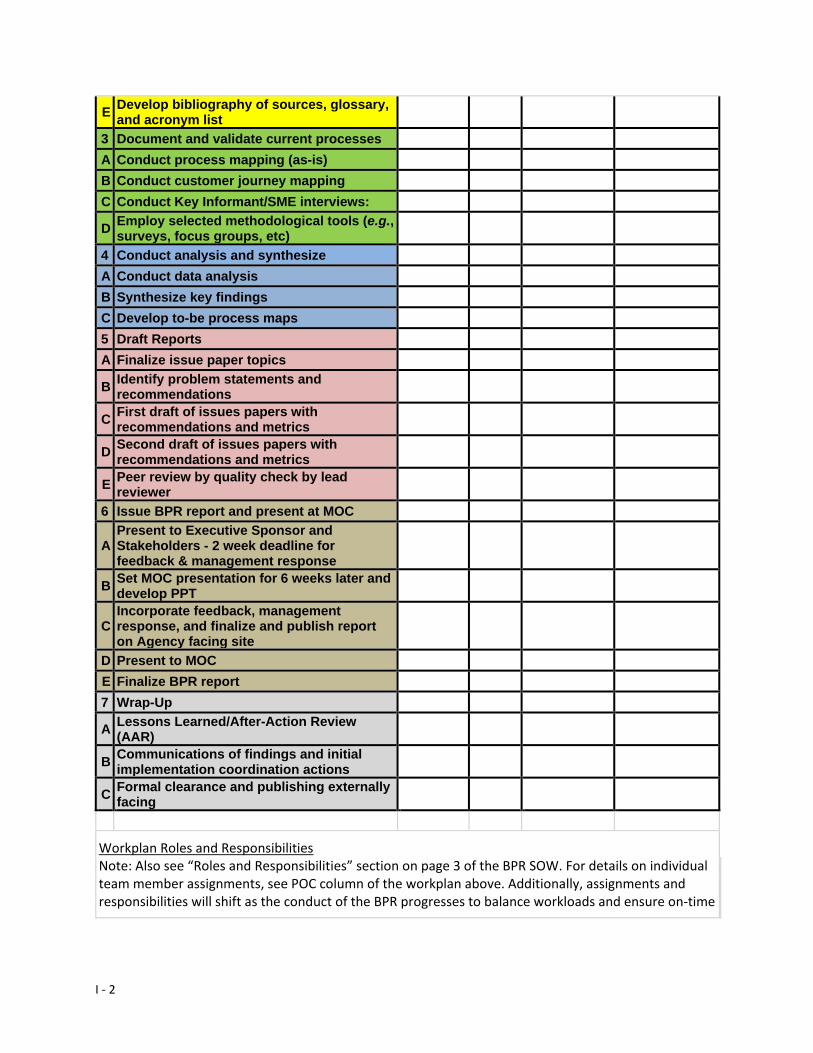
I - 2
E Develop bibliography of sources, glossary, and acronym list
3 Document and validate current processes
A Conduct process mapping (as-is)
B Conduct customer journey mapping
C Conduct Key Informant/SME interviews:
D Employ selected methodological tools (e.g., surveys, focus groups, etc)
4 Conduct analysis and synthesize
A Conduct data analysis
B Synthesize key findings
C Develop to-be process maps
5 Draft Reports
A Finalize issue paper topics
B Identify problem statements and recommendations
C First draft of issues papers with recommendations and metrics
D Second draft of issues papers with recommendations and metrics
E Peer review by quality check by lead reviewer
6 Issue BPR report and present at MOC
A Present to Executive Sponsor and Stakeholders - 2 week deadline for feedback & management response
B Set MOC presentation for 6 weeks later and develop PPT
C Incorporate feedback, management response, and finalize and publish report on Agency facing site
D Present to MOC
E Finalize BPR report
7 Wrap-Up
A Lessons Learned/After-Action Review (AAR)
B Communications of findings and initial implementation coordination actions
C Formal clearance and publishing externally facing
Workplan Roles and Responsibilities Note: Also see “Roles and Responsibilities” section on page 3 of the BPR SOW. For details on individual team member assignments, see POC column of the workplan above. Additionally, assignments and responsibilities will shift as the conduct of the BPR progresses to balance workloads and ensure on-time
I - 3
delivery of varying components. Senior Analysts Senior Analysts are responsible for team organization and scheduling to ensure on-time delivery of major BPR deliverables including analysis milestones, issue papers, and recommendations. Junior Analysts Junior Analysts are responsible for seeking assistance as needed with any assigned tasks and supporting senior analysts in all aspects of the BPR including detailed note-taking at interviews, file management, and bibliographies. Specific issue paper assignments will be issued in the coming weeks.
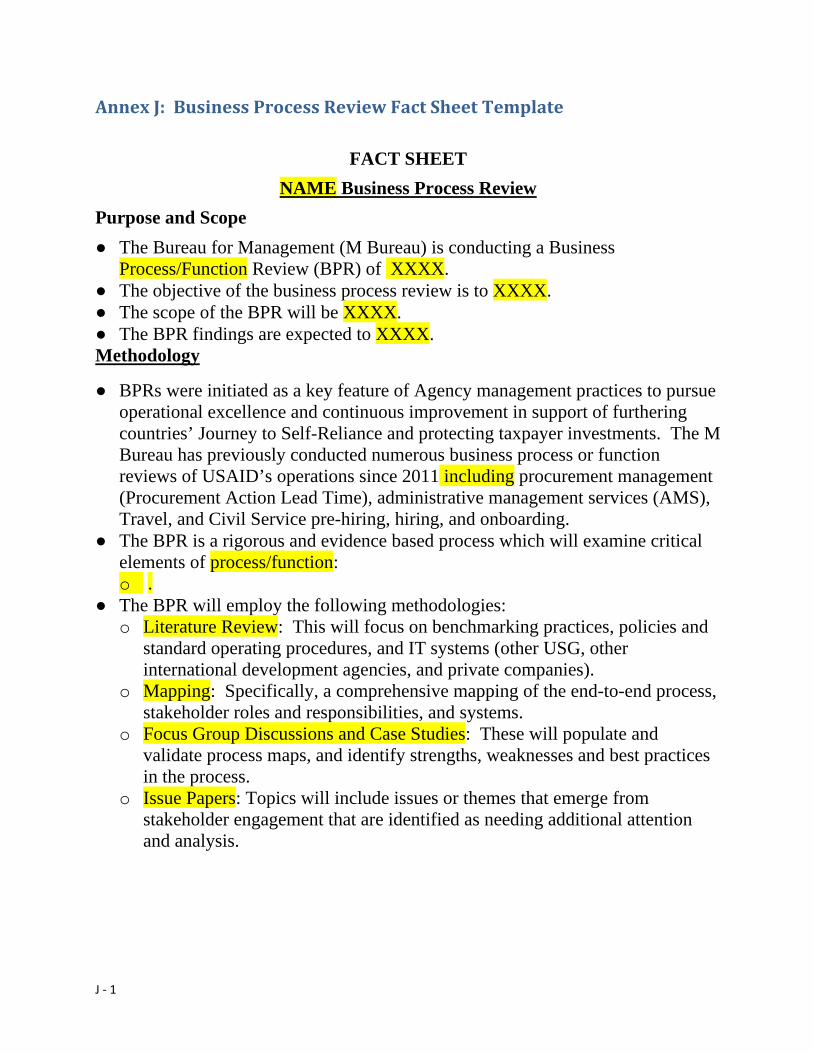
J - 1
Annex J: Business Process Review Fact Sheet Template
FACT SHEET NAME Business Process Review
Purpose and Scope ● The Bureau for Management (M Bureau) is conducting a Business
Process/Function Review (BPR) of XXXX. ● The objective of the business process review is to XXXX. ● The scope of the BPR will be XXXX. ● The BPR findings are expected to XXXX. Methodology
● BPRs were initiated as a key feature of Agency management practices to pursue operational excellence and continuous improvement in support of furthering countries’ Journey to Self-Reliance and protecting taxpayer investments. The M Bureau has previously conducted numerous business process or function reviews of USAID’s operations since 2011 including procurement management (Procurement Action Lead Time), administrative management services (AMS), Travel, and Civil Service pre-hiring, hiring, and onboarding.
● The BPR is a rigorous and evidence based process which will examine critical elements of process/function: o .
● The BPR will employ the following methodologies: o Literature Review: This will focus on benchmarking practices, policies and
standard operating procedures, and IT systems (other USG, other international development agencies, and private companies).
o Mapping: Specifically, a comprehensive mapping of the end-to-end process, stakeholder roles and responsibilities, and systems.
o Focus Group Discussions and Case Studies: These will populate and validate process maps, and identify strengths, weaknesses and best practices in the process.
o Issue Papers: Topics will include issues or themes that emerge from stakeholder engagement that are identified as needing additional attention and analysis.
J - 2
Timeline ● The period of the Review will be approximately XXX weeks beginning in
MONTH/YEAR. Points of Contact for the BPR: ● NAME email, phone extension
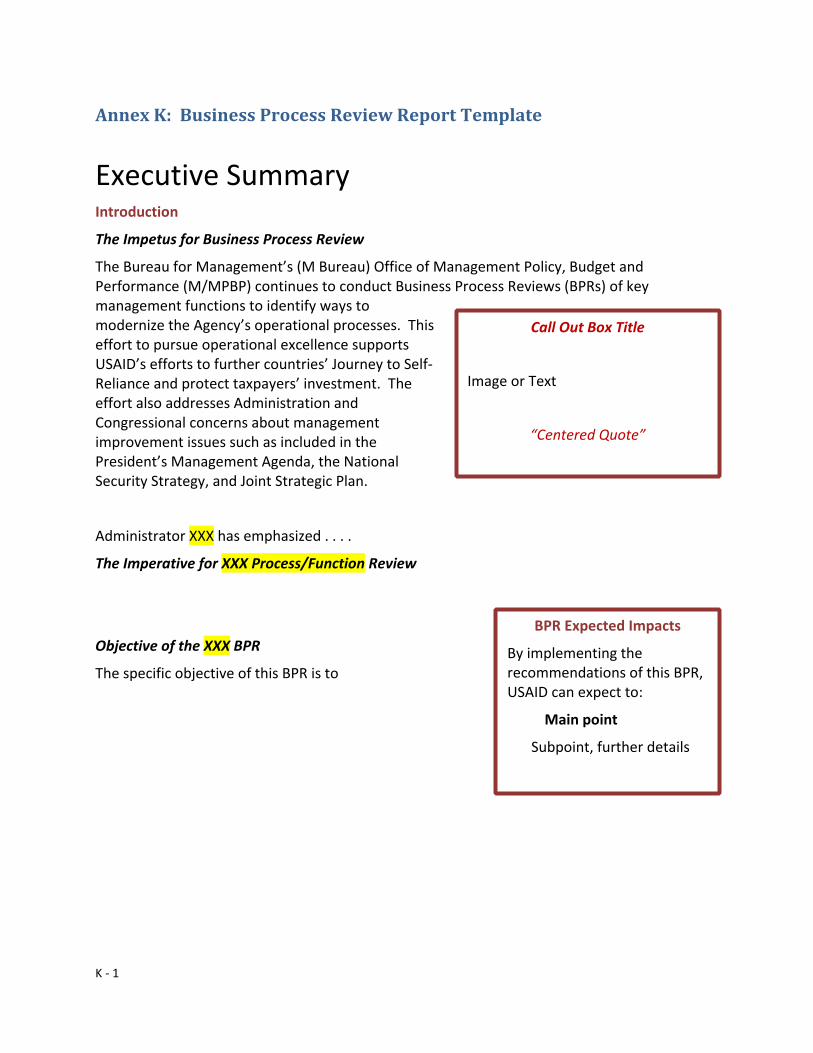
K - 1
Annex K: Business Process Review Report Template
Executive Summary Introduction
The Impetus for Business Process Review
The Bureau for Management’s (M Bureau) Office of Management Policy, Budget and Performance (M/MPBP) continues to conduct Business Process Reviews (BPRs) of key management functions to identify ways to modernize the Agency’s operational processes. This effort to pursue operational excellence supports USAID’s efforts to further countries’ Journey to Self-Reliance and protect taxpayers’ investment. The effort also addresses Administration and Congressional concerns about management improvement issues such as included in the President’s Management Agenda, the National Security Strategy, and Joint Strategic Plan.
Administrator XXX has emphasized . . . .
The Imperative for XXX Process/Function Review
Objective of the XXX BPR
The specific objective of this BPR is to
Call Out Box Title
Image or Text
“Centered Quote”
BPR Expected Impacts
By implementing the recommendations of this BPR, USAID can expect to:
Main point
Subpoint, further details
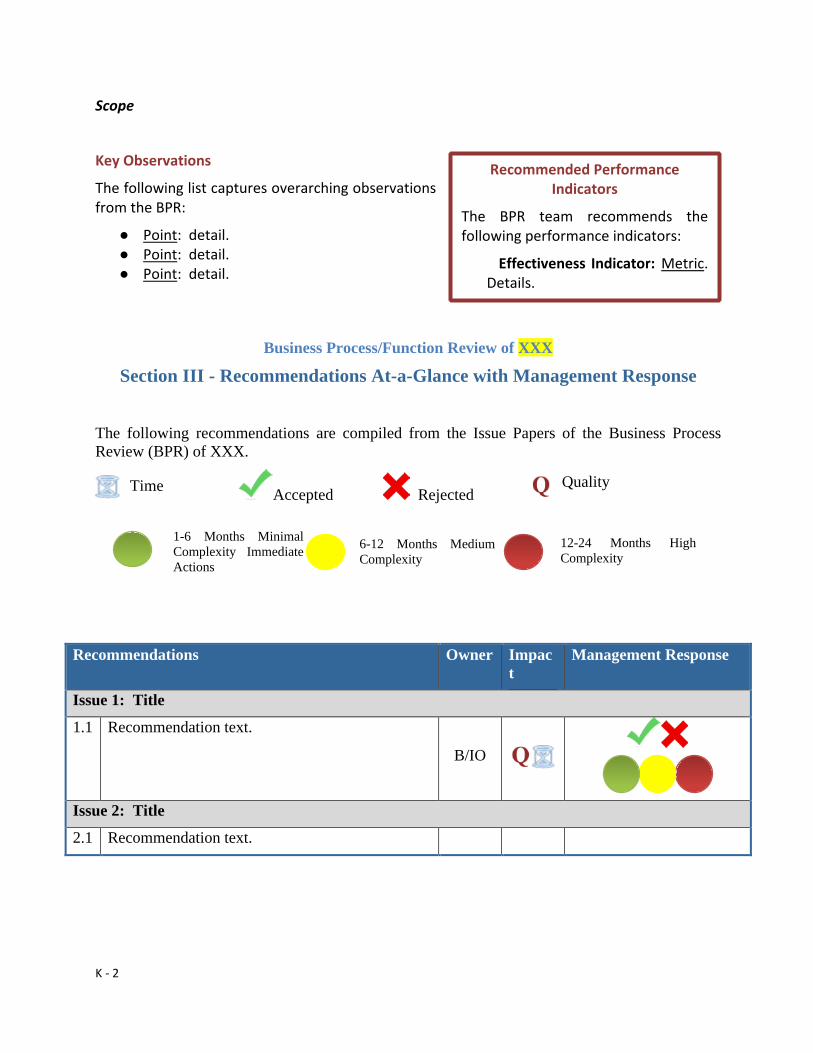
K - 2
Scope
Key Observations
The following list captures overarching observations from the BPR:
● Point: detail. ● Point: detail. ● Point: detail.
Business Process/Function Review of XXX
Section III - Recommendations At-a-Glance with Management Response
The following recommendations are compiled from the Issue Papers of the Business Process Review (BPR) of XXX.
Accepted Rejected
Recommendations Owner Impact
Management Response
Issue 1: Title
1.1 Recommendation text.
B/IO
Issue 2: Title
2.1 Recommendation text.
Quality
Recommended Performance Indicators
The BPR team recommends the following performance indicators:
Effectiveness Indicator: Metric. Details.
Time
1-6 Months Minimal Complexity Immediate Actions
6-12 Months Medium Complexity
12-24 Months High Complexity
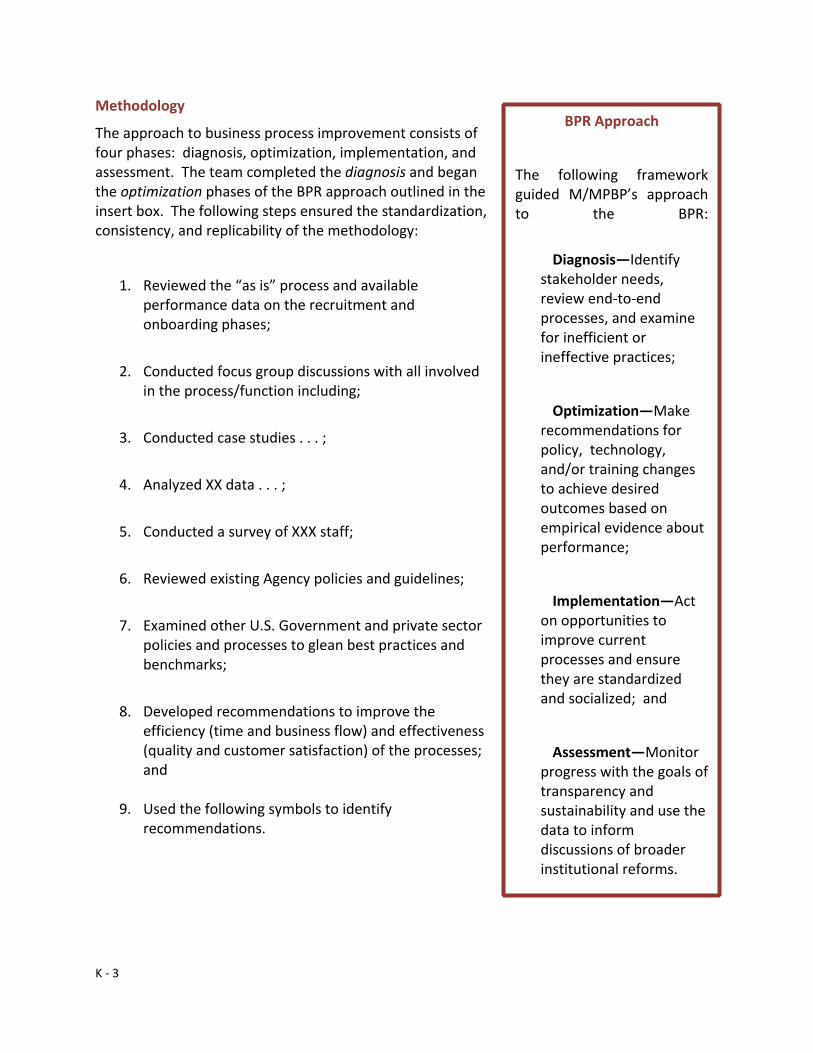
K - 3
Methodology
The approach to business process improvement consists of four phases: diagnosis, optimization, implementation, and assessment. The team completed the diagnosis and began the optimization phases of the BPR approach outlined in the insert box. The following steps ensured the standardization, consistency, and replicability of the methodology:
1. Reviewed the “as is” process and available performance data on the recruitment and onboarding phases;
2. Conducted focus group discussions with all involved in the process/function including;
3. Conducted case studies . . . ;
4. Analyzed XX data . . . ;
5. Conducted a survey of XXX staff;
6. Reviewed existing Agency policies and guidelines;
7. Examined other U.S. Government and private sector policies and processes to glean best practices and benchmarks;
8. Developed recommendations to improve the efficiency (time and business flow) and effectiveness (quality and customer satisfaction) of the processes; and
9. Used the following symbols to identify recommendations.
BPR Approach
The following framework guided M/MPBP’s approach to the BPR:
Diagnosis—Identify stakeholder needs, review end-to-end processes, and examine for inefficient or ineffective practices;
Optimization—Make recommendations for policy, technology, and/or training changes to achieve desired outcomes based on empirical evidence about performance;
Implementation—Act on opportunities to improve current processes and ensure they are standardized and socialized; and
Assessment—Monitor progress with the goals of transparency and sustainability and use the data to inform discussions of broader institutional reforms.
K - 4
● Recommendations that address efficiency:
● Recommendations that address quality, customer service, or effectiveness:
The review team recommends the Agency now undertake the implementation phase including a monitoring plan for the assessment phase. These phases should include the following next steps by the relevant B/IO implementing agent:
1. Convene an implementation planning session with key personnel and recommendation owners to include review of the recommendations, metrics, and benchmarks and best practices included in the BPR report;
2. Create an Action Plan and Communications Plan to socialize and implement the recommendations presented;
3. Manage the Action Plan on an ongoing basis to ensure implementation of recommendations;
4. Develop a dashboard including a process to monitor responsible B/IO implementation of the Action Plan;
5. Update the dashboard on a monthly basis to monitor implementation; and
6. Conduct quarterly meetings to inform future decision-making.
The following sections present detailed discussions of key issues and recommendations at-a-glance.
Q
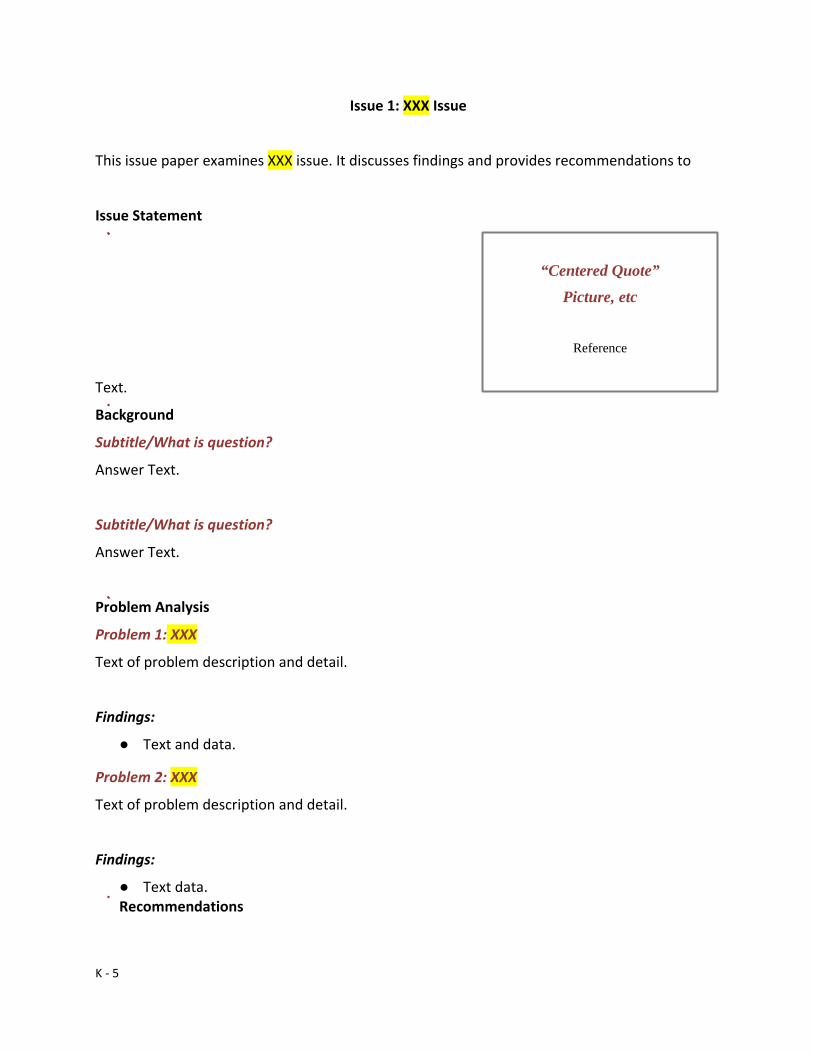
K - 5
Issue 1: XXX Issue
This issue paper examines XXX issue. It discusses findings and provides recommendations to
Issue Statement
Text.
Background
Subtitle/What is question?
Answer Text.
Subtitle/What is question?
Answer Text.
Problem Analysis
Problem 1: XXX
Text of problem description and detail.
Findings:
● Text and data.
Problem 2: XXX
Text of problem description and detail.
Findings:
● Text data. Recommendations
“Centered Quote” Picture, etc
Reference
K - 6
Recommendation text.
1 Rationale:
Rationale text.
Recommendation text.
2 Rationale:
Rationale text.
Annexes
As needed and including appropriate reporting on data collected
Q
Q