Embed Size (px)
Citation preview
3 1 1 7 1
P E T R O N
C O R P O R A T I O N
S M C H E A D O F F I C E C O M P L E X 4 0 S A N
M I G U E L A V E. M A N D A L U Y O N G C I T Y
1 2 3 1 0 5 1 7
Dept. Requiring this Doc.
Total No. of Stockholders
Remarks = pls. use black ink for scanning purposes
C O V E R S H E E T
S. E. C. Registration Number
(Company's Full Name)
( Business Adress: No. Street City / Town / Province )
ATTY. JHOANNA JASMINE M. JAVIER-ELACIO 8884-9200
Contact Person Company Telephone Number
Month Day FORM TYPE Month Day
(SEC FORM 17-A)
ANNUAL REPORT 2021
Amended Articles Number/Section
Total Amount of Debt Outstanding: P211,841 Million (as of December 31, 2021-CONSO)
Fiscal Year Annual Meeting
Secondary License Type, if Applicable
N/A
(for 2022)
144,753 (as of December 31, 2021)
Certificates of Permit to Offer Securities for Sale dated 1994, 1995, 1996, 2010, 2014, 2016, 2018 and 2019
Document I. D. Cashier
S T A M P S
Domestic Foreign
To be accomplished by SEC Personnel concerned
Fiscal Numer LCU
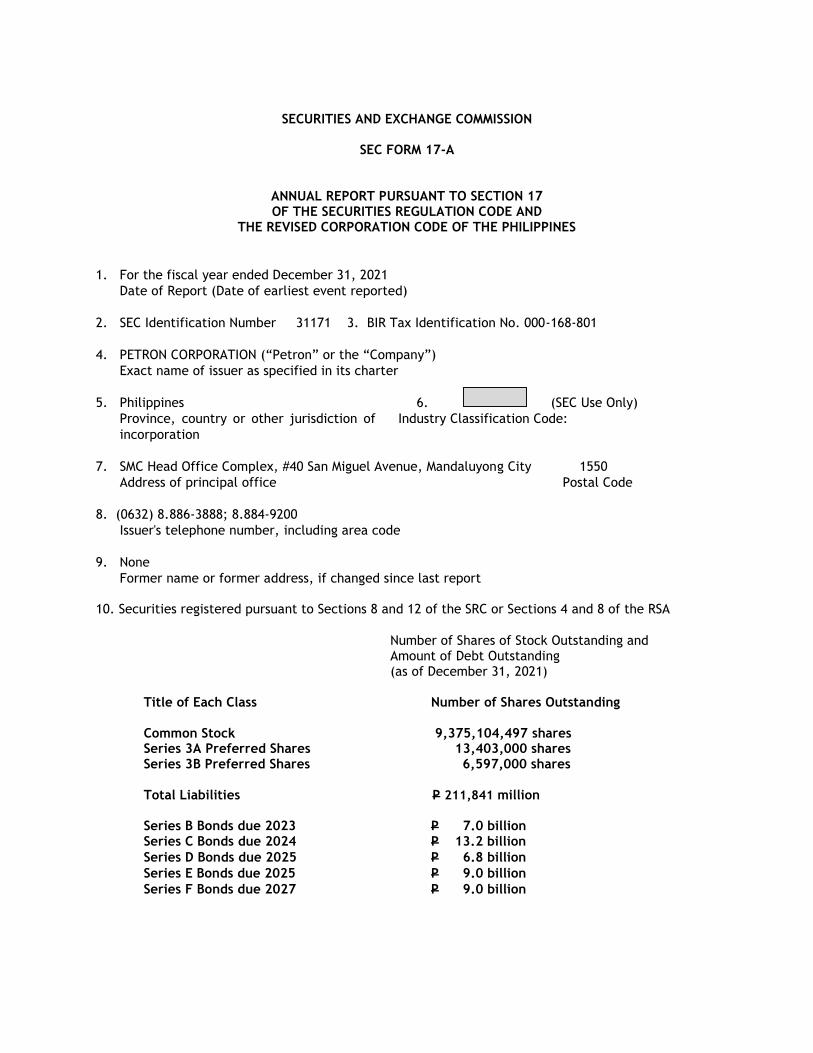
SECURITIES AND EXCHANGE COMMISSION
SEC FORM 17-A
ANNUAL REPORT PURSUANT TO SECTION 17 OF THE SECURITIES REGULATION CODE AND
THE REVISED CORPORATION CODE OF THE PHILIPPINES
1. For the fiscal year ended December 31, 2021
Date of Report (Date of earliest event reported)
2. SEC Identification Number 31171 3. BIR Tax Identification No. 000-168-801
4. PETRON CORPORATION (“Petron” or the “Company”)
Exact name of issuer as specified in its charter
5. Philippines 6. (SEC Use Only)
Province, country or other jurisdiction of
incorporation
Industry Classification Code:
7. SMC Head Office Complex, #40 San Miguel Avenue, Mandaluyong City 1550
Address of principal office Postal Code
8. (0632) 8.886-3888; 8.884-9200
Issuer's telephone number, including area code
9. None
Former name or former address, if changed since last report 10. Securities registered pursuant to Sections 8 and 12 of the SRC or Sections 4 and 8 of the RSA
Number of Shares of Stock Outstanding and Amount of Debt Outstanding (as of December 31, 2021)
Title of Each Class Number of Shares Outstanding
Common Stock 9,375,104,497 shares Series 3A Preferred Shares 13,403,000 shares
Series 3B Preferred Shares 6,597,000 shares Total Liabilities P 211,841 million Series B Bonds due 2023 P 7.0 billion Series C Bonds due 2024 P 13.2 billion
Series D Bonds due 2025 P 6.8 billion
Series E Bonds due 2025 P 9.0 billion
Series F Bonds due 2027 P 9.0 billion
2
11. Are any or all of these securities listed on any Philippine stock exchange? Yes [X] No [ ] If yes, state the name of such stock exchange and the classes of securities listed therein:
Philippine Stock Exchange Common Shares Series 3A Preferred Shares Series 3B Preferred Shares
Philippine Dealing & Exchange Corp. Series B Bonds due 2023
Series C Bonds due 2024 Series D Bonds due 2025 Series E Bonds due 2025 Series F Bonds due 2027
12. Check whether the registrant:
(a) has filed all reports required to be filed by Section 17 of the SRC and SRC Rule 17 thereunder or Section 11 of the RSA and RSA Rule 11(a)-1 thereunder, and Sections 26 and 141 of the Corporation Code of the Philippines (the “Corporation Code”) during the preceding 12 months (or for such shorter period that the registrant was required to file such reports);
Yes [X] No [ ]
The SEC Form 17-Q for the first quarter of 2022 will be filed by the Company by May 12, 2022.
(b) has been subject to such filing requirements for the past 90 days.
Yes [X] No [ ] 13. The aggregate market value of the voting stock held by non-affiliates of the Company (i.e., other than San Miguel Corporation, SEA Refinery Corporation, Petron Corporation Employees’ Retirement Plan and the directors and officers of Petron Corporation from Vice President and up as of December 31, 2021 totaling 2,514,322,488 common shares was P7,970,402,286.96 based on the price of P3.17 per share as of December 20, 2021, the last trading day of 2021. Petron had a public ownership of 26.72% as of December 31, 2021. The aggregate market value of the voting stock held by non-affiliates of the Company as of March 31, 2022 totaling 2,514,320,488 common shares was P8,297,257,610.40 based on the price of P3.30 per share as of March 31, 2022, the last trading day of March 2022. Petron had a public ownership of 26.72% as of March 31, 2022. Attached as Annexes A and B are the public ownership reports of the Company as of December 31, 2021 and March 31, 2022.
DOCUMENTS INCORPORATED BY REFERENCE
N o n e
3
PART I – BUSINESS AND GENERAL INFORMATION
(A) Description of Business
(1) Business Development (i) The Company
Petron was incorporated in the Philippines on December 22, 1966 as “Esso Philippines Inc.” Petron was renamed “Petrophil Corporation” in 1974 when the Philippine National Oil Company (“PNOC”) acquired it. In 1985, Petrophil and Bataan Refinery Corporation (formerly, the “Standard Vacuum Refining Corporation”) were merged with Petrophil Corporation as the surviving corporation. The Company changed its corporate name to “Petron Corporation” in 1988. On September 13, 2013, the SEC approved the amendment of the Company’s Articles by extending the corporate term of the Company for another 50 years from and after December 22, 2016. However, as a general rule under the Revised Corporation Code of the Philippines (“Revised Corporation Code”), which took effect on February 23, 2019, corporations with certificates of incorporation prior to the effectivity of the Revised Corporation Code, and which continue to exist, shall have perpetual existence. By operation of law, therefore, the Company shall now have perpetual existence. As of March 22, 2022 (the record date for the 2022 annual stockholders’ meeting), the three (3) principal common shareholders of the Company holding at least 5% of its common stock were SEA Refinery Corporation (“SEA Refinery”) (50.10%), PCD Nominee Corporation - Filipino (19.78%) and San Miguel Corporation (“SMC”) (18.16%). SEA Refinery is wholly-owned by SMC. SMC thus holds an aggregate 68.26% ownership of the common shares of the Company. The registered office address of Petron is at the SMC Head Office Complex, 40 San Miguel Avenue, Mandaluyong City. (ii) Subsidiaries The direct subsidiaries of the Company as of December 31, 2021 are listed below:
• New Ventures Realty Corporation (“NVRC”) is a realty firm established on August 24, 1995. NVRC is authorized to acquire and develop land but it does not engage in the subdivision business. Land suitable for use as service station sites, bulk plants or sales offices are purchased by NVRC, which are then leased to Petron for use in the latter’s operation. NVRC’s wholly owned subsidiary, Las Lucas Development Corporation, which was acquired in 2003, was later renamed “Las Lucas Construction and Development Corporation” upon approval by the SEC in September 2009 (“LLCDC”). In 2012, NVRC acquired 100% of Parkville Estates and Development Corporation and 60% of Mariveles Landco Corporation. In 2013, NVRC further acquired 100% of South Luzon Prime Holdings Incorporated, MRGVeloso Holdings, Inc. (which was merged into LLCDC effective June 1, 2018) and Abreco Realty Corp.
• Overseas Ventures Insurance Corporation Ltd. (“Ovincor”) was incorporated on November 16, 1995 under the laws of Bermuda for the purpose of expediting the reinsurance of Petron’s insurable interests as covered by Petrogen. Reinsurance includes the insurance cover for the refinery of Petron in Bataan (the “Petron Bataan Refinery”), the bulk plants and service station properties, petroleum and cargo insurance and performance bonds for Petron contractors and haulers as well.
4
• Petron Freeport Corporation (“PFC”; formerly, “Petron Treats Subic, Inc.”) was incorporated on November 6, 2003. The company is registered with the Subic Bay Metropolitan Authority (“SBMA”) as a Subic Bay Freeport (“SBF”) enterprise. PFC is engaged in the business of importing, transporting, trading and retailing petroleum products and related products. As a registered SBF enterprise, PFC is entitled to tax-free and duty-free importation of raw materials and capital equipment for use solely within SBF. PFC has two (2) divisions - retail and manufacturing. The retail division handles the service station operations (i.e., forecourt, quick-service restaurant, and locators). The manufacturing division is engaged in refining, distilling and manufacturing any and all kinds of petroleum products, oil, gas and other vehicle substances. Direct operations of the retail facilities and the manufacturing plant of PFC allows Petron to deal in the business of purchasing, marketing, distributing and trading petroleum, oil, gas, and related products.
• Petron Marketing Corporation (“PMC”) was incorporated on January 27, 2004 with the same business purpose as PFC but operated outside the SBF. PMC is a wholly-owned subsidiary of Petron. PMC turned over to Petron the operation of service stations that PMC held and the operation of Treats stores, effective August 1, 2016 and November 30, 2016, respectively. PMC also terminated its franchises to the fastfood stores.
• Petron Singapore Trading Pte. Ltd. (“PSTPL”) was established in 2010 as Petron’s trading subsidiary in Singapore. The subsidiary aims to optimize crude procurement and participate in Singapore’s Global Trader Program, which allows the Company access to a wider selection of crude alternatives, resulting in further optimization of Petron’s crude selection.
• Petron Global Limited (“Petron Global”) is a holding company incorporated under the laws of the British Virgin Islands acquired by the Company on February 24, 2012.
• Petron Finance (Labuan) Limited (“Petron Finance”) is a holding company incorporated under the laws of Labuan, Malaysia acquired by the Company on March 2, 2012.
• Petrochemical Asia (HK) Limited (“PAHL”) is a holding company incorporated under the laws of Hong Kong over which the Company obtained control in January 2013 and 100% ownership in July 2016.
• Petron Oil & Gas Mauritius Ltd. (“POGM”) is a holding company incorporated under the laws of Mauritius acquired by the Company on February 8, 2012. Petron Oil & Gas International Sdn. Bhd. (“POGI”) is a subsidiary of POGM incorporated under the laws of Malaysia, which, on March 30, 2012, acquired 65% of the issued and outstanding share capital of Esso Malaysia Berhad (“EMB”), a publicly-listed company in Malaysia, and 100% of the issued and outstanding share capital of ExxonMobil Malaysia Sdn. Bhd. and ExxonMobil Borneo Sdn. Bhd. POGI subsequently acquired an additional 8.4% of the voting shares of EMB in May 2012 pursuant to a mandatory takeover offer. On April 23, 2012, the Companies Commission of Malaysia (“CCM”) issued a certificate for the change of name of ExxonMobil Malaysia Sdn. Bhd. to “Petron Fuel International Sdn. Bhd.” (“PFISB”) and of ExxonMobil Borneo Sdn Bhd. to “Petron Oil (M) Sdn. Bhd.” (“POMSB”). Thereafter, on July 10, 2012, the CCM issued a certificate for the change of name of EMB to “Petron Malaysia Refining & Marketing Bhd.” (“PMRMB”).
5
PMRMB, PFISB and POMSB (collectively, the “Petron Malaysia Companies”) are companies incorporated under the laws of Malaysia and are engaged in the downstream oil business in Malaysia. The Petron Malaysia Companies’ distribution network (including in the state of Sabah) is comprised of 12 product terminals and facilities. The Petron Malaysia Companies have a network of more than 720 retail service stations in the country. PMRMB owns and operates the 88,000 bpd Port Dickson Refinery (“PDR”). The PDR produces a range of products, including LPG, naphtha, gasoline, diesel, jet fuel, and low sulfur waxy residue (“LSWR”). The Petron Malaysia Companies’ fuels marketing business in Malaysia is divided into retail business and commercial sales. The retail business markets fuels and other retail products through its network of service stations located throughout Peninsular and Sabah-East Malaysia. In December 2016, POMSB launched its downstream business in the state of Sarawak-East Malaysia. The Petron Malaysia Companies’ commercial sales are divided into four (4) segments: industrial and wholesale, aviation fuels, LPG and lubricants/specialties. The industrial segment sells diesel and gasoline fuels to mini-stations and power plants, as well as to the manufacturing, plantation, transportation and construction sectors while the Malaysian wholesale segment primarily engages in diesel sales to company-appointed resellers, which sell the Company’s products to industrial customers. The aviation group mainly sells to key airline customers which operate at the Kuala Lumpur International Airport where the product is supplied through the pipeline connected to the Port Dickson Terminal. PMRMB markets LPG in 12-kg and 14-kg cylinders for domestic use and 50-kg and bulk for commercial use. In April 2012, PFISB established a lubricants and specialties segment to introduce Petron lubricants and greases into the Malaysian market. Automotive lubricants are sold through the service stations and vehicle workshops by appointed distributors in Malaysia. PMRMB exports LSWR and naphtha from the PDR.
The above-listed subsidiaries of the Company have no plans of engaging in lines of products or services other than those provided in connection with the promotion and enhancement of the business of the Company. The Company and its subsidiaries are not subject of any bankruptcy, receivership or similar proceedings.
Operating Highlights
Sales For the whole of 2021, the Company’s consolidated sales volume stood at 82.2 million barrels, 5% higher than 2020’s 78.6 million barrels. Refining The Petron Bataan Refinery Master Plan Phase-2 Upgrade (“RMP-2”) upgraded the Petron Bataan Refinery to a full conversion refining complex, where all fuel oil is converted to higher value products (gasoline, diesel, and petrochemicals), making it comparable to other highly complex refineries worldwide. RMP-2 started its full commercial operation in January 2016. The closure of the Shell Refinery since May 2020 leaves the Petron Bataan Refinery as the only remaining refining facility in the country.
6
In December 2021, the Petron Bataan Refinery renewed its registration with the AFAB as a registered enterprise. FAB-registered enterprises are entitled to avail of fiscal incentives under the Special Economic Zone Act of 1995 or the Omnibus Investment Code of 1987 such as (i) tax- and duty-free importation of merchandise which include raw materials, capital equipment machineries and spare parts; (ii) exemption from export wharfage dues, export taxes, imposts, and fees; and (iii) VAT zero-rating of local purchases, subject to compliance with Bureau of Internal Revenue and AFAB requirements. Further, VAT will only be imposed on the Company as a FAB Registered Enterprise upon the withdrawal of products from the refinery instead of the VAT being payable upon importation of crude oil. Product Supply and Distribution The Company continues to implement programs to ensure adequate and timely product supply such as storage capacity additions, effective inventory management, keeping a sufficient fleet of tank trucks and marine vessels, and an inter-depot support system during periods of calamities. Human Resources In 2021, the Company aimed at providing learning opportunities to support the increasingly dynamic business conditions. The training programs were centered on fueling career growth through developing both hard and soft skills of the Company’s talents. Capitalizing on online learning platforms such as MS Teams and Zoom, Petron dedicated 49,074.65 training hours for all employees or an average of 19.58 hours of training per employee. In strengthening the leadership pipeline, leadership development programs were the top priority as Petron maximized the learning opportunities offered by SMC. This is supported by Petron’s coaching program composed of 60 coachees and 40 coaches which generated 790 coaching hours in 2021.
Health, Safety and Environment (“HSE”) The Company’s HSE programs continue to be an important element in the operations of its facilities. HSE programs of the Company include ECOWATCH assessment and safety oversight assessment and compliance inspections of the depots/terminals, service stations and third-party LPG filling plants, participation in industry-wide oil spill response exercises, emergency drills and exercises, safety seminars/trainings, and maintenance of management systems and ISO certifications on environment, health and safety. All 30 terminals are certified under the new ISO 9001:2015 (QMS), ISO 14001:2015 (EMS) standards and ISO 45001:2018 (Occupational Health and Safety (OH&S) Management System). Furthermore, all 15 Petron pier facilities are compliant with the International Ship and Port Facility Security Code (“ISPS Code”) and certified by the Office of the Transport Security under the DOTC. The ISPS certification is a requirement by the International Maritime Organization for all international vessels calling on international ports and for all ports accepting international vessels.
The Terminal Operations Division of the Company implemented the Loss Prevention System (“LPS”). LPS is a system to prevent or reduce losses using behavior-based tools and proven management techniques. With this new system, the Company aims to improve the over-all safety culture of the division to prevent all types of loses, and eventually apply the same system throughout the organization
From January to December 2021, a total of 10.6 million safe man hours were achieved by the Head Office, the Petron Bataan Refinery and the Terminals.
7
Corporate Social Responsibility (“CSR”) Through Petron Foundation, Inc. (“PFI”), the Company remains in the consciousness of the Filipino public and in the process, support the Company’s business growth. The Company continues to add value to the business by actively engaging with its host communities through relevant and strategic CSR programs that focus on education, environment, entrepreneurship and livelihood, and community engagement, as well as strengthening ties with its stakeholders.
Among the CSR and sustainability activities of Petron in 2021 were the following: Education
• Tulong Aral ng Petron. In partnership with the Department of Social Welfare and Development (“DSWD”) and the Department of Education (“DepEd”), the Company continued to implement its flagship education program Tulong Aral ng Petron (“Tulong Aral”) in sending deserving children and youth through elementary, high school and college. By the end of school year 2020-2021, Tulong Aral had a total of 2,752 scholars from elementary to college in 129 partner schools in the National Capitol Region and in provinces where the Company’s terminals are located. A total of 690 Tulong Aral scholars from elementary to college graduated at the end of School year 2020-2021 (596 elementary, 91 high school and three college scholars).
An internal Christmas campaign among Petron employees generated additional support for Tulong Aral scholars.
• Bataan scholarships. Graduates of the Company’s Bataan engineering scholarship program joined the Petron Bataan Refinery work force in 2021, bringing the number of Bataan scholars presently employed by the Petron Bataan Refinery to 86.
• Brigada Eskwela. The Company provided financial assistance to nearly 100 partner schools located in fence-line communities nationwide, benefitting at least 100,000 students and educators.
In October 2021, the Company renewed its partnership with the DepEd supporting DepEd’s Basic Education Learning Continuity Plan.
Environment
• Bataan Integrated Coastal Management Program (“BICMP”). The Company continued to support the implementation of the BICMP in 2021. It sustained its partnership with the Provincial Government of Bataan in the hosting of the virtual annual Pawikan Festival in December 2021 that had an online audience of at least 2,700 public school students and teachers and DepEd officials from Bataan.
• Participation in the National Greening Program. The Company continued to help reduce its environmental footprint, comply with government regulations, contribute to operational efficiency, and maintain its sustainable practices.
• Reforestation and Tree-Planting. In the first half of 2021, the Company secured approval from the local government units for the planting by the Bawing Terminal of about 2,500 new mangrove propagules and by the Tagaloan Terminal of bamboo and other seedlings. The Subic and Davao Terminal conducted tree-planting activities in the fourth quarter of 2021 in celebration of International Coastal Cleanup Month.
8
Health and Human Services
• Petron Clinic. The Petron Clinics in Rosario, Pandacan and Limay are intended to complement government health centers with specialized medical services, such as x-ray, ultrasound, ECG and other laboratory services. The Covid-19 pandemic has however kept these clinics closed to the community as part of health protocols. The Company though has accommodated the request of the Rosario, Cavite local government unit for the temporary use of a room at the Petron Rosario Clinic to perform elective surgery one day each weekend, as the few government health facilities in the municipality have prioritized their available beds for Covid-related cases.
• Responding to Crises. The Company continued to assist the workforce and stakeholders during the pandemic. Throughout 2021, the Company funded the RT-PCR tests of Petron employees and third party personnel nationwide. The Company also joined SMC’s Ligtas Lahat Core Team handling the coordination with external partners for the vaccination of Petron employees, with Petron acting as the lead for the SMC Bataan Vaccination Site. By end-2021, more than 5,000 SMC Group employees, third party service personnel, endorsed individuals, and Limay residents were vaccinated.
The Company, through San Miguel Foundation, provided food packs to a total of 3,700 families from the Petron fence-line communities in Mandaue and Mactan affected by the Supertyphoon Odette in December 2021.
• Engaging employees and partners. Petron employees continued actively participate in the Volunteers In Action Program through their support to those affected by the Supertyphoon Odette and the Covid-19 pandemic. Also, through the generosity of Petron employees in Manila, Malaysia and Singapore, Petron was able to distribute tablet computers to more than 280 Tulong Aral scholars.
• Adopt-a-School Program. Petron continued to invest its resources in support of education. DepEd continues to recognize Petron as one of its longest and strongest supporters of this public-private partnership arrangement.
Petron Malaysia The Petron Malaysia Companies have completed the upgrading of the product terminals to comply with the B10 biodiesel and Euro E4M gasoline requirements in line with the Malaysian government’s thrust of providing cleaner and more environment-friendly fuels to consumers. As part of the Petron brand enhancement program, three (3) card programs, Petron Miles loyalty card, Petron Fleet Card with microchip technology (post-paid and pre-paid), and co-branded Petron Public Bank Visa Card program are in place.
(2) Business of Petron (i) Principal products or services and their markets Petron’s principal business involves the refining of crude oil and the marketing and distribution of refined petroleum products. It sells a full range of refined petroleum products including gasoline, naphtha, LPG, diesel, jet fuel, kerosene, and petrochemicals (benzene, toluene, mixed xylene, propylene and polypropylene). When necessary, some refined petroleum products are imported. The major markets in the petroleum industry are the reseller (service station), industrial, LPG and lube trades. Petron sells its products through a nationwide network of service stations, LPG dealerships and lube outlets and to industrial end-users and bulk off-takers.
9
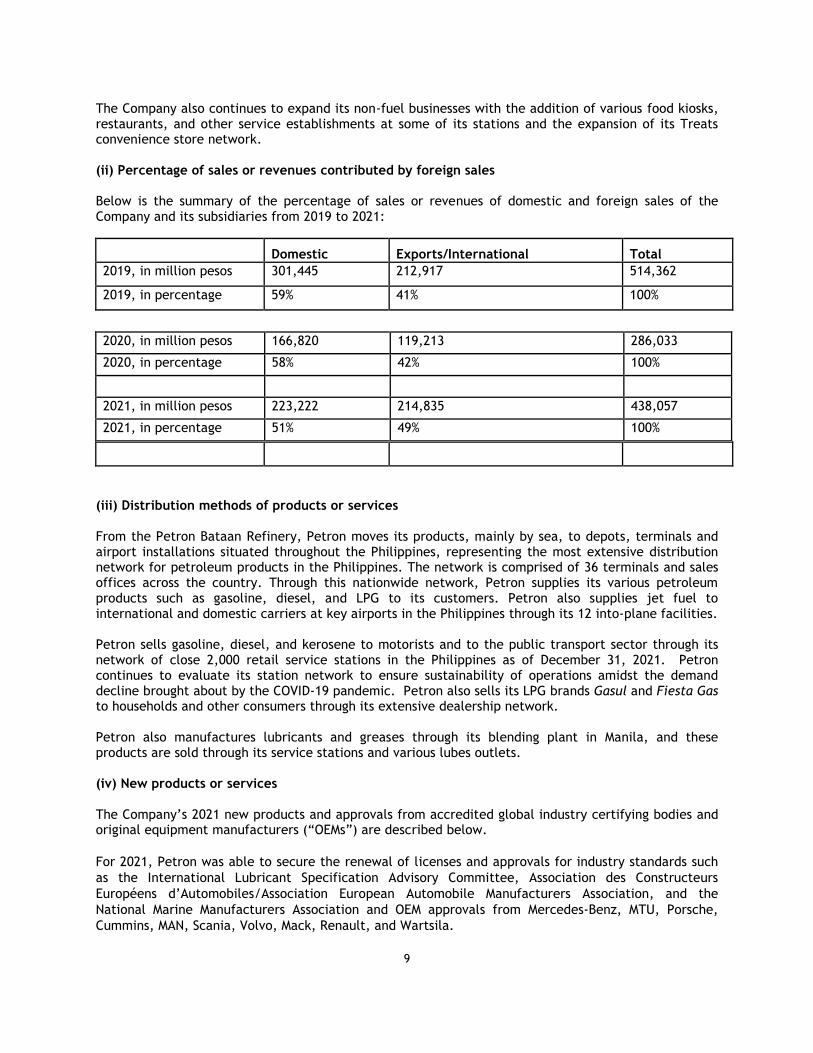
The Company also continues to expand its non-fuel businesses with the addition of various food kiosks, restaurants, and other service establishments at some of its stations and the expansion of its Treats convenience store network. (ii) Percentage of sales or revenues contributed by foreign sales Below is the summary of the percentage of sales or revenues of domestic and foreign sales of the Company and its subsidiaries from 2019 to 2021:
Domestic Exports/International Total
2019, in million pesos 301,445 212,917 514,362
2019, in percentage 59% 41% 100%
(iii) Distribution methods of products or services From the Petron Bataan Refinery, Petron moves its products, mainly by sea, to depots, terminals and airport installations situated throughout the Philippines, representing the most extensive distribution network for petroleum products in the Philippines. The network is comprised of 36 terminals and sales offices across the country. Through this nationwide network, Petron supplies its various petroleum products such as gasoline, diesel, and LPG to its customers. Petron also supplies jet fuel to international and domestic carriers at key airports in the Philippines through its 12 into-plane facilities.
Petron sells gasoline, diesel, and kerosene to motorists and to the public transport sector through its network of close 2,000 retail service stations in the Philippines as of December 31, 2021. Petron continues to evaluate its station network to ensure sustainability of operations amidst the demand decline brought about by the COVID-19 pandemic. Petron also sells its LPG brands Gasul and Fiesta Gas to households and other consumers through its extensive dealership network. Petron also manufactures lubricants and greases through its blending plant in Manila, and these products are sold through its service stations and various lubes outlets. (iv) New products or services The Company’s 2021 new products and approvals from accredited global industry certifying bodies and original equipment manufacturers (“OEMs”) are described below.
For 2021, Petron was able to secure the renewal of licenses and approvals for industry standards such
as the International Lubricant Specification Advisory Committee, Association des Constructeurs
Européens d’Automobiles/Association European Automobile Manufacturers Association, and the
National Marine Manufacturers Association and OEM approvals from Mercedes-Benz, MTU, Porsche,
Cummins, MAN, Scania, Volvo, Mack, Renault, and Wartsila.
2020, in million pesos 166,820 119,213 286,033
2020, in percentage 58% 42% 100%
2021, in million pesos 223,222 214,835 438,057
2021, in percentage 51% 49% 100%
10
Petron obtained certifications and approvals from globally accepted licensing organizations and OEMS,
which are also applicable to the Malaysian, Chinese, Brunei, Vietnamese and Cambodian markets.
• Registration with Association des Constructeurs Européens d’Automobiles/Association European
Automobile Manufacturers Association (“ACEA”)
In 2021, Petron renewed the registration for its Blaze Racing, Rev-X and Ultron automotive
lubricants with ACEA in compliance with the European Engine Lubricant Quality Management
System.
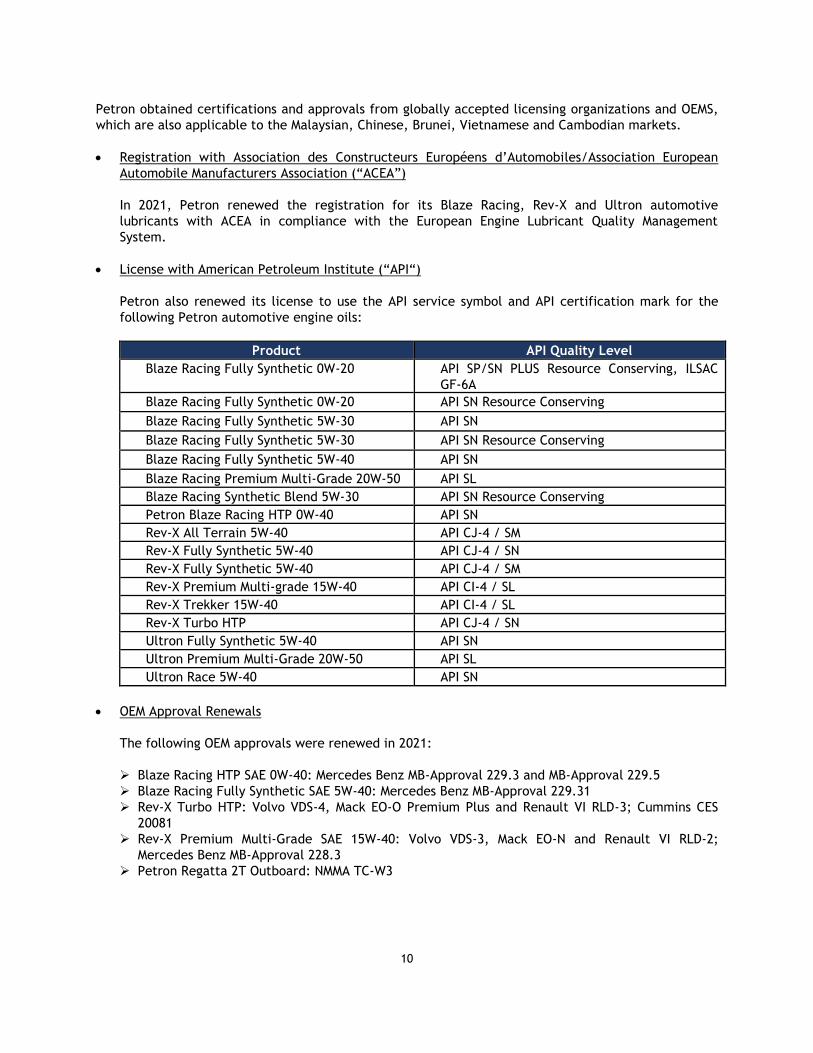
• License with American Petroleum Institute (“API“)
Petron also renewed its license to use the API service symbol and API certification mark for the
following Petron automotive engine oils:
Product API Quality Level
Blaze Racing Fully Synthetic 0W-20 API SP/SN PLUS Resource Conserving, ILSAC
GF-6A
Blaze Racing Fully Synthetic 0W-20 API SN Resource Conserving
Blaze Racing Fully Synthetic 5W-30 API SN
Blaze Racing Fully Synthetic 5W-30 API SN Resource Conserving
Blaze Racing Fully Synthetic 5W-40 API SN
Blaze Racing Premium Multi-Grade 20W-50 API SL
Blaze Racing Synthetic Blend 5W-30 API SN Resource Conserving
Petron Blaze Racing HTP 0W-40 API SN
Rev-X All Terrain 5W-40 API CJ-4 / SM
Rev-X Fully Synthetic 5W-40 API CJ-4 / SN
Rev-X Fully Synthetic 5W-40 API CJ-4 / SM
Rev-X Premium Multi-grade 15W-40 API CI-4 / SL
Rev-X Trekker 15W-40 API CI-4 / SL
Rev-X Turbo HTP API CJ-4 / SN
Ultron Fully Synthetic 5W-40 API SN
Ultron Premium Multi-Grade 20W-50 API SL
Ultron Race 5W-40 API SN
• OEM Approval Renewals
The following OEM approvals were renewed in 2021:
Blaze Racing HTP SAE 0W-40: Mercedes Benz MB-Approval 229.3 and MB-Approval 229.5
Blaze Racing Fully Synthetic SAE 5W-40: Mercedes Benz MB-Approval 229.31
Rev-X Turbo HTP: Volvo VDS-4, Mack EO-O Premium Plus and Renault VI RLD-3; Cummins CES
20081
Rev-X Premium Multi-Grade SAE 15W-40: Volvo VDS-3, Mack EO-N and Renault VI RLD-2;
Mercedes Benz MB-Approval 228.3
Petron Regatta 2T Outboard: NMMA TC-W3
11
(v) Competition Petron operates in a deregulated oil industry along with more than 300 other industry players. With several players sharing in the market, competition is intense. Retail and depot network expansion, pricing, and various marketing programs are being employed to gain a bigger share of the domestic market. However, Petron’s wider retail and depot network allows it to expand its reach in the domestic market more effectively. Moreover, with its upgraded refinery, Petron now produces more fuels, namely, gasoline, diesel and jet fuel.
(vi) Sources and availability of raw materials and the names of principal suppliers In 2021, Petron purchased all its term and spot crude requirements through its wholly-owned subsidiary, PSTPL. Majority of the crude purchases were sourced under a term contract with a supplier and various spot suppliers for the balance of the crude slate. For its 2022 crude requirements, Petron, through PSTPL, will continue to source from both term and spot suppliers. Petron purchased its finished product import requirements in 2021 also through PSTPL. For 2022, aviation gasoline, asphalt, LPG, high RON gasoline and base oil contracts were renewed for the period January to December 2022 through PSTPL. For its requirements for ethanol, Petron continued to support the directive of the DOE on prioritization of locally produced ethanol, complying with the required monthly allocation. About 67.5% of the total ethanol requirement of the Company in 2021 was sourced from various local ethanol producers. (vii) Dependence on one or a few major customers and identity of any such major customers Petron and its subsidiaries do not have a single external customer from which sales revenue generated amounted to 20% or more of the total revenue. (viii) Transactions with and/or dependence on related parties Petron, and certain of its subsidiaries and its affiliate, as well as SMC and its subsidiaries, purchase products and services from one another in the normal course of business. On August 6, 2019, the Board of Directors of the Company approved the Policy on Related Party Transactions of the Company that requires that all related party transactions of the Company be conducted on an arm’s length basis and under fair terms in order that no shareholder or stakeholder will be unduly disadvantaged and there will be no prejudice to the interest of the stakeholders of the
Company. Under the terms of this policy, board approval is required for related party transactions with
the same related party, either individually or in aggregate over a 12-month period from the first transaction, amounting to at least 10% of the Company’s total consolidated assets based on its latest audited financial statements. On January 11, 2021, upon the recommendation of the Related Party Transaction Committee of the Board of Directors and pursuant to the Policy on Related Party Transactions of the Company, the Board Executive Committee approved the proposed transactions for 2021 between the Company and PSTPL and the Board of Directors ratified such action of the Executive Committee at the board meeting held on February 16, 2021. On November 9, 2021, also upon the recommendation of the Related Party Transaction Committee of the Board of Directors and pursuant to the Policy on Related Party Transactions of the Company, the Board of Directors approved the proposed transactions for 2022 between the Company and PSTPL.
12
The transactions of Petron with related parties in 2021 include the following:
1. Supply agreements with various SMC subsidiaries. Under these agreements, Petron supplies the fuel and lube requirements of selected SMC plants and subsidiaries.
2. Purchase of goods and services, such as those related to construction, information technology, shipping and terminaling, from various SMC subsidiaries.
3. Lease agreements with San Miguel Properties, Inc. for office space covering 6,683 square meters and certain parcels of lands where service stations are located.
4. Lease agreements with SMC covering certain parcels of lands where service stations are located.
5. Payment to SMC for its share in common expenses such as utilities and management fees.
6. Long-term lease agreements with NVRC covering certain parcels of lands where the Petron Bataan Refinery and some of its depots, terminals and service stations are located.
7. Retail of its fuel products through its subsidiary PFC as well as lubes through PFISB. 8. Insurance coverage from Petrogen which, in turn, obtains reinsurance coverage from Ovincor
and other local reinsurers. 9. Certain advances to PCERP for investment opportunities.
10. Trading agreement with PSTPL for the procurement of crude oil, and trading of finished
petroleum products and other materials such as ethanol, coal, catalysts and additives. 11. Engagement of PSTPL to perform the chartering function such as the renewal and negotiation
of contract of affreightments and commodity risk management via hedging transactions. 12. General management services to PFISB.
13. NVRC and SMC subsidiaries entered into various lease agreements for portion of lands located
at Limay, Bataan.
14. Logistics and freight forwarding agreement with PLI.
15. Purchase from San Miguel Foods, Inc. and Foodcrave Marketing, Inc. of the Treats convenience store business in February 2021.
13
(ix) Patents, trademarks, licenses, franchises, concessions, royalty agreements The Company’s intellectual property registrations and applications as of December 31, 2021 are described below.
Trademark. Petron has registered the following trademarks for a term of 10 years: Petron (word mark), Petron (logo), P logo (color), P logo (black and white), Petron Canopy Fascia, Petron Canopy Fascia (color), Petron Canopy Fascia (black and white), Blaze, Diesel Max, Petron Blaze 100, Blaze 100 Octane Euro 6, Petron XCS3, Xpert Diesel Oils, Petron Super Xtra Gasoline, Xtra Advance (inside a rectangle device), Tri-Action, Blaze Racing, Tri Plus, Petron XCS3 Triple Action Premium Unleaded, Thermal Control System, Tri-Action Advantage, Petron XCS3, Triangle Device, Boomerang Device, Gasul, Gasul (stylized), Gasulette, Gasulite, Gasulgrille, Gasulite, Gasulgrille, LPG Gasul Cylinder 50 kg, Gasul and Device, LPG Gasul Cylinder 11 kg, Petron Gasul 11-kg POL-VALVED Cylinder, Gasulito (word
mark), New Gasulito (word mark), Petron Gasul Elite, Petron Gasul Elite, Petron Gasul Elite Blue Pantone 298, Fiesta Gas with device, Xtra, Fiesta Gas 2.7kg cylinder, Fiesta Gas 5kg cylinder, Fiesta Gas 5kg POL-VALVED, Fiesta Gas 11kg cylinder, Fiesta Gas 11kg POL-VALVED, Fiesta Gas 22kg POL-VALVED, Fiesta Gas 50kg POL-VALVED, REV-X, Rev-X Trekker, Rev-X Hauler, Rev-X HD, Rev-X Turbo, Rev-X Power, Ultron Rallye, Ultron Extra, Ultron Race, Ultron Touring, Sprint 4T, Clean ‘n Shine, Rider, Racer Maximum Performance, Rider 4T, ADVANSTRASSE MOTO (word mark), ADVANSTRASSE MOTO (logo), 3D Engine Oil Lubricant Bottle 1L and 6L (black), 3D Engine Oil Lubricant Bottle 1L and 6L (red), 3D Engine Oil Lubricant Bottle 1L and 6L (silver), 3D Engine Oil Lubricant Bottle 1L and 6L (blue), 3D Specialty Lubricant Bottle 1L (silver), 3D Specialty Lubricant Bottle 1L (black), Petron Value Card and Device, Petron Super Driver, Petron Fleet Card & device, e-fuel, Miles Better (word mark), Pshop, Car Care Center & Logo, Treats (word mark), Treats & device, Treats & device with blue background, Petron Laser Wash, Petron Car Wash, Lakbay Alalay (word mark), Lakbay Alalay (logo), Lakbay Alalay,
Lakbay Ligtas, Lakbay Alalay Para sa Kalikasan, Sagip Alalay, Tulong Aral ng Petron & Device, Puno ng Buhay, Fuel Hope, Fuel Trust, Fuel Experience, Fuel Drive, Fuel Excellence, Fuel Efficiency, Everyone’s Vision & device, I fuel (logo), I Fuel Hope, I Fuel Communities, Petron Blaze Spikers, Petron Lakbay Pinoy, Petron! Get Rewards & Benefits, Ultimate Release from Engine Stress, Your friend on the Road, Super Tsuper, Road Safety & device, Miles, Extra with a car device against a red background, Gift and App Device, Footprints Inside a Sphere & Device, Petron Ronnie Mascot in Seatbelt & device, Ronnie Mascot, Seat Belts Save Lives, Pay with Points Save your Cash, Thermal Stress Stabilizing System, Dynamic Cleaning Technology, Your Fleet Your Rules, Blu & Device, Blu with Gasul Tank, Gas Padala, Performance Run, Petron Best Day, Super Saya, Resibo Blowout, Power that Persists, Mean Clean Machine, Petron Motorsports, Fuel Wise (long form), Fuel Wise (flag type), Fuel Wise (long form in black), Fuel Wise (flag type in black), Fuel Wise, Fuel Wisely, Choose Quality Fuel Wisely, Fuel Wisely with Petron (word mark), Be Sure to Fuel Wisely (word mark), Kalakbay (word mark), Kasabay sa
Lakbay (word mark), Kasabay sa Paglakbay (word mark), Kasabay sa Paglalakbay (word mark), #Beastmode, Kalmakina (colored), Kalmakina (word mark), Kalmakina (black and white), Hypex, 2T, Turnol, Petrogrease EP-2, Gearfluid, Petron STM, Petron Autokote, GEP, Petrokote, Marinekote, Petron 2040, Penetrating Oil, Solvent 3040, Pchem, Xtend, HTP, Petrolene, PCHEM DEF (Diesel Exhaust Fluid), Petromate, TCS and Device, TDH50 (word mark), Econo, Elite, Pantra, Petron Pinoy Fuels & Device, Petron Pinoy Diesel & Device, Petron Pinoy Regular & Device, Go, Maxi Gas, Xtra Exceed, Xtra Ultra, Xtra Prime, Xtra Miles, Pinoy HP Gasoline, Xtra Excel, UnliPower Saver Gasoline, Ultramax Gasoline, Ecomax Gasoline, PMax Gasoline, Carbon Buster, Petron PMB, Reyna (logo), and Reyna (word mark). Spinol, Petrokut, Petron Railroad Extra, Rubbex, Dust Stop Oil, Oil Saver, Milrol, Petron GST, Petron with XCS, With XCS, Super DC, Petromul CSS-1, Power Booster, Automatic Transmission Fluid, Petrotherm, Petrosine, Petron HDX, Petron TF, Ropgriz, Ultron and Device, 2T Motorcycle Oil, Molygrease and Petron GX are registered for a term of 20 years.
14
Pending Trademark Applications. Petron has pending applications for registration of the following trademarks: Miles Better, Turbo Diesel, Turbo Diesel (logo), Vision Petron, Automotive Fuels Specialist, 3D Gasul 2.7kg, 3D Fiesta 2.7kg, 3D Gasul 2.7kg (colored), 3D Fiesta 2.7kg (colored), 3D Petron Engine Oil Jerry Can Bottle 1L and 800ml (black), 3D Petron Engine Oil Jerry Can Bottle 1L and 800ml (dark grey), 3D Petron Engine Oil Jerry Can Bottle 1L and 800ml (blue), 3D Petron Engine Oil Jerry Can Bottle 1L and 800ml (red), 3D Petron Engine Oil Jerry Can Bottle 1L and 800ml (silver), AUTO ADVANSTRASSE, AUTO ADVANSTRASSE logo, REV-X HD4X, REV-X HD, Sprint 4T (logo), ELITE (logo), Fe Dela Fiesta (logo), Vision Petron (logo), 2T (logo), EXPRESS (logo), CCC Automotive Fluids Specialist, New Petron Logo, Puno ng Buhay, and Petron PMB. Petron also has registered and pending trademarks in Malaysia, Indonesia, Cambodia, Thailand, Myanmar, Australia, China, United Kingdom, India, Japan, Republic of Korea, Singapore, Hong Kong, China and Saudi Arabia. The Company has filed trademark applications in Malaysia relating to its Malaysian operations. It has obtained copyright protection for the stylized letter “P” and has registered trademarks in Malaysia, including but not limited to the Petron, Petron Logo, Gas Miles, Gasul, Fiesta Gas, Energen, Petron Plus, Perks, Miles, Propel, XCS, Petromate, Hydrotur, Miles with P-Logo, MILES with P Logo and ‘Privilege Miles Card’ words, Petroil, Fuel Journeys, Better by Miles, Petron Cares, DCL 100, Petromar, Energy, Treats with Crocodile Logo, and Petron Greenfuel, Kedai Mart with P logo, Rider, Rider 4T, Petrolaysia, Prime, Petron with Canopy Fascia logo, Petron Racing, Sprint 4T, Rev-X Diesel Engine Oils, Prestige, Xtra Mile, Xtra Unleaded, Treats and Device, Petron Value Card Rewards & Benefits, Turbo Diesel, Diesel Maz, Blaze Gasoline, Petron XCS3, Powerburn 2T & Device, Racing, Powerburn, Petrogrease, Greaseway, GEP, Gearfluid, Clean ‘n Shine, ATF, Treats & Device, Powered by Petron, Miles with P Logo & Petrol Word, Petromar HD, Petrogrease EP, Blaze with P Logo and Petrol, Fuel Trust, Fuel Success, Fuel Hope, Blaze Racing, Fuel Care, Treats, Petron Motorsports, Fuel Life, Fueled by Petron, Miles Better, Your Fleet Your Rules, 5th year Anniversary Fuel Happy, and Petron Car Care Center. Copyright. Petron has copyrights for its seven (7)-kg LPG container, Gasulito with stylized letter “P” and two (2) flames, Powerburn 2T, Petron New Logo (22 styles), Philippine Card Designs and Malaysian Card Designs, and Petron font. Copyrights are protected during the lifetime of the creator and for 50 years after the creator’s death. Pending Industrial Design Applications. Petron has pending applications for registration of the following industrial designs: Petron Specialty Lubricant Bottle (1Liter container), Petron Engine Oil Bottles (1L and 800ML Jerry can bottle container), Petron Engine Oil Bottles (4L and 6L container), Petron Fiesta 2.7kg LPG Cylinder, and Petron Gasul 2.7kg LPG cylinder. (x) Government Approval of Principal Products or Services Government approval of Petron products and services is not generally required. Petroleum products, both locally refined and imported, however, must conform to specifications under the Philippine National Standards. Importations of petroleum products and additives are reported to the DOE, in accordance with the Downstream Oil Industry Deregulation Act of 1998 and its implementing rules and regulations. Clearances are secured from concerned government authorities for importations of restricted goods. The supply of products or services to government and government agencies undergo a bidding process in accordance with law. (xi) Effect of existing or probable government regulations on the business
• Corporate Recovery and Tax Incentives for Enterprise Act (“CREATE Act”). Republic Act No. 11534 or the CREATE Act was signed into law by the President of the Philippines on March 26, 2021 and is expected to take effect on April 12, 2021. The CREATE Act lowers corporate income taxes and rationalizes fiscal incentives.
15
The corporate income tax rate for domestic corporations and resident foreign corporations has been reduced to 25% effective July 1, 2021 and on January 1, 2021 for non-resident foreign corporations. Domestic corporations and resident foreign corporations no longer have an option to be taxed at 15% on gross income and the rate of the minimum corporate income tax shall be lowered to 1%. Under the CREATE Act, persons that directly import petroleum products for resale in the Philippine customs territory and/or in free zones will be subject to applicable duties and taxes. However, importers can file for the refund of duties and taxes for direct or indirect export of petroleum products, including the subsequent export of fuel, subject to the appropriate rules of the fuel marking program, and/or other tax-exempt sales by the importer. The CREATE Act also provides for the rationalization of tax incentives that may be granted by investment promotion agencies (such as the AFAB) to qualified registered business enterprises. As part of the rationalization of tax incentives, the CREATE Act provides that (i) any law to the contrary notwithstanding, the importation of petroleum products by any person will be subject to the payment of applicable duties and taxes under the Customs Modernization and Tariff Act and the National Internal Revenue Code, respectively, upon importation into the Philippine customs territory and/or into free zones (as defined in the Customs Modernization and Tariff Act), subject to the right of the importer to file claims for refund of duties and taxes under applicable law; and (ii) the importation of crude oil that is intended to be refined at a local refinery, including the volumes that are lost and not converted to petroleum products when the crude oil actually undergoes the refining process, will be exempt from payment of applicable duties and taxes, provided the applicable duties and taxes on the refined petroleum products shall be paid upon the lifting of the petroleum products produced from the imported crude oil in accordance with the rules and regulations that may be prescribed by the Bureau of Customs and the Bureau of Internal Revenue.
Under the CREATE Act, the Company shall be entitled to, among others: (i) a lower corporate income tax and (ii) the tax exemption for the importation of crude oil to be refined at a local petroleum refinery.
Under the tax regime prior to the effectivity of the CREATE Act, domestic refiners are disadvantaged because they are made to pay VAT upon importation of crude oil which they cannot recover until the finished products refined from them are sold. Compared to non-refiners, which pay VAT upon importation of finished products, domestic refiners are unable to recover the VAT for a longer period. The Company believes that the CREATE Act allows it to be more competitive as domestic petroleum refineries are now taxed on finished products, similar to importers of refined fuel which only pay after sales tax.
• LPG Industry Regulation Act. Republic Act No. 11592 or the “LPG Industry Regulation Act”, enacted into law on October 14, 2021, aims to ensure health, safety, security, environmental and quality standards in the LPG industry by instituting reforms in the existing standards and practices. The law defines prohibited acts such as engaging in LPG industry activities without the required licenses, certificates, and permits; selling, fabricating, or refilling unfilled LPG cylinders without the approval of the trademark owner; selling, exchanging, possessing empty LPG cylinders that belong to another trademark owner; and non-compliance with standards such as those relating to safety, materials, and markings. It also provides for the establishment of an LPG Cylinder Exchange and Swapping Program for the exchange, swapping or buy back of LPG cylinders among industry participants and the establishment of accredited swapping centers. The implementing rules and regulations of the law are expected to be finalized in 2022.
16
• Tax Reform for Acceleration and Inclusion (the “TRAIN Law”). Republic Act No. 10963 or the TRAIN Law, which took effect on January 1, 2018, imposed a phased increase in excise taxes on petroleum products from 2018 to 2020. The schedule of increase for this three (3)-year period was P2.65-P2-P1 per liter (“/li”) per year for gasoline, P2.50-P2-P1.50/li for diesel and fuel oil, P1-P1-P1/kg for LPG, and P0.33-P0-P0/li for jet fuel. The incremental excise tax is further subject to 12% VAT. Higher excise taxes can potentially constrain demand growth, especially for LPG given there are substitutes such as charcoal, kerosene and electric, and gasoline with public transportation as alternative.
The TRAIN law also mandates the implementation of a fuel marking program for diesel, gasoline and kerosene to help curb illicit trading of fuel products. While the cost for the fuel marker would be shouldered by the government in the initial year of implementation, this cost was eventually passed on to oil companies beginning 2020 which resulted in higher fuel prices.
• Biofuels Act of 2006 (the “Biofuels Act”). The Biofuels Act and its implementing circulars mandate that gasoline and diesel volumes contain 10% bioethanol and 2% biodiesel/cocomethyl ester (“CME”) components, respectively. To produce compliant fuels, the Company invested in CME injection systems at the Petron Bataan Refinery and the depots. On the bioethanol component, the DOE issued in June 2015 its Circular No. 2015-06-0005 entitled “Amending Department Circular No. 2011-02-0001 entitled Mandatory Use of Biofuel Blend” which currently exempts premium plus gasoline from the 10% blending requirement.
• Renewable Energy Act of 2008 (the “Renewable Energy Act”). The Renewable Energy Act aims to promote development and commercialization of renewable and environment-friendly energy resources (e.g., biomass, solar, wind, hydro, geothermal) through various tax incentives such as seven (7)-year income tax holiday and duty-free importation of renewable energy equipment and machinery. The sale of power generated from these sources is also exempt from value-added tax under the TRAIN Law. The growth in renewable energy may displace or reduce use of oil-based power plants affecting the Company’s sales to the power sector.
• Clean Air Act of 1999 (the “Clean Air Act”). The Clean Air Act established air quality guidelines and emission standards for stationary and mobile equipment. It also included the required specifications for gasoline, diesel and IFO to allow attainment of emission standards. Petron invested in a gasoil hydrotreater plant and an isomerization plant to enable it to produce diesel and gasoline compliant with the standards set by law.
• Laws on Controlled Chemicals (Presidential Decree No. 1866 as amended by Republic Act No. 9516). The implementing rules and regulations for this amended law were approved on June 9, 2016 and listed the chemicals under the control of the Philippine National Police. These rules reduced the controlled list from 101 to 32 chemicals and further classified 15 chemicals as high-risk and 17 as low-risk substances. The rules also outline the procedures for regulating, storing, handling and transporting chemicals.
• Compliance with Euro 4 standards. In September 2010, the DENR issued Administrative Order 2010-23 mandating that, by 2016, all new motor vehicles that would be introduced in the market shall comply with Euro 4 emission limits, subject to Euro 4 fuel availability. In June 2015, the DOE issued Circular 2015 - 06-0004 entitled “Implementing the Corresponding Philippine National Standard Specifications (PNS) for the Euro 4/IV PH Fuels Complying with the Euro 4/IV Emissions” directing all oil companies to adopt Euro4-compliant fuels. With its RMP-2, Petron is now producing Euro 4-compliant fuels ahead of the 2016 mandate.
17
• Department Circular 2014-01-0001. The DOE issued Department Circular 2014-01-0001 directed at ensuring safe and lawful practices by all LPG industry participants as evidenced by standards compliance certificates. The circular also mandates that all persons engaged or intending to engage as a refiller of LPG shall likewise strictly comply with the minimum standards requirements set by the DTI and the DOE. The circular imposes penalties for, among others, underfilling, illegal refilling and adulteration.
• Laws on Oil Pollution. To address issues on marine pollution and oil spillage, the Maritime Industry Authority (“MARINA”) mandated the use of double-hull vessels for transporting black products beginning end-2008 and white products by 2011. Petron has been using double-hull vessels in transporting all its products.
• Oil Marine Pollution Circulars. The Philippine Coast Guard has memorandum circulars prescribing the rules and regulations on the prevention, containment, abatement and control of oil marine pollution by all marine vessels, coastal and offshore facilities and other facilities utilizing or storing petroleum products. The circulars identify the prohibited acts and provide the penalties.
• Anti-Competition Law (the “Philippine Competition Act”). The Philippine Competition Act, approved in July 2015, prohibits anti-competitive agreements, abuses of dominant positions, and mergers and acquisitions that limit, prevent, and restrict competition. To implement the national competition policy and attain the objectives and purposes of the law, the Philippine Competition Commission (“PCC”) was created. Among the powers of the PCC is the review of mergers and acquisitions based on factors it may deem relevant. The PCC, after due notice and hearing, may impose administrative fines on any entity found to have violated the provisions of the law on prohibited arrangements or to have failed to provide prior notification to the PCC of certain mergers and acquisitions. The PCC is empowered to impose criminal penalties on an entity that enters into any anti-competitive agreement and, when the entities involved are juridical persons, on its officers, directors, or employees holding managerial positions who are knowingly and willfully responsible for such violation. Currently pending with the House of Representatives are two bills to amend the Philippine Competition Act to, among others, legislate competition policy, amend requirements for PCC notification, and strengthen the powers of the PCC.
• Amended Price Freeze Act of 2013. This law mandates the implementation of a 15-day price freeze of basic necessities, including LPG and kerosene, for areas declared under a state of emergency or calamity.
Executive Order 890: Removing Import Duties on All Crude and Refined Petroleum Products.
After the ASEAN Trade in Goods Agreement was implemented in 2010, the tariff rate structure in the oil industry was distorted with crude and product imports from ASEAN countries enjoying zero tariff while crude and product imports from outside the ASEAN were levied 3% tariff. To level the playing field, Petron filed a petition with the Tariff Commission to apply the same tariff duty on crude and petroleum product imports, regardless of source. In June 2010, the government approved Petron’s petition and issued Executive Order 890 which eliminated import duties on all crude and petroleum products regardless of source. The reduction of duties took effect on July 4, 2010.
• Department Circular 2019-05-008. This DOE circular requires oil companies to submit a detailed computation, with corresponding explanation and supporting documents, of the cost components of liquid fuel and LPG on a per liter and per product basis. The circular has not been implemented following the temporary restraining orders and writs of preliminary injunction issued by the Regional Trial Courts of Taguig and Mandaluyong.
18
• Department Circular 2021-06-0014. The DOE issued the “Revised Circular for the Accreditation and Submission of Notices and Reports of the Philippine Downstream Oil Industry Pursuant to the Biofuels Act” on July 2, 2021 requiring oil companies to submit notices, accreditation and reportorial requirements using revised templates in relation to the utilization of biofuels. The new circular provides for more stringent penalties and additional monthly and quarterly reports for DOE to monitor compliance with regard to the utilization of biofuels, including compliance to local monthly allocation for ethanol.
• Department Circular 2021-09-0029. The “Revised Guidelines on Notices and Reportorial Requirements Pursuant to the Oil Deregulation Law”, published on November 5, 2021, requires the submission of monthly and annual reports using revised templates for DOE to monitor importation and/or production of oil companies (and for Petron as a refiner) and includes additional reportorial requirements for lubes and blending plants, with more stringent penalties for non-compliance.
• Department Circular 2021-07-0023. The DOE issued this circular on July 2, 2021 providing for a framework for the adoption and development of electric vehicles (“EVs”) and electric charging stations (“EVCs”) in the Philippines, including installation of EVCs in retail stations. While there is no current law on EVs and EVCs, a bill on these has already passed the Bicameral Conference Committee in Congress and is for the signature of the President of the Philippines.
• House Bill No. 10483. In light of rising fuel prices, House Bill No. 10483 was filed with the House Committee Ways and Means on November 3, 2021 seeking to amend the TRAIN Law by reducing excise taxes for diesel, gasoline, kerosene and LPG for the period December 2021 to June 2022. The bill is pending in Congress.
(xii) Estimate of the amount spent during each of the last three fiscal years on
research and development activities The Company’s Research and Development (“R&D”) is responsible for all product development that complies with government laws and regulations such as the Clean Air Act and the Biofuels Act. Other drivers of product innovations are the requirements of original engine manufacturers and the latest technological trends in the industry. Petron R&D spent a total of P61.71 million in 2021, lower than the P65.55 million in 2020. Expenses in 2019 totaled the P76.31 million. (xiii) Costs and effects of compliance with environmental laws Compliance with the various environmental laws like the Renewable Energy Act, the Biofuels Act, the Clean Air Act, and the Clean Water Act entails costs and additional investments on the part of the Company, resulting in higher production costs and operating expenses. In 2021, the Company spent a total of P39.52 million for treatment of wastes, monitoring and compliance, permits, and personnel training at the Petron Bataan Refinery while in 2020, it spent a total of P28.42 million. (xiv) Total number of employees As of December 31, 2021, the Company and its subsidiaries had 2,665 employees, with 2,033 employees in the Company (comprising one president, one general manager, 28 vice presidents and assistant vice presidents, 1,424 managerial, professional and technical employees, and 579 rank-and-file employees); 600 employees of the Company’s Malaysian operations; 19 in PSTPL; and 13 in PFC.
19
Petron has CBAs with its three (3) labor unions, namely: (i) Bataan Refiners Union of the Philippines (“BRUP”), which is affiliated with the Philippine Transport and General Workers Organization; (ii) Petron Employees Labor Union (“PELU”), affiliated with the Philippine Transport and General Workers Organization, and (iii) Petron Employees Association (“PEA”), which is affiliated with the National Association of Trade Unions. The CBAs with BRUP and PELU were for the period from January 1, 2019 to December 31, 2021. PEA’s CBA covers the period from January 1, 2020 to December 31, 2022. In the meantime that negotiations and the finalization of the renewal of the CBAs with BRUP and PELU are ongoing, the expiring CBAs remain effective pursuant to their respective terms that provide for a carry-over of the CBA provisions until their renewals have been signed by the parties. In addition to the statutory benefits, the Company provides medical and life insurance, vacation, sick and emergency leaves, computer and emergency loans to employees, and a savings plan program.
(xv) Major Risks Involved
(i) Risk Management Framework and Process
Petron follows an enterprise-wide risk management framework for identifying, mapping and addressing the risk factors that affect or may affect its businesses. The Company’s risk management process is a bottom-up approach, with each division mandated to conduct regular assessment of its risk profile and formulate action plans for managing identified risks. As Petron’s operation is an integrated value chain, risks emanate from every process and some can cut across divisions. The results of these activities flow up to the Management Committee and eventually the Board through the Company’s annual Business Planning process. Oversight and technical assistance is likewise provided by corporate units with special duties. The International Trade Finance Section of the Treasurers Department is in charge of foreign exchange hedging transactions. The Transaction Management Unit of the Controllers Department provides backroom support for all financial transactions. The Corporate Technical Services Group oversees compliance with the domestic and international standards set for health, safety and environment. The Internal Audit Department is tasked with the implementation of a risk-based auditing. Commodity price risk is a major area being managed by the Commodity Risk Management Department (“CRMD”) of the Supply Division, under the guidance of the Commodity Risk Management Committee (“CRMC”) composed of cross-functional senior and middle management. The CRMC oversees the long-term and short-term commodity hedging program which includes risk assessment, authorized hedging instruments and hedging tenor. Hedging strategies are developed by the CRMD which also monitors commodity risks, sets controls, and ensures that risk management activities stay within the board-approved limits and parameters approved by CRMC. PSTPL executes the hedging strategies involving crude and product imports and exports on behalf of the Company.
(ii) Major Risks The Company classifies a risk as a major risk if it assesses the risk event to both have a relatively high probability of occurring and a substantial adverse impact on the Company if the risk would occur. The major risks that the Company managed in 2021 were substantially the same as those in the previous year since there were no fundamental changes in the nature of the Company’s operations. These risks were the following:
(a) Foreign exchange risk arises from the difference in the denomination of majority of revenues, which is in Philippine Pesos, against that for the bulk of costs; i.e. crude oil and petroleum products imports, which is in US Dollars. Further, for the Petron Malaysia Companies, whose transactions are in Malaysian Ringgit which is subsequently converted into US Dollar before
20
ultimately being translated to equivalent Philippine Peso amount using applicable rates for the purpose of consolidation, changes in the foreign exchange rates of the Malaysian Ringgit and the US Dollar would result in the revaluation of key assets and liabilities.
(b) The risk of substantial disruptions in the Company’s operations caused by accidents, process or machinery failure, human error, natural disasters, weather conditions, geopolitical events, and other unforeseen circumstances. These disruptions may result in injury or loss of life, delays in implementation of capital projects, slowdown or shutdown of refinery operations, product run-outs, interruptions in supply or product distribution, equipment repair or replacement, and other such outcomes.
(c) Profit margin and cash flow risk arising from volatility in the prices of crude oil, and fluctuations in the relative prices of crude oil and petroleum products.
(d) Regulatory risk, arising from changes in national and local government policies and regulations affecting product standards, tax policies, environmental, health and safety regulations, and licensing and permitting requirements, among others.
Except as covered by the above-mentioned specific risks, the Company has determined that none of the risk factors faced by any of its subsidiaries would be a major risk. These risk factors have a low probability of occurring and/or have an insignificant potential impact. Thus, while subsidiary-specific risks were considered in the risk management process, these are considered relatively minor. (iii) Management of Major Risks
(a) Foreign exchange risk
• The Company hedges its dollar-denominated liabilities using forwards, other derivative instruments and the generation of dollar-denominated sales. It avoids the creation of risk from derivative speculation by limiting the use of derivative instruments up to 100% of the value of the underlying dollar-denominated liabilities net of dollar-denominated assets.
• Dollar-denominated assets and liabilities and the resulting potential foreign exchange losses are recorded on a daily basis through an enterprise resource planning software that monitors financial transactions. This allows real-time awareness and response to contain losses posed by foreign exchange exposure. Such software is also capable of tracking risk exposures arising from other market sensitive financial variables, such as interest rates and commodity prices.
(b) Risk of operational disruptions
• The Company maintains insurance whose coverage includes property, marine cargo and third-party liability, as well as personal injury, accidental death and dismemberment, sabotage and terrorism, machinery breakdown and business interruption. One of the main insurance policies of the Company, the Industrial All Risk policy, covers the Petron Bataan Refinery for material damages and machinery breakdown.
• The Company continuously implements effective preventive maintenance programs, process improvements, health, safety and environmental programs and standards and technical trainings to ensure operational reliability and prevent operational disruptions. Additionally, Company facilities are compliant with internationally recognized management systems and facility standards.
21
• All 30 terminals are certified under the new ISO 9001:2015 (QMS), ISO 14001:2015 (EMS) standards and ISO 45001:2018 (Occupational Health and Safety (OH&S) Management System).
• All 15 Petron pier facilities are compliant with the International Ship and Port
Facility Security Code (“ISPS Code”) and certified by the Office of the Transport Security under the DOTC. The ISPS certification is a requirement by the International Maritime Organization for all international vessels calling on international ports and for all ports accepting international vessels.
• The Company implements a Loss Prevention System (“LPS”) to prevent or reduce losses using behavior-based tools and proven management techniques. With this system, the Company aims to improve the overall safety culture of the organization. From January to December 2021, a total of 10.6 million safe man hours were achieved by the Head Office, the Petron Bataan Refinery and the Terminals.
• The Company also has an inter-depot support system that ensures continued product supply to areas affected by natural disasters or other unforeseen circumstances. Sourcing from other nearby Petron terminals to serve tributary areas of an affected terminal is immediately implemented whenever necessary.
(c) Profit margin and cash flow risk
• Margin hedging strategies are used in order to mitigate the risk of profit margin compression due to changes in crude and product prices. A margin hedge simultaneously fixes the future dollar prices of Dubai crude oil and that of a selected product manufactured from the crude oil. This partially locks in the refining margin of the Company.
• The risk of losses in inventory value as a result of significant volatility in the prices of crude and products is managed through commodity hedging.
• The Company endeavors to arrange long-term contracts for some of its fuel and petrochemical products whenever these are financially attractive. Long-term sales contracts provide a partial hedge on future cash flow uncertainty.
• The Company uses cash flow projection software that enables it to proactively respond to potential future cash flow imbalances. It likewise maintains access to credit lines in excess of typical requirements so that funds can be readily tapped in case of a cash flow squeeze.
(d) Regulatory risk
• The Company monitors developments in government policies and regulations, and maintains strong lines of communication with its counterparties in the public arena at local and national levels. This enables the Company to anticipate potential risk factors and plan proactively for any necessary expenditure.
• The Company remains materially compliant with the various environmental standards set by the government.
22
)
(B) Description of Property
Petron operates an extensive network of terminals, depots, and LPG and aviation plants which are located in Luzon, Visayas and Mindanao. As of December 31, 2021, its bulk fuel terminals were in Limay, Bataan; Mabini, Batangas; Mandaue City, Cebu; Poro Point, San Fernando, La Union; Navotas, Metro Manila; Rosario, Cavite; Puerto Princesa, Palawan; Culasi, Roxas City; Lapuz, Iloilo City; Bacolod City, Negros Occidental; Ormoc City, Leyte; Anibong, Tacloban City; Isabel, Leyte; Tagoloan, Misamis Oriental; Sasa, Davao City; Iligan City, Lanao del Norte; Jimenez, Misamis Occidental; Bawing, General Santos City; Nasipit, Agusan del Norte; and Zamboanga City. It has third party facilities at Harbor Center, Tondo, Manila; Limay, Bataan; Subic, Zambales, and PHIVIDEC, Tagoloan, Misamis Oriental. Its sales offices are located in Calapan, Oriental Mindoro; San Jose in Occidental Mindoro; Odiongan, Romblon; Pasacao, Camarines Sur; Mobo, Masbate; Amlan, Negros Oriental; and Tagbilaran City, Bohol. Petron has LPG bulk refilling plants in Ugong, Pasig City; San Fernando, Pampanga; San Pablo City, Laguna; and Legazpi City, Albay. Among its other installations were the aviation depots at JOCASP-NAIA, Pasay City and Mactan, Cebu; airport installations at Laoag City, Davao City and Laguindingan, Misamis Oriental; an additive plant in Subic, Zambales, a grease plant in Pandacan Manila, and a lube oil blending plant in Harbor Center, Tondo, Manila. Petron owns the largest petroleum refinery complex in the Philippines located in Limay, Bataan, with a crude distillation capacity of 180,000 barrels per day. In addition to major process units, the refinery also has several crude and product storage tanks, and its own piers and other berthing facilities, one of which can accommodate very large crude carriers. The Company entered into commercial leases with the PNOC for parcels of land occupied by the Petron Bataan Refinery, depots, terminals and some of its service stations. The lease agreements include upward escalation adjustment of the annual rental rates. In 2009, the Company renewed its lease with PNOC (through NVRC) for the continued use of the Petron Bataan Refinery for 30 years starting January 1, 2010 (renewable upon agreement of the parties for another 25 years). In 2015, the Company also entered into another 25-year lease agreement with PNOC effective August 1, 2014 for additional lots near the Petron Bataan Refinery for its expansion projects. Expenses relating to the PNOC leases amounted to ₱311.4 million in 2021.
On October 20, 2017, the Company filed an action against the PNOC in respect of the leased properties to preserve its rights under the lease agreements. On December 11, 2017, the trial court granted the Company’s prayer for a writ of preliminary injunction, enjoining PNOC from committing any act aimed at ousting the Company from possession of the subject properties until the case is decided. The court-mandated mediation was terminated on February 5, 2018 without any agreement between the parties. The judicial dispute resolution proceedings before the court were likewise terminated on March 28, 2019, after the parties failed to agree to a settlement. Without prejudice to any further discussion between the parties regarding settlement, the case was remanded to the trial court for trial proper, with the pre-trial held on September 10, 2019. The Company also filed a motion for summary judgment on May 17, 2019. In a resolution dated November 13, 2019, the trial court granted the Company’s motion for summary judgment and ordered (i) the rescission of the Deeds of Conveyance dated 1993 relating to the Company’s conveyance of such leased premises to PNOC pursuant to a property dividend declaration in 1993, (ii) the reconveyance by PNOC to the Company of all such properties, and (iii) the payment by the Company to PNOC of the amount of P142 million, with legal interest from 1993, representing the book value of the litigated properties at the time of the property dividend declaration. PNOC filed a motion for reconsideration. The Company also filed a motion for partial reconsideration seeking a modification of the judgment to include an order directing PNOC to return to the Company all lease payments the latter had paid to PNOC since 1993. Following the trial court’s denial of their separate motions for reconsideration, both PNOC and the Company filed their notices of appeal with the trial court. The case was raffled off to the 5th Division of the Court of Appeals. The
23
Company filed its appellant’s brief in October 2020. PNOC filed its appellant’s brief in November 2020. In a decision dated December 13, 2021, the Court of Appeals dismissed both appeals of PNOC and the Company and affirmed the resolution of the trial court as described above. The Court of Appeals upheld the Company’s position that PNOC committed a substantial breach of its contractual obligation under the lease agreements when it dishonored the automatic renewal clause in the lease agreements and threatened to terminate the Company’s lease thereby depriving the Company a long-term lease consistent with its business requirements, which was the primordial consideration in the Deeds of Conveyance. The Court of Appeals ruled, however, that, consistent with jurisprudence, while rescission repeals the contract from its inception, it does not disregard all the consequences that the contract has created and that it was therefore only proper that the Company paid PNOC the rentals for the use and enjoyment of the properties which PNOC could have enjoyed by virtue of the Deeds of Conveyance were it not for the lease agreements. On January 11, 2022, the Company filed its motion for reconsideration insofar as the decision dismissed the Company’s appeal to return the lease payments made by it to PNOC. PNOC also filed its own motion for reconsideration. The parties await the order of the Court Appeals on the motions filed. Petron anticipates that it may lease desirable lots for development as service stations in the next 12 months.
(C) Contingent Liabilities
Petron is involved in certain cases, the material of which are discussed below:
1. Guimaras Oil Spill
a. In the Matter of the Sinking of the MT Solar I SBMI No. 936-06 Special Board of Marine Inquiry Background: Petron hired on a “single voyage basis” the vessel MT Solar I owned by Sunshine Maritime Development Corporation (“SMDC”) for the transport of industrial fuel oil from the Petron Bataan Refinery to Zamboanga. Petron, as a shipper of the cargo, conducted inspection of the vessel MT Solar I and likewise, relied on the documents presented by SMDC as carrier. Petron also relied on the implied warranties of SMDC as a carrier with respect to the seaworthiness of the vessel MT Solar I and other statutory/trading certificates issued by MARINA and other pertinent government agencies.
SMDC, taking into consideration the vessel’s trim, stability and draft, declared to Petron that the vessel MT Solar I can safely load approximately 13,500 barrels of cargo as stated in the Fixture Note, Notice of Readiness and Seaworthiness Certificate. On this basis and relying on the declaration of SMDC, Petron loaded the quantity as specified by SMDC. Unfortunately, the vessel MT Solar I sank off Guimaras when it encountered bad weather on or about August 11, 2006. In September 2006, the Special Board of Marine Inquiry (“SBMI”) was created by the Philippine Coast Guard for the purpose of determining the administrative liability of the crew, owner of the vessel and other involved parties. The SBMI in its initial findings found Petron liable for allegedly overloading the vessel.
24
On November 21, 2006, Petron filed a memorandum of appeal with the Department of Transportation (“DOTr”) (then “Department Transportation and Communication (“DOTC”), elevating the disputed ruling of the SBMI for review. The appeal to the DOTr of the finding of the SBMI that Petron was negligent and responsible for overloading the MT Solar I remained pending as of December 31, 2021. Exposure: Considering the nature of this investigation, no potential liability exists for Petron at this point. Relief sought: Reversal of the SBMI’s initial finding that Petron was liable for allegedly overloading the vessel. Status: The matter was still pending with the DOTr as of December 31, 2021.
b. Rogelio Arsenal, Jr., et al. v. SMDC, Petron, et al. Civil Case No. 09-0394; RTC Br. 65, Jordan, Guimaras
Oliver S. Chavez, et al. v. SMDC, Petron, et al. Civil Case No. 09-0395; RTC Br. 65, Jordan, Guimaras
Background: These are complaints for damages filed on August 6, 2009 by a total of 1,063 plaintiffs who allegedly did not receive any payment from the defendants of their claims for damages arising from the oil spill due to the sinking of MT Solar 1 on August 11, 2006. Total claims for both cases amount to P291.9 million (P286.4 million and P5.5 m). The reception of plaintiffs’ evidence is on-going. In the Arsenal case, respondents filed a motion to hear affirmative defenses based on lack of jurisdiction for non-payment of docket fees, prescription and lack of cause of action but it was denied. The respondents went to the CA on a petition for certiorari. The respondents filed with the CA a compliance with the resolution requiring submission of pleadings and orders. The complainants filed their comment on the petition and the respondents filed their reply to the said comment. On May 29, 2014, the CA rendered a decision directing the plaintiffs to file their respective affidavits substantiating their claims of indigency. The plaintiffs filed a motion for partial reconsideration of the decision which was denied by the CA on January 30, 2015. In the Chavez case, the respondents likewise filed the same motion based on the same grounds. The lower court also denied the motion so the respondents went to the CA on a petition for certiorari. The CA dismissed the petition for failing to attach the necessary pleadings and orders. Status: Both the Arsenal and Chavez cases have been remanded to and are now pending with the trial courts. In the course of plaintiffs’ presentation of evidence, the plaintiffs moved for trial by commissioner, which was denied by the trial court. The plaintiffs elevated the matter by way of a petition for certiorari to the Court of Appeals in Cebu City, which, on January 9, 2020 issued a Resolution ordering the Company to file its comment on plaintiffs’ petition within 10 days. The Company filed a motion for reconsideration of the said resolution, which remains pending as of the date of this report. In the meantime, proceedings before the trial court continue as of the date of this report.
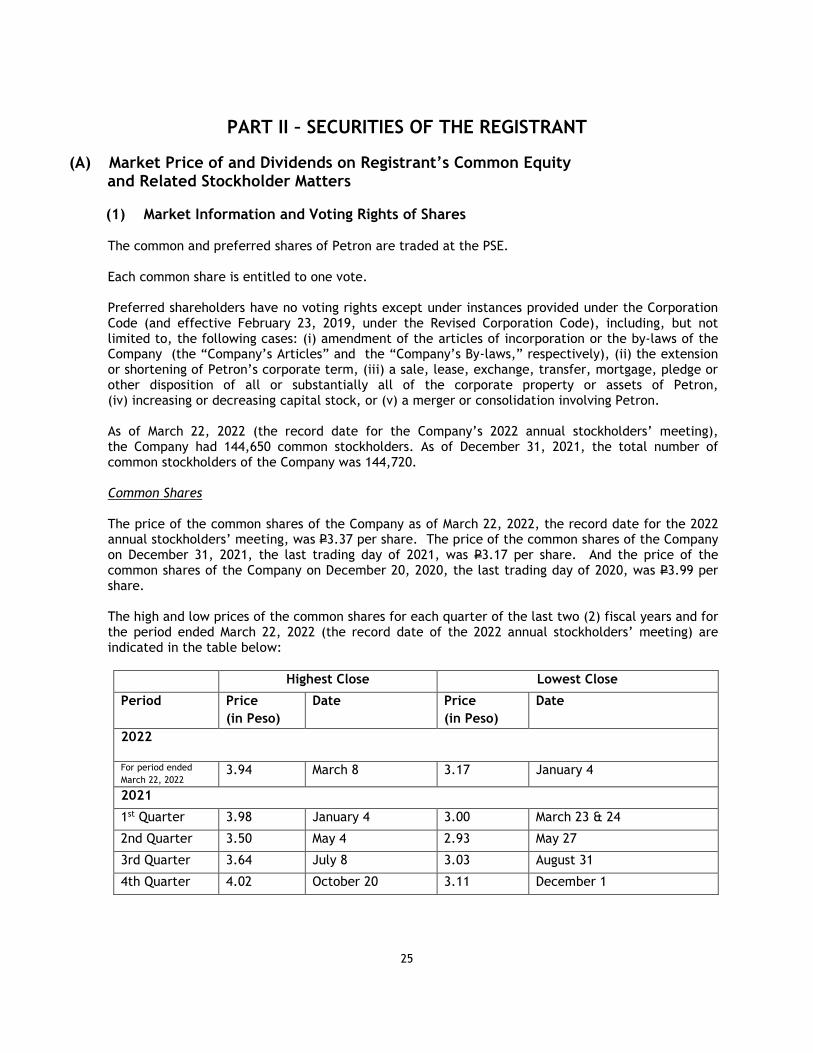
25
PART II – SECURITIES OF THE REGISTRANT
(A) Market Price of and Dividends on Registrant’s Common Equity and Related Stockholder Matters
(1) Market Information and Voting Rights of Shares
The common and preferred shares of Petron are traded at the PSE.
Each common share is entitled to one vote.
Preferred shareholders have no voting rights except under instances provided under the Corporation Code (and effective February 23, 2019, under the Revised Corporation Code), including, but not limited to, the following cases: (i) amendment of the articles of incorporation or the by-laws of the Company (the “Company’s Articles” and the “Company’s By-laws,” respectively), (ii) the extension or shortening of Petron’s corporate term, (iii) a sale, lease, exchange, transfer, mortgage, pledge or other disposition of all or substantially all of the corporate property or assets of Petron, (iv) increasing or decreasing capital stock, or (v) a merger or consolidation involving Petron.
As of March 22, 2022 (the record date for the Company’s 2022 annual stockholders’ meeting), the Company had 144,650 common stockholders. As of December 31, 2021, the total number of common stockholders of the Company was 144,720.
Common Shares
The price of the common shares of the Company as of March 22, 2022, the record date for the 2022 annual stockholders’ meeting, was P3.37 per share. The price of the common shares of the Company on December 31, 2021, the last trading day of 2021, was P3.17 per share. And the price of the common shares of the Company on December 20, 2020, the last trading day of 2020, was P3.99 per share. The high and low prices of the common shares for each quarter of the last two (2) fiscal years and for the period ended March 22, 2022 (the record date of the 2022 annual stockholders’ meeting) are indicated in the table below:
Highest Close Lowest Close
Period Price
(in Peso)
Date Price
(in Peso)
Date
2022
For period ended
March 22, 2022 3.94 March 8 3.17 January 4
2021
1st Quarter 3.98 January 4 3.00 March 23 & 24
2nd Quarter 3.50 May 4 2.93 May 27
3rd Quarter 3.64 July 8 3.03 August 31
4th Quarter 4.02 October 20 3.11 December 1
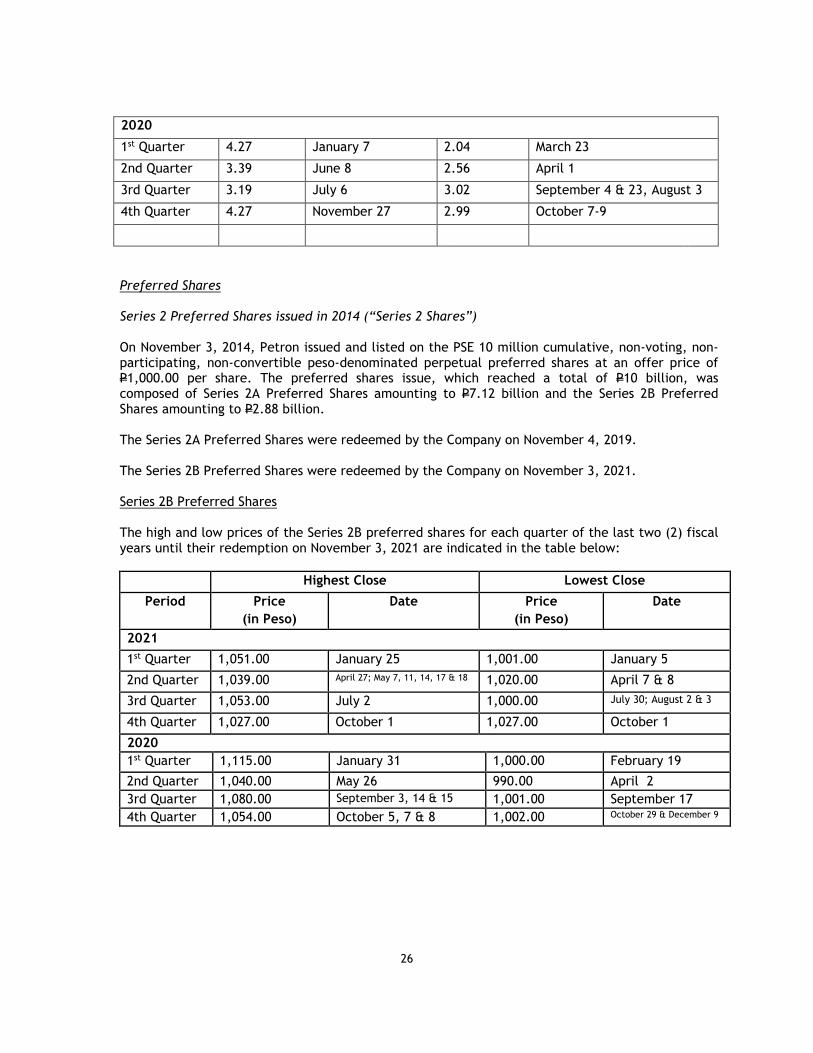
26
2020
1st Quarter 4.27 January 7 2.04 March 23
2nd Quarter 3.39 June 8 2.56 April 1
3rd Quarter 3.19 July 6 3.02 September 4 & 23, August 3
4th Quarter 4.27 November 27 2.99 October 7-9
Preferred Shares
Series 2 Preferred Shares issued in 2014 (“Series 2 Shares”)
On November 3, 2014, Petron issued and listed on the PSE 10 million cumulative, non-voting, non-participating, non-convertible peso-denominated perpetual preferred shares at an offer price of P1,000.00 per share. The preferred shares issue, which reached a total of P10 billion, was composed of Series 2A Preferred Shares amounting to P7.12 billion and the Series 2B Preferred Shares amounting to P2.88 billion. The Series 2A Preferred Shares were redeemed by the Company on November 4, 2019. The Series 2B Preferred Shares were redeemed by the Company on November 3, 2021. Series 2B Preferred Shares
The high and low prices of the Series 2B preferred shares for each quarter of the last two (2) fiscal years until their redemption on November 3, 2021 are indicated in the table below:
Highest Close Lowest Close
Period Price
(in Peso)
Date Price
(in Peso)
Date
2021
1st Quarter 1,051.00 January 25 1,001.00 January 5
2nd Quarter 1,039.00 April 27; May 7, 11, 14, 17 & 18 1,020.00 April 7 & 8
3rd Quarter 1,053.00 July 2 1,000.00 July 30; August 2 & 3
4th Quarter 1,027.00 October 1 1,027.00 October 1
2020
1st Quarter 1,115.00 January 31 1,000.00 February 19
2nd Quarter 1,040.00 May 26 990.00 April 2
3rd Quarter 1,080.00 September 3, 14 & 15 1,001.00 September 17
4th Quarter 1,054.00 October 5, 7 & 8 1,002.00 October 29 & December 9

27
Series 3 Preferred Shares issued in 2014 (“Series 3 Shares”) On June 25, 2019, Petron issued and listed on the PSE 20 million cumulative, non-voting, non-participating, non-convertible peso-denominated perpetual preferred shares at an offer price of P1,000.00 per share. The preferred shares issue, which reached a total of P20 billion, was composed of Series 3A Preferred Shares amounting to P13.403 billion and the Series 3B Preferred Shares amounting to P6.597 billion. The Series 3A Preferred Shares may be redeemed by the Company starting on 5.5th anniversary form the listing date. The Series 3B Preferred Shares may be redeemed starting on the seventh anniversary from the listing date.
Series 3A Preferred Shares
The price of the Series 3A Preferred Shares as of March 21, 2022, the last day they traded prior to March 22, 2022, the record date for the2022 annual stockholders’ meeting, was P1,050.00 per share. The price of the Series 3A Preferred Shares on December 31, 2021, the last trading day of 2021, was P1,000.00 per share. And the price of the Series 3A Preferred Shares on December 29, 2020, the last trading day of 2020 the shares were traded was P1,010.00 per share.
The high and low prices of the Series 3A preferred shares for each quarter of the last two (2) fiscal years and for the period ended March 22, 2022 (the record date of the 2022 annual stockholders’ meeting) are indicated in the table below:
Highest Close Lowest Close
Period Price
(in Peso)
Date Price
(in Peso)
Date
2022
For period ended March 22, 2022
1,080.00 March 14 1,040.00 January 12 & 25
2021
1st Quarter 1,019.00 March 8 & 22 1,061.00 March 19
2nd Quarter 1,119.00 April 22 1,068.00 April 6 & 14
3rd Quarter 1,135.00 September 30 1,045.00 September 16
4th Quarter 1,045.00 October 22 1,000.00 December 31
2020
1st Quarter 1,070.00 February 20 & 21 1,002.00 March 24 & 25
2nd Quarter 1,065.00 June 25 993.00 May 27
3rd Quarter 1,062.00 August 24 1,021.00 July 13
4th Quarter 1,072.00 December 16 & 17 1,010.00 December 29
Series 3B Preferred Shares
The price of the Series 3B Preferred Shares as of March 28, 2022, the last day they traded prior to March 22, 2022, the record date for the 2022 annual stockholders’ meeting, was P1,080.00 per share. The price of the Series 3B Preferred Shares on December 31, 2021, the last trading day of 2021, was P1,119.00 per share. And the price of the Series 3B Preferred Shares on December 29, 2020, the last trading day of 2020, was P1,114.00 per share.
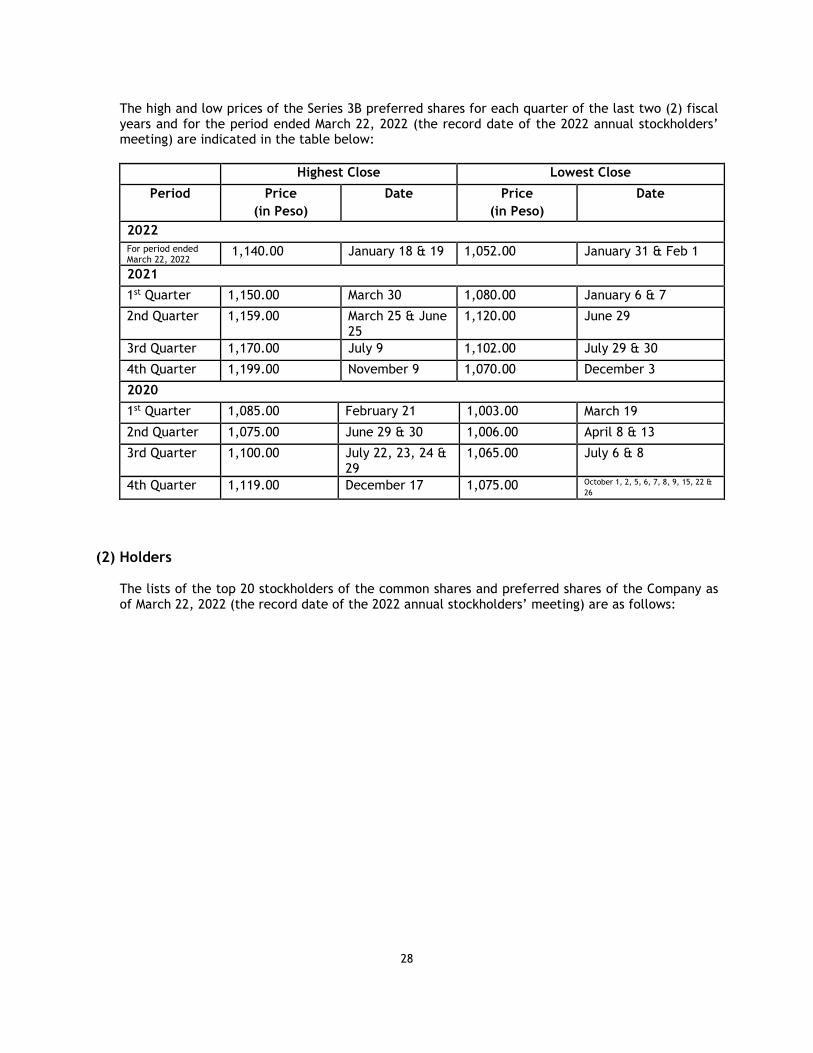
28
The high and low prices of the Series 3B preferred shares for each quarter of the last two (2) fiscal years and for the period ended March 22, 2022 (the record date of the 2022 annual stockholders’ meeting) are indicated in the table below:
Highest Close Lowest Close
Period Price
(in Peso)
Date Price
(in Peso)
Date
2022
For period ended March 22, 2022
1,140.00 January 18 & 19 1,052.00 January 31 & Feb 1
2021
1st Quarter 1,150.00 March 30 1,080.00 January 6 & 7
2nd Quarter 1,159.00 March 25 & June 25
1,120.00 June 29
3rd Quarter 1,170.00 July 9 1,102.00 July 29 & 30
4th Quarter 1,199.00 November 9 1,070.00 December 3
2020
1st Quarter 1,085.00 February 21 1,003.00 March 19
2nd Quarter 1,075.00 June 29 & 30 1,006.00 April 8 & 13
3rd Quarter 1,100.00 July 22, 23, 24 & 29
1,065.00 July 6 & 8
4th Quarter 1,119.00 December 17 1,075.00 October 1, 2, 5, 6, 7, 8, 9, 15, 22 &
26
(2) Holders
The lists of the top 20 stockholders of the common shares and preferred shares of the Company as of March 22, 2022 (the record date of the 2022 annual stockholders’ meeting) are as follows:
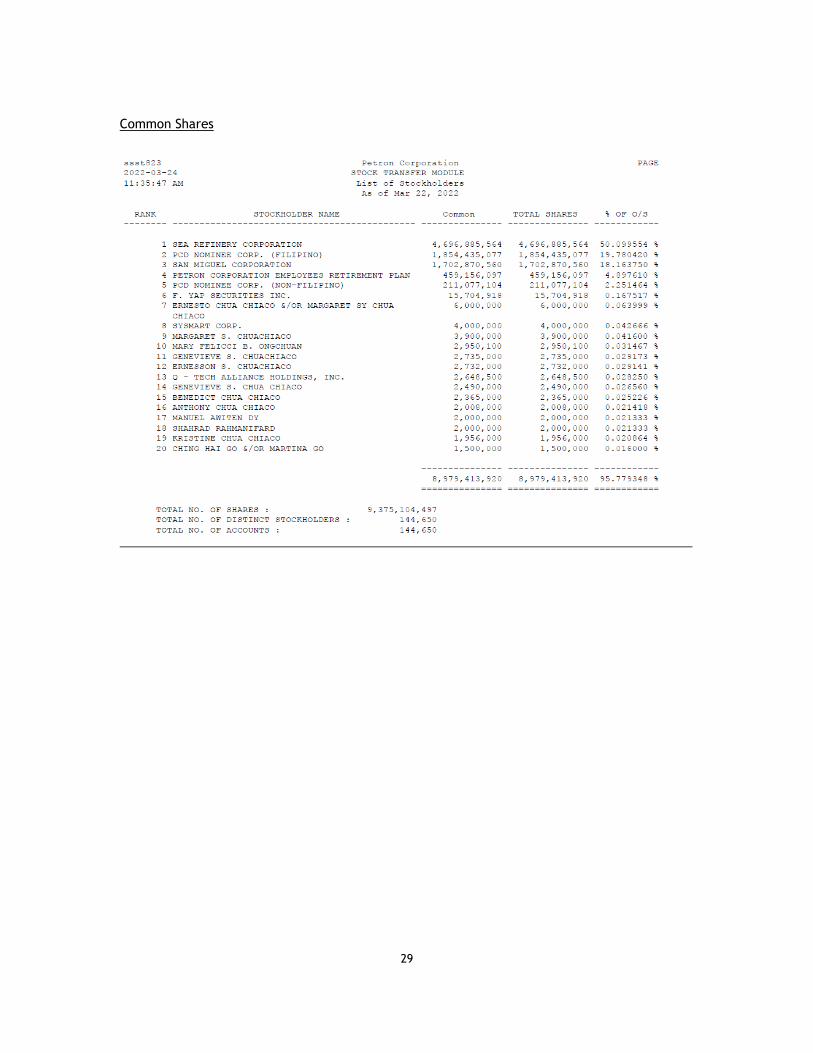
29
Common Shares
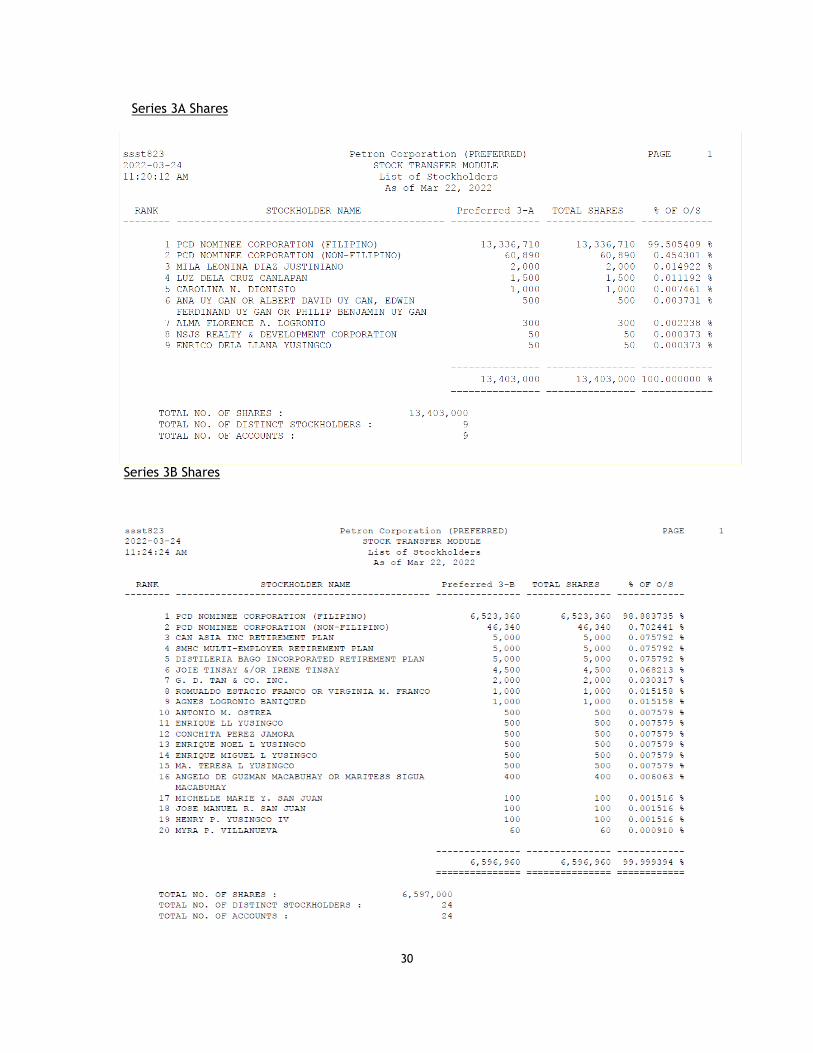
30
Series 3A Shares
Series 3B Shares
31
(3) Dividends
It is the policy of the Company under its Corporate Governance Manual (as defined below) to declare dividends when its retained earnings exceed 100% of its paid-in capital stock, except: (a) when justified by definite corporate expansion projects or programs approved by the Board, (b) when the Company is prohibited under any loan agreement with any financial institution or creditor, whether local or foreign, from declaring dividends without its consent and such consent has not been secured, or (c) when it can be clearly shown that such retention is necessary under special circumstances obtaining in the Company, such as when there is a need for special reserve for probable contingencies.
The Company pays out dividends on common shares within 30 days after the declaration, to the extent practicable. On November 3, 2014, the Company issued 7,122,320 Series 2A Preferred Shares and 2,877,680 Series 2B Preferred Shares. The dividend on the Series 2A Preferred Shares was at the fixed rate of 6.30% per annum and on the Series 2B Preferred Shares at the fixed rate of 6.8583% per annum, each as calculated based on the offer price of P1,000 per share on a 30/360-day basis and payable quarterly in arrears, whenever approved by the Board of Directors. If the dividend payment date is not a banking day, dividends will be paid on the next succeeding banking day, without adjustment as to the amount of dividends to be paid. Cash dividends have been paid out on the Series 2 Shares in February 2015 since their listing in November 2014. The Series 2A Preferred Shares and the Series 2B Preferred Shares were redeemed on November 4, 2019 and November 3, 2021, respectively. On June 25, 2019, the Company issued 13,403,000 Series 3A Preferred Shares and 6,596,900 Series 3B Preferred Shares. The dividend on the Series 3A Preferred Shares is at the fixed rate of 6.8713% per annum and on the Series 3B Preferred Shares at the fixed rate of 7.1383% per annum, each as calculated based on the offer price of P1,000.00 per share on a 30/360-day basis and payable quarterly in arrears, whenever approved by the Board of Directors. If the dividend payment date is not a banking day, dividends will be paid on the next succeeding banking day, without adjustment as to the amount of dividends to be paid. Cash dividends have been paid out on the Series 3 Shares since their listing in June 2019. Dividend Declarations and Payments 2021 On March 9, 2021, the Board of Directors approved cash dividends of (i) P17.14575 per Series 2B Preferred Share to shareholders of such shares for the second quarter of 2021, with a record date of April 7, 2021 and a pay-out date of May 3, 2021; (ii) P17.17825 per Series 3A Preferred Share to shareholders of such shares for the second quarter of 2021, with a record date of June 2, 2021 and a pay-out date of June 25, 2021; and (iii) P17.84575 per Series 3B Preferred Share to shareholders of such shares for the second quarter of 2021, with a record date of June 2, 2021 and a pay-out date of June 25, 2021. On May 4, 2021, the Board of Directors approved cash dividends of (i) P17.14575 per Series 2B Preferred Share to shareholders of such shares for the third quarter of 2021, with a record date of July 8, 2021 and a pay-out date of August 3, 2021; (ii) P17.17825 per Series 3A Preferred Share to shareholders of such shares for the third quarter of 2021, with a record date of September 2, 2021 and a pay-out date of September 27, 2021 (with September 25, 2021 falling on a Saturday); and (ii9) P17.84575 per Series 3B Preferred Share to shareholders of such shares for the third quarter of
32
2021, with a record date of September 2, 2021 and a pay-out date of September 27, 2021 (with September 25, 2021 falling on a Saturday).
On August 3, 2021, the Board of Directors approved cash dividends of (i) P17.14575 per Series 2B Preferred Share to shareholders of such shares for the fourth quarter of 2021, with a record date of October 7, 2021 and a pay-out date of November 3, 2021; (ii) P17.17825 per Series 3A Preferred Share to shareholders of such shares for fourth quarter of 2021, with a record date of November 29, 2021 and a pay-out date of December 27, 2021 (with December 25, 2021 being a holiday and falling on a Saturday); and (ii) P17.84575 per Series 3B Preferred Share to shareholders of such shares for the fourth quarter of 2021, with a record date of November 29, 2021 and a pay-out date of December 27, 2021 (with December 25, 2021 being a holiday and falling on a Saturday). On November 9, 2021, the Board of Directors approved cash dividends of (i) P17.17825 per Series 3A Preferred Share to shareholders of such shares for the fourth quarter of 2021 and the first quarter of 2022, with a record date of March 3, 2022 and June 3, 2022, respectively; and a pay-out date of March 25, 2022 and June 27, 2022 (with June 25, 2022 falling on a Saturday); and (ii) P17.84575 per Series 3B Preferred Share to shareholders of such shares for the for the fourth quarter of 2021 and the first quarter of 2022, with a record date of March 3, 2022 and June 3, 2022, respectively; and a pay-out date of March 25, 2022 and June 27, 2022 (with June 25, 2022 falling on a Saturday).
2020 On March 10, 2020, the Board of Directors approved a cash dividend of P0.10 per share to all common shareholders with a record date of March 24, 2020 and a pay-out date of April 8, 2020. On the same date, the Board of Directors also approved cash dividends of (i) P17.14575 per share to the shareholders of the Series 2B Preferred Shares for the second quarter of 2020 with a record
date of April 7, 2020 and a pay-out date of May 4, 2020 (with May 3 falling on a Sunday); (ii) P17.17825 per share to the shareholders of the Series 3A Preferred Shares for the second quarter of 2020, with a record date of June 1, 2020 and a pay-out date of June 25, 2020; and (iii) of P17.84575 per share to the shareholders of the Series 3B Preferred Shares for the second quarter of 2020, with a record date of June 1, 2020 and a pay-out date of June 25, 2020. On May 26, 2020, the Board of Directors approved cash dividends of (i) P17.14575 per share to the shareholders of the Series 2B Preferred Shares for the third quarter of 2020 with a record date of July 9, 2020 and a pay-out date of August 3, 2020; (ii) P17.17825 per share to the shareholders of the Series 3A Preferred Shares for the third quarter of 2020, with a record date of September 2, 2020 and a pay-out date of September 25, 2020; and (iii) of P17.84575 per share to the shareholders of the Series 3B Preferred Shares for the third quarter of 2020, with a record date of September 2, 2020 and a pay-out date of September 25, 2020.
On August 4, 2020, the Board of Directors approved cash dividends of (i) P17.14575 per share to the shareholders of the Series 2B Preferred Shares for the fourth quarter of 2020 with a record date of October 9, 2020 and a pay-out date of November 3, 2020; (ii) P17.17825 per share to the shareholders of the Series 3A Preferred Shares for the fourth quarter of 2020, with a record date of December 2, 2020 and a pay-out date of December 28, 2020; and (iii) of P17.84575 per share to the shareholders of the Series 3B Preferred Shares for the fourth quarter of 2020, with a record date of December 2, 2020 and a pay-out date of December 28, 2020. On November 3, 2020, the Board of Directors approved cash dividends of (i) P17.14575 per share to the shareholders of the Series 2B Preferred Shares for the first quarter of 2021 with a record date of January 8, 2021 and a pay-out date of February 3, 2021; (ii) of P17.17825 per share to the shareholders of the Series 3A Preferred Shares for the first quarter of 2021, with a record date of
33
March 2, 2021 and a pay-out date of March 25, 2021; and (iii) of P17.84575 per share to the shareholders of the Series 3B Preferred Shares for the first quarter of 2021, with a record date of March 2, 2021 and a pay-out date of March 25, 2021. Distributions Under the terms and conditions of the undated unsubordinated capital securities issued by the Company on January 19, 2018 (collectively, the “Capital Securities”), more particularly described below in “Recent Sales of Unregistered or Exempt Securities Including Recent Issuances of Securities Constituting an Exempt Transaction, the Company cannot declare dividends on any Junior Securities (as defined thereunder), which include the common shares of the Company, or (except on a pro rata basis) on any Parity Securities (as defined thereunder), which include the outstanding preferred shares of the Company, in case the payment of all distributions scheduled to be made on the Capital Securities is not made in full by reason of the Company deferring such distributions in accordance with the terms of the Capital Securities.
(4) Recent Sales of Unregistered or Exempt Including Recent Issuances of Securities Constituting an Exempt Transaction
Under the Securities and Regulation Code (the “Code”), securities are not permitted to be sold or offered for sale or distribution within the Philippines unless such securities are approved for registration by the SEC or are otherwise exempt securities under Section 9 of the Code or sold pursuant to an exempt transaction under Section 10 of the Code. The securities discussed below were offered and/or sold for the past three (3) years (from 2018) in the Philippines to institutional lenders not exceeding 19 or to not more than 19 non-qualified buyers and/or to any number of qualified buyers as defined in the Code. Thus, the offer and sale of the subject securities qualified as exempt transactions pursuant to Sections 10.1 (k) and 10.1(l) of the Code. A confirmation of exemption from the SEC that the offer and sale of the securities in the Philippines qualified as an exempt transaction under the Code was not required to be, and had not been, obtained. In compliance with existing rules, no notice of exemption was filed after the issuance below which qualified as an exempt transaction. The securities discussed below were not registered with the SEC under the Code. Any future offer or sale thereof is subject to registration requirements under the Code, unless such offer or sale qualifies as an exempt transaction.
US$500 Million Undated Unsubordinated Capital Securities
a. On January 19, 2018, the Company issued US$500 million undated unsubordinated capital
securities (the “January 2018 Issuance”). b. The joint lead managers were Australia and New Zealand Banking Group Limited, DBS Bank
Ltd., Deutsche Bank AG, Singapore Branch, The Hongkong and Shanghai Banking Corporation, Singapore Branch, Standard Chartered Bank, and UBS AG, Singapore Branch.
c. The offer price for the January 2018 Issuance was at 100%. c. As the capital securities described herein were offered to qualified buyers in the
Philippines, the issuance of such securities was considered an exempt transaction and no confirmation or notice of exemption from the registration requirements of the Code was required to be filed with the SEC pursuant to the Code and the 2015 Implementing Rules and Regulations of the Securities Regulation Code (the “2015 SRC Rules”). The capital
34
securities were listed with the Singapore Exchange Securities Trading Limited on January 22, 2018.
US Dollar Redeemable Perpetual Securities
a. On November 27, 2019, June 22, 2020, and August 10, 2020, the Company issued redeemable
perpetual securities (the “Redeemable Perpetual Securities”) to SMC in the amounts of US$6 million, US$130 million, and US$100 million, respectively.
b. As the Redeemable Perpetual Securities were offered only SMC, the issuance of such
securities was considered an exempt transaction and no confirmation or notice of exemption from the registration requirements of the Code was required to be filed with the SEC pursuant to the Code and the 2015 SRC rules.
US$550 Million Undated Unsubordinated Capital Securities
a. On April 19, 2021, the Company issued US$550 million undated unsubordinated capital securities (the “2021 Capital Securities”).
b. The sole global coordinator for the transaction was The Hongkong and Shanghai Banking
Corporation Limited and the joint lead managers were DBS Bank Ltd., HSBC, MUFG Securities Asia Limited, SMBC Nikko Capital Markets Limited, Standard Chartered Bank and UBS AG Singapore Branch.
c. The offer price for the 2021 Capital Securities was at 100%. d. As the 2021 Capital Securities were offered to qualified buyers in the Philippines, the
issuance of such securities was considered an exempt transaction and no confirmation or notice of exemption from the registration requirements of the Code was required to be filed with the SEC pursuant to the Code and the 2015 SRC rules. The capital securities were listed with the Singapore Exchange Securities Trading Limited on April 20, 2021.
(B) Description of Petron’s Shares
The Company has an authorized capital stock of P10 billion divided into 9,375,104,497 common shares and 624,895,503 preferred shares, with a par value of P1 each. As of the date of this Annual Report, the outstanding capital stock of the Company is comprised of 9,375,104,497 common shares, 13,403,000 Series 3A Preferred Shares, and 6,597,000 Series 3B Preferred Shares. The Company has 90,000,000 treasury shares. The Series 2 Preferred Shares, with an aggregate issue value of P10 billion, were offered during the period October 20-24, 2014 pursuant to the order of registration and the permit to sell issued by the SEC on October 17, 2014. The Series 2 Preferred Shares were issued and listed on the PSE on November 3, 2014. The Series 2A Preferred Shares were redeemed by the Company on November 4, 2019. The Series 2A Preferred Shares and the Series 2B Preferred Shares were redeemed by the Company on November 4, 2019 and November 3, 2021, respectively. The Series 3 Preferred Shares, with an aggregate issue value of P20 billion, were offered during the period June 3-18, 2019 pursuant to the order of registration and the permit to sell issued by the SEC on May 31, 2019 and issued out of the treasury shares of the Company. The Series 3 Preferred Shares were issued and listed on the PSE on June 25, 2019.
35
Each common share is entitled to one vote. Preferred shareholders have no voting rights except under instances provided under the Corporation Code, including, but not limited to, the following cases: (i) amendment of the Company’s Articles or the Company’s By-laws, (ii) the extension or shortening of Petron’s corporate term, (iii) a sale, lease, exchange, transfer, mortgage, pledge or other disposition of all or substantially all of the corporate property or assets of Petron, (iv) increasing or decreasing capital stock, or (v) a merger or consolidation involving Petron.
(C) Stock Ownership Plan
Petron currently does not have a stock ownership plan or program. In 1994, when Petron’s initial public offering was undertaken, a special secondary sale of Petron’s shares was offered to its employees. The entitlement of shares at the listing price of P9.00 per share was made equivalent to the employee’s base pay factored by his/her service years with Petron. Petron’s executive officers, except the Chairman, the President and the Vice President for Corporate Planning, were entitled to own Petron shares under this stock ownership plan. Preparatory to the listing of the Company’s preferred shares, availment of said shares was offered to employees from February 15 to 19, 2010.
(D) Public Ownership
Based on the report provided by SMC Stock Transfer Services Corporation, the stock transfer agent of the Company, 26.72% of the outstanding common shares of the Company was owned by the public as of December 31, 2021 and March 31, 2022 in compliance with the minimum public ownership set by the PSE and the SEC. Attached as Annexes A and B are the public ownership reports of the Company as of December 31, 2021 and March 31, 2022.
[Rest of page intentionally left blank; “Part III - Management’s Discussion and Analysis of Financial Position
and Financial Performance” follows on next page]
36
PART III - MANAGEMENT’S DISCUSSION AND ANALYSIS OF FINANCIAL POSITION AND FINANCIAL PERFORMANCE
Financial Performance
2021 vs 2020 As global vaccination rate continued to improve, pandemic restrictions were relaxed and more economic activities were resumed. This supported the continued recovery in global demand towards its pre-pandemic level. This rebound was complemented by the OPEC’s managed approach in increasing crude supply back in the market which allowed the oil sector to regain momentum and enjoy improved margins. With this as the backdrop, Petron Corporation’s consolidated net income for 2021 reached P6.14 billion, a turnaround from P= 11.41 billion net loss suffered in the previous year.
Consolidated Sales volume grew by 5% to 82.24 million barrels (MMB) from 78.58 MMB in prior year. Through the Company’s volume-generating programs, retail volumes in the Philippines managed to grow despite granular lockdowns. Petrochemical sales and PSTPL trading volume were also up. However, growth in commercial sales remained subdued largely due to the slowdown in the aviation industry.
Net Sales more than doubled to P= 438.06 billion from P= 286.03 billion in prior year traced to the steady rise in regional reference MOPS prices during the year. Cost of Goods Sold (CGS) likewise surged by 47% to P= 407.56 billion from P= 277.32 billion mainly due to higher cost per liter. Benchmark crude Dubai breached the $80/bbl-mark in the 4th quarter and averaged US$69/bbl for the year, up by 64% from US$42/bbl average in 2020. Gross profit climbed up to P= 30.50 billion traced to the absence of inventory losses and improved refining cracks.
Selling and Administrative Expenses (OPEX), net of Other Operating Income at P= 13.28 billion was the same level as previous year. Savings on terminalling and storage expenses, outsourced services and increase in rent income were offset by higher maintenance and repairs related to service stations, depot and information technology as well as higher LPG cylinder purchases.
Net Financing Costs and Other Charges declined by 14% to P= 9.92 billion largely due to reduced borrowing level and interest rates as well as lower unrealized losses on commodity hedges.
Income tax expense amounted to P= 1.16 billion in contrast to last year’s P= 4.80 billion tax benefit from huge loss before tax.
2020 vs. 2019 The year 2020 was marked with the adverse impact of the COVID-19 pandemic to the global economy. The unprecedented destruction in worldwide fuel demand caused oil prices to crash at record-low levels in the second quarter. The lockdowns implemented in most parts of the Philippines and Malaysia pulled down sales volume while the historic slump in prices resulted in substantial inventory losses. Despite the moderate recovery in the second semester, Petron ended the year with a consolidated net loss of P11.4 billion, a reversal from its 2019 net income of P2.3 billion. Aside from the impact of the volume contraction and inventory loss, the prevailing weak refining cracks also continued to challenge the Company’s financial performance. Consolidated Sales volume dropped by 27% to 78.58 million barrels (MMB), from 106.96 MMB in previous year (PY) primarily due to reduced economic activities and travel restrictions from worldwide lockdowns.
37
Net sales dropped by 44% to P= 286.03 billion from P= 514.36 billion in 2019 due to reduced volume and lower average selling price, compounded by the impact of P= 2.18 appreciation of the peso against the US dollar, partly offset by incremental excise taxes with the implementation of the last tranche of the TRAIN law. Cost of Goods Sold declined to P= 277.32 billion from PY’s P= 483.86 billion traced to lower sales volume and average cost per liter as benchmark crude Dubai plunged from an average of US$64/bbl in 2019 to US$42/bbl, partly offset by higher excise taxes. Gross profit fell to P= 8.71 billion from the P= 30.51 billion in 2019 largely on account of the volume drop, inventory losses and product cracks narrowing, which partly mitigated by improved marketing margins. Continuous cost reduction measures led to the 7% dip in Selling and Administrative Expenses (OPEX), net of Other operating Income, to P= 13.34 billion compared to previous year’s 14.31 billion. The OPEX savings mainly came from outsourced services, advertising and promotional expenses, service station & depot maintenance & repairs, and employee costs, but were partly offset by decrease in rent income. Net Financing Costs and Other Charges was also down by 7% from P= 12.46 billion to P= 11.58 billion attributed to the decline in interest expense at the back of lower average borrowing rates, partly offset by higher marked-to-market losses on commodity hedges and lower interest income. Income tax benefit amounted to P= 4.80 billion owing to the loss before tax position, as against the P= 1.43 billion income tax expense in the previous year.
2019 vs. 2018 For 2019, the Company reported a consolidated net income of P= 2.30 billion, 67% lower than previous year’s (PY) P= 7.07 billion essentially from the continued weakening of regional refining margins. Its Bataan refinery was forced to an unplanned total plant shutdown for 108 days following the April 22 earthquake that hit Luzon which resulted in losses due to low production and start-up and stabilization activities on the processing units. Consolidated Sales volume slightly declined to 106.96 million barrels (MMB), from 108.50 MMB in 2018 primarily due to the 5% drop in Philippine volumes following the low production of the Bataan refinery. Meanwhile, Petron Malaysia’s volumes sustained its growth by 3% mostly coming from its domestic sales.
Net sales decreased by 8% to P= 514.36 billion mainly due to lower average selling price, further reduced by the decline in volume and impact of the P= 0.88 average appreciation of the Philippine peso against the US dollar. These were partly offset by the increase in excise tax per liter. Cost of Goods Sold (CGS) at P= 483.86 billion was also lower by 7% or P= 38.97 billion due to the combined effect of lower cost per liter and sales volume. During the year, the average price of benchmark Dubai crude fell to US$63.53/bbl from US$69.42/bbl in 2018. Gross Margin contracted by 12% from P= 34.56 billion to P= 30.51 billion due to lower product cracks, higher crude premium and losses incurred as a result of the Bataan refinery total plant shutdown. These were partially mitigated by the net inventory holding gains and improved marketing margins.
38
Selling and Administrative Expenses (OPEX) net of Other operating Income was reduced by 9% or P= 1.33 billion to P= 14.31 billion largely from lower advertising expenses, employee costs, donation and provision for bad debts as well as reduced LPG cylinder purchases, partly offset by higher terminal operation expenses. Net Financing Costs and Other Charges grew by 47% from P= 8.47 billion to P= 12.46 billion brought about by the increase in average borrowing level and interest rates, adoption of PFRS 16, as well as the recognition of unrealized commodity hedging loss versus gain LY. These were partly offset by higher interest income. Income tax expense was cut by more than half from P 3.39 billion to P 1.43 billion on account of lower pre-tax income.
Financial Position
2021 vs 2020 The Consolidated assets of Petron Corporation and its Subsidiaries as of end-2021 amounted to P= 402.42 billion, 16% or P= 57.69 billion higher than end-2020 balance of P= 349.73 billion. The increase in total assets can be traced to higher inventories, trade and other receivables, and cash and cash equivalents. Cash and cash equivalents increased by 35% to P= 36.41 billion from P= 27.05 billion mainly from the proceeds of perpetual securities issuance and availment of loans, reduced by cash dividend and distribution payments, spending for capital projects and increase in working capital requirements during the year. Financial assets at fair value went up to P= 1.01 billion from P= 603 million due to higher gains on outstanding currency hedges. Investments in debt instruments (current and non-current) became nil from the P= 381 million balance as of end-2020 with the deconsolidation of Petrogen Insurance Corporation (PIC) from the Petron Group. Trade and other receivables - net rose by 90% to P= 51.75 billion attributable to the increase in trade receivables owing to higher prices, further elevated by the increase in government receivables of Petron Malaysia, partly countered by the decrease in non-trade receivables of the Parent Company. Inventories increased by P= 22.76 billion to P= 67.68 billion mainly from higher prices partly offset by lower volume of finished products versus the end 2020 level. Investment in shares of stock of an associate amounting to P= 1.01 billion is a result of the decrease in ownership interest of the Parent Company in PIC from 100% to 25.06% effective February 2021. Right of Use asset declined by 7% or P= 398 million to P= 5.65 billion due to depreciation for the period. Other noncurrent assets – net declined to P= 1.54 billion from P= 2.09 billion mostly from the amortization of deferred input tax. Short-term loans increased to P= 109.20 billion from end-2020 level of P= 77.70 billion due to borrowings to support the increase in working capital requirements. Liabilities for crude oil and petroleum products stood higher at P= 42.64 billion compared to end-2020 level of P= 22.32 billion owing primarily to the continuous increase in prices during the period.
39
Trade and other payables declined by 9% or P= 1.40 billion to P= 14.00 billion due to lower outstanding liabilities to contractors and vendors. Derivative liabilities decreased by 11% to P= 997 million with the lower expected payout on outstanding commodity hedges, as well as currency hedges under hedge accounting. Income tax payable grew by 86% from P= 162 million to P= 302 million as tax liabilities of Petron Malaysia increased. Long-term debt (including current portion) declined to P= 102.65 billion from end-2020 balance of P= 119.45 billion as a result of the Parent Company’s prepayment and amortization of existing peso and dollar loans partly offset by the issuance of retail bonds. Retirement benefits liability -net decreased by 10% to P= 3.33 billion after considering the contributions made to the retirement fund during the year. Deferred tax liabilities – net went up to P= 3.78 billion from P= 3.08 billion due to Petron Malaysia’s temporary differences with respect to depreciation of qualifying assets.
Other noncurrent liabilities stood at P= 1.20 billion, 37% lower than end-2020 level due to lower customer deposits and liabilities from cash flow hedges. Capital Securities moved up by 72% to P= 62.71 billion traced to the issuance of the US$550 million Senior Perpetual Capital Securities. Treasury Stock increased by 19% to P= 18.00 billion attributed to redemption of preferred shares. Non-controlling interests rose by 14% to P= 7.33 billion mainly from its proportionate share in net income during the period. 2020 vs 2019 The consolidated assets of Petron Corporation and its Subsidiaries as of end-2020 amounted to P= 349.73 billion, 11% or P= 45.11 billion lower than end-2019 balance of P= 394.84 billion primarily due to the decrease in inventories and trade receivables from lower prices and volume. Cash and cash equivalents was reduced by 21% from P= 34.22 billion to P= 27.05 billion as available cash was used to finance capital projects. Financial assets at fair value decreased to P= 603 million from P= 864 million due to lower gains on outstanding commodity and currency hedges. Investments in debt instruments (current and non-current) went down by 9% to P= 381 million from the end-2019 level of P= 420 million with the maturity of some government securities and bonds partly offset by the new investment in government securities by the insurance subsidiary. Trade and other receivables - net dropped by 39% to P= 27.20 billion attributed to the decrease in sales volume and prices of fuel products. Inventories was cut by P= 27.29 billion to P= 44.92 billion mainly from lower prices and volume of crude and finished products on hand compared to the end-2019 level.
40
Other current assets increased by 18% to P= 32.34 billion from higher excise tax claims and unused creditable withholding taxes. Right of Use assets went up by 10% or P= 536 million to P= 6.05 billion with the remeasurement of the related asset retirement obligation for the refinery. The change in net tax position of the Parent Company due to the additional Net Operating Loss Carry-Over (NOLCO) in 2020 led to the increase in Deferred tax assets - net to P= 2.19 billion from P= 262 million as of end 2019 and consequently resulted in the reduction in Deferred tax liabilities – net from P= 6.35 billion to P= 3.08 billion. Other noncurrent assets – net declined to P= 2.09 billion from P= 2.74 billion on account of the amortization of deferred input tax, usage of catalysts as well as drop in currency hedges under hedge accounting. Short-term loans increased from P= 71.09 billion to P= 77.70 billion traced to net loan availment during the year. Liabilities for crude oil and petroleum products at P= 22.32 billion was lower by 43% compared to end-2019 level of P= 39.36 billion owing primarily to lower prices and lesser number of outstanding importations as of end 2020. Trade and other payables was reduced by 46% to P= 15.40 due to lower outstanding liabilities to contractors and vendors. Derivative liabilities grew by 52% to P= 1.12 billion with the increase in the expected payout on outstanding commodity hedges, as well as currency hedges under hedge accounting, partly offset by the decrease in marked-to-market (MTM) losses on currency forwards. Income tax payable fell 39% to P= 162 million as tax liabilities of foreign subsidiaries declined. Long-term debt (including current portion) decreased to P= 119.45 billion from end-2019 balance of P= 133.08 billion following the Parent Company’s prepayment and amortization of dollar and peso loans, partly offset by availment of new loans, i.e. USD 150 million, JPY 15 billion and P= 5 billion loan. Asset retirement obligation increased by more than half to P= 2.87 billion from P= 1.72 billion traced to the reassessment/re-measurement of future liability.
Other noncurrent liabilities stood at P= 1.90 billion, 9% higher than end-2019 level due to additional cash bonds received from customers. Capital securities grew by P= 11.30 billion to P= 36.48 billion with the issuance of USD 230 million Redeemable Perpetual Securities in the 2nd and 3rd quarters of 2020.
Retained earnings at P= 29.80 billion was 35% down versus end-2019 level primarily due to the P= 11.38 billion net loss incurred by the equity holders of the Parent Company further reduced by the cash dividends and distributions declared during the period. The negative balance of Equity reserves increased from P= 16.90 billion to P= 18.37 billion mainly from the translation loss on its investments in foreign subsidiaries as a result of the strengthening of the peso against the US dollar. Consequently, Non-controlling interests slipped from P= 6.77 billion to P= 6.42 billion, proportionate to its share in net loss during period, the cash dividends declared to minority shareholders coupled by currency translation adjustments.
41
2019 vs 2018 By the end of 2019, the consolidated assets of Petron and its Subsidiaries stood at P= 394.84 billion, higher by 10% from end-2018 balance of P= 358.15 billion largely due to the recognition of relevant assets with the adoption of PFRS 16 (Leases), higher cash and cash equivalents and inventories, partly offset by the decline in other assets (current and non-current). Cash and cash equivalents almost doubled from P= 17.41 billion to P= 34.22 billion mostly from funds generated from operations and the issuance of preferred shares. Financial assets at fair value declined from P= 1.13 billion to P= 864 million due to lower unrealized gain on outstanding commodity hedges. Investments in debt instruments (current and non-current) went up by 11% to P= 420 million from end 2018 level of P= 378 million traced to additional investment in government securities acquired by the Insurance subsidiary. Trade and other receivables - net increased by P= 2.16 billion to P= 44.66 billion owing to higher price and excise tax of fuel products partly offset by the collection of receivables from the Malaysian government. Inventories rose to P= 72.21 billion from P= 63.87 billion due to higher volume of finished product and price of crude and the incremental excise tax imposed beginning 2019. Other current assets dropped by 26% to P= 27.43 billion mainly due to Petron Malaysia’s collection of its Goods and Service Tax refunds from the government and the Parent’s utilization of tax credit certificates, partly negated by the increase in prepaid and creditable withholding taxes. The adoption of PFRS 16 resulted in the recognition of right-of-use assets of P= 5.51 billion, 81% increase in investment property to P= 29.94 billion and a reduction in the prepaid rent which largely accounted for the 53% drop in other noncurrent assets - net to P= 3.07 billion. Corresponding lease liabilities - current and noncurrent were also booked totaling P= 15.75 billion. Short-term loans decreased to P= 71.09 billion from P= 83.0 billion mainly due to Parent Company’s net payments during the year. Liabilities for crude oil and petroleum products grew by more than half to P= 39.36 billion on account of higher volume and price of outstanding finished products importations as of end-2019 versus prior year. Derivative liabilities increased by 20% from P= 614 million to P= 738 million arising from higher expected payout on outstanding commodity and currency hedges. Income tax payable climbed to P= 267 million from P= 146 million largely from higher tax liabilities of Petron Malaysia. Long-term debt (current and non-current portion) grew by 13% to P= 133.08 billion as the Parent Company availed of US$800 million loan partly offset by the payment of matured peso and dollar loans. Retirement benefits liability rose by 47% to P= 3.56 billion on account of the re-measurement losses on plan assets partly offset by the contributions made to the fund during the year. Deferred tax liability – net dropped by 25% from P= 8.45 billion to P= 6.35 billion brought about by the
recognition of NOLCO and MCIT by the Parent Company.
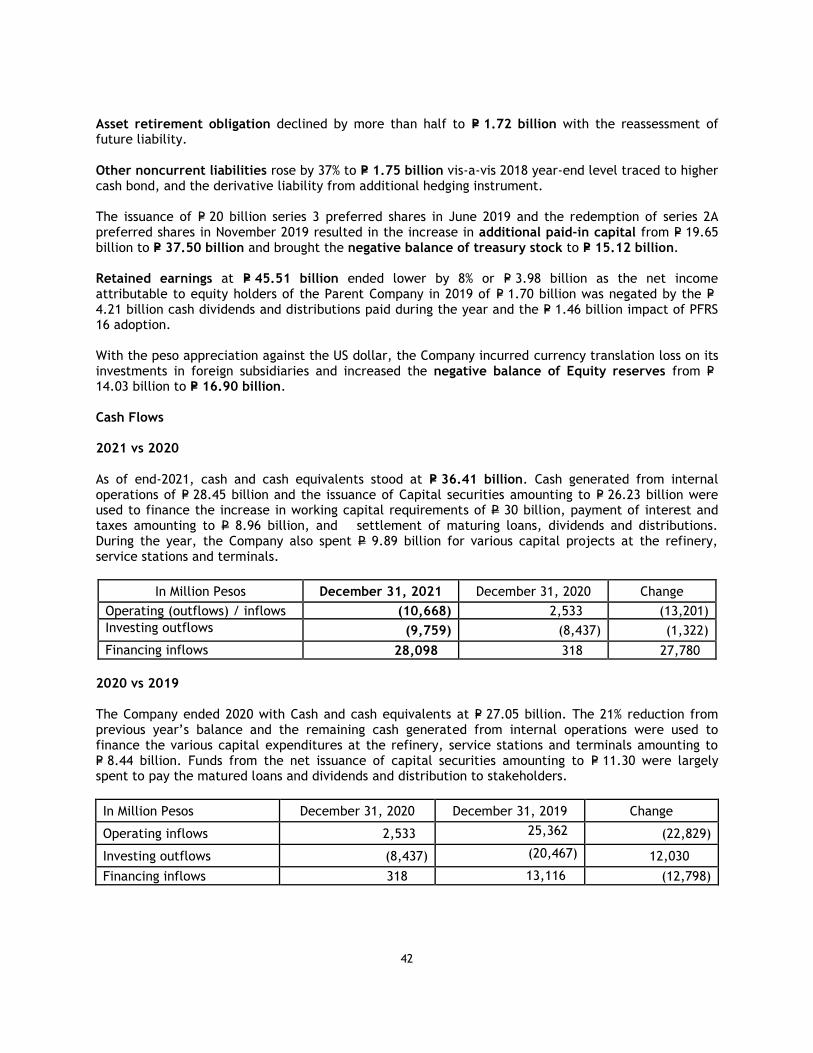
42
Asset retirement obligation declined by more than half to P= 1.72 billion with the reassessment of future liability.
Other noncurrent liabilities rose by 37% to P= 1.75 billion vis-a-vis 2018 year-end level traced to higher cash bond, and the derivative liability from additional hedging instrument. The issuance of P= 20 billion series 3 preferred shares in June 2019 and the redemption of series 2A preferred shares in November 2019 resulted in the increase in additional paid-in capital from P= 19.65 billion to P= 37.50 billion and brought the negative balance of treasury stock to P= 15.12 billion. Retained earnings at P= 45.51 billion ended lower by 8% or P= 3.98 billion as the net income attributable to equity holders of the Parent Company in 2019 of P= 1.70 billion was negated by the P= 4.21 billion cash dividends and distributions paid during the year and the P= 1.46 billion impact of PFRS 16 adoption. With the peso appreciation against the US dollar, the Company incurred currency translation loss on its investments in foreign subsidiaries and increased the negative balance of Equity reserves from P= 14.03 billion to P= 16.90 billion.
Cash Flows 2021 vs 2020
As of end-2021, cash and cash equivalents stood at P= 36.41 billion. Cash generated from internal operations of P= 28.45 billion and the issuance of Capital securities amounting to P= 26.23 billion were used to finance the increase in working capital requirements of P 30 billion, payment of interest and taxes amounting to P 8.96 billion, and settlement of maturing loans, dividends and distributions. During the year, the Company also spent P 9.89 billion for various capital projects at the refinery, service stations and terminals.
In Million Pesos December 31, 2021 December 31, 2020 Change
Operating (outflows) / inflows (10,668) 2,533 (13,201)
Investing outflows (9,759) (8,437) (1,322)
Financing inflows 28,098 318 27,780
2020 vs 2019
The Company ended 2020 with Cash and cash equivalents at P= 27.05 billion. The 21% reduction from previous year’s balance and the remaining cash generated from internal operations were used to finance the various capital expenditures at the refinery, service stations and terminals amounting to P= 8.44 billion. Funds from the net issuance of capital securities amounting to P= 11.30 were largely spent to pay the matured loans and dividends and distribution to stakeholders.
In Million Pesos December 31, 2020 December 31, 2019 Change
Operating inflows 2,533 25,362 (22,829)
Investing outflows (8,437) (20,467) 12,030
Financing inflows 318 13,116 (12,798)
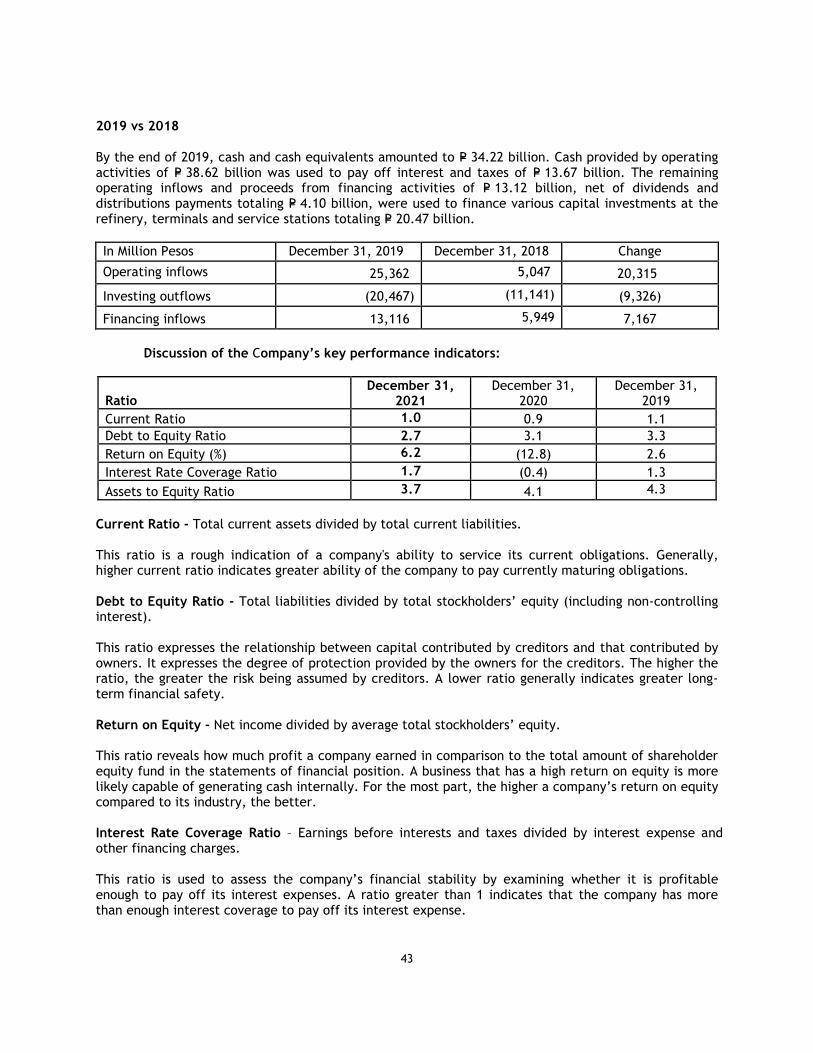
43
2019 vs 2018
By the end of 2019, cash and cash equivalents amounted to P= 34.22 billion. Cash provided by operating activities of P= 38.62 billion was used to pay off interest and taxes of P= 13.67 billion. The remaining operating inflows and proceeds from financing activities of P= 13.12 billion, net of dividends and distributions payments totaling P= 4.10 billion, were used to finance various capital investments at the refinery, terminals and service stations totaling P= 20.47 billion.
In Million Pesos December 31, 2019 December 31, 2018 Change
Operating inflows 25,362 5,047 20,315
Investing outflows (20,467) (11,141) (9,326)
Financing inflows 13,116 5,949 7,167
Discussion of the Company’s key performance indicators:
Ratio December 31,
2021 December 31,
2020 December 31,
2019
Current Ratio 1.0 0.9 1.1
Debt to Equity Ratio 2.7 3.1 3.3
Return on Equity (%) 6.2 (12.8) 2.6
Interest Rate Coverage Ratio 1.7 (0.4) 1.3
Assets to Equity Ratio 3.7 4.1 4.3
Current Ratio - Total current assets divided by total current liabilities. This ratio is a rough indication of a company's ability to service its current obligations. Generally, higher current ratio indicates greater ability of the company to pay currently maturing obligations. Debt to Equity Ratio - Total liabilities divided by total stockholders’ equity (including non-controlling interest). This ratio expresses the relationship between capital contributed by creditors and that contributed by owners. It expresses the degree of protection provided by the owners for the creditors. The higher the ratio, the greater the risk being assumed by creditors. A lower ratio generally indicates greater long-term financial safety. Return on Equity - Net income divided by average total stockholders’ equity. This ratio reveals how much profit a company earned in comparison to the total amount of shareholder equity fund in the statements of financial position. A business that has a high return on equity is more likely capable of generating cash internally. For the most part, the higher a company’s return on equity compared to its industry, the better. Interest Rate Coverage Ratio – Earnings before interests and taxes divided by interest expense and other financing charges.
This ratio is used to assess the company’s financial stability by examining whether it is profitable enough to pay off its interest expenses. A ratio greater than 1 indicates that the company has more than enough interest coverage to pay off its interest expense.
44
Assets to Equity Ratio – Total assets divided by total equity (including non-controlling interest). This ratio is used as a measure of financial leverage and long-term solvency. The function of the ratio is to determine the value of the total assets of the company less any portion of the assets that are owned by the shareholders of the corporation.
[Rest of page intentionally left blank]
45
Philippine Economy The 2021 Philippine economy posted a growth of 5.6%, a rebound from last year’s 9.6% slump. The rebound was attributed to the reopening of the economy with accelerated vaccination. Although new variants continued to pose risks to the economy, demand continued to improve as daily Covid-19 cases declined leading to easing of movement restrictions and increased operational capacities for various businesses and establishments. The resumption of construction, growth of remittances of overseas Filipino workers, and increased trade with global recovery also supported growth.
The peso strengthened by 0.72% to average Php49.28/$ in 2021, from P49.64/$ in 2020. Strength in the Philippine peso was due to BSP’s all-time low interest rates, balance-of-payments surplus, and rising international reserves. Inflation averaged 4.5% in 2021, much higher than the 2.6% in 2020. Continuous increase in electricity rates, prices of key food items, and global crude prices, aggravated by the prolonged pandemic, pushed up inflation. Oil Market Oil demand1 in the country grew by 10.9% to 70,505 thousand barrels (“MB”) in the first half 2021 from 63,563 MB in the first half of 2020. Growth in demand was mainly due to the transition to less stringent travel restrictions implemented nationwide during the first half of 2021, resulting to increased economic activity. Crude price benchmark, Dubai, averaged $69.2 per barrel (“/bbl”) in 2021, much higher than the 2020 average of $42.2/bbl due to continued managed production increases by OPEC+ amid higher crude demand. Recorded improvement in gasoline and kero-jet cracks is due to an improvement in demand arising from increased mobility with the wider vaccine roll-out. Diesel cracks remained weak due to relatively low demand and ample stocks.
Any event that will trigger direct or contingent financial obligation that is material to the company, including any default or acceleration of an obligation. Guimaras Oil Spill Incident On August 11, 2006, MT Solar I, a third party vessel contracted by the Company to transport approximately two million liters of industrial fuel oil, sank 13 nautical miles southwest of Guimaras, an island province in the Western Visayas region of the Philippines. In separate investigations by the Department of Justice (“DOJ”) and the Special Board of Marine Inquiry (“SBMI”), both agencies found the owners of MT Solar I liable. The DOJ found the Company not criminally liable, but the SBMI found the Company to have overloaded the vessel. The Company has appealed the findings of the SBMI to the DOTr (then DOTC) and is awaiting its resolution. The Company believes that SBMI can impose administrative penalties on vessel owners and crew, but has no authority to penalize other parties, such as the Company, which are charterers. Other complaints for non-payment of compensation for the clean-up operations during the oil spill were filed by a total of 1,063 plaintiffs who allegedly did not receive any payment of their claims for damages arising from the oil spill. The total claims for both cases amount to P292 million. The cases were still pending as of December 31, 2021.
1 Information as of the first half of 2021; only includes gasoline, kerosene, aviation turbo, diesel, industrial fuel and liquified petroleum gas (“LPG”) and does not include direct imports by end-users of naphtha, condensate, aviation turbo, LPG, diesel, asphalt, and petcoke
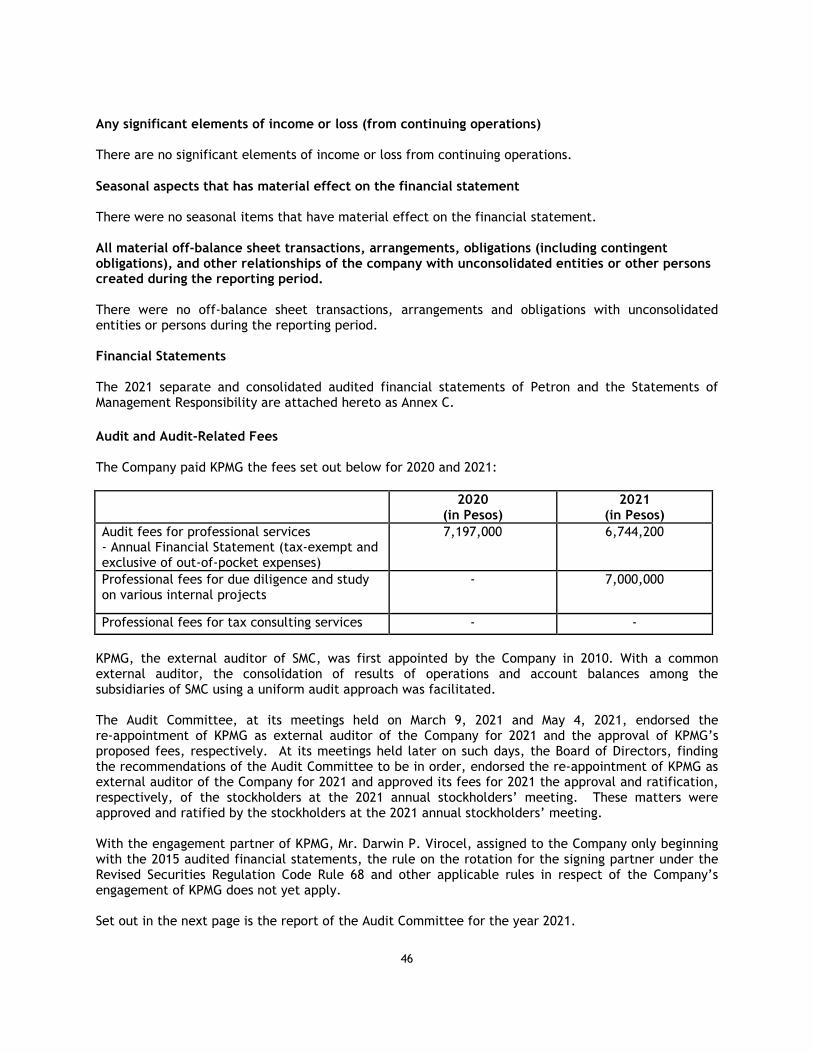
46
Any significant elements of income or loss (from continuing operations) There are no significant elements of income or loss from continuing operations.
Seasonal aspects that has material effect on the financial statement There were no seasonal items that have material effect on the financial statement. All material off-balance sheet transactions, arrangements, obligations (including contingent obligations), and other relationships of the company with unconsolidated entities or other persons created during the reporting period. There were no off-balance sheet transactions, arrangements and obligations with unconsolidated entities or persons during the reporting period. Financial Statements The 2021 separate and consolidated audited financial statements of Petron and the Statements of Management Responsibility are attached hereto as Annex C.
Audit and Audit-Related Fees The Company paid KPMG the fees set out below for 2020 and 2021:
2020
(in Pesos) 2021
(in Pesos)
Audit fees for professional services - Annual Financial Statement (tax-exempt and exclusive of out-of-pocket expenses)
7,197,000 6,744,200
Professional fees for due diligence and study on various internal projects
- 7,000,000
Professional fees for tax consulting services - -
KPMG, the external auditor of SMC, was first appointed by the Company in 2010. With a common external auditor, the consolidation of results of operations and account balances among the subsidiaries of SMC using a uniform audit approach was facilitated. The Audit Committee, at its meetings held on March 9, 2021 and May 4, 2021, endorsed the re-appointment of KPMG as external auditor of the Company for 2021 and the approval of KPMG’s proposed fees, respectively. At its meetings held later on such days, the Board of Directors, finding the recommendations of the Audit Committee to be in order, endorsed the re-appointment of KPMG as external auditor of the Company for 2021 and approved its fees for 2021 the approval and ratification, respectively, of the stockholders at the 2021 annual stockholders’ meeting. These matters were approved and ratified by the stockholders at the 2021 annual stockholders’ meeting. With the engagement partner of KPMG, Mr. Darwin P. Virocel, assigned to the Company only beginning with the 2015 audited financial statements, the rule on the rotation for the signing partner under the Revised Securities Regulation Code Rule 68 and other applicable rules in respect of the Company’s engagement of KPMG does not yet apply. Set out in the next page is the report of the Audit Committee for the year 2021.
47
48
Commitments for Capital Expenditure
In 2021, the Company spent P7.71 billion in capital investments, majority of which was spent for Petron Bataan Refinery-related projects, including those that were incurred for the Refinery Solid Fuel Fired Boilers (“RSFFFB”) Phase 3, amounting to P6.74 billion. In addition, expenditures incurred for projects in depots amounted to P468 million, service-station related expenditures totaled P417 million and P80 million for other commercial, maintenance and miscellaneous projects. In 2020, Petron spent P4.4 billion in capital projects, P3.1 billion of which were spent for Petron Bataan Refinery-related projects, including the expenditures for RSFFB Phase 3 amounting to P2.2 billion. In addition, plant and other depot projects totaled P646 million, P419 million for service station-related expenditures, and P272 million for other commercial, maintenance and miscellaneous projects. Trends, Events or Uncertainties with Material Impact on Liquidity and Net Sales or Revenues or Income The Company is in a healthy liquidity position with ample cash balances, and strong support from domestic and international banks for its working capital lines. The Company is not in default or breach of any loans or other financing arrangements, does not anticipate any cash flow or liquidity problems, and does not have a significant amount of trade payables that has not been paid within agreed trade terms. The expected increase in working capital requirements stemming from currently elevated oil prices is sufficiently addressed by the Company’s healthy cash balances, available credit lines from financial institutions, and continuous and prudent management of the Company’s cash position. Crude oil accounts for more than 30% of the Company’s total cost of goods sold. Because of the commodity nature of oil, the cost of the Company’s refined products is highly dependent on international crude oil and product prices. Fluctuations in the price of crude oil and finished products in the global market arise from factors that are beyond the Company’s control, such as changes in global oil supply and demand The Company’s financial results are primarily affected by the differential or margin between the prices for its refined petroleum products and the prices for the crude oil that is the main raw material for these refined petroleum products., geopolitical factors (such as the current Russia-Ukraine conflict), global economic conditions, weather, and government regulations. The Company holds approximately two months of crude oil and finished petroleum products inventory in the Philippines, which is accounted for using the first in-first-out method. Thus, a sharp drop in crude oil prices, for example, will result in losses, as the Company sells products produced from higher-priced crude oil, at lower prices. Changes in and Disagreements with Accountants on Accounting and Financial Disclosure There were no changes in and disagreements with accountants on accounting and financial disclosures.
[Rest of page intentionally left blank; “Part IV - Management and Certain Security Holders” follows on next page]
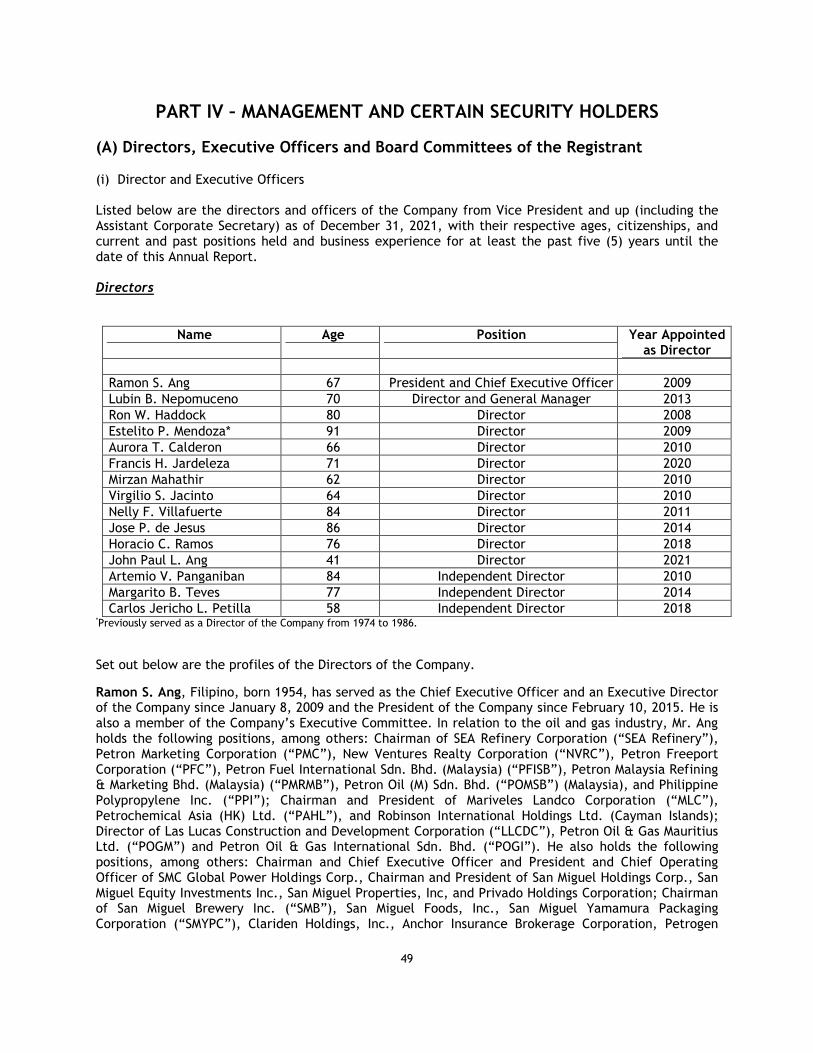
49
PART IV – MANAGEMENT AND CERTAIN SECURITY HOLDERS
(A) Directors, Executive Officers and Board Committees of the Registrant (i) Director and Executive Officers Listed below are the directors and officers of the Company from Vice President and up (including the Assistant Corporate Secretary) as of December 31, 2021, with their respective ages, citizenships, and current and past positions held and business experience for at least the past five (5) years until the date of this Annual Report. Directors
Name Age Position Year Appointed as Director
Ramon S. Ang 67 President and Chief Executive Officer 2009
Lubin B. Nepomuceno 70 Director and General Manager 2013
Ron W. Haddock 80 Director 2008
Estelito P. Mendoza* 91 Director 2009
Aurora T. Calderon 66 Director 2010
Francis H. Jardeleza 71 Director 2020
Mirzan Mahathir 62 Director 2010
Virgilio S. Jacinto 64 Director 2010
Nelly F. Villafuerte 84 Director 2011
Jose P. de Jesus 86 Director 2014
Horacio C. Ramos 76 Director 2018
John Paul L. Ang 41 Director 2021
Artemio V. Panganiban 84 Independent Director 2010
Margarito B. Teves 77 Independent Director 2014
Carlos Jericho L. Petilla 58 Independent Director 2018 *Previously served as a Director of the Company from 1974 to 1986.
Set out below are the profiles of the Directors of the Company.
Ramon S. Ang, Filipino, born 1954, has served as the Chief Executive Officer and an Executive Director of the Company since January 8, 2009 and the President of the Company since February 10, 2015. He is also a member of the Company’s Executive Committee. In relation to the oil and gas industry, Mr. Ang holds the following positions, among others: Chairman of SEA Refinery Corporation (“SEA Refinery”), Petron Marketing Corporation (“PMC”), New Ventures Realty Corporation (“NVRC”), Petron Freeport Corporation (“PFC”), Petron Fuel International Sdn. Bhd. (Malaysia) (“PFISB”), Petron Malaysia Refining & Marketing Bhd. (Malaysia) (“PMRMB”), Petron Oil (M) Sdn. Bhd. (“POMSB”) (Malaysia), and Philippine Polypropylene Inc. (“PPI”); Chairman and President of Mariveles Landco Corporation (“MLC”), Petrochemical Asia (HK) Ltd. (“PAHL”), and Robinson International Holdings Ltd. (Cayman Islands); Director of Las Lucas Construction and Development Corporation (“LLCDC”), Petron Oil & Gas Mauritius Ltd. (“POGM”) and Petron Oil & Gas International Sdn. Bhd. (“POGI”). He also holds the following positions, among others: Chairman and Chief Executive Officer and President and Chief Operating Officer of SMC Global Power Holdings Corp., Chairman and President of San Miguel Holdings Corp., San Miguel Equity Investments Inc., San Miguel Properties, Inc, and Privado Holdings Corporation; Chairman of San Miguel Brewery Inc. (“SMB”), San Miguel Foods, Inc., San Miguel Yamamura Packaging Corporation (“SMYPC”), Clariden Holdings, Inc., Anchor Insurance Brokerage Corporation, Petrogen
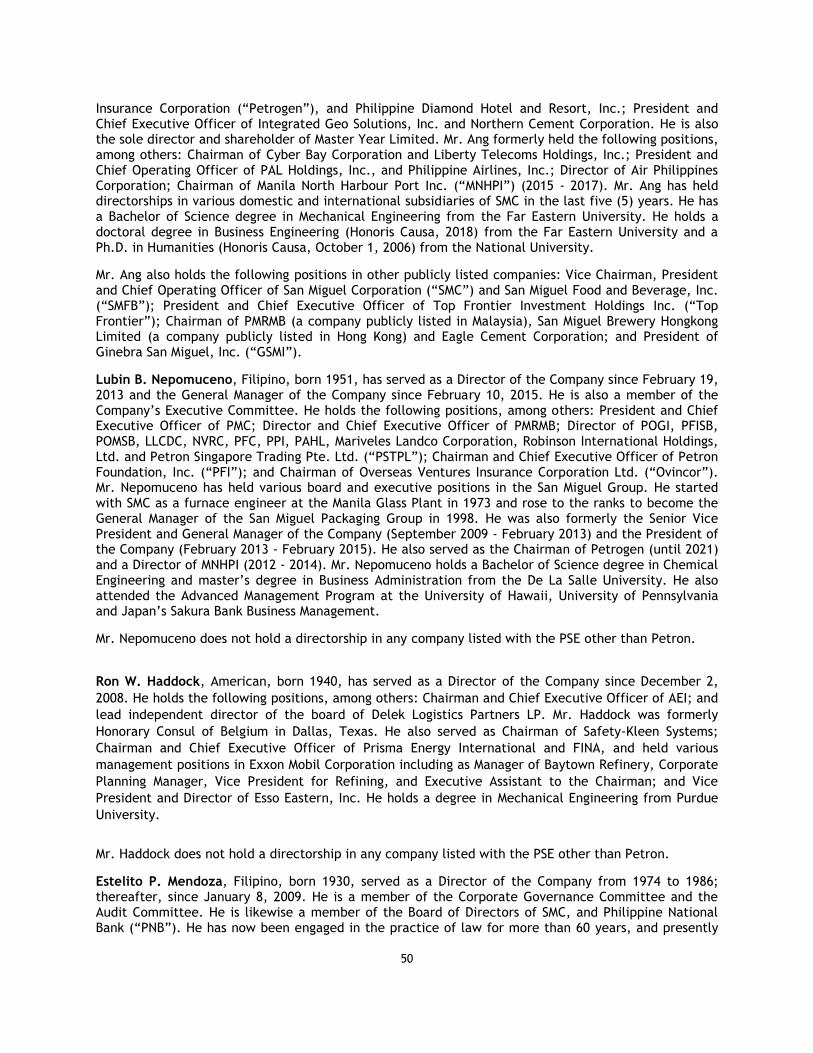
50
Insurance Corporation (“Petrogen”), and Philippine Diamond Hotel and Resort, Inc.; President and Chief Executive Officer of Integrated Geo Solutions, Inc. and Northern Cement Corporation. He is also the sole director and shareholder of Master Year Limited. Mr. Ang formerly held the following positions, among others: Chairman of Cyber Bay Corporation and Liberty Telecoms Holdings, Inc.; President and Chief Operating Officer of PAL Holdings, Inc., and Philippine Airlines, Inc.; Director of Air Philippines Corporation; Chairman of Manila North Harbour Port Inc. (“MNHPI”) (2015 - 2017). Mr. Ang has held directorships in various domestic and international subsidiaries of SMC in the last five (5) years. He has a Bachelor of Science degree in Mechanical Engineering from the Far Eastern University. He holds a doctoral degree in Business Engineering (Honoris Causa, 2018) from the Far Eastern University and a Ph.D. in Humanities (Honoris Causa, October 1, 2006) from the National University.
Mr. Ang also holds the following positions in other publicly listed companies: Vice Chairman, President and Chief Operating Officer of San Miguel Corporation (“SMC”) and San Miguel Food and Beverage, Inc. (“SMFB”); President and Chief Executive Officer of Top Frontier Investment Holdings Inc. (“Top Frontier”); Chairman of PMRMB (a company publicly listed in Malaysia), San Miguel Brewery Hongkong Limited (a company publicly listed in Hong Kong) and Eagle Cement Corporation; and President of Ginebra San Miguel, Inc. (“GSMI”).
Lubin B. Nepomuceno, Filipino, born 1951, has served as a Director of the Company since February 19, 2013 and the General Manager of the Company since February 10, 2015. He is also a member of the Company’s Executive Committee. He holds the following positions, among others: President and Chief Executive Officer of PMC; Director and Chief Executive Officer of PMRMB; Director of POGI, PFISB, POMSB, LLCDC, NVRC, PFC, PPI, PAHL, Mariveles Landco Corporation, Robinson International Holdings, Ltd. and Petron Singapore Trading Pte. Ltd. (“PSTPL”); Chairman and Chief Executive Officer of Petron Foundation, Inc. (“PFI”); and Chairman of Overseas Ventures Insurance Corporation Ltd. (“Ovincor”). Mr. Nepomuceno has held various board and executive positions in the San Miguel Group. He started with SMC as a furnace engineer at the Manila Glass Plant in 1973 and rose to the ranks to become the General Manager of the San Miguel Packaging Group in 1998. He was also formerly the Senior Vice President and General Manager of the Company (September 2009 - February 2013) and the President of the Company (February 2013 - February 2015). He also served as the Chairman of Petrogen (until 2021) and a Director of MNHPI (2012 - 2014). Mr. Nepomuceno holds a Bachelor of Science degree in Chemical Engineering and master’s degree in Business Administration from the De La Salle University. He also attended the Advanced Management Program at the University of Hawaii, University of Pennsylvania and Japan’s Sakura Bank Business Management.
Mr. Nepomuceno does not hold a directorship in any company listed with the PSE other than Petron.
Ron W. Haddock, American, born 1940, has served as a Director of the Company since December 2,
2008. He holds the following positions, among others: Chairman and Chief Executive Officer of AEI; and
lead independent director of the board of Delek Logistics Partners LP. Mr. Haddock was formerly
Honorary Consul of Belgium in Dallas, Texas. He also served as Chairman of Safety-Kleen Systems;
Chairman and Chief Executive Officer of Prisma Energy International and FINA, and held various
management positions in Exxon Mobil Corporation including as Manager of Baytown Refinery, Corporate
Planning Manager, Vice President for Refining, and Executive Assistant to the Chairman; and Vice
President and Director of Esso Eastern, Inc. He holds a degree in Mechanical Engineering from Purdue
University.
Mr. Haddock does not hold a directorship in any company listed with the PSE other than Petron.
Estelito P. Mendoza, Filipino, born 1930, served as a Director of the Company from 1974 to 1986; thereafter, since January 8, 2009. He is a member of the Corporate Governance Committee and the Audit Committee. He is likewise a member of the Board of Directors of SMC, and Philippine National Bank (“PNB”). He has now been engaged in the practice of law for more than 60 years, and presently
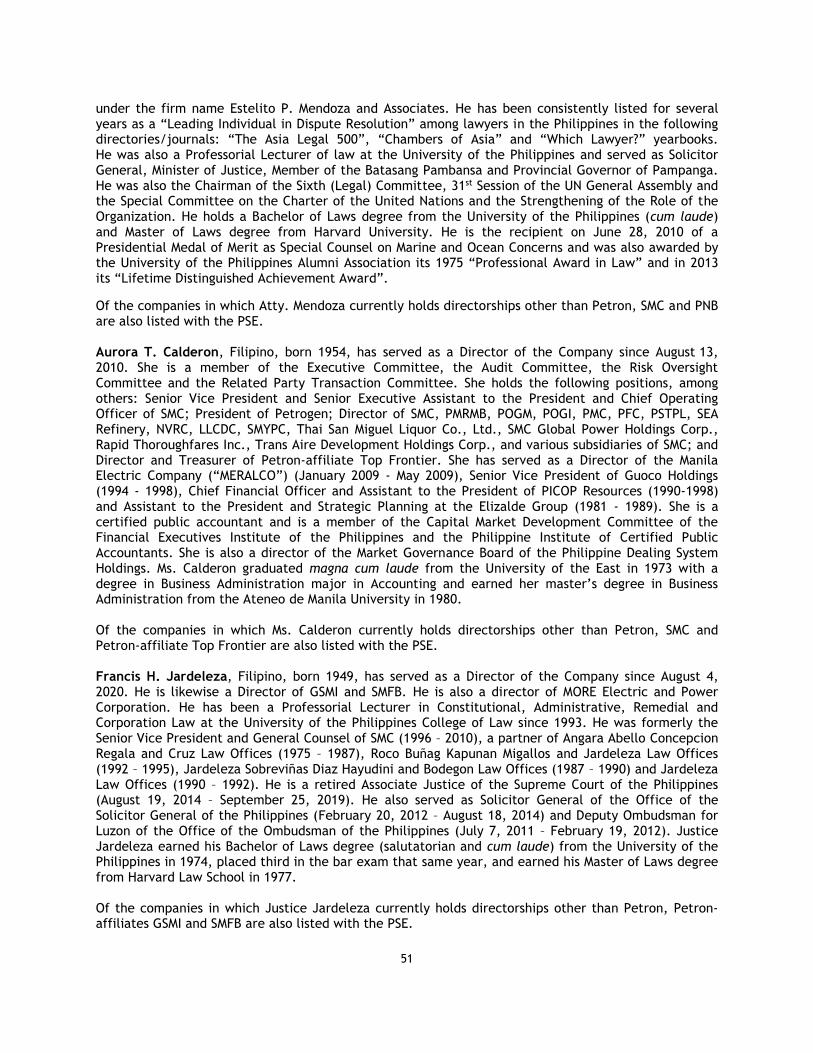
51
under the firm name Estelito P. Mendoza and Associates. He has been consistently listed for several years as a “Leading Individual in Dispute Resolution” among lawyers in the Philippines in the following directories/journals: “The Asia Legal 500”, “Chambers of Asia” and “Which Lawyer?” yearbooks. He was also a Professorial Lecturer of law at the University of the Philippines and served as Solicitor General, Minister of Justice, Member of the Batasang Pambansa and Provincial Governor of Pampanga. He was also the Chairman of the Sixth (Legal) Committee, 31st Session of the UN General Assembly and the Special Committee on the Charter of the United Nations and the Strengthening of the Role of the Organization. He holds a Bachelor of Laws degree from the University of the Philippines (cum laude) and Master of Laws degree from Harvard University. He is the recipient on June 28, 2010 of a Presidential Medal of Merit as Special Counsel on Marine and Ocean Concerns and was also awarded by the University of the Philippines Alumni Association its 1975 “Professional Award in Law” and in 2013 its “Lifetime Distinguished Achievement Award”.
Of the companies in which Atty. Mendoza currently holds directorships other than Petron, SMC and PNB are also listed with the PSE. Aurora T. Calderon, Filipino, born 1954, has served as a Director of the Company since August 13, 2010. She is a member of the Executive Committee, the Audit Committee, the Risk Oversight Committee and the Related Party Transaction Committee. She holds the following positions, among others: Senior Vice President and Senior Executive Assistant to the President and Chief Operating Officer of SMC; President of Petrogen; Director of SMC, PMRMB, POGM, POGI, PMC, PFC, PSTPL, SEA Refinery, NVRC, LLCDC, SMYPC, Thai San Miguel Liquor Co., Ltd., SMC Global Power Holdings Corp., Rapid Thoroughfares Inc., Trans Aire Development Holdings Corp., and various subsidiaries of SMC; and Director and Treasurer of Petron-affiliate Top Frontier. She has served as a Director of the Manila Electric Company (“MERALCO”) (January 2009 - May 2009), Senior Vice President of Guoco Holdings (1994 - 1998), Chief Financial Officer and Assistant to the President of PICOP Resources (1990-1998) and Assistant to the President and Strategic Planning at the Elizalde Group (1981 - 1989). She is a certified public accountant and is a member of the Capital Market Development Committee of the Financial Executives Institute of the Philippines and the Philippine Institute of Certified Public Accountants. She is also a director of the Market Governance Board of the Philippine Dealing System Holdings. Ms. Calderon graduated magna cum laude from the University of the East in 1973 with a degree in Business Administration major in Accounting and earned her master’s degree in Business Administration from the Ateneo de Manila University in 1980. Of the companies in which Ms. Calderon currently holds directorships other than Petron, SMC and Petron-affiliate Top Frontier are also listed with the PSE. Francis H. Jardeleza, Filipino, born 1949, has served as a Director of the Company since August 4, 2020. He is likewise a Director of GSMI and SMFB. He is also a director of MORE Electric and Power Corporation. He has been a Professorial Lecturer in Constitutional, Administrative, Remedial and Corporation Law at the University of the Philippines College of Law since 1993. He was formerly the Senior Vice President and General Counsel of SMC (1996 – 2010), a partner of Angara Abello Concepcion Regala and Cruz Law Offices (1975 – 1987), Roco Buñag Kapunan Migallos and Jardeleza Law Offices (1992 – 1995), Jardeleza Sobreviñas Diaz Hayudini and Bodegon Law Offices (1987 – 1990) and Jardeleza Law Offices (1990 – 1992). He is a retired Associate Justice of the Supreme Court of the Philippines (August 19, 2014 – September 25, 2019). He also served as Solicitor General of the Office of the Solicitor General of the Philippines (February 20, 2012 – August 18, 2014) and Deputy Ombudsman for Luzon of the Office of the Ombudsman of the Philippines (July 7, 2011 – February 19, 2012). Justice Jardeleza earned his Bachelor of Laws degree (salutatorian and cum laude) from the University of the Philippines in 1974, placed third in the bar exam that same year, and earned his Master of Laws degree from Harvard Law School in 1977. Of the companies in which Justice Jardeleza currently holds directorships other than Petron, Petron-affiliates GSMI and SMFB are also listed with the PSE.
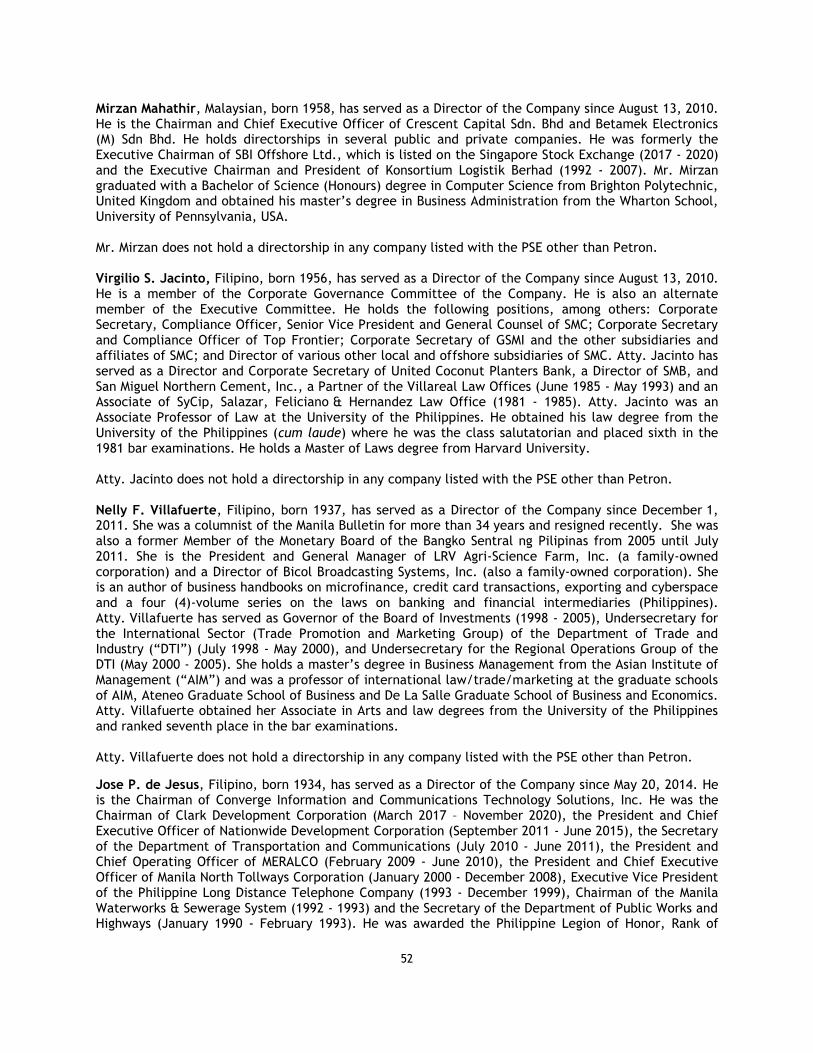
52
Mirzan Mahathir, Malaysian, born 1958, has served as a Director of the Company since August 13, 2010. He is the Chairman and Chief Executive Officer of Crescent Capital Sdn. Bhd and Betamek Electronics (M) Sdn Bhd. He holds directorships in several public and private companies. He was formerly the Executive Chairman of SBI Offshore Ltd., which is listed on the Singapore Stock Exchange (2017 - 2020) and the Executive Chairman and President of Konsortium Logistik Berhad (1992 - 2007). Mr. Mirzan graduated with a Bachelor of Science (Honours) degree in Computer Science from Brighton Polytechnic, United Kingdom and obtained his master’s degree in Business Administration from the Wharton School, University of Pennsylvania, USA. Mr. Mirzan does not hold a directorship in any company listed with the PSE other than Petron. Virgilio S. Jacinto, Filipino, born 1956, has served as a Director of the Company since August 13, 2010. He is a member of the Corporate Governance Committee of the Company. He is also an alternate member of the Executive Committee. He holds the following positions, among others: Corporate Secretary, Compliance Officer, Senior Vice President and General Counsel of SMC; Corporate Secretary and Compliance Officer of Top Frontier; Corporate Secretary of GSMI and the other subsidiaries and affiliates of SMC; and Director of various other local and offshore subsidiaries of SMC. Atty. Jacinto has served as a Director and Corporate Secretary of United Coconut Planters Bank, a Director of SMB, and San Miguel Northern Cement, Inc., a Partner of the Villareal Law Offices (June 1985 - May 1993) and an Associate of SyCip, Salazar, Feliciano & Hernandez Law Office (1981 - 1985). Atty. Jacinto was an Associate Professor of Law at the University of the Philippines. He obtained his law degree from the University of the Philippines (cum laude) where he was the class salutatorian and placed sixth in the 1981 bar examinations. He holds a Master of Laws degree from Harvard University. Atty. Jacinto does not hold a directorship in any company listed with the PSE other than Petron. Nelly F. Villafuerte, Filipino, born 1937, has served as a Director of the Company since December 1, 2011. She was a columnist of the Manila Bulletin for more than 34 years and resigned recently. She was also a former Member of the Monetary Board of the Bangko Sentral ng Pilipinas from 2005 until July 2011. She is the President and General Manager of LRV Agri-Science Farm, Inc. (a family-owned corporation) and a Director of Bicol Broadcasting Systems, Inc. (also a family-owned corporation). She is an author of business handbooks on microfinance, credit card transactions, exporting and cyberspace and a four (4)-volume series on the laws on banking and financial intermediaries (Philippines). Atty. Villafuerte has served as Governor of the Board of Investments (1998 - 2005), Undersecretary for the International Sector (Trade Promotion and Marketing Group) of the Department of Trade and Industry (“DTI”) (July 1998 - May 2000), and Undersecretary for the Regional Operations Group of the DTI (May 2000 - 2005). She holds a master’s degree in Business Management from the Asian Institute of Management (“AIM”) and was a professor of international law/trade/marketing at the graduate schools of AIM, Ateneo Graduate School of Business and De La Salle Graduate School of Business and Economics. Atty. Villafuerte obtained her Associate in Arts and law degrees from the University of the Philippines and ranked seventh place in the bar examinations. Atty. Villafuerte does not hold a directorship in any company listed with the PSE other than Petron.
Jose P. de Jesus, Filipino, born 1934, has served as a Director of the Company since May 20, 2014. He is the Chairman of Converge Information and Communications Technology Solutions, Inc. He was the Chairman of Clark Development Corporation (March 2017 – November 2020), the President and Chief Executive Officer of Nationwide Development Corporation (September 2011 - June 2015), the Secretary of the Department of Transportation and Communications (July 2010 - June 2011), the President and Chief Operating Officer of MERALCO (February 2009 - June 2010), the President and Chief Executive Officer of Manila North Tollways Corporation (January 2000 - December 2008), Executive Vice President of the Philippine Long Distance Telephone Company (1993 - December 1999), Chairman of the Manila Waterworks & Sewerage System (1992 - 1993) and the Secretary of the Department of Public Works and Highways (January 1990 - February 1993). He was awarded the Philippine Legion of Honor, Rank of
53
Commander in June 1992 by then President Corazon C. Aquino. He was Lux in Domino Awardee (Most Outstanding Alumnus) of the Ateneo de Manila University in July 2012. He is also a Director of SMC Skyway Corporation, SMC TPLEX Corporation, and SMC SLEX, Inc. He is a Trustee of Automotive Association of the Philippines, Kapampangan Development Foundation and Holy Angel University. Mr. de Jesus earned his Bachelor of Arts degree in Economics and holds a Master of Arts in Social Psychology from the Ateneo de Manila University. He also finished Graduate Studies in Human Development from the University of Chicago.
Of the companies in which Mr. de Jesus currently holds directorships, Converge Information and Communications Technology Solutions, Inc. is also listed with the PSE. Horacio C. Ramos, Filipino, born 1945, has served as a Director of the Company since May 2018. He is also the President of Clariden Holdings, Inc. (2012 - present). He was previously a Director of SMC (2014 to 2016), the Secretary of the Department of Environment and Natural Resources (February 12 - June 30, 2010), and the Director of Mines and Geosciences Bureau (June 1996 - February 2010). Mr. Ramos has a Bachelor of Science degree in Mining Engineering from the Mapua Institute of Technology obtained in 1967, and has a Graduate Diploma in Mining and Mineral Engineering from the University of New South Wales, Australia in 1976, and a Master of Engineering in Mining Engineering also from the University of New South Wales, Australia in 1978.
Mr. Ramos does not hold a directorship in any company listed with the PSE other than Petron. John Paul L. Ang, Filipino, born 1980, was elected as a Director of the Company on March 9, 2021. He has been a director of SMC since January 21, 2021, SMC Global Power Holdings Corp. since June 1, 2021, SMFB since June 2, 2021 and Top Frontier since July 9, 2021. He holds and has held various positions in Eagle Cement Corporation, such as the President and Chief Executive Officer since 2008, a Director since 2010, a member of the Audit Committee since 2020 and the Chairman of the Executive Committee since February 2017. He also served as a member of the Nomination and Remuneration Committee (February 13, 2017 – July 15, 2020) and the General Manager and Chief Operating Officer (2008 – 2016). He has been the President and Chief Executive Officer of South Western Cement Corporation since 2017 and a Director of KB Space Holdings, Inc. since 2016. He was the Managing Director of Sarawak Clinker Sdn. Bhd. Malaysia (2002 – 2008) and the Purchasing Officer of Basic Cement (2002 – 2003). Mr. Ang has a Bachelor of Arts in Interdisciplinary Studies from the Ateneo de Manila University.
Of the companies in which Mr. Ang currently holds directorships, parent companies Top Frontier and SMC, Petron affiliate SMFB, and Eagle Cement Corporation are also listed with the PSE.
Artemio V. Panganiban, Filipino, born 1936, has served as an Independent Director of the Company since October 21, 2010. He is the Chairman of the Related Party Transaction Committee and a member of the Audit and Corporate Governance Committees. He is a columnist of the Philippine Daily Inquirer, and an officer, adviser or consultant to several other business, civic, educational and religious organizations. He was the Chief Justice of the Supreme Court of the Philippines in 2005 - 2006; Associate Justice of the Supreme Court (1995 - 2005); Chairperson of the Philippine House of Representatives Electoral Tribunal (2004 - 2005); Senior Partner of Panganiban Benitez Parlade Africa & Barinaga Law Office (1963-1995); President of Baron Travel Corporation (1967 - 1993); and professor at the Far Eastern University, Assumption College and San Sebastian College (1961 - 1970). He authored over a dozen books and received various awards for his numerous accomplishments, most notably the “Renaissance Jurist of the 21st Century” conferred by the Supreme Court in 2006 and the “Outstanding Manilan” for 1991 by the City of Manila. Chief Justice Panganiban earned his Bachelor of Laws degree (cum laude) from the Far Eastern University in 1960, placed sixth in the bar exam that same year, and holds honorary doctoral degrees in law from several universities.
54
Apart from Petron, Chief Justice Panganiban is an Independent Director of the following listed companies: MERALCO, JG Summit Holdings, Inc., Philippine Long Distance Telephone Co., Metro Pacific Investment Corp., RL Commercial REIT, Inc., GMA Network, Inc., GMA Holdings, Inc., and Asian Terminals, Inc. and is a non-executive Director of Jollibee Foods Corporation.
Margarito B. Teves, Filipino, born 1943, has served as an Independent Director of the Company since May 20, 2014 and currently sits as the Lead Independent Director of the Company. He is the Chairman of the Audit Committee and is a member of the Corporate Governance, the Related Party Transaction, and the Risk Oversight Committees of the Company. He is also an Independent Director of SMC and Atok Big Wedge Corporation, as well as Alphaland Corporation, Alphaland Balesin Island Club, Inc., and Atlantic Atrium Investments Philippines Corporation. He is also the Managing Director of The Wallace Business Forum. He was the Secretary of the Department of Finance of the Philippine government (2005 - 2010), and was previously the President and Chief Executive Officer of the Land Bank of the Philippines (2000 - 2005), among others. He was awarded as “2009 Finance Minister of Year/Asia” by the London-based The Banker Magazine. He holds a Master of Arts degree in Development Economics from the Center for Development Economics, Williams College, Massachusetts and is a graduate of the City of London College, with a degree of Higher National Diploma in Business Studies which is equivalent to a Bachelor of Science in Business Economics.
Of the companies in which Mr. Teves currently holds directorships other than Petron, SMC and Atok are also listed with the PSE. Carlos Jericho L. Petilla, Filipino, born 1963, has served as an Independent Director of the Company since May 15, 2018. He is the Chairman of the Risk Oversight and Corporate Governance Committees and is a member of the Audit Committee of the Company. He is the founder in 2001, and President and Chief Executive Officer of International Data Conversion Solutions, Inc. (2015 - present; 2001 - 2004); President and Chief Executive Officer of Freight Process Outsourcing, Inc. (2015 - present), and a co-founder in 1989 and a Director of DDC Group of Companies (2015 - present; 1989 - 2004). He was previously the Secretary of the Department of Energy (2012 - 2015). Provincial Governor of the Province of Leyte (2004 – 2012) and Independent Director of MRC Allied, Inc. (2017 - 2018). Mr. Petilla has a Bachelor of Science degree in Management Engineering from the Ateneo De Manila University.
Mr. Petilla does not hold a directorship in any company listed with the PSE other than the Company.
Board Attendance and Trainings/Corporate Governance Seminars in 2021 The schedule of the meetings for any given year is presented to the directors the year before. The Board of Directors was therefore advised of the schedule of the board meetings for 2021 at the board meeting held on November 9, 2021. Similarly for 2021, the schedules of the meetings for this year was approved by the Board of Directors on November 3, 2020. Should any matter requiring immediate approval by the Board of Directors arise in between meetings, such matters are reviewed, considered and approved at meetings of the Executive Committee, subject to the Company’s by-laws. Special meetings of the Board of Directors may also be called when necessary in accordance with the Company’s by-laws. In keeping abreast of the latest best practices in corporate governance and complying with applicable legal requirements, including SEC Memorandum Circular No. 13 (Series of 2013), all the directors of the Company (including all its executive officers, the Assistant Corporate Secretary and the Internal Auditor) attended a corporate governance seminar in 2018 conducted by providers duly accredited by the SEC and conducted in accordance with SEC Memorandum Circular No. 20, Series of 2013.
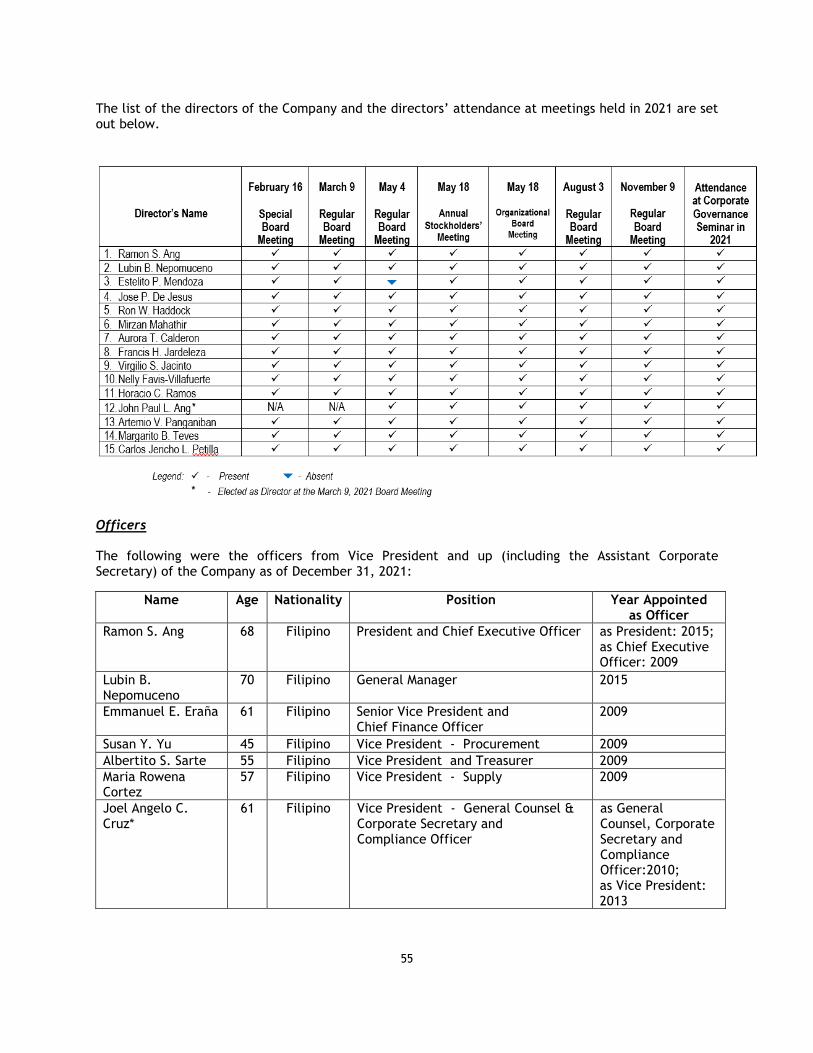
55
The list of the directors of the Company and the directors’ attendance at meetings held in 2021 are set out below.
Officers The following were the officers from Vice President and up (including the Assistant Corporate Secretary) of the Company as of December 31, 2021:
Name Age Nationality Position Year Appointed as Officer
Ramon S. Ang 68 Filipino President and Chief Executive Officer as President: 2015; as Chief Executive Officer: 2009
Lubin B. Nepomuceno
70 Filipino General Manager 2015
Emmanuel E. Eraña 61 Filipino Senior Vice President and Chief Finance Officer
2009
Susan Y. Yu 45 Filipino Vice President - Procurement 2009
Albertito S. Sarte 55 Filipino Vice President and Treasurer 2009
Maria Rowena Cortez
57 Filipino Vice President - Supply 2009
Joel Angelo C. Cruz*
61 Filipino Vice President - General Counsel & Corporate Secretary and Compliance Officer
as General Counsel, Corporate Secretary and Compliance Officer:2010; as Vice President: 2013
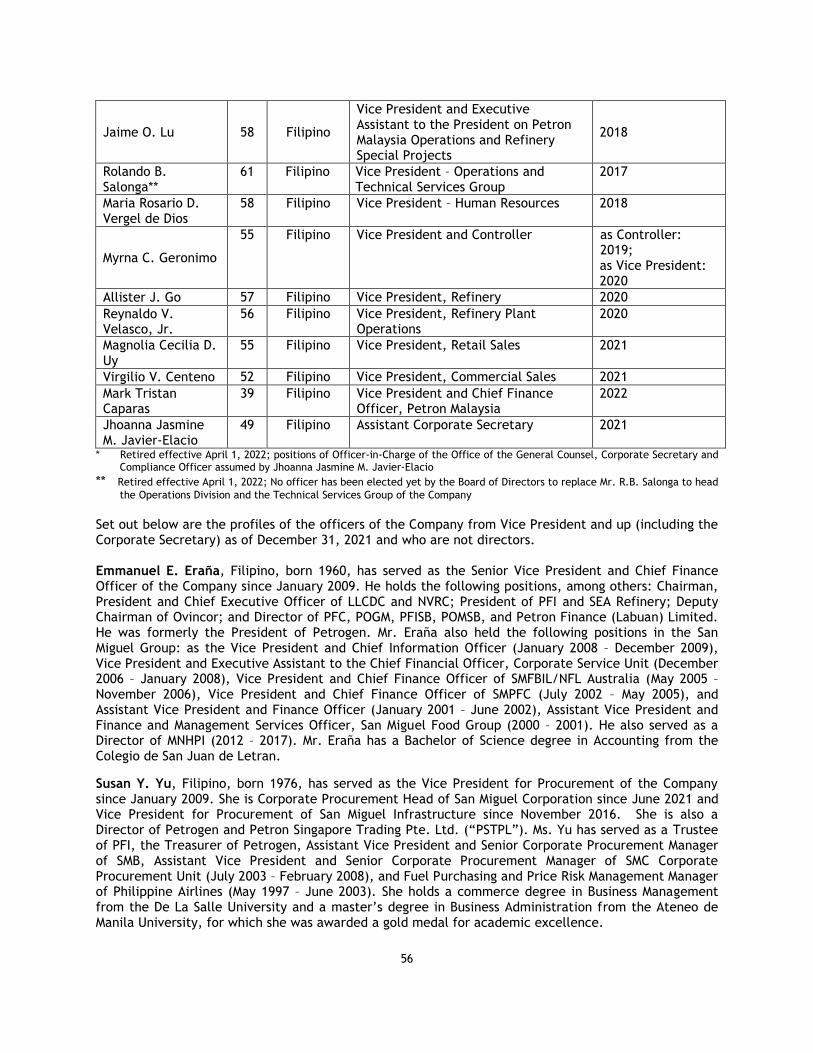
56
Jaime O. Lu 58 Filipino
Vice President and Executive Assistant to the President on Petron Malaysia Operations and Refinery Special Projects
2018
Rolando B. Salonga**
61 Filipino Vice President – Operations and Technical Services Group
2017
Maria Rosario D. Vergel de Dios
58 Filipino Vice President – Human Resources 2018
Myrna C. Geronimo
55 Filipino Vice President and Controller as Controller: 2019; as Vice President: 2020
Allister J. Go 57 Filipino Vice President, Refinery 2020
Reynaldo V. Velasco, Jr.
56 Filipino Vice President, Refinery Plant Operations
2020
Magnolia Cecilia D. Uy
55 Filipino Vice President, Retail Sales 2021
Virgilio V. Centeno 52 Filipino Vice President, Commercial Sales 2021
Mark Tristan Caparas
39 Filipino Vice President and Chief Finance Officer, Petron Malaysia
2022
Jhoanna Jasmine M. Javier-Elacio
49 Filipino Assistant Corporate Secretary 2021
* Retired effective April 1, 2022; positions of Officer-in-Charge of the Office of the General Counsel, Corporate Secretary and Compliance Officer assumed by Jhoanna Jasmine M. Javier-Elacio
** Retired effective April 1, 2022; No officer has been elected yet by the Board of Directors to replace Mr. R.B. Salonga to head
the Operations Division and the Technical Services Group of the Company
Set out below are the profiles of the officers of the Company from Vice President and up (including the Corporate Secretary) as of December 31, 2021 and who are not directors. Emmanuel E. Eraña, Filipino, born 1960, has served as the Senior Vice President and Chief Finance Officer of the Company since January 2009. He holds the following positions, among others: Chairman, President and Chief Executive Officer of LLCDC and NVRC; President of PFI and SEA Refinery; Deputy Chairman of Ovincor; and Director of PFC, POGM, PFISB, POMSB, and Petron Finance (Labuan) Limited. He was formerly the President of Petrogen. Mr. Eraña also held the following positions in the San Miguel Group: as the Vice President and Chief Information Officer (January 2008 – December 2009), Vice President and Executive Assistant to the Chief Financial Officer, Corporate Service Unit (December 2006 – January 2008), Vice President and Chief Finance Officer of SMFBIL/NFL Australia (May 2005 – November 2006), Vice President and Chief Finance Officer of SMPFC (July 2002 – May 2005), and Assistant Vice President and Finance Officer (January 2001 – June 2002), Assistant Vice President and Finance and Management Services Officer, San Miguel Food Group (2000 – 2001). He also served as a Director of MNHPI (2012 – 2017). Mr. Eraña has a Bachelor of Science degree in Accounting from the Colegio de San Juan de Letran.
Susan Y. Yu, Filipino, born 1976, has served as the Vice President for Procurement of the Company since January 2009. She is Corporate Procurement Head of San Miguel Corporation since June 2021 and Vice President for Procurement of San Miguel Infrastructure since November 2016. She is also a Director of Petrogen and Petron Singapore Trading Pte. Ltd. (“PSTPL”). Ms. Yu has served as a Trustee of PFI, the Treasurer of Petrogen, Assistant Vice President and Senior Corporate Procurement Manager of SMB, Assistant Vice President and Senior Corporate Procurement Manager of SMC Corporate Procurement Unit (July 2003 – February 2008), and Fuel Purchasing and Price Risk Management Manager of Philippine Airlines (May 1997 – June 2003). She holds a commerce degree in Business Management from the De La Salle University and a master’s degree in Business Administration from the Ateneo de Manila University, for which she was awarded a gold medal for academic excellence.
57
Albert S. Sarte, Filipino, born 1967, has served as the Treasurer of the Company since August 2009 and the Treasurer and Deputy Chief Finance Officer of the Company since May 4, 2021. He is also the Treasurer of most of the Company’s subsidiaries. Mr. Sarte served as Assistant Vice President for SMC International Treasury until June 2009. He graduated from the Ateneo de Manila University in 1987 with a Bachelor of Science degree in Business Management and has attended the Management Development Program of the AIM in 1995.
Maria Rowena O. Cortez, Filipino, born 1964, has served as the Vice President for Supply of the Company since November 2013, and concurrently the Executive Director for PSTPL since June 2013. She is also a Director of PAHL, Robinson International Holdings Ltd., and Mariveles Landco Corporation. The various positions she has held in the Company include Vice President for Supply & Operations (July 2010 – November 2013), Vice President for Supply (June 2009-June 2010) and various managerial and supervisory positions in the Marketing/Sales and Supply and Operations Divisions of Petron. Ms. Cortez also held various positions at the Phil. National Oil Company-Energy Research and Development Center from 1986 to 1993. She holds a Bachelor of Science degree in Industrial Engineering and a Master’s Degree in Business Administration both from the University of the Philippines, Diliman. She also took post graduate courses at the AIM, University of Oxford in Oxfordshire, UK and ExecOnline-Columbia University. She has attended local and foreign trainings and seminars on leadership, market research, supply chain, commodity risk management, petroleum, petrochemicals and energy oil trading.
Joel Angelo C. Cruz, Filipino, born 1961, served as the Vice President of the Office of the General Counsel of the Company from March 2013 and the Corporate Secretary and Compliance Officer of the Company from April 2010 until he retired on March 31, 2022. He held the following positions, among others: Corporate Secretary and Compliance Officer of Petrogen, Corporate Secretary of LLCDC, NVRC, PMC, and PFC; and Corporate Secretary of Petron Global Limited. Atty. Cruz was formerly the Assistant Vice President of the Office of the General Counsel, Assistant Corporate Secretary and Legal Counsel of the Company, and Assistant Corporate Secretary of all the Company’s subsidiaries. He also served as Assistant Corporate Secretary of MNHPI (2012 – 2017). He is a member of the Integrated Bar of the Philippines. Atty. Cruz holds a Bachelor of Arts degree in Economics from the University of the Philippines and a Bachelor of Laws degree from San Beda College. He attended the Basic Management Program of the AIM in 1997 as well as numerous local and foreign training and seminars.
Jaime O. Lu, Filipino, born 1963, has served as the Company’s Vice President and Executive Assistant to the President on Petron Malaysia Operations and Special Projects since November 2018. He is also a director of PLI, PFISB and POMSB. Mr. Lu was formerly the Company’s Vice President – Operations Manager for Petron Malaysia (April 2012 – October 2018), the Operations Manager of PMRMB (April 2012 – October 2018) and the General Manager of PPI (January 2011 – February 2012). He holds a Bachelor of Science Degree in Chemical Engineering from the Pamantasan ng Lungsod ng Maynila and a master’s degree in Business Administration from the Ateneo de Manila University.
Rolando B. Salonga, Filipino, born 1961, served as Vice President for Operations and Corporate Technical Services Group from May 1, 2017 until he retired on March 31, 2022. Previous positions he held include Vice President for Terminal Operations (November 16, 2016-April 30, 2017), Assistant Vice President for Operations (September 2015 – November 2016), Officer-in-Charge-Operations (March 2015 – August 2015), Supply and Distribution Head of Petron Malaysia (April 2012 – February 2015), Functional Team Lead-Distribution, Project Rajah (Malaysian Acquisition) (October 2011 – March 2012), Manager-Visayas Operations (July 2009 – October 2011), Manager-Distribution (May 2005 – May 2009), Superintendent-Mandaue Terminal (April 2001 – May 2005), Superintendent-Pandacan Manufacturing (April 1994 – April 2001), Superintendent-Pandacan Lubeoil Warehouse (November 1994 – March 1995) and Superintendent-Pandacan Transportation/Distribution (April 1993 – October 1994). Mr. Salonga has a Bachelor of Science degree in Mechanical Engineering from the Mapua Institute of Technology.
58
Maria Rosario D. Vergel de Dios, Filipino, born 1963, has served as Vice President for Human Resources Management of the Company since November 16, 2018. Other positions she has held include Assistant Vice President for Human Resources (July 2012 – November 15, 2018), Head for Human Resources (October 2011 – June 2012), Human Resources Planning and Services Manager (October 2008 – September 2011), Payroll and Benefits Officer (January 2002 – September 2008), Payroll Officer (February 1997 to – December 2001), Assistant for Treasury/ Funds Management (May 1994 to – January 1997), Assistant for Treasury/ Foreign Operations (September 1991 – April 1994) and Secretary for the Office of the President (April 1991 – August 1991). She has a Bachelor of Science degree in Economics from the University of the Philippines and a master’s degree in Business Management from the Ateneo de Manila University. Myrna C. Geronimo, Filipino, born 1966, has served as Vice President for Controllers and Controller the Company since February 13, 2020. She holds the following positions, among others: Controller of LLCDC, NVRC, PMC, PFC, MLC and PPI; and director, Controller and Treasurer of PEDC and SLHPI and Corporate Secretary of Petron Global Limited. She is also the Controller of PFI. Ms. Geronimo was formerly the Assistant Vice President for Controllers and Controller of the Company and the Chief Finance Officer of PMRMB, PFISB and POMSB. Ms. Geronimo holds a Bachelor of Arts degree in Accountancy from the Polytechnic University of the Philippines.
Allister J. Go, Filipino, born 1965, has served as Vice President for Refinery of the Company since February 13, 2020. Other positions he has held include Head of Refinery Plant Operations (February 2018 – November 2019), Assistant Vice President for Refinery Production A (January 2018), Officer-in-Charge of Refinery Production A (April 2017 – December 2017), Operations Manager of Refinery Production B (July 2014 – March 2017), Project Manager of RMP2 Project (December 2010 – June 2014), Supply Head, Supply Division (June 2010 – November 2010), Manager of Production Division B Expansion Facilities (June 2009 – May 2010), Manager of Refinery Planning and Quality Control (January 2007 – May 2009), Refinery Engineering Technology Manager (April 2003 – Dec 2006), and Assistant Manager of Business Development, Corporate Planning (June 2001 – March 2003), Business Development Officer, Corporate Planning (March 1995 – May 2001). He joined the Company as a Refinery Process Design Engineer in May 1988 and has handled several positions in the refinery, including Linear Program Engineer, prior to his assignment in Corporate Planning. He graduated from Adamson University in 1987 with a Bachelor of Science degree in Chemical Engineering and placed Top 2 in the November 1987 Chemical Engineering Licensure Exam. He has attended the Management Development Program of the Asian Institute of Management in 2002 as well as several foreign and local trainings and seminars, including an Engineering Design Course at UOP in Illinois, USA in 1993. Reynaldo V. Velasco, Jr., Filipino, born 1965, has served as Vice President for Refinery Plant Operations since February 13, 2020. He was formerly Assistant Vice President – Technical Services Refinery (November 2018 – January 2020), Assistant Vice President – Production B Refinery (January 2018 – October 2018), Officer-in-Charge – Production B Refinery (April 2017 – December 2017), Manager – Technical Services B Refinery (July 2014 – March 2017), Project Manager – Block B RMP 2 Refinery (December 2010 – June 2014), Manager – PBR SPG Technology Operations (November 2009 – November 2010), Area Manager – Operations Process Block 1 (January 2007 – November 2009), Area Manager – Operations Process Block 2 (July 2005 – December 2006), Area Manager – Operations Process Block 1 (July 2003 – June 2005), Process Specialist (January 2002 – June 2003), Senior Process Engineer (April 2000 – December 2001), Shift Supervisor – PBR Operations (November 1998 – March 2000), Operations Engineer – PBR Engineering (September 1993 – October 1998), Process Design Engineer – PBR Engineering (July 1990 – August 1993). He has a Bachelor of Science degree in Chemical Engineering from the University of Sto. Tomas.
59
Magnolia Cecilia D. Uy, Filipino, born 1966, has served as Vice President for Retail Sales since October 1, 2021. She was formerly the Vice President for Management Services Division of the Company from February 13, 2020 to September 30, 2021. Other positions she has held include Assistant Vice President for Management Services (June 2018 – February 2020), Assistant Vice President for Market Planning, Research and Sales Information and concurrent Head of the Management Information Systems (February 2018 – May 2018) and Assistant Vice President for Market Planning, Research and Sales Information (February 2013 – January 2018). She has a Bachelor of Science degree in Computer Science and a master’s degree in Business Administration from the University of the Philippines.
Virgilio V. Centeno, Filipino, born 1969, has served as Vice President for Industrial Sales since October 1, 2021. Other positions he has held include Vice President for LPG and Strategic Business Development (May 1, 2021 – September 30, 2021), Assistant Vice President – LPG Business Group (September 2019 – April 2021), Assistant Vice President – LPG, Lubes & Greases/Commercial Sales (June 2018 – August 2019), Assistant Vice President – Lubes & Greases/National Sales (September 2016 – May 2018), Lubes & Greases Trade Manager/National Sales (March 2016 – August 2016), Card Sales Manager/Reseller Trade/National Sales (August 2013 – February 2016), Card Sales Manager/LPG, Lubes & Greases, and Cards/National Sales (July 2012 – July 2013), National Accounts Manager/Industrial Trade (June 2009 – June 2012), Fleet Cards Sales Manager/Cards Business Group (August 2006 – June 2009), Business Development Coordinator/Direct Retail/Convenience Retail (November 2005 – July 2006), IMD Account Executive/Industrial Trade (February 2003 – October 2005), Special Projects Engineer/Technical Services (April 2002 – January 2003), Field Technical Services Engineer/Technical Services (February 1993 – March 2002) and Analyst, EDD/Geothermal (February 1992 – January 1993). Mr. Centeno has a BS Mechanical Engineering degree from the Bulacan College of Arts and Trades (magna cum laude).
Jhoanna Jasmine M. Javier-Elacio, Filipino, born 1972, was the Assistant Corporate Secretary and Alternate Compliance Officer of the Company from May 15, 2012 until March 31, 2022. From April 1, 2022, she assumed the position of the Officer-in-Charge of the Office of the General Counsel, Corporate Secretary and Compliance Officer of the Company and the Corporate Secretary of the domestic subsidiaries of the Company vice Atty. Cruz upon his retirement from the Company. Atty. Javier-Elacio was also the Legal Manager of Petron Corporation and the Assistant Corporate Secretary of Petron Foundation, Inc. and a number of the domestic subsidiaries of the Company. She previously held the positions of Associate General Counsel of San Miguel Yamamura Packaging Corporation (January 2010-February 2012), Manager for Corporate Restructuring and Reorganization of San Miguel Corporation (December 2007-December 2009) and legal counsel of San Miguel Corporation (October 20005-November 2007). She has also acted as Corporate Secretary and Assistant Corporate Secretary of various subsidiaries of San Miguel Corporation. She was a former associate at the law firm SyCip Salazar Hernandez & Gatmaitan. Atty. Javier-Elacio holds a Bachelor of Arts degree in English (cum laude) and a Bachelor of Laws degree from the University of the Philippines, and a master’s degree in law from the Kyushu University in Fukuoka, Japan. Officer Trainings in 2021 All the executive officers of the Company, including the Assistant Corporate Secretary and the Assistant Vice President for Internal Audit, completed a corporate governance seminar for year 2021 conducted in accordance with SEC Memorandum Circular No. 20, Series of 2013.
(ii) Board Committees; Board and Committee Charters Pursuant to the new Corporate Governance Manual of the Company approved by the Board on May 8, 2017 (the “Corporate Governance Manual”), the Company has Executive, Audit, Corporate Governance, Risk Oversight, and Related Party Transaction Committees constituted in accordance with Corporate Governance Manual and the Company’s By-Laws. Their respective members were appointed at the organizational meeting held on May 18, 2021.
60
The Board charter and the charter of each of the board committees were adopted on May 16, 2017.
• Executive Committee. The Executive Committee is composed of not less than three (3) members, which shall include the Chairman of the Board of Directors and the President, with two (2) alternate members. The Executive Committee, when the Board of Directors of Directors is not in session, may exercise the powers of the latter in the management of the business and affairs of the Company, except with respect to (a) the approval of any action for which stockholders’ approval is also required, (b) the filling of vacancies in the Board of Directors, (c) the amendment or repeal of the by-laws of the adoption of new by-laws; (d) the amendment or repeal of any resolution of the Board of Directors which by its express terms is not so amendable or repealable, (e) a distribution of dividends to the stockholders, and (f) such other matters as may be specifically excluded or limited by the Board of Directors. As of the date of this Annual Report, the members of the Executive Committee are Mr. Ramon S. Ang, Ms. Aurora T. Calderon, and Mr. Lubin B. Nepomuceno. Mr. John Paul S. Ang and Atty. Virgilio S. Jacinto are the two (2) alternate members of the Executive Committee.
The Executive Committee held 11 meetings in 2021, with attendance as shown below. The resolutions approved by the Executive Committee were passed with the unanimous vote of the committee members in attendance (whether regular members or alternate members) and later presented to and ratified by the Board of Directors at the board meeting held after each approved resolution.
Members January 11
February 22
March 2
April 8 May 19
June 22
July 5 November 17
November 24
December 9
December 21
Ramon S. Ang – Chairman
Lubin B. Nepomuceno
Aurora T. Calderon*
* Alternate member until May 18, 2021 and regular member thereafter
• Corporate Governance Committee. The Corporate Governance Committee, created on May 8, 2017, is composed of at least three (3) independent directors as members. The Chairperson of the committee is an independent director. The Corporate Governance Committee is tasked to assist the Board of Directors in the performance of its corporate governance, nomination and remuneration responsibilities and ensure compliance with and proper observance of corporate governance principles and practices. As of the date of this Annual Report, the Corporate Governance Committee is chaired by independent director Mr. Carlos Jericho L. Petilla, with independent directors former Chief Justice Artemio V. Panganiban and Mr. Margarito B, Teves, Atty. Estelito P. Mendoza, and Atty. Virgilio S. Jacinto as members.
In 2021, the Corporate Governance Committee held two (2) meetings, with the following members in attendance:
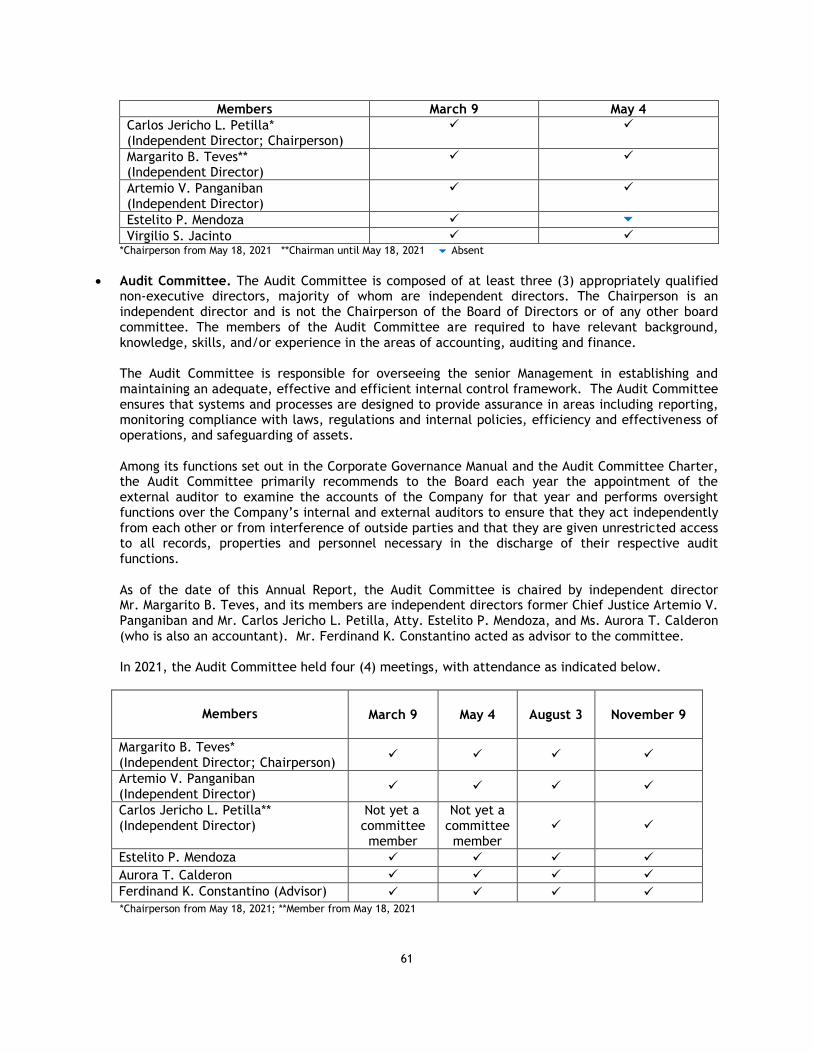
61
Members March 9 May 4
Carlos Jericho L. Petilla* (Independent Director; Chairperson)
Margarito B. Teves** (Independent Director)
Artemio V. Panganiban (Independent Director)
Estelito P. Mendoza
Virgilio S. Jacinto *Chairperson from May 18, 2021 **Chairman until May 18, 2021 Absent
• Audit Committee. The Audit Committee is composed of at least three (3) appropriately qualified non-executive directors, majority of whom are independent directors. The Chairperson is an independent director and is not the Chairperson of the Board of Directors or of any other board committee. The members of the Audit Committee are required to have relevant background, knowledge, skills, and/or experience in the areas of accounting, auditing and finance. The Audit Committee is responsible for overseeing the senior Management in establishing and maintaining an adequate, effective and efficient internal control framework. The Audit Committee ensures that systems and processes are designed to provide assurance in areas including reporting, monitoring compliance with laws, regulations and internal policies, efficiency and effectiveness of operations, and safeguarding of assets.
Among its functions set out in the Corporate Governance Manual and the Audit Committee Charter, the Audit Committee primarily recommends to the Board each year the appointment of the external auditor to examine the accounts of the Company for that year and performs oversight functions over the Company’s internal and external auditors to ensure that they act independently from each other or from interference of outside parties and that they are given unrestricted access to all records, properties and personnel necessary in the discharge of their respective audit functions.
As of the date of this Annual Report, the Audit Committee is chaired by independent director Mr. Margarito B. Teves, and its members are independent directors former Chief Justice Artemio V. Panganiban and Mr. Carlos Jericho L. Petilla, Atty. Estelito P. Mendoza, and Ms. Aurora T. Calderon
(who is also an accountant). Mr. Ferdinand K. Constantino acted as advisor to the committee. In 2021, the Audit Committee held four (4) meetings, with attendance as indicated below.
Members March 9 May 4 August 3 November 9
Margarito B. Teves* (Independent Director; Chairperson)
Artemio V. Panganiban (Independent Director)
Carlos Jericho L. Petilla** (Independent Director)
Not yet a committee member
Not yet a committee member
Estelito P. Mendoza
Aurora T. Calderon
Ferdinand K. Constantino (Advisor) *Chairperson from May 18, 2021; **Member from May 18, 2021
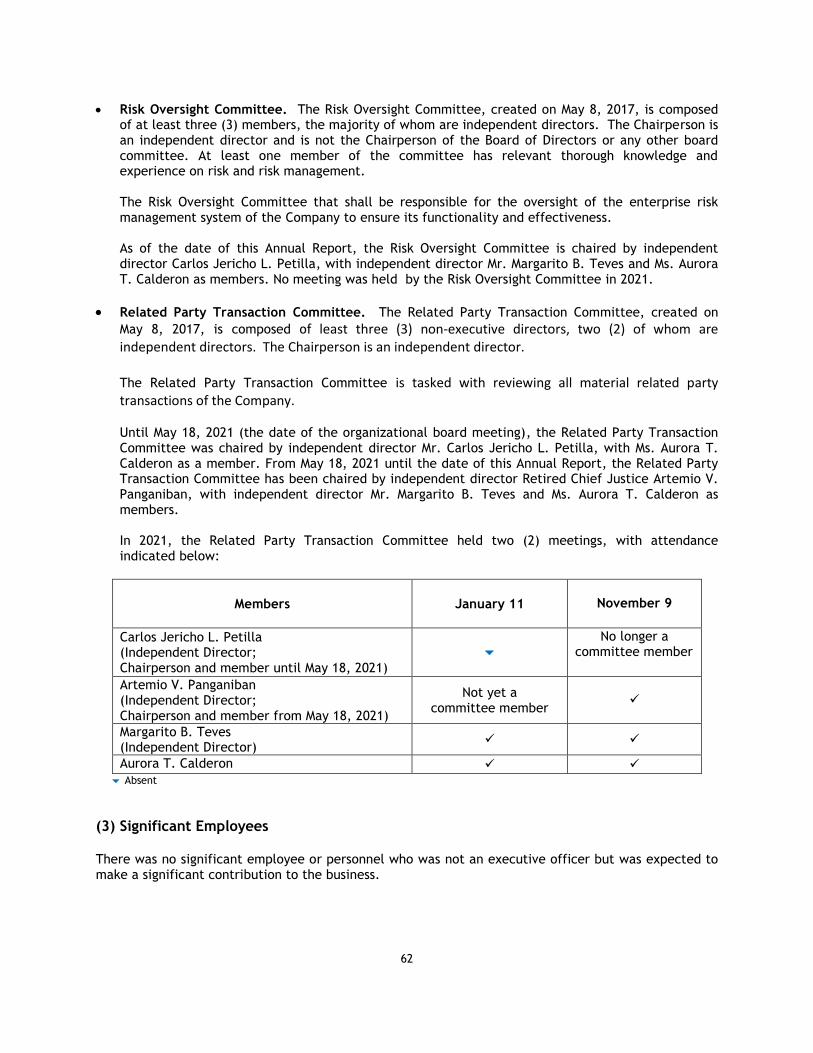
62
• Risk Oversight Committee. The Risk Oversight Committee, created on May 8, 2017, is composed of at least three (3) members, the majority of whom are independent directors. The Chairperson is an independent director and is not the Chairperson of the Board of Directors or any other board committee. At least one member of the committee has relevant thorough knowledge and experience on risk and risk management. The Risk Oversight Committee that shall be responsible for the oversight of the enterprise risk management system of the Company to ensure its functionality and effectiveness. As of the date of this Annual Report, the Risk Oversight Committee is chaired by independent director Carlos Jericho L. Petilla, with independent director Mr. Margarito B. Teves and Ms. Aurora T. Calderon as members. No meeting was held by the Risk Oversight Committee in 2021.
• Related Party Transaction Committee. The Related Party Transaction Committee, created on
May 8, 2017, is composed of least three (3) non-executive directors, two (2) of whom are independent directors. The Chairperson is an independent director.
The Related Party Transaction Committee is tasked with reviewing all material related party transactions of the Company. Until May 18, 2021 (the date of the organizational board meeting), the Related Party Transaction Committee was chaired by independent director Mr. Carlos Jericho L. Petilla, with Ms. Aurora T. Calderon as a member. From May 18, 2021 until the date of this Annual Report, the Related Party Transaction Committee has been chaired by independent director Retired Chief Justice Artemio V. Panganiban, with independent director Mr. Margarito B. Teves and Ms. Aurora T. Calderon as members. In 2021, the Related Party Transaction Committee held two (2) meetings, with attendance indicated below:
Members January 11
November 9
Carlos Jericho L. Petilla (Independent Director; Chairperson and member until May 18, 2021)
No longer a
committee member
Artemio V. Panganiban (Independent Director; Chairperson and member from May 18, 2021)
Not yet a committee member
Margarito B. Teves (Independent Director)
Aurora T. Calderon Absent
(3) Significant Employees There was no significant employee or personnel who was not an executive officer but was expected to make a significant contribution to the business.
63
(4) Family Relationships Director John Paul L. Ang is the son of Director Ramon S. Ang. Other than this, the Company has no director or executive officer related to any other director or executive officer up to the fourth degree of consanguinity or affinity.
(5) Involvement in Certain Legal Proceedings The Company is not aware that any one of the incumbent directors and executive officers and persons nominated to become a director and executive officer has been the subject of a bankruptcy petition or a conviction by final judgment in a criminal proceeding, domestic or foreign, excluding traffic violations and other minor offenses, or has been by final judgment or decree found to have violated securities or commodities law and enjoined from engaging in any business, securities, commodities or banking activities for the past five (5) years until the date of this Annual Report.
(B) Executive Compensation Standard Arrangements. Petron’s executive officers are also regular employees of the Company and are similarly remunerated with a compensation package comprising of 12 months base pay. They also receive whatever gratuity pay the Board of Directors extends to the managerial, supervisory and technical employees of the Company.
The members of the Board of Directors who are not executive officers are elected for a term of one year. They receive remuneration for 12 months in director’s fees and gas allowance, in addition to compensation on a per meeting participation.
Other Arrangements. There are no other arrangements for which the directors are compensated by the Company for services other than those provided as a director.
Warrants or Options. There are no warrants or options held by directors or officers. Employment Contract. In lieu of an employment contract, the directors are elected at the annual meeting of stockholders for a one year term until their successors shall have been duly elected and qualified pursuant to the Company’s By-Laws. Any director elected in the interim will serve for the remaining term until the next annual meeting of the stockholders.
The aggregate compensation paid or estimated to be paid to the executive officers and the aggregate
fees and per diem allowances paid or estimated to be paid to the directors of the Company during the
periods indicated below are as follows (in million pesos):
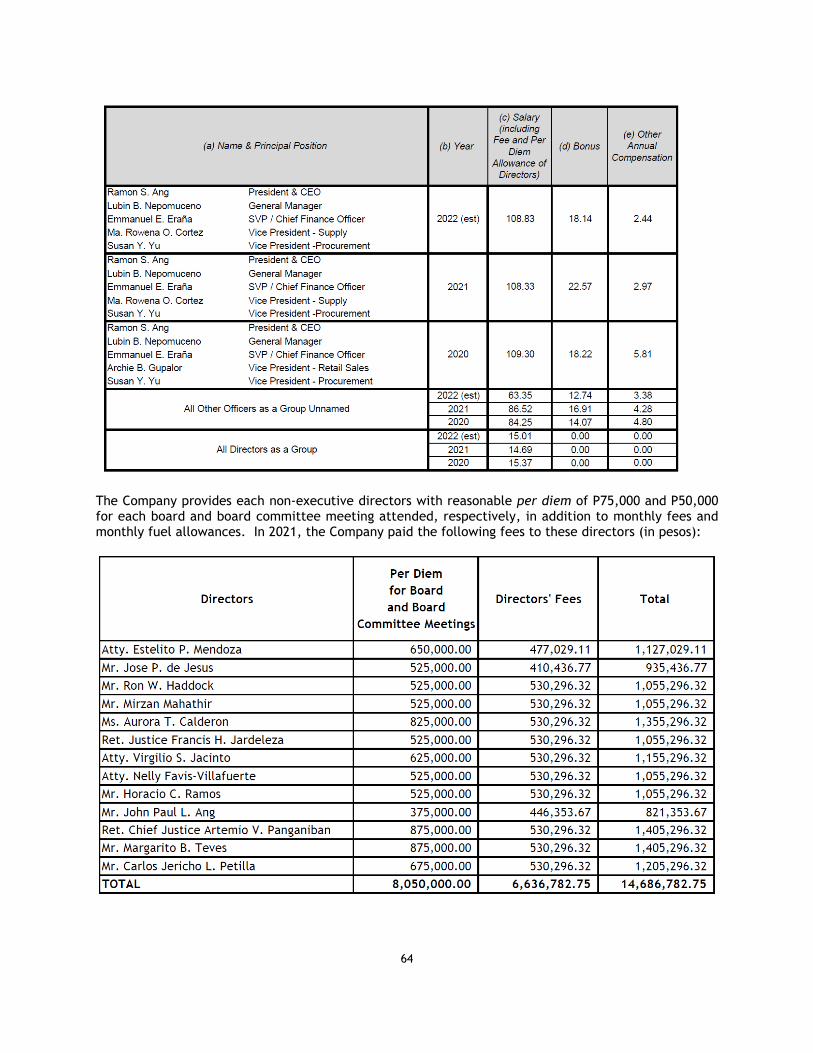
64
The Company provides each non-executive directors with reasonable per diem of P75,000 and P50,000 for each board and board committee meeting attended, respectively, in addition to monthly fees and monthly fuel allowances. In 2021, the Company paid the following fees to these directors (in pesos):
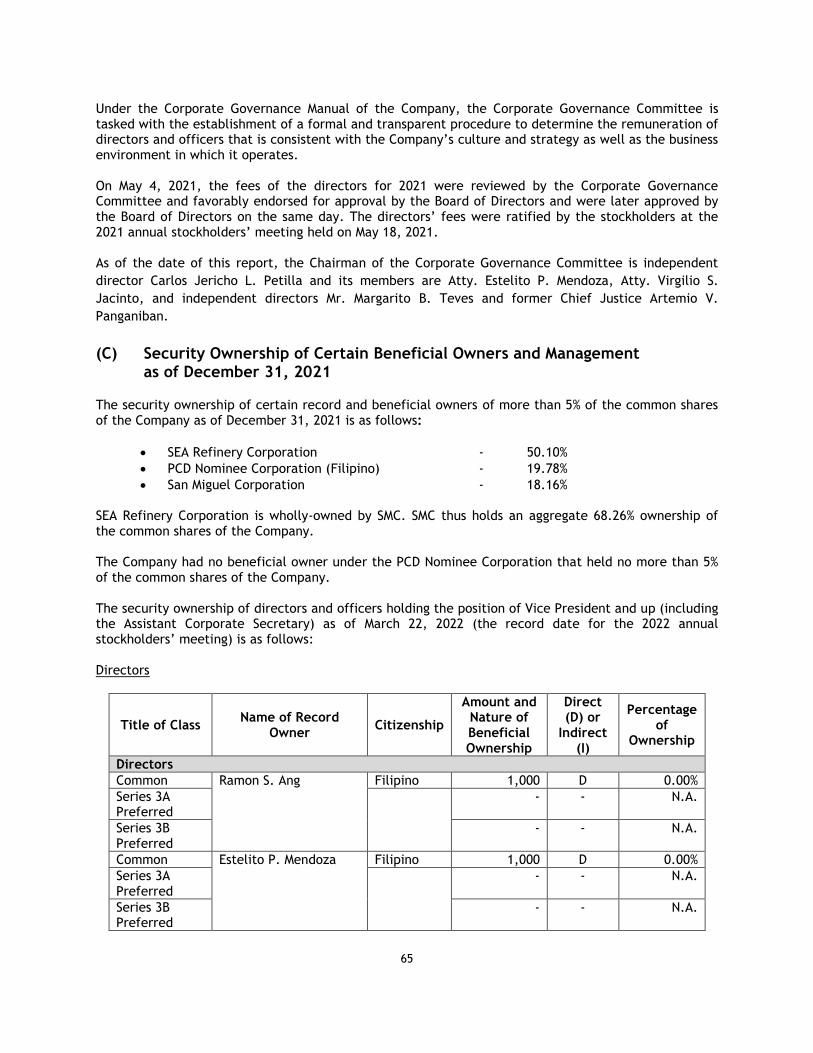
65
Under the Corporate Governance Manual of the Company, the Corporate Governance Committee is tasked with the establishment of a formal and transparent procedure to determine the remuneration of directors and officers that is consistent with the Company’s culture and strategy as well as the business environment in which it operates. On May 4, 2021, the fees of the directors for 2021 were reviewed by the Corporate Governance Committee and favorably endorsed for approval by the Board of Directors and were later approved by the Board of Directors on the same day. The directors’ fees were ratified by the stockholders at the 2021 annual stockholders’ meeting held on May 18, 2021. As of the date of this report, the Chairman of the Corporate Governance Committee is independent
director Carlos Jericho L. Petilla and its members are Atty. Estelito P. Mendoza, Atty. Virgilio S.
Jacinto, and independent directors Mr. Margarito B. Teves and former Chief Justice Artemio V.
Panganiban.
(C) Security Ownership of Certain Beneficial Owners and Management as of December 31, 2021
The security ownership of certain record and beneficial owners of more than 5% of the common shares of the Company as of December 31, 2021 is as follows:
• SEA Refinery Corporation - 50.10%
• PCD Nominee Corporation (Filipino) - 19.78%
• San Miguel Corporation - 18.16%
SEA Refinery Corporation is wholly-owned by SMC. SMC thus holds an aggregate 68.26% ownership of the common shares of the Company. The Company had no beneficial owner under the PCD Nominee Corporation that held no more than 5% of the common shares of the Company. The security ownership of directors and officers holding the position of Vice President and up (including the Assistant Corporate Secretary) as of March 22, 2022 (the record date for the 2022 annual stockholders’ meeting) is as follows: Directors
Title of Class Name of Record
Owner Citizenship
Amount and Nature of Beneficial Ownership
Direct (D) or
Indirect (I)
Percentage of
Ownership
Directors
Common Ramon S. Ang Filipino 1,000 D 0.00%
Series 3A Preferred
- - N.A.
Series 3B Preferred
- - N.A.
Common Estelito P. Mendoza Filipino 1,000 D 0.00%
Series 3A Preferred
- - N.A.
Series 3B Preferred
- - N.A.
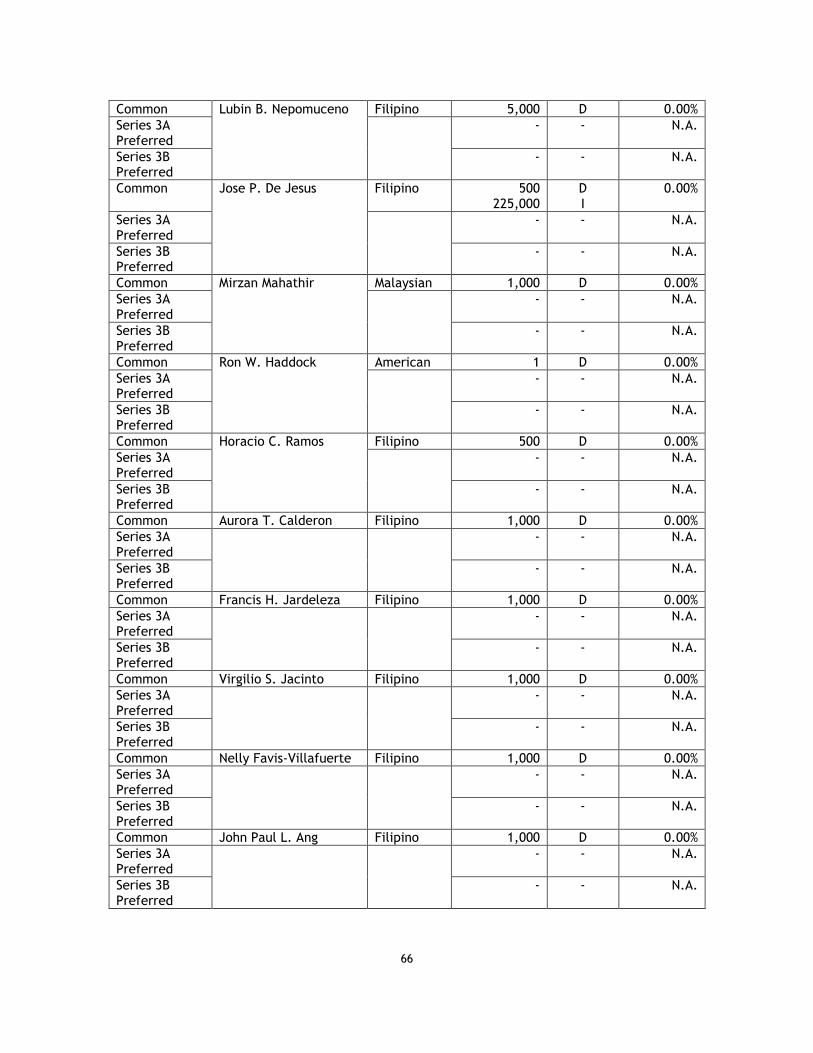
66
Common Lubin B. Nepomuceno Filipino 5,000 D 0.00%
Series 3A Preferred
- - N.A.
Series 3B Preferred
- - N.A.
Common Jose P. De Jesus Filipino 500 225,000
D I
0.00%
Series 3A Preferred
- - N.A.
Series 3B Preferred
- - N.A.
Common Mirzan Mahathir Malaysian 1,000 D 0.00%
Series 3A Preferred
- - N.A.
Series 3B Preferred
- - N.A.
Common Ron W. Haddock American 1 D 0.00%
Series 3A Preferred
- - N.A.
Series 3B Preferred
- - N.A.
Common Horacio C. Ramos Filipino 500 D 0.00%
Series 3A Preferred
- - N.A.
Series 3B Preferred
- - N.A.
Common Aurora T. Calderon Filipino 1,000 D 0.00%
Series 3A Preferred
- - N.A.
Series 3B Preferred
- - N.A.
Common Francis H. Jardeleza Filipino 1,000 D 0.00%
Series 3A Preferred
- - N.A.
Series 3B Preferred
- - N.A.
Common Virgilio S. Jacinto Filipino 1,000 D 0.00%
Series 3A Preferred
- - N.A.
Series 3B Preferred
- - N.A.
Common Nelly Favis-Villafuerte Filipino 1,000 D 0.00%
Series 3A Preferred
- - N.A.
Series 3B Preferred
- - N.A.
Common John Paul L. Ang Filipino 1,000 D 0.00%
Series 3A Preferred
- - N.A.
Series 3B Preferred
- - N.A.
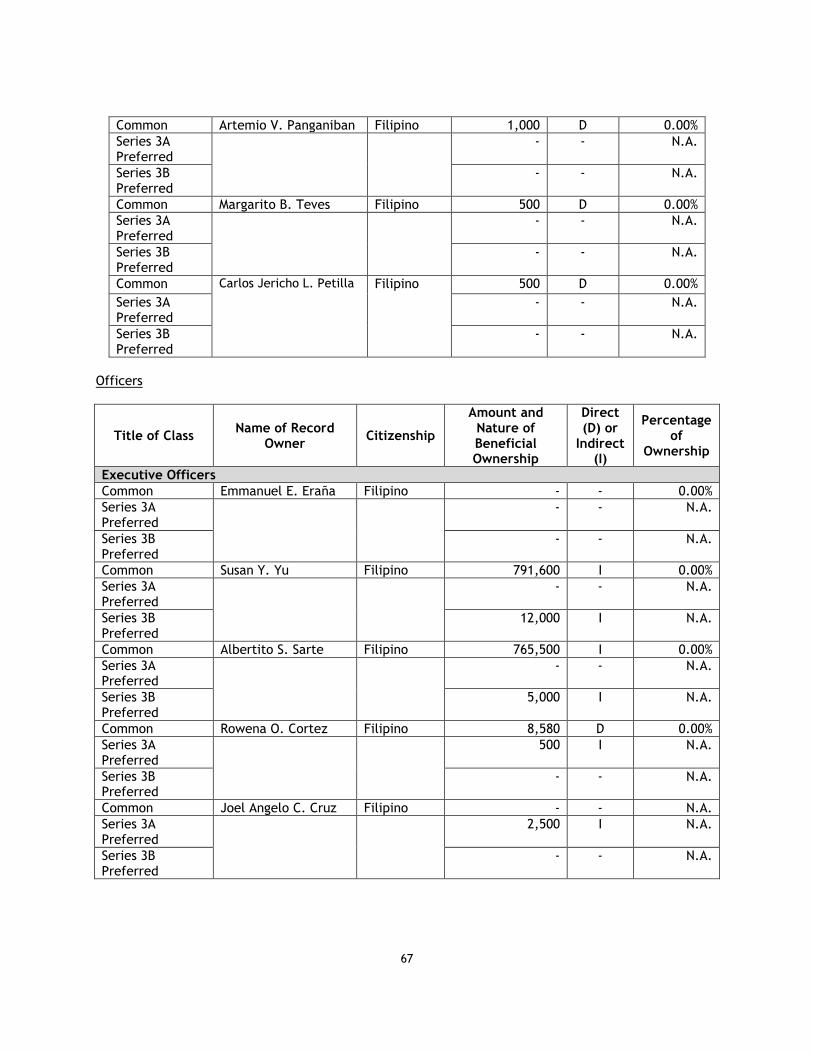
67
Common Artemio V. Panganiban Filipino 1,000 D 0.00%
Series 3A Preferred
- - N.A.
Series 3B Preferred
- - N.A.
Common Margarito B. Teves Filipino 500 D 0.00%
Series 3A Preferred
- - N.A.
Series 3B Preferred
- - N.A.
Common Carlos Jericho L. Petilla Filipino 500 D 0.00%
Series 3A Preferred
- - N.A.
Series 3B Preferred
- - N.A.
Officers
Title of Class Name of Record
Owner Citizenship
Amount and Nature of Beneficial Ownership
Direct (D) or
Indirect (I)
Percentage of
Ownership
Executive Officers
Common Emmanuel E. Eraña Filipino - - 0.00%
Series 3A Preferred
- - N.A.
Series 3B Preferred
- - N.A.
Common Susan Y. Yu Filipino 791,600 I 0.00%
Series 3A Preferred
- - N.A.
Series 3B Preferred
12,000 I N.A.
Common Albertito S. Sarte Filipino 765,500 I 0.00%
Series 3A Preferred
- - N.A.
Series 3B Preferred
5,000 I N.A.
Common Rowena O. Cortez Filipino 8,580 D 0.00%
Series 3A Preferred
500 I N.A.
Series 3B Preferred
- - N.A.
Common Joel Angelo C. Cruz Filipino - - N.A.
Series 3A Preferred
2,500 I N.A.
Series 3B Preferred
- - N.A.
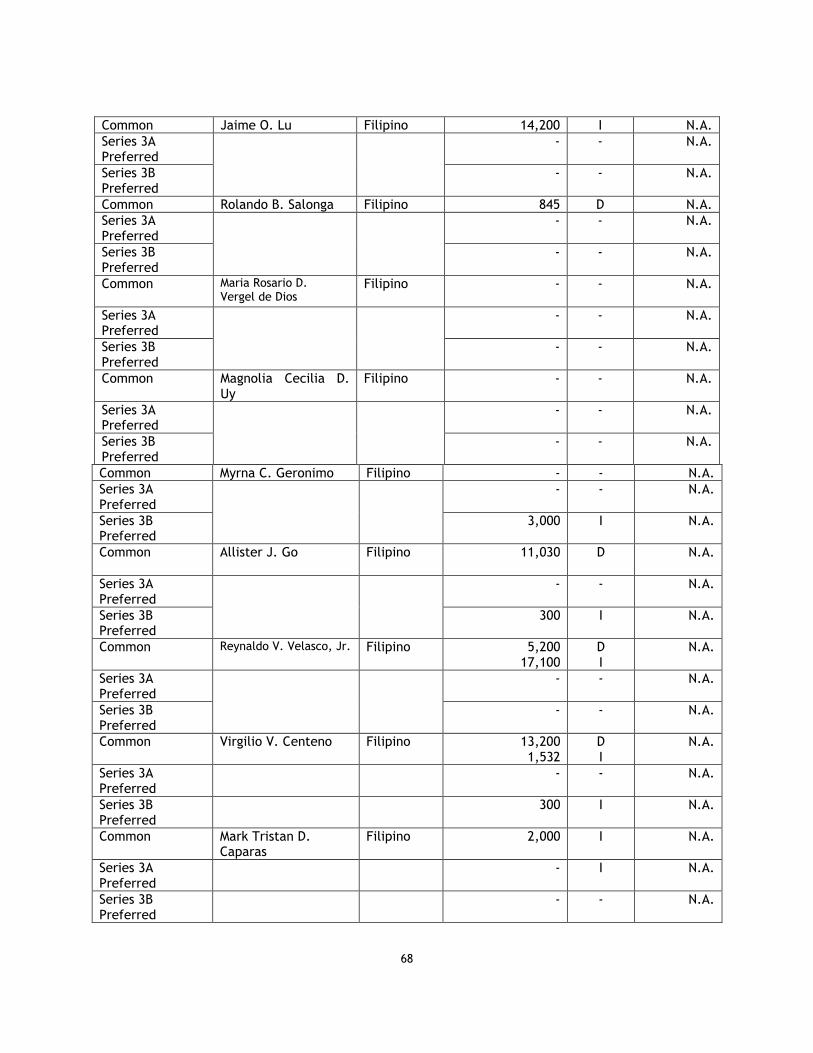
68
Common Jaime O. Lu Filipino 14,200 I N.A.
Series 3A Preferred
- - N.A.
Series 3B Preferred
- - N.A.
Common Rolando B. Salonga Filipino 845 D N.A.
Series 3A Preferred
- - N.A.
Series 3B Preferred
- - N.A.
Common Maria Rosario D. Vergel de Dios
Filipino
- - N.A.
Series 3A Preferred
- - N.A.
Series 3B Preferred
- - N.A.
Common Magnolia Cecilia D. Uy
Filipino - - N.A.
Series 3A Preferred
- - N.A.
Series 3B Preferred
- - N.A.
Common Myrna C. Geronimo Filipino - - N.A.
Series 3A Preferred
- - N.A.
Series 3B Preferred
3,000 I N.A.
Common Allister J. Go Filipino
11,030 D N.A.
Series 3A Preferred
- - N.A.
Series 3B Preferred
300 I N.A.
Common Reynaldo V. Velasco, Jr. Filipino
5,200 17,100
D I
N.A.
Series 3A Preferred
- - N.A.
Series 3B Preferred
- - N.A.
Common Virgilio V. Centeno Filipino 13,200 1,532
D I
N.A.
Series 3A Preferred
- - N.A.
Series 3B Preferred
300 I N.A.
Common Mark Tristan D. Caparas
Filipino 2,000 I N.A.
Series 3A Preferred
- I N.A.
Series 3B Preferred
- - N.A.
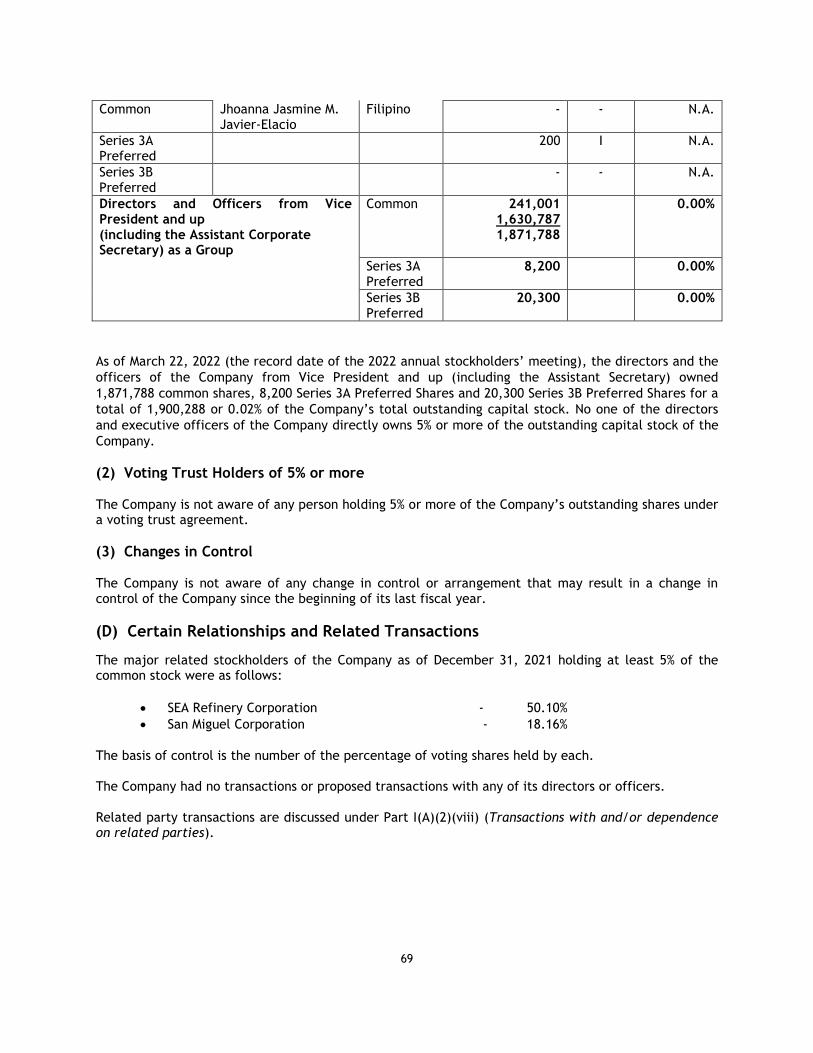
69
Common Jhoanna Jasmine M. Javier-Elacio
Filipino - - N.A.
Series 3A Preferred
200 I N.A.
Series 3B Preferred
- - N.A.
Directors and Officers from Vice President and up (including the Assistant Corporate Secretary) as a Group
Common 241,001 1,630,787 1,871,788
0.00%
Series 3A Preferred
8,200 0.00%
Series 3B Preferred
20,300 0.00%
As of March 22, 2022 (the record date of the 2022 annual stockholders’ meeting), the directors and the
officers of the Company from Vice President and up (including the Assistant Secretary) owned
1,871,788 common shares, 8,200 Series 3A Preferred Shares and 20,300 Series 3B Preferred Shares for a
total of 1,900,288 or 0.02% of the Company’s total outstanding capital stock. No one of the directors
and executive officers of the Company directly owns 5% or more of the outstanding capital stock of the
Company.
(2) Voting Trust Holders of 5% or more The Company is not aware of any person holding 5% or more of the Company’s outstanding shares under a voting trust agreement.
(3) Changes in Control The Company is not aware of any change in control or arrangement that may result in a change in control of the Company since the beginning of its last fiscal year.
(D) Certain Relationships and Related Transactions
The major related stockholders of the Company as of December 31, 2021 holding at least 5% of the common stock were as follows:
• SEA Refinery Corporation - 50.10%
• San Miguel Corporation - 18.16%
The basis of control is the number of the percentage of voting shares held by each. The Company had no transactions or proposed transactions with any of its directors or officers. Related party transactions are discussed under Part I(A)(2)(viii) (Transactions with and/or dependence on related parties).
70
PART IV – CORPORATE GOVERNANCE AND SUSTAINABILITY
(A) Corporate Governance
Corporate Governance Manual On May 8, 2017, the Board of Directors approved the new Corporate Governance Manual of the Company primarily based on the Code of Corporate Governance for Publicly-Listed Companies approved by the SEC pursuant to its Memorandum Circular No. 19 (2016). A copy of the Corporate Governance Manual was submitted to the SEC on May 29, 2017.
Various Corporate Policies The Company previously observed the San Miguel Corporation and Subsidiaries Whistle-blowing Policy for itself and its subsidiaries. On May 6, 2013, the Company, in its pursuit of further ensuring that its business is conducted in the highest standards of fairness, transparency, accountability and ethics as embodied in its Code of Conduct and Ethical Business Policy, adopted the Petron Corporation and Subsidiaries Whistle-blowing Policy. The Petron Corporation and Subsidiaries Whistle-blowing Policy
provides for the procedures for the communication and investigation of concerns relating to accounting, internal accounting controls, auditing and financial reporting matters of the Company and its subsidiaries (the “Petron Group”). The policy expressly provides the commitment of the Company that it shall not tolerate retaliation in any form against a director, officer, employee or any the other interested party who, in good faith, raises a concern or reports a possible violation of the policy. The Company also previously observed the San Miguel Corporation Policy on Dealings in Securities for itself and its subsidiaries. On May 6, 2013, the Company likewise adopted the Petron Corporation Policy on Dealings in Securities. Under this policy, the directors, officers and employees of the Company are obliged to exercise extreme caution when dealing in the Company’s securities and ensure that such dealings comply with this policy and the requirements under the Securities Regulation Code. The policy sets out the conditions and rules under which the directors, officers and employees of the Company should deal in securities of the Company.
Board Assessment and Summary of 2021 Assessment The directors accomplished the annual self-assessment for 2021. In August 2013, the Board of Directors adopted a new format for the annual self-assessment by each director of his/her performance and that of the Board of Directors and the board committees.
The self-assessment forms covers the evaluation of the (i) fulfillment of the key responsibilities of the Board of Directors including the consideration of the interests of minority shareholders and stakeholders and their equitable treatment in its decision-making processes, the pursuit of good corporate governance, the establishment of a clear strategic direction for the Company designed to maximize long-term shareholder value, the review and approval of financial statements and budgets, and the appointment of directors who can add value and contribute independent judgment to the formulation of sound policies and strategies of the Company and officers who are competent and highly motivated; (ii) relationship between the Board of Directors and the Management of the Company including having a clear understanding of where the role of the Board of Directors ends and where that of Management begins, the participation of the Board of Directors and the board committees in major business policies or decisions, the continuous interaction with Management for an understanding of the businesses better, and the consideration of the correlation between executive pay and Company performance; (iii) effectiveness of board process and meetings through the adequacy of the frequency, duration and scheduling of board and committee meetings, the ability of the Board of Directors to
71
balance and allocate its time effectively in discussing issues related to the Company’s strategy and competitiveness, the attendance at board and committee meetings and the conduct of meetings in a manner that ensures open communication, meaningful participation, and timely resolution of issues, the wide and diverse range of expertise and occupational and personal backgrounds of the directors, and the institutionalization of a formal review process for monitoring the effectiveness of the Board of Directors and the individual directors; and (iv) individual performance of the directors including a director’s understanding of the mission, values and strategies of the Company, his/her duties as a director and the Company’s Articles, the Company’s By-Laws and governing policies and applicable law, rules and regulations, the attendance at meetings and the conscious effort to avoid entering into situations where a director may be placed in a conflict of interest with that of the Company.
All the 15 directors accomplished the annual self-assessment for 2021. The average self-rating by the Directors covering all four (4) topics discussed above was 4.73 (out of a possible 5.0), broken down as follows: (1) Fulfilment of Board Key Responsibilities – The ratings averaged 4.73 based on a series of nine (9) questions; (2) Board-Management Relationship – The ratings averaged 4.71 based on a series of four (4) questions; (3) Effectiveness of Board Processes and Meetings - The ratings averaged 4.71 based on a series of nine (9) questions; and (4) Individual Performance of Directors - The ratings averaged 4.79 based on a series of 10 questions.
Compliance with the Corporate Governance Manual The Company is in compliance with the provisions of the Corporate Governance Manual.
• Its directors possess all the qualifications and none of the disqualifications of a director under the Corporate Governance Manual, the Company’s By-laws and applicable laws and regulations.
• The Company had three (3) independent directors (Retired Supreme Court Chief Justice Artemio V. Panganiban, Mr. Margarito B. Teves, and Mr. Carlos Jericho L. Petilla) and a Compliance Officer (Atty. Joel Angelo C. Cruz).
• The Company had a Lead Independent Director (Mr. Margarito B. Teves)
• The Company regularly held board meetings and board committee meetings, at which a quorum was always present.
• The Company conducted an orientation seminar on May 14, 2021 for Director John Paul S. Ang following his election as a director on March 9, 2021.
• The directors properly discharge their duties and responsibilities as directors and attended a corporate governance seminar.
• Each director accomplished a self-assessment form for 2021.
• The Company has an external auditor.
• The Company has an Internal Audit Department.
• The Company respects and observes the rights of its stockholders under applicable law.
• The Company is in material compliance with laws and regulations applicable to its business operations, including applicable accounting standards and disclosure requirements,
Pursuit of Corporate Governance As above-discussed, the Company adopted on May 8, 2017 its new Corporate Governance Manual to align with the Code of Corporate Governance for Publicly Listed Company approved by the SEC and which took effect on January 1, 2017. The Company is committed in pursuing good corporate governance by keeping abreast of new developments in and leading principles and practices on good corporate governance. The Company also continuously reviews its own policies and practices as it competes in a continually evolving business
environment while taking into account the Company’s corporate objectives and the best interests of its stakeholders and the Company.
72
To further instill good governance in the Company, the Company will continue to coordinate with accredited providers for the attendance of the directors and officers in more extensive corporate governance programs to keep them updated with the latest developments in and best practices on good corporate governance. The Office of the General Counsel and Corporate Secretary will also continue to periodically release internal memoranda to explain and/or reiterate the Company’s corporate governance practices and the latest good corporate governance practices in general. Integrated Annual Corporate Governance Report (“i-ACGR”) Other matters relating to the governance of the Company are discussed in the i-ACGR of the Company filed with the SEC and posted on the company website.
(B) Sustainability Report
Please find attached as Annex D the Sustainability Report of the Company for 2021.
[Rest of page intentionally left blank;
“Part V – Exhibits and Schedules” follows on next page]
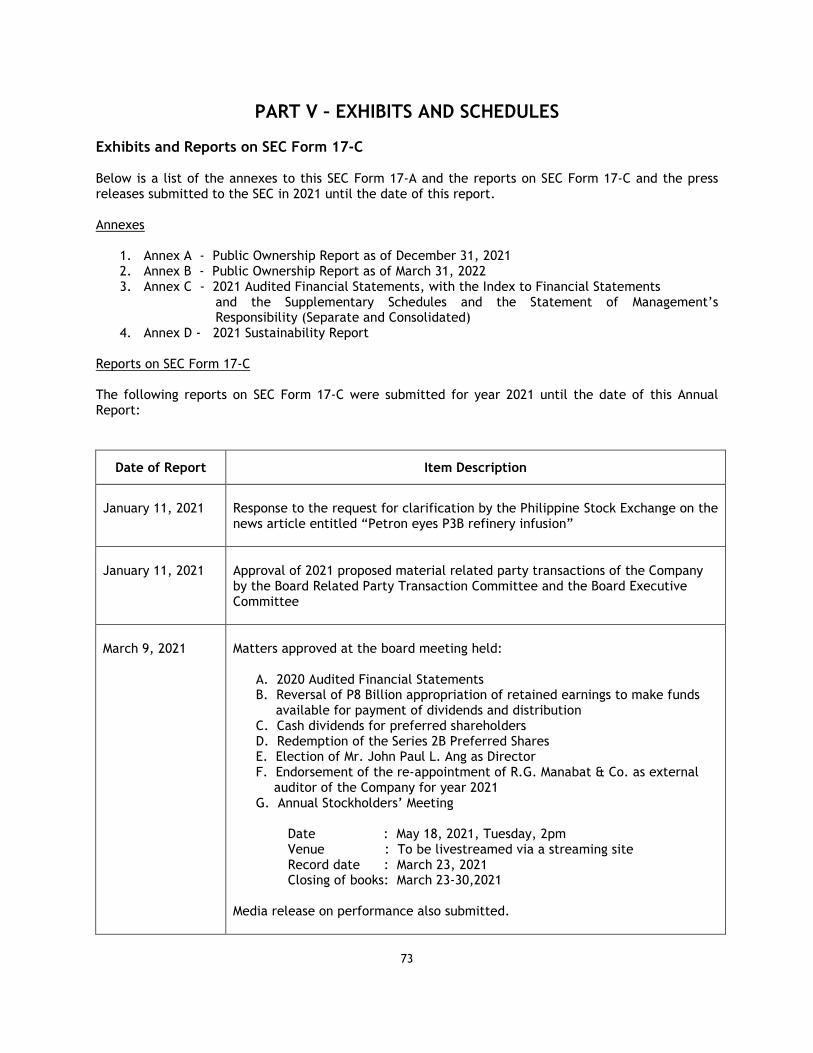
73
PART V – EXHIBITS AND SCHEDULES
Exhibits and Reports on SEC Form 17-C Below is a list of the annexes to this SEC Form 17-A and the reports on SEC Form 17-C and the press releases submitted to the SEC in 2021 until the date of this report. Annexes
1. Annex A - Public Ownership Report as of December 31, 2021 2. Annex B - Public Ownership Report as of March 31, 2022 3. Annex C - 2021 Audited Financial Statements, with the Index to Financial Statements
and the Supplementary Schedules and the Statement of Management’s Responsibility (Separate and Consolidated)
4. Annex D - 2021 Sustainability Report Reports on SEC Form 17-C The following reports on SEC Form 17-C were submitted for year 2021 until the date of this Annual Report:
Date of Report Item Description
January 11, 2021
Response to the request for clarification by the Philippine Stock Exchange on the news article entitled “Petron eyes P3B refinery infusion”
January 11, 2021
Approval of 2021 proposed material related party transactions of the Company by the Board Related Party Transaction Committee and the Board Executive Committee
March 9, 2021
Matters approved at the board meeting held:
A. 2020 Audited Financial Statements B. Reversal of P8 Billion appropriation of retained earnings to make funds available for payment of dividends and distribution C. Cash dividends for preferred shareholders D. Redemption of the Series 2B Preferred Shares E. Election of Mr. John Paul L. Ang as Director F. Endorsement of the re-appointment of R.G. Manabat & Co. as external
auditor of the Company for year 2021 G. Annual Stockholders’ Meeting
Date : May 18, 2021, Tuesday, 2pm Venue : To be livestreamed via a streaming site Record date : March 23, 2021 Closing of books: March 23-30,2021
Media release on performance also submitted.
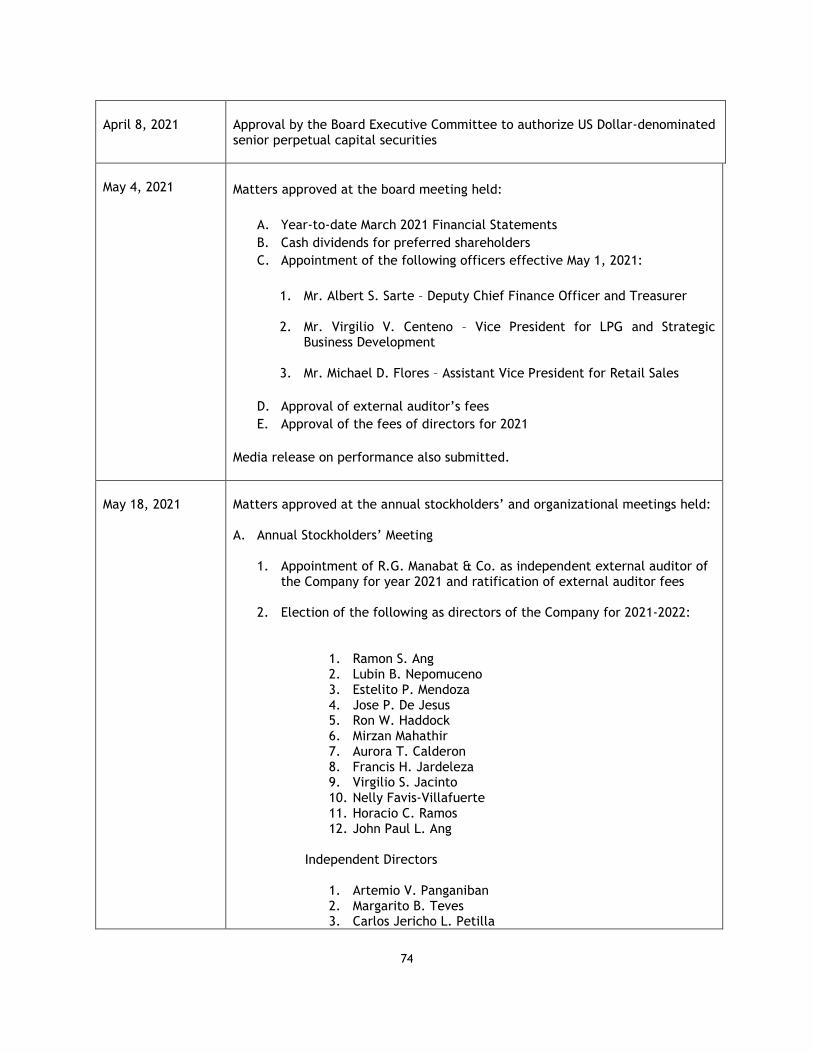
74
April 8, 2021
Approval by the Board Executive Committee to authorize US Dollar-denominated senior perpetual capital securities
May 4, 2021
Matters approved at the board meeting held:
A. Year-to-date March 2021 Financial Statements
B. Cash dividends for preferred shareholders
C. Appointment of the following officers effective May 1, 2021:
1. Mr. Albert S. Sarte – Deputy Chief Finance Officer and Treasurer 2. Mr. Virgilio V. Centeno – Vice President for LPG and Strategic
Business Development 3. Mr. Michael D. Flores – Assistant Vice President for Retail Sales
D. Approval of external auditor’s fees
E. Approval of the fees of directors for 2021
Media release on performance also submitted.
May 18, 2021
Matters approved at the annual stockholders’ and organizational meetings held: A. Annual Stockholders’ Meeting
1. Appointment of R.G. Manabat & Co. as independent external auditor of the Company for year 2021 and ratification of external auditor fees
2. Election of the following as directors of the Company for 2021-2022:
1. Ramon S. Ang 2. Lubin B. Nepomuceno 3. Estelito P. Mendoza 4. Jose P. De Jesus 5. Ron W. Haddock 6. Mirzan Mahathir 7. Aurora T. Calderon 8. Francis H. Jardeleza 9. Virgilio S. Jacinto 10. Nelly Favis-Villafuerte 11. Horacio C. Ramos 12. John Paul L. Ang
Independent Directors
1. Artemio V. Panganiban 2. Margarito B. Teves 3. Carlos Jericho L. Petilla
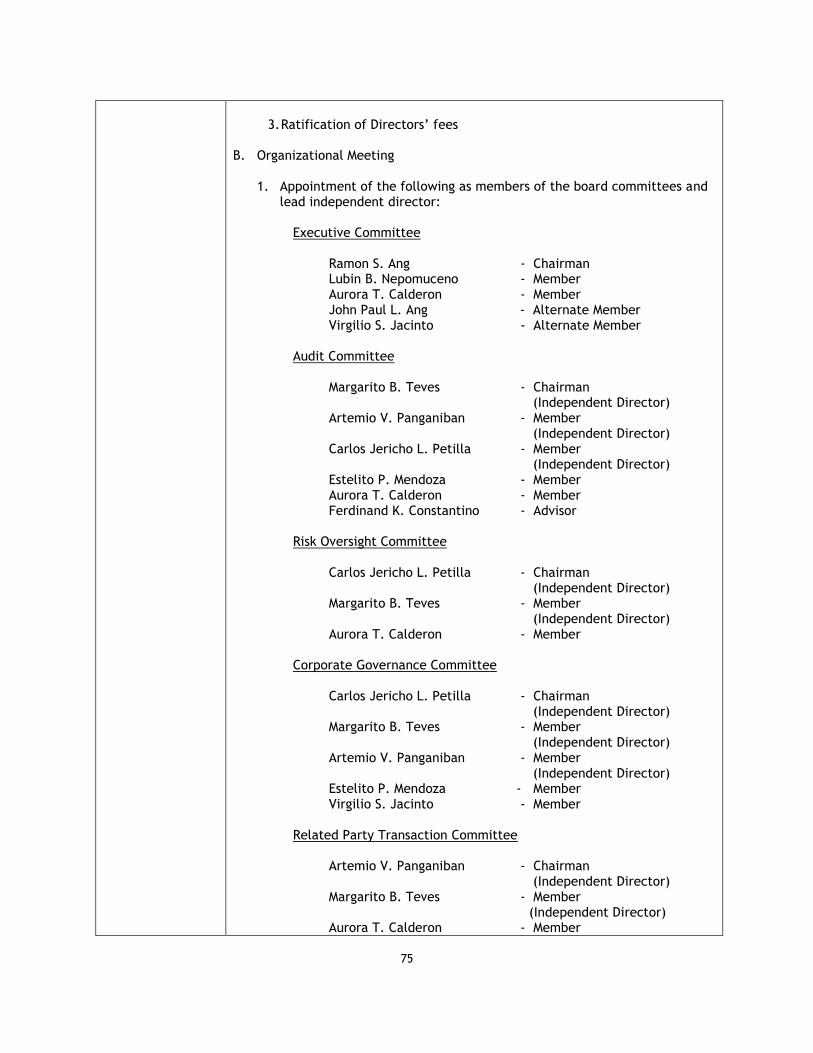
75
3. Ratification of Directors’ fees
B. Organizational Meeting
1. Appointment of the following as members of the board committees and
lead independent director:
Executive Committee
Ramon S. Ang - Chairman Lubin B. Nepomuceno - Member
Aurora T. Calderon - Member John Paul L. Ang - Alternate Member Virgilio S. Jacinto - Alternate Member
Audit Committee
Margarito B. Teves - Chairman (Independent Director) Artemio V. Panganiban - Member (Independent Director) Carlos Jericho L. Petilla - Member (Independent Director) Estelito P. Mendoza - Member Aurora T. Calderon - Member Ferdinand K. Constantino - Advisor
Risk Oversight Committee
Carlos Jericho L. Petilla - Chairman (Independent Director) Margarito B. Teves - Member (Independent Director) Aurora T. Calderon - Member
Corporate Governance Committee
Carlos Jericho L. Petilla - Chairman (Independent Director) Margarito B. Teves - Member (Independent Director) Artemio V. Panganiban - Member (Independent Director) Estelito P. Mendoza - Member Virgilio S. Jacinto - Member
Related Party Transaction Committee
Artemio V. Panganiban - Chairman (Independent Director) Margarito B. Teves - Member (Independent Director) Aurora T. Calderon - Member
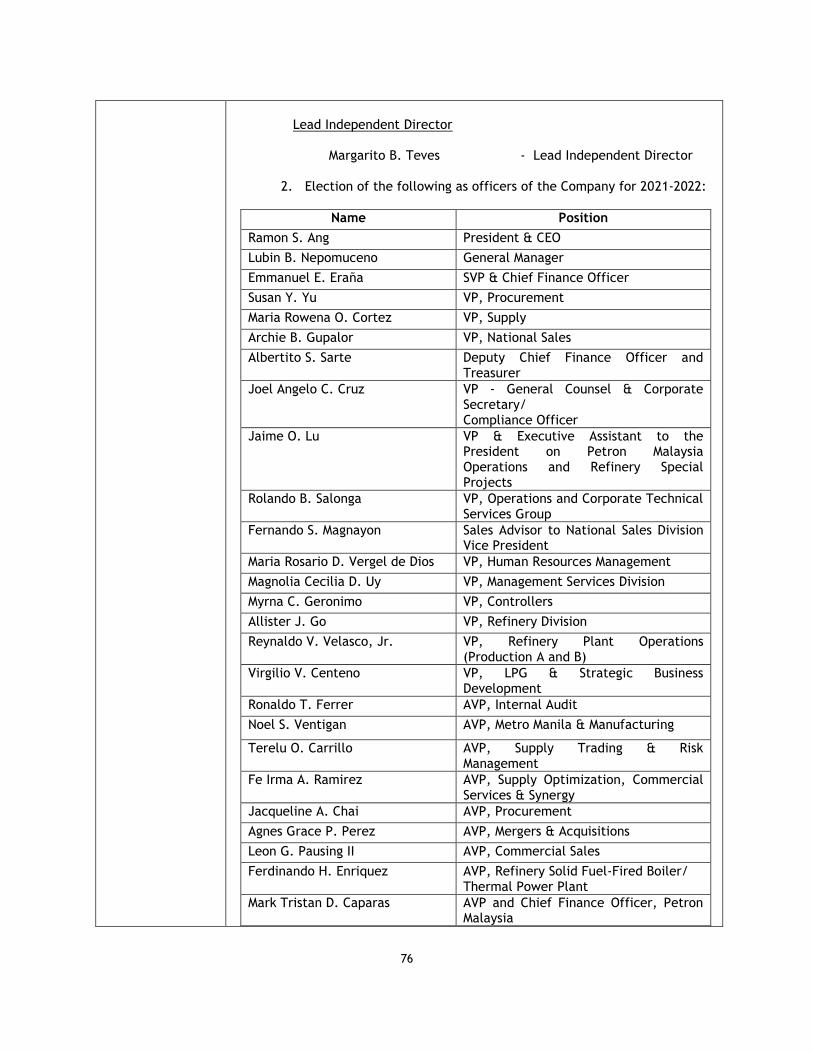
76
Lead Independent Director
Margarito B. Teves - Lead Independent Director
2. Election of the following as officers of the Company for 2021-2022:
Name Position
Ramon S. Ang President & CEO
Lubin B. Nepomuceno General Manager
Emmanuel E. Eraña SVP & Chief Finance Officer
Susan Y. Yu VP, Procurement
Maria Rowena O. Cortez VP, Supply
Archie B. Gupalor VP, National Sales
Albertito S. Sarte Deputy Chief Finance Officer and Treasurer
Joel Angelo C. Cruz VP - General Counsel & Corporate Secretary/ Compliance Officer
Jaime O. Lu VP & Executive Assistant to the President on Petron Malaysia Operations and Refinery Special Projects
Rolando B. Salonga VP, Operations and Corporate Technical Services Group
Fernando S. Magnayon Sales Advisor to National Sales Division Vice President
Maria Rosario D. Vergel de Dios VP, Human Resources Management
Magnolia Cecilia D. Uy VP, Management Services Division
Myrna C. Geronimo VP, Controllers
Allister J. Go VP, Refinery Division
Reynaldo V. Velasco, Jr. VP, Refinery Plant Operations (Production A and B)
Virgilio V. Centeno VP, LPG & Strategic Business Development
Ronaldo T. Ferrer AVP, Internal Audit
Noel S. Ventigan AVP, Metro Manila & Manufacturing
Terelu O. Carrillo AVP, Supply Trading & Risk Management
Fe Irma A. Ramirez AVP, Supply Optimization, Commercial Services & Synergy
Jacqueline A. Chai AVP, Procurement
Agnes Grace P. Perez AVP, Mergers & Acquisitions
Leon G. Pausing II AVP, Commercial Sales
Ferdinando H. Enriquez AVP, Refinery Solid Fuel-Fired Boiler/ Thermal Power Plant
Mark Tristan D. Caparas AVP and Chief Finance Officer, Petron Malaysia
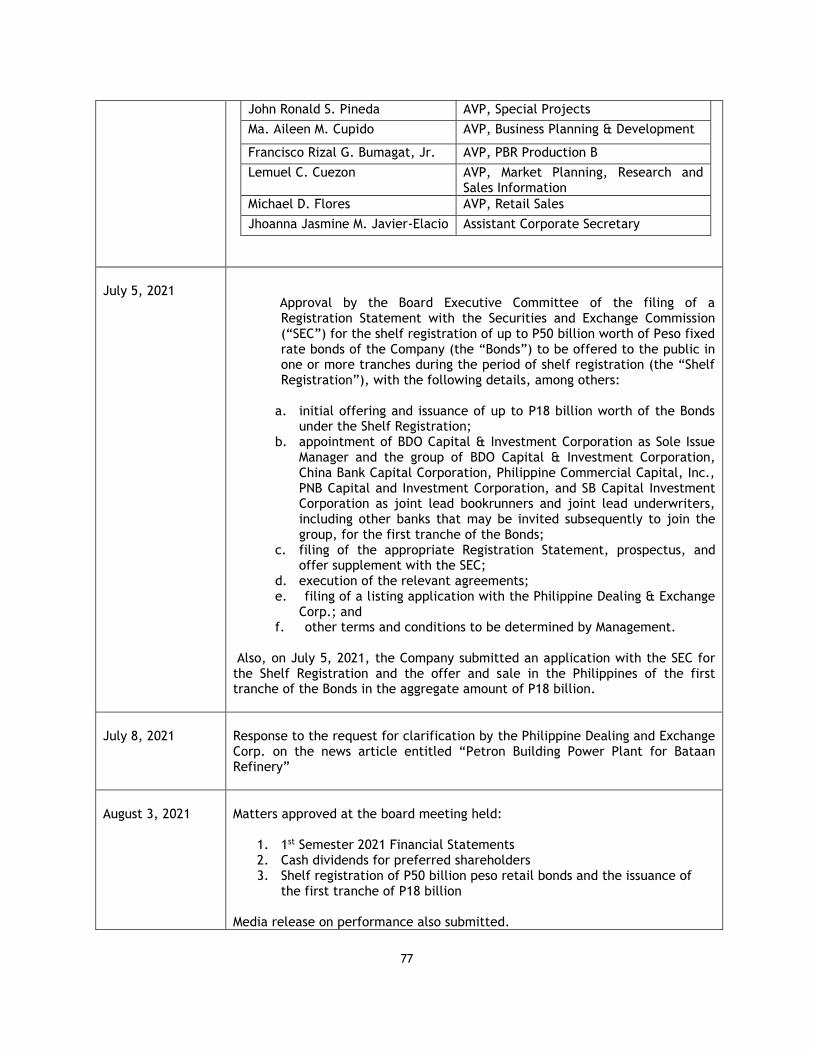
77
John Ronald S. Pineda AVP, Special Projects
Ma. Aileen M. Cupido AVP, Business Planning & Development
Francisco Rizal G. Bumagat, Jr. AVP, PBR Production B
Lemuel C. Cuezon AVP, Market Planning, Research and Sales Information
Michael D. Flores AVP, Retail Sales
Jhoanna Jasmine M. Javier-Elacio Assistant Corporate Secretary
July 5, 2021
Approval by the Board Executive Committee of the filing of a Registration Statement with the Securities and Exchange Commission (“SEC”) for the shelf registration of up to P50 billion worth of Peso fixed rate bonds of the Company (the “Bonds”) to be offered to the public in one or more tranches during the period of shelf registration (the “Shelf Registration”), with the following details, among others:
a. initial offering and issuance of up to P18 billion worth of the Bonds
under the Shelf Registration; b. appointment of BDO Capital & Investment Corporation as Sole Issue
Manager and the group of BDO Capital & Investment Corporation, China Bank Capital Corporation, Philippine Commercial Capital, Inc., PNB Capital and Investment Corporation, and SB Capital Investment Corporation as joint lead bookrunners and joint lead underwriters, including other banks that may be invited subsequently to join the group, for the first tranche of the Bonds;
c. filing of the appropriate Registration Statement, prospectus, and offer supplement with the SEC;
d. execution of the relevant agreements; e. filing of a listing application with the Philippine Dealing & Exchange
Corp.; and f. other terms and conditions to be determined by Management.
Also, on July 5, 2021, the Company submitted an application with the SEC for the Shelf Registration and the offer and sale in the Philippines of the first tranche of the Bonds in the aggregate amount of P18 billion.
July 8, 2021
Response to the request for clarification by the Philippine Dealing and Exchange Corp. on the news article entitled “Petron Building Power Plant for Bataan Refinery”
August 3, 2021
Matters approved at the board meeting held:
1. 1st Semester 2021 Financial Statements 2. Cash dividends for preferred shareholders 3. Shelf registration of P50 billion peso retail bonds and the issuance of
the first tranche of P18 billion
Media release on performance also submitted.
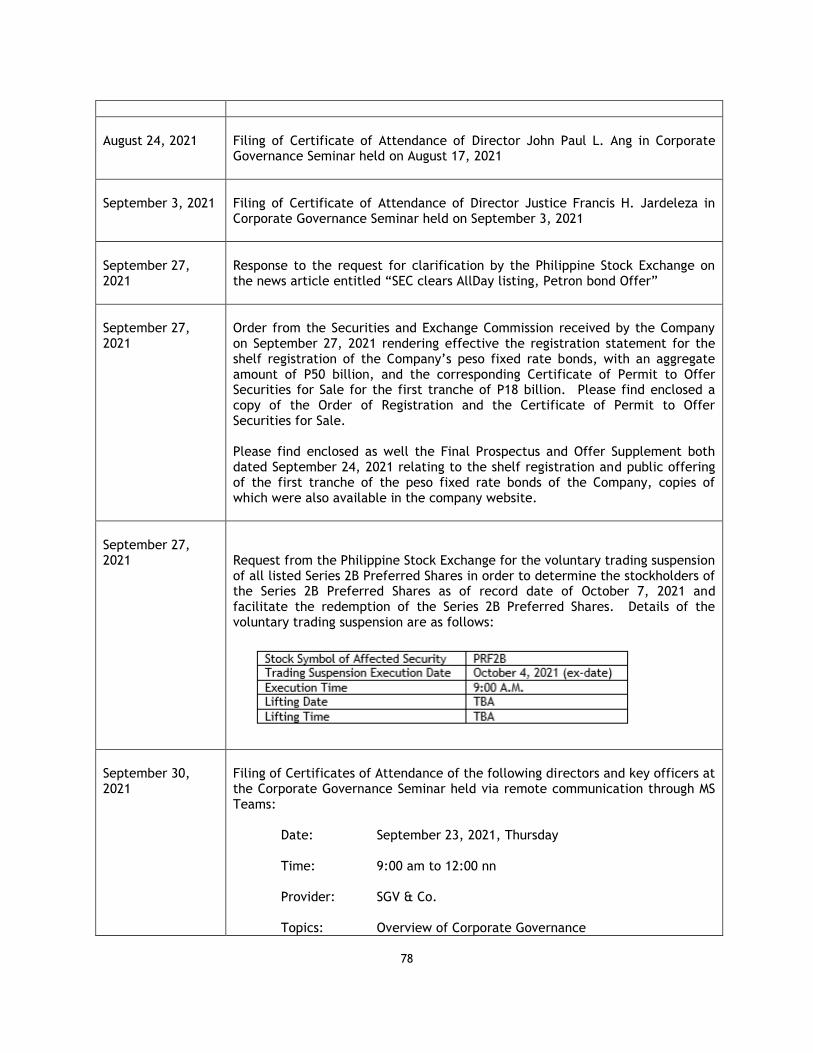
78
August 24, 2021
Filing of Certificate of Attendance of Director John Paul L. Ang in Corporate Governance Seminar held on August 17, 2021
September 3, 2021
Filing of Certificate of Attendance of Director Justice Francis H. Jardeleza in Corporate Governance Seminar held on September 3, 2021
September 27, 2021
Response to the request for clarification by the Philippine Stock Exchange on the news article entitled “SEC clears AllDay listing, Petron bond Offer”
September 27, 2021
Order from the Securities and Exchange Commission received by the Company on September 27, 2021 rendering effective the registration statement for the shelf registration of the Company’s peso fixed rate bonds, with an aggregate amount of P50 billion, and the corresponding Certificate of Permit to Offer Securities for Sale for the first tranche of P18 billion. Please find enclosed a copy of the Order of Registration and the Certificate of Permit to Offer Securities for Sale.
Please find enclosed as well the Final Prospectus and Offer Supplement both dated September 24, 2021 relating to the shelf registration and public offering of the first tranche of the peso fixed rate bonds of the Company, copies of which were also available in the company website.
September 27, 2021
Request from the Philippine Stock Exchange for the voluntary trading suspension of all listed Series 2B Preferred Shares in order to determine the stockholders of the Series 2B Preferred Shares as of record date of October 7, 2021 and facilitate the redemption of the Series 2B Preferred Shares. Details of the voluntary trading suspension are as follows:
September 30, 2021
Filing of Certificates of Attendance of the following directors and key officers at the Corporate Governance Seminar held via remote communication through MS Teams:
Date: September 23, 2021, Thursday Time: 9:00 am to 12:00 nn Provider: SGV & Co. Topics: Overview of Corporate Governance
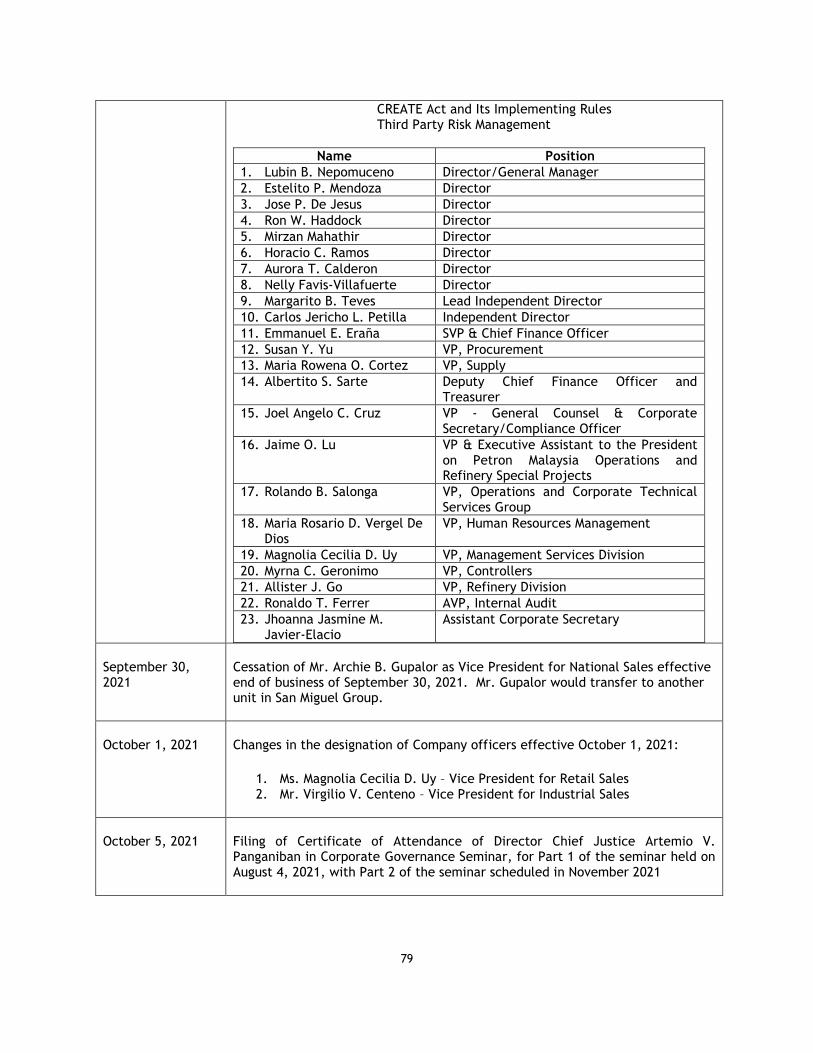
79
CREATE Act and Its Implementing Rules Third Party Risk Management
Name Position
1. Lubin B. Nepomuceno Director/General Manager
2. Estelito P. Mendoza Director
3. Jose P. De Jesus Director
4. Ron W. Haddock Director
5. Mirzan Mahathir Director
6. Horacio C. Ramos Director
7. Aurora T. Calderon Director
8. Nelly Favis-Villafuerte Director
9. Margarito B. Teves Lead Independent Director
10. Carlos Jericho L. Petilla Independent Director
11. Emmanuel E. Eraña SVP & Chief Finance Officer
12. Susan Y. Yu VP, Procurement
13. Maria Rowena O. Cortez VP, Supply
14. Albertito S. Sarte Deputy Chief Finance Officer and Treasurer
15. Joel Angelo C. Cruz VP - General Counsel & Corporate Secretary/Compliance Officer
16. Jaime O. Lu VP & Executive Assistant to the President on Petron Malaysia Operations and Refinery Special Projects
17. Rolando B. Salonga VP, Operations and Corporate Technical Services Group
18. Maria Rosario D. Vergel De Dios
VP, Human Resources Management
19. Magnolia Cecilia D. Uy VP, Management Services Division
20. Myrna C. Geronimo VP, Controllers
21. Allister J. Go VP, Refinery Division
22. Ronaldo T. Ferrer AVP, Internal Audit
23. Jhoanna Jasmine M. Javier-Elacio
Assistant Corporate Secretary
September 30, 2021
Cessation of Mr. Archie B. Gupalor as Vice President for National Sales effective end of business of September 30, 2021. Mr. Gupalor would transfer to another unit in San Miguel Group.
October 1, 2021
Changes in the designation of Company officers effective October 1, 2021:
1. Ms. Magnolia Cecilia D. Uy – Vice President for Retail Sales 2. Mr. Virgilio V. Centeno – Vice President for Industrial Sales
October 5, 2021
Filing of Certificate of Attendance of Director Chief Justice Artemio V. Panganiban in Corporate Governance Seminar, for Part 1 of the seminar held on August 4, 2021, with Part 2 of the seminar scheduled in November 2021
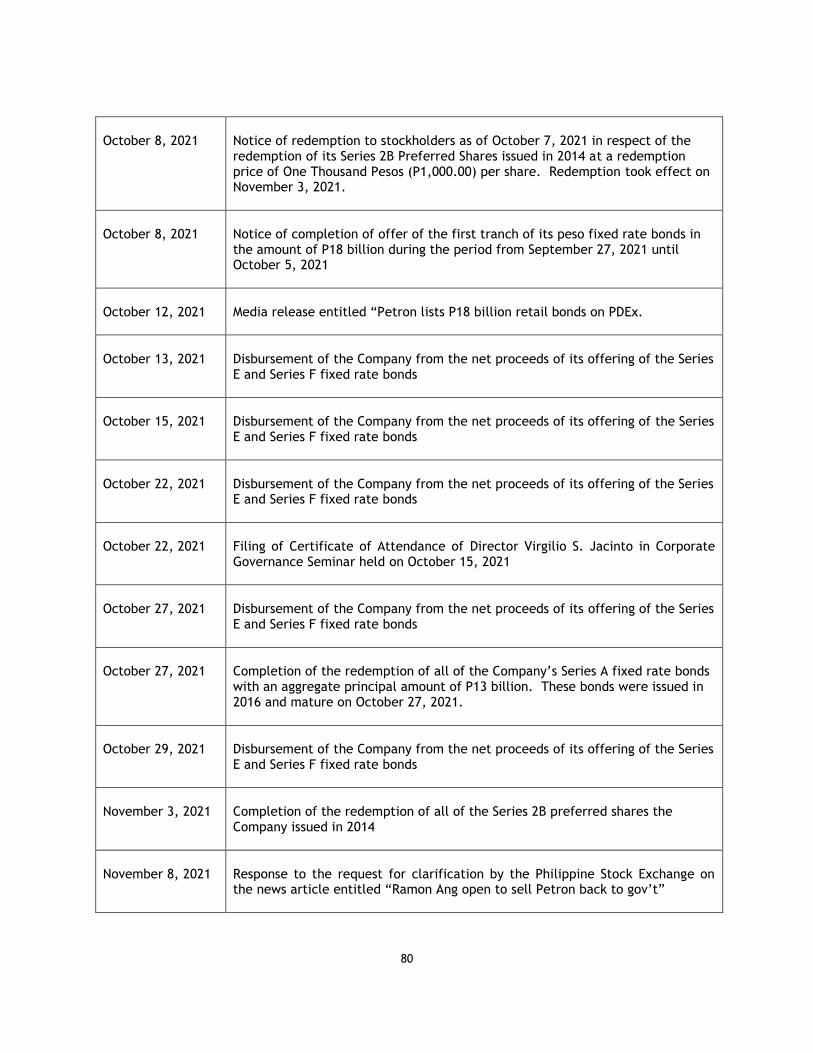
80
October 8, 2021
Notice of redemption to stockholders as of October 7, 2021 in respect of the redemption of its Series 2B Preferred Shares issued in 2014 at a redemption price of One Thousand Pesos (P1,000.00) per share. Redemption took effect on November 3, 2021.
October 8, 2021
Notice of completion of offer of the first tranch of its peso fixed rate bonds in the amount of P18 billion during the period from September 27, 2021 until October 5, 2021
October 12, 2021
Media release entitled “Petron lists P18 billion retail bonds on PDEx.
October 13, 2021
Disbursement of the Company from the net proceeds of its offering of the Series E and Series F fixed rate bonds
October 15, 2021
Disbursement of the Company from the net proceeds of its offering of the Series E and Series F fixed rate bonds
October 22, 2021
Disbursement of the Company from the net proceeds of its offering of the Series E and Series F fixed rate bonds
October 22, 2021
Filing of Certificate of Attendance of Director Virgilio S. Jacinto in Corporate Governance Seminar held on October 15, 2021
October 27, 2021
Disbursement of the Company from the net proceeds of its offering of the Series E and Series F fixed rate bonds
October 27, 2021
Completion of the redemption of all of the Company’s Series A fixed rate bonds with an aggregate principal amount of P13 billion. These bonds were issued in 2016 and mature on October 27, 2021.
October 29, 2021
Disbursement of the Company from the net proceeds of its offering of the Series E and Series F fixed rate bonds
November 3, 2021
Completion of the redemption of all of the Series 2B preferred shares the Company issued in 2014
November 8, 2021
Response to the request for clarification by the Philippine Stock Exchange on the news article entitled “Ramon Ang open to sell Petron back to gov’t”
81
November 8, 2021
Disbursement of the Company from the net proceeds of its offering of the Series E and Series F fixed rate bonds
November 8, 2021
Disbursement of the Company from the net proceeds of its offering of the Series E and Series F fixed rate bonds
November 9, 2021
Filing of Certificate of Attendance of Mr. Ramon S. Ang, President and Chief Executive Officer, in Corporate Governance Seminar held on October 29, 2021
November 9, 2021
Matters approved at the board meeting held:
1. Year-to-date September 2021 Financial Statements 2. Cash dividends for the preferred shareholders 3. Approval of material related party transactions for 2022
Media release on performance also submitted.
November 15, 2021
Disbursement of the Company from the net proceeds of its offering of the Series E and Series F fixed rate bonds
November 17, 2021
Filing of Certificate of Attendance of Director Chief Justice Artemio V. Panganiban in Corporate Governance Seminar, for Part 2 of the seminar held on November 12, 2021
November 19, 2021
Disbursement of the Company from the net proceeds of its offering of the Series E and Series F fixed rate bonds
November 22, 2021
Disbursement of the Company from the net proceeds of its offering of the Series E and Series F fixed rate bonds
November 29, 2021
Disbursement of the Company from the net proceeds of its offering of the Series E and Series F fixed rate bonds
December 3, 2021
Disbursement of the Company from the net proceeds of its offering of the Series E and Series F fixed rate bonds
December 10, 2021
Disbursement of the Company from the net proceeds of its offering of the Series E and Series F fixed rate bonds
82
December 15, 2021
Disbursement of the Company from the net proceeds of its offering of the Series E and Series F fixed rate bonds
December 15, 2021
Disbursement of the Company from the net proceeds of its offering of the Series E and Series F fixed rate bonds, correcting the amount of the sixth (6th) disbursement in the list from P11,758,800.00 to P10,347,774.00 and the resulting total disbursements
December 28 2021
Disbursement of the Company from the net proceeds of its offering of the Series E and Series F fixed rate bonds
December 29, 2021
Disbursement of the Company from the net proceeds of its offering of the Series E and Series F fixed rate bonds
January 7, 2022
Disbursement of the Company from the net proceeds of its offering of the Series E and Series F fixed rate bonds
February 8, 2022
Disbursement of the Company from the net proceeds of its offering of the Series E and Series F fixed rate bonds
February 15, 2022
Disbursement of the Company from the net proceeds of its offering of the Series E and Series F fixed rate bonds
February 22, 2022
Disbursement of the Company from the net proceeds of its offering of the Series E and Series F fixed rate bonds
February 28, 2022
Disbursement of the Company from the net proceeds of its offering of the Series E and Series F fixed rate bonds
March 2, 2022
Disbursement of the Company from the net proceeds of its offering of the Series E and Series F fixed rate bonds
March 3, 2022
Disbursement of the Company from the net proceeds of its offering of the Series E and Series F fixed rate bonds
March 8, 2022
Matters approved at the board meeting held:
1. 2021 Audited Financial Statements 2. Approval of directors’ fees for 2022 3. Endorsement of the Re-Appointment of the External Auditor and
83
Approval of Fees 4. Holding of the Annual Stockholders’ Meeting for 2022 5. Election of Officers
1. Mark Tristan D. Caparas – Vice President, Petron Malaysia CFO 2. Jonathan F. Del Rosario – Assistant Vice President, Metro Manila and
Manufacturing District 3. Mia S. Delos Reyes – Assistant Vice President, Corporate Affairs 4. Brian R. Ocampo – Assistant Vice President, Management
Information Systems 5. Alejandro R. Romulo – Assistant Vice President, PBR Technical
Services 6. Jhoanna Jasmine M. Javier-Elacio – OIC General Counsel, Corporate
Secretary and Compliance Officer* 7. Marian Wilma H. Bautista – Assistant Corporate Secretary*
*effective April 1, 2022
Media release on performance also submitted.
March 8, 2022
Disbursement of the Company from the net proceeds of its offering of the Series E and Series F fixed rate bonds
March 15, 2022
Disbursement of the Company from the net proceeds of its offering of the Series E and Series F fixed rate bonds
March 22, 2022
Disbursement of the Company from the net proceeds of its offering of the Series E and Series F fixed rate bonds
March 29, 2022
Disbursement of the Company from the net proceeds of its offering of the Series E and Series F fixed rate bonds
March 31, 2022
Disbursement of the Company from the net proceeds of its offering of the Series E and Series F fixed rate bonds
April 1, 2022
Retirement of Mr. Rolando B. Salonga, Vice President – Operations and Corporate Technical Services Group, and Atty. Joel Angelo C. Cruz, Vice President – General Counsel and Corporate Secretary/Compliance Officer of the Company effective end of business of March 31, 2022
84
April 5, 2022
Approval by the Securities and Exchange Commission of the Company’s request for exemptive relief from the requirement under Rule 68 of the Revised Securities Regulation Code (“Revised SRC Rule 68”) that the interim financial statements of the Company for the first quarter of 2022 (the “2022 Q1 Reports”) be attached to the Definitive Information Statement (the “DIS”) for its 2022 Annual Stockholders’ Meeting scheduled on May 17, 2022 and the release of the DIS without the 2022 Q1 Reports.
Press Releases
The following press releases were made for year 2021 until the date of this Annual Report:
March 9, 2021 “Petron sustains growth momentum in Q4 2020; continues to recover from pandemic slump”
May 4, 2021 “Petron opens 2021 with P1.73 billion first quarter net income”
August 3, 2021 “Petron closes first half of the year with P3.87 billion net income”
October 12, 2021 “Petron lists P18 billion retail bonds on PDEx”
November 9, 2021 “Petron sustains recovery; posts P4.99B net income for first nine months from P12.6B loss last year”
March 8, 2022 “Petron remains on steady path to recovery; closes 2021 with P6.14 billion net income”
[signature page follows on next page]
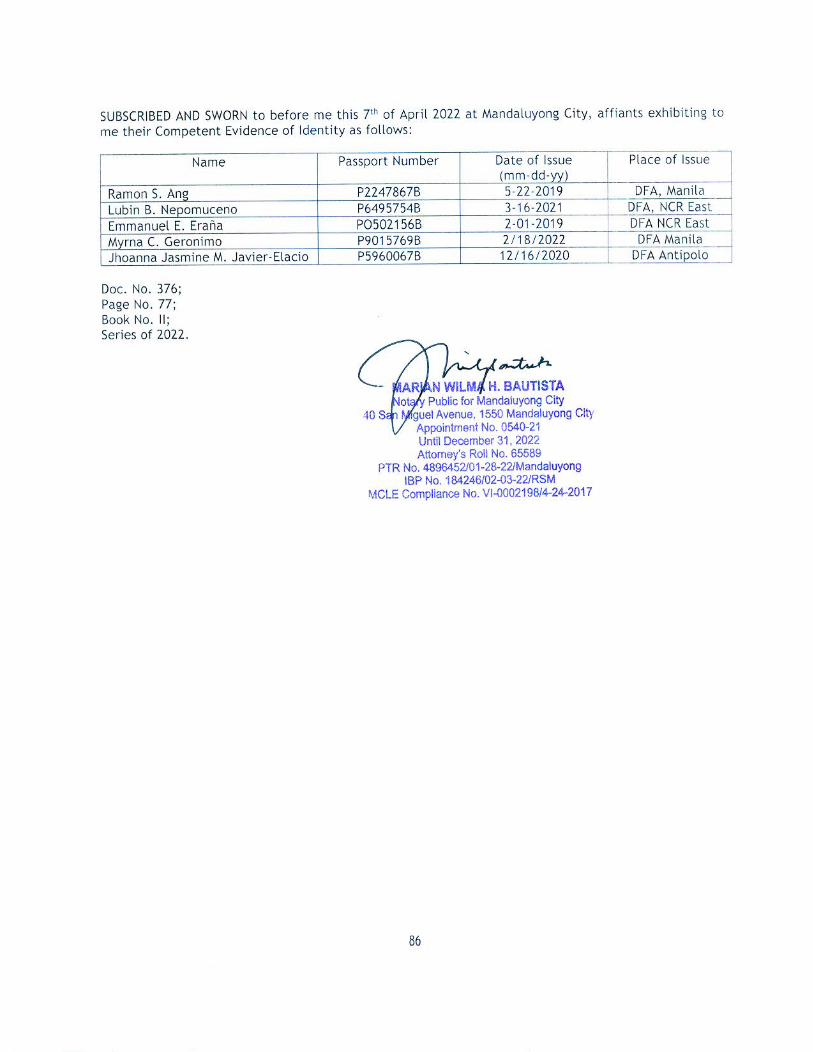
87
ANNEX A
Public Ownership Report as of December 31, 2021
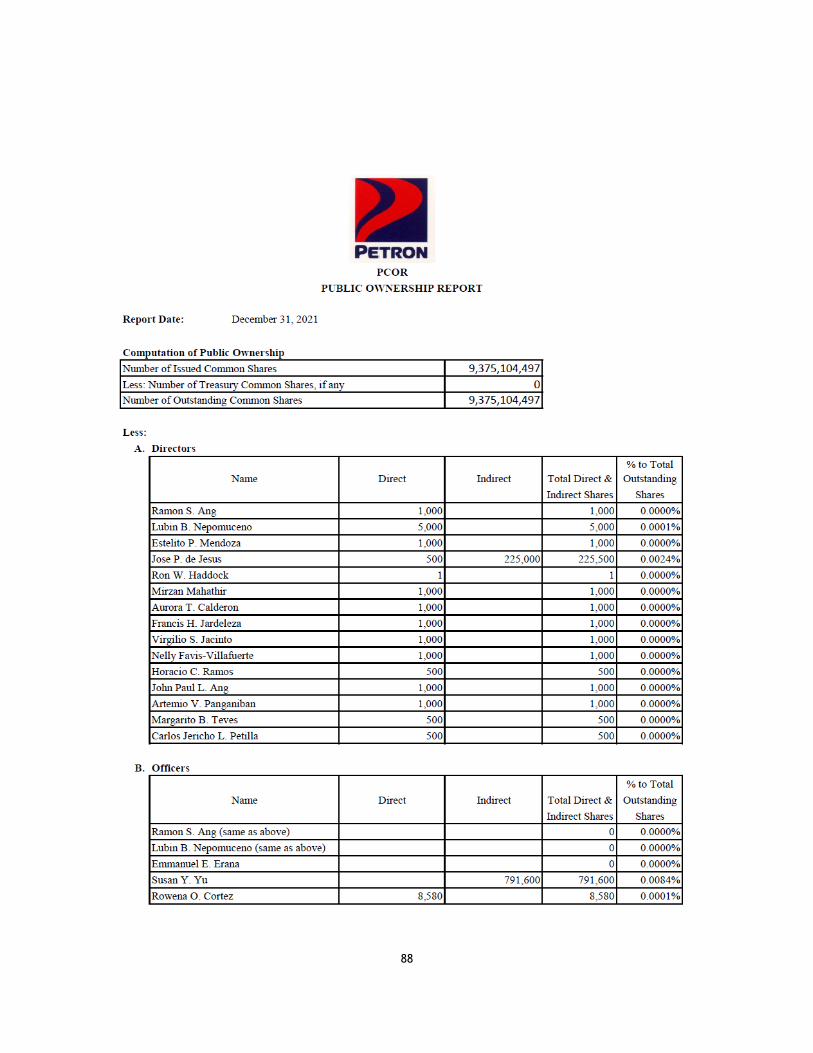
88
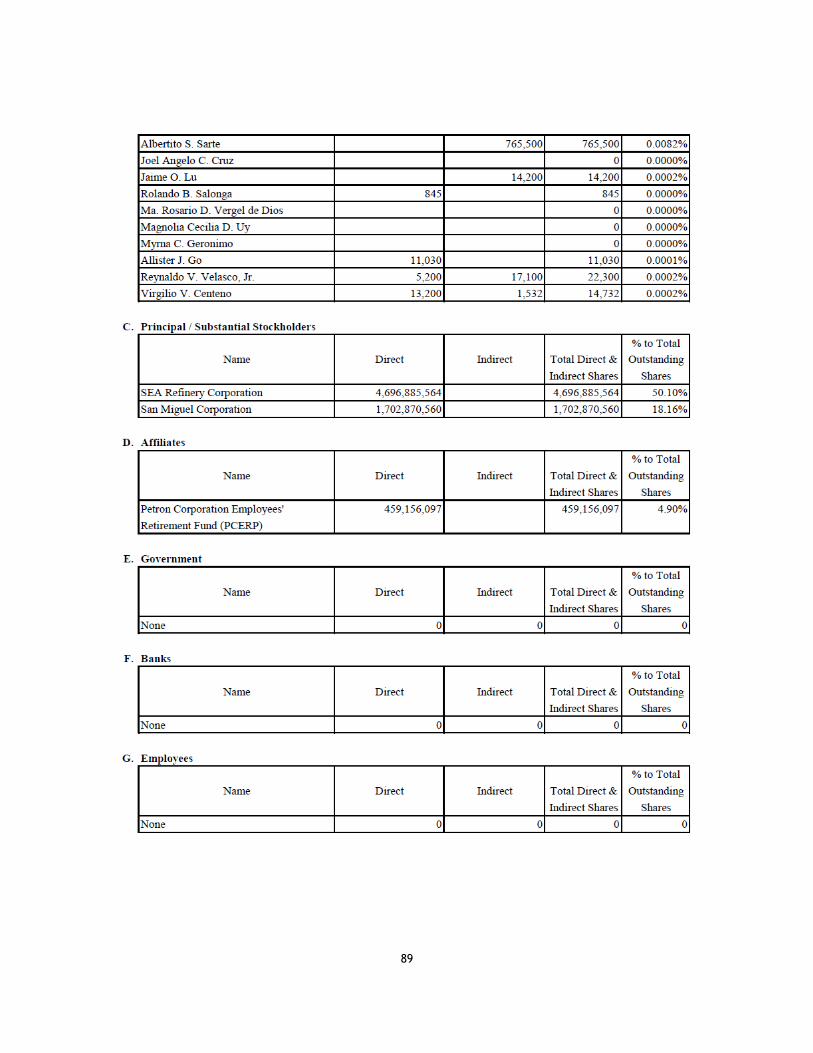
89
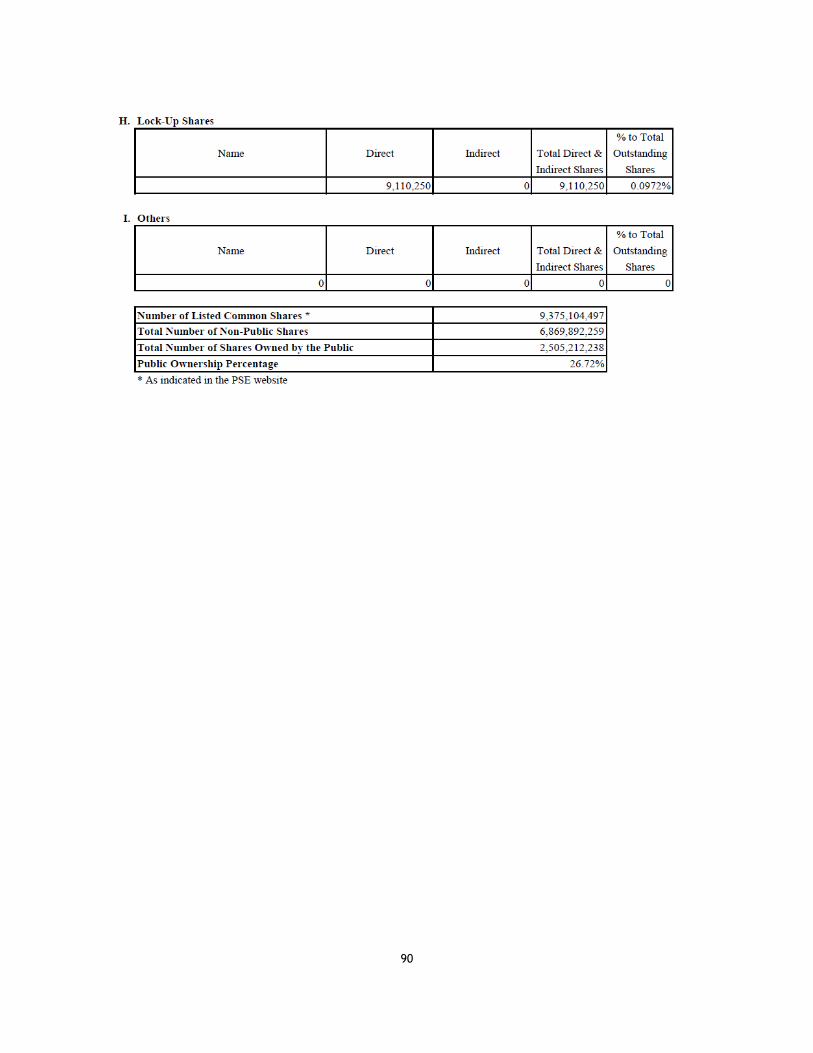
90
91
ANNEX B
Public Ownership Report as of March 31, 2022
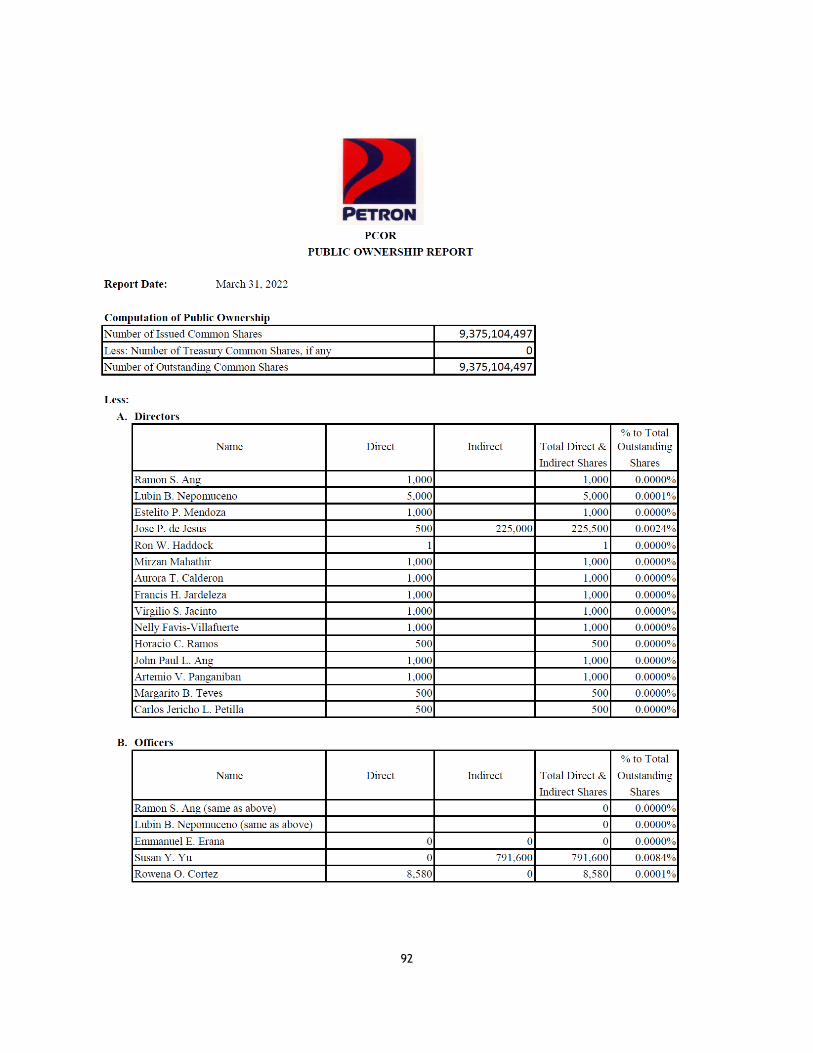
92
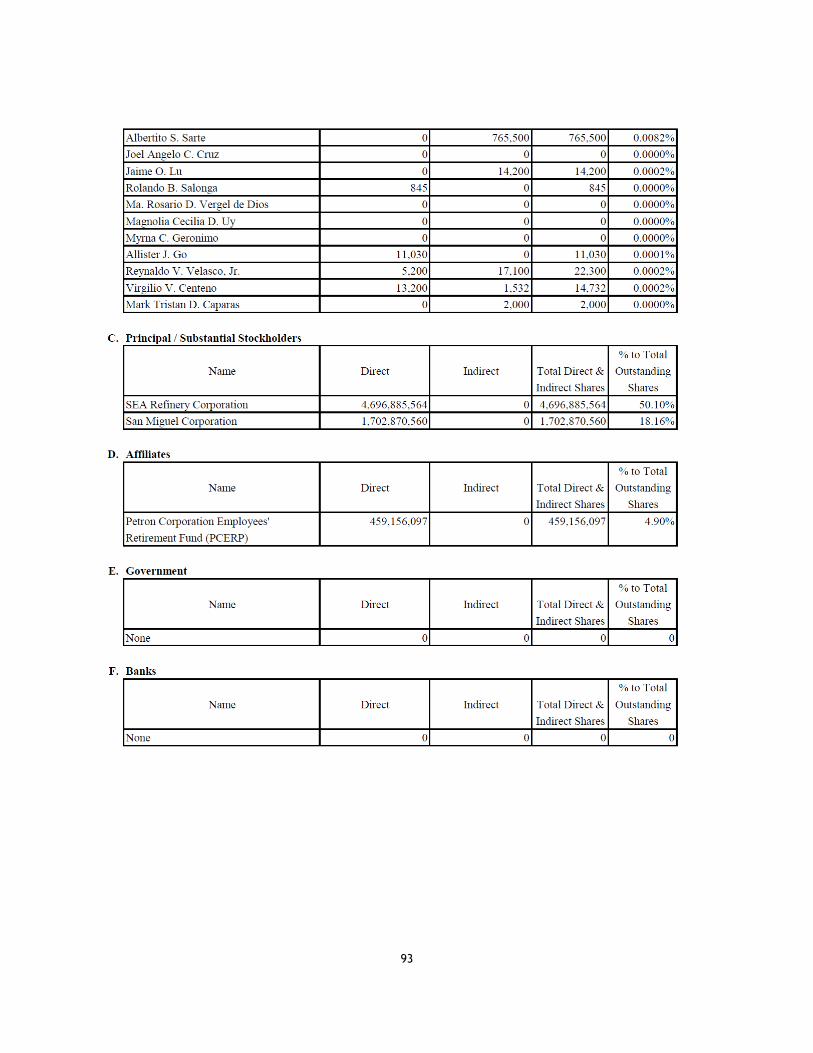
93
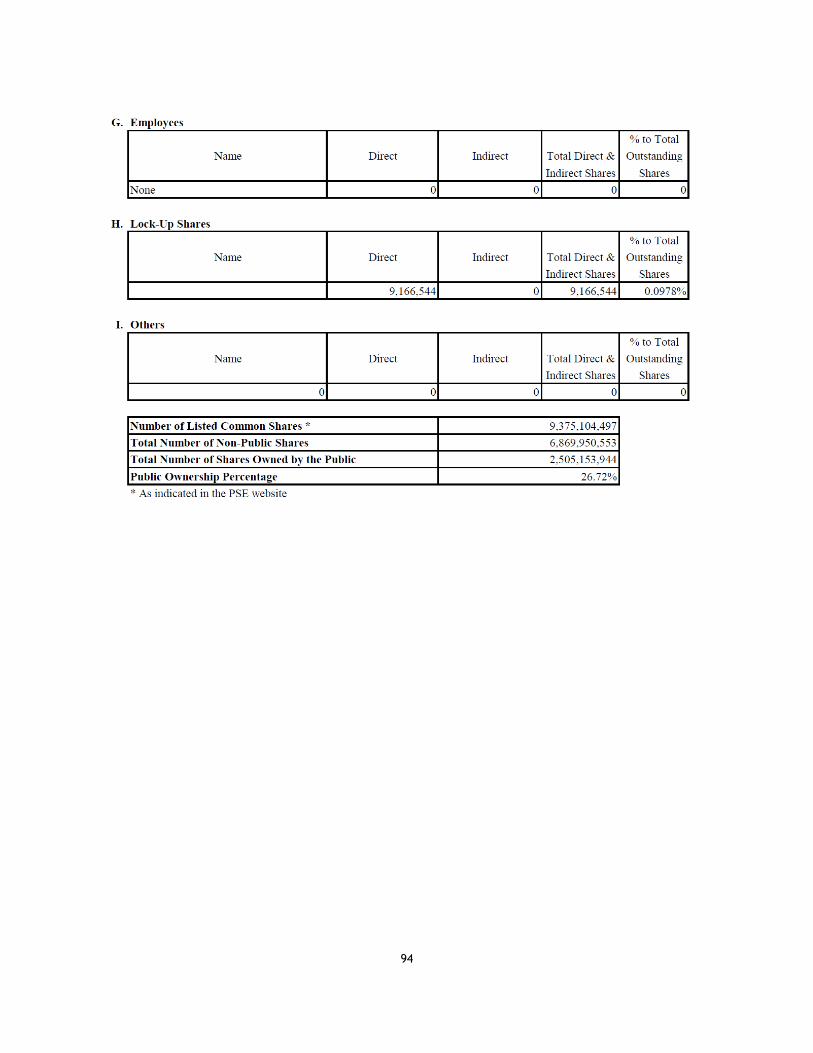
94
95
ANNEX C
2021 Audited Financial Statements, with Statement of Management’s
Responsibility
(Separate Financial Statements and Consolidated Financial Statements)
The following document has been received:
Receiving: AARON PAGKATIPUNAN
Receipt Date and Time: March 25, 2022 04:18:36 PM
Company Information____________________________________________________________________________
SEC Registration No.: 0000031171
Company Name: Petron Corporation
Industry Classification: E40200
Company Type: Stock Corporation
Document Information____________________________________________________________________________
____________________________________________________________________________
Document ID: OST1032520228268465
Document Type: Financial Statement
Document Code: FS
Period Covered: December 31, 2021
Submission Type: Parent
Remarks: None

PETRON CORPORATION SEPARATE FINANCIAL STATEMENTS December 31, 2021 and 2020 With Independent Auditors’ Report
R.G. Manabat & Co. The KPMG Center, 6/F
6787 Ayala Avenue, Makati City
Philippines 1209
Telephone +63 (2) 8885 7000
Fax +63 (2) 8894 1985
Internet www.home.kpmg/ph
Email [email protected]
PRC-BOA Registration No. 0003, valid until November 21, 2023 SEC Accreditation No. 0004-FR-5, Group A, valid until November 15, 2020 IC Accreditation No. F-2017/010-R, valid until August 26, 2020 BSP - Selected External Auditors, Category A, valid for 3-year audit period (2017 to 2019)
R.G. Manabat & Co., a Philippine partnership and a member firm of the KPMG network of independent member firms affiliated with KPMG International Cooperative ("KPMG International"), a Swiss entity.
Firm Regulatory Registration & Accreditation: PRC-BOA Registration No. 0003, valid until November 21, 2023 SEC Accreditation No. 0003-SEC, Group A, valid for five (5) years covering the audit of 2020 to 2024 financial statements (2019 financial statements are covered by SEC Accreditation No. 0004-FR-5) IC Accreditation No. 0003-IC, Group A, valid for five (5) years covering the audit of 2020 to 2024 financial statements (2019 financial statements are covered by IC Circular Letter (CL) No. 2019-39, Transition clause) BSP Accreditation No. 0003-BSP, Group A, valid for five (5) years covering the audit of 2020 to 2024 financial statements (2019 financial statements are covered by BSP Monetary Board Resolution No. 2161, Transition clause)
R.G. Manabat & Co., a Philippine partnership and a member firm of the KPMG global organization of independent member firms
affiliated with KPMG International Limited, a private English company limited by guarantee
REPORT OF INDEPENDENT AUDITORS The Board of Directors and Stockholders Petron Corporation SMC Head Office Complex 40 San Miguel Avenue Mandaluyong City Report on the Audit of the Separate Financial Statements Opinion We have audited the separate financial statements of Petron Corporation (the ”Company”), which comprise the separate statements of financial position as at December 31, 2021 and 2020, and the separate statements of comprehensive income, separate statements of changes in equity and separate statements of cash flows for the years then ended, and notes, comprising significant accounting policies and other explanatory information. In our opinion, the accompanying separate financial statements present fairly, in all material respects, the unconsolidated financial position of the Company as at December 31, 2021 and 2020, and its unconsolidated financial performance and its unconsolidated cash flows for the years then ended, in accordance with Philippine Financial Reporting Standards (PFRS). Basis for Opinion We conducted our audits in accordance with Philippine Standards on Auditing (PSA). Our responsibilities under those standards are further described in the Auditors’ Responsibilities for the Audit of the Separate Financial Statements section of our report. We are independent of the Company in accordance with the Code of Ethics for Professional Accountants in the Philippines (Code of Ethics) together with the ethical requirements that are relevant to our audits of the financial statements in the Philippines, and we have fulfilled our other ethical responsibilities in accordance with these requirements and the Code of Ethics. We believe that the audit evidence we have obtained is sufficient and appropriate to provide a basis for our opinion.
Responsibilities of Management and Those Charged with Governance for the Separate Financial Statements Management is responsible for the preparation and fair presentation of the separate financial statements in accordance with PFRS, and for such internal control as management determines is necessary to enable the preparation of financial statements that are free from material misstatement, whether due to fraud or error. In preparing the separate financial statements, management is responsible for assessing the Company’s ability to continue as a going concern, disclosing, as applicable, matters related to going concern and using the going concern basis of accounting unless management either intends to liquidate the Company or to cease its operations, or has no realistic alternative but to do so. Those charged with governance are responsible for overseeing the Company’s financial reporting process. Auditors’ Responsibilities for the Audit of the Separate Financial Statements Our objectives are to obtain reasonable assurance about whether the separate financial statements as a whole are free from material misstatement, whether due to fraud or error, and to issue an auditors’ report that includes our opinion. Reasonable assurance is a high level of assurance, but is not a guarantee that an audit conducted in accordance with PSA will always detect a material misstatement when it exists. Misstatements can arise from fraud or error and are considered material if, individually or in the aggregate, they could reasonably be expected to influence the economic decisions of users taken on the basis of these separate financial statements. As part of an audit in accordance with PSA, we exercise professional judgment and maintain professional skepticism throughout the audit. We also: Identify and assess the risks of material misstatement of the separate financial
statements, whether due to fraud or error, design and perform audit procedures responsive to those risks, and obtain audit evidence that is sufficient and appropriate to provide a basis for our opinion. The risk of not detecting a material misstatement resulting from fraud is higher than for one resulting from error, as fraud may involve collusion, forgery, intentional omissions, misrepresentations, or the override of internal control.
Obtain an understanding of internal control relevant to the audits in order to design
audit procedures that are appropriate in the circumstances, but not for the purpose of expressing an opinion on the effectiveness of the Company’s internal control.
Evaluate the appropriateness of accounting policies used and the reasonableness of
accounting estimates and related disclosures made by management. Conclude on the appropriateness of management’s use of the going concern basis
of accounting and, based on the audit evidence obtained, whether a material uncertainty exists related to events or conditions that may cast significant doubt on the Company’s ability to continue as a going concern. If we conclude that a material uncertainty exists, we are required to draw attention in our auditors’ report to the related disclosures in the separate financial statements or, if such disclosures are inadequate, to modify our opinion. Our conclusions are based on the audit evidence obtained up to the date of our auditors’ report. However, future events or conditions may cause the Company to cease to continue as a going concern.
Evaluate the overall presentation, structure and content of the separate financial statements, including the disclosures, and whether the separate financial statements represent the underlying transactions and events in a manner that achieves fair presentation.
We communicate with those charged with governance regarding, among other matters, the planned scope and timing of the audit and significant audit findings, including any significant deficiencies in internal control that we identify during our audits. We also provide those charged with governance with a statement that we have complied with relevant ethical requirements regarding independence, and communicate with them all relationships and other matters that may reasonably be thought to bear on our independence, and where applicable, actions taken to eliminate threats or safeguards applied. Report on the Supplementary Information Required Under Revenue Regulations No. 15-2010 of the Bureau of Internal Revenue The supplementary information required for purposes of filing with the Bureau of Internal Revenue is presented by the management of Petron Corporation in a separate schedule. Such supplementary information is not a required part of the separate financial statements. Our opinion on the separate financial statements is not affected by the presentation of the separate information in a separate schedule. The engagement partner on the audit resulting in this independent auditors’ report is Mr. Darwin P. Virocel. R.G. MANABAT & CO. DARWIN P. VIROCEL Partner CPA License No. 0094495 SEC Accreditation No. 94495-SEC, Group A, valid for five (5) years covering the audit of 2019 to 2023 financial statements Tax Identification No. 912-535-864 BIR Accreditation No. 08-001987-031-2019 Issued August 7, 2019; valid until August 6, 2022 PTR No. MKT 8854088 Issued January 3, 2022 at Makati City March 18, 2022 Makati City, Metro Manila
R.G. Manabat & Co. The KPMG Center, 6/F
6787 Ayala Avenue, Makati City
Philippines 1209
Telephone +63 (2) 8885 7000
Fax +63 (2) 8894 1985
Internet www.home.kpmg/ph
Email [email protected]
PRC-BOA Registration No. 0003, valid until November 21, 2023 SEC Accreditation No. 0004-FR-5, Group A, valid until November 15, 2020 IC Accreditation No. F-2017/010-R, valid until August 26, 2020 BSP - Selected External Auditors, Category A, valid for 3-year audit period (2017 to 2019)
R.G. Manabat & Co., a Philippine partnership and a member firm of the KPMG network of independent member firms affiliated with KPMG International Cooperative ("KPMG International"), a Swiss entity.
Firm Regulatory Registration & Accreditation: PRC-BOA Registration No. 0003, valid until November 21, 2023 SEC Accreditation No. 0003-SEC, Group A, valid for five (5) years covering the audit of 2020 to 2024 financial statements (2019 financial statements are covered by SEC Accreditation No. 0004-FR-5) IC Accreditation No. 0003-IC, Group A, valid for five (5) years covering the audit of 2020 to 2024 financial statements (2019 financial statements are covered by IC Circular Letter (CL) No. 2019-39, Transition clause) BSP Accreditation No. 0003-BSP, Group A, valid for five (5) years covering the audit of 2020 to 2024 financial statements (2019 financial statements are covered by BSP Monetary Board Resolution No. 2161, Transition clause)
R.G. Manabat & Co., a Philippine partnership and a member firm of the KPMG global organization of independent member firms
affiliated with KPMG International Limited, a private English company limited by guarantee
REPORT OF INDEPENDENT AUDITORS TO ACCOMPANY FINANCIAL STATEMENTS FOR FILING WITH THE BUREAU OF INTERNAL REVENUE The Board of Directors and Stockholders Petron Corporation SMC Head Office Complex 40 San Miguel Avenue Mandaluyong City We have audited the accompanying separate financial statements of Petron Corporation (the “Company”), as at and for the year ended December 31, 2021, on which we have rendered our report dated March 18, 2022. In compliance with Revenue Regulations V-20, we are stating that no partner of our firm is related by consanguinity or affinity to the president, manager or principal stockholders of the Company. R.G. MANABAT & CO. DARWIN P. VIROCEL Partner CPA License No. 0094495 SEC Accreditation No. 94495-SEC, Group A, valid for five (5) years covering the audit of 2019 to 2023 financial statements Tax Identification No. 912-535-864 BIR Accreditation No. 08-001987-031-2019 Issued August 7, 2019; valid until August 6, 2022 PTR No. MKT 8854088 Issued January 3, 2022 at Makati City March 18, 2022 Makati City, Metro Manila
R.G. Manabat & Co. The KPMG Center, 6/F
6787 Ayala Avenue, Makati City
Philippines 1209
Telephone +63 (2) 8885 7000
Fax +63 (2) 8894 1985
Internet www.home.kpmg/ph
Email [email protected]
Firm Regulatory Registration & Accreditation: PRC-BOA Registration No. 0003, valid until November 21, 2023 SEC Accreditation No. 0003-SEC, Group A, valid for five (5) years covering the audit of 2020 to 2024 financial statements (2019 financial statements are covered by SEC Accreditation No. 0004-FR-5) IC Accreditation No. 0003-IC, Group A, valid for five (5) years covering the audit of 2020 to 2024 financial statements (2019 financial statements are covered by IC Circular Letter (CL) No. 2019-39, Transition clause) BSP Accreditation No. 0003-BSP, Group A, valid for five (5) years covering the audit of 2020 to 2024 financial statements (2019 financial statements are covered by BSP Monetary Board Resolution No. 2161, Transition clause)
R.G. Manabat & Co., a Philippine partnership and a member firm of the KPMG global organization of independent member firms affiliated with KPMG International Limited, a private English company limited by guarantee
REPORT OF INDEPENDENT AUDITORS TO ACCOMPANY FINANCIAL STATEMENTS FOR FILING WITH THE BUREAU OF INTERNAL REVENUE The Board of Directors and Stockholders Petron Corporation SMC Head Office Complex 40 San Miguel Avenue Mandaluyong City We have audited the accompanying separate financial statements of Petron Corporation
(the “Company”) as at and for the year ended December 31, 2021, on which we have
rendered our report dated March 18, 2022.
In compliance with Revenue Regulation 5-2021, we are certifying in connection with the
foreign-sourced dividends received by the Company for the year ended December 31,
2021 the following:
(i) The Company received the dividends amounting to:
(a) Six Million Three Hundred Thousand Dollars (US$6,300,000) on June 18,
2021 from Petron Singapore Trading Pte. Ltd. (“PSTPL”), a 100%-owned
subsidiary of the Company, incorporated and registered under the laws of
Singapore, since May 13, 2010 to the present;
(b) Two Million Four Hundred Forty One Thousand Two Hundred Eighty One
and 18/100 Dollars (US$2,441,281.18) on July 22, 2021 from Petron Oil and
Gas Mauritius Ltd. (“POGM”), 100%-owned subsidiary of the Company,
incorporated and registered under the laws of Mauritius, since February 8, 2012
to the present;
(c) Four Million Nine Hundred Seven Thousand Eight Hundred Forty Five and
37/100 Dollars (US$4,907,845.37) on October 29, 2021 from POGM; and
(d) Eleven Million Dollars (US$11,000,000) on December 22, 2021 from PSTPL.
(ii) The Company, through its Board of Directors, has appropriated to reinvest the
dividends in its business operations to fund its working capital requirements; and
(iii) The total amount of dividends received has been disbursed as of December 31,
2021 and such disbursement complied with requirement (ii).
R.G. MANABAT & CO. DARWIN P. VIROCEL Partner CPA License No. 0094495 SEC Accreditation No. 94495-SEC, Group A, valid for five (5) years covering the audit of 2019 to 2023 financial statements Tax Identification No. 912-535-864 BIR Accreditation No. 08-001987-031-2019 Issued August 7, 2019; valid until August 6, 2022 PTR No. MKT 8854088 Issued January 3, 2022 at Makati City March 18, 2022 Makati City, Metro Manila
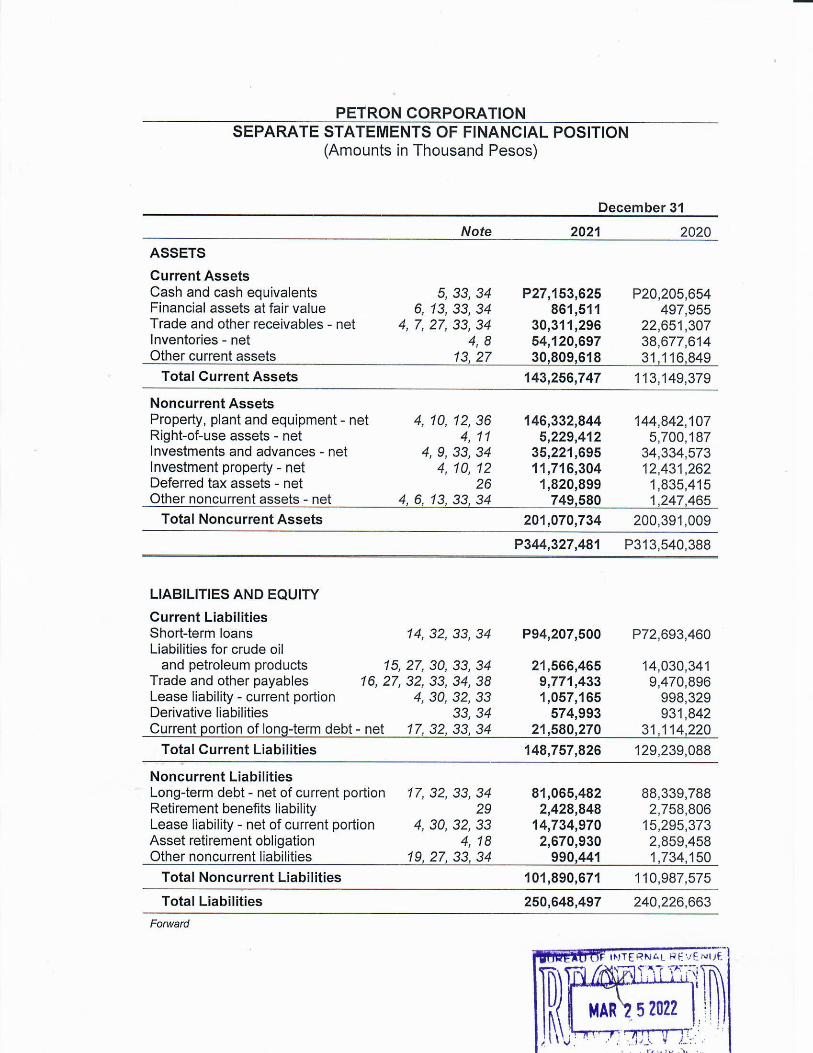
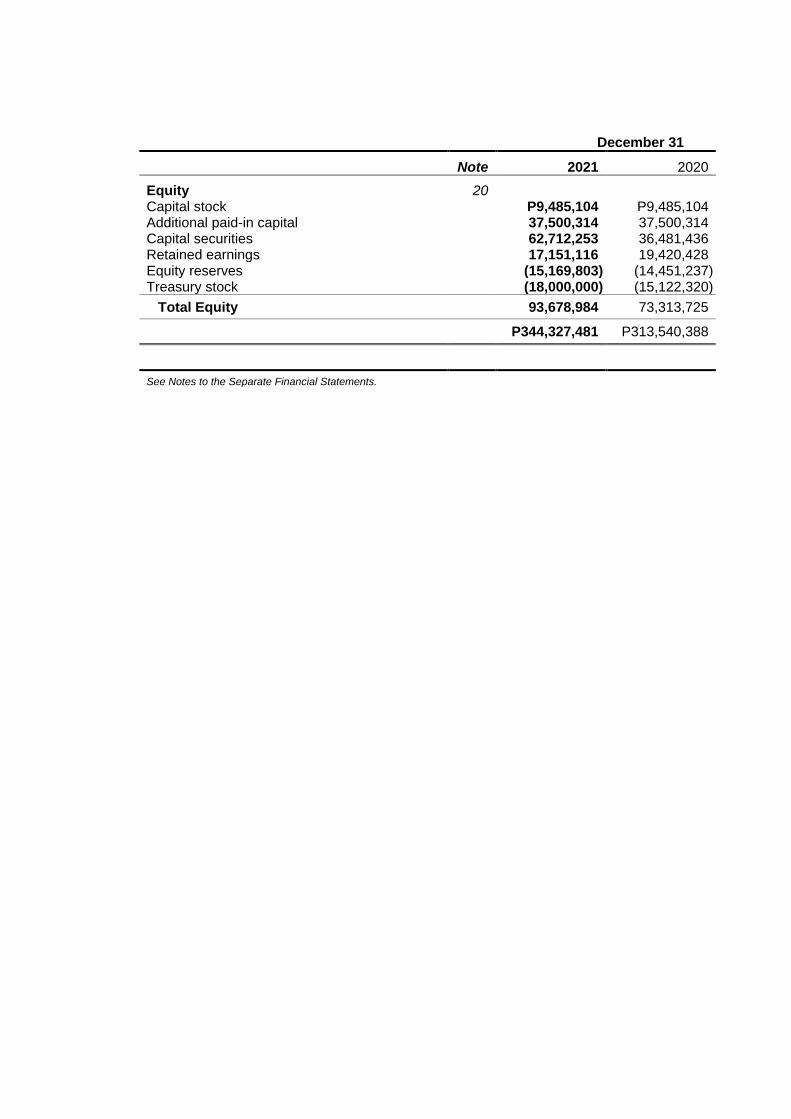
December 31
Note 2021 2020
Equity 20 Capital stock P9,485,104 P9,485,104 Additional paid-in capital 37,500,314 37,500,314 Capital securities 62,712,253 36,481,436 Retained earnings 17,151,116 19,420,428 Equity reserves (15,169,803) (14,451,237) Treasury stock (18,000,000) (15,122,320)
Total Equity 93,678,984 73,313,725
P344,327,481 P313,540,388
See Notes to the Separate Financial Statements.
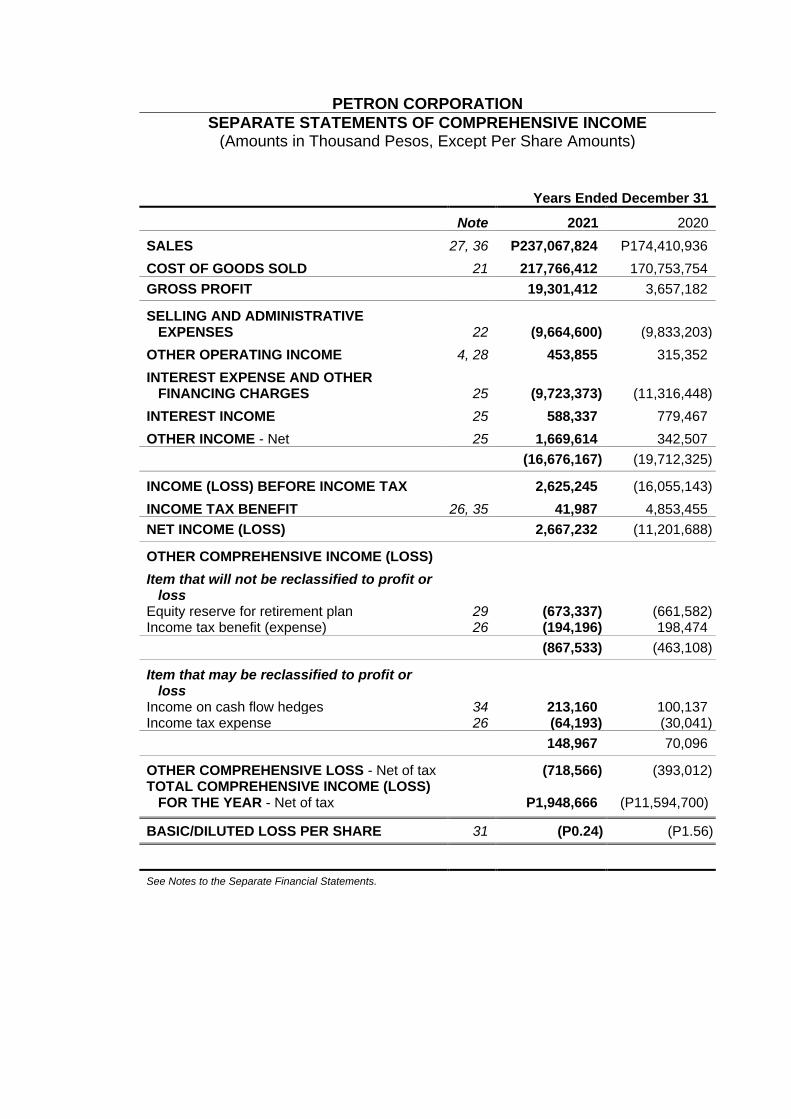
PETRON CORPORATION
SEPARATE STATEMENTS OF COMPREHENSIVE INCOME (Amounts in Thousand Pesos, Except Per Share Amounts)
Years Ended December 31
Note 2021 2020
SALES 27, 36 P237,067,824 P174,410,936
COST OF GOODS SOLD 21 217,766,412 170,753,754
GROSS PROFIT 19,301,412 3,657,182
SELLING AND ADMINISTRATIVE EXPENSES 22 (9,664,600) (9,833,203)
OTHER OPERATING INCOME 4, 28 453,855 315,352
INTEREST EXPENSE AND OTHER FINANCING CHARGES 25 (9,723,373) (11,316,448)
INTEREST INCOME 25 588,337 779,467
OTHER INCOME - Net 25 1,669,614 342,507
(16,676,167) (19,712,325)
INCOME (LOSS) BEFORE INCOME TAX 2,625,245 (16,055,143)
INCOME TAX BENEFIT 26, 35 41,987 4,853,455
NET INCOME (LOSS) 2,667,232 (11,201,688)
OTHER COMPREHENSIVE INCOME (LOSS)
Item that will not be reclassified to profit or loss
Equity reserve for retirement plan 29 (673,337) (661,582) Income tax benefit (expense) 26 (194,196) 198,474
(867,533) (463,108)
Item that may be reclassified to profit or loss
Income on cash flow hedges 34 213,160 100,137 Income tax expense 26 (64,193) (30,041)
148,967 70,096
OTHER COMPREHENSIVE LOSS - Net of tax (718,566) (393,012) TOTAL COMPREHENSIVE INCOME (LOSS)
FOR THE YEAR - Net of tax P1,948,666 (P11,594,700)
BASIC/DILUTED LOSS PER SHARE 31 (P0.24) (P1.56)
See Notes to the Separate Financial Statements.
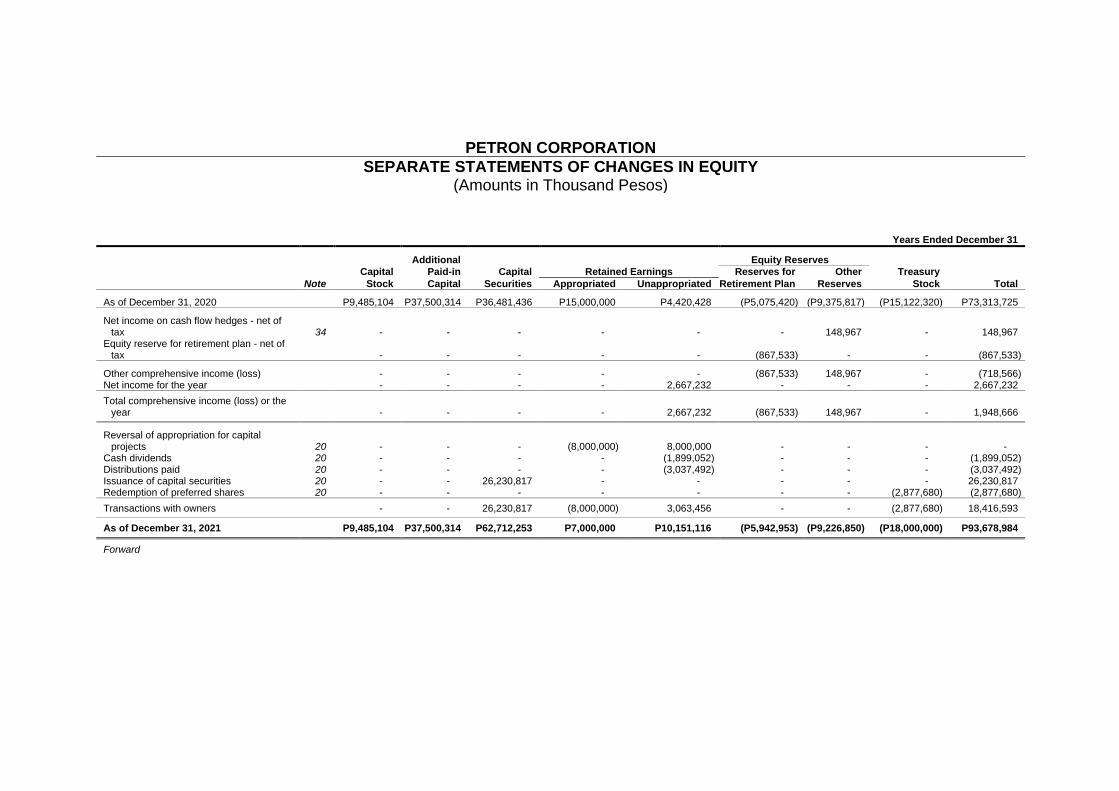
PETRON CORPORATION
SEPARATE STATEMENTS OF CHANGES IN EQUITY (Amounts in Thousand Pesos)
Years Ended December 31
Additional Equity Reserves Capital Paid-in Capital Retained Earnings Reserves for Other Treasury
Note Stock Capital Securities Appropriated Unappropriated Retirement Plan Reserves Stock Total
As of December 31, 2020 P9,485,104 P37,500,314 P36,481,436 P15,000,000 P4,420,428 (P5,075,420) (P9,375,817) (P15,122,320) P73,313,725
Net income on cash flow hedges - net of tax 34 - - - - - - 148,967 - 148,967
Equity reserve for retirement plan - net of tax - - - - - (867,533) - - (867,533)
Other comprehensive income (loss) - - - - - (867,533) 148,967 - (718,566) Net income for the year - - - - 2,667,232 - - - 2,667,232
Total comprehensive income (loss) or the year
- - - - 2,667,232 (867,533) 148,967 - 1,948,666
Reversal of appropriation for capital projects 20 - - - (8,000,000) 8,000,000 - - - -
Cash dividends 20 - - - - (1,899,052) - - - (1,899,052) Distributions paid 20 - - - - (3,037,492) - - - (3,037,492) Issuance of capital securities 20 - - 26,230,817 - - - - - 26,230,817 Redemption of preferred shares 20 - - - - - - - (2,877,680) (2,877,680)
Transactions with owners - - 26,230,817 (8,000,000) 3,063,456 - - (2,877,680) 18,416,593
As of December 31, 2021
P9,485,104 P37,500,314 P62,712,253 P7,000,000 P10,151,116 (P5,942,953) (P9,226,850) (P18,000,000) P93,678,984
Forward
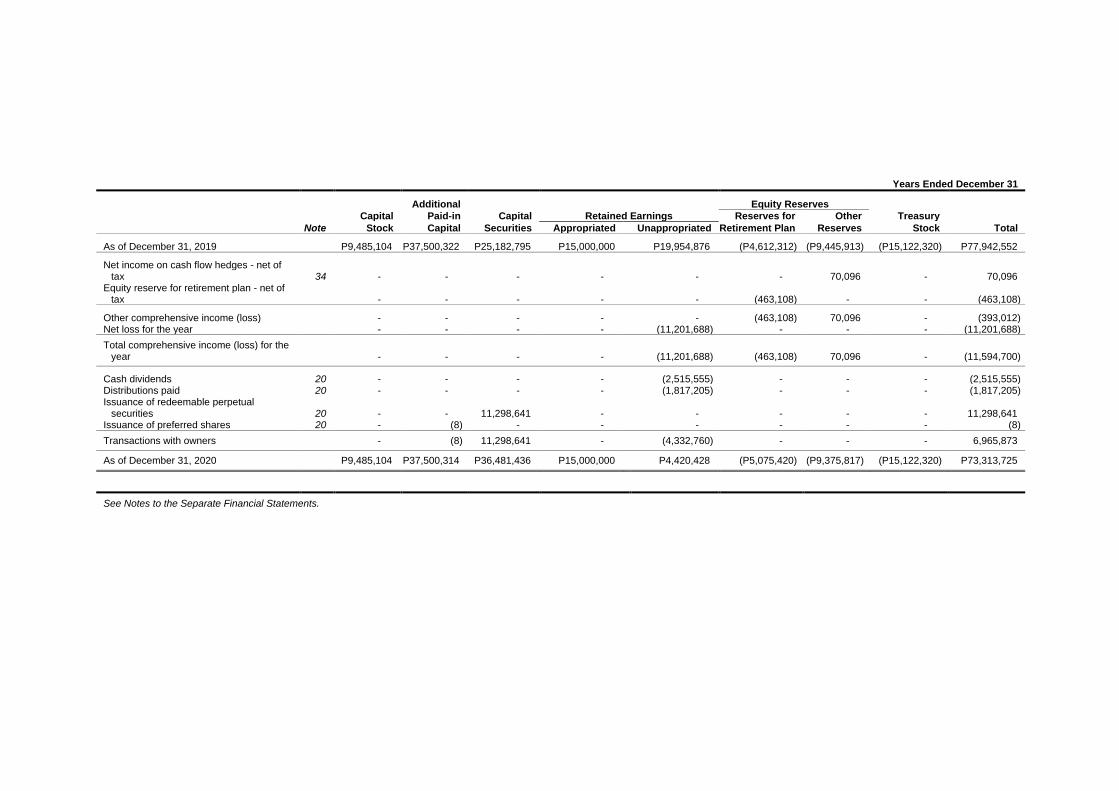
Years Ended December 31
Additional Equity Reserves Capital Paid-in Capital Retained Earnings Reserves for Other Treasury
Note Stock Capital Securities Appropriated Unappropriated Retirement Plan Reserves Stock Total
As of December 31, 2019 P9,485,104 P37,500,322 P25,182,795 P15,000,000 P19,954,876 (P4,612,312) (P9,445,913) (P15,122,320) P77,942,552
Net income on cash flow hedges - net of tax 34 - - - - - - 70,096 - 70,096
Equity reserve for retirement plan - net of tax - - - - - (463,108) - - (463,108)
Other comprehensive income (loss) - - - - - (463,108) 70,096 - (393,012) Net loss for the year - - - - (11,201,688) - - - (11,201,688)
Total comprehensive income (loss) for the year
- - - - (11,201,688) (463,108) 70,096 - (11,594,700)
Cash dividends 20 - - - - (2,515,555) - - - (2,515,555) Distributions paid 20 - - - - (1,817,205) - - - (1,817,205) Issuance of redeemable perpetual
securities 20 - - 11,298,641 - - - - - 11,298,641 Issuance of preferred shares 20 - (8) - - - - - - (8)
Transactions with owners - (8) 11,298,641 - (4,332,760) - - - 6,965,873
As of December 31, 2020
P9,485,104 P37,500,314 P36,481,436 P15,000,000 P4,420,428 (P5,075,420) (P9,375,817) (P15,122,320) P73,313,725
See Notes to the Separate Financial Statements.
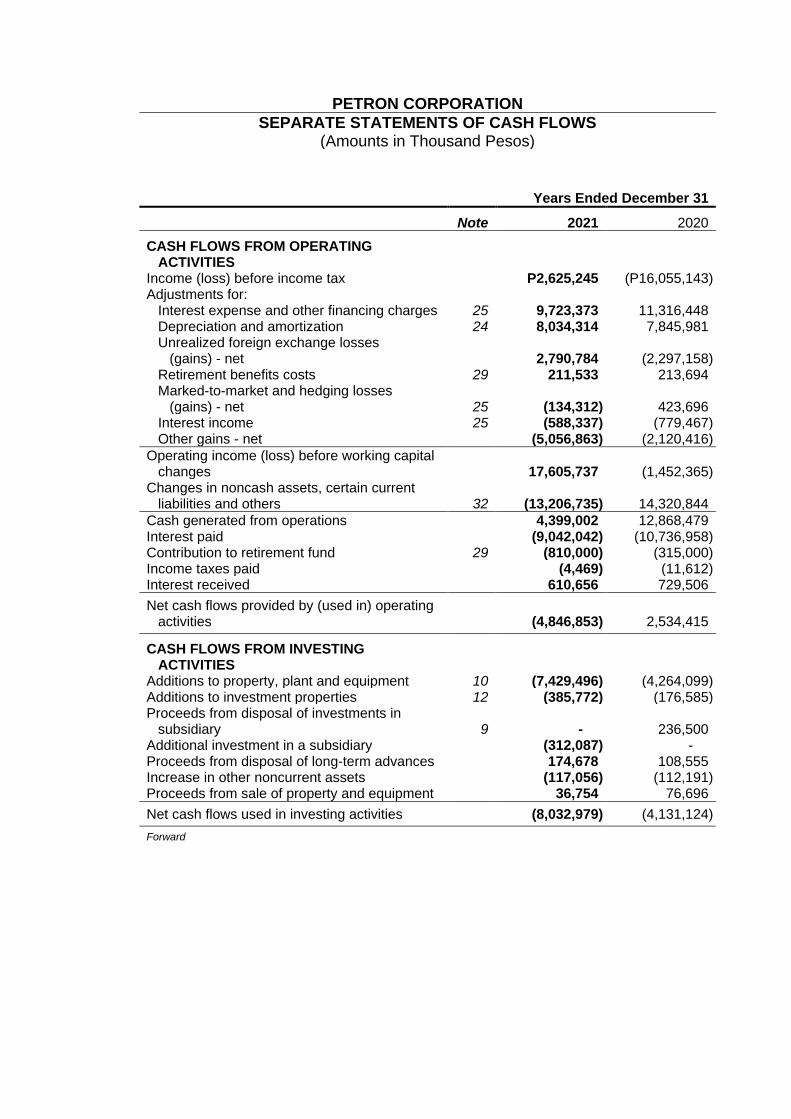
PETRON CORPORATION
SEPARATE STATEMENTS OF CASH FLOWS (Amounts in Thousand Pesos)
Years Ended December 31
Note 2021 2020
CASH FLOWS FROM OPERATING ACTIVITIES
Income (loss) before income tax P2,625,245 (P16,055,143) Adjustments for:
Interest expense and other financing charges 25 9,723,373 11,316,448 Depreciation and amortization 24 8,034,314 7,845,981 Unrealized foreign exchange losses
(gains) - net 2,790,784 (2,297,158) Retirement benefits costs 29 211,533 213,694 Marked-to-market and hedging losses
(gains) - net 25 (134,312) 423,696 Interest income 25 (588,337) (779,467) Other gains - net (5,056,863) (2,120,416)
Operating income (loss) before working capital changes 17,605,737 (1,452,365)
Changes in noncash assets, certain current liabilities and others 32 (13,206,735) 14,320,844
Cash generated from operations 4,399,002 12,868,479 Interest paid (9,042,042) (10,736,958) Contribution to retirement fund 29 (810,000) (315,000) Income taxes paid (4,469) (11,612) Interest received 610,656 729,506
Net cash flows provided by (used in) operating activities (4,846,853) 2,534,415
CASH FLOWS FROM INVESTING ACTIVITIES
Additions to property, plant and equipment 10 (7,429,496) (4,264,099) Additions to investment properties 12 (385,772) (176,585) Proceeds from disposal of investments in
subsidiary 9 - 236,500 Additional investment in a subsidiary (312,087) - Proceeds from disposal of long-term advances 174,678 108,555 Increase in other noncurrent assets (117,056) (112,191) Proceeds from sale of property and equipment 36,754 76,696
Net cash flows used in investing activities (8,032,979) (4,131,124)
Forward
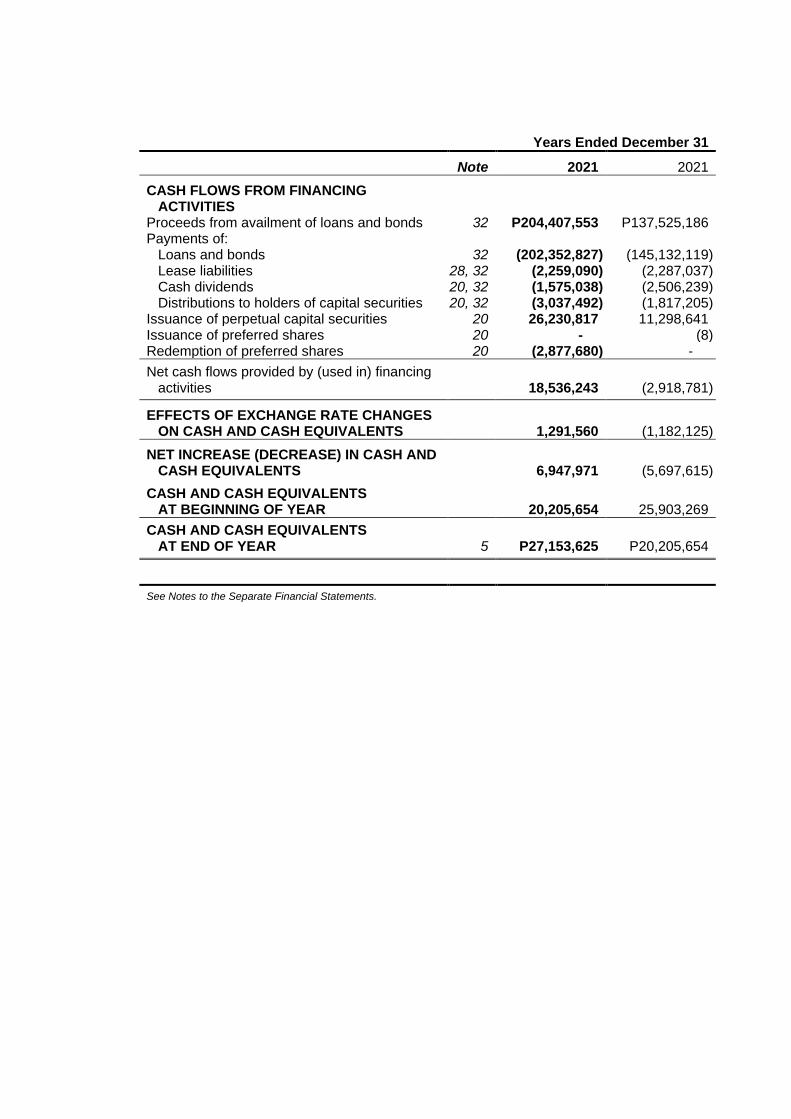
Years Ended December 31
Note 2021 2021
CASH FLOWS FROM FINANCING ACTIVITIES
Proceeds from availment of loans and bonds 32 P204,407,553 P137,525,186 Payments of:
Loans and bonds 32 (202,352,827) (145,132,119) Lease liabilities 28, 32 (2,259,090) (2,287,037) Cash dividends 20, 32 (1,575,038) (2,506,239) Distributions to holders of capital securities 20, 32 (3,037,492) (1,817,205)
Issuance of perpetual capital securities 20 26,230,817 11,298,641 Issuance of preferred shares 20 - (8) Redemption of preferred shares 20 (2,877,680) -
Net cash flows provided by (used in) financing activities 18,536,243 (2,918,781)
EFFECTS OF EXCHANGE RATE CHANGES ON CASH AND CASH EQUIVALENTS 1,291,560 (1,182,125)
NET INCREASE (DECREASE) IN CASH AND CASH EQUIVALENTS 6,947,971 (5,697,615)
CASH AND CASH EQUIVALENTS AT BEGINNING OF YEAR 20,205,654 25,903,269
CASH AND CASH EQUIVALENTS AT END OF YEAR 5 P27,153,625 P20,205,654
See Notes to the Separate Financial Statements.
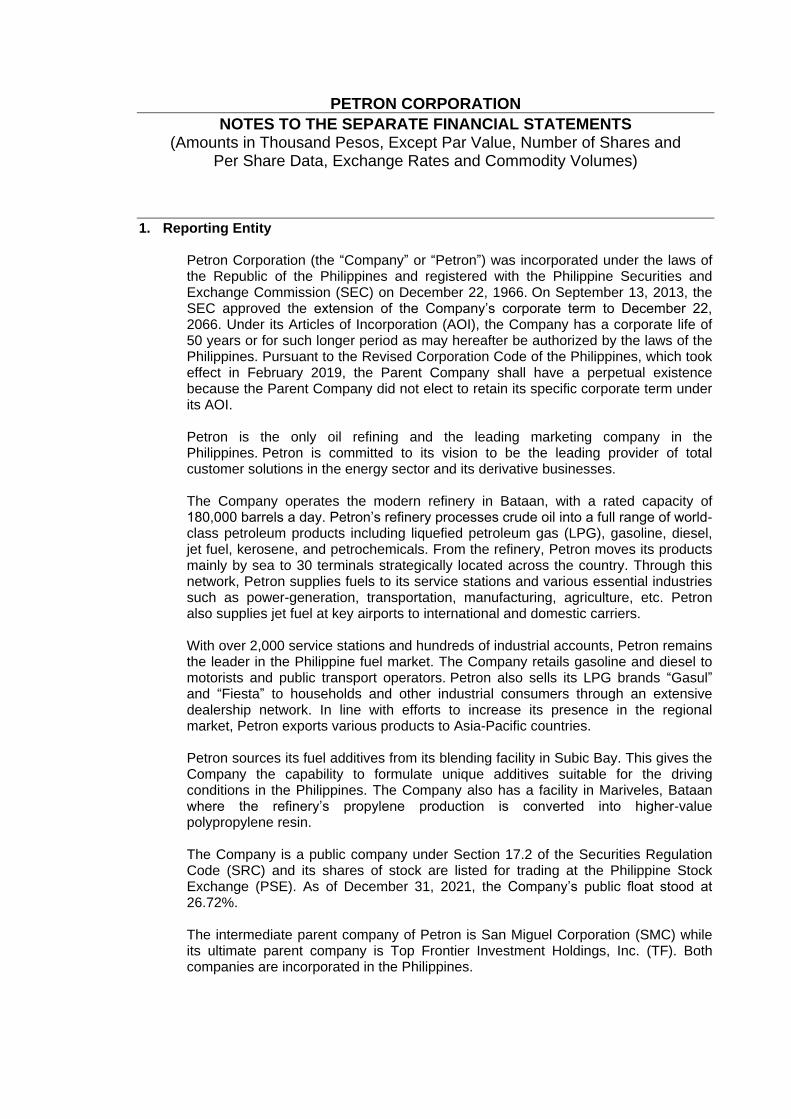
PETRON CORPORATION
NOTES TO THE SEPARATE FINANCIAL STATEMENTS (Amounts in Thousand Pesos, Except Par Value, Number of Shares and
Per Share Data, Exchange Rates and Commodity Volumes)
1. Reporting Entity Petron Corporation (the “Company” or “Petron”) was incorporated under the laws of the Republic of the Philippines and registered with the Philippine Securities and Exchange Commission (SEC) on December 22, 1966. On September 13, 2013, the SEC approved the extension of the Company’s corporate term to December 22, 2066. Under its Articles of Incorporation (AOI), the Company has a corporate life of 50 years or for such longer period as may hereafter be authorized by the laws of the Philippines. Pursuant to the Revised Corporation Code of the Philippines, which took effect in February 2019, the Parent Company shall have a perpetual existence because the Parent Company did not elect to retain its specific corporate term under its AOI. Petron is the only oil refining and the leading marketing company in the Philippines. Petron is committed to its vision to be the leading provider of total customer solutions in the energy sector and its derivative businesses. The Company operates the modern refinery in Bataan, with a rated capacity of 180,000 barrels a day. Petron’s refinery processes crude oil into a full range of world-class petroleum products including liquefied petroleum gas (LPG), gasoline, diesel, jet fuel, kerosene, and petrochemicals. From the refinery, Petron moves its products mainly by sea to 30 terminals strategically located across the country. Through this network, Petron supplies fuels to its service stations and various essential industries such as power-generation, transportation, manufacturing, agriculture, etc. Petron also supplies jet fuel at key airports to international and domestic carriers. With over 2,000 service stations and hundreds of industrial accounts, Petron remains the leader in the Philippine fuel market. The Company retails gasoline and diesel to motorists and public transport operators. Petron also sells its LPG brands “Gasul” and “Fiesta” to households and other industrial consumers through an extensive dealership network. In line with efforts to increase its presence in the regional market, Petron exports various products to Asia-Pacific countries. Petron sources its fuel additives from its blending facility in Subic Bay. This gives the Company the capability to formulate unique additives suitable for the driving conditions in the Philippines. The Company also has a facility in Mariveles, Bataan where the refinery’s propylene production is converted into higher-value polypropylene resin. The Company is a public company under Section 17.2 of the Securities Regulation Code (SRC) and its shares of stock are listed for trading at the Philippine Stock Exchange (PSE). As of December 31, 2021, the Company’s public float stood at 26.72%. The intermediate parent company of Petron is San Miguel Corporation (SMC) while its ultimate parent company is Top Frontier Investment Holdings, Inc. (TF). Both companies are incorporated in the Philippines.
- 2 -
The registered office address of Petron is SMC Head Office Complex, 40 San Miguel Avenue, Mandaluyong City.
2. Basis of Preparation Statement of Compliance The accompanying separate financial statements have been prepared in compliance with Philippine Financial Reporting Standards (PFRS). PFRS are based on International Financial Reporting Standards (IFRS) issued by the International Accounting Standards Board (IASB). PFRS consist of PFRS, Philippine Accounting Standards (PAS) and Philippine Interpretations issued by the Financial Reporting Standards Council (FRSC). The Company also prepares and issues consolidated financial statements for the same period as the separate financial statements presented in compliance with PFRS. These may be obtained at the Company’s registered office address (Note 1). The separate financial statements were approved and authorized for issuance by the Board of Directors (BOD) on March 8, 2022. Basis of Measurement The separate financial statements of the Company have been prepared on the historical cost basis of accounting except for the following items which are measured on an alternative basis at each reporting date: Items Measurement Bases
Derivative financial instruments Fair value Financial assets at fair value through
profit or loss (FVPL) Fair value Financial assets at fair value through
other comprehensive income (FVOCI) Fair value Retirement benefits liability Present value of the defined benefit
obligation less fair value of plan assets
Functional and Presentation Currency The separate financial statements are presented in Philippine peso, which is the Company’s functional currency. All financial information presented in Philippine peso is rounded off to the nearest thousand (P000), except when otherwise indicated.
- 3 -
3. Significant Accounting Policies The accounting policies set out below have been applied consistently to all periods presented in these separate financial statements, except for the changes in accounting policies as explained below. Adoption of New or Revised Standards, Amended to Standards and Interpretations The Company has adopted the following new and amended standards and interpretations starting January 1, 2021 and accordingly, changed its accounting policies. Except as otherwise indicated, the adoption of the new and amended standards and interpretations did not have a material effect on the Company’s separate financial statements. Coronavirus Disease 2019 (COVID-19) - Related Rent Concessions
(Amendments to PFRS 16, Leases). The amendments introduce an optional practical expedient that simplifies how a lessee accounts for rent concessions that are a direct consequence of COVID-19. A lessee that applies the practical expedient is not required to assess whether eligible rent concessions are lease modifications, and accounts for them in accordance with other applicable guidance. The practical expedient apply if:
• the revised consideration is substantially the same or less than the original consideration;
• the reduction in lease payments relates to payments due on or before June 30, 2021; and
• no other substantive changes have been made to the terms of the lease. Lessees applying the practical expedient are required to disclose that fact, whether they have applied the practical expedient to all eligible rent concessions and, if not, the nature of the contracts to which they have applied the practical expedient; and the amount recognized in profit or loss for the reporting period arising from application of the practical expedient. No practical expedient is provided for lessors. A lessee applies the amendments retrospectively, recognizing the cumulative effect of the amendments as an adjustment to the opening balance of retained earnings or other component of equity, as appropriate.
Standards Issued but Not Yet Adopted A number of new and amended standards are effective for annual periods beginning after January 1, 2021. However, the Company has not early adopted the following new or amended standards in preparing these consolidated financial statements. Unless otherwise stated, none of these are expected to have a significant impact on the Company’s separate financial statements. The Company will adopt the following new and amended standards on the respective effective dates:
COVID-19-Related Rent Concessions beyond 30 June 2021 (Amendment to
PFRS 16 Leases). The amendment extends the practical expedient introduced in the 2020 amendment which simplified how a lessee accounts for rent concessions that are a direct consequence of COVID-19, permitting lessees to apply the practical expedient to rent concessions for which any reduction in lease payments affects only payments originally due on or before June 30, 2022.

- 4 -
The amendment is effective for annual reporting periods beginning on or after April 1, 2021. Earlier application is permitted. A lessee applies the amendments retrospectively, recognizing the cumulative effect of the amendments as an adjustment to the opening balance of retained earnings or other component of equity, as appropriate. The adoption is mandatory for lessees that chose to apply the practical expedient introduced by the 2020 amendments and may result in reversal of lease modifications that was ineligible for the practical expedient under the 2020 amendments, but becomes eligible as a result of the extension.
Property, Plant and Equipment - Proceeds before Intended Use (Amendments to PAS 16, Property, Plant and Equipment). The amendments prohibit an entity from deducting from the cost of an item of property, plant and equipment the proceeds from selling items produced before that asset is available for use. The proceeds before intended use should be recognized in profit or loss, together with the costs of producing those items which are identified and measured in accordance with PAS 2, Inventories. The amendments also clarify that testing whether an item of property, plant and equipment is functioning properly means assessing its technical and physical performance rather than assessing its financial performance. For the sale of items that are not part of an entity’s ordinary activities, the amendments require the company to disclose separately the sales proceeds and related production cost recognized in profit or loss and specify the line items in which such proceeds and costs are included in the statement of comprehensive income. This disclosure is not required if such proceeds and cost are presented separately in the statement of comprehensive income. The amendments are effective for annual reporting periods beginning on or after January 1, 2022. Earlier application is permitted. The amendments apply retrospectively, but only to items of property, plant and equipment made available for use on or after the beginning of the earliest period presented in the financial statements in which an entity first applies the amendments.
Onerous Contracts - Cost of Fulfilling a Contract (Amendments to PAS 37, Provisions, Contingent Liabilities and Contingent Assets). The amendments clarify that the cost of fulfilling a contract when assessing whether a contract is onerous includes all costs that relate directly to a contract - i.e. it comprise both incremental costs and an allocation of other direct costs. The amendments are effective for annual reporting periods beginning on or after January 1, 2022 to contracts existing at the date when the amendments are first applied. At the date of initial application, the cumulative effect of applying the amendments is recognized as an opening balance adjustment to retained earnings or other component of equity, as appropriate. The comparatives are not restated. Earlier application is permitted.
- 5 -
Annual Improvements to PFRS Standards 2018-2020. This cycle of improvements contains amendments to four standards of which the following are applicable to the Company:
• Fees in the ‘10 per cent’ Test for Derecognition of Financial Liabilities (Amendment to PFRS 9). The amendment clarifies that for the purpose of performing the ’10 per cent’ test for derecognition of financial liabilities, the fees paid net of fees received included in the discounted cash flows include only fees paid or received between the borrower and the lender, including fees paid or received by either the borrower or lender on the other’s behalf. It applies to financial liabilities that are modified or exchanged on or after the beginning of the annual reporting period in which the entity first applies the amendment.
• Lease Incentives (Amendment to Illustrative Examples accompanying PFRS 16). The amendment deletes from the Illustrative Example 13 the reimbursement relating to leasehold improvements to remove the potential for confusion because the example had not explained clearly enough the conclusion as to whether the reimbursement would meet the definition of a lease incentive in PFRS 16.
• Taxation in Fair Value Measurements (Amendment to PAS 41, Agriculture). The amendment removes the requirement to exclude cash flows for taxation when measuring fair value, thereby aligning the fair value measurement requirements in PAS 41 with those in PFRS 13, Fair Value Measurement. It applies to fair value measurements on or after the beginning of the first annual reporting period beginning on or after January 1, 2022.
The amendments are effective for annual reporting periods beginning on or after January 1, 2022. Earlier application is permitted.
Reference to the Conceptual Framework (Amendment to PFRS 3, Business
Combinations). The amendments:
• updated PFRS 3 so that it now refers to the 2018 Conceptual Framework;
• added a requirement that, for transactions and other events within the scope of PAS 37 or IFRIC 21, Levies, an acquirer applies PAS 37 or IFRIC 21 instead of the Conceptual Framework to identify the liabilities it has assumed in a business combination; and
• added an explicit statement that an acquirer does not recognize contingent assets acquired in a business combination.
The amendments are effective for business combinations occurring in reporting periods starting on or after January 1, 2022. Earlier application is permitted.
Classification of Liabilities as Current or Noncurrent (Amendments to PAS 1, Presentation of Financial Statements). To promote consistency in application and clarify the requirements on determining whether a liability is current or noncurrent, the amendments:
• removed the requirement for a right to defer settlement of a liability for at least 12 months after the reporting period to be unconditional and instead requires that the right must have substance and exist at the end of the reporting period;
- 6 -
• clarified that a right to defer settlement exists only if an entity complies with conditions specified in the loan agreement at the end of the reporting period, even if the lender does not test compliance until a later date; and
• clarified that settlement of a liability includes transferring an entity’s own equity instruments to the counterparty, but conversion options that are classified as equity do not affect classification of the liability as current or noncurrent.
The amendments apply retrospectively for annual reporting periods beginning on or after January 1, 2023, with early application permitted. In November 2021, the International Accounting Standards Board issued the Exposure Draft, Non-Current Liabilities with Covenants after considering stakeholder feedback on the December 2020 tentative agenda decision issued by the IFRS Interpretations Committee about the amendments. The exposure draft proposes to again amend IAS 1 as follows:
• Conditions which the entity must comply within twelve months after the reporting period will have no effect on the classification as current or non-current.
• Additional disclosure requirements will apply to non-current liabilities subject to such conditions to enable the assessment of the risk that the liability could become repayable within twelve months.
• Separate presentation in the statement of financial position will be required for non-current liabilities for which the right to defer settlement is subject to conditions within 12 months after the reporting period.
• The effective date of the amendments will be deferred to no earlier than January 1, 2024.
Comments on the Exposure Draft is due on March 21, 2022.
Definition of Accounting Estimates (Amendments to PAS 8, Accounting Policies,
Changes in Accounting Estimates and Errors). The amendments clarify that accounting estimates are monetary amounts in the financial statements that are subject to measurement uncertainty. The amendments also clarify the relationship between accounting policies and accounting estimates by specifying that an entity develops an accounting estimate to achieve the objective set out by an accounting policy. Developing an accounting estimate includes selecting a measurement technique (estimate or valuation technique) and choosing the inputs to be used when applying the chosen measurement technique. The effects of changes in the inputs or measurement techniques are changes in accounting estimates. The amendments are effective for annual reporting periods beginning on or after January 1, 2023. Earlier application is permitted. The amendments apply prospectively to changes in accounting estimates and changes in accounting policies occurring on or after the beginning of the first annual reporting period in which the entity applies the amendments.
- 7 -
Disclosure of Accounting Policies (Amendments to PAS 1 and PFRS Practice Statement 2, Making Materiality Judgments). The amendments are intended to help companies provide useful accounting policy disclosures. The key amendments to PAS 1 include:
• requiring companies to disclose their material accounting policies rather than their significant accounting policies;
• clarifying that accounting policies related to immaterial transactions, other events or conditions are themselves immaterial and as such need not be disclosed; and
• clarifying that not all accounting policies that relate to material transactions, other events or conditions are themselves material to a company’s financial statements.
The amendments to PFRS Practice Statement 2 includes guidance and additional examples on the application of materiality to accounting policy disclosures.
Deferred Tax related to Assets and Liabilities arising from a Single Transaction (Amendments to PAS 12, Income Taxes). The amendments clarify that the initial recognition exemption does not apply to transactions that give rise to equal taxable and deductible temporary differences such as leases and decommissioning obligations. The amendments apply for annual reporting periods beginning on or after January 1, 2023. Earlier application is permitted. For leases and decommissioning liabilities, the associated deferred tax assets and liabilities will be recognized from the beginning of the earliest comparative period presented, with any cumulative effect recognized as an adjustment to retained earnings or other appropriate component of equity at that date. For all other transactions, the amendments apply to transactions that occur after the beginning of the earliest period presented.
PFRS 17, Insurance Contracts, replaces the interim standard, PFRS 4 Insurance Contracts. Reflecting the view that an insurance contract combines features of both a financial instrument and a service contract, and considering the fact that many insurance contracts generate cash flows with substantial variability over a long period, PFRS 17 introduces a new approach that: a) combines current measurement of the future cash flows with the recognition
of profit over the period services are provided under the contract; b) presents insurance service results (including presentation of insurance
revenue) separately from insurance finance income or expenses; and c) requires an entity to make an accounting policy choice portfolio-by-portfolio
of whether to recognize all insurance finance income or expenses for the reporting period in profit or loss or to recognize some of that income or expenses in other comprehensive income
Under PFRS 17, groups of insurance contracts are measured based on fulfilment cash flows, which represent the risk-adjusted present value of the entity’s rights and obligations to the policy holders, and a contractual service margin, which represents the unearned profit the entity will recognize as it provides services over the coverage period. Subsequent to initial recognition, the liability of a group of insurance contracts represents the liability for remaining coverage and the liability for incurred claims, with the fulfilment cash flows remeasured at each reporting date to reflect current estimates.
- 8 -
Simplifications or modifications to the general measurement model apply to groups of insurance contracts measured using the ‘premium allocation approach’, investment contracts with discretionary participation features, and reinsurance contracts held. PFRS 17 brings greater comparability and transparency about the profitability of new and in-force business and gives users of financial statements more insight into an insurer’s financial health. Separate presentation of underwriting and financial results will give added transparency about the sources of profits and quality of earnings. PFRS 17 is effective for annual periods beginning on or after January 1, 2025. Full retrospective application is required, unless it is impracticable, in which case the entity chooses to apply the modified retrospective approach or the fair value approach. However, if the entity cannot obtain reasonable and supportable information necessary to apply the modified retrospective approach, then it applies the fair value approach. There is also a transition option allowing presentation of comparative information about financial assets using a classification overlay approach on a basis that is more consistent with how PFRS 9 will be applied in future reporting periods. Early application is permitted for entities that apply PFRS 9 Financial Instruments on or before the date of initial application of PFRS 17.
Deferral of the local implementation of Amendments to PFRS 10, Consolidated Financial Statements, and PAS 28, Investments in Associates and Joint Ventures: Sale or Contribution of Assets between an Investor and its Associate or Joint Venture. Sale or Contribution of Assets between an Investor and its Associate or Joint
Venture (Amendments to PFRS 10 and PAS 28). The amendments address an inconsistency in the requirements in PFRS 10 and PAS 28 in dealing with the sale or contribution of assets between an investor and its associate or joint venture. The amendments require that a full gain or loss is recognized when a transaction involves a business (whether it is housed in a subsidiary or not). A partial gain or loss is recognized when a transaction involves assets that do not constitute a business, even if these assets are housed in a subsidiary.
Originally, the amendments apply prospectively for annual periods beginning on or after January 1, 2016, with early adoption permitted. However, on January 13, 2016, the FRSC decided to postpone the effective date until the IASB has completed its broader review of the research project on equity accounting that may result in the simplification of accounting for such transactions and of other aspects of accounting for associates and joint ventures.
Current versus Noncurrent Classification The Company presents assets and liabilities in the separate statements of financial position based on current and noncurrent classification. An asset is current when it is: (a) expected to be realized or intended to be sold or consumed in the normal operating cycle; (b) held primarily for the purpose of trading; (c) expected to be realized within 12 months after the reporting period; or (d) cash or cash equivalent unless restricted from being exchanged or used to settle a liability for at least 12 months after the reporting period.

- 9 -
A liability is current when: (a) it is expected to be settled in the normal operating cycle; (b) it is held primarily for trading; (c) it is due to be settled within 12 months after the reporting period; or (d) there is no unconditional right to defer the settlement of the liability for at least 12 months after the reporting period. The Company classifies all other assets and liabilities as noncurrent. Deferred tax assets and liabilities are classified as noncurrent. Financial Instruments Recognition and Initial Measurement. A financial instrument is any contract that gives rise to a financial asset of one entity and a financial liability or equity instrument of another entity. The Company recognizes a financial asset or a financial liability in the separate statements of financial position when it becomes a party to the contractual provisions of the instrument. A financial asset (unless a trade receivable without a significant financing component) or financial liability is initially measured at the fair value of the consideration given or received. The initial measurement of financial instruments, except for those designated as at FVPL, includes transaction costs. A trade receivable without a significant financing component is initially measured at the transaction price. Financial Assets The Company classifies its financial assets, at initial recognition, as subsequently measured at amortized cost, FVOCI and FVPL. The classification depends on the contractual cash flow characteristics of the financial assets and the business model of the Company for managing the financial assets. Subsequent to initial recognition, financial assets are not reclassified unless the Company changes the business model for managing financial assets. All affected financial assets are reclassified on the first day of the reporting period following the change in the business model. The business model refers to how the Company manages the financial assets in order to generate cash flows. The business model determines whether cash flows will result from collecting contractual cash flows, selling the financial assets, or both. The Company considers the following information in assessing the objective of the business model in which a financial asset is held at a portfolio level, which reflects the way the business is managed and information is provided to management: the stated policies and objectives for the portfolio and the operation of those
policies in practice; how the performance of the portfolio is evaluated and reported to the Company’s
management; the risks that affect the performance of the business model (and the financial
assets held within that business model) and how those risks are managed; how employees of the business are compensated; and the frequency, volume and timing of sales of financial assets in prior periods, the
reasons for such sales and expectations about future sales activity.
- 10 -
The Company considers the contractual terms of the instrument in assessing whether the contractual cash flows are solely payments of principal and interest. For purposes of this assessment, “Principal” is defined as the fair value of the financial asset on initial recognition. “Interest” is defined as consideration for the time value of money and for the credit risk associated with the principal amount outstanding during a particular period of time for other basic lending risks and costs (e.g. liquidity risk and administrative costs), as well as profit margin. The assessment includes whether the financial asset contains a contractual term that could change the timing or amount of contractual cash flows such that it would not meet this condition. The Company considers the following in making the assessment: contingent events that would change the amount or timing of cash flows; terms that may adjust the contractual coupon rate, including variable rate
features; prepayment and extension features; and terms that limit the Company’s claim to cash flows from specified assets. A prepayment feature is consistent with the solely payments of principal and interest criterion if the prepayment amount substantially represents unpaid amounts of principal and interest on the principal amount outstanding, which may include reasonable additional compensation for early termination of the contract. Additionally, for a financial asset acquired at a discount or premium to its contractual par amount, a feature that permits or requires prepayment at an amount that substantially represents the contractual par amount plus accrued (but unpaid) contractual interest (which may also include reasonable additional compensation for early termination) is treated as consistent with this criterion if the fair value of the prepayment feature is insignificant at initial recognition. For purposes of subsequent measurement, financial assets are classified in the following categories: financial assets at amortized cost, financial assets at FVOCI (with or without recycling of cumulative gains and losses) and financial assets at FVPL. Financial Assets at Amortized Cost. A financial asset is measured at amortized cost if it meets both of the following conditions and is not designated as at FVPL: it is held within a business model with the objective of holding financial assets to
collect contractual cash flows; and its contractual terms give rise on specified dates to cash flows that are solely
payments of principal and interest on the principal amount outstanding. Financial assets at amortized cost are subsequently measured using the effective interest method and are subject to impairment. Gains and losses are recognized in the separate statements of comprehensive income when the financial asset is derecognized, modified or impaired. The Company’s cash and cash equivalents, trade and other receivables and advances to a subsidiary are included under this category. Cash includes cash on hand and in banks. Cash equivalents are short-term, highly liquid investments that are readily convertible to known amounts of cash and are subject to an insignificant risk of changes in value.
- 11 -
Financial Assets at FVOCI. Investment in debt instruments is measured at FVOCI if it meets both of the following conditions and is not designated as at FVPL: it is held within a business model whose objective is achieved by both collecting
contractual cash flows and selling the financial assets; and its contractual terms give rise on specified dates to cash flows that are solely
payments of principal and interest on the principal amount outstanding. At initial recognition of an investment in equity instrument that is not held for trading, the Company may irrevocably elect to present subsequent changes in the fair value in other comprehensive income. This election is made on an instrument-by-instrument basis. Financial assets at FVOCI are subsequently measured at fair value. Changes in fair value are recognized in OCI. Interest income calculated using the effective interest method, foreign exchange gains and losses and impairment on investment in debt instruments are recognized in the separate statements of comprehensive income. When investment in debt instruments at FVOCI is derecognized, the related accumulated gains or losses previously reported in the separate statements of changes in equity are transferred to and recognized in the separate statements of comprehensive income. Dividends earned on holding an investment in equity instrument are recognized as dividend income in the separate statements of comprehensive income when the right to receive the payment has been established, unless the dividend clearly represents a recovery of the part of the cost of the investment. When investment in equity instruments at FVOCI is derecognized, the related accumulated gains or losses previously reported in the separate statements of changes in equity are never reclassified to the separate statements of comprehensive income. The Company’s investments in equity and debt instruments at FVOCI are classified under this category. Financial Assets at FVPL. All financial assets not classified as measured at amortized cost or FVOCI are measured at FVPL. This includes derivative financial assets that are not designated as cash flow hedge. Financial assets that are held for trading or are managed and whose performance is evaluated on a fair value basis are measured at FVPL. At initial recognition, the Company may irrevocably designate a financial asset as at FVPL if the designation eliminates or significantly reduces an accounting mismatch that would otherwise arise from measuring assets or liabilities or recognizing the gains and losses on different bases. The Company carries financial assets at FVPL using their fair values. Attributable transaction costs are recognized in the separate statements of comprehensive income as incurred. Changes in fair value and realized gains or losses are recognized in the separate statements of comprehensive income. Fair value changes from derivatives accounted for as part of an effective cash flow hedge are recognized in OCI. Any interest earned from investment in debt instrument designated as at FVPL is recognized in the separate statements of comprehensive income. Any dividend income from investment in equity instrument is recognized in the separate statements of comprehensive income when the right to receive payment has been established, unless the dividend clearly represents a recovery of the part of the cost of the investment.
- 12 -
The Company’s derivative assets not designated as cash flow hedge and investments in equity instruments at FVPL are classified under this category. Financial Liabilities The Company determines the classification of its financial liabilities, at initial recognition, in the following categories: financial liabilities at FVPL and other financial liabilities. All financial liabilities are recognized initially at fair value and, in the case of loans and borrowings, net of directly attributable transaction costs. Financial Liabilities at FVPL. Financial liabilities are classified under this category through the fair value option. Derivative instruments (including embedded derivatives) with negative fair values, except those covered by hedge accounting relationships, are also classified under this category. The Company carries financial liabilities at FVPL using their fair values and reports fair value changes in the separate statements of comprehensive income. Any interest expense incurred is recognized as part of “Interest expense and other financing charges” account in the separate statements of comprehensive income. The Company’s derivative liabilities that are not designated as cash flow hedge are classified under this category. Other Financial Liabilities. This category pertains to financial liabilities that are not designated or classified as at FVPL. After initial measurement, other financial liabilities are carried at amortized cost using the effective interest method. Amortized cost is calculated by taking into account any premium or discount and any directly attributable transaction costs that are considered an integral part of the effective interest rate of the liability. The effective interest rate amortization is included in “Interest expense and other financing charges” account in the separate statements of comprehensive income. Gains and losses are recognized in the separate statements of comprehensive income when the liabilities are derecognized as well as through the amortization process. Debt issue costs are considered as an adjustment to the effective yield of the related debt and are deferred and amortized using the effective interest method. When a loan is paid, the related unamortized debt issue costs at the date of repayment are recognized in the separate statements of comprehensive income. The Company’s liabilities arising from its trade or borrowings such as loans payable, accounts payable and accrued expenses, long-term debt, lease liabilities and other noncurrent liabilities are included under this category. Derecognition of Financial Assets and Financial Liabilities Financial Assets. A financial asset (or, where applicable, a part of a financial asset or part of a group of similar financial assets) is primarily derecognized when: the rights to receive cash flows from the asset have expired; or the Company has transferred its rights to receive cash flows from the asset or
has assumed an obligation to pay them in full without material delay to a third party under a “pass-through” arrangement; and either: (a) has transferred substantially all the risks and rewards of the asset; or (b) has neither transferred nor retained substantially all the risks and rewards of the asset but has transferred control of the asset.
- 13 -
When the Company has transferred its rights to receive cash flows from an asset or has entered into a pass-through arrangement, it evaluates if and to what extent it has retained the risks and rewards of ownership. When it has neither transferred nor retained substantially all the risks and rewards of the asset nor transferred control of the asset, the Company continues to recognize the transferred asset to the extent of the Company’s continuing involvement. In that case, the Company also recognizes the associated liability. The transferred asset and the associated liability are measured on the basis that reflects the rights and obligations that the Company has retained. Continuing involvement that takes the form of a guarantee over the transferred asset is measured at the lower of the original carrying amount of the asset and the maximum amount of consideration that the Company is required to repay. Financial Liabilities. A financial liability is derecognized when the obligation under the liability is discharged, cancelled or expired. When an existing financial liability is replaced by another from the same lender on substantially different terms, or the terms of an existing liability are substantially modified, such an exchange or modification is treated as a derecognition of the original liability and the recognition of a new liability. The difference in the respective carrying amounts is recognized in separate statements of comprehensive income. Impairment of Financial Assets The Company recognizes allowance for expected credit loss (ECL) on financial assets at amortized cost and investments in debt instruments at FVOCI. ECLs are probability-weighted estimates of credit losses. Credit losses are measured as the present value of all cash shortfalls (i.e. the difference between the cash flows due to the Company in accordance with the contract and the cash flows that the Company expects to receive), discounted at the effective interest rate of the financial asset, and reflects reasonable and supportable information that is available without undue cost or effort about past events, current conditions and forecasts of future economic conditions. The Company recognizes an allowance for impairment based on either 12-month or lifetime ECLs, depending on whether there has been a significant increase in credit risk since initial recognition. When determining whether the credit risk of a financial asset has increased significantly since initial recognition and when estimating ECLs, the Company considers reasonable and supportable information that is relevant and available without undue cost or effort. This includes both quantitative and qualitative information and analysis, based on the Company’s historical experience and informed credit assessment and including forward-looking information. The Company recognizes lifetime ECLs for receivables that do not contain significant financing component. The Company uses provision matrix that is based on the Company’s historical credit loss experience, adjusted for forward-looking factors specific to the borrowers and the economic environment.
- 14 -
At each reporting date, the Company assesses whether financial assets carried at amortized cost and investments in debt instruments at FVOCI are credit-impaired. A financial asset is credit-impaired when one or more events that have a detrimental impact on the estimated future cash flows of the financial asset have occurred. Evidence that a financial asset is credit-impaired include observable data about the following events: (a) significant financial difficulty of the issuer or the borrower; (b) a breach of contract, such as a default or past due event; (c) the restructuring of a financial asset by the Company on terms that the Company
would not consider otherwise; (d) it is becoming probable that the borrower will enter bankruptcy or other financial
reorganization; or (e) the disappearance of an active market for that financial asset because of
financial difficulties. The Company considers a financial asset to be in default when a counterparty fails to pay its contractual obligations, or there is a breach of other contractual terms, such as covenants. The Company directly reduces the gross carrying amount of a financial asset when there is no reasonable expectation of recovering the contractual cash flows on a financial asset, either partially or in full. This is generally the case when the Company determines that the borrower does not have assets or sources of income that could generate sufficient cash flows to repay the amounts subject to the write-off. However, financial assets that are written off could still be subject to enforcement activities in order to comply with the Company's procedures for recovery of amounts due. The ECLs on financial assets at amortized cost are recognized as allowance for impairment losses against the gross carrying amount of the financial asset, with the resulting impairment losses (or reversals) recognized in the separate statements of comprehensive income. The ECLs on investments in debt instruments at FVOCI are recognized as accumulated impairment losses in OCI, with the resulting impairment losses (or reversals) recognized in the separate statements of comprehensive income. Classification of Financial Instruments between Liability and Equity Financial instruments are classified as liability or equity in accordance with the substance of the contractual arrangement. Interest, dividends, gains and losses relating to a financial instrument or a component that is a financial liability, are reported as expense or income. Distributions to holders of financial instruments classified as equity are charged directly to equity, net of any related income tax benefits. A financial instrument is classified as liability if it provides for a contractual obligation to: deliver cash or another financial asset to another entity; exchange financial assets or financial liabilities with another entity under
conditions that are potentially unfavorable to the Company; or
- 15 -
satisfy the obligation other than by the exchange of a fixed amount of cash or another financial asset for a fixed number of own equity shares.
The components of issued financial instruments that contain both liability and equity elements are accounted for separately, with the equity component being assigned the residual amount after deducting from the instrument as a whole or in part, the amount separately determined as the fair value of the liability component on the date of issue. Offsetting Financial Instruments Financial assets and financial liabilities are offset and the net amount is reported in the separate statements of financial position if, and only if, there is a currently enforceable legal right to offset the recognized amounts and there is an intention to settle on a net basis, or to realize the assets and settle the liabilities simultaneously. Derivative Financial Instruments and Hedge Accounting The Company uses derivative financial instruments, such as forwards, swaps and options to manage its exposure on foreign currency and commodity price risks. Derivative financial instruments are initially recognized at fair value on the date the derivative contract is entered into and are subsequently remeasured at fair value. Derivatives are carried as financial assets when the fair value is positive and as financial liabilities when the fair value is negative. Changes in fair value of derivatives that are not designated as hedging instruments are recognized in separate statements of comprehensive income. Freestanding Derivatives. The Company designates certain derivatives as hedging instruments to hedge the exposure to variability in cash flows associated with recognized liabilities arising from changes in foreign exchange rates and interest rates. At the inception of a hedge relationship, the Company formally designates and documents the hedge relationship to which the Company wishes to apply hedge accounting and the risk management objective and strategy for undertaking the hedge. The Company also documents the economic relationship between the hedged item and the hedging instrument, including whether the changes in cash flows of the hedging instrument are expected to offset the changes in cash flows of the hedged item. Cash Flow Hedge. When a derivative is designated as a cash flow hedging instrument, the effective portion of changes in the fair value of the derivative is recognized in OCI and presented in the “Other reserves” account in the separate statements of changes in equity. The effective portion of changes in the fair value of the derivative that is recognized in OCI is limited to the cumulative change in fair value of the hedged item. Any ineffective portion of changes in the fair value of the derivative is recognized immediately in the separate statements of comprehensive income. The Company designates only the intrinsic value of options and the change in fair value of the spot element of forward contracts as the hedging instrument in cash flow hedging relationships. The change in fair value of the time value of options, the forward element of forward contracts and the foreign currency basis spread of financial instruments are separately accounted for as cost of hedging and recognized in OCI. The cost of hedging is removed from OCI and recognized in separate statements of comprehensive income, either over the period of the hedge if the hedge is time related, or when the hedged transaction affects separate statements of comprehensive income if the hedge is transaction related.
- 16 -
When the hedged transaction subsequently results in the recognition of a non-financial item, the amount accumulated in equity is transferred and included in the initial cost of the hedged asset or liability. For all other hedged transactions, the amount accumulated in equity is reclassified to separate statements of comprehensive income as a reclassification adjustment in the same period or periods during which the hedged cash flows affect separate statements of comprehensive income. If the hedge no longer meets the criteria for hedge accounting or the hedging instrument expires, is sold, is terminated or is exercised, hedge accounting is discontinued prospectively. The amount that has been accumulated in equity is: (a) retained until it is included in the cost of non-financial item on initial recognition, for a hedge of a transaction resulting in the recognition of a non-financial item; or (b) reclassified to separate statements of comprehensive income as a reclassification adjustment in the same period or periods as the hedged cash flows affect separate statements of comprehensive income, for other cash flow hedges. If the hedged future cash flows are no longer expected to occur, the amounts that have been accumulated in equity are immediately reclassified to separate statements of comprehensive income. The Company has outstanding derivatives accounted for as cash flow hedge as at December 31, 2021 and 2020 (Note 34). Embedded Derivatives. The Company assesses whether embedded derivatives are required to be separated from the host contracts when the Company becomes a party to the contract. An embedded derivative is separated from the host contract and accounted for as a derivative if all of the following conditions are met: (a) the economic characteristics and risks of the embedded derivative are not
closely related to the economic characteristics and risks of the host contract; (b) a separate instrument with the same terms as the embedded derivative would
meet the definition of a derivative; and (c) the hybrid or combined instrument is not recognized at FVPL. However, an embedded derivative is not separated if the host contract is a financial asset. Reassessment only occurs if there is a change in the terms of the contract that significantly modifies the cash flows that would otherwise be required. Embedded derivatives that are bifurcated from the host contracts are accounted for either as financial assets or financial liabilities at FVPL. The Company has embedded derivatives as at December 31, 2021 and 2020 (Note 34). Inventories Inventories are carried at the lower of cost and net realizable value (NRV). For petroleum products and crude oil, the NRV is the estimated selling price in the ordinary course of business, less the estimated costs to complete and/or market and distribute.
- 17 -
For financial reporting purposes, the Company uses the first-in, first-out method in costing petroleum products and crude oil. Cost is determined using the moving-average method in costing lubes and greases, blending components, polypropylene, materials and supplies inventories. For income tax reporting purposes, cost of all inventories is determined using the moving-average method. For financial reporting purposes, duties and taxes related to the acquisition of inventories are capitalized as part of inventory cost. For income tax reporting purposes, such duties and taxes are treated as deductible expenses in the year these charges are incurred. Prepaid Expenses and Other Current Assets Prepaid expenses represent expenses not yet incurred but already paid in cash. These are initially recorded as assets and measured at the amount of cash paid. Subsequently, these are recognized in the separate statements of comprehensive income as they are consumed or expire with the passage of time. Other current assets pertain to assets which are expected to be realized within 12 months after the reporting period. Otherwise, these are classified as noncurrent assets. Investments in Shares of Stock of Subsidiaries and Associate The Company’s investments in shares of stock of subsidiaries and associate are accounted for under the cost method as provided for under PAS 27, Consolidated and Separate Financial Statements. A subsidiary is an entity controlled by the Company. The Company controls an entity when it is exposed to, or has rights to, variable returns from its involvement with the entity and has the ability to affect those returns through its power over the entity. An associate is an entity in which the Company has significant influence. Significant influence is the power to participate in the financial and operating policies of the investee, but not control over those policies. The investments are carried in the Company’s separate statements of financial position at cost less any impairment in value. The Company recognizes dividends from subsidiaries and associate in separate statements of comprehensive income when its right to receive the dividend is established.
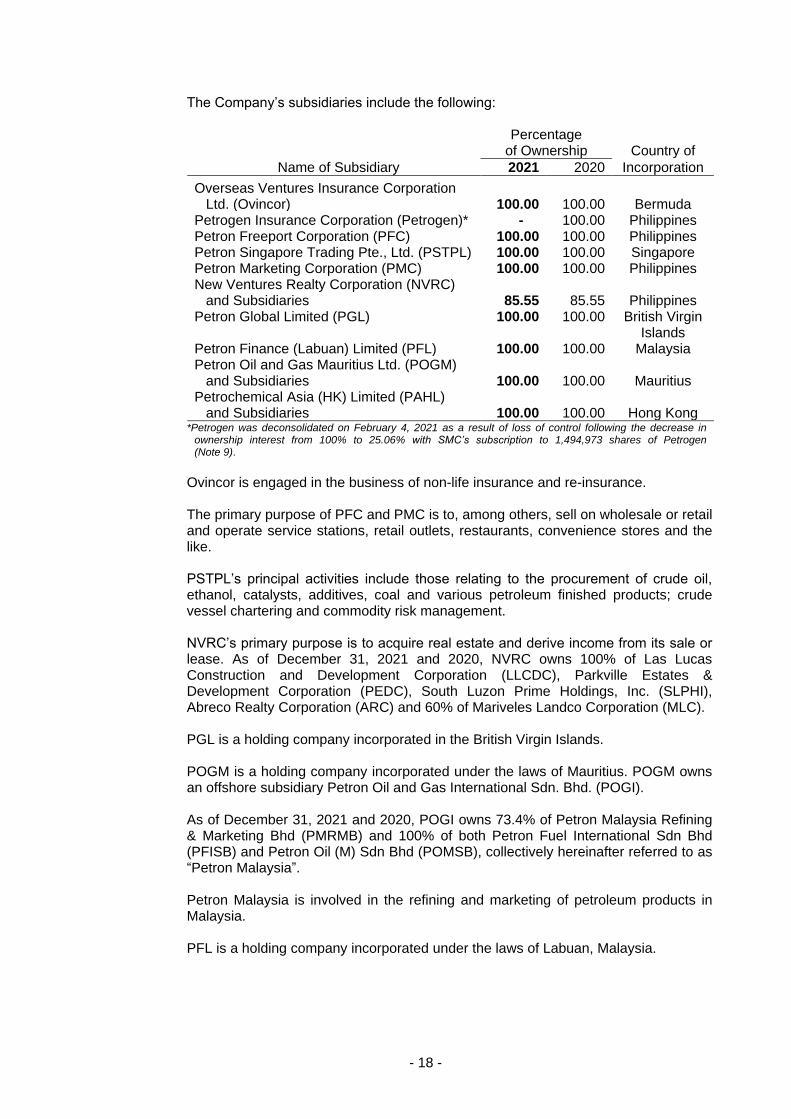
- 18 -
The Company’s subsidiaries include the following:
Percentage
of Ownership Country of
Name of Subsidiary 2021 2020 Incorporation
Overseas Ventures Insurance Corporation Ltd. (Ovincor) 100.00 100.00 Bermuda
Petrogen Insurance Corporation (Petrogen)* - 100.00 Philippines Petron Freeport Corporation (PFC) 100.00 100.00 Philippines Petron Singapore Trading Pte., Ltd. (PSTPL) 100.00 100.00 Singapore Petron Marketing Corporation (PMC) 100.00 100.00 Philippines New Ventures Realty Corporation (NVRC)
and Subsidiaries 85.55 85.55 Philippines Petron Global Limited (PGL) 100.00 100.00 British Virgin
Islands Petron Finance (Labuan) Limited (PFL) 100.00 100.00 Malaysia Petron Oil and Gas Mauritius Ltd. (POGM)
and Subsidiaries 100.00 100.00 Mauritius Petrochemical Asia (HK) Limited (PAHL)
and Subsidiaries 100.00 100.00 Hong Kong *Petrogen was deconsolidated on February 4, 2021 as a result of loss of control following the decrease in
ownership interest from 100% to 25.06% with SMC’s subscription to 1,494,973 shares of Petrogen (Note 9).
Ovincor is engaged in the business of non-life insurance and re-insurance. The primary purpose of PFC and PMC is to, among others, sell on wholesale or retail and operate service stations, retail outlets, restaurants, convenience stores and the like. PSTPL’s principal activities include those relating to the procurement of crude oil, ethanol, catalysts, additives, coal and various petroleum finished products; crude vessel chartering and commodity risk management. NVRC’s primary purpose is to acquire real estate and derive income from its sale or lease. As of December 31, 2021 and 2020, NVRC owns 100% of Las Lucas Construction and Development Corporation (LLCDC), Parkville Estates & Development Corporation (PEDC), South Luzon Prime Holdings, Inc. (SLPHI), Abreco Realty Corporation (ARC) and 60% of Mariveles Landco Corporation (MLC). PGL is a holding company incorporated in the British Virgin Islands. POGM is a holding company incorporated under the laws of Mauritius. POGM owns an offshore subsidiary Petron Oil and Gas International Sdn. Bhd. (POGI). As of December 31, 2021 and 2020, POGI owns 73.4% of Petron Malaysia Refining & Marketing Bhd (PMRMB) and 100% of both Petron Fuel International Sdn Bhd (PFISB) and Petron Oil (M) Sdn Bhd (POMSB), collectively hereinafter referred to as “Petron Malaysia”. Petron Malaysia is involved in the refining and marketing of petroleum products in Malaysia. PFL is a holding company incorporated under the laws of Labuan, Malaysia.
- 19 -
PAHL is a holding company incorporated in Hong Kong in March 2008. As of December 31, 2021 and 2020, PAHL owns 100% of Robinsons International Holdings Limited (RIHL) which owns 100% of Philippine Polypropylene, Inc. (PPI) and 40% of MLC. The Company’s 25.06% interest in Petrogen, accounted for as an investment in an associate as part of “Investments and advances - net” account in the separate statements of financial position, is accounted for under the cost method of accounting. The investment in associate is carried in the separate statements of financial position at cost less any impairment in value. Interest in a Joint Venture A joint venture is a type of joint arrangement whereby the parties that have joint control of the arrangement have rights to the net assets of the joint venture. Joint control is the contractually agreed sharing of control of an arrangement, which exists only when decisions about the relevant activities require unanimous consent of the parties sharing control. The Company’s 33.33% joint venture interest in Pandacan Depot Services, Inc. (PDSI), included under “Investments and advances” account in the separate statements of financial position, is accounted for under the cost method of accounting. The interest in joint venture is carried in the separate statements of financial position at cost less any impairment in value. The Company has no capital commitments or contingent liabilities in relation to its interest in this joint venture. Property, Plant and Equipment Property, plant and equipment, except land, are stated at cost less accumulated depreciation and any accumulated impairment in value. Such cost includes the cost of replacing part of the property, plant and equipment at the time that cost is incurred, if the recognition criteria are met, and excludes the costs of day-to-day servicing. Land is stated at cost less any impairment value, if any. The initial cost of property, plant and equipment comprises its construction cost or purchase price, including import duties, taxes and any directly attributable costs in bringing the asset to its working condition and location for its intended use. Expenditures incurred after the asset has been put into operation, such as repairs, maintenance and overhaul costs, are normally recognized as an expense in the period the costs are incurred. Major repairs are capitalized as part of property, plant and equipment only when it is probable that future economic benefits associated with the items will flow to the Company and the cost of the items can be measured reliably. Capital projects in progress (CPIP) represents structures under construction and is stated at cost. This includes the costs of construction and other direct costs. Borrowing costs that are directly attributable to the construction of plant and equipment are capitalized during the construction period. CPIP is not depreciated until such time that the relevant assets are ready for use.
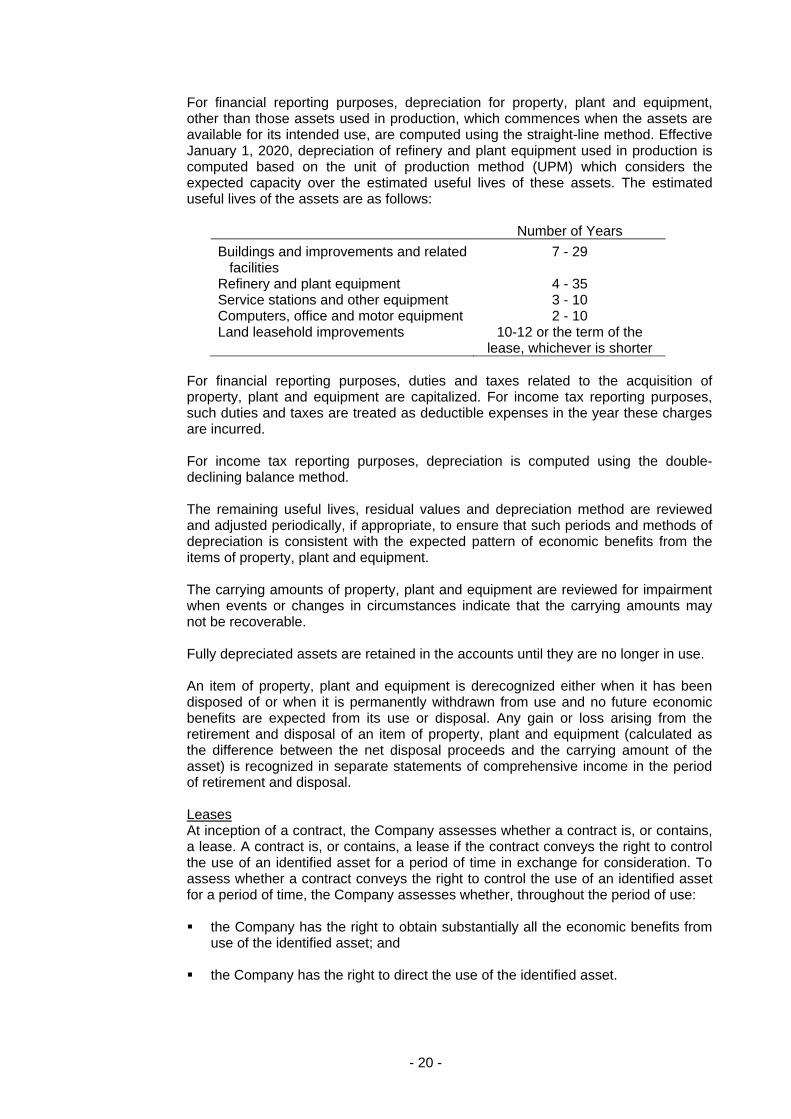
- 20 -
For financial reporting purposes, depreciation for property, plant and equipment, other than those assets used in production, which commences when the assets are available for its intended use, are computed using the straight-line method. Effective January 1, 2020, depreciation of refinery and plant equipment used in production is computed based on the unit of production method (UPM) which considers the expected capacity over the estimated useful lives of these assets. The estimated useful lives of the assets are as follows:
Number of Years
Buildings and improvements and related facilities
7 - 29
Refinery and plant equipment 4 - 35 Service stations and other equipment 3 - 10 Computers, office and motor equipment 2 - 10 Land leasehold improvements 10-12 or the term of the
lease, whichever is shorter
For financial reporting purposes, duties and taxes related to the acquisition of property, plant and equipment are capitalized. For income tax reporting purposes, such duties and taxes are treated as deductible expenses in the year these charges are incurred. For income tax reporting purposes, depreciation is computed using the double-declining balance method. The remaining useful lives, residual values and depreciation method are reviewed and adjusted periodically, if appropriate, to ensure that such periods and methods of depreciation is consistent with the expected pattern of economic benefits from the items of property, plant and equipment. The carrying amounts of property, plant and equipment are reviewed for impairment when events or changes in circumstances indicate that the carrying amounts may not be recoverable. Fully depreciated assets are retained in the accounts until they are no longer in use. An item of property, plant and equipment is derecognized either when it has been disposed of or when it is permanently withdrawn from use and no future economic benefits are expected from its use or disposal. Any gain or loss arising from the retirement and disposal of an item of property, plant and equipment (calculated as the difference between the net disposal proceeds and the carrying amount of the asset) is recognized in separate statements of comprehensive income in the period of retirement and disposal. Leases At inception of a contract, the Company assesses whether a contract is, or contains, a lease. A contract is, or contains, a lease if the contract conveys the right to control the use of an identified asset for a period of time in exchange for consideration. To assess whether a contract conveys the right to control the use of an identified asset for a period of time, the Company assesses whether, throughout the period of use: the Company has the right to obtain substantially all the economic benefits from
use of the identified asset; and the Company has the right to direct the use of the identified asset.

- 21 -
Company as a Lessee The Company recognizes a right-of-use asset and a lease liability at the lease commencement date (i.e., the date the underlying asset is available for use). The right-of-use asset is initially measured at cost, which comprises the initial amount of the lease liability adjusted for any lease payments made at or before the commencement date, plus any initial direct costs incurred and an estimate of costs to dismantle and remove the underlying asset or to restore the underlying asset or the site on which it is located, less any lease incentives received. The right-of-use asset is subsequently depreciated using the straight-line method from the commencement date to the earlier of the end of the useful life of the right-of use asset or the end of the lease term. In addition, the right-of-use asset is periodically reduced by impairment losses, if any, and adjusted for certain remeasurements of the lease liability. The lease liability is initially measured at the present value of the lease payments that are not paid at the commencement date, discounted using the interest rate implicit in the lease or, if that rate cannot be readily determined, the Company’s incremental borrowing rate. Generally, the Company uses its incremental borrowing rate as the discount rate. Lease payments included in the measurement of the lease liability comprise of the following: fixed payments, including in-substance fixed payments, less any lease incentives
receivable; variable lease payments that depend on an index or a rate, initially measured
using the index or rate as at the commencement date; amounts expected to be payable under a residual value guarantee; and the exercise price under a purchase option that the Company is reasonably
certain to exercise, lease payments in an optional renewal period if the Company is reasonably certain to exercise an extension option, and penalties for early termination of a lease unless the Company is reasonably certain not to terminate early.
The lease liability is measured at amortized cost using the effective interest method. The carrying amount of the lease liability is remeasured when there is a change in future lease payments arising from a change in an index or rate, a change in the estimate of the amount expected to be payable under a residual value guarantee, or a change in the assessment of whether a purchase or extension option is reasonably certain to be exercised or a termination option is reasonably certain not to be exercised. When the lease liability is remeasured, a corresponding adjustment is made to the carrying amount of the right-of-use asset, or is recognized in the separate statements of comprehensive income if the carrying amount of the right-of-use asset has been reduced to zero. The Company has elected not to recognize right-of-use assets and lease liabilities for short-term leases (i.e., lease that have a lease term of 12 months or less from the commencement date and do not contain a purchase option) and leases of low-value assets, including pallets and computer equipment. The Company recognizes the lease payments associated with these leases as expense on a straight-line basis over the lease term.
- 22 -
At commencement or on modification of a contract that contains a lease component, the Company allocates the consideration in the contract to each lease component on the basis of its relative stand-alone prices. However, for the leases of property, the Company has elected not to separate non-lease components and account for the lease and non-lease components as a single component. The Company has applied COVID-19-Related Rent Concessions. The Company applies the practical expedient allowing it not to assess whether eligible rent concessions that are a direct consequence of the COVID-19 pandemic are lease modifications. The Company applies the practical expedient consistently to contracts with similar characteristics and in similar circumstances. For rent concessions in leases to which the Company chooses not to apply the practical expedient, or that do not qualify for the practical expedient, the Company assesses whether there is a lease modification. Company as a Lessor The Company determines at lease inception whether each lease is a finance lease or an operating lease. To classify each lease, the Company makes an overall assessment of whether the lease transfers substantially all of the risks and rewards incidental to ownership of the underlying asset. If this is the case, the lease is classified as a finance lease; if not, it is classified as an operating lease. As part of the assessment, the Company considers certain indicators such as whether the lease is for the major part of the economic life of the asset. When the Company is an intermediate lessor, it accounts for the head lease and the sublease separately. It assesses the lease classification of a sublease with reference to the right-of-use asset arising from the head lease. If a head lease is a short-term lease to which the Company applies the recognition exemption, it classifies the sublease as an operating lease. If an arrangement contains lease and non-lease components, the Company applies PFRS 15 to allocate the consideration in the contract. The Company identified the use of loaned equipment related to the sale of goods to be accounted under PFRS 16. The Company provides equipment such as pumps, tanks, signage and other ancillary equipment necessary for the operation of the business. These are loaned to the customers for the duration of the contract for the sole purpose of storing, handling and selling products and shall, at all times, remain the property of the Company. The Company allocates portion of the revenue to the use of loaned equipment and presented as part of “Net sales” in the separate statements of comprehensive income based on adjusted market assessment approach. Lease revenue from the use of loaned equipment is contingent to, and recognized at the same time as, the sale of goods. The Company recognizes lease payments received under operating leases as rent income on a straight-line basis over the lease term. Initial direct costs incurred in negotiating an operating lease are added to the carrying amount of the leased asset and recognized as an expense over the lease term on the same basis as rent income. Contingent rents are recognized as income in the period in which they are earned.
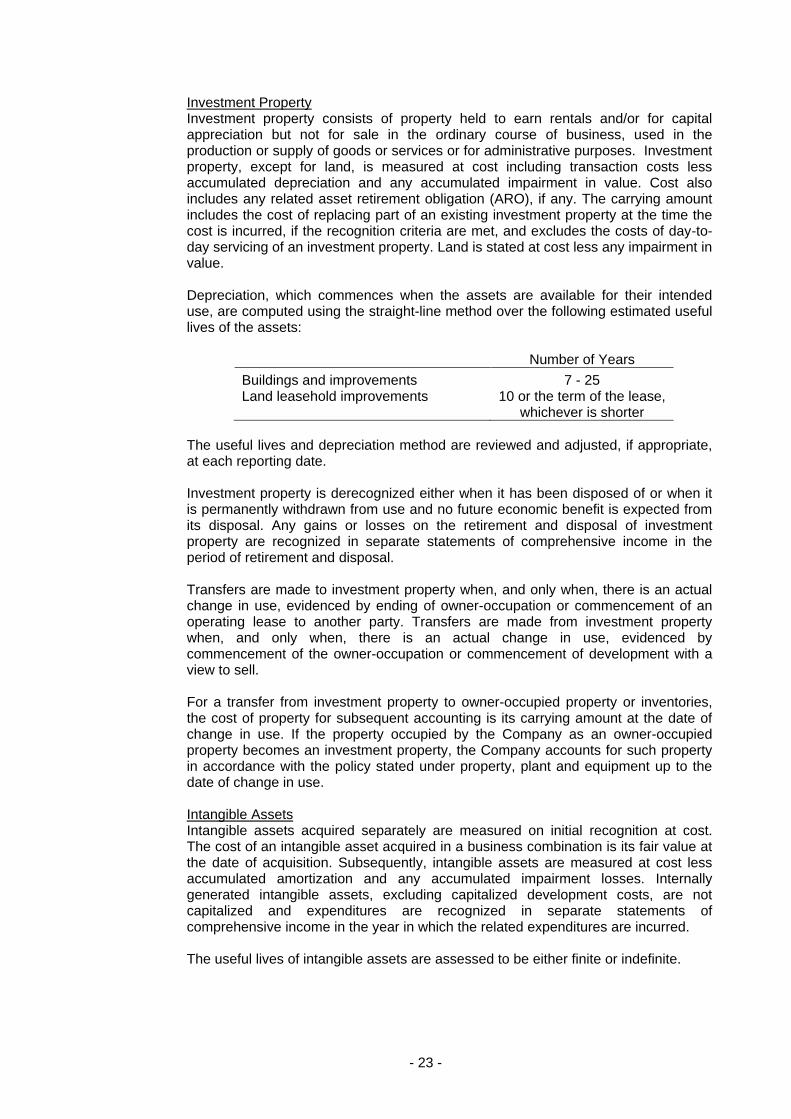
- 23 -
Investment Property Investment property consists of property held to earn rentals and/or for capital appreciation but not for sale in the ordinary course of business, used in the production or supply of goods or services or for administrative purposes. Investment property, except for land, is measured at cost including transaction costs less accumulated depreciation and any accumulated impairment in value. Cost also includes any related asset retirement obligation (ARO), if any. The carrying amount includes the cost of replacing part of an existing investment property at the time the cost is incurred, if the recognition criteria are met, and excludes the costs of day-to-day servicing of an investment property. Land is stated at cost less any impairment in value. Depreciation, which commences when the assets are available for their intended use, are computed using the straight-line method over the following estimated useful lives of the assets:
Number of Years
Buildings and improvements 7 - 25 Land leasehold improvements 10 or the term of the lease,
whichever is shorter
The useful lives and depreciation method are reviewed and adjusted, if appropriate, at each reporting date. Investment property is derecognized either when it has been disposed of or when it is permanently withdrawn from use and no future economic benefit is expected from its disposal. Any gains or losses on the retirement and disposal of investment property are recognized in separate statements of comprehensive income in the period of retirement and disposal. Transfers are made to investment property when, and only when, there is an actual change in use, evidenced by ending of owner-occupation or commencement of an operating lease to another party. Transfers are made from investment property when, and only when, there is an actual change in use, evidenced by commencement of the owner-occupation or commencement of development with a view to sell. For a transfer from investment property to owner-occupied property or inventories, the cost of property for subsequent accounting is its carrying amount at the date of change in use. If the property occupied by the Company as an owner-occupied property becomes an investment property, the Company accounts for such property in accordance with the policy stated under property, plant and equipment up to the date of change in use. Intangible Assets Intangible assets acquired separately are measured on initial recognition at cost. The cost of an intangible asset acquired in a business combination is its fair value at the date of acquisition. Subsequently, intangible assets are measured at cost less accumulated amortization and any accumulated impairment losses. Internally generated intangible assets, excluding capitalized development costs, are not capitalized and expenditures are recognized in separate statements of comprehensive income in the year in which the related expenditures are incurred. The useful lives of intangible assets are assessed to be either finite or indefinite.
- 24 -
Intangible assets with finite lives are amortized over the useful life and assessed for impairment whenever there is an indication that the intangible assets may be impaired. The amortization period and the amortization method used for an intangible asset with a finite useful life are reviewed at least at each reporting date. Changes in the expected useful life or the expected pattern of consumption of future economic benefits embodied in the asset are accounted for by changing the amortization period or method, as appropriate, and are treated as changes in accounting estimate. The amortization expense on intangible assets with finite lives is recognized in separate statements of comprehensive income consistent with the function of the intangible asset. Amortization is computed using the straight-line method over 5 to 16 years. Gains or losses arising from the disposal of an intangible asset are measured as the difference between the net disposal proceeds and the carrying amount of the asset, and are recognized in separate statements of comprehensive income when the asset is derecognized. As of December 31, 2021 and 2020, the Company has existing and pending trademark registration for its products for a term of 10 to 20 years. It also has copyrights for its 7-kg LPG container, Gasulito with stylized letter “P” and two flames, Powerburn 2T, Petron New Logo (22 styles), Philippine Card Designs and Malaysian Card Designs, and Petron font. Copyrights endure during the lifetime of the creator and for another 50 years after creator’s death. The amount of intangible assets is included as part of “Other noncurrent assets - net” in the separate statements of financial position. Expenses incurred for research and development of internal projects and internally developed patents and copyrights are expensed as incurred and are part of “Selling and administrative expenses” account in the separate statements of comprehensive income. Asset Held for Sale The Company classifies assets as held for sale, if their carrying amounts will be recovered primarily through sale rather than through continuing use. The assets are generally measured at the lower of their carrying amount and fair value less costs to sell. Impairment losses on initial classification as held for sale and subsequent gains and losses on remeasurement are recognized in the separate statements of comprehensive income. Gains are not recognized in excess of any cumulative impairment losses. The criteria for held for sale is regarded as met only when the sale is highly probable and the asset is available for immediate sale in its present condition. Actions required to complete the sale should indicate that it is unlikely that significant changes will be made or that the decision on sale will be withdrawn. Management must be committed to the sale within one year from date of classification. Equity accounting of equity-accounted investees ceases once classified as held for sale. Asset held for sale is presented under “Other current assets” account in the separate statements of financial position.
- 25 -
Impairment of Nonfinancial Assets The carrying amounts of property, plant and equipment, right-of-use assets, investment property, intangible assets with finite useful lives, investments in shares of stock of subsidiaries and associate and interest in a joint venture are reviewed for impairment when events or changes in circumstances indicate that the carrying amount may not be recoverable. If any such indication exists, and if the carrying amount exceeds the estimated recoverable amount, the assets or cash-generating units are written down to their recoverable amounts. The recoverable amount of the asset is the greater of fair value less costs to sell and value in use. The fair value less costs to sell is the amount obtainable from the sale of an asset in an arm’s length transaction between knowledgeable, willing parties, less costs of disposal. Value in use is the present value of estimated future cash flows expected to arise from the continuing use of an asset and from its disposal at the end of its useful life. In assessing value in use, the estimated future cash flows are discounted to their present value using a pre-tax discount rate that reflects current market assessments of the time value of money and the risks specific to the asset. For an asset that does not generate largely independent cash inflows, the recoverable amount is determined for the cash-generating unit to which the asset belongs. Impairment losses are recognized in separate statements of comprehensive income in those expense categories consistent with the function of the impaired asset. An assessment is made at each reporting date as to whether there is any indication that previously recognized impairment losses may no longer exist or may have decreased. If such indication exists, the recoverable amount is estimated. A previously recognized impairment loss is reversed only if there has been a change in the estimates used to determine the asset’s recoverable amount since the last impairment loss was recognized. If that is the case, the carrying amount of the asset is increased to its recoverable amount. That increased amount cannot exceed the carrying amount that would have been determined, net of depreciation and amortization, had no impairment loss been recognized for the asset in prior years. Such reversal is recognized in separate statements of comprehensive income. After such a reversal, the depreciation and amortization charge is adjusted in future periods to allocate the asset’s revised carrying amount, less any residual value, on a systematic basis over its remaining useful life. An impairment loss with respect to goodwill is not reversed. Cylinder Deposits The Company purchases LPG cylinders which are loaned to dealers upon payment by the latter of an amount equivalent to about 90% of the acquisition cost of the cylinders. The Company maintains the balance of cylinder deposits at an amount equivalent to three days worth of inventory of all its dealers, but in no case lower than P200,000 at any given time, to take care of possible returns by dealers. At the end of each reporting date, cylinder deposits, shown under “Other noncurrent liabilities” account in the separate statements of financial position, are reduced for estimated non-returns. The reduction is recognized directly in the separate statements of comprehensive income. Fair Value Measurements The Company measures financial and non-financial assets and liabilities at fair value at each reporting date.
- 26 -
Fair value is the price that would be received to sell an asset or paid to transfer a liability in an orderly transaction between market participants at the measurement date. The fair value measurement is based on the presumption that the transaction to sell the asset or transfer the liability takes place either: (a) in the principal market for the asset or liability; or (b) in the absence of a principal market, in the most advantageous market for the asset or liability. The principal or most advantageous market must be accessible to the Company. The fair value of an asset or liability is measured using the assumptions that market participants would use when pricing the asset or liability, assuming that market participants act in their best economic interest. The Company uses valuation techniques that are appropriate in the circumstances and for which sufficient data are available to measure fair value, maximizing the use of relevant observable inputs and minimizing the use of unobservable inputs. All assets and liabilities for which fair value is measured or disclosed in the separate financial statements are categorized within the fair value hierarchy, described as follows, based on the lowest level input that is significant to the fair value measurement as a whole: Level 1: quoted prices (unadjusted) in active markets for identical assets or
liabilities; Level 2: inputs other than quoted prices included within Level 1 that are
observable for the asset or liability, either directly or indirectly; and Level 3: inputs for the asset or liability that are not based on observable market
data. For assets and liabilities that are recognized in the separate financial statements on a recurring basis, the Company determines whether transfers have occurred between levels in the hierarchy by re-assessing the categorization at the end of each reporting period. For purposes of the fair value disclosures, the Company has determined classes of assets and liabilities on the basis of the nature, characteristics and risks of the asset or liability and the level of fair value hierarchy. Provisions Provisions are recognized when: (a) the Company has a present obligation (legal or constructive) as a result of past event; (b) it is probable (i.e., more likely than not) that an outflow of resources embodying economic benefits will be required to settle the obligation; and (c) a reliable estimate of the amount of the obligation can be made. Where some or all of the expenditure required to settle a provision is expected to be reimbursed by another party, the reimbursement is recognized as a separate asset only when it is virtually certain that reimbursement will be received. The amount recognized for the reimbursement shall not exceed the amount of the provision. Provisions are reviewed at each reporting date and adjusted to reflect the current best estimate. If the effect of the time value of money is material, provisions are determined by discounting the expected future cash flows at a pre-tax rate that reflects current market assessment of the time value of money and the risks specific to the liability. Where discounting is used, the increase in the provision due to the passage of time is recognized as interest expense.
- 27 -
The Company recognizes provisions arising from legal and/or constructive obligations associated with the cost of dismantling and removing an item of property, plant and equipment and restoring the site where it is located, the obligation for which the Company incurs either when the asset is acquired or as a consequence of using the asset during a particular year for purposes other than to produce inventories during the year. Capital Stock Common Shares. Common shares are classified as equity. Incremental costs directly attributable to the issue of common shares and share options are recognized as a deduction from equity, net of any tax effects. Preferred Shares. Preferred shares are classified as equity if they are non-redeemable, or redeemable only at the Company’s option, and any dividends thereon are discretionary. Dividends thereon are recognized as distributions within equity upon approval by the BOD of the Company. Preferred shares are classified as a liability if they are redeemable on a specific date or at the option of the shareholders, or if dividend payments are not discretionary. Dividends thereon are recognized as interest expense in separate statements of comprehensive income as accrued. Additional Paid-in Capital When the shares are sold at premium, the difference between the proceeds and the par value is credited to the “Additional paid-in capital” account. When shares are issued for a consideration other than cash, the proceeds are measured by the fair value of the consideration received. In case the shares are issued to extinguish or settle the liability of the Company, the shares are measured either at the fair value of the shares issued or fair value of the liability settled, whichever is more reliably determinable. Capital Securities Senior Perpetual Capital Securities (SPCS) and Redeemable Perpetual Securities (RPS) are classified as equity instruments in the separate financial statements since these securities are perpetual securities in respect of which there is no fixed redemption date and the redemption is at the option of the Company. Also, the Company has the sole and absolute discretion to defer payment of any or all of the distribution (Note 20). Incremental costs directly attributable to the issuance of capital securities are recognized as a deduction from equity, net of tax. The proceeds received net of any directly attributable transaction costs are credited to capital securities. Retained Earnings Retained earnings represent the accumulated net income or losses, net of any dividend distributions and other capital adjustments. Appropriated retained earnings represent that portion which is restricted and therefore not available for any dividend declaration. Equity Reserve The equity reserve includes the effect of transactions with non-controlling interests and equity adjustments. Reserve for Retirement Plan The reserve for retirement plan represents re-measurements of net defined benefit retirement liability or asset comprising actuarial gains and losses, return on plan assets, and any change in the effect of the asset ceiling (excluding net interest).
- 28 -
Hedging Reserve The hedging reserve comprises the effective portion of the cumulative net change in the fair value of hedging instruments used in cash flow hedges pending subsequent recognition in profit or loss or directly included in the initial cost or other carrying amount of a non-financial asset or non-financial liability. The hedging reserve also includes cost of hedging which reflects gain or loss on the portion excluded from the designated hedging instrument that relates to the forward element of forward contracts, time value of options and foreign currency basis spread which are initially recorded in other comprehensive income. Treasury Stock Own equity instruments which are reacquired are carried at cost and deducted from equity. No gain or loss is recognized on the purchase, sale, reissuance or cancellation of the Company’s own equity instruments. When the shares are retired, the capital stock account is reduced by its par value and the excess of cost over par value upon retirement is debited to additional paid-in capital to the extent of the specific or average additional paid-in capital when the shares were issued and to retained earnings for the remaining balance. Revenue The Company recognizes revenue from contracts with customers when control of the goods or services are transferred to the customer at an amount that reflects the consideration to which the Company expects to be entitled in exchange for those goods or services, excluding amounts collected on behalf of third parties. The transfer of control can occur over time or at a point in time. Revenue is recognized at a point in time unless one of the following criteria is met, in which case it is recognized over time: (a) the customer simultaneously receives and consumes the benefits as the Company performs its obligations; (b) the Company’s performance creates or enhances an asset that the customer controls as the asset is created or enhanced; or (c) the Company’s performance does not create an asset with an alternative use to the Company and the Company has an enforceable right to payment for performance completed to date. The Company assesses its revenue arrangements to determine if it is acting as a principal or as an agent. The Company has assessed that it acts as a principal as it controls the goods or services before transferring to the customer. The following specific recognition criteria must also be met before revenue is recognized: Sale of Goods. Revenue is recognized at the point in time when control of petroleum and related products is transferred to the customer, which is normally upon delivery of the goods. The Company provides trade discounts and volume rebates to certain customers based on the level of their purchases which may be applied against the amount of their existing or future payables to the Company. Trade discounts and volume rebates do not result to significant variable consideration and are generally determined based on concluded sales transactions as at the end of each month. The general payment terms with customers are combination of prepayments and credit terms on an average of 45 days from invoice date.
- 29 -
The Company identified several performance obligations related to the sale of goods and accounted for them separately: Provisions of Technical Support. The Company provides technical information,
assistance and advice relating to the uses, handling and disposition of the products, loaned equipment and the machinery and equipment necessary or appropriate for the customers’ needs. Revenue is recognized over time upon rendering of services to the customer. The Company allocates portion of the revenue to the technical support based on expected cost plus a margin approach.
Consumer Loyalty Program. The Company has Consumer Loyalty Programs
which allows customers to accumulate points when they purchase products at participating service stations. These points can be redeemed for Company’s products, rewards, discounts and other privileges from partner merchants. Revenue is allocated between the goods sold and the points issued that are expected to be redeemed. This allocation is based on the relative stand-alone selling price of the points. A deferred liability account is set up for these points. The liability will be reversed when the Company has fulfilled its obligations to supply the discounted products under the terms of the program or when it is no longer probable that the points under the program will be redeemed. The deferred liability is based on the best estimate of future redemption profile. All the estimates are reviewed on an annual basis or more frequently, where there is indication of a material change.
Other sources of revenue are as follows: Interest Income. Interest income is recognized using the effective interest method. In calculating interest income, the effective interest rate is applied to the gross carrying amount of the asset. Dividend Income. Dividend Income is recognized when the Company’s right to receive the payment is established. Rent Income. Rent income from operating leases (net of any incentives given to the lessees), other than from the use of loaned equipment, is recognized on a straight-line basis over the lease terms. Lease incentives granted are recognized as an integral part of the total rent income over the term of the lease. Gain or Loss on Sale of Investments in Share of Stock. Gain or loss is recognized when the Company disposes of its investment in shares of stock of a subsidiary, associate and joint venture and financial assets at FVPL. Gain or loss is computed as the difference between the proceeds of the disposed investment and its carrying amount, including the carrying amount of goodwill, any. Other Income. Other income is recognized when there is incidental economic benefit, other than the usual business operations, that will flow to the Company and that can be measured reliably. Cost and Expense Recognition Costs and expenses are decreases in economic benefits during the reporting period in the form of outflows or decrease of assets or incurrence of liabilities that result in decreases in equity, other than those relating to distributions to equity participants. Expenses are recognized when incurred.
- 30 -
Borrowing Costs Borrowing costs directly attributable to the acquisition or construction of an asset that necessarily takes a substantial period of time to get ready for its intended use are capitalized as part of the cost of the respective assets. All other borrowing costs are expensed in the period they occur. Capitalization of borrowing costs commences when the activities to prepare the asset are in progress and expenditures and borrowing costs are being incurred. Borrowing costs are capitalized until the assets are substantially ready for their intended use. Investment income earned on the temporary investment of specific borrowings pending expenditure on qualifying assets is deducted from the borrowing costs eligible for capitalization. Research and Development Costs Research costs are expensed as incurred. Development costs incurred on an individual project are carried forward when their future recoverability can be reasonably regarded as assured. Any expenditure carried forward is amortized in line with the expected future sales from the related project. The carrying amount of development costs is reviewed for impairment annually when the related asset is not yet in use. Otherwise, this is reviewed for impairment when events or changes in circumstances indicate that the carrying amount may not be recoverable. Employee Benefits Short-term Employee Benefits. Short-term employee benefits are expensed as the related service is provided. A liability is recognized for the amount expected to be paid if the Company has a present legal or constructive obligation to pay this amount as a result of past service provided by the employee and the obligation can be estimated reliably. Retirement Benefits Costs and Other Employee Benefit Costs. The Company has a tax qualified and funded defined benefit pension plan covering all permanent, regular, full-time employees administered by trustee banks. Some of its subsidiaries have separate unfunded, noncontributory, retirement plans. The net defined benefit retirement liability or asset is the aggregate of the present value of the amount of future benefit that employees have earned in return for their service in the current and prior periods, reduced by the fair value of plan assets (if any), adjusted for any effect of limiting a net defined benefit asset to the asset ceiling. The asset ceiling is the present value of economic benefits available in the form of reductions in future contributions to the plan. The cost of providing benefits under the defined benefit retirement plan is actuarially determined using the projected unit credit method. Projected unit credit method reflects services rendered by employees to the date of valuation and incorporates assumptions concerning projected salaries of employees. Actuarial gains and losses are recognized in full in the period in which they occur in OCI. Such actuarial gains and losses are also immediately recognized in equity and are not reclassified to profit or loss in subsequent period. Defined benefit costs comprise the following: Service costs; Net interest on the defined benefit retirement liability or asset; and Remeasurements of defined benefit retirement liability or asset; and Settlement gain or loss, if any
- 31 -
Service costs which include current service costs, past service costs and gains or losses on non-routine settlements are recognized as expense in the separate statements of comprehensive income. Past service costs are recognized when plan amendment or curtailment occurs. These amounts are calculated periodically by independent qualified actuary. Net interest on the net defined benefit retirement liability or asset is the change during the period as a result of contributions and benefit payments, which is determined by applying the discount rate based on the government bonds to the net defined benefit retirement liability or asset. Net interest on the net defined benefit retirement liability or asset is recognized as expense or income in the separate statements of comprehensive income. Remeasurements of net defined benefit retirement liability or asset comprising actuarial gains and losses, return on plan assets, and any change in the effect of the asset ceiling (excluding net interest) are recognized immediately in OCI in the period in which they arise. Remeasurements are not reclassified to separate statements of comprehensive income in subsequent periods. Settlement gain or loss pertains to the difference between the present value of the defined benefit obligation being settled, as determined on the date of settlement and the settlement price, including any plan assets transferred and any payments made directly by the entity in connection with the settlement. Any gain or loss on settlement is recognized as income or expense in the separate statements of comprehensive income. The Company also provides other benefits to its employees as follows: Corporate Performance Incentive Program. The Company has a corporate performance incentive program that aims to provide financial incentives for the employees, contingent on the achievement of the Company’s annual business goals and objectives. The Company recognizes achievement of its business goals through key performance indicators (KPIs) which are used to evaluate performance of the organization. The Company recognizes the related expense when the KPIs are met, that is when the Company is contractually obliged to pay the benefits. Savings Plan. The Company established a Savings Plan wherein eligible employees may apply for membership and have the option to contribute 5% to 15% of their monthly base pay. The Company, in turn, contributes an amount equivalent to 50% of the employee-member’s contribution. However, the Company’s 50% share applies only to a maximum of 10% of the employee-member’s contribution. The Savings Plan aims to supplement benefits upon employees’ retirement and to encourage employee-members to save a portion of their earnings. The Company accounts for this benefit as a defined contribution pension plan and recognizes a liability and an expense for this plan as the expenses for its contribution fall due. The Company has no legal or constructive obligations to pay further contributions after payments of the equivalent employer-share. The accumulated savings of the employees plus the Company’s share, including earnings, will be paid in the event of the employee’s: (a) retirement, (b) resignation after completing at least five years of continuous services, (c) death, or (d) involuntary separation not for cause. Land/Home Ownership Plan. The Company established the Land/Home Ownership Plan, an integral part of the Savings Plan, to extend a one-time financial assistance to Savings Plan members in securing housing loans for residential purposes.
- 32 -
Foreign Currency Foreign Currency Translations. Transactions in foreign currencies are initially recorded in the Company’s functional currency at exchange rates at the dates of the transactions. Monetary assets and monetary liabilities denominated in foreign currencies are translated to the functional currency at exchange rate at the reporting date. Nonmonetary assets and nonmonetary liabilities denominated in foreign currencies that are measured at fair value are translated to the functional currency at the exchange rate when the fair value was determined. Nonmonetary items denominated in foreign currencies that are measured based on historical cost are translated using the exchange rate at the date of the transaction. Foreign currency differences arising on translation are recognized in separate statements of comprehensive income, except for differences arising on the translation of financial assets at FVOCI, a financial liability designated as a hedge of the net investment in a foreign operation that is effective, or qualifying cash flow hedges, which are recognized in OCI. Taxes Current Tax. Current tax is the expected tax payable or receivable on the taxable income or loss for the year, using tax rates enacted or substantively enacted at the reporting date, and any adjustment to tax payable in respect of previous years. Current tax relating to items recognized directly in equity is recognized in equity and not in separate statements of comprehensive income. The Company periodically evaluates positions taken in the tax returns with respect to situations in which applicable tax regulations are subject to interpretations and establishes provisions where appropriate. Deferred Tax. Deferred tax is recognized using the liability method in respect of temporary differences between the carrying amounts of assets and liabilities for financial reporting purposes and the amounts used for taxation purposes. Deferred tax liabilities are recognized for all taxable temporary differences, except: where the deferred tax liability arises from the initial recognition of goodwill or of
an asset or liability in a transaction that is not a business combination and, at the time of the transaction, affects neither the accounting profit nor taxable profit or loss; and
with respect to taxable temporary differences associated with investments in shares of stock of subsidiaries, associates and interests in joint ventures, where the timing of the reversal of the temporary differences can be controlled and it is probable that the temporary differences will not reverse in the foreseeable future.
- 33 -
Deferred tax assets are recognized for all deductible temporary differences, carryforward benefits of unused tax credits - Minimum Corporate Income Tax (MCIT) and unused tax losses - Net Operating Loss Carry Over (NOLCO), to the extent that it is probable that taxable profit will be available against which the deductible temporary differences, and the carryforward benefits of MCIT and NOLCO can be utilized, except:
where the deferred tax asset relating to the deductible temporary difference arises from the initial recognition of an asset or liability in a transaction that is not a business combination and, at the time of the transaction, affects neither the accounting profit nor taxable profit or loss; and
with respect to deductible temporary differences associated with investments in
shares of stock of subsidiaries, associates and interests in joint ventures, deferred tax assets are recognized only to the extent that it is probable that the temporary differences will reverse in the foreseeable future and taxable profit will be available against which the temporary differences can be utilized.
The carrying amount of deferred tax assets is reviewed at each reporting date and reduced to the extent that it is no longer probable that sufficient taxable profit will be available to allow all or part of the deferred tax asset to be utilized. Unrecognized deferred tax assets are reassessed at each reporting date and are recognized to the extent that it has become probable that future taxable profit will allow the deferred tax asset to be recovered. The measurement of deferred tax reflects the tax consequences that would follow the manner in which the Company expects, at the end of the reporting period, to recover or settle the carrying amount of its assets and liabilities. Deferred tax assets and liabilities are measured at the tax rates that are expected to apply in the year when the asset is realized or the liability is settled, based on tax rates (and tax laws) that have been enacted or substantively enacted at the reporting date. Current tax and deferred tax are recognized in the separate statements of comprehensive income except to the extent that it relates to a business combination, or items recognized directly in equity or in OCI. Deferred tax assets and deferred tax liabilities are offset, if a legally enforceable right exists to set off current tax assets against current tax liabilities and the deferred taxes relate to the same taxable entity and the same taxation authority. Value-added Tax (VAT). Revenues, expenses and assets are recognized net of the amount of VAT, except: where the tax incurred on a purchase of assets or services is not recoverable
from the taxation authority, in which case the tax is recognized as part of the cost of acquisition of the asset or as part of the expense item as applicable; and
receivables and payables that are stated with the amount of tax included. The net amount of tax recoverable from, or payable to, the taxation authority is included as part of “Other current assets” or “Trade and other payables” accounts in the separate statements of financial position.
- 34 -
Related Parties Parties are considered to be related if one party has the ability, directly or indirectly, to control the other party or exercise significant influence over the other party in making financial and operating decisions. Parties are also considered to be related if they are subject to common control and significant influence. Related parties may be individuals or corporate entities. Basic and Diluted Earnings Per Common Share (EPS) Basic EPS is computed by dividing the net income for the period attributable to equity holders of the Company, net of dividends on preferred shares and distributions to holders of capital securities, by the weighted average number of issued and outstanding common shares during the period, with retroactive adjustment for any stock dividends declared. Diluted EPS is computed in the same manner, adjusted for the effect of all potential dilutive debt or equity instruments. Operating Segments The Company’s operating segments are organized and managed separately according to the nature of the products and services provided, with each segment representing a strategic business unit that offers different products and serves different markets. Financial information on operating segments is presented in Note 36 to the separate financial statements. The Chief Executive Officer (the chief operating decision maker) reviews management reports on a regular basis. The measurement policies the Company used for segment reporting under PFRS 8 are the same as those used in its separate financial statements. There have been no changes in the measurement methods used to determine reported segment profit or loss from prior periods. All inter-segment transfers are carried out at arm’s length prices. Segment revenues, expenses and performance include sales and purchases between business segments. Contingencies Contingent liabilities are not recognized in the separate financial statements. They are disclosed in the notes to the separate financial statements unless the possibility of an outflow of resources embodying economic benefits is remote. Contingent assets are not recognized in the separate financial statements but are disclosed in the notes to the separate financial statements when an inflow of economic benefits is probable. Events After the Reporting Date Post year-end events that provide additional information about the Company’s financial position at the reporting date (adjusting events) are reflected in the separate financial statements. Post year-end events that are not adjusting events are disclosed in the notes to the separate financial statements when material.
- 35 -
4. Use of Judgments, Estimates and Assumptions The preparation of the Company’s separate financial statements in accordance with PFRS requires management to make judgments, estimates and assumptions that affect the application of accounting policies and the amounts of assets, liabilities, income and expenses reported in the separate financial statements at the reporting date. However, uncertainty about these judgments, estimates and assumptions could result in outcome that could require a material adjustment to the carrying amount of the affected asset or liability in the future. Judgments and estimates are continually evaluated and are based on historical experience and other factors, including expectations of future events that are believed to be reasonable under the circumstances. Revisions are recognized in the period in which the judgments and estimates are revised and in any future period affected. Judgments In the process of applying the Company’s accounting policies, management has made the following judgments, apart from those involving estimations, which have the most significant effect on the amounts recognized in the separate financial statements: Determining Functional Currency. The Company has determined that its functional currency is the Philippine peso. It is the currency of the primary economic environment in which the Company operates. It is the currency that mainly influences the sales price of goods and services and the costs of providing these goods and services. Identification of Distinct Performance Obligation. The Company assesses the goods or services promised in a contract with a customer and identifies as a performance obligation either: (a) a good or service (or a bundle of goods or services) that is distinct; or (b) a series of distinct goods or services that are substantially the same and that have the same pattern of transfer to the customer. The Company has determined that it has distinct performance obligations other than the sale of petroleum products such as the provision of technical support and consumer loyalty program and allocates the transaction price into these several performance obligations. Determining whether a Contract Contains a Lease. The Company uses its judgment in determining whether a contract contains a lease. At inception of a contract, the Company makes an assessment whether it has the right to obtain substantially all the economic benefits from the use of the identified asset and the right to direct the use of the identified asset. Operating Lease Commitments - Company as Lessor. The Company has entered into various lease agreements as lessor. The Company had determined that it retains all the significant risks and rewards of ownership of the properties leased out on operating leases. Rent income recognized as “Other operating income” account in the separate statements of comprehensive income amounted to P453,855 and P315,352 in 2021 and 2020, respectively. Revenues from the customers’ use of loaned equipment amounted to P1,152,796 in 2021 and P1,149,761 in 2020 (Note 36).
- 36 -
Estimating the Incremental Borrowing Rate. The Company cannot readily determine the interest rate implicit in its leases. Therefore, it uses the relevant incremental borrowing rate (IBR) to measure lease liabilities. The IBR is the rate of interest that the Company would have to pay to borrow over a similar term, and with a similar security, the funds necessary to obtain an asset of a similar value to the right-of-use asset in a similar economic environment. The IBR, therefore, reflects what the Company would have to pay, which requires estimation when no observable rates are available (such as for subsidiaries that do not enter into financing transactions) and to make adjustments to reflect the terms and conditions of the lease. The Company estimates the IBR using observable inputs (such as market interest rates) when available and is required to consider certain contract and entity-specific judgement estimates. Determining the Lease Term of Contracts with Renewal Options - Company as Lessee. The Company determines the lease term as the noncancellable term of the lease, together with any periods covered by an option to extend the lease if it is reasonably certain to be exercised. The Company has several lease contracts that include extension options. At lease commencement date, the Company applies judgment in evaluating whether it is reasonably certain to exercise the option to renew the lease by considering all relevant factors that create an economic incentive for it to exercise the renewal option. The Company reassesses whether it is reasonably certain to exercise the options if there is a significant event or change in circumstances within its control. Determining Whether the Company is acting as a Principal or Agent in a Revenue Transaction. The determination whether the Company is a principal or agent in a contract is made by identifying each specified goods or services promised to the customers in the contract and evaluating whether the Company obtains control of the specified goods and services before it is transferred to the customer. For the sale of petroleum products to dealers, the Company transfers the control of the goods upon delivery, hence, the Company has determined that it is acting as principal in the sales transactions with dealers. The dealers are likewise acting as principal in the sales transactions to end consumers on the basis of the following: (a) the dealers have the primary responsibility to provide specified goods to the end consumers; (b) the dealers bear inventory risk before the goods are transferred to end consumers; and (c) the dealers have discretion to establish prices for specified goods. For the Company’s fleet card transactions, the Company has likewise determined that it is acting as principal in the sales transactions with the customers since the Company has the primary responsibility for providing goods purchased through fleet cards and the Company has discretion to establish prices for specified goods in a fleet card transaction. Classification of Financial Instruments. The Company exercises judgments in classifying a financial instrument, or its component parts, on initial recognition as a financial asset, a financial liability or an equity instrument in accordance with the substance of the contractual arrangement and the definitions of a financial asset, a financial liability or an equity instrument. The substance of a financial instrument, rather than its legal form, governs its classification in the separate statements of financial position.
- 37 -
The Company uses its judgment in determining the classification of financial assets based on its business model in which assets are managed and their cash flow characteristics. The classification and fair values of financial assets and financial liabilities are presented in Note 34. Evaluating Control or Significant Influence over its Investees. Determining whether the Company has control or significant influence in an investee requires significant judgment. The Company has assessed it has lost its control over Petrogen upon the decrease in ownership interest from 100% to 25.06% in 2021. The Company has no longer the power, in practice, to govern the financial and operating policies of Petrogen, to appoint or remove the majority of the members of the BOD of Petrogen and to cast majority votes at meetings of the BOD of Petrogen. However, the Company has determined that it exercises significant influence over Petrogen by virtue of its representation in the BOD of Petrogen (Note 9). Distinction Between Property, Plant and Equipment and Investment Property. The Company determines whether a property qualifies as investment property. In making its judgment, the Company considers whether the property generates cash flows largely independent of the other assets held by the Company. Owner-occupied properties generate cash flows that are attributable not only to the property but also to other assets used in the production or supply process. Some properties comprise a portion that is held to earn rentals or for capital appreciation and another portion that is held for use in the production and supply of goods and services or for administrative purposes. If these portions can be sold separately (or leased out separately under finance lease), the Company accounts for the portions separately. If the portion cannot be sold separately, the property is accounted for as investment property only if an insignificant portion is held for use in the production or supply of goods or services for administrative purposes. Judgment is applied in determining whether ancillary services are so significant that a property does not qualify as investment property. The Company considers each property separately in making its judgment. Determining Impairment Indicators of Other Nonfinancial Assets. PFRS requires that an impairment review be performed on property, plant and equipment, investments in shares of stock of an associate and interest in joint ventures, investment property and intangible assets when events or changes in circumstances indicate that the carrying value may not be recoverable. Determining the recoverable amount of assets requires the estimation of cash flows expected to be generated from the continued use and ultimate disposition of such assets. While it is believed that the assumptions used in the estimation of recoverable amounts are appropriate and reasonable, significant changes in these assumptions may materially affect the assessment of recoverable amounts and any resulting impairment loss could have a material adverse impact on financial performance. Taxes. Significant judgment is required in determining current and deferred tax expense. There are many transactions and calculations for which the ultimate tax determination is uncertain during the ordinary course of business. The Company recognizes liabilities for anticipated tax audit issues based on estimates of whether additional taxes will be due. Where the final tax outcome of these matters is different from the amounts that were initially recorded, such differences will impact the current income tax and deferred tax expenses in the year in which such determination is made.
- 38 -
Contingencies. The Company is currently involved in various pending claims and lawsuits which could be decided in favor of or against the Company. The Company’s estimate of the probable costs for the resolution of these pending claims and lawsuits has been developed in consultation with in-house as well as outside legal counsel handling the prosecution and defense of these matters and is based on an analysis of potential results. The Company currently does not believe that these pending claims and lawsuits will have a material adverse effect on its financial position and financial performance. It is possible, however, that future financial performance could be materially affected by changes in the estimates or in the effectiveness of strategies relating to these proceedings. Estimates and Assumptions The key estimates and assumptions used in the separate financial statements are based upon the Company’s evaluation of relevant facts and circumstances as at the date of the separate financial statements. Actual results could differ from such estimates. Assessment for ECL on Trade and Other Receivables. The Company, applying the simplified approach in the computation of ECL, initially uses a provision matrix based on historical default rates for trade and other receivables. The Company also uses appropriate groupings if its historical credit loss experience shows significantly different loss patterns for different customer segments. The Company then adjusts the historical credit loss experience with forward-looking information on the basis of current observable data affecting each customer segment to reflect the effects of current and forecasted economic conditions. The Company adjusts historical default rates to forward-looking default rate by determining the closely related economic factor affecting each customer segment. The Company regularly reviews the methodology and assumptions used for estimating ECL to reduce any differences between estimates and actual credit loss experience. The determination of the relationship between historical default rates and forecasted economic conditions is a significant accounting estimate. The Company has assessed that the forward-looking default rate component of its ECL on trade and other receivables is not material because substantial amount of receivables are normally collected within one year. Moreover, based on Management’s assessment, current conditions and forward-looking information does not indicate a significant increase in credit risk exposure of the Company from its trade receivables. Impairment losses on trade and other receivables amounted to P25,676 and P77,249 in 2021 and 2020, respectively (Notes 7 and 22). Receivables written-off amounted to P4,313 and P5,520 in 2021 and 2020, respectively (Note 7). Reversal of impairment loss amounted to P17,514 and nil in 2021 and 2020, respectively (Note 7). The carrying amount of trade and other receivables amounted to P30,311,296 and P22,651,307 as of December 31, 2021 and 2020, respectively (Note 7). Assessment for ECL on Other Financial Assets at Amortized Cost. The Company determines the allowance for ECL using general approach based on the probability-weighted estimate of the present value of all cash shortfalls over the expected life of financial assets at amortized cost. ECL is provided for credit losses that result from possible default events within the next 12 months unless there has been a significant increase in credit risk since initial recognition in which case ECL is provided based on lifetime ECL.
- 39 -
When determining if there has been a significant increase in credit risk, the Company considers reasonable and supportable information that is available without undue cost or effort and that is relevant for the particular financial instrument being assessed such as, but not limited to, the following factors: Actual or expected external and internal credit rating downgrade; Existing or forecasted adverse changes in business, financial or economic
conditions; and Actual or expected significant adverse changes in the operating results of the
borrower. The Company also considers financial assets at day one to be the latest point at which lifetime ECL should be recognized unless it can demonstrate that this does not represent a significant risk in credit risk such as when non-payment was an administrative oversight rather than resulting from financial difficulty of the borrower. The Company has assessed that the ECL on other financial assets at amortized cost is not material because the transactions with respect to these financial assets were entered into by the Company only with reputable banks, the Government of the Philippines and companies with good credit standing and relatively low risk of defaults. Accordingly, no additional provision for ECL on other financial assets at amortized cost was recognized in 2021 and 2020. The carrying amounts of other financial assets at amortized cost are as follows: Note 2021 2020
Cash in banks and cash equivalents 5 P26,070,566 P19,128,434 Advances to a subsidiary 9 1,159,707 1,238,004
P27,230,273 P20,366,438
Net Realizable Values of Inventories. In determining the NRV of inventories, management takes into account the most reliable evidence available at the times the estimates are made. Future realization of the carrying amount of inventories of P54,120,697 and P38,677,614 as of the end of 2021 and 2021, respectively (Note 8), is affected by price changes in different market segments for crude and petroleum products. Both aspects are considered key sources of estimation uncertainty and may cause significant adjustments to the Company’s inventories within the next financial year. The Company recognized loss on inventory write-down amounting to P2,633 and nil in 2021 and 2020, respectively (Note 8). Allowance for Inventory Obsolescence. The allowance for inventory obsolescence consists of collective and specific valuation allowance. A collective valuation allowance is established at a certain percentage based on the age and movement of stocks. In case there is write-off or disposal of slow-moving items during the year, a reduction in the allowance for inventory obsolescence is made. Review of allowance is done every quarter, while a revised set-up or booking is posted at the end of the year based on evaluations or recommendations of the proponents. The amount and timing of recorded expenses for any year would therefore differ based on the judgments or estimates made. In 2021 and 2020, the Company reduced the allowance for inventory obsolescence by nil and P545,445, respectively (Note 8).
- 40 -
Fair Value Measurements. A number of the Company’s accounting policies and disclosures require the measurement of fair values for both financial and non-financial assets and liabilities. The Company has an established control framework with respect to the measurement of fair values. This includes a valuation team that has the overall responsibility for overseeing all significant fair value measurements, including Level 3 fair values. The valuation team regularly reviews significant unobservable inputs and valuation adjustments. If third party information is used to measure fair values, then the valuation team assesses the evidence obtained to support the conclusion that such valuations meet the requirements of PFRS, including the level in the fair value hierarchy in which such valuations should be classified. The Company uses market observable data when measuring the fair value of an asset or liability. Fair values are categorized into different levels in a fair value hierarchy based on the inputs used in the valuation techniques. If the inputs used to measure the fair value of an asset or a liability can be categorized in different levels of the fair value hierarchy, then the fair value measurement is categorized in its entirety in the same level of the fair value hierarchy based on the lowest level input that is significant to the entire measurement. The Company recognizes transfers between levels of the fair value hierarchy at the end of the reporting period during which the change has occurred. The methods and assumptions used to estimate the fair values for both financial and non-financial assets and liabilities are discussed in Note 34. Estimated Useful Lives of Property, Plant and Equipment, Right-of-Use Asset, Investment Property and Intangible Assets with Finite Useful Lives. The Company estimates the useful lives of property, plant and equipment, right-of-use asset, investment property and intangible assets with finite useful lives based on the period over which the assets are expected to be available for use. The estimated useful lives of property, plant and equipment, right-of-use asset, investment property and intangible assets with finite useful lives are reviewed periodically and are updated if expectations differ from previous estimates due to physical wear and tear, technical or commercial obsolescence and legal or other limits on the use of the assets. In addition, estimation of the useful lives of property, plant and equipment, right-of-use asset, investment property and intangible assets with finite useful lives is based on collective assessment of industry practice, internal technical evaluation and experience with similar assets. It is possible, however, that future financial performance could be materially affected by changes in estimates brought about by changes in factors mentioned above. The amounts and timing of recorded expenses for any period would be affected by changes in these factors and circumstances. A reduction in the estimated useful lives of property, plant and equipment, right-of-use asset, investment property and intangible assets with finite useful lives would increase recorded cost of goods sold and selling and administrative expenses and decrease noncurrent assets. Except for refinery and plant equipment used in production, there is no change in estimated useful lives of property, plant and equipment, right-of-use asset, investment property and intangible assets with finite useful lives based on management’s review at the reporting date.
- 41 -
Starting January 1, 2020, the Company adopted the UPM of accounting for depreciation of refinery and plant equipment used in production. UPM closely reflects the expected pattern of consumption of the future economic benefits embodied in these assets. Depreciation of said assets is computed using the expected consumption over the estimated useful lives of these assets. Previously, depreciation was computed using the straight-line method over the estimated useful lives of the assets. Property, plant and equipment, net of accumulated depreciation amounted to P146,332,844 and P144,842,107 as at December 31, 2021 and 2020, respectively. Accumulated depreciation of property, plant and equipment amounted to P85,339,566 and P79,503,258 as at December 31, 2021 and 2020, respectively (Note 10). Right-of-use of assets, net of accumulated depreciation amounted to P5,229,412 and P5,700,187 as at December 31, 2021 and 2020, respectively. Accumulated depreciation of right-of-use asset amounted to P1,509,405 and P1,395,295 as at December 31, 2021 and 2020, respectively (Note 11). Investment property, net of accumulated depreciation amounted to P11,716,304 and P12,431,262 as at December 31, 2021 and 2020, respectively. Accumulated depreciation of investment property amounted to P7,942,965 and P6,733,548 as at December 31, 2021 and 2020, respectively (Note 12). Intangible assets with finite useful lives, net of accumulated amortization, amounted to P83,317 and P105,665 as at December 31, 2021 and 2020, respectively (Note 13). Accumulated amortization of intangible assets with finite useful lives amounted to P165,590 and P143,243 as at December 31, 2021 and 2020, respectively. Fair Value of Investment Property. The fair value of investment property presented for disclosure purposes is based on market values, being the estimated amount for which the property can be sold or based on a most recent sale transaction of a similar property within the same vicinity where the investment property is located. In the absence of current prices in an active market, the valuations are prepared by considering: (a) the aggregate estimated future cash flows expected to be received from leasing out the property. A yield that reflects the specific risks inherent in the net cash flows is then applied to the net annual cash flows to arrive at the property valuation; or (b) the depreciated replacement cost of the asset, which estimates the current replacement cost of new assets and adjusted for obsolescence, including physical, functional and economic obsolescence. Estimated fair values of investment property amounted to P16,005,584 and P16,374,698 as of December 31, 2021 and 2020, respectively (Note 12). Realizability of Deferred Tax Assets. The Company reviews its deferred tax assets at each reporting date and reduces the carrying amount to the extent that it is no longer probable that sufficient taxable profit will be available to allow all or part of the deferred tax assets to be utilized. The Company’s assessment on the recognition of deferred tax assets on deductible temporary differences and carry forward benefits of MCIT and NOLCO is based on the projected taxable income in the following periods. Deferred tax assets amounted to P13,825,719 and P15,996,465 as of December 31, 2021 and 2020, respectively (Note 26).
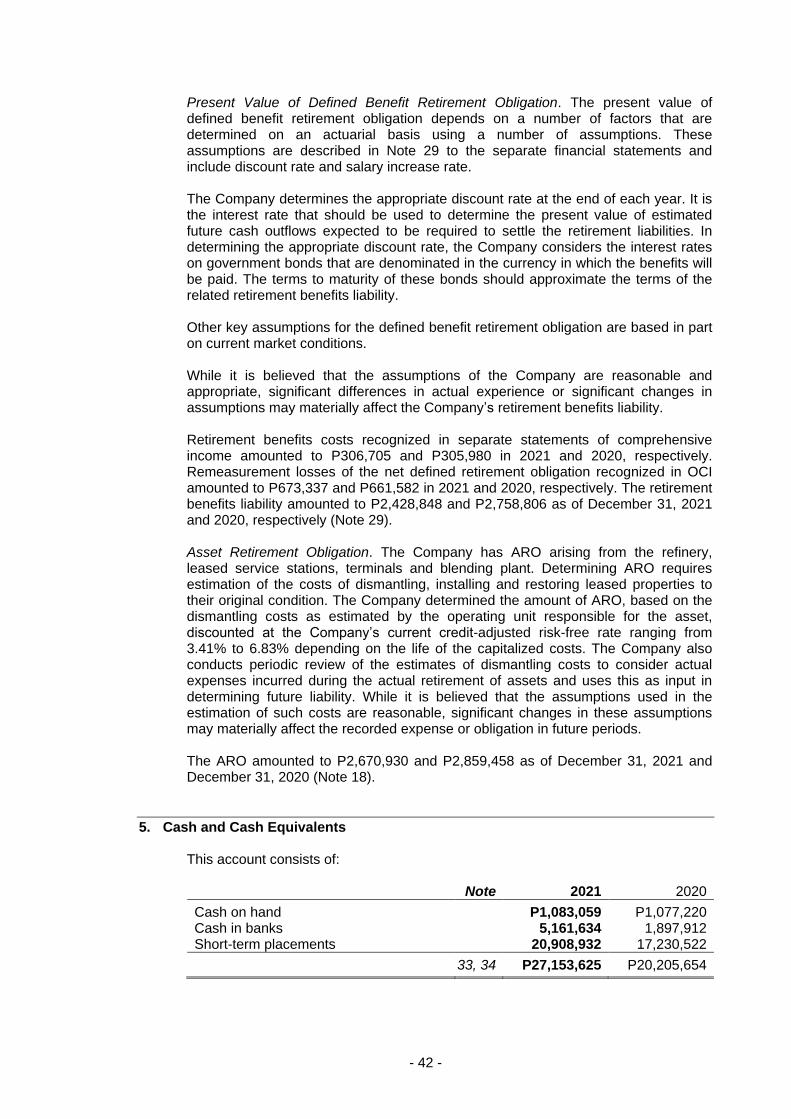
- 42 -
Present Value of Defined Benefit Retirement Obligation. The present value of defined benefit retirement obligation depends on a number of factors that are determined on an actuarial basis using a number of assumptions. These assumptions are described in Note 29 to the separate financial statements and include discount rate and salary increase rate. The Company determines the appropriate discount rate at the end of each year. It is the interest rate that should be used to determine the present value of estimated future cash outflows expected to be required to settle the retirement liabilities. In determining the appropriate discount rate, the Company considers the interest rates on government bonds that are denominated in the currency in which the benefits will be paid. The terms to maturity of these bonds should approximate the terms of the related retirement benefits liability. Other key assumptions for the defined benefit retirement obligation are based in part on current market conditions. While it is believed that the assumptions of the Company are reasonable and appropriate, significant differences in actual experience or significant changes in assumptions may materially affect the Company’s retirement benefits liability. Retirement benefits costs recognized in separate statements of comprehensive income amounted to P306,705 and P305,980 in 2021 and 2020, respectively. Remeasurement losses of the net defined retirement obligation recognized in OCI amounted to P673,337 and P661,582 in 2021 and 2020, respectively. The retirement benefits liability amounted to P2,428,848 and P2,758,806 as of December 31, 2021 and 2020, respectively (Note 29). Asset Retirement Obligation. The Company has ARO arising from the refinery, leased service stations, terminals and blending plant. Determining ARO requires estimation of the costs of dismantling, installing and restoring leased properties to their original condition. The Company determined the amount of ARO, based on the dismantling costs as estimated by the operating unit responsible for the asset, discounted at the Company’s current credit-adjusted risk-free rate ranging from 3.41% to 6.83% depending on the life of the capitalized costs. The Company also conducts periodic review of the estimates of dismantling costs to consider actual expenses incurred during the actual retirement of assets and uses this as input in determining future liability. While it is believed that the assumptions used in the estimation of such costs are reasonable, significant changes in these assumptions may materially affect the recorded expense or obligation in future periods. The ARO amounted to P2,670,930 and P2,859,458 as of December 31, 2021 and December 31, 2020 (Note 18).
5. Cash and Cash Equivalents This account consists of: Note 2021 2020
Cash on hand P1,083,059 P1,077,220 Cash in banks 5,161,634 1,897,912 Short-term placements 20,908,932 17,230,522
33, 34 P27,153,625 P20,205,654
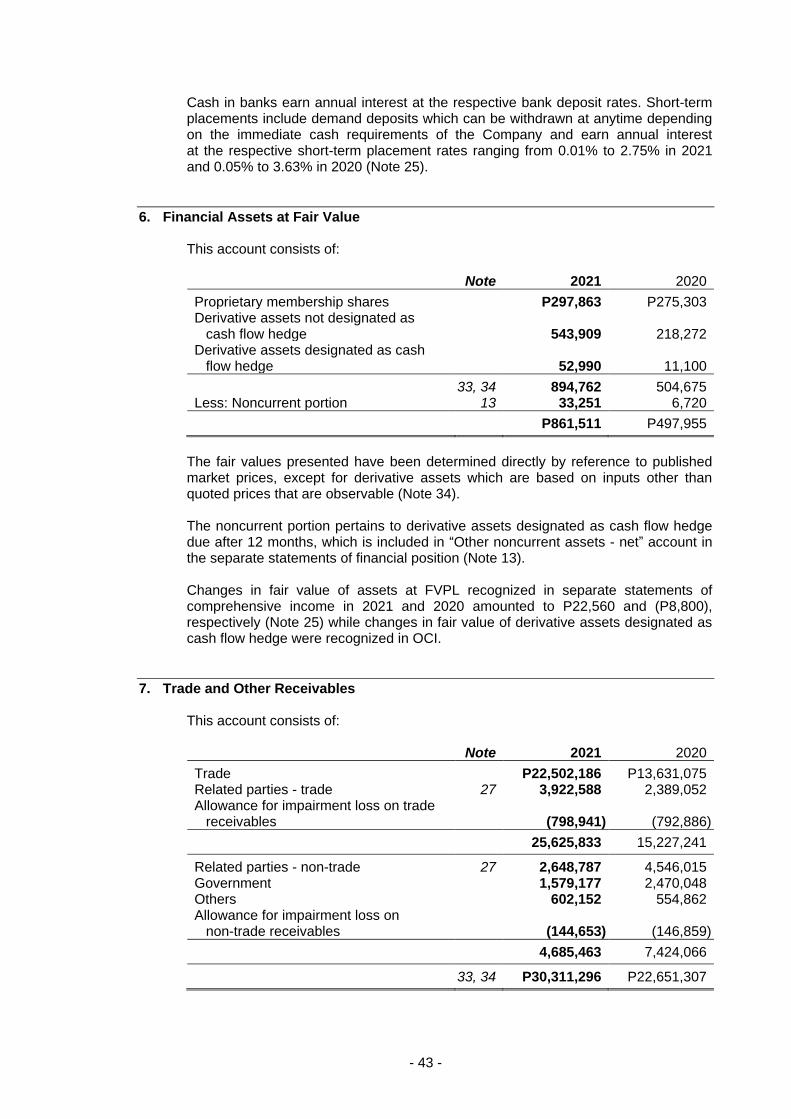
- 43 -
Cash in banks earn annual interest at the respective bank deposit rates. Short-term placements include demand deposits which can be withdrawn at anytime depending on the immediate cash requirements of the Company and earn annual interest at the respective short-term placement rates ranging from 0.01% to 2.75% in 2021 and 0.05% to 3.63% in 2020 (Note 25).
6. Financial Assets at Fair Value This account consists of: Note 2021 2020
Proprietary membership shares P297,863 P275,303 Derivative assets not designated as
cash flow hedge 543,909 218,272 Derivative assets designated as cash
flow hedge 52,990 11,100
33, 34 894,762 504,675 Less: Noncurrent portion 13 33,251 6,720
P861,511 P497,955
The fair values presented have been determined directly by reference to published market prices, except for derivative assets which are based on inputs other than quoted prices that are observable (Note 34). The noncurrent portion pertains to derivative assets designated as cash flow hedge due after 12 months, which is included in “Other noncurrent assets - net” account in the separate statements of financial position (Note 13). Changes in fair value of assets at FVPL recognized in separate statements of comprehensive income in 2021 and 2020 amounted to P22,560 and (P8,800), respectively (Note 25) while changes in fair value of derivative assets designated as cash flow hedge were recognized in OCI.
7. Trade and Other Receivables This account consists of: Note 2021 2020
Trade P22,502,186 P13,631,075 Related parties - trade 27 3,922,588 2,389,052 Allowance for impairment loss on trade
receivables (798,941) (792,886)
25,625,833 15,227,241
Related parties - non-trade 27 2,648,787 4,546,015 Government 1,579,177 2,470,048 Others 602,152 554,862 Allowance for impairment loss on
non-trade receivables (144,653) (146,859)
4,685,463 7,424,066
33, 34 P30,311,296 P22,651,307
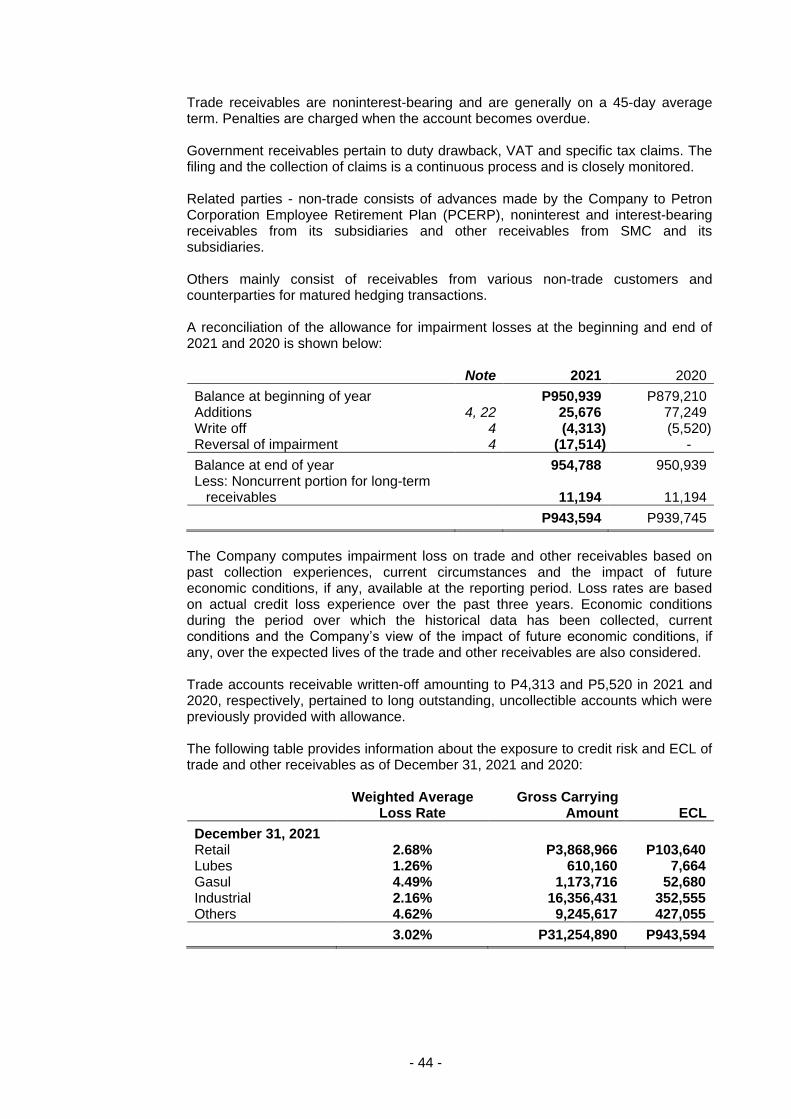
- 44 -
Trade receivables are noninterest-bearing and are generally on a 45-day average term. Penalties are charged when the account becomes overdue. Government receivables pertain to duty drawback, VAT and specific tax claims. The filing and the collection of claims is a continuous process and is closely monitored. Related parties - non-trade consists of advances made by the Company to Petron Corporation Employee Retirement Plan (PCERP), noninterest and interest-bearing receivables from its subsidiaries and other receivables from SMC and its subsidiaries. Others mainly consist of receivables from various non-trade customers and counterparties for matured hedging transactions. A reconciliation of the allowance for impairment losses at the beginning and end of 2021 and 2020 is shown below: Note 2021 2020
Balance at beginning of year P950,939 P879,210 Additions 4, 22 25,676 77,249 Write off 4 (4,313) (5,520) Reversal of impairment 4 (17,514) -
Balance at end of year 954,788 950,939 Less: Noncurrent portion for long-term
receivables 11,194 11,194
P943,594 P939,745
The Company computes impairment loss on trade and other receivables based on past collection experiences, current circumstances and the impact of future economic conditions, if any, available at the reporting period. Loss rates are based on actual credit loss experience over the past three years. Economic conditions during the period over which the historical data has been collected, current conditions and the Company’s view of the impact of future economic conditions, if any, over the expected lives of the trade and other receivables are also considered. Trade accounts receivable written-off amounting to P4,313 and P5,520 in 2021 and 2020, respectively, pertained to long outstanding, uncollectible accounts which were previously provided with allowance. The following table provides information about the exposure to credit risk and ECL of trade and other receivables as of December 31, 2021 and 2020:
Weighted Average
Loss Rate Gross Carrying
Amount ECL
December 31, 2021 Retail 2.68% P3,868,966 P103,640 Lubes 1.26% 610,160 7,664 Gasul 4.49% 1,173,716 52,680 Industrial 2.16% 16,356,431 352,555 Others 4.62% 9,245,617 427,055
3.02% P31,254,890 P943,594
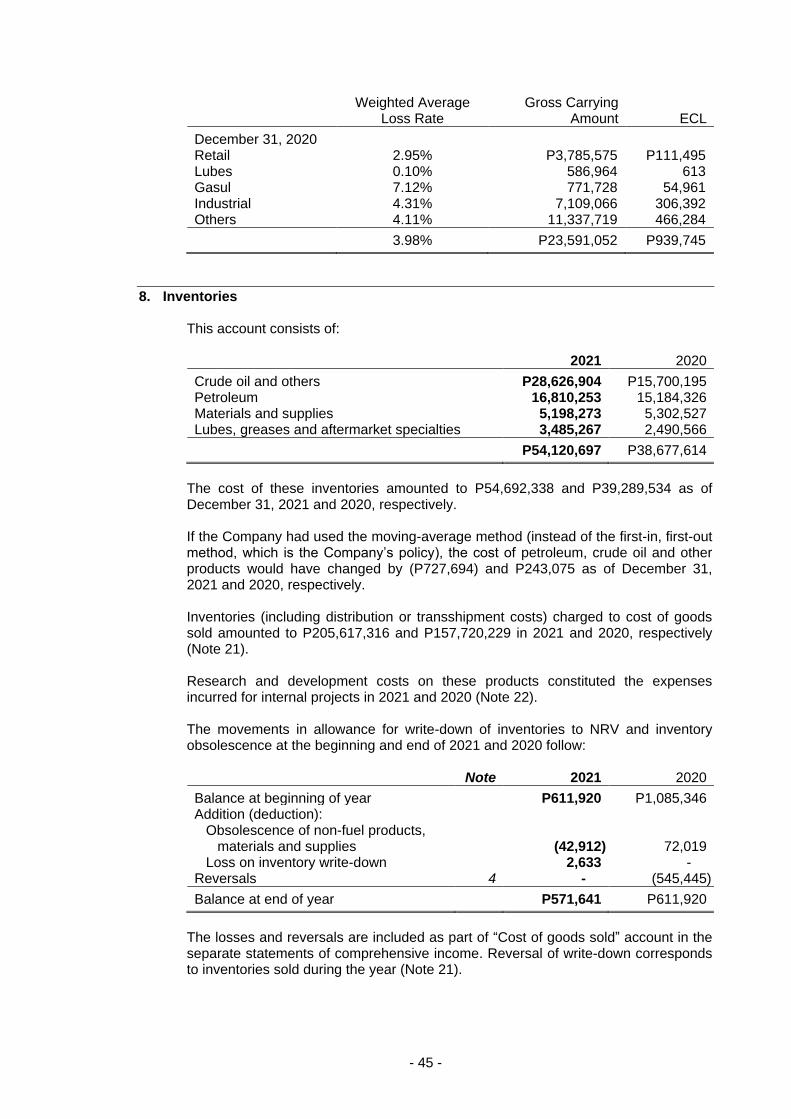
- 45 -
Weighted Average
Loss Rate Gross Carrying
Amount ECL
December 31, 2020 Retail 2.95% P3,785,575 P111,495 Lubes 0.10% 586,964 613 Gasul 7.12% 771,728 54,961 Industrial 4.31% 7,109,066 306,392 Others 4.11% 11,337,719 466,284
3.98% P23,591,052 P939,745
8. Inventories This account consists of: 2021 2020
Crude oil and others P28,626,904 P15,700,195 Petroleum 16,810,253 15,184,326 Materials and supplies 5,198,273 5,302,527 Lubes, greases and aftermarket specialties 3,485,267 2,490,566
P54,120,697 P38,677,614
The cost of these inventories amounted to P54,692,338 and P39,289,534 as of December 31, 2021 and 2020, respectively. If the Company had used the moving-average method (instead of the first-in, first-out method, which is the Company’s policy), the cost of petroleum, crude oil and other products would have changed by (P727,694) and P243,075 as of December 31, 2021 and 2020, respectively. Inventories (including distribution or transshipment costs) charged to cost of goods sold amounted to P205,617,316 and P157,720,229 in 2021 and 2020, respectively (Note 21). Research and development costs on these products constituted the expenses incurred for internal projects in 2021 and 2020 (Note 22). The movements in allowance for write-down of inventories to NRV and inventory obsolescence at the beginning and end of 2021 and 2020 follow: Note 2021 2020
Balance at beginning of year P611,920 P1,085,346 Addition (deduction):
Obsolescence of non-fuel products, materials and supplies (42,912) 72,019
Loss on inventory write-down 2,633 - Reversals 4 - (545,445)
Balance at end of year P571,641 P611,920
The losses and reversals are included as part of “Cost of goods sold” account in the separate statements of comprehensive income. Reversal of write-down corresponds to inventories sold during the year (Note 21).
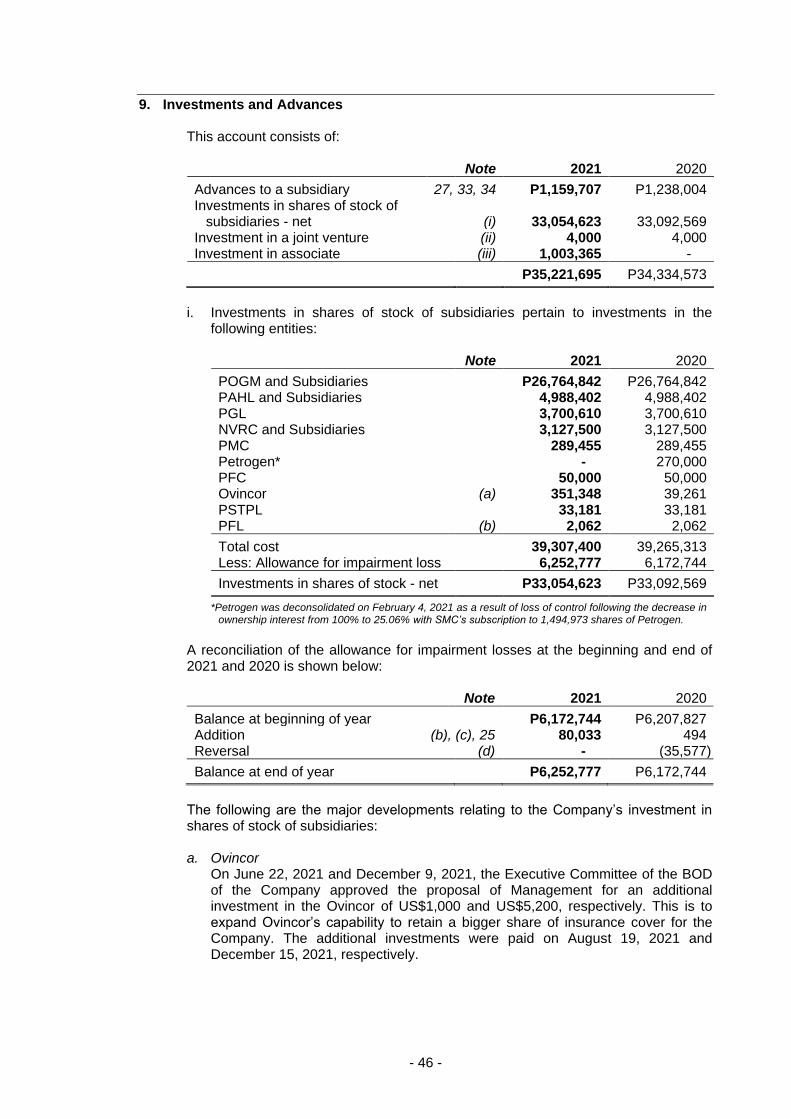
- 46 -
9. Investments and Advances This account consists of: Note 2021 2020
Advances to a subsidiary 27, 33, 34 P1,159,707 P1,238,004 Investments in shares of stock of
subsidiaries - net (i) 33,054,623 33,092,569 Investment in a joint venture (ii) 4,000 4,000 Investment in associate (iii) 1,003,365 -
P35,221,695 P34,334,573
i. Investments in shares of stock of subsidiaries pertain to investments in the
following entities: Note 2021 2020
POGM and Subsidiaries P26,764,842 P26,764,842 PAHL and Subsidiaries 4,988,402 4,988,402 PGL 3,700,610 3,700,610 NVRC and Subsidiaries 3,127,500 3,127,500 PMC 289,455 289,455 Petrogen* - 270,000 PFC 50,000 50,000 Ovincor (a) 351,348 39,261 PSTPL 33,181 33,181 PFL (b) 2,062 2,062
Total cost 39,307,400 39,265,313 Less: Allowance for impairment loss 6,252,777 6,172,744
Investments in shares of stock - net P33,054,623 P33,092,569
*Petrogen was deconsolidated on February 4, 2021 as a result of loss of control following the decrease in ownership interest from 100% to 25.06% with SMC’s subscription to 1,494,973 shares of Petrogen.
A reconciliation of the allowance for impairment losses at the beginning and end of 2021 and 2020 is shown below: Note 2021 2020
Balance at beginning of year P6,172,744 P6,207,827 Addition (b), (c), 25 80,033 494 Reversal (d) - (35,577)
Balance at end of year P6,252,777 P6,172,744
The following are the major developments relating to the Company’s investment in shares of stock of subsidiaries: a. Ovincor
On June 22, 2021 and December 9, 2021, the Executive Committee of the BOD of the Company approved the proposal of Management for an additional investment in the Ovincor of US$1,000 and US$5,200, respectively. This is to expand Ovincor’s capability to retain a bigger share of insurance cover for the Company. The additional investments were paid on August 19, 2021 and December 15, 2021, respectively.
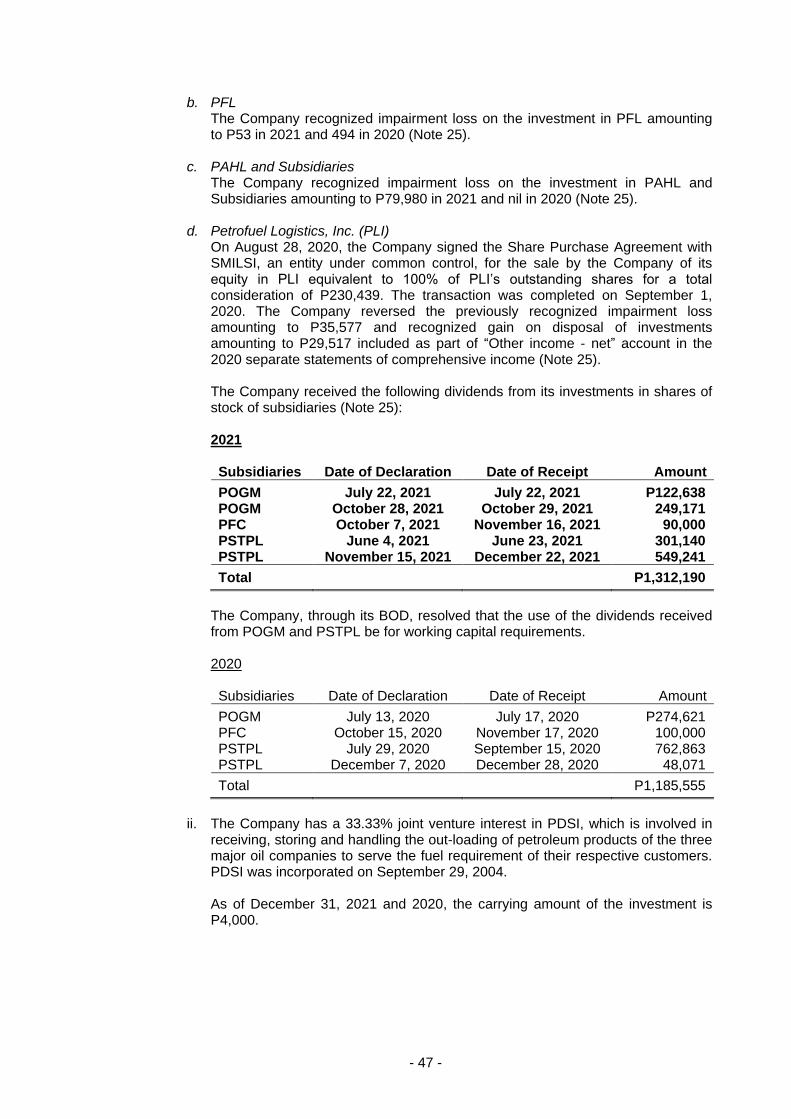
- 47 -
b. PFL The Company recognized impairment loss on the investment in PFL amounting to P53 in 2021 and 494 in 2020 (Note 25).
c. PAHL and Subsidiaries
The Company recognized impairment loss on the investment in PAHL and Subsidiaries amounting to P79,980 in 2021 and nil in 2020 (Note 25).
d. Petrofuel Logistics, Inc. (PLI)
On August 28, 2020, the Company signed the Share Purchase Agreement with SMILSI, an entity under common control, for the sale by the Company of its equity in PLI equivalent to 100% of PLI’s outstanding shares for a total consideration of P230,439. The transaction was completed on September 1, 2020. The Company reversed the previously recognized impairment loss amounting to P35,577 and recognized gain on disposal of investments amounting to P29,517 included as part of “Other income - net” account in the 2020 separate statements of comprehensive income (Note 25). The Company received the following dividends from its investments in shares of stock of subsidiaries (Note 25): 2021 Subsidiaries Date of Declaration Date of Receipt Amount
POGM July 22, 2021 July 22, 2021 P122,638 POGM October 28, 2021 October 29, 2021 249,171 PFC October 7, 2021 November 16, 2021 90,000 PSTPL June 4, 2021 June 23, 2021 301,140 PSTPL November 15, 2021 December 22, 2021 549,241
Total P1,312,190
The Company, through its BOD, resolved that the use of the dividends received from POGM and PSTPL be for working capital requirements. 2020 Subsidiaries Date of Declaration Date of Receipt Amount
POGM July 13, 2020 July 17, 2020 P274,621 PFC October 15, 2020 November 17, 2020 100,000 PSTPL July 29, 2020 September 15, 2020 762,863 PSTPL December 7, 2020 December 28, 2020 48,071
Total P1,185,555
ii. The Company has a 33.33% joint venture interest in PDSI, which is involved in
receiving, storing and handling the out-loading of petroleum products of the three major oil companies to serve the fuel requirement of their respective customers. PDSI was incorporated on September 29, 2004. As of December 31, 2021 and 2020, the carrying amount of the investment is P4,000.
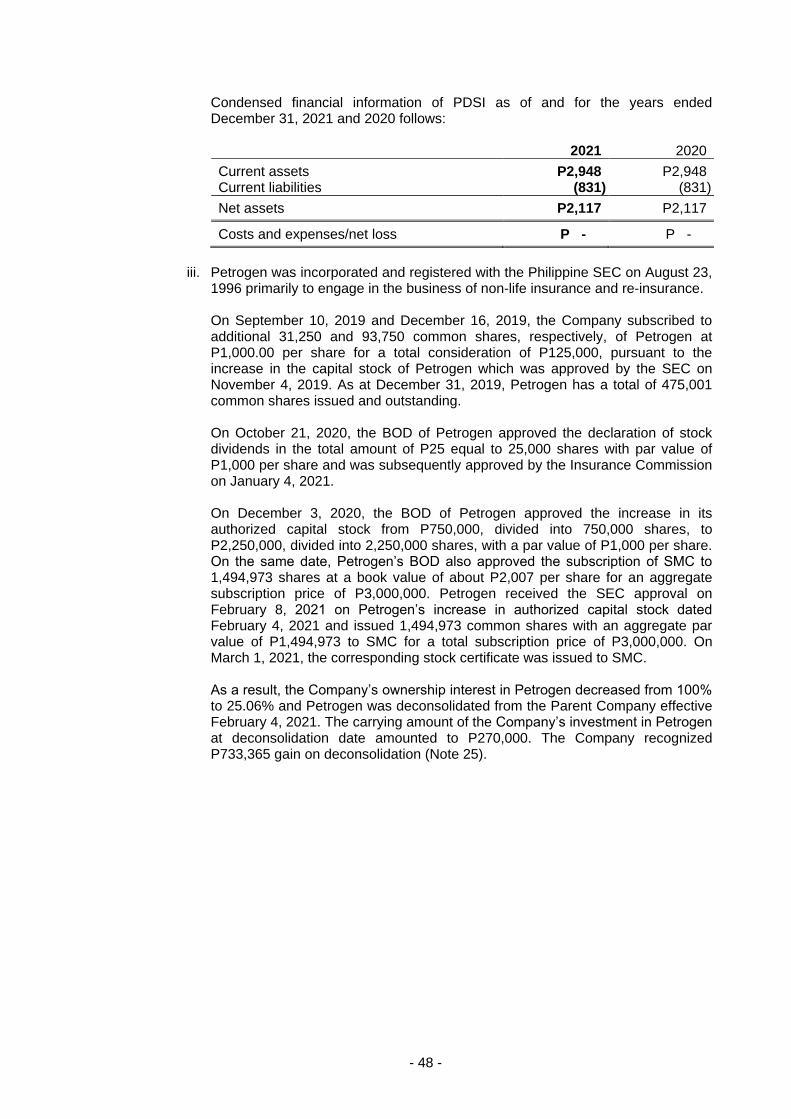
- 48 -
Condensed financial information of PDSI as of and for the years ended December 31, 2021 and 2020 follows: 2021 2020
Current assets P2,948 P2,948 Current liabilities (831) (831)
Net assets P2,117 P2,117
Costs and expenses/net loss P - P -
iii. Petrogen was incorporated and registered with the Philippine SEC on August 23,
1996 primarily to engage in the business of non-life insurance and re-insurance. On September 10, 2019 and December 16, 2019, the Company subscribed to additional 31,250 and 93,750 common shares, respectively, of Petrogen at P1,000.00 per share for a total consideration of P125,000, pursuant to the increase in the capital stock of Petrogen which was approved by the SEC on November 4, 2019. As at December 31, 2019, Petrogen has a total of 475,001 common shares issued and outstanding. On October 21, 2020, the BOD of Petrogen approved the declaration of stock dividends in the total amount of P25 equal to 25,000 shares with par value of P1,000 per share and was subsequently approved by the Insurance Commission on January 4, 2021. On December 3, 2020, the BOD of Petrogen approved the increase in its authorized capital stock from P750,000, divided into 750,000 shares, to P2,250,000, divided into 2,250,000 shares, with a par value of P1,000 per share. On the same date, Petrogen’s BOD also approved the subscription of SMC to 1,494,973 shares at a book value of about P2,007 per share for an aggregate subscription price of P3,000,000. Petrogen received the SEC approval on February 8, 2021 on Petrogen’s increase in authorized capital stock dated February 4, 2021 and issued 1,494,973 common shares with an aggregate par value of P1,494,973 to SMC for a total subscription price of P3,000,000. On March 1, 2021, the corresponding stock certificate was issued to SMC.
As a result, the Company’s ownership interest in Petrogen decreased from 100% to 25.06% and Petrogen was deconsolidated from the Parent Company effective February 4, 2021. The carrying amount of the Company’s investment in Petrogen at deconsolidation date amounted to P270,000. The Company recognized P733,365 gain on deconsolidation (Note 25).
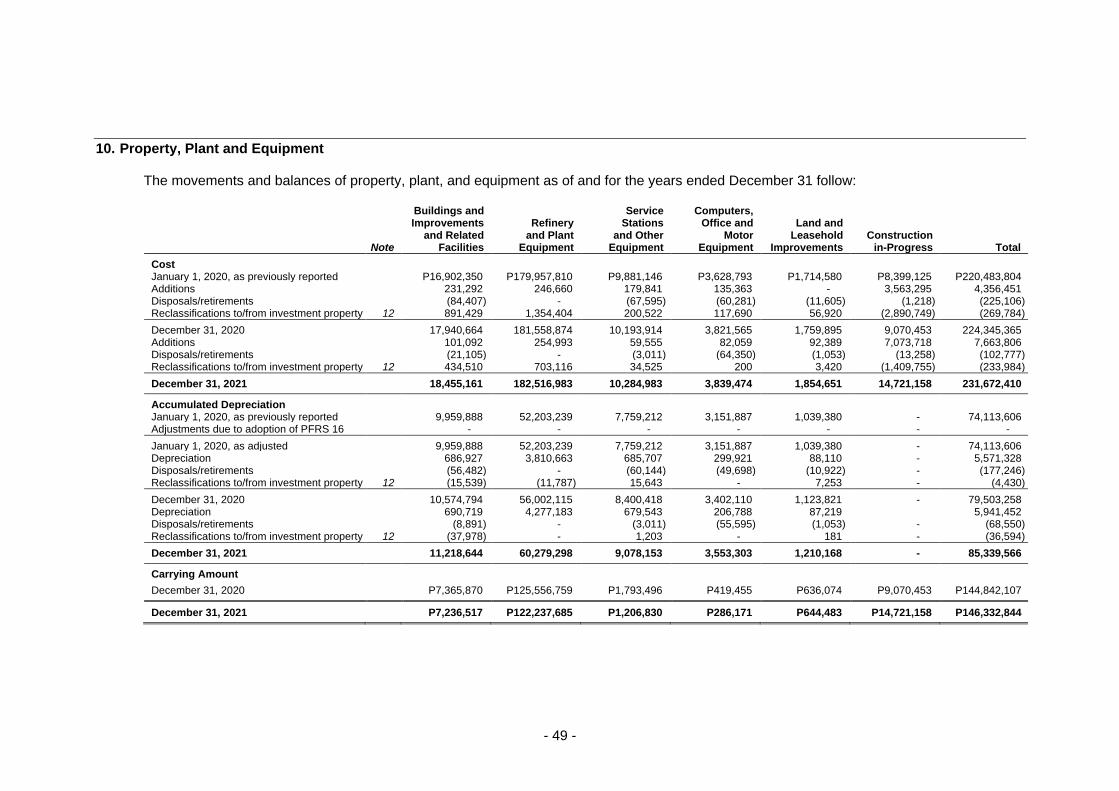
- 49 -
10. Property, Plant and Equipment The movements and balances of property, plant, and equipment as of and for the years ended December 31 follow:
Note
Buildings and Improvements
and Related Facilities
Refinery and Plant
Equipment
Service Stations
and Other Equipment
Computers, Office and
Motor Equipment
Land and Leasehold
Improvements Construction
in-Progress Total
Cost January 1, 2020, as previously reported P16,902,350 P179,957,810 P9,881,146 P3,628,793 P1,714,580 P8,399,125 P220,483,804 Additions 231,292 246,660 179,841 135,363 - 3,563,295 4,356,451 Disposals/retirements (84,407) - (67,595) (60,281) (11,605) (1,218) (225,106) Reclassifications to/from investment property 12 891,429 1,354,404 200,522 117,690 56,920 (2,890,749) (269,784)
December 31, 2020 17,940,664 181,558,874 10,193,914 3,821,565 1,759,895 9,070,453 224,345,365 Additions 101,092 254,993 59,555 82,059 92,389 7,073,718 7,663,806 Disposals/retirements (21,105) - (3,011) (64,350) (1,053) (13,258) (102,777) Reclassifications to/from investment property 12 434,510 703,116 34,525 200 3,420 (1,409,755) (233,984)
December 31, 2021 18,455,161 182,516,983 10,284,983 3,839,474 1,854,651 14,721,158 231,672,410
Accumulated Depreciation January 1, 2020, as previously reported 9,959,888 52,203,239 7,759,212 3,151,887 1,039,380 - 74,113,606 Adjustments due to adoption of PFRS 16 - - - - - - -
January 1, 2020, as adjusted 9,959,888 52,203,239 7,759,212 3,151,887 1,039,380 - 74,113,606 Depreciation 686,927 3,810,663 685,707 299,921 88,110 - 5,571,328 Disposals/retirements (56,482) - (60,144) (49,698) (10,922) - (177,246) Reclassifications to/from investment property 12 (15,539) (11,787) 15,643 - 7,253 - (4,430)
December 31, 2020 10,574,794 56,002,115 8,400,418 3,402,110 1,123,821 - 79,503,258 Depreciation 690,719 4,277,183 679,543 206,788 87,219 5,941,452 Disposals/retirements (8,891) - (3,011) (55,595) (1,053) - (68,550) Reclassifications to/from investment property 12 (37,978) - 1,203 - 181 - (36,594)
December 31, 2021 11,218,644 60,279,298 9,078,153 3,553,303 1,210,168 - 85,339,566
Carrying Amount
December 31, 2020 P7,365,870 P125,556,759 P1,793,496 P419,455 P636,074 P9,070,453 P144,842,107
December 31, 2021 P7,236,517 P122,237,685 P1,206,830 P286,171 P644,483 P14,721,158 P146,332,844
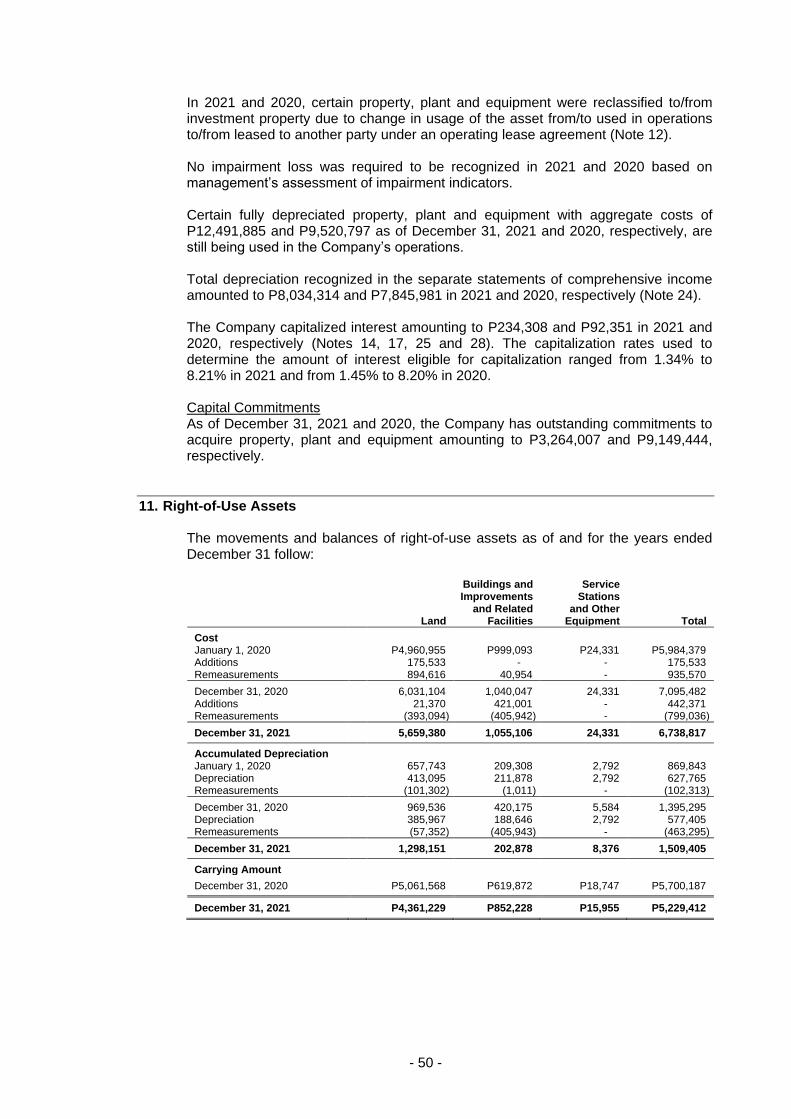
- 50 -
In 2021 and 2020, certain property, plant and equipment were reclassified to/from investment property due to change in usage of the asset from/to used in operations to/from leased to another party under an operating lease agreement (Note 12). No impairment loss was required to be recognized in 2021 and 2020 based on management’s assessment of impairment indicators. Certain fully depreciated property, plant and equipment with aggregate costs of P12,491,885 and P9,520,797 as of December 31, 2021 and 2020, respectively, are still being used in the Company’s operations. Total depreciation recognized in the separate statements of comprehensive income amounted to P8,034,314 and P7,845,981 in 2021 and 2020, respectively (Note 24). The Company capitalized interest amounting to P234,308 and P92,351 in 2021 and 2020, respectively (Notes 14, 17, 25 and 28). The capitalization rates used to determine the amount of interest eligible for capitalization ranged from 1.34% to 8.21% in 2021 and from 1.45% to 8.20% in 2020. Capital Commitments As of December 31, 2021 and 2020, the Company has outstanding commitments to acquire property, plant and equipment amounting to P3,264,007 and P9,149,444, respectively.
11. Right-of-Use Assets The movements and balances of right-of-use assets as of and for the years ended December 31 follow:
Land
Buildings and Improvements
and Related Facilities
Service Stations
and Other Equipment Total
Cost January 1, 2020 P4,960,955 P999,093 P24,331 P5,984,379 Additions 175,533 - - 175,533 Remeasurements 894,616 40,954 - 935,570
December 31, 2020 6,031,104 1,040,047 24,331 7,095,482 Additions 21,370 421,001 - 442,371 Remeasurements (393,094) (405,942) - (799,036)
December 31, 2021 5,659,380 1,055,106 24,331 6,738,817
Accumulated Depreciation January 1, 2020 657,743 209,308 2,792 869,843 Depreciation 413,095 211,878 2,792 627,765 Remeasurements (101,302) (1,011) - (102,313)
December 31, 2020 969,536 420,175 5,584 1,395,295 Depreciation 385,967 188,646 2,792 577,405 Remeasurements (57,352) (405,943) - (463,295)
December 31, 2021 1,298,151 202,878 8,376 1,509,405
Carrying Amount
December 31, 2020 P5,061,568 P619,872 P18,747 P5,700,187
December 31, 2021 P4,361,229 P852,228 P15,955 P5,229,412
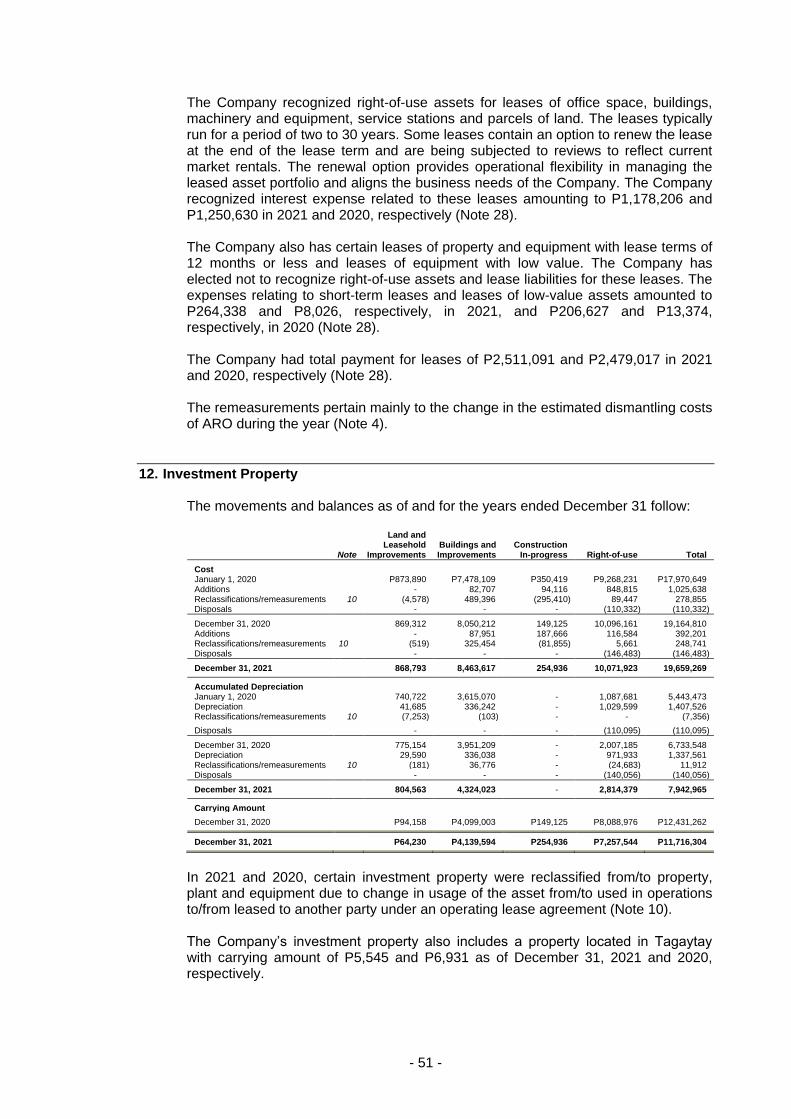
- 51 -
The Company recognized right-of-use assets for leases of office space, buildings, machinery and equipment, service stations and parcels of land. The leases typically run for a period of two to 30 years. Some leases contain an option to renew the lease at the end of the lease term and are being subjected to reviews to reflect current market rentals. The renewal option provides operational flexibility in managing the leased asset portfolio and aligns the business needs of the Company. The Company recognized interest expense related to these leases amounting to P1,178,206 and P1,250,630 in 2021 and 2020, respectively (Note 28). The Company also has certain leases of property and equipment with lease terms of 12 months or less and leases of equipment with low value. The Company has elected not to recognize right-of-use assets and lease liabilities for these leases. The expenses relating to short-term leases and leases of low-value assets amounted to P264,338 and P8,026, respectively, in 2021, and P206,627 and P13,374, respectively, in 2020 (Note 28). The Company had total payment for leases of P2,511,091 and P2,479,017 in 2021 and 2020, respectively (Note 28). The remeasurements pertain mainly to the change in the estimated dismantling costs of ARO during the year (Note 4).
12. Investment Property The movements and balances as of and for the years ended December 31 follow:
Note
Land and Leasehold
Improvements Buildings and Improvements
Construction In-progress Right-of-use Total
Cost January 1, 2020 P873,890 P7,478,109 P350,419 P9,268,231 P17,970,649 Additions - 82,707 94,116 848,815 1,025,638 Reclassifications/remeasurements 10 (4,578) 489,396 (295,410) 89,447 278,855 Disposals - - - (110,332) (110,332)
December 31, 2020 869,312 8,050,212 149,125 10,096,161 19,164,810 Additions - 87,951 187,666 116,584 392,201 Reclassifications/remeasurements 10 (519) 325,454 (81,855) 5,661 248,741 Disposals - - - (146,483) (146,483)
December 31, 2021 868,793 8,463,617 254,936 10,071,923 19,659,269
Accumulated Depreciation January 1, 2020 740,722 3,615,070 - 1,087,681 5,443,473 Depreciation 41,685 336,242 - 1,029,599 1,407,526 Reclassifications/remeasurements 10 (7,253) (103) - - (7,356)
Disposals - - - (110,095) (110,095)
December 31, 2020 775,154 3,951,209 - 2,007,185 6,733,548 Depreciation 29,590 336,038 - 971,933 1,337,561 Reclassifications/remeasurements 10 (181) 36,776 - (24,683) 11,912 Disposals - - - (140,056) (140,056)
December 31, 2021 804,563 4,324,023 - 2,814,379 7,942,965
Carrying Amount
December 31, 2020 P94,158 P4,099,003 P149,125 P8,088,976 P12,431,262
December 31, 2021 P64,230 P4,139,594 P254,936 P7,257,544 P11,716,304
In 2021 and 2020, certain investment property were reclassified from/to property, plant and equipment due to change in usage of the asset from/to used in operations to/from leased to another party under an operating lease agreement (Note 10). The Company’s investment property also includes a property located in Tagaytay with carrying amount of P5,545 and P6,931 as of December 31, 2021 and 2020, respectively.
- 52 -
No impairment loss was required to be recognized in 2021 and 2020 based on management’s assessment of impairment indicators. There are no other direct selling and administrative expenses other than depreciation and real property taxes arising from investment property that generated income in 2021 and 2020. The fair value of investment property amounting to P16,005,584 and P16,374,698 as of December 31, 2021 and 2020, respectively, has been categorized as Level 3 in the fair value hierarchy based on the inputs used in the valuation techniques. For properties with available appraisal reports, the fair value of investment property amounting to P52,813 as of December 31, 2021 and 2020 was determined by external, independent property appraisers having appropriate recognized professional qualifications and recent experience in the location and category of the property being valued. The independent appraisers provide the fair value of the Company’s investment property on a regular basis. The fair value of investment property amounting to P6,017,169 and P4,819,800 as of December 31, 2021 and 2020, respectively, was determined using the depreciated replacement cost method. The net present value of lease liability recognized in investment property represents the remaining fair value amounting to P9,935,602 and P11,502,085 as of December 31, 2021 and 2020. Valuation Technique and Significant Unobservable Inputs The valuation of investment property applied the following approaches below: Sales Comparison Approach. The market value of the land was determined using the Sales Comparison Approach. The comparative approach considers the sale of similar or substitute property, registered within the vicinity, and the related market data. The estimated value is established through such process of comparing available data. The property being valued is compared with sales transactions involving similar properties in the market. Listings and offerings may also be considered. The observable inputs to determine the market value of the property are the following: location characteristics, size, time element, quality and prospective use, bargaining allowance and marketability. Depreciated Replacement Cost Method. The fair value of land and leasehold improvements, buildings and improvements and facilities were arrived at using the depreciated replacement cost method, which estimates the current replacement cost of new assets and adjusted for obsolescence, including physical, functional and economic obsolescence. Income Approach. The rental value of the subject property was determined using the Income Approach. Under the Income Approach, the remaining lease payments on the property is first determined followed by the application of the proper capitalization rate to arrive at its net present value. The rental value of the property is determined on the basis of what a prudent lessor or a prospective lessee are willing to pay for its use and occupancy considering the prevailing rental rates of similar property and/or rate of return a prudent lessor generally expects on the return on its investment.
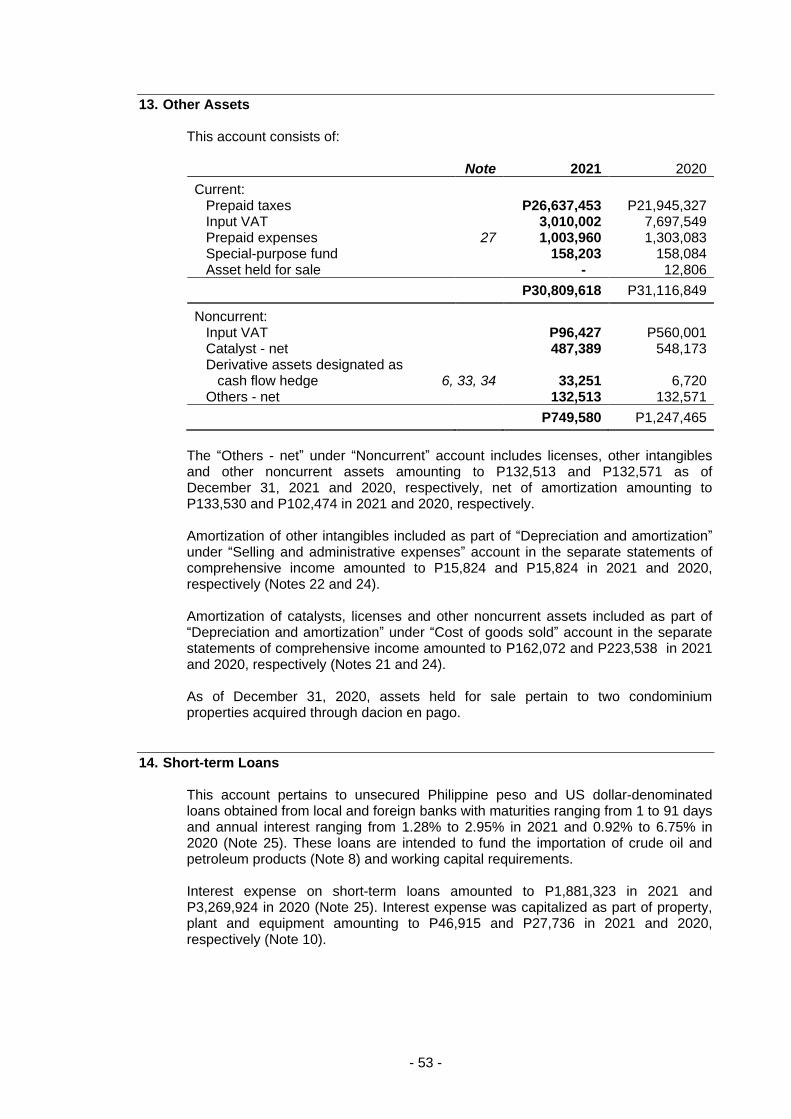
- 53 -
13. Other Assets This account consists of: Note 2021 2020
Current: Prepaid taxes P26,637,453 P21,945,327 Input VAT 3,010,002 7,697,549 Prepaid expenses 27 1,003,960 1,303,083 Special-purpose fund 158,203 158,084 Asset held for sale - 12,806
P30,809,618 P31,116,849
Noncurrent: Input VAT P96,427 P560,001 Catalyst - net 487,389 548,173 Derivative assets designated as
cash flow hedge 6, 33, 34 33,251 6,720 Others - net 132,513 132,571
P749,580 P1,247,465
The “Others - net” under “Noncurrent” account includes licenses, other intangibles and other noncurrent assets amounting to P132,513 and P132,571 as of December 31, 2021 and 2020, respectively, net of amortization amounting to P133,530 and P102,474 in 2021 and 2020, respectively. Amortization of other intangibles included as part of “Depreciation and amortization” under “Selling and administrative expenses” account in the separate statements of comprehensive income amounted to P15,824 and P15,824 in 2021 and 2020, respectively (Notes 22 and 24). Amortization of catalysts, licenses and other noncurrent assets included as part of “Depreciation and amortization” under “Cost of goods sold” account in the separate statements of comprehensive income amounted to P162,072 and P223,538 in 2021 and 2020, respectively (Notes 21 and 24). As of December 31, 2020, assets held for sale pertain to two condominium properties acquired through dacion en pago.
14. Short-term Loans This account pertains to unsecured Philippine peso and US dollar-denominated loans obtained from local and foreign banks with maturities ranging from 1 to 91 days and annual interest ranging from 1.28% to 2.95% in 2021 and 0.92% to 6.75% in 2020 (Note 25). These loans are intended to fund the importation of crude oil and petroleum products (Note 8) and working capital requirements. Interest expense on short-term loans amounted to P1,881,323 in 2021 and P3,269,924 in 2020 (Note 25). Interest expense was capitalized as part of property, plant and equipment amounting to P46,915 and P27,736 in 2021 and 2020, respectively (Note 10).
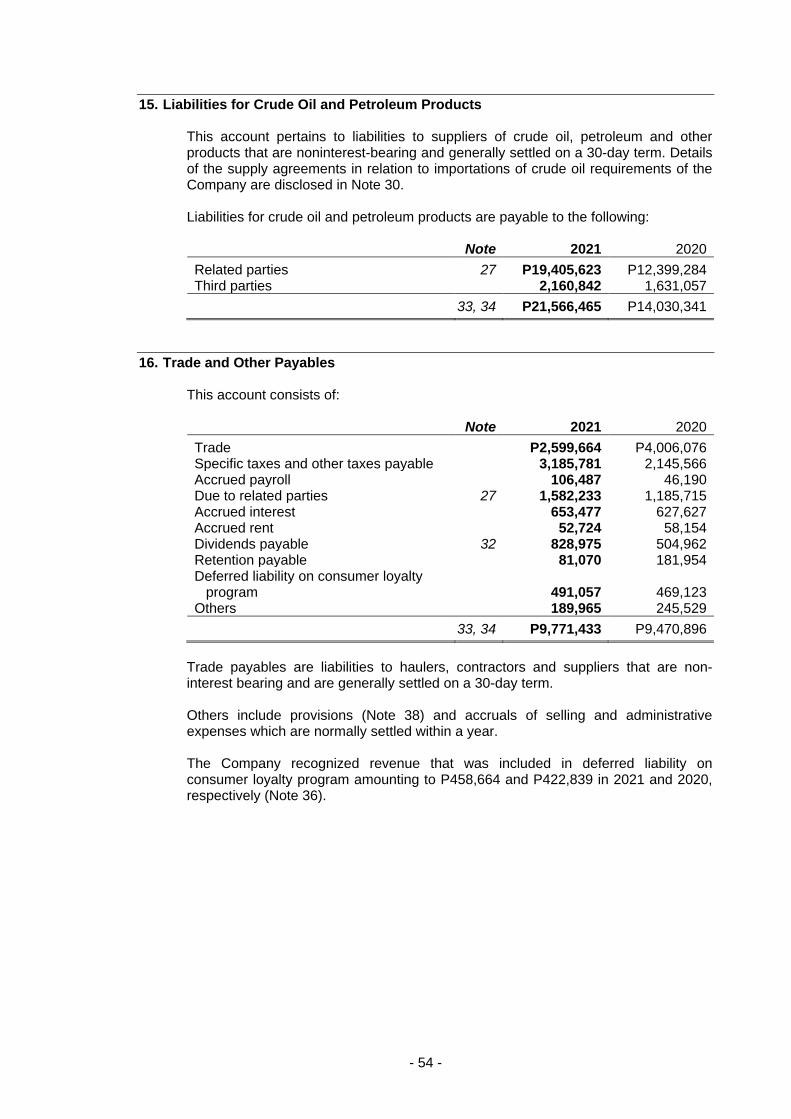
- 54 -
15. Liabilities for Crude Oil and Petroleum Products This account pertains to liabilities to suppliers of crude oil, petroleum and other products that are noninterest-bearing and generally settled on a 30-day term. Details of the supply agreements in relation to importations of crude oil requirements of the Company are disclosed in Note 30. Liabilities for crude oil and petroleum products are payable to the following: Note 2021 2020
Related parties 27 P19,405,623 P12,399,284 Third parties 2,160,842 1,631,057
33, 34 P21,566,465 P14,030,341
16. Trade and Other Payables This account consists of: Note 2021 2020
Trade P2,599,664 P4,006,076 Specific taxes and other taxes payable 3,185,781 2,145,566 Accrued payroll 106,487 46,190 Due to related parties 27 1,582,233 1,185,715 Accrued interest 653,477 627,627 Accrued rent 52,724 58,154 Dividends payable 32 828,975 504,962 Retention payable 81,070 181,954 Deferred liability on consumer loyalty
program 491,057 469,123 Others 189,965 245,529
33, 34 P9,771,433 P9,470,896
Trade payables are liabilities to haulers, contractors and suppliers that are non-interest bearing and are generally settled on a 30-day term. Others include provisions (Note 38) and accruals of selling and administrative expenses which are normally settled within a year. The Company recognized revenue that was included in deferred liability on consumer loyalty program amounting to P458,664 and P422,839 in 2021 and 2020, respectively (Note 36).
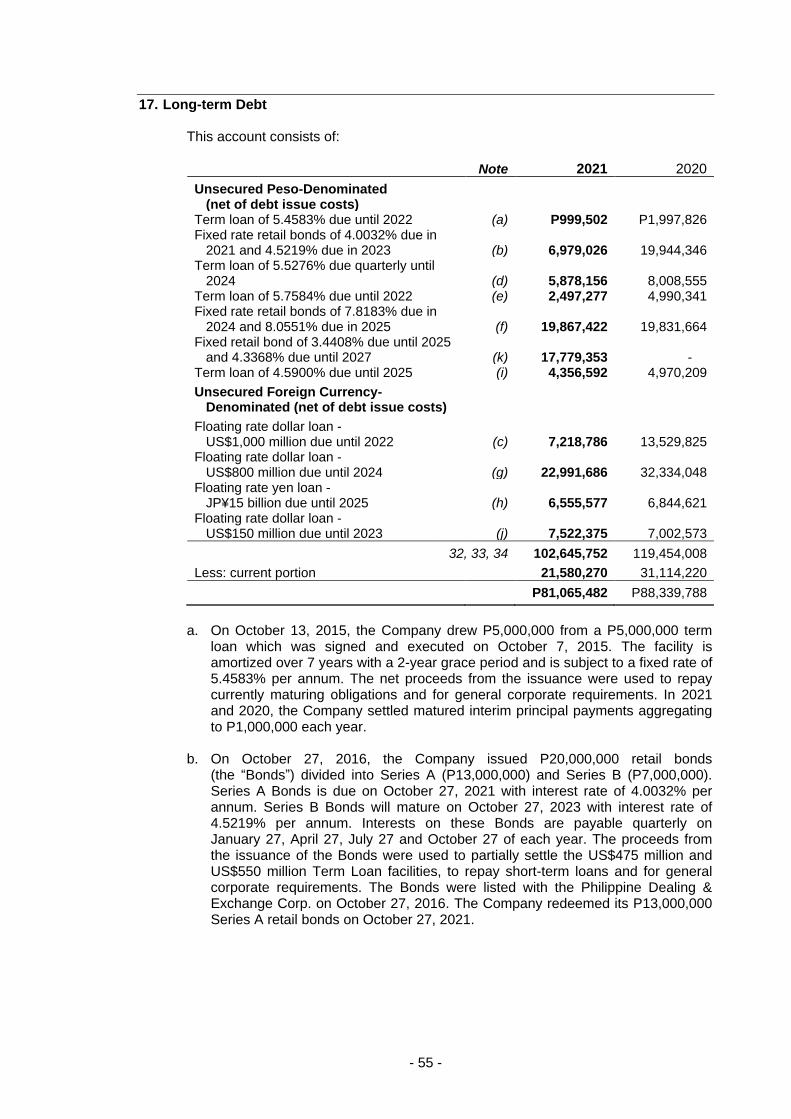
- 55 -
17. Long-term Debt This account consists of:
Note 2021 2020
Unsecured Peso-Denominated (net of debt issue costs)
Term loan of 5.4583% due until 2022 (a) P999,502 P1,997,826 Fixed rate retail bonds of 4.0032% due in
2021 and 4.5219% due in 2023 (b) 6,979,026 19,944,346 Term loan of 5.5276% due quarterly until
2024 (d) 5,878,156 8,008,555 Term loan of 5.7584% due until 2022 (e) 2,497,277 4,990,341 Fixed rate retail bonds of 7.8183% due in
2024 and 8.0551% due in 2025 (f) 19,867,422 19,831,664 Fixed retail bond of 3.4408% due until 2025
and 4.3368% due until 2027 (k) 17,779,353 - Term loan of 4.5900% due until 2025 (i) 4,356,592 4,970,209
Unsecured Foreign Currency-Denominated (net of debt issue costs)
Floating rate dollar loan - US$1,000 million due until 2022 (c) 7,218,786 13,529,825
Floating rate dollar loan - US$800 million due until 2024 (g) 22,991,686 32,334,048
Floating rate yen loan - JP¥15 billion due until 2025 (h) 6,555,577 6,844,621
Floating rate dollar loan - US$150 million due until 2023 (j) 7,522,375 7,002,573
32, 33, 34 102,645,752 119,454,008
Less: current portion 21,580,270 31,114,220
P81,065,482 P88,339,788
a. On October 13, 2015, the Company drew P5,000,000 from a P5,000,000 term
loan which was signed and executed on October 7, 2015. The facility is amortized over 7 years with a 2-year grace period and is subject to a fixed rate of 5.4583% per annum. The net proceeds from the issuance were used to repay currently maturing obligations and for general corporate requirements. In 2021 and 2020, the Company settled matured interim principal payments aggregating to P1,000,000 each year.
b. On October 27, 2016, the Company issued P20,000,000 retail bonds
(the “Bonds”) divided into Series A (P13,000,000) and Series B (P7,000,000). Series A Bonds is due on October 27, 2021 with interest rate of 4.0032% per annum. Series B Bonds will mature on October 27, 2023 with interest rate of 4.5219% per annum. Interests on these Bonds are payable quarterly on January 27, April 27, July 27 and October 27 of each year. The proceeds from the issuance of the Bonds were used to partially settle the US$475 million and US$550 million Term Loan facilities, to repay short-term loans and for general corporate requirements. The Bonds were listed with the Philippine Dealing & Exchange Corp. on October 27, 2016. The Company redeemed its P13,000,000 Series A retail bonds on October 27, 2021.
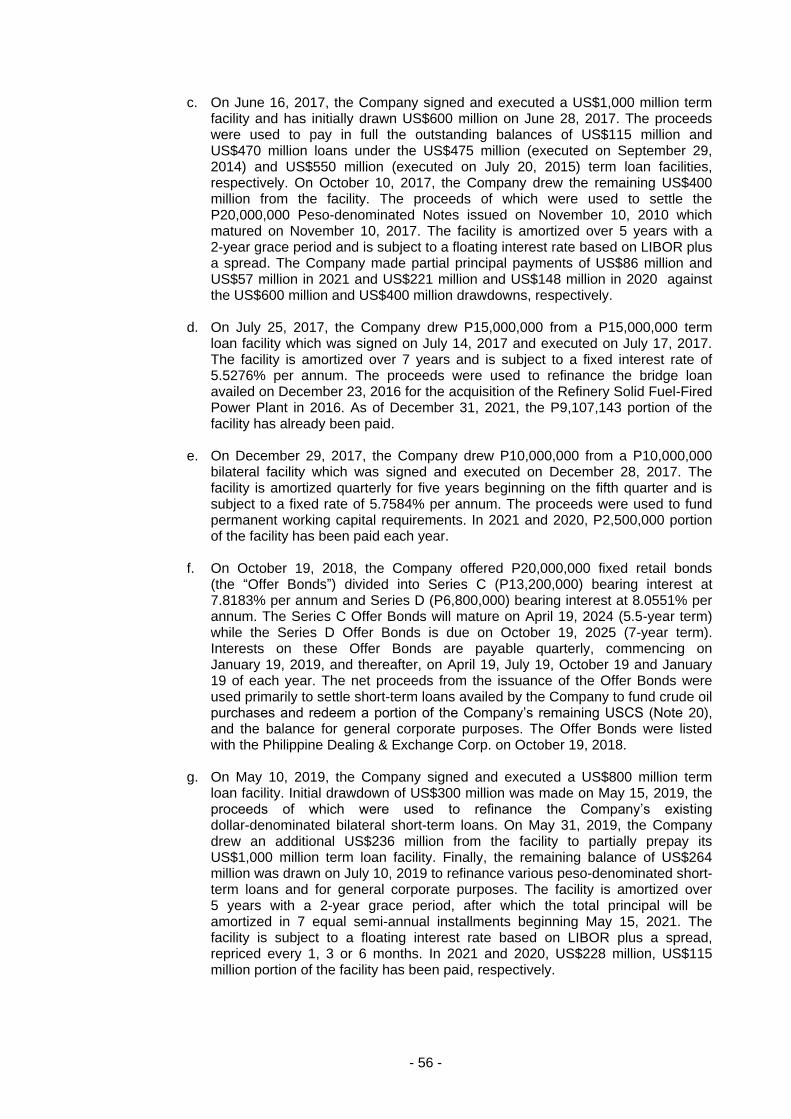
- 56 -
c. On June 16, 2017, the Company signed and executed a US$1,000 million term facility and has initially drawn US$600 million on June 28, 2017. The proceeds were used to pay in full the outstanding balances of US$115 million and US$470 million loans under the US$475 million (executed on September 29, 2014) and US$550 million (executed on July 20, 2015) term loan facilities, respectively. On October 10, 2017, the Company drew the remaining US$400 million from the facility. The proceeds of which were used to settle the P20,000,000 Peso-denominated Notes issued on November 10, 2010 which matured on November 10, 2017. The facility is amortized over 5 years with a 2-year grace period and is subject to a floating interest rate based on LIBOR plus a spread. The Company made partial principal payments of US$86 million and US$57 million in 2021 and US$221 million and US$148 million in 2020 against the US$600 million and US$400 million drawdowns, respectively.
d. On July 25, 2017, the Company drew P15,000,000 from a P15,000,000 term
loan facility which was signed on July 14, 2017 and executed on July 17, 2017. The facility is amortized over 7 years and is subject to a fixed interest rate of 5.5276% per annum. The proceeds were used to refinance the bridge loan availed on December 23, 2016 for the acquisition of the Refinery Solid Fuel-Fired Power Plant in 2016. As of December 31, 2021, the P9,107,143 portion of the facility has already been paid.
e. On December 29, 2017, the Company drew P10,000,000 from a P10,000,000
bilateral facility which was signed and executed on December 28, 2017. The facility is amortized quarterly for five years beginning on the fifth quarter and is subject to a fixed rate of 5.7584% per annum. The proceeds were used to fund permanent working capital requirements. In 2021 and 2020, P2,500,000 portion of the facility has been paid each year.
f. On October 19, 2018, the Company offered P20,000,000 fixed retail bonds
(the “Offer Bonds”) divided into Series C (P13,200,000) bearing interest at 7.8183% per annum and Series D (P6,800,000) bearing interest at 8.0551% per annum. The Series C Offer Bonds will mature on April 19, 2024 (5.5-year term) while the Series D Offer Bonds is due on October 19, 2025 (7-year term). Interests on these Offer Bonds are payable quarterly, commencing on January 19, 2019, and thereafter, on April 19, July 19, October 19 and January 19 of each year. The net proceeds from the issuance of the Offer Bonds were used primarily to settle short-term loans availed by the Company to fund crude oil purchases and redeem a portion of the Company’s remaining USCS (Note 20), and the balance for general corporate purposes. The Offer Bonds were listed with the Philippine Dealing & Exchange Corp. on October 19, 2018.
g. On May 10, 2019, the Company signed and executed a US$800 million term
loan facility. Initial drawdown of US$300 million was made on May 15, 2019, the proceeds of which were used to refinance the Company’s existing dollar-denominated bilateral short-term loans. On May 31, 2019, the Company drew an additional US$236 million from the facility to partially prepay its US$1,000 million term loan facility. Finally, the remaining balance of US$264 million was drawn on July 10, 2019 to refinance various peso-denominated short-term loans and for general corporate purposes. The facility is amortized over 5 years with a 2-year grace period, after which the total principal will be amortized in 7 equal semi-annual installments beginning May 15, 2021. The facility is subject to a floating interest rate based on LIBOR plus a spread, repriced every 1, 3 or 6 months. In 2021 and 2020, US$228 million, US$115 million portion of the facility has been paid, respectively.
- 57 -
h. On April 22, 2020, the Company drew JP¥15 billion from a JP¥15 billion term loan facility signed and executed on March 27, 2020. The proceeds were used to partially prepay its US$1 billion term loan facility. The JP¥ facility is amortized over 5 years with a 2-year grace period, after which the total principal will be amortized in 7 equal semi-annual installments beginning March 27, 2022. It is subject to a floating interest rate based on JP¥ LIBOR plus a spread, repriced every 1, 3 or 6 months. Due to the global discontinuation of JPY LIBOR by December 31, 2021, an amendment was made to the JPY Facility adopting the Tokyo Overnight Average Rate (TONA) as the new benchmark rate. Beginning December 29, 2021, the floating interest rate on the JPY15 billion facility is based on TONA plus a spread, repriced every 1, 3 or 6 months.
i. On April 27, 2020, the Company drew P5,000,000 from a P5,000,000 term loan facility which was signed and executed on April 23, 2020. The facility is subject to a fixed interest rate of 4.59% per annum and amortized over 5 years with a 12-month grace period, after which the total principal will be amortized in 16 equal quarterly payments beginning July 27, 2021. The proceeds were used for general corporate purposes. In 2021, P625,000 amortization of principal has been paid.
j. On August 26, 2020, the Company availed a US$150 million three-year long-
term debt, subject to floating interest rate based on LIBOR plus a spread, repriced every 1, 3 or 6 months, that will mature on August 7, 2023. The proceeds were used to prepay part of the existing US$1.0 billion term loan facility and US$800 million loan.
k. On October 12, 2021, the Company issued P18,000,000 retail bonds divided into
Series E due in 2025 (P9.0 billion) and Series F due in 2027 (P9.0 billion) with interest rates of 3.4408% p.a. and 4.3368% p.a., respectively. The Bonds are listed on the Philippine Dealing & Exchange Corp. The proceeds were used for the redemption of the Company’s Series A Bonds, the partial financing of the Power Plant project and payment of existing indebtedness.
The above-mentioned debt agreements contain, among others, covenants relating to merger and consolidation, maintenance of certain financial ratios, restrictions on loans and guarantees, disposal of a substantial portion of assets, significant changes in the ownership or control of subsidiaries, payments of dividends and redemption of capital stock. The Company has two financial covenants, namely, net leverage ratio not to exceed 6.5x and ratio of consolidated gross debt to consolidated net worth not to exceed 2.75x. In November 2020, the Company secured consent to amend the testing of its net leverage ratio from semi-annual to incurrence-based, while the ratio of consolidated gross debt to consolidated net worth remained to be tested quarterly. As of December 31, 2021 and 2020, the Company has complied with its financial covenants of its debt agreements. Total interest incurred on the above-mentioned long-term loans (including amortization of debt issue costs) amounted to P5,219,670 and P5,726,351 for the years ended 2021 and 2020, respectively (Note 25). Interest amounting to P130,166 and P48,572 was capitalized in 2021 and 2020, respectively (Note 10).
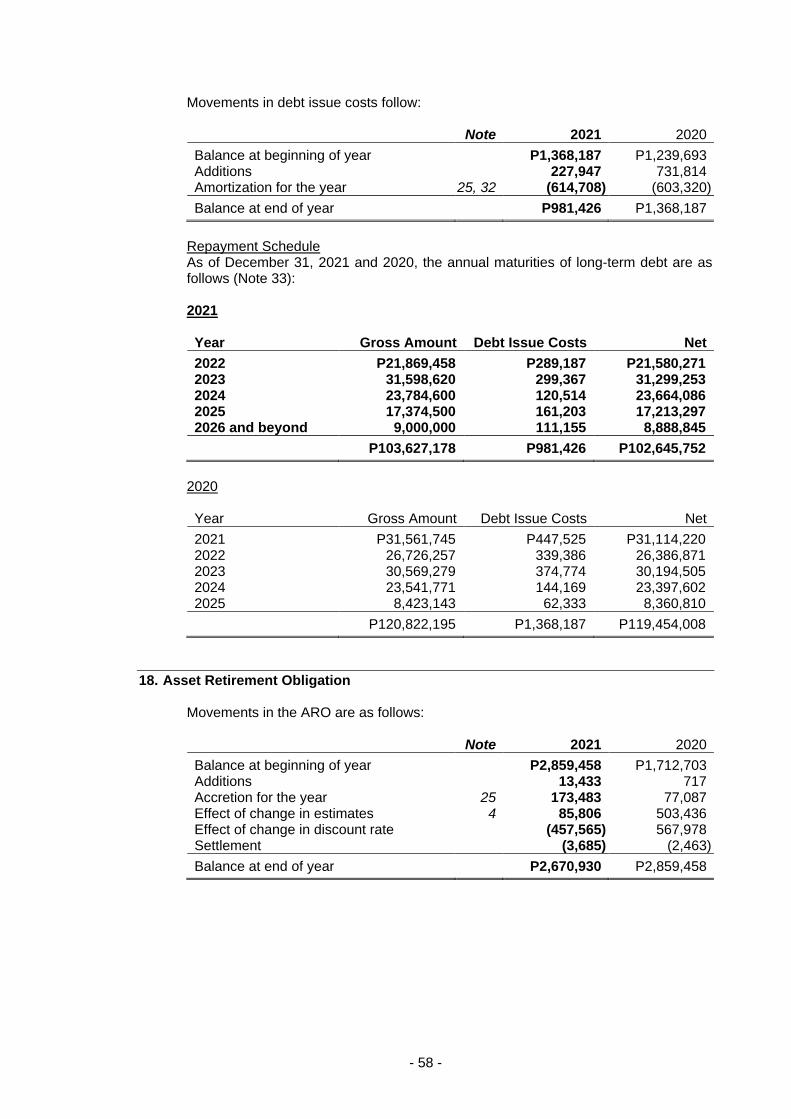
- 58 -
Movements in debt issue costs follow: Note 2021 2020
Balance at beginning of year P1,368,187 P1,239,693 Additions 227,947 731,814 Amortization for the year 25, 32 (614,708) (603,320)
Balance at end of year P981,426 P1,368,187
Repayment Schedule As of December 31, 2021 and 2020, the annual maturities of long-term debt are as follows (Note 33): 2021 Year Gross Amount Debt Issue Costs Net
2022 P21,869,458 P289,187 P21,580,271 2023 31,598,620 299,367 31,299,253 2024 23,784,600 120,514 23,664,086 2025 17,374,500 161,203 17,213,297 2026 and beyond 9,000,000 111,155 8,888,845
P103,627,178 P981,426 P102,645,752
2020 Year Gross Amount Debt Issue Costs Net
2021 P31,561,745 P447,525 P31,114,220 2022 26,726,257 339,386 26,386,871 2023 30,569,279 374,774 30,194,505 2024 23,541,771 144,169 23,397,602 2025 8,423,143 62,333 8,360,810
P120,822,195 P1,368,187 P119,454,008
18. Asset Retirement Obligation Movements in the ARO are as follows: Note 2021 2020
Balance at beginning of year P2,859,458 P1,712,703 Additions 13,433 717 Accretion for the year 25 173,483 77,087 Effect of change in estimates 4 85,806 503,436 Effect of change in discount rate (457,565) 567,978 Settlement (3,685) (2,463)
Balance at end of year P2,670,930 P2,859,458
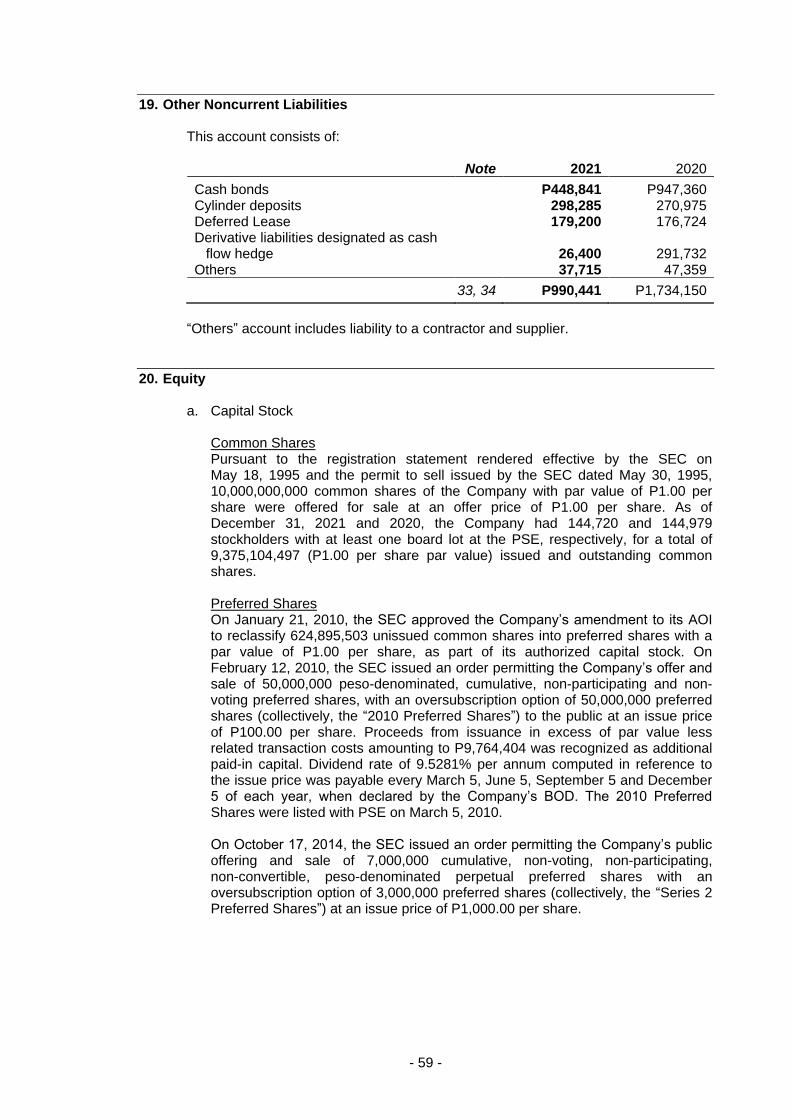
- 59 -
19. Other Noncurrent Liabilities This account consists of: Note 2021 2020
Cash bonds P448,841 P947,360 Cylinder deposits 298,285 270,975 Deferred Lease 179,200 176,724 Derivative liabilities designated as cash
flow hedge 26,400 291,732 Others 37,715 47,359
33, 34 P990,441 P1,734,150
“Others” account includes liability to a contractor and supplier.
20. Equity a. Capital Stock
Common Shares Pursuant to the registration statement rendered effective by the SEC on May 18, 1995 and the permit to sell issued by the SEC dated May 30, 1995, 10,000,000,000 common shares of the Company with par value of P1.00 per share were offered for sale at an offer price of P1.00 per share. As of December 31, 2021 and 2020, the Company had 144,720 and 144,979 stockholders with at least one board lot at the PSE, respectively, for a total of 9,375,104,497 (P1.00 per share par value) issued and outstanding common shares. Preferred Shares On January 21, 2010, the SEC approved the Company’s amendment to its AOI to reclassify 624,895,503 unissued common shares into preferred shares with a par value of P1.00 per share, as part of its authorized capital stock. On February 12, 2010, the SEC issued an order permitting the Company’s offer and sale of 50,000,000 peso-denominated, cumulative, non-participating and non-voting preferred shares, with an oversubscription option of 50,000,000 preferred shares (collectively, the “2010 Preferred Shares”) to the public at an issue price of P100.00 per share. Proceeds from issuance in excess of par value less related transaction costs amounting to P9,764,404 was recognized as additional paid-in capital. Dividend rate of 9.5281% per annum computed in reference to the issue price was payable every March 5, June 5, September 5 and December 5 of each year, when declared by the Company’s BOD. The 2010 Preferred Shares were listed with PSE on March 5, 2010. On October 17, 2014, the SEC issued an order permitting the Company’s public offering and sale of 7,000,000 cumulative, non-voting, non-participating, non-convertible, peso-denominated perpetual preferred shares with an oversubscription option of 3,000,000 preferred shares (collectively, the “Series 2 Preferred Shares”) at an issue price of P1,000.00 per share.
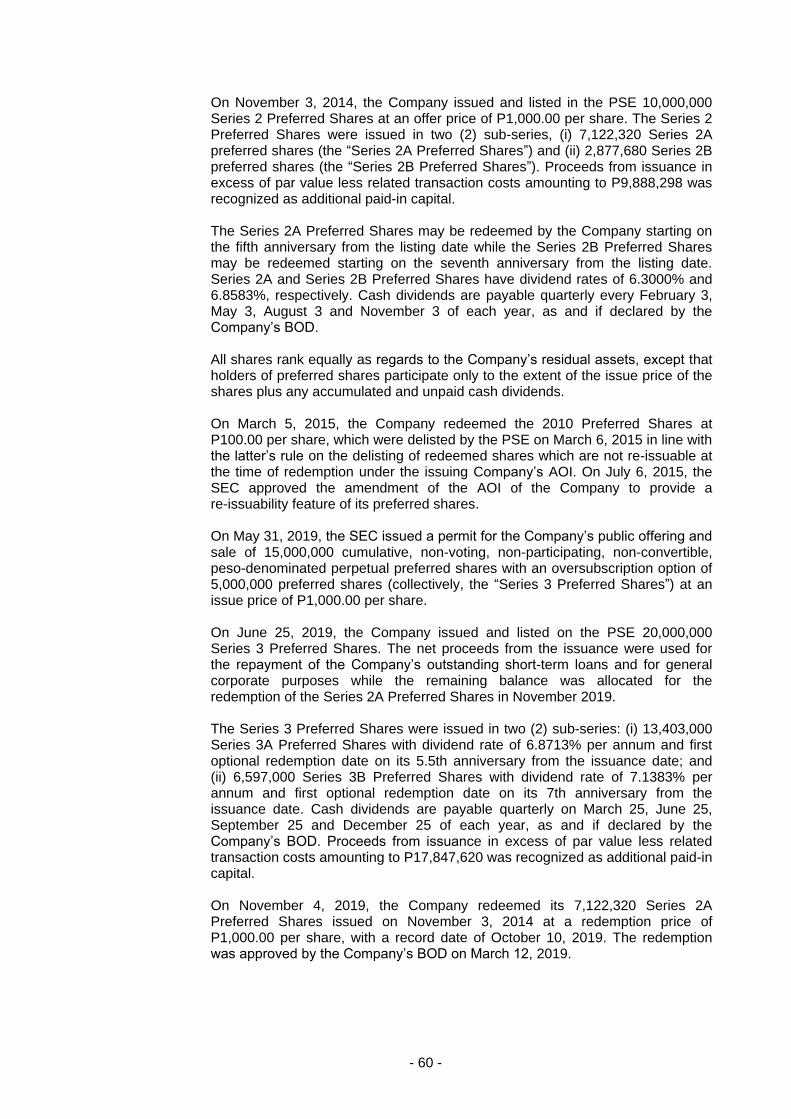
- 60 -
On November 3, 2014, the Company issued and listed in the PSE 10,000,000 Series 2 Preferred Shares at an offer price of P1,000.00 per share. The Series 2 Preferred Shares were issued in two (2) sub-series, (i) 7,122,320 Series 2A preferred shares (the “Series 2A Preferred Shares”) and (ii) 2,877,680 Series 2B preferred shares (the “Series 2B Preferred Shares”). Proceeds from issuance in excess of par value less related transaction costs amounting to P9,888,298 was recognized as additional paid-in capital. The Series 2A Preferred Shares may be redeemed by the Company starting on the fifth anniversary from the listing date while the Series 2B Preferred Shares may be redeemed starting on the seventh anniversary from the listing date. Series 2A and Series 2B Preferred Shares have dividend rates of 6.3000% and 6.8583%, respectively. Cash dividends are payable quarterly every February 3, May 3, August 3 and November 3 of each year, as and if declared by the Company’s BOD. All shares rank equally as regards to the Company’s residual assets, except that holders of preferred shares participate only to the extent of the issue price of the shares plus any accumulated and unpaid cash dividends. On March 5, 2015, the Company redeemed the 2010 Preferred Shares at P100.00 per share, which were delisted by the PSE on March 6, 2015 in line with the latter’s rule on the delisting of redeemed shares which are not re-issuable at the time of redemption under the issuing Company’s AOI. On July 6, 2015, the SEC approved the amendment of the AOI of the Company to provide a re-issuability feature of its preferred shares. On May 31, 2019, the SEC issued a permit for the Company’s public offering and sale of 15,000,000 cumulative, non-voting, non-participating, non-convertible, peso-denominated perpetual preferred shares with an oversubscription option of 5,000,000 preferred shares (collectively, the “Series 3 Preferred Shares”) at an issue price of P1,000.00 per share. On June 25, 2019, the Company issued and listed on the PSE 20,000,000 Series 3 Preferred Shares. The net proceeds from the issuance were used for the repayment of the Company’s outstanding short-term loans and for general corporate purposes while the remaining balance was allocated for the redemption of the Series 2A Preferred Shares in November 2019. The Series 3 Preferred Shares were issued in two (2) sub-series: (i) 13,403,000 Series 3A Preferred Shares with dividend rate of 6.8713% per annum and first optional redemption date on its 5.5th anniversary from the issuance date; and (ii) 6,597,000 Series 3B Preferred Shares with dividend rate of 7.1383% per annum and first optional redemption date on its 7th anniversary from the issuance date. Cash dividends are payable quarterly on March 25, June 25, September 25 and December 25 of each year, as and if declared by the Company’s BOD. Proceeds from issuance in excess of par value less related transaction costs amounting to P17,847,620 was recognized as additional paid-in capital. On November 4, 2019, the Company redeemed its 7,122,320 Series 2A Preferred Shares issued on November 3, 2014 at a redemption price of P1,000.00 per share, with a record date of October 10, 2019. The redemption was approved by the Company’s BOD on March 12, 2019.
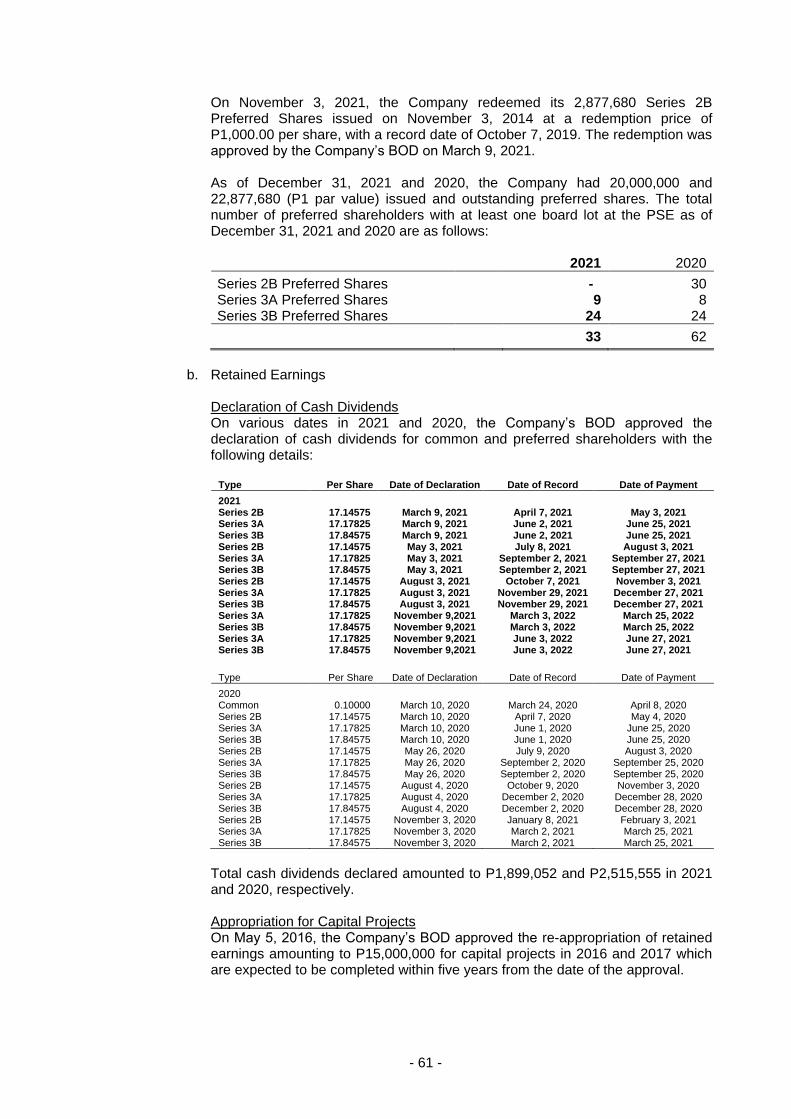
- 61 -
On November 3, 2021, the Company redeemed its 2,877,680 Series 2B Preferred Shares issued on November 3, 2014 at a redemption price of P1,000.00 per share, with a record date of October 7, 2019. The redemption was approved by the Company’s BOD on March 9, 2021. As of December 31, 2021 and 2020, the Company had 20,000,000 and 22,877,680 (P1 par value) issued and outstanding preferred shares. The total number of preferred shareholders with at least one board lot at the PSE as of December 31, 2021 and 2020 are as follows:
2021 2020
Series 2B Preferred Shares - 30 Series 3A Preferred Shares 9 8 Series 3B Preferred Shares 24 24
33 62
b. Retained Earnings
Declaration of Cash Dividends On various dates in 2021 and 2020, the Company’s BOD approved the declaration of cash dividends for common and preferred shareholders with the following details:
Type Per Share Date of Declaration Date of Record Date of Payment
2021 Series 2B 17.14575 March 9, 2021 April 7, 2021 May 3, 2021 Series 3A 17.17825 March 9, 2021 June 2, 2021 June 25, 2021 Series 3B 17.84575 March 9, 2021 June 2, 2021 June 25, 2021 Series 2B 17.14575 May 3, 2021 July 8, 2021 August 3, 2021 Series 3A 17.17825 May 3, 2021 September 2, 2021 September 27, 2021 Series 3B 17.84575 May 3, 2021 September 2, 2021 September 27, 2021 Series 2B 17.14575 August 3, 2021 October 7, 2021 November 3, 2021 Series 3A 17.17825 August 3, 2021 November 29, 2021 December 27, 2021 Series 3B 17.84575 August 3, 2021 November 29, 2021 December 27, 2021 Series 3A 17.17825 November 9,2021 March 3, 2022 March 25, 2022 Series 3B 17.84575 November 9,2021 March 3, 2022 March 25, 2022 Series 3A 17.17825 November 9,2021 June 3, 2022 June 27, 2021 Series 3B 17.84575 November 9,2021 June 3, 2022 June 27, 2021
Type Per Share Date of Declaration Date of Record Date of Payment
2020 Common 0.10000 March 10, 2020 March 24, 2020 April 8, 2020 Series 2B 17.14575 March 10, 2020 April 7, 2020 May 4, 2020 Series 3A 17.17825 March 10, 2020 June 1, 2020 June 25, 2020 Series 3B 17.84575 March 10, 2020 June 1, 2020 June 25, 2020 Series 2B 17.14575 May 26, 2020 July 9, 2020 August 3, 2020 Series 3A 17.17825 May 26, 2020 September 2, 2020 September 25, 2020 Series 3B 17.84575 May 26, 2020 September 2, 2020 September 25, 2020 Series 2B 17.14575 August 4, 2020 October 9, 2020 November 3, 2020 Series 3A 17.17825 August 4, 2020 December 2, 2020 December 28, 2020 Series 3B 17.84575 August 4, 2020 December 2, 2020 December 28, 2020 Series 2B 17.14575 November 3, 2020 January 8, 2021 February 3, 2021 Series 3A 17.17825 November 3, 2020 March 2, 2021 March 25, 2021 Series 3B 17.84575 November 3, 2020 March 2, 2021 March 25, 2021
Total cash dividends declared amounted to P1,899,052 and P2,515,555 in 2021 and 2020, respectively. Appropriation for Capital Projects On May 5, 2016, the Company’s BOD approved the re-appropriation of retained earnings amounting to P15,000,000 for capital projects in 2016 and 2017 which are expected to be completed within five years from the date of the approval.
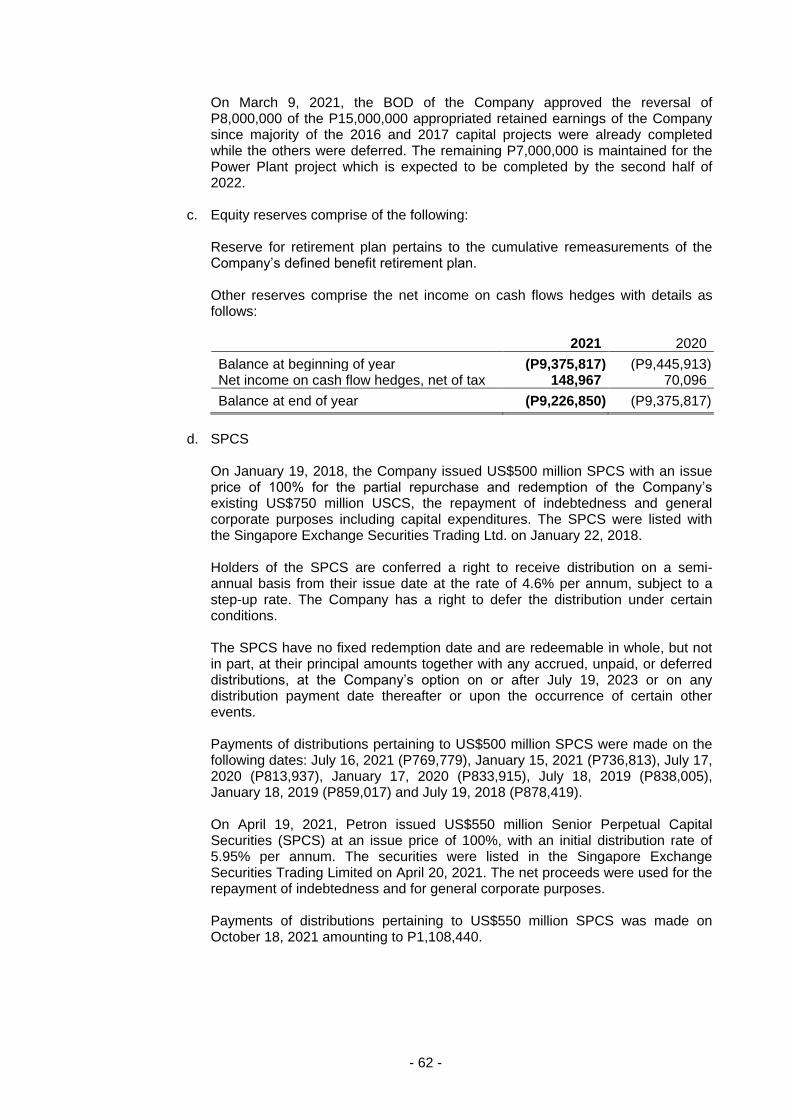
- 62 -
On March 9, 2021, the BOD of the Company approved the reversal of P8,000,000 of the P15,000,000 appropriated retained earnings of the Company since majority of the 2016 and 2017 capital projects were already completed while the others were deferred. The remaining P7,000,000 is maintained for the Power Plant project which is expected to be completed by the second half of 2022.
c. Equity reserves comprise of the following: Reserve for retirement plan pertains to the cumulative remeasurements of the Company’s defined benefit retirement plan. Other reserves comprise the net income on cash flows hedges with details as follows: 2021 2020
Balance at beginning of year (P9,375,817) (P9,445,913) Net income on cash flow hedges, net of tax 148,967 70,096
Balance at end of year (P9,226,850) (P9,375,817)
d. SPCS
On January 19, 2018, the Company issued US$500 million SPCS with an issue price of 100% for the partial repurchase and redemption of the Company’s existing US$750 million USCS, the repayment of indebtedness and general corporate purposes including capital expenditures. The SPCS were listed with the Singapore Exchange Securities Trading Ltd. on January 22, 2018. Holders of the SPCS are conferred a right to receive distribution on a semi-annual basis from their issue date at the rate of 4.6% per annum, subject to a step-up rate. The Company has a right to defer the distribution under certain conditions. The SPCS have no fixed redemption date and are redeemable in whole, but not in part, at their principal amounts together with any accrued, unpaid, or deferred distributions, at the Company’s option on or after July 19, 2023 or on any distribution payment date thereafter or upon the occurrence of certain other events. Payments of distributions pertaining to US$500 million SPCS were made on the following dates: July 16, 2021 (P769,779), January 15, 2021 (P736,813), July 17, 2020 (P813,937), January 17, 2020 (P833,915), July 18, 2019 (P838,005), January 18, 2019 (P859,017) and July 19, 2018 (P878,419). On April 19, 2021, Petron issued US$550 million Senior Perpetual Capital Securities (SPCS) at an issue price of 100%, with an initial distribution rate of 5.95% per annum. The securities were listed in the Singapore Exchange Securities Trading Limited on April 20, 2021. The net proceeds were used for the repayment of indebtedness and for general corporate purposes. Payments of distributions pertaining to US$550 million SPCS was made on October 18, 2021 amounting to P1,108,440.
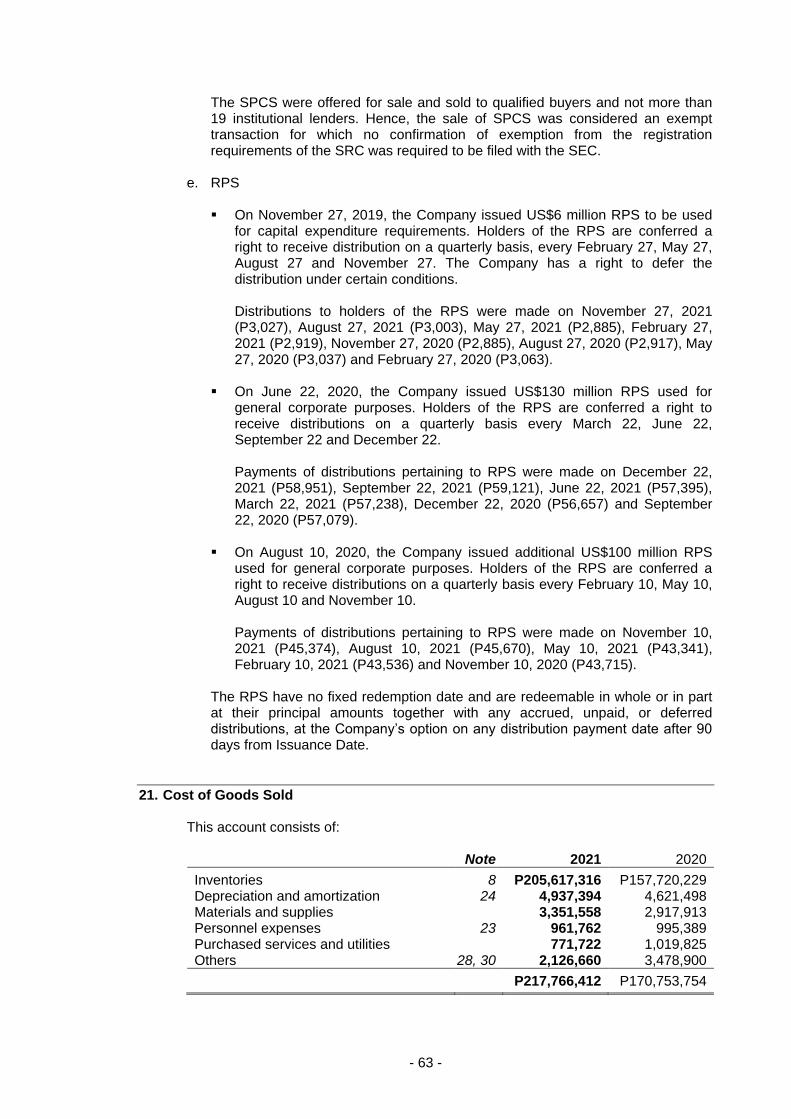
- 63 -
The SPCS were offered for sale and sold to qualified buyers and not more than 19 institutional lenders. Hence, the sale of SPCS was considered an exempt transaction for which no confirmation of exemption from the registration requirements of the SRC was required to be filed with the SEC.
e. RPS On November 27, 2019, the Company issued US$6 million RPS to be used
for capital expenditure requirements. Holders of the RPS are conferred a right to receive distribution on a quarterly basis, every February 27, May 27, August 27 and November 27. The Company has a right to defer the distribution under certain conditions. Distributions to holders of the RPS were made on November 27, 2021 (P3,027), August 27, 2021 (P3,003), May 27, 2021 (P2,885), February 27, 2021 (P2,919), November 27, 2020 (P2,885), August 27, 2020 (P2,917), May 27, 2020 (P3,037) and February 27, 2020 (P3,063).
On June 22, 2020, the Company issued US$130 million RPS used for
general corporate purposes. Holders of the RPS are conferred a right to receive distributions on a quarterly basis every March 22, June 22, September 22 and December 22.
Payments of distributions pertaining to RPS were made on December 22, 2021 (P58,951), September 22, 2021 (P59,121), June 22, 2021 (P57,395), March 22, 2021 (P57,238), December 22, 2020 (P56,657) and September 22, 2020 (P57,079).
On August 10, 2020, the Company issued additional US$100 million RPS
used for general corporate purposes. Holders of the RPS are conferred a right to receive distributions on a quarterly basis every February 10, May 10, August 10 and November 10.
Payments of distributions pertaining to RPS were made on November 10, 2021 (P45,374), August 10, 2021 (P45,670), May 10, 2021 (P43,341), February 10, 2021 (P43,536) and November 10, 2020 (P43,715).
The RPS have no fixed redemption date and are redeemable in whole or in part at their principal amounts together with any accrued, unpaid, or deferred distributions, at the Company’s option on any distribution payment date after 90 days from Issuance Date.
21. Cost of Goods Sold This account consists of: Note 2021 2020
Inventories 8 P205,617,316 P157,720,229 Depreciation and amortization 24 4,937,394 4,621,498 Materials and supplies 3,351,558 2,917,913 Personnel expenses 23 961,762 995,389 Purchased services and utilities 771,722 1,019,825 Others 28, 30 2,126,660 3,478,900
P217,766,412 P170,753,754
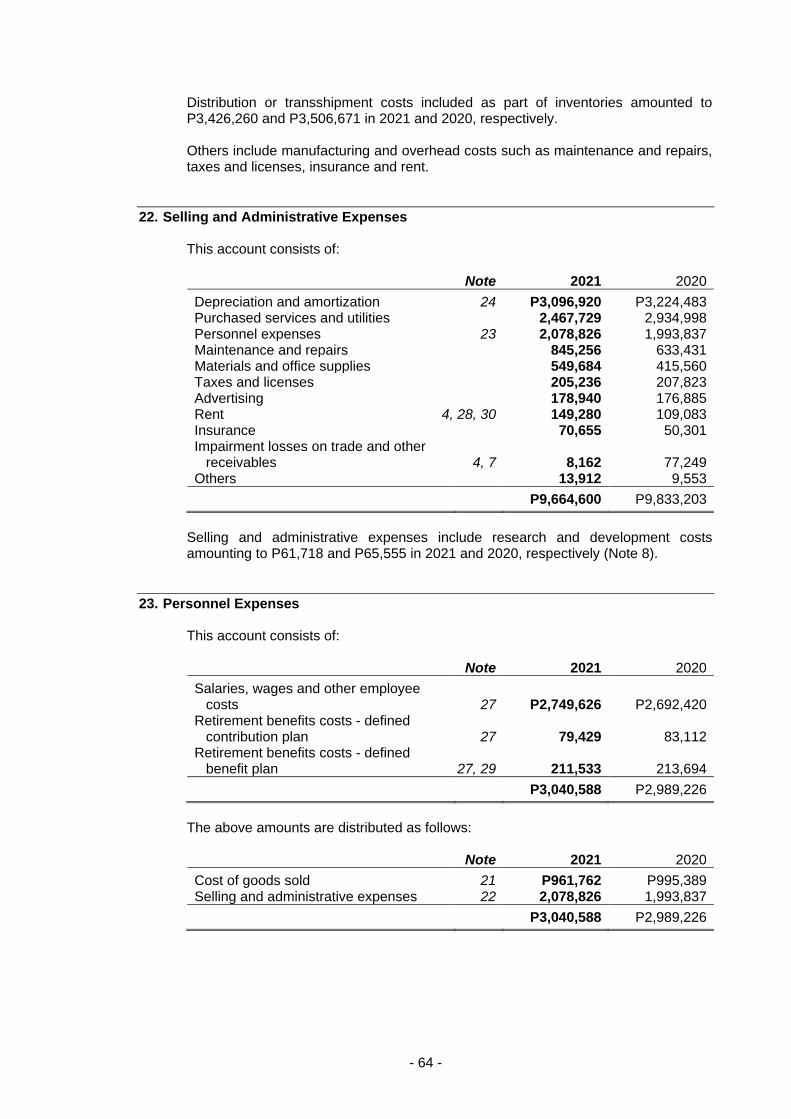
- 64 -
Distribution or transshipment costs included as part of inventories amounted to P3,426,260 and P3,506,671 in 2021 and 2020, respectively. Others include manufacturing and overhead costs such as maintenance and repairs, taxes and licenses, insurance and rent.
22. Selling and Administrative Expenses This account consists of: Note 2021 2020
Depreciation and amortization 24 P3,096,920 P3,224,483 Purchased services and utilities 2,467,729 2,934,998 Personnel expenses 23 2,078,826 1,993,837 Maintenance and repairs 845,256 633,431 Materials and office supplies 549,684 415,560 Taxes and licenses 205,236 207,823 Advertising 178,940 176,885 Rent 4, 28, 30 149,280 109,083 Insurance 70,655 50,301 Impairment losses on trade and other
receivables 4, 7 8,162 77,249 Others 13,912 9,553
P9,664,600 P9,833,203
Selling and administrative expenses include research and development costs amounting to P61,718 and P65,555 in 2021 and 2020, respectively (Note 8).
23. Personnel Expenses This account consists of: Note 2021 2020
Salaries, wages and other employee costs 27 P2,749,626 P2,692,420
Retirement benefits costs - defined contribution plan 27 79,429 83,112
Retirement benefits costs - defined benefit plan 27, 29 211,533 213,694
P3,040,588 P2,989,226
The above amounts are distributed as follows: Note 2021 2020
Cost of goods sold 21 P961,762 P995,389 Selling and administrative expenses 22 2,078,826 1,993,837
P3,040,588 P2,989,226
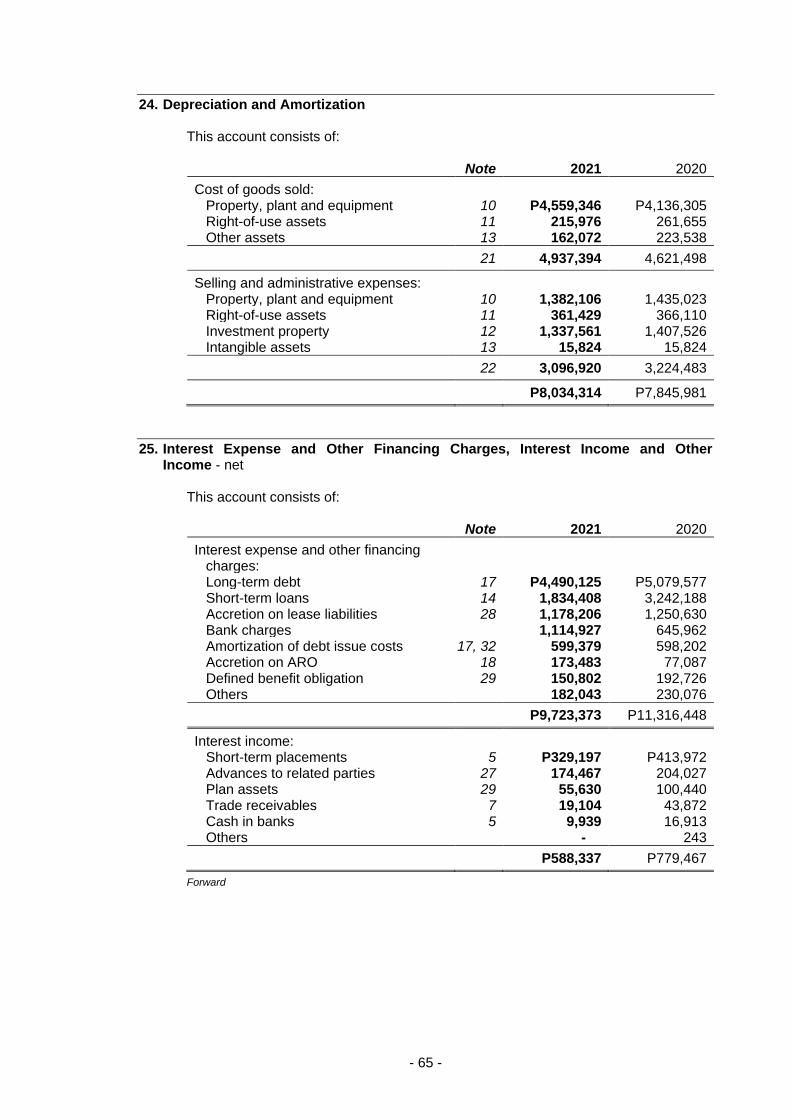
- 65 -
24. Depreciation and Amortization This account consists of: Note 2021 2020
Cost of goods sold: Property, plant and equipment 10 P4,559,346 P4,136,305 Right-of-use assets 11 215,976 261,655 Other assets 13 162,072 223,538
21 4,937,394 4,621,498
Selling and administrative expenses: Property, plant and equipment 10 1,382,106 1,435,023 Right-of-use assets 11 361,429 366,110 Investment property 12 1,337,561 1,407,526 Intangible assets 13 15,824 15,824
22 3,096,920 3,224,483
P8,034,314 P7,845,981
25. Interest Expense and Other Financing Charges, Interest Income and Other Income - net
This account consists of: Note 2021 2020
Interest expense and other financing charges: Long-term debt 17 P4,490,125 P5,079,577 Short-term loans 14 1,834,408 3,242,188 Accretion on lease liabilities 28 1,178,206 1,250,630 Bank charges 1,114,927 645,962 Amortization of debt issue costs 17, 32 599,379 598,202 Accretion on ARO 18 173,483 77,087 Defined benefit obligation 29 150,802 192,726 Others 182,043 230,076
P9,723,373 P11,316,448
Interest income: Short-term placements 5 P329,197 P413,972 Advances to related parties 27 174,467 204,027 Plan assets 29 55,630 100,440 Trade receivables 7 19,104 43,872 Cash in banks 5 9,939 16,913 Others - 243
P588,337 P779,467
Forward
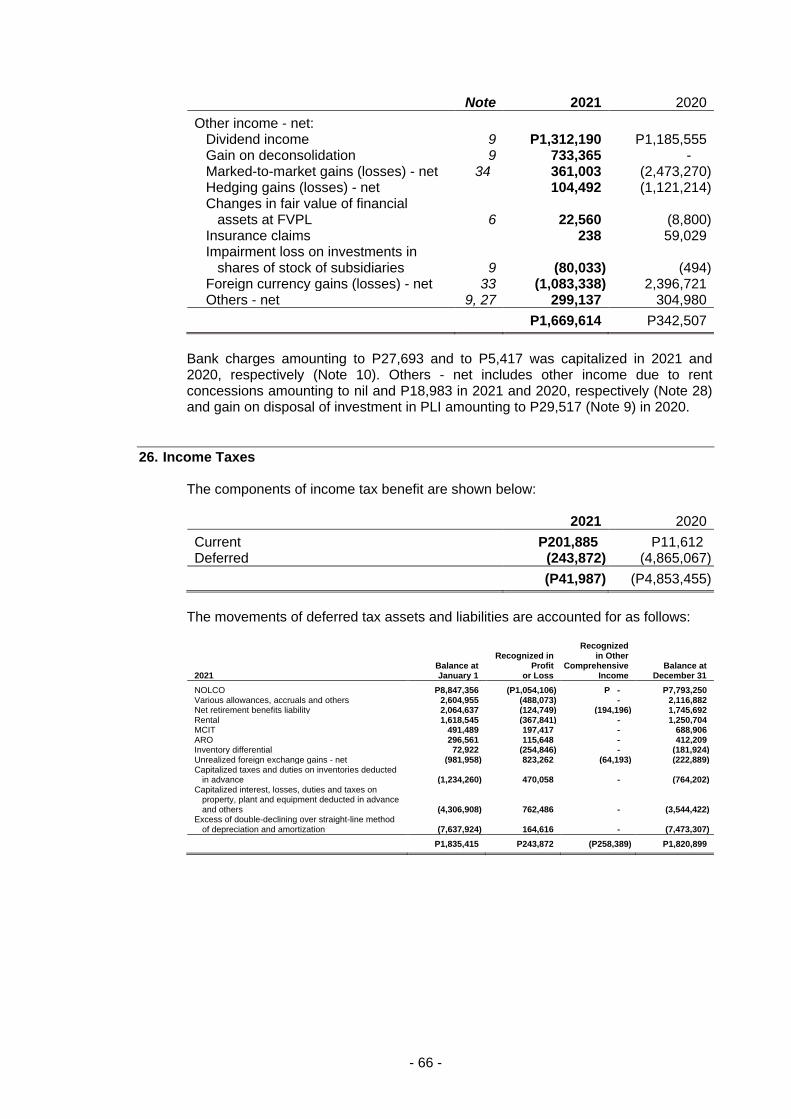
- 66 -
Note 2021 2020
Other income - net: Dividend income 9 P1,312,190 P1,185,555 Gain on deconsolidation 9 733,365 - Marked-to-market gains (losses) - net 34 361,003 (2,473,270) Hedging gains (losses) - net 104,492 (1,121,214) Changes in fair value of financial
assets at FVPL 6 22,560 (8,800) Insurance claims 238 59,029 Impairment loss on investments in
shares of stock of subsidiaries 9 (80,033) (494) Foreign currency gains (losses) - net 33 (1,083,338) 2,396,721 Others - net 9, 27 299,137 304,980
P1,669,614 P342,507
Bank charges amounting to P27,693 and to P5,417 was capitalized in 2021 and 2020, respectively (Note 10). Others - net includes other income due to rent concessions amounting to nil and P18,983 in 2021 and 2020, respectively (Note 28) and gain on disposal of investment in PLI amounting to P29,517 (Note 9) in 2020.
26. Income Taxes The components of income tax benefit are shown below: 2021 2020
Current P201,885 P11,612 Deferred (243,872) (4,865,067)
(P41,987) (P4,853,455)
The movements of deferred tax assets and liabilities are accounted for as follows:
2021 Balance at January 1
Recognized in Profit
or Loss
Recognized in Other
Comprehensive Income
Balance at December 31
NOLCO P8,847,356 (P1,054,106) P - P7,793,250 Various allowances, accruals and others 2,604,955 (488,073) - 2,116,882 Net retirement benefits liability 2,064,637 (124,749) (194,196) 1,745,692 Rental 1,618,545 (367,841) - 1,250,704 MCIT 491,489 197,417 - 688,906 ARO 296,561 115,648 - 412,209 Inventory differential 72,922 (254,846) - (181,924) Unrealized foreign exchange gains - net (981,958) 823,262 (64,193) (222,889) Capitalized taxes and duties on inventories deducted
in advance (1,234,260) 470,058 - (764,202) Capitalized interest, losses, duties and taxes on
property, plant and equipment deducted in advance and others (4,306,908) 762,486 - (3,544,422)
Excess of double-declining over straight-line method of depreciation and amortization (7,637,924) 164,616 - (7,473,307)
P1,835,415 P243,872 (P258,389) P1,820,899
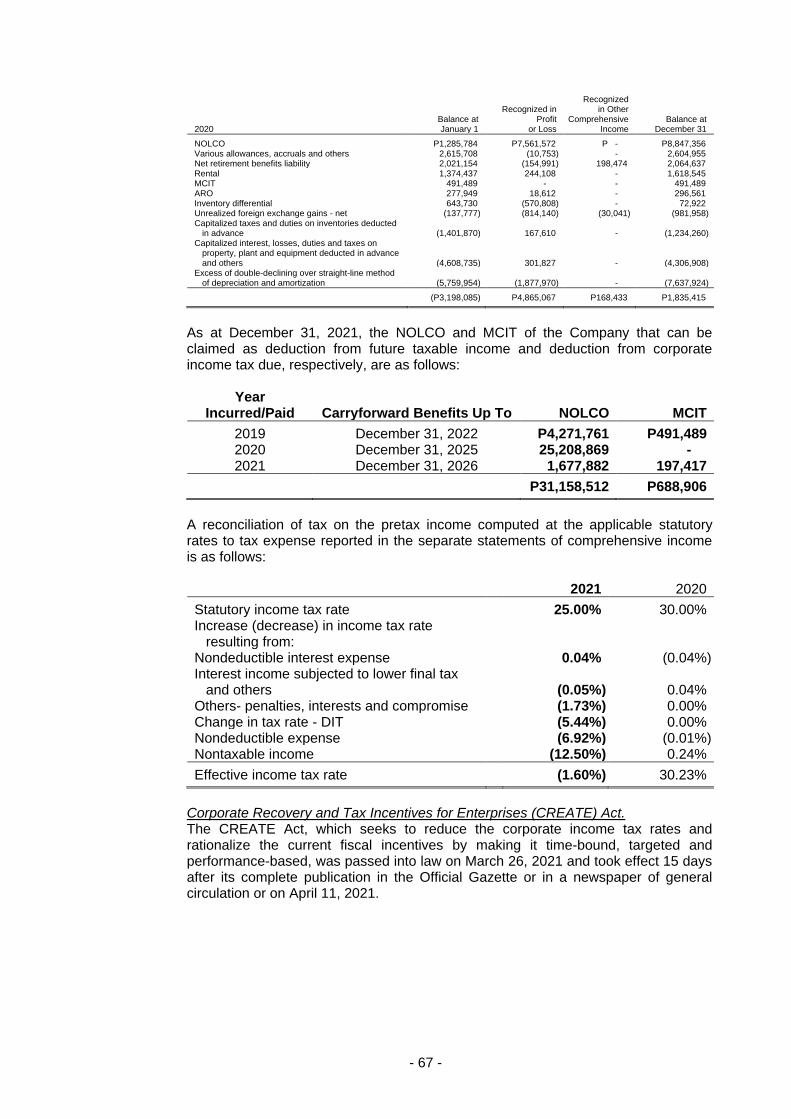
- 67 -
2020 Balance at January 1
Recognized in Profit
or Loss
Recognized in Other
Comprehensive Income
Balance at December 31
NOLCO P1,285,784 P7,561,572 P - P8,847,356 Various allowances, accruals and others 2,615,708 (10,753) - 2,604,955 Net retirement benefits liability 2,021,154 (154,991) 198,474 2,064,637 Rental 1,374,437 244,108 - 1,618,545 MCIT 491,489 - - 491,489 ARO 277,949 18,612 - 296,561 Inventory differential 643,730 (570,808) - 72,922 Unrealized foreign exchange gains - net (137,777) (814,140) (30,041) (981,958) Capitalized taxes and duties on inventories deducted
in advance (1,401,870) 167,610 - (1,234,260) Capitalized interest, losses, duties and taxes on
property, plant and equipment deducted in advance and others (4,608,735) 301,827 - (4,306,908)
Excess of double-declining over straight-line method of depreciation and amortization (5,759,954) (1,877,970) - (7,637,924)
(P3,198,085) P4,865,067 P168,433 P1,835,415
As at December 31, 2021, the NOLCO and MCIT of the Company that can be claimed as deduction from future taxable income and deduction from corporate income tax due, respectively, are as follows:
Year Incurred/Paid Carryforward Benefits Up To NOLCO MCIT
2019 December 31, 2022 P4,271,761 P491,489 2020 December 31, 2025 25,208,869 - 2021 December 31, 2026 1,677,882 197,417
P31,158,512 P688,906
A reconciliation of tax on the pretax income computed at the applicable statutory rates to tax expense reported in the separate statements of comprehensive income is as follows: 2021 2020
Statutory income tax rate 25.00% 30.00% Increase (decrease) in income tax rate
resulting from: Nondeductible interest expense 0.04% (0.04%) Interest income subjected to lower final tax
and others (0.05%) 0.04% Others- penalties, interests and compromise (1.73%) 0.00% Change in tax rate - DIT (5.44%) 0.00% Nondeductible expense (6.92%) (0.01%) Nontaxable income (12.50%) 0.24%
Effective income tax rate (1.60%) 30.23%
Corporate Recovery and Tax Incentives for Enterprises (CREATE) Act. The CREATE Act, which seeks to reduce the corporate income tax rates and rationalize the current fiscal incentives by making it time-bound, targeted and performance-based, was passed into law on March 26, 2021 and took effect 15 days after its complete publication in the Official Gazette or in a newspaper of general circulation or on April 11, 2021.
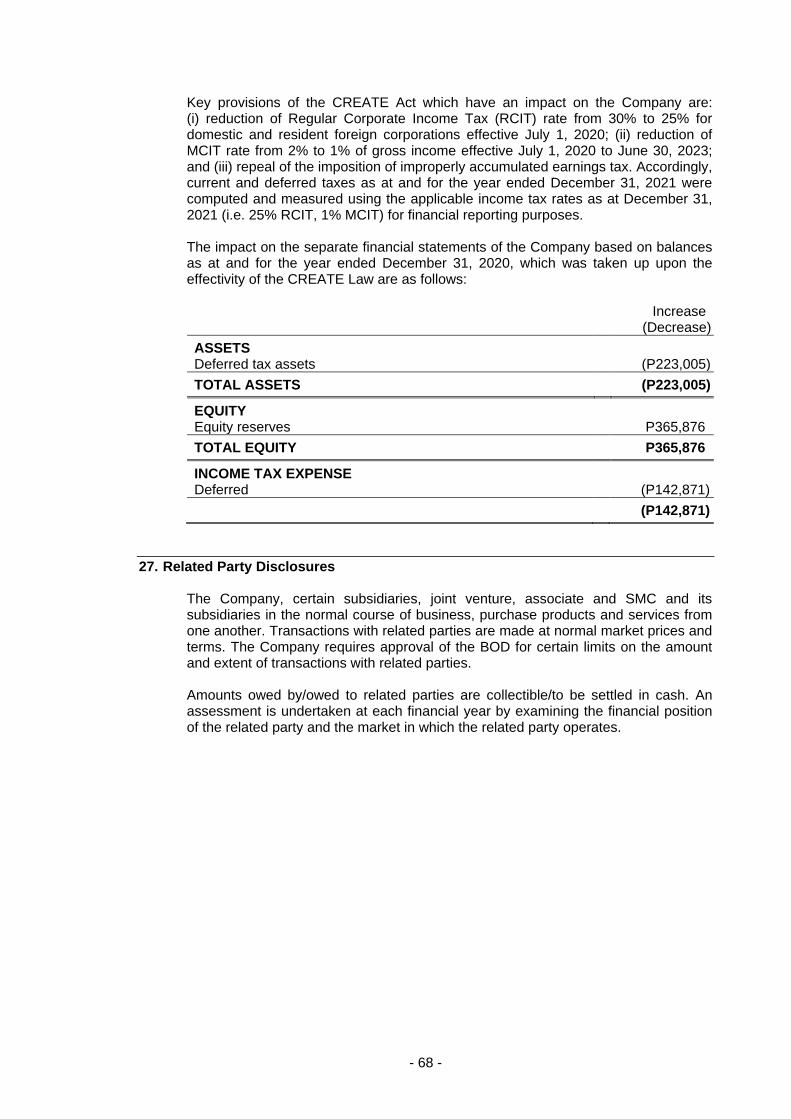
- 68 -
Key provisions of the CREATE Act which have an impact on the Company are: (i) reduction of Regular Corporate Income Tax (RCIT) rate from 30% to 25% for domestic and resident foreign corporations effective July 1, 2020; (ii) reduction of MCIT rate from 2% to 1% of gross income effective July 1, 2020 to June 30, 2023; and (iii) repeal of the imposition of improperly accumulated earnings tax. Accordingly, current and deferred taxes as at and for the year ended December 31, 2021 were computed and measured using the applicable income tax rates as at December 31, 2021 (i.e. 25% RCIT, 1% MCIT) for financial reporting purposes. The impact on the separate financial statements of the Company based on balances as at and for the year ended December 31, 2020, which was taken up upon the effectivity of the CREATE Law are as follows:
Increase (Decrease)
ASSETS Deferred tax assets (P223,005)
TOTAL ASSETS (P223,005)
EQUITY Equity reserves P365,876
TOTAL EQUITY P365,876
INCOME TAX EXPENSE Deferred (P142,871)
(P142,871)
27. Related Party Disclosures The Company, certain subsidiaries, joint venture, associate and SMC and its subsidiaries in the normal course of business, purchase products and services from one another. Transactions with related parties are made at normal market prices and terms. The Company requires approval of the BOD for certain limits on the amount and extent of transactions with related parties. Amounts owed by/owed to related parties are collectible/to be settled in cash. An assessment is undertaken at each financial year by examining the financial position of the related party and the market in which the related party operates.
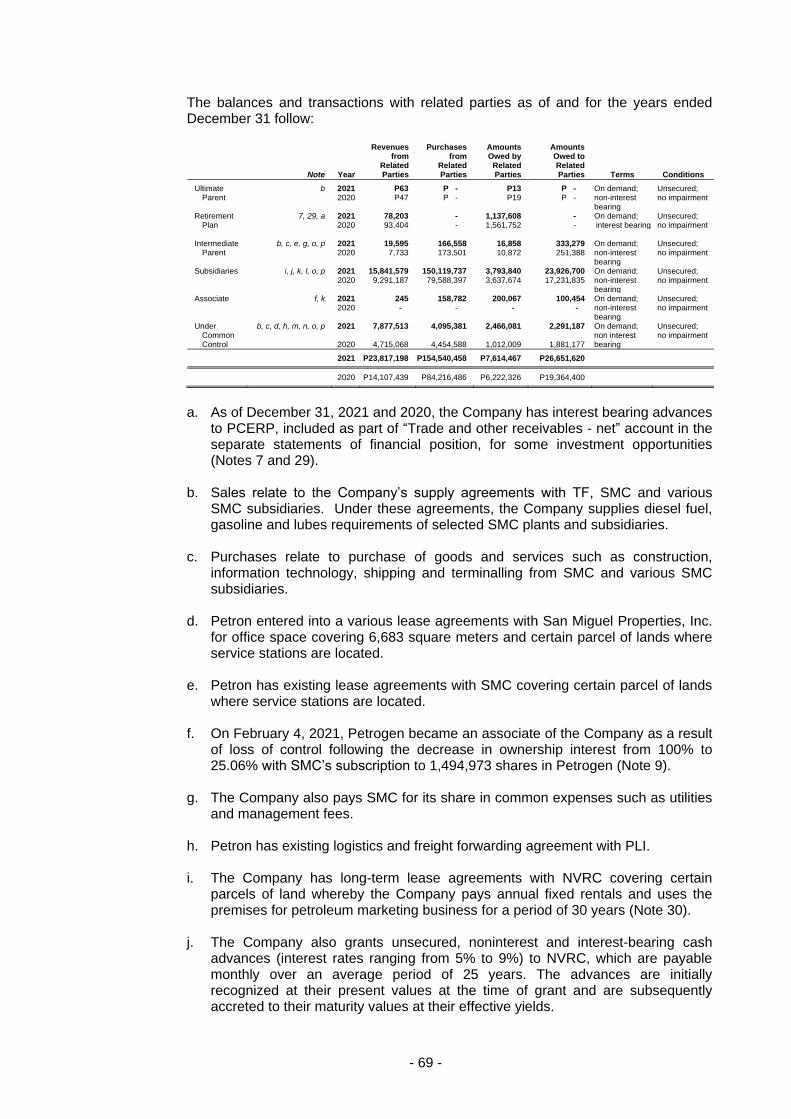
- 69 -
The balances and transactions with related parties as of and for the years ended December 31 follow:
Note Year
Revenues from
Related Parties
Purchases from
Related Parties
Amounts Owed by
Related Parties
Amounts Owed to Related Parties Terms Conditions
Ultimate b 2021 P63 P - P13 P - On demand; Unsecured; Parent 2020 P47 P - P19 P - non-interest no impairment
bearing Retirement 7, 29, a 2021 78,203 - 1,137,608 - On demand; Unsecured;
Plan 2020 93,404 - 1,561,752 - interest bearing no impairment
Intermediate b, c, e, g, o, p 2021 19,595 166,558 16,858 333,279 On demand; Unsecured; Parent 2020 7,733 173,501 10,872 251,388 non-interest no impairment
bearing Subsidiaries i, j, k, l, o, p 2021 15,841,579 150,119,737 3,793,840 23,926,700 On demand; Unsecured; 2020 9,291,187 79,588,397 3,637,674 17,231,835 non-interest no impairment bearing Associate f, k 2021 245 158,782 200,067 100,454 On demand; Unsecured; 2020 - - - - non-interest no impairment bearing Under
Common b, c, d, h, m, n, o, p 2021 7,877,513 4,095,381 2,466,081 2,291,187 On demand;
non interest Unsecured; no impairment
Control 2020 4,715,068 4,454,588 1,012,009 1,881,177 bearing
2021 P23,817,198 P154,540,458 P7,614,467 P26,651,620
2020 P14,107,439 P84,216,486 P6,222,326 P19,364,400
a. As of December 31, 2021 and 2020, the Company has interest bearing advances
to PCERP, included as part of “Trade and other receivables - net” account in the separate statements of financial position, for some investment opportunities (Notes 7 and 29).
b. Sales relate to the Company’s supply agreements with TF, SMC and various
SMC subsidiaries. Under these agreements, the Company supplies diesel fuel, gasoline and lubes requirements of selected SMC plants and subsidiaries.
c. Purchases relate to purchase of goods and services such as construction,
information technology, shipping and terminalling from SMC and various SMC subsidiaries.
d. Petron entered into a various lease agreements with San Miguel Properties, Inc.
for office space covering 6,683 square meters and certain parcel of lands where service stations are located.
e. Petron has existing lease agreements with SMC covering certain parcel of lands
where service stations are located. f. On February 4, 2021, Petrogen became an associate of the Company as a result
of loss of control following the decrease in ownership interest from 100% to 25.06% with SMC’s subscription to 1,494,973 shares in Petrogen (Note 9).
g. The Company also pays SMC for its share in common expenses such as utilities
and management fees. h. Petron has existing logistics and freight forwarding agreement with PLI. i. The Company has long-term lease agreements with NVRC covering certain
parcels of land whereby the Company pays annual fixed rentals and uses the premises for petroleum marketing business for a period of 30 years (Note 30).
j. The Company also grants unsecured, noninterest and interest-bearing cash
advances (interest rates ranging from 5% to 9%) to NVRC, which are payable monthly over an average period of 25 years. The advances are initially recognized at their present values at the time of grant and are subsequently accreted to their maturity values at their effective yields.
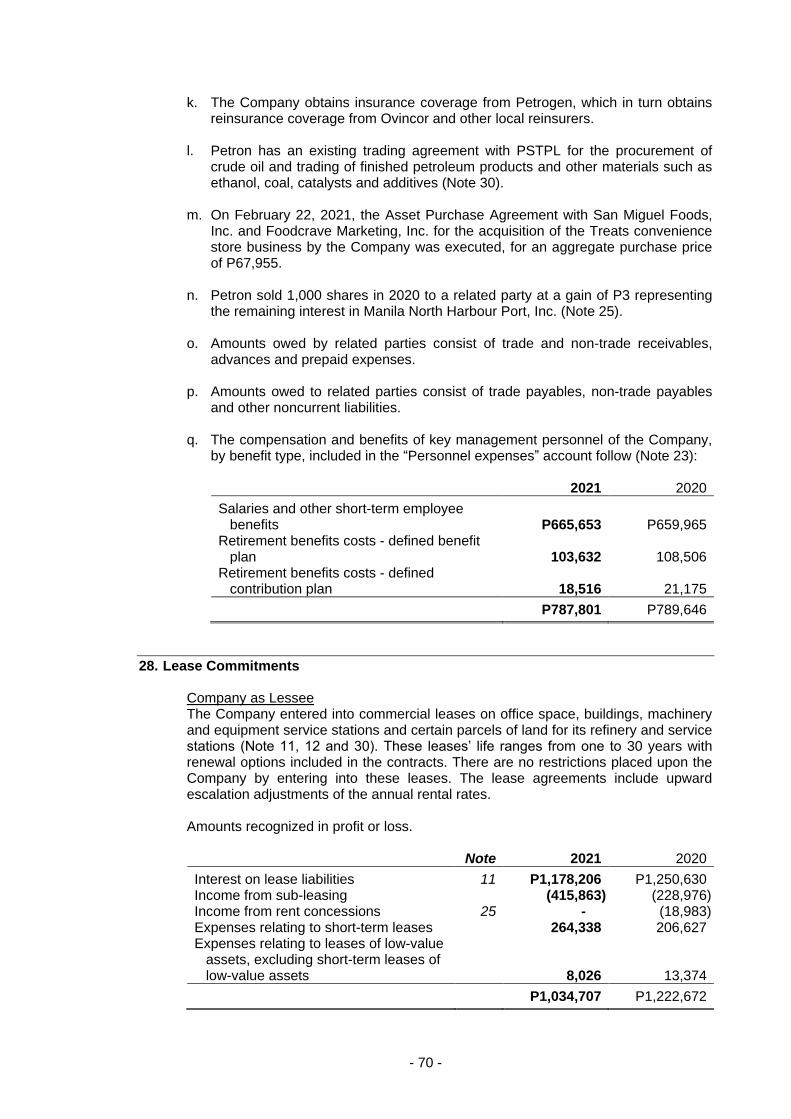
- 70 -
k. The Company obtains insurance coverage from Petrogen, which in turn obtains reinsurance coverage from Ovincor and other local reinsurers.
l. Petron has an existing trading agreement with PSTPL for the procurement of
crude oil and trading of finished petroleum products and other materials such as ethanol, coal, catalysts and additives (Note 30).
m. On February 22, 2021, the Asset Purchase Agreement with San Miguel Foods,
Inc. and Foodcrave Marketing, Inc. for the acquisition of the Treats convenience store business by the Company was executed, for an aggregate purchase price of P67,955.
n. Petron sold 1,000 shares in 2020 to a related party at a gain of P3 representing
the remaining interest in Manila North Harbour Port, Inc. (Note 25). o. Amounts owed by related parties consist of trade and non-trade receivables,
advances and prepaid expenses. p. Amounts owed to related parties consist of trade payables, non-trade payables
and other noncurrent liabilities. q. The compensation and benefits of key management personnel of the Company,
by benefit type, included in the “Personnel expenses” account follow (Note 23):
2021 2020
Salaries and other short-term employee benefits P665,653 P659,965
Retirement benefits costs - defined benefit plan 103,632 108,506
Retirement benefits costs - defined contribution plan 18,516 21,175
P787,801 P789,646
28. Lease Commitments Company as Lessee The Company entered into commercial leases on office space, buildings, machinery and equipment service stations and certain parcels of land for its refinery and service stations (Note 11, 12 and 30). These leases’ life ranges from one to 30 years with renewal options included in the contracts. There are no restrictions placed upon the Company by entering into these leases. The lease agreements include upward escalation adjustments of the annual rental rates. Amounts recognized in profit or loss. Note 2021 2020
Interest on lease liabilities 11 P1,178,206 P1,250,630 Income from sub-leasing (415,863) (228,976) Income from rent concessions 25 - (18,983) Expenses relating to short-term leases 264,338 206,627 Expenses relating to leases of low-value
assets, excluding short-term leases of low-value assets 8,026 13,374
P1,034,707 P1,222,672
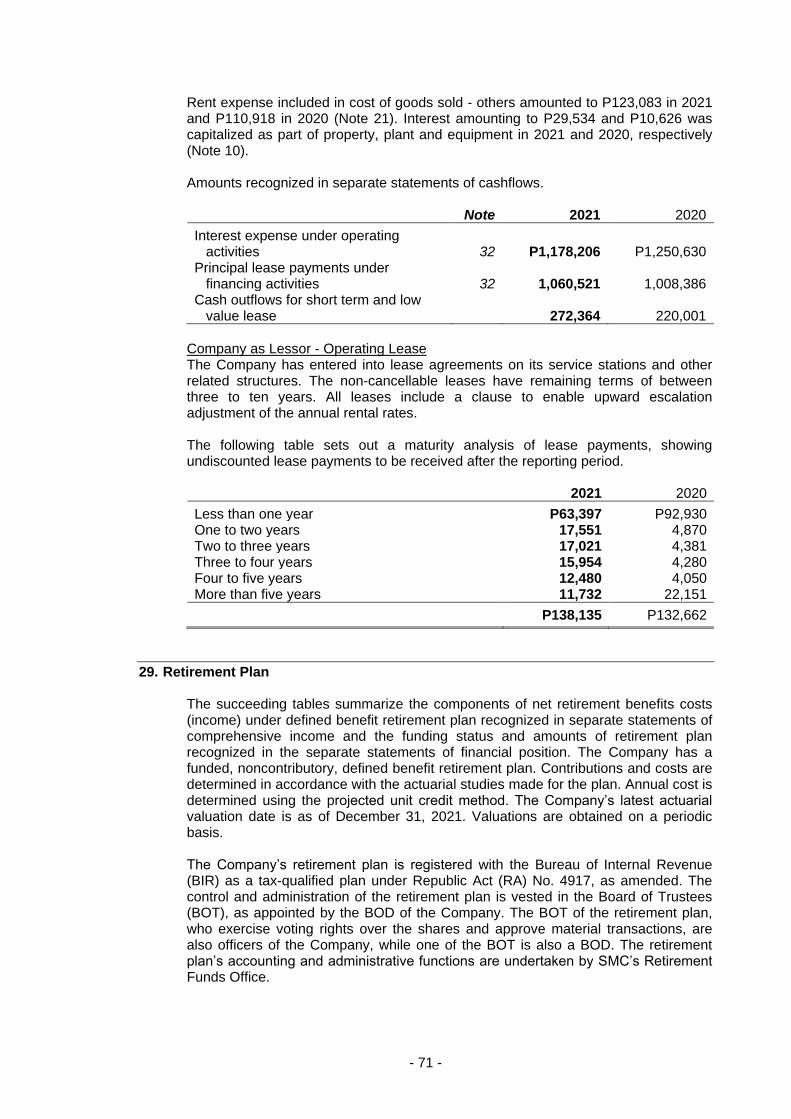
- 71 -
Rent expense included in cost of goods sold - others amounted to P123,083 in 2021 and P110,918 in 2020 (Note 21). Interest amounting to P29,534 and P10,626 was capitalized as part of property, plant and equipment in 2021 and 2020, respectively (Note 10). Amounts recognized in separate statements of cashflows. Note 2021 2020
Interest expense under operating activities 32 P1,178,206 P1,250,630
Principal lease payments under financing activities 32 1,060,521 1,008,386
Cash outflows for short term and low value lease 272,364 220,001
Company as Lessor - Operating Lease The Company has entered into lease agreements on its service stations and other related structures. The non-cancellable leases have remaining terms of between three to ten years. All leases include a clause to enable upward escalation adjustment of the annual rental rates. The following table sets out a maturity analysis of lease payments, showing undiscounted lease payments to be received after the reporting period. 2021 2020
Less than one year P63,397 P92,930 One to two years 17,551 4,870 Two to three years 17,021 4,381 Three to four years 15,954 4,280 Four to five years 12,480 4,050 More than five years 11,732 22,151
P138,135 P132,662
29. Retirement Plan The succeeding tables summarize the components of net retirement benefits costs (income) under defined benefit retirement plan recognized in separate statements of comprehensive income and the funding status and amounts of retirement plan recognized in the separate statements of financial position. The Company has a funded, noncontributory, defined benefit retirement plan. Contributions and costs are determined in accordance with the actuarial studies made for the plan. Annual cost is determined using the projected unit credit method. The Company’s latest actuarial valuation date is as of December 31, 2021. Valuations are obtained on a periodic basis. The Company’s retirement plan is registered with the Bureau of Internal Revenue (BIR) as a tax-qualified plan under Republic Act (RA) No. 4917, as amended. The control and administration of the retirement plan is vested in the Board of Trustees (BOT), as appointed by the BOD of the Company. The BOT of the retirement plan, who exercise voting rights over the shares and approve material transactions, are also officers of the Company, while one of the BOT is also a BOD. The retirement plan’s accounting and administrative functions are undertaken by SMC’s Retirement Funds Office.
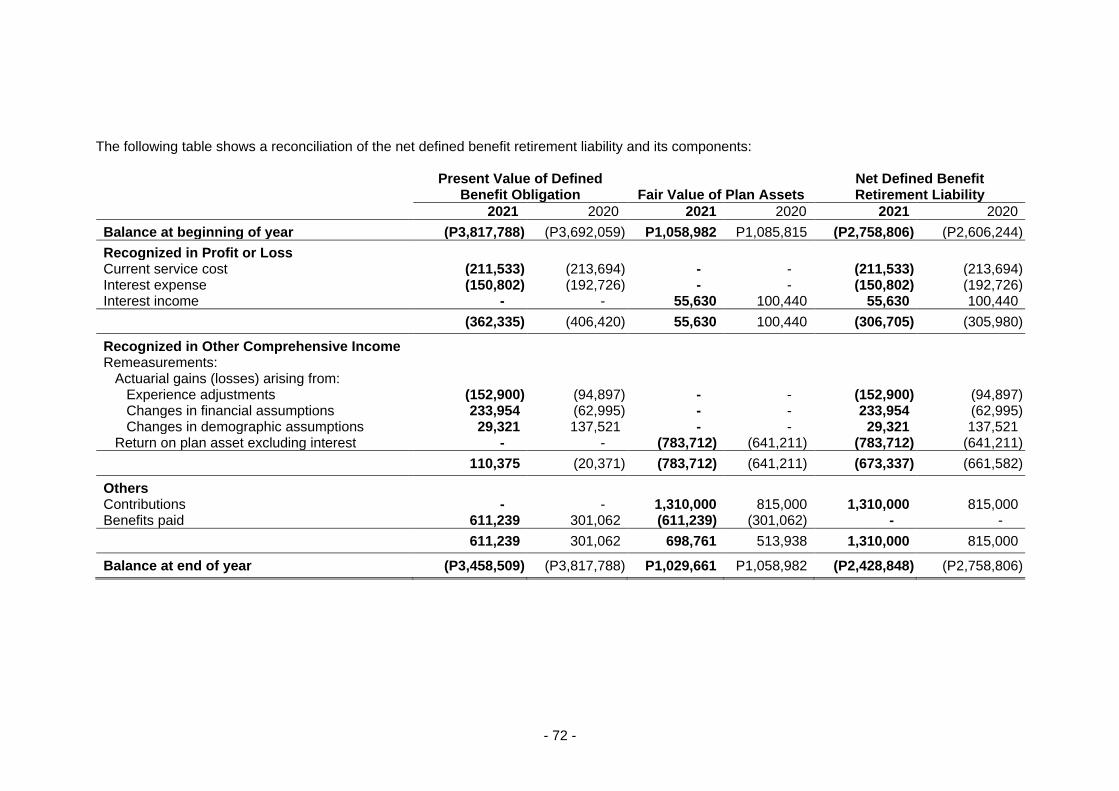
- 72 -
The following table shows a reconciliation of the net defined benefit retirement liability and its components:
Present Value of Defined
Benefit Obligation Fair Value of Plan Assets Net Defined Benefit Retirement Liability
2021 2020 2021 2020 2021 2020
Balance at beginning of year (P3,817,788) (P3,692,059) P1,058,982 P1,085,815 (P2,758,806) (P2,606,244)
Recognized in Profit or Loss Current service cost (211,533) (213,694) - - (211,533) (213,694) Interest expense (150,802) (192,726) - - (150,802) (192,726) Interest income - - 55,630 100,440 55,630 100,440
(362,335) (406,420) 55,630 100,440 (306,705) (305,980)
Recognized in Other Comprehensive Income Remeasurements:
Actuarial gains (losses) arising from: Experience adjustments (152,900) (94,897) - - (152,900) (94,897) Changes in financial assumptions 233,954 (62,995) - - 233,954 (62,995) Changes in demographic assumptions 29,321 137,521 - - 29,321 137,521
Return on plan asset excluding interest - - (783,712) (641,211) (783,712) (641,211)
110,375 (20,371) (783,712) (641,211) (673,337) (661,582)
Others Contributions - - 1,310,000 815,000 1,310,000 815,000 Benefits paid 611,239 301,062 (611,239) (301,062) - -
611,239 301,062 698,761 513,938 1,310,000 815,000
Balance at end of year (P3,458,509) (P3,817,788) P1,029,661 P1,058,982 (P2,428,848) (P2,758,806)
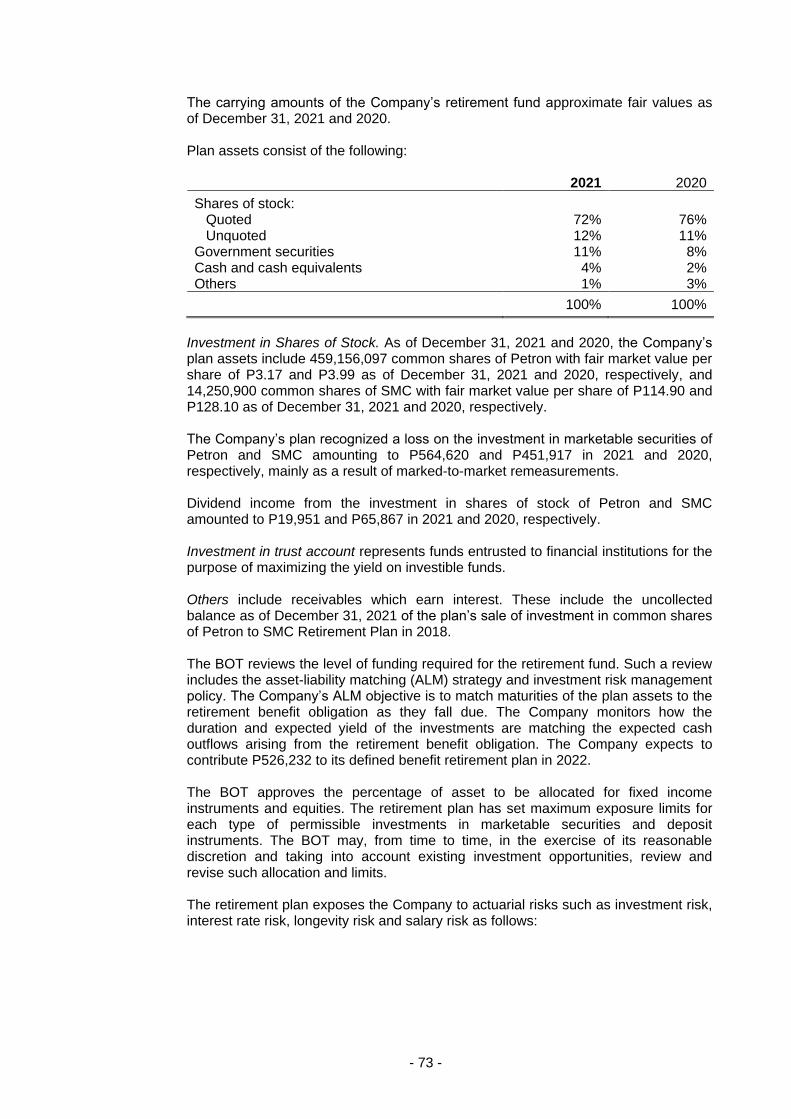
- 73 -
The carrying amounts of the Company’s retirement fund approximate fair values as of December 31, 2021 and 2020. Plan assets consist of the following: 2021 2020
Shares of stock: Quoted 72% 76% Unquoted 12% 11%
Government securities 11% 8% Cash and cash equivalents 4% 2% Others 1% 3%
100% 100%
Investment in Shares of Stock. As of December 31, 2021 and 2020, the Company’s plan assets include 459,156,097 common shares of Petron with fair market value per share of P3.17 and P3.99 as of December 31, 2021 and 2020, respectively, and 14,250,900 common shares of SMC with fair market value per share of P114.90 and P128.10 as of December 31, 2021 and 2020, respectively. The Company’s plan recognized a loss on the investment in marketable securities of Petron and SMC amounting to P564,620 and P451,917 in 2021 and 2020, respectively, mainly as a result of marked-to-market remeasurements. Dividend income from the investment in shares of stock of Petron and SMC amounted to P19,951 and P65,867 in 2021 and 2020, respectively. Investment in trust account represents funds entrusted to financial institutions for the purpose of maximizing the yield on investible funds. Others include receivables which earn interest. These include the uncollected balance as of December 31, 2021 of the plan’s sale of investment in common shares of Petron to SMC Retirement Plan in 2018. The BOT reviews the level of funding required for the retirement fund. Such a review includes the asset-liability matching (ALM) strategy and investment risk management policy. The Company’s ALM objective is to match maturities of the plan assets to the retirement benefit obligation as they fall due. The Company monitors how the duration and expected yield of the investments are matching the expected cash outflows arising from the retirement benefit obligation. The Company expects to contribute P526,232 to its defined benefit retirement plan in 2022. The BOT approves the percentage of asset to be allocated for fixed income instruments and equities. The retirement plan has set maximum exposure limits for each type of permissible investments in marketable securities and deposit instruments. The BOT may, from time to time, in the exercise of its reasonable discretion and taking into account existing investment opportunities, review and revise such allocation and limits. The retirement plan exposes the Company to actuarial risks such as investment risk, interest rate risk, longevity risk and salary risk as follows:
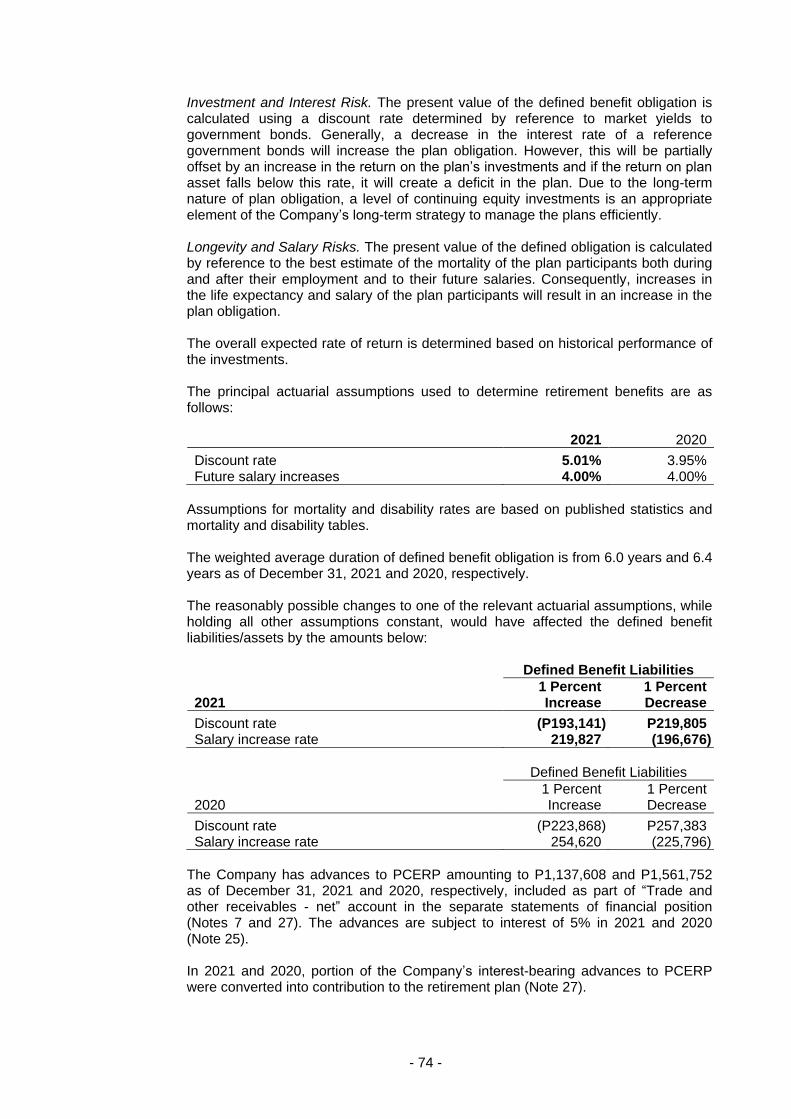
- 74 -
Investment and Interest Risk. The present value of the defined benefit obligation is calculated using a discount rate determined by reference to market yields to government bonds. Generally, a decrease in the interest rate of a reference government bonds will increase the plan obligation. However, this will be partially offset by an increase in the return on the plan’s investments and if the return on plan asset falls below this rate, it will create a deficit in the plan. Due to the long-term nature of plan obligation, a level of continuing equity investments is an appropriate element of the Company’s long-term strategy to manage the plans efficiently. Longevity and Salary Risks. The present value of the defined obligation is calculated by reference to the best estimate of the mortality of the plan participants both during and after their employment and to their future salaries. Consequently, increases in the life expectancy and salary of the plan participants will result in an increase in the plan obligation. The overall expected rate of return is determined based on historical performance of the investments. The principal actuarial assumptions used to determine retirement benefits are as follows: 2021 2020
Discount rate 5.01% 3.95% Future salary increases 4.00% 4.00%
Assumptions for mortality and disability rates are based on published statistics and mortality and disability tables. The weighted average duration of defined benefit obligation is from 6.0 years and 6.4 years as of December 31, 2021 and 2020, respectively. The reasonably possible changes to one of the relevant actuarial assumptions, while holding all other assumptions constant, would have affected the defined benefit liabilities/assets by the amounts below: Defined Benefit Liabilities
2021 1 Percent Increase
1 Percent Decrease
Discount rate (P193,141) P219,805 Salary increase rate 219,827 (196,676)
Defined Benefit Liabilities
2020 1 Percent Increase
1 Percent Decrease
Discount rate (P223,868) P257,383 Salary increase rate 254,620 (225,796)
The Company has advances to PCERP amounting to P1,137,608 and P1,561,752 as of December 31, 2021 and 2020, respectively, included as part of “Trade and other receivables - net” account in the separate statements of financial position (Notes 7 and 27). The advances are subject to interest of 5% in 2021 and 2020 (Note 25). In 2021 and 2020, portion of the Company’s interest-bearing advances to PCERP were converted into contribution to the retirement plan (Note 27).
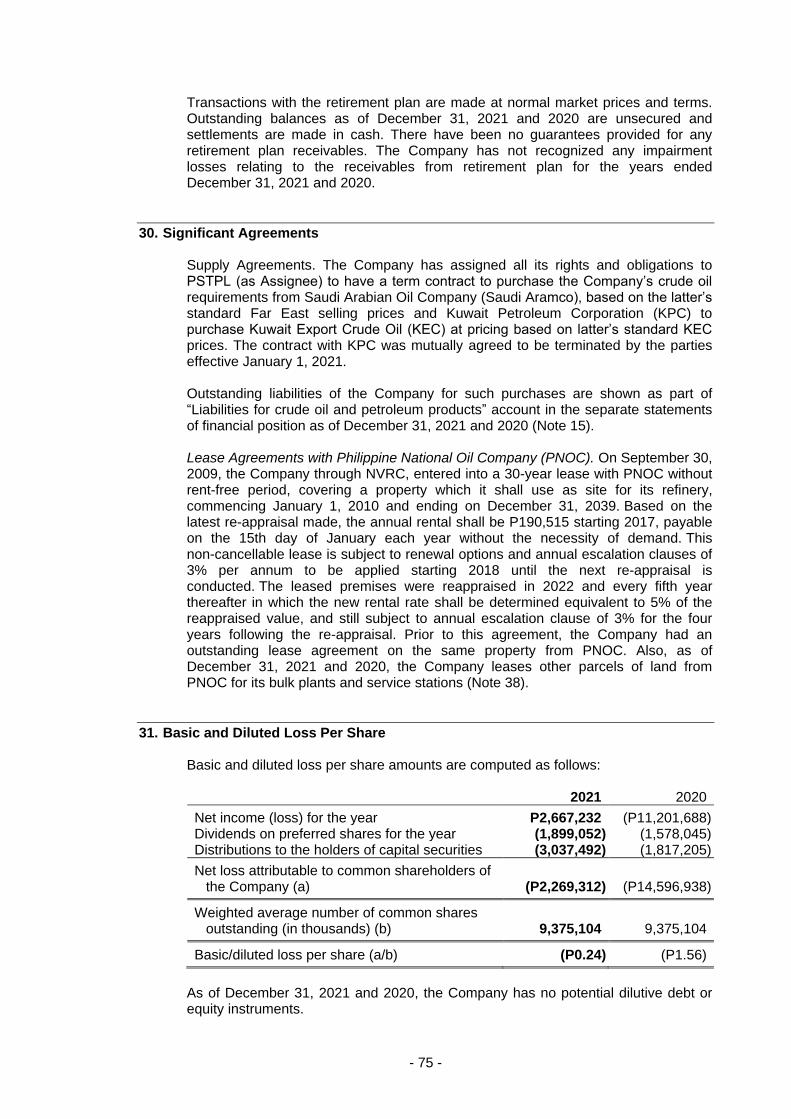
- 75 -
Transactions with the retirement plan are made at normal market prices and terms. Outstanding balances as of December 31, 2021 and 2020 are unsecured and settlements are made in cash. There have been no guarantees provided for any retirement plan receivables. The Company has not recognized any impairment losses relating to the receivables from retirement plan for the years ended December 31, 2021 and 2020.
30. Significant Agreements Supply Agreements. The Company has assigned all its rights and obligations to PSTPL (as Assignee) to have a term contract to purchase the Company’s crude oil requirements from Saudi Arabian Oil Company (Saudi Aramco), based on the latter’s standard Far East selling prices and Kuwait Petroleum Corporation (KPC) to purchase Kuwait Export Crude Oil (KEC) at pricing based on latter’s standard KEC prices. The contract with KPC was mutually agreed to be terminated by the parties effective January 1, 2021. Outstanding liabilities of the Company for such purchases are shown as part of “Liabilities for crude oil and petroleum products” account in the separate statements of financial position as of December 31, 2021 and 2020 (Note 15). Lease Agreements with Philippine National Oil Company (PNOC). On September 30, 2009, the Company through NVRC, entered into a 30-year lease with PNOC without rent-free period, covering a property which it shall use as site for its refinery, commencing January 1, 2010 and ending on December 31, 2039. Based on the latest re-appraisal made, the annual rental shall be P190,515 starting 2017, payable on the 15th day of January each year without the necessity of demand. This non-cancellable lease is subject to renewal options and annual escalation clauses of 3% per annum to be applied starting 2018 until the next re-appraisal is conducted. The leased premises were reappraised in 2022 and every fifth year thereafter in which the new rental rate shall be determined equivalent to 5% of the reappraised value, and still subject to annual escalation clause of 3% for the four years following the re-appraisal. Prior to this agreement, the Company had an outstanding lease agreement on the same property from PNOC. Also, as of December 31, 2021 and 2020, the Company leases other parcels of land from PNOC for its bulk plants and service stations (Note 38).
31. Basic and Diluted Loss Per Share Basic and diluted loss per share amounts are computed as follows: 2021 2020
Net income (loss) for the year P2,667,232 (P11,201,688) Dividends on preferred shares for the year (1,899,052) (1,578,045) Distributions to the holders of capital securities (3,037,492) (1,817,205)
Net loss attributable to common shareholders of the Company (a) (P2,269,312) (P14,596,938)
Weighted average number of common shares outstanding (in thousands) (b) 9,375,104 9,375,104
Basic/diluted loss per share (a/b) (P0.24) (P1.56)
As of December 31, 2021 and 2020, the Company has no potential dilutive debt or equity instruments.
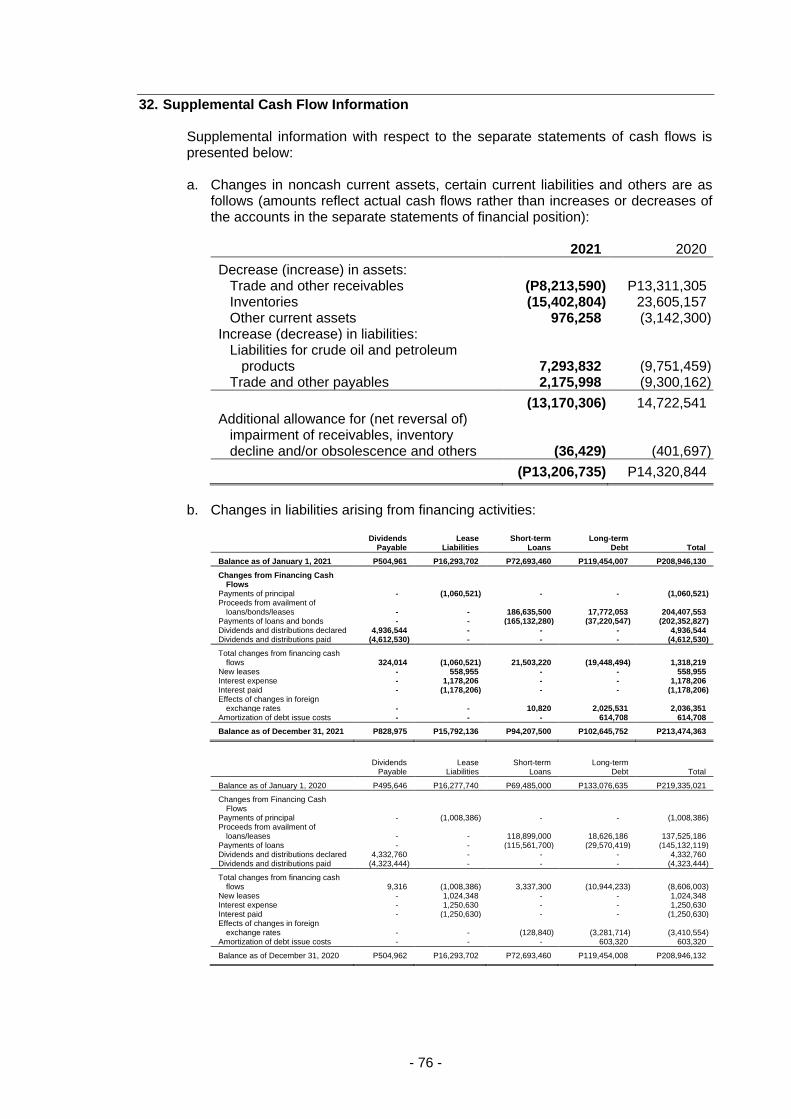
- 76 -
32. Supplemental Cash Flow Information Supplemental information with respect to the separate statements of cash flows is presented below: a. Changes in noncash current assets, certain current liabilities and others are as
follows (amounts reflect actual cash flows rather than increases or decreases of the accounts in the separate statements of financial position): 2021 2020
Decrease (increase) in assets: Trade and other receivables (P8,213,590) P13,311,305 Inventories (15,402,804) 23,605,157 Other current assets 976,258 (3,142,300)
Increase (decrease) in liabilities: Liabilities for crude oil and petroleum
products 7,293,832 (9,751,459) Trade and other payables 2,175,998 (9,300,162)
(13,170,306) 14,722,541 Additional allowance for (net reversal of)
impairment of receivables, inventory decline and/or obsolescence and others (36,429) (401,697)
(P13,206,735) P14,320,844
b. Changes in liabilities arising from financing activities:
Dividends
Payable Lease
Liabilities Short-term
Loans Long-term
Debt Total
Balance as of January 1, 2021 P504,961 P16,293,702 P72,693,460 P119,454,007 P208,946,130
Changes from Financing Cash Flows
Payments of principal - (1,060,521) - - (1,060,521) Proceeds from availment of
loans/bonds/leases - - 186,635,500 17,772,053 204,407,553 Payments of loans and bonds - - (165,132,280) (37,220,547) (202,352,827) Dividends and distributions declared 4,936,544 - - - 4,936,544 Dividends and distributions paid (4,612,530) - - - (4,612,530)
Total changes from financing cash flows 324,014 (1,060,521) 21,503,220 (19,448,494) 1,318,219
New leases - 558,955 - - 558,955 Interest expense - 1,178,206 - - 1,178,206 Interest paid - (1,178,206) - - (1,178,206) Effects of changes in foreign
exchange rates - - 10,820 2,025,531 2,036,351 Amortization of debt issue costs - - - 614,708 614,708
Balance as of December 31, 2021 P828,975 P15,792,136 P94,207,500 P102,645,752 P213,474,363
Dividends
Payable Lease
Liabilities Short-term
Loans Long-term
Debt Total
Balance as of January 1, 2020 P495,646 P16,277,740 P69,485,000 P133,076,635 P219,335,021
Changes from Financing Cash Flows
Payments of principal - (1,008,386) - - (1,008,386) Proceeds from availment of
loans/leases - - 118,899,000 18,626,186 137,525,186 Payments of loans - - (115,561,700) (29,570,419) (145,132,119) Dividends and distributions declared 4,332,760 - - - 4,332,760 Dividends and distributions paid (4,323,444) - - - (4,323,444)
Total changes from financing cash flows 9,316 (1,008,386) 3,337,300 (10,944,233) (8,606,003)
New leases - 1,024,348 - - 1,024,348 Interest expense - 1,250,630 - - 1,250,630 Interest paid - (1,250,630) - - (1,250,630) Effects of changes in foreign
exchange rates - - (128,840) (3,281,714) (3,410,554) Amortization of debt issue costs - - - 603,320 603,320
Balance as of December 31, 2020 P504,962 P16,293,702 P72,693,460 P119,454,008 P208,946,132
- 77 -
33. Financial Risk Management Objectives and Policies The Company’s principal financial instruments include cash and cash equivalents, debt and equity securities, bank loans and derivative instruments. The main purpose of bank loans is to finance working capital relating to importation of crude and petroleum products, as well as to partly fund capital expenditures. The Company has other financial assets and liabilities such as trade and other receivables and trade and other payables, which are generated directly from its operations. It is the Company’s policy not to enter into derivative transactions for speculative purposes. The Company uses hedging instruments to protect its margin on its products from potential price volatility of crude oil and products. It also enters into forward currency and option contracts to hedge its currency exposure on crude oil importations and long-term dollar loan, respectively. The main risks arising from the Company’s financial instruments are foreign currency risk, interest rate risk, credit risk, liquidity risk and commodity price risk. The BOD regularly reviews and approves the policies for managing these financial risks. Details of each of these risks are discussed below, together with the related risk management structure. Risk Management Structure The Company follows an enterprise-wide risk management framework for identifying, assessing and addressing the risk factors that affect or may affect its businesses. The Company’s risk management process is a bottom-up approach, with each risk owner mandated to conduct regular assessment of its risk profile and formulate action plans for managing identified risks. As the Company’s operation is an integrated value chain, risks emanate from every process, while some could cut across groups. The results of these activities flow up to the Management Committee and, eventually, to the BOD through the Company’s annual business planning process. Oversight and technical assistance is likewise provided by corporate units and committees with special duties. These groups and their functions are: a. The Risk and Insurance Management Group, which is mandated with the overall
coordination and development of the enterprise-wide risk management process. b. The Treasurers Department, which is in charge of foreign exchange hedging
transactions. c. The Transaction Management Unit of Controllers Department, which provides
backroom support for all hedging transactions. d. The Corporate Technical and Engineering Services Department, which oversees
strict adherence to safety and environmental mandates across all facilities. e. The Internal Audit Department, which has been tasked with the implementation
of a risk-based auditing. f. The Commodity Risk Management Department (CRMD), which sets new and
updates existing hedging policies by the BOD, provides the strategic targets and recommends corporate hedging strategy to the Commodity Risk Management Committee and Steering Committee.
- 78 -
g. PSTPL executes the hedging transactions involving crude and product imports on behalf of the Company.
The BOD also created separate positions and board-level entities with explicit authority and responsibility in managing and monitoring risks, as follows: a. The Audit Committee is responsible for overseeing the Senior Management in
establishing and maintaining an adequate, effective and efficient internal control framework. It ensures that systems and processes are designed to provide assurance in areas including reporting, monitoring compliance with laws, regulations and internal policies, efficiency and effectiveness of operations, and safeguarding of assets. The Internal Audit Department and the External Auditor directly report to the Audit Committee regarding the direction, scope and coordination of audit and any related activities.
b. The Risk Oversight Committee is responsible for the oversight of the enterprise
risk management system of the Company to ensure its functionality and effectiveness.
c. The Compliance Officer, who is a senior officer of the Company reports to the
BOD chairperson. Among other functions, he monitors compliance with the provisions and requirements of the Corporate Governance Manual and relevant laws and regulations and determines any possible violations and recommends corresponding penalties, subject to review and approval of the BOD. The Compliance Officer identifies and monitors compliance risk. Lastly, the Compliance Officer represents the Company before the SEC regarding matters involving compliance with the Corporate Governance Manual and other relevant rules and regulations of the SEC.
Foreign Currency Risk The Company’s functional currency is the Philippine peso, which is the denomination of the bulk of its revenues. The Company’s exposures to foreign currency risk arise mainly from US dollar-denominated sales as well as purchases principally of crude oil and petroleum products. As a result of this, the Company maintains a level of US dollar-denominated assets and liabilities during the year. Foreign exchange risk occurs due to differences in the levels of US dollar-denominated assets and liabilities. The Company pursues a policy of mitigating foreign currency risk by entering into hedging transactions or by substituting US dollar-denominated liabilities with peso-based debt. The natural hedge provided by US dollar-denominated assets is also factored in hedging decisions. As a matter of policy, currency hedging is limited to the extent of 100% of the underlying exposure. The Company is allowed to engage in active risk management strategies for a portion of its foreign currency risk exposure. Loss limits are in place, monitored daily and regularly reviewed by management.
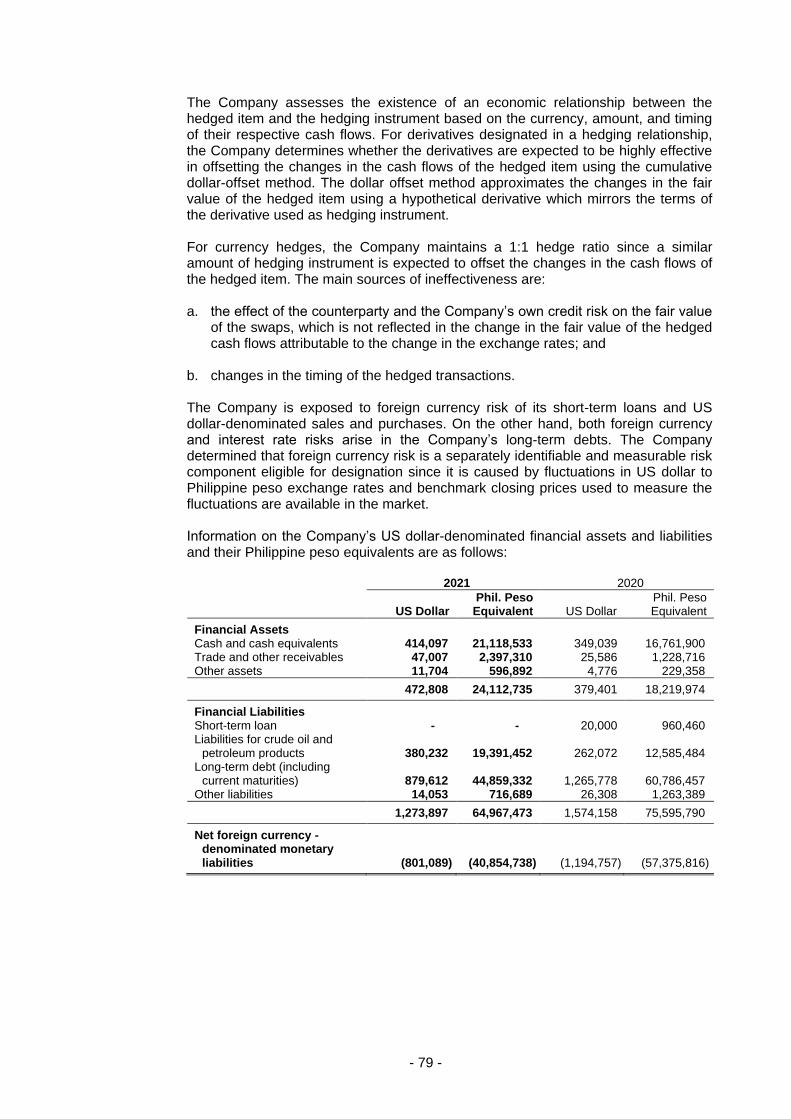
- 79 -
The Company assesses the existence of an economic relationship between the hedged item and the hedging instrument based on the currency, amount, and timing of their respective cash flows. For derivatives designated in a hedging relationship, the Company determines whether the derivatives are expected to be highly effective in offsetting the changes in the cash flows of the hedged item using the cumulative dollar-offset method. The dollar offset method approximates the changes in the fair value of the hedged item using a hypothetical derivative which mirrors the terms of the derivative used as hedging instrument. For currency hedges, the Company maintains a 1:1 hedge ratio since a similar amount of hedging instrument is expected to offset the changes in the cash flows of the hedged item. The main sources of ineffectiveness are: a. the effect of the counterparty and the Company’s own credit risk on the fair value
of the swaps, which is not reflected in the change in the fair value of the hedged cash flows attributable to the change in the exchange rates; and
b. changes in the timing of the hedged transactions. The Company is exposed to foreign currency risk of its short-term loans and US dollar-denominated sales and purchases. On the other hand, both foreign currency and interest rate risks arise in the Company’s long-term debts. The Company determined that foreign currency risk is a separately identifiable and measurable risk component eligible for designation since it is caused by fluctuations in US dollar to Philippine peso exchange rates and benchmark closing prices used to measure the fluctuations are available in the market. Information on the Company’s US dollar-denominated financial assets and liabilities and their Philippine peso equivalents are as follows:
2021 2020
US Dollar Phil. Peso Equivalent US Dollar
Phil. Peso Equivalent
Financial Assets Cash and cash equivalents 414,097 21,118,533 349,039 16,761,900 Trade and other receivables 47,007 2,397,310 25,586 1,228,716 Other assets 11,704 596,892 4,776 229,358
472,808 24,112,735 379,401 18,219,974
Financial Liabilities Short-term loan - - 20,000 960,460 Liabilities for crude oil and
petroleum products 380,232 19,391,452 262,072 12,585,484 Long-term debt (including
current maturities) 879,612 44,859,332 1,265,778 60,786,457 Other liabilities 14,053 716,689 26,308 1,263,389
1,273,897 64,967,473 1,574,158 75,595,790
Net foreign currency -denominated monetary liabilities (801,089) (40,854,738) (1,194,757) (57,375,816)
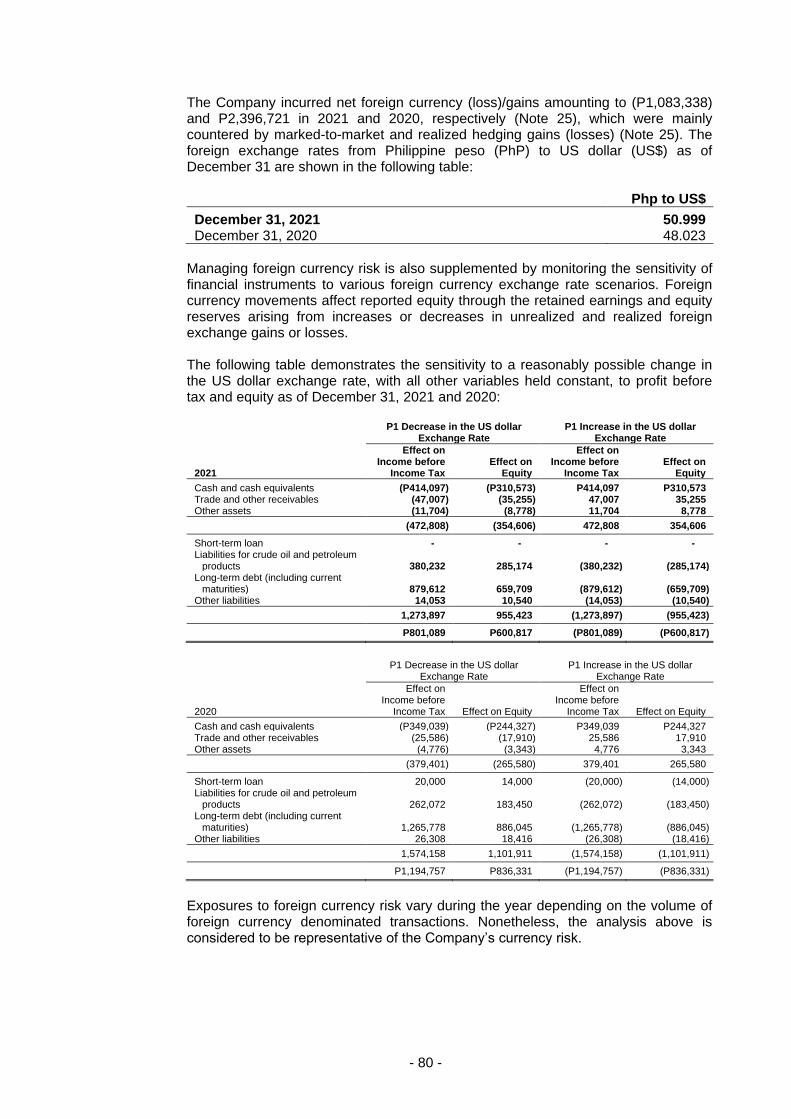
- 80 -
The Company incurred net foreign currency (loss)/gains amounting to (P1,083,338) and P2,396,721 in 2021 and 2020, respectively (Note 25), which were mainly countered by marked-to-market and realized hedging gains (losses) (Note 25). The foreign exchange rates from Philippine peso (PhP) to US dollar (US$) as of December 31 are shown in the following table: Php to US$
December 31, 2021 50.999 December 31, 2020 48.023
Managing foreign currency risk is also supplemented by monitoring the sensitivity of financial instruments to various foreign currency exchange rate scenarios. Foreign currency movements affect reported equity through the retained earnings and equity reserves arising from increases or decreases in unrealized and realized foreign exchange gains or losses. The following table demonstrates the sensitivity to a reasonably possible change in the US dollar exchange rate, with all other variables held constant, to profit before tax and equity as of December 31, 2021 and 2020:
P1 Decrease in the US dollar
Exchange Rate P1 Increase in the US dollar
Exchange Rate
2021
Effect on Income before
Income Tax Effect on
Equity
Effect on Income before
Income Tax Effect on
Equity
Cash and cash equivalents (P414,097) (P310,573) P414,097 P310,573 Trade and other receivables (47,007) (35,255) 47,007 35,255 Other assets (11,704) (8,778) 11,704 8,778
(472,808) (354,606) 472,808 354,606
Short-term loan - - - - Liabilities for crude oil and petroleum
products 380,232 285,174 (380,232) (285,174) Long-term debt (including current
maturities) 879,612 659,709 (879,612) (659,709) Other liabilities 14,053 10,540 (14,053) (10,540)
1,273,897 955,423 (1,273,897) (955,423)
P801,089 P600,817 (P801,089) (P600,817)
P1 Decrease in the US dollar
Exchange Rate P1 Increase in the US dollar
Exchange Rate
2020
Effect on Income before
Income Tax Effect on Equity
Effect on Income before
Income Tax Effect on Equity
Cash and cash equivalents (P349,039) (P244,327) P349,039 P244,327 Trade and other receivables (25,586) (17,910) 25,586 17,910 Other assets (4,776) (3,343) 4,776 3,343
(379,401) (265,580) 379,401 265,580
Short-term loan 20,000 14,000 (20,000) (14,000) Liabilities for crude oil and petroleum
products 262,072 183,450 (262,072) (183,450) Long-term debt (including current
maturities) 1,265,778 886,045 (1,265,778) (886,045) Other liabilities 26,308 18,416 (26,308) (18,416)
1,574,158 1,101,911 (1,574,158) (1,101,911)
P1,194,757 P836,331 (P1,194,757) (P836,331)
Exposures to foreign currency risk vary during the year depending on the volume of foreign currency denominated transactions. Nonetheless, the analysis above is considered to be representative of the Company’s currency risk.
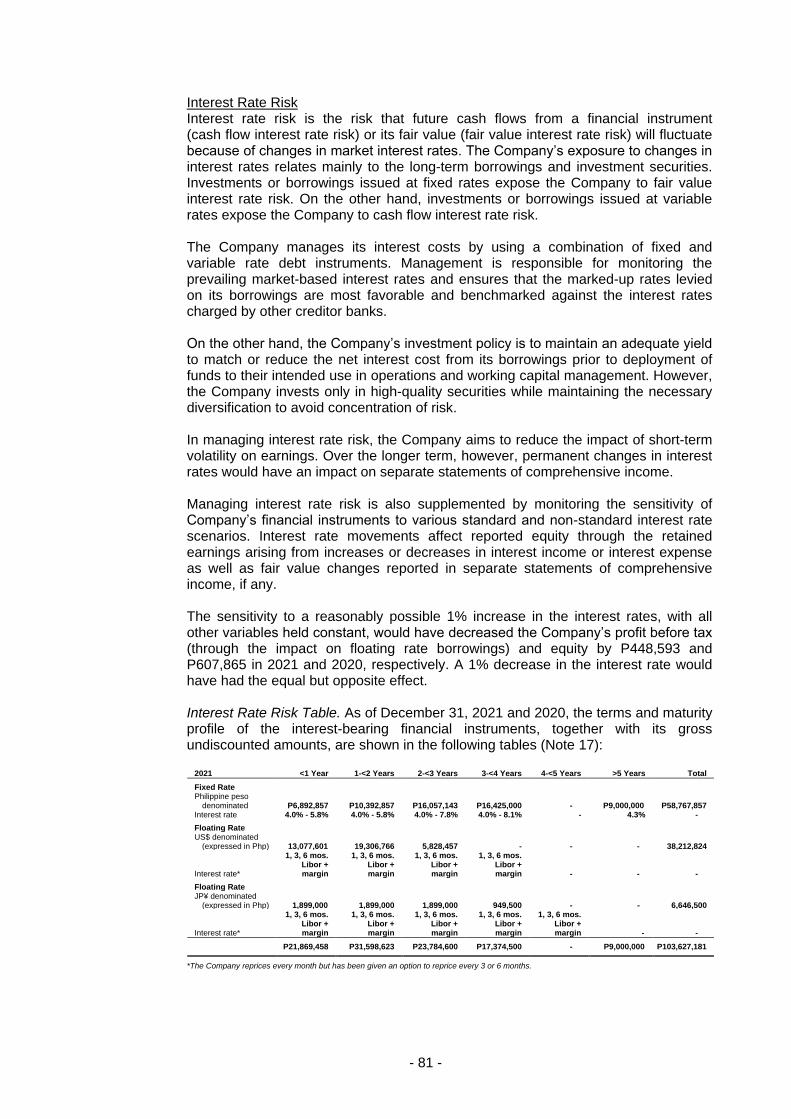
- 81 -
Interest Rate Risk Interest rate risk is the risk that future cash flows from a financial instrument (cash flow interest rate risk) or its fair value (fair value interest rate risk) will fluctuate because of changes in market interest rates. The Company’s exposure to changes in interest rates relates mainly to the long-term borrowings and investment securities. Investments or borrowings issued at fixed rates expose the Company to fair value interest rate risk. On the other hand, investments or borrowings issued at variable rates expose the Company to cash flow interest rate risk. The Company manages its interest costs by using a combination of fixed and variable rate debt instruments. Management is responsible for monitoring the prevailing market-based interest rates and ensures that the marked-up rates levied on its borrowings are most favorable and benchmarked against the interest rates charged by other creditor banks. On the other hand, the Company’s investment policy is to maintain an adequate yield to match or reduce the net interest cost from its borrowings prior to deployment of funds to their intended use in operations and working capital management. However, the Company invests only in high-quality securities while maintaining the necessary diversification to avoid concentration of risk. In managing interest rate risk, the Company aims to reduce the impact of short-term volatility on earnings. Over the longer term, however, permanent changes in interest rates would have an impact on separate statements of comprehensive income. Managing interest rate risk is also supplemented by monitoring the sensitivity of Company’s financial instruments to various standard and non-standard interest rate scenarios. Interest rate movements affect reported equity through the retained earnings arising from increases or decreases in interest income or interest expense as well as fair value changes reported in separate statements of comprehensive income, if any. The sensitivity to a reasonably possible 1% increase in the interest rates, with all other variables held constant, would have decreased the Company’s profit before tax (through the impact on floating rate borrowings) and equity by P448,593 and P607,865 in 2021 and 2020, respectively. A 1% decrease in the interest rate would have had the equal but opposite effect. Interest Rate Risk Table. As of December 31, 2021 and 2020, the terms and maturity profile of the interest-bearing financial instruments, together with its gross undiscounted amounts, are shown in the following tables (Note 17):
2021 <1 Year 1-<2 Years 2-<3 Years 3-<4 Years 4-<5 Years >5 Years Total
Fixed Rate Philippine peso
denominated P6,892,857 P10,392,857 P16,057,143 P16,425,000 - P9,000,000 P58,767,857 Interest rate 4.0% - 5.8% 4.0% - 5.8% 4.0% - 7.8% 4.0% - 8.1% - 4.3% -
Floating Rate US$ denominated
(expressed in Php) 13,077,601 19,306,766 5,828,457 - - - 38,212,824
Interest rate*
1, 3, 6 mos. Libor + margin
1, 3, 6 mos. Libor + margin
1, 3, 6 mos. Libor + margin
1, 3, 6 mos. Libor + margin - - -
Floating Rate JP¥ denominated
(expressed in Php) 1,899,000 1,899,000 1,899,000 949,500 - - 6,646,500
Interest rate*
1, 3, 6 mos. Libor + margin
1, 3, 6 mos. Libor + margin
1, 3, 6 mos. Libor + margin
1, 3, 6 mos. Libor + margin
1, 3, 6 mos. Libor + margin - -
P21,869,458 P31,598,623 P23,784,600 P17,374,500 - P9,000,000 P103,627,181
*The Company reprices every month but has been given an option to reprice every 3 or 6 months.
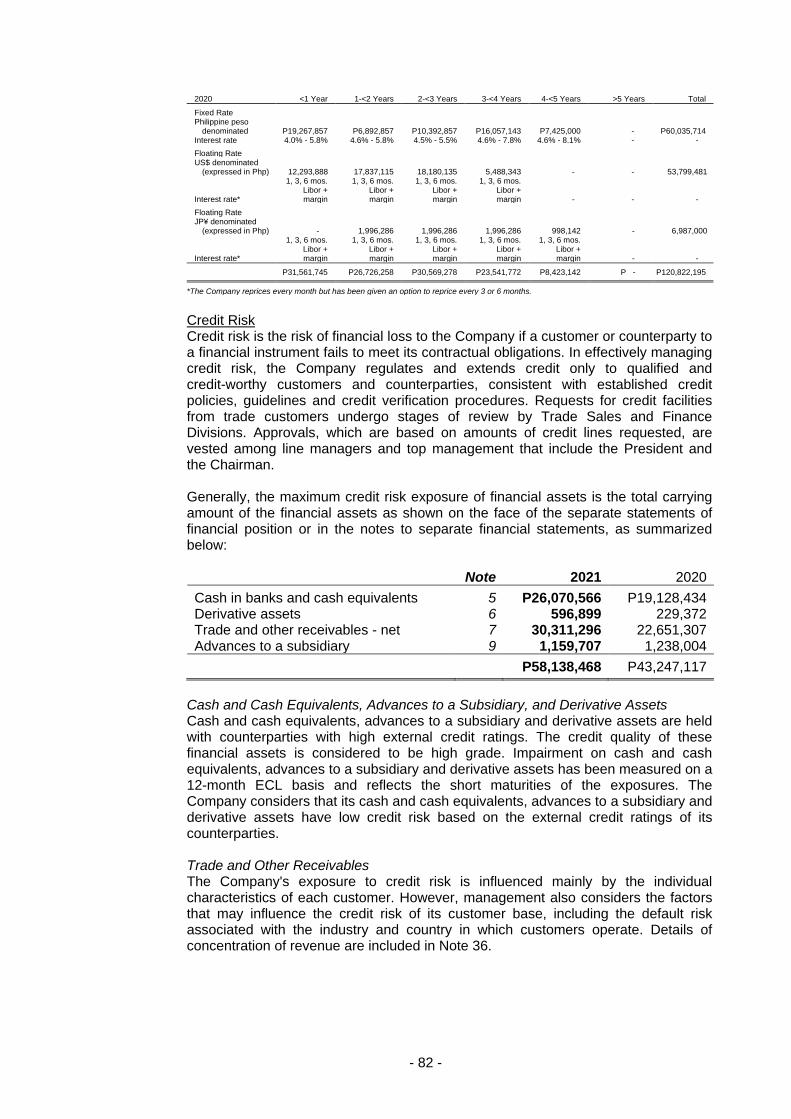
- 82 -
2020 <1 Year 1-<2 Years 2-<3 Years 3-<4 Years 4-<5 Years >5 Years Total
Fixed Rate Philippine peso
denominated P19,267,857 P6,892,857 P10,392,857 P16,057,143 P7,425,000 - P60,035,714 Interest rate 4.0% - 5.8% 4.6% - 5.8% 4.5% - 5.5% 4.6% - 7.8% 4.6% - 8.1% - -
Floating Rate US$ denominated
(expressed in Php) 12,293,888 17,837,115 18,180,135 5,488,343 - - 53,799,481
Interest rate*
1, 3, 6 mos. Libor + margin
1, 3, 6 mos. Libor + margin
1, 3, 6 mos. Libor + margin
1, 3, 6 mos. Libor + margin - - -
Floating Rate JP¥ denominated
(expressed in Php) - 1,996,286 1,996,286 1,996,286 998,142 - 6,987,000
Interest rate*
1, 3, 6 mos. Libor + margin
1, 3, 6 mos. Libor + margin
1, 3, 6 mos. Libor + margin
1, 3, 6 mos. Libor + margin
1, 3, 6 mos. Libor + margin - -
P31,561,745 P26,726,258 P30,569,278 P23,541,772 P8,423,142 P - P120,822,195
*The Company reprices every month but has been given an option to reprice every 3 or 6 months.
Credit Risk Credit risk is the risk of financial loss to the Company if a customer or counterparty to a financial instrument fails to meet its contractual obligations. In effectively managing credit risk, the Company regulates and extends credit only to qualified and credit-worthy customers and counterparties, consistent with established credit policies, guidelines and credit verification procedures. Requests for credit facilities from trade customers undergo stages of review by Trade Sales and Finance Divisions. Approvals, which are based on amounts of credit lines requested, are vested among line managers and top management that include the President and the Chairman. Generally, the maximum credit risk exposure of financial assets is the total carrying amount of the financial assets as shown on the face of the separate statements of financial position or in the notes to separate financial statements, as summarized below: Note 2021 2020
Cash in banks and cash equivalents 5 P26,070,566 P19,128,434 Derivative assets 6 596,899 229,372 Trade and other receivables - net 7 30,311,296 22,651,307 Advances to a subsidiary 9 1,159,707 1,238,004
P58,138,468 P43,247,117
Cash and Cash Equivalents, Advances to a Subsidiary, and Derivative Assets Cash and cash equivalents, advances to a subsidiary and derivative assets are held with counterparties with high external credit ratings. The credit quality of these financial assets is considered to be high grade. Impairment on cash and cash equivalents, advances to a subsidiary and derivative assets has been measured on a 12-month ECL basis and reflects the short maturities of the exposures. The Company considers that its cash and cash equivalents, advances to a subsidiary and derivative assets have low credit risk based on the external credit ratings of its counterparties. Trade and Other Receivables The Company's exposure to credit risk is influenced mainly by the individual characteristics of each customer. However, management also considers the factors that may influence the credit risk of its customer base, including the default risk associated with the industry and country in which customers operate. Details of concentration of revenue are included in Note 36.
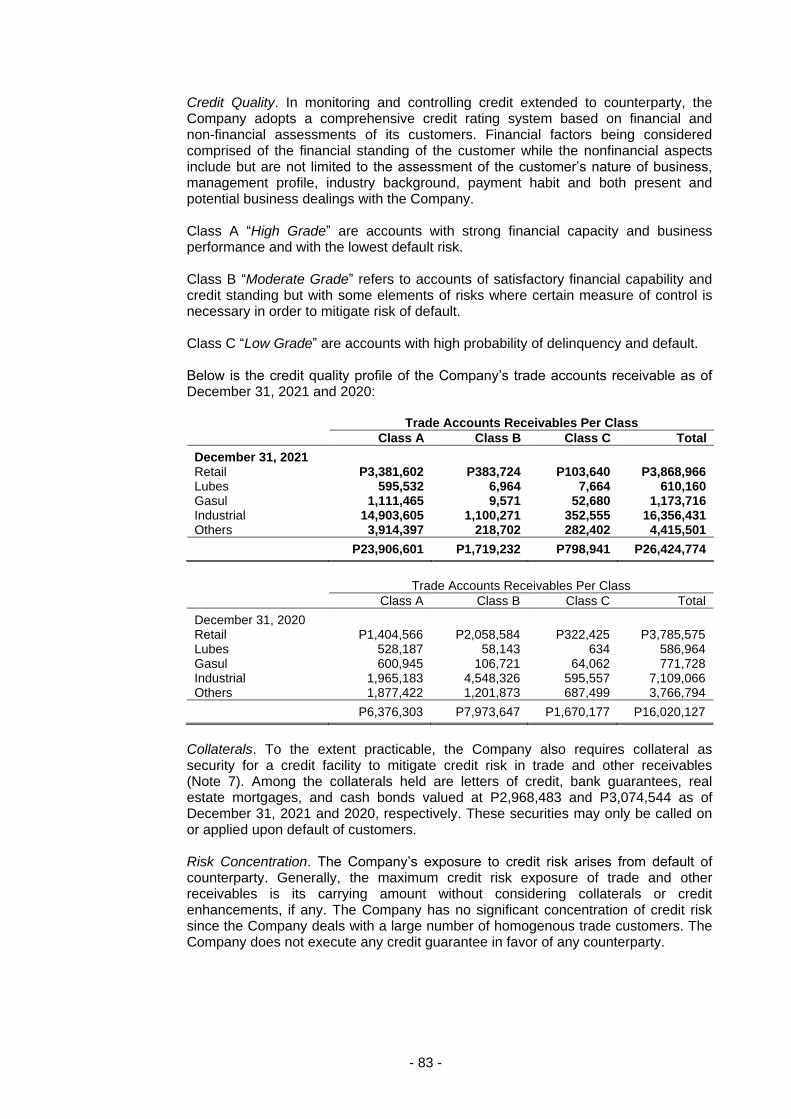
- 83 -
Credit Quality. In monitoring and controlling credit extended to counterparty, the Company adopts a comprehensive credit rating system based on financial and non-financial assessments of its customers. Financial factors being considered comprised of the financial standing of the customer while the nonfinancial aspects include but are not limited to the assessment of the customer’s nature of business, management profile, industry background, payment habit and both present and potential business dealings with the Company. Class A “High Grade” are accounts with strong financial capacity and business performance and with the lowest default risk. Class B “Moderate Grade” refers to accounts of satisfactory financial capability and credit standing but with some elements of risks where certain measure of control is necessary in order to mitigate risk of default. Class C “Low Grade” are accounts with high probability of delinquency and default. Below is the credit quality profile of the Company’s trade accounts receivable as of December 31, 2021 and 2020:
Trade Accounts Receivables Per Class
Class A Class B Class C Total
December 31, 2021 Retail P3,381,602 P383,724 P103,640 P3,868,966 Lubes 595,532 6,964 7,664 610,160 Gasul 1,111,465 9,571 52,680 1,173,716 Industrial 14,903,605 1,100,271 352,555 16,356,431 Others 3,914,397 218,702 282,402 4,415,501
P23,906,601 P1,719,232 P798,941 P26,424,774
Trade Accounts Receivables Per Class
Class A Class B Class C Total
December 31, 2020 Retail P1,404,566 P2,058,584 P322,425 P3,785,575 Lubes 528,187 58,143 634 586,964 Gasul 600,945 106,721 64,062 771,728 Industrial 1,965,183 4,548,326 595,557 7,109,066 Others 1,877,422 1,201,873 687,499 3,766,794
P6,376,303 P7,973,647 P1,670,177 P16,020,127
Collaterals. To the extent practicable, the Company also requires collateral as security for a credit facility to mitigate credit risk in trade and other receivables (Note 7). Among the collaterals held are letters of credit, bank guarantees, real estate mortgages, and cash bonds valued at P2,968,483 and P3,074,544 as of December 31, 2021 and 2020, respectively. These securities may only be called on or applied upon default of customers. Risk Concentration. The Company’s exposure to credit risk arises from default of counterparty. Generally, the maximum credit risk exposure of trade and other receivables is its carrying amount without considering collaterals or credit enhancements, if any. The Company has no significant concentration of credit risk since the Company deals with a large number of homogenous trade customers. The Company does not execute any credit guarantee in favor of any counterparty.
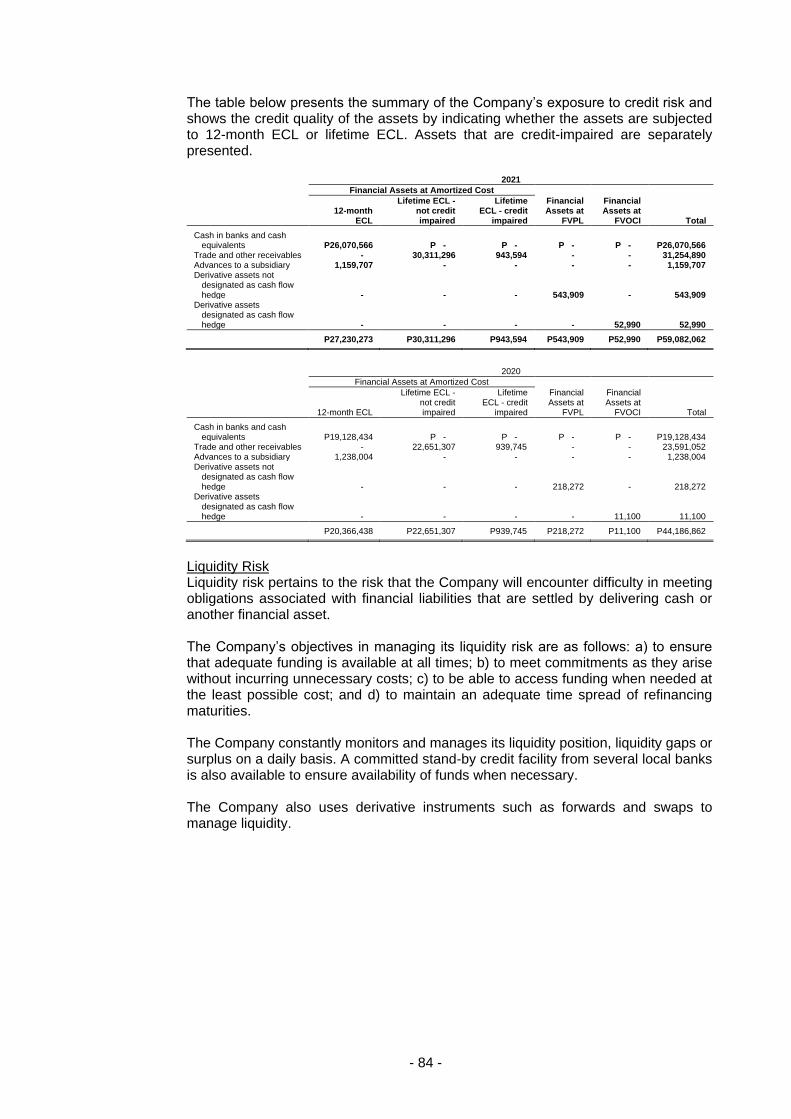
- 84 -
The table below presents the summary of the Company’s exposure to credit risk and shows the credit quality of the assets by indicating whether the assets are subjected to 12-month ECL or lifetime ECL. Assets that are credit-impaired are separately presented.
2021
Financial Assets at Amortized Cost
12-month
ECL
Lifetime ECL - not credit impaired
Lifetime ECL - credit
impaired
Financial Assets at
FVPL
Financial Assets at
FVOCI Total
Cash in banks and cash equivalents P26,070,566 P - P - P - P - P26,070,566
Trade and other receivables - 30,311,296 943,594 - - 31,254,890 Advances to a subsidiary 1,159,707 - - - - 1,159,707 Derivative assets not
designated as cash flow hedge - - - 543,909 - 543,909
Derivative assets designated as cash flow hedge - - - - 52,990 52,990
P27,230,273 P30,311,296 P943,594 P543,909 P52,990 P59,082,062
2020
Financial Assets at Amortized Cost
12-month ECL
Lifetime ECL - not credit impaired
Lifetime ECL - credit
impaired
Financial Assets at
FVPL
Financial Assets at
FVOCI Total
Cash in banks and cash equivalents P19,128,434 P - P - P - P - P19,128,434
Trade and other receivables - 22,651,307 939,745 - - 23,591,052 Advances to a subsidiary 1,238,004 - - - - 1,238,004 Derivative assets not
designated as cash flow hedge - - - 218,272 - 218,272
Derivative assets designated as cash flow hedge - - - - 11,100 11,100
P20,366,438 P22,651,307 P939,745 P218,272 P11,100 P44,186,862
Liquidity Risk Liquidity risk pertains to the risk that the Company will encounter difficulty in meeting obligations associated with financial liabilities that are settled by delivering cash or another financial asset. The Company’s objectives in managing its liquidity risk are as follows: a) to ensure that adequate funding is available at all times; b) to meet commitments as they arise without incurring unnecessary costs; c) to be able to access funding when needed at the least possible cost; and d) to maintain an adequate time spread of refinancing maturities. The Company constantly monitors and manages its liquidity position, liquidity gaps or surplus on a daily basis. A committed stand-by credit facility from several local banks is also available to ensure availability of funds when necessary. The Company also uses derivative instruments such as forwards and swaps to manage liquidity.
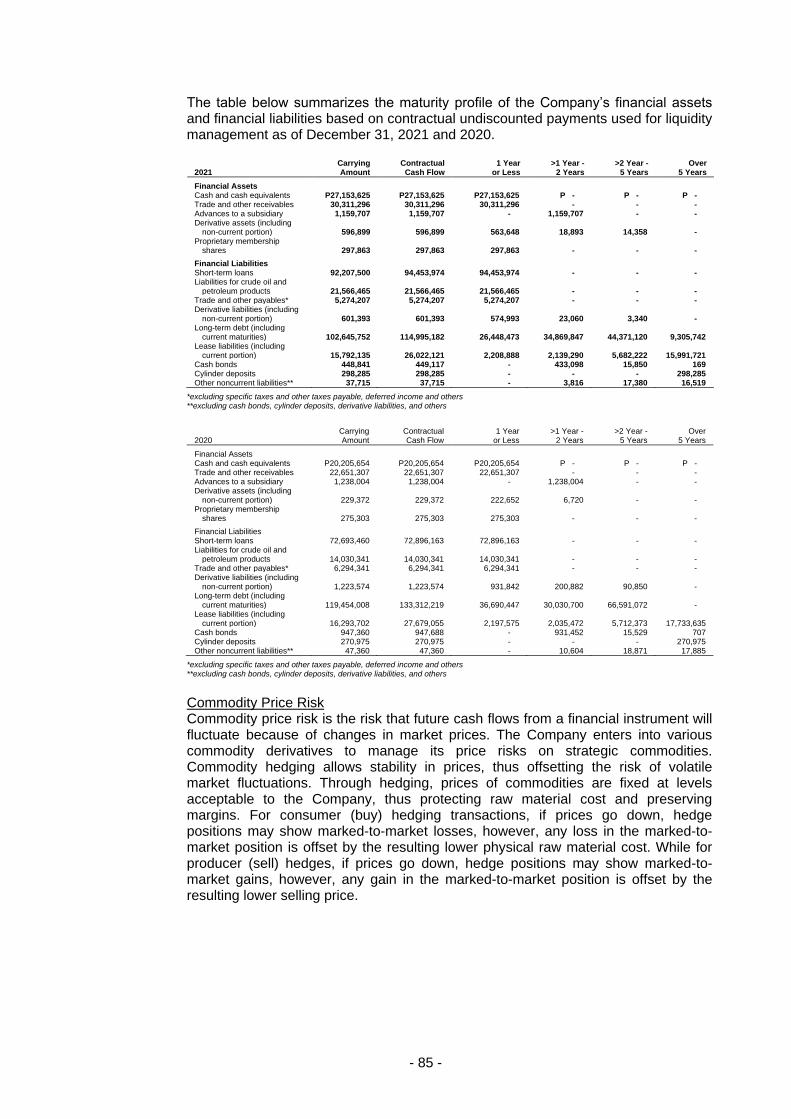
- 85 -
The table below summarizes the maturity profile of the Company’s financial assets and financial liabilities based on contractual undiscounted payments used for liquidity management as of December 31, 2021 and 2020.
2021 Carrying Amount
Contractual Cash Flow
1 Year or Less
>1 Year - 2 Years
>2 Year - 5 Years
Over 5 Years
Financial Assets Cash and cash equivalents P27,153,625 P27,153,625 P27,153,625 P - P - P - Trade and other receivables 30,311,296 30,311,296 30,311,296 - - - Advances to a subsidiary 1,159,707 1,159,707 - 1,159,707 - - Derivative assets (including
non-current portion) 596,899 596,899 563,648 18,893 14,358 - Proprietary membership
shares 297,863 297,863 297,863 - - -
Financial Liabilities Short-term loans 92,207,500 94,453,974 94,453,974 - - - Liabilities for crude oil and
petroleum products 21,566,465 21,566,465 21,566,465 - - - Trade and other payables* 5,274,207 5,274,207 5,274,207 - - - Derivative liabilities (including
non-current portion) 601,393 601,393 574,993 23,060 3,340 - Long-term debt (including
current maturities) 102,645,752 114,995,182 26,448,473 34,869,847 44,371,120 9,305,742 Lease liabilities (including
current portion) 15,792,135 26,022,121 2,208,888 2,139,290 5,682,222 15,991,721 Cash bonds 448,841 449,117 - 433,098 15,850 169 Cylinder deposits 298,285 298,285 - - - 298,285 Other noncurrent liabilities** 37,715 37,715 - 3,816 17,380 16,519
*excluding specific taxes and other taxes payable, deferred income and others **excluding cash bonds, cylinder deposits, derivative liabilities, and others
2020 Carrying Amount
Contractual Cash Flow
1 Year or Less
>1 Year - 2 Years
>2 Year - 5 Years
Over 5 Years
Financial Assets Cash and cash equivalents P20,205,654 P20,205,654 P20,205,654 P - P - P - Trade and other receivables 22,651,307 22,651,307 22,651,307 - - - Advances to a subsidiary 1,238,004 1,238,004 - 1,238,004 - - Derivative assets (including
non-current portion) 229,372 229,372 222,652 6,720 - - Proprietary membership
shares 275,303 275,303 275,303 - - -
Financial Liabilities Short-term loans 72,693,460 72,896,163 72,896,163 - - - Liabilities for crude oil and
petroleum products 14,030,341 14,030,341 14,030,341 - - - Trade and other payables* 6,294,341 6,294,341 6,294,341 - - - Derivative liabilities (including
non-current portion) 1,223,574 1,223,574 931,842 200,882 90,850 - Long-term debt (including
current maturities) 119,454,008 133,312,219 36,690,447 30,030,700 66,591,072 - Lease liabilities (including
current portion) 16,293,702 27,679,055 2,197,575 2,035,472 5,712,373 17,733,635 Cash bonds 947,360 947,688 - 931,452 15,529 707 Cylinder deposits 270,975 270,975 - - - 270,975 Other noncurrent liabilities** 47,360 47,360 - 10,604 18,871 17,885
*excluding specific taxes and other taxes payable, deferred income and others **excluding cash bonds, cylinder deposits, derivative liabilities, and others
Commodity Price Risk Commodity price risk is the risk that future cash flows from a financial instrument will fluctuate because of changes in market prices. The Company enters into various commodity derivatives to manage its price risks on strategic commodities. Commodity hedging allows stability in prices, thus offsetting the risk of volatile market fluctuations. Through hedging, prices of commodities are fixed at levels acceptable to the Company, thus protecting raw material cost and preserving margins. For consumer (buy) hedging transactions, if prices go down, hedge positions may show marked-to-market losses, however, any loss in the marked-to-market position is offset by the resulting lower physical raw material cost. While for producer (sell) hedges, if prices go down, hedge positions may show marked-to-market gains, however, any gain in the marked-to-market position is offset by the resulting lower selling price.
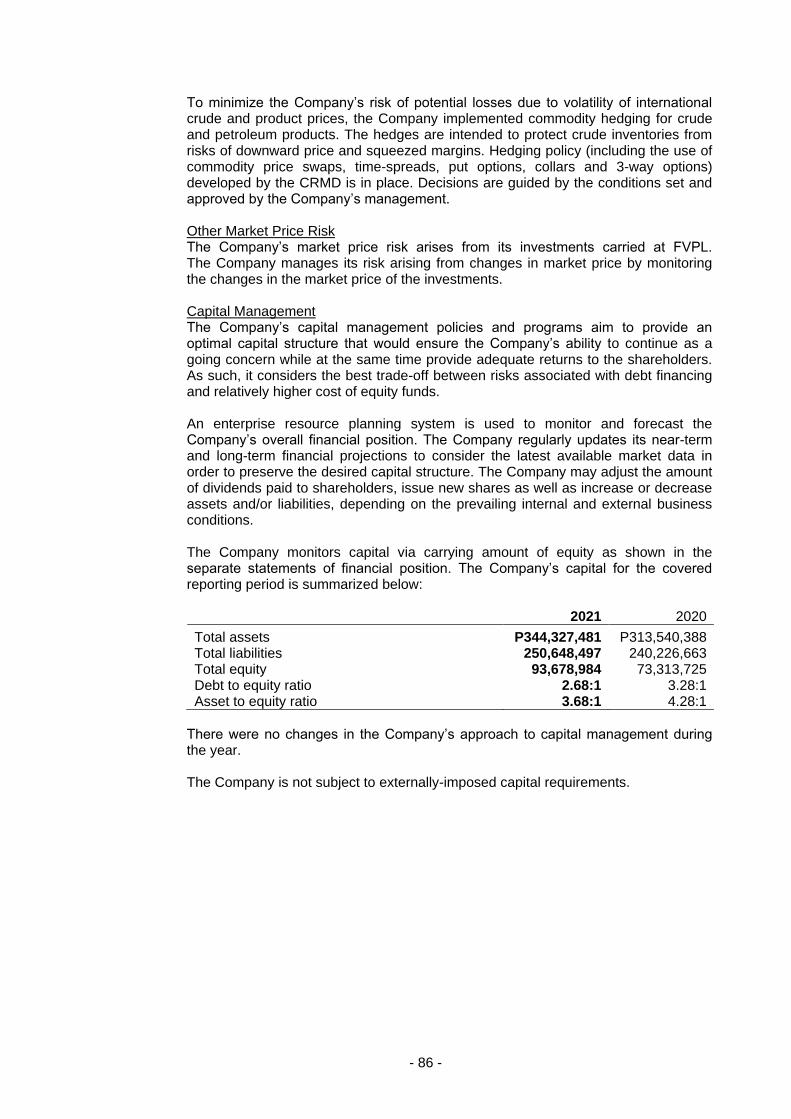
- 86 -
To minimize the Company’s risk of potential losses due to volatility of international crude and product prices, the Company implemented commodity hedging for crude and petroleum products. The hedges are intended to protect crude inventories from risks of downward price and squeezed margins. Hedging policy (including the use of commodity price swaps, time-spreads, put options, collars and 3-way options) developed by the CRMD is in place. Decisions are guided by the conditions set and approved by the Company’s management. Other Market Price Risk The Company’s market price risk arises from its investments carried at FVPL. The Company manages its risk arising from changes in market price by monitoring the changes in the market price of the investments. Capital Management The Company’s capital management policies and programs aim to provide an optimal capital structure that would ensure the Company’s ability to continue as a going concern while at the same time provide adequate returns to the shareholders. As such, it considers the best trade-off between risks associated with debt financing and relatively higher cost of equity funds. An enterprise resource planning system is used to monitor and forecast the Company’s overall financial position. The Company regularly updates its near-term and long-term financial projections to consider the latest available market data in order to preserve the desired capital structure. The Company may adjust the amount of dividends paid to shareholders, issue new shares as well as increase or decrease assets and/or liabilities, depending on the prevailing internal and external business conditions. The Company monitors capital via carrying amount of equity as shown in the separate statements of financial position. The Company’s capital for the covered reporting period is summarized below: 2021 2020
Total assets P344,327,481 P313,540,388 Total liabilities 250,648,497 240,226,663 Total equity 93,678,984 73,313,725 Debt to equity ratio 2.68:1 3.28:1 Asset to equity ratio 3.68:1 4.28:1
There were no changes in the Company’s approach to capital management during the year. The Company is not subject to externally-imposed capital requirements.
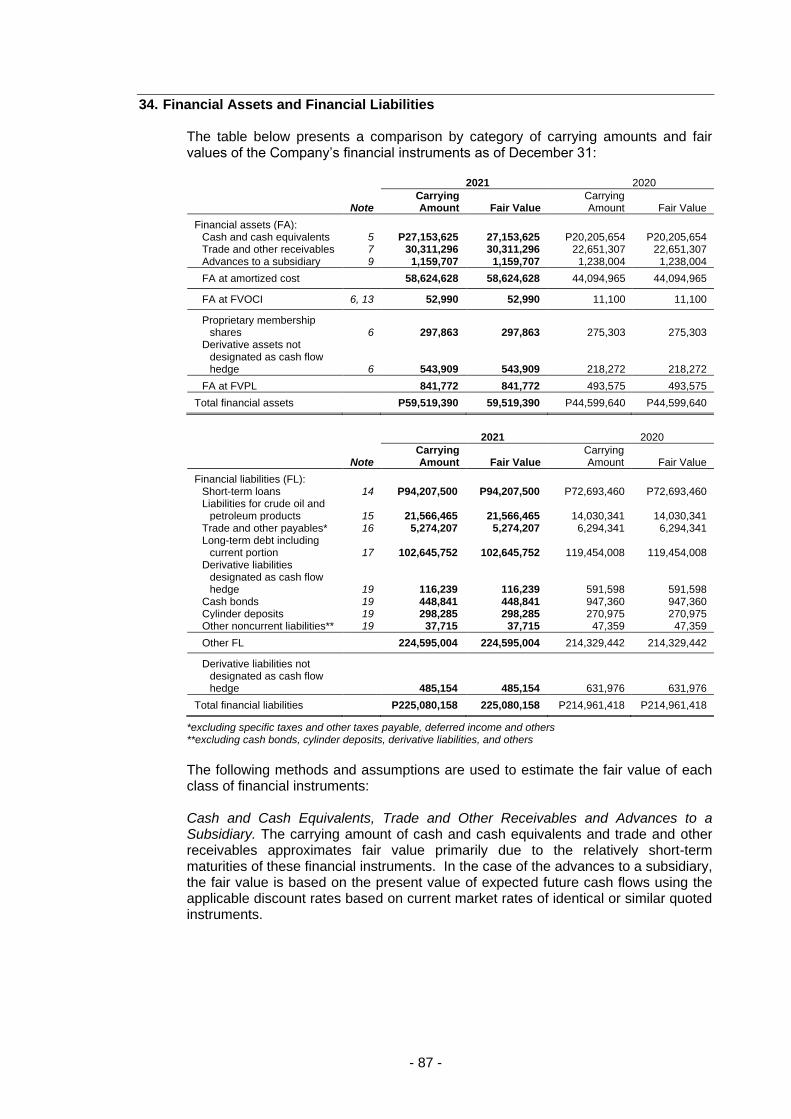
- 87 -
34. Financial Assets and Financial Liabilities The table below presents a comparison by category of carrying amounts and fair values of the Company’s financial instruments as of December 31:
2021 2020
Note Carrying Amount Fair Value
Carrying Amount Fair Value
Financial assets (FA): Cash and cash equivalents 5 P27,153,625 27,153,625 P20,205,654 P20,205,654 Trade and other receivables 7 30,311,296 30,311,296 22,651,307 22,651,307 Advances to a subsidiary 9 1,159,707 1,159,707 1,238,004 1,238,004
FA at amortized cost 58,624,628 58,624,628 44,094,965 44,094,965
FA at FVOCI 6, 13 52,990 52,990 11,100 11,100
Proprietary membership shares 6 297,863 297,863 275,303 275,303
Derivative assets not designated as cash flow hedge 6 543,909 543,909 218,272 218,272
FA at FVPL 841,772 841,772 493,575 493,575
Total financial assets P59,519,390 59,519,390 P44,599,640 P44,599,640
2021 2020
Note Carrying Amount Fair Value
Carrying Amount Fair Value
Financial liabilities (FL): Short-term loans 14 P94,207,500 P94,207,500 P72,693,460 P72,693,460 Liabilities for crude oil and
petroleum products 15 21,566,465 21,566,465 14,030,341 14,030,341 Trade and other payables* 16 5,274,207 5,274,207 6,294,341 6,294,341 Long-term debt including
current portion 17 102,645,752 102,645,752 119,454,008 119,454,008 Derivative liabilities
designated as cash flow hedge 19 116,239 116,239 591,598 591,598
Cash bonds 19 448,841 448,841 947,360 947,360 Cylinder deposits 19 298,285 298,285 270,975 270,975 Other noncurrent liabilities** 19 37,715 37,715 47,359 47,359
Other FL 224,595,004 224,595,004 214,329,442 214,329,442
Derivative liabilities not designated as cash flow hedge 485,154 485,154 631,976 631,976
Total financial liabilities P225,080,158 225,080,158 P214,961,418 P214,961,418
*excluding specific taxes and other taxes payable, deferred income and others **excluding cash bonds, cylinder deposits, derivative liabilities, and others
The following methods and assumptions are used to estimate the fair value of each class of financial instruments: Cash and Cash Equivalents, Trade and Other Receivables and Advances to a Subsidiary. The carrying amount of cash and cash equivalents and trade and other receivables approximates fair value primarily due to the relatively short-term maturities of these financial instruments. In the case of the advances to a subsidiary, the fair value is based on the present value of expected future cash flows using the applicable discount rates based on current market rates of identical or similar quoted instruments.
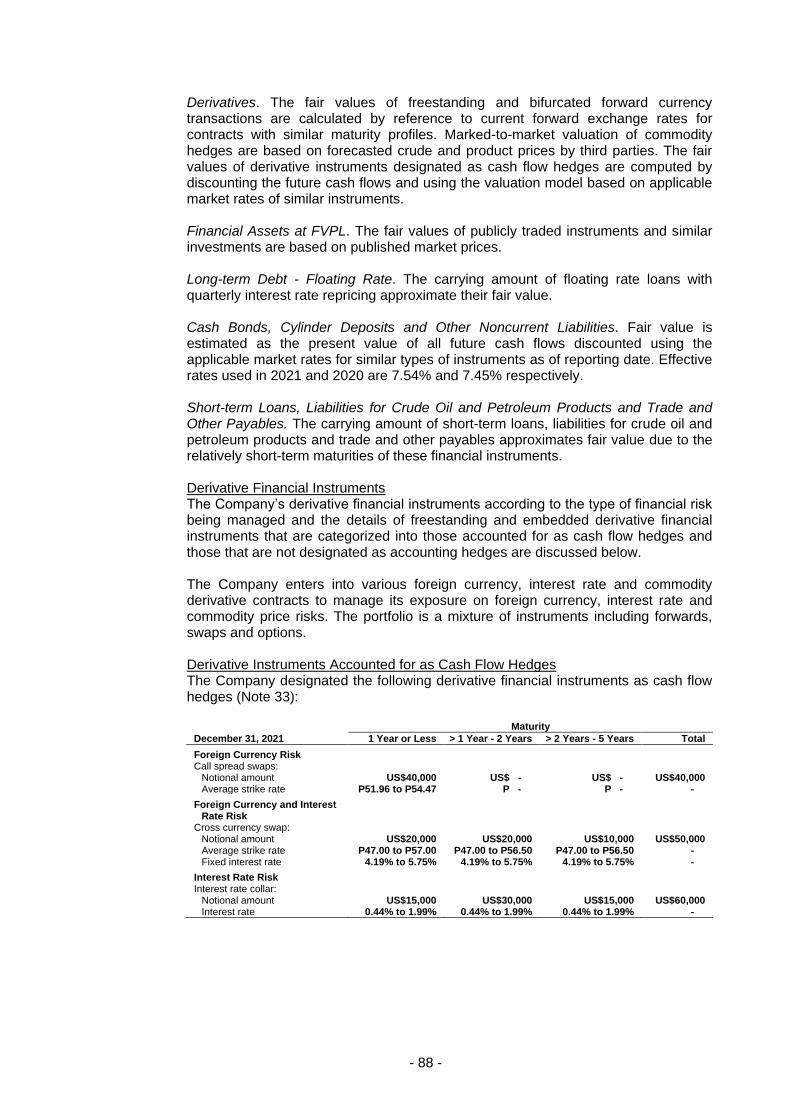
- 88 -
Derivatives. The fair values of freestanding and bifurcated forward currency transactions are calculated by reference to current forward exchange rates for contracts with similar maturity profiles. Marked-to-market valuation of commodity hedges are based on forecasted crude and product prices by third parties. The fair values of derivative instruments designated as cash flow hedges are computed by discounting the future cash flows and using the valuation model based on applicable market rates of similar instruments. Financial Assets at FVPL. The fair values of publicly traded instruments and similar investments are based on published market prices. Long-term Debt - Floating Rate. The carrying amount of floating rate loans with quarterly interest rate repricing approximate their fair value. Cash Bonds, Cylinder Deposits and Other Noncurrent Liabilities. Fair value is estimated as the present value of all future cash flows discounted using the applicable market rates for similar types of instruments as of reporting date. Effective rates used in 2021 and 2020 are 7.54% and 7.45% respectively. Short-term Loans, Liabilities for Crude Oil and Petroleum Products and Trade and Other Payables. The carrying amount of short-term loans, liabilities for crude oil and petroleum products and trade and other payables approximates fair value due to the relatively short-term maturities of these financial instruments. Derivative Financial Instruments The Company’s derivative financial instruments according to the type of financial risk being managed and the details of freestanding and embedded derivative financial instruments that are categorized into those accounted for as cash flow hedges and those that are not designated as accounting hedges are discussed below. The Company enters into various foreign currency, interest rate and commodity derivative contracts to manage its exposure on foreign currency, interest rate and commodity price risks. The portfolio is a mixture of instruments including forwards, swaps and options. Derivative Instruments Accounted for as Cash Flow Hedges The Company designated the following derivative financial instruments as cash flow hedges (Note 33):
Maturity
December 31, 2021 1 Year or Less > 1 Year - 2 Years > 2 Years - 5 Years Total
Foreign Currency Risk Call spread swaps:
Notional amount US$40,000 US$ - US$ - US$40,000 Average strike rate P51.96 to P54.47 P - P - -
Foreign Currency and Interest Rate Risk
Cross currency swap: Notional amount US$20,000 US$20,000 US$10,000 US$50,000 Average strike rate P47.00 to P57.00 P47.00 to P56.50 P47.00 to P56.50 - Fixed interest rate 4.19% to 5.75% 4.19% to 5.75% 4.19% to 5.75% -
Interest Rate Risk Interest rate collar:
Notional amount US$15,000 US$30,000 US$15,000 US$60,000 Interest rate 0.44% to 1.99% 0.44% to 1.99% 0.44% to 1.99% -
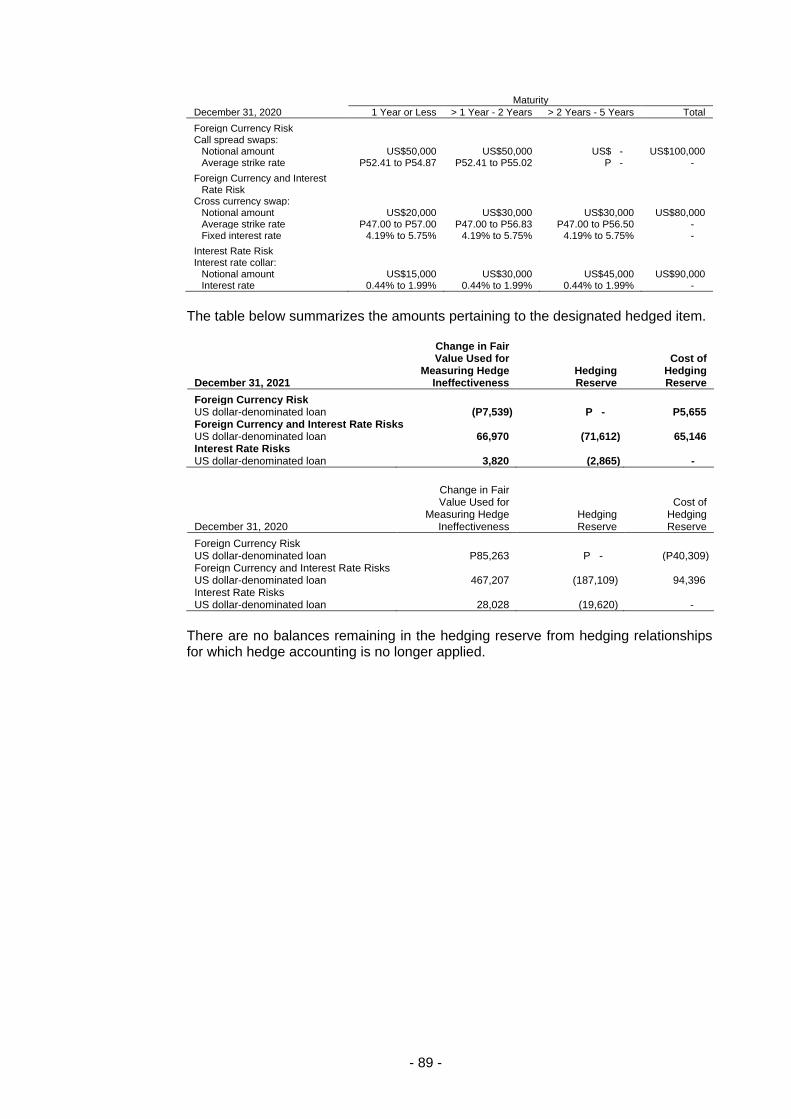
- 89 -
Maturity
December 31, 2020 1 Year or Less > 1 Year - 2 Years > 2 Years - 5 Years Total
Foreign Currency Risk Call spread swaps:
Notional amount US$50,000 US$50,000 US$ - US$100,000 Average strike rate P52.41 to P54.87 P52.41 to P55.02 P - -
Foreign Currency and Interest Rate Risk
Cross currency swap: Notional amount US$20,000 US$30,000 US$30,000 US$80,000 Average strike rate P47.00 to P57.00 P47.00 to P56.83 P47.00 to P56.50 - Fixed interest rate 4.19% to 5.75% 4.19% to 5.75% 4.19% to 5.75% -
Interest Rate Risk Interest rate collar:
Notional amount US$15,000 US$30,000 US$45,000 US$90,000 Interest rate 0.44% to 1.99% 0.44% to 1.99% 0.44% to 1.99% -
The table below summarizes the amounts pertaining to the designated hedged item.
December 31, 2021
Change in Fair Value Used for
Measuring Hedge Ineffectiveness
Hedging Reserve
Cost of Hedging Reserve
Foreign Currency Risk US dollar-denominated loan (P7,539) P - P5,655 Foreign Currency and Interest Rate Risks US dollar-denominated loan 66,970 (71,612) 65,146 Interest Rate Risks US dollar-denominated loan 3,820 (2,865) -
December 31, 2020
Change in Fair Value Used for
Measuring Hedge Ineffectiveness
Hedging Reserve
Cost of Hedging Reserve
Foreign Currency Risk US dollar-denominated loan P85,263 P - (P40,309) Foreign Currency and Interest Rate Risks US dollar-denominated loan 467,207 (187,109) 94,396 Interest Rate Risks US dollar-denominated loan 28,028 (19,620) -
There are no balances remaining in the hedging reserve from hedging relationships for which hedge accounting is no longer applied.
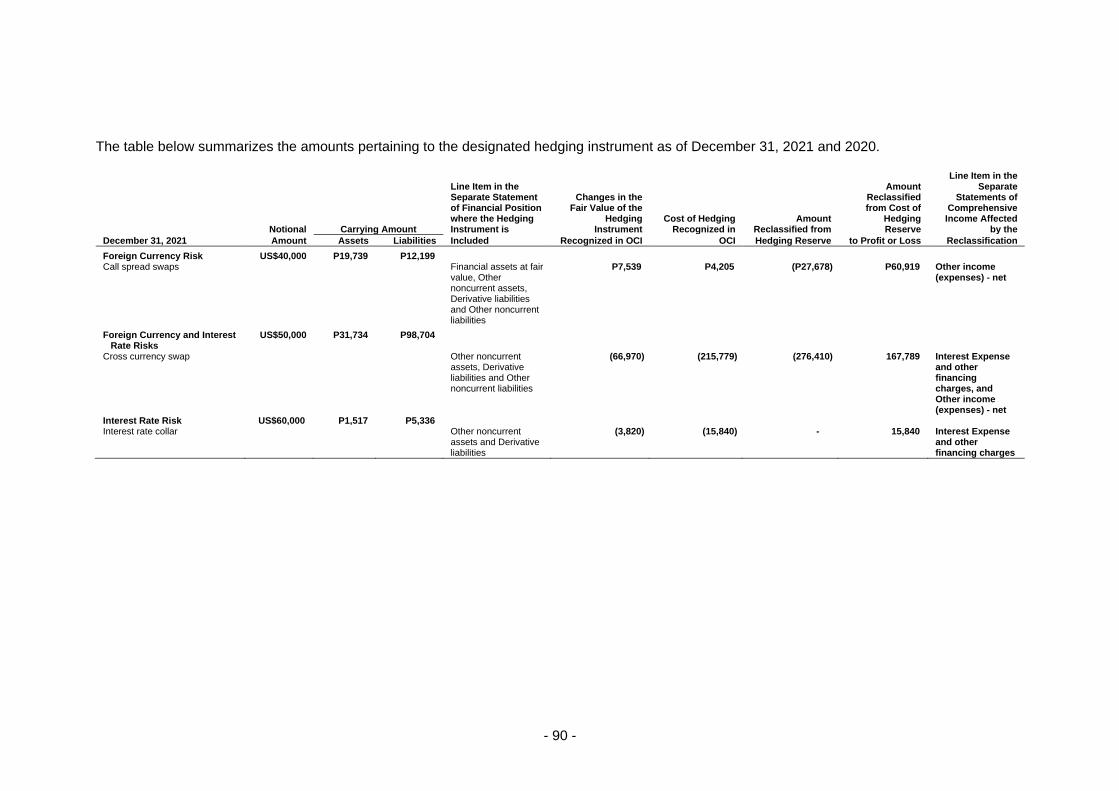
- 90 -
The table below summarizes the amounts pertaining to the designated hedging instrument as of December 31, 2021 and 2020.
Notional Carrying Amount
Line Item in the Separate Statement of Financial Position where the Hedging Instrument is
Changes in the Fair Value of the
Hedging Instrument
Cost of Hedging Recognized in
Amount Reclassified from
Amount Reclassified from Cost of
Hedging Reserve
Line Item in the Separate
Statements of Comprehensive Income Affected
by the
December 31, 2021 Amount Assets Liabilities Included Recognized in OCI OCI Hedging Reserve to Profit or Loss Reclassification
Foreign Currency Risk US$40,000 P19,739 P12,199 Call spread swaps Financial assets at fair
value, Other noncurrent assets, Derivative liabilities and Other noncurrent liabilities
P7,539 P4,205 (P27,678) P60,919 Other income (expenses) - net
Foreign Currency and Interest Rate Risks
US$50,000 P31,734 P98,704
Cross currency swap Other noncurrent assets, Derivative liabilities and Other noncurrent liabilities
(66,970) (215,779) (276,410) 167,789 Interest Expense and other financing charges, and Other income (expenses) - net
Interest Rate Risk US$60,000 P1,517 P5,336 Interest rate collar Other noncurrent
assets and Derivative liabilities
(3,820) (15,840) - 15,840 Interest Expense and other financing charges
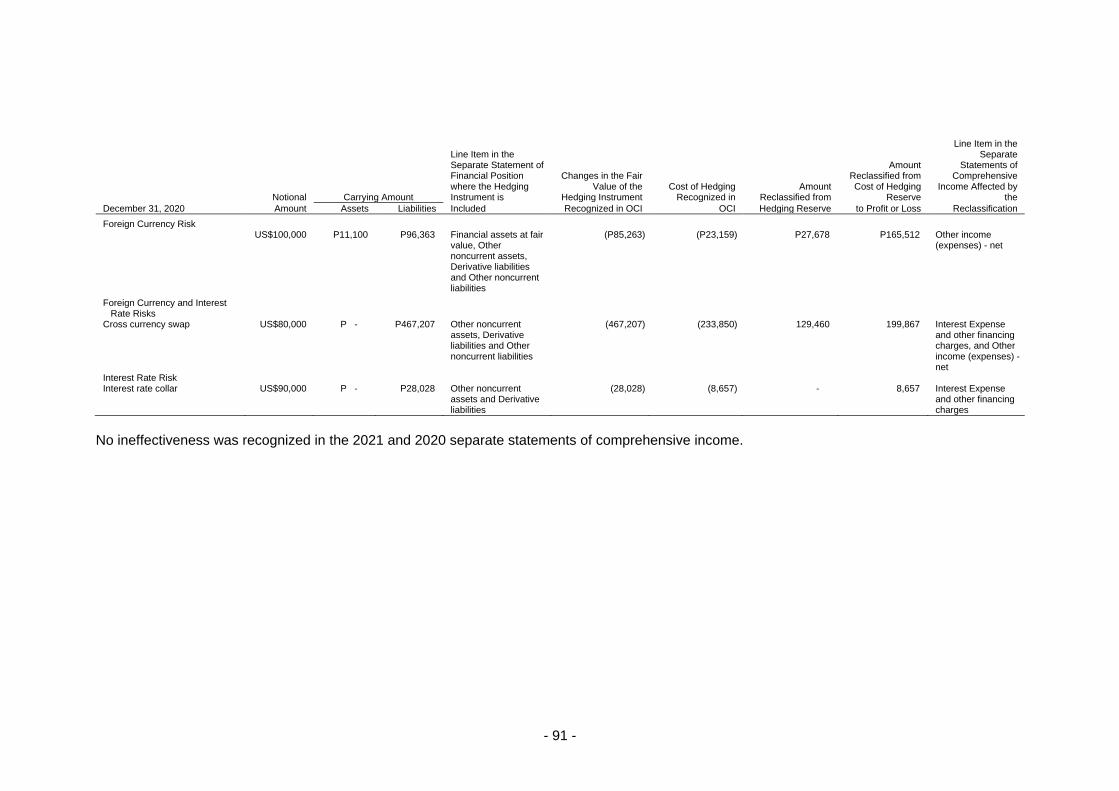
- 91 -
Notional Carrying Amount
Line Item in the Separate Statement of Financial Position where the Hedging Instrument is
Changes in the Fair Value of the
Hedging Instrument Cost of Hedging
Recognized in Amount
Reclassified from
Amount Reclassified from Cost of Hedging
Reserve
Line Item in the Separate
Statements of Comprehensive
Income Affected by the
December 31, 2020 Amount Assets Liabilities Included Recognized in OCI OCI Hedging Reserve to Profit or Loss Reclassification
Foreign Currency Risk US$100,000 P11,100 P96,363 Financial assets at fair
value, Other noncurrent assets, Derivative liabilities and Other noncurrent liabilities
(P85,263) (P23,159) P27,678 P165,512 Other income (expenses) - net
Foreign Currency and Interest Rate Risks
Cross currency swap US$80,000 P - P467,207 Other noncurrent assets, Derivative liabilities and Other noncurrent liabilities
(467,207) (233,850) 129,460 199,867 Interest Expense and other financing charges, and Other income (expenses) - net
Interest Rate Risk Interest rate collar US$90,000 P - P28,028 Other noncurrent
assets and Derivative liabilities
(28,028) (8,657) - 8,657 Interest Expense and other financing charges
No ineffectiveness was recognized in the 2021 and 2020 separate statements of comprehensive income.
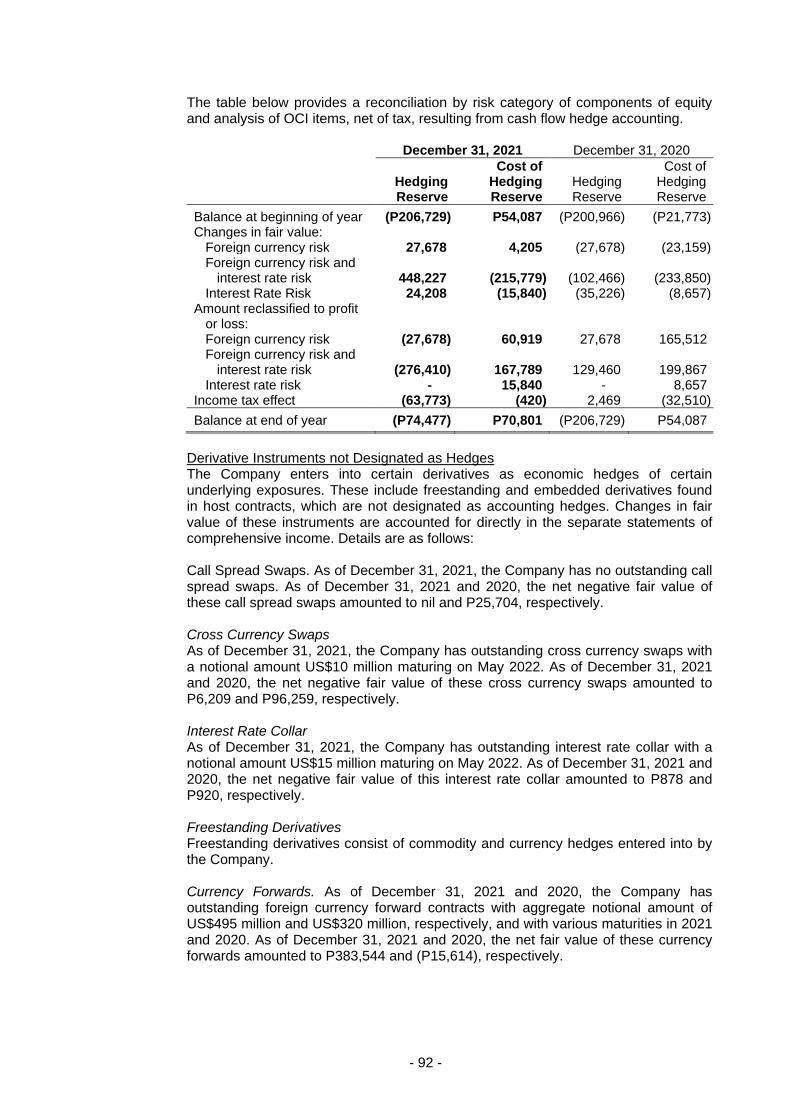
- 92 -
The table below provides a reconciliation by risk category of components of equity and analysis of OCI items, net of tax, resulting from cash flow hedge accounting. December 31, 2021 December 31, 2020
Hedging Reserve
Cost of Hedging Reserve
Hedging Reserve
Cost of Hedging Reserve
Balance at beginning of year (P206,729) P54,087 (P200,966) (P21,773) Changes in fair value:
Foreign currency risk 27,678 4,205 (27,678) (23,159) Foreign currency risk and
interest rate risk 448,227 (215,779) (102,466) (233,850) Interest Rate Risk 24,208 (15,840) (35,226) (8,657)
Amount reclassified to profit or loss: Foreign currency risk (27,678) 60,919 27,678 165,512 Foreign currency risk and
interest rate risk (276,410) 167,789 129,460 199,867 Interest rate risk - 15,840 - 8,657
Income tax effect (63,773) (420) 2,469 (32,510)
Balance at end of year (P74,477) P70,801 (P206,729) P54,087
Derivative Instruments not Designated as Hedges The Company enters into certain derivatives as economic hedges of certain underlying exposures. These include freestanding and embedded derivatives found in host contracts, which are not designated as accounting hedges. Changes in fair value of these instruments are accounted for directly in the separate statements of comprehensive income. Details are as follows: Call Spread Swaps. As of December 31, 2021, the Company has no outstanding call spread swaps. As of December 31, 2021 and 2020, the net negative fair value of these call spread swaps amounted to nil and P25,704, respectively. Cross Currency Swaps As of December 31, 2021, the Company has outstanding cross currency swaps with a notional amount US$10 million maturing on May 2022. As of December 31, 2021 and 2020, the net negative fair value of these cross currency swaps amounted to P6,209 and P96,259, respectively. Interest Rate Collar As of December 31, 2021, the Company has outstanding interest rate collar with a notional amount US$15 million maturing on May 2022. As of December 31, 2021 and 2020, the net negative fair value of this interest rate collar amounted to P878 and P920, respectively. Freestanding Derivatives Freestanding derivatives consist of commodity and currency hedges entered into by the Company. Currency Forwards. As of December 31, 2021 and 2020, the Company has outstanding foreign currency forward contracts with aggregate notional amount of US$495 million and US$320 million, respectively, and with various maturities in 2021 and 2020. As of December 31, 2021 and 2020, the net fair value of these currency forwards amounted to P383,544 and (P15,614), respectively.
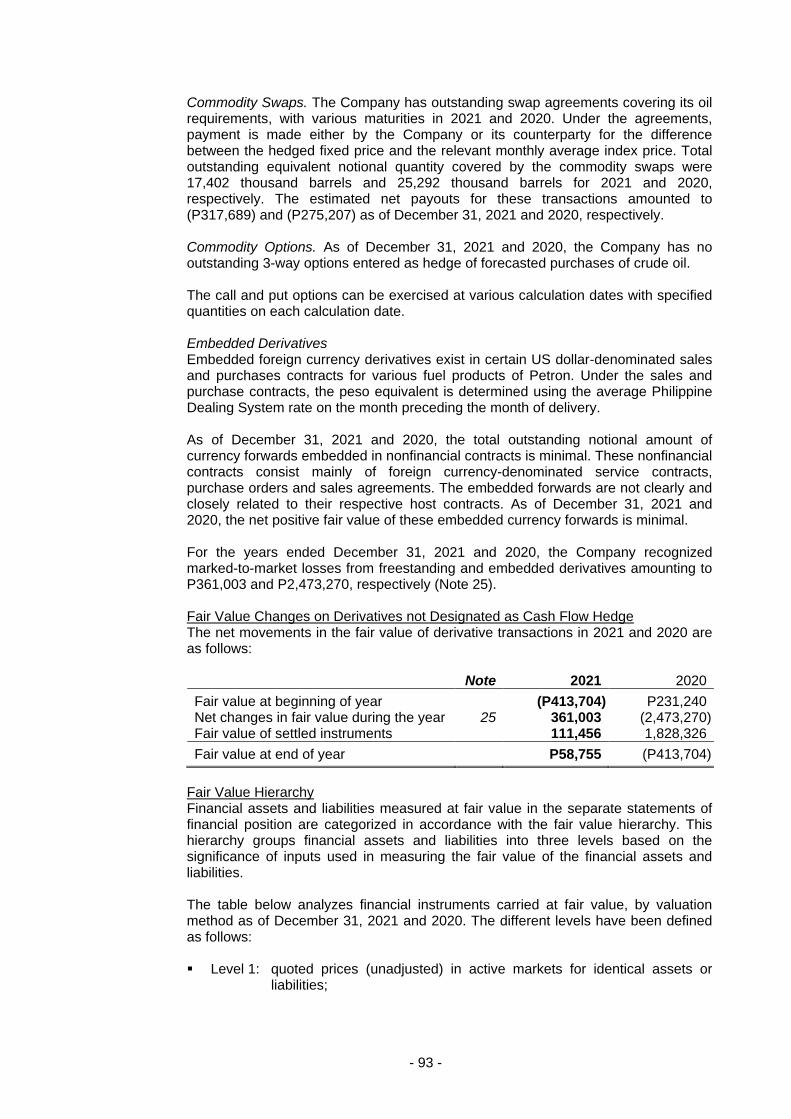
- 93 -
Commodity Swaps. The Company has outstanding swap agreements covering its oil requirements, with various maturities in 2021 and 2020. Under the agreements, payment is made either by the Company or its counterparty for the difference between the hedged fixed price and the relevant monthly average index price. Total outstanding equivalent notional quantity covered by the commodity swaps were 17,402 thousand barrels and 25,292 thousand barrels for 2021 and 2020, respectively. The estimated net payouts for these transactions amounted to (P317,689) and (P275,207) as of December 31, 2021 and 2020, respectively. Commodity Options. As of December 31, 2021 and 2020, the Company has no outstanding 3-way options entered as hedge of forecasted purchases of crude oil. The call and put options can be exercised at various calculation dates with specified quantities on each calculation date. Embedded Derivatives Embedded foreign currency derivatives exist in certain US dollar-denominated sales and purchases contracts for various fuel products of Petron. Under the sales and purchase contracts, the peso equivalent is determined using the average Philippine Dealing System rate on the month preceding the month of delivery. As of December 31, 2021 and 2020, the total outstanding notional amount of currency forwards embedded in nonfinancial contracts is minimal. These nonfinancial contracts consist mainly of foreign currency-denominated service contracts, purchase orders and sales agreements. The embedded forwards are not clearly and closely related to their respective host contracts. As of December 31, 2021 and 2020, the net positive fair value of these embedded currency forwards is minimal. For the years ended December 31, 2021 and 2020, the Company recognized marked-to-market losses from freestanding and embedded derivatives amounting to P361,003 and P2,473,270, respectively (Note 25). Fair Value Changes on Derivatives not Designated as Cash Flow Hedge The net movements in the fair value of derivative transactions in 2021 and 2020 are as follows: Note 2021 2020
Fair value at beginning of year (P413,704) P231,240 Net changes in fair value during the year 25 361,003 (2,473,270) Fair value of settled instruments 111,456 1,828,326
Fair value at end of year P58,755 (P413,704)
Fair Value Hierarchy Financial assets and liabilities measured at fair value in the separate statements of financial position are categorized in accordance with the fair value hierarchy. This hierarchy groups financial assets and liabilities into three levels based on the significance of inputs used in measuring the fair value of the financial assets and liabilities. The table below analyzes financial instruments carried at fair value, by valuation method as of December 31, 2021 and 2020. The different levels have been defined as follows: Level 1: quoted prices (unadjusted) in active markets for identical assets or
liabilities;
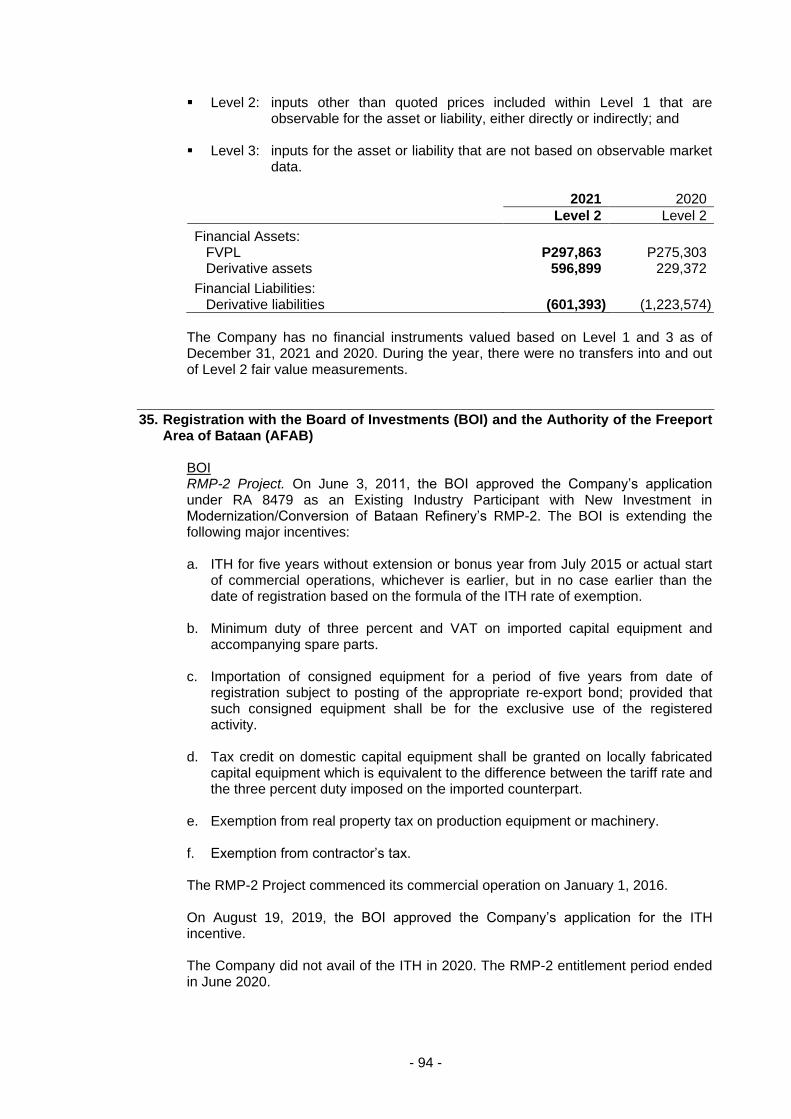
- 94 -
Level 2: inputs other than quoted prices included within Level 1 that are observable for the asset or liability, either directly or indirectly; and
Level 3: inputs for the asset or liability that are not based on observable market
data. 2021 2020
Level 2 Level 2
Financial Assets: FVPL P297,863 P275,303 Derivative assets 596,899 229,372
Financial Liabilities: Derivative liabilities (601,393) (1,223,574)
The Company has no financial instruments valued based on Level 1 and 3 as of December 31, 2021 and 2020. During the year, there were no transfers into and out of Level 2 fair value measurements.
35. Registration with the Board of Investments (BOI) and the Authority of the Freeport Area of Bataan (AFAB)
BOI RMP-2 Project. On June 3, 2011, the BOI approved the Company’s application under RA 8479 as an Existing Industry Participant with New Investment in Modernization/Conversion of Bataan Refinery’s RMP-2. The BOI is extending the following major incentives: a. ITH for five years without extension or bonus year from July 2015 or actual start
of commercial operations, whichever is earlier, but in no case earlier than the date of registration based on the formula of the ITH rate of exemption.
b. Minimum duty of three percent and VAT on imported capital equipment and
accompanying spare parts. c. Importation of consigned equipment for a period of five years from date of
registration subject to posting of the appropriate re-export bond; provided that such consigned equipment shall be for the exclusive use of the registered activity.
d. Tax credit on domestic capital equipment shall be granted on locally fabricated
capital equipment which is equivalent to the difference between the tariff rate and the three percent duty imposed on the imported counterpart.
e. Exemption from real property tax on production equipment or machinery. f. Exemption from contractor’s tax. The RMP-2 Project commenced its commercial operation on January 1, 2016. On August 19, 2019, the BOI approved the Company’s application for the ITH incentive. The Company did not avail of the ITH in 2020. The RMP-2 entitlement period ended in June 2020.
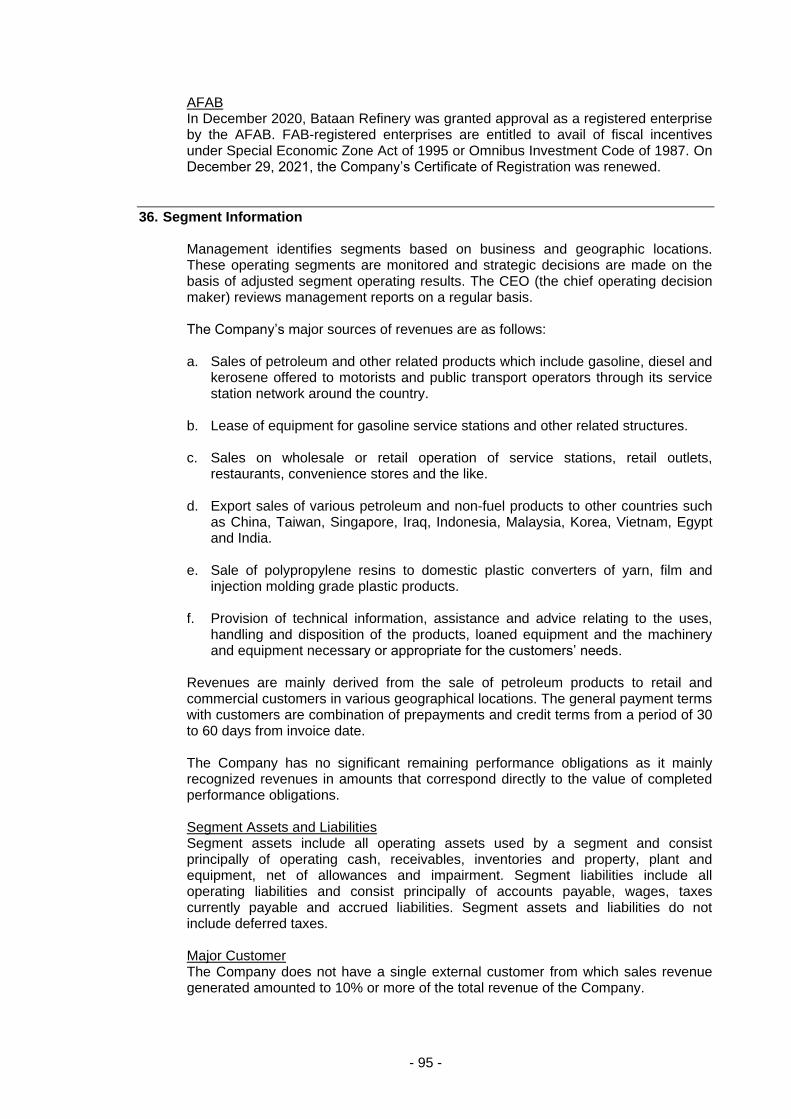
- 95 -
AFAB In December 2020, Bataan Refinery was granted approval as a registered enterprise by the AFAB. FAB-registered enterprises are entitled to avail of fiscal incentives under Special Economic Zone Act of 1995 or Omnibus Investment Code of 1987. On December 29, 2021, the Company’s Certificate of Registration was renewed.
36. Segment Information Management identifies segments based on business and geographic locations. These operating segments are monitored and strategic decisions are made on the basis of adjusted segment operating results. The CEO (the chief operating decision maker) reviews management reports on a regular basis. The Company’s major sources of revenues are as follows: a. Sales of petroleum and other related products which include gasoline, diesel and
kerosene offered to motorists and public transport operators through its service station network around the country.
b. Lease of equipment for gasoline service stations and other related structures. c. Sales on wholesale or retail operation of service stations, retail outlets,
restaurants, convenience stores and the like. d. Export sales of various petroleum and non-fuel products to other countries such
as China, Taiwan, Singapore, Iraq, Indonesia, Malaysia, Korea, Vietnam, Egypt and India.
e. Sale of polypropylene resins to domestic plastic converters of yarn, film and
injection molding grade plastic products. f. Provision of technical information, assistance and advice relating to the uses,
handling and disposition of the products, loaned equipment and the machinery and equipment necessary or appropriate for the customers’ needs.
Revenues are mainly derived from the sale of petroleum products to retail and commercial customers in various geographical locations. The general payment terms with customers are combination of prepayments and credit terms from a period of 30 to 60 days from invoice date. The Company has no significant remaining performance obligations as it mainly recognized revenues in amounts that correspond directly to the value of completed performance obligations. Segment Assets and Liabilities Segment assets include all operating assets used by a segment and consist principally of operating cash, receivables, inventories and property, plant and equipment, net of allowances and impairment. Segment liabilities include all operating liabilities and consist principally of accounts payable, wages, taxes currently payable and accrued liabilities. Segment assets and liabilities do not include deferred taxes. Major Customer The Company does not have a single external customer from which sales revenue generated amounted to 10% or more of the total revenue of the Company.
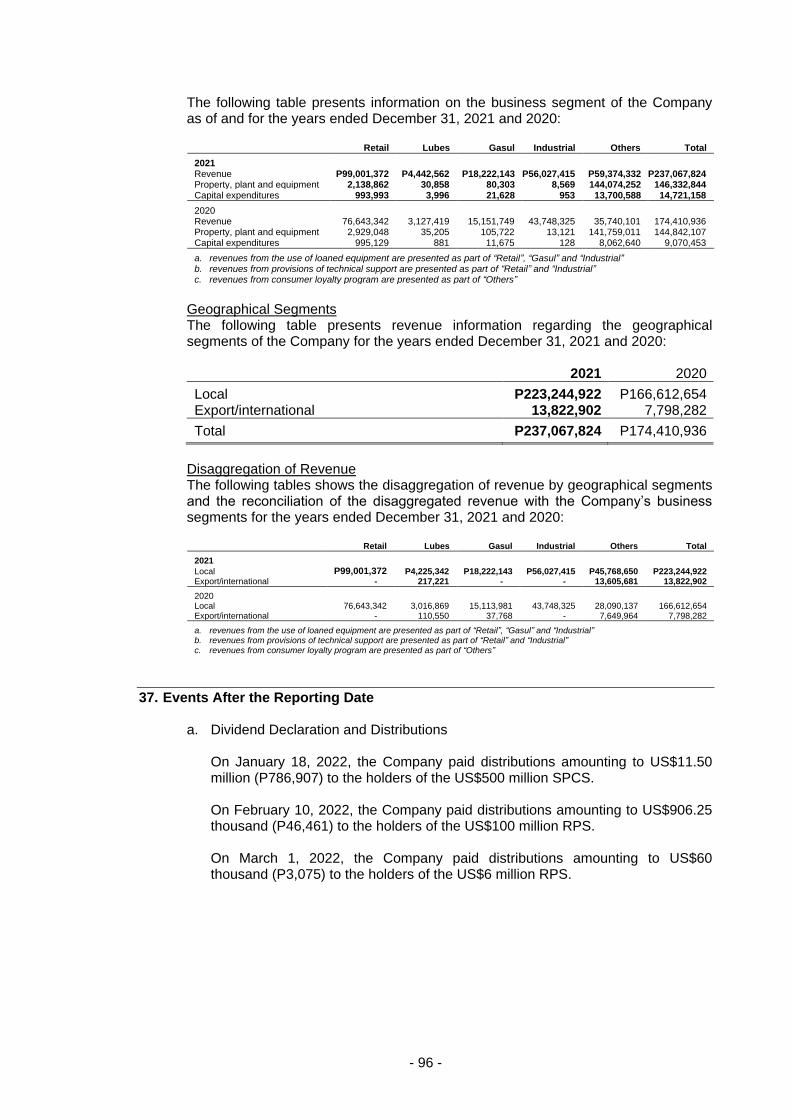
- 96 -
The following table presents information on the business segment of the Company as of and for the years ended December 31, 2021 and 2020:
Retail Lubes Gasul Industrial Others Total
2021 Revenue P99,001,372 P4,442,562 P18,222,143 P56,027,415 P59,374,332 P237,067,824 Property, plant and equipment 2,138,862 30,858 80,303 8,569 144,074,252 146,332,844 Capital expenditures 993,993 3,996 21,628 953 13,700,588 14,721,158
2020 Revenue 76,643,342 3,127,419 15,151,749 43,748,325 35,740,101 174,410,936 Property, plant and equipment 2,929,048 35,205 105,722 13,121 141,759,011 144,842,107 Capital expenditures 995,129 881 11,675 128 8,062,640 9,070,453
a. revenues from the use of loaned equipment are presented as part of “Retail”, “Gasul” and “Industrial” b. revenues from provisions of technical support are presented as part of “Retail” and “Industrial” c. revenues from consumer loyalty program are presented as part of “Others”
Geographical Segments The following table presents revenue information regarding the geographical segments of the Company for the years ended December 31, 2021 and 2020: 2021 2020
Local P223,244,922 P166,612,654 Export/international 13,822,902 7,798,282
Total P237,067,824 P174,410,936
Disaggregation of Revenue The following tables shows the disaggregation of revenue by geographical segments and the reconciliation of the disaggregated revenue with the Company’s business segments for the years ended December 31, 2021 and 2020:
Retail Lubes Gasul Industrial Others Total
2021
Local P99,001,372 P4,225,342 P18,222,143 P56,027,415 P45,768,650 P223,244,922 Export/international - 217,221 - - 13,605,681 13,822,902
2020 Local 76,643,342 3,016,869 15,113,981 43,748,325 28,090,137 166,612,654 Export/international - 110,550 37,768 - 7,649,964 7,798,282
a. revenues from the use of loaned equipment are presented as part of “Retail”, “Gasul” and “Industrial” b. revenues from provisions of technical support are presented as part of “Retail” and “Industrial” c. revenues from consumer loyalty program are presented as part of “Others”
37. Events After the Reporting Date a. Dividend Declaration and Distributions
On January 18, 2022, the Company paid distributions amounting to US$11.50 million (P786,907) to the holders of the US$500 million SPCS. On February 10, 2022, the Company paid distributions amounting to US$906.25 thousand (P46,461) to the holders of the US$100 million RPS. On March 1, 2022, the Company paid distributions amounting to US$60 thousand (P3,075) to the holders of the US$6 million RPS.
- 97 -
b. Acquisition of Mema Holdings, Inc. On February 16, 2022, the Company paid P104,124 for the acquisition of 10,000,000 common shares with par value of P1.00 per share representing 100% of the authorized capital stock of Mema Holdings Inc. (Mema), a corporation duly organized and existing under and by virtue of Philippine laws. Mema is a holding company proposed by the management to be considered, among others, as a vehicle and holding company for the venture by the Company into fuel hauling and logistics services. The acquisition cost approximates the fair value of net assets acquired.
38. Other Matters
a. Lease Agreements with PNOC
On October 20, 2017, the Company filed with the Regional Trial Court (RTC) of Mandaluyong City a complaint against PNOC for the reconveyance of the various landholdings it conveyed to PNOC in 1993 as a result of the government-mandated privatization of the Company. The subject landholdings consist of the refinery lots in Limay, Bataan, 23 bulk plant sites and 66 service station lots located in different parts of the country. The Deeds of Conveyance covering the landholdings provide that the transfer of these lots to PNOC was without prejudice to the continued long-term use by the Company of the conveyed lots for its business operation. Thus, PNOC and the Company executed three lease agreements covering the refinery lots, the bulk plants, and the service station sites, all with an initial lease term of 25 years to expire in August 2018, with a provision for automatic renewal for another 25 years. In 2009, the Company, through its realty subsidiary, NVRC, had an early renewal of the lease agreement for the refinery lots with an initial lease term of 30 years, renewable for another 25 years. The complaint alleges that PNOC committed a fundamental breach of the lease agreements when it refused to honor both the automatic renewal clause in the lease agreements for the bulk plants and the service station sites and the renewed lease agreement for the refinery lots on the alleged ground that all such lease agreements were grossly disadvantageous to PNOC, a government-owned-and-controlled corporation. On December 11, 2017, the trial court granted the Company’s prayer for a writ of preliminary injunction, enjoining PNOC from committing any act aimed at ousting the Company from possession of the subject properties until the case is decided.
- 98 -
The court-mandated mediation was terminated on February 5, 2018 without any agreement between the parties. The judicial dispute resolution proceedings before the court were likewise terminated on March 28, 2020, after the parties failed to agree to a settlement. Without prejudice to any further discussion between the parties regarding settlement, the case was remanded to the trial court for trial proper, with the pre-trial held on September 10, 2020. The Company also filed a motion for summary judgment on May 17, 2020. In a resolution dated November 13, 2020, the trial court granted the Company’s motion for summary judgment and ordered (i) the rescission of the Deeds of Conveyance dated 1993 relating to the Company’s conveyance of such leased premises to PNOC pursuant to a property dividend declaration in 1993, (ii) the reconveyance by PNOC to the Company of all such properties, and (iii) the payment by the Company to PNOC of the amount of P143,000, with legal interest from 1993, representing the book value of the litigated properties at the time of the property dividend declaration. PNOC filed a motion for reconsideration. The Company also filed a motion for partial reconsideration seeking a modification of the judgment to include an order directing PNOC to return to the Company all lease payments the latter had paid to PNOC since 1993. Following the trial court’s denial of their separate motions for reconsideration, both PNOC and Petron filed their respective notices of appeal with the trial court. The case was raffled off to the 5th Division of the Court of Appeals. Petron filed its appellant’s brief in October 2020. PNOC filed its appellant’s brief in November 2020. In a decision dated December 13, 2021, the Court of Appeals dismissed both appeals of Petron and PNOC and affirmed the resolution of the trial court as described above. The Court of Appeals upheld Petron’s position that PNOC committed a substantial breach of its contractual obligation under the lease agreements when it dishonored the automatic renewal clause in the lease agreements and threatened to terminate Petron’s lease thereby depriving the Petron a long-term lease consistent with its business requirements, which was the primordial consideration in the Deeds of Conveyance. The Court of Appeals ruled, however, that, consistent with jurisprudence, while rescission repeals the contract from its inception, it does not disregard all the consequences that the contract has created and that it was therefore only proper that Petron paid PNOC the rentals for the use and enjoyment of the properties which PNOC could have enjoyed by virtue of the Deeds of Conveyance were it not for the lease agreements. On January 11, 2022, Petron filed its motion for reconsideration insofar as the decision dismissed the Petron’s appeal to return the lease payments made by it to PNOC. PNOC also filed its own motion for reconsideration. The parties await the order of the Court Appeals on the motions filed.
b. Oil Spill Incident in Guimaras On August 11, 2006, MT Solar I, a third party vessel contracted by the Company to transport approximately two million liters of industrial fuel oil, sank 13 nautical miles southwest of Guimaras, an island province in the Western Visayas region of the Philippines. In separate investigations by the Philippine Department of Justice (DOJ) and the Special Board of Marine Inquiry (SBMI), both agencies found the owners of MT Solar I liable. The DOJ found the Company not criminally liable, but the SBMI found the Company to have overloaded the vessel. The Company has appealed the findings of the SBMI to the Philippine Department of Transportation and Communication (DOTC) and is awaiting its resolution. The Company believes that SBMI can impose administrative penalties on vessel owners and crew, but has no authority to penalize other parties, such as the Company, which are charterers.
- 99 -
Other complaints for non-payment of compensation for the clean-up operations during the oil spill were filed with the Regional Trial Court of Guimaras by a total of 1,063 plaintiffs who allegedly did not receive any payment of their claims for damages arising from the oil spill. The total claims amount to P292,000. The cases were pending as of December 31, 2021. In the course of plaintiffs’ presentation of evidence, they moved for trial by commissioner, which was denied by the trial court. The plaintiffs elevated the matter by way of a petition for certiorari to the Court of Appeals in Cebu City (CA). On January 9, 2020, the CA issued a Resolution granting plaintiffs’ motion for reconsideration of the earlier resolution denying their petition and ordering the Company to file its comment on plaintiffs’ petition within 10 days. On February 6, 2020, the Company filed a motion for reconsideration of said Resolution, which remains pending to date. In the meantime, proceedings before the trial court continues. Less than 200 of the plaintiffs have testified so far.
c. Effect of COVID-19 Since the start of the global pandemic, the Company, being engaged in the fuel business, has been affected by the implementation of Enhanced Community Quarantine (ECQ) in the National Capital Region and other key cities in the country. The reduced economic activities and travel restrictions due to lockdowns in many countries significantly affected the Company’s volume. Global oil prices began to plunge in March 2020 as the price war among top oil producing countries was worsened by the demand destruction caused by the COVID-19 pandemic. Dubai crude plunged from US$64/bbl in January to US$20/bbl in April, posting record low levels in 26 years, which resulted in successive rollbacks in pump prices and reflected in the substantial net loss in 2020. With Organization of Petroleum Exporting Countries (OPEC) and Russia agreeing to output cuts, recovery in oil prices was seen starting May 2020. From then on international oil prices began to climb steadily. Dubai averaged to about $71/bbl in 2021 as against $42/bbl in 2020. The gradual opening-up of economies and easing up of pandemic restrictions especially in the West alongside robust vaccination efforts around the world contributed much to the recovery of demand to reach pre-pandemic level by the 4th quarter of 2021. On the supply-side, consistent effort of oil producing countries to manage supply also supported the escalation in oil prices amidst some resurgences in COVID-19 cases from new variants. Th Company saw fuel consumption began to pick up as shown by the gradual improvement in domestic sales volume in 2021 compared to 2020. Revenues in 2021 rose by 40% to P237 billion. Combined with improvement in refining margins, this resulted to a modest net income in 2021 of P2.7 billion, a reversal of P11.2 billion net loss in 2020. The extent to which the COVID-19 pandemic will continue to impact the Company will depend on future developments, including the timeliness and effectiveness of actions taken or not taken to contain and mitigate the effects of COVID-19 both in the Philippines and internationally by governments, central banks, healthcare providers, health system participants, other businesses and individuals, which are highly uncertain and cannot be predicted.
- 100 -
d. Impact of Ukraine - Russia Conflict In relation to the ongoing conflict between Russia and Ukraine of which changes in economic conditions developed as a consequence of the Russian invasion of Ukraine in February 2022 and the resulting economic sanctions by the international community, Petron currently does not foresee issues on its oil supply on a short or medium-term basis as Petron does not have term crude supply contracts with Russia. The Company primarily sources its crude requirement from the Middle East. However, based on recent events and market sentiments, oil prices are expected to be high during the crisis and in the event of a protracted conflict, oil supply could become tight. The extent to which the ongoing conflict will affect the Company will depend on future developments, including the actions and decisions taken or not taken by the OPEC and other oil producing countries, international community, and the Philippine government which are highly uncertain and cannot be quantified nor determined at this point.
e. Construction of Coco-Methyl Ester Plant
On November 24, 2021, the Executive Committee of the BOD of the Company approved Management’s proposal to construct a coco-methyl ester plant (the “CME Plant”) with an initial but expandable capacity of 60 million liters per year, enough to meet the Company’s current requirements at 2% CME blend. The CME Plant will serve the Company’s CME requirements for bio-diesel sales. With a projected cost of P1.2 billion, the CME Plant will be located in and integrated with the Refinery to leverage on the Bataan Refinery’s support facilities, minimize freight costs, and benefit from the tax incentives granted by the AFAB. Completion and operation are targeted within two (2) years with commercial operations beginning 2024.
f. Other Proceedings The Company is also a party to certain other proceedings arising out of the ordinary course of its business, including legal proceedings with respect to tax, regulatory and other matters. While the results of litigation cannot be predicted with certainty, management believes that the final outcome of these other proceedings will not have a material adverse effect on the Company’s business, financial condition or results of operations.
g. The Company has unused letters of credit totaling approximately P31,660,367 and P7,055,492 as of December 31, 2021 and 2020, respectively.
39. Supplementary Information Required by the BIR The BIR has issued RR No. 15-2010 which requires certain tax information to be disclosed in the notes to the separate financial statements. The Company presented the required supplementary tax information as a separate schedule attached to its annual income tax return.
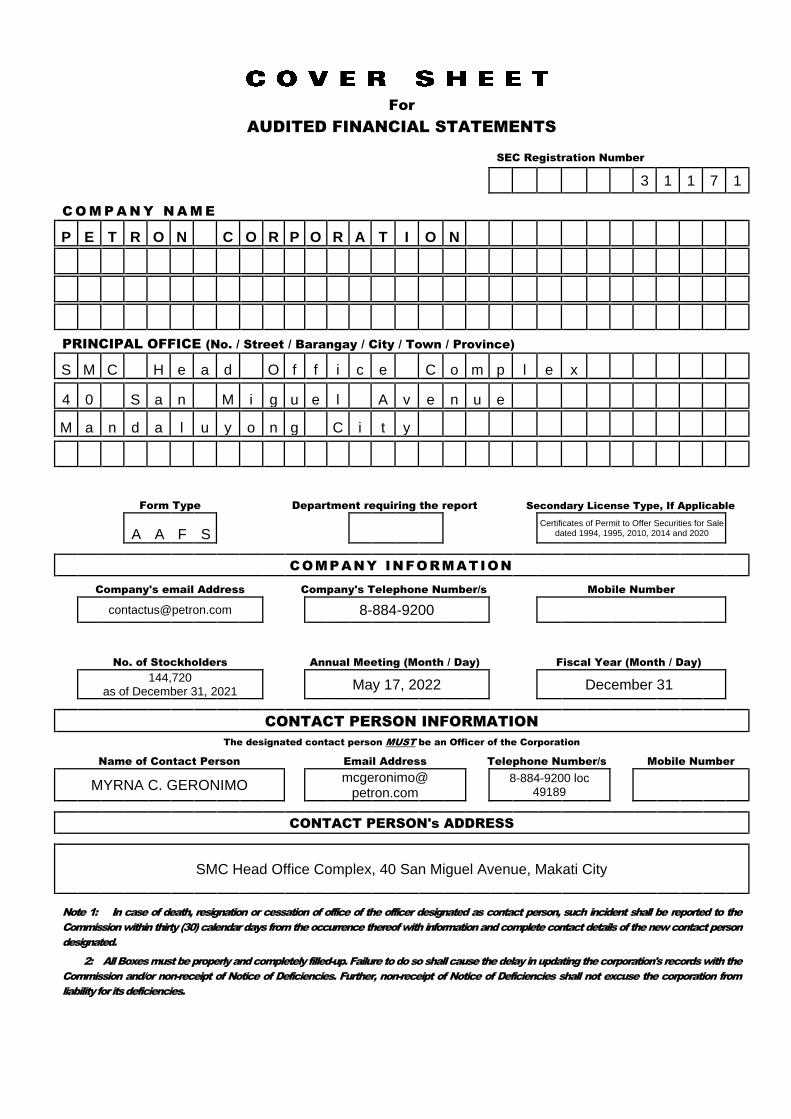
For
AUDITED FINANCIAL STATEMENTS
SEC Registration Number
3 1 1 7 1
C O M P A N Y N A M E
P E T R O N C O R P O R A T I O N
PRINCIPAL OFFICE (No. / Street / Barangay / City / Town / Province)
S M C H e a d O f f i c e C o m p l e x
4 0 S a n M i g u e l A v e n u e
M a n d a l u y o n g C i t y
Form Type
Department requiring the report Secondary License Type, If Applicable
A A F S
Certificates of Permit to Offer Securities for Sale dated 1994, 1995, 2010, 2014 and 2020
COMPANY INFORMATION
Company's email Address
Company's Telephone Number/s
Mobile Number
[email protected] 8-884-9200
No. of Stockholders
Annual Meeting (Month / Day)
Fiscal Year (Month / Day)
144,720 as of December 31, 2021
May 17, 2022 December 31
CONTACT PERSON INFORMATION
The designated contact person MUST be an Officer of the Corporation
Name of Contact Person Email Address Telephone Number/s Mobile Number
MYRNA C. GERONIMO mcgeronimo@ petron.com
8-884-9200 loc 49189
CONTACT PERSON's ADDRESS
SMC Head Office Complex, 40 San Miguel Avenue, Makati City
Note 1: In case of death, resignation or cessation of office of the officer designated as contact person, such incident shall be reported to the
Commission within thirty (30) calendar days from the occurrence thereof with information and complete contact details of the new contact person
designated.
2: All Boxes must be properly and completely filled-up. Failure to do so shall cause the delay in updating the corporation's records with the
Commission and/or non-receipt of Notice of Deficiencies. Further, non-receipt of Notice of Deficiencies shall not excuse the corporation from
liability for its deficiencies.
The following document has been received:
Receiving: AARON PAGKATIPUNAN
Receipt Date and Time: March 25, 2022 04:17:24 PM
Company Information____________________________________________________________________________
SEC Registration No.: 0000031171
Company Name: Petron Corporation
Industry Classification: E40200
Company Type: Stock Corporation
Document Information____________________________________________________________________________
____________________________________________________________________________
Document ID: OST1032520228268475
Document Type: Financial Statement
Document Code: FS
Period Covered: December 31, 2021
Submission Type: Consolidated
Remarks: None
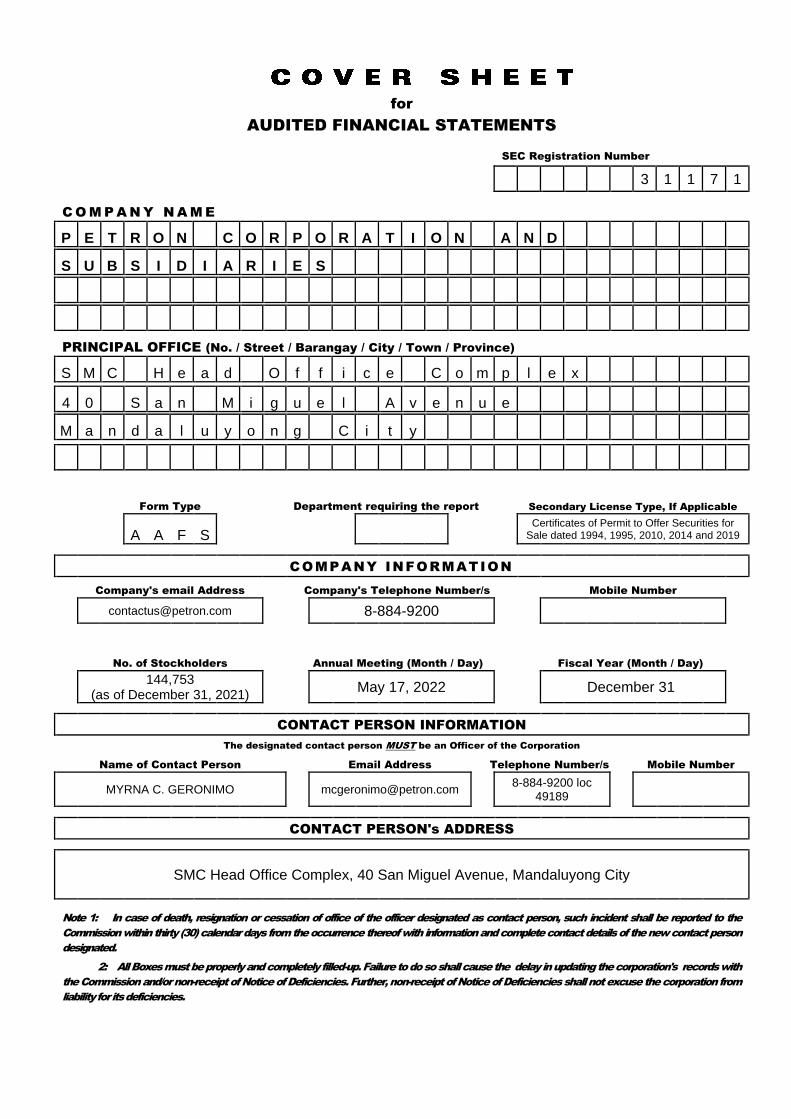
for
AUDITED FINANCIAL STATEMENTS
SEC Registration Number
3 1 1 7 1
C O M P A N Y N A M E
P E T R O N C O R P O R A T I O N A N D
S U B S I D I A R I E S
PRINCIPAL OFFICE (No. / Street / Barangay / City / Town / Province)
S M C H e a d O f f i c e C o m p l e x
4 0 S a n M i g u e l A v e n u e
M a n d a l u y o n g C i t y
Form Type
Department requiring the report Secondary License Type, If Applicable
A A F S
Certificates of Permit to Offer Securities for Sale dated 1994, 1995, 2010, 2014 and 2019
COMPANY INFORMATION
Company's email Address
Company's Telephone Number/s
Mobile Number
[email protected] 8-884-9200
No. of Stockholders
Annual Meeting (Month / Day)
Fiscal Year (Month / Day)
144,753 (as of December 31, 2021)
May 17, 2022 December 31
CONTACT PERSON INFORMATION
The designated contact person MUST be an Officer of the Corporation
Name of Contact Person Email Address Telephone Number/s Mobile Number
MYRNA C. GERONIMO [email protected] 8-884-9200 loc 49189
CONTACT PERSON's ADDRESS
SMC Head Office Complex, 40 San Miguel Avenue, Mandaluyong City
Note 1: In case of death, resignation or cessation of office of the officer designated as contact person, such incident shall be reported to the
Commission within thirty (30) calendar days from the occurrence thereof with information and complete contact details of the new contact person
designated.
2: All Boxes must be properly and completely filled-up. Failure to do so shall cause the delay in updating the corporation's records with
the Commission and/or non-receipt of Notice of Deficiencies. Further, non-receipt of Notice of Deficiencies shall not excuse the corporation from
liability for its deficiencies.
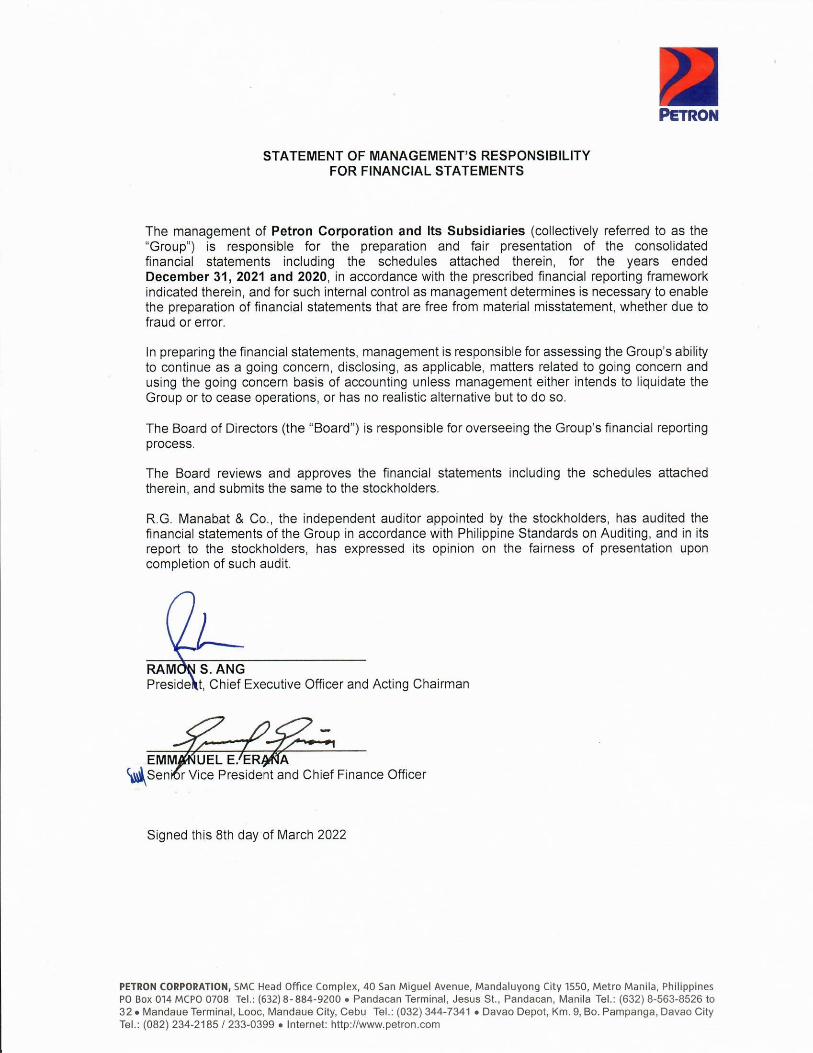
PETRON CORPORATION AND SUBSIDIARIES CONSOLIDATED FINANCIAL STATEMENTS December 31, 2021, 2020 and 2019 With Independent Auditors’ Report
R.G. Manabat & Co. The KPMG Center, 6/F
6787 Ayala Avenue, Makati City Philippines 1209
Telephone +63 (2) 8885 7000
Fax +63 (2) 8894 1985
Internet www.home.kpmg/ph Email [email protected]
Firm Regulatory Registration & Accreditation: PRC-BOA Registration No. 0003, valid until November 21, 2023 SEC Accreditation No. 0003-SEC, Group A, valid for five (5) years covering the audit of 2020 to 2024 financial statements (2019 financial statements are covered by SEC Accreditation No. 0004-FR-5) IC Accreditation No. 0003-IC, Group A, valid for five (5) years covering the audit of 2020 to 2024 financial statements (2019 financial statements are covered by IC Circular Letter (CL) No. 2019-39, Transition clause) BSP Accreditation No. 0003-BSP, Group A, valid for five (5) years covering the audit of 2020 to 2024 financial statements (2019 financial statements are covered by BSP Monetary Board Resolution No. 2161, Transition clause)
R.G. Manabat & Co., a Philippine partnership and a member firm of the KPMG global organization of independent member firms
affiliated with KPMG International Limited, a private English company limited by guarantee
REPORT OF INDEPENDENT AUDITORS The Board of Directors and Stockholders Petron Corporation SMC Head Office Complex 40 San Miguel Avenue Mandaluyong City Opinion We have audited the consolidated financial statements of Petron Corporation and Subsidiaries (the “Group”), which comprise the consolidated statements of financial position as at December 31, 2021 and 2020, the consolidated statements of income, consolidated statements of comprehensive income, consolidated statements of changes in equity and consolidated statements of cash flows for each of the three years in the period ended December 31, 2021, and notes, comprising significant accounting policies and other explanatory information. In our opinion, the accompanying consolidated financial statements present fairly, in all material respects, the consolidated financial position of the Group as at December 31, 2021 and 2020, and of its consolidated financial performance and its consolidated cash flows for each of the three years in the period ended December 31, 2021, in accordance with Philippine Financial Reporting Standards (PFRS). Basis for Opinion We conducted our audits in accordance with Philippine Standards on Auditing (PSA). Our responsibilities under those standards are further described in the Auditors’ Responsibilities for the Audit of the Consolidated Financial Statements section of our report. We are independent of the Group in accordance with the Code of Ethics for Professional Accountants in the Philippines (Code of Ethics) together with the ethical requirements that are relevant to our audits of the financial statements in the Philippines, and we have fulfilled our other ethical responsibilities in accordance with these requirements and the Code of Ethics. We believe that the audit evidence we have obtained is sufficient and appropriate to provide a basis for our opinion.
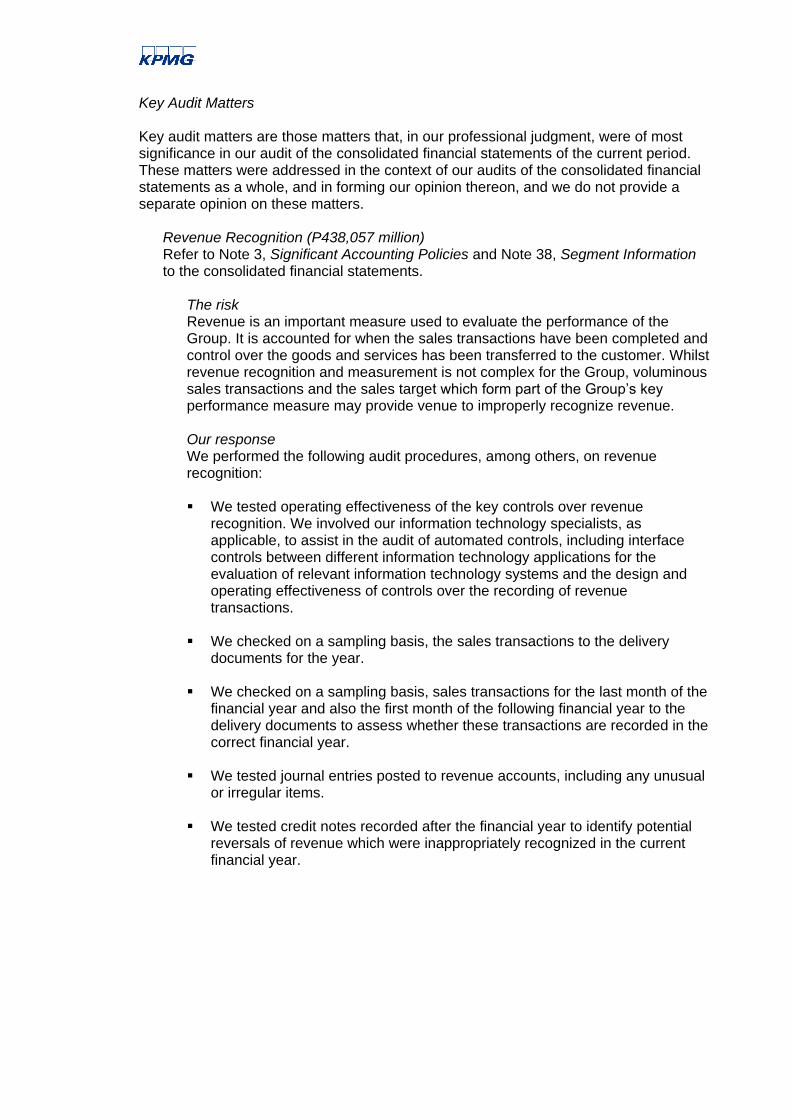
Key Audit Matters Key audit matters are those matters that, in our professional judgment, were of most significance in our audit of the consolidated financial statements of the current period. These matters were addressed in the context of our audits of the consolidated financial statements as a whole, and in forming our opinion thereon, and we do not provide a separate opinion on these matters.
Revenue Recognition (P438,057 million) Refer to Note 3, Significant Accounting Policies and Note 38, Segment Information to the consolidated financial statements.
The risk Revenue is an important measure used to evaluate the performance of the Group. It is accounted for when the sales transactions have been completed and control over the goods and services has been transferred to the customer. Whilst revenue recognition and measurement is not complex for the Group, voluminous sales transactions and the sales target which form part of the Group’s key performance measure may provide venue to improperly recognize revenue. Our response We performed the following audit procedures, among others, on revenue recognition: We tested operating effectiveness of the key controls over revenue
recognition. We involved our information technology specialists, as applicable, to assist in the audit of automated controls, including interface controls between different information technology applications for the evaluation of relevant information technology systems and the design and operating effectiveness of controls over the recording of revenue transactions.
We checked on a sampling basis, the sales transactions to the delivery
documents for the year. We checked on a sampling basis, sales transactions for the last month of the
financial year and also the first month of the following financial year to the delivery documents to assess whether these transactions are recorded in the correct financial year.
We tested journal entries posted to revenue accounts, including any unusual
or irregular items. We tested credit notes recorded after the financial year to identify potential
reversals of revenue which were inappropriately recognized in the current financial year.
Valuation of Inventories (P67,684 million) Refer to Note 3, Significant Accounting Policies, Note 4, Significant Accounting Judgments, Estimates and Assumptions and Note 9, Inventories to the consolidated financial statements.
The risk There is a risk over the recoverability of the Group’s inventories due to market price volatility of crude and petroleum products. Such volatility can lead to potential issues over the full recoverability of inventory balances. In addition, determining the net realizable values of inventories is subject to management’s judgment and estimation. This includes estimating the selling price of finished goods and the cost of conversion of raw materials based on available market price forecasts and current costs. Our response We performed the following audit procedures, among others, on the valuation of inventories: We obtained and reviewed the calculation of write-down of the Group’s raw
materials and finished goods based on the net realizable values of finished goods at yearend.
For raw materials, projected production yield was used to estimate the cost of
conversion for the raw materials as at yearend. We assessed the projected yield by comparing it to the actual yield achieved from crude oil production runs during the year. We then compared the estimated costs of finished goods to the net realizable values to determine any potential write-down.
For finished goods, we assessed the reasonableness of estimated selling
prices by checking various products’ sales invoices issued around and after yearend. Any write-down is computed based on the difference between the net realizable value and the cost of inventory held at yearend.
Valuation of Goodwill (P8,235 million) Refer to Note 3, Significant Accounting Policies, Note 4, Significant Accounting Judgments, Estimates and Assumptions and Note 13, Investment in Shares of Stock of Subsidiaries, Goodwill and Non-Controlling Interests to the consolidated financial statements.
The risk The Group has significant amount of goodwill arising from business acquisitions. We particularly focused on the valuation of goodwill allocated to Petron Oil and Gas International Sdn. Bhd. Group (Petron Malaysia Group) which accounts for 99% of total goodwill. The annual impairment test was significant to our audit as the assessment process is complex by nature and is based on management’s judgment and assumptions on future market and/or economic conditions. The assumptions used include future cash flow projections, growth rates and discount rates.
Our response We performed the following audit procedures, among others, on the valuation of goodwill: We tested the integrity of the discounted cash flow model used by the Group.
This involved the review of component auditor’s work and use of their own valuation specialist to assist in evaluating the models used and assumptions applied and comparing these assumptions to external data, where applicable. The key assumptions include sales volume, selling price and gross profit margin.
We compared the Group's assumptions to externally derived data as well as
our own assessments in relation to key inputs such as projected economic growth, competition, cost of inflation and discount rates, as well as performing break-even analysis on the assumptions.
We also assessed the Group's disclosures about the sensitivity of the
outcome of the impairment assessment to changes in key assumptions used in the valuation of goodwill.
Other Information Management is responsible for the other information. The other information comprises the information included in the SEC Form 20-IS (Definitive Information Statement), SEC Form 17-A and Annual Report for the year ended December 31, 2021, but does not include the consolidated financial statements and our auditors’ report thereon. The SEC Form 20-IS (Definitive Information Statement), SEC Form 17-A and Annual Report for the year ended December 31, 2021 are expected to be made available to us after the date of this auditors’ report. Our opinion on the consolidated financial statements does not cover the other information and we will not express any form of assurance conclusion thereon. In connection with our audits of the consolidated financial statements, our responsibility is to read the other information identified above when it becomes available and, in doing so, consider whether the other information is materially inconsistent with the consolidated financial statements or our knowledge obtained in the audits, or otherwise appears to be materially misstated. Responsibilities of Management and Those Charged with Governance for the Consolidated Financial Statements Management is responsible for the preparation and fair presentation of the consolidated financial statements in accordance with PFRS, and for such internal control as management determines is necessary to enable the preparation of consolidated financial statements that are free from material misstatement, whether due to fraud or error. In preparing the consolidated financial statements, management is responsible for assessing the Group’s ability to continue as a going concern, disclosing, as applicable, matters related to going concern and using the going concern basis of accounting unless management either intends to liquidate the Group or to cease operations, or has no realistic alternative but to do so.
Those charged with governance are responsible for overseeing the Group’s financial reporting process. Auditors’ Responsibilities for the Audit of the Consolidated Financial Statements Our objectives are to obtain reasonable assurance about whether the consolidated financial statements as a whole are free from material misstatement, whether due to fraud or error, and to issue an auditors’ report that includes our opinion. Reasonable assurance is a high level of assurance, but is not a guarantee that an audit conducted in accordance with PSA will always detect a material misstatement when it exists. Misstatements can arise from fraud or error and are considered material if, individually or in the aggregate, they could reasonably be expected to influence the economic decisions of users taken on the basis of these consolidated financial statements. As part of an audit in accordance with PSA, we exercise professional judgment and maintain professional skepticism throughout the audit. We also: Identify and assess the risks of material misstatement of the consolidated financial
statements, whether due to fraud or error, design and perform audit procedures responsive to those risks, and obtain audit evidence that is sufficient and appropriate to provide a basis for our opinion. The risk of not detecting a material misstatement resulting from fraud is higher than for one resulting from error, as fraud may involve collusion, forgery, intentional omissions, misrepresentations, or the override of internal control.
Obtain an understanding of internal control relevant to the audit in order to design
audit procedures that are appropriate in the circumstances, but not for the purpose of expressing an opinion on the effectiveness of the Group’s internal control.
Evaluate the appropriateness of accounting policies used and the reasonableness of
accounting estimates and related disclosures made by management. Conclude on the appropriateness of management’s use of the going concern basis
of accounting and, based on the audit evidence obtained, whether a material uncertainty exists related to events or conditions that may cast significant doubt on the Group’s ability to continue as a going concern. If we conclude that a material uncertainty exists, we are required to draw attention in our auditors’ report to the related disclosures in the consolidated financial statements or, if such disclosures are inadequate, to modify our opinion. Our conclusions are based on the audit evidence obtained up to the date of our auditors’ report. However, future events or conditions may cause the Group to cease to continue as a going concern.
Evaluate the overall presentation, structure and content of the consolidated financial
statements, including the disclosures, and whether the consolidated financial statements represent the underlying transactions and events in a manner that achieves fair presentation.
Obtain sufficient appropriate audit evidence regarding the financial information of the
entities or business activities within the Group to express an opinion on the consolidated financial statements. We are responsible for the direction, supervision and performance of the group audit. We remain solely responsible for our audit opinion.
We communicate with those charged with governance regarding, among other matters, the planned scope and timing of the audit and significant audit findings, including any significant deficiencies in internal control that we identify during our audit. We also provide those charged with governance with a statement that we have complied with relevant ethical requirements regarding independence, and communicate with them all relationships and other matters that may reasonably be thought to bear on our independence, and where applicable, actions taken to eliminate threats or safeguards applied. From the matters communicated with those charged with governance, we determine those matters that were of most significance in the audit of the consolidated financial statements of the current period and are therefore the key audit matters. We describe these matters in our auditors’ report unless law or regulation precludes public disclosure about the matter or when, in extremely rare circumstances, we determine that a matter should not be communicated in our report because the adverse consequences of doing so would reasonably be expected to outweigh the public interest benefits of such communication. The engagement partner on the audit resulting in this independent auditors’ report is Mr. Darwin P. Virocel. R.G. MANABAT & CO. DARWIN P. VIROCEL Partner CPA License No. 0094495 SEC Accreditation No. 94495-SEC, Group A, valid for five (5) years covering the audit of 2019 to 2023 financial statements Tax Identification No. 912-535-864 BIR Accreditation No. 08-001987-031-2019 Issued August 7, 2019; valid until August 6, 2022 PTR No. MKT 8854088 Issued January 3, 2022 at Makati City March 18, 2022 Makati City, Metro Manila
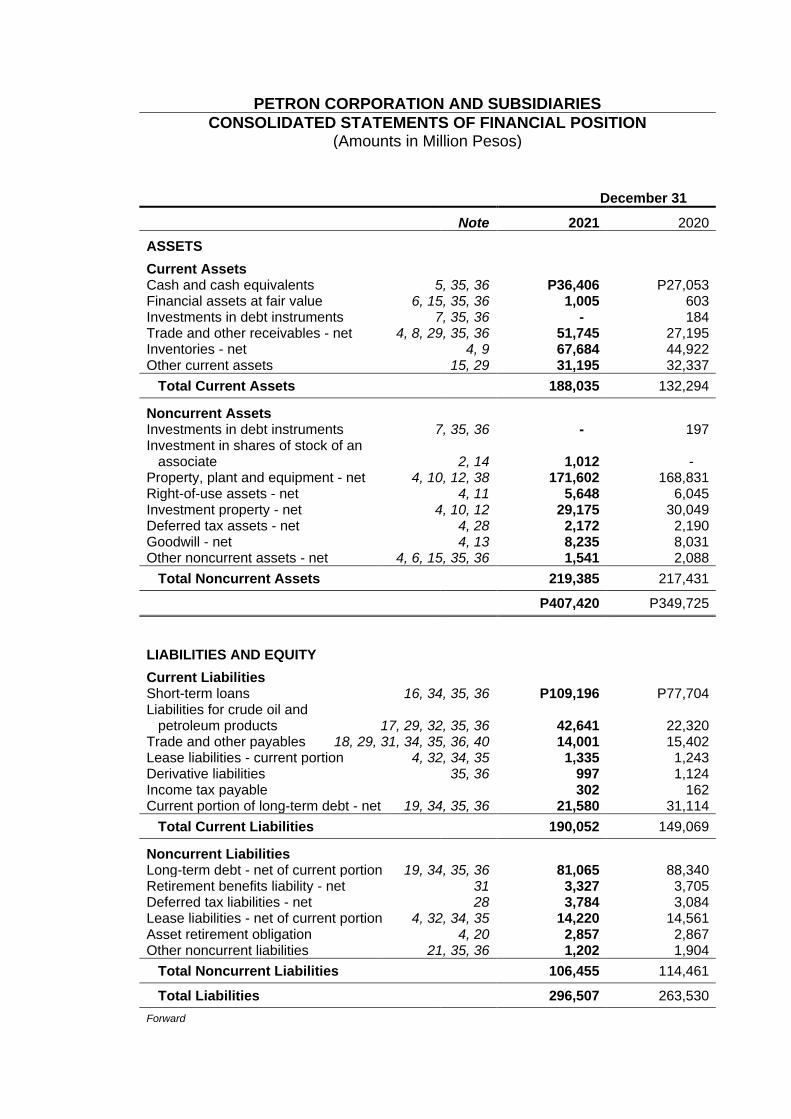
PETRON CORPORATION AND SUBSIDIARIES
CONSOLIDATED STATEMENTS OF FINANCIAL POSITION (Amounts in Million Pesos)
December 31
Note 2021 2020
ASSETS
Current Assets Cash and cash equivalents 5, 35, 36 P36,406 P27,053 Financial assets at fair value 6, 15, 35, 36 1,005 603 Investments in debt instruments 7, 35, 36 - 184 Trade and other receivables - net 4, 8, 29, 35, 36 51,745 27,195 Inventories - net 4, 9 67,684 44,922 Other current assets 15, 29 31,195 32,337
Total Current Assets 188,035 132,294
Noncurrent Assets Investments in debt instruments 7, 35, 36 - 197 Investment in shares of stock of an
associate 2, 14 1,012 - Property, plant and equipment - net 4, 10, 12, 38 171,602 168,831 Right-of-use assets - net 4, 11 5,648 6,045 Investment property - net 4, 10, 12 29,175 30,049 Deferred tax assets - net 4, 28 2,172 2,190 Goodwill - net 4, 13 8,235 8,031 Other noncurrent assets - net 4, 6, 15, 35, 36 1,541 2,088
Total Noncurrent Assets 219,385 217,431
P407,420 P349,725
LIABILITIES AND EQUITY
Current Liabilities Short-term loans 16, 34, 35, 36 P109,196 P77,704 Liabilities for crude oil and
petroleum products 17, 29, 32, 35, 36 42,641 22,320 Trade and other payables 18, 29, 31, 34, 35, 36, 40 14,001 15,402 Lease liabilities - current portion 4, 32, 34, 35 1,335 1,243 Derivative liabilities 35, 36 997 1,124 Income tax payable 302 162 Current portion of long-term debt - net 19, 34, 35, 36 21,580 31,114
Total Current Liabilities 190,052 149,069
Noncurrent Liabilities Long-term debt - net of current portion 19, 34, 35, 36 81,065 88,340 Retirement benefits liability - net 31 3,327 3,705 Deferred tax liabilities - net 28 3,784 3,084 Lease liabilities - net of current portion 4, 32, 34, 35 14,220 14,561 Asset retirement obligation 4, 20 2,857 2,867 Other noncurrent liabilities 21, 35, 36 1,202 1,904
Total Noncurrent Liabilities 106,455 114,461
Total Liabilities 296,507 263,530
Forward
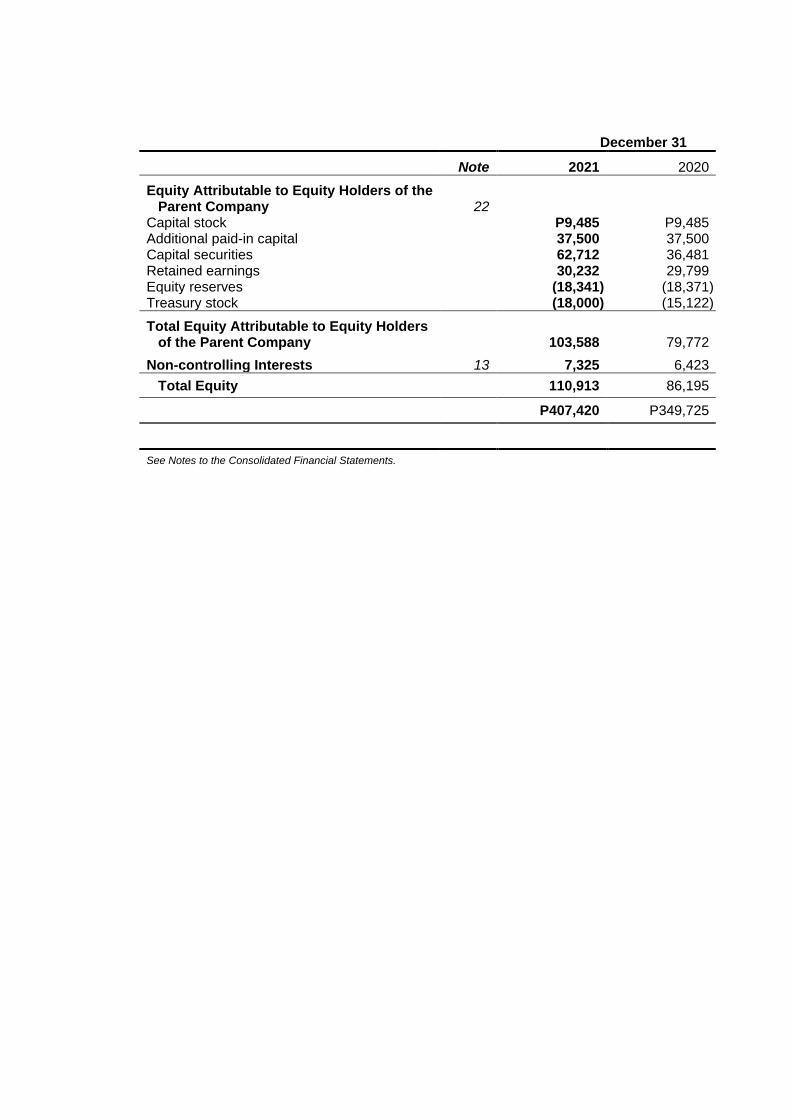
December 31
Note 2021 2020
Equity Attributable to Equity Holders of the Parent Company 22
Capital stock P9,485 P9,485 Additional paid-in capital 37,500 37,500 Capital securities 62,712 36,481 Retained earnings 30,232 29,799 Equity reserves (18,341) (18,371) Treasury stock (18,000) (15,122)
Total Equity Attributable to Equity Holders of the Parent Company 103,588 79,772
Non-controlling Interests 13 7,325 6,423
Total Equity 110,913 86,195
P407,420 P349,725
See Notes to the Consolidated Financial Statements.
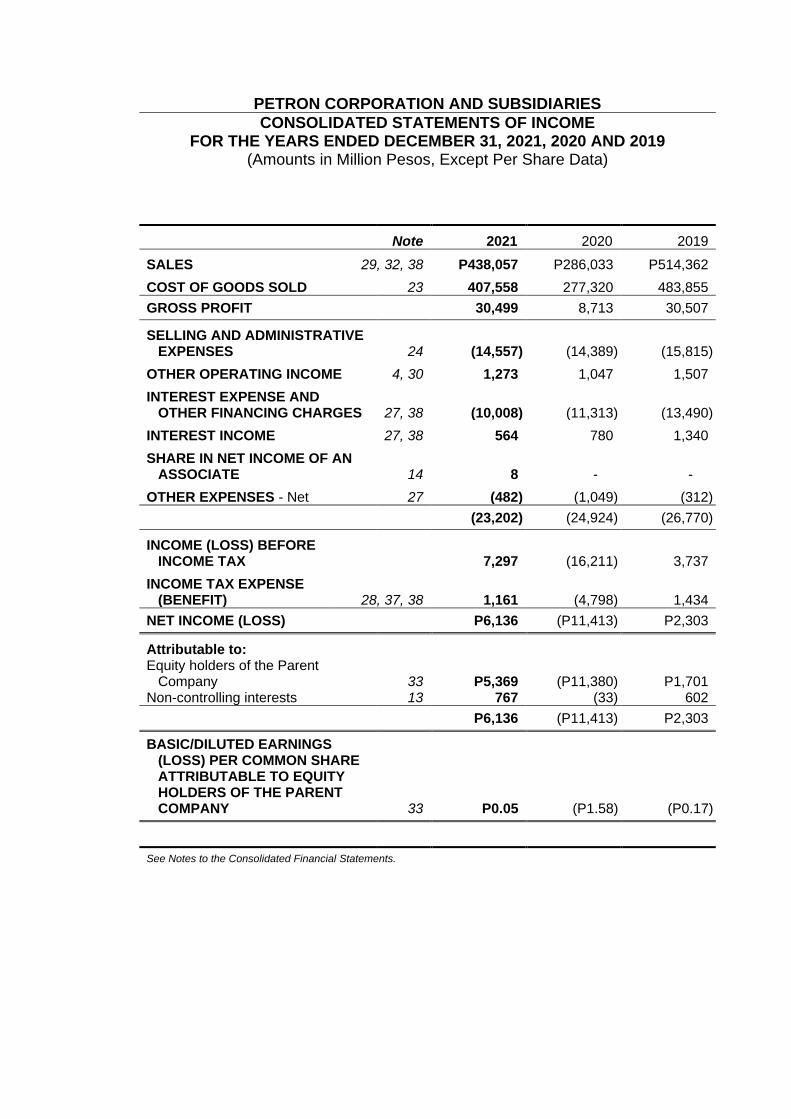
PETRON CORPORATION AND SUBSIDIARIES
CONSOLIDATED STATEMENTS OF INCOME FOR THE YEARS ENDED DECEMBER 31, 2021, 2020 AND 2019
(Amounts in Million Pesos, Except Per Share Data)
Note 2021 2020 2019
SALES 29, 32, 38 P438,057 P286,033 P514,362
COST OF GOODS SOLD 23 407,558 277,320 483,855
GROSS PROFIT 30,499 8,713 30,507
SELLING AND ADMINISTRATIVE EXPENSES 24 (14,557) (14,389) (15,815)
OTHER OPERATING INCOME 4, 30 1,273 1,047 1,507
INTEREST EXPENSE AND OTHER FINANCING CHARGES 27, 38 (10,008) (11,313) (13,490)
INTEREST INCOME 27, 38 564 780 1,340
SHARE IN NET INCOME OF AN ASSOCIATE 14 8 - -
OTHER EXPENSES - Net 27 (482) (1,049) (312)
(23,202) (24,924) (26,770)
INCOME (LOSS) BEFORE INCOME TAX 7,297 (16,211) 3,737
INCOME TAX EXPENSE (BENEFIT) 28, 37, 38 1,161 (4,798) 1,434
NET INCOME (LOSS) P6,136 (P11,413) P2,303
Attributable to: Equity holders of the Parent
Company 33 P5,369 (P11,380) P1,701 Non-controlling interests 13 767 (33) 602
P6,136 (P11,413) P2,303
BASIC/DILUTED EARNINGS (LOSS) PER COMMON SHARE ATTRIBUTABLE TO EQUITY HOLDERS OF THE PARENT COMPANY 33 P0.05 (P1.58) (P0.17)
See Notes to the Consolidated Financial Statements.
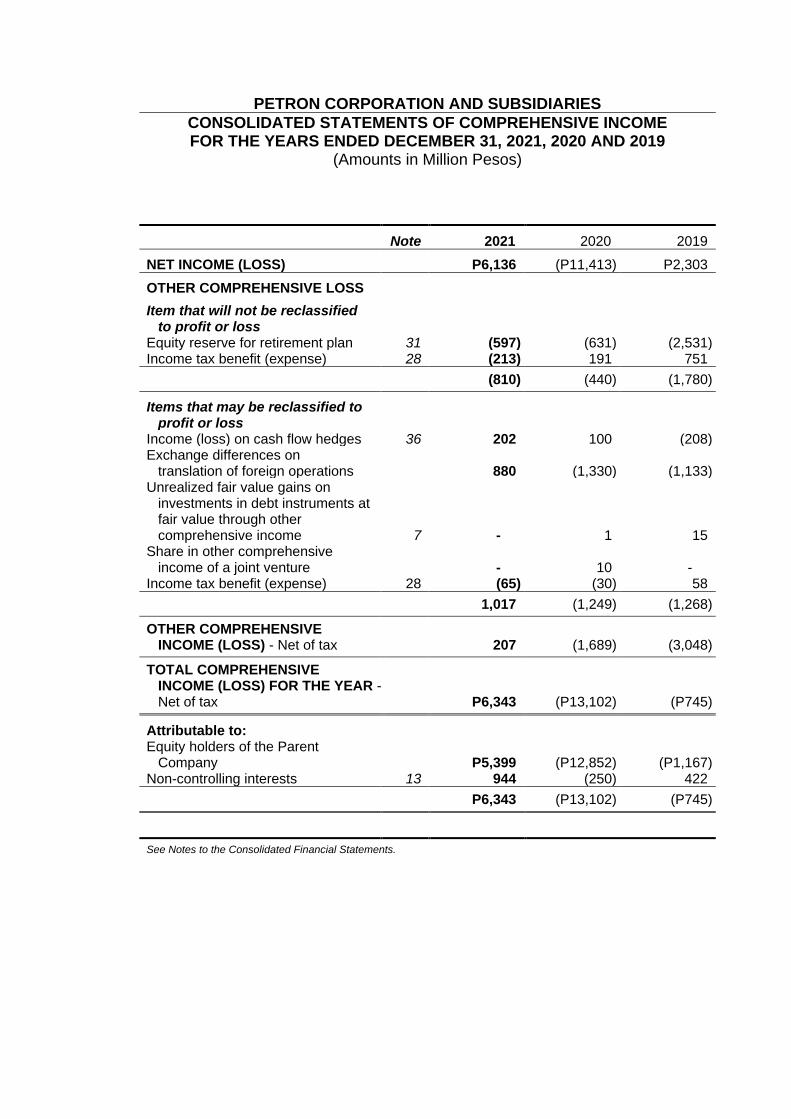
PETRON CORPORATION AND SUBSIDIARIES
CONSOLIDATED STATEMENTS OF COMPREHENSIVE INCOME FOR THE YEARS ENDED DECEMBER 31, 2021, 2020 AND 2019
(Amounts in Million Pesos)
Note 2021 2020 2019
NET INCOME (LOSS) P6,136 (P11,413) P2,303
OTHER COMPREHENSIVE LOSS
Item that will not be reclassified to profit or loss
Equity reserve for retirement plan 31 (597) (631) (2,531) Income tax benefit (expense) 28 (213) 191 751
(810) (440) (1,780)
Items that may be reclassified to profit or loss
Income (loss) on cash flow hedges 36 202 100 (208) Exchange differences on
translation of foreign operations 880 (1,330) (1,133) Unrealized fair value gains on
investments in debt instruments at fair value through other comprehensive income 7 - 1 15
Share in other comprehensive income of a joint venture - 10 -
Income tax benefit (expense) 28 (65) (30) 58
1,017 (1,249) (1,268)
OTHER COMPREHENSIVE INCOME (LOSS) - Net of tax 207 (1,689) (3,048)
TOTAL COMPREHENSIVE INCOME (LOSS) FOR THE YEAR - Net of tax P6,343 (P13,102) (P745)
Attributable to: Equity holders of the Parent
Company P5,399 (P12,852) (P1,167) Non-controlling interests 13 944 (250) 422
P6,343 (P13,102) (P745)
See Notes to the Consolidated Financial Statements.
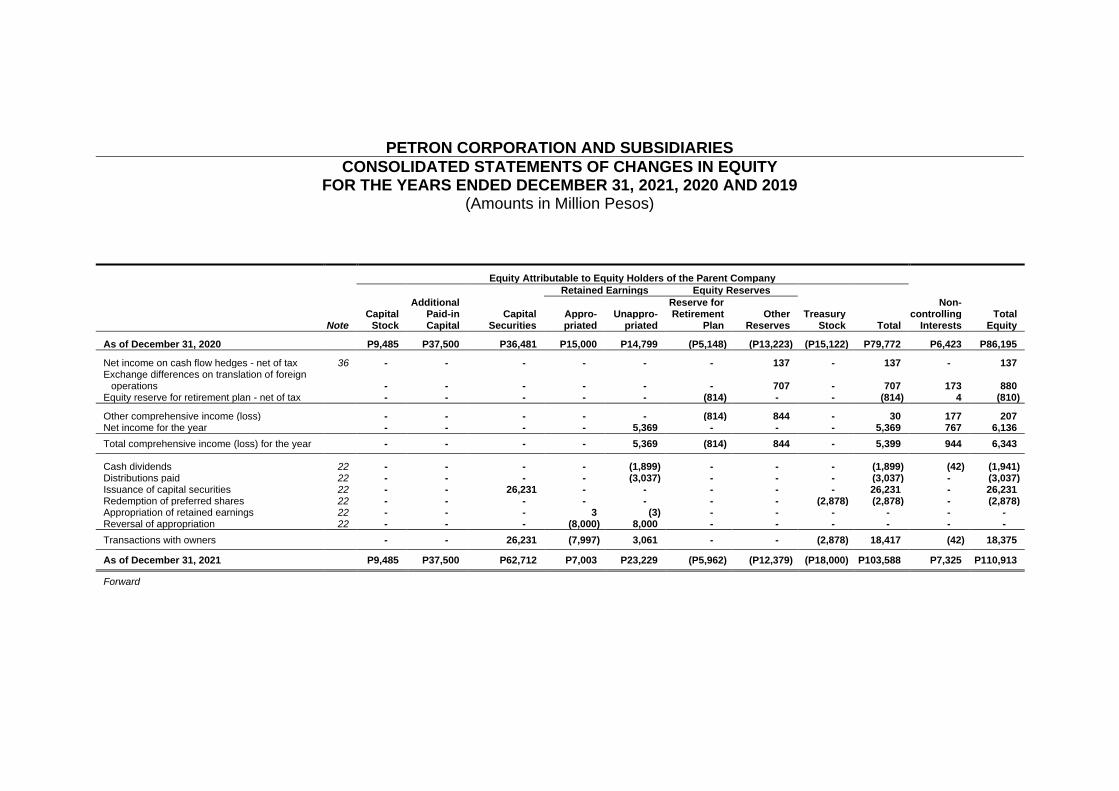
PETRON CORPORATION AND SUBSIDIARIES
CONSOLIDATED STATEMENTS OF CHANGES IN EQUITY FOR THE YEARS ENDED DECEMBER 31, 2021, 2020 AND 2019
(Amounts in Million Pesos)
Equity Attributable to Equity Holders of the Parent Company
Retained Earnings Equity Reserves
Capital Additional
Paid-in Capital Appro- Unappro- Reserve for Retirement Other Treasury
Non- controlling Total
Note Stock Capital Securities priated priated Plan Reserves Stock Total Interests Equity
As of December 31, 2020 P9,485 P37,500 P36,481 P15,000 P14,799 (P5,148) (P13,223) (P15,122) P79,772 P6,423 P86,195
Net income on cash flow hedges - net of tax 36 - - - - - - 137 - 137 - 137 Exchange differences on translation of foreign
operations - - - - - - 707 - 707 173 880 Equity reserve for retirement plan - net of tax - - - - - (814) - - (814) 4 (810)
Other comprehensive income (loss) - - - - - (814) 844 - 30 177 207 Net income for the year - - - - 5,369 - - - 5,369 767 6,136
Total comprehensive income (loss) for the year - - - - 5,369 (814) 844 - 5,399 944 6,343
Cash dividends 22 - - - - (1,899) - - - (1,899) (42) (1,941) Distributions paid 22 - - - - (3,037) - - - (3,037) - (3,037) Issuance of capital securities 22 - - 26,231 - - - - - 26,231 - 26,231 Redemption of preferred shares 22 - - - - - - - (2,878) (2,878) - (2,878) Appropriation of retained earnings 22 - - - 3 (3) - - - - - - Reversal of appropriation 22 - - - (8,000) 8,000 - - - - - -
Transactions with owners - - 26,231 (7,997) 3,061 - - (2,878) 18,417 (42) 18,375
As of December 31, 2021 P9,485 P37,500 P62,712 P7,003 P23,229 (P5,962) (P12,379) (P18,000) P103,588 P7,325 P110,913
Forward
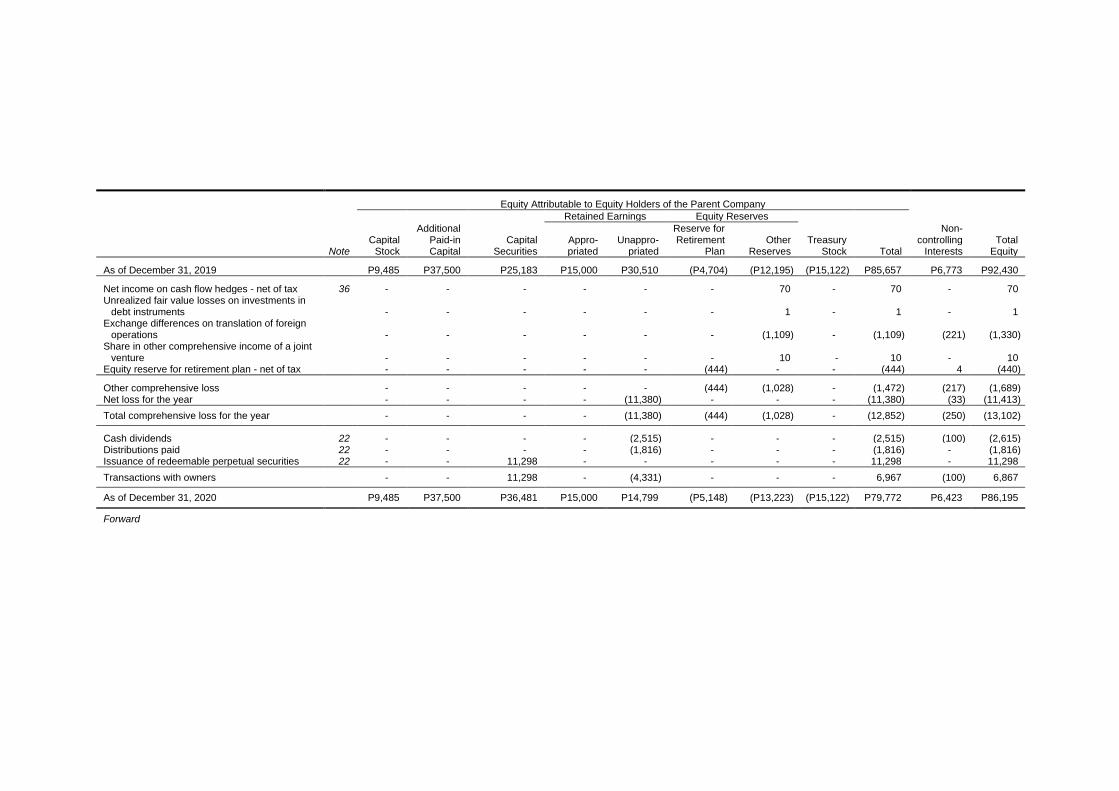
Equity Attributable to Equity Holders of the Parent Company
Retained Earnings Equity Reserves
Capital Additional
Paid-in Capital Appro- Unappro- Reserve for Retirement Other Treasury
Non- controlling Total
Note Stock Capital Securities priated priated Plan Reserves Stock Total Interests Equity
As of December 31, 2019 P9,485 P37,500 P25,183 P15,000 P30,510 (P4,704) (P12,195) (P15,122) P85,657 P6,773 P92,430
Net income on cash flow hedges - net of tax 36 - - - - - - 70 - 70 - 70 Unrealized fair value losses on investments in
debt instruments - - - - - - 1 - 1 - 1 Exchange differences on translation of foreign
operations - - - - - - (1,109) - (1,109) (221) (1,330) Share in other comprehensive income of a joint
venture - - - - - - 10 - 10 - 10 Equity reserve for retirement plan - net of tax - - - - - (444) - - (444) 4 (440)
Other comprehensive loss - - - - - (444) (1,028) - (1,472) (217) (1,689) Net loss for the year - - - - (11,380) - - - (11,380) (33) (11,413)
Total comprehensive loss for the year - - - - (11,380) (444) (1,028) - (12,852) (250) (13,102)
Cash dividends 22 - - - - (2,515) - - - (2,515) (100) (2,615) Distributions paid 22 - - - - (1,816) - - - (1,816) - (1,816) Issuance of redeemable perpetual securities 22 - - 11,298 - - - - - 11,298 - 11,298
Transactions with owners - - 11,298 - (4,331) - - - 6,967 (100) 6,867
As of December 31, 2020 P9,485 P37,500 P36,481 P15,000 P14,799 (P5,148) (P13,223) (P15,122) P79,772 P6,423 P86,195
Forward
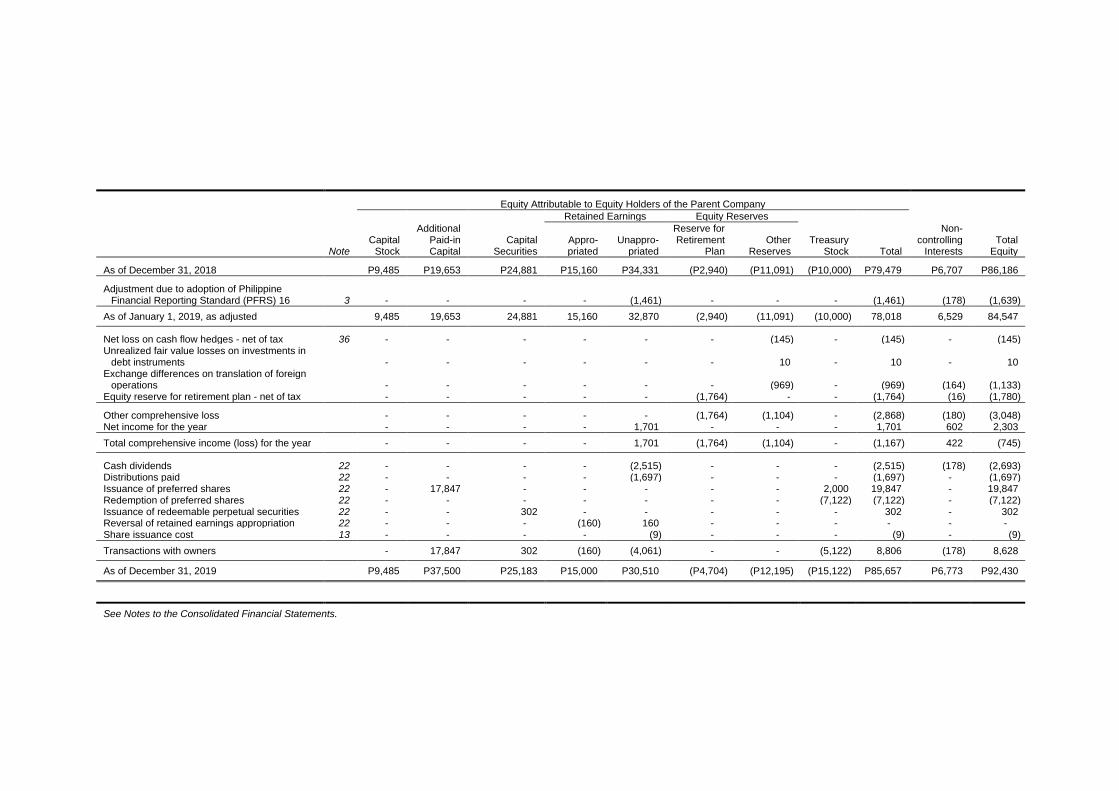
Equity Attributable to Equity Holders of the Parent Company
Retained Earnings Equity Reserves
Capital Additional
Paid-in Capital Appro- Unappro- Reserve for Retirement Other Treasury
Non- controlling Total
Note Stock Capital Securities priated priated Plan Reserves Stock Total Interests Equity
As of December 31, 2018 P9,485 P19,653 P24,881 P15,160 P34,331 (P2,940) (P11,091) (P10,000) P79,479 P6,707 P86,186
Adjustment due to adoption of Philippine Financial Reporting Standard (PFRS) 16 3 - - - - (1,461) - - - (1,461) (178) (1,639)
As of January 1, 2019, as adjusted 9,485 19,653 24,881 15,160 32,870 (2,940) (11,091) (10,000) 78,018 6,529 84,547
Net loss on cash flow hedges - net of tax 36 - - - - - - (145) - (145) - (145) Unrealized fair value losses on investments in
debt instruments - - - - - - 10 - 10 - 10 Exchange differences on translation of foreign
operations - - - - - - (969) - (969) (164) (1,133) Equity reserve for retirement plan - net of tax - - - - - (1,764) - - (1,764) (16) (1,780)
Other comprehensive loss - - - - - (1,764) (1,104) - (2,868) (180) (3,048) Net income for the year - - - - 1,701 - - - 1,701 602 2,303
Total comprehensive income (loss) for the year - - - - 1,701 (1,764) (1,104) - (1,167) 422 (745)
Cash dividends 22 - - - - (2,515) - - - (2,515) (178) (2,693) Distributions paid 22 - - - - (1,697) - - - (1,697) - (1,697) Issuance of preferred shares 22 - 17,847 - - - - - 2,000 19,847 - 19,847 Redemption of preferred shares 22 - - - - - - - (7,122) (7,122) - (7,122) Issuance of redeemable perpetual securities 22 - - 302 - - - - - 302 - 302 Reversal of retained earnings appropriation 22 - - - (160) 160 - - - - - - Share issuance cost 13 - - - - (9) - - - (9) - (9)
Transactions with owners - 17,847 302 (160) (4,061) - - (5,122) 8,806 (178) 8,628
As of December 31, 2019 P9,485 P37,500 P25,183 P15,000 P30,510 (P4,704) (P12,195) (P15,122) P85,657 P6,773 P92,430
See Notes to the Consolidated Financial Statements.
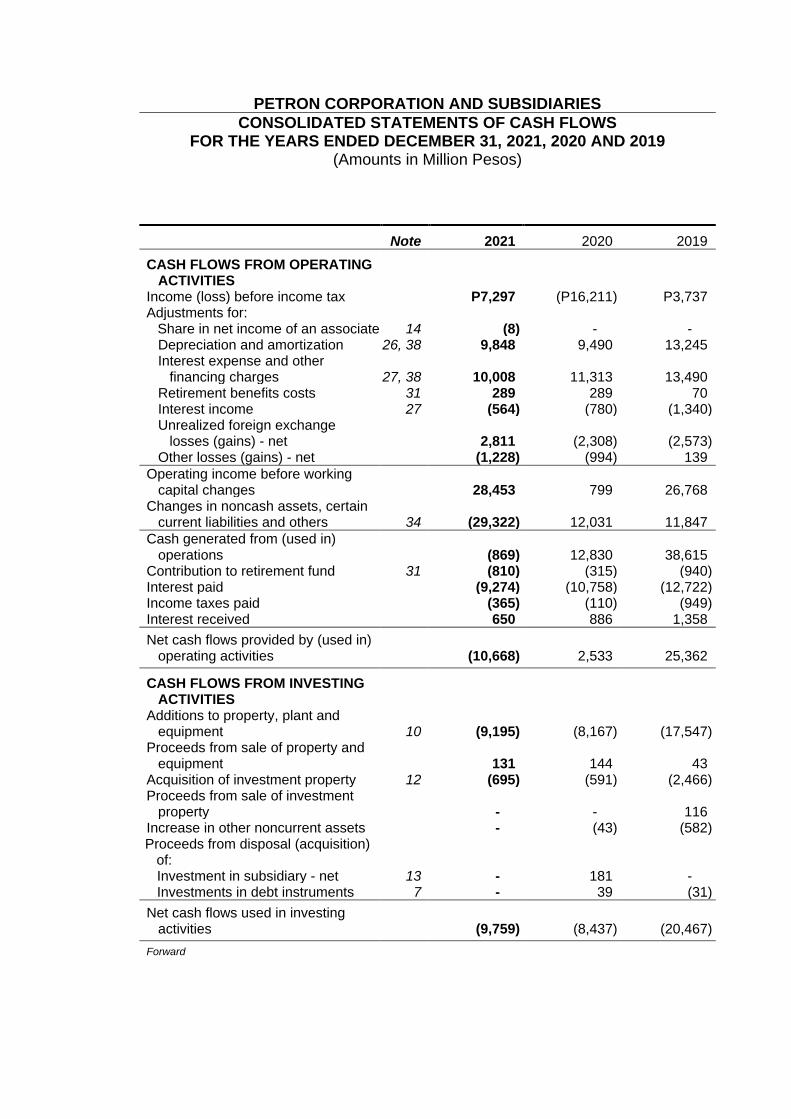
PETRON CORPORATION AND SUBSIDIARIES
CONSOLIDATED STATEMENTS OF CASH FLOWS FOR THE YEARS ENDED DECEMBER 31, 2021, 2020 AND 2019
(Amounts in Million Pesos)
Note 2021 2020 2019
CASH FLOWS FROM OPERATING ACTIVITIES
Income (loss) before income tax P7,297 (P16,211) P3,737 Adjustments for:
Share in net income of an associate 14 (8) - - Depreciation and amortization 26, 38 9,848 9,490 13,245 Interest expense and other
financing charges 27, 38 10,008 11,313 13,490 Retirement benefits costs 31 289 289 70 Interest income 27 (564) (780) (1,340) Unrealized foreign exchange
losses (gains) - net 2,811 (2,308) (2,573) Other losses (gains) - net (1,228) (994) 139
Operating income before working capital changes 28,453 799 26,768
Changes in noncash assets, certain current liabilities and others 34 (29,322) 12,031 11,847
Cash generated from (used in) operations (869) 12,830 38,615
Contribution to retirement fund 31 (810) (315) (940) Interest paid (9,274) (10,758) (12,722) Income taxes paid (365) (110) (949) Interest received 650 886 1,358
Net cash flows provided by (used in) operating activities (10,668) 2,533 25,362
CASH FLOWS FROM INVESTING ACTIVITIES
Additions to property, plant and equipment 10 (9,195) (8,167) (17,547)
Proceeds from sale of property and equipment 131 144 43
Acquisition of investment property 12 (695) (591) (2,466) Proceeds from sale of investment
property - - 116 Increase in other noncurrent assets - (43) (582) Proceeds from disposal (acquisition)
of: Investment in subsidiary - net 13 - 181 - Investments in debt instruments 7 - 39 (31)
Net cash flows used in investing activities (9,759) (8,437) (20,467)
Forward
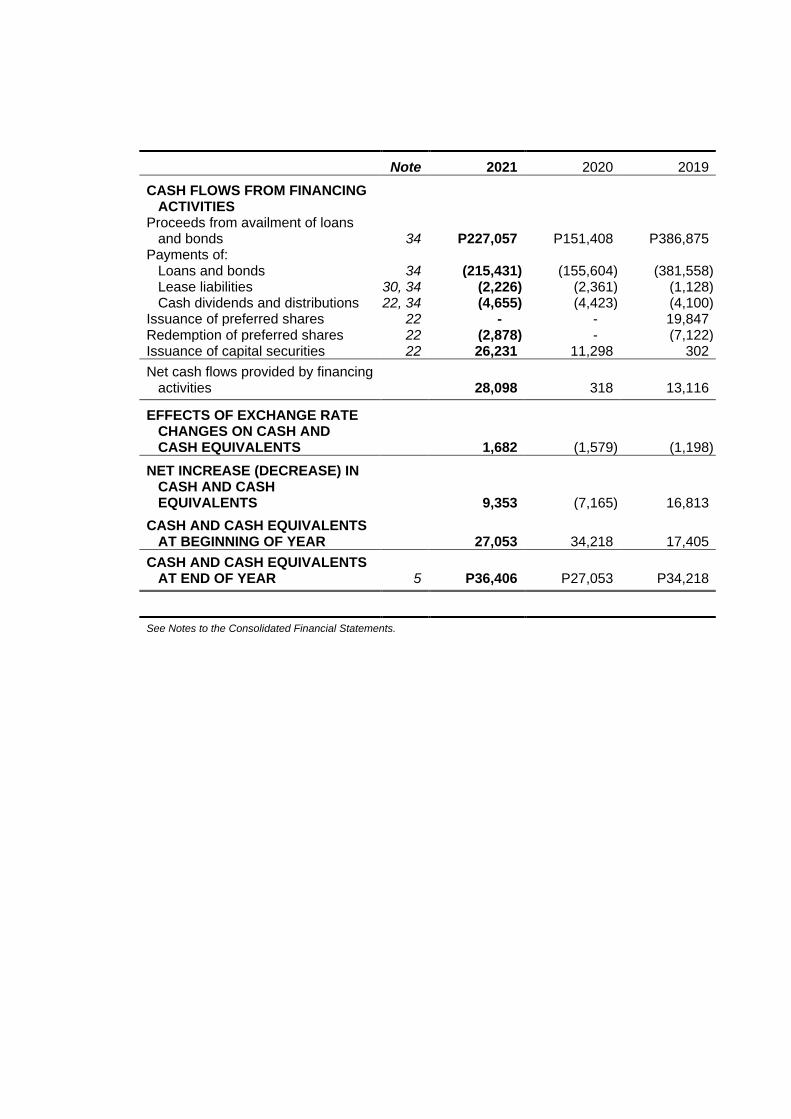
Note 2021 2020 2019
CASH FLOWS FROM FINANCING ACTIVITIES
Proceeds from availment of loans and bonds 34 P227,057 P151,408 P386,875
Payments of: Loans and bonds 34 (215,431) (155,604) (381,558) Lease liabilities 30, 34 (2,226) (2,361) (1,128) Cash dividends and distributions 22, 34 (4,655) (4,423) (4,100)
Issuance of preferred shares 22 - - 19,847 Redemption of preferred shares 22 (2,878) - (7,122) Issuance of capital securities 22 26,231 11,298 302
Net cash flows provided by financing activities 28,098 318 13,116
EFFECTS OF EXCHANGE RATE CHANGES ON CASH AND CASH EQUIVALENTS 1,682 (1,579) (1,198)
NET INCREASE (DECREASE) IN CASH AND CASH EQUIVALENTS 9,353 (7,165) 16,813
CASH AND CASH EQUIVALENTS AT BEGINNING OF YEAR 27,053 34,218 17,405
CASH AND CASH EQUIVALENTS AT END OF YEAR 5 P36,406 P27,053 P34,218
See Notes to the Consolidated Financial Statements.
PETRON CORPORATION AND SUBSIDIARIES
NOTES TO THE CONSOLIDATED FINANCIAL STATEMENTS (Amounts in Million Pesos, Except Par Value, Number of Shares and
Per Share Data, Exchange Rates and Commodity Volumes)
1. Reporting Entity Petron Corporation (the “Parent Company” or “Petron”) was incorporated under the laws of the Republic of the Philippines and registered with the Philippine Securities and Exchange Commission (SEC) on December 22, 1966. On September 13, 2013, the SEC approved the extension of the Parent Company’s corporate term to December 22, 2066. Under its Articles of Incorporation (AOI), the Parent Company’s has a corporate life of 50 years or for such longer period as may hereafter be authorized by the laws of the Philippines. Pursuant to the Revised Corporation Code of the Philippines, which took effect in February 2019, the Parent Company shall have a perpetual existence because the Parent Company did not elect to retain its specific corporate term under its AOI. Petron is the only oil refining and the leading marketing company in the Philippines. Petron is committed to its vision to be the leading provider of total customer solutions in the energy sector and its derivative businesses. Petron operates the modern refinery in Bataan, with a rated capacity of 180,000 barrels a day. Petron’s refinery processes crude oil into a full range of world-class petroleum products including liquefied petroleum gas (LPG), gasoline, diesel, jet fuel, kerosene, and petrochemicals. From the refinery, Petron moves its products mainly by sea to 30 terminals strategically located across the country. Through this network, Petron supplies fuels to its service stations and various essential industries such as power-generation, transportation, manufacturing, agriculture, etc. Petron also supplies jet fuel at key airports to international and domestic carriers. With over 2,000 service stations and hundreds of industrial accounts, Petron remains the leader in the Philippine fuel market. Petron retails gasoline and diesel to motorists and public transport operators. Petron also sells its LPG brands “Gasul” and “Fiesta” to households and other industrial consumers through an extensive dealership network. In line with efforts to increase its presence in the regional market, Petron exports various products to Asia-Pacific countries. Petron sources its fuel additives from its blending facility in Subic Bay. This gives Petron the capability to formulate unique additives suitable for the driving conditions in the Philippines. Petron also has a facility in Mariveles, Bataan where the refinery’s propylene production is converted into higher-value polypropylene resin. Today, Petron is one of the leading oil companies in Malaysia with an integrated business which includes an 88,000 barrel-per-day refinery, 12 terminals and facilities, and a network of more than 720 service stations.
- 2 -
The Parent Company is a public company under Section 17.2 of Securities Regulation Code (SRC) and its shares of stock are listed for trading at the Philippine Stock Exchange (PSE). As of December 31, 2021, the Parent Company’s public float stood at 26.72%. The intermediate parent company of Petron is San Miguel Corporation (SMC) while its ultimate parent company is Top Frontier Investment Holdings, Inc. Both companies are incorporated in the Philippines. The registered office address of Petron is SMC Head Office Complex, 40 San Miguel Avenue, Mandaluyong City.
2. Basis of Preparation Statement of Compliance The accompanying consolidated financial statements have been prepared in compliance with Philippine Financial Reporting Standards (PFRS). PFRS are based on International Financial Reporting Standards (IFRS) issued by the International Accounting Standards Board (IASB). PFRS consist of PFRS, Philippine Accounting Standards (PAS) and Philippine Interpretations issued by the Financial Reporting Standards Council (FRSC). The consolidated financial statements were approved and authorized for issuance by the Board of Directors (BOD) on March 8, 2022. Basis of Measurement The consolidated financial statements of the Group have been prepared on the historical cost basis of accounting except for the following which are measured on an alternative basis at each reporting date: Items Measurement Bases
Derivative financial instruments Fair value Financial assets at fair value through
profit or loss (FVPL) Fair value
Investments in debt instruments at fair value through other comprehensive income (FVOCI)
Fair value
Retirement benefits liability Present value of the defined benefit obligation less fair value of plan assets
Functional and Presentation Currency The consolidated financial statements are presented in Philippine peso, which is the Parent Company’s functional currency. All financial information presented in Philippine peso is rounded off to the nearest million (P000,000), except when otherwise indicated.
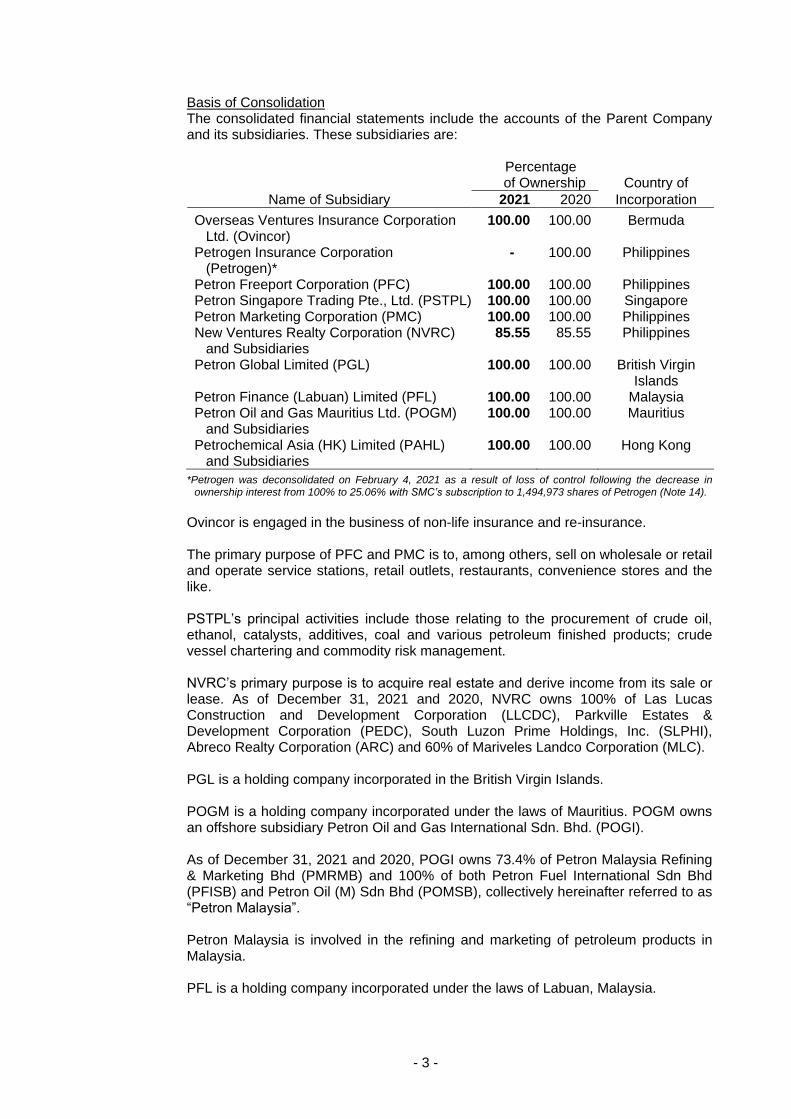
- 3 -
Basis of Consolidation The consolidated financial statements include the accounts of the Parent Company and its subsidiaries. These subsidiaries are:
Percentage
of Ownership Country of
Name of Subsidiary 2021 2020 Incorporation
Overseas Ventures Insurance Corporation Ltd. (Ovincor)
100.00 100.00 Bermuda
Petrogen Insurance Corporation (Petrogen)*
- 100.00 Philippines
Petron Freeport Corporation (PFC) 100.00 100.00 Philippines Petron Singapore Trading Pte., Ltd. (PSTPL) 100.00 100.00 Singapore Petron Marketing Corporation (PMC) 100.00 100.00 Philippines New Ventures Realty Corporation (NVRC)
and Subsidiaries 85.55 85.55 Philippines
Petron Global Limited (PGL) 100.00 100.00 British Virgin Islands
Petron Finance (Labuan) Limited (PFL) 100.00 100.00 Malaysia Petron Oil and Gas Mauritius Ltd. (POGM)
and Subsidiaries 100.00 100.00 Mauritius
Petrochemical Asia (HK) Limited (PAHL) and Subsidiaries
100.00 100.00 Hong Kong
*Petrogen was deconsolidated on February 4, 2021 as a result of loss of control following the decrease in ownership interest from 100% to 25.06% with SMC’s subscription to 1,494,973 shares of Petrogen (Note 14).
Ovincor is engaged in the business of non-life insurance and re-insurance. The primary purpose of PFC and PMC is to, among others, sell on wholesale or retail and operate service stations, retail outlets, restaurants, convenience stores and the like. PSTPL’s principal activities include those relating to the procurement of crude oil, ethanol, catalysts, additives, coal and various petroleum finished products; crude vessel chartering and commodity risk management. NVRC’s primary purpose is to acquire real estate and derive income from its sale or lease. As of December 31, 2021 and 2020, NVRC owns 100% of Las Lucas Construction and Development Corporation (LLCDC), Parkville Estates & Development Corporation (PEDC), South Luzon Prime Holdings, Inc. (SLPHI), Abreco Realty Corporation (ARC) and 60% of Mariveles Landco Corporation (MLC). PGL is a holding company incorporated in the British Virgin Islands. POGM is a holding company incorporated under the laws of Mauritius. POGM owns an offshore subsidiary Petron Oil and Gas International Sdn. Bhd. (POGI). As of December 31, 2021 and 2020, POGI owns 73.4% of Petron Malaysia Refining & Marketing Bhd (PMRMB) and 100% of both Petron Fuel International Sdn Bhd (PFISB) and Petron Oil (M) Sdn Bhd (POMSB), collectively hereinafter referred to as “Petron Malaysia”. Petron Malaysia is involved in the refining and marketing of petroleum products in Malaysia. PFL is a holding company incorporated under the laws of Labuan, Malaysia.
- 4 -
PAHL is a holding company incorporated in Hong Kong in March 2008. As of December 31, 2021 and 2020, PAHL owns 100% of Robinsons International Holdings Limited (RIHL) which owns 100% of Philippine Polypropylene, Inc. (PPI) and 40% of MLC. A subsidiary is an entity controlled by the Group. The Group controls an entity if and only if, the Group is exposed to, or has rights to, variable returns from its involvement with the entity and has the ability to affect those returns through its power over the entity. The Group reassesses whether or not it controls an investee if facts and circumstances indicate that there are changes to one or more of the three elements of control. When the Group has less than majority of the voting or similar rights of an investee, the Group considers all relevant facts and circumstances in assessing whether it has power over an investee, including the contractual arrangement with the other vote holders of the investee, rights arising from other contractual arrangements and the Group’s voting rights and potential voting rights. The financial statements of the subsidiaries are included in the consolidated financial statements from the date when the Group obtains control and continue to be consolidated until the date when such control ceases. The financial statements of the subsidiaries are prepared for the same reporting period as the Parent Company, using uniform accounting policies for like transactions and other events in similar circumstances. Intergroup balances and transactions, including intergroup unrealized profits and losses, are eliminated in preparing the consolidated financial statements. Non-controlling interests represent the portion of consolidated statements of income and net assets not attributable to the Parent Company and are presented in the consolidated statements of income, consolidated statements of comprehensive income and within equity in the consolidated statements of financial position, separately from the equity attributable to equity holders of the Parent Company. Non-controlling interests represent the interests not held by the Parent Company in NVRC and PMRMB in 2021 and 2020. A change in the ownership interest of a subsidiary, without loss of control, is accounted for as an equity transaction. If the Group loses control over a subsidiary, the Group: (i) derecognizes the assets (including goodwill) and liabilities of the subsidiary, the carrying amount of any non-controlling interests and the cumulative transaction differences recorded in equity; (ii) recognizes the fair value of the consideration received, the fair value of any investment retained and any surplus or deficit in consolidated statements of income; and (iii) reclassify the Parent Company’s share of components previously recognized in other comprehensive income (OCI) to consolidated statements of income or retained earnings, as appropriate, as would be required if the Group had directly disposed of the related assets or liabilities.
- 5 -
3. Significant Accounting Policies The accounting policies set out below have been applied consistently to all periods presented in these consolidated financial statements, except for the changes in accounting policies as explained below. Adoption of New or Revised Standards, Amended to Standards and Interpretations The Group has adopted the following new and amended standards and interpretations starting January 1, 2021 and accordingly, changed its accounting policies. Except as otherwise indicated, the adoption of the new and amended standards and interpretations did not have a material effect on the Group’s consolidated financial statements. Coronavirus Disease 2019 (COVID-19) - Related Rent Concessions
(Amendments to PFRS 16, Leases). The amendments introduce an optional practical expedient that simplifies how a lessee accounts for rent concessions that are a direct consequence of COVID-19. A lessee that applies the practical expedient is not required to assess whether eligible rent concessions are lease modifications, and accounts for them in accordance with other applicable guidance. The practical expedient apply if:
• the revised consideration is substantially the same or less than the original consideration;
• the reduction in lease payments relates to payments due on or before June 30, 2021; and
• no other substantive changes have been made to the terms of the lease. Lessees applying the practical expedient are required to disclose that fact, whether they have applied the practical expedient to all eligible rent concessions and, if not, the nature of the contracts to which they have applied the practical expedient; and the amount recognized in profit or loss for the reporting period arising from application of the practical expedient. No practical expedient is provided for lessors. A lessee applies the amendments retrospectively, recognizing the cumulative effect of the amendments as an adjustment to the opening balance of retained earnings or other component of equity, as appropriate.
Standards Issued But Not Yet Adopted A number of new standards and amendments to standards are effective for annual periods beginning after January 1, 2021. However, the Group has not early adopted the following new or amended standards in preparing these consolidated financial statements. Unless otherwise stated, none of these are expected to have a significant impact on the Group’s consolidated financial statements. The Group will adopt the following new and amended standards on the respective effective dates: COVID-19-Related Rent Concessions beyond 30 June 2021 (Amendment to
PFRS 16 Leases). The amendment extends the practical expedient introduced in the 2020 amendment which simplified how a lessee accounts for rent concessions that are a direct consequence of COVID-19, permitting lessees to apply the practical expedient to rent concessions for which any reduction in lease payments affects only payments originally due on or before June 30, 2022.
- 6 -
The amendment is effective for annual reporting periods beginning on or after April 1, 2021. Earlier application is permitted. A lessee applies the amendments retrospectively, recognizing the cumulative effect of the amendments as an adjustment to the opening balance of retained earnings or other component of equity, as appropriate. The adoption is mandatory for lessees that chose to apply the practical expedient introduced by the 2020 amendments and may result in reversal of lease modifications that was ineligible for the practical expedient under the 2020 amendments, but becomes eligible as a result of the extension.
Property, Plant and Equipment - Proceeds before Intended Use (Amendments to
PAS 16, Property, Plant and Equipment). The amendments prohibit an entity from deducting from the cost of an item of property, plant and equipment the proceeds from selling items produced before that asset is available for use. The proceeds before intended use should be recognized in profit or loss, together with the costs of producing those items which are identified and measured in accordance with PAS 2, Inventories. The amendments also clarify that testing whether an item of property, plant and equipment is functioning properly means assessing its technical and physical performance rather than assessing its financial performance. For the sale of items that are not part of an entity’s ordinary activities, the amendments require the company to disclose separately the sales proceeds and related production cost recognized in profit or loss and specify the line items in which such proceeds and costs are included in the statement of comprehensive income. This disclosure is not required if such proceeds and cost are presented separately in the statement of comprehensive income. The amendments are effective for annual reporting periods beginning on or after January 1, 2022. Earlier application is permitted. The amendments apply retrospectively, but only to items of property, plant and equipment made available for use on or after the beginning of the earliest period presented in the financial statements in which an entity first applies the amendments.
Onerous Contracts - Cost of Fulfilling a Contract (Amendments to PAS 37, Provisions, Contingent Liabilities and Contingent Assets). The amendments clarify that the cost of fulfilling a contract when assessing whether a contract is onerous includes all costs that relate directly to a contract - i.e. it comprise both incremental costs and an allocation of other direct costs. The amendments are effective for annual reporting periods beginning on or after January 1, 2022 to contracts existing at the date when the amendments are first applied. At the date of initial application, the cumulative effect of applying the amendments is recognized as an opening balance adjustment to retained earnings or other component of equity, as appropriate. The comparatives are not restated. Earlier application is permitted.

- 7 -
Annual Improvements to PFRS Standards 2018-2020. This cycle of improvements contains amendments to four standards of which the following are applicable to the Group:
• Fees in the ‘10 per cent’ Test for Derecognition of Financial Liabilities (Amendment to PFRS 9). The amendment clarifies that for the purpose of performing the ’10 per cent’ test for derecognition of financial liabilities, the fees paid net of fees received included in the discounted cash flows include only fees paid or received between the borrower and the lender, including fees paid or received by either the borrower or lender on the other’s behalf. It applies to financial liabilities that are modified or exchanged on or after the beginning of the annual reporting period in which the entity first applies the amendment.
• Lease Incentives (Amendment to Illustrative Examples accompanying PFRS 16). The amendment deletes from the Illustrative Example 13 the reimbursement relating to leasehold improvements to remove the potential for confusion because the example had not explained clearly enough the conclusion as to whether the reimbursement would meet the definition of a lease incentive in PFRS 16.
• Taxation in Fair Value Measurements (Amendment to PAS 41, Agriculture). The amendment removes the requirement to exclude cash flows for taxation when measuring fair value, thereby aligning the fair value measurement requirements in PAS 41 with those in PFRS 13, Fair Value Measurement. It applies to fair value measurements on or after the beginning of the first annual reporting period beginning on or after January 1, 2022.
The amendments are effective for annual reporting periods beginning on or after January 1, 2022. Earlier application is permitted.
Reference to the Conceptual Framework (Amendment to PFRS 3, Business
Combinations). The amendments:
• updated PFRS 3 so that it now refers to the 2018 Conceptual Framework;
• added a requirement that, for transactions and other events within the scope of PAS 37 or IFRIC 21, Levies, an acquirer applies PAS 37 or IFRIC 21 instead of the Conceptual Framework to identify the liabilities it has assumed in a business combination; and
• added an explicit statement that an acquirer does not recognize contingent assets acquired in a business combination.
The amendments are effective for business combinations occurring in reporting periods starting on or after January 1, 2022. Earlier application is permitted.
Classification of Liabilities as Current or Noncurrent (Amendments to PAS 1,
Presentation of Financial Statements). To promote consistency in application and clarify the requirements on determining whether a liability is current or noncurrent, the amendments:
• removed the requirement for a right to defer settlement of a liability for at least 12 months after the reporting period to be unconditional and instead requires that the right must have substance and exist at the end of the reporting period;
- 8 -
• clarified that a right to defer settlement exists only if an entity complies with conditions specified in the loan agreement at the end of the reporting period, even if the lender does not test compliance until a later date; and
• clarified that settlement of a liability includes transferring an entity’s own equity instruments to the counterparty, but conversion options that are classified as equity do not affect classification of the liability as current or noncurrent.
The amendments apply retrospectively for annual reporting periods beginning on or after January 1, 2023, with early application permitted. In November 2021, the International Accounting Standards Board issued the Exposure Draft, Non-Current Liabilities with Covenants after considering stakeholder feedback on the December 2020 tentative agenda decision issued by the IFRS Interpretations Committee about the amendments. The exposure draft proposes to again amend IAS 1 as follows:
• Conditions which the entity must comply within twelve months after the reporting period will have no effect on the classification as current or non-current.
• Additional disclosure requirements will apply to non-current liabilities subject to such conditions to enable the assessment of the risk that the liability could become repayable within twelve months.
• Separate presentation in the statement of financial position will be required for non-current liabilities for which the right to defer settlement is subject to conditions within 12 months after the reporting period.
• The effective date of the amendments will be deferred to no earlier than January 1, 2024.
Comments on the Exposure Draft is due on March 21, 2022.
Definition of Accounting Estimates (Amendments to PAS 8, Accounting Policies,
Changes in Accounting Estimates and Errors). To clarify the distinction between changes in accounting policies and changes in accounting estimates, the amendments introduce a new definition for accounting estimates, clarifying that they are monetary amounts in the financial statements that are subject to measurement uncertainty. The amendments also clarify the relationship between accounting policies and accounting estimates by specifying that an accounting estimate is developed to achieve the objective set out by an accounting policy. Developing an accounting estimate includes both selecting a measurement technique and choosing the inputs to be used when applying the chosen measurement technique. The effects of changes in such inputs or measurement techniques are changes in accounting estimates. The definition of accounting policies remain unchanged. The amendments also provide examples on the application of the new definition. The amendments are effective for annual reporting periods beginning on or after January 1, 2023, with earlier application permitted, and will apply prospectively to changes in accounting estimates and changes in accounting policies occurring on or after the beginning of the first annual reporting period in which the amendments are applied.
- 9 -
Disclosure of Accounting Policies (Amendments to PAS 1 and PFRS Practice Statement 2, Making Materiality Judgments). The amendments are intended to help companies provide useful accounting policy disclosures. The key amendments to PAS 1 include:
• requiring companies to disclose their material accounting policies rather than their significant accounting policies;
• clarifying that accounting policies related to immaterial transactions, other events or conditions are themselves immaterial and as such need not be disclosed; and
• clarifying that not all accounting policies that relate to material transactions, other events or conditions are themselves material to a company’s financial statements.
The amendments to PFRS Practice Statement 2 includes guidance and additional examples on the application of materiality to accounting policy disclosures. The amendments are effective from January 1, 2023. Earlier application is permitted.
Deferred Tax related to Assets and Liabilities arising from a Single Transaction
(Amendments to PAS 12, Income Taxes). The amendments clarify that that the initial recognition exemption does not apply to transactions that give rise to equal taxable and deductible temporary differences such as leases and decommissioning obligations. The amendments apply for annual reporting periods beginning on or after January 1, 2023. Earlier application is permitted. For leases and decommissioning liabilities, the associated deferred tax assets and liabilities will be recognized from the beginning of the earliest comparative period presented, with any cumulative effect recognized as an adjustment to retained earnings or other appropriate component of equity at that date. For all other transactions, the amendments apply to transactions that occur after the beginning of the earliest period presented.
PFRS 17, Insurance Contracts, replaces the interim standard, PFRS 4 Insurance
Contracts. Reflecting the view that an insurance contract combines features of both a financial instrument and a service contract, and considering the fact that many insurance contracts generate cash flows with substantial variability over a long period, PFRS 17 introduces a new approach that: a) combines current measurement of the future cash flows with the recognition
of profit over the period services are provided under the contract; b) presents insurance service results (including presentation of insurance
revenue) separately from insurance finance income or expenses; and c) requires an entity to make an accounting policy choice portfolio-by-portfolio
of whether to recognize all insurance finance income or expenses for the reporting period in profit or loss or to recognize some of that income or expenses in other comprehensive income.
Under PFRS 17, groups of insurance contracts are measured based on fulfilment cash flows, which represent the risk-adjusted present value of the entity’s rights and obligations to the policy holders, and a contractual service margin, which represents the unearned profit the entity will recognize as it provides services over the coverage period. Subsequent to initial recognition, the liability of a group of insurance contracts represents the liability for remaining coverage and the liability for incurred claims, with the fulfilment cash flows remeasured at each reporting date to reflect current estimates.

- 10 -
Simplifications or modifications to the general measurement model apply to groups of insurance contracts measured using the ‘premium allocation approach’, investment contracts with discretionary participation features, and reinsurance contracts held. PFRS 17 brings greater comparability and transparency about the profitability of new and in-force business and gives users of financial statements more insight into an insurer’s financial health. Separate presentation of underwriting and financial results will give added transparency about the sources of profits and quality of earnings. PFRS 17 is effective for annual periods beginning on or after January 1, 2025. Full retrospective application is required, unless it is impracticable, in which case the entity chooses to apply the modified retrospective approach or the fair value approach. However, if the entity cannot obtain reasonable and supportable information necessary to apply the modified retrospective approach, then it applies the fair value approach. There is also a transition option allowing presentation of comparative information about financial assets using a classification overlay approach on a basis that is more consistent with how PFRS 9 will be applied in future reporting periods. Early application is permitted for entities that apply PFRS 9 Financial Instruments on or before the date of initial application of PFRS 17.
Deferral of the local implementation of Amendments to PFRS 10, Consolidated Financial Statements, and PAS 28, Investments in Associates and Joint Ventures: Sale or Contribution of Assets between an Investor and its Associate or Joint Venture. Sale or Contribution of Assets between an Investor and its Associate or Joint
Venture (Amendments to PFRS 10 and PAS 28). The amendments address an inconsistency in the requirements in PFRS 10 and PAS 28 in dealing with the sale or contribution of assets between an investor and its associate or joint venture. The amendments require that a full gain or loss is recognized when a transaction involves a business (whether it is housed in a subsidiary or not). A partial gain or loss is recognized when a transaction involves assets that do not constitute a business, even if these assets are housed in a subsidiary. Originally, the amendments apply prospectively for annual periods beginning on or after January 1, 2016, with early adoption permitted. However, on January 13, 2016, the FRSC decided to postpone the effective date until the IASB has completed its broader review of the research project on equity accounting that may result in the simplification of accounting for such transactions and of other aspects of accounting for associates and joint ventures.
Current versus Noncurrent Classification The Group presents assets and liabilities in the consolidated statements of financial position based on current and noncurrent classification. An asset is current when it is: (a) expected to be realized or intended to be sold or consumed in the normal operating cycle; (b) held primarily for the purpose of trading; (c) expected to be realized within 12 months after the reporting period; or (d) cash or cash equivalent unless restricted from being exchanged or used to settle a liability for at least 12 months after the reporting period.
- 11 -
A liability is current when: (a) it is expected to be settled in the normal operating cycle; (b) it is held primarily for trading; (c) it is due to be settled within 12 months after the reporting period; or (d) there is no unconditional right to defer the settlement of the liability for at least 12 months after the reporting period. The Group classifies all other assets and liabilities as noncurrent. Deferred tax assets and liabilities are classified as noncurrent. Financial Instruments Recognition and Initial Measurement. A financial instrument is any contract that gives rise to a financial asset of one entity and a financial liability or equity instrument of another entity. The Group recognizes a financial asset or a financial liability in the consolidated statements of financial position when it becomes a party to the contractual provisions of the instrument. A financial asset (unless a trade receivable without a significant financing component) or financial liability is initially measured at the fair value of the consideration given or received. The initial measurement of financial instruments, except for those designated as at FVPL, includes transaction costs. A trade receivable without a significant financing component is initially measured at the transaction price. Financial Assets The Group classifies its financial assets, at initial recognition, as subsequently measured at amortized cost, FVOCI and FVPL. The classification depends on the contractual cash flow characteristics of the financial assets and the business model of the Group for managing the financial assets. Subsequent to initial recognition, financial assets are not reclassified unless the Group changes the business model for managing financial assets. All affected financial assets are reclassified on the first day of the reporting period following the change in the business model. The business model refers to how the Group manages the financial assets in order to generate cash flows. The business model determines whether cash flows will result from collecting contractual cash flows, selling the financial assets, or both. The Group considers the following information in assessing the objective of the business model in which a financial asset is held at a portfolio level, which reflects the way the business is managed and information is provided to management: the stated policies and objectives for the portfolio and the operation of those
policies in practice; how the performance of the portfolio is evaluated and reported to the Group’s
management; the risks that affect the performance of the business model (and the financial
assets held within that business model) and how those risks are managed; how employees of the business are compensated; and the frequency, volume and timing of sales of financial assets in prior periods, the
reasons for such sales and expectations about future sales activity.
- 12 -
The Group considers the contractual terms of the instrument in assessing whether the contractual cash flows are solely payments of principal and interest. For purposes of this assessment, “principal” is defined as the fair value of the financial asset on initial recognition. “Interest” is defined as consideration for the time value of money and for the credit risk associated with the principal amount outstanding during a particular period of time for other basic lending risks and costs (e.g., liquidity risk and administrative costs), as well as profit margin. The assessment includes whether the financial asset contains a contractual term that could change the timing or amount of contractual cash flows such that it would not meet this condition. The Group considers the following in making the assessment: contingent events that would change the amount or timing of cash flows; terms that may adjust the contractual coupon rate, including variable rate
features; prepayment and extension features; and terms that limit the Group’s claim to cash flows from specified assets. A prepayment feature is consistent with the solely payments of principal and interest criterion if the prepayment amount substantially represents unpaid amounts of principal and interest on the principal amount outstanding, which may include reasonable additional compensation for early termination of the contract. Additionally, for a financial asset acquired at a discount or premium to its contractual par amount, a feature that permits or requires prepayment at an amount that substantially represents the contractual par amount plus accrued (but unpaid) contractual interest (which may also include reasonable additional compensation for early termination) is treated as consistent with this criterion if the fair value of the prepayment feature is insignificant at initial recognition. For purposes of subsequent measurement, financial assets are classified in the following categories: financial assets at amortized cost, financial assets at FVOCI (with or without recycling of cumulative gains and losses) and financial assets at FVPL. Financial Assets at Amortized Cost. A financial asset is measured at amortized cost if it meets both of the following conditions and is not designated as at FVPL: it is held within a business model with the objective of holding financial assets to
collect contractual cash flows; and its contractual terms give rise on specified dates to cash flows that are solely
payments of principal and interest on the principal amount outstanding. Financial assets at amortized cost are subsequently measured using the effective interest method and are subject to impairment. Gains and losses are recognized in the consolidated statements of income when the financial asset is derecognized, modified or impaired. The Group’s cash and cash equivalents, trade and other receivables, investment in debt instruments at amortized cost, noncurrent receivables and deposits, and restricted cash are included under this category. Cash includes cash on hand and in banks. Cash equivalents are short-term, highly liquid investments that are readily convertible to known amounts of cash and are subject to an insignificant risk of changes in value.
- 13 -
Financial Assets at FVOCI. Investment in debt instruments is measured at FVOCI if it meets both of the following conditions and is not designated as at FVPL: it is held within a business model whose objective is achieved by both collecting
contractual cash flows and selling the financial assets; and its contractual terms give rise on specified dates to cash flows that are solely
payments of principal and interest on the principal amount outstanding. At initial recognition of an investment in equity instrument that is not held for trading, the Group may irrevocably elect to present subsequent changes in the fair value in other comprehensive income. This election is made on an instrument-by-instrument basis. Financial assets at FVOCI are subsequently measured at fair value. Changes in fair value are recognized in other comprehensive income. Interest income calculated using the effective interest method, foreign exchange gains and losses and impairment on investment in debt instruments are recognized in the consolidated statements of income. When investment in debt instruments at FVOCI is derecognized, the related accumulated gains or losses previously reported in the consolidated statements of changes in equity are transferred to and recognized in the consolidated statements of income. Dividends earned on holding an investment in equity instrument are recognized as dividend income in the consolidated statements of income when the right to receive the payment has been established, unless the dividend clearly represents a recovery of the part of the cost of the investment. When investment in equity instruments at FVOCI is derecognized, the related accumulated gains or losses previously reported in the consolidated statements of changes in equity are never reclassified to the consolidated statements of income. The Group’s investments in equity and debt instruments at FVOCI are classified under this category. Financial Assets at FVPL. All financial assets not classified as measured at amortized cost or FVOCI are measured at FVPL. This includes derivative financial assets that are not designated as cash flow hedge. Financial assets that are held for trading or are managed and whose performance is evaluated on a fair value basis are measured at FVPL. At initial recognition, the Group may irrevocably designate a financial asset as at FVPL if the designation eliminates or significantly reduces an accounting mismatch that would otherwise arise from measuring assets or liabilities or recognizing the gains and losses on different bases. The Group carries financial assets at FVPL using their fair values. Attributable transaction costs are recognized in the consolidated statements of income as incurred. Changes in fair value and realized gains or losses are recognized in the consolidated statements of income. Fair value changes from derivatives accounted for as part of an effective cash flow hedge are recognized in other comprehensive income. Any interest earned from investment in debt instrument designated as at FVPL is recognized in the consolidated statements of income. Any dividend income from investment in equity instrument is recognized in the consolidated statements of income when the right to receive payment has been established, unless the dividend clearly represents a recovery of the part of the cost of the investment.
- 14 -
The Group’s derivative assets that are not designated as cash flow hedge and investments in equity instruments at FVPL are classified under this category. Financial Liabilities The Group determines the classification of its financial liabilities, at initial recognition, in the following categories: financial liabilities at FVPL and other financial liabilities. All financial liabilities are recognized initially at fair value and, in the case of loans and borrowings, net of directly attributable transaction costs. Financial Liabilities at FVPL. Financial liabilities are classified under this category through the fair value option. Derivative instruments (including embedded derivatives) with negative fair values, except those covered by hedge accounting relationships, are also classified under this category. The Group carries financial liabilities at FVPL using their fair values and reports fair value changes in the consolidated statements of income. Fair value changes from derivatives accounted for as part of an effective accounting hedge are recognized in other comprehensive income and presented in the consolidated statements of changes in equity. Any interest expense incurred is recognized as part of “Interest expense and other financing charges” account in the consolidated statements of income. The Group’s derivative liabilities that are not designated as cash flow hedge are classified under this category. Other Financial Liabilities. This category pertains to financial liabilities that are not designated or classified as at FVPL. After initial measurement, other financial liabilities are carried at amortized cost using the effective interest method. Amortized cost is calculated by taking into account any premium or discount and any directly attributable transaction costs that are considered an integral part of the effective interest rate of the liability. The effective interest rate amortization is included in “Interest expense and other financing charges” account in the consolidated statements of income. Gains and losses are recognized in the consolidated statements of income when the liabilities are derecognized as well as through the amortization process. Debt issue costs are considered as an adjustment to the effective yield of the related debt and are deferred and amortized using the effective interest method. When a loan is paid, the related unamortized debt issue costs at the date of repayment are recognized in the consolidated statements of income. The Group’s liabilities arising from its trade transactions or borrowings such as loans payable, accounts payable and accrued expenses, long-term debt, lease liabilities and other noncurrent liabilities are included under this category. Derecognition of Financial Assets and Financial Liabilities Financial Assets. A financial asset (or, where applicable, a part of a financial asset or part of a group of similar financial assets) is primarily derecognized when: the rights to receive cash flows from the asset have expired; or the Group has transferred its rights to receive cash flows from the asset or has
assumed an obligation to pay them in full without material delay to a third party under a “pass-through” arrangement; and either: (a) has transferred substantially all the risks and rewards of the asset; or (b) has neither transferred nor retained substantially all the risks and rewards of the asset, but has transferred control of the asset.
- 15 -
When the Group has transferred its rights to receive cash flows from an asset or has entered into a pass-through arrangement, it evaluates if and to what extent it has retained the risks and rewards of ownership. When it has neither transferred nor retained substantially all the risks and rewards of the asset nor transferred control of the asset, the Group continues to recognize the transferred asset to the extent of the Group’s continuing involvement. In that case, the Group also recognizes the associated liability. The transferred asset and the associated liability are measured on the basis that reflects the rights and obligations that the Group has retained. Continuing involvement that takes the form of a guarantee over the transferred asset is measured at the lower of the original carrying amount of the asset and the maximum amount of consideration that the Group is required to repay. Financial Liabilities. A financial liability is derecognized when the obligation under the liability is discharged or cancelled, or expires. When an existing financial liability is replaced by another from the same lender on substantially different terms, or the terms of an existing liability are substantially modified, such an exchange or modification is treated as a derecognition of the original liability and the recognition of a new liability. The difference in the respective carrying amounts is recognized in the consolidated statements of income. Impairment of Financial Assets The Group recognizes allowance for expected credit loss (ECL) on financial assets at amortized cost and investments in debt instruments at FVOCI. ECLs are probability-weighted estimates of credit losses. Credit losses are measured as the present value of all cash shortfalls (i.e., the difference between the cash flows due to the Group in accordance with the contract and the cash flows that the Group expects to receive), discounted at the effective interest rate of the financial asset, and reflects reasonable and supportable information that is available without undue cost or effort about past events, current conditions and forecasts of future economic conditions. The Group recognizes an allowance for impairment based on either 12-month or lifetime ECLs, depending on whether there has been a significant increase in credit risk since initial recognition. When determining whether the credit risk of a financial asset has increased significantly since initial recognition and when estimating ECLs, the Group considers reasonable and supportable information that is relevant and available without undue cost or effort. This includes both quantitative and qualitative information and analysis, based on the Group’s historical experience and informed credit assessment and including forward-looking information. The Group recognizes lifetime ECLs for receivables that do not contain significant financing component. The Group uses provision matrix that is based on the Group’s historical credit loss experience, adjusted for forward-looking factors specific to the borrowers and the economic environment. At each reporting date, the Group assesses whether these financial assets at amortized cost and investments in debt instruments at FVOCI are credit-impaired. A financial asset is credit-impaired when one or more events that have a detrimental impact on the estimated future cash flows of the financial asset have occurred. Evidence that a financial asset is credit-impaired include observable data about the following events: (a) significant financial difficulty of the issuer or the borrower;
- 16 -
(b) a breach of contract, such as a default or past due event; (c) the restructuring of a financial asset by the Group on terms that the Group would
not consider otherwise; (d) it is becoming probable that the borrower will enter bankruptcy or other financial
reorganization; or (e) the disappearance of an active market for that financial asset because of
financial difficulties. The Group considers a financial asset to be in default when a counterparty fails to pay its contractual obligations, or there is a breach of other contractual terms, such as covenants. The Group directly reduces the gross carrying amount of a financial asset when there is no reasonable expectation of recovering the contractual cash flows on a financial asset, either partially or in full. This is generally the case when the Group determines that the borrower does not have assets or sources of income that could generate sufficient cash flows to repay the amounts subject to the write-off. However, financial assets that are written off could still be subject to enforcement activities in order to comply with the Group's procedures for recovery of amounts due. The ECLs on financial assets at amortized cost are recognized as allowance for impairment losses against the gross carrying amount of the financial asset, with the resulting impairment losses (or reversals) recognized in the consolidated statements of income. The ECLs on investments in debt instruments at FVOCI are recognized as accumulated impairment losses in other comprehensive income, with the resulting impairment losses (or reversals) recognized in the consolidated statements of income. Classification of Financial Instruments between Liability and Equity Financial instruments are classified as liability or equity in accordance with the substance of the contractual arrangement. Interest, dividends, gains and losses relating to a financial instrument or a component that is a financial liability, are reported as expense or income. Distributions to holders of financial instruments classified as equity are charged directly to equity, net of any related income tax benefits. A financial instrument is classified as liability if it provides for a contractual obligation to: deliver cash or another financial asset to another entity; exchange financial assets or financial liabilities with another entity under
conditions that are potentially unfavorable to the Group; or satisfy the obligation other than by the exchange of a fixed amount of cash or
another financial asset for a fixed number of own equity shares. The components of issued financial instruments that contain both liability and equity elements are accounted for separately, with the equity component being assigned the residual amount after deducting from the instrument as a whole or in part, the amount separately determined as the fair value of the liability component on the date of issue.
- 17 -
Offsetting Financial Instruments Financial assets and financial liabilities are offset and the net amount is reported in the consolidated statements of financial position if, and only if, there is a currently enforceable legal right to offset the recognized amounts and there is an intention to settle on a net basis, or to realize the assets and settle the liabilities simultaneously. Derivative Financial Instruments and Hedge Accounting The Group uses derivative financial instruments, such as forwards, swaps and options to manage its exposure on foreign currency, interest rate and commodity price risks. Derivative financial instruments are initially recognized at fair value on the date the derivative contract is entered into and are subsequently remeasured at fair value. Derivatives are carried as financial assets when the fair value is positive and as financial liabilities when the fair value is negative. Changes in the fair value of derivatives that are not designated as hedging instruments are recognized in the consolidated statements of income. Freestanding Derivatives The Group designates certain derivatives as hedging instruments to hedge the exposure to variability in cash flows associated with recognized liabilities arising from changes in foreign exchange rates and interest rates. At the inception of a hedge relationship, the Group formally designates and documents the hedge relationship to which the Group wishes to apply hedge accounting and the risk management objective and strategy for undertaking the hedge. The Group also documents the economic relationship between the hedged item and the hedging instrument, including whether the changes in cash flows of the hedging instrument are expected to offset the changes in cash flows of the hedged item. Cash Flow Hedge. When a derivative is designated as a cash flow hedging instrument, the effective portion of changes in the fair value of the derivative is recognized in other comprehensive income and presented in the “Hedging reserve” account in the consolidated statements of changes in equity. The effective portion of changes in the fair value of the derivative that is recognized in other comprehensive income is limited to the cumulative change in fair value of the hedged item. Any ineffective portion of changes in the fair value of the derivative is recognized immediately in the consolidated statements of income. The Group designates only the intrinsic value of options and the change in fair value of the spot element of forward contracts as the hedging instrument in cash flow hedging relationships. The change in fair value of the time value of options, the forward element of forward contracts and the foreign currency basis spread of financial instruments are separately accounted for as cost of hedging and recognized in other comprehensive income. The cost of hedging is removed from other comprehensive income and recognized in the consolidated statements of income, either over the period of the hedge if the hedge is time related, or when the hedged transaction affects the consolidated statements of income if the hedge is transaction related. When the hedged transaction subsequently results in the recognition of a non-financial item, the amount accumulated in equity is transferred and included in the initial cost of the hedged asset or liability. For all other hedged transactions, the amount accumulated in equity is reclassified to the consolidated statements of income as a reclassification adjustment in the same period or periods during which the hedged cash flows affect the consolidated statements of income.
- 18 -
If the hedge no longer meets the criteria for hedge accounting or the hedging instrument expires, is sold, is terminated or is exercised, hedge accounting is discontinued prospectively. The amount that has been accumulated in equity is: (a) retained until it is included in the cost of non-financial item on initial recognition, for a hedge of a transaction resulting in the recognition of a non-financial item; or (b) reclassified to the consolidated statements of income as a reclassification adjustment in the same period or periods as the hedged cash flows affect the consolidated statements of income, for other cash flow hedges. If the hedged future cash flows are no longer expected to occur, the amounts that have been accumulated in equity are immediately reclassified to the consolidated statements of income. The Group has outstanding derivatives accounted for as cash flow hedge as at December 31, 2021 and 2020 (Note 36). Embedded Derivatives The Group assesses whether embedded derivatives are required to be separated from the host contracts when the Group becomes a party to the contract. An embedded derivative is separated from the host contract and accounted for as a derivative if all of the following conditions are met: (a) the economic characteristics and risks of the embedded derivative are not
closely related to the economic characteristics and risks of the host contract; (b) a separate instrument with the same terms as the embedded derivative would
meet the definition of a derivative; and (c) the hybrid or combined instrument is not recognized as at FVPL. However, an embedded derivative is not separated if the host contract is a financial asset. Reassessment only occurs if there is a change in the terms of the contract that significantly modifies the cash flows that would otherwise be required. Embedded derivatives that are bifurcated from the host contracts are accounted for either as financial assets or financial liabilities at FVPL. The Group has embedded derivatives as at December 31, 2021 and 2020 (Note 36). Inventories Inventories are carried at the lower of cost and net realizable value (NRV). For petroleum products and crude oil, the NRV is the estimated selling price in the ordinary course of business, less the estimated costs to complete and/or market and distribute. For financial reporting purposes, the Group uses the first-in, first-out method in costing petroleum products and crude oil. Cost is determined using the moving-average method in costing lubes and greases, blending components, polypropylene, materials and supplies inventories. For income tax reporting purposes, cost of all inventories is determined using the moving-average method. For financial reporting purposes, duties and taxes related to the acquisition of inventories are capitalized as part of inventory cost. For income tax reporting purposes, such duties and taxes are treated as deductible expenses in the year these charges are incurred.
- 19 -
Prepaid Expenses and Other Current Assets Prepaid expenses represent expenses not yet incurred but already paid in cash. These are initially recorded as assets and measured at the amount of cash paid. Subsequently, these are recognized in the consolidated statements of income as they are consumed or expire with the passage of time. Other current assets pertain to assets which are expected to be realized within 12 months after the reporting period. Otherwise, these are classified as noncurrent assets. Business Combination Business combinations are accounted for using the acquisition method. The cost of an acquisition is measured as the aggregate of the consideration transferred, measured at acquisition date fair value, and the amount of any non-controlling interests in the acquiree. For each business combination, the Group elects whether to measure the non-controlling interests in the acquiree at fair value or at proportionate share of the acquiree’s identifiable net assets. Acquisition-related costs are expensed as incurred and included as part of “Selling and administrative expenses” account in the consolidated statements of income. When the Group acquires a business, it assesses the financial assets and financial liabilities assumed for appropriate classification and designation in accordance with the contractual terms, economic circumstances and pertinent conditions as at the acquisition date. If the business combination is achieved in stages, the acquisition date fair value of the acquirer’s previously held equity interest in the acquiree is remeasured at the acquisition date fair value and any resulting gain or loss is recognized in the consolidated statements of income. The Group measures goodwill at the acquisition date as: a) the fair value of the consideration transferred; plus b) the recognized amount of any non-controlling interests in the acquiree; plus c) if the business combination is achieved in stages, the fair value of the existing equity interest in the acquiree; less d) the net recognized amount (generally fair value) of the identifiable assets acquired and liabilities assumed. When the excess is negative, a bargain purchase gain is recognized immediately in the consolidated statements of income. Subsequently, goodwill is measured at cost less any accumulated impairment in value. Goodwill is reviewed for impairment, annually or more frequently, if events or changes in circumstances indicate that the carrying amount may be impaired. The consideration transferred does not include amounts related to the settlement of pre-existing relationships. Such amounts are generally recognized in the consolidated statements of income. Costs related to the acquisition, other than those associated with the issuance of debt or equity securities that the Group incurs in connection with a business combination, are expensed as incurred. Any contingent consideration payable is measured at fair value at the acquisition date. If the contingent consideration is classified as equity, it is not remeasured and settlement is accounted for within equity. Otherwise, subsequent changes to the fair value of the contingent consideration are recognized in the consolidated statements of income. Goodwill in a Business Combination
Goodwill acquired in a business combination is, from the acquisition date, allocated to each of the cash-generating units, or groups of cash-generating units that are expected to benefit from the synergies of the combination, irrespective of whether other assets or liabilities are assigned to those units or groups of units.
- 20 -
Each unit or group of units to which the goodwill is allocated:
• represents the lowest level within the Group at which the goodwill is monitored for internal management purposes; and
• is not larger than an operating segment determined in accordance with PFRS 8, Operating Segments.
Impairment is determined by assessing the recoverable amount of the cash-generating unit or group of cash-generating units, to which the goodwill relates. Where the recoverable amount of the cash-generating unit or group of cash-generating units is less than the carrying amount, an impairment loss is recognized. Where goodwill forms part of a cash-generating unit or group of cash-generating units and part of the operation within that unit is disposed of, the goodwill associated with the operation disposed of is included in the carrying amount of the operation when determining the gain or loss on disposal of the operation. Goodwill disposed of in this circumstance is measured based on the relative values of the operation disposed of and the portion of the cash-generating unit retained. An impairment loss with respect to goodwill is not reversed.
Intangible Assets Acquired in a Business Combination
The cost of an intangible asset acquired in a business combination is the fair value as at the date of acquisition, determined using discounted cash flows as a result of the asset being owned. Following initial recognition, intangible asset is carried at cost less any accumulated amortization and impairment losses, if any. The useful life of an intangible asset is assessed to be either finite or indefinite. An intangible asset with finite life is amortized over the useful economic life and assessed for impairment whenever there is an indication that the intangible asset may be impaired. The amortization period and the amortization method for an intangible asset with a finite useful life are reviewed at least at each reporting date. A change in the expected useful life or the expected pattern of consumption of future economic benefits embodied in the asset is accounted for as a change in accounting estimate. The amortization expense on intangible asset with finite life is recognized in the consolidated statements of income.
Business Combinations under Common Control The Group accounts for business combinations involving entities that are ultimately controlled by the same ultimate parent before and after the business combination and the control is not transitory, using the pooling of interests method. The assets and liabilities of the combining entities are reflected in the consolidated statements of financial position at their carrying amounts. No adjustments are made to reflect fair values, or recognize any new assets or liabilities, at the date of the combination. The only adjustments are those to align accounting policies between the combining entities. No new goodwill is recognized as a result of the business combination. The only goodwill that is recognized is any existing goodwill relating to either of the combining entities. Any difference between the consideration paid or transferred and the equity acquired is recognized in equity. The consolidated statements of income reflect the results of the combining entities for the full year, irrespective of when the combination took place.
- 21 -
Comparatives are presented as if the entities had been combined for the period that the entities were under common control. Non-controlling Interests The acquisitions of non-controlling interests are accounted for as transactions with owners in their capacity as owners and therefore no goodwill is recognized as a result of such transactions. Any difference between the purchase price and the net assets of the acquired entity is recognized in equity. The adjustments to non-controlling interests are based on a proportionate amount of the identifiable net assets of the subsidiary. Investments in Shares of Stock of Associates and Joint Ventures An associate is an entity in which the Group has significant influence. Significant influence is the power to participate in the financial and operating policy decisions of the investee, but is not control or joint control over those policies. A joint venture is a type of joint arrangement whereby the parties that have joint control of the arrangement have rights to the net assets of the joint venture. Joint control is the contractually agreed sharing of control of an arrangement, which exists only when decisions about the relevant activities require unanimous consent of the parties sharing control. The considerations made in determining significant influence or joint control is similar to those necessary to determine control over subsidiaries. The Group’s investments in shares of stock of associates and joint ventures are accounted for using the equity method. Under the equity method, the investment in shares of stock of an associate or joint venture is initially recognized at cost. The carrying amount of the investment is adjusted to recognize the changes in the Group’s share of net assets of the associate or joint venture since the acquisition date. Goodwill relating to the associate or joint venture is included in the carrying amount of the investment and is neither amortized nor individually tested for impairment. The Group’s share in profit or loss of an associate or joint venture is recognized as “Share in net income of an associate and joint venture” account in the consolidated statements of income. Adjustments to the carrying amount may also be necessary for changes in the Group’s proportionate interest in the associate or joint venture arising from changes in the associate or joint venture’s other comprehensive income. The Group’s share on these changes is recognized as “Share in other comprehensive income of an associate and joint venture” account in the consolidated statements of comprehensive income. Unrealized gains and losses resulting from transactions between the Group and the associate or joint venture are eliminated to the extent of the interest in the associate or joint venture. After application of the equity method, the Group determines whether it is necessary to recognize an impairment loss on its investment in the shares of stock of an associate or joint venture. At each reporting date, the Group determines whether there is objective evidence that the investment in shares of stock of an associate or joint venture is impaired. If there is such evidence, the Group calculates the amount of impairment as the difference between the recoverable amount and carrying amount of the investment in shares of stock of an associate or joint venture and then recognizes the loss as part of “Share in net income of an associate and joint venture” account in the consolidated statements of income.
- 22 -
Upon loss of significant influence over the associate or joint control over the joint venture, the Group measures and recognizes any retained investment at fair value. Any difference between the carrying amount of the investment in an associate or joint venture upon loss of significant influence or joint control, and the fair value of the retained investment and proceeds from disposal is recognized in the consolidated statements of income. The financial statements of the associate or joint venture are prepared for the same reporting period as the Group. When necessary, adjustments are made to bring the accounting policies in line with those of the Group. The Group’s 25.06% interest in Petrogen, accounted for as an investment in an associate, 33.33% joint venture interest in Pandacan Depot Services, Inc. (PDSI) and 50.00% joint venture interest in Terminal Bersama Sdn Bhd (TBSB), included under “Other noncurrent assets - net” account in the consolidated statements of financial position, are accounted for under the equity method of accounting. The investment in associate and interest in joint ventures is carried in the consolidated statements of financial position at cost plus post-acquisition changes in the Group’s share in net income (loss) of the joint ventures, less any impairment in value. The consolidated statements of income reflect the Group’s share in the results of operations of joint ventures presented as part of “Other expenses - Net” account. As of December 31, 2021, the Group has capital commitments amounting to P1.5 and nil for TBSB and PDSI, respectively. The Group has no contingent liabilities in relation to its interest in these associate and joint ventures. Results of operations as well as financial position balances of PDSI and TBSB were less than 1% of the consolidated balances of the Group and as such are assessed as not material; hence, not separately disclosed. Property, Plant and Equipment Property, plant and equipment, except for land, are stated at cost less accumulated depreciation and any accumulated impairment in value. Such cost includes the cost of replacing part of the property, plant and equipment at the time the cost is incurred, if the recognition criteria are met, and excludes the costs of day-to-day servicing. Land is stated at cost less impairment in value, if any. The initial cost of property, plant and equipment comprises its construction cost or purchase price, including import duties, taxes and any directly attributable costs in bringing the asset to its working condition and location for its intended use. Cost also includes related asset retirement obligation (ARO), if any. Expenditures incurred after the asset has been put into operation, such as repairs, maintenance and overhaul costs, are normally recognized as expense in the period the costs are incurred. Major repairs are capitalized as part of property, plant and equipment only when it is probable that future economic benefits associated with the items will flow to the Group and the cost of the items can be measured reliably. Capital projects in progress (CPIP) represents the amount of accumulated expenditures on unfinished and/or ongoing projects. This includes the costs of construction and other direct costs. Borrowing costs that are directly attributable to the construction of plant and equipment are capitalized during the construction period. CPIP is not depreciated until such time that the relevant assets are ready for use.
- 23 -
For financial reporting purposes, depreciation for property, plant and equipment other than those assets used in production such as refinery and plant equipment, which commences when the assets are available for its intended use, are computed using the straight-line method. Effective January 1, 2020, depreciation of refinery and plant equipment used in production is computed based on the unit of production method (UPM) which considers the expected capacity over the estimated useful lives of these assets. The estimated useful lives of the assets are as follows:
Number of Years
Buildings and improvements and related facilities
7 - 50
Refinery and plant equipment 4 - 35 Service stations and other equipment 3 - 33 Computers, office and motor
equipment 2 - 20 Land and leasehold improvements 10- 12 or the term of the
lease, whichever is shorter
For financial reporting purposes, duties and taxes related to the acquisition of property, plant and equipment are capitalized. For income tax reporting purposes, such duties and taxes are treated as deductible expenses in the year these charges are incurred. For income tax reporting purposes, depreciation are computed using the double-declining balance method. The remaining useful lives, residual values, and depreciation method are reviewed and adjusted periodically, if appropriate, to ensure that such periods and method of depreciation are consistent with the expected pattern of economic benefits from the items of property, plant and equipment. The carrying amounts of property, plant and equipment are reviewed for impairment when events or changes in circumstances indicate that the carrying amounts may not be recoverable. Fully depreciated assets are retained in the accounts until they are no longer in use. An item of property, plant and equipment is derecognized when either it has been disposed of or when it is permanently withdrawn from use and no future economic benefits are expected from its use or disposal. Any gain or loss arising from the retirement and disposal of an item of property, plant and equipment (calculated as the difference between the net disposal proceeds and the carrying amount of the asset) is recognized in the consolidated statements of income in the period of retirement and disposal. Leases At inception of a contract, the Group assesses whether a contract is, or contains, a lease. A contract is, or contains, a lease if the contract conveys the right to control the use of an identified asset for a period of time in exchange for consideration. To assess whether a contract conveys the right to control the use of an identified asset for a period of time, the Group assesses whether, throughout the period of use: the Group has the right to obtain substantially all the economic benefits from use
of the identified asset; and the Group has the right to direct the use of the identified asset.
- 24 -
Group as a Lessee The Group recognizes a right-of-use asset and a lease liability at the lease commencement date (i.e., the date the underlying asset is available for use). The right-of-use asset is initially measured at cost, which comprises the initial amount of the lease liability adjusted for any lease payments made at or before the commencement date, plus any initial direct costs incurred and an estimate of costs to dismantle and remove the underlying asset or to restore the underlying asset or the site on which it is located, less any lease incentives received. The right-of-use asset is subsequently depreciated using the straight-line method from the commencement date to the earlier of the end of the useful life of the right-of use asset or the end of the lease term. In addition, the right-of-use asset is periodically reduced by impairment losses, if any, and adjusted for certain remeasurements of the lease liability. The lease liability is initially measured at the present value of the lease payments that are not paid at the commencement date, discounted using the interest rate implicit in the lease or, if that rate cannot be readily determined, the Group’s incremental borrowing rate. Generally, the Group uses its incremental borrowing rate as the discount rate. Lease payments included in the measurement of the lease liability comprise of the following: fixed payments, including in-substance fixed payments, less any lease incentives
receivable; variable lease payments that depend on an index or a rate, initially measured
using the index or rate as at the commencement date; amounts expected to be payable under a residual value guarantee; and the exercise price under a purchase option that the Group is reasonably certain
to exercise, lease payments in an optional renewal period if the Group is reasonably certain to exercise an extension option, and penalties for early termination of a lease unless the Group is reasonably certain not to terminate early.
The lease liability is measured at amortized cost using the effective interest method. The carrying amount of the lease liability is remeasured when there is a change in future lease payments arising from a change in an index or rate, a change in the estimate of the amount expected to be payable under a residual value guarantee, or a change in the assessment of whether a purchase or extension option is reasonably certain to be exercised or a termination option is reasonably certain not to be exercised. When the lease liability is remeasured, a corresponding adjustment is made to the carrying amount of the right-of-use asset, or is recognized in the consolidated statements of income if the carrying amount of the right-of-use asset has been reduced to zero. The Group has elected not to recognize right-of use assets and lease liabilities for short-term leases (i.e., lease that have a lease term of 12 months or less from the commencement date and do not contain a purchase option) and leases of low-value assets, including pallets and computer equipment. The Group recognizes the lease payments associated with these leases as expense on a straight-line basis over the lease term.
- 25 -
At commencement or on modification of a contract that contains a lease component, the Group allocates the consideration in the contract to each lease component on the basis of its relative stand-alone prices. However, for the leases of property, the Group has elected not to separate non-lease components and account for the lease and non-lease components as a single component. The Group has applied COVID-19-Related Rent Concessions. The Group applies the practical expedient allowing it not to assess whether eligible rent concessions that are a direct consequence of the COVID-19 pandemic are lease modifications. The Group applies the practical expedient consistently to contracts with similar characteristics and in similar circumstances. For rent concessions in leases to which the Group chooses not to apply the practical expedient, or that do not qualify for the practical expedient, the Group assesses whether there is a lease modification. Group as a Lessor The Group determines at lease inception whether each lease is a finance lease or an operating lease. To classify each lease, the Group makes an overall assessment of whether the lease transfers substantially all of the risks and rewards incidental to ownership of the underlying asset. If this is the case, the lease is classified as a finance lease; if not, it is classified as an operating lease. As part of the assessment, the Group considers certain indicators such as whether the lease is for the major part of the economic life of the asset. When the Group is an intermediate lessor, it accounts for the head lease and the sublease separately. It assesses the lease classification of a sublease with reference to the right-of-use asset arising from the head lease. If a head lease is a short-term lease to which the Group applies the recognition exemption, it classifies the sublease as an operating lease. If an arrangement contains lease and non-lease components, the Group applies PFRS 15 to allocate the consideration in the contract. The Group identified the use of loaned equipment related to the sale of goods to be accounted for under PFRS 16. The Group provides equipment such as pumps, tanks, signage and other ancillary equipment necessary for the operation of the business. These are loaned to the customers for the duration of the contract for the sole purpose of storing, handling and selling products and shall, at all times, remain the property of Petron. The Group allocates portion of the revenue to the use of loaned equipment and presented as part of "Net sales” in the consolidated statements of income based on adjusted market assessment approach. Lease revenue from the use of loaned equipment is contingent to, and recognized at the same time as, the sale of goods. The Group recognizes lease payments received under operating leases as rent income on a straight-line basis over the lease term. Initial direct costs incurred in negotiating an operating lease are added to the carrying amount of the leased asset and recognized as an expense over the lease term on the same basis as rent income. Contingent rents are recognized as income in the period in which they are earned.
- 26 -
Investment Property Investment property consists of property held to earn rentals and/or for capital appreciation but not for sale in the ordinary course of business, used in the production or supply of goods or services or for administrative purposes. Investment property, except for land, is measured at cost including transaction costs less accumulated depreciation and any accumulated impairment in value. Cost also includes any related asset retirement obligation (ARO), if any. The carrying amount includes the cost of replacing part of an existing investment property at the time the cost is incurred, if the recognition criteria are met, and excludes the costs of day-to-day servicing of an investment property. Land is stated at cost less any impairment in value. Depreciation, which commences when the assets are available for their intended use, are computed using the straight-line method over the following estimated useful lives of the assets:
Number of Years
Buildings and improvements 7 - 50 Land and leasehold improvements 10 or the term of the lease,
whichever is shorter
The useful lives and depreciation method are reviewed and adjusted, if appropriate, at each reporting date. Investment property is derecognized either when it has been disposed of or when it is permanently withdrawn from use and no future economic benefit is expected from its disposal. Any gains or losses on the retirement or disposal of investment property are recognized in the consolidated statements of income in the period of retirement or disposal. Transfers are made to investment property when, and only when, there is an actual change in use, evidenced by ending of owner-occupation or commencement of an operating lease to another party. Transfers are made from investment property when, and only when, there is an actual change in use, evidenced by commencement of the owner-occupation or commencement of development with a view to sell. For a transfer from investment property to owner-occupied property or inventories, the cost of property for subsequent accounting is its carrying amount at the date of change in use. If the property occupied by the Group as an owner-occupied property becomes an investment property, the Group accounts for such property in accordance with the policy stated under property, plant and equipment up to the date of change in use. Intangible Assets Intangible assets acquired separately are measured on initial recognition at cost. The cost of intangible assets acquired in a business combination is its fair value at the date of acquisition. Subsequently, intangible assets are carried at cost less accumulated amortization and any accumulated impairment losses. Internally generated intangible assets, excluding capitalized development costs, are not capitalized and expenditures are recognized in the consolidated statements of income in the year in which the related expenditures are incurred. The useful lives of intangible assets are assessed to be either finite or indefinite.
- 27 -
Intangible assets with finite lives are amortized over the useful life and assessed for impairment whenever there is an indication that the intangible assets may be impaired. The amortization period and amortization method used for an intangible asset with a finite useful life are reviewed at each reporting date. Changes in the expected useful life or the expected pattern of consumption of future economic benefits embodied in the asset are accounted for by changing the amortization period or method, as appropriate, and are treated as changes in accounting estimate. The amortization expense on intangible assets with finite lives is recognized in the consolidated statements of income consistent with the function of the intangible asset. Amortization is computed using the straight-line method over the following estimated useful lives of the other intangible assets with finite lives:
Number of Years
Software 5 - 7 Franchise fee 3 - 10 Other intangibles 10 - 16
Gains or losses arising from the disposal of an intangible asset are measured as the difference between the net disposal proceeds and the carrying amount of the asset, and are recognized in the consolidated statements of income when the asset is derecognized. As of December 31, 2021 and 2020, the Group has existing and pending trademark registration for its products for a term of 10 to 20 years. It also has copyrights for its 7-kg LPG container, Gasulito with stylized letter “P” and two flames, Powerburn 2T, Petron New Logo (22 styles), Philippine Card Designs and Malaysian Card Designs, and Petron font. Copyrights endure during the lifetime of the creator and for another 50 years after creator’s death. The amount of intangible assets is included as part of “Other noncurrent assets - net” in the consolidated statements of financial position. Expenses incurred for research and development of internal projects and internally developed patents and copyrights are expensed as incurred and are part of “Selling and administrative expenses” account in the consolidated statements of income. Asset Held for Sale The Group classifies assets as held for sale, if their carrying amounts will be recovered primarily through sale rather than through continuing use. The assets are generally measured at the lower of their carrying amount and fair value less costs to sell. Impairment losses on initial classification as held for sale and subsequent gains and losses on remeasurement are recognized in the consolidated statements of income. Gains are not recognized in excess of any cumulative impairment losses. The criteria for held for sale is regarded as met only when the sale is highly probable and the asset is available for immediate sale in its present condition. Actions required to complete the sale should indicate that it is unlikely that significant changes will be made or that the decision on sale will be withdrawn. Management must be committed to the sale within one year from date of classification. Equity accounting of equity-accounted investees ceases once classified as held for sale. Assets held for sale are presented under “Other current assets” account in the consolidated statements of financial position.
- 28 -
Impairment of Nonfinancial Assets The carrying amounts of property, plant and equipment, right-of-use assets, investment property, intangible assets with finite useful lives, investment in shares of stock of an associate and interest in joint ventures are reviewed for impairment when events or changes in circumstances indicate that the carrying amount may not be recoverable. Goodwill, licenses and trademarks and brand names with indefinite useful lives are tested for impairment annually either individually or at the cash-generating unit level. If any such indication exists, and if the carrying amount exceeds the estimated recoverable amount, the assets or cash-generating units are written down to their recoverable amounts. The recoverable amount of the asset is the greater of fair value less costs to sell and value in use. The fair value less costs to sell is the amount obtainable from the sale of an asset in an arm’s length transaction between knowledgeable, willing parties, less costs of disposal. Value in use is the present value of estimated future cash flows expected to arise from the continuing use of an asset and from its disposal at the end of its useful life. In assessing value in use, the estimated future cash flows are discounted to their present value using a pre-tax discount rate that reflects current market assessments of the time value of money and the risks specific to the asset. For an asset that does not generate largely independent cash inflows, the recoverable amount is determined for the cash-generating unit to which the asset belongs. Impairment losses are recognized in the consolidated statements of income in those expense categories consistent with the function of the impaired asset. An assessment is made at each reporting date as to whether there is any indication that previously recognized impairment losses may no longer exist or may have decreased. If such indication exists, the recoverable amount is estimated. A previously recognized impairment loss is reversed only if there has been a change in the estimates used to determine the asset’s recoverable amount since the last impairment loss was recognized. If that is the case, the carrying amount of the asset is increased to its recoverable amount. That increased amount cannot exceed the carrying amount that would have been determined, net of depreciation and amortization, had no impairment loss been recognized for the asset in prior years. Such reversal is recognized in the consolidated statements of income. After such a reversal, the depreciation and amortization charge are adjusted in future periods to allocate the asset’s revised carrying amount, less any residual value, on a systematic basis over its remaining useful life. An impairment loss with respect to goodwill is not reversed. Cylinder Deposits The Group purchases LPG cylinders which are loaned to dealers upon payment by the latter of an amount equivalent to about 90% of the acquisition cost of the cylinders. The Group maintains the balance of cylinder deposits at an amount equivalent to three days worth of inventory of all its dealers, but in no case lower than P200 at any given time, to take care of possible returns by dealers. At the end of each reporting date, cylinder deposits, shown under “Other noncurrent liabilities” account in the consolidated statements of financial position, are reduced for estimated non-returns. The reduction is recognized directly in the consolidated statements of income. Fair Value Measurements The Group measures financial and non-financial assets and liabilities at fair value at each reporting date.

- 29 -
Fair value is the price that would be received to sell an asset or paid to transfer a liability in an orderly transaction between market participants at the measurement date. The fair value measurement is based on the presumption that the transaction to sell the asset or transfer the liability takes place either: (a) in the principal market for the asset or liability; or (b) in the absence of a principal market, in the most advantageous market for the asset or liability. The principal or most advantageous market must be accessible to the Group. The fair value of an asset or liability is measured using the assumptions that market participants would use when pricing the asset or liability, assuming that market participants act in their best economic best interest. The Group uses valuation techniques that are appropriate in the circumstances and for which sufficient data are available to measure fair value, maximizing the use of relevant observable inputs and minimizing the use of unobservable inputs. All assets and liabilities for which fair value is measured or disclosed in the consolidated financial statements are categorized within the fair value hierarchy, described as follows, based on the lowest level input that is significant to the fair value measurement as a whole: Level 1: quoted prices (unadjusted) in active markets for identical assets or
liabilities; Level 2: inputs other than quoted prices included within Level 1 that are
observable for the asset or liability, either directly or indirectly; and Level 3: inputs for the asset or liability that are not based on observable market
data. For assets and liabilities that are recognized in the consolidated financial statements on a recurring basis, the Group determines whether transfers have occurred between levels in the hierarchy by re-assessing the categorization at the end of each reporting period. For purposes of the fair value disclosures, the Group has determined classes of assets and liabilities on the basis of the nature, characteristics and risks of the asset or liability and the level of fair value hierarchy. Provisions Provisions are recognized when: (a) the Group has a present obligation (legal or constructive) as a result of past event; (b) it is probable (i.e., more likely than not) that an outflow of resources embodying economic benefits will be required to settle the obligation; and (c) a reliable estimate of the amount of the obligation can be made. Where some or all of the expenditure required to settle a provision is expected to be reimbursed by another party, the reimbursement is recognized as a separate asset only when it is virtually certain that reimbursement will be received. The amount recognized for the reimbursement shall not exceed the amount of the provision. Provisions are reviewed at each reporting date and adjusted to reflect the current best estimate. If the effect of the time value of money is material, provisions are determined by discounting the expected future cash flows at a pre-tax rate that reflects current market assessment of the time value of money and the risks specific to the liability. Where discounting is used, the increase in the provision due to the passage of time is recognized as interest expense.
- 30 -
The Group recognizes provisions arising from legal and/or constructive obligations associated with the cost of dismantling and removing an item of property, plant and equipment and restoring the site where it is located, the obligation for which the Group incurs either when the asset is acquired or as a consequence of using the asset during a particular year for purposes other than to produce inventories during the year. Capital Stock Common Shares. Common shares are classified as equity. Incremental costs directly attributable to the issue of common shares and share options are recognized as a deduction from equity, net of any tax effects. Preferred Shares. Preferred shares are classified as equity if they are non-redeemable, or redeemable only at the option of the Parent Company, and any dividends thereon are discretionary. Dividends thereon are recognized as distributions within equity upon approval by the BOD of the Parent Company. Preferred shares are classified as a liability if they are redeemable on a specific date or at the option of the shareholders, or if dividend payments are not discretionary. Dividends thereon are recognized as interest expense in the consolidated statements of income as accrued. Additional Paid-in Capital When the shares are sold at premium, the difference between the proceeds and the par value is credited to the “Additional paid-in capital” account. When shares are issued for a consideration other than cash, the proceeds are measured by the fair value of the consideration received. In case the shares are issued to extinguish or settle the liability of the Parent Company, the shares are measured either at the fair value of the shares issued or fair value of the liability settled, whichever is more reliably determinable. Capital Securities Senior Perpetual Capital Securities (SPCS) and Redeemable Perpetual Securities (RPS) are classified as equity instruments in the consolidated financial statements since these securities are perpetual securities in respect of which there is no fixed redemption date and the redemption is at the option of the Group. Also, the Group has the sole and absolute discretion to defer payment of any or all of the distribution (Note 22). Incremental costs directly attributable to the issuance of capital securities are recognized as a deduction from equity, net of tax. The proceeds received net of any directly attributable transaction costs are credited to capital securities. Retained Earnings Retained earnings represent the accumulated net income or losses, net of any dividend distributions and other capital adjustments. Appropriated retained earnings represent that portion which is restricted and therefore not available for any dividend declaration. Equity Reserve The equity reserve includes the effect of transactions with non-controlling interests and equity adjustments. Translation Reserve The translation reserve comprises of all foreign currency differences arising from the translation of the financial statements of foreign operations.
- 31 -
Reserve for Retirement Plan The reserve for retirement plan represents re-measurements of net defined benefit retirement liability or asset comprising actuarial gains and losses, return on plan assets, and any change in the effect of the asset ceiling (excluding net interest). Hedging Reserve The hedging reserve comprises the effective portion of the cumulative net change in the fair value of hedging instruments used in cash flow hedges pending subsequent recognition in profit or loss or directly included in the initial cost or other carrying amount of a non-financial asset or non-financial liability. The hedging reserve also includes cost of hedging which reflects gain or loss on the portion excluded from the designated hedging instrument that relates to the forward element of forward contracts, time value of options and foreign currency basis spread which are initially recorded in other comprehensive income. Treasury Stock Own equity instruments which are reacquired are carried at cost and deducted from equity. No gain or loss is recognized on the purchase, sale, reissuance or cancellation of the Parent Company’s own equity instruments. When the shares are retired, the capital stock account is reduced by its par value and the excess of cost over par value upon retirement is debited to additional paid-in capital to the extent of the specific or average additional paid-in capital when the shares were issued and to retained earnings for the remaining balance. Revenue The Group recognizes revenue from contracts with customers when control of the goods or services are transferred to the customer at an amount that reflects the consideration to which the Group expects to be entitled in exchange for those goods or services, excluding amounts collected on behalf of third parties. The transfer of control can occur over time or at a point in time. Revenue is recognized at a point in time unless one of the following criteria is met, in which case it is recognized over time: (a) the customer simultaneously receives and consumes the benefits as the Group performs its obligations; (b) the Group’s performance creates or enhances an asset that the customer controls as the asset is created or enhanced; or (c) the Group’s performance does not create an asset with an alternative use to the Group and the Group has an enforceable right to payment for performance completed to date. The Group also assesses its revenue arrangements to determine if it is acting as a principal or as an agent. The Group has concluded that it acts as a principal as it controls the goods or services before transferring to the customer. The following specific recognition criteria must also be met before revenue is recognized: Sale of Goods. Revenue is recognized at the point in time when control of petroleum and related products is transferred to the customer, which is normally upon delivery of the goods. The Group provides trade discounts and volume rebates to certain customers based on the level of their purchases which may be applied against the amount of their existing or future payables to the Group. Trade discounts and volume rebates do not result to significant variable consideration and are generally determined based on concluded sales transactions as at the end of each month. The general payment terms with customers are combination of prepayments and credit terms on an average of 45 days from invoice date.
- 32 -
The Group identified several performance obligations related to the sale of goods and accounted for them separately: Provisions of Technical Support. The Group provides technical information,
assistance and advice relating to the uses, handling and disposition of the products, loaned equipment and the machinery and equipment necessary or appropriate for the customers’ needs. Revenue is recognized over time upon rendering of services to the customer. The Group allocates portion of the revenue to the technical support based on expected cost plus a margin approach.
Consumer Loyalty Program. The Group has Consumer Loyalty Programs which
allows customers to accumulate points when they purchase products at participating service stations. These points can be redeemed for Group's products, rewards, discounts and other privileges from partner merchants. Revenue is allocated between the goods sold and the points issued that are expected to be redeemed. This allocation is based on the relative stand-alone selling price of the points. A deferred liability account is set up for these points. The liability will be reversed when the Group has fulfilled its obligations to supply the discounted products under the terms of the program or when it is no longer probable that the points under the program will be redeemed. The deferred liability is based on the best estimate of future redemption profile. All the estimates are reviewed on an annual basis or more frequently, where there is indication of a material change.
Service Income. Revenue is recognized over time when the performance of contractually agreed task has been rendered and control over the services has been transferred to the customer. General payment terms is on an average of 45 days from invoice date. Other sources of revenue are as follows: Interest Income. Interest income is recognized using the effective interest method. In calculating interest income, the effective interest rate is applied to the gross carrying amount of the asset. Dividend Income. Dividend income is recognized when the Group’s right to receive the payment is established. Rent Income. Rent income from operating leases (net of any incentives given to the lessees), other than from the use of loaned equipment, is recognized on a straight-line basis over the lease terms. Lease incentives granted are recognized as an integral part of the total rent income over the term of the lease. Gain or Loss on Sale of Investments in Shares of Stock. Gain or loss is recognized when the Group disposes of its investment in shares of stock of a subsidiary, associate and joint venture and financial assets at FVPL. Gain or loss is computed as the difference between the proceeds of the disposed investment and its carrying amount, including the carrying amount of goodwill, if any Other Income. Other income is recognized when there is incidental economic benefit, other than the usual business operations, that will flow to the Group and that can be measured reliably.
- 33 -
Cost and Expense Recognition Costs and expenses are decreases in economic benefits during the reporting period in the form of outflows or decrease of assets or incurrence of liabilities that result in decreases in equity, other than those relating to distributions to equity participants. Expenses are recognized when incurred. Borrowing Costs Borrowing costs directly attributable to the acquisition or construction of an asset that necessarily takes a substantial period of time to get ready for its intended use are capitalized as part of the cost of the respective assets. All other borrowing costs are expensed in the period they occur. Capitalization of borrowing costs commences when the activities to prepare the asset are in progress and expenditures and borrowing costs are being incurred. Borrowing costs are capitalized until the assets are substantially ready for their intended use. Investment income earned on the temporary investment of specific borrowings pending expenditure on qualifying assets is deducted from the borrowing costs eligible for capitalization. Research and Development Costs Research costs are expensed as incurred. Development costs incurred on an individual project are carried forward when their future recoverability can be reasonably regarded as assured. Any expenditure carried forward is amortized in line with the expected future sales from the related project. The carrying amount of development costs is reviewed for impairment annually when the related asset is not yet in use. Otherwise, this is reviewed for impairment when events or changes in circumstances indicate that the carrying amount may not be recoverable. Employee Benefits Short-term Employee Benefits. Short-term employee benefits are expensed as the related service is provided. A liability is recognized for the amount expected to be paid if the Group has a present legal or constructive obligation to pay this amount as a result of past service provided by the employee and the obligation can be estimated reliably. Retirement Benefits Costs and Other Employee Benefit Costs. Petron has a tax qualified and funded defined benefit pension plan covering all permanent, regular, full-time employees administered by trustee banks. Some of its subsidiaries have separate unfunded, noncontributory, retirement plans. The net defined benefit retirement liability or asset is the aggregate of the present value of the amount of future benefit that employees have earned in return for their service in the current and prior periods, reduced by the fair value of plan assets (if any), adjusted for any effect of limiting a net defined benefit asset to the asset ceiling. The asset ceiling is the present value of economic benefits available in the form of reductions in future contributions to the plan. The cost of providing benefits under the defined benefit retirement plan is actuarially determined using the projected unit credit method. Projected unit credit method reflects services rendered by employees to the date of valuation and incorporates assumptions concerning projected salaries of employees. Actuarial gains and losses are recognized in full in the period in which they occur in OCI. Such actuarial gains and losses are also immediately recognized in equity and are not reclassified to profit or loss in subsequent period.
- 34 -
Defined benefit costs comprise the following: Service costs; Net interest on the defined benefit retirement liability or asset; Remeasurements of defined benefit retirement liability or asset; and Settlement gain or loss, if any. Service costs which include current service costs, past service costs and gains or losses on non-routine settlements are recognized as expense in the consolidated statements of income. Past service costs are recognized when plan amendment or curtailment occurs. These amounts are calculated periodically by independent qualified actuary. Net interest on the net defined benefit retirement liability or asset is the change during the period as a result of contributions and benefit payments, which is determined by applying the discount rate based on the government bonds to the net defined benefit retirement liability or asset. Net interest on the net defined benefit retirement liability or asset is recognized as expense or income in the consolidated statements of income. Remeasurements of net defined benefit retirement liability or asset comprising actuarial gains and losses, return on plan assets, and any change in the effect of the asset ceiling (excluding net interest) are recognized immediately in OCI in the period in which they arise. Remeasurements are not reclassified to consolidated statements of income in subsequent periods. Settlement gain or loss pertains to the difference between the present value of the defined benefit obligation being settled, as determined on the date of settlement and the settlement price, including any plan assets transferred and any payments made directly by the entity in connection with the settlement. Any gain or loss on settlement is recognized as income or expense in the consolidated statements of income. The Group also provides other benefits to its employees as follows: Corporate Performance Incentive Program. The Group has a corporate performance incentive program that aims to provide financial incentives for the employees, contingent on the achievement of the Group’s annual business goals and objectives. The Group recognizes achievement of its business goals through key performance indicators (KPIs) which are used to evaluate performance of the organization. The Group recognizes the related expense when the KPIs are met, that is when the Group is contractually obliged to pay the benefits. Savings Plan. The Group established a Savings Plan wherein eligible employees may apply for membership and have the option to contribute 5% to 15% of their monthly base pay. The Group, in turn, contributes an amount equivalent to 50% of the employee-member’s contribution. However, the Group’s 50% share applies only to a maximum of 10% of the employee-member’s contribution. The Savings Plan aims to supplement benefits upon employees’ retirement and to encourage employee-members to save a portion of their earnings. The Group accounts for this benefit as a defined contribution pension plan and recognizes a liability and an expense for this plan as the expenses for its contribution fall due. The Group has no legal or constructive obligations to pay further contributions after payments of the equivalent employer-share. The accumulated savings of the employees plus the Group’s share, including earnings, will be paid in the event of the employee’s: (a) retirement, (b) resignation after completing at least five years of continuous services, (c) death, or (d) involuntary separation not for cause.
- 35 -
Land/Home Ownership Plan. The Group established the Land/Home Ownership Plan, an integral part of the Savings Plan, to extend a one-time financial assistance to Savings Plan members in securing housing loans for residential purposes. Foreign Currency Foreign Currency Translations. Transactions in foreign currencies are initially recorded in the respective functional currencies of Group entities at exchange rates at the dates of the transactions. Monetary assets and monetary liabilities denominated in foreign currencies are translated to the functional currency at exchange rate at the reporting date. Non-monetary assets and non-monetary liabilities denominated in foreign currencies that are measured at fair value are translated to the functional currency at the exchange rate when fair value was determined. Non-monetary items denominated in foreign currencies that are measured based on historical cost are translated using the exchange rate at the date of the transaction. Foreign currency differences arising on translation are recognized in the consolidated statements of income, except for differences arising on the translation of financial assets at FVOCI, a financial liability designated as a hedge of the net investment in a foreign operation that is effective, or qualifying cash flow hedges, which are recognized in OCI. Foreign Operations. The assets and liabilities of foreign operations, including goodwill and fair value adjustments arising on acquisition, are translated to Philippine peso at exchange rates at the reporting date. The income and expenses of foreign operations, excluding foreign operations in hyperinflationary economies, are translated to Philippine peso at average exchange rates for the period. Foreign currency differences are recognized in OCI and presented in the “Other reserves” account in the consolidated statements of changes in equity. However, if the operation is not a wholly-owned subsidiary, the relevant proportionate share of the translation difference is allocated to the non-controlling interests. When a foreign operation is disposed of such that control, significant influence or joint control is lost, the cumulative amount in the translation reserve related to that foreign operation is reclassified to the consolidated statements of income as part of the gain or loss on disposal. When the Group disposes of only part of its interest in a subsidiary that includes a foreign operation while retaining control, the relevant proportion of the cumulative amount is reattributed to non-controlling interests. When the Group disposes of only part of its investment in share of stock of an associate or joint venture that includes a foreign operation while retaining significant influence or joint control, the relevant proportion of the cumulative amount is reclassified to the profit or loss. When the settlement of a monetary item receivable from or payable to a foreign operation is neither planned nor likely to occur in the foreseeable future, foreign exchange gains and losses arising from such a monetary item are considered to form part of a net investment in a foreign operation and are recognized in OCI, and presented in the “Other reserves” account in the consolidated statements of changes in equity.
- 36 -
Taxes Current Tax. Current tax is the expected tax payable or receivable on the taxable income or loss for the year, using tax rates enacted or substantively enacted at the reporting date, and any adjustment to tax payable in respect of previous years. Current tax relating to items recognized directly in equity is recognized in equity and not in consolidated statements of income. The Group periodically evaluates positions taken in the tax returns with respect to situations in which applicable tax regulations are subject to interpretations and establishes provisions where appropriate. Deferred Tax. Deferred tax is recognized using the liability method in respect of temporary differences between the carrying amounts of assets and liabilities for financial reporting purposes and the amounts used for taxation purposes. Deferred tax liabilities are recognized for all taxable temporary differences, except: where the deferred tax liability arises from the initial recognition of goodwill or of
an asset or liability in a transaction that is not a business combination and, at the time of the transaction, affects neither the accounting profit taxable profit or loss; and
with respect to taxable temporary differences associated with investments in
shares of stock of subsidiaries, associates and interests in joint ventures, where the timing of the reversal of the temporary differences can be controlled and it is probable that the temporary differences will not reverse in the foreseeable future.
Deferred tax assets are recognized for all deductible temporary differences, carryforward benefits of unused tax credits - Minimum Corporate Income Tax (MCIT) and unused tax losses - Net Operating Loss Carry Over (NOLCO), to the extent that it is probable that taxable profit will be available against which the deductible temporary differences, and the carryforward benefits of MCIT and NOLCO can be utilized, except: where the deferred tax asset relating to the deductible temporary difference
arises from the initial recognition of an asset or liability in a transaction that is not a business combination and, at the time of the transaction, affects neither the accounting profit nor taxable profit or loss; and
with respect to deductible temporary differences associated with investments in
shares of stock of subsidiaries, associates and interests in joint ventures, deferred tax assets are recognized only to the extent that it is probable that the temporary differences will reverse in the foreseeable future and taxable profit will be available against which the temporary differences can be utilized.
The carrying amount of deferred tax assets is reviewed at each reporting date and reduced to the extent that it is no longer probable that sufficient taxable profit will be available to allow all or part of the deferred tax asset to be utilized. Unrecognized deferred tax assets are reassessed at each reporting date and are recognized to the extent that it has become probable that future taxable profit will allow the deferred tax asset to be recovered. The measurement of deferred tax reflects the tax consequences that would follow the manner in which the Group expects, at the end of the reporting period, to recover or settle the carrying amount of its assets and liabilities.
- 37 -
Deferred tax assets and liabilities are measured at the tax rates that are expected to apply in the year when the asset is realized or the liability is settled, based on tax rates (and tax laws) that have been enacted or substantively enacted at the reporting date. Current tax and deferred tax are recognized in the consolidated statements of income except to the extent that it relates to a business combination, or items recognized directly in equity or in other comprehensive income. Deferred tax assets and deferred tax liabilities are offset, if a legally enforceable right exists to set off current tax assets against current tax liabilities and the deferred taxes relate to the same taxable entity and the same taxation authority. Value-added Tax (VAT). Revenues, expenses and assets are recognized net of the amount of VAT, except: where the tax incurred on a purchase of assets or services is not recoverable
from the taxation authority, in which case the tax is recognized as part of the cost of acquisition of the asset or as part of the expense item as applicable; and
receivables and payables that are stated with the amount of tax included. The net amount of tax recoverable from, or payable to, the taxation authority is included as part of “Other current assets” or “Trade and other payables” accounts in the consolidated statements of financial position. Related Parties Parties are considered to be related if one party has the ability, directly or indirectly, to control the other party or exercise significant influence over the other party in making financial and operating decisions. Parties are also considered to be related if they are subject to common control and significant influence. Related parties may be individuals or corporate entities. Basic and Diluted Earnings Per Common Share (EPS) Basic EPS is computed by dividing the net income for the period attributable to equity holders of the Parent Company, net of dividends on preferred shares and distributions to holders of capital securities, by the weighted average number of issued and outstanding common shares during the period, with retroactive adjustment for any stock dividends declared. Diluted EPS is computed in the same manner, adjusted for the effect of all potential dilutive debt or equity instruments. Operating Segments The Group’s operating segments are organized and managed separately according to the nature of the products and services provided, with each segment representing a strategic business unit that offers different products and serves different markets. Financial information on operating segments is presented in Note 38 to the consolidated financial statements. The Chief Executive Officer (the chief operating decision maker) reviews management reports on a regular basis. The measurement policies the Group used for segment reporting under PFRS 8 are the same as those used in its consolidated financial statements. There have been no changes in the measurement methods used to determine reported segment profit or loss from prior periods.
- 38 -
Segment revenues, expenses and performance include sales and purchases between business segments. Such sales and purchases are eliminated in consolidation. Contingencies Contingent liabilities are not recognized in the consolidated financial statements. They are disclosed in the notes to the consolidated financial statements unless the possibility of an outflow of resources embodying economic benefits is remote. Contingent assets are not recognized in the consolidated financial statements but are disclosed in the notes to the consolidated financial statements when an inflow of economic benefits is probable . Events After the Reporting Date Post year-end events that provide additional information about the Group’s financial position at the reporting date (adjusting events) are reflected in the consolidated financial statements. Post year-end events that are not adjusting events are disclosed in the notes to the consolidated financial statements when material.
4. Use of Judgments, Estimates and Assumptions The preparation of the Group’s consolidated financial statements in accordance with PFRS requires management to make judgments, estimates and assumptions that affect the application of accounting policies and the amounts of assets, liabilities, income and expenses reported in the consolidated financial statements at the reporting date. However, uncertainty about these judgments, estimates and assumptions could result in outcome that could require a material adjustment to the carrying amount of the affected asset or liability in the future. Judgments and estimates are continually evaluated and are based on historical experience and other factors, including expectations of future events that are believed to be reasonable under the circumstances. Revisions are recognized in the period in which the judgments and estimates are revised and in any future period affected. Judgments In the process of applying the Group’s accounting policies, management has made the following judgments, apart from those involving estimations, which have the most significant effect on the amounts recognized in the consolidated financial statements: Determining Functional Currency. The Parent Company has determined that its functional currency is the Philippine peso. It is the currency of the primary economic environment in which the Parent Company operates. It is the currency that mainly influences the sales price of goods and services and the costs of providing these goods and services. Identification of Distinct Performance Obligation. The Group assesses the goods or services promised in a contract with a customer and identifies as a performance obligation either: (a) a good or service (or a bundle of goods or services) that is distinct; or (b) a series of distinct goods or services that are substantially the same and that have the same pattern of transfer to the customer. The Group has determined that it has distinct performance obligations other than the sale of petroleum products such as the provision of technical support and consumer loyalty program and allocates the transaction price into these several performance obligations.
- 39 -
Determining whether a Contract Contains a Lease. The Group uses its judgment in determining whether a contract contains a lease. At inception of a contract, the Group makes an assessment whether it has the right to obtain substantially all the economic benefits from the use of the identified asset and the right to direct the use of the identified asset. Operating Lease Commitments - Group as Lessor. The Group has entered into various lease agreements as lessor. The Group had determined that it retains all the significant risks and rewards of ownership of the properties leased out on operating leases. Rent income recognized as “Other operating income” in the consolidated statements of income amounted to P1,273, P1,047 and P1,507 in 2021, 2020 and 2019, respectively. Rent income recognized as part of “Other expenses - net” account in the consolidated statements of comprehensive income amounted to P63 each in 2021, 2020 and 2019 (Note 27). Revenues from the customers’ use of loaned equipment amounted to P1,153, P1,150 and P1,100 in 2021, 2020 and 2019, respectively (Note 38). Estimating the Incremental Borrowing Rate. The Group cannot readily determine the interest rate implicit in its leases. Therefore, it uses the relevant incremental borrowing rate (IBR) to measure lease liabilities. The IBR is the rate of interest that the Group would pay to borrow over a similar term, and with a similar security, the funds necessary to obtain an asset of a similar value to the right-of-use asset in a similar economic environment. The IBR, therefore, reflects what the Group would have to pay, which requires estimation when no observable rates are available (such as for subsidiaries that do not enter into financing transactions) and to make adjustments to reflect the terms and conditions of the lease. The Group estimates the IBR using observable inputs (such as market interest rates) when available and is required to consider certain contract and entity-specific judgement estimates. Determining the Lease Term of Contracts with Renewal Options - Group as Lessee. The Group determines the lease term as the noncancellable term of the lease, together with any periods covered by an option to extend the lease if it is reasonably certain to be exercised. The Group has several lease contracts that include extension options. At lease commencement date, the Group applies judgment in evaluating whether it is reasonably certain to exercise the option to renew the lease by considering all relevant factors that create an economic incentive for it to exercise the renewal option. The Group reassesses whether it is reasonably certain to exercise the options if there is a significant event or change in circumstances within its control. Determining Whether the Group is acting as a Principal or Agent in a Revenue Transaction. The determination whether the Group is a principal or agent in a contract is made by identifying each specified goods or services promised to the customers in the contract and evaluating whether the Group obtains control of the specified goods and services before it is transferred to the customer. For the sale of petroleum products to dealers, the Group transfers the control of the goods upon delivery, hence, the Group has determined that it is acting as principal in the sales transactions with dealers. The dealers are likewise acting as principal in the sales transactions to end consumers on the basis of the following: (a) the dealers have the primary responsibility to provide specified goods to the end consumers; (b) the dealers bear inventory risk before the goods are transferred to end consumers; and (c) the dealers have discretion to establish prices for specified goods.
- 40 -
For the Group’s fleet card transactions, the Group has likewise determined that it is acting as principal in the sales transactions with the customers since the Group has the primary responsibility for providing goods purchased through fleet cards and the Group has discretion to establish prices for specified goods in a fleet card transaction. Classification of Financial Instruments. The Group exercises judgments in classifying a financial instrument, or its component parts, on initial recognition as a financial asset, a financial liability, or an equity instrument in accordance with the substance of the contractual arrangement and the definitions of a financial asset, a financial liability or an equity instrument. The substance of a financial instrument, rather than its legal form, governs its classification in the consolidated statements of financial position. The Group uses its judgment in determining the classification of financial assets based on its business model in which assets are managed and their cash flow characteristics. The classification and fair values of financial assets and financial liabilities are presented in Note 36. Evaluating Control or Significant Influence over its Investees. Determining whether the Group has control or significant influence in an investee requires significant judgment. The Group has assessed it has lost its control over Petrogen upon the decrease in ownership interest from 100% to 25.06% in 2021. The Group has no longer the power, in practice, to govern the financial and operating policies of Petrogen, to appoint or remove the majority of the members of the BOD of Petrogen and to cast majority votes at meetings of the BOD of Petrogen. However, the Group has determined that it exercises significant influence over Petrogen by virtue of its representation in the BOD of Petrogen (Note 14). Distinction Between Property, Plant and Equipment and Investment Property. The Group determines whether a property qualifies as investment property. In making its judgment, the Group considers whether the property generates cash flows largely independent of the other assets held by the Group. Owner-occupied properties generate cash flows that are attributable not only to the property but also to other assets used in the production or supply process. Some properties comprise a portion that is held to earn rentals or for capital appreciation and another portion that is held for use in the production and supply of goods and services or for administrative purposes. If these portions can be sold separately (or leased out separately under finance lease), the Group accounts for the portions separately. If the portion cannot be sold separately, the property is accounted for as investment property only if an insignificant portion is held for use in the production or supply of goods or services for administrative purposes. Judgment is applied in determining whether ancillary services are so significant that a property does not qualify as investment property. The Group considers each property separately in making its judgment.
- 41 -
Determining Impairment Indicators of Other Non-financial Assets. PFRS requires that an impairment review be performed on property, plant and equipment, investment in shares of stock of an associate and interest in joint ventures, investment property and intangible assets when events or changes in circumstances indicate that the carrying value may not be recoverable. Determining the recoverable amount of assets requires the estimation of cash flows expected to be generated from the continued use and ultimate disposition of such assets. While it is believed that the assumptions used in the estimation of recoverable amounts are appropriate and reasonable, significant changes in these assumptions may materially affect the assessment of recoverable amounts and any resulting impairment loss could have a material adverse impact on financial performance. Taxes. Significant judgment is required in determining current and deferred tax expense. There are many transactions and calculations for which the ultimate tax determination is uncertain during the ordinary course of business. The Group recognizes liabilities for anticipated tax audit issues based on estimates of whether additional taxes will be due. Where the final tax outcome of these matters is different from the amounts that were initially recorded, such differences will impact the current income tax and deferred tax expenses in the year in which such determination is made. In the determination of the Group’s current taxable income, entities within the Group has an option to either apply the optional standard deduction (OSD) or continue to claim itemized standard deduction. Entities within the Group, at each taxable year from the effectivity of the law, may decide which option to apply; once an option to use OSD is made, it shall be irrevocable for that particular taxable year. For 2021, 2020 and 2019, majority of the entities within the Group opted to continue claiming itemized standard deductions except for Petrogen and certain subsidiaries of NVRC such as LLCDC, MLC, SLPHI, ARC and PEDC, as they opted to apply OSD (Note 28). Contingencies. The Group is currently involved in various pending claims and lawsuits which could be decided in favor of or against the Group. The Group’s estimate of the probable costs for the resolution of these pending claims and lawsuits has been developed in consultation with in-house as well as outside legal counsel handling the prosecution and defense of these matters and is based on an analysis of potential results. The Group currently does not believe that these pending claims and lawsuits will have a material adverse effect on its financial position and financial performance. It is possible, however, that future financial performance could be materially affected by the changes in the estimates or in the effectiveness of strategies relating to these proceedings. Estimates and Assumptions The key estimates and assumptions used in the consolidated financial statements are based upon the Group’s evaluation of relevant facts and circumstances as at the date of the consolidated financial statements. Actual results could differ from such estimates. Assessment for ECL on Trade and Other Receivables. The Group, applying the simplified approach in the computation of ECL, initially uses a provision matrix based on historical default rates for trade and other receivables. The Group also uses appropriate groupings if its historical credit loss experience show significantly different loss patterns for different customer segments. The Group then adjusts the historical credit loss experience with forward-looking information on the basis of current observable data affecting each customer segment to reflect the effects of current and forecasted economic conditions.
- 42 -
The Group adjusts historical default rates to forward-looking default rate by determining the closely related economic factor affecting each customer segment. The Group regularly reviews the methodology and assumptions used for estimating ECL to reduce any differences between estimates and actual credit loss experience. The determination of the relationship between historical default rates and forecasted economic conditions is a significant accounting estimate. The Group has assessed that the forward-looking default rate component of its ECL on trade and other receivables is not material because substantial amount of receivables are normally collected within one year. Moreover, based on Management’s assessment, current conditions and forward-looking information does not indicate a significant increase in credit risk exposure of the Group from its trade receivables. Impairment losses on trade and other receivables amounted to P28, P67 and P294 in 2021, 2020 and 2019 respectively (Notes 8, 24 and 27). Receivables written-off amounted to P6 in 2021, P8 in 2020 and P375 in 2019 (Note 8). The carrying amount of trade and other receivables amounted to P51,745 and P27,195 as of December 31, 2021 and 2020, respectively (Note 8). Assessment for ECL on Other Financial Assets at Amortized Cost. The Group determines the allowance for ECL using general approach based on the probability-weighted estimate of the present value of all cash shortfalls over the expected life of financial assets at amortized cost. ECL is provided for credit losses that result from possible default events within the next 12 months unless there has been a significant increase in credit risk since initial recognition in which case ECL is provided based on lifetime ECL. The Group adjusts historical default rates to forward-looking default rate by determining the closely related economic factor affecting each customer segment. The Group regularly reviews the methodology and assumptions used for estimating ECL to reduce any differences between estimates and actual credit loss experience. The determination of the relationship between historical default rates and forecasted economic conditions is a significant accounting estimate. When determining if there has been a significant increase in credit risk, the Group considers reasonable and supportable information that is available without undue cost or effort and that is relevant for the particular financial instrument being assessed such as, but not limited to, the following factors: Actual or expected external and internal credit rating downgrade; Existing or forecasted adverse changes in business, financial or economic
conditions; and Actual or expected significant adverse changes in the operating results of the
borrower. The Group also considers financial assets at day one to be the latest point at which lifetime ECL should be recognized unless it can demonstrate that this does not represent a significant risk in credit risk such as when non-payment was an administrative oversight rather than resulting from financial difficulty of the borrower.
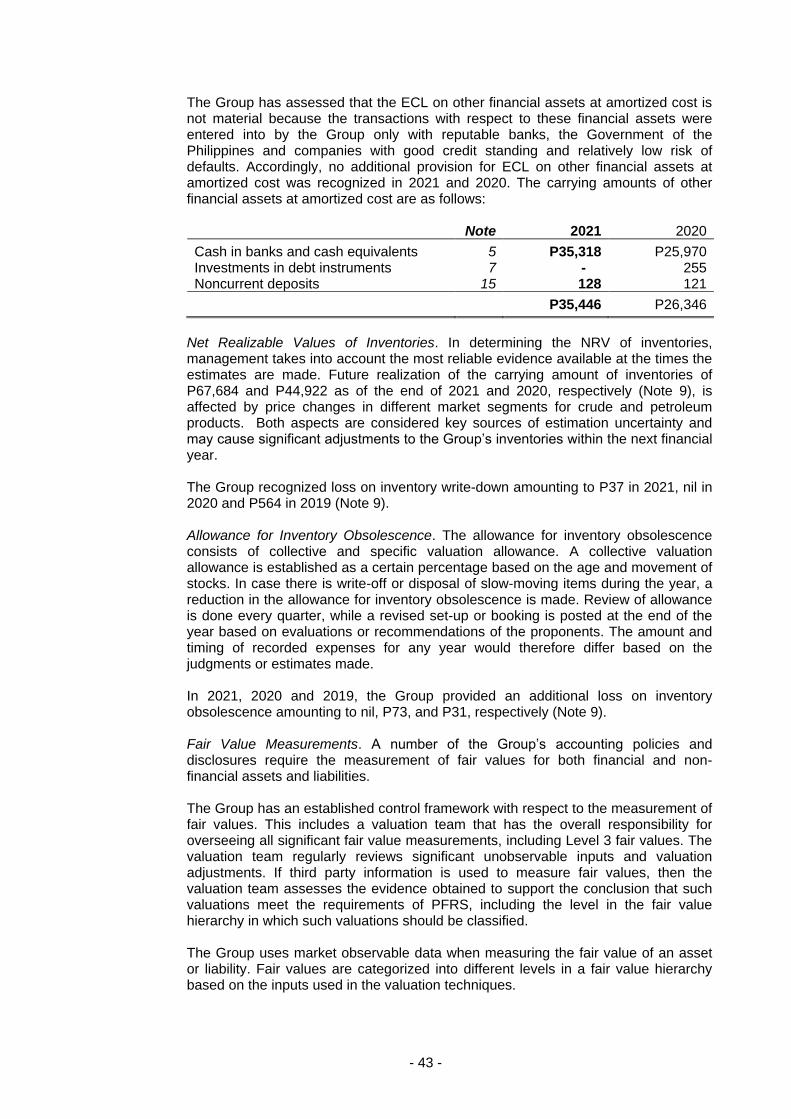
- 43 -
The Group has assessed that the ECL on other financial assets at amortized cost is not material because the transactions with respect to these financial assets were entered into by the Group only with reputable banks, the Government of the Philippines and companies with good credit standing and relatively low risk of defaults. Accordingly, no additional provision for ECL on other financial assets at amortized cost was recognized in 2021 and 2020. The carrying amounts of other financial assets at amortized cost are as follows: Note 2021 2020
Cash in banks and cash equivalents 5 P35,318 P25,970 Investments in debt instruments 7 - 255 Noncurrent deposits 15 128 121
P35,446 P26,346
Net Realizable Values of Inventories. In determining the NRV of inventories, management takes into account the most reliable evidence available at the times the estimates are made. Future realization of the carrying amount of inventories of P67,684 and P44,922 as of the end of 2021 and 2020, respectively (Note 9), is affected by price changes in different market segments for crude and petroleum products. Both aspects are considered key sources of estimation uncertainty and may cause significant adjustments to the Group’s inventories within the next financial year. The Group recognized loss on inventory write-down amounting to P37 in 2021, nil in 2020 and P564 in 2019 (Note 9). Allowance for Inventory Obsolescence. The allowance for inventory obsolescence consists of collective and specific valuation allowance. A collective valuation allowance is established as a certain percentage based on the age and movement of stocks. In case there is write-off or disposal of slow-moving items during the year, a reduction in the allowance for inventory obsolescence is made. Review of allowance is done every quarter, while a revised set-up or booking is posted at the end of the year based on evaluations or recommendations of the proponents. The amount and timing of recorded expenses for any year would therefore differ based on the judgments or estimates made. In 2021, 2020 and 2019, the Group provided an additional loss on inventory obsolescence amounting to nil, P73, and P31, respectively (Note 9). Fair Value Measurements. A number of the Group’s accounting policies and disclosures require the measurement of fair values for both financial and non-financial assets and liabilities. The Group has an established control framework with respect to the measurement of fair values. This includes a valuation team that has the overall responsibility for overseeing all significant fair value measurements, including Level 3 fair values. The valuation team regularly reviews significant unobservable inputs and valuation adjustments. If third party information is used to measure fair values, then the valuation team assesses the evidence obtained to support the conclusion that such valuations meet the requirements of PFRS, including the level in the fair value hierarchy in which such valuations should be classified. The Group uses market observable data when measuring the fair value of an asset or liability. Fair values are categorized into different levels in a fair value hierarchy based on the inputs used in the valuation techniques.
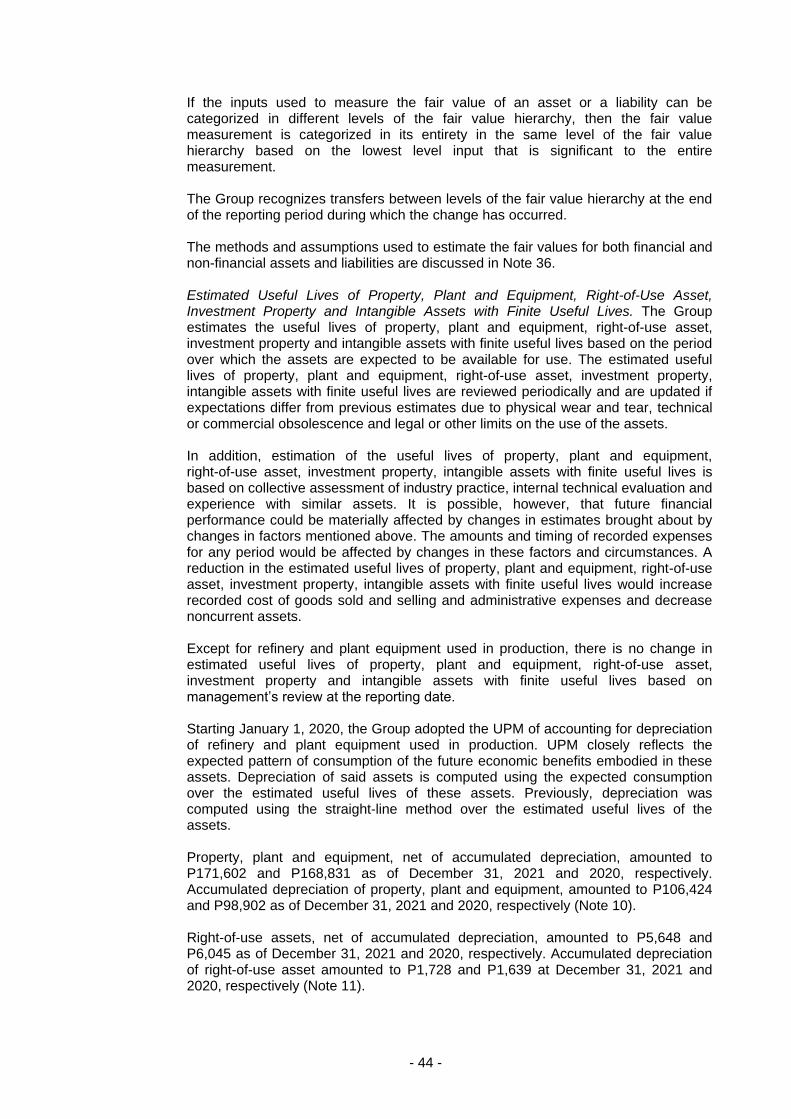
- 44 -
If the inputs used to measure the fair value of an asset or a liability can be categorized in different levels of the fair value hierarchy, then the fair value measurement is categorized in its entirety in the same level of the fair value hierarchy based on the lowest level input that is significant to the entire measurement. The Group recognizes transfers between levels of the fair value hierarchy at the end of the reporting period during which the change has occurred. The methods and assumptions used to estimate the fair values for both financial and non-financial assets and liabilities are discussed in Note 36. Estimated Useful Lives of Property, Plant and Equipment, Right-of-Use Asset, Investment Property and Intangible Assets with Finite Useful Lives. The Group estimates the useful lives of property, plant and equipment, right-of-use asset, investment property and intangible assets with finite useful lives based on the period over which the assets are expected to be available for use. The estimated useful lives of property, plant and equipment, right-of-use asset, investment property, intangible assets with finite useful lives are reviewed periodically and are updated if expectations differ from previous estimates due to physical wear and tear, technical or commercial obsolescence and legal or other limits on the use of the assets. In addition, estimation of the useful lives of property, plant and equipment, right-of-use asset, investment property, intangible assets with finite useful lives is based on collective assessment of industry practice, internal technical evaluation and experience with similar assets. It is possible, however, that future financial performance could be materially affected by changes in estimates brought about by changes in factors mentioned above. The amounts and timing of recorded expenses for any period would be affected by changes in these factors and circumstances. A reduction in the estimated useful lives of property, plant and equipment, right-of-use asset, investment property, intangible assets with finite useful lives would increase recorded cost of goods sold and selling and administrative expenses and decrease noncurrent assets. Except for refinery and plant equipment used in production, there is no change in estimated useful lives of property, plant and equipment, right-of-use asset, investment property and intangible assets with finite useful lives based on management’s review at the reporting date. Starting January 1, 2020, the Group adopted the UPM of accounting for depreciation of refinery and plant equipment used in production. UPM closely reflects the expected pattern of consumption of the future economic benefits embodied in these assets. Depreciation of said assets is computed using the expected consumption over the estimated useful lives of these assets. Previously, depreciation was computed using the straight-line method over the estimated useful lives of the assets. Property, plant and equipment, net of accumulated depreciation, amounted to P171,602 and P168,831 as of December 31, 2021 and 2020, respectively. Accumulated depreciation of property, plant and equipment, amounted to P106,424 and P98,902 as of December 31, 2021 and 2020, respectively (Note 10). Right-of-use assets, net of accumulated depreciation, amounted to P5,648 and P6,045 as of December 31, 2021 and 2020, respectively. Accumulated depreciation of right-of-use asset amounted to P1,728 and P1,639 at December 31, 2021 and 2020, respectively (Note 11).
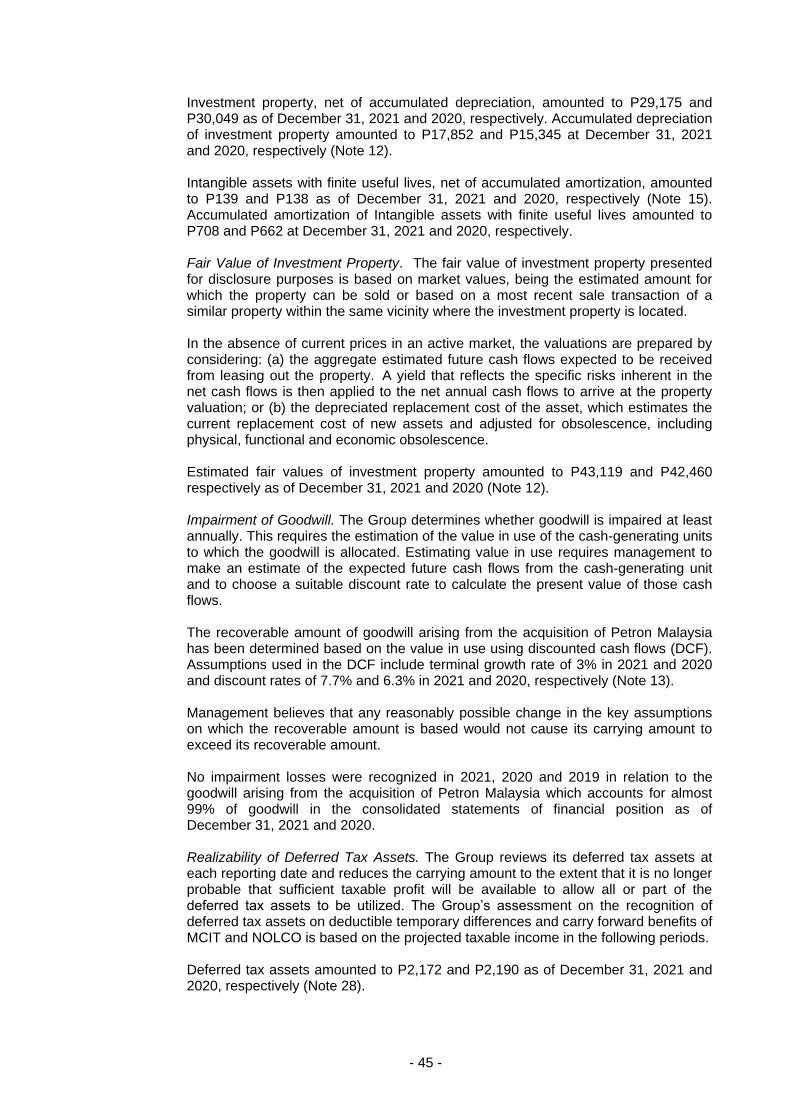
- 45 -
Investment property, net of accumulated depreciation, amounted to P29,175 and P30,049 as of December 31, 2021 and 2020, respectively. Accumulated depreciation of investment property amounted to P17,852 and P15,345 at December 31, 2021 and 2020, respectively (Note 12). Intangible assets with finite useful lives, net of accumulated amortization, amounted to P139 and P138 as of December 31, 2021 and 2020, respectively (Note 15). Accumulated amortization of Intangible assets with finite useful lives amounted to P708 and P662 at December 31, 2021 and 2020, respectively. Fair Value of Investment Property. The fair value of investment property presented for disclosure purposes is based on market values, being the estimated amount for which the property can be sold or based on a most recent sale transaction of a similar property within the same vicinity where the investment property is located. In the absence of current prices in an active market, the valuations are prepared by considering: (a) the aggregate estimated future cash flows expected to be received from leasing out the property. A yield that reflects the specific risks inherent in the net cash flows is then applied to the net annual cash flows to arrive at the property valuation; or (b) the depreciated replacement cost of the asset, which estimates the current replacement cost of new assets and adjusted for obsolescence, including physical, functional and economic obsolescence. Estimated fair values of investment property amounted to P43,119 and P42,460 respectively as of December 31, 2021 and 2020 (Note 12). Impairment of Goodwill. The Group determines whether goodwill is impaired at least annually. This requires the estimation of the value in use of the cash-generating units to which the goodwill is allocated. Estimating value in use requires management to make an estimate of the expected future cash flows from the cash-generating unit and to choose a suitable discount rate to calculate the present value of those cash flows. The recoverable amount of goodwill arising from the acquisition of Petron Malaysia has been determined based on the value in use using discounted cash flows (DCF). Assumptions used in the DCF include terminal growth rate of 3% in 2021 and 2020 and discount rates of 7.7% and 6.3% in 2021 and 2020, respectively (Note 13). Management believes that any reasonably possible change in the key assumptions on which the recoverable amount is based would not cause its carrying amount to exceed its recoverable amount. No impairment losses were recognized in 2021, 2020 and 2019 in relation to the goodwill arising from the acquisition of Petron Malaysia which accounts for almost 99% of goodwill in the consolidated statements of financial position as of December 31, 2021 and 2020. Realizability of Deferred Tax Assets. The Group reviews its deferred tax assets at each reporting date and reduces the carrying amount to the extent that it is no longer probable that sufficient taxable profit will be available to allow all or part of the deferred tax assets to be utilized. The Group’s assessment on the recognition of deferred tax assets on deductible temporary differences and carry forward benefits of MCIT and NOLCO is based on the projected taxable income in the following periods. Deferred tax assets amounted to P2,172 and P2,190 as of December 31, 2021 and 2020, respectively (Note 28).
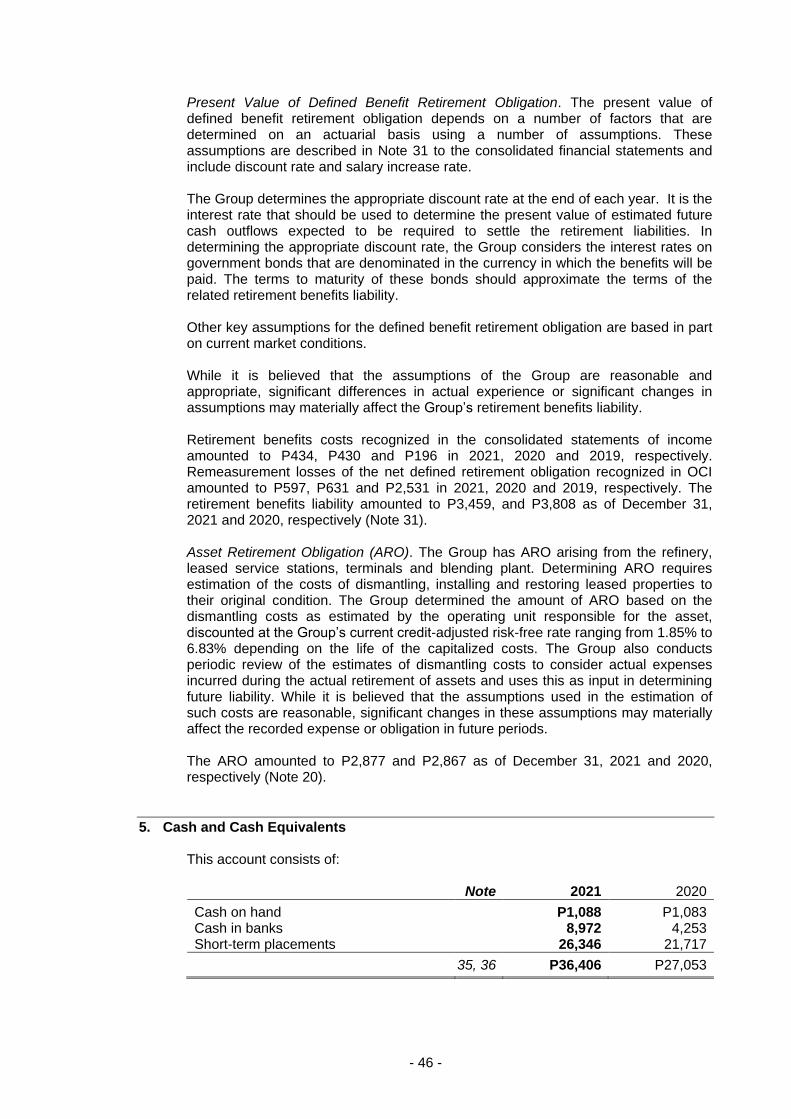
- 46 -
Present Value of Defined Benefit Retirement Obligation. The present value of defined benefit retirement obligation depends on a number of factors that are determined on an actuarial basis using a number of assumptions. These assumptions are described in Note 31 to the consolidated financial statements and include discount rate and salary increase rate. The Group determines the appropriate discount rate at the end of each year. It is the interest rate that should be used to determine the present value of estimated future cash outflows expected to be required to settle the retirement liabilities. In determining the appropriate discount rate, the Group considers the interest rates on government bonds that are denominated in the currency in which the benefits will be paid. The terms to maturity of these bonds should approximate the terms of the related retirement benefits liability. Other key assumptions for the defined benefit retirement obligation are based in part on current market conditions. While it is believed that the assumptions of the Group are reasonable and appropriate, significant differences in actual experience or significant changes in assumptions may materially affect the Group’s retirement benefits liability. Retirement benefits costs recognized in the consolidated statements of income amounted to P434, P430 and P196 in 2021, 2020 and 2019, respectively. Remeasurement losses of the net defined retirement obligation recognized in OCI amounted to P597, P631 and P2,531 in 2021, 2020 and 2019, respectively. The retirement benefits liability amounted to P3,459, and P3,808 as of December 31, 2021 and 2020, respectively (Note 31). Asset Retirement Obligation (ARO). The Group has ARO arising from the refinery, leased service stations, terminals and blending plant. Determining ARO requires estimation of the costs of dismantling, installing and restoring leased properties to their original condition. The Group determined the amount of ARO based on the dismantling costs as estimated by the operating unit responsible for the asset, discounted at the Group’s current credit-adjusted risk-free rate ranging from 1.85% to 6.83% depending on the life of the capitalized costs. The Group also conducts periodic review of the estimates of dismantling costs to consider actual expenses incurred during the actual retirement of assets and uses this as input in determining future liability. While it is believed that the assumptions used in the estimation of such costs are reasonable, significant changes in these assumptions may materially affect the recorded expense or obligation in future periods. The ARO amounted to P2,877 and P2,867 as of December 31, 2021 and 2020, respectively (Note 20).
5. Cash and Cash Equivalents This account consists of: Note 2021 2020
Cash on hand P1,088 P1,083 Cash in banks 8,972 4,253 Short-term placements 26,346 21,717
35, 36 P36,406 P27,053
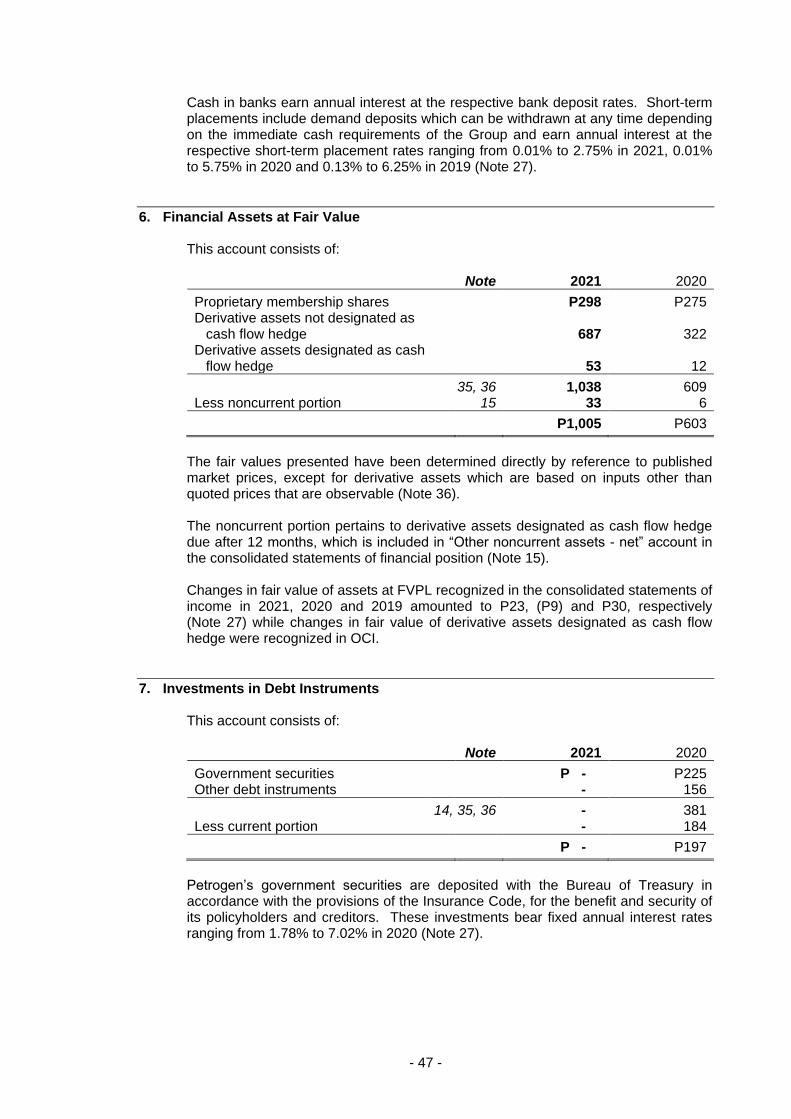
- 47 -
Cash in banks earn annual interest at the respective bank deposit rates. Short-term placements include demand deposits which can be withdrawn at any time depending on the immediate cash requirements of the Group and earn annual interest at the respective short-term placement rates ranging from 0.01% to 2.75% in 2021, 0.01% to 5.75% in 2020 and 0.13% to 6.25% in 2019 (Note 27).
6. Financial Assets at Fair Value This account consists of: Note 2021 2020
Proprietary membership shares P298 P275 Derivative assets not designated as
cash flow hedge 687 322 Derivative assets designated as cash
flow hedge 53 12
35, 36 1,038 609 Less noncurrent portion 15 33 6
P1,005 P603
The fair values presented have been determined directly by reference to published market prices, except for derivative assets which are based on inputs other than quoted prices that are observable (Note 36). The noncurrent portion pertains to derivative assets designated as cash flow hedge due after 12 months, which is included in “Other noncurrent assets - net” account in the consolidated statements of financial position (Note 15). Changes in fair value of assets at FVPL recognized in the consolidated statements of income in 2021, 2020 and 2019 amounted to P23, (P9) and P30, respectively (Note 27) while changes in fair value of derivative assets designated as cash flow hedge were recognized in OCI.
7. Investments in Debt Instruments This account consists of: Note 2021 2020
Government securities P - P225 Other debt instruments - 156
14, 35, 36 - 381 Less current portion - 184
P - P197
Petrogen’s government securities are deposited with the Bureau of Treasury in accordance with the provisions of the Insurance Code, for the benefit and security of its policyholders and creditors. These investments bear fixed annual interest rates ranging from 1.78% to 7.02% in 2020 (Note 27).
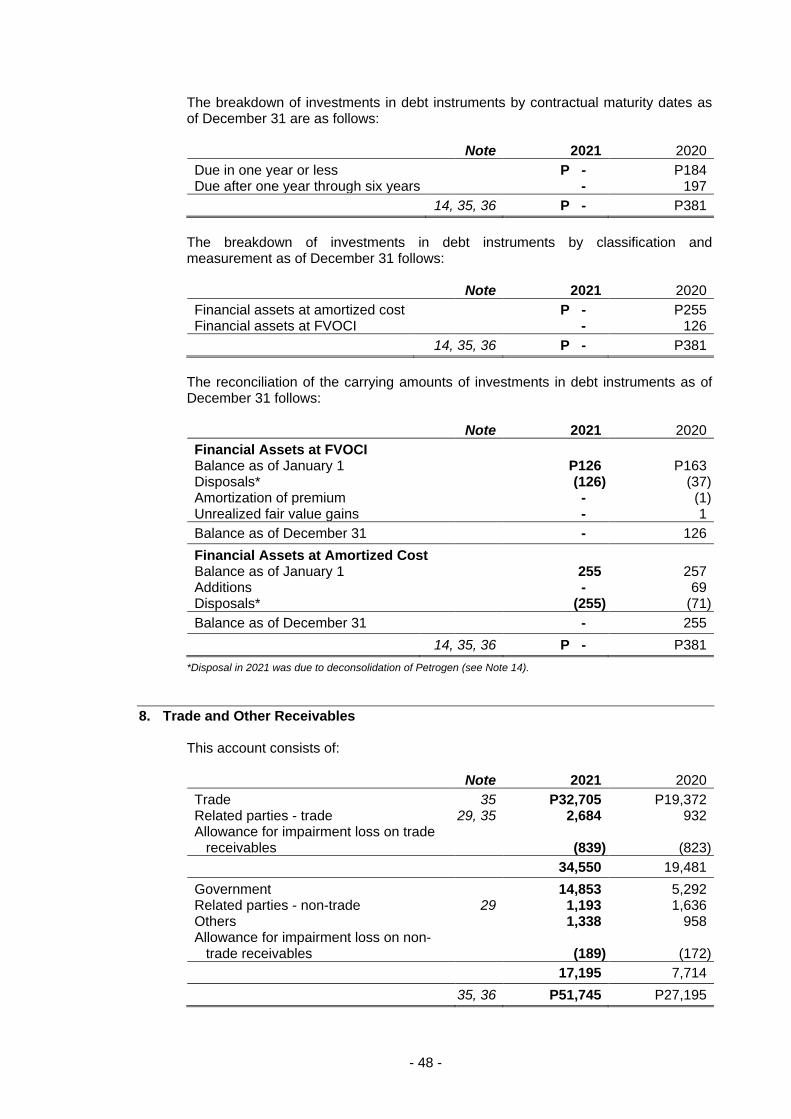
- 48 -
The breakdown of investments in debt instruments by contractual maturity dates as of December 31 are as follows: Note 2021 2020
Due in one year or less P - P184 Due after one year through six years - 197
14, 35, 36 P - P381
The breakdown of investments in debt instruments by classification and measurement as of December 31 follows: Note 2021 2020
Financial assets at amortized cost P - P255 Financial assets at FVOCI - 126
14, 35, 36 P - P381
The reconciliation of the carrying amounts of investments in debt instruments as of December 31 follows: Note 2021 2020
Financial Assets at FVOCI Balance as of January 1 P126 P163 Disposals* (126) (37) Amortization of premium - (1) Unrealized fair value gains - 1
Balance as of December 31 - 126
Financial Assets at Amortized Cost Balance as of January 1 255 257 Additions - 69 Disposals* (255) (71)
Balance as of December 31 - 255
14, 35, 36 P - P381
*Disposal in 2021 was due to deconsolidation of Petrogen (see Note 14).
8. Trade and Other Receivables This account consists of: Note 2021 2020
Trade 35 P32,705 P19,372 Related parties - trade 29, 35 2,684 932 Allowance for impairment loss on trade
receivables (839) (823)
34,550 19,481
Government 14,853 5,292 Related parties - non-trade 29 1,193 1,636 Others 1,338 958 Allowance for impairment loss on non-
trade receivables (189) (172)
17,195 7,714
35, 36 P51,745 P27,195
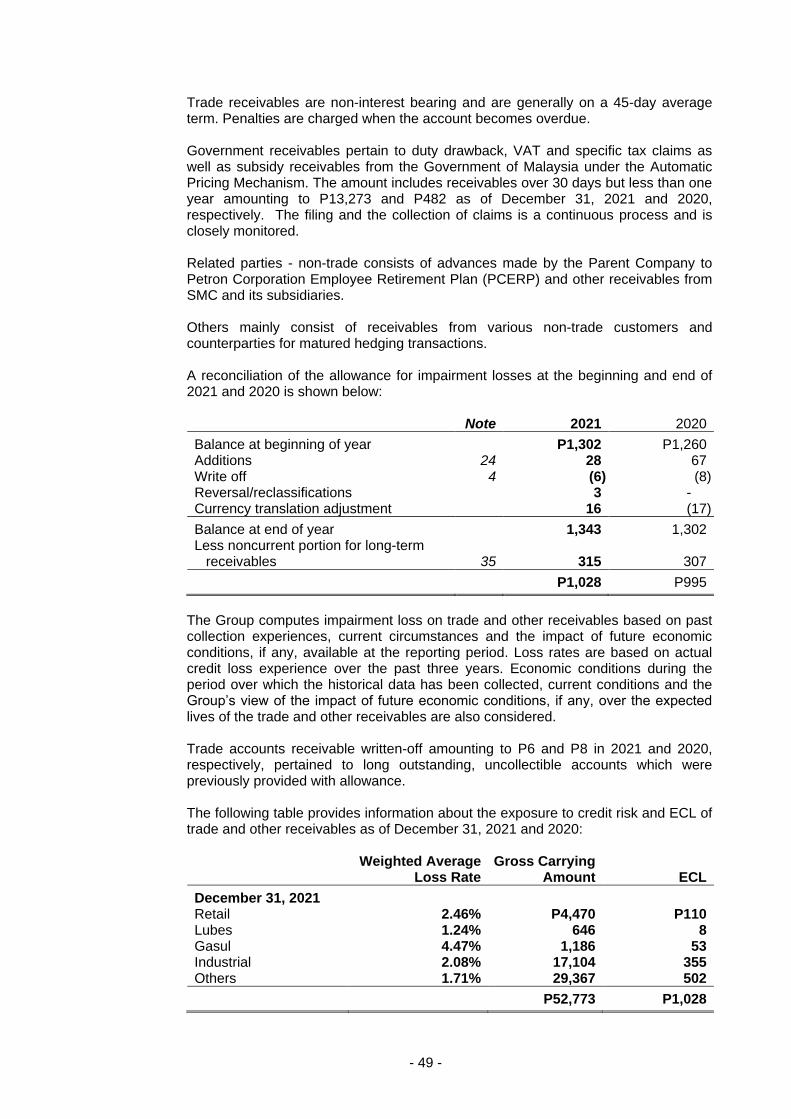
- 49 -
Trade receivables are non-interest bearing and are generally on a 45-day average term. Penalties are charged when the account becomes overdue. Government receivables pertain to duty drawback, VAT and specific tax claims as well as subsidy receivables from the Government of Malaysia under the Automatic Pricing Mechanism. The amount includes receivables over 30 days but less than one year amounting to P13,273 and P482 as of December 31, 2021 and 2020, respectively. The filing and the collection of claims is a continuous process and is closely monitored. Related parties - non-trade consists of advances made by the Parent Company to Petron Corporation Employee Retirement Plan (PCERP) and other receivables from SMC and its subsidiaries. Others mainly consist of receivables from various non-trade customers and counterparties for matured hedging transactions. A reconciliation of the allowance for impairment losses at the beginning and end of 2021 and 2020 is shown below: Note 2021 2020
Balance at beginning of year P1,302 P1,260 Additions 24 28 67 Write off 4 (6) (8) Reversal/reclassifications 3 - Currency translation adjustment 16 (17)
Balance at end of year 1,343 1,302 Less noncurrent portion for long-term
receivables 35 315 307
P1,028 P995
The Group computes impairment loss on trade and other receivables based on past collection experiences, current circumstances and the impact of future economic conditions, if any, available at the reporting period. Loss rates are based on actual credit loss experience over the past three years. Economic conditions during the period over which the historical data has been collected, current conditions and the Group’s view of the impact of future economic conditions, if any, over the expected lives of the trade and other receivables are also considered. Trade accounts receivable written-off amounting to P6 and P8 in 2021 and 2020, respectively, pertained to long outstanding, uncollectible accounts which were previously provided with allowance. The following table provides information about the exposure to credit risk and ECL of trade and other receivables as of December 31, 2021 and 2020:
Weighted Average
Loss Rate Gross Carrying
Amount ECL
December 31, 2021 Retail 2.46% P4,470 P110 Lubes 1.24% 646 8 Gasul 4.47% 1,186 53 Industrial 2.08% 17,104 355 Others 1.71% 29,367 502
P52,773 P1,028
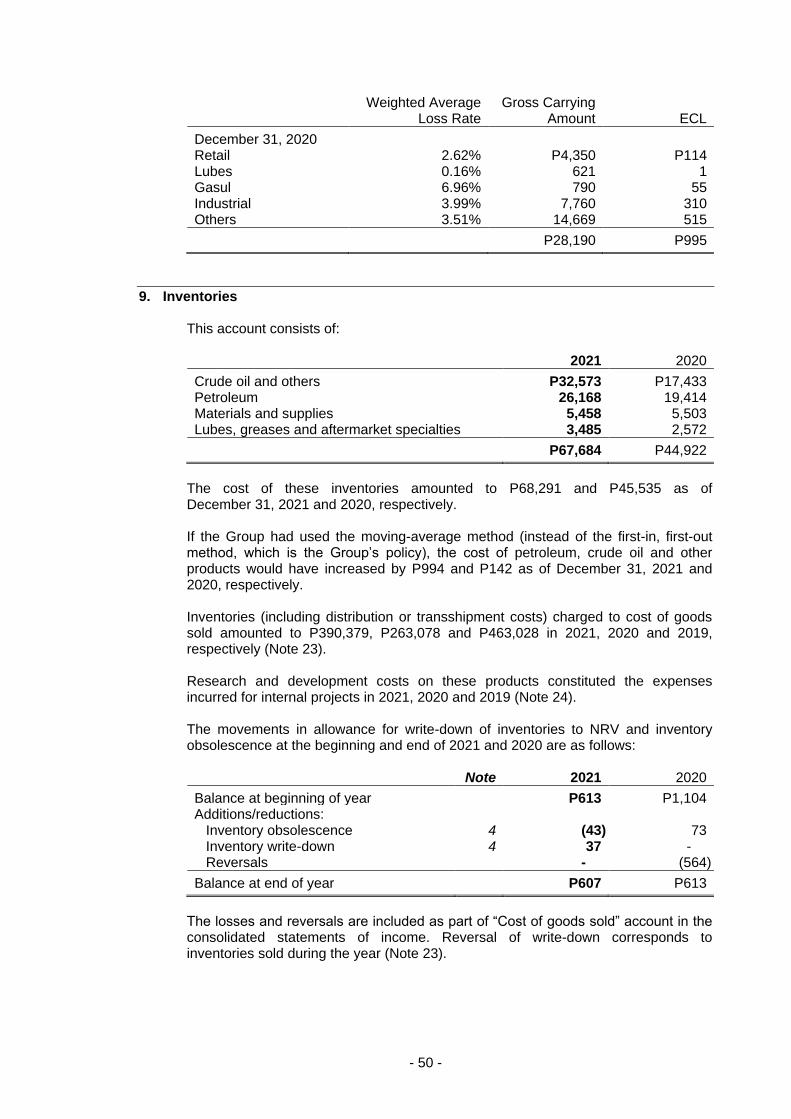
- 50 -
Weighted Average
Loss Rate Gross Carrying
Amount ECL
December 31, 2020 Retail 2.62% P4,350 P114 Lubes 0.16% 621 1 Gasul 6.96% 790 55 Industrial 3.99% 7,760 310 Others 3.51% 14,669 515
P28,190 P995
9. Inventories This account consists of: 2021 2020
Crude oil and others P32,573 P17,433 Petroleum 26,168 19,414 Materials and supplies 5,458 5,503 Lubes, greases and aftermarket specialties 3,485 2,572
P67,684 P44,922
The cost of these inventories amounted to P68,291 and P45,535 as of December 31, 2021 and 2020, respectively. If the Group had used the moving-average method (instead of the first-in, first-out method, which is the Group’s policy), the cost of petroleum, crude oil and other products would have increased by P994 and P142 as of December 31, 2021 and 2020, respectively. Inventories (including distribution or transshipment costs) charged to cost of goods sold amounted to P390,379, P263,078 and P463,028 in 2021, 2020 and 2019, respectively (Note 23). Research and development costs on these products constituted the expenses incurred for internal projects in 2021, 2020 and 2019 (Note 24). The movements in allowance for write-down of inventories to NRV and inventory obsolescence at the beginning and end of 2021 and 2020 are as follows: Note 2021 2020
Balance at beginning of year P613 P1,104 Additions/reductions:
Inventory obsolescence 4 (43) 73 Inventory write-down 4 37 - Reversals - (564)
Balance at end of year P607 P613
The losses and reversals are included as part of “Cost of goods sold” account in the consolidated statements of income. Reversal of write-down corresponds to inventories sold during the year (Note 23).
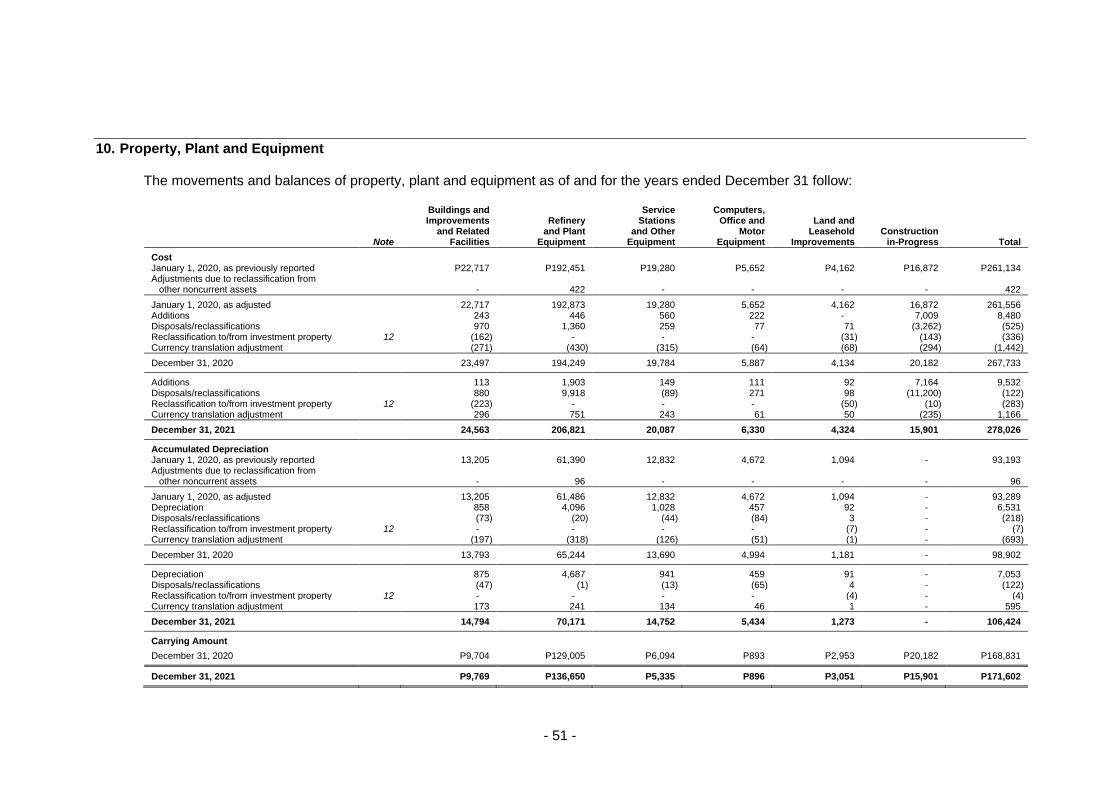
- 51 -
10. Property, Plant and Equipment The movements and balances of property, plant and equipment as of and for the years ended December 31 follow:
Note
Buildings and Improvements
and Related Facilities
Refinery and Plant
Equipment
Service Stations
and Other Equipment
Computers, Office and
Motor Equipment
Land and Leasehold
Improvements Construction
in-Progress Total
Cost January 1, 2020, as previously reported P22,717 P192,451 P19,280 P5,652 P4,162 P16,872 P261,134 Adjustments due to reclassification from
other noncurrent assets - 422 - - - - 422
January 1, 2020, as adjusted 22,717 192,873 19,280 5,652 4,162 16,872 261,556 Additions 243 446 560 222 - 7,009 8,480 Disposals/reclassifications 970 1,360 259 77 71 (3,262) (525) Reclassification to/from investment property 12 (162) - - - (31) (143) (336) Currency translation adjustment (271) (430) (315) (64) (68) (294) (1,442)
December 31, 2020 23,497 194,249 19,784 5,887 4,134 20,182 267,733
Additions 113 1,903 149 111 92 7,164 9,532 Disposals/reclassifications 880 9,918 (89) 271 98 (11,200) (122) Reclassification to/from investment property 12 (223) - - - (50) (10) (283) Currency translation adjustment 296 751 243 61 50 (235) 1,166
December 31, 2021 24,563 206,821 20,087 6,330 4,324 15,901 278,026
Accumulated Depreciation January 1, 2020, as previously reported 13,205 61,390 12,832 4,672 1,094 - 93,193 Adjustments due to reclassification from
other noncurrent assets - 96 - - - - 96
January 1, 2020, as adjusted 13,205 61,486 12,832 4,672 1,094 - 93,289 Depreciation 858 4,096 1,028 457 92 - 6,531 Disposals/reclassifications (73) (20) (44) (84) 3 - (218) Reclassification to/from investment property 12 - - - - (7) - (7) Currency translation adjustment (197) (318) (126) (51) (1) - (693)
December 31, 2020 13,793 65,244 13,690 4,994 1,181 - 98,902
Depreciation 875 4,687 941 459 91 - 7,053 Disposals/reclassifications (47) (1) (13) (65) 4 - (122) Reclassification to/from investment property 12 - - - - (4) - (4) Currency translation adjustment 173 241 134 46 1 - 595
December 31, 2021 14,794 70,171 14,752 5,434 1,273 - 106,424
Carrying Amount
December 31, 2020 P9,704 P129,005 P6,094 P893 P2,953 P20,182 P168,831
December 31, 2021 P9,769 P136,650 P5,335 P896 P3,051 P15,901 P171,602
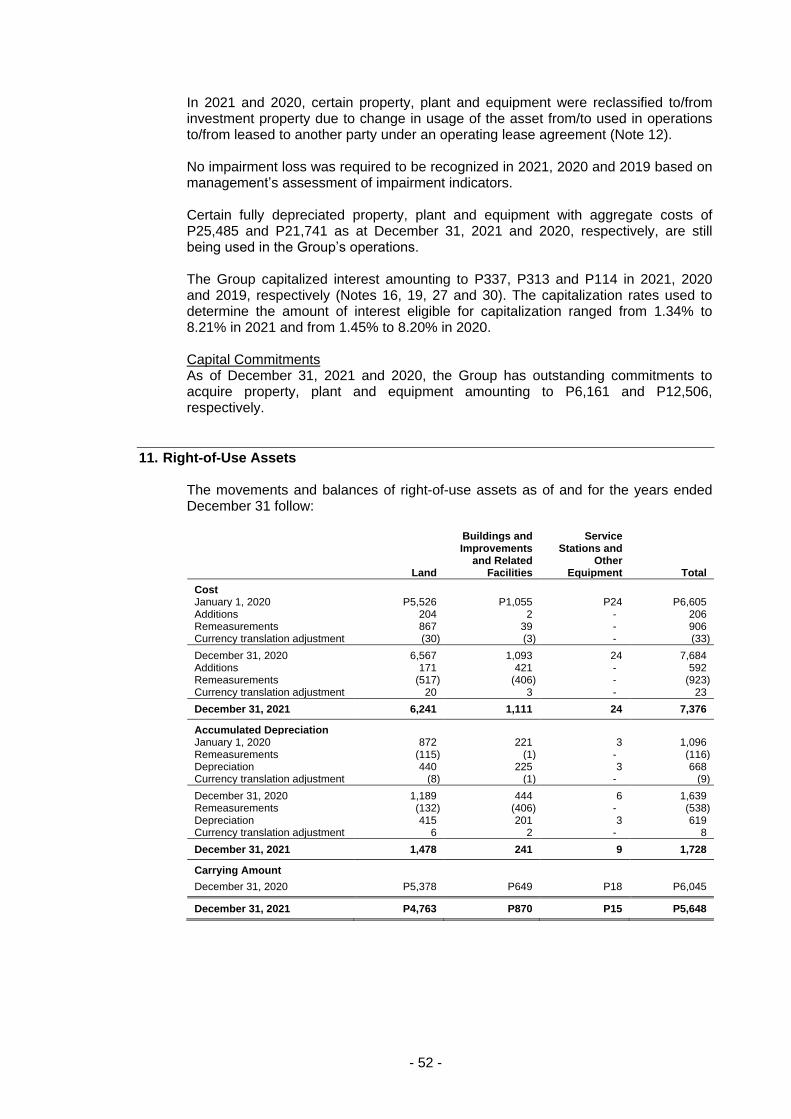
- 52 -
In 2021 and 2020, certain property, plant and equipment were reclassified to/from investment property due to change in usage of the asset from/to used in operations to/from leased to another party under an operating lease agreement (Note 12). No impairment loss was required to be recognized in 2021, 2020 and 2019 based on management’s assessment of impairment indicators. Certain fully depreciated property, plant and equipment with aggregate costs of P25,485 and P21,741 as at December 31, 2021 and 2020, respectively, are still being used in the Group’s operations. The Group capitalized interest amounting to P337, P313 and P114 in 2021, 2020 and 2019, respectively (Notes 16, 19, 27 and 30). The capitalization rates used to determine the amount of interest eligible for capitalization ranged from 1.34% to 8.21% in 2021 and from 1.45% to 8.20% in 2020. Capital Commitments As of December 31, 2021 and 2020, the Group has outstanding commitments to acquire property, plant and equipment amounting to P6,161 and P12,506, respectively.
11. Right-of-Use Assets The movements and balances of right-of-use assets as of and for the years ended December 31 follow:
Land
Buildings and Improvements
and Related Facilities
Service Stations and
Other Equipment Total
Cost January 1, 2020 P5,526 P1,055 P24 P6,605 Additions 204 2 - 206 Remeasurements 867 39 - 906 Currency translation adjustment (30) (3) - (33)
December 31, 2020 6,567 1,093 24 7,684 Additions 171 421 - 592 Remeasurements (517) (406) - (923) Currency translation adjustment 20 3 - 23
December 31, 2021 6,241 1,111 24 7,376
Accumulated Depreciation January 1, 2020 872 221 3 1,096 Remeasurements (115) (1) - (116) Depreciation 440 225 3 668 Currency translation adjustment (8) (1) - (9)
December 31, 2020 1,189 444 6 1,639 Remeasurements (132) (406) - (538) Depreciation 415 201 3 619 Currency translation adjustment 6 2 - 8
December 31, 2021 1,478 241 9 1,728
Carrying Amount
December 31, 2020 P5,378 P649 P18 P6,045
December 31, 2021 P4,763 P870 P15 P5,648
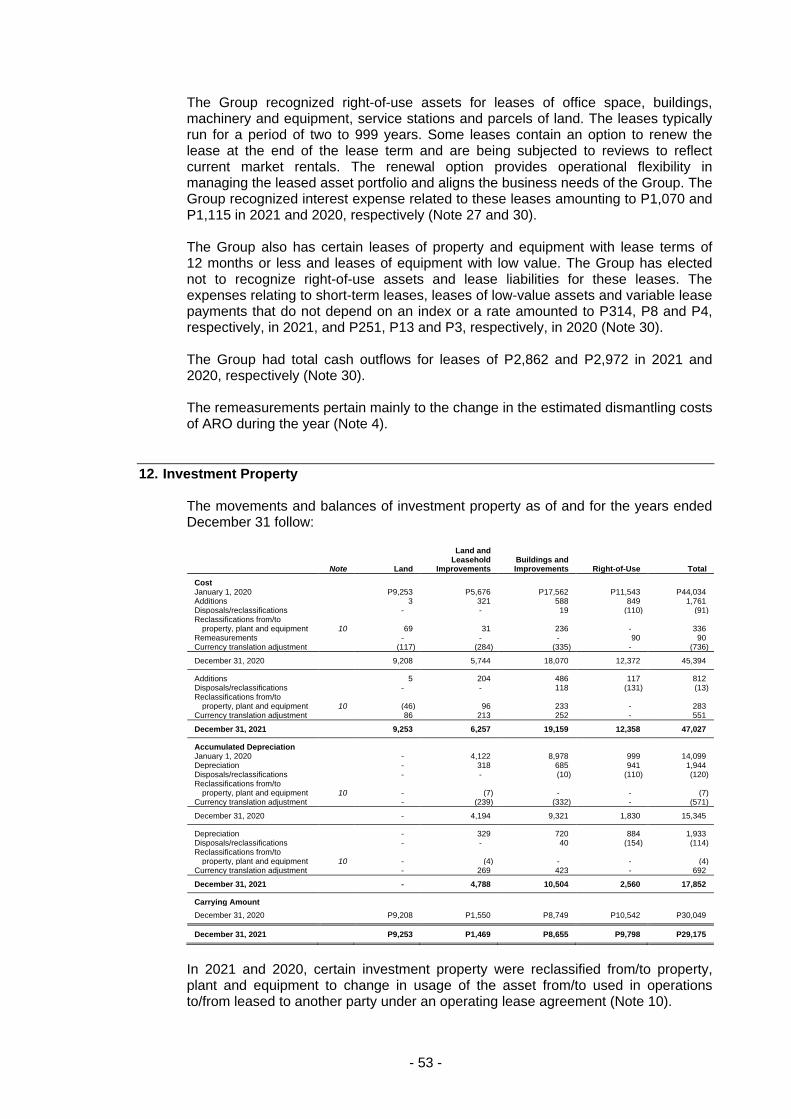
- 53 -
The Group recognized right-of-use assets for leases of office space, buildings, machinery and equipment, service stations and parcels of land. The leases typically run for a period of two to 999 years. Some leases contain an option to renew the lease at the end of the lease term and are being subjected to reviews to reflect current market rentals. The renewal option provides operational flexibility in managing the leased asset portfolio and aligns the business needs of the Group. The Group recognized interest expense related to these leases amounting to P1,070 and P1,115 in 2021 and 2020, respectively (Note 27 and 30). The Group also has certain leases of property and equipment with lease terms of 12 months or less and leases of equipment with low value. The Group has elected not to recognize right-of-use assets and lease liabilities for these leases. The expenses relating to short-term leases, leases of low-value assets and variable lease payments that do not depend on an index or a rate amounted to P314, P8 and P4, respectively, in 2021, and P251, P13 and P3, respectively, in 2020 (Note 30). The Group had total cash outflows for leases of P2,862 and P2,972 in 2021 and 2020, respectively (Note 30). The remeasurements pertain mainly to the change in the estimated dismantling costs of ARO during the year (Note 4).
12. Investment Property The movements and balances of investment property as of and for the years ended December 31 follow:
Note Land
Land and Leasehold
Improvements Buildings and Improvements Right-of-Use Total
Cost January 1, 2020 P9,253 P5,676 P17,562 P11,543 P44,034 Additions 3 321 588 849 1,761 Disposals/reclassifications - - 19 (110) (91) Reclassifications from/to
property, plant and equipment 10 69 31 236 - 336 Remeasurements - - - 90 90 Currency translation adjustment (117) (284) (335) - (736)
December 31, 2020 9,208 5,744 18,070 12,372 45,394
Additions 5 204 486 117 812 Disposals/reclassifications - - 118 (131) (13) Reclassifications from/to
property, plant and equipment 10 (46) 96 233 - 283 Currency translation adjustment 86 213 252 - 551
December 31, 2021 9,253 6,257 19,159 12,358 47,027
Accumulated Depreciation January 1, 2020 - 4,122 8,978 999 14,099 Depreciation - 318 685 941 1,944 Disposals/reclassifications - - (10) (110) (120) Reclassifications from/to
property, plant and equipment 10 - (7) - - (7) Currency translation adjustment - (239) (332) - (571)
December 31, 2020 - 4,194 9,321 1,830 15,345
Depreciation - 329 720 884 1,933 Disposals/reclassifications - - 40 (154) (114) Reclassifications from/to
property, plant and equipment 10 - (4) - - (4) Currency translation adjustment - 269 423 - 692
December 31, 2021 - 4,788 10,504 2,560 17,852
Carrying Amount
December 31, 2020 P9,208 P1,550 P8,749 P10,542 P30,049
December 31, 2021 P9,253 P1,469 P8,655 P9,798 P29,175
In 2021 and 2020, certain investment property were reclassified from/to property, plant and equipment to change in usage of the asset from/to used in operations to/from leased to another party under an operating lease agreement (Note 10).
- 54 -
No impairment loss was required to be recognized in 2021, 2020 and 2019 based on management’s assessment of impairment indicators. There are no other direct selling and administrative expenses other than depreciation and real property taxes arising from investment property that generated income in 2021, 2020 and 2019. The fair value of investment property amounting to P43,119 and P42,460 as of December 31, 2021 and 2020, respectively, has been categorized as Level 3 in the fair value hierarchy based on the inputs used in the valuation techniques. For properties with available appraisal reports, the fair value of investment property amounting to P27,166 and P26,138 as of December 31, 2021 and 2020, respectively, were determined by external, independent property appraisers having appropriate recognized professional qualifications and recent experience in the location and category of the property being valued. The independent appraisers provide the fair value of the Group’s investment property on a regular basis. The fair value of investment property amounting to P6,017 and P4,820 as of December 31, 2021 and 2020, respectively, were determined by using the depreciated replacement cost method. The net present value of lease liability recognized in investment property as of December 31, 2021 and 2020 represents the remaining fair value amounting to P9,936 and P11,502, respectively. Valuation Technique and Significant Unobservable Inputs The valuation of investment property applied the following approaches below: Sales Comparison Approach. The market value of land was determined using the Sales Comparison Approach. The comparative approach considers the sale of similar or substitute property, registered within the vicinity, and the related market data. The estimated value is established through such process of comparing available data. The property being valued is then compared with sales transactions involving similar properties in the market. Listings and offerings may also be considered. The observable inputs to determine the market value of the property are the following: location characteristics, size, time element, quality and prospective use, bargaining allowance and marketability. Depreciated Replacement Cost Method. The fair value of land and leasehold improvements and buildings and related improvements and facilities were arrived at using the depreciated replacement cost method, which estimates the current replacement cost of new assets and adjusted for obsolescence, including physical, functional and economic obsolescence. Income Approach. The rental value of the subject property was determined using the Income Approach. Under the Income Approach, the remaining lease payments on the property is first determined followed by the application of the proper capitalization rate is applied to arrive at its net present value. The rental value of the property is determined on the basis of what a prudent lessor or a prospective lessee are willing to pay for its use and occupancy considering the prevailing rental rates of similar property and/or rate of return a prudent lessor generally expects on the return on its investment.
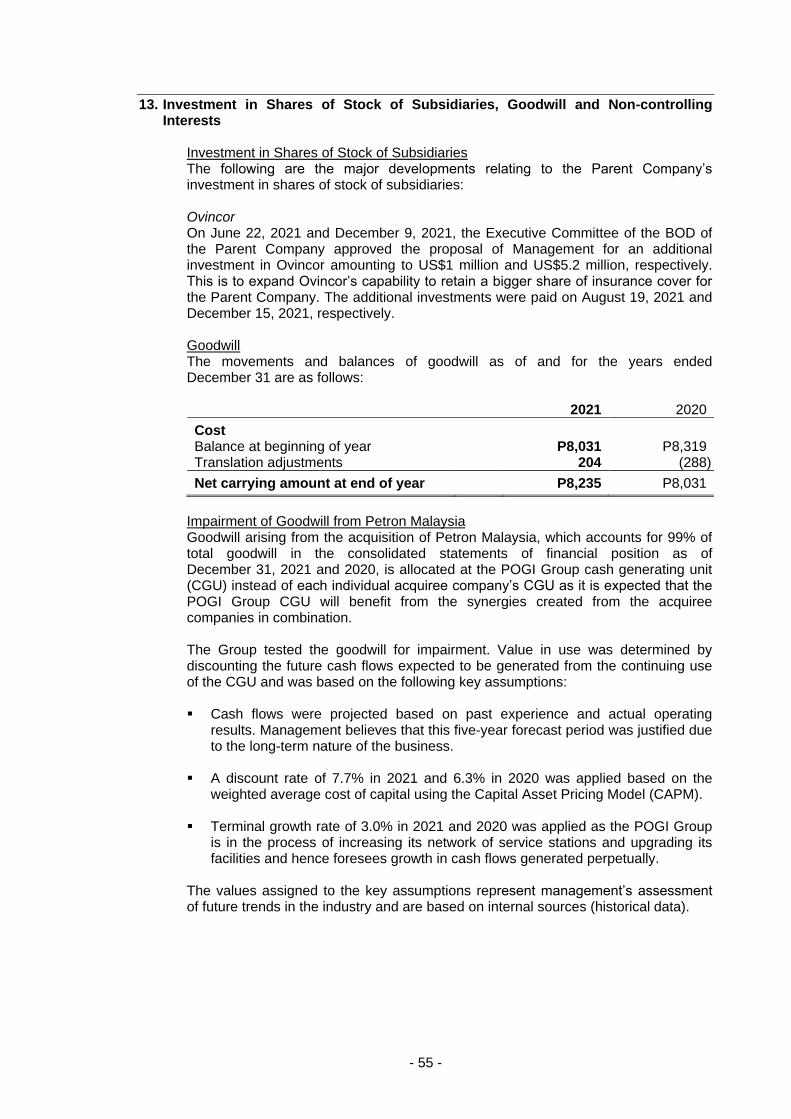
- 55 -
13. Investment in Shares of Stock of Subsidiaries, Goodwill and Non-controlling Interests
Investment in Shares of Stock of Subsidiaries The following are the major developments relating to the Parent Company’s investment in shares of stock of subsidiaries: Ovincor On June 22, 2021 and December 9, 2021, the Executive Committee of the BOD of the Parent Company approved the proposal of Management for an additional investment in Ovincor amounting to US$1 million and US$5.2 million, respectively. This is to expand Ovincor’s capability to retain a bigger share of insurance cover for the Parent Company. The additional investments were paid on August 19, 2021 and December 15, 2021, respectively. Goodwill The movements and balances of goodwill as of and for the years ended December 31 are as follows: 2021 2020
Cost Balance at beginning of year P8,031 P8,319 Translation adjustments 204 (288)
Net carrying amount at end of year P8,235 P8,031
Impairment of Goodwill from Petron Malaysia Goodwill arising from the acquisition of Petron Malaysia, which accounts for 99% of total goodwill in the consolidated statements of financial position as of December 31, 2021 and 2020, is allocated at the POGI Group cash generating unit (CGU) instead of each individual acquiree company’s CGU as it is expected that the POGI Group CGU will benefit from the synergies created from the acquiree companies in combination. The Group tested the goodwill for impairment. Value in use was determined by discounting the future cash flows expected to be generated from the continuing use of the CGU and was based on the following key assumptions: Cash flows were projected based on past experience and actual operating
results. Management believes that this five-year forecast period was justified due to the long-term nature of the business.
A discount rate of 7.7% in 2021 and 6.3% in 2020 was applied based on the
weighted average cost of capital using the Capital Asset Pricing Model (CAPM). Terminal growth rate of 3.0% in 2021 and 2020 was applied as the POGI Group
is in the process of increasing its network of service stations and upgrading its facilities and hence foresees growth in cash flows generated perpetually.
The values assigned to the key assumptions represent management’s assessment of future trends in the industry and are based on internal sources (historical data).
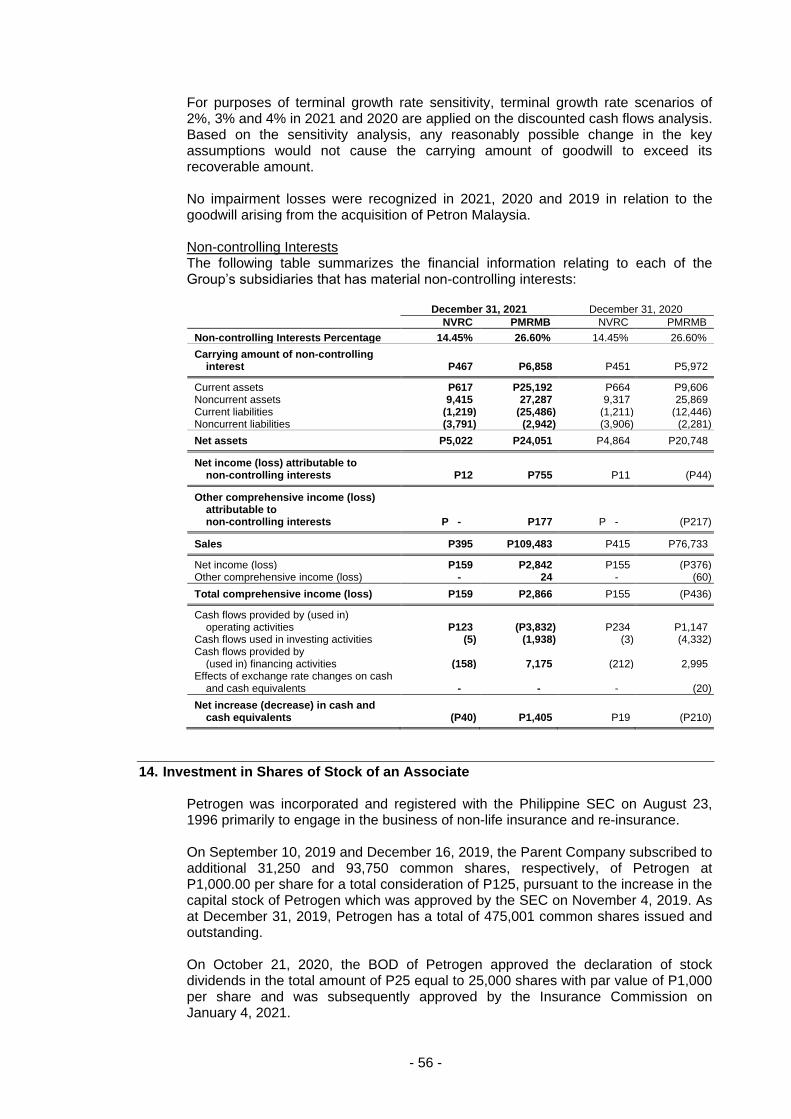
- 56 -
For purposes of terminal growth rate sensitivity, terminal growth rate scenarios of 2%, 3% and 4% in 2021 and 2020 are applied on the discounted cash flows analysis. Based on the sensitivity analysis, any reasonably possible change in the key assumptions would not cause the carrying amount of goodwill to exceed its recoverable amount. No impairment losses were recognized in 2021, 2020 and 2019 in relation to the goodwill arising from the acquisition of Petron Malaysia. Non-controlling Interests The following table summarizes the financial information relating to each of the Group’s subsidiaries that has material non-controlling interests:
December 31, 2021 December 31, 2020
NVRC PMRMB NVRC PMRMB
Non-controlling Interests Percentage 14.45% 26.60% 14.45% 26.60%
Carrying amount of non-controlling interest P467 P6,858 P451 P5,972
Current assets P617 P25,192 P664 P9,606 Noncurrent assets 9,415 27,287 9,317 25,869 Current liabilities (1,219) (25,486) (1,211) (12,446) Noncurrent liabilities (3,791) (2,942) (3,906) (2,281)
Net assets P5,022 P24,051 P4,864 P20,748
Net income (loss) attributable to non-controlling interests P12 P755 P11 (P44)
Other comprehensive income (loss) attributable to non-controlling interests P - P177 P - (P217)
Sales P395 P109,483 P415 P76,733
Net income (loss) P159 P2,842 P155 (P376) Other comprehensive income (loss) - 24 - (60)
Total comprehensive income (loss) P159 P2,866 P155 (P436)
Cash flows provided by (used in) operating activities P123 (P3,832) P234 P1,147
Cash flows used in investing activities (5) (1,938) (3) (4,332) Cash flows provided by
(used in) financing activities (158) 7,175 (212) 2,995 Effects of exchange rate changes on cash
and cash equivalents - - - (20)
Net increase (decrease) in cash and cash equivalents (P40) P1,405 P19 (P210)
14. Investment in Shares of Stock of an Associate Petrogen was incorporated and registered with the Philippine SEC on August 23, 1996 primarily to engage in the business of non-life insurance and re-insurance. On September 10, 2019 and December 16, 2019, the Parent Company subscribed to additional 31,250 and 93,750 common shares, respectively, of Petrogen at P1,000.00 per share for a total consideration of P125, pursuant to the increase in the capital stock of Petrogen which was approved by the SEC on November 4, 2019. As at December 31, 2019, Petrogen has a total of 475,001 common shares issued and outstanding. On October 21, 2020, the BOD of Petrogen approved the declaration of stock dividends in the total amount of P25 equal to 25,000 shares with par value of P1,000 per share and was subsequently approved by the Insurance Commission on January 4, 2021.
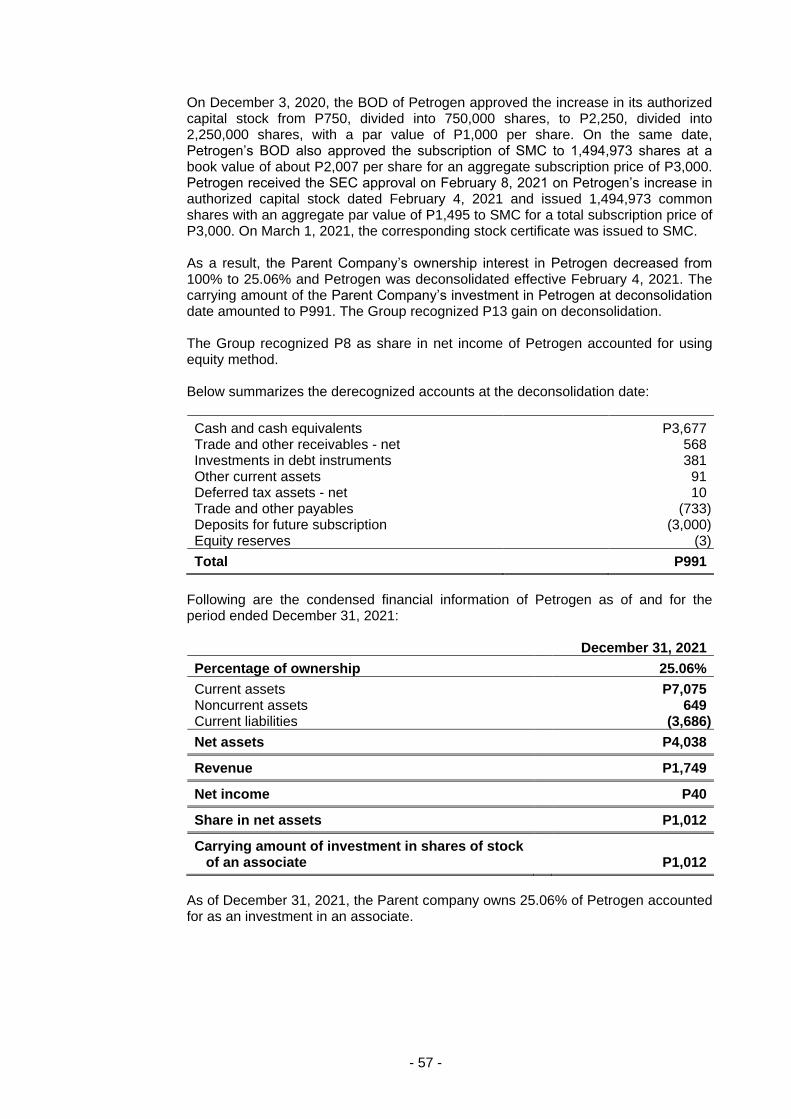
- 57 -
On December 3, 2020, the BOD of Petrogen approved the increase in its authorized capital stock from P750, divided into 750,000 shares, to P2,250, divided into 2,250,000 shares, with a par value of P1,000 per share. On the same date, Petrogen’s BOD also approved the subscription of SMC to 1,494,973 shares at a book value of about P2,007 per share for an aggregate subscription price of P3,000. Petrogen received the SEC approval on February 8, 2021 on Petrogen’s increase in authorized capital stock dated February 4, 2021 and issued 1,494,973 common shares with an aggregate par value of P1,495 to SMC for a total subscription price of P3,000. On March 1, 2021, the corresponding stock certificate was issued to SMC. As a result, the Parent Company’s ownership interest in Petrogen decreased from 100% to 25.06% and Petrogen was deconsolidated effective February 4, 2021. The carrying amount of the Parent Company’s investment in Petrogen at deconsolidation date amounted to P991. The Group recognized P13 gain on deconsolidation. The Group recognized P8 as share in net income of Petrogen accounted for using equity method. Below summarizes the derecognized accounts at the deconsolidation date:
Cash and cash equivalents P3,677 Trade and other receivables - net 568 Investments in debt instruments 381 Other current assets 91 Deferred tax assets - net 10 Trade and other payables (733) Deposits for future subscription (3,000) Equity reserves (3)
Total P991
Following are the condensed financial information of Petrogen as of and for the period ended December 31, 2021: December 31, 2021
Percentage of ownership 25.06%
Current assets P7,075 Noncurrent assets 649 Current liabilities (3,686)
Net assets P4,038
Revenue P1,749
Net income P40
Share in net assets P1,012
Carrying amount of investment in shares of stock of an associate P1,012
As of December 31, 2021, the Parent company owns 25.06% of Petrogen accounted for as an investment in an associate.
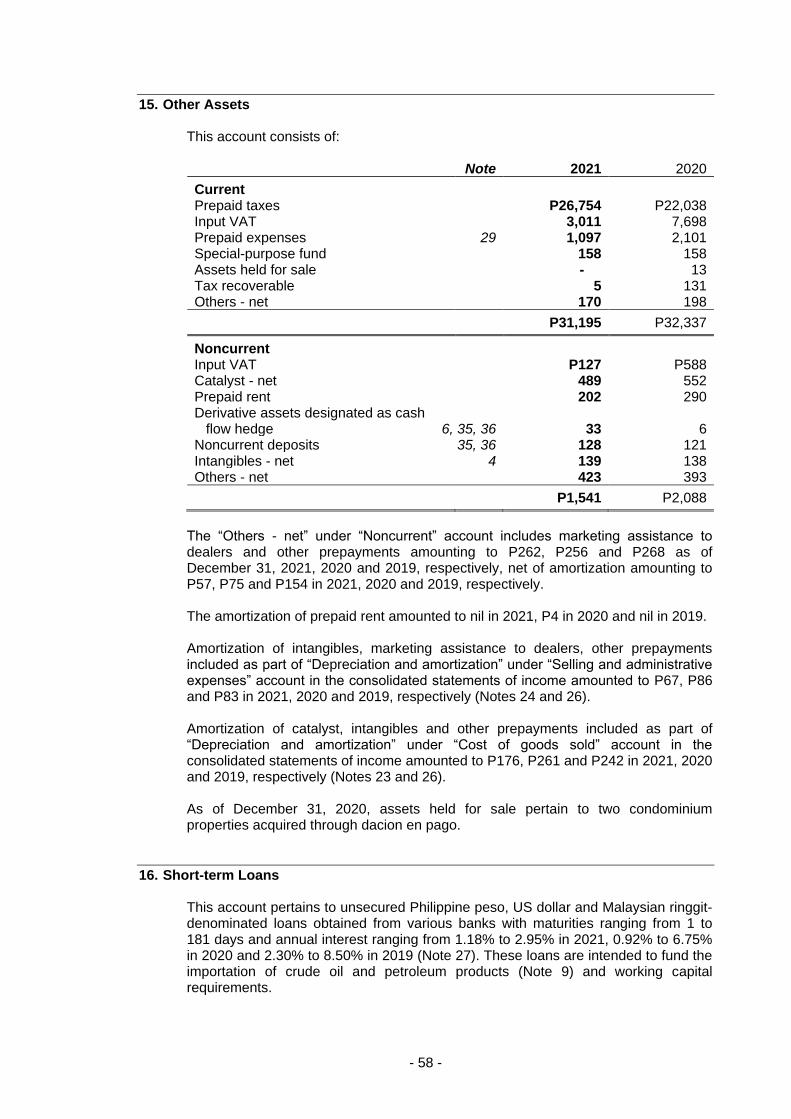
- 58 -
15. Other Assets This account consists of: Note 2021 2020
Current Prepaid taxes P26,754 P22,038 Input VAT 3,011 7,698 Prepaid expenses 29 1,097 2,101 Special-purpose fund 158 158 Assets held for sale - 13 Tax recoverable 5 131 Others - net 170 198
P31,195 P32,337
Noncurrent Input VAT P127 P588 Catalyst - net 489 552 Prepaid rent 202 290 Derivative assets designated as cash
flow hedge 6, 35, 36 33 6 Noncurrent deposits 35, 36 128 121 Intangibles - net 4 139 138 Others - net 423 393
P1,541 P2,088
The “Others - net” under “Noncurrent” account includes marketing assistance to dealers and other prepayments amounting to P262, P256 and P268 as of December 31, 2021, 2020 and 2019, respectively, net of amortization amounting to P57, P75 and P154 in 2021, 2020 and 2019, respectively. The amortization of prepaid rent amounted to nil in 2021, P4 in 2020 and nil in 2019. Amortization of intangibles, marketing assistance to dealers, other prepayments included as part of “Depreciation and amortization” under “Selling and administrative expenses” account in the consolidated statements of income amounted to P67, P86 and P83 in 2021, 2020 and 2019, respectively (Notes 24 and 26). Amortization of catalyst, intangibles and other prepayments included as part of “Depreciation and amortization” under “Cost of goods sold” account in the consolidated statements of income amounted to P176, P261 and P242 in 2021, 2020 and 2019, respectively (Notes 23 and 26). As of December 31, 2020, assets held for sale pertain to two condominium properties acquired through dacion en pago.
16. Short-term Loans This account pertains to unsecured Philippine peso, US dollar and Malaysian ringgit-denominated loans obtained from various banks with maturities ranging from 1 to 181 days and annual interest ranging from 1.18% to 2.95% in 2021, 0.92% to 6.75% in 2020 and 2.30% to 8.50% in 2019 (Note 27). These loans are intended to fund the importation of crude oil and petroleum products (Note 9) and working capital requirements.
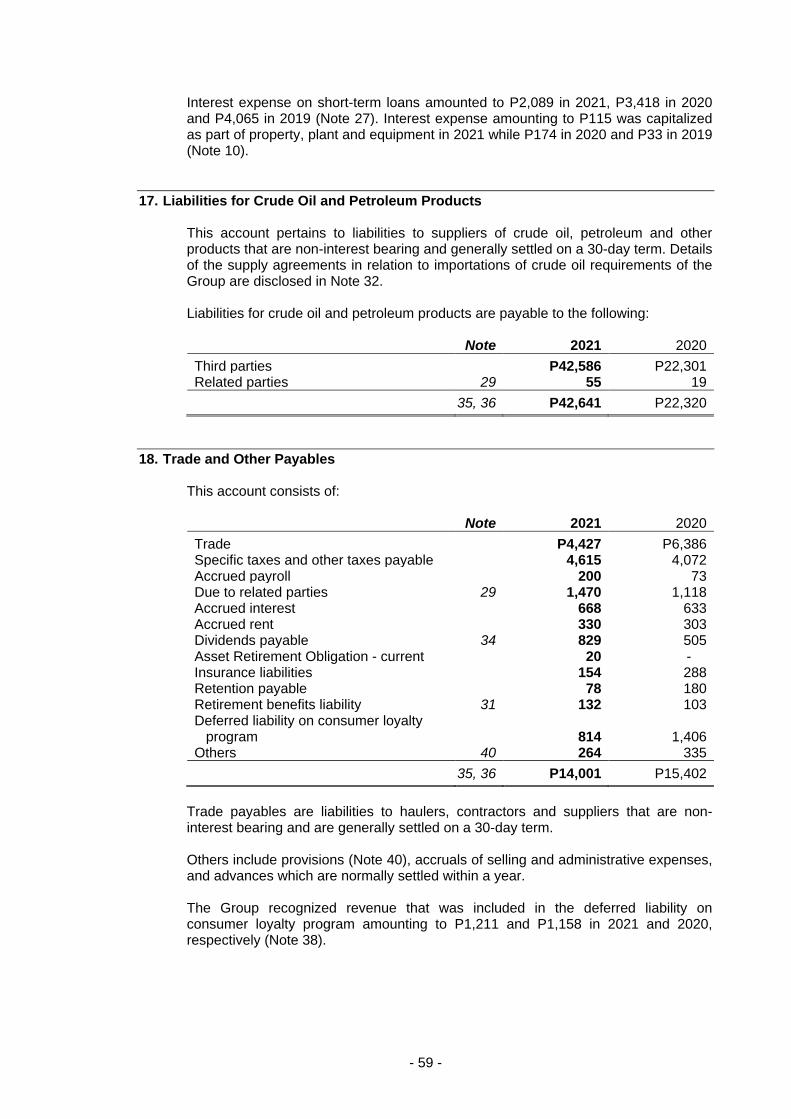
- 59 -
Interest expense on short-term loans amounted to P2,089 in 2021, P3,418 in 2020 and P4,065 in 2019 (Note 27). Interest expense amounting to P115 was capitalized as part of property, plant and equipment in 2021 while P174 in 2020 and P33 in 2019 (Note 10).
17. Liabilities for Crude Oil and Petroleum Products This account pertains to liabilities to suppliers of crude oil, petroleum and other products that are non-interest bearing and generally settled on a 30-day term. Details of the supply agreements in relation to importations of crude oil requirements of the Group are disclosed in Note 32. Liabilities for crude oil and petroleum products are payable to the following: Note 2021 2020
Third parties P42,586 P22,301 Related parties 29 55 19
35, 36 P42,641 P22,320
18. Trade and Other Payables This account consists of: Note 2021 2020
Trade P4,427 P6,386 Specific taxes and other taxes payable 4,615 4,072 Accrued payroll 200 73 Due to related parties 29 1,470 1,118 Accrued interest 668 633 Accrued rent 330 303 Dividends payable 34 829 505 Asset Retirement Obligation - current 20 - Insurance liabilities 154 288 Retention payable 78 180 Retirement benefits liability 31 132 103 Deferred liability on consumer loyalty
program 814 1,406 Others 40 264 335
35, 36 P14,001 P15,402
Trade payables are liabilities to haulers, contractors and suppliers that are non-interest bearing and are generally settled on a 30-day term. Others include provisions (Note 40), accruals of selling and administrative expenses, and advances which are normally settled within a year. The Group recognized revenue that was included in the deferred liability on consumer loyalty program amounting to P1,211 and P1,158 in 2021 and 2020, respectively (Note 38).
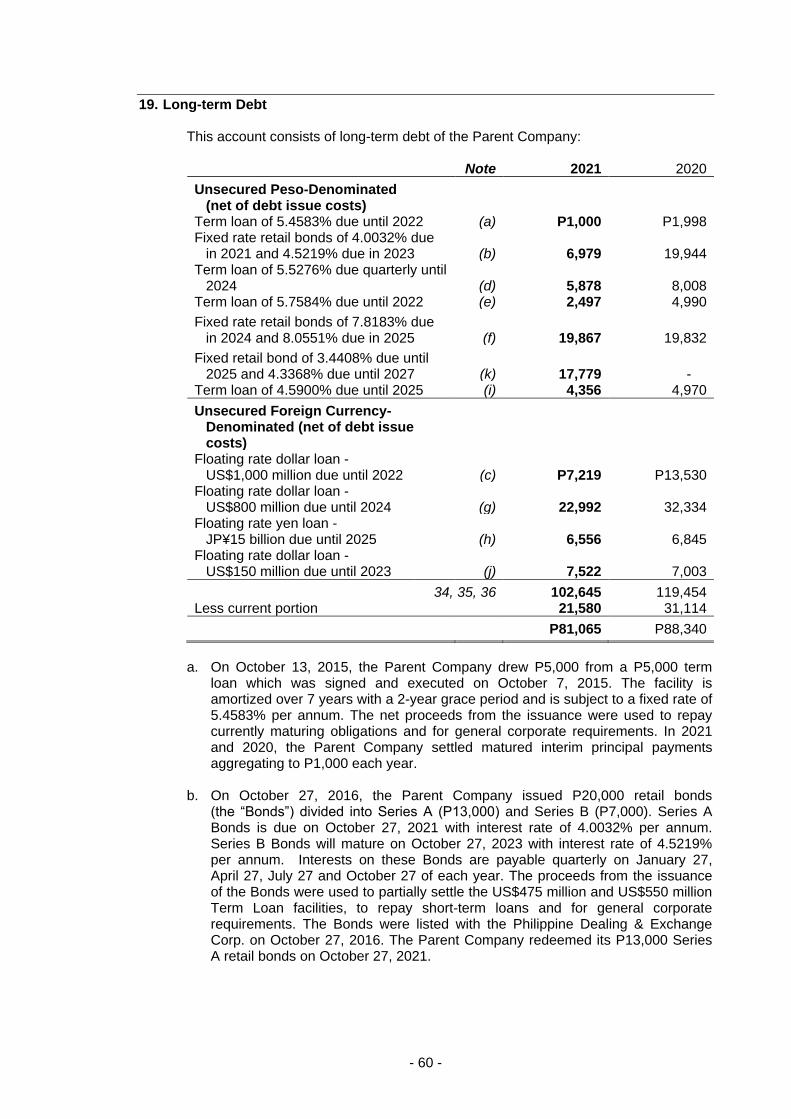
- 60 -
19. Long-term Debt This account consists of long-term debt of the Parent Company: Note 2021 2020
Unsecured Peso-Denominated (net of debt issue costs)
Term loan of 5.4583% due until 2022 (a) P1,000 P1,998 Fixed rate retail bonds of 4.0032% due
in 2021 and 4.5219% due in 2023 (b) 6,979 19,944 Term loan of 5.5276% due quarterly until
2024 (d) 5,878 8,008 Term loan of 5.7584% due until 2022 (e) 2,497 4,990
Fixed rate retail bonds of 7.8183% due in 2024 and 8.0551% due in 2025 (f) 19,867 19,832
Fixed retail bond of 3.4408% due until 2025 and 4.3368% due until 2027 (k) 17,779 -
Term loan of 4.5900% due until 2025 (i) 4,356 4,970
Unsecured Foreign Currency- Denominated (net of debt issue costs)
Floating rate dollar loan - US$1,000 million due until 2022 (c) P7,219 P13,530
Floating rate dollar loan - US$800 million due until 2024 (g) 22,992 32,334
Floating rate yen loan - JP¥15 billion due until 2025 (h) 6,556 6,845
Floating rate dollar loan - US$150 million due until 2023 (j) 7,522 7,003
34, 35, 36 102,645 119,454 Less current portion 21,580 31,114
P81,065 P88,340
a. On October 13, 2015, the Parent Company drew P5,000 from a P5,000 term
loan which was signed and executed on October 7, 2015. The facility is amortized over 7 years with a 2-year grace period and is subject to a fixed rate of 5.4583% per annum. The net proceeds from the issuance were used to repay currently maturing obligations and for general corporate requirements. In 2021 and 2020, the Parent Company settled matured interim principal payments aggregating to P1,000 each year.
b. On October 27, 2016, the Parent Company issued P20,000 retail bonds
(the “Bonds”) divided into Series A (P13,000) and Series B (P7,000). Series A Bonds is due on October 27, 2021 with interest rate of 4.0032% per annum. Series B Bonds will mature on October 27, 2023 with interest rate of 4.5219% per annum. Interests on these Bonds are payable quarterly on January 27, April 27, July 27 and October 27 of each year. The proceeds from the issuance of the Bonds were used to partially settle the US$475 million and US$550 million Term Loan facilities, to repay short-term loans and for general corporate requirements. The Bonds were listed with the Philippine Dealing & Exchange Corp. on October 27, 2016. The Parent Company redeemed its P13,000 Series A retail bonds on October 27, 2021.
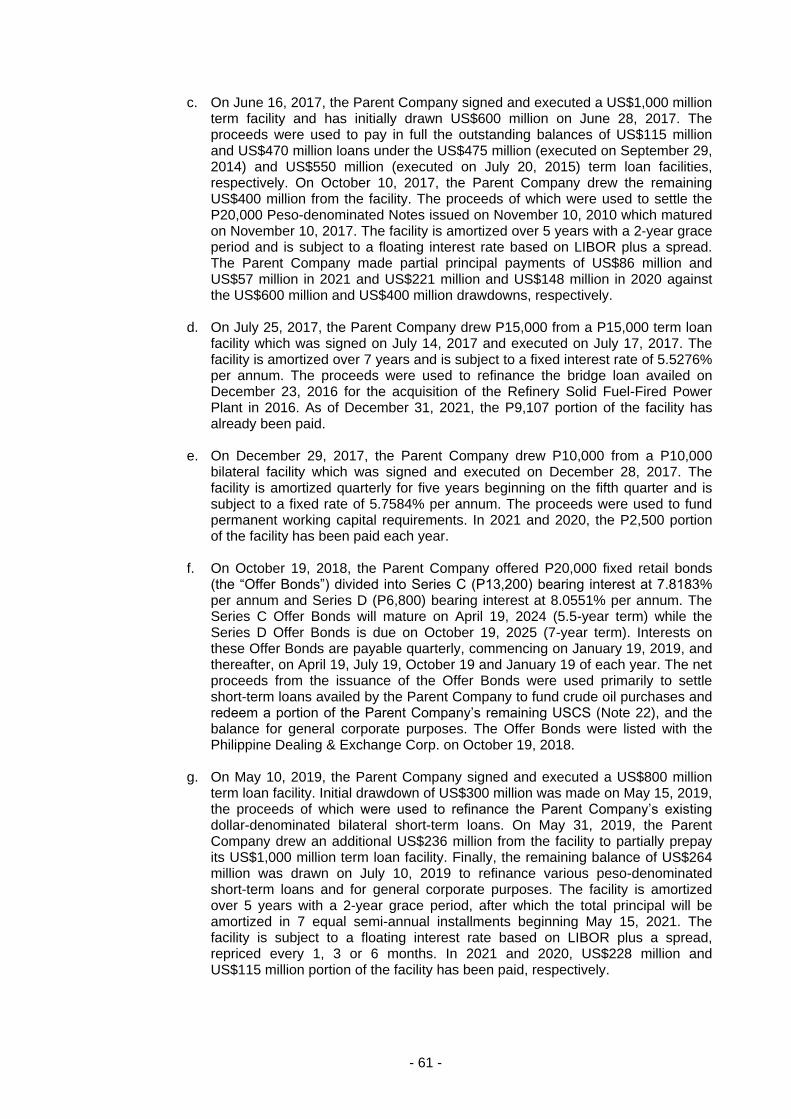
- 61 -
c. On June 16, 2017, the Parent Company signed and executed a US$1,000 million term facility and has initially drawn US$600 million on June 28, 2017. The proceeds were used to pay in full the outstanding balances of US$115 million and US$470 million loans under the US$475 million (executed on September 29, 2014) and US$550 million (executed on July 20, 2015) term loan facilities, respectively. On October 10, 2017, the Parent Company drew the remaining US$400 million from the facility. The proceeds of which were used to settle the P20,000 Peso-denominated Notes issued on November 10, 2010 which matured on November 10, 2017. The facility is amortized over 5 years with a 2-year grace period and is subject to a floating interest rate based on LIBOR plus a spread. The Parent Company made partial principal payments of US$86 million and US$57 million in 2021 and US$221 million and US$148 million in 2020 against the US$600 million and US$400 million drawdowns, respectively.
d. On July 25, 2017, the Parent Company drew P15,000 from a P15,000 term loan facility which was signed on July 14, 2017 and executed on July 17, 2017. The facility is amortized over 7 years and is subject to a fixed interest rate of 5.5276% per annum. The proceeds were used to refinance the bridge loan availed on December 23, 2016 for the acquisition of the Refinery Solid Fuel-Fired Power Plant in 2016. As of December 31, 2021, the P9,107 portion of the facility has already been paid.
e. On December 29, 2017, the Parent Company drew P10,000 from a P10,000
bilateral facility which was signed and executed on December 28, 2017. The facility is amortized quarterly for five years beginning on the fifth quarter and is subject to a fixed rate of 5.7584% per annum. The proceeds were used to fund permanent working capital requirements. In 2021 and 2020, the P2,500 portion of the facility has been paid each year.
f. On October 19, 2018, the Parent Company offered P20,000 fixed retail bonds
(the “Offer Bonds”) divided into Series C (P13,200) bearing interest at 7.8183% per annum and Series D (P6,800) bearing interest at 8.0551% per annum. The Series C Offer Bonds will mature on April 19, 2024 (5.5-year term) while the Series D Offer Bonds is due on October 19, 2025 (7-year term). Interests on these Offer Bonds are payable quarterly, commencing on January 19, 2019, and thereafter, on April 19, July 19, October 19 and January 19 of each year. The net proceeds from the issuance of the Offer Bonds were used primarily to settle short-term loans availed by the Parent Company to fund crude oil purchases and redeem a portion of the Parent Company’s remaining USCS (Note 22), and the balance for general corporate purposes. The Offer Bonds were listed with the Philippine Dealing & Exchange Corp. on October 19, 2018.
g. On May 10, 2019, the Parent Company signed and executed a US$800 million
term loan facility. Initial drawdown of US$300 million was made on May 15, 2019, the proceeds of which were used to refinance the Parent Company’s existing dollar-denominated bilateral short-term loans. On May 31, 2019, the Parent Company drew an additional US$236 million from the facility to partially prepay its US$1,000 million term loan facility. Finally, the remaining balance of US$264 million was drawn on July 10, 2019 to refinance various peso-denominated short-term loans and for general corporate purposes. The facility is amortized over 5 years with a 2-year grace period, after which the total principal will be amortized in 7 equal semi-annual installments beginning May 15, 2021. The facility is subject to a floating interest rate based on LIBOR plus a spread, repriced every 1, 3 or 6 months. In 2021 and 2020, US$228 million and US$115 million portion of the facility has been paid, respectively.
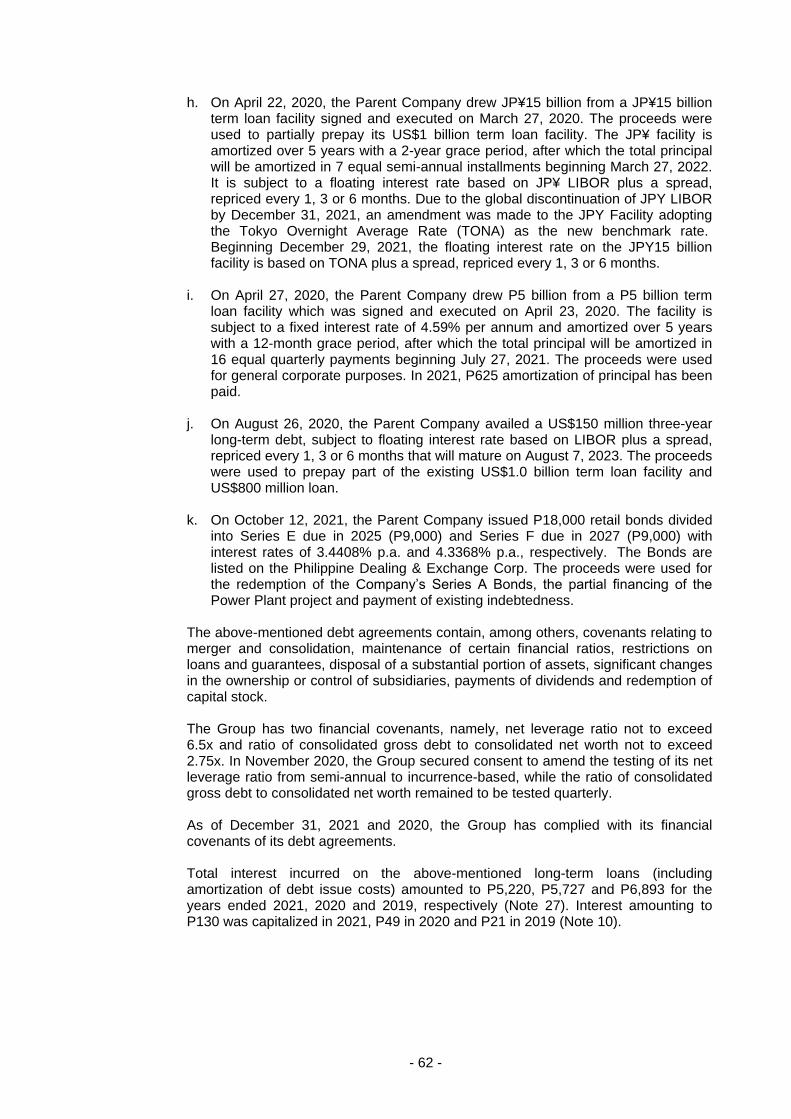
- 62 -
h. On April 22, 2020, the Parent Company drew JP¥15 billion from a JP¥15 billion term loan facility signed and executed on March 27, 2020. The proceeds were used to partially prepay its US$1 billion term loan facility. The JP¥ facility is amortized over 5 years with a 2-year grace period, after which the total principal will be amortized in 7 equal semi-annual installments beginning March 27, 2022. It is subject to a floating interest rate based on JP¥ LIBOR plus a spread, repriced every 1, 3 or 6 months. Due to the global discontinuation of JPY LIBOR by December 31, 2021, an amendment was made to the JPY Facility adopting the Tokyo Overnight Average Rate (TONA) as the new benchmark rate. Beginning December 29, 2021, the floating interest rate on the JPY15 billion facility is based on TONA plus a spread, repriced every 1, 3 or 6 months.
i. On April 27, 2020, the Parent Company drew P5 billion from a P5 billion term loan facility which was signed and executed on April 23, 2020. The facility is subject to a fixed interest rate of 4.59% per annum and amortized over 5 years with a 12-month grace period, after which the total principal will be amortized in 16 equal quarterly payments beginning July 27, 2021. The proceeds were used for general corporate purposes. In 2021, P625 amortization of principal has been paid.
j. On August 26, 2020, the Parent Company availed a US$150 million three-year
long-term debt, subject to floating interest rate based on LIBOR plus a spread, repriced every 1, 3 or 6 months that will mature on August 7, 2023. The proceeds were used to prepay part of the existing US$1.0 billion term loan facility and US$800 million loan.
k. On October 12, 2021, the Parent Company issued P18,000 retail bonds divided
into Series E due in 2025 (P9,000) and Series F due in 2027 (P9,000) with interest rates of 3.4408% p.a. and 4.3368% p.a., respectively. The Bonds are listed on the Philippine Dealing & Exchange Corp. The proceeds were used for the redemption of the Company’s Series A Bonds, the partial financing of the Power Plant project and payment of existing indebtedness.
The above-mentioned debt agreements contain, among others, covenants relating to merger and consolidation, maintenance of certain financial ratios, restrictions on loans and guarantees, disposal of a substantial portion of assets, significant changes in the ownership or control of subsidiaries, payments of dividends and redemption of capital stock. The Group has two financial covenants, namely, net leverage ratio not to exceed 6.5x and ratio of consolidated gross debt to consolidated net worth not to exceed 2.75x. In November 2020, the Group secured consent to amend the testing of its net leverage ratio from semi-annual to incurrence-based, while the ratio of consolidated gross debt to consolidated net worth remained to be tested quarterly. As of December 31, 2021 and 2020, the Group has complied with its financial covenants of its debt agreements. Total interest incurred on the above-mentioned long-term loans (including amortization of debt issue costs) amounted to P5,220, P5,727 and P6,893 for the years ended 2021, 2020 and 2019, respectively (Note 27). Interest amounting to P130 was capitalized in 2021, P49 in 2020 and P21 in 2019 (Note 10).
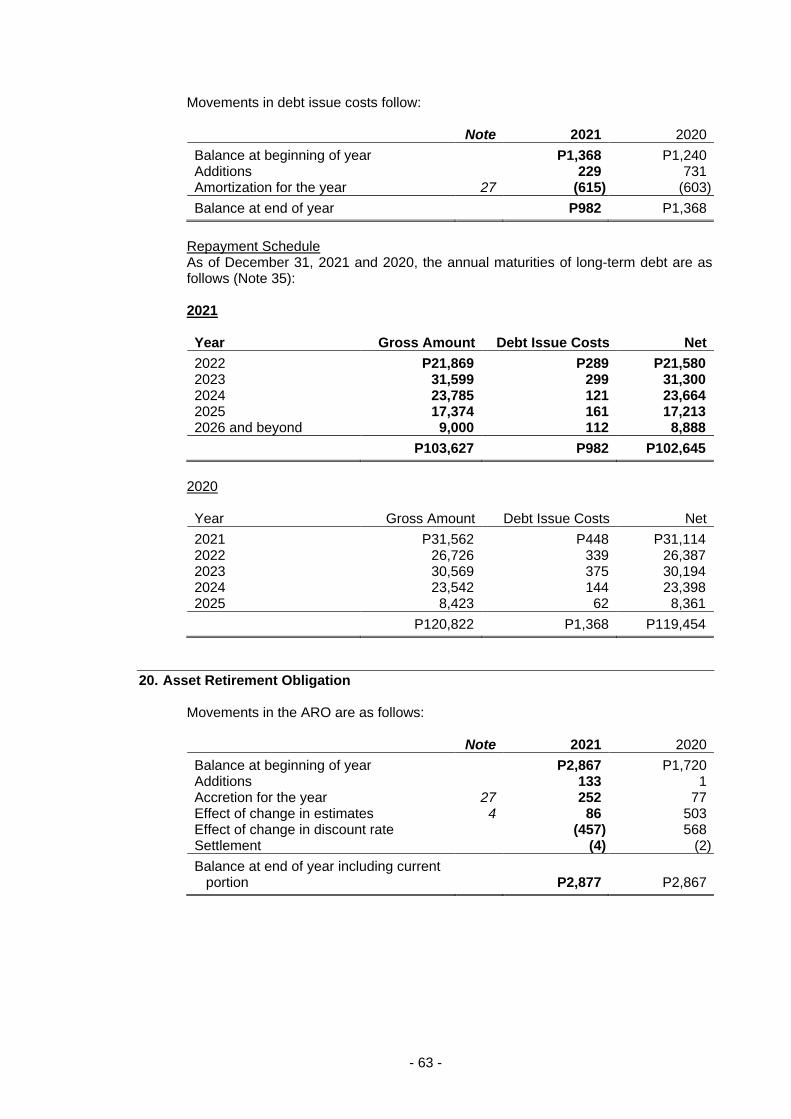
- 63 -
Movements in debt issue costs follow: Note 2021 2020
Balance at beginning of year P1,368 P1,240 Additions 229 731 Amortization for the year 27 (615) (603)
Balance at end of year P982 P1,368
Repayment Schedule As of December 31, 2021 and 2020, the annual maturities of long-term debt are as follows (Note 35): 2021 Year Gross Amount Debt Issue Costs Net
2022 P21,869 P289 P21,580 2023 31,599 299 31,300 2024 23,785 121 23,664 2025 17,374 161 17,213 2026 and beyond 9,000 112 8,888
P103,627 P982 P102,645
2020 Year Gross Amount Debt Issue Costs Net
2021 P31,562 P448 P31,114 2022 26,726 339 26,387 2023 30,569 375 30,194 2024 23,542 144 23,398 2025 8,423 62 8,361
P120,822 P1,368 P119,454
20. Asset Retirement Obligation Movements in the ARO are as follows: Note 2021 2020
Balance at beginning of year P2,867 P1,720 Additions 133 1 Accretion for the year 27 252 77 Effect of change in estimates 4 86 503 Effect of change in discount rate (457) 568 Settlement (4) (2)
Balance at end of year including current portion P2,877 P2,867
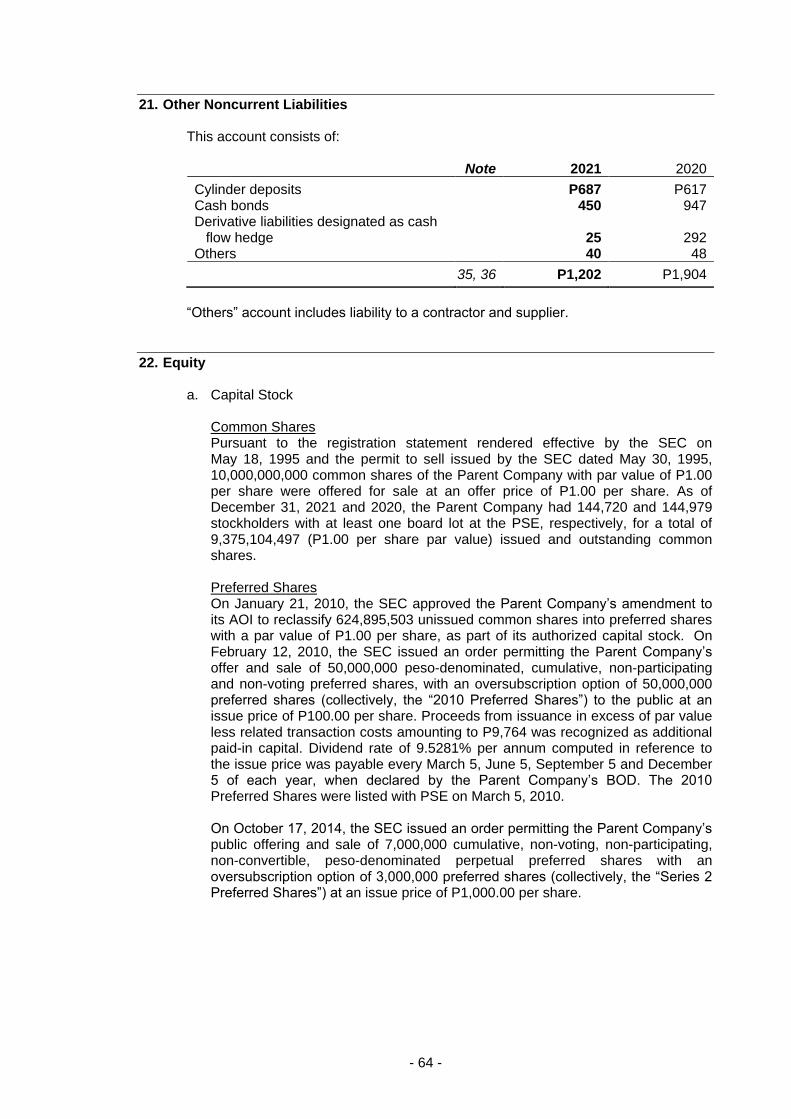
- 64 -
21. Other Noncurrent Liabilities This account consists of: Note 2021 2020
Cylinder deposits P687 P617 Cash bonds 450 947 Derivative liabilities designated as cash
flow hedge 25 292 Others 40 48
35, 36 P1,202 P1,904
“Others” account includes liability to a contractor and supplier.
22. Equity a. Capital Stock
Common Shares Pursuant to the registration statement rendered effective by the SEC on May 18, 1995 and the permit to sell issued by the SEC dated May 30, 1995, 10,000,000,000 common shares of the Parent Company with par value of P1.00 per share were offered for sale at an offer price of P1.00 per share. As of December 31, 2021 and 2020, the Parent Company had 144,720 and 144,979 stockholders with at least one board lot at the PSE, respectively, for a total of 9,375,104,497 (P1.00 per share par value) issued and outstanding common shares. Preferred Shares On January 21, 2010, the SEC approved the Parent Company’s amendment to its AOI to reclassify 624,895,503 unissued common shares into preferred shares with a par value of P1.00 per share, as part of its authorized capital stock. On February 12, 2010, the SEC issued an order permitting the Parent Company’s offer and sale of 50,000,000 peso-denominated, cumulative, non-participating and non-voting preferred shares, with an oversubscription option of 50,000,000 preferred shares (collectively, the “2010 Preferred Shares”) to the public at an issue price of P100.00 per share. Proceeds from issuance in excess of par value less related transaction costs amounting to P9,764 was recognized as additional paid-in capital. Dividend rate of 9.5281% per annum computed in reference to the issue price was payable every March 5, June 5, September 5 and December 5 of each year, when declared by the Parent Company’s BOD. The 2010 Preferred Shares were listed with PSE on March 5, 2010. On October 17, 2014, the SEC issued an order permitting the Parent Company’s public offering and sale of 7,000,000 cumulative, non-voting, non-participating, non-convertible, peso-denominated perpetual preferred shares with an oversubscription option of 3,000,000 preferred shares (collectively, the “Series 2 Preferred Shares”) at an issue price of P1,000.00 per share.
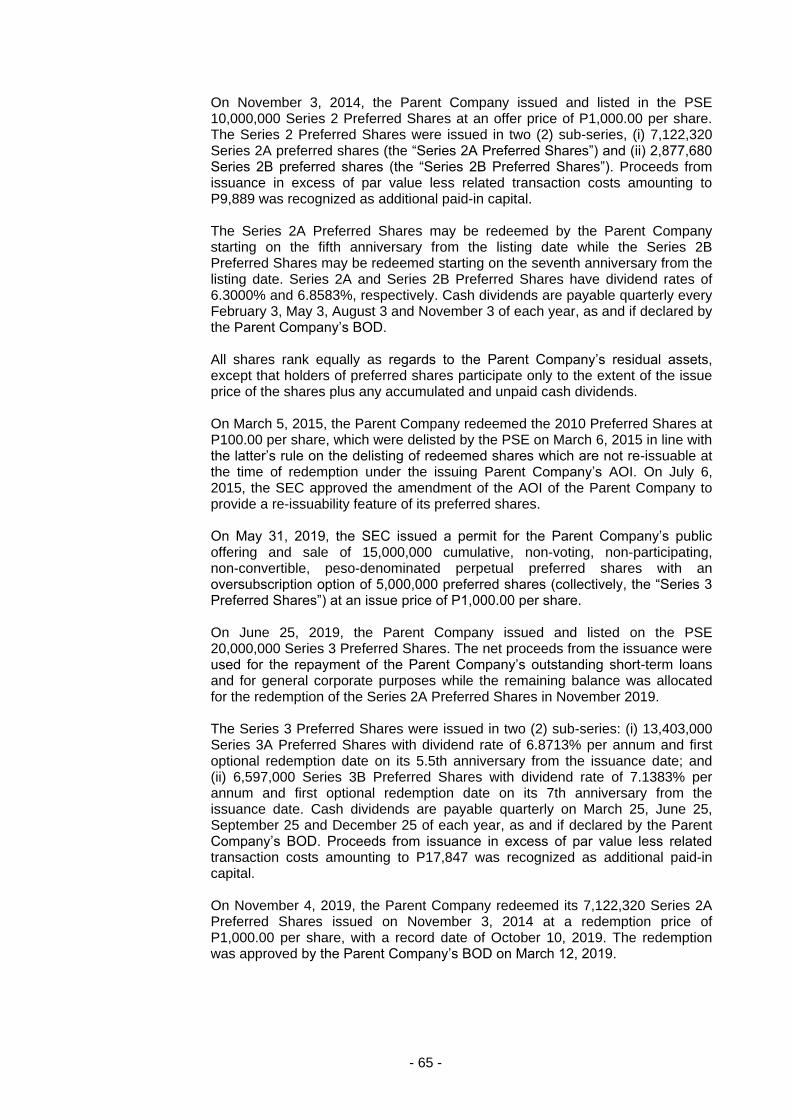
- 65 -
On November 3, 2014, the Parent Company issued and listed in the PSE 10,000,000 Series 2 Preferred Shares at an offer price of P1,000.00 per share. The Series 2 Preferred Shares were issued in two (2) sub-series, (i) 7,122,320 Series 2A preferred shares (the “Series 2A Preferred Shares”) and (ii) 2,877,680 Series 2B preferred shares (the “Series 2B Preferred Shares”). Proceeds from issuance in excess of par value less related transaction costs amounting to P9,889 was recognized as additional paid-in capital. The Series 2A Preferred Shares may be redeemed by the Parent Company starting on the fifth anniversary from the listing date while the Series 2B Preferred Shares may be redeemed starting on the seventh anniversary from the listing date. Series 2A and Series 2B Preferred Shares have dividend rates of 6.3000% and 6.8583%, respectively. Cash dividends are payable quarterly every February 3, May 3, August 3 and November 3 of each year, as and if declared by the Parent Company’s BOD. All shares rank equally as regards to the Parent Company’s residual assets, except that holders of preferred shares participate only to the extent of the issue price of the shares plus any accumulated and unpaid cash dividends. On March 5, 2015, the Parent Company redeemed the 2010 Preferred Shares at P100.00 per share, which were delisted by the PSE on March 6, 2015 in line with the latter’s rule on the delisting of redeemed shares which are not re-issuable at the time of redemption under the issuing Parent Company’s AOI. On July 6, 2015, the SEC approved the amendment of the AOI of the Parent Company to provide a re-issuability feature of its preferred shares. On May 31, 2019, the SEC issued a permit for the Parent Company’s public offering and sale of 15,000,000 cumulative, non-voting, non-participating, non-convertible, peso-denominated perpetual preferred shares with an oversubscription option of 5,000,000 preferred shares (collectively, the “Series 3 Preferred Shares”) at an issue price of P1,000.00 per share. On June 25, 2019, the Parent Company issued and listed on the PSE 20,000,000 Series 3 Preferred Shares. The net proceeds from the issuance were used for the repayment of the Parent Company’s outstanding short-term loans and for general corporate purposes while the remaining balance was allocated for the redemption of the Series 2A Preferred Shares in November 2019. The Series 3 Preferred Shares were issued in two (2) sub-series: (i) 13,403,000 Series 3A Preferred Shares with dividend rate of 6.8713% per annum and first optional redemption date on its 5.5th anniversary from the issuance date; and (ii) 6,597,000 Series 3B Preferred Shares with dividend rate of 7.1383% per annum and first optional redemption date on its 7th anniversary from the issuance date. Cash dividends are payable quarterly on March 25, June 25, September 25 and December 25 of each year, as and if declared by the Parent Company’s BOD. Proceeds from issuance in excess of par value less related transaction costs amounting to P17,847 was recognized as additional paid-in capital. On November 4, 2019, the Parent Company redeemed its 7,122,320 Series 2A Preferred Shares issued on November 3, 2014 at a redemption price of P1,000.00 per share, with a record date of October 10, 2019. The redemption was approved by the Parent Company’s BOD on March 12, 2019.
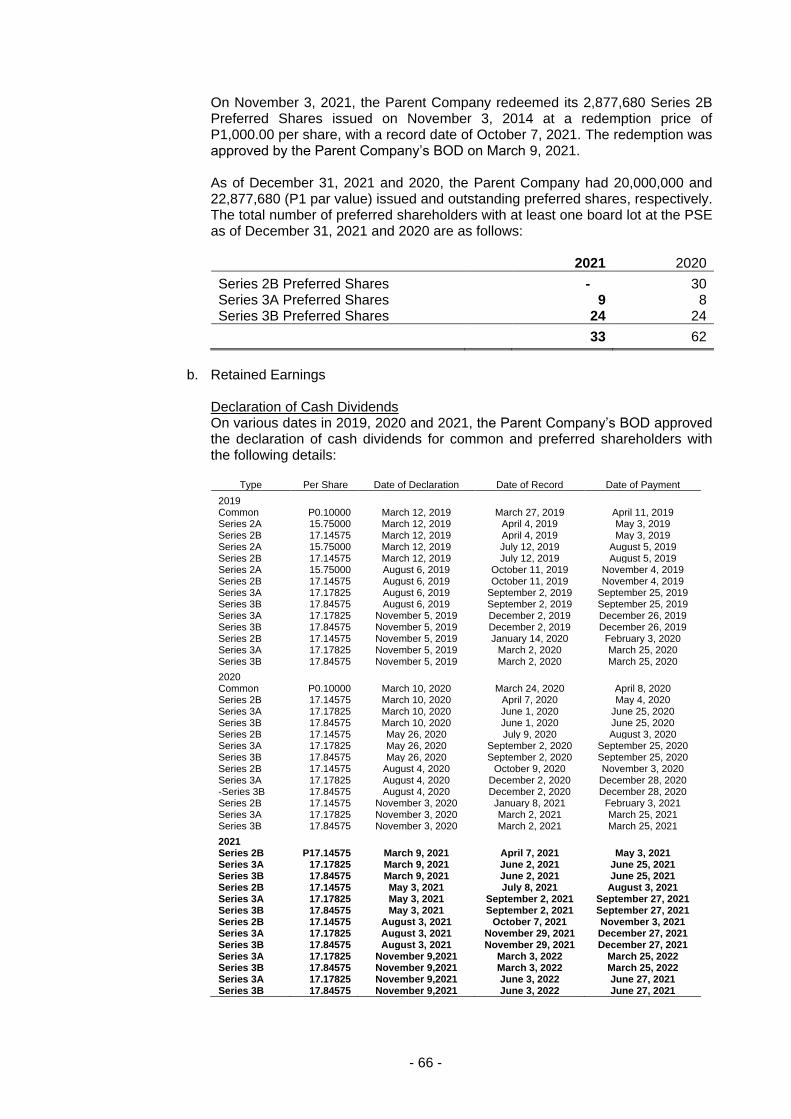
- 66 -
On November 3, 2021, the Parent Company redeemed its 2,877,680 Series 2B Preferred Shares issued on November 3, 2014 at a redemption price of P1,000.00 per share, with a record date of October 7, 2021. The redemption was approved by the Parent Company’s BOD on March 9, 2021. As of December 31, 2021 and 2020, the Parent Company had 20,000,000 and 22,877,680 (P1 par value) issued and outstanding preferred shares, respectively. The total number of preferred shareholders with at least one board lot at the PSE as of December 31, 2021 and 2020 are as follows: 2021 2020
Series 2B Preferred Shares - 30 Series 3A Preferred Shares 9 8 Series 3B Preferred Shares 24 24
33 62
b. Retained Earnings
Declaration of Cash Dividends On various dates in 2019, 2020 and 2021, the Parent Company’s BOD approved the declaration of cash dividends for common and preferred shareholders with the following details:
Type Per Share Date of Declaration Date of Record Date of Payment
2019 Common P0.10000 March 12, 2019 March 27, 2019 April 11, 2019 Series 2A 15.75000 March 12, 2019 April 4, 2019 May 3, 2019 Series 2B 17.14575 March 12, 2019 April 4, 2019 May 3, 2019 Series 2A 15.75000 March 12, 2019 July 12, 2019 August 5, 2019 Series 2B 17.14575 March 12, 2019 July 12, 2019 August 5, 2019 Series 2A 15.75000 August 6, 2019 October 11, 2019 November 4, 2019 Series 2B 17.14575 August 6, 2019 October 11, 2019 November 4, 2019 Series 3A 17.17825 August 6, 2019 September 2, 2019 September 25, 2019 Series 3B 17.84575 August 6, 2019 September 2, 2019 September 25, 2019 Series 3A 17.17825 November 5, 2019 December 2, 2019 December 26, 2019 Series 3B 17.84575 November 5, 2019 December 2, 2019 December 26, 2019 Series 2B 17.14575 November 5, 2019 January 14, 2020 February 3, 2020 Series 3A 17.17825 November 5, 2019 March 2, 2020 March 25, 2020 Series 3B 17.84575 November 5, 2019 March 2, 2020 March 25, 2020
2020 Common P0.10000 March 10, 2020 March 24, 2020 April 8, 2020 Series 2B 17.14575 March 10, 2020 April 7, 2020 May 4, 2020 Series 3A 17.17825 March 10, 2020 June 1, 2020 June 25, 2020 Series 3B 17.84575 March 10, 2020 June 1, 2020 June 25, 2020 Series 2B 17.14575 May 26, 2020 July 9, 2020 August 3, 2020 Series 3A 17.17825 May 26, 2020 September 2, 2020 September 25, 2020 Series 3B 17.84575 May 26, 2020 September 2, 2020 September 25, 2020 Series 2B 17.14575 August 4, 2020 October 9, 2020 November 3, 2020 Series 3A 17.17825 August 4, 2020 December 2, 2020 December 28, 2020 -Series 3B 17.84575 August 4, 2020 December 2, 2020 December 28, 2020 Series 2B 17.14575 November 3, 2020 January 8, 2021 February 3, 2021 Series 3A 17.17825 November 3, 2020 March 2, 2021 March 25, 2021 Series 3B 17.84575 November 3, 2020 March 2, 2021 March 25, 2021
2021 Series 2B P17.14575 March 9, 2021 April 7, 2021 May 3, 2021 Series 3A 17.17825 March 9, 2021 June 2, 2021 June 25, 2021 Series 3B 17.84575 March 9, 2021 June 2, 2021 June 25, 2021 Series 2B 17.14575 May 3, 2021 July 8, 2021 August 3, 2021 Series 3A 17.17825 May 3, 2021 September 2, 2021 September 27, 2021 Series 3B 17.84575 May 3, 2021 September 2, 2021 September 27, 2021 Series 2B 17.14575 August 3, 2021 October 7, 2021 November 3, 2021 Series 3A 17.17825 August 3, 2021 November 29, 2021 December 27, 2021 Series 3B 17.84575 August 3, 2021 November 29, 2021 December 27, 2021 Series 3A 17.17825 November 9,2021 March 3, 2022 March 25, 2022 Series 3B 17.84575 November 9,2021 March 3, 2022 March 25, 2022 Series 3A 17.17825 November 9,2021 June 3, 2022 June 27, 2021 Series 3B 17.84575 November 9,2021 June 3, 2022 June 27, 2021
- 67 -
Total cash dividends declared by the Parent Company amounted to P1,899 for 2021 and P2,515 both in 2020 and 2019. Appropriation for Capital Projects On May 5, 2016, the Parent Company’s BOD approved the reversal of P25,000 appropriation for the Parent Company’s RMP-2 and the re-appropriation of retained earnings amounting to P15,000 for capital projects in 2016 and 2017 which are expected to be completed within five years from the date of the approval. On August 23, 2016, LLCDC’s BOD approved the reversal of appropriation made in 2010 amounting to P5 (P3 - attributable to non-controlling interest) which was aimed to fund its construction management service. On September 29, 2015, NVRC’s BOD approved the appropriation of retained earnings of P200 (P120 - attributable to non-controlling interest) and on December 20, 2016, an additional appropriation of P200 (P120 - attributable to non-controlling interest) was approved, both for the programmed lot acquisitions which are expected to be completed in 2019. On October 16, 2019, the BOD of NVRC authorized and approved the reversal of P400 appropriation following a change in the property acquisition plans of NVRC. On March 9, 2021, the BOD of the Parent Company approved the reversal of P8,000 of the P15,000 appropriated retained earnings of the Parent Company since majority of the 2016 and 2017 capital projects were already completed while others were deferred. The remaining P7,000 is maintained for the Power Plant project which is expected to be completed by the second half of 2022. On October 7, 2021, the BOD of PEDC approved the appropriation of its retained earnings amounting to P3 for acquisition of three lots located in Bulacan which is expected to be completed by the second half of 2022. The appropriated retained earnings attributable to the equity holders of the Parent Company as of December 31, 2021 and 2020 amounted to P7,003 and P15,000, respectively.
c. The Group’s unappropriated retained earnings include its accumulated equity in
net earnings of subsidiaries, joint ventures and an associate amounting to P33,573, P26,345 and P28,791 as of December 31, 2021, 2020 and 2019, respectively. Such amounts are not available for declaration as dividends until declared by the respective investees.
d. Equity reserves comprise of the following:
Reserve for retirement plan pertains to the cumulative remeasurements of the Group’s defined benefit retirement plan.
- 68 -
Other reserves comprise the net loss on cash flows hedges, unrealized fair value losses on investments in debt instruments, exchange differences on translation of foreign operations, effect of redemption of USCS and others with details as follows: 2021 2020 2019
Balance at beginning of year (P13,223) (P12,195) (P11,091) Net loss on cash flow hedges,
net of tax (718) (393) (145) Changes in fair value of
investment in debt instruments 866 464 10 Cumulative translation
adjustment 696 (1,109) (969) Share in other comprehensive
loss of a joint venture - 10 -
Balance at end of year (P12,379) (P13,223) (P12,195)
e. SPCS
On January 19, 2018, the Parent Company issued US$500 million SPCS with an issue price of 100% for the partial repurchase and redemption of the Parent Company’s existing US$750 million USCS, the repayment of indebtedness and general corporate purposes including capital expenditures. The SPCS were listed with the Singapore Exchange Securities Trading Ltd. on January 22, 2018. Holders of the SPCS are conferred a right to receive distribution on a semi-annual basis from their issue date at the rate of 4.6% per annum, subject to a step-up rate. The Parent Company has a right to defer the distribution under certain conditions. The SPCS have no fixed redemption date and are redeemable in whole, but not in part, at their principal amounts together with any accrued, unpaid, or deferred distributions, at the Parent Company’s option on or after July 19, 2023 or on any distribution payment date thereafter or upon the occurrence of certain other events. Payments of distributions pertaining to US$500 million SPCS were made on the following dates: July 16, 2021 (P770), January 15, 2021 (P737), July 17, 2020 (P814), January 17, 2020 (P834), July 18, 2019 (P838), January 18, 2019 (P859) On April 19, 2021, Petron issued US$550 million Senior Perpetual Capital Securities (SPCS) at an issue price of 100%, with an initial distribution rate of 5.95% per annum. The securities were listed in the Singapore Exchange Securities Trading Limited on April 20, 2021. The net proceeds were used for the repayment of indebtedness and for general corporate purposes. Payments of distributions pertaining to US$550 million SPCS was made on October 18, 2021 amounting to P1,108. These SPCS were offered for sale and sold to qualified buyers and not more than 19 institutional lenders. Hence, the sale of SPCS was considered an exempt transaction for which no confirmation of exemption from the registration requirements of the SRC was required to be filed with the SEC.
- 69 -
g. RPS On November 27, 2019, the Parent Company issued US$6 million RPS to be used for capital expenditures requirements. Holders of the RPS are conferred a right to receive distributions on a quarterly basis, every February 27, May 27, August 27 and November 27. The Parent Company has a right to defer the distribution under certain conditions. Distributions to holders of the RPS were made on November 27, 2021 (P3), August 27, 2021 (P3), May 27, 2021 (P3), February 27, 2021 (P3), November 27, 2020 (P3), August 27, 2020 (P3), May 27, 2020 (P3) and February 27, 2020 (P3). On June 22, 2020, the Parent Company issued US$130 million RPS used for general corporate purposes. Holders of the RPS are conferred a right to receive distributions on a quarterly basis every March 22, June 22, September 22 and December 22. Payment of distributions pertaining to RPS were made on December 22, 2021 (P59), September 22, 2021 (P59), June 22, 2021 (P57), March 22, 2021 (P57), December 22, 2020 (P56) and September 22, 2020 (P57). On August 10, 2020, the Parent Company issued additional US$100 million RPS used for general corporate purposes. Holders of the RPS are conferred a right to receive distributions on a quarterly basis every February 10, May 10, August 10 and November 10. Holders of the RPS were paid on November 10, 2021 (P45), August 10, 2021 (P46), May 10, 2021 (P43), February 10, 2021 (P44) and November 10, 2020 (P43). The RPS have no fixed redemption date and are redeemable in whole, or in part, at their principal amounts together with any accrued, unpaid, or deferred distributions, at the Parent Company’s option on any distribution payment date after 90 days from Issuance Date.
23. Cost of Goods Sold This account consists of: Note 2021 2020 2019
Inventories 9 P390,379 P263,078 P463,028 Depreciation and amortization 26 5,099 4,802 8,430 Materials and supplies 3,431 2,969 4,099 Purchased services and
utilities 1,387 1,567 2,101 Personnel expenses 25 1,413 1,463 1,771 Others 30, 32 5,849 3,441 4,426
P407,558 P277,320 P483,855
Distribution or transshipment costs included as part of inventories amounted to P6,035, P8,290 and P11,380 in 2021, 2020 and 2019, respectively.
- 70 -
Others include manufacturing and overhead costs such as maintenance and repairs, taxes and licenses, insurance and rent.
24. Selling and Administrative Expenses This account consists of: Note 2021 2020 2019
Depreciation and amortization 26 P4,749 P4,688 P4,815 Purchased services and
utilities 3,524 3,988 4,597 Personnel expenses 25 3,219 3,103 3,318 Maintenance and repairs 1,429 1,177 1,342 Materials and office supplies 673 422 528 Advertising 318 421 696 Taxes and licenses 309 340 360 Rent 30 220 130 38 Impairment losses on trade
and other receivables 4, 8 28 67 35 Others 9 88 53 86
P14,557 P14,389 P15,815
Selling and administrative expenses include research and development costs amounting to P62, P66 and P76 in 2021, 2020 and 2019, respectively (Note 9).
25. Personnel Expenses This account consists of: Note 2021 2020 2019
Salaries, wages and other employee costs 29 P4,264 P4,194 P4,919
Retirement benefits costs - defined benefit plan 29, 31 289 289 70
Retirement benefits costs - defined contribution plan 29 79 83 100
P4,632 P4,566 P5,089
The above amounts are distributed as follows: Note 2021 2020 2019
Costs of goods sold 23 P1,413 P1,463 P1,771 Selling and administrative
expenses 24 3,219 3,103 3,318
P4,632 P4,566 P5,089
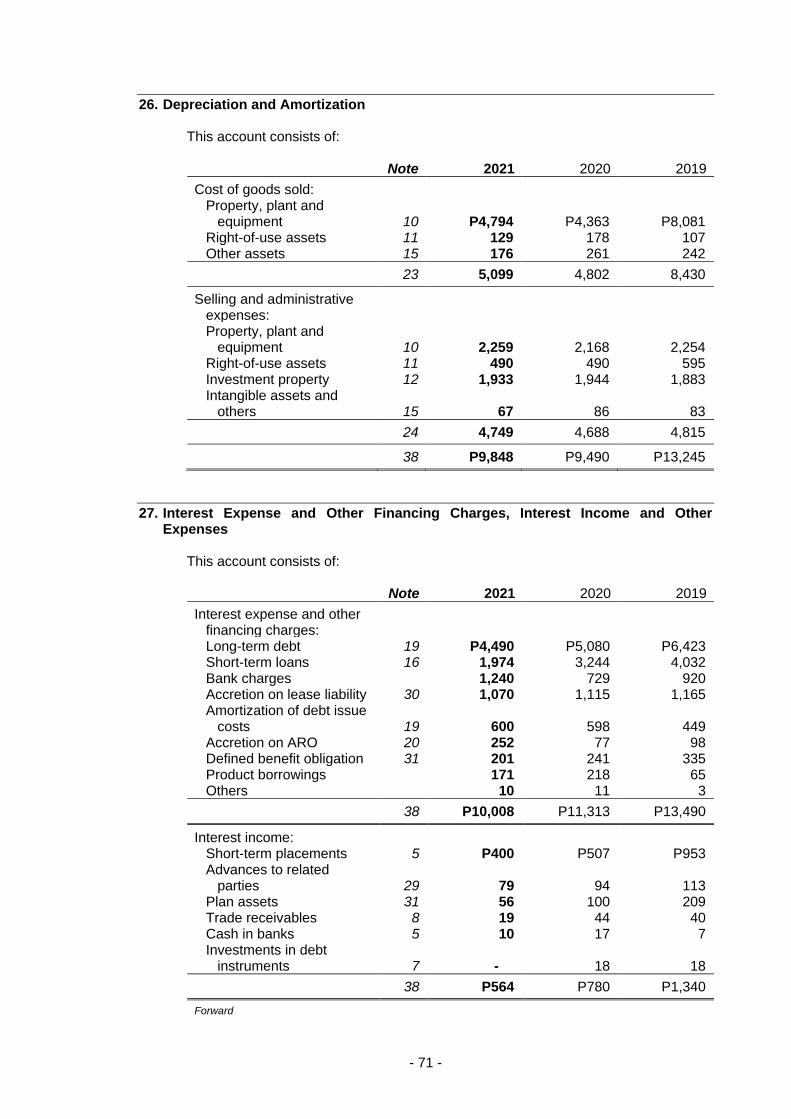
- 71 -
26. Depreciation and Amortization This account consists of: Note 2021 2020 2019
Cost of goods sold: Property, plant and
equipment 10 P4,794 P4,363 P8,081 Right-of-use assets 11 129 178 107 Other assets 15 176 261 242
23 5,099 4,802 8,430
Selling and administrative expenses: Property, plant and
equipment 10 2,259 2,168 2,254 Right-of-use assets 11 490 490 595 Investment property 12 1,933 1,944 1,883 Intangible assets and
others 15 67 86 83
24 4,749 4,688 4,815
38 P9,848 P9,490 P13,245
27. Interest Expense and Other Financing Charges, Interest Income and Other Expenses
This account consists of: Note 2021 2020 2019
Interest expense and other financing charges: Long-term debt 19 P4,490 P5,080 P6,423 Short-term loans 16 1,974 3,244 4,032 Bank charges 1,240 729 920 Accretion on lease liability 30 1,070 1,115 1,165 Amortization of debt issue
costs 19 600 598 449 Accretion on ARO 20 252 77 98 Defined benefit obligation 31 201 241 335 Product borrowings 171 218 65 Others 10 11 3
38 P10,008 P11,313 P13,490
Interest income: Short-term placements 5 P400 P507 P953 Advances to related
parties 29 79 94 113 Plan assets 31 56 100 209 Trade receivables 8 19 44 40 Cash in banks 5 10 17 7 Investments in debt
instruments 7 - 18 18
38 P564 P780 P1,340
Forward
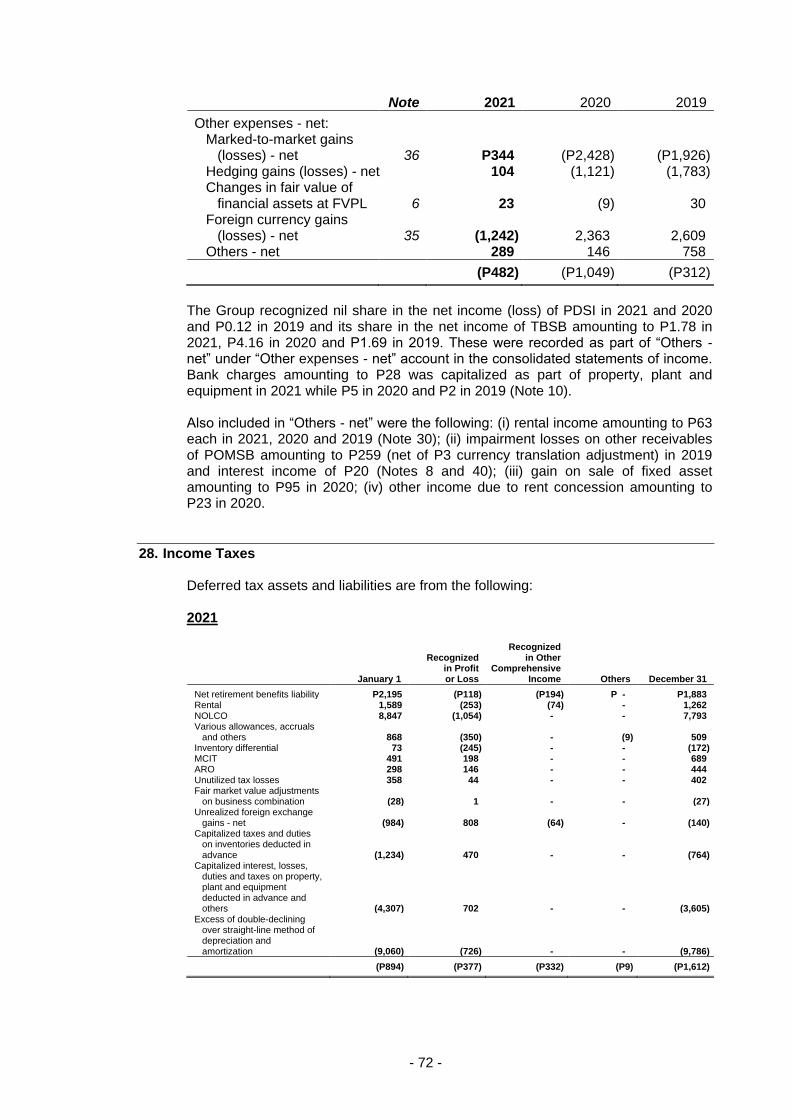
- 72 -
Note 2021 2020 2019
Other expenses - net: Marked-to-market gains
(losses) - net 36 P344 (P2,428) (P1,926) Hedging gains (losses) - net 104 (1,121) (1,783) Changes in fair value of
financial assets at FVPL 6 23 (9) 30 Foreign currency gains
(losses) - net 35 (1,242) 2,363 2,609 Others - net 289 146 758
(P482) (P1,049) (P312)
The Group recognized nil share in the net income (loss) of PDSI in 2021 and 2020 and P0.12 in 2019 and its share in the net income of TBSB amounting to P1.78 in 2021, P4.16 in 2020 and P1.69 in 2019. These were recorded as part of “Others - net” under “Other expenses - net” account in the consolidated statements of income. Bank charges amounting to P28 was capitalized as part of property, plant and equipment in 2021 while P5 in 2020 and P2 in 2019 (Note 10). Also included in “Others - net” were the following: (i) rental income amounting to P63 each in 2021, 2020 and 2019 (Note 30); (ii) impairment losses on other receivables of POMSB amounting to P259 (net of P3 currency translation adjustment) in 2019 and interest income of P20 (Notes 8 and 40); (iii) gain on sale of fixed asset amounting to P95 in 2020; (iv) other income due to rent concession amounting to P23 in 2020.
28. Income Taxes Deferred tax assets and liabilities are from the following: 2021
January 1
Recognized in Profit or Loss
Recognized in Other
Comprehensive Income Others December 31
Net retirement benefits liability P2,195 (P118) (P194) P - P1,883 Rental 1,589 (253) (74) - 1,262 NOLCO 8,847 (1,054) - - 7,793 Various allowances, accruals
and others 868 (350) - (9) 509 Inventory differential 73 (245) - - (172) MCIT 491 198 - - 689 ARO 298 146 - - 444 Unutilized tax losses 358 44 - - 402 Fair market value adjustments
on business combination (28) 1 - - (27) Unrealized foreign exchange
gains - net (984) 808 (64) - (140) Capitalized taxes and duties
on inventories deducted in advance (1,234) 470 - - (764)
Capitalized interest, losses, duties and taxes on property, plant and equipment deducted in advance and others (4,307) 702 - - (3,605)
Excess of double-declining over straight-line method of depreciation and amortization (9,060) (726) - - (9,786)
(P894) (P377) (P332) (P9) (P1,612)
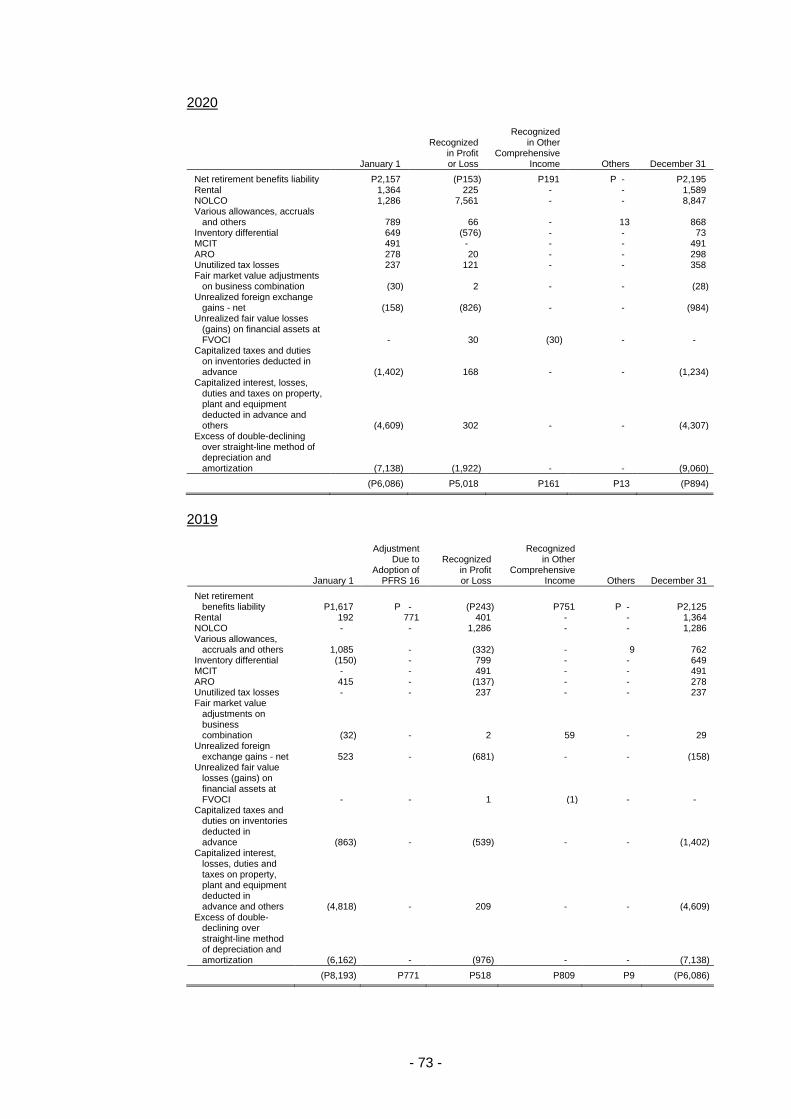
- 73 -
2020
January 1
Recognized in Profit or Loss
Recognized in Other
Comprehensive Income Others December 31
Net retirement benefits liability P2,157 (P153) P191 P - P2,195 Rental 1,364 225 - - 1,589 NOLCO 1,286 7,561 - - 8,847 Various allowances, accruals
and others 789 66 - 13 868 Inventory differential 649 (576) - - 73 MCIT 491 - - - 491 ARO 278 20 - - 298 Unutilized tax losses 237 121 - - 358 Fair market value adjustments
on business combination (30) 2 - - (28) Unrealized foreign exchange
gains - net (158) (826) - - (984) Unrealized fair value losses
(gains) on financial assets at FVOCI - 30 (30) - -
Capitalized taxes and duties on inventories deducted in advance (1,402) 168 - - (1,234)
Capitalized interest, losses, duties and taxes on property, plant and equipment deducted in advance and others (4,609) 302 - - (4,307)
Excess of double-declining over straight-line method of depreciation and amortization (7,138) (1,922) - - (9,060)
(P6,086) P5,018 P161 P13 (P894)
2019
January 1
Adjustment Due to
Adoption of PFRS 16
Recognized in Profit or Loss
Recognized in Other
Comprehensive Income Others December 31
Net retirement benefits liability P1,617 P - (P243) P751 P - P2,125
Rental 192 771 401 - - 1,364 NOLCO - - 1,286 - - 1,286 Various allowances,
accruals and others 1,085 - (332) - 9 762 Inventory differential (150) - 799 - - 649 MCIT - - 491 - - 491 ARO 415 - (137) - - 278 Unutilized tax losses - - 237 - - 237 Fair market value
adjustments on business combination (32) - 2 59 - 29
Unrealized foreign exchange gains - net 523 - (681) - - (158)
Unrealized fair value losses (gains) on financial assets at FVOCI - - 1 (1) - -
Capitalized taxes and duties on inventories deducted in advance (863) - (539) - - (1,402)
Capitalized interest, losses, duties and taxes on property, plant and equipment deducted in advance and others (4,818) - 209 - - (4,609)
Excess of double-declining over straight-line method of depreciation and amortization (6,162) - (976) - - (7,138)
(P8,193) P771 P518 P809 P9 (P6,086)
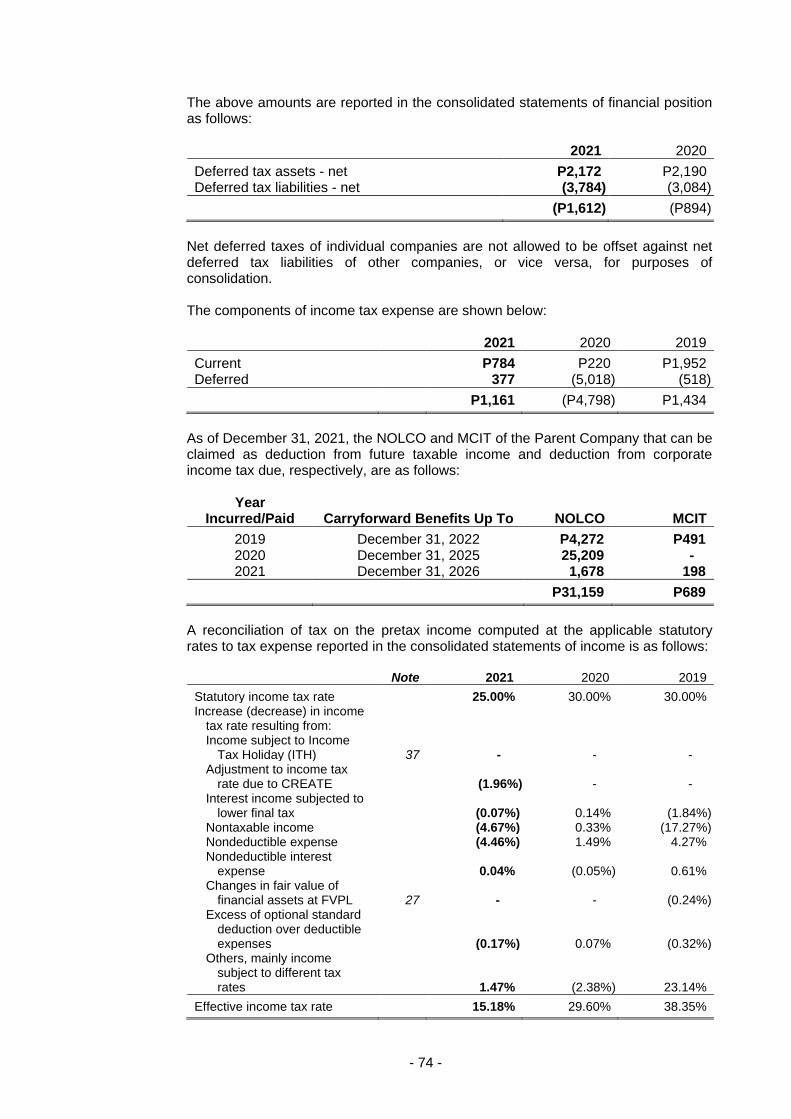
- 74 -
The above amounts are reported in the consolidated statements of financial position as follows: 2021 2020
Deferred tax assets - net P2,172 P2,190 Deferred tax liabilities - net (3,784) (3,084)
(P1,612) (P894)
Net deferred taxes of individual companies are not allowed to be offset against net deferred tax liabilities of other companies, or vice versa, for purposes of consolidation. The components of income tax expense are shown below: 2021 2020 2019
Current P784 P220 P1,952 Deferred 377 (5,018) (518)
P1,161 (P4,798) P1,434
As of December 31, 2021, the NOLCO and MCIT of the Parent Company that can be claimed as deduction from future taxable income and deduction from corporate income tax due, respectively, are as follows:
Year Incurred/Paid Carryforward Benefits Up To NOLCO MCIT
2019 December 31, 2022 P4,272 P491 2020 December 31, 2025 25,209 - 2021 December 31, 2026 1,678 198
P31,159 P689
A reconciliation of tax on the pretax income computed at the applicable statutory rates to tax expense reported in the consolidated statements of income is as follows:
Note 2021 2020 2019
Statutory income tax rate 25.00% 30.00% 30.00% Increase (decrease) in income
tax rate resulting from: Income subject to Income
Tax Holiday (ITH) 37 - - - Adjustment to income tax
rate due to CREATE (1.96%) - - Interest income subjected to
lower final tax (0.07%) 0.14% (1.84%) Nontaxable income (4.67%) 0.33% (17.27%) Nondeductible expense (4.46%) 1.49% 4.27% Nondeductible interest
expense 0.04% (0.05%) 0.61% Changes in fair value of
financial assets at FVPL 27 - - (0.24%) Excess of optional standard
deduction over deductible expenses (0.17%) 0.07% (0.32%)
Others, mainly income subject to different tax rates 1.47% (2.38%) 23.14%
Effective income tax rate 15.18% 29.60% 38.35%
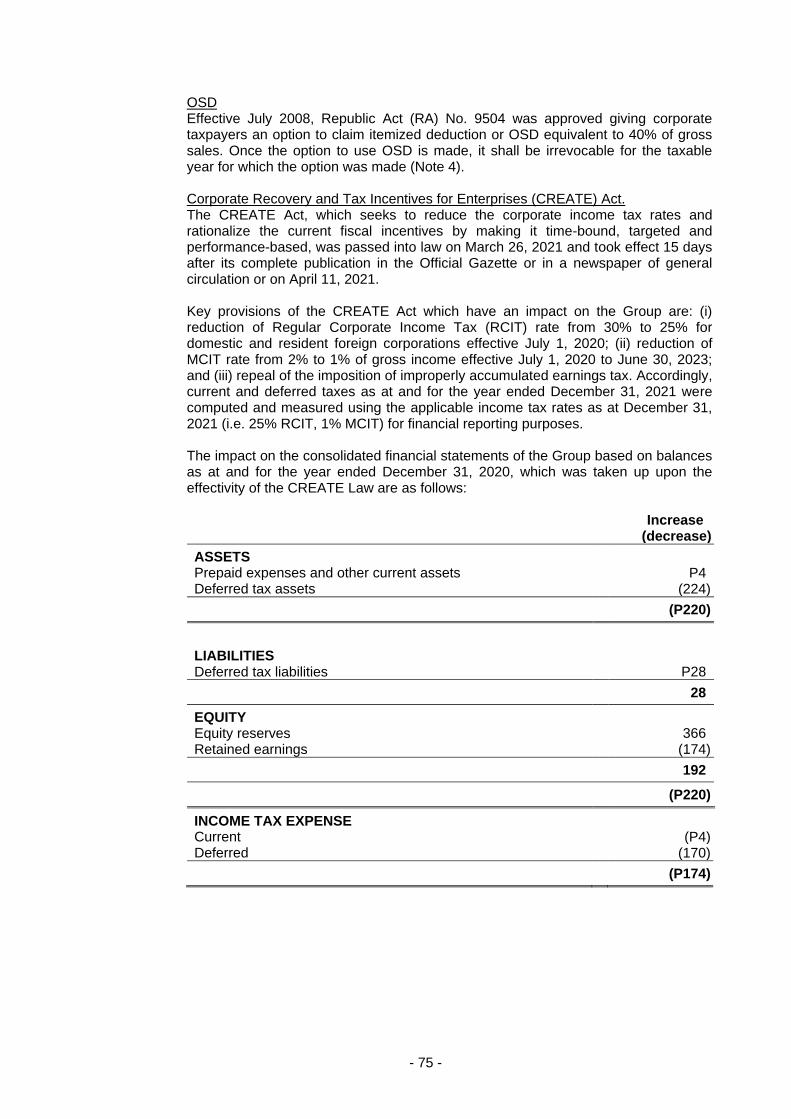
- 75 -
OSD Effective July 2008, Republic Act (RA) No. 9504 was approved giving corporate taxpayers an option to claim itemized deduction or OSD equivalent to 40% of gross sales. Once the option to use OSD is made, it shall be irrevocable for the taxable year for which the option was made (Note 4). Corporate Recovery and Tax Incentives for Enterprises (CREATE) Act. The CREATE Act, which seeks to reduce the corporate income tax rates and rationalize the current fiscal incentives by making it time-bound, targeted and performance-based, was passed into law on March 26, 2021 and took effect 15 days after its complete publication in the Official Gazette or in a newspaper of general circulation or on April 11, 2021. Key provisions of the CREATE Act which have an impact on the Group are: (i) reduction of Regular Corporate Income Tax (RCIT) rate from 30% to 25% for domestic and resident foreign corporations effective July 1, 2020; (ii) reduction of MCIT rate from 2% to 1% of gross income effective July 1, 2020 to June 30, 2023; and (iii) repeal of the imposition of improperly accumulated earnings tax. Accordingly, current and deferred taxes as at and for the year ended December 31, 2021 were computed and measured using the applicable income tax rates as at December 31, 2021 (i.e. 25% RCIT, 1% MCIT) for financial reporting purposes. The impact on the consolidated financial statements of the Group based on balances as at and for the year ended December 31, 2020, which was taken up upon the effectivity of the CREATE Law are as follows:
Increase (decrease)
ASSETS Prepaid expenses and other current assets P4 Deferred tax assets
(224)
(P220)
LIABILITIES Deferred tax liabilities P28
28
EQUITY Equity reserves 366 Retained earnings (174)
192
(P220)
INCOME TAX EXPENSE Current (P4) Deferred
(170)
(P174)
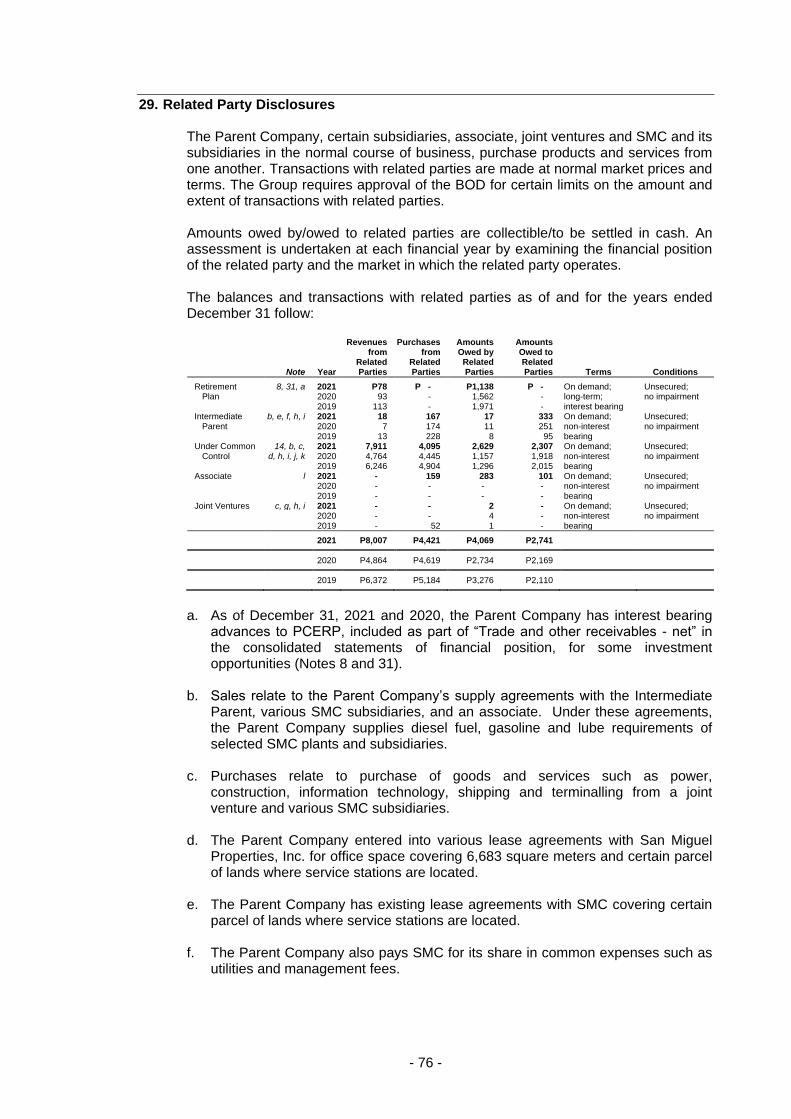
- 76 -
29. Related Party Disclosures The Parent Company, certain subsidiaries, associate, joint ventures and SMC and its subsidiaries in the normal course of business, purchase products and services from one another. Transactions with related parties are made at normal market prices and terms. The Group requires approval of the BOD for certain limits on the amount and extent of transactions with related parties. Amounts owed by/owed to related parties are collectible/to be settled in cash. An assessment is undertaken at each financial year by examining the financial position of the related party and the market in which the related party operates. The balances and transactions with related parties as of and for the years ended December 31 follow:
Note Year
Revenues from
Related Parties
Purchases from
Related Parties
Amounts Owed by Related Parties
Amounts Owed to Related Parties Terms Conditions
Retirement 8, 31, a 2021 P78 P - P1,138 P - On demand; Unsecured; Plan 2020 93 - 1,562 - long-term; no impairment 2019 113 - 1,971 - interest bearing
Intermediate b, e, f, h, i 2021 18 167 17 333 On demand; Unsecured; Parent 2020 7 174 11 251 non-interest no impairment
2019 13 228 8 95 bearing Under Common 14, b, c, 2021 7,911 4,095 2,629 2,307 On demand; Unsecured;
Control d, h, i, j, k 2020 4,764 4,445 1,157 1,918 non-interest no impairment 2019 6,246 4,904 1,296 2,015 bearing Associate l 2021 - 159 283 101 On demand; Unsecured; 2020 - - - - non-interest no impairment 2019 - - - - bearing Joint Ventures c, g, h, i 2021 - - 2 - On demand; Unsecured; 2020 - - 4 - non-interest no impairment 2019 - 52 1 - bearing
2021 P8,007 P4,421 P4,069 P2,741
2020 P4,864 P4,619 P2,734 P2,169
2019 P6,372 P5,184 P3,276 P2,110
a. As of December 31, 2021 and 2020, the Parent Company has interest bearing
advances to PCERP, included as part of “Trade and other receivables - net” in the consolidated statements of financial position, for some investment opportunities (Notes 8 and 31).
b. Sales relate to the Parent Company’s supply agreements with the Intermediate
Parent, various SMC subsidiaries, and an associate. Under these agreements, the Parent Company supplies diesel fuel, gasoline and lube requirements of selected SMC plants and subsidiaries.
c. Purchases relate to purchase of goods and services such as power,
construction, information technology, shipping and terminalling from a joint venture and various SMC subsidiaries.
d. The Parent Company entered into various lease agreements with San Miguel
Properties, Inc. for office space covering 6,683 square meters and certain parcel of lands where service stations are located.
e. The Parent Company has existing lease agreements with SMC covering certain
parcel of lands where service stations are located. f. The Parent Company also pays SMC for its share in common expenses such as
utilities and management fees.
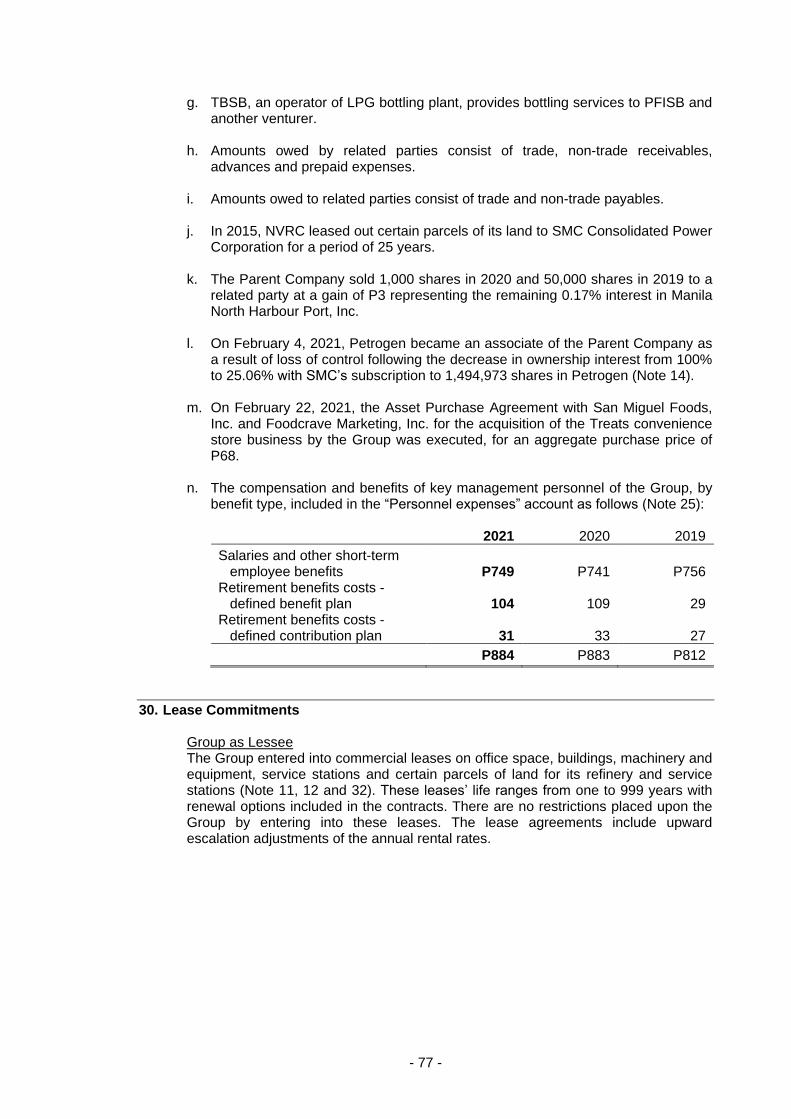
- 77 -
g. TBSB, an operator of LPG bottling plant, provides bottling services to PFISB and another venturer.
h. Amounts owed by related parties consist of trade, non-trade receivables,
advances and prepaid expenses. i. Amounts owed to related parties consist of trade and non-trade payables. j. In 2015, NVRC leased out certain parcels of its land to SMC Consolidated Power
Corporation for a period of 25 years. k. The Parent Company sold 1,000 shares in 2020 and 50,000 shares in 2019 to a
related party at a gain of P3 representing the remaining 0.17% interest in Manila North Harbour Port, Inc.
l. On February 4, 2021, Petrogen became an associate of the Parent Company as
a result of loss of control following the decrease in ownership interest from 100% to 25.06% with SMC’s subscription to 1,494,973 shares in Petrogen (Note 14).
m. On February 22, 2021, the Asset Purchase Agreement with San Miguel Foods,
Inc. and Foodcrave Marketing, Inc. for the acquisition of the Treats convenience store business by the Group was executed, for an aggregate purchase price of P68.
n. The compensation and benefits of key management personnel of the Group, by
benefit type, included in the “Personnel expenses” account as follows (Note 25): 2021 2020 2019
Salaries and other short-term employee benefits P749 P741 P756
Retirement benefits costs - defined benefit plan 104 109 29
Retirement benefits costs - defined contribution plan 31 33 27
P884 P883 P812
30. Lease Commitments Group as Lessee The Group entered into commercial leases on office space, buildings, machinery and equipment, service stations and certain parcels of land for its refinery and service stations (Note 11, 12 and 32). These leases’ life ranges from one to 999 years with renewal options included in the contracts. There are no restrictions placed upon the Group by entering into these leases. The lease agreements include upward escalation adjustments of the annual rental rates.
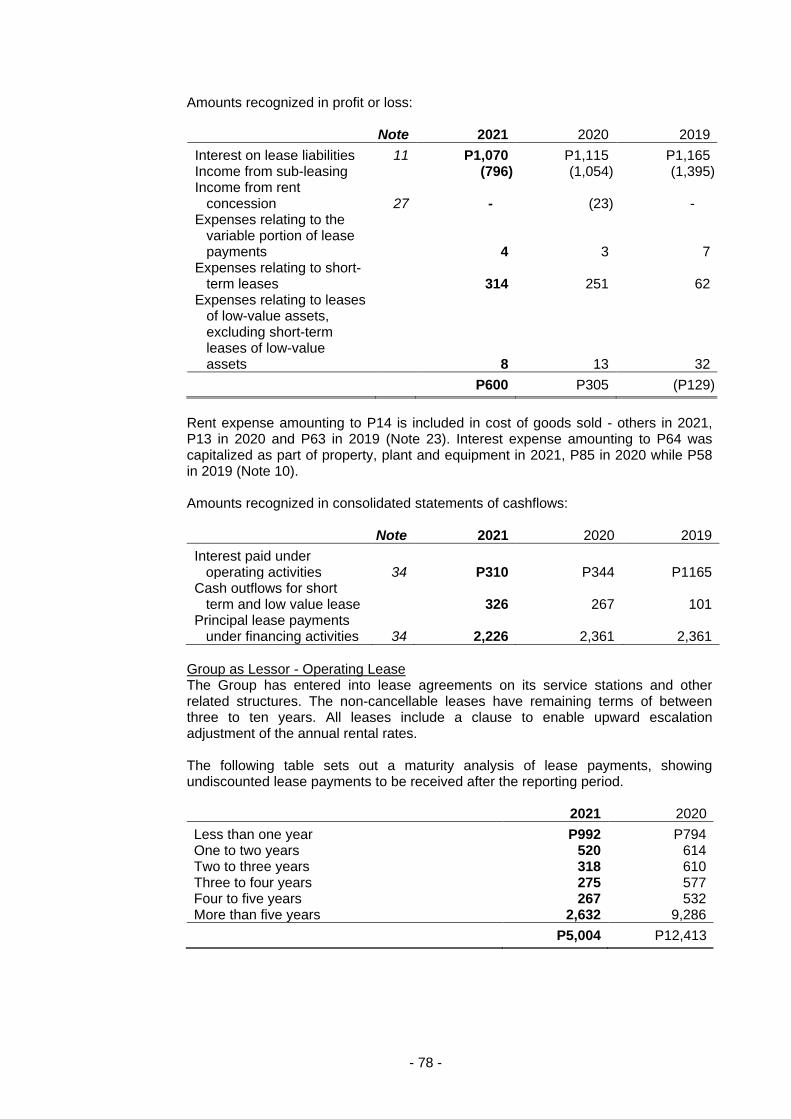
- 78 -
Amounts recognized in profit or loss: Note 2021 2020 2019
Interest on lease liabilities 11 P1,070 P1,115 P1,165 Income from sub-leasing (796) (1,054) (1,395) Income from rent
concession 27 - (23) - Expenses relating to the
variable portion of lease payments 4 3 7
Expenses relating to short-term leases 314 251 62
Expenses relating to leases of low-value assets, excluding short-term leases of low-value assets 8 13 32
P600 P305 (P129)
Rent expense amounting to P14 is included in cost of goods sold - others in 2021, P13 in 2020 and P63 in 2019 (Note 23). Interest expense amounting to P64 was capitalized as part of property, plant and equipment in 2021, P85 in 2020 while P58 in 2019 (Note 10). Amounts recognized in consolidated statements of cashflows: Note 2021 2020 2019
Interest paid under operating activities 34 P310 P344 P1165
Cash outflows for short term and low value lease 326 267 101
Principal lease payments under financing activities 34 2,226 2,361 2,361
Group as Lessor - Operating Lease The Group has entered into lease agreements on its service stations and other related structures. The non-cancellable leases have remaining terms of between three to ten years. All leases include a clause to enable upward escalation adjustment of the annual rental rates. The following table sets out a maturity analysis of lease payments, showing undiscounted lease payments to be received after the reporting period.
2021 2020
Less than one year P992 P794 One to two years 520 614 Two to three years 318 610 Three to four years 275 577 Four to five years 267 532 More than five years 2,632 9,286
P5,004 P12,413
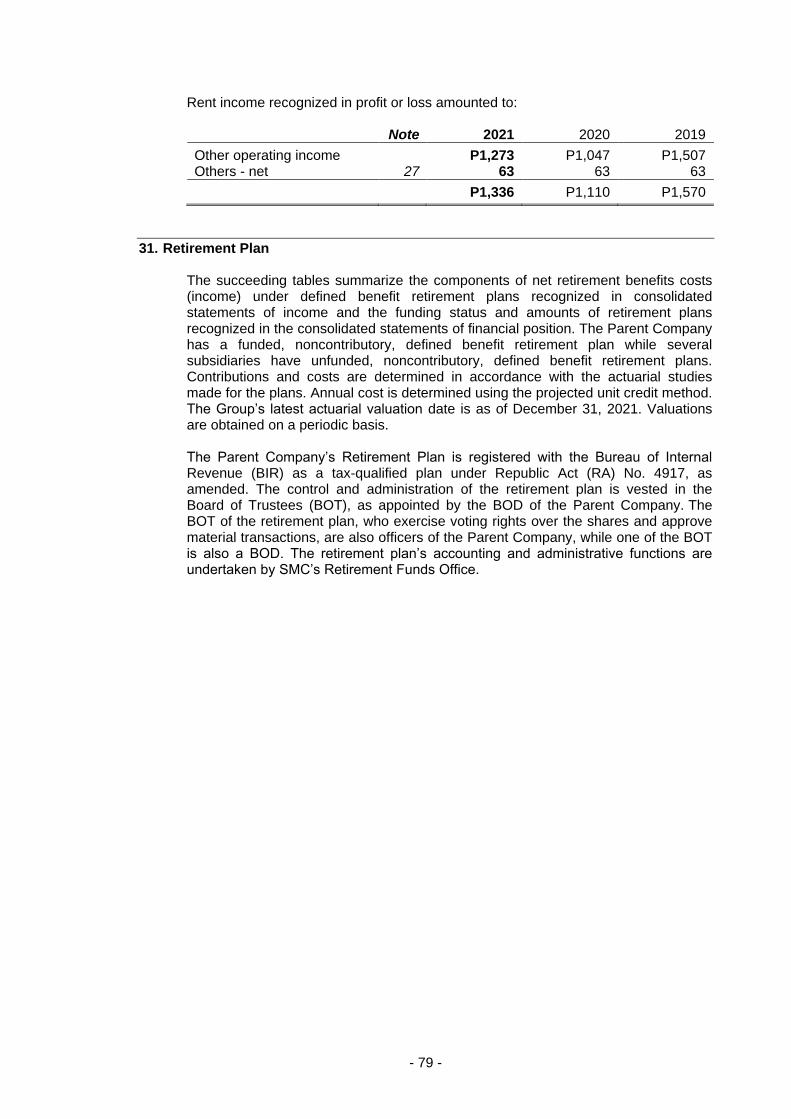
- 79 -
Rent income recognized in profit or loss amounted to: Note 2021 2020 2019
Other operating income P1,273 P1,047 P1,507 Others - net 27 63 63 63
P1,336 P1,110 P1,570
31. Retirement Plan The succeeding tables summarize the components of net retirement benefits costs (income) under defined benefit retirement plans recognized in consolidated statements of income and the funding status and amounts of retirement plans recognized in the consolidated statements of financial position. The Parent Company has a funded, noncontributory, defined benefit retirement plan while several subsidiaries have unfunded, noncontributory, defined benefit retirement plans. Contributions and costs are determined in accordance with the actuarial studies made for the plans. Annual cost is determined using the projected unit credit method. The Group’s latest actuarial valuation date is as of December 31, 2021. Valuations are obtained on a periodic basis. The Parent Company’s Retirement Plan is registered with the Bureau of Internal Revenue (BIR) as a tax-qualified plan under Republic Act (RA) No. 4917, as amended. The control and administration of the retirement plan is vested in the Board of Trustees (BOT), as appointed by the BOD of the Parent Company. The BOT of the retirement plan, who exercise voting rights over the shares and approve material transactions, are also officers of the Parent Company, while one of the BOT is also a BOD. The retirement plan’s accounting and administrative functions are undertaken by SMC’s Retirement Funds Office.
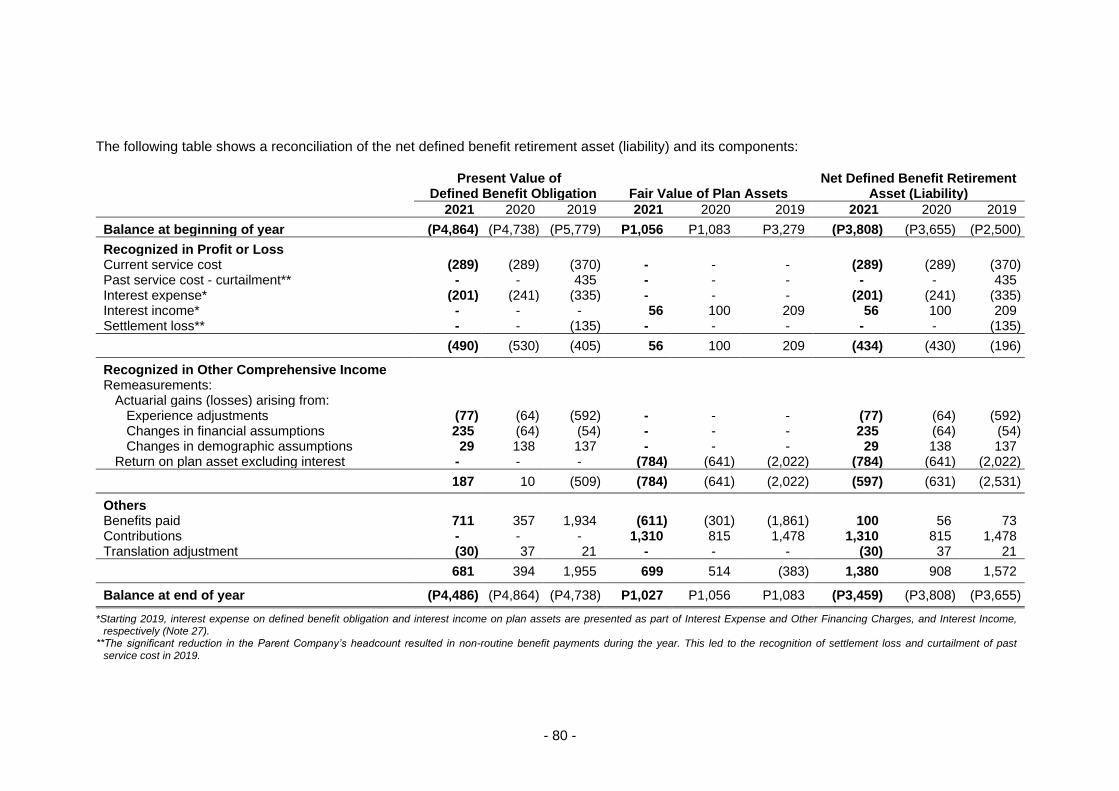
- 80 -
The following table shows a reconciliation of the net defined benefit retirement asset (liability) and its components:
Present Value of
Defined Benefit Obligation Fair Value of Plan Assets Net Defined Benefit Retirement
Asset (Liability)
2021 2020 2019 2021 2020 2019 2021 2020 2019
Balance at beginning of year (P4,864) (P4,738) (P5,779) P1,056 P1,083 P3,279 (P3,808) (P3,655) (P2,500)
Recognized in Profit or Loss Current service cost (289) (289) (370) - - - (289) (289) (370) Past service cost - curtailment** - - 435 - - - - - 435 Interest expense* (201) (241) (335) - - - (201) (241) (335) Interest income* - - - 56 100 209 56 100 209 Settlement loss** - - (135) - - - - - (135)
(490) (530) (405) 56 100 209 (434) (430) (196)
Recognized in Other Comprehensive Income Remeasurements:
Actuarial gains (losses) arising from: Experience adjustments (77) (64) (592) - - - (77) (64) (592) Changes in financial assumptions 235 (64) (54) - - - 235 (64) (54) Changes in demographic assumptions 29 138 137 - - - 29 138 137
Return on plan asset excluding interest - - - (784) (641) (2,022) (784) (641) (2,022)
187 10 (509) (784) (641) (2,022) (597) (631) (2,531)
Others Benefits paid 711 357 1,934 (611) (301) (1,861) 100 56 73 Contributions - - - 1,310 815 1,478 1,310 815 1,478 Translation adjustment (30) 37 21 - - - (30) 37 21
681 394 1,955 699 514 (383) 1,380 908 1,572
Balance at end of year (P4,486) (P4,864) (P4,738) P1,027 P1,056 P1,083 (P3,459) (P3,808) (P3,655)
*Starting 2019, interest expense on defined benefit obligation and interest income on plan assets are presented as part of Interest Expense and Other Financing Charges, and Interest Income, respectively (Note 27).
**The significant reduction in the Parent Company’s headcount resulted in non-routine benefit payments during the year. This led to the recognition of settlement loss and curtailment of past service cost in 2019.
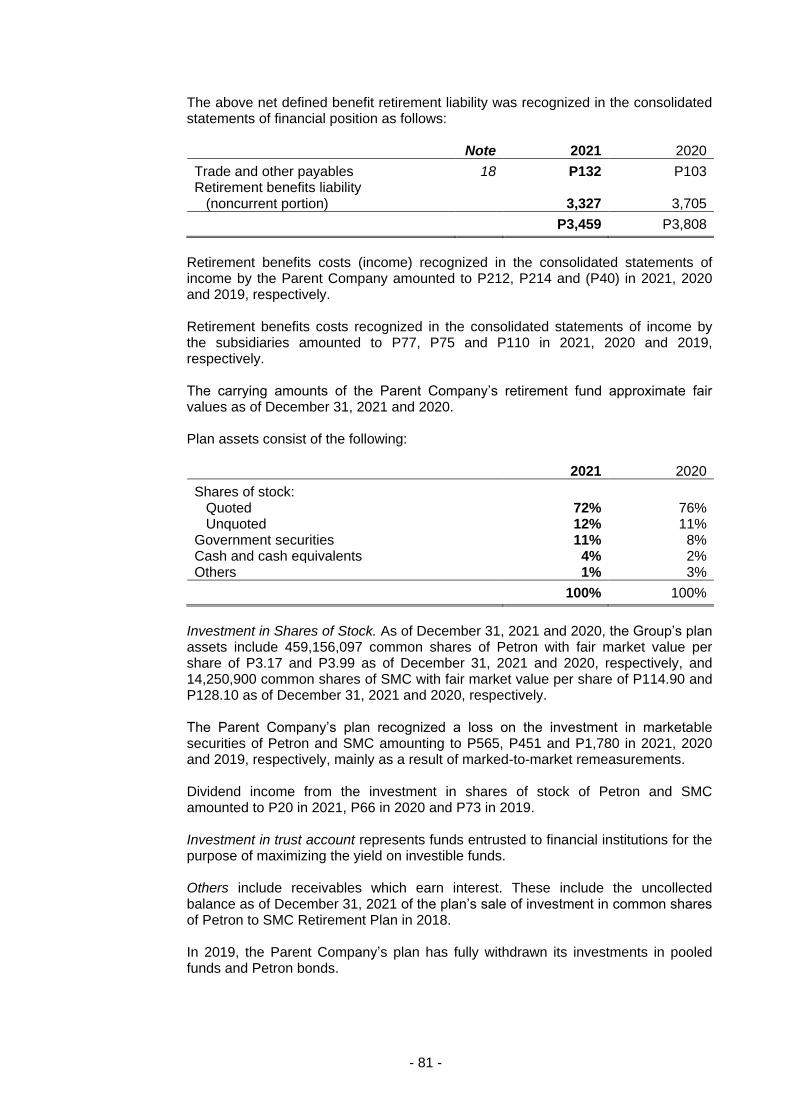
- 81 -
The above net defined benefit retirement liability was recognized in the consolidated statements of financial position as follows: Note 2021 2020
Trade and other payables 18 P132 P103 Retirement benefits liability
(noncurrent portion) 3,327 3,705
P3,459 P3,808
Retirement benefits costs (income) recognized in the consolidated statements of income by the Parent Company amounted to P212, P214 and (P40) in 2021, 2020 and 2019, respectively. Retirement benefits costs recognized in the consolidated statements of income by the subsidiaries amounted to P77, P75 and P110 in 2021, 2020 and 2019, respectively. The carrying amounts of the Parent Company’s retirement fund approximate fair values as of December 31, 2021 and 2020. Plan assets consist of the following: 2021 2020
Shares of stock: Quoted 72% 76% Unquoted 12% 11%
Government securities 11% 8% Cash and cash equivalents 4% 2% Others 1% 3%
100% 100%
Investment in Shares of Stock. As of December 31, 2021 and 2020, the Group’s plan assets include 459,156,097 common shares of Petron with fair market value per share of P3.17 and P3.99 as of December 31, 2021 and 2020, respectively, and 14,250,900 common shares of SMC with fair market value per share of P114.90 and P128.10 as of December 31, 2021 and 2020, respectively. The Parent Company’s plan recognized a loss on the investment in marketable securities of Petron and SMC amounting to P565, P451 and P1,780 in 2021, 2020 and 2019, respectively, mainly as a result of marked-to-market remeasurements. Dividend income from the investment in shares of stock of Petron and SMC amounted to P20 in 2021, P66 in 2020 and P73 in 2019. Investment in trust account represents funds entrusted to financial institutions for the purpose of maximizing the yield on investible funds. Others include receivables which earn interest. These include the uncollected balance as of December 31, 2021 of the plan’s sale of investment in common shares of Petron to SMC Retirement Plan in 2018. In 2019, the Parent Company’s plan has fully withdrawn its investments in pooled funds and Petron bonds.
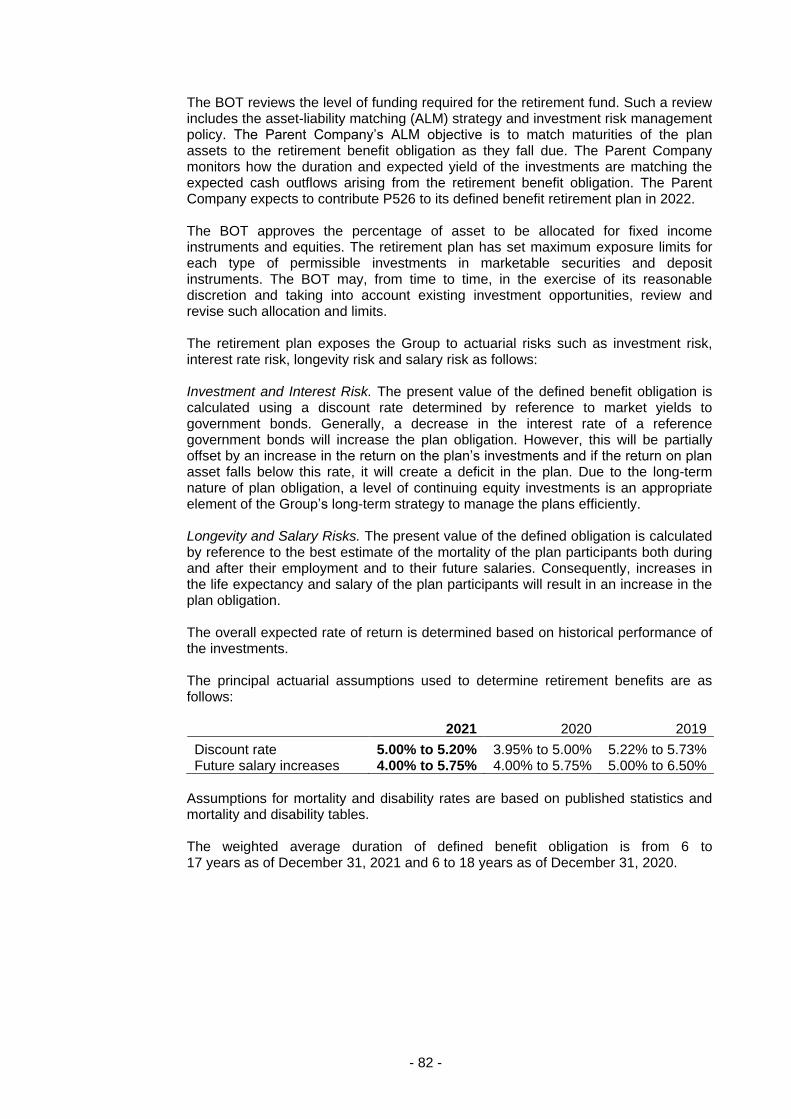
- 82 -
The BOT reviews the level of funding required for the retirement fund. Such a review includes the asset-liability matching (ALM) strategy and investment risk management policy. The Parent Company’s ALM objective is to match maturities of the plan assets to the retirement benefit obligation as they fall due. The Parent Company monitors how the duration and expected yield of the investments are matching the expected cash outflows arising from the retirement benefit obligation. The Parent Company expects to contribute P526 to its defined benefit retirement plan in 2022. The BOT approves the percentage of asset to be allocated for fixed income instruments and equities. The retirement plan has set maximum exposure limits for each type of permissible investments in marketable securities and deposit instruments. The BOT may, from time to time, in the exercise of its reasonable discretion and taking into account existing investment opportunities, review and revise such allocation and limits. The retirement plan exposes the Group to actuarial risks such as investment risk, interest rate risk, longevity risk and salary risk as follows: Investment and Interest Risk. The present value of the defined benefit obligation is calculated using a discount rate determined by reference to market yields to government bonds. Generally, a decrease in the interest rate of a reference government bonds will increase the plan obligation. However, this will be partially offset by an increase in the return on the plan’s investments and if the return on plan asset falls below this rate, it will create a deficit in the plan. Due to the long-term nature of plan obligation, a level of continuing equity investments is an appropriate element of the Group’s long-term strategy to manage the plans efficiently. Longevity and Salary Risks. The present value of the defined obligation is calculated by reference to the best estimate of the mortality of the plan participants both during and after their employment and to their future salaries. Consequently, increases in the life expectancy and salary of the plan participants will result in an increase in the plan obligation. The overall expected rate of return is determined based on historical performance of the investments. The principal actuarial assumptions used to determine retirement benefits are as follows: 2021 2020 2019
Discount rate 5.00% to 5.20% 3.95% to 5.00% 5.22% to 5.73% Future salary increases 4.00% to 5.75% 4.00% to 5.75% 5.00% to 6.50%
Assumptions for mortality and disability rates are based on published statistics and mortality and disability tables. The weighted average duration of defined benefit obligation is from 6 to 17 years as of December 31, 2021 and 6 to 18 years as of December 31, 2020.
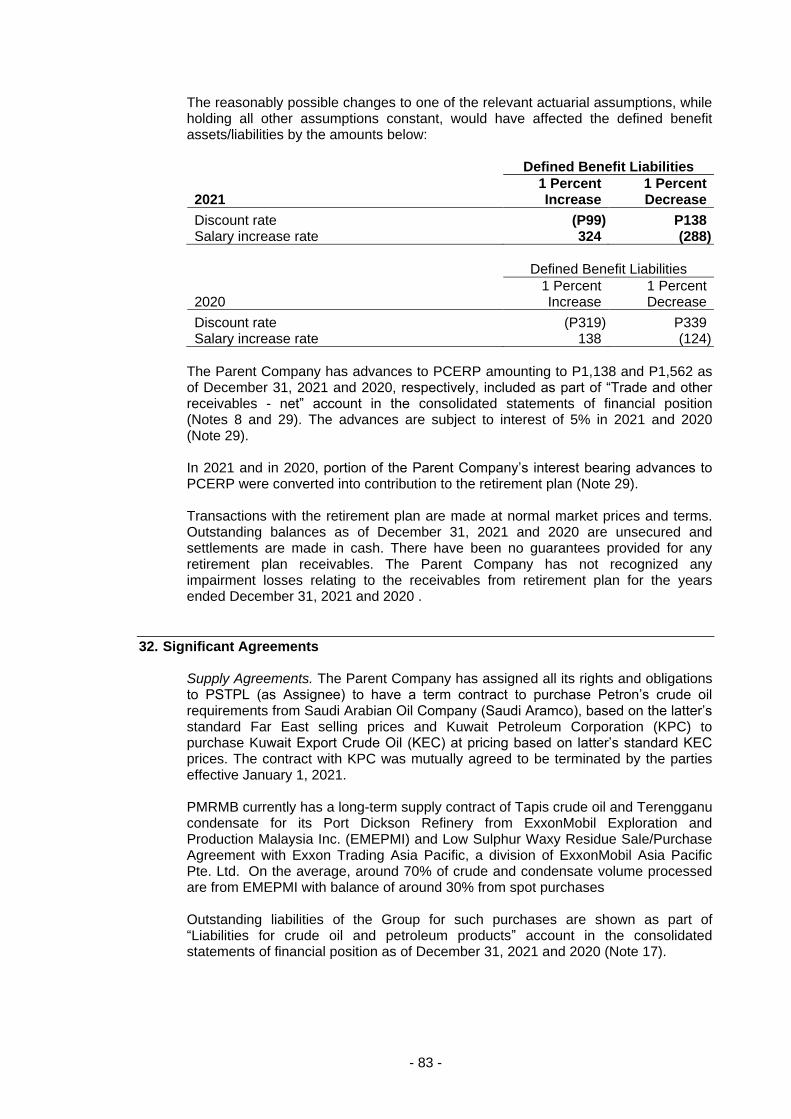
- 83 -
The reasonably possible changes to one of the relevant actuarial assumptions, while holding all other assumptions constant, would have affected the defined benefit assets/liabilities by the amounts below: Defined Benefit Liabilities
2021 1 Percent Increase
1 Percent Decrease
Discount rate (P99) P138 Salary increase rate 324 (288)
Defined Benefit Liabilities
2020 1 Percent Increase
1 Percent Decrease
Discount rate (P319) P339 Salary increase rate 138 (124)
The Parent Company has advances to PCERP amounting to P1,138 and P1,562 as of December 31, 2021 and 2020, respectively, included as part of “Trade and other receivables - net” account in the consolidated statements of financial position (Notes 8 and 29). The advances are subject to interest of 5% in 2021 and 2020 (Note 29). In 2021 and in 2020, portion of the Parent Company’s interest bearing advances to PCERP were converted into contribution to the retirement plan (Note 29). Transactions with the retirement plan are made at normal market prices and terms. Outstanding balances as of December 31, 2021 and 2020 are unsecured and settlements are made in cash. There have been no guarantees provided for any retirement plan receivables. The Parent Company has not recognized any impairment losses relating to the receivables from retirement plan for the years ended December 31, 2021 and 2020 .
32. Significant Agreements Supply Agreements. The Parent Company has assigned all its rights and obligations to PSTPL (as Assignee) to have a term contract to purchase Petron’s crude oil requirements from Saudi Arabian Oil Company (Saudi Aramco), based on the latter’s standard Far East selling prices and Kuwait Petroleum Corporation (KPC) to purchase Kuwait Export Crude Oil (KEC) at pricing based on latter’s standard KEC prices. The contract with KPC was mutually agreed to be terminated by the parties effective January 1, 2021. PMRMB currently has a long-term supply contract of Tapis crude oil and Terengganu condensate for its Port Dickson Refinery from ExxonMobil Exploration and Production Malaysia Inc. (EMEPMI) and Low Sulphur Waxy Residue Sale/Purchase Agreement with Exxon Trading Asia Pacific, a division of ExxonMobil Asia Pacific Pte. Ltd. On the average, around 70% of crude and condensate volume processed are from EMEPMI with balance of around 30% from spot purchases Outstanding liabilities of the Group for such purchases are shown as part of “Liabilities for crude oil and petroleum products” account in the consolidated statements of financial position as of December 31, 2021 and 2020 (Note 17).
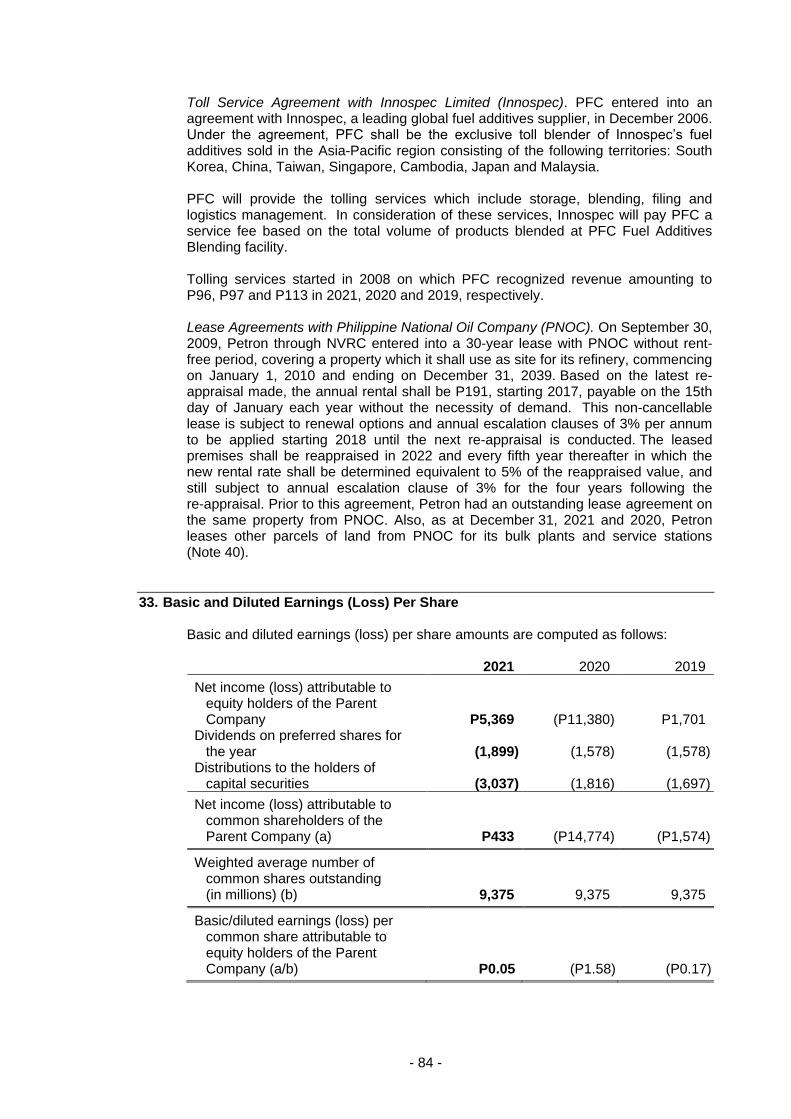
- 84 -
Toll Service Agreement with Innospec Limited (Innospec). PFC entered into an agreement with Innospec, a leading global fuel additives supplier, in December 2006. Under the agreement, PFC shall be the exclusive toll blender of Innospec’s fuel additives sold in the Asia-Pacific region consisting of the following territories: South Korea, China, Taiwan, Singapore, Cambodia, Japan and Malaysia. PFC will provide the tolling services which include storage, blending, filing and logistics management. In consideration of these services, Innospec will pay PFC a service fee based on the total volume of products blended at PFC Fuel Additives Blending facility. Tolling services started in 2008 on which PFC recognized revenue amounting to P96, P97 and P113 in 2021, 2020 and 2019, respectively. Lease Agreements with Philippine National Oil Company (PNOC). On September 30, 2009, Petron through NVRC entered into a 30-year lease with PNOC without rent-free period, covering a property which it shall use as site for its refinery, commencing on January 1, 2010 and ending on December 31, 2039. Based on the latest re-appraisal made, the annual rental shall be P191, starting 2017, payable on the 15th day of January each year without the necessity of demand. This non-cancellable lease is subject to renewal options and annual escalation clauses of 3% per annum to be applied starting 2018 until the next re-appraisal is conducted. The leased premises shall be reappraised in 2022 and every fifth year thereafter in which the new rental rate shall be determined equivalent to 5% of the reappraised value, and still subject to annual escalation clause of 3% for the four years following the re-appraisal. Prior to this agreement, Petron had an outstanding lease agreement on the same property from PNOC. Also, as at December 31, 2021 and 2020, Petron leases other parcels of land from PNOC for its bulk plants and service stations (Note 40).
33. Basic and Diluted Earnings (Loss) Per Share Basic and diluted earnings (loss) per share amounts are computed as follows: 2021 2020 2019
Net income (loss) attributable to equity holders of the Parent Company P5,369 (P11,380) P1,701
Dividends on preferred shares for the year (1,899) (1,578) (1,578)
Distributions to the holders of capital securities (3,037) (1,816) (1,697)
Net income (loss) attributable to common shareholders of the Parent Company (a) P433 (P14,774) (P1,574)
Weighted average number of common shares outstanding (in millions) (b) 9,375 9,375 9,375
Basic/diluted earnings (loss) per common share attributable to equity holders of the Parent Company (a/b) P0.05 (P1.58) (P0.17)
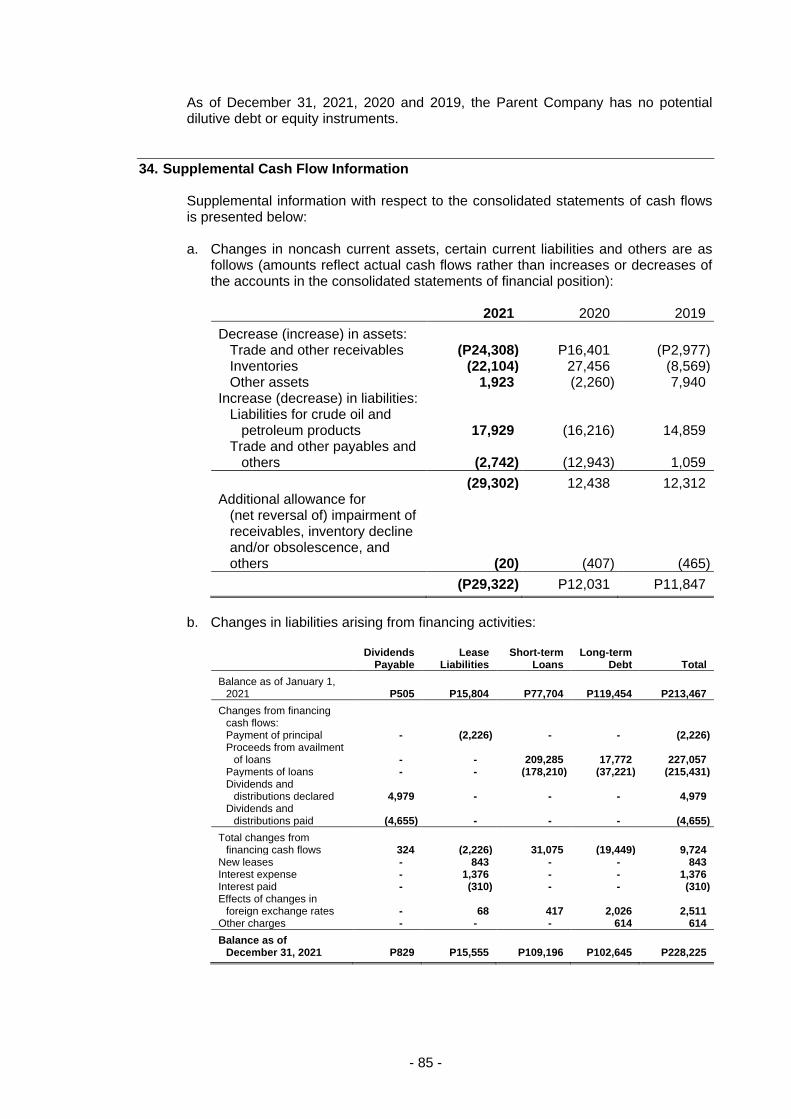
- 85 -
As of December 31, 2021, 2020 and 2019, the Parent Company has no potential dilutive debt or equity instruments.
34. Supplemental Cash Flow Information Supplemental information with respect to the consolidated statements of cash flows is presented below: a. Changes in noncash current assets, certain current liabilities and others are as
follows (amounts reflect actual cash flows rather than increases or decreases of the accounts in the consolidated statements of financial position): 2021 2020 2019
Decrease (increase) in assets: Trade and other receivables (P24,308) P16,401 (P2,977) Inventories (22,104) 27,456 (8,569) Other assets 1,923 (2,260) 7,940
Increase (decrease) in liabilities: Liabilities for crude oil and
petroleum products 17,929 (16,216) 14,859 Trade and other payables and
others (2,742) (12,943) 1,059
(29,302) 12,438 12,312 Additional allowance for
(net reversal of) impairment of receivables, inventory decline and/or obsolescence, and others (20) (407) (465)
(P29,322) P12,031 P11,847
b. Changes in liabilities arising from financing activities:
Dividends
Payable Lease
Liabilities Short-term
Loans Long-term
Debt Total
Balance as of January 1, 2021 P505 P15,804 P77,704 P119,454 P213,467
Changes from financing cash flows: Payment of principal - (2,226) - - (2,226) Proceeds from availment
of loans - - 209,285 17,772 227,057 Payments of loans - - (178,210) (37,221) (215,431) Dividends and
distributions declared 4,979 - - - 4,979 Dividends and
distributions paid (4,655) - - - (4,655)
Total changes from financing cash flows 324 (2,226) 31,075 (19,449) 9,724
New leases - 843 - - 843 Interest expense - 1,376 - - 1,376 Interest paid - (310) - - (310) Effects of changes in
foreign exchange rates - 68 417 2,026 2,511 Other charges - - - 614 614
Balance as of December 31, 2021 P829 P15,555 P109,196 P102,645 P228,225
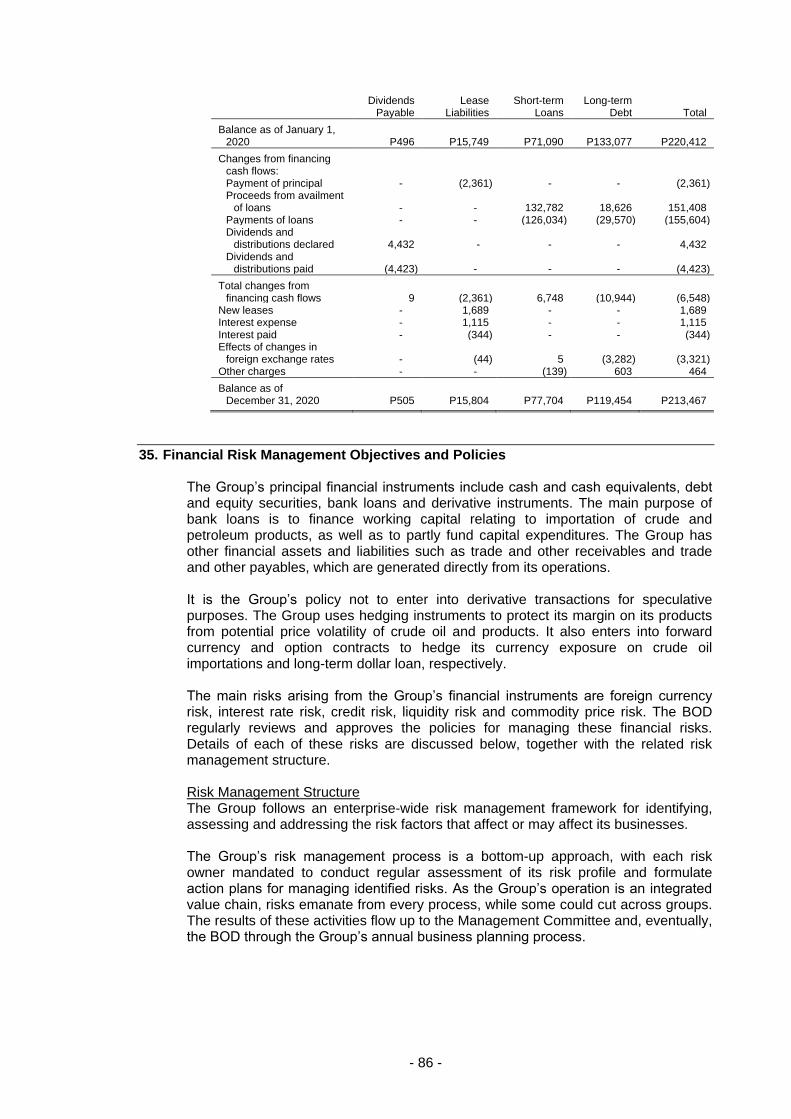
- 86 -
Dividends
Payable Lease
Liabilities Short-term
Loans Long-term
Debt Total
Balance as of January 1, 2020 P496 P15,749 P71,090 P133,077 P220,412
Changes from financing cash flows: Payment of principal - (2,361) - - (2,361) Proceeds from availment
of loans - - 132,782 18,626 151,408 Payments of loans - - (126,034) (29,570) (155,604) Dividends and
distributions declared 4,432 - - - 4,432 Dividends and
distributions paid (4,423) - - - (4,423)
Total changes from financing cash flows 9 (2,361) 6,748 (10,944) (6,548)
New leases - 1,689 - - 1,689 Interest expense - 1,115 - - 1,115 Interest paid - (344) - - (344) Effects of changes in
foreign exchange rates - (44) 5 (3,282) (3,321) Other charges - - (139) 603 464
Balance as of December 31, 2020 P505 P15,804 P77,704 P119,454 P213,467
35. Financial Risk Management Objectives and Policies The Group’s principal financial instruments include cash and cash equivalents, debt and equity securities, bank loans and derivative instruments. The main purpose of bank loans is to finance working capital relating to importation of crude and petroleum products, as well as to partly fund capital expenditures. The Group has other financial assets and liabilities such as trade and other receivables and trade and other payables, which are generated directly from its operations. It is the Group’s policy not to enter into derivative transactions for speculative purposes. The Group uses hedging instruments to protect its margin on its products from potential price volatility of crude oil and products. It also enters into forward currency and option contracts to hedge its currency exposure on crude oil importations and long-term dollar loan, respectively. The main risks arising from the Group’s financial instruments are foreign currency risk, interest rate risk, credit risk, liquidity risk and commodity price risk. The BOD regularly reviews and approves the policies for managing these financial risks. Details of each of these risks are discussed below, together with the related risk management structure. Risk Management Structure The Group follows an enterprise-wide risk management framework for identifying, assessing and addressing the risk factors that affect or may affect its businesses. The Group’s risk management process is a bottom-up approach, with each risk owner mandated to conduct regular assessment of its risk profile and formulate action plans for managing identified risks. As the Group’s operation is an integrated value chain, risks emanate from every process, while some could cut across groups. The results of these activities flow up to the Management Committee and, eventually, the BOD through the Group’s annual business planning process.
- 87 -
Oversight and technical assistance is likewise provided by corporate units and committees with special duties. These groups and their functions are: a. The Risk and Insurance Management Group, which is mandated with the overall
coordination and development of the enterprise-wide risk management process. b. The Treasurers Department, which is in charge of foreign currency hedging
transactions. c. The Transaction Management Unit of Controllers Department, which provides
backroom support for all hedging transactions. d. The Corporate Technical and Engineering Services Group, which oversees strict
adherence to safety and environmental mandates across all facilities. e. The Internal Audit Department, which has been tasked with the implementation
of a risk-based auditing. f. The Commodity Risk Management Department (CRMD), which sets new and
updates existing hedging policies by the BOD, provides the strategic targets and recommends corporate hedging strategy to the Commodity Risk Management Committee and Steering Committee.
g. PSTPL executes the hedging transactions involving crude and product imports
on behalf of the Group. The BOD also created separate positions and board-level entities with explicit authority and responsibility in managing and monitoring risks, as follows: a. The Audit Committee is responsible for overseeing the Senior Management in
establishing and maintaining an adequate, effective and efficient internal control framework. It ensures that systems and processes are designed to provide assurance in areas including reporting, monitoring compliance with laws, regulations and internal policies, efficiency and effectiveness of operations, and safeguarding of assets. The Internal Audit Department and the External Auditor directly report to the Audit Committee regarding the direction, scope and coordination of audit and any related activities.
b. The Risk Oversight Committee is responsible for the oversight of the enterprise
risk management system of the Group to ensure its functionality and effectiveness.
c. The Compliance Officer, who is a senior officer of the Parent Company reports to
the BOD chairperson. Among other functions, he monitors compliance with the provisions and requirements of the Corporate Governance Manual and relevant laws and regulations and determines any possible violations and recommends corresponding penalties, subject to review and approval of the BOD. The Compliance Officer identifies and monitors compliance risk. Lastly, the Compliance Officer represents the Group before the SEC regarding matters involving compliance with the Corporate Governance Manual and other relevant rules and regulations of the SEC.
- 88 -
Foreign Currency Risk The Parent Company’s functional currency is the Philippine peso, which is the denomination of the bulk of the Group’s revenues. The Group’s exposures to foreign currency risk arise mainly from US dollar-denominated sales as well as purchases principally of crude oil and petroleum products. As a result of this, the Group maintains a level of US dollar-denominated assets and liabilities during the year. Foreign currency risk occurs due to differences in the levels of US dollar-denominated assets and liabilities. In addition, starting March 31, 2012, the Group’s exposure to foreign currency risks also arise from US dollar-denominated sales and purchases, principally of crude oil and petroleum products, of Petron Malaysia whose transactions are in Malaysian ringgit, which are subsequently converted into US dollar before ultimately translated to equivalent Philippine peso amount using applicable rates for the purpose of consolidation. The Group pursues a policy of mitigating foreign currency risk by entering into hedging transactions or by substituting US dollar-denominated liabilities with peso-based debt. The natural hedge provided by US dollar-denominated assets is also factored in hedging decisions. As a matter of policy, currency hedging is limited to the extent of 100% of the underlying exposure. The Group is allowed to engage in active risk management strategies for a portion of its foreign currency risk exposure. Loss limits are in place, monitored daily and regularly reviewed by management. The Group assesses the existence of an economic relationship between the hedged item and the hedging instrument based on the currency, amount, and timing of their respective cash flows. For derivatives designated in a hedging relationship, the Group determines whether the derivatives are expected to be highly effective in offsetting the changes in the cash flows of the hedged item using the cumulative dollar-offset method. The dollar-offset method approximates the changes in the fair value of the hedged item using a hypothetical derivative which mirrors the terms of the derivative used as hedging instrument. For currency hedges, the Group maintains a 1:1 hedge ratio since a similar amount of hedging instrument is expected to offset the changes in the cash flows of the hedged item. The main sources of ineffectiveness are: a. the effect of the counterparty and the Group’s own credit risk on the fair value of
the swaps, which is not reflected in the change in the fair value of the hedged cash flows attributable to the change in the exchange rates; and
b. changes in the timing of the hedged transactions. The Group is exposed to foreign currency risk of its short-term loans and US dollar-denominated sales and purchases. On the other hand, both foreign currency and interest rate risks arise in the Group’s long-term debts. The Group determined that foreign currency risk is a separately identifiable and measurable risk component eligible for designation since it is caused by fluctuations in US dollar to Philippine peso exchange rates and benchmark closing prices used to measure the fluctuations are available in the market.
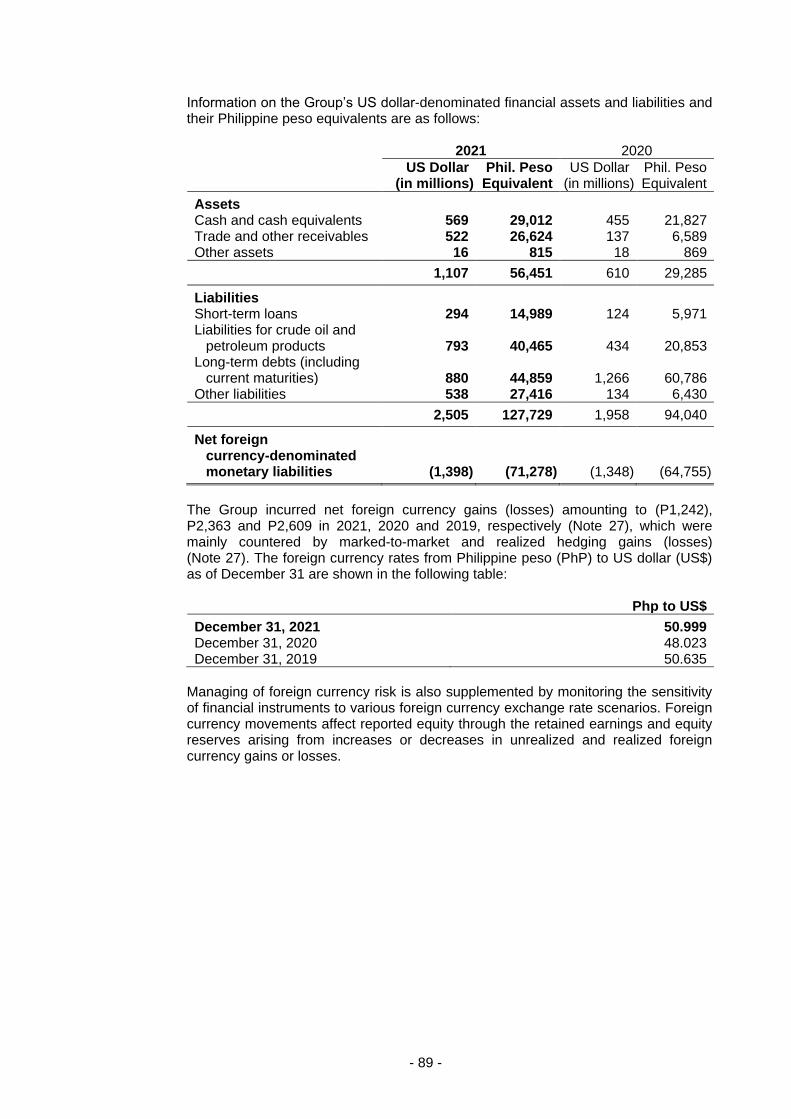
- 89 -
Information on the Group’s US dollar-denominated financial assets and liabilities and their Philippine peso equivalents are as follows: 2021 2020
US Dollar
(in millions) Phil. Peso
Equivalent US Dollar
(in millions) Phil. Peso Equivalent
Assets Cash and cash equivalents 569 29,012 455 21,827 Trade and other receivables 522 26,624 137 6,589 Other assets 16 815 18 869
1,107 56,451 610 29,285
Liabilities Short-term loans 294 14,989 124 5,971 Liabilities for crude oil and
petroleum products 793 40,465 434 20,853 Long-term debts (including
current maturities) 880 44,859 1,266 60,786 Other liabilities 538 27,416 134 6,430
2,505 127,729 1,958 94,040
Net foreign currency-denominated monetary liabilities (1,398) (71,278) (1,348) (64,755)
The Group incurred net foreign currency gains (losses) amounting to (P1,242), P2,363 and P2,609 in 2021, 2020 and 2019, respectively (Note 27), which were mainly countered by marked-to-market and realized hedging gains (losses) (Note 27). The foreign currency rates from Philippine peso (PhP) to US dollar (US$) as of December 31 are shown in the following table: Php to US$
December 31, 2021 50.999 December 31, 2020 48.023 December 31, 2019 50.635
Managing of foreign currency risk is also supplemented by monitoring the sensitivity of financial instruments to various foreign currency exchange rate scenarios. Foreign currency movements affect reported equity through the retained earnings and equity reserves arising from increases or decreases in unrealized and realized foreign currency gains or losses.
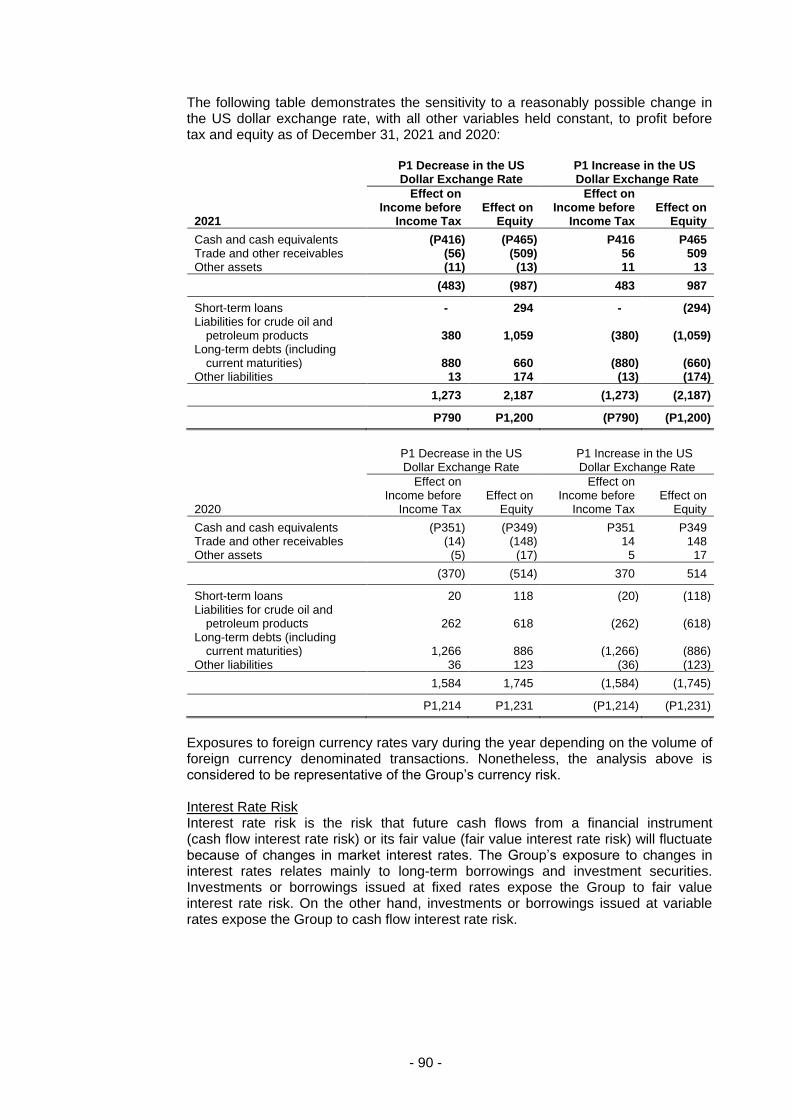
- 90 -
The following table demonstrates the sensitivity to a reasonably possible change in the US dollar exchange rate, with all other variables held constant, to profit before tax and equity as of December 31, 2021 and 2020:
P1 Decrease in the US Dollar Exchange Rate
P1 Increase in the US Dollar Exchange Rate
2021
Effect on Income before
Income Tax Effect on
Equity
Effect on Income before
Income Tax Effect on
Equity
Cash and cash equivalents (P416) (P465) P416 P465 Trade and other receivables (56) (509) 56 509 Other assets (11) (13) 11 13
(483) (987) 483 987
Short-term loans - 294 - (294) Liabilities for crude oil and
petroleum products 380 1,059 (380) (1,059) Long-term debts (including
current maturities) 880 660 (880) (660) Other liabilities 13 174 (13) (174)
1,273 2,187 (1,273) (2,187)
P790 P1,200 (P790) (P1,200)
P1 Decrease in the US Dollar Exchange Rate
P1 Increase in the US Dollar Exchange Rate
2020
Effect on Income before
Income Tax Effect on
Equity
Effect on Income before
Income Tax Effect on
Equity
Cash and cash equivalents (P351) (P349) P351 P349 Trade and other receivables (14) (148) 14 148 Other assets (5) (17) 5 17
(370) (514) 370 514
Short-term loans 20 118 (20) (118) Liabilities for crude oil and
petroleum products 262 618 (262) (618) Long-term debts (including
current maturities) 1,266 886 (1,266) (886) Other liabilities 36 123 (36) (123)
1,584 1,745 (1,584) (1,745)
P1,214 P1,231 (P1,214) (P1,231)
Exposures to foreign currency rates vary during the year depending on the volume of foreign currency denominated transactions. Nonetheless, the analysis above is considered to be representative of the Group’s currency risk. Interest Rate Risk Interest rate risk is the risk that future cash flows from a financial instrument (cash flow interest rate risk) or its fair value (fair value interest rate risk) will fluctuate because of changes in market interest rates. The Group’s exposure to changes in interest rates relates mainly to long-term borrowings and investment securities. Investments or borrowings issued at fixed rates expose the Group to fair value interest rate risk. On the other hand, investments or borrowings issued at variable rates expose the Group to cash flow interest rate risk.
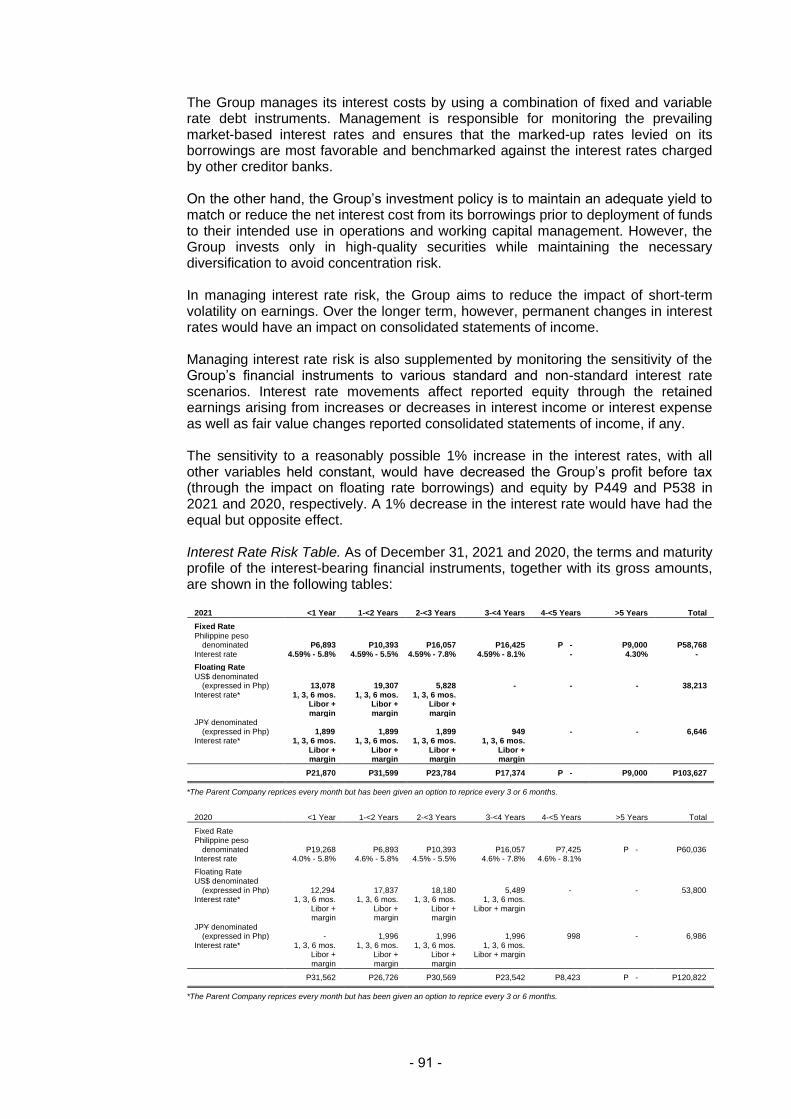
The Group manages its interest costs by using a combination of fixed and variable rate debt instruments. Management is responsible for monitoring the prevailing market-based interest rates and ensures that the marked-up rates levied on its borrowings are most favorable and benchmarked against the interest rates charged by other creditor banks.
On the other hand, the Group’s investment policy is to maintain an adequate yield to match or reduce the net interest cost from its borrowings prior to deployment of funds to their intended use in operations and working capital management. However, the Group invests only in high-quality securities while maintaining the necessary diversification to avoid concentration risk.
In managing interest rate risk, the Group aims to reduce the impact of short-term volatility on earnings. Over the longer term, however, permanent changes in interest rates would have an impact on consolidated statements of income.
Managing interest rate risk is also supplemented by monitoring the sensitivity of the Group’s financial instruments to various standard and non-standard interest rate scenarios. Interest rate movements affect reported equity through the retained earnings arising from increases or decreases in interest income or interest expense as well as fair value changes reported consolidated statements of income, if any.
The sensitivity to a reasonably possible 1% increase in the interest rates, with all other variables held constant, would have decreased the Group’s profit before tax (through the impact on floating rate borrowings) and equity by P449 and P538 in 2021 and 2020, respectively. A 1% decrease in the interest rate would have had the equal but opposite effect.
Interest Rate Risk Table. As of December 31, 2021 and 2020, the terms and maturity profile of the interest-bearing financial instruments, together with its gross amounts, are shown in the following tables:
2021 <1 Year 1-<2 Years 2-<3 Years 3-<4 Years 4-<5 Years >5 Years Total
Fixed Rate
Philippine peso denominated P6,893 P10,393 P16,057 P16,425 P - P9,000 P58,768
Interest rate 4.59% - 5.8% 4.59% - 5.5% 4.59% - 7.8% 4.59% - 8.1% - 4.30% -
Floating Rate
US$ denominated (expressed in Php) 13,078 19,307 5,828 - - - 38,213
Interest rate* 1, 3, 6 mos. Libor + margin
1, 3, 6 mos. Libor + margin
1, 3, 6 mos. Libor + margin
JPY denominated (expressed in Php) 1,899 1,899 1,899 949 - - 6,646
Interest rate* 1, 3, 6 mos. Libor + margin
1, 3, 6 mos. Libor + margin
1, 3, 6 mos. Libor + margin
1, 3, 6 mos. Libor + margin
P21,870 P31,599 P23,784 P17,374 P - P9,000 P103,627
*The Parent Company reprices every month but has been given an option to reprice every 3 or 6 months.
2020 <1 Year 1-<2 Years 2-<3 Years 3-<4 Years 4-<5 Years >5 Years Total
Fixed Rate Philippine peso
denominated P19,268 P6,893 P10,393 P16,057 P7,425 P - P60,036 Interest rate 4.0% - 5.8% 4.6% - 5.8% 4.5% - 5.5% 4.6% - 7.8% 4.6% - 8.1%
Floating Rate US$ denominated
(expressed in Php) 12,294 17,837 18,180 5,489 - - 53,800 Interest rate* 1, 3, 6 mos.
Libor + margin
1, 3, 6 mos. Libor + margin
1, 3, 6 mos. Libor + margin
1, 3, 6 mos. Libor + margin
JPY denominated (expressed in Php) - 1,996 1,996 1,996 998 - 6,986
Interest rate* 1, 3, 6 mos. Libor + margin
1, 3, 6 mos. Libor + margin
1, 3, 6 mos. Libor + margin
1, 3, 6 mos. Libor + margin
P31,562 P26,726 P30,569 P23,542 P8,423 P - P120,822
*The Parent Company reprices every month but has been given an option to reprice every 3 or 6 months.
- 91 -
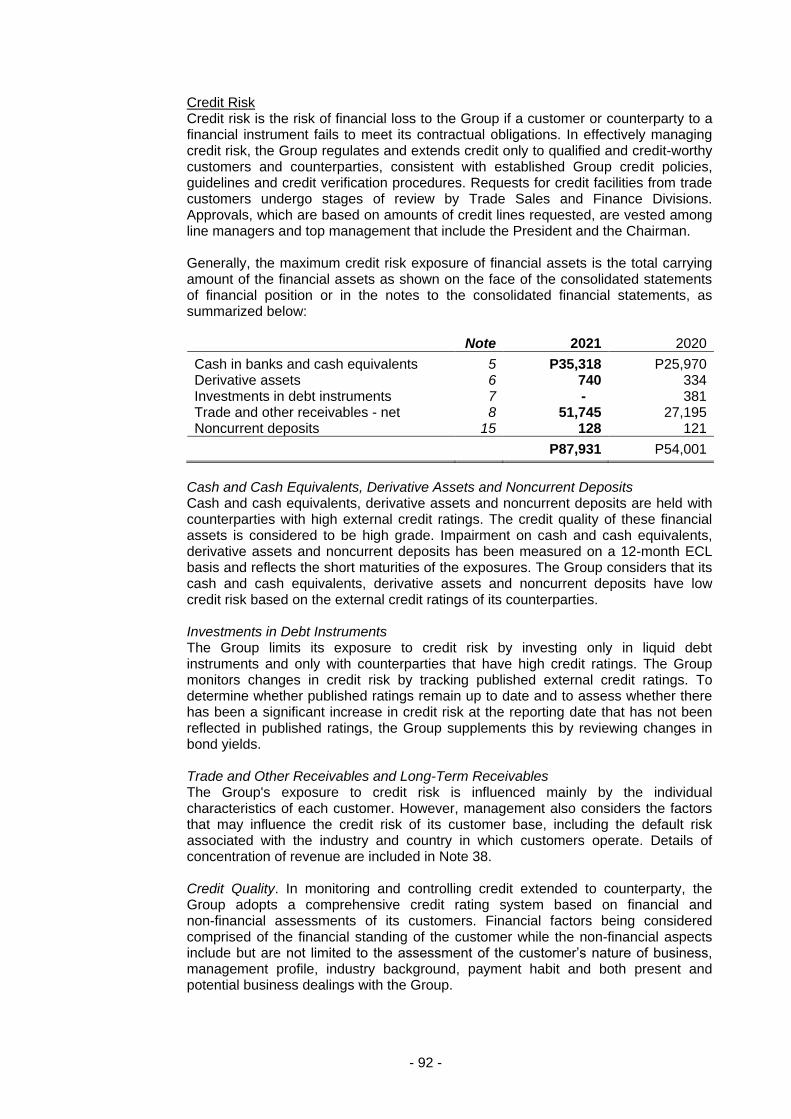
- 92 -
Credit Risk Credit risk is the risk of financial loss to the Group if a customer or counterparty to a financial instrument fails to meet its contractual obligations. In effectively managing credit risk, the Group regulates and extends credit only to qualified and credit-worthy customers and counterparties, consistent with established Group credit policies, guidelines and credit verification procedures. Requests for credit facilities from trade customers undergo stages of review by Trade Sales and Finance Divisions. Approvals, which are based on amounts of credit lines requested, are vested among line managers and top management that include the President and the Chairman.
Generally, the maximum credit risk exposure of financial assets is the total carrying amount of the financial assets as shown on the face of the consolidated statements of financial position or in the notes to the consolidated financial statements, as summarized below:
Note 2021 2020
Cash in banks and cash equivalents 5 P35,318 P25,970 Derivative assets 6 740 334 Investments in debt instruments 7 - 381 Trade and other receivables - net 8 51,745 27,195 Noncurrent deposits 15 128 121
P87,931 P54,001
Cash and Cash Equivalents, Derivative Assets and Noncurrent Deposits Cash and cash equivalents, derivative assets and noncurrent deposits are held with counterparties with high external credit ratings. The credit quality of these financial assets is considered to be high grade. Impairment on cash and cash equivalents, derivative assets and noncurrent deposits has been measured on a 12-month ECL basis and reflects the short maturities of the exposures. The Group considers that its cash and cash equivalents, derivative assets and noncurrent deposits have low credit risk based on the external credit ratings of its counterparties.
Investments in Debt Instruments The Group limits its exposure to credit risk by investing only in liquid debt instruments and only with counterparties that have high credit ratings. The Group monitors changes in credit risk by tracking published external credit ratings. To determine whether published ratings remain up to date and to assess whether there has been a significant increase in credit risk at the reporting date that has not been reflected in published ratings, the Group supplements this by reviewing changes in bond yields.
Trade and Other Receivables and Long-Term Receivables The Group's exposure to credit risk is influenced mainly by the individual characteristics of each customer. However, management also considers the factors that may influence the credit risk of its customer base, including the default risk associated with the industry and country in which customers operate. Details of concentration of revenue are included in Note 38.
Credit Quality. In monitoring and controlling credit extended to counterparty, the Group adopts a comprehensive credit rating system based on financial and non-financial assessments of its customers. Financial factors being considered comprised of the financial standing of the customer while the non-financial aspects include but are not limited to the assessment of the customer’s nature of business, management profile, industry background, payment habit and both present and potential business dealings with the Group.
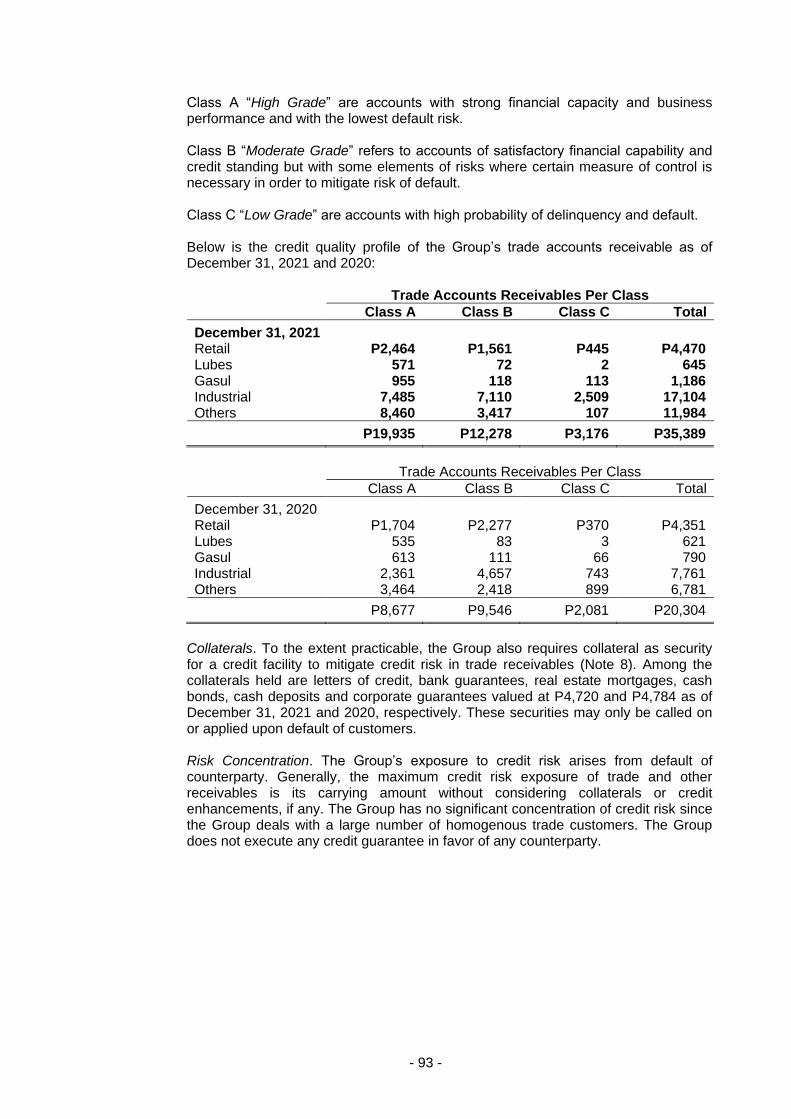
- 93 -
Class A “High Grade” are accounts with strong financial capacity and business performance and with the lowest default risk. Class B “Moderate Grade” refers to accounts of satisfactory financial capability and credit standing but with some elements of risks where certain measure of control is necessary in order to mitigate risk of default. Class C “Low Grade” are accounts with high probability of delinquency and default. Below is the credit quality profile of the Group’s trade accounts receivable as of December 31, 2021 and 2020: Trade Accounts Receivables Per Class
Class A Class B Class C Total
December 31, 2021 Retail P2,464 P1,561 P445 P4,470 Lubes 571 72 2 645 Gasul 955 118 113 1,186 Industrial 7,485 7,110 2,509 17,104 Others 8,460 3,417 107 11,984
P19,935 P12,278 P3,176 P35,389
Trade Accounts Receivables Per Class
Class A Class B Class C Total
December 31, 2020 Retail P1,704 P2,277 P370 P4,351 Lubes 535 83 3 621 Gasul 613 111 66 790 Industrial 2,361 4,657 743 7,761 Others 3,464 2,418 899 6,781
P8,677 P9,546 P2,081 P20,304
Collaterals. To the extent practicable, the Group also requires collateral as security for a credit facility to mitigate credit risk in trade receivables (Note 8). Among the collaterals held are letters of credit, bank guarantees, real estate mortgages, cash bonds, cash deposits and corporate guarantees valued at P4,720 and P4,784 as of December 31, 2021 and 2020, respectively. These securities may only be called on or applied upon default of customers. Risk Concentration. The Group’s exposure to credit risk arises from default of counterparty. Generally, the maximum credit risk exposure of trade and other receivables is its carrying amount without considering collaterals or credit enhancements, if any. The Group has no significant concentration of credit risk since the Group deals with a large number of homogenous trade customers. The Group does not execute any credit guarantee in favor of any counterparty.
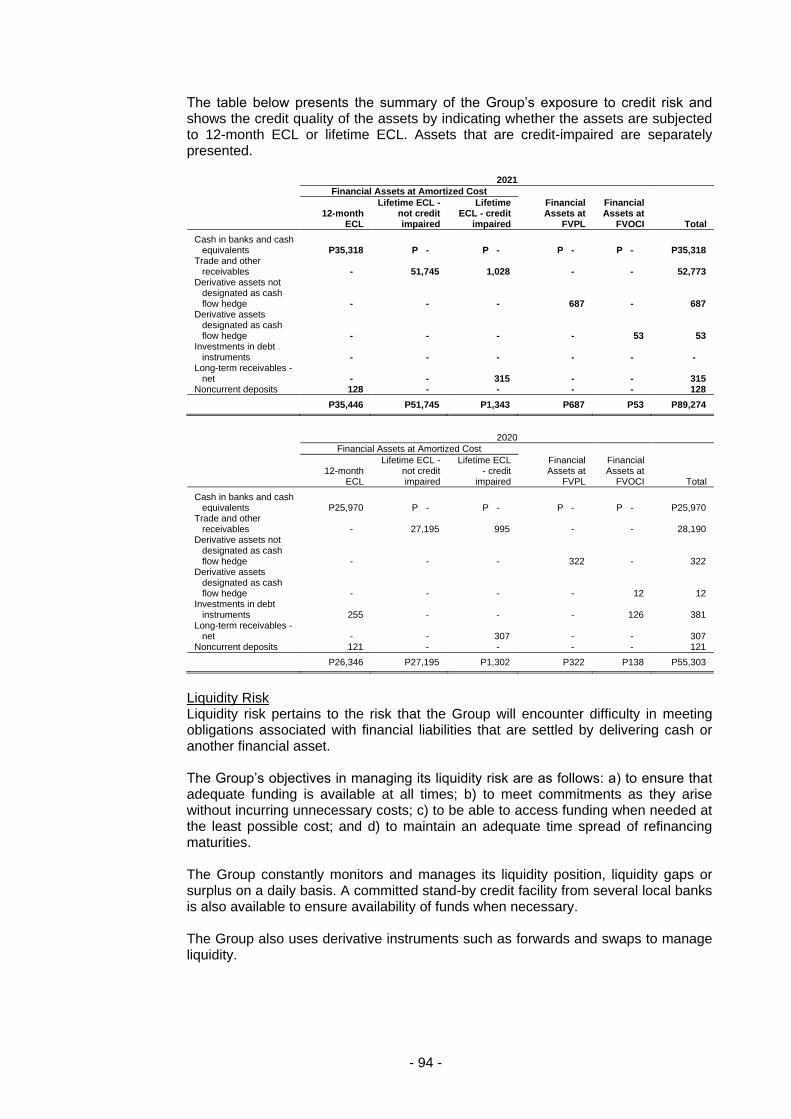
- 94 -
The table below presents the summary of the Group’s exposure to credit risk and shows the credit quality of the assets by indicating whether the assets are subjected to 12-month ECL or lifetime ECL. Assets that are credit-impaired are separately presented.
2021
Financial Assets at Amortized Cost
12-month
ECL
Lifetime ECL - not credit impaired
Lifetime ECL - credit
impaired
Financial Assets at
FVPL
Financial Assets at
FVOCI Total
Cash in banks and cash equivalents P35,318 P - P - P - P - P35,318
Trade and other receivables - 51,745 1,028 - - 52,773
Derivative assets not designated as cash flow hedge - - - 687 - 687
Derivative assets designated as cash flow hedge - - - - 53 53
Investments in debt instruments - - - - - -
Long-term receivables - net - - 315 - - 315
Noncurrent deposits 128 - - - - 128
P35,446 P51,745 P1,343 P687 P53 P89,274
2020
Financial Assets at Amortized Cost
12-month
ECL
Lifetime ECL - not credit impaired
Lifetime ECL - credit
impaired
Financial Assets at
FVPL
Financial Assets at
FVOCI Total
Cash in banks and cash equivalents P25,970 P - P - P - P - P25,970
Trade and other receivables - 27,195 995 - - 28,190
Derivative assets not designated as cash flow hedge - - - 322 - 322
Derivative assets designated as cash flow hedge - - - - 12 12
Investments in debt instruments 255 - - - 126 381
Long-term receivables - net - - 307 - - 307
Noncurrent deposits 121 - - - - 121
P26,346 P27,195 P1,302 P322 P138 P55,303
Liquidity Risk Liquidity risk pertains to the risk that the Group will encounter difficulty in meeting obligations associated with financial liabilities that are settled by delivering cash or another financial asset. The Group’s objectives in managing its liquidity risk are as follows: a) to ensure that adequate funding is available at all times; b) to meet commitments as they arise without incurring unnecessary costs; c) to be able to access funding when needed at the least possible cost; and d) to maintain an adequate time spread of refinancing maturities. The Group constantly monitors and manages its liquidity position, liquidity gaps or surplus on a daily basis. A committed stand-by credit facility from several local banks is also available to ensure availability of funds when necessary. The Group also uses derivative instruments such as forwards and swaps to manage liquidity.
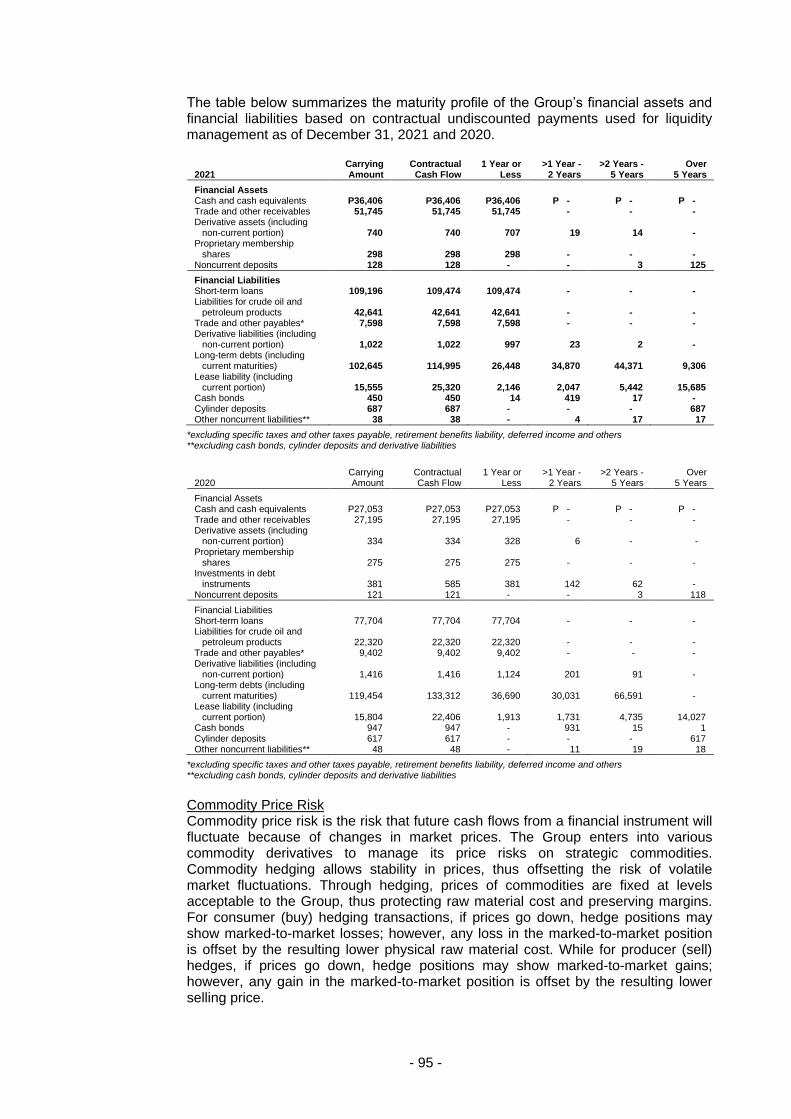
- 95 -
The table below summarizes the maturity profile of the Group’s financial assets and financial liabilities based on contractual undiscounted payments used for liquidity management as of December 31, 2021 and 2020.
2021 Carrying Amount
Contractual Cash Flow
1 Year or Less
>1 Year - 2 Years
>2 Years - 5 Years
Over 5 Years
Financial Assets Cash and cash equivalents P36,406 P36,406 P36,406 P - P - P - Trade and other receivables 51,745 51,745 51,745 - - - Derivative assets (including
non-current portion) 740 740 707 19 14 - Proprietary membership
shares 298 298 298 - - - Noncurrent deposits 128 128 - - 3 125
Financial Liabilities Short-term loans 109,196 109,474 109,474 - - - Liabilities for crude oil and
petroleum products 42,641 42,641 42,641 - - - Trade and other payables* 7,598 7,598 7,598 - - - Derivative liabilities (including
non-current portion) 1,022 1,022 997 23 2 - Long-term debts (including
current maturities) 102,645 114,995 26,448 34,870 44,371 9,306 Lease liability (including
current portion) 15,555 25,320 2,146 2,047 5,442 15,685 Cash bonds 450 450 14 419 17 - Cylinder deposits 687 687 - - - 687 Other noncurrent liabilities** 38 38 - 4 17 17
*excluding specific taxes and other taxes payable, retirement benefits liability, deferred income and others **excluding cash bonds, cylinder deposits and derivative liabilities
2020 Carrying Amount
Contractual Cash Flow
1 Year or Less
>1 Year - 2 Years
>2 Years - 5 Years
Over 5 Years
Financial Assets Cash and cash equivalents P27,053 P27,053 P27,053 P - P - P - Trade and other receivables 27,195 27,195 27,195 - - - Derivative assets (including
non-current portion) 334 334 328 6 - - Proprietary membership
shares 275 275 275 - - - Investments in debt
instruments 381 585 381 142 62 - Noncurrent deposits 121 121 - - 3 118
Financial Liabilities Short-term loans 77,704 77,704 77,704 - - - Liabilities for crude oil and
petroleum products 22,320 22,320 22,320 - - - Trade and other payables* 9,402 9,402 9,402 - - - Derivative liabilities (including
non-current portion) 1,416 1,416 1,124 201 91 - Long-term debts (including
current maturities) 119,454 133,312 36,690 30,031 66,591 - Lease liability (including
current portion) 15,804 22,406 1,913 1,731 4,735 14,027 Cash bonds 947 947 - 931 15 1 Cylinder deposits 617 617 - - - 617 Other noncurrent liabilities** 48 48 - 11 19 18
*excluding specific taxes and other taxes payable, retirement benefits liability, deferred income and others **excluding cash bonds, cylinder deposits and derivative liabilities
Commodity Price Risk Commodity price risk is the risk that future cash flows from a financial instrument will fluctuate because of changes in market prices. The Group enters into various commodity derivatives to manage its price risks on strategic commodities. Commodity hedging allows stability in prices, thus offsetting the risk of volatile market fluctuations. Through hedging, prices of commodities are fixed at levels acceptable to the Group, thus protecting raw material cost and preserving margins. For consumer (buy) hedging transactions, if prices go down, hedge positions may show marked-to-market losses; however, any loss in the marked-to-market position is offset by the resulting lower physical raw material cost. While for producer (sell) hedges, if prices go down, hedge positions may show marked-to-market gains; however, any gain in the marked-to-market position is offset by the resulting lower selling price.
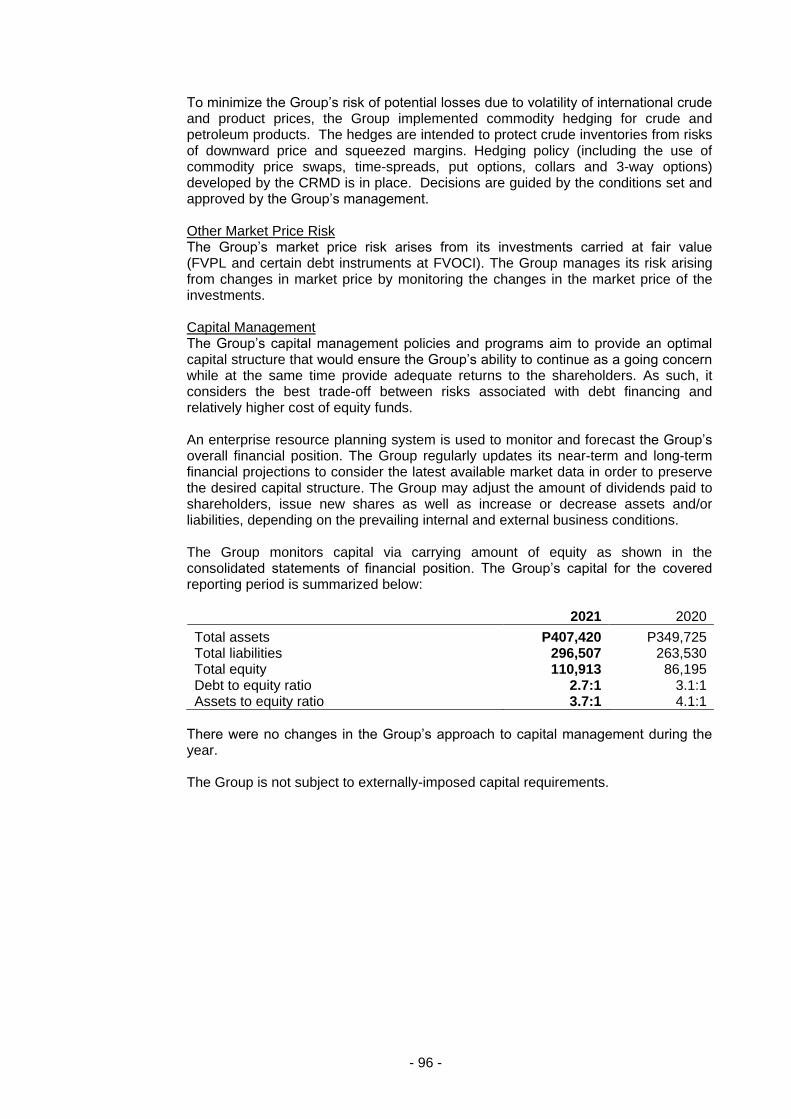
- 96 -
To minimize the Group’s risk of potential losses due to volatility of international crude and product prices, the Group implemented commodity hedging for crude and petroleum products. The hedges are intended to protect crude inventories from risks of downward price and squeezed margins. Hedging policy (including the use of commodity price swaps, time-spreads, put options, collars and 3-way options) developed by the CRMD is in place. Decisions are guided by the conditions set and approved by the Group’s management. Other Market Price Risk The Group’s market price risk arises from its investments carried at fair value (FVPL and certain debt instruments at FVOCI). The Group manages its risk arising from changes in market price by monitoring the changes in the market price of the investments. Capital Management The Group’s capital management policies and programs aim to provide an optimal capital structure that would ensure the Group’s ability to continue as a going concern while at the same time provide adequate returns to the shareholders. As such, it considers the best trade-off between risks associated with debt financing and relatively higher cost of equity funds. An enterprise resource planning system is used to monitor and forecast the Group’s overall financial position. The Group regularly updates its near-term and long-term financial projections to consider the latest available market data in order to preserve the desired capital structure. The Group may adjust the amount of dividends paid to shareholders, issue new shares as well as increase or decrease assets and/or liabilities, depending on the prevailing internal and external business conditions. The Group monitors capital via carrying amount of equity as shown in the consolidated statements of financial position. The Group’s capital for the covered reporting period is summarized below: 2021 2020
Total assets P407,420 P349,725 Total liabilities 296,507 263,530 Total equity 110,913 86,195 Debt to equity ratio 2.7:1 3.1:1 Assets to equity ratio 3.7:1 4.1:1
There were no changes in the Group’s approach to capital management during the year. The Group is not subject to externally-imposed capital requirements.
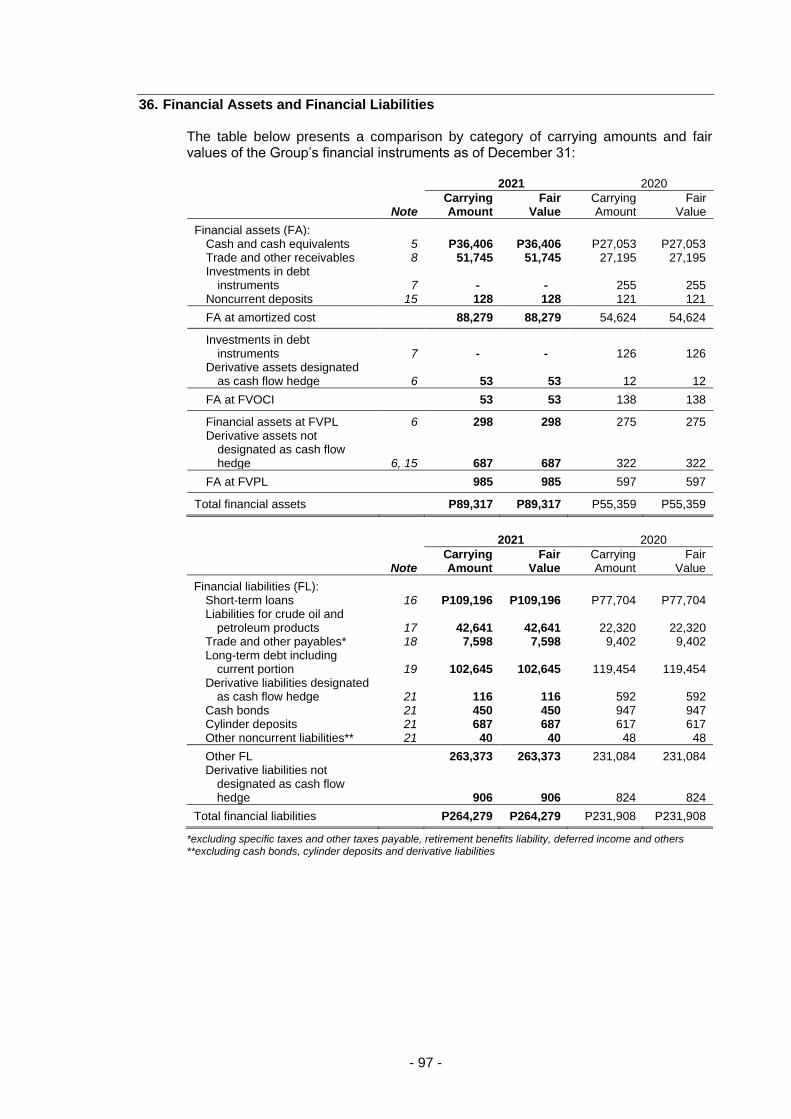
- 97 -
36. Financial Assets and Financial Liabilities The table below presents a comparison by category of carrying amounts and fair values of the Group’s financial instruments as of December 31:
2021 2020
Note Carrying Amount
Fair Value
Carrying Amount
Fair Value
Financial assets (FA): Cash and cash equivalents 5 P36,406 P36,406 P27,053 P27,053 Trade and other receivables 8 51,745 51,745 27,195 27,195 Investments in debt
instruments 7 - - 255 255 Noncurrent deposits 15 128 128 121 121
FA at amortized cost 88,279 88,279 54,624 54,624
Investments in debt instruments 7 - - 126 126
Derivative assets designated as cash flow hedge 6 53 53 12 12
FA at FVOCI 53 53 138 138
Financial assets at FVPL 6 298 298 275 275 Derivative assets not
designated as cash flow hedge 6, 15 687 687 322 322
FA at FVPL 985 985 597 597
Total financial assets P89,317 P89,317 P55,359 P55,359
2021 2020
Note Carrying Amount
Fair Value
Carrying Amount
Fair Value
Financial liabilities (FL): Short-term loans 16 P109,196 P109,196 P77,704 P77,704 Liabilities for crude oil and
petroleum products 17 42,641 42,641 22,320 22,320 Trade and other payables* 18 7,598 7,598 9,402 9,402 Long-term debt including
current portion 19 102,645 102,645 119,454 119,454 Derivative liabilities designated
as cash flow hedge 21 116 116 592 592 Cash bonds 21 450 450 947 947 Cylinder deposits 21 687 687 617 617 Other noncurrent liabilities** 21 40 40 48 48
Other FL 263,373 263,373 231,084 231,084 Derivative liabilities not
designated as cash flow hedge 906 906 824 824
Total financial liabilities P264,279 P264,279 P231,908 P231,908
*excluding specific taxes and other taxes payable, retirement benefits liability, deferred income and others **excluding cash bonds, cylinder deposits and derivative liabilities
- 98 -
The following methods and assumptions are used to estimate the fair value of each class of financial instruments: Cash and Cash Equivalents, Trade and Other Receivables and Advances to Subsidiaries and a Joint Venture. The carrying amount of cash and cash equivalents and trade and other receivables approximates fair value primarily due to the relatively short-term maturities of these financial instruments. In the case of the advances to subsidiaries and a joint venture, the fair value is based on the present value of expected future cash flows using the applicable discount rates based on current market rates of identical or similar quoted instruments. Derivatives. The fair values of freestanding and bifurcated forward currency transactions are calculated by reference to current forward exchange rates for contracts with similar maturity profiles. Marked-to-market valuation of commodity hedges are based on forecasted crude and product prices by third parties. The fair values of derivative instruments designated as cash flow hedges are computed by discounting the future cash flows and using the valuation model based on applicable market rates of similar instruments. Financial Assets at FVPL. The fair values of publicly traded instruments and similar investments are based on published market prices. Long-term Debt - Floating Rate. The carrying amount of floating rate loans with quarterly interest rate repricing approximate their fair value. Cash Bonds, Cylinder Deposits and Other Noncurrent Liabilities. Fair value is estimated as the present value of all future cash flows discounted using the applicable market rates for similar types of instruments as of reporting date. Effective rates used in 2021 and 2020 are 7.54% and 7.45% respectively. Short-term Loans, Liabilities for Crude Oil and Petroleum Products and Trade and Other Payables. The carrying amount of short-term loans, liabilities for crude oil and petroleum products and trade and other payables approximates fair value due to the relatively short-term maturities of these financial instruments. Derivative Financial Instruments The Group’s derivative financial instruments according to the type of financial risk being managed and the details of freestanding and embedded derivative financial instruments that are categorized into those accounted for as cash flow hedges and those that are not designated as accounting hedges are discussed below. The Group enters into various foreign currency, interest rate and commodity derivative contracts to manage its exposure on foreign currency, interest rate and commodity price risks. The portfolio is a mixture of instruments including forwards, swaps and options.
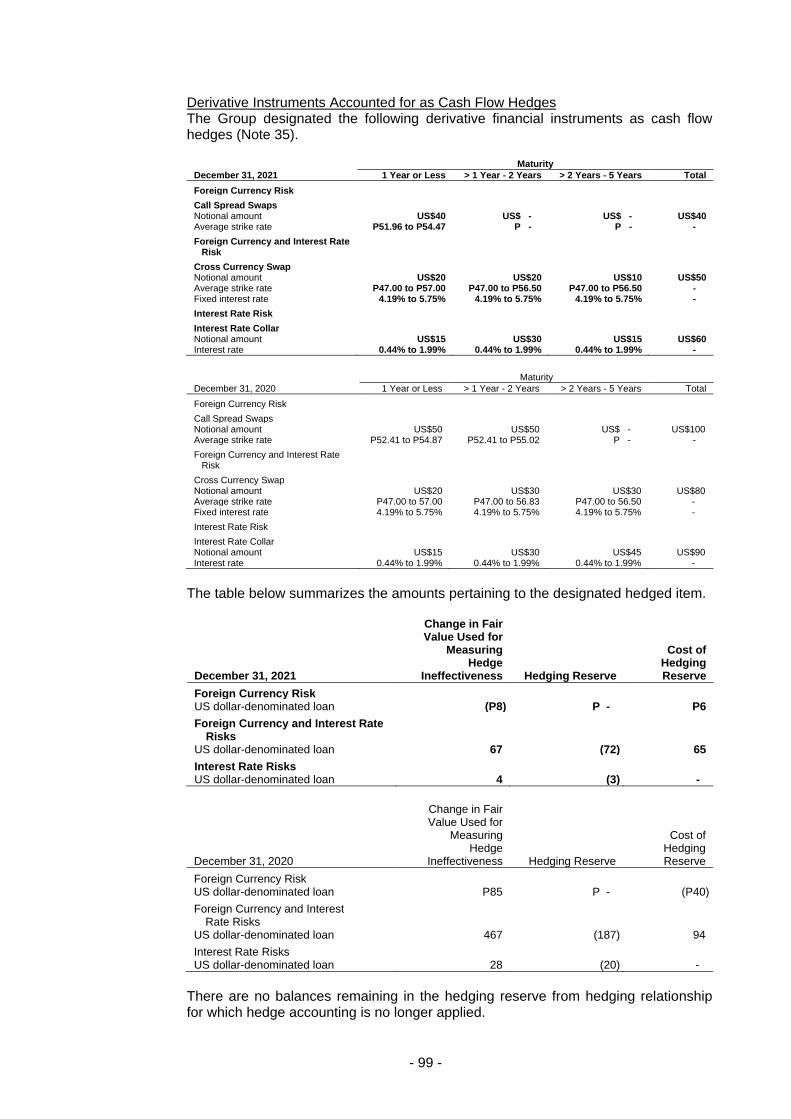
- 99 -
Derivative Instruments Accounted for as Cash Flow Hedges The Group designated the following derivative financial instruments as cash flow hedges (Note 35).
Maturity
December 31, 2021 1 Year or Less > 1 Year - 2 Years > 2 Years - 5 Years Total
Foreign Currency Risk
Call Spread Swaps Notional amount US$40 US$ - US$ - US$40 Average strike rate P51.96 to P54.47 P - P - -
Foreign Currency and Interest Rate Risk
Cross Currency Swap Notional amount US$20 US$20 US$10 US$50 Average strike rate P47.00 to P57.00 P47.00 to P56.50 P47.00 to P56.50 - Fixed interest rate 4.19% to 5.75% 4.19% to 5.75% 4.19% to 5.75% -
Interest Rate Risk
Interest Rate Collar Notional amount US$15 US$30 US$15 US$60 Interest rate 0.44% to 1.99% 0.44% to 1.99% 0.44% to 1.99% -
Maturity
December 31, 2020 1 Year or Less > 1 Year - 2 Years > 2 Years - 5 Years Total
Foreign Currency Risk
Call Spread Swaps Notional amount US$50 US$50 US$ - US$100 Average strike rate P52.41 to P54.87 P52.41 to P55.02 P - -
Foreign Currency and Interest Rate Risk
Cross Currency Swap Notional amount US$20 US$30 US$30 US$80 Average strike rate P47.00 to 57.00 P47.00 to 56.83 P47.00 to 56.50 - Fixed interest rate 4.19% to 5.75% 4.19% to 5.75% 4.19% to 5.75% -
Interest Rate Risk
Interest Rate Collar Notional amount US$15 US$30 US$45 US$90 Interest rate 0.44% to 1.99% 0.44% to 1.99% 0.44% to 1.99% -
The table below summarizes the amounts pertaining to the designated hedged item.
December 31, 2021
Change in Fair Value Used for
Measuring Hedge
Ineffectiveness Hedging Reserve
Cost of Hedging Reserve
Foreign Currency Risk US dollar-denominated loan (P8) P - P6
Foreign Currency and Interest Rate Risks
US dollar-denominated loan 67 (72) 65
Interest Rate Risks US dollar-denominated loan 4 (3) -
December 31, 2020
Change in Fair Value Used for
Measuring Hedge
Ineffectiveness Hedging Reserve
Cost of Hedging Reserve
Foreign Currency Risk US dollar-denominated loan P85 P - (P40)
Foreign Currency and Interest Rate Risks
US dollar-denominated loan 467 (187) 94
Interest Rate Risks US dollar-denominated loan 28 (20) -
There are no balances remaining in the hedging reserve from hedging relationship for which hedge accounting is no longer applied.
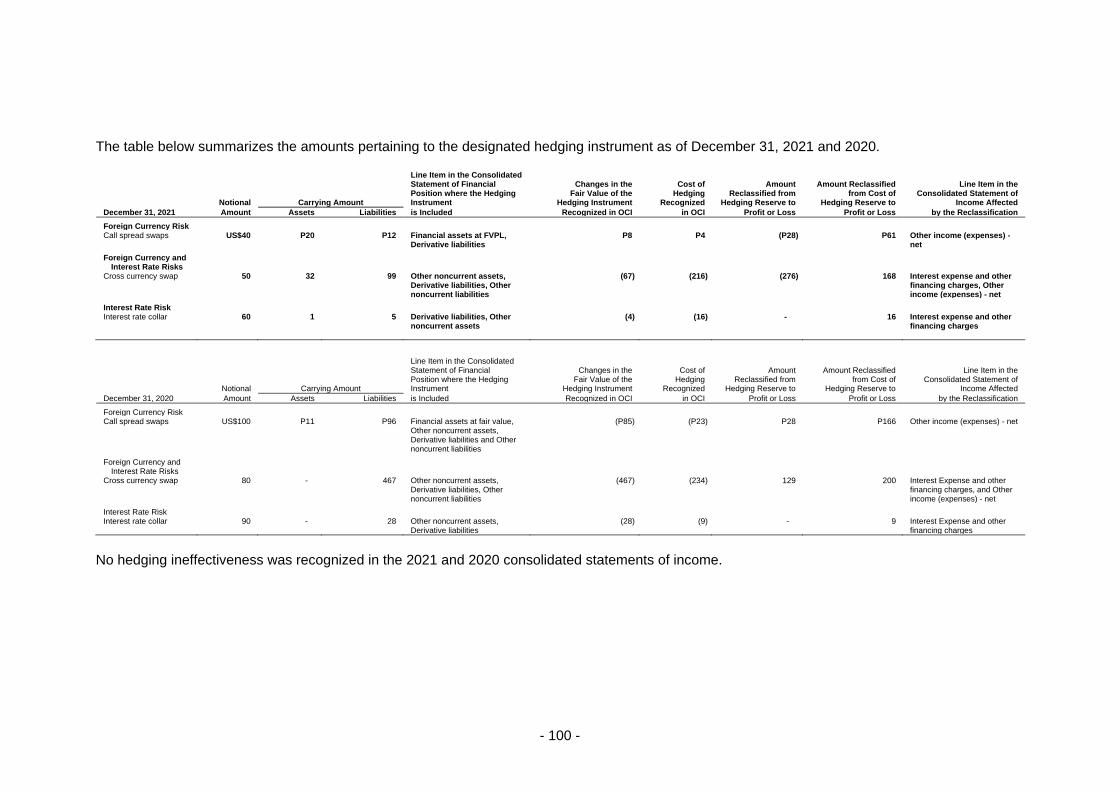
- 100 -
The table below summarizes the amounts pertaining to the designated hedging instrument as of December 31, 2021 and 2020.
Notional Carrying Amount
Line Item in the Consolidated Statement of Financial Position where the Hedging Instrument
Changes in the Fair Value of the
Hedging Instrument
Cost of Hedging
Recognized
Amount Reclassified from
Hedging Reserve to
Amount Reclassified from Cost of
Hedging Reserve to
Line Item in the Consolidated Statement of
Income Affected
December 31, 2021 Amount Assets Liabilities is Included Recognized in OCI in OCI Profit or Loss Profit or Loss by the Reclassification
Foreign Currency Risk Call spread swaps US$40 P20 P12 Financial assets at FVPL,
Derivative liabilities P8 P4 (P28) P61 Other income (expenses) -
net
Foreign Currency and Interest Rate Risks
Cross currency swap 50 32 99 Other noncurrent assets, Derivative liabilities, Other noncurrent liabilities
(67) (216) (276) 168 Interest expense and other financing charges, Other income (expenses) - net
Interest Rate Risk Interest rate collar 60 1 5 Derivative liabilities, Other
noncurrent assets (4) (16) - 16 Interest expense and other
financing charges
Notional Carrying Amount
Line Item in the Consolidated Statement of Financial Position where the Hedging Instrument
Changes in the Fair Value of the
Hedging Instrument
Cost of Hedging
Recognized
Amount Reclassified from
Hedging Reserve to
Amount Reclassified from Cost of
Hedging Reserve to
Line Item in the Consolidated Statement of
Income Affected
December 31, 2020 Amount Assets Liabilities is Included Recognized in OCI in OCI Profit or Loss Profit or Loss by the Reclassification
Foreign Currency Risk Call spread swaps US$100 P11 P96 Financial assets at fair value,
Other noncurrent assets, Derivative liabilities and Other noncurrent liabilities
(P85) (P23) P28 P166 Other income (expenses) - net
Foreign Currency and Interest Rate Risks
Cross currency swap 80 - 467 Other noncurrent assets, Derivative liabilities, Other noncurrent liabilities
(467) (234) 129 200 Interest Expense and other financing charges, and Other income (expenses) - net
Interest Rate Risk Interest rate collar 90 - 28 Other noncurrent assets,
Derivative liabilities (28) (9) - 9 Interest Expense and other
financing charges
No hedging ineffectiveness was recognized in the 2021 and 2020 consolidated statements of income.
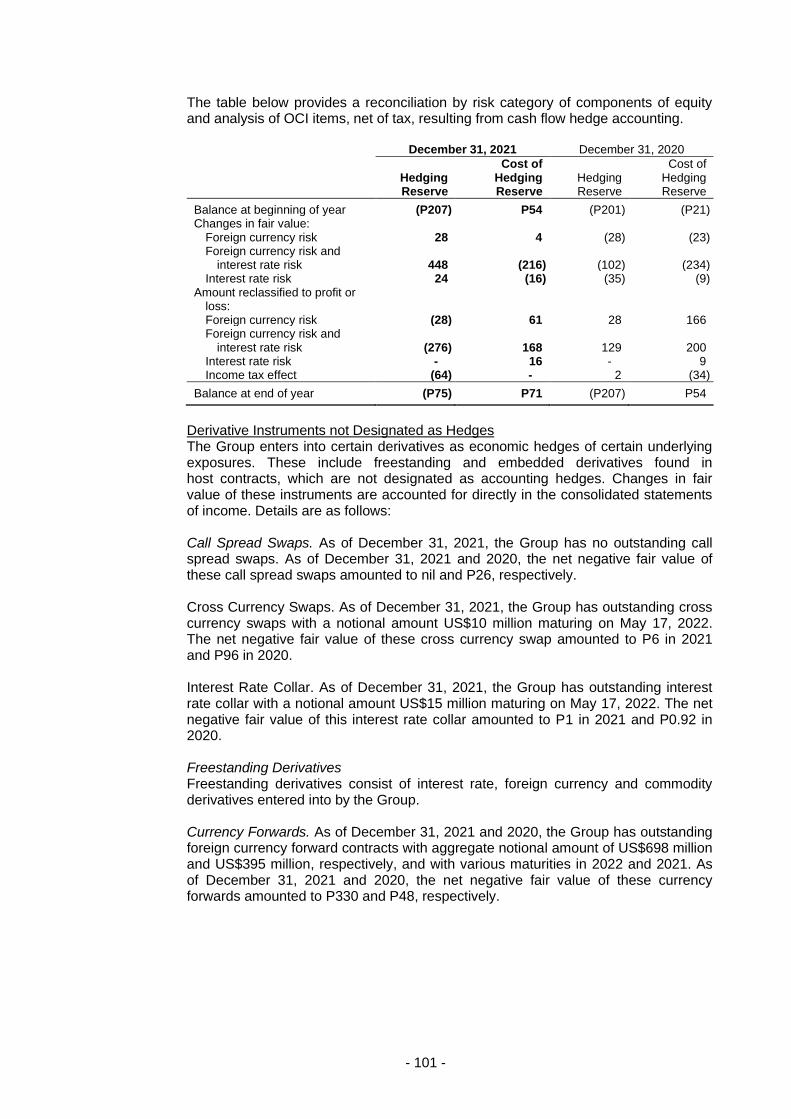
The table below provides a reconciliation by risk category of components of equity and analysis of OCI items, net of tax, resulting from cash flow hedge accounting.
December 31, 2021 December 31, 2020
Hedging Reserve
Cost of Hedging Reserve
Hedging Reserve
Cost of Hedging Reserve
Balance at beginning of year (P207) P54 (P201) (P21) Changes in fair value:
Foreign currency risk 28 4 (28) (23)Foreign currency risk and
interest rate risk 448 (216) (102) (234) Interest rate risk 24 (16) (35) (9)
Amount reclassified to profit or loss: Foreign currency risk (28) 61 28 166 Foreign currency risk and
interest rate risk (276) 168 129 200 Interest rate risk - 16 - 9 Income tax effect (64) - 2 (34)
Balance at end of year (P75) P71 (P207) P54
Derivative Instruments not Designated as Hedges The Group enters into certain derivatives as economic hedges of certain underlying exposures. These include freestanding and embedded derivatives found in host contracts, which are not designated as accounting hedges. Changes in fair value of these instruments are accounted for directly in the consolidated statements of income. Details are as follows:
Call Spread Swaps. As of December 31, 2021, the Group has no outstanding call spread swaps. As of December 31, 2021 and 2020, the net negative fair value of these call spread swaps amounted to nil and P26, respectively.
Cross Currency Swaps. As of December 31, 2021, the Group has outstanding cross currency swaps with a notional amount US$10 million maturing on May 17, 2022. The net negative fair value of these cross currency swap amounted to P6 in 2021 and P96 in 2020.
Interest Rate Collar. As of December 31, 2021, the Group has outstanding interest rate collar with a notional amount US$15 million maturing on May 17, 2022. The net negative fair value of this interest rate collar amounted to P1 in 2021 and P0.92 in 2020.
Freestanding Derivatives Freestanding derivatives consist of interest rate, foreign currency and commodity derivatives entered into by the Group.
Currency Forwards. As of December 31, 2021 and 2020, the Group has outstanding foreign currency forward contracts with aggregate notional amount of US$698 million and US$395 million, respectively, and with various maturities in 2022 and 2021. As of December 31, 2021 and 2020, the net negative fair value of these currency forwards amounted to P330 and P48, respectively.
- 101 -
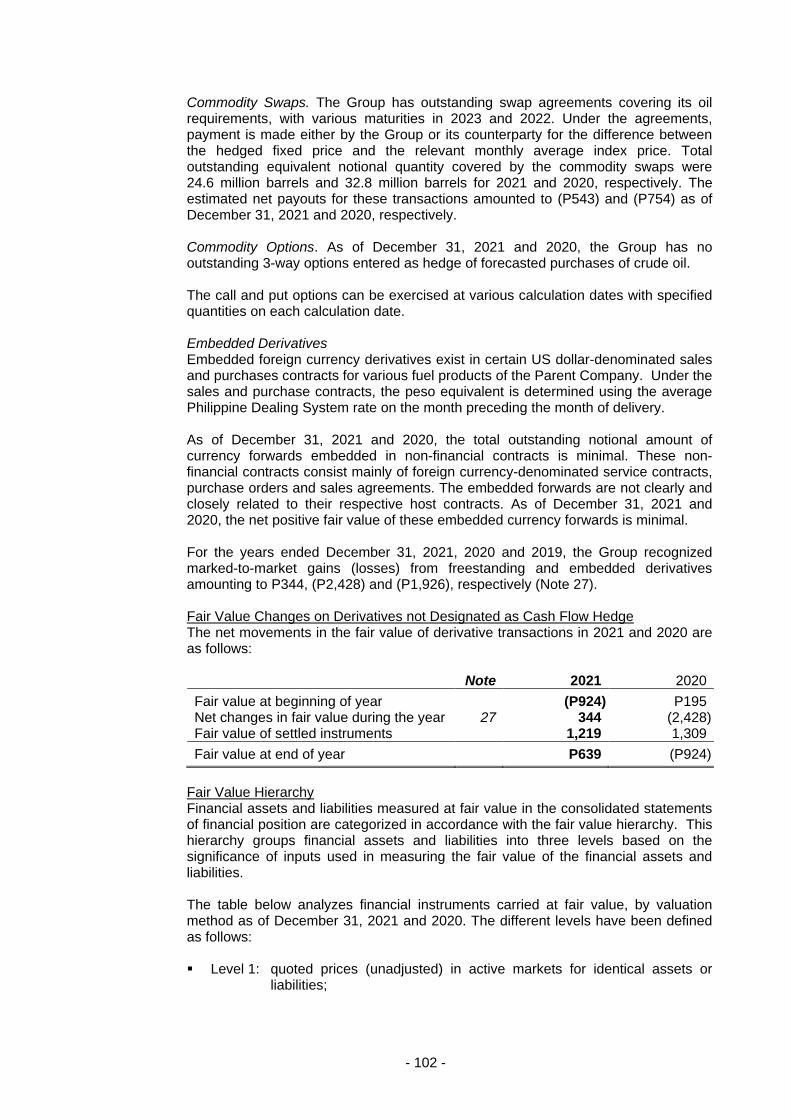
- 102 -
Commodity Swaps. The Group has outstanding swap agreements covering its oil requirements, with various maturities in 2023 and 2022. Under the agreements, payment is made either by the Group or its counterparty for the difference between the hedged fixed price and the relevant monthly average index price. Total outstanding equivalent notional quantity covered by the commodity swaps were 24.6 million barrels and 32.8 million barrels for 2021 and 2020, respectively. The estimated net payouts for these transactions amounted to (P543) and (P754) as of December 31, 2021 and 2020, respectively. Commodity Options. As of December 31, 2021 and 2020, the Group has no outstanding 3-way options entered as hedge of forecasted purchases of crude oil. The call and put options can be exercised at various calculation dates with specified quantities on each calculation date. Embedded Derivatives Embedded foreign currency derivatives exist in certain US dollar-denominated sales and purchases contracts for various fuel products of the Parent Company. Under the sales and purchase contracts, the peso equivalent is determined using the average Philippine Dealing System rate on the month preceding the month of delivery. As of December 31, 2021 and 2020, the total outstanding notional amount of currency forwards embedded in non-financial contracts is minimal. These non-financial contracts consist mainly of foreign currency-denominated service contracts, purchase orders and sales agreements. The embedded forwards are not clearly and closely related to their respective host contracts. As of December 31, 2021 and 2020, the net positive fair value of these embedded currency forwards is minimal. For the years ended December 31, 2021, 2020 and 2019, the Group recognized marked-to-market gains (losses) from freestanding and embedded derivatives amounting to P344, (P2,428) and (P1,926), respectively (Note 27). Fair Value Changes on Derivatives not Designated as Cash Flow Hedge The net movements in the fair value of derivative transactions in 2021 and 2020 are as follows: Note 2021 2020
Fair value at beginning of year (P924) P195 Net changes in fair value during the year 27 344 (2,428) Fair value of settled instruments 1,219 1,309
Fair value at end of year P639 (P924)
Fair Value Hierarchy Financial assets and liabilities measured at fair value in the consolidated statements of financial position are categorized in accordance with the fair value hierarchy. This hierarchy groups financial assets and liabilities into three levels based on the significance of inputs used in measuring the fair value of the financial assets and liabilities. The table below analyzes financial instruments carried at fair value, by valuation method as of December 31, 2021 and 2020. The different levels have been defined as follows: Level 1: quoted prices (unadjusted) in active markets for identical assets or
liabilities;
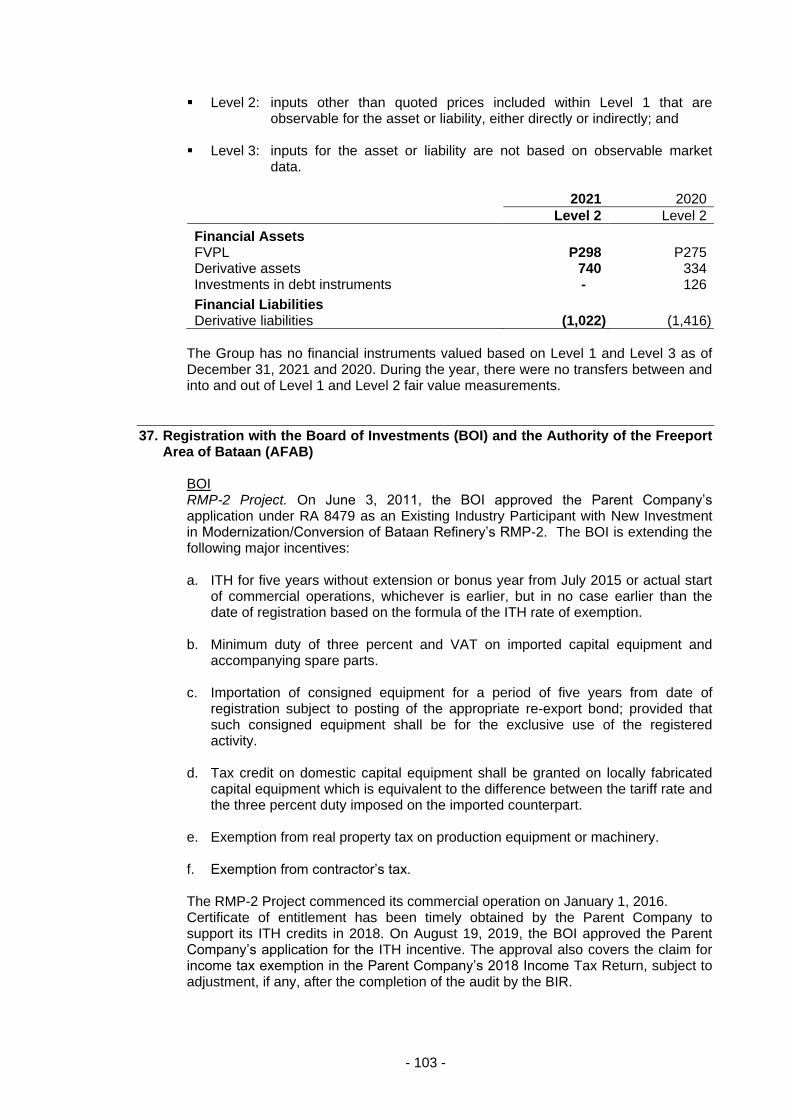
- 103 -
Level 2: inputs other than quoted prices included within Level 1 that are observable for the asset or liability, either directly or indirectly; and
Level 3: inputs for the asset or liability are not based on observable market
data. 2021 2020
Level 2 Level 2
Financial Assets FVPL P298 P275 Derivative assets 740 334 Investments in debt instruments - 126
Financial Liabilities Derivative liabilities (1,022) (1,416)
The Group has no financial instruments valued based on Level 1 and Level 3 as of December 31, 2021 and 2020. During the year, there were no transfers between and into and out of Level 1 and Level 2 fair value measurements.
37. Registration with the Board of Investments (BOI) and the Authority of the Freeport Area of Bataan (AFAB)
BOI RMP-2 Project. On June 3, 2011, the BOI approved the Parent Company’s application under RA 8479 as an Existing Industry Participant with New Investment in Modernization/Conversion of Bataan Refinery’s RMP-2. The BOI is extending the following major incentives: a. ITH for five years without extension or bonus year from July 2015 or actual start
of commercial operations, whichever is earlier, but in no case earlier than the date of registration based on the formula of the ITH rate of exemption.
b. Minimum duty of three percent and VAT on imported capital equipment and
accompanying spare parts. c. Importation of consigned equipment for a period of five years from date of
registration subject to posting of the appropriate re-export bond; provided that such consigned equipment shall be for the exclusive use of the registered activity.
d. Tax credit on domestic capital equipment shall be granted on locally fabricated
capital equipment which is equivalent to the difference between the tariff rate and the three percent duty imposed on the imported counterpart.
e. Exemption from real property tax on production equipment or machinery. f. Exemption from contractor’s tax. The RMP-2 Project commenced its commercial operation on January 1, 2016. Certificate of entitlement has been timely obtained by the Parent Company to support its ITH credits in 2018. On August 19, 2019, the BOI approved the Parent Company’s application for the ITH incentive. The approval also covers the claim for income tax exemption in the Parent Company’s 2018 Income Tax Return, subject to adjustment, if any, after the completion of the audit by the BIR.
- 104 -
The Parent Company did not avail of the ITH in 2020 and 2019. The RMP-2 entitlement period ended in June 2020. AFAB In December 2020, Bataan Refinery was granted approval as a registered enterprise by the AFAB. FAB-registered enterprises are entitled to avail of fiscal incentives under Special Economic Zone Act of 1995 or Omnibus Investment Code of 1987. On December 29, 2021, the Parent Company’s Certificate of Registration was renewed.
38. Segment Information Management identifies segments based on business and geographic locations. These operating segments are monitored and strategic decisions are made on the basis of adjusted segment operating results. The CEO (the chief operating decision maker) reviews management reports on a regular basis. The Group’s major sources of revenues are as follows: a. Sales of petroleum and other related products which include gasoline, diesel and
kerosene offered to motorists and public transport operators through its service station network around the country.
b. Insurance premiums from the business and operation of all kinds of insurance
and reinsurance, on sea as well as on land, of properties, goods and merchandise, of transportation or conveyance, against fire, earthquake, marine perils, accidents and all others forms and lines of insurance authorized by law, except life insurance.
c. Lease of acquired real estate properties and equipment for petroleum, refining,
storage and distribution facilities, gasoline service stations and other related structures.
d. Sales on wholesale or retail and operation of service stations, retail outlets,
restaurants, convenience stores and the like. e. Export sales of various petroleum and non-fuel products to other countries such
as China, Taiwan, Malaysia, South Korea, Singapore, Vietnam, Egypt, Indonesia, Iraq and India.
f. Sale of polypropylene resins to domestic plastic converters of yarn, film and
injection molding grade plastic products. g. Provision of technical information, assistance and advice relating to the uses,
handling and disposition of the products, loaned equipment and the machinery and equipment necessary or appropriate for the customers’ needs.
Revenues are mainly derived from the sale of petroleum products to retail and commercial customers in various geographical locations. The Group has no significant remaining performance obligations as it mainly recognized revenues in amounts that correspond directly to the value of completed performance obligations.
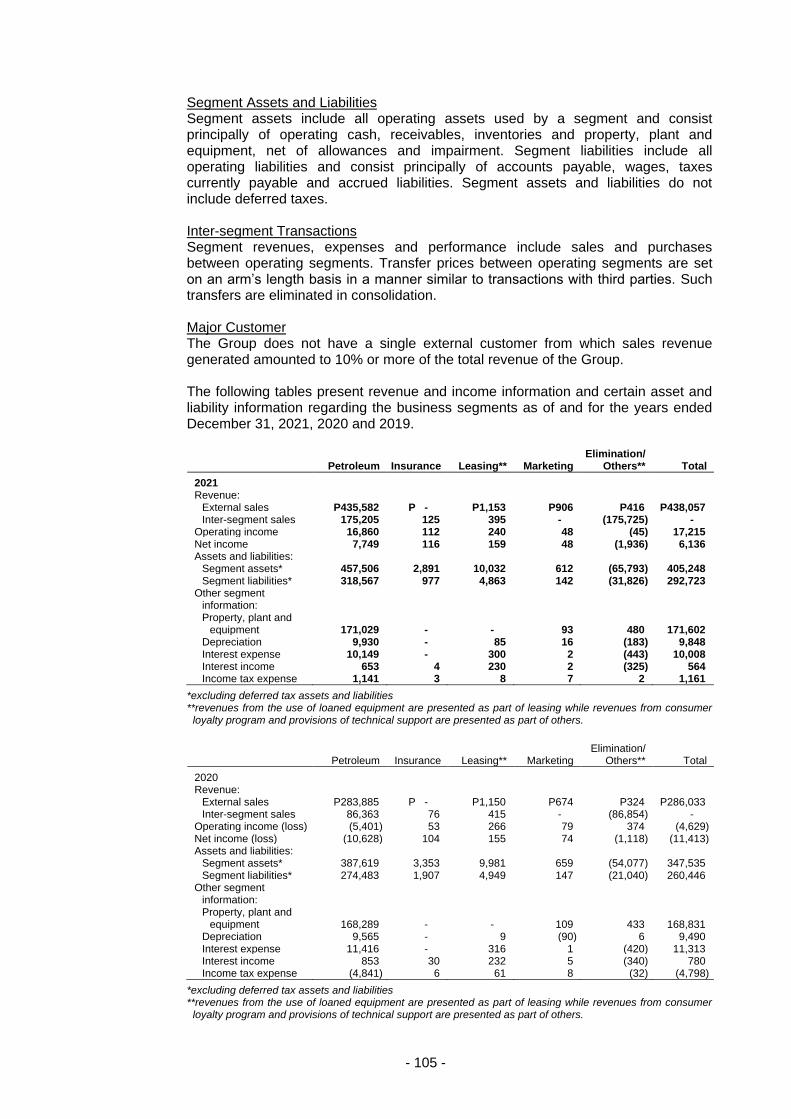
- 105 -
Segment Assets and Liabilities Segment assets include all operating assets used by a segment and consist principally of operating cash, receivables, inventories and property, plant and equipment, net of allowances and impairment. Segment liabilities include all operating liabilities and consist principally of accounts payable, wages, taxes currently payable and accrued liabilities. Segment assets and liabilities do not include deferred taxes. Inter-segment Transactions Segment revenues, expenses and performance include sales and purchases between operating segments. Transfer prices between operating segments are set on an arm’s length basis in a manner similar to transactions with third parties. Such transfers are eliminated in consolidation. Major Customer The Group does not have a single external customer from which sales revenue generated amounted to 10% or more of the total revenue of the Group. The following tables present revenue and income information and certain asset and liability information regarding the business segments as of and for the years ended December 31, 2021, 2020 and 2019.
Petroleum Insurance Leasing** Marketing Elimination/
Others** Total
2021 Revenue:
External sales P435,582 P - P1,153 P906 P416 P438,057 Inter-segment sales 175,205 125 395 - (175,725) -
Operating income 16,860 112 240 48 (45) 17,215 Net income 7,749 116 159 48 (1,936) 6,136 Assets and liabilities:
Segment assets* 457,506 2,891 10,032 612 (65,793) 405,248 Segment liabilities* 318,567 977 4,863 142 (31,826) 292,723
Other segment information: Property, plant and
equipment 171,029 - - 93 480 171,602 Depreciation 9,930 - 85 16 (183) 9,848 Interest expense 10,149 - 300 2 (443) 10,008 Interest income 653 4 230 2 (325) 564 Income tax expense 1,141 3 8 7 2 1,161
*excluding deferred tax assets and liabilities **revenues from the use of loaned equipment are presented as part of leasing while revenues from consumer
loyalty program and provisions of technical support are presented as part of others.
Petroleum Insurance Leasing** Marketing Elimination/
Others** Total
2020 Revenue:
External sales P283,885 P - P1,150 P674 P324 P286,033 Inter-segment sales 86,363 76 415 - (86,854) -
Operating income (loss) (5,401) 53 266 79 374 (4,629) Net income (loss) (10,628) 104 155 74 (1,118) (11,413) Assets and liabilities:
Segment assets* 387,619 3,353 9,981 659 (54,077) 347,535 Segment liabilities* 274,483 1,907 4,949 147 (21,040) 260,446
Other segment information: Property, plant and
equipment 168,289 - - 109 433 168,831 Depreciation 9,565 - 9 (90) 6 9,490 Interest expense 11,416 - 316 1 (420) 11,313 Interest income 853 30 232 5 (340) 780 Income tax expense (4,841) 6 61 8 (32) (4,798)
*excluding deferred tax assets and liabilities **revenues from the use of loaned equipment are presented as part of leasing while revenues from consumer
loyalty program and provisions of technical support are presented as part of others.
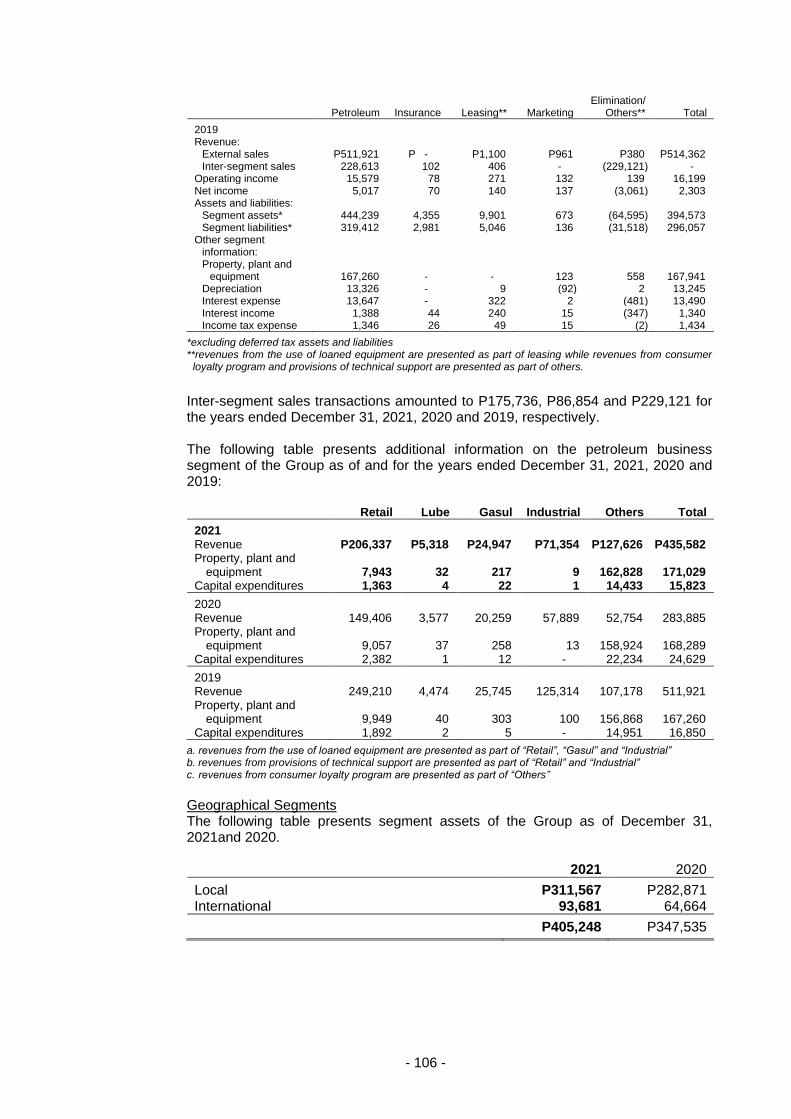
- 106 -
Petroleum Insurance Leasing** Marketing Elimination/
Others** Total
2019 Revenue:
External sales P511,921 P - P1,100 P961 P380 P514,362 Inter-segment sales 228,613 102 406 - (229,121) -
Operating income 15,579 78 271 132 139 16,199 Net income 5,017 70 140 137 (3,061) 2,303 Assets and liabilities:
Segment assets* 444,239 4,355 9,901 673 (64,595) 394,573 Segment liabilities* 319,412 2,981 5,046 136 (31,518) 296,057
Other segment information: Property, plant and
equipment 167,260 - - 123 558 167,941 Depreciation 13,326 - 9 (92) 2 13,245 Interest expense 13,647 - 322 2 (481) 13,490 Interest income 1,388 44 240 15 (347) 1,340 Income tax expense 1,346 26 49 15 (2) 1,434
*excluding deferred tax assets and liabilities **revenues from the use of loaned equipment are presented as part of leasing while revenues from consumer
loyalty program and provisions of technical support are presented as part of others.
Inter-segment sales transactions amounted to P175,736, P86,854 and P229,121 for the years ended December 31, 2021, 2020 and 2019, respectively. The following table presents additional information on the petroleum business segment of the Group as of and for the years ended December 31, 2021, 2020 and 2019:
Retail Lube Gasul Industrial Others Total
2021 Revenue P206,337 P5,318 P24,947 P71,354 P127,626 P435,582 Property, plant and
equipment 7,943 32 217 9 162,828 171,029 Capital expenditures 1,363 4 22 1 14,433 15,823
2020 Revenue 149,406 3,577 20,259 57,889 52,754 283,885 Property, plant and
equipment 9,057 37 258 13 158,924 168,289 Capital expenditures 2,382 1 12 - 22,234 24,629
2019 Revenue 249,210 4,474 25,745 125,314 107,178 511,921 Property, plant and
equipment 9,949 40 303 100 156,868 167,260 Capital expenditures 1,892 2 5 - 14,951 16,850
a. revenues from the use of loaned equipment are presented as part of “Retail”, “Gasul” and “Industrial” b. revenues from provisions of technical support are presented as part of “Retail” and “Industrial” c. revenues from consumer loyalty program are presented as part of “Others”
Geographical Segments The following table presents segment assets of the Group as of December 31, 2021and 2020. 2021 2020
Local P311,567 P282,871 International 93,681 64,664
P405,248 P347,535
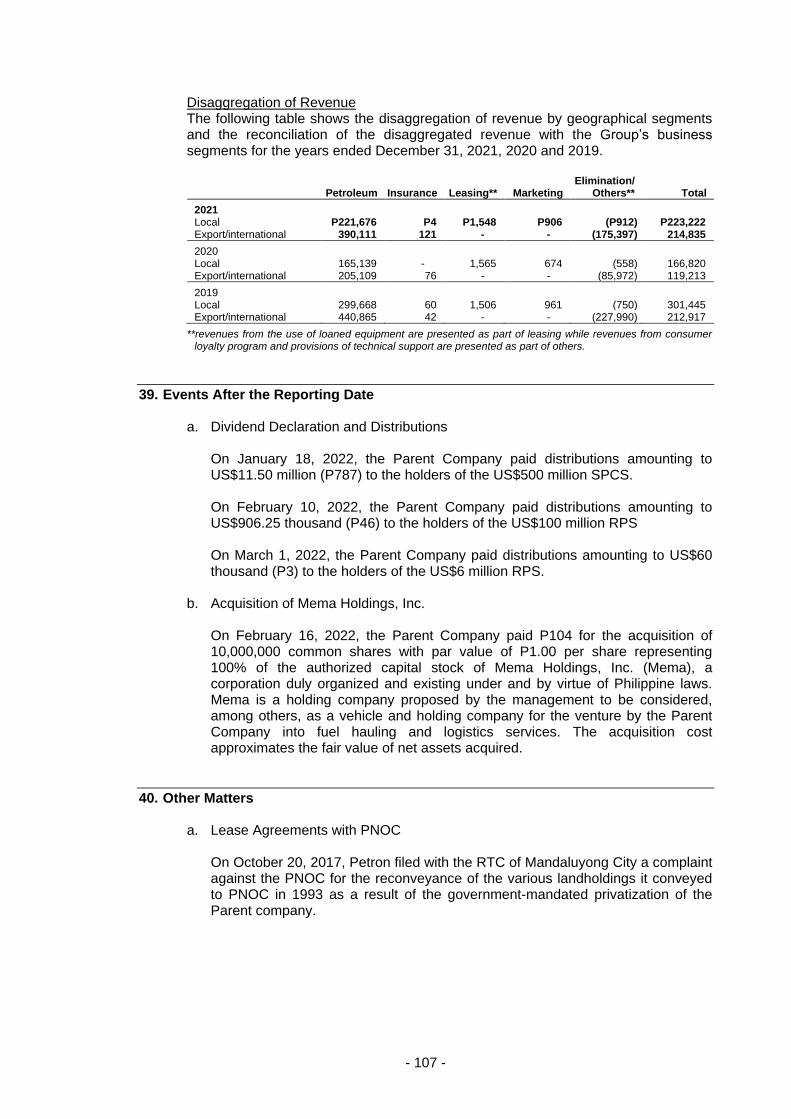
- 107 -
Disaggregation of Revenue The following table shows the disaggregation of revenue by geographical segments and the reconciliation of the disaggregated revenue with the Group’s business segments for the years ended December 31, 2021, 2020 and 2019.
Petroleum Insurance Leasing** Marketing Elimination/
Others** Total
2021 Local P221,676 P4 P1,548 P906 (P912) P223,222 Export/international 390,111 121 - - (175,397) 214,835
2020 Local 165,139 - 1,565 674 (558) 166,820 Export/international 205,109 76 - - (85,972) 119,213
2019 Local 299,668 60 1,506 961 (750) 301,445 Export/international 440,865 42 - - (227,990) 212,917
**revenues from the use of loaned equipment are presented as part of leasing while revenues from consumer loyalty program and provisions of technical support are presented as part of others.
39. Events After the Reporting Date a. Dividend Declaration and Distributions
On January 18, 2022, the Parent Company paid distributions amounting to US$11.50 million (P787) to the holders of the US$500 million SPCS. On February 10, 2022, the Parent Company paid distributions amounting to US$906.25 thousand (P46) to the holders of the US$100 million RPS On March 1, 2022, the Parent Company paid distributions amounting to US$60 thousand (P3) to the holders of the US$6 million RPS.
b. Acquisition of Mema Holdings, Inc. On February 16, 2022, the Parent Company paid P104 for the acquisition of 10,000,000 common shares with par value of P1.00 per share representing 100% of the authorized capital stock of Mema Holdings, Inc. (Mema), a corporation duly organized and existing under and by virtue of Philippine laws. Mema is a holding company proposed by the management to be considered, among others, as a vehicle and holding company for the venture by the Parent Company into fuel hauling and logistics services. The acquisition cost approximates the fair value of net assets acquired.
40. Other Matters a. Lease Agreements with PNOC
On October 20, 2017, Petron filed with the RTC of Mandaluyong City a complaint against the PNOC for the reconveyance of the various landholdings it conveyed to PNOC in 1993 as a result of the government-mandated privatization of the Parent company.
- 108 -
The subject landholdings consist of the refinery lots in Limay, Bataan, 23 bulk plant sites and 66 service station lots located in different parts of the country. The Deeds of Conveyance covering the landholdings provide that the transfer of these lots to PNOC was without prejudice to the continued long-term use by Petron of the conveyed lots for its business operation. Thus, PNOC and the Parent company executed three lease agreements covering the refinery lots, the bulk plants, and the service station sites, all with an initial lease term of 25 years which expired in August 2018, with a provision for automatic renewal for another 25 years. In 2009, the Parent company, through its realty subsidiary, NVRC, had an early renewal of the lease agreement for the refinery lots with an initial lease term of 30 years, renewable for another 25 years. The complaint alleges that PNOC committed a fundamental breach of the lease agreements when it refused to honor both the automatic renewal clause in the lease agreements for the bulk plants and the service station sites and the renewed lease agreement for the refinery lots on the alleged ground that all such lease agreements were grossly disadvantageous to PNOC, a government-owned-and-controlled corporation. On December 11, 2017, the trial court granted Parent company’s prayer for a writ of preliminary injunction, enjoining PNOC from committing any act aimed at ousting the Parent company from possession of the subject properties until the case is decided. The court-mandated mediation was terminated on February 5, 2018 without any agreement between the parties. The judicial dispute resolution proceedings before the court were likewise terminated on March 28, 2019, after the parties failed to agree to a settlement. Without prejudice to any further discussion between the parties regarding settlement, the case was remanded to the trial court for trial proper, with the pre-trial held on September 10, 2019. The Parent company also filed a motion for summary judgment on May 17, 2019. In a resolution dated November 13 2019, the trial court granted the Parent company’s motion for summary judgment and ordered: (i) the rescission of the Deeds of Conveyance dated 1993 relating to the Parent company’s conveyance of such leased premises to PNOC pursuant to a property dividend declaration in 1993, (ii) the reconveyance by PNOC to the Parent company’s of all such properties, and (iii) the payment by the Parent company to PNOC of the amount of P143, with legal interest from 1993, representing the book value of the litigated properties at the time of the property dividend declaration. PNOC filed a motion for reconsideration. The Parent company also filed a motion for partial reconsideration seeking a modification of the judgment to include an order directing PNOC to return to the Parent company all lease payments the latter had paid to PNOC since 1993.
- 109 -
Following the trial court’s denial of their separate motions for reconsideration, both PNOC and Petron filed their respective notices of appeal with the trial court. The case was raffled off to the 5th Division of the Court of Appeals. Petron filed its appellant’s brief in October 2020. PNOC filed its appellant’s brief in November 2020. In a decision dated December 13, 2021, the Court of Appeals dismissed both appeals of Petron and PNOC and affirmed the resolution of the trial court as described above. The Court of Appeals upheld Petron’s position that PNOC committed a substantial breach of its contractual obligation under the lease agreements when it dishonored the automatic renewal clause in the lease agreements and threatened to terminate Petron’s lease thereby depriving Petron a long-term lease consistent with its business requirements, which was the primordial consideration in the Deeds of Conveyance. The Court of Appeals ruled, however, that, consistent with jurisprudence, while rescission repeals the contract from its inception, it does not disregard all the consequences that the contract has created and that it was therefore only proper that Petron paid PNOC the rentals for the use and enjoyment of the properties which PNOC could have enjoyed by virtue of the Deeds of Conveyance were it not for the lease agreements. On January 11, 2022, Petron filed its motion for reconsideration insofar as the decision dismissed the Petron’s appeal to return the lease payments made by it to PNOC. PNOC also filed its own motion for reconsideration. The parties await the order of the Court of Appeals on the motions filed.
b. Swakaya Dispute
In 2015, a disputed trade receivable balance of RM25 (P307) in favor of POMSB was reclassified to long-term receivables. The dispute arose from the supply by POMSB of diesel to Swakaya. In 2013, POMSB entered into an agreement to supply diesel to Swakaya who subsequently sold the product to an operator of power plants in Sabah. In 2013, due to a government investigation, Swakaya’s bank accounts were frozen which affected its ability to supply the power plants. Swakaya and the power plants operator agreed to ask POMSB to supply the power plants operator directly and, correspondingly, pay POMSB directly. Unknown to POMSB, Swakaya had a financing arrangement with Sabah Development Bank (SDB) which obligated the power plants operator to remit to SDB payments due to Swakaya. Due to some administrative issues, the moneys due to POMSB were remitted by power plants operator into a joint Swakaya/SDB Bank account. Despite SDB’s earlier promise to remit the moneys to POMSB once it is established that the payment was indeed for a direct supply to the power plants operator, SDB subsequently refused and set off the moneys against Swakaya’s debt to the bank. The sum involved was RM25 (P307). POMSB sued Swakaya and SDB before the Kota Kinabalu High Court for, among others, breach of trust. Swakaya did not appear in court and judgment was awarded in favor of POMSB and against Swakaya. In April 2016, the Kota Kinabalu High Court ruled in favor of POMSB and a judgment sum inclusive of interest amounting to RM28 (P343) was deposited to its solicitor account in August 2016. SDB subsequently filed an appeal to Court of Appeal.
- 110 -
In May 2017, the Court of Appeal re-affirmed the decision of the Kota Kinabalu High Court and dismissed SDB’s appeal with costs RM0.015 (P0.20) awarded to POMSB. In June 2017, SDB filed a Notice of Motion for leave to appeal to the Federal Court against the decision of the Court of Appeal, which was granted in April 2018. After hearing the appeal, in February 2020, the Federal Court allowed the appeal by SDB and set aside the Court of Appeal’s decision. POMSB filed an application for a review by the Federal Court (to set aside its own decision). On August 2, 2021, the Federal Court disallowed the review. No further action was taken by POMSB and the decision of the Federal Court has attained finality. Considering the length of time of litigation matters, a discount of RM8 (P95) was computed based on the original effective interest rate. Part of the discount, amounting to RM2 (P20) was unwound in 2019 and recognized as interest income. The balance amounting to RM23 (P282) was provided full impairment in 2019.
c. Oil Spill Incident in Guimaras On August 11, 2006, MT Solar I, a third party vessel contracted by the Parent company to transport approximately two million liters of industrial fuel oil, sank 13 nautical miles southwest of Guimaras, an island province in the Western Visayas region of the Philippines. In separate investigations by the Philippine Department of Justice (DOJ) and the Special Board of Marine Inquiry (SBMI), both agencies found the owners of MT Solar I liable. The DOJ found the Parent company not criminally liable, but the SBMI found the Parent company to have overloaded the vessel. Parent company has appealed the findings of the SBMI to the DOTr and is awaiting its resolution. Parent company believes that SBMI can impose administrative penalties on vessel owners and crew, but has no authority to penalize other parties, such as Petron, which are charterers. Other complaints for non-payment of compensation for the clean-up operations during the oil spill were filed with the RTC of Guimaras by a total of 1,063 plaintiffs who allegedly did not receive any payment of their claims for damages arising from the oil spill. The total claims amounted to P292. The cases were pending as at December 31, 2021. In the course of plaintiffs’ presentation of evidence, they moved for trial by commissioner, which was denied by the trial court. The plaintiffs elevated the matter by way of a petition for certiorari to the Court of Appeals in Cebu City (CA). On January 9, 2020, the CA issued a Resolution granting plaintiffs’ motion for reconsideration of the earlier resolution denying their petition and ordering the Parent Company to file its comment on plaintiffs’ petition within 10 days. On February 6, 2020, the Parent Company filed a motion for reconsideration of said Resolution which remains pending to date. In the meantime, proceedings before the trial court continues. Less than 200 of the plaintiffs have testified so far.
d. Effect of COVID-19 Since the start of the global pandemic, the Group, being engaged in the fuel business, has been affected by the implementation of Enhanced Community Quarantine (ECQ) in the National Capital Region and other key cities in the Philippines and Movement Control Order (MCO) in Malaysia. The reduced economic activities and travel restrictions due to lockdowns in many countries significantly affected volumes of both the Philippine and Malaysia operations.
- 111 -
Global oil prices began to plunge in March 2020 as the price war among top oil producing countries was worsened by the demand destruction caused by the COVID-19 pandemic. Dubai crude plunged from US$64/bbl in January to US$20/bbl in April, posting record low levels in 26 years, which resulted in successive rollbacks in pump prices and reflected in the substantial net loss of the Group in 2020. With Organization of Petroleum Exporting Countries (OPEC) and Russia agreeing to output cuts, recovery in oil prices was seen starting May 2020. From then on international oil prices began to climb steadily. Dubai averaged to about $71/bbl in 2021 as against $42/bbl in 2020. The gradual opening-up of economies and easing up of pandemic restrictions especially in the West alongside robust vaccination efforts around the world contributed much to the recovery of demand to reach pre-pandemic level by the 4th quarter of 2021. On the supply-side, consistent effort of oil producing countries to manage supply also supported the escalation in oil prices amidst some resurgences in COVID-19 cases from new variants. The Group saw fuel consumption began to pick up as shown by the gradual improvement in the Philippine’s domestic sales volume in 2021 compared to 2020. However, the prolonged full MCO in Malaysia slightly weighed down volume recovery in the 2nd half of 2021. The Group’s consolidated revenues in 2021 rose by more than half to P438,057. Combined with improvement in refining margins, this resulted in modest net income in 2021 of P6,136, a reversal of P11,413 net loss in 2020. The extent to which the COVID-19 pandemic will continue to impact the Group will depend on future developments, including the timeliness and effectiveness of actions taken or not taken to contain and mitigate the effects of COVID-19 both in the Philippines and internationally by governments, central banks, healthcare providers, health system participants, other businesses and individuals, which are highly uncertain and cannot be predicted.
e. Impact of Ukraine - Russia Conflict In relation to the ongoing conflict between Russia and Ukraine of which changes in economic conditions developed as a consequence of the Russian invasion of Ukraine in February 2022 and the resulting economic sanctions by the international community, Petron currently does not foresee issues on its oil supply on a short or medium-term basis as Petron does not have term crude supply contracts with Russia. The Company primarily sources its crude requirement from the Middle East. However, based on recent events and market sentiments, oil prices are expected to be high during the crisis and in the event of a protracted conflict, oil supply could become tight. The extent to which the ongoing conflict will affect the Group will depend on future developments, including the actions and decisions taken or not taken by the OPEC and other oil producing countries, international community, and the Philippine government which are highly uncertain and cannot be quantified nor determined at this point.
- 112 -
f. Construction of Coco-Methyl Ester Plant On November 24, 2021, the Executive Committee of the BOD of the Parent Company approved the construction of a coco-methyl ester plant (the “CME Plant”) with an initial but expandable capacity of 60 million liters per year, enough to meet the Parent Company’s current requirements at 2% CME blend. The CME Plant will serve the Parent Company’s CME requirements for bio-diesel sales. With a projected cost of P1,200, the CME Plant will be located in and integrated with the Refinery to leverage on the Bataan Refinery’s support facilities, minimize freight costs, and benefit from the tax incentives granted by the AFAB. Completion and operation are targeted within two (2) years with commercial operations beginning 2024.
g. Other Proceedings The Group is also a party to certain other proceedings arising out of the ordinary course of its business, including legal proceedings with respect to tax, regulatory and other matters. While the results of litigation cannot be predicted with certainty, management believes that the final outcome of these other proceedings will not have a material adverse effect on the Group’s business financial condition or results of operations.
h. The Group has unused letters of credit totaling approximately P52,251 and
P14,847 as of December 31, 2021 and 2020, respectively.
PETRON CORPORATION AND SUBSIDIARIES
INDEX TO SUPPLEMENTARY SCHEDULES DECEMBER 31, 2021
Statement of Management’s Responsibility for the Consolidated Financial
Statements Report of Independent Auditors on Supplementary Information Filed Separately
from the Consolidated Financial Statements Supplementary Schedules to the Consolidated Financial Statements Supplementary Schedules of Annex 68 - J Page No.
A. Financial Assets NA(a)
B. Amounts Receivable from Directors, Officers, Employees, Related Parties, and Principal Stockholders (Other than Related Parties)
NA(b)
C. Amounts Receivable and Payable from Related Parties which are Eliminated during the Consolidation of Financial Statements
1 - 2
D. Long-term Debt 3
E. Indebtedness to Related Parties NA
F. Guarantees of Securities of Other Issuers NA
G. Capital Stock 4 (a)Balance of Financial Assets at Fair Value Through Profit or Loss is less than 5% of total current assets. (b)Balance of account is less than 1% of the total assets of the Group and no individually significant advances over
P100,000.
Map of the Conglomerate within which the Group belongs Financial Soundness Indicators Schedule of Proceeds from Recent Offering of Securities Report on Independent Auditors on Supplementary Information Filed Separately
from the Separate Financial Statements Reconciliation of Parent Company’s Retained Earnings Available for Dividend Declaration
R.G. Manabat & Co. The KPMG Center, 6/F
6787 Ayala Avenue, Makati City Philippines 1209
Telephone +63 (2) 8885 7000
Fax +63 (2) 8894 1985
Internet www.home.kpmg/ph Email [email protected]
Firm Regulatory Registration & Accreditation: PRC-BOA Registration No. 0003, valid until November 21, 2023 SEC Accreditation No. 0003-SEC, Group A, valid for five (5) years covering the audit of 2020 to 2024 financial statements (2019 financial statements are covered by SEC Accreditation No. 0004-FR-5) IC Accreditation No. 0003-IC, Group A, valid for five (5) years covering the audit of 2020 to 2024 financial statements (2019 financial statements are covered by IC Circular Letter (CL) No. 2019-39, Transition clause) BSP Accreditation No. 0003-BSP, Group A, valid for five (5) years covering the audit of 2020 to 2024 financial statements (2019 financial statements are covered by BSP Monetary Board Resolution No. 2161, Transition clause)
R.G. Manabat & Co., a Philippine partnership and a member firm of the KPMG global organization of independent member firms
affiliated with KPMG International Limited, a private English company limited by guarantee
REPORT OF INDEPENDENT AUDITORS ON SUPPLEMENTARY INFORMATION The Board of Directors and Stockholders Petron Corporation SMC Head Office Complex 40 San Miguel Avenue Mandaluyong City We have audited in accordance with Philippine Standards on Auditing, the consolidated financial statements of Petron Corporation and Subsidiaries (the “Group”) as at December 31, 2021 and 2020 and for each of the three years in the period ended December 31, 2021, and have issued our report thereon dated March 18, 2022. Our audits were made for the purpose of forming an opinion on the consolidated financial statements of the Group taken as a whole. The supplementary information included in the following schedules are the responsibility of the Group’s management:
Supplementary Schedules of Annex 68-J Map of the Conglomerate
These supplementary information are presented for purposes of complying with the Revised Securities Regulation Code Rule 68, and are not required parts of the consolidated financial statements. Such supplementary information have been subjected to the auditing procedures applied in the audits of the consolidated financial statements and, in our opinion, are fairly stated, in all material respects, in relation to the consolidated financial statements taken as a whole. R.G. MANABAT & CO. DARWIN P. VIROCEL Partner CPA License No. 0094495 SEC Accreditation No. 94495-SEC, Group A, valid for five (5) years covering the audit of 2019 to 2023 financial statements Tax Identification No. 912-535-864 BIR Accreditation No. 08-001987-031-2019 Issued August 7, 2019; valid until August 6, 2022 PTR No. MKT 8854088 Issued January 3, 2022 at Makati City March 18, 2022 Makati City, Metro Manila
R.G. Manabat & Co. The KPMG Center, 6/F
6787 Ayala Avenue, Makati City Philippines 1209
Telephone +63 (2) 8885 7000
Fax +63 (2) 8894 1985
Internet www.home.kpmg/ph Email [email protected]
Firm Regulatory Registration & Accreditation: PRC-BOA Registration No. 0003, valid until November 21, 2023 SEC Accreditation No. 0003-SEC, Group A, valid for five (5) years covering the audit of 2020 to 2024 financial statements (2019 financial statements are covered by SEC Accreditation No. 0004-FR-5) IC Accreditation No. 0003-IC, Group A, valid for five (5) years covering the audit of 2020 to 2024 financial statements (2019 financial statements are covered by IC Circular Letter (CL) No. 2019-39, Transition clause) BSP Accreditation No. 0003-BSP, Group A, valid for five (5) years covering the audit of 2020 to 2024 financial statements (2019 financial statements are covered by BSP Monetary Board Resolution No. 2161, Transition clause)
R.G. Manabat & Co., a Philippine partnership and a member firm of the KPMG global organization of independent member firms
affiliated with KPMG International Limited, a private English company limited by guarantee
REPORT OF INDEPENDENT AUDITORS ON COMPONENTS OF FINANCIAL SOUNDNESS INDICATORS The Board of Directors and Stockholders Petron Corporation SMC Head Office Complex 40 San Miguel Avenue Mandaluyong City We have audited in accordance with Philippine Standards on Auditing, the consolidated financial statements of Petron Corporation and Subsidiaries (the “Group”) as at December 31, 2021 and 2020 and for each of the three years in the period ended December 31, 2021, and have issued our report thereon dated March 18, 2022. Our audits were made for the purpose of forming an opinion on the consolidated financial statements taken as a whole. The Supplementary Schedule of Financial Soundness Indicators, including their definitions, formulas and calculations, is the responsibility of the Group’s management. These financial soundness indicators are not measures of operating performance defined by Philippine Financial Reporting Standards (PFRS) and may not be comparable to similarly titled measures presented by other companies. This schedule is presented for the purpose of complying with the Revised Securities Regulation Code Rule 68 issued by the Securities and Exchange Commission, and is not a required part of the consolidated financial statements prepared in accordance with PFRS. The components of these financial soundness indicators have been traced to the Group’s consolidated financial statements as at December 31, 2021 and 2020 and for each of the three years in the period ended December 31, 2021 and no material exceptions were noted. R.G. MANABAT & CO. DARWIN P. VIROCEL Partner CPA License No. 0094495 SEC Accreditation No. 94495-SEC, Group A, valid for five (5) years covering the audit of 2019 to 2023 financial statements Tax Identification No. 912-535-864 BIR Accreditation No. 08-001987-031-2019 Issued August 7, 2019; valid until August 6, 2022 PTR No. MKT 8854088 Issued January 3, 2022 at Makati City March 18, 2022 Makati City, Metro Manila
R.G. Manabat & Co. The KPMG Center, 6/F
6787 Ayala Avenue, Makati City Philippines 1209
Telephone +63 (2) 8885 7000
Fax +63 (2) 8894 1985
Internet www.home.kpmg/ph Email [email protected]
Firm Regulatory Registration & Accreditation: PRC-BOA Registration No. 0003, valid until November 21, 2023 SEC Accreditation No. 0003-SEC, Group A, valid for five (5) years covering the audit of 2020 to 2024 financial statements (2019 financial statements are covered by SEC Accreditation No. 0004-FR-5) IC Accreditation No. 0003-IC, Group A, valid for five (5) years covering the audit of 2020 to 2024 financial statements (2019 financial statements are covered by IC Circular Letter (CL) No. 2019-39, Transition clause) BSP Accreditation No. 0003-BSP, Group A, valid for five (5) years covering the audit of 2020 to 2024 financial statements (2019 financial statements are covered by BSP Monetary Board Resolution No. 2161, Transition clause)
R.G. Manabat & Co., a Philippine partnership and a member firm of the KPMG global organization of independent member firms
affiliated with KPMG International Limited, a private English company limited by guarantee
REPORT OF INDEPENDENT AUDITORS ON SUPPLEMENTARY INFORMATION The Board of Directors and Stockholders Petron Corporation SMC Head Office Complex 40 San Miguel Avenue Mandaluyong City We have audited, in accordance with Philippine Standards on Auditing, the separate financial statements of Petron Corporation (the “Company”) as at and for the years ended December 31, 2021 and 2020, and have issued our report thereon dated March 18, 2022. Our audits were made for the purpose of forming an opinion on the separate financial statements taken as a whole. The supplementary information included in the Reconciliation of Retained Earnings Available for Dividend Declaration is the responsibility of the Company’s management.
This supplementary information is presented for purposes of complying with the Revised Securities Regulation Code Rule 68, and is not a required part of the separate financial statements. Such supplementary information has been subjected to the auditing procedures applied in the audits of the separate financial statements and, in our opinion, is fairly stated, in all material respects, in relation to the separate financial statements taken as a whole. R.G. MANABAT & CO. DARWIN P. VIROCEL Partner CPA License No. 0094495 SEC Accreditation No. 94495-SEC, Group A, valid for five (5) years covering the audit of 2019 to 2023 financial statements Tax Identification No. 912-535-864 BIR Accreditation No. 08-001987-031-2019 Issued August 7, 2019; valid until August 6, 2022 PTR No. MKT 8854088 Issued January 3, 2022 at Makati City March 18, 2022 Makati City, Metro Manila
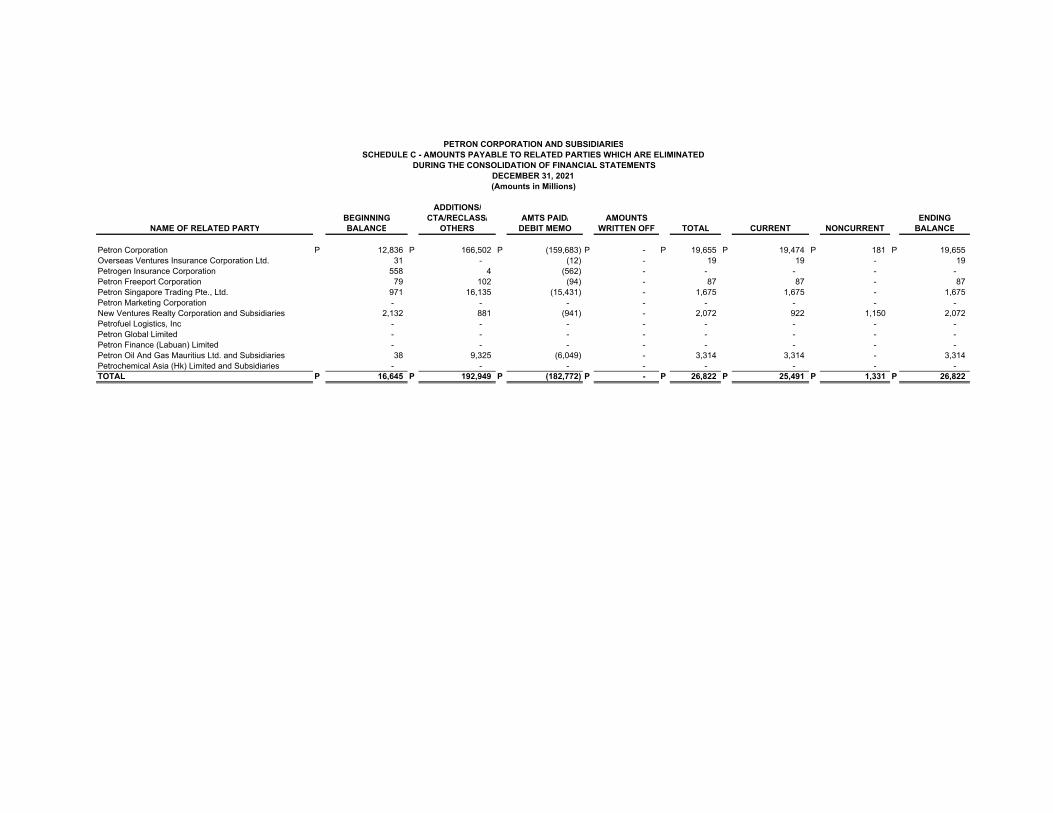
ADDITIONS/BEGINNING CTA/RECLASS/ AMTS PAID/ AMOUNTS ENDING
NAME OF RELATED PARTY BALANCE OTHERS DEBIT MEMO WRITTEN OFF TOTAL CURRENT NONCURRENT BALANCE
Petron Corporation P 12,836 P 166,502 P (159,683) P - P 19,655 P 19,474 P 181 P 19,655 Overseas Ventures Insurance Corporation Ltd. 31 - (12) - 19 19 - 19 Petrogen Insurance Corporation 558 4 (562) - - - - - Petron Freeport Corporation 79 102 (94) - 87 87 - 87 Petron Singapore Trading Pte., Ltd. 971 16,135 (15,431) - 1,675 1,675 - 1,675 Petron Marketing Corporation - - - - - - - - New Ventures Realty Corporation and Subsidiaries 2,132 881 (941) - 2,072 922 1,150 2,072 Petrofuel Logistics, Inc - - - - - - - - Petron Global Limited - - - - - - - - Petron Finance (Labuan) Limited - - - - - - - - Petron Oil And Gas Mauritius Ltd. and Subsidiaries 38 9,325 (6,049) - 3,314 3,314 - 3,314 Petrochemical Asia (Hk) Limited and Subsidiaries - - - - - - - - TOTAL P 16,645 P 192,949 P (182,772) P - P 26,822 P 25,491 P 1,331 P 26,822
PETRON CORPORATION AND SUBSIDIARIESSCHEDULE C - AMOUNTS PAYABLE TO RELATED PARTIES WHICH ARE ELIMINATED
DURING THE CONSOLIDATION OF FINANCIAL STATEMENTSDECEMBER 31, 2021(Amounts in Millions)
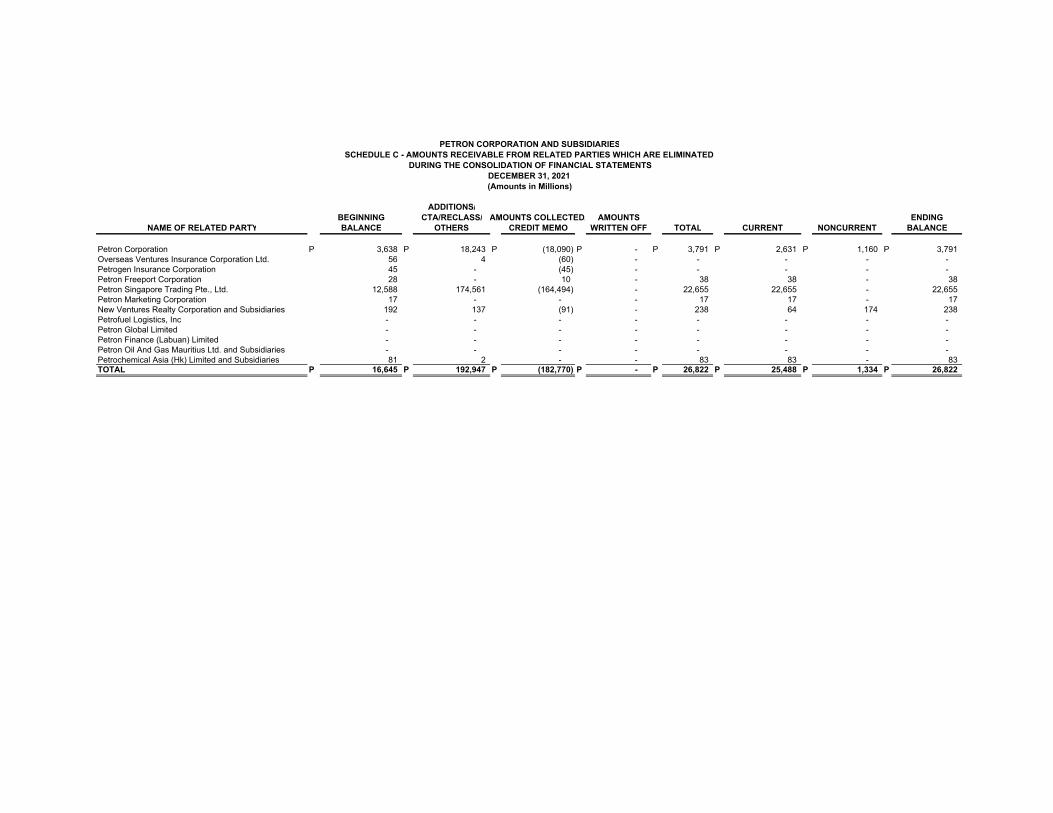
ADDITIONS/BEGINNING CTA/RECLASS/ AMOUNTS COLLECTED/ AMOUNTS ENDING
NAME OF RELATED PARTY BALANCE OTHERS CREDIT MEMO WRITTEN OFF TOTAL CURRENT NONCURRENT BALANCE
Petron Corporation P 3,638 P 18,243 P (18,090) P - P 3,791 P 2,631 P 1,160 P 3,791 Overseas Ventures Insurance Corporation Ltd. 56 4 (60) - - - - - Petrogen Insurance Corporation 45 - (45) - - - - - Petron Freeport Corporation 28 - 10 - 38 38 - 38 Petron Singapore Trading Pte., Ltd. 12,588 174,561 (164,494) - 22,655 22,655 - 22,655 Petron Marketing Corporation 17 - - - 17 17 - 17 New Ventures Realty Corporation and Subsidiaries 192 137 (91) - 238 64 174 238 Petrofuel Logistics, Inc - - - - - - - - Petron Global Limited - - - - - - - - Petron Finance (Labuan) Limited - - - - - - - - Petron Oil And Gas Mauritius Ltd. and Subsidiaries - - - - - - - - Petrochemical Asia (Hk) Limited and Subsidiaries 81 2 - - 83 83 - 83 TOTAL P 16,645 P 192,947 P (182,770) P - P 26,822 P 25,488 P 1,334 P 26,822
PETRON CORPORATION AND SUBSIDIARIESSCHEDULE C - AMOUNTS RECEIVABLE FROM RELATED PARTIES WHICH ARE ELIMINATED
DURING THE CONSOLIDATION OF FINANCIAL STATEMENTSDECEMBER 31, 2021(Amounts in Millions)
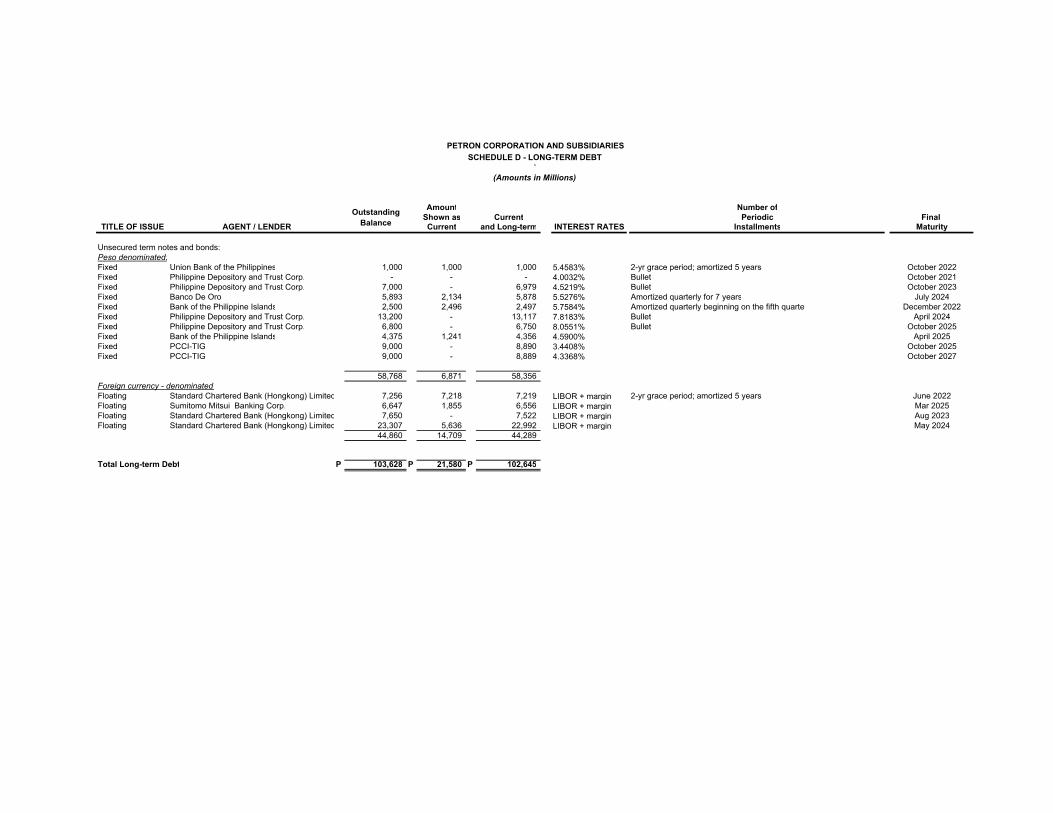
Amount Number ofShown as Current Periodic Final
AGENT / LENDER Current and Long-term INTEREST RATES Installments Maturity
Unsecured term notes and bonds:Peso denominated:Fixed Union Bank of the Philippines 1,000 1,000 1,000 5.4583% 2-yr grace period; amortized 5 years October 2022Fixed Philippine Depository and Trust Corp. - - - 4.0032% Bullet October 2021Fixed Philippine Depository and Trust Corp. 7,000 - 6,979 4.5219% Bullet October 2023Fixed Banco De Oro 5,893 2,134 5,878 5.5276% Amortized quarterly for 7 years July 2024Fixed Bank of the Philippine Islands 2,500 2,496 2,497 5.7584% Amortized quarterly beginning on the fifth quarter December 2022Fixed Philippine Depository and Trust Corp. 13,200 - 13,117 7.8183% Bullet April 2024Fixed Philippine Depository and Trust Corp. 6,800 - 6,750 8.0551% Bullet October 2025Fixed Bank of the Philippine Islands 4,375 1,241 4,356 4.5900% April 2025Fixed PCCI-TIG 9,000 - 8,890 3.4408% October 2025Fixed PCCI-TIG 9,000 - 8,889 4.3368% October 2027
58,768 6,871 58,356 Foreign currency - denominated Floating Standard Chartered Bank (Hongkong) Limited 7,256 7,218 7,219 LIBOR + margin 2-yr grace period; amortized 5 years June 2022Floating Sumitomo Mitsui Banking Corp. 6,647 1,855 6,556 LIBOR + margin Mar 2025Floating Standard Chartered Bank (Hongkong) Limited 7,650 - 7,522 LIBOR + margin Aug 2023Floating Standard Chartered Bank (Hongkong) Limited 23,307 5,636 22,992 LIBOR + margin May 2024
44,860 14,709 44,289
Total Long-term Debt P 103,628 P 21,580 P 102,645
PETRON CORPORATION AND SUBSIDIARIESSCHEDULE D - LONG-TERM DEBT
`(Amounts in Millions)
Outstanding BalanceTITLE OF ISSUE
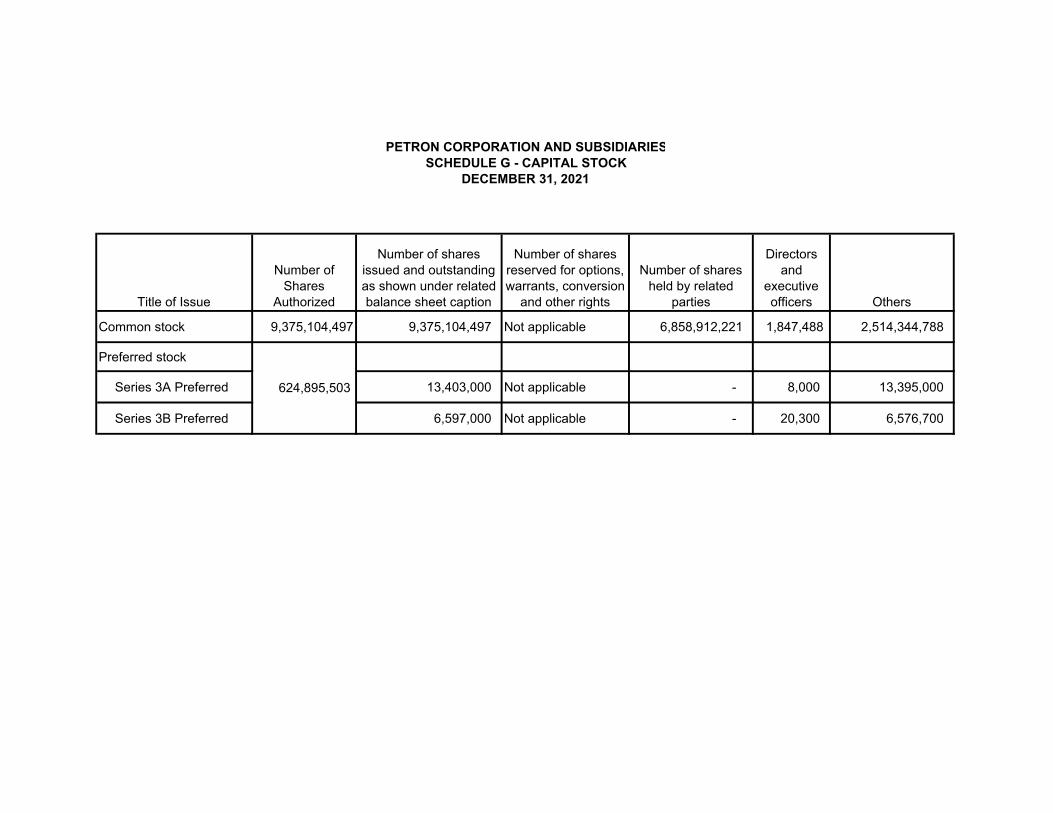
Title of Issue
Number of Shares
Authorized
Number of shares issued and outstanding as shown under related balance sheet caption
Number of shares reserved for options, warrants, conversion
and other rights
Number of shares held by related
parties
Directors and
executive officers Others
Common stock 9,375,104,497 9,375,104,497 Not applicable 6,858,912,221 1,847,488 2,514,344,788
Preferred stock
Series 3A Preferred 13,403,000 Not applicable - 8,000 13,395,000
Series 3B Preferred 6,597,000 Not applicable - 20,300 6,576,700
PETRON CORPORATION AND SUBSIDIARIESSCHEDULE G - CAPITAL STOCK
DECEMBER 31, 2021
624,895,503
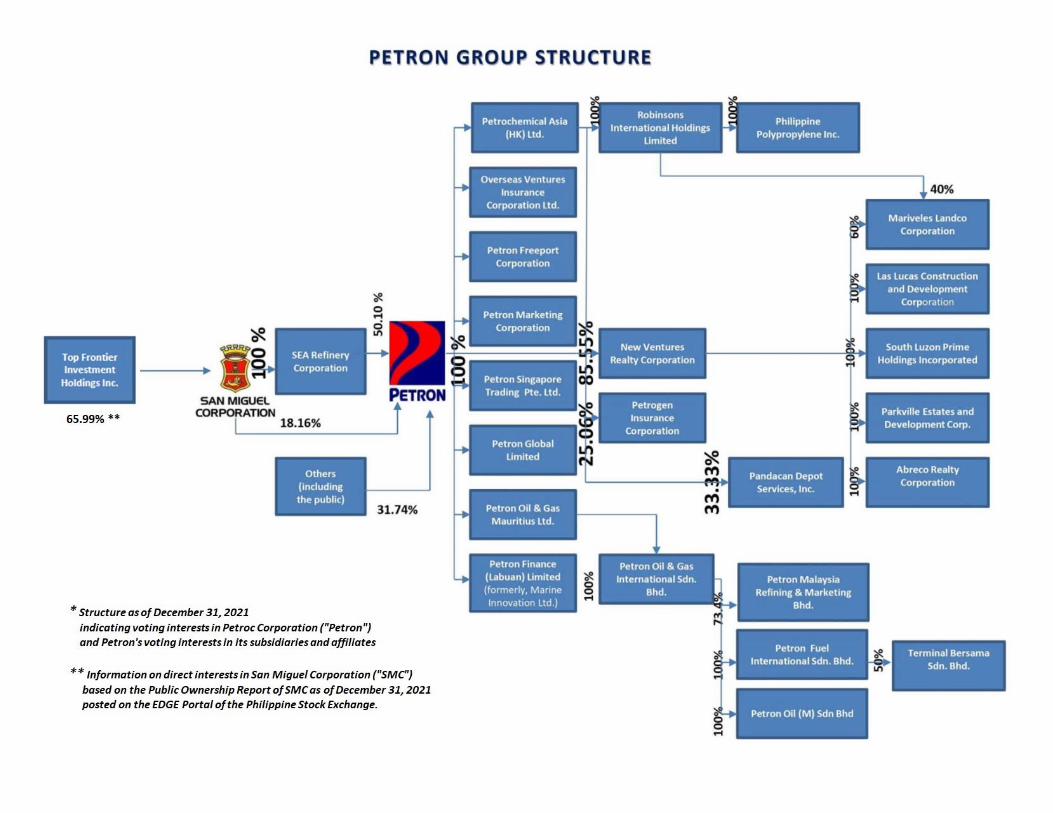
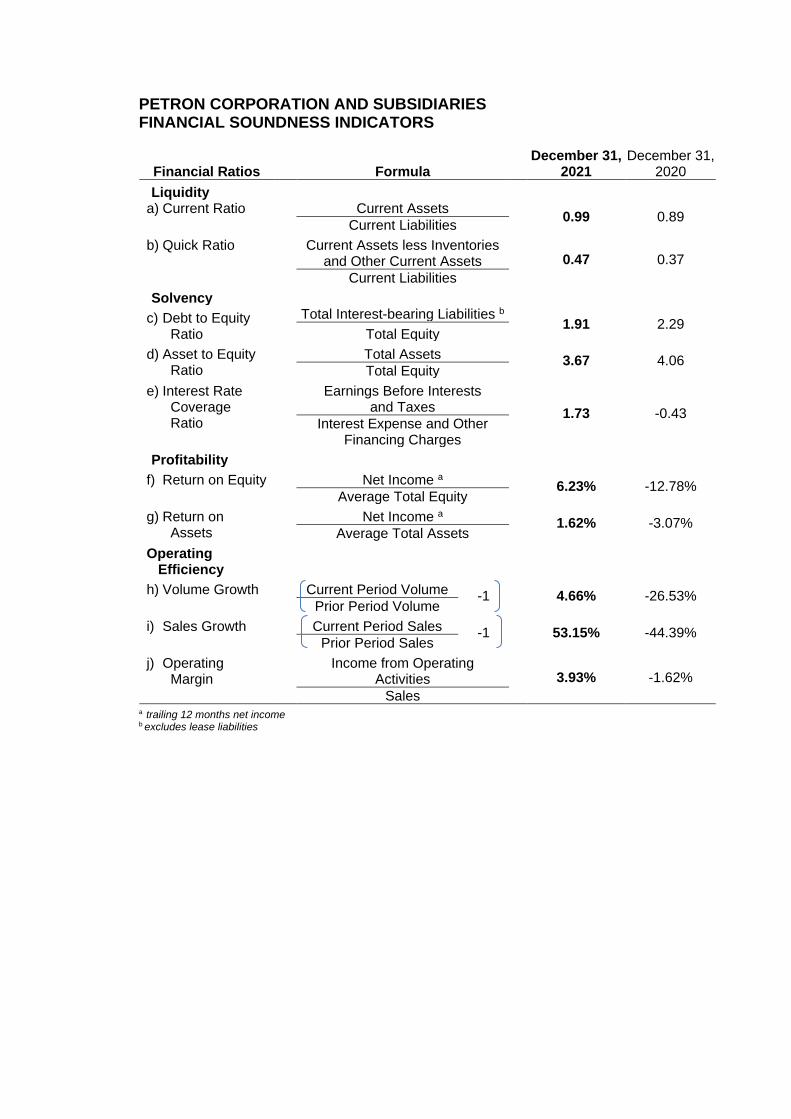
PETRON CORPORATION AND SUBSIDIARIES FINANCIAL SOUNDNESS INDICATORS
Financial Ratios Formula December 31,
2021 December 31,
2020
Liquidity a) Current Ratio Current Assets
0.99 0.89 Current Liabilities
b) Quick Ratio
Current Assets less Inventories and Other Current Assets 0.47 0.37
Current Liabilities
Solvency
c) Debt to Equity Ratio
Total Interest-bearing Liabilities b 1.91 2.29
Total Equity
d) Asset to Equity Ratio
Total Assets 3.67 4.06 Total Equity
e) Interest Rate Coverage Ratio
Earnings Before Interests
and Taxes 1.73 -0.43
Interest Expense and Other
Financing Charges
Profitability
f) Return on Equity Net Income a 6.23% -12.78% Average Total Equity
g) Return on Assets
Net Income a 1.62% -3.07% Average Total Assets
Operating Efficiency
h) Volume Growth Current Period Volume -1 4.66% -26.53% Prior Period Volume
i) Sales Growth Current Period Sales -1 53.15% -44.39% Prior Period Sales
j) Operating Margin
Income from Operating Activities 3.93% -1.62%
Sales a trailing 12 months net income b excludes lease liabilities
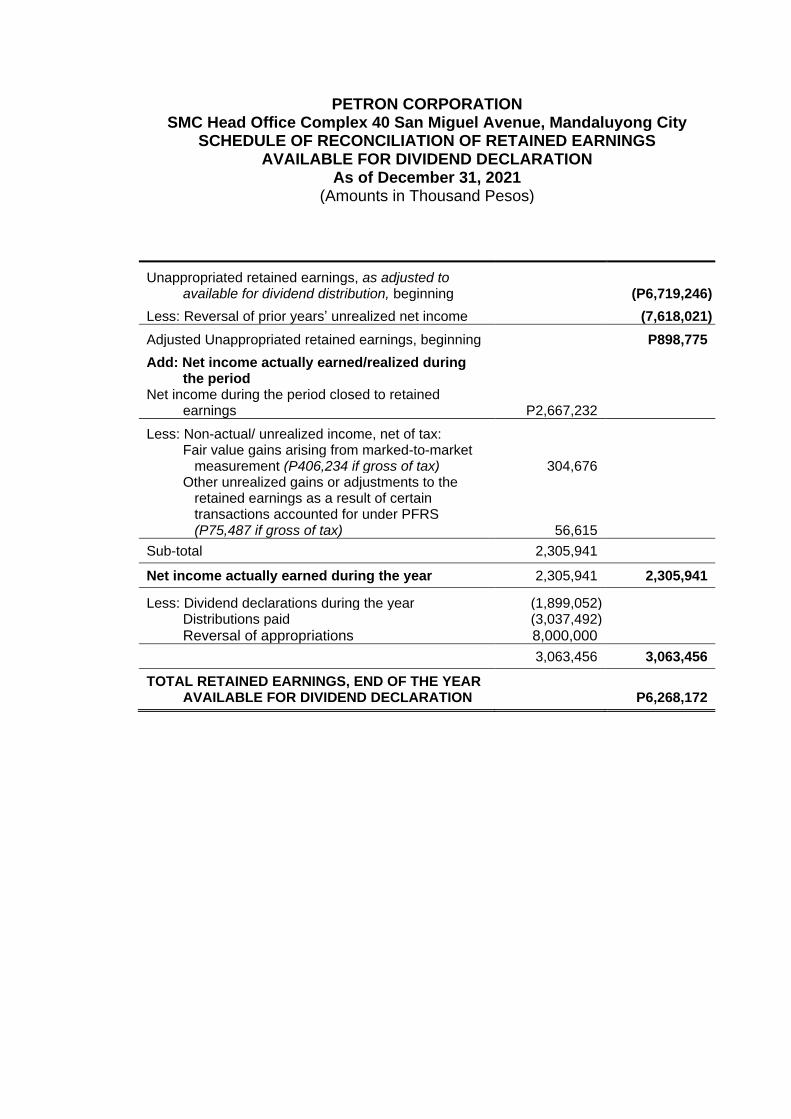
PETRON CORPORATION SMC Head Office Complex 40 San Miguel Avenue, Mandaluyong City
SCHEDULE OF RECONCILIATION OF RETAINED EARNINGS AVAILABLE FOR DIVIDEND DECLARATION
As of December 31, 2021 (Amounts in Thousand Pesos)
Unappropriated retained earnings, as adjusted to available for dividend distribution, beginning (P6,719,246)
Less: Reversal of prior years’ unrealized net income (7,618,021)
Adjusted Unappropriated retained earnings, beginning P898,775
Add: Net income actually earned/realized during the period
Net income during the period closed to retained earnings P2,667,232
Less: Non-actual/ unrealized income, net of tax: Fair value gains arising from marked-to-market
measurement (P406,234 if gross of tax) 304,676 Other unrealized gains or adjustments to the
retained earnings as a result of certain transactions accounted for under PFRS (P75,487 if gross of tax) 56,615
Sub-total 2,305,941
Net income actually earned during the year 2,305,941 2,305,941
Less: Dividend declarations during the year (1,899,052) Distributions paid (3,037,492)
Reversal of appropriations 8,000,000
3,063,456 3,063,456
TOTAL RETAINED EARNINGS, END OF THE YEAR AVAILABLE FOR DIVIDEND DECLARATION P6,268,172
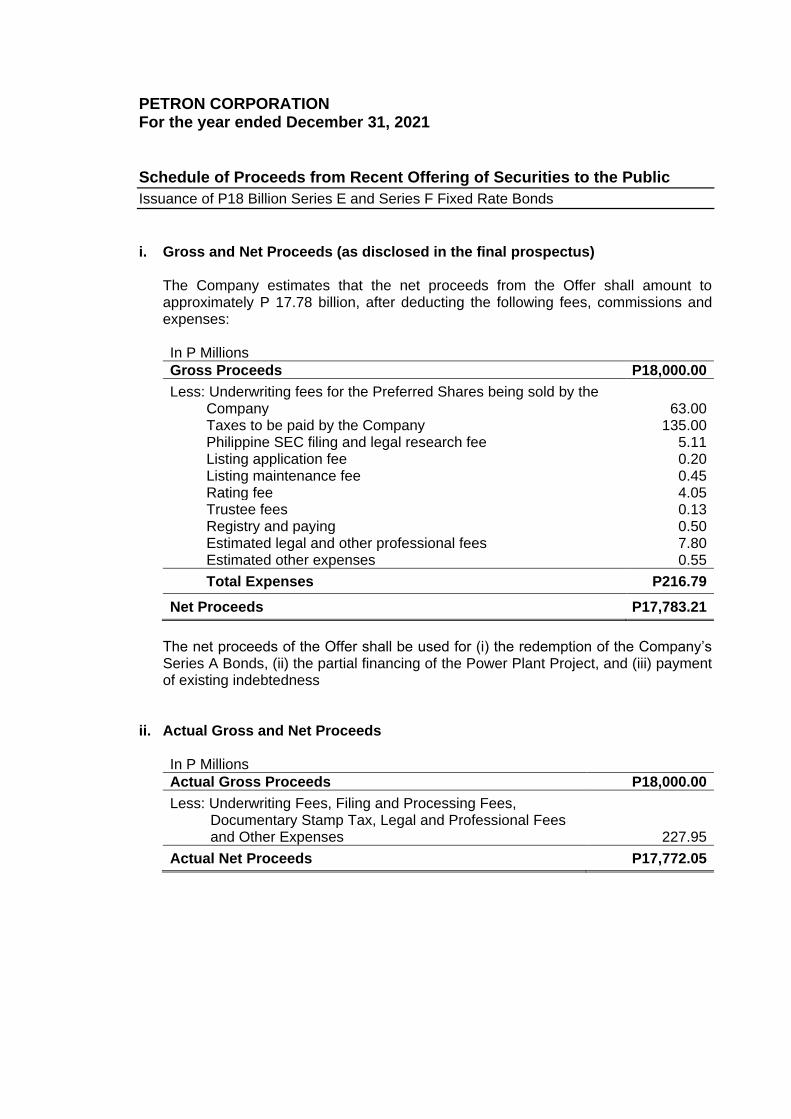
PETRON CORPORATION For the year ended December 31, 2021 Schedule of Proceeds from Recent Offering of Securities to the Public
Issuance of P18 Billion Series E and Series F Fixed Rate Bonds
i. Gross and Net Proceeds (as disclosed in the final prospectus)
The Company estimates that the net proceeds from the Offer shall amount to approximately P 17.78 billion, after deducting the following fees, commissions and expenses: In P Millions
Gross Proceeds P18,000.00
Less: Underwriting fees for the Preferred Shares being sold by the Company 63.00 Taxes to be paid by the Company 135.00 Philippine SEC filing and legal research fee 5.11 Listing application fee 0.20 Listing maintenance fee 0.45 Rating fee 4.05 Trustee fees 0.13 Registry and paying 0.50 Estimated legal and other professional fees 7.80 Estimated other expenses 0.55
Total Expenses P216.79
Net Proceeds P17,783.21
The net proceeds of the Offer shall be used for (i) the redemption of the Company’s Series A Bonds, (ii) the partial financing of the Power Plant Project, and (iii) payment of existing indebtedness
ii. Actual Gross and Net Proceeds
In P Millions
Actual Gross Proceeds P18,000.00
Less: Underwriting Fees, Filing and Processing Fees, Documentary Stamp Tax, Legal and Professional Fees and Other Expenses 227.95
Actual Net Proceeds P17,772.05
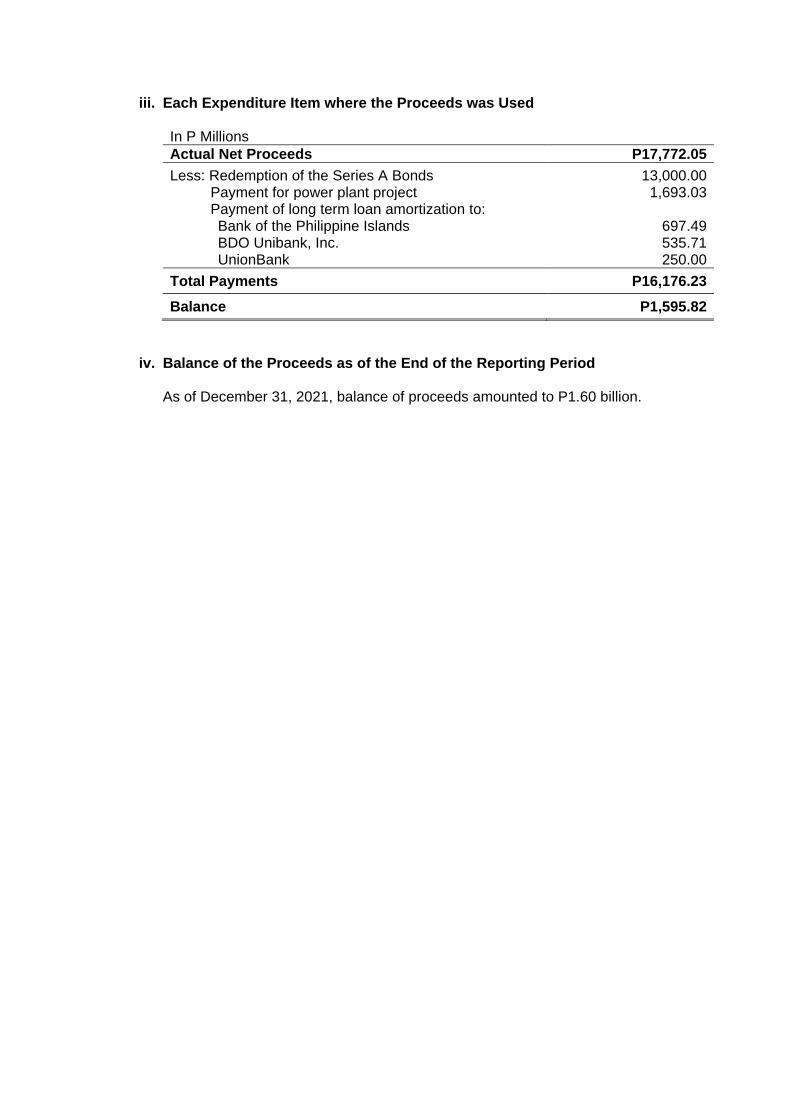
iii. Each Expenditure Item where the Proceeds was Used In P Millions
Actual Net Proceeds P17,772.05
Less: Redemption of the Series A Bonds 13,000.00 Payment for power plant project 1,693.03 Payment of long term loan amortization to: Bank of the Philippine Islands 697.49 BDO Unibank, Inc. 535.71 UnionBank 250.00
Total Payments P16,176.23
Balance P1,595.82
iv. Balance of the Proceeds as of the End of the Reporting Period
As of December 31, 2021, balance of proceeds amounted to P1.60 billion.
96
ANNEX D
2021 Sustainability Report
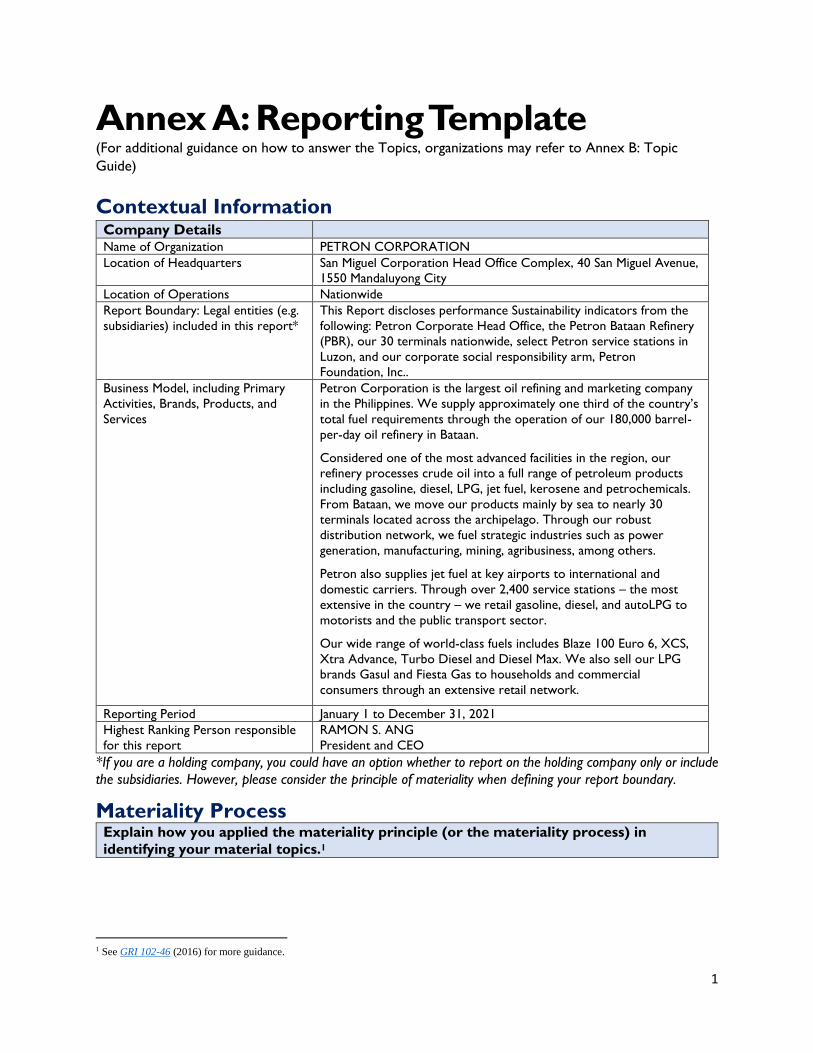
1
Annex A: Reporting Template (For additional guidance on how to answer the Topics, organizations may refer to Annex B: Topic
Guide)
Contextual Information Company Details Name of Organization PETRON CORPORATION
Location of Headquarters San Miguel Corporation Head Office Complex, 40 San Miguel Avenue,
1550 Mandaluyong City
Location of Operations Nationwide
Report Boundary: Legal entities (e.g.
subsidiaries) included in this report*
This Report discloses performance Sustainability indicators from the
following: Petron Corporate Head Office, the Petron Bataan Refinery
(PBR), our 30 terminals nationwide, select Petron service stations in
Luzon, and our corporate social responsibility arm, Petron
Foundation, Inc..
Business Model, including Primary
Activities, Brands, Products, and
Services
Petron Corporation is the largest oil refining and marketing company
in the Philippines. We supply approximately one third of the country’s
total fuel requirements through the operation of our 180,000 barrel-
per-day oil refinery in Bataan.
Considered one of the most advanced facilities in the region, our
refinery processes crude oil into a full range of petroleum products
including gasoline, diesel, LPG, jet fuel, kerosene and petrochemicals.
From Bataan, we move our products mainly by sea to nearly 30
terminals located across the archipelago. Through our robust
distribution network, we fuel strategic industries such as power
generation, manufacturing, mining, agribusiness, among others.
Petron also supplies jet fuel at key airports to international and
domestic carriers. Through over 2,400 service stations – the most
extensive in the country – we retail gasoline, diesel, and autoLPG to
motorists and the public transport sector.
Our wide range of world-class fuels includes Blaze 100 Euro 6, XCS,
Xtra Advance, Turbo Diesel and Diesel Max. We also sell our LPG
brands Gasul and Fiesta Gas to households and commercial
consumers through an extensive retail network.
Reporting Period January 1 to December 31, 2021
Highest Ranking Person responsible
for this report
RAMON S. ANG
President and CEO
*If you are a holding company, you could have an option whether to report on the holding company only or include
the subsidiaries. However, please consider the principle of materiality when defining your report boundary.
Materiality Process Explain how you applied the materiality principle (or the materiality process) in
identifying your material topics.1
1 See GRI 102-46 (2016) for more guidance.
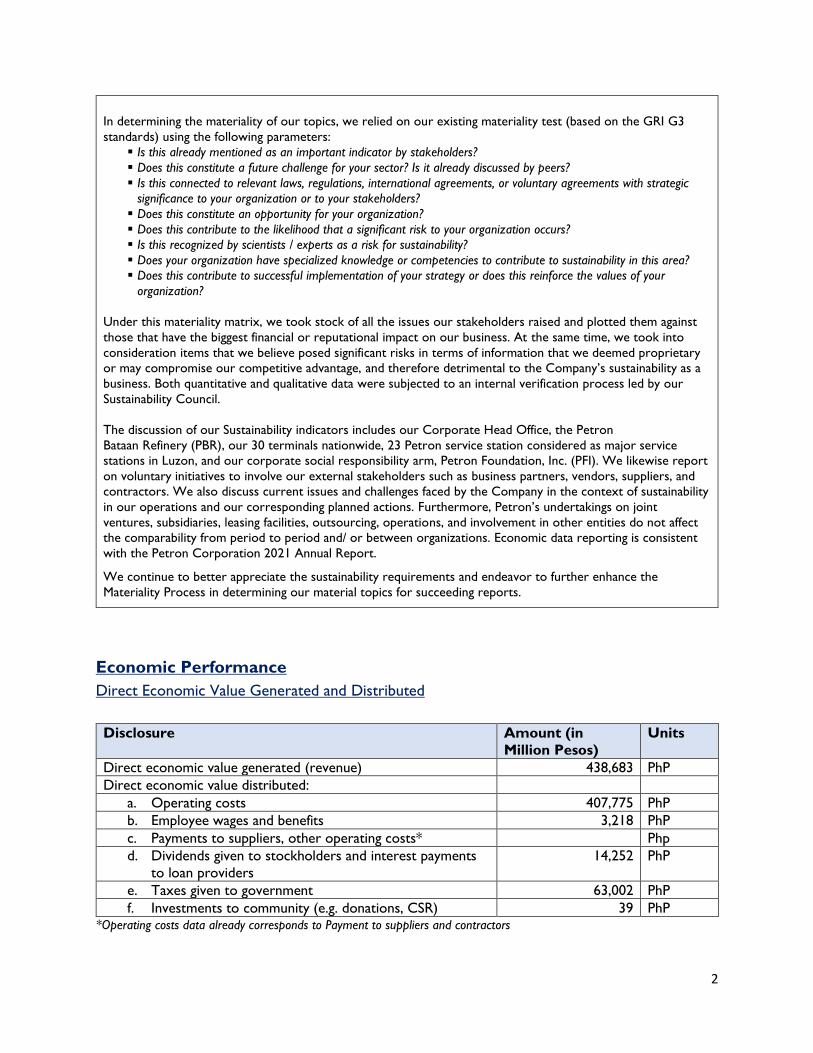
2
In determining the materiality of our topics, we relied on our existing materiality test (based on the GRI G3
standards) using the following parameters:
Is this already mentioned as an important indicator by stakeholders?
Does this constitute a future challenge for your sector? Is it already discussed by peers?
Is this connected to relevant laws, regulations, international agreements, or voluntary agreements with strategic
significance to your organization or to your stakeholders?
Does this constitute an opportunity for your organization?
Does this contribute to the likelihood that a significant risk to your organization occurs?
Is this recognized by scientists / experts as a risk for sustainability?
Does your organization have specialized knowledge or competencies to contribute to sustainability in this area?
Does this contribute to successful implementation of your strategy or does this reinforce the values of your
organization?
Under this materiality matrix, we took stock of all the issues our stakeholders raised and plotted them against
those that have the biggest financial or reputational impact on our business. At the same time, we took into
consideration items that we believe posed significant risks in terms of information that we deemed proprietary
or may compromise our competitive advantage, and therefore detrimental to the Company’s sustainability as a
business. Both quantitative and qualitative data were subjected to an internal verification process led by our
Sustainability Council.
The discussion of our Sustainability indicators includes our Corporate Head Office, the Petron
Bataan Refinery (PBR), our 30 terminals nationwide, 23 Petron service station considered as major service
stations in Luzon, and our corporate social responsibility arm, Petron Foundation, Inc. (PFI). We likewise report
on voluntary initiatives to involve our external stakeholders such as business partners, vendors, suppliers, and
contractors. We also discuss current issues and challenges faced by the Company in the context of sustainability
in our operations and our corresponding planned actions. Furthermore, Petron’s undertakings on joint
ventures, subsidiaries, leasing facilities, outsourcing, operations, and involvement in other entities do not affect
the comparability from period to period and/ or between organizations. Economic data reporting is consistent
with the Petron Corporation 2021 Annual Report.
We continue to better appreciate the sustainability requirements and endeavor to further enhance the
Materiality Process in determining our material topics for succeeding reports.
ECONOMIC Economic Performance
Direct Economic Value Generated and Distributed
Disclosure Amount (in
Million Pesos)
Units
Direct economic value generated (revenue) 438,683 PhP
Direct economic value distributed:
a. Operating costs 407,775 PhP
b. Employee wages and benefits 3,218 PhP
c. Payments to suppliers, other operating costs* Php
d. Dividends given to stockholders and interest payments
to loan providers
14,252 PhP
e. Taxes given to government 63,002 PhP
f. Investments to community (e.g. donations, CSR) 39 PhP *Operating costs data already corresponds to Payment to suppliers and contractors
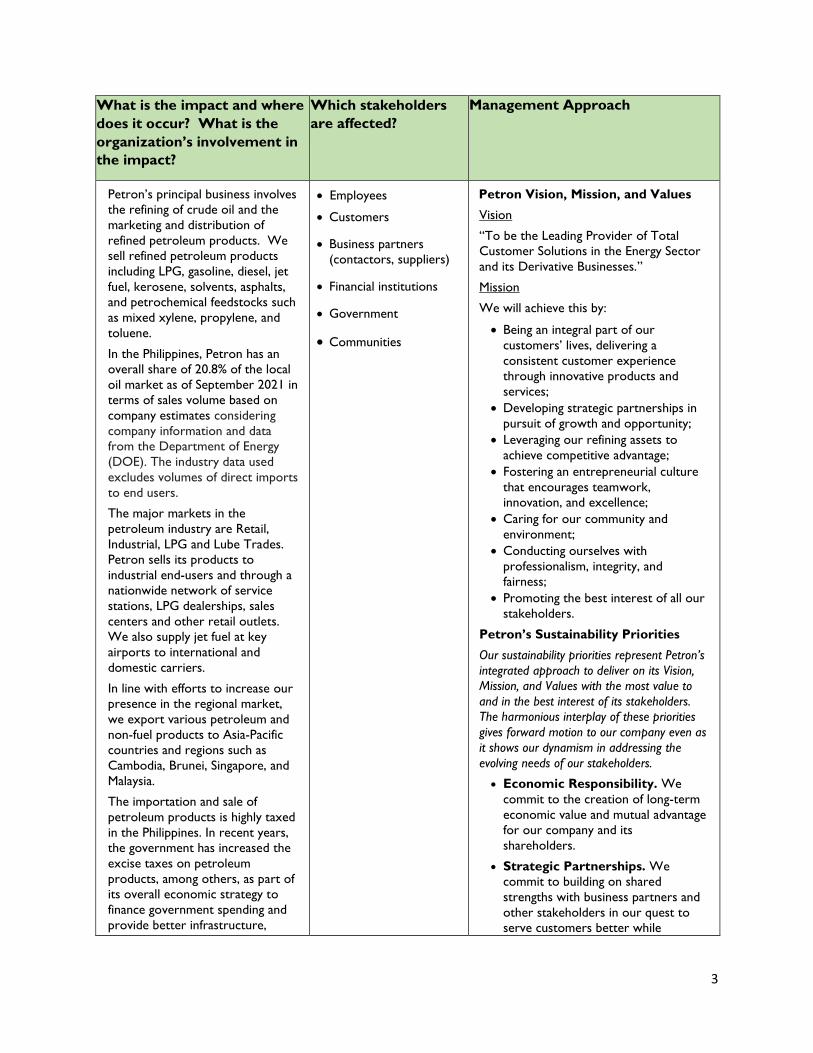
3
What is the impact and where
does it occur? What is the
organization’s involvement in
the impact?
Which stakeholders
are affected?
Management Approach
Petron’s principal business involves
the refining of crude oil and the
marketing and distribution of
refined petroleum products. We
sell refined petroleum products
including LPG, gasoline, diesel, jet
fuel, kerosene, solvents, asphalts,
and petrochemical feedstocks such
as mixed xylene, propylene, and
toluene.
In the Philippines, Petron has an
overall share of 20.8% of the local
oil market as of September 2021 in
terms of sales volume based on
company estimates considering
company information and data
from the Department of Energy
(DOE). The industry data used
excludes volumes of direct imports
to end users.
The major markets in the
petroleum industry are Retail,
Industrial, LPG and Lube Trades.
Petron sells its products to
industrial end-users and through a
nationwide network of service
stations, LPG dealerships, sales
centers and other retail outlets.
We also supply jet fuel at key
airports to international and
domestic carriers.
In line with efforts to increase our
presence in the regional market,
we export various petroleum and
non-fuel products to Asia-Pacific
countries and regions such as
Cambodia, Brunei, Singapore, and
Malaysia.
The importation and sale of
petroleum products is highly taxed
in the Philippines. In recent years,
the government has increased the
excise taxes on petroleum
products, among others, as part of
its overall economic strategy to
finance government spending and
provide better infrastructure,
• Employees
• Customers
• Business partners
(contactors, suppliers)
• Financial institutions
• Government
• Communities
Petron Vision, Mission, and Values
Vision
“To be the Leading Provider of Total
Customer Solutions in the Energy Sector
and its Derivative Businesses.”
Mission
We will achieve this by:
• Being an integral part of our
customers’ lives, delivering a
consistent customer experience
through innovative products and
services;
• Developing strategic partnerships in
pursuit of growth and opportunity;
• Leveraging our refining assets to
achieve competitive advantage;
• Fostering an entrepreneurial culture
that encourages teamwork,
innovation, and excellence;
• Caring for our community and
environment;
• Conducting ourselves with
professionalism, integrity, and
fairness;
• Promoting the best interest of all our
stakeholders.
Petron’s Sustainability Priorities
Our sustainability priorities represent Petron’s
integrated approach to deliver on its Vision,
Mission, and Values with the most value to
and in the best interest of its stakeholders.
The harmonious interplay of these priorities
gives forward motion to our company even as
it shows our dynamism in addressing the
evolving needs of our stakeholders.
• Economic Responsibility. We
commit to the creation of long-term
economic value and mutual advantage
for our company and its
shareholders.
• Strategic Partnerships. We
commit to building on shared
strengths with business partners and
other stakeholders in our quest to
serve customers better while
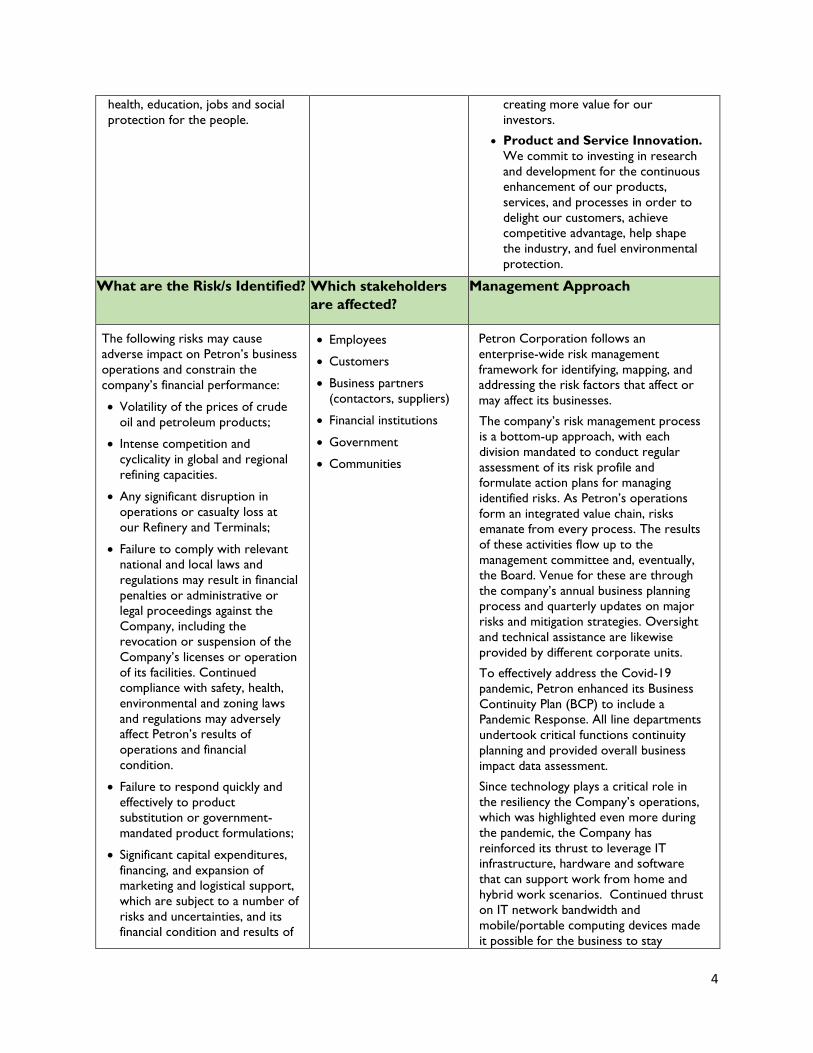
4
health, education, jobs and social
protection for the people. creating more value for our
investors.
• Product and Service Innovation.
We commit to investing in research
and development for the continuous
enhancement of our products,
services, and processes in order to
delight our customers, achieve
competitive advantage, help shape
the industry, and fuel environmental
protection.
What are the Risk/s Identified? Which stakeholders
are affected?
Management Approach
The following risks may cause
adverse impact on Petron’s business
operations and constrain the
company’s financial performance:
• Volatility of the prices of crude
oil and petroleum products;
• Intense competition and
cyclicality in global and regional
refining capacities.
• Any significant disruption in
operations or casualty loss at
our Refinery and Terminals;
• Failure to comply with relevant
national and local laws and
regulations may result in financial
penalties or administrative or
legal proceedings against the
Company, including the
revocation or suspension of the
Company’s licenses or operation
of its facilities. Continued
compliance with safety, health,
environmental and zoning laws
and regulations may adversely
affect Petron’s results of
operations and financial
condition.
• Failure to respond quickly and
effectively to product
substitution or government-
mandated product formulations;
• Significant capital expenditures,
financing, and expansion of
marketing and logistical support,
which are subject to a number of
risks and uncertainties, and its
financial condition and results of
• Employees
• Customers
• Business partners
(contactors, suppliers)
• Financial institutions
• Government
• Communities
Petron Corporation follows an
enterprise-wide risk management
framework for identifying, mapping, and
addressing the risk factors that affect or
may affect its businesses.
The company’s risk management process
is a bottom-up approach, with each
division mandated to conduct regular
assessment of its risk profile and
formulate action plans for managing
identified risks. As Petron’s operations
form an integrated value chain, risks
emanate from every process. The results
of these activities flow up to the
management committee and, eventually,
the Board. Venue for these are through
the company’s annual business planning
process and quarterly updates on major
risks and mitigation strategies. Oversight
and technical assistance are likewise
provided by different corporate units.
To effectively address the Covid-19
pandemic, Petron enhanced its Business
Continuity Plan (BCP) to include a
Pandemic Response. All line departments
undertook critical functions continuity
planning and provided overall business
impact data assessment.
Since technology plays a critical role in
the resiliency the Company’s operations,
which was highlighted even more during
the pandemic, the Company has
reinforced its thrust to leverage IT
infrastructure, hardware and software
that can support work from home and
hybrid work scenarios. Continued thrust
on IT network bandwidth and
mobile/portable computing devices made
it possible for the business to stay
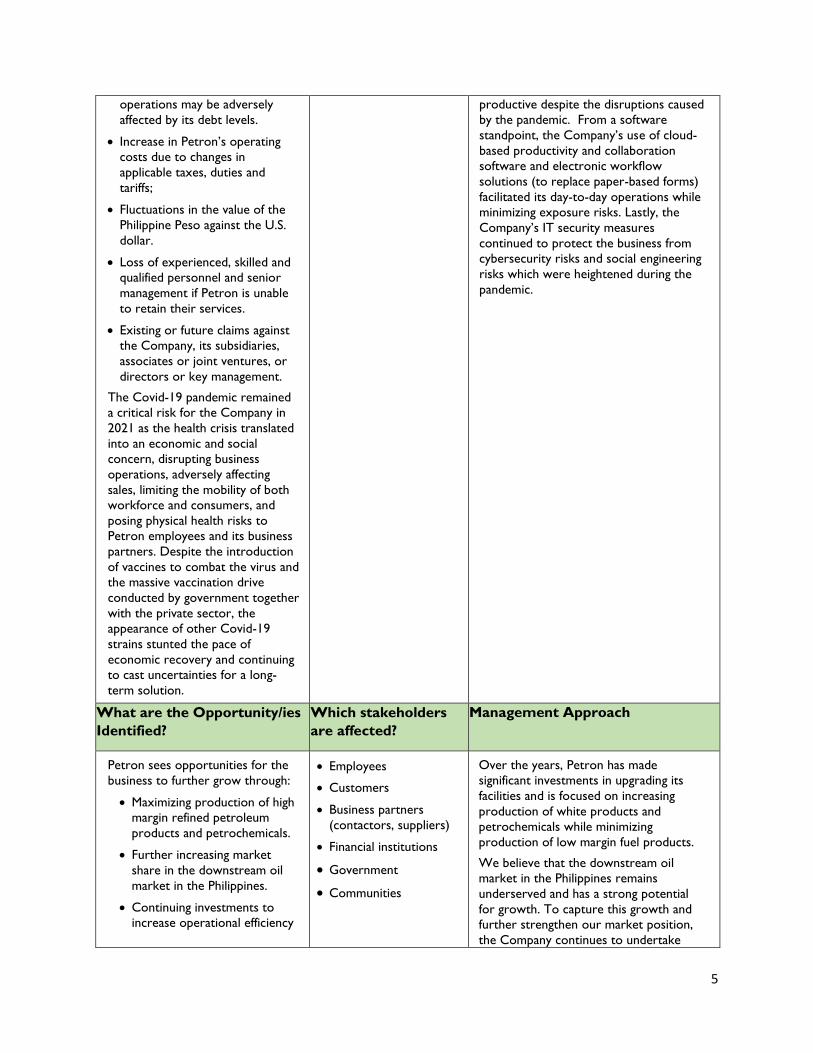
5
operations may be adversely
affected by its debt levels.
• Increase in Petron’s operating
costs due to changes in
applicable taxes, duties and
tariffs;
• Fluctuations in the value of the
Philippine Peso against the U.S.
dollar.
• Loss of experienced, skilled and
qualified personnel and senior
management if Petron is unable
to retain their services.
• Existing or future claims against
the Company, its subsidiaries,
associates or joint ventures, or
directors or key management.
The Covid-19 pandemic remained
a critical risk for the Company in
2021 as the health crisis translated
into an economic and social
concern, disrupting business
operations, adversely affecting
sales, limiting the mobility of both
workforce and consumers, and
posing physical health risks to
Petron employees and its business
partners. Despite the introduction
of vaccines to combat the virus and
the massive vaccination drive
conducted by government together
with the private sector, the
appearance of other Covid-19
strains stunted the pace of
economic recovery and continuing
to cast uncertainties for a long-
term solution.
productive despite the disruptions caused
by the pandemic. From a software
standpoint, the Company’s use of cloud-
based productivity and collaboration
software and electronic workflow
solutions (to replace paper-based forms)
facilitated its day-to-day operations while
minimizing exposure risks. Lastly, the
Company’s IT security measures
continued to protect the business from
cybersecurity risks and social engineering
risks which were heightened during the
pandemic.
What are the Opportunity/ies
Identified?
Which stakeholders
are affected?
Management Approach
Petron sees opportunities for the
business to further grow through:
• Maximizing production of high
margin refined petroleum
products and petrochemicals.
• Further increasing market
share in the downstream oil
market in the Philippines.
• Continuing investments to
increase operational efficiency
• Employees
• Customers
• Business partners
(contactors, suppliers)
• Financial institutions
• Government
• Communities
Over the years, Petron has made
significant investments in upgrading its
facilities and is focused on increasing
production of white products and
petrochemicals while minimizing
production of low margin fuel products.
We believe that the downstream oil
market in the Philippines remains
underserved and has a strong potential
for growth. To capture this growth and
further strengthen our market position,
the Company continues to undertake
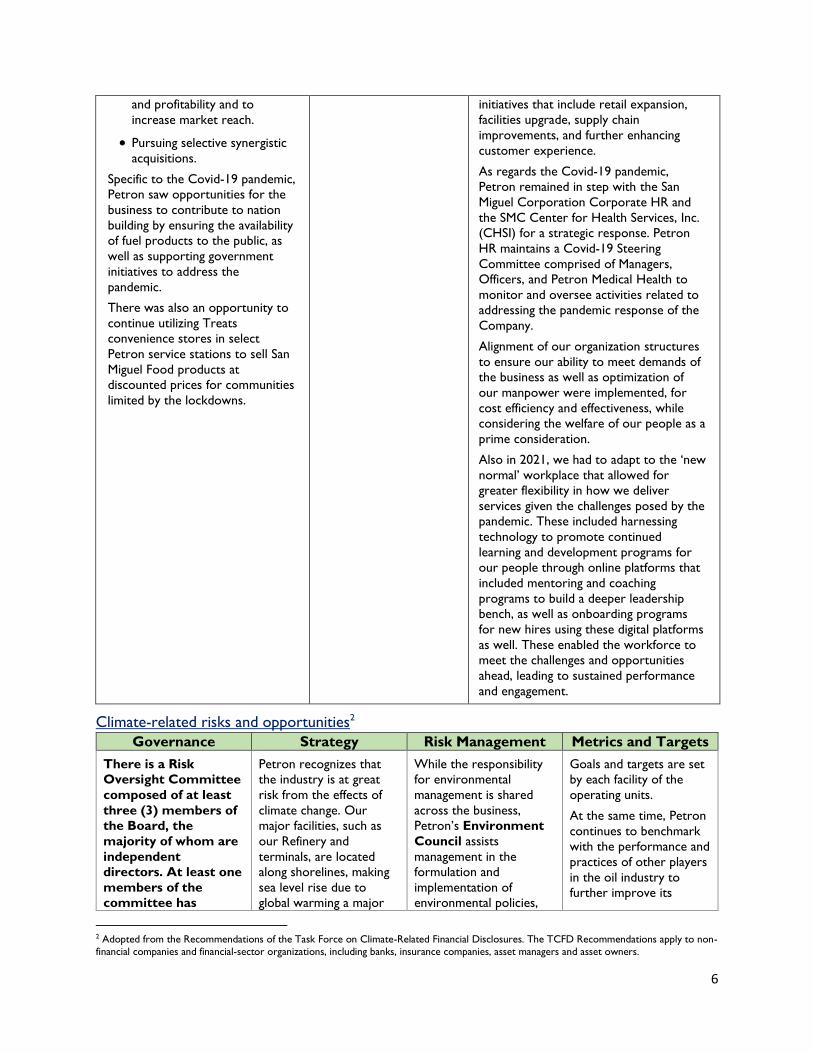
6
and profitability and to
increase market reach.
• Pursuing selective synergistic
acquisitions.
Specific to the Covid-19 pandemic,
Petron saw opportunities for the
business to contribute to nation
building by ensuring the availability
of fuel products to the public, as
well as supporting government
initiatives to address the
pandemic.
There was also an opportunity to
continue utilizing Treats
convenience stores in select
Petron service stations to sell San
Miguel Food products at
discounted prices for communities
limited by the lockdowns.
initiatives that include retail expansion,
facilities upgrade, supply chain
improvements, and further enhancing
customer experience.
As regards the Covid-19 pandemic,
Petron remained in step with the San
Miguel Corporation Corporate HR and
the SMC Center for Health Services, Inc.
(CHSI) for a strategic response. Petron
HR maintains a Covid-19 Steering
Committee comprised of Managers,
Officers, and Petron Medical Health to
monitor and oversee activities related to
addressing the pandemic response of the
Company.
Alignment of our organization structures
to ensure our ability to meet demands of
the business as well as optimization of
our manpower were implemented, for
cost efficiency and effectiveness, while
considering the welfare of our people as a
prime consideration.
Also in 2021, we had to adapt to the ‘new
normal’ workplace that allowed for
greater flexibility in how we deliver
services given the challenges posed by the
pandemic. These included harnessing
technology to promote continued
learning and development programs for
our people through online platforms that
included mentoring and coaching
programs to build a deeper leadership
bench, as well as onboarding programs
for new hires using these digital platforms
as well. These enabled the workforce to
meet the challenges and opportunities
ahead, leading to sustained performance
and engagement.
Climate-related risks and opportunities2
Governance Strategy Risk Management Metrics and Targets
There is a Risk
Oversight Committee
composed of at least
three (3) members of
the Board, the
majority of whom are
independent
directors. At least one
members of the
committee has
Petron recognizes that
the industry is at great
risk from the effects of
climate change. Our
major facilities, such as
our Refinery and
terminals, are located
along shorelines, making
sea level rise due to
global warming a major
While the responsibility
for environmental
management is shared
across the business,
Petron’s Environment
Council assists
management in the
formulation and
implementation of
environmental policies,
Goals and targets are set
by each facility of the
operating units.
At the same time, Petron
continues to benchmark
with the performance and
practices of other players
in the oil industry to
further improve its
2 Adopted from the Recommendations of the Task Force on Climate-Related Financial Disclosures. The TCFD Recommendations apply to non-
financial companies and financial-sector organizations, including banks, insurance companies, asset managers and asset owners.
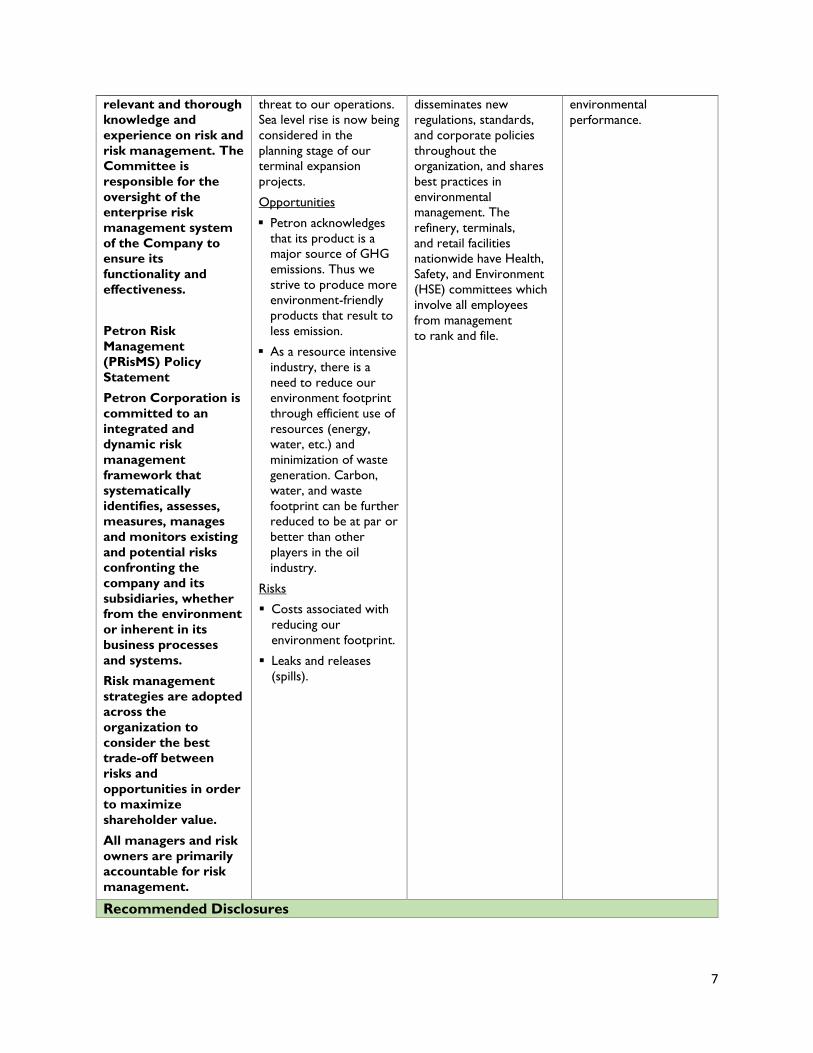
7
relevant and thorough
knowledge and
experience on risk and
risk management. The
Committee is
responsible for the
oversight of the
enterprise risk
management system
of the Company to
ensure its
functionality and
effectiveness.
Petron Risk
Management
(PRisMS) Policy
Statement
Petron Corporation is
committed to an
integrated and
dynamic risk
management
framework that
systematically
identifies, assesses,
measures, manages
and monitors existing
and potential risks
confronting the
company and its
subsidiaries, whether
from the environment
or inherent in its
business processes
and systems.
Risk management
strategies are adopted
across the
organization to
consider the best
trade-off between
risks and
opportunities in order
to maximize
shareholder value.
All managers and risk
owners are primarily
accountable for risk
management.
threat to our operations.
Sea level rise is now being
considered in the
planning stage of our
terminal expansion
projects.
Opportunities
Petron acknowledges
that its product is a
major source of GHG
emissions. Thus we
strive to produce more
environment-friendly
products that result to
less emission.
As a resource intensive
industry, there is a
need to reduce our
environment footprint
through efficient use of
resources (energy,
water, etc.) and
minimization of waste
generation. Carbon,
water, and waste
footprint can be further
reduced to be at par or
better than other
players in the oil
industry.
Risks
Costs associated with
reducing our
environment footprint.
Leaks and releases
(spills).
disseminates new
regulations, standards,
and corporate policies
throughout the
organization, and shares
best practices in
environmental
management. The
refinery, terminals,
and retail facilities
nationwide have Health,
Safety, and Environment
(HSE) committees which
involve all employees
from management
to rank and file.
environmental
performance.
Recommended Disclosures
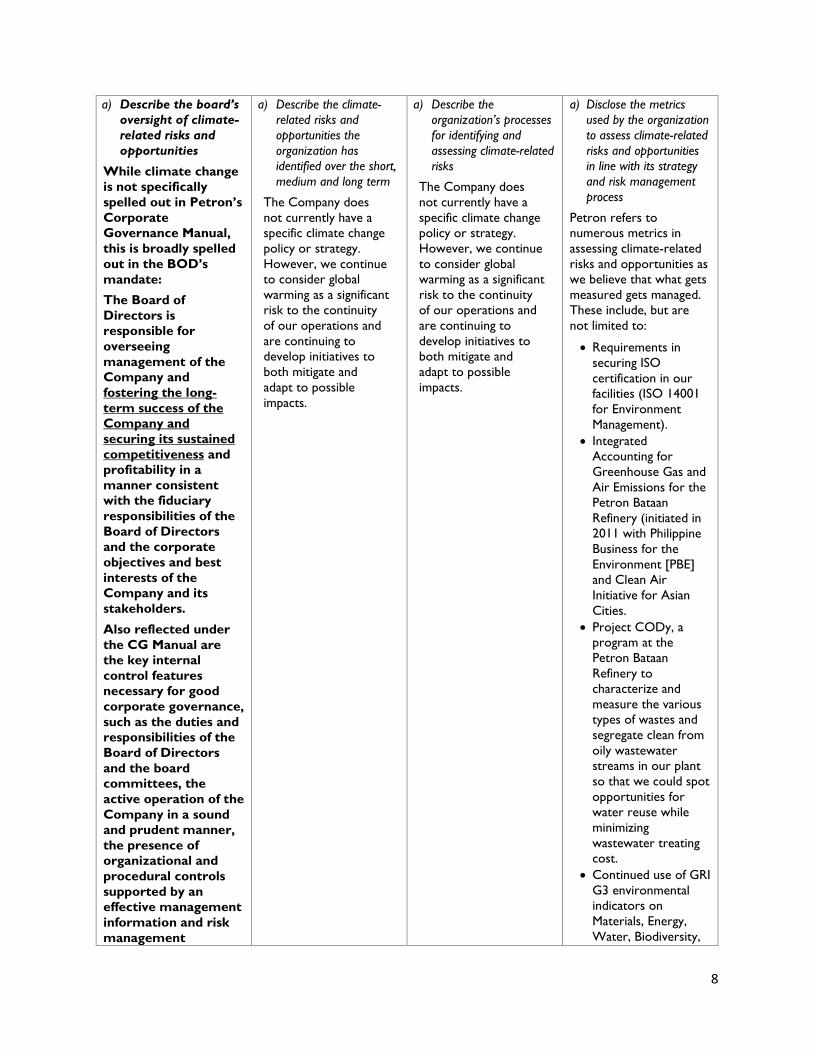
8
a) Describe the board’s
oversight of climate-
related risks and
opportunities
While climate change
is not specifically
spelled out in Petron’s
Corporate
Governance Manual,
this is broadly spelled
out in the BOD’s
mandate:
The Board of
Directors is
responsible for
overseeing
management of the
Company and
fostering the long-
term success of the
Company and
securing its sustained
competitiveness and
profitability in a
manner consistent
with the fiduciary
responsibilities of the
Board of Directors
and the corporate
objectives and best
interests of the
Company and its
stakeholders.
Also reflected under
the CG Manual are
the key internal
control features
necessary for good
corporate governance,
such as the duties and
responsibilities of the
Board of Directors
and the board
committees, the
active operation of the
Company in a sound
and prudent manner,
the presence of
organizational and
procedural controls
supported by an
effective management
information and risk
management
a) Describe the climate-
related risks and
opportunities the
organization has
identified over the short,
medium and long term
The Company does
not currently have a
specific climate change
policy or strategy.
However, we continue
to consider global
warming as a significant
risk to the continuity
of our operations and
are continuing to
develop initiatives to
both mitigate and
adapt to possible
impacts.
a) Describe the
organization’s processes
for identifying and
assessing climate-related
risks
The Company does
not currently have a
specific climate change
policy or strategy.
However, we continue
to consider global
warming as a significant
risk to the continuity
of our operations and
are continuing to
develop initiatives to
both mitigate and
adapt to possible
impacts.
a) Disclose the metrics
used by the organization
to assess climate-related
risks and opportunities
in line with its strategy
and risk management
process
Petron refers to
numerous metrics in
assessing climate-related
risks and opportunities as
we believe that what gets
measured gets managed.
These include, but are
not limited to:
• Requirements in
securing ISO
certification in our
facilities (ISO 14001
for Environment
Management).
• Integrated
Accounting for
Greenhouse Gas and
Air Emissions for the
Petron Bataan
Refinery (initiated in
2011 with Philippine
Business for the
Environment [PBE]
and Clean Air
Initiative for Asian
Cities.
• Project CODy, a
program at the
Petron Bataan
Refinery to
characterize and
measure the various
types of wastes and
segregate clean from
oily wastewater
streams in our plant
so that we could spot
opportunities for
water reuse while
minimizing
wastewater treating
cost.
• Continued use of GRI
G3 environmental
indicators on
Materials, Energy,
Water, Biodiversity,
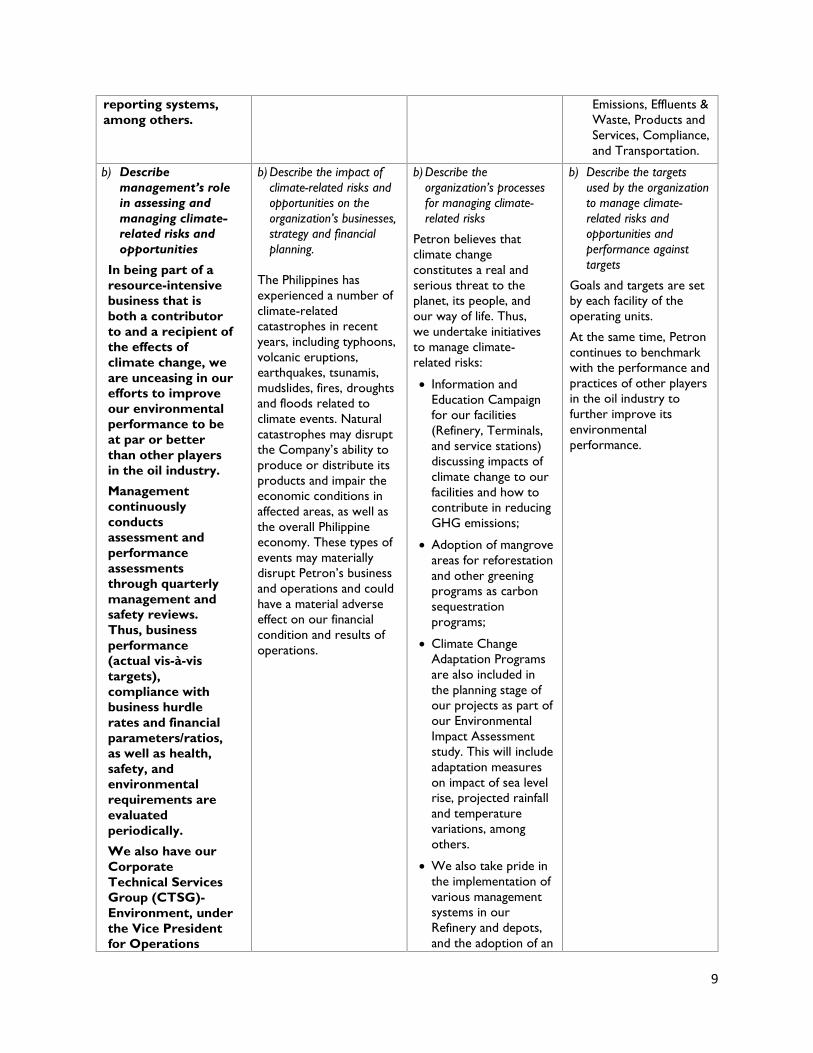
9
reporting systems,
among others. Emissions, Effluents &
Waste, Products and
Services, Compliance,
and Transportation.
b) Describe
management’s role
in assessing and
managing climate-
related risks and
opportunities
In being part of a
resource-intensive
business that is
both a contributor
to and a recipient of
the effects of
climate change, we
are unceasing in our
efforts to improve
our environmental
performance to be
at par or better
than other players
in the oil industry.
Management
continuously
conducts
assessment and
performance
assessments
through quarterly
management and
safety reviews.
Thus, business
performance
(actual vis-à-vis
targets),
compliance with
business hurdle
rates and financial
parameters/ratios,
as well as health,
safety, and
environmental
requirements are
evaluated
periodically.
We also have our
Corporate
Technical Services
Group (CTSG)-
Environment, under
the Vice President
for Operations
b) Describe the impact of
climate-related risks and
opportunities on the
organization’s businesses,
strategy and financial
planning.
The Philippines has
experienced a number of
climate-related
catastrophes in recent
years, including typhoons,
volcanic eruptions,
earthquakes, tsunamis,
mudslides, fires, droughts
and floods related to
climate events. Natural
catastrophes may disrupt
the Company’s ability to
produce or distribute its
products and impair the
economic conditions in
affected areas, as well as
the overall Philippine
economy. These types of
events may materially
disrupt Petron’s business
and operations and could
have a material adverse
effect on our financial
condition and results of
operations.
b) Describe the
organization’s processes
for managing climate-
related risks
Petron believes that
climate change
constitutes a real and
serious threat to the
planet, its people, and
our way of life. Thus,
we undertake initiatives
to manage climate-
related risks:
• Information and
Education Campaign
for our facilities
(Refinery, Terminals,
and service stations)
discussing impacts of
climate change to our
facilities and how to
contribute in reducing
GHG emissions;
• Adoption of mangrove
areas for reforestation
and other greening
programs as carbon
sequestration
programs;
• Climate Change
Adaptation Programs
are also included in
the planning stage of
our projects as part of
our Environmental
Impact Assessment
study. This will include
adaptation measures
on impact of sea level
rise, projected rainfall
and temperature
variations, among
others.
• We also take pride in
the implementation of
various management
systems in our
Refinery and depots,
and the adoption of an
b) Describe the targets
used by the organization
to manage climate-
related risks and
opportunities and
performance against
targets
Goals and targets are set
by each facility of the
operating units.
At the same time, Petron
continues to benchmark
with the performance and
practices of other players
in the oil industry to
further improve its
environmental
performance.
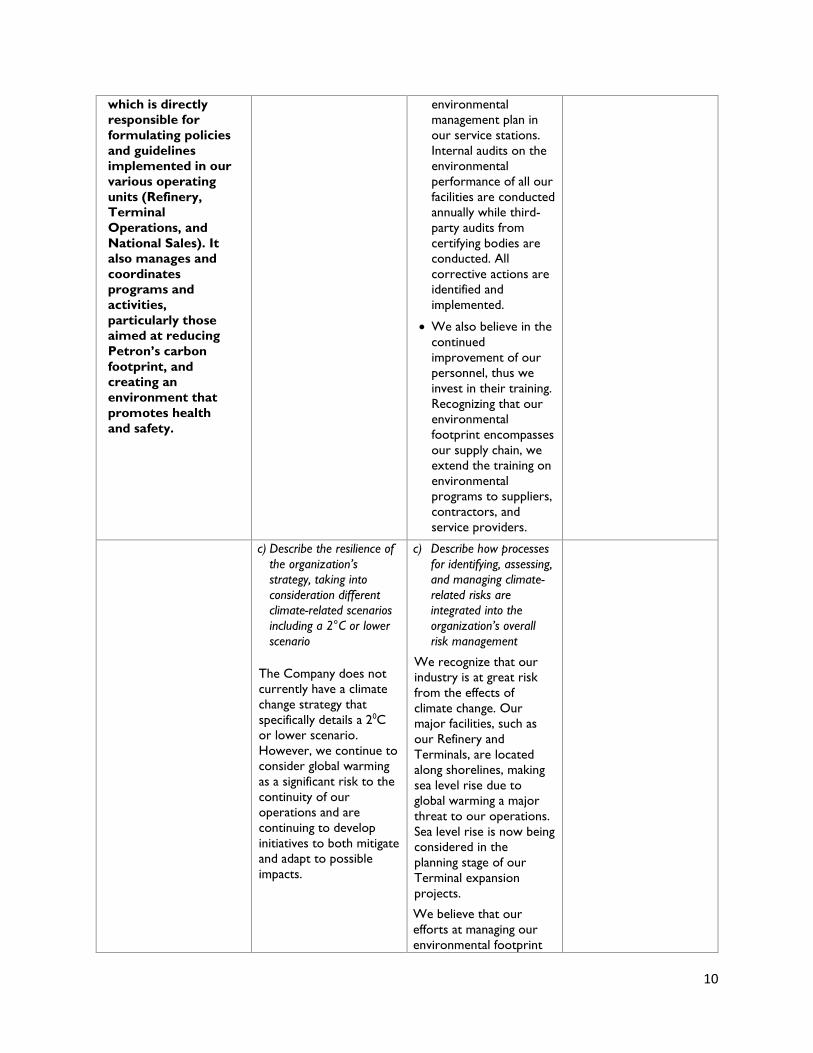
10
which is directly
responsible for
formulating policies
and guidelines
implemented in our
various operating
units (Refinery,
Terminal
Operations, and
National Sales). It
also manages and
coordinates
programs and
activities,
particularly those
aimed at reducing
Petron’s carbon
footprint, and
creating an
environment that
promotes health
and safety.
environmental
management plan in
our service stations.
Internal audits on the
environmental
performance of all our
facilities are conducted
annually while third-
party audits from
certifying bodies are
conducted. All
corrective actions are
identified and
implemented.
• We also believe in the
continued
improvement of our
personnel, thus we
invest in their training.
Recognizing that our
environmental
footprint encompasses
our supply chain, we
extend the training on
environmental
programs to suppliers,
contractors, and
service providers.
c) Describe the resilience of
the organization’s
strategy, taking into
consideration different
climate-related scenarios
including a 2°C or lower
scenario
The Company does not
currently have a climate
change strategy that
specifically details a 20C
or lower scenario.
However, we continue to
consider global warming
as a significant risk to the
continuity of our
operations and are
continuing to develop
initiatives to both mitigate
and adapt to possible
impacts.
c) Describe how processes
for identifying, assessing,
and managing climate-
related risks are
integrated into the
organization’s overall
risk management
We recognize that our
industry is at great risk
from the effects of
climate change. Our
major facilities, such as
our Refinery and
Terminals, are located
along shorelines, making
sea level rise due to
global warming a major
threat to our operations.
Sea level rise is now being
considered in the
planning stage of our
Terminal expansion
projects.
We believe that our
efforts at managing our
environmental footprint
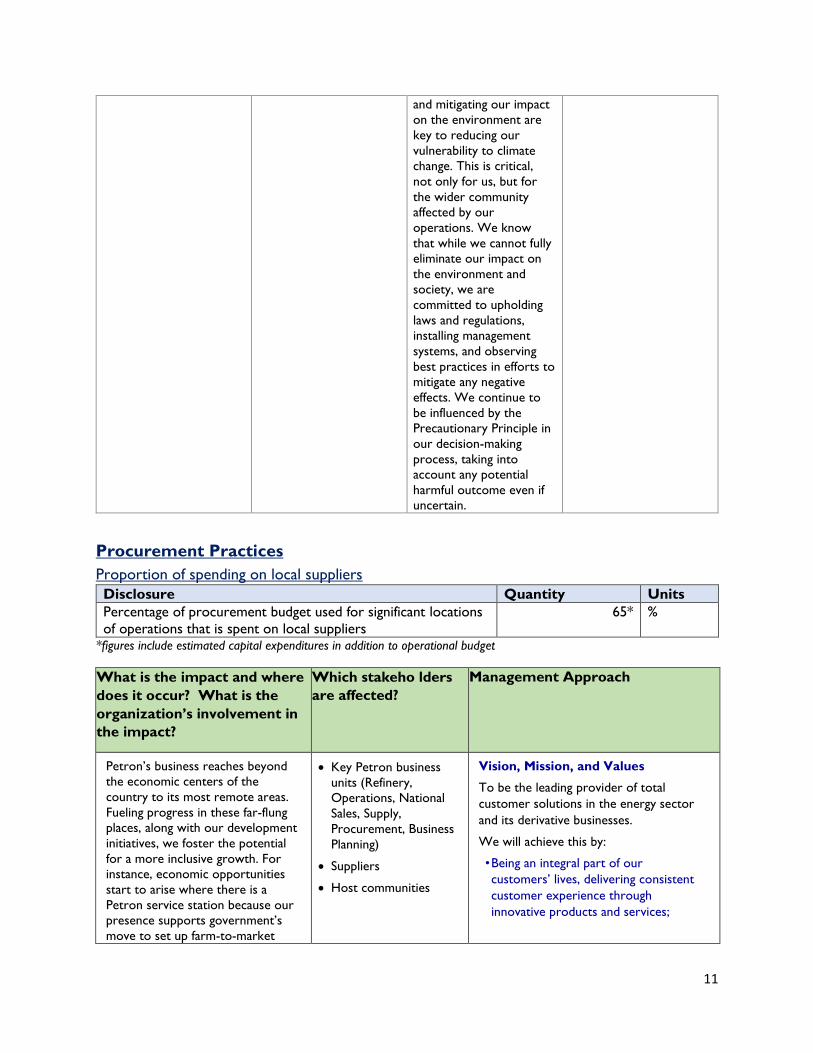
11
and mitigating our impact
on the environment are
key to reducing our
vulnerability to climate
change. This is critical,
not only for us, but for
the wider community
affected by our
operations. We know
that while we cannot fully
eliminate our impact on
the environment and
society, we are
committed to upholding
laws and regulations,
installing management
systems, and observing
best practices in efforts to
mitigate any negative
effects. We continue to
be influenced by the
Precautionary Principle in
our decision-making
process, taking into
account any potential
harmful outcome even if
uncertain.
Procurement Practices
Proportion of spending on local suppliers
Disclosure Quantity Units
Percentage of procurement budget used for significant locations
of operations that is spent on local suppliers
65* %
*figures include estimated capital expenditures in addition to operational budget
What is the impact and where
does it occur? What is the
organization’s involvement in
the impact?
Which stakeho lders
are affected?
Management Approach
Petron’s business reaches beyond
the economic centers of the
country to its most remote areas.
Fueling progress in these far-flung
places, along with our development
initiatives, we foster the potential
for a more inclusive growth. For
instance, economic opportunities
start to arise where there is a
Petron service station because our
presence supports government’s
move to set up farm-to-market
• Key Petron business
units (Refinery,
Operations, National
Sales, Supply,
Procurement, Business
Planning)
• Suppliers
• Host communities
Vision, Mission, and Values
To be the leading provider of total
customer solutions in the energy sector
and its derivative businesses.
We will achieve this by:
• Being an integral part of our
customers’ lives, delivering consistent
customer experience through
innovative products and services;
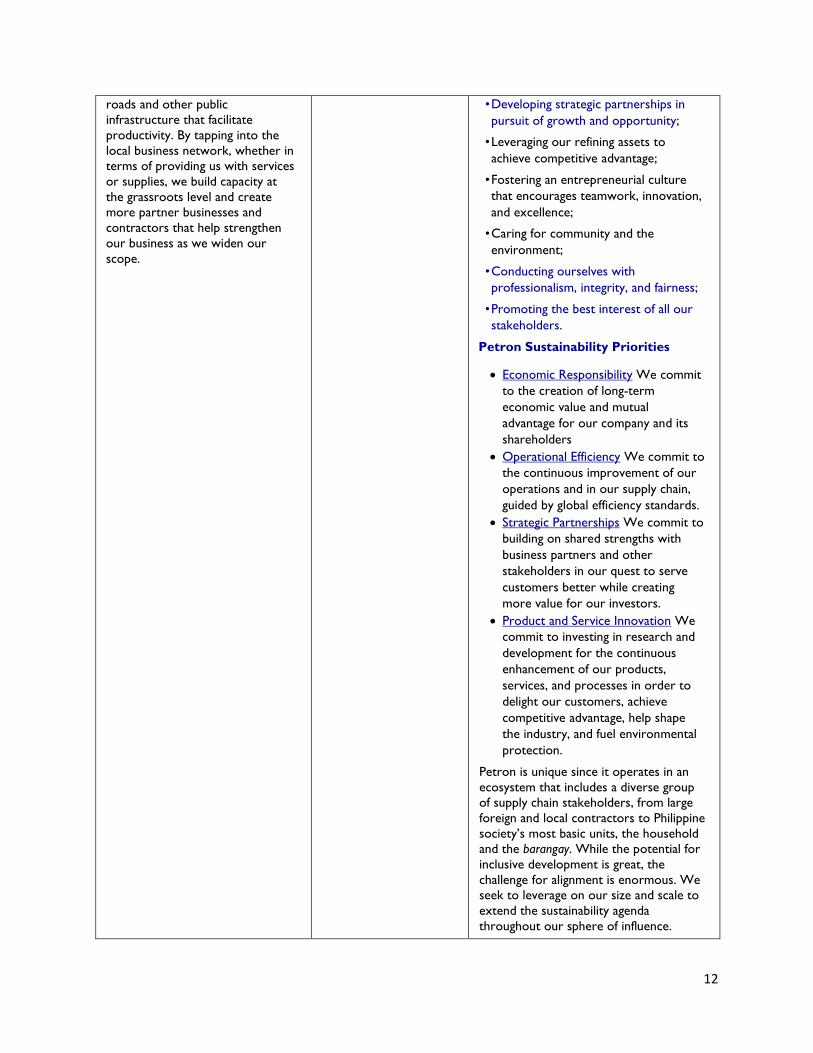
12
roads and other public
infrastructure that facilitate
productivity. By tapping into the
local business network, whether in
terms of providing us with services
or supplies, we build capacity at
the grassroots level and create
more partner businesses and
contractors that help strengthen
our business as we widen our
scope.
• Developing strategic partnerships in
pursuit of growth and opportunity;
• Leveraging our refining assets to
achieve competitive advantage;
• Fostering an entrepreneurial culture
that encourages teamwork, innovation,
and excellence;
• Caring for community and the
environment;
• Conducting ourselves with
professionalism, integrity, and fairness;
• Promoting the best interest of all our
stakeholders.
Petron Sustainability Priorities
• Economic Responsibility We commit
to the creation of long-term
economic value and mutual
advantage for our company and its
shareholders
• Operational Efficiency We commit to
the continuous improvement of our
operations and in our supply chain,
guided by global efficiency standards.
• Strategic Partnerships We commit to
building on shared strengths with
business partners and other
stakeholders in our quest to serve
customers better while creating
more value for our investors.
• Product and Service Innovation We
commit to investing in research and
development for the continuous
enhancement of our products,
services, and processes in order to
delight our customers, achieve
competitive advantage, help shape
the industry, and fuel environmental
protection.
Petron is unique since it operates in an
ecosystem that includes a diverse group
of supply chain stakeholders, from large
foreign and local contractors to Philippine
society’s most basic units, the household
and the barangay. While the potential for
inclusive development is great, the
challenge for alignment is enormous. We
seek to leverage on our size and scale to
extend the sustainability agenda
throughout our sphere of influence.
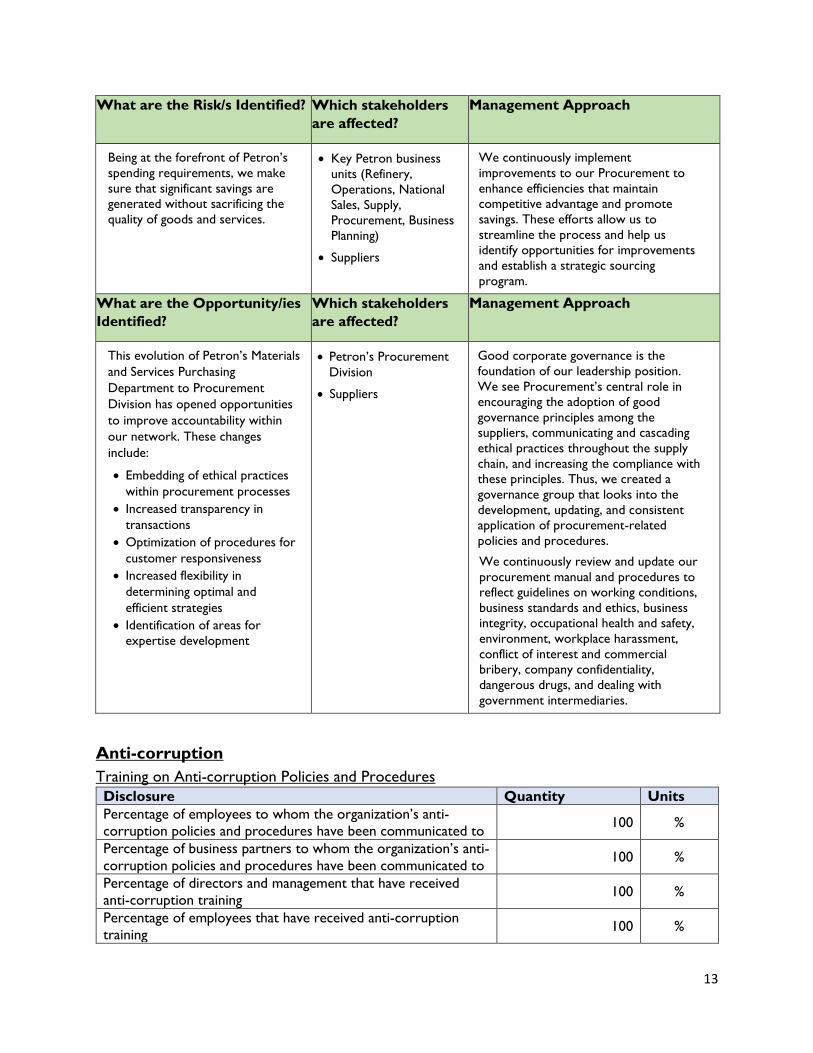
13
What are the Risk/s Identified? Which stakeholders
are affected?
Management Approach
Being at the forefront of Petron’s
spending requirements, we make
sure that significant savings are
generated without sacrificing the
quality of goods and services.
• Key Petron business
units (Refinery,
Operations, National
Sales, Supply,
Procurement, Business
Planning)
• Suppliers
We continuously implement
improvements to our Procurement to
enhance efficiencies that maintain
competitive advantage and promote
savings. These efforts allow us to
streamline the process and help us
identify opportunities for improvements
and establish a strategic sourcing
program.
What are the Opportunity/ies
Identified?
Which stakeholders
are affected?
Management Approach
This evolution of Petron’s Materials
and Services Purchasing
Department to Procurement
Division has opened opportunities
to improve accountability within
our network. These changes
include:
• Embedding of ethical practices
within procurement processes
• Increased transparency in
transactions
• Optimization of procedures for
customer responsiveness
• Increased flexibility in
determining optimal and
efficient strategies
• Identification of areas for
expertise development
• Petron’s Procurement
Division
• Suppliers
Good corporate governance is the
foundation of our leadership position.
We see Procurement’s central role in
encouraging the adoption of good
governance principles among the
suppliers, communicating and cascading
ethical practices throughout the supply
chain, and increasing the compliance with
these principles. Thus, we created a
governance group that looks into the
development, updating, and consistent
application of procurement-related
policies and procedures.
We continuously review and update our
procurement manual and procedures to
reflect guidelines on working conditions,
business standards and ethics, business
integrity, occupational health and safety,
environment, workplace harassment,
conflict of interest and commercial
bribery, company confidentiality,
dangerous drugs, and dealing with
government intermediaries.
Anti-corruption
Training on Anti-corruption Policies and Procedures
Disclosure Quantity Units
Percentage of employees to whom the organization’s anti-
corruption policies and procedures have been communicated to 100 %
Percentage of business partners to whom the organization’s anti-
corruption policies and procedures have been communicated to 100 %
Percentage of directors and management that have received
anti-corruption training 100 %
Percentage of employees that have received anti-corruption
training 100 %
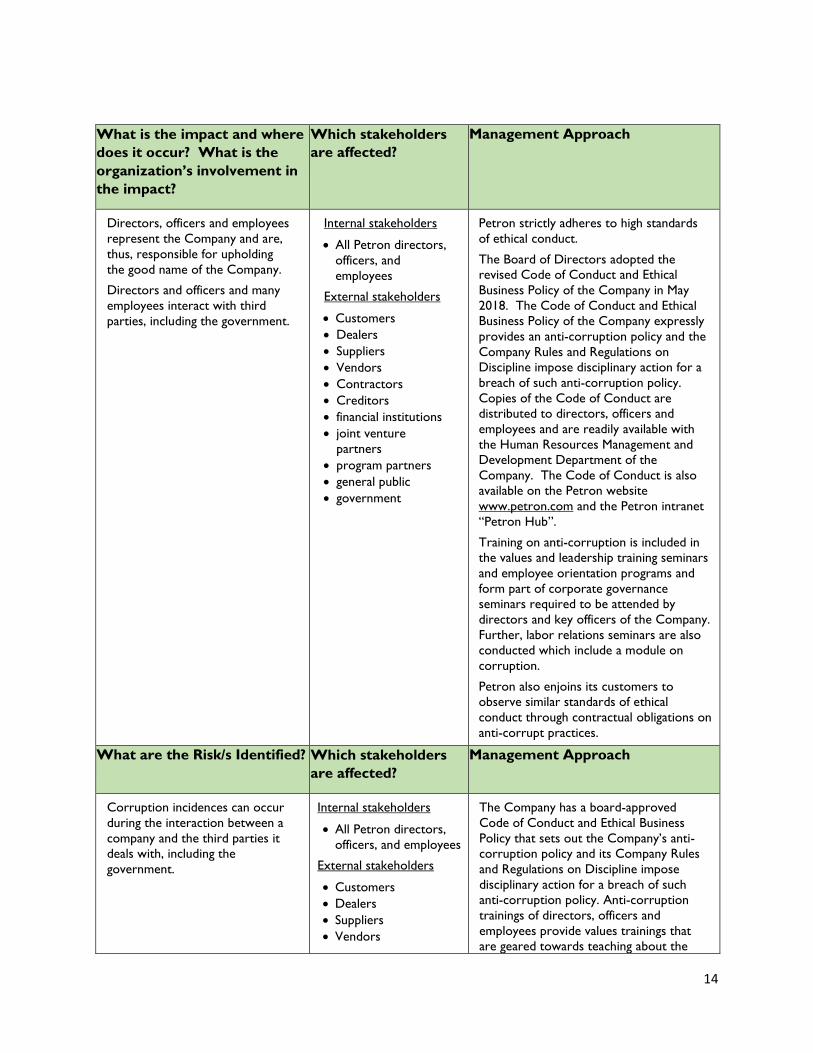
14
What is the impact and where
does it occur? What is the
organization’s involvement in
the impact?
Which stakeholders
are affected?
Management Approach
Directors, officers and employees
represent the Company and are,
thus, responsible for upholding
the good name of the Company.
Directors and officers and many
employees interact with third
parties, including the government.
Internal stakeholders
• All Petron directors,
officers, and
employees
External stakeholders
• Customers
• Dealers
• Suppliers
• Vendors
• Contractors
• Creditors
• financial institutions
• joint venture
partners
• program partners
• general public
• government
Petron strictly adheres to high standards
of ethical conduct.
The Board of Directors adopted the
revised Code of Conduct and Ethical
Business Policy of the Company in May
2018. The Code of Conduct and Ethical
Business Policy of the Company expressly
provides an anti-corruption policy and the
Company Rules and Regulations on
Discipline impose disciplinary action for a
breach of such anti-corruption policy.
Copies of the Code of Conduct are
distributed to directors, officers and
employees and are readily available with
the Human Resources Management and
Development Department of the
Company. The Code of Conduct is also
available on the Petron website
www.petron.com and the Petron intranet
“Petron Hub”.
Training on anti-corruption is included in
the values and leadership training seminars
and employee orientation programs and
form part of corporate governance
seminars required to be attended by
directors and key officers of the Company.
Further, labor relations seminars are also
conducted which include a module on
corruption.
Petron also enjoins its customers to
observe similar standards of ethical
conduct through contractual obligations on
anti-corrupt practices.
What are the Risk/s Identified? Which stakeholders
are affected?
Management Approach
Corruption incidences can occur
during the interaction between a
company and the third parties it
deals with, including the
government.
Internal stakeholders
• All Petron directors,
officers, and employees
External stakeholders
• Customers
• Dealers
• Suppliers
• Vendors
The Company has a board-approved
Code of Conduct and Ethical Business
Policy that sets out the Company’s anti-
corruption policy and its Company Rules
and Regulations on Discipline impose
disciplinary action for a breach of such
anti-corruption policy. Anti-corruption
trainings of directors, officers and
employees provide values trainings that
are geared towards teaching about the
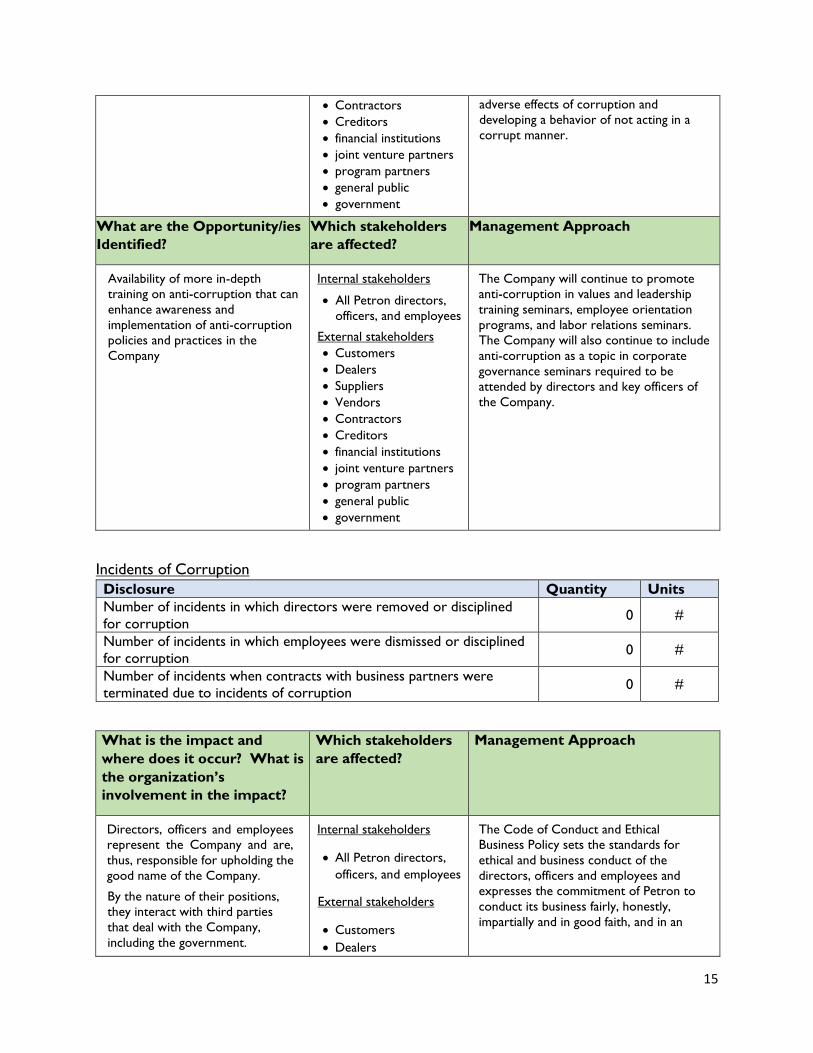
15
• Contractors
• Creditors
• financial institutions
• joint venture partners
• program partners
• general public
• government
adverse effects of corruption and
developing a behavior of not acting in a
corrupt manner.
What are the Opportunity/ies
Identified?
Which stakeholders
are affected?
Management Approach
Availability of more in-depth
training on anti-corruption that can
enhance awareness and
implementation of anti-corruption
policies and practices in the
Company
Internal stakeholders
• All Petron directors,
officers, and employees
External stakeholders
• Customers
• Dealers
• Suppliers
• Vendors
• Contractors
• Creditors
• financial institutions
• joint venture partners
• program partners
• general public
• government
The Company will continue to promote
anti-corruption in values and leadership
training seminars, employee orientation
programs, and labor relations seminars.
The Company will also continue to include
anti-corruption as a topic in corporate
governance seminars required to be
attended by directors and key officers of
the Company.
Incidents of Corruption
Disclosure Quantity Units
Number of incidents in which directors were removed or disciplined
for corruption 0 #
Number of incidents in which employees were dismissed or disciplined
for corruption 0 #
Number of incidents when contracts with business partners were
terminated due to incidents of corruption 0 #
What is the impact and
where does it occur? What is
the organization’s
involvement in the impact?
Which stakeholders
are affected?
Management Approach
Directors, officers and employees
represent the Company and are,
thus, responsible for upholding the
good name of the Company.
By the nature of their positions,
they interact with third parties
that deal with the Company,
including the government.
Internal stakeholders
• All Petron directors,
officers, and employees
External stakeholders
• Customers
• Dealers
The Code of Conduct and Ethical
Business Policy sets the standards for
ethical and business conduct of the
directors, officers and employees and
expresses the commitment of Petron to
conduct its business fairly, honestly,
impartially and in good faith, and in an
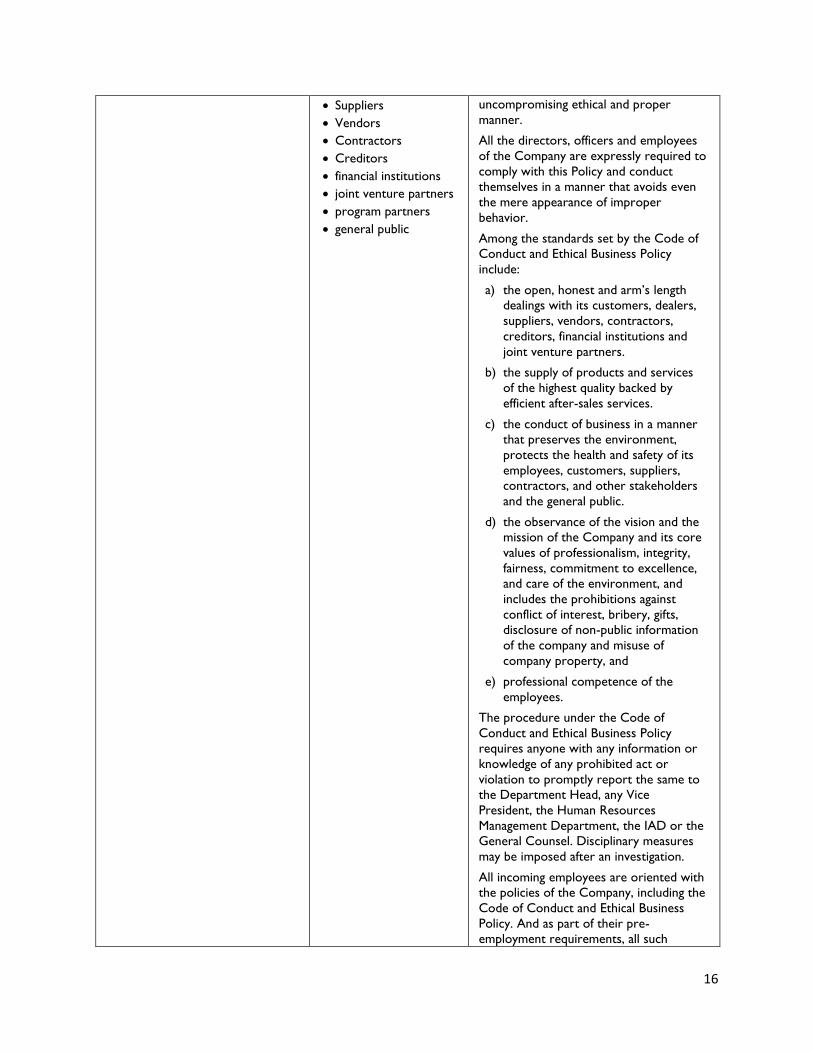
16
• Suppliers
• Vendors
• Contractors
• Creditors
• financial institutions
• joint venture partners
• program partners
• general public
uncompromising ethical and proper
manner.
All the directors, officers and employees
of the Company are expressly required to
comply with this Policy and conduct
themselves in a manner that avoids even
the mere appearance of improper
behavior.
Among the standards set by the Code of
Conduct and Ethical Business Policy
include:
a) the open, honest and arm’s length
dealings with its customers, dealers,
suppliers, vendors, contractors,
creditors, financial institutions and
joint venture partners.
b) the supply of products and services
of the highest quality backed by
efficient after-sales services.
c) the conduct of business in a manner
that preserves the environment,
protects the health and safety of its
employees, customers, suppliers,
contractors, and other stakeholders
and the general public.
d) the observance of the vision and the
mission of the Company and its core
values of professionalism, integrity,
fairness, commitment to excellence,
and care of the environment, and
includes the prohibitions against
conflict of interest, bribery, gifts,
disclosure of non-public information
of the company and misuse of
company property, and
e) professional competence of the
employees.
The procedure under the Code of
Conduct and Ethical Business Policy
requires anyone with any information or
knowledge of any prohibited act or
violation to promptly report the same to
the Department Head, any Vice
President, the Human Resources
Management Department, the IAD or the
General Counsel. Disciplinary measures
may be imposed after an investigation.
All incoming employees are oriented with
the policies of the Company, including the
Code of Conduct and Ethical Business
Policy. And as part of their pre-
employment requirements, all such
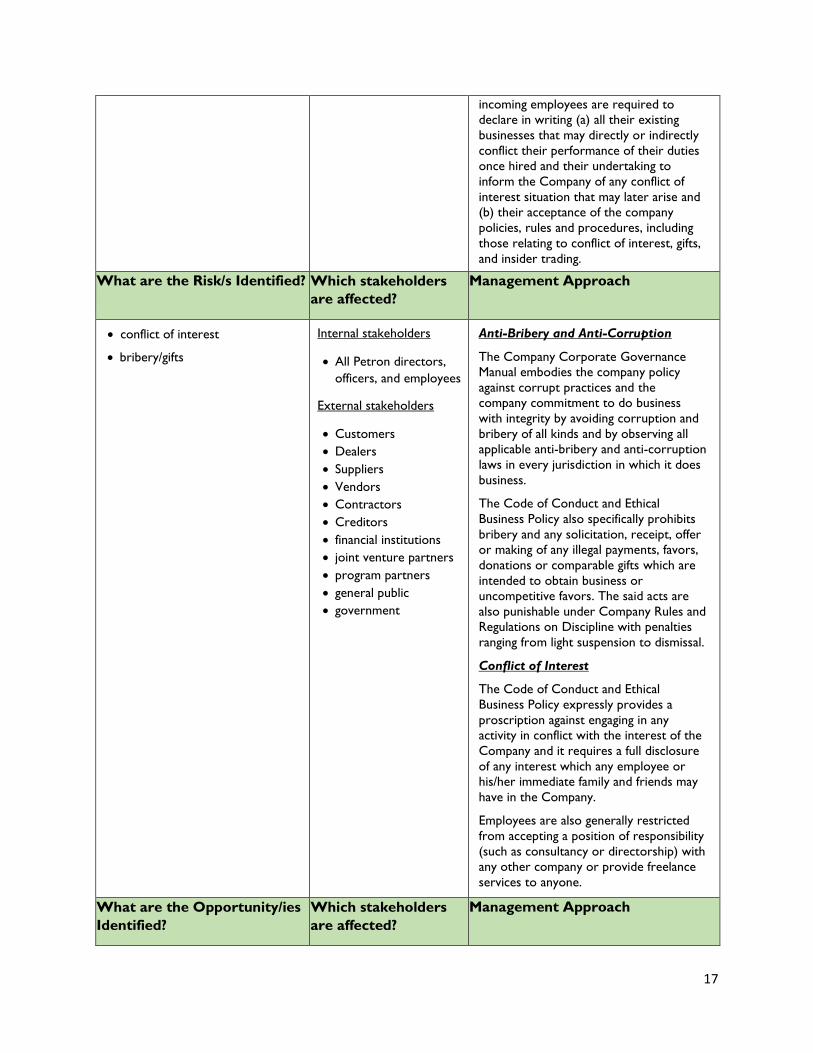
17
incoming employees are required to
declare in writing (a) all their existing
businesses that may directly or indirectly
conflict their performance of their duties
once hired and their undertaking to
inform the Company of any conflict of
interest situation that may later arise and
(b) their acceptance of the company
policies, rules and procedures, including
those relating to conflict of interest, gifts,
and insider trading.
What are the Risk/s Identified? Which stakeholders
are affected?
Management Approach
• conflict of interest
• bribery/gifts
Internal stakeholders
• All Petron directors,
officers, and employees
External stakeholders
• Customers
• Dealers
• Suppliers
• Vendors
• Contractors
• Creditors
• financial institutions
• joint venture partners
• program partners
• general public
• government
Anti-Bribery and Anti-Corruption
The Company Corporate Governance
Manual embodies the company policy
against corrupt practices and the
company commitment to do business
with integrity by avoiding corruption and
bribery of all kinds and by observing all
applicable anti-bribery and anti-corruption
laws in every jurisdiction in which it does
business.
The Code of Conduct and Ethical
Business Policy also specifically prohibits
bribery and any solicitation, receipt, offer
or making of any illegal payments, favors,
donations or comparable gifts which are
intended to obtain business or
uncompetitive favors. The said acts are
also punishable under Company Rules and
Regulations on Discipline with penalties
ranging from light suspension to dismissal.
Conflict of Interest
The Code of Conduct and Ethical
Business Policy expressly provides a
proscription against engaging in any
activity in conflict with the interest of the
Company and it requires a full disclosure
of any interest which any employee or
his/her immediate family and friends may
have in the Company.
Employees are also generally restricted
from accepting a position of responsibility
(such as consultancy or directorship) with
any other company or provide freelance
services to anyone.
What are the Opportunity/ies
Identified?
Which stakeholders
are affected?
Management Approach
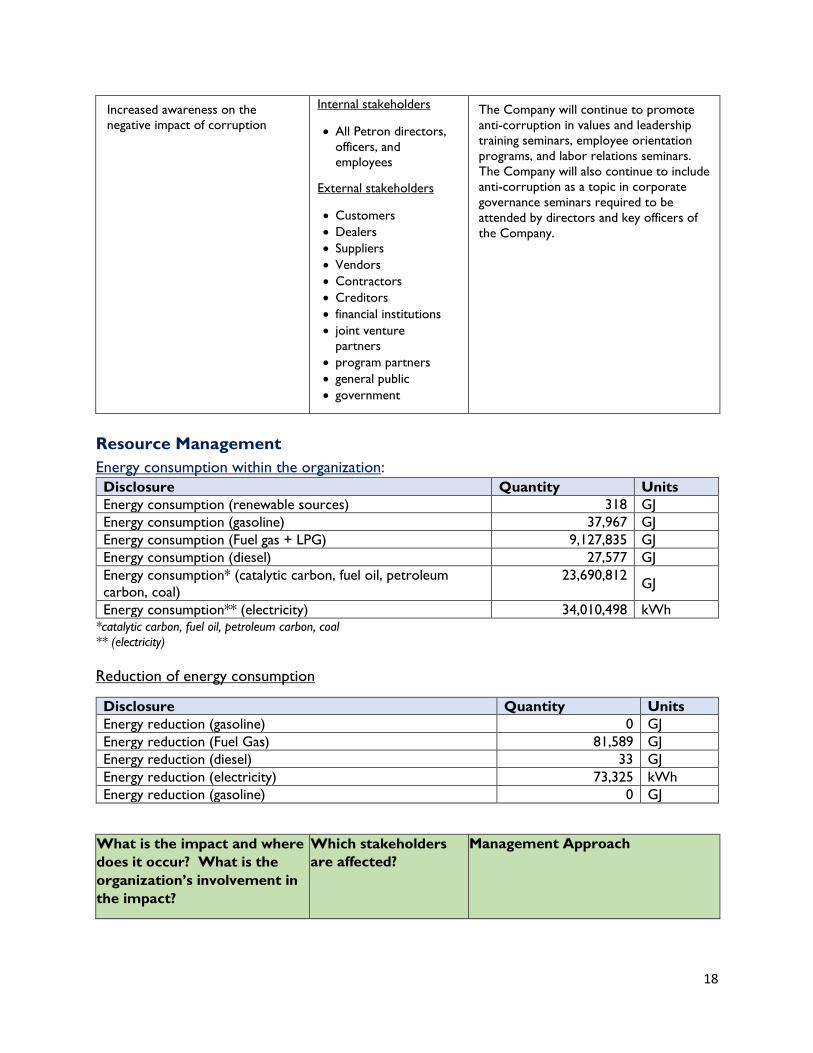
18
Increased awareness on the
negative impact of corruption
Internal stakeholders
• All Petron directors,
officers, and
employees
External stakeholders
• Customers
• Dealers
• Suppliers
• Vendors
• Contractors
• Creditors
• financial institutions
• joint venture
partners
• program partners
• general public
• government
The Company will continue to promote
anti-corruption in values and leadership
training seminars, employee orientation
programs, and labor relations seminars.
The Company will also continue to include
anti-corruption as a topic in corporate
governance seminars required to be
attended by directors and key officers of
the Company.
Resource Management
Energy consumption within the organization:
Disclosure Quantity Units
Energy consumption (renewable sources) 318 GJ
Energy consumption (gasoline) 37,967 GJ
Energy consumption (Fuel gas + LPG) 9,127,835 GJ
Energy consumption (diesel) 27,577 GJ
Energy consumption* (catalytic carbon, fuel oil, petroleum
carbon, coal)
23,690,812 GJ
Energy consumption** (electricity) 34,010,498 kWh *catalytic carbon, fuel oil, petroleum carbon, coal
** (electricity)
Reduction of energy consumption
Disclosure Quantity Units
Energy reduction (gasoline) 0 GJ
Energy reduction (Fuel Gas) 81,589 GJ
Energy reduction (diesel) 33 GJ
Energy reduction (electricity) 73,325 kWh
Energy reduction (gasoline) 0 GJ
What is the impact and where
does it occur? What is the
organization’s involvement in
the impact?
Which stakeholders
are affected?
Management Approach
19
Petron Bataan Refinery accounts
for 99.69% of the energy
consumption of the organization.
The energy consumption has a
material impact on the operating
cost of the organization.
Bulk of the energy utilized comes
from fossil fuel. Air emission from
fuel combustion will impact the air
quality in the area where we
operate and in the fenceline
communities.
Shareholders
Fenceline Communities
Petron Vision, Mission, and Values
Vision
“To be the Leading Provider of Total
Customer Solutions in the Energy Sector
and its Derivative Businesses.”
Mission
We will achieve this by:
• Being an integral part of our
customers’ lives, delivering a
consistent customer experience
through innovative products and
services;
• Developing strategic partnerships in
pursuit of growth and opportunity;
• Leveraging our refining assets to
achieve competitive advantage;
• Fostering an entrepreneurial culture
that encourages teamwork,
innovation, and excellence;
• Caring for our community and
environment;
• Conducting ourselves with
professionalism, integrity, and
fairness;
• Promoting the best interest of all our
stakeholders.
Petron’s Sustainability Priorities
• Environmental Stewardship We
commit to business practices that
help protect the environment
knowing that this accordingly
safeguards the interests of our
company and its stakeholders over
the long term.
• Operational Efficiency We commit to
the continuous improvement of our
operations and in our supply chain,
guided by global efficiency standards.
• Product and Service Innovation We
commit to investing in research and
development for the continuous
enhancement of our products,
services, and processes in order to
delight our customers, achieve
competitive advantage, help shape
the industry, and fuel environmental
protection.
Petron Bataan Refinery was able to
reduce energy consumption by 81,589 GJ
in 2021 by implementing energy efficient
measures in its refinery process. The
20
energy conservation programs
implemented include upgrading the soot
blowers and optimizing combustion
efficiency by monitoring and controlling
excess air in its furnace. The biggest
reduction, accounting to 65% of the
energy consumption reduction in PBR,
came by switching the mode of operation
of a downstream offsite unit from
continuous to batch.
A total of 624,295 GJ of energy was
saved from 2014-2021. Key projects
implemented include the installation of
Flare Gas Recovery Unit and optimization
of steam utilization in process units. Fuel
oil consumption was also reduced by
maximizing the use of High Pressure
Steam from steam generators.
Additional energy consumption reduction
programs will be implemented in 2022.
This RSFFB-3 project, which is expected
to be operational by 2H 2022 will greatly
improve the energy efficiency of the
refinery.
Pilot implementation of the use of solar
power in service stations started in 2021.
Solar panels with 5KW rating were
installed in three service stations.
Average energy supplied from solar
power is 1,000 KWh/month equivalent to
2.5% of the total energy consumption of
the three stations. The program will be
rolled out to other stations to further
increase the percentage of solar power in
our energy mix.
Since 2013, our terminals have been
setting up annual reduction targets in
their power consumption to demonstrate
continuous improvement in their
environmental management system and
to attain higher rating in the Ecowatch
Program. Typical reduction target ranges
from 1-5% per year.
Our terminals, who were the first to
utilize solar energy within Petron, were
able to use 14,351 KWh of solar energy
in 2021. It is set to further increase in the
coming years by installing additional solar
panels for its offices.
Petron Corporation has ASEAN Energy
Management Scheme (AEMAS)-Certified
Energy Managers that are formulating
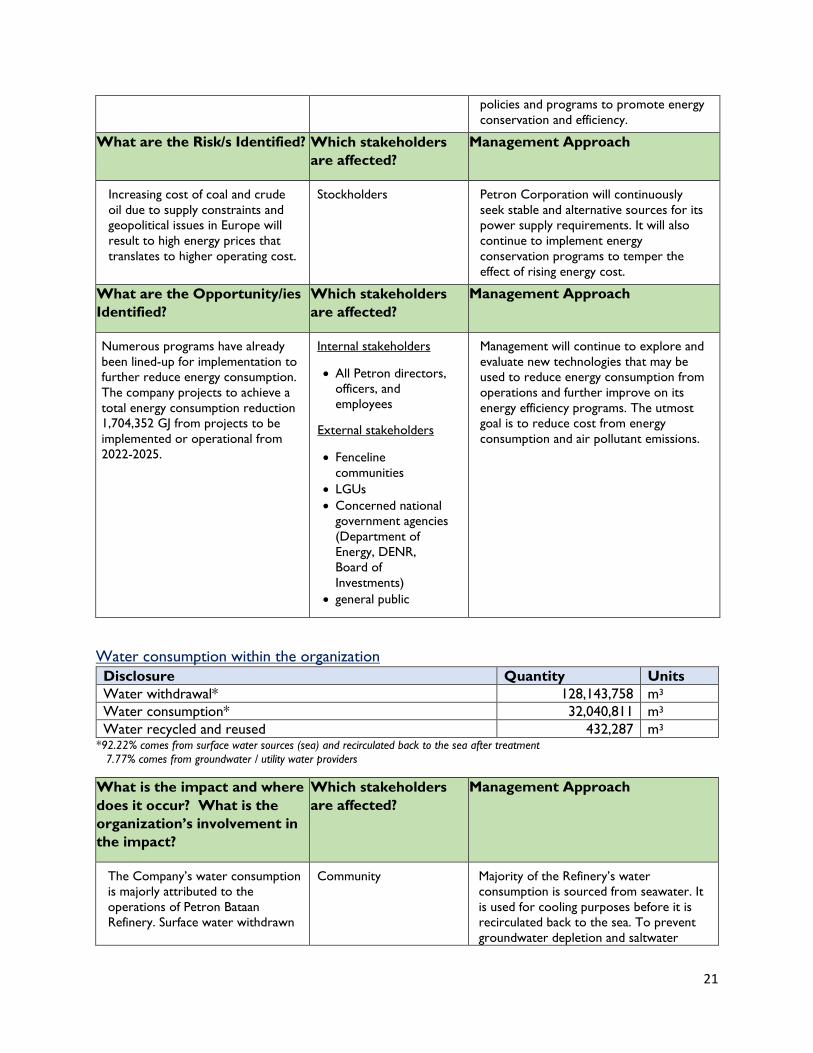
21
policies and programs to promote energy
conservation and efficiency.
What are the Risk/s Identified? Which stakeholders
are affected?
Management Approach
Increasing cost of coal and crude
oil due to supply constraints and
geopolitical issues in Europe will
result to high energy prices that
translates to higher operating cost.
Stockholders Petron Corporation will continuously
seek stable and alternative sources for its
power supply requirements. It will also
continue to implement energy
conservation programs to temper the
effect of rising energy cost.
What are the Opportunity/ies
Identified?
Which stakeholders
are affected?
Management Approach
Numerous programs have already
been lined-up for implementation to
further reduce energy consumption.
The company projects to achieve a
total energy consumption reduction
1,704,352 GJ from projects to be
implemented or operational from
2022-2025.
Internal stakeholders
• All Petron directors,
officers, and
employees
External stakeholders
• Fenceline
communities
• LGUs
• Concerned national
government agencies
(Department of
Energy, DENR,
Board of
Investments)
• general public
Management will continue to explore and
evaluate new technologies that may be
used to reduce energy consumption from
operations and further improve on its
energy efficiency programs. The utmost
goal is to reduce cost from energy
consumption and air pollutant emissions.
Water consumption within the organization
Disclosure Quantity Units
Water withdrawal* 128,143,758 m3
Water consumption* 32,040,811 m3
Water recycled and reused 432,287 m3 *92.22% comes from surface water sources (sea) and recirculated back to the sea after treatment
7.77% comes from groundwater / utility water providers
What is the impact and where
does it occur? What is the
organization’s involvement in
the impact?
Which stakeholders
are affected?
Management Approach
The Company’s water consumption
is majorly attributed to the
operations of Petron Bataan
Refinery. Surface water withdrawn
Community Majority of the Refinery’s water
consumption is sourced from seawater. It
is used for cooling purposes before it is
recirculated back to the sea. To prevent
groundwater depletion and saltwater
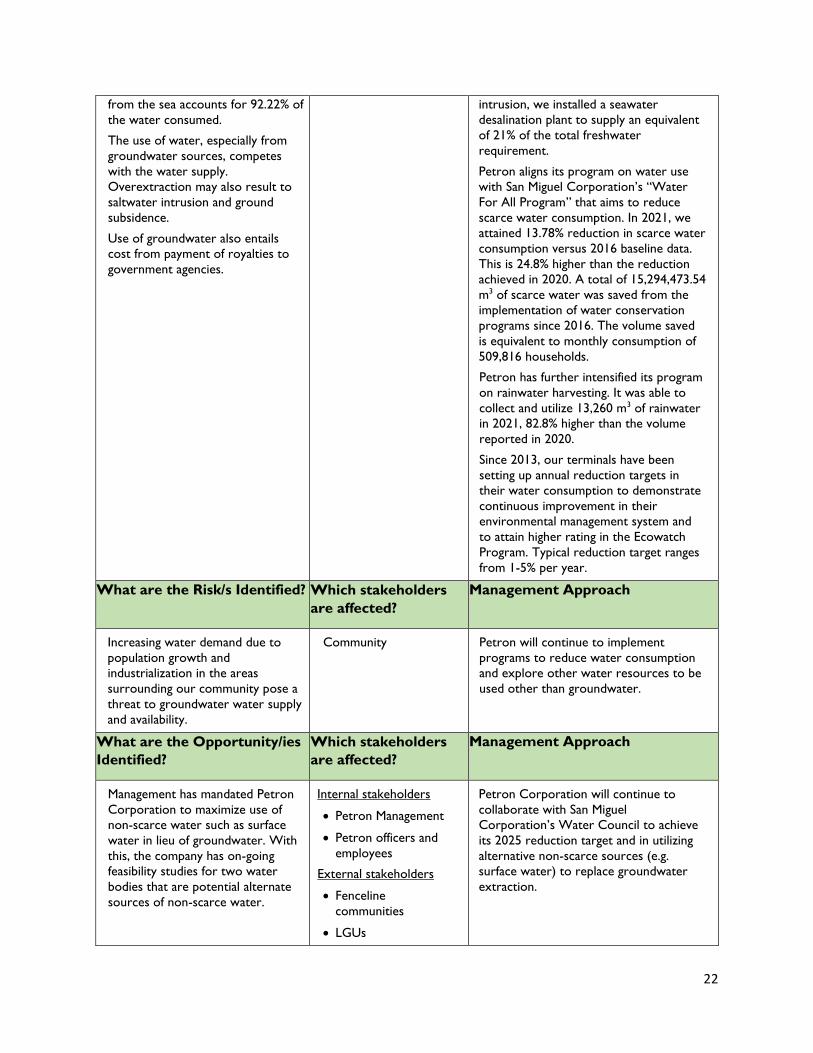
22
from the sea accounts for 92.22% of
the water consumed.
The use of water, especially from
groundwater sources, competes
with the water supply.
Overextraction may also result to
saltwater intrusion and ground
subsidence.
Use of groundwater also entails
cost from payment of royalties to
government agencies.
intrusion, we installed a seawater
desalination plant to supply an equivalent
of 21% of the total freshwater
requirement.
Petron aligns its program on water use
with San Miguel Corporation’s “Water
For All Program” that aims to reduce
scarce water consumption. In 2021, we
attained 13.78% reduction in scarce water
consumption versus 2016 baseline data.
This is 24.8% higher than the reduction
achieved in 2020. A total of 15,294,473.54
m3 of scarce water was saved from the
implementation of water conservation
programs since 2016. The volume saved
is equivalent to monthly consumption of
509,816 households.
Petron has further intensified its program
on rainwater harvesting. It was able to
collect and utilize 13,260 m3 of rainwater
in 2021, 82.8% higher than the volume
reported in 2020.
Since 2013, our terminals have been
setting up annual reduction targets in
their water consumption to demonstrate
continuous improvement in their
environmental management system and
to attain higher rating in the Ecowatch
Program. Typical reduction target ranges
from 1-5% per year.
What are the Risk/s Identified? Which stakeholders
are affected?
Management Approach
Increasing water demand due to
population growth and
industrialization in the areas
surrounding our community pose a
threat to groundwater water supply
and availability.
Community Petron will continue to implement
programs to reduce water consumption
and explore other water resources to be
used other than groundwater.
What are the Opportunity/ies
Identified?
Which stakeholders
are affected?
Management Approach
Management has mandated Petron
Corporation to maximize use of
non-scarce water such as surface
water in lieu of groundwater. With
this, the company has on-going
feasibility studies for two water
bodies that are potential alternate
sources of non-scarce water.
Internal stakeholders
• Petron Management
• Petron officers and
employees
External stakeholders
• Fenceline
communities
• LGUs
Petron Corporation will continue to
collaborate with San Miguel
Corporation’s Water Council to achieve
its 2025 reduction target and in utilizing
alternative non-scarce sources (e.g.
surface water) to replace groundwater
extraction.
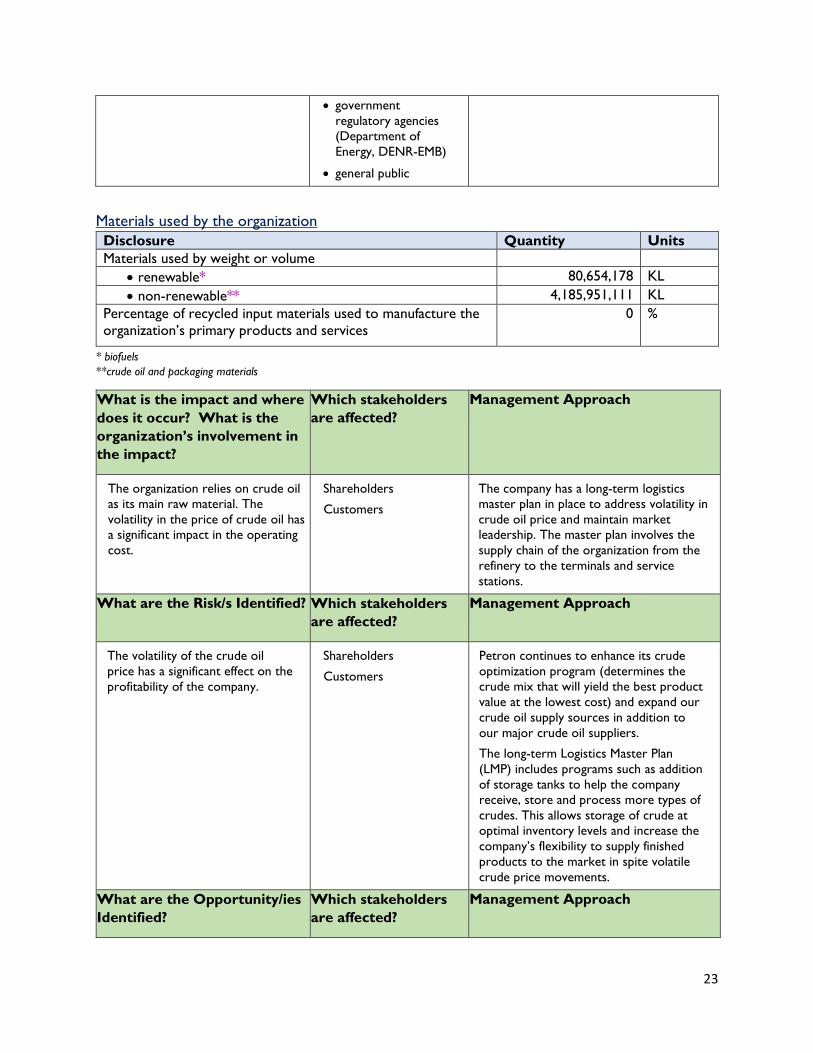
23
• government
regulatory agencies
(Department of
Energy, DENR-EMB)
• general public
Materials used by the organization
Disclosure Quantity Units
Materials used by weight or volume
• renewable* 80,654,178 KL
• non-renewable** 4,185,951,111 KL
Percentage of recycled input materials used to manufacture the
organization’s primary products and services
0 %
* biofuels
**crude oil and packaging materials
What is the impact and where
does it occur? What is the
organization’s involvement in
the impact?
Which stakeholders
are affected?
Management Approach
The organization relies on crude oil
as its main raw material. The
volatility in the price of crude oil has
a significant impact in the operating
cost.
Shareholders
Customers
The company has a long-term logistics
master plan in place to address volatility in
crude oil price and maintain market
leadership. The master plan involves the
supply chain of the organization from the
refinery to the terminals and service
stations.
What are the Risk/s Identified? Which stakeholders
are affected?
Management Approach
The volatility of the crude oil
price has a significant effect on the
profitability of the company.
Shareholders
Customers
Petron continues to enhance its crude
optimization program (determines the
crude mix that will yield the best product
value at the lowest cost) and expand our
crude oil supply sources in addition to
our major crude oil suppliers.
The long-term Logistics Master Plan
(LMP) includes programs such as addition
of storage tanks to help the company
receive, store and process more types of
crudes. This allows storage of crude at
optimal inventory levels and increase the
company’s flexibility to supply finished
products to the market in spite volatile
crude price movements.
What are the Opportunity/ies
Identified?
Which stakeholders
are affected?
Management Approach
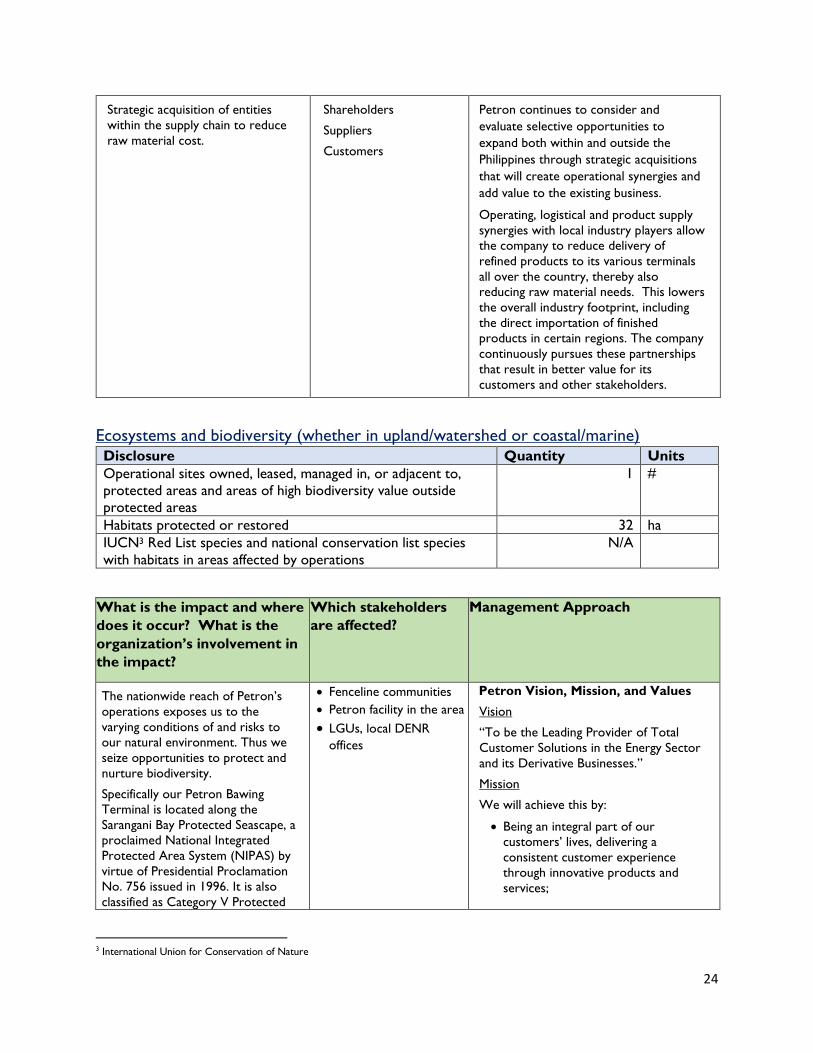
24
Strategic acquisition of entities
within the supply chain to reduce
raw material cost.
Shareholders
Suppliers
Customers
Petron continues to consider and
evaluate selective opportunities to
expand both within and outside the
Philippines through strategic acquisitions
that will create operational synergies and
add value to the existing business.
Operating, logistical and product supply
synergies with local industry players allow
the company to reduce delivery of
refined products to its various terminals
all over the country, thereby also
reducing raw material needs. This lowers
the overall industry footprint, including
the direct importation of finished
products in certain regions. The company
continuously pursues these partnerships
that result in better value for its
customers and other stakeholders.
Ecosystems and biodiversity (whether in upland/watershed or coastal/marine) Disclosure Quantity Units
Operational sites owned, leased, managed in, or adjacent to,
protected areas and areas of high biodiversity value outside
protected areas
1 #
Habitats protected or restored 32 ha
IUCN3 Red List species and national conservation list species
with habitats in areas affected by operations
N/A
What is the impact and where
does it occur? What is the
organization’s involvement in
the impact?
Which stakeholders
are affected?
Management Approach
The nationwide reach of Petron’s
operations exposes us to the
varying conditions of and risks to
our natural environment. Thus we
seize opportunities to protect and
nurture biodiversity.
Specifically our Petron Bawing
Terminal is located along the
Sarangani Bay Protected Seascape, a
proclaimed National Integrated
Protected Area System (NIPAS) by
virtue of Presidential Proclamation
No. 756 issued in 1996. It is also
classified as Category V Protected
• Fenceline communities
• Petron facility in the area
• LGUs, local DENR
offices
Petron Vision, Mission, and Values
Vision
“To be the Leading Provider of Total
Customer Solutions in the Energy Sector
and its Derivative Businesses.”
Mission
We will achieve this by:
• Being an integral part of our
customers’ lives, delivering a
consistent customer experience
through innovative products and
services;
3 International Union for Conservation of Nature
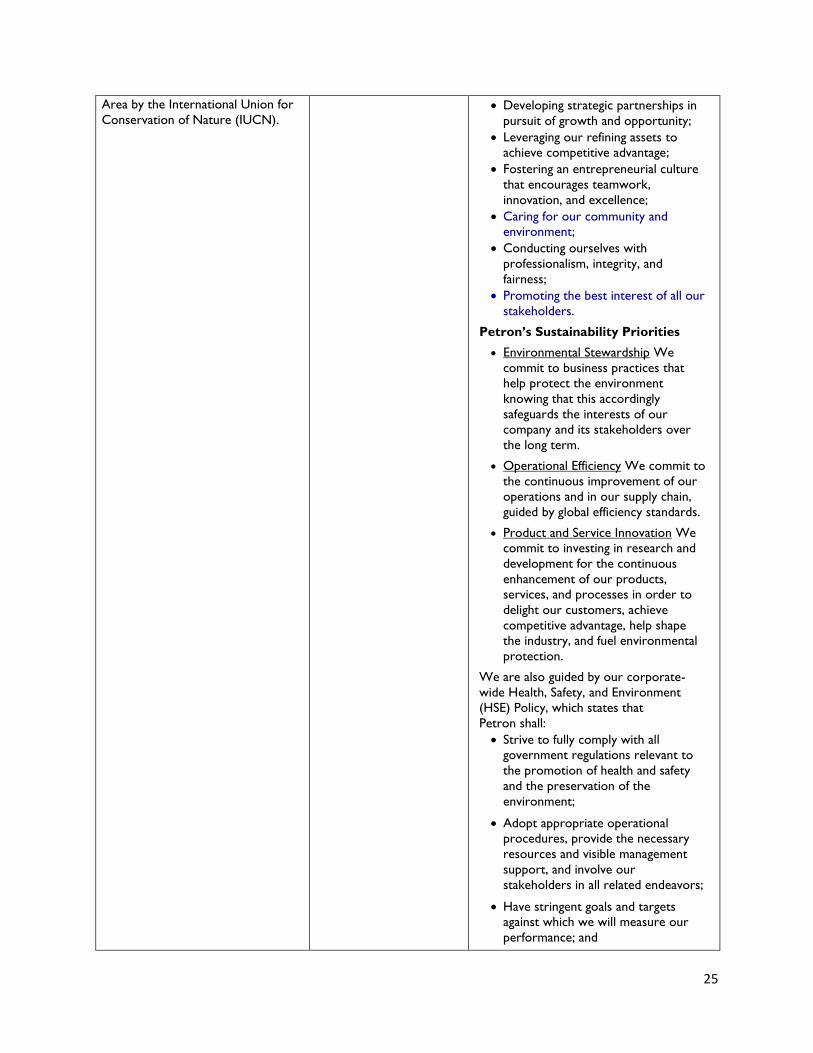
25
Area by the International Union for
Conservation of Nature (IUCN). • Developing strategic partnerships in
pursuit of growth and opportunity;
• Leveraging our refining assets to
achieve competitive advantage;
• Fostering an entrepreneurial culture
that encourages teamwork,
innovation, and excellence;
• Caring for our community and
environment;
• Conducting ourselves with
professionalism, integrity, and
fairness;
• Promoting the best interest of all our
stakeholders.
Petron’s Sustainability Priorities
• Environmental Stewardship We
commit to business practices that
help protect the environment
knowing that this accordingly
safeguards the interests of our
company and its stakeholders over
the long term.
• Operational Efficiency We commit to
the continuous improvement of our
operations and in our supply chain,
guided by global efficiency standards.
• Product and Service Innovation We
commit to investing in research and
development for the continuous
enhancement of our products,
services, and processes in order to
delight our customers, achieve
competitive advantage, help shape
the industry, and fuel environmental
protection.
We are also guided by our corporate-
wide Health, Safety, and Environment
(HSE) Policy, which states that
Petron shall:
• Strive to fully comply with all
government regulations relevant to
the promotion of health and safety
and the preservation of the
environment;
• Adopt appropriate operational
procedures, provide the necessary
resources and visible management
support, and involve our
stakeholders in all related endeavors;
• Have stringent goals and targets
against which we will measure our
performance; and
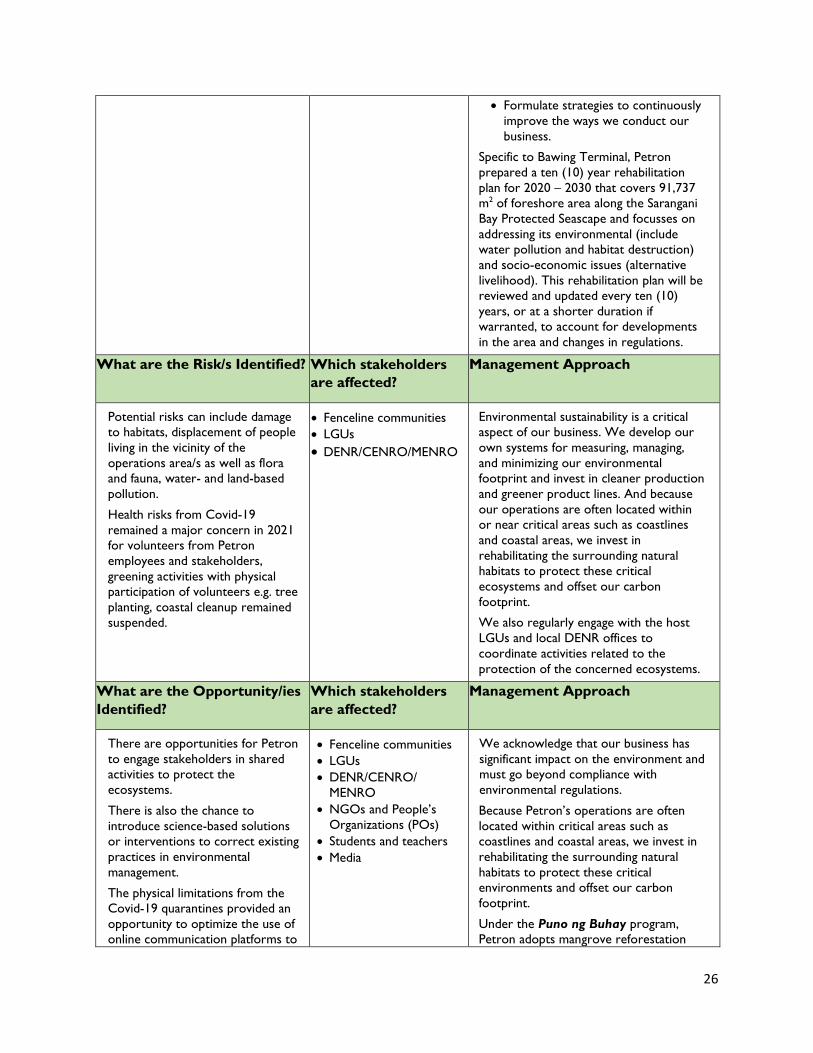
26
• Formulate strategies to continuously
improve the ways we conduct our
business.
Specific to Bawing Terminal, Petron
prepared a ten (10) year rehabilitation
plan for 2020 – 2030 that covers 91,737
m2 of foreshore area along the Sarangani
Bay Protected Seascape and focusses on
addressing its environmental (include
water pollution and habitat destruction)
and socio-economic issues (alternative
livelihood). This rehabilitation plan will be
reviewed and updated every ten (10)
years, or at a shorter duration if
warranted, to account for developments
in the area and changes in regulations.
What are the Risk/s Identified? Which stakeholders
are affected?
Management Approach
Potential risks can include damage
to habitats, displacement of people
living in the vicinity of the
operations area/s as well as flora
and fauna, water- and land-based
pollution.
Health risks from Covid-19
remained a major concern in 2021
for volunteers from Petron
employees and stakeholders,
greening activities with physical
participation of volunteers e.g. tree
planting, coastal cleanup remained
suspended.
• Fenceline communities
• LGUs
• DENR/CENRO/MENRO
Environmental sustainability is a critical
aspect of our business. We develop our
own systems for measuring, managing,
and minimizing our environmental
footprint and invest in cleaner production
and greener product lines. And because
our operations are often located within
or near critical areas such as coastlines
and coastal areas, we invest in
rehabilitating the surrounding natural
habitats to protect these critical
ecosystems and offset our carbon
footprint.
We also regularly engage with the host
LGUs and local DENR offices to
coordinate activities related to the
protection of the concerned ecosystems.
What are the Opportunity/ies
Identified?
Which stakeholders
are affected?
Management Approach
There are opportunities for Petron
to engage stakeholders in shared
activities to protect the
ecosystems.
There is also the chance to
introduce science-based solutions
or interventions to correct existing
practices in environmental
management.
The physical limitations from the
Covid-19 quarantines provided an
opportunity to optimize the use of
online communication platforms to
• Fenceline communities
• LGUs
• DENR/CENRO/
MENRO
• NGOs and People’s
Organizations (POs)
• Students and teachers
• Media
We acknowledge that our business has
significant impact on the environment and
must go beyond compliance with
environmental regulations.
Because Petron’s operations are often
located within critical areas such as
coastlines and coastal areas, we invest in
rehabilitating the surrounding natural
habitats to protect these critical
environments and offset our carbon
footprint.
Under the Puno ng Buhay program,
Petron adopts mangrove reforestation
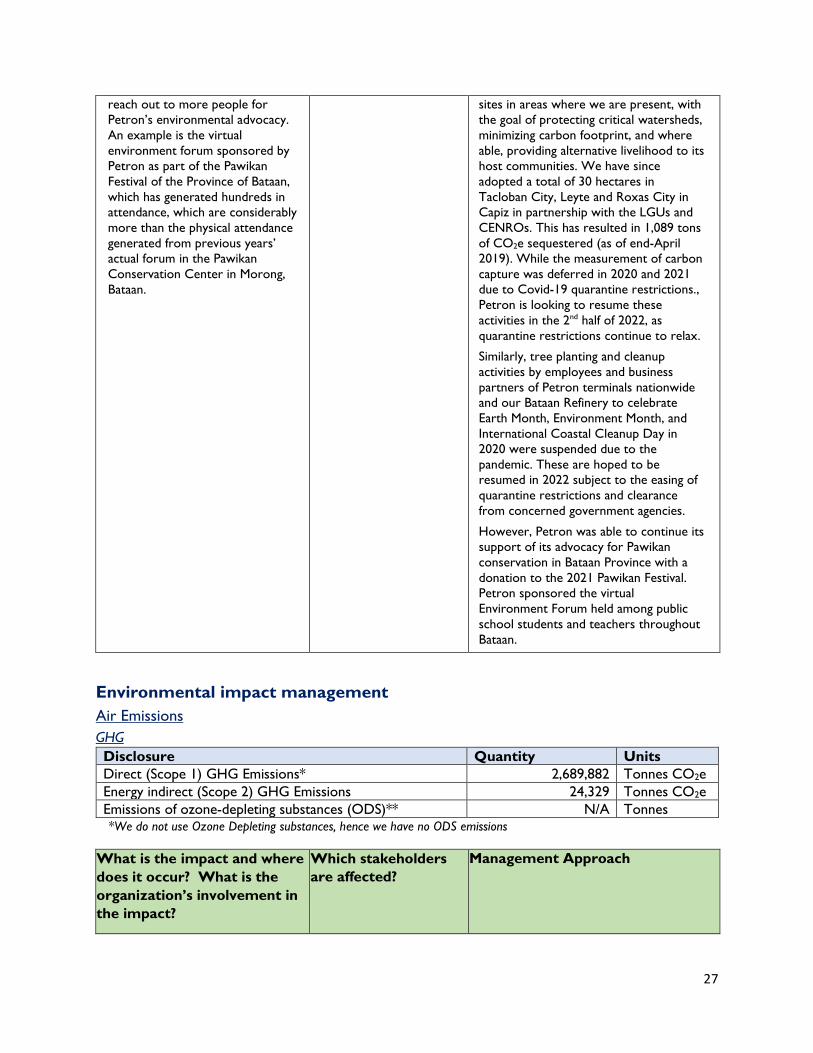
27
reach out to more people for
Petron’s environmental advocacy.
An example is the virtual
environment forum sponsored by
Petron as part of the Pawikan
Festival of the Province of Bataan,
which has generated hundreds in
attendance, which are considerably
more than the physical attendance
generated from previous years’
actual forum in the Pawikan
Conservation Center in Morong,
Bataan.
sites in areas where we are present, with
the goal of protecting critical watersheds,
minimizing carbon footprint, and where
able, providing alternative livelihood to its
host communities. We have since
adopted a total of 30 hectares in
Tacloban City, Leyte and Roxas City in
Capiz in partnership with the LGUs and
CENROs. This has resulted in 1,089 tons
of CO2e sequestered (as of end-April
2019). While the measurement of carbon
capture was deferred in 2020 and 2021
due to Covid-19 quarantine restrictions.,
Petron is looking to resume these
activities in the 2nd half of 2022, as
quarantine restrictions continue to relax.
Similarly, tree planting and cleanup
activities by employees and business
partners of Petron terminals nationwide
and our Bataan Refinery to celebrate
Earth Month, Environment Month, and
International Coastal Cleanup Day in
2020 were suspended due to the
pandemic. These are hoped to be
resumed in 2022 subject to the easing of
quarantine restrictions and clearance
from concerned government agencies.
However, Petron was able to continue its
support of its advocacy for Pawikan
conservation in Bataan Province with a
donation to the 2021 Pawikan Festival.
Petron sponsored the virtual
Environment Forum held among public
school students and teachers throughout
Bataan.
Environmental impact management
Air Emissions
GHG
Disclosure Quantity Units
Direct (Scope 1) GHG Emissions* 2,689,882 Tonnes CO2e
Energy indirect (Scope 2) GHG Emissions 24,329 Tonnes CO2e
Emissions of ozone-depleting substances (ODS)** N/A Tonnes *We do not use Ozone Depleting substances, hence we have no ODS emissions
What is the impact and where
does it occur? What is the
organization’s involvement in
the impact?
Which stakeholders
are affected?
Management Approach
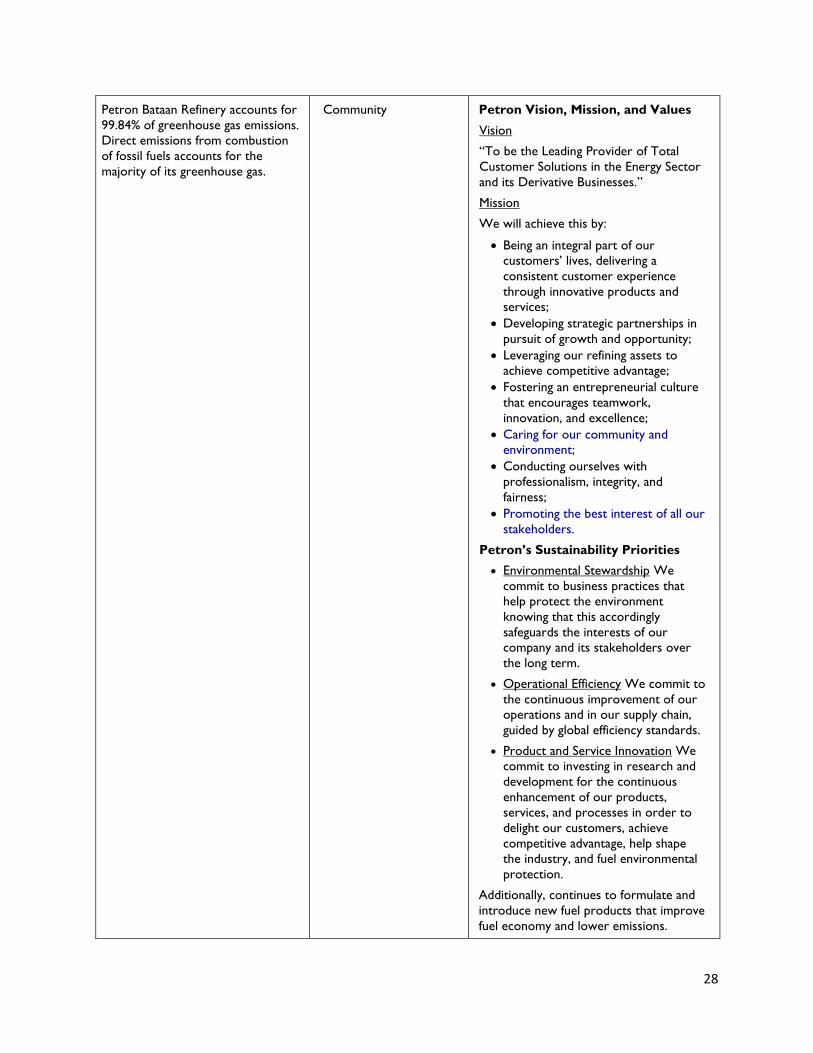
28
Petron Bataan Refinery accounts for
99.84% of greenhouse gas emissions.
Direct emissions from combustion
of fossil fuels accounts for the
majority of its greenhouse gas.
Community Petron Vision, Mission, and Values
Vision
“To be the Leading Provider of Total
Customer Solutions in the Energy Sector
and its Derivative Businesses.”
Mission
We will achieve this by:
• Being an integral part of our
customers’ lives, delivering a
consistent customer experience
through innovative products and
services;
• Developing strategic partnerships in
pursuit of growth and opportunity;
• Leveraging our refining assets to
achieve competitive advantage;
• Fostering an entrepreneurial culture
that encourages teamwork,
innovation, and excellence;
• Caring for our community and
environment;
• Conducting ourselves with
professionalism, integrity, and
fairness;
• Promoting the best interest of all our
stakeholders.
Petron’s Sustainability Priorities
• Environmental Stewardship We
commit to business practices that
help protect the environment
knowing that this accordingly
safeguards the interests of our
company and its stakeholders over
the long term.
• Operational Efficiency We commit to
the continuous improvement of our
operations and in our supply chain,
guided by global efficiency standards.
• Product and Service Innovation We
commit to investing in research and
development for the continuous
enhancement of our products,
services, and processes in order to
delight our customers, achieve
competitive advantage, help shape
the industry, and fuel environmental
protection.
Additionally, continues to formulate and
introduce new fuel products that improve
fuel economy and lower emissions.
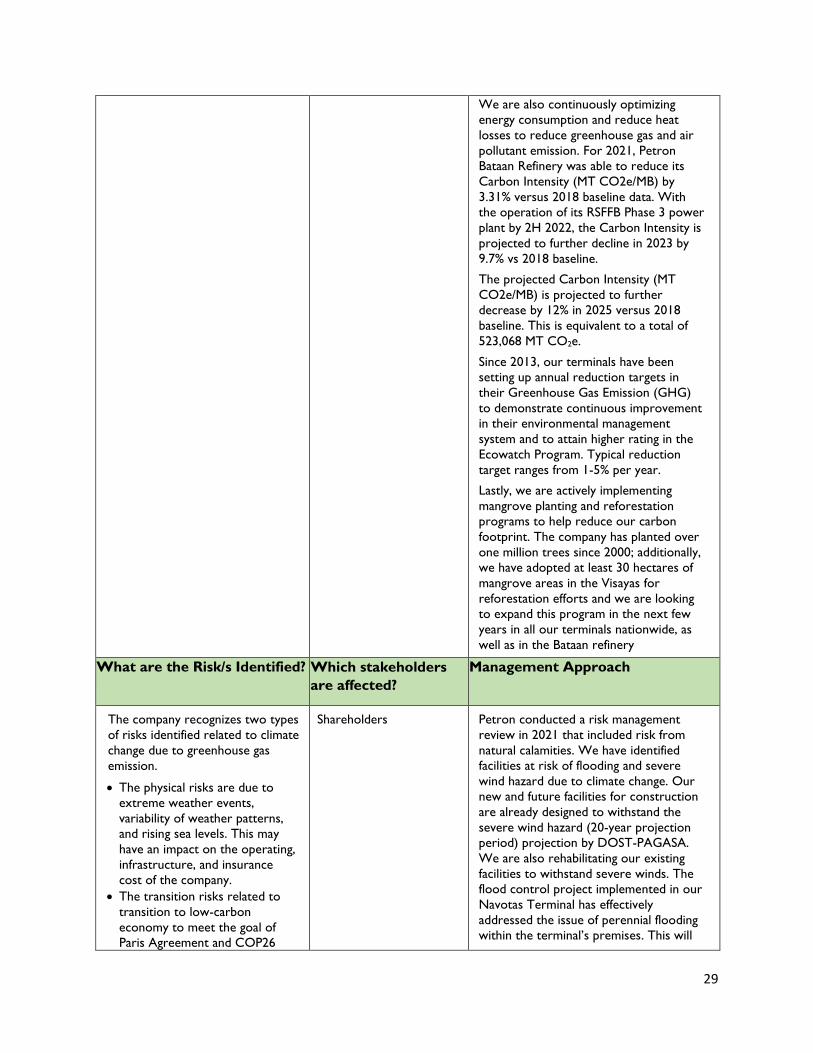
29
We are also continuously optimizing
energy consumption and reduce heat
losses to reduce greenhouse gas and air
pollutant emission. For 2021, Petron
Bataan Refinery was able to reduce its
Carbon Intensity (MT CO2e/MB) by
3.31% versus 2018 baseline data. With
the operation of its RSFFB Phase 3 power
plant by 2H 2022, the Carbon Intensity is
projected to further decline in 2023 by
9.7% vs 2018 baseline.
The projected Carbon Intensity (MT
CO2e/MB) is projected to further
decrease by 12% in 2025 versus 2018
baseline. This is equivalent to a total of
523,068 MT CO2e.
Since 2013, our terminals have been
setting up annual reduction targets in
their Greenhouse Gas Emission (GHG)
to demonstrate continuous improvement
in their environmental management
system and to attain higher rating in the
Ecowatch Program. Typical reduction
target ranges from 1-5% per year.
Lastly, we are actively implementing
mangrove planting and reforestation
programs to help reduce our carbon
footprint. The company has planted over
one million trees since 2000; additionally,
we have adopted at least 30 hectares of
mangrove areas in the Visayas for
reforestation efforts and we are looking
to expand this program in the next few
years in all our terminals nationwide, as
well as in the Bataan refinery
What are the Risk/s Identified? Which stakeholders
are affected?
Management Approach
The company recognizes two types
of risks identified related to climate
change due to greenhouse gas
emission.
• The physical risks are due to
extreme weather events,
variability of weather patterns,
and rising sea levels. This may
have an impact on the operating,
infrastructure, and insurance
cost of the company.
• The transition risks related to
transition to low-carbon
economy to meet the goal of
Paris Agreement and COP26
Shareholders Petron conducted a risk management
review in 2021 that included risk from
natural calamities. We have identified
facilities at risk of flooding and severe
wind hazard due to climate change. Our
new and future facilities for construction
are already designed to withstand the
severe wind hazard (20-year projection
period) projection by DOST-PAGASA.
We are also rehabilitating our existing
facilities to withstand severe winds. The
flood control project implemented in our
Navotas Terminal has effectively
addressed the issue of perennial flooding
within the terminal’s premises. This will
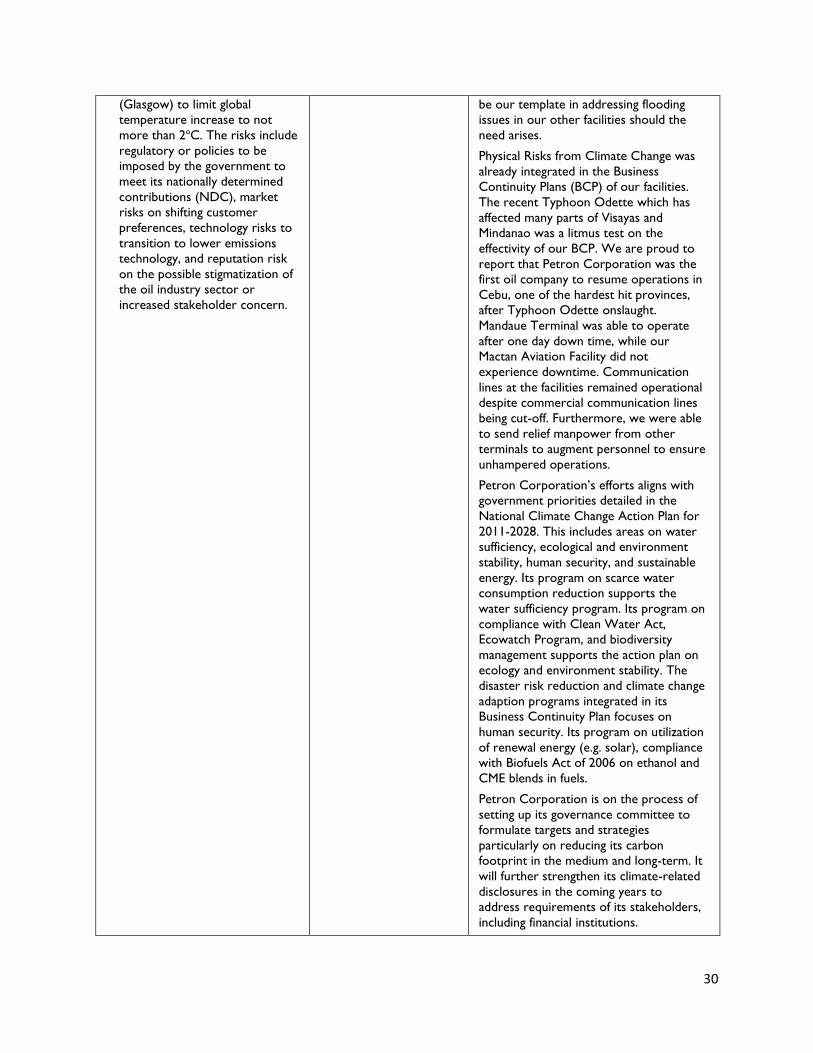
30
(Glasgow) to limit global
temperature increase to not
more than 2oC. The risks include
regulatory or policies to be
imposed by the government to
meet its nationally determined
contributions (NDC), market
risks on shifting customer
preferences, technology risks to
transition to lower emissions
technology, and reputation risk
on the possible stigmatization of
the oil industry sector or
increased stakeholder concern.
be our template in addressing flooding
issues in our other facilities should the
need arises.
Physical Risks from Climate Change was
already integrated in the Business
Continuity Plans (BCP) of our facilities.
The recent Typhoon Odette which has
affected many parts of Visayas and
Mindanao was a litmus test on the
effectivity of our BCP. We are proud to
report that Petron Corporation was the
first oil company to resume operations in
Cebu, one of the hardest hit provinces,
after Typhoon Odette onslaught.
Mandaue Terminal was able to operate
after one day down time, while our
Mactan Aviation Facility did not
experience downtime. Communication
lines at the facilities remained operational
despite commercial communication lines
being cut-off. Furthermore, we were able
to send relief manpower from other
terminals to augment personnel to ensure
unhampered operations.
Petron Corporation’s efforts aligns with
government priorities detailed in the
National Climate Change Action Plan for
2011-2028. This includes areas on water
sufficiency, ecological and environment
stability, human security, and sustainable
energy. Its program on scarce water
consumption reduction supports the
water sufficiency program. Its program on
compliance with Clean Water Act,
Ecowatch Program, and biodiversity
management supports the action plan on
ecology and environment stability. The
disaster risk reduction and climate change
adaption programs integrated in its
Business Continuity Plan focuses on
human security. Its program on utilization
of renewal energy (e.g. solar), compliance
with Biofuels Act of 2006 on ethanol and
CME blends in fuels.
Petron Corporation is on the process of
setting up its governance committee to
formulate targets and strategies
particularly on reducing its carbon
footprint in the medium and long-term. It
will further strengthen its climate-related
disclosures in the coming years to
address requirements of its stakeholders,
including financial institutions.
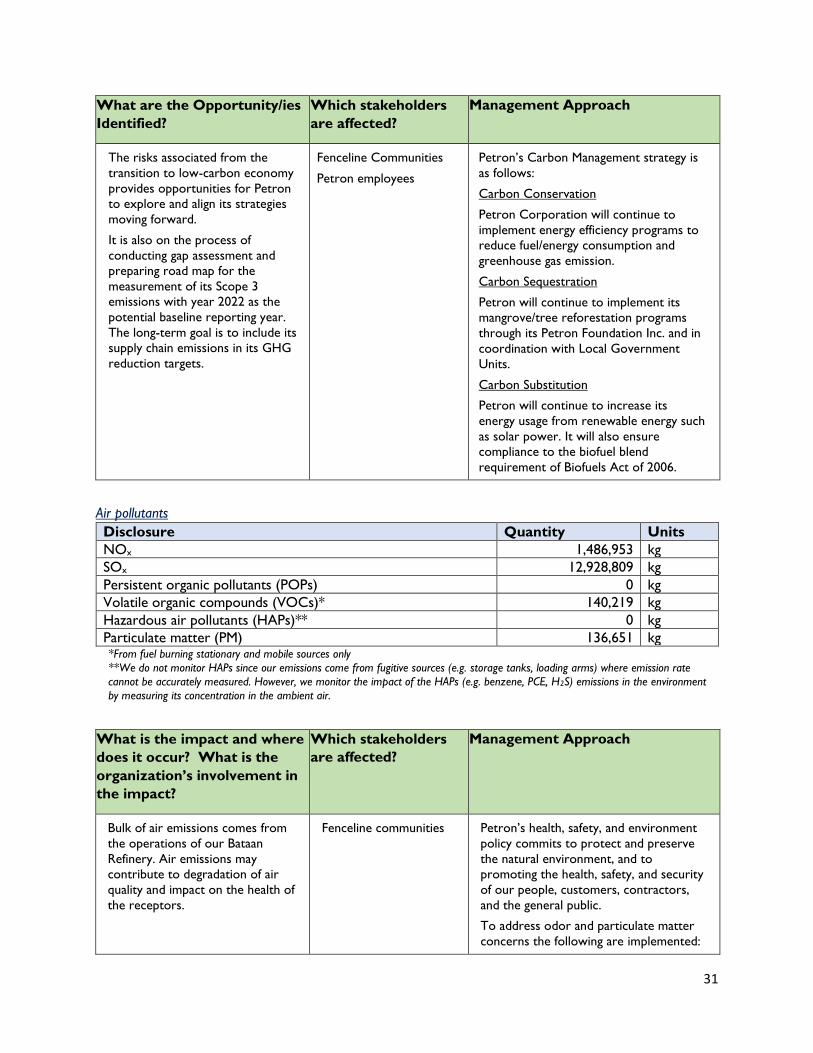
31
What are the Opportunity/ies
Identified?
Which stakeholders
are affected?
Management Approach
The risks associated from the
transition to low-carbon economy
provides opportunities for Petron
to explore and align its strategies
moving forward.
It is also on the process of
conducting gap assessment and
preparing road map for the
measurement of its Scope 3
emissions with year 2022 as the
potential baseline reporting year.
The long-term goal is to include its
supply chain emissions in its GHG
reduction targets.
Fenceline Communities
Petron employees
Petron’s Carbon Management strategy is
as follows:
Carbon Conservation
Petron Corporation will continue to
implement energy efficiency programs to
reduce fuel/energy consumption and
greenhouse gas emission.
Carbon Sequestration
Petron will continue to implement its
mangrove/tree reforestation programs
through its Petron Foundation Inc. and in
coordination with Local Government
Units.
Carbon Substitution
Petron will continue to increase its
energy usage from renewable energy such
as solar power. It will also ensure
compliance to the biofuel blend
requirement of Biofuels Act of 2006.
Air pollutants
Disclosure Quantity Units
NOx 1,486,953 kg
SOx 12,928,809 kg
Persistent organic pollutants (POPs) 0 kg
Volatile organic compounds (VOCs)* 140,219 kg
Hazardous air pollutants (HAPs)** 0 kg
Particulate matter (PM) 136,651 kg *From fuel burning stationary and mobile sources only
**We do not monitor HAPs since our emissions come from fugitive sources (e.g. storage tanks, loading arms) where emission rate
cannot be accurately measured. However, we monitor the impact of the HAPs (e.g. benzene, PCE, H2S) emissions in the environment
by measuring its concentration in the ambient air.
What is the impact and where
does it occur? What is the
organization’s involvement in
the impact?
Which stakeholders
are affected?
Management Approach
Bulk of air emissions comes from
the operations of our Bataan
Refinery. Air emissions may
contribute to degradation of air
quality and impact on the health of
the receptors.
Fenceline communities Petron’s health, safety, and environment
policy commits to protect and preserve
the natural environment, and to
promoting the health, safety, and security
of our people, customers, contractors,
and the general public.
To address odor and particulate matter
concerns the following are implemented:
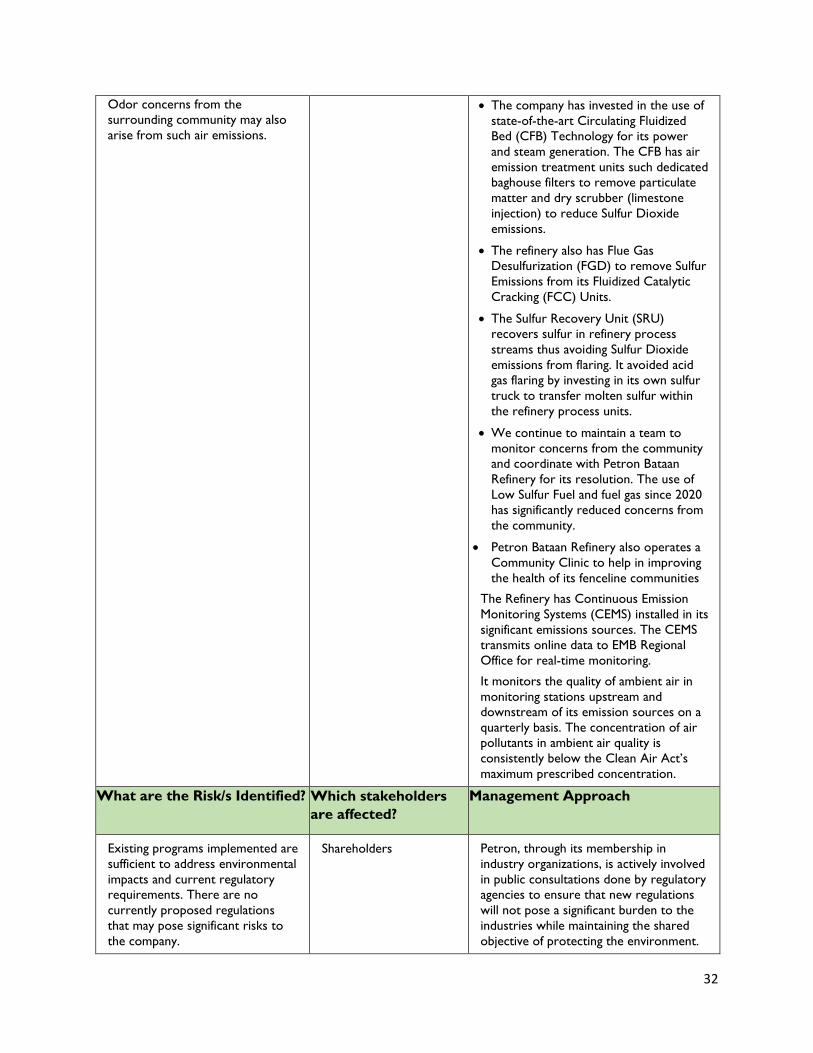
32
Odor concerns from the
surrounding community may also
arise from such air emissions.
• The company has invested in the use of
state-of-the-art Circulating Fluidized
Bed (CFB) Technology for its power
and steam generation. The CFB has air
emission treatment units such dedicated
baghouse filters to remove particulate
matter and dry scrubber (limestone
injection) to reduce Sulfur Dioxide
emissions.
• The refinery also has Flue Gas
Desulfurization (FGD) to remove Sulfur
Emissions from its Fluidized Catalytic
Cracking (FCC) Units.
• The Sulfur Recovery Unit (SRU)
recovers sulfur in refinery process
streams thus avoiding Sulfur Dioxide
emissions from flaring. It avoided acid
gas flaring by investing in its own sulfur
truck to transfer molten sulfur within
the refinery process units.
• We continue to maintain a team to
monitor concerns from the community
and coordinate with Petron Bataan
Refinery for its resolution. The use of
Low Sulfur Fuel and fuel gas since 2020
has significantly reduced concerns from
the community.
• Petron Bataan Refinery also operates a
Community Clinic to help in improving
the health of its fenceline communities
The Refinery has Continuous Emission
Monitoring Systems (CEMS) installed in its
significant emissions sources. The CEMS
transmits online data to EMB Regional
Office for real-time monitoring.
It monitors the quality of ambient air in
monitoring stations upstream and
downstream of its emission sources on a
quarterly basis. The concentration of air
pollutants in ambient air quality is
consistently below the Clean Air Act’s
maximum prescribed concentration.
What are the Risk/s Identified? Which stakeholders
are affected?
Management Approach
Existing programs implemented are
sufficient to address environmental
impacts and current regulatory
requirements. There are no
currently proposed regulations
that may pose significant risks to
the company.
Shareholders Petron, through its membership in
industry organizations, is actively involved
in public consultations done by regulatory
agencies to ensure that new regulations
will not pose a significant burden to the
industries while maintaining the shared
objective of protecting the environment.
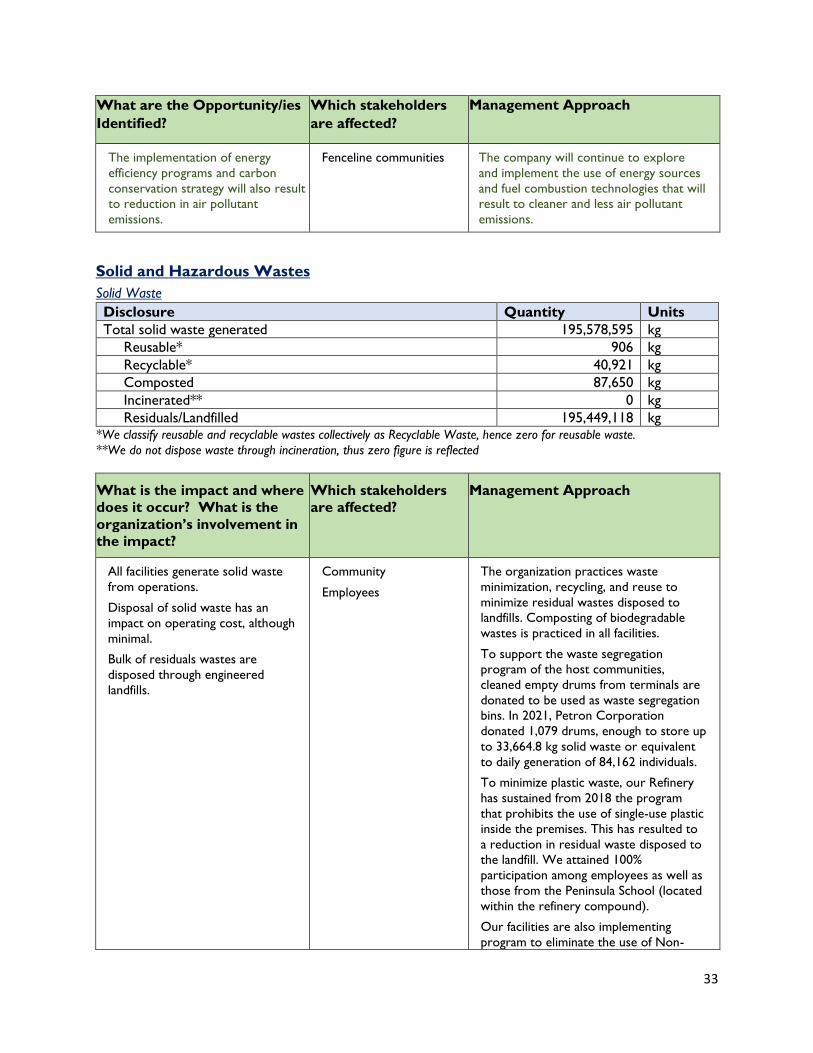
33
What are the Opportunity/ies
Identified?
Which stakeholders
are affected?
Management Approach
The implementation of energy
efficiency programs and carbon
conservation strategy will also result
to reduction in air pollutant
emissions.
Fenceline communities The company will continue to explore
and implement the use of energy sources
and fuel combustion technologies that will
result to cleaner and less air pollutant
emissions.
Solid and Hazardous Wastes
Solid Waste
Disclosure Quantity Units
Total solid waste generated 195,578,595 kg
Reusable* 906 kg
Recyclable* 40,921 kg
Composted 87,650 kg
Incinerated** 0 kg
Residuals/Landfilled 195,449,118 kg *We classify reusable and recyclable wastes collectively as Recyclable Waste, hence zero for reusable waste.
**We do not dispose waste through incineration, thus zero figure is reflected
What is the impact and where
does it occur? What is the
organization’s involvement in
the impact?
Which stakeholders
are affected?
Management Approach
All facilities generate solid waste
from operations.
Disposal of solid waste has an
impact on operating cost, although
minimal.
Bulk of residuals wastes are
disposed through engineered
landfills.
Community
Employees
The organization practices waste
minimization, recycling, and reuse to
minimize residual wastes disposed to
landfills. Composting of biodegradable
wastes is practiced in all facilities.
To support the waste segregation
program of the host communities,
cleaned empty drums from terminals are
donated to be used as waste segregation
bins. In 2021, Petron Corporation
donated 1,079 drums, enough to store up
to 33,664.8 kg solid waste or equivalent
to daily generation of 84,162 individuals.
To minimize plastic waste, our Refinery
has sustained from 2018 the program
that prohibits the use of single-use plastic
inside the premises. This has resulted to
a reduction in residual waste disposed to
the landfill. We attained 100%
participation among employees as well as
those from the Peninsula School (located
within the refinery compound).
Our facilities are also implementing
program to eliminate the use of Non-
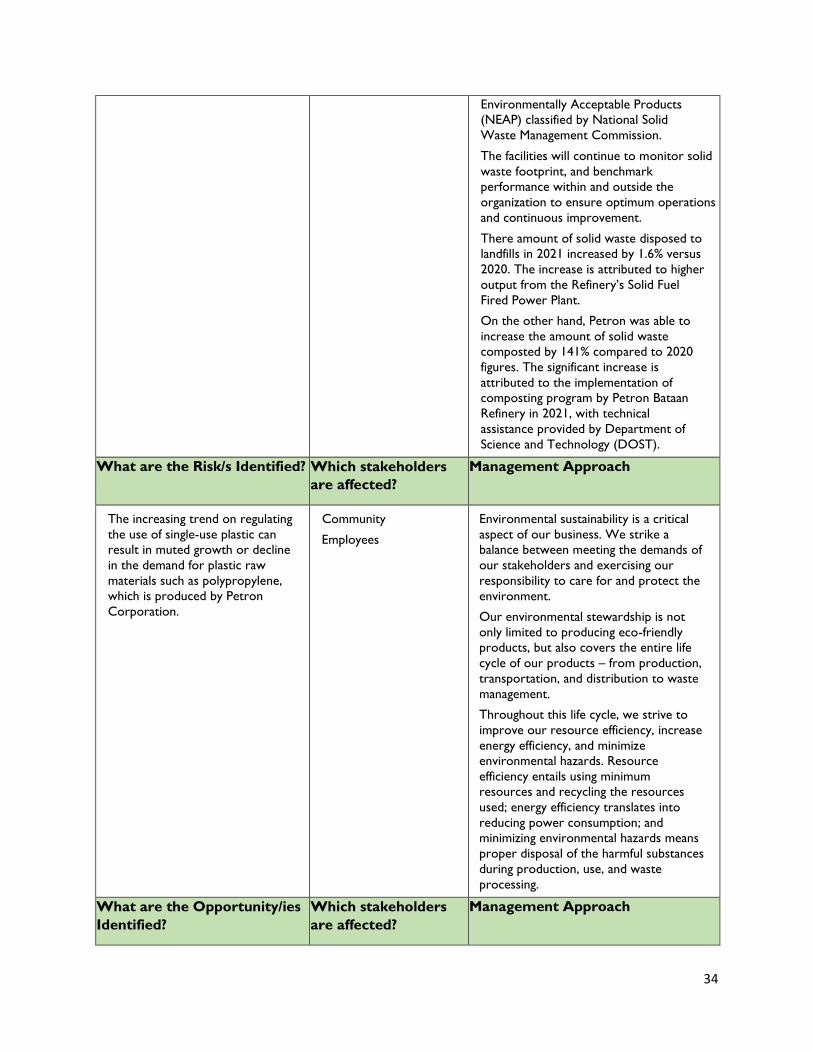
34
Environmentally Acceptable Products
(NEAP) classified by National Solid
Waste Management Commission.
The facilities will continue to monitor solid
waste footprint, and benchmark
performance within and outside the
organization to ensure optimum operations
and continuous improvement.
There amount of solid waste disposed to
landfills in 2021 increased by 1.6% versus
2020. The increase is attributed to higher
output from the Refinery’s Solid Fuel
Fired Power Plant.
On the other hand, Petron was able to
increase the amount of solid waste
composted by 141% compared to 2020
figures. The significant increase is
attributed to the implementation of
composting program by Petron Bataan
Refinery in 2021, with technical
assistance provided by Department of
Science and Technology (DOST).
What are the Risk/s Identified? Which stakeholders
are affected?
Management Approach
The increasing trend on regulating
the use of single-use plastic can
result in muted growth or decline
in the demand for plastic raw
materials such as polypropylene,
which is produced by Petron
Corporation.
Community
Employees
Environmental sustainability is a critical
aspect of our business. We strike a
balance between meeting the demands of
our stakeholders and exercising our
responsibility to care for and protect the
environment.
Our environmental stewardship is not
only limited to producing eco-friendly
products, but also covers the entire life
cycle of our products – from production,
transportation, and distribution to waste
management.
Throughout this life cycle, we strive to
improve our resource efficiency, increase
energy efficiency, and minimize
environmental hazards. Resource
efficiency entails using minimum
resources and recycling the resources
used; energy efficiency translates into
reducing power consumption; and
minimizing environmental hazards means
proper disposal of the harmful substances
during production, use, and waste
processing.
What are the Opportunity/ies
Identified?
Which stakeholders
are affected?
Management Approach
35
The production of environmental-
friendly packaging such as
biodegradable plastics is an
opportunity to tackle the issue on
single-use plastics.
The practice of waste management
in our facilities is also an
opportunity for Petron to assist
the LGU in implementing R.A.
9003 through its company-wide
practice of waste reduction,
recycling and reuse, as well as
composting, to minimize solid
waste disposal in public landfills.
We are also providing cleaned
used empty drums to communities
and stakeholders to serve as waste
bins for segregated trash.
EMB Regional Office has granted
Petron Bataan Refinery’s request
to re-classify its spent limestone
power from its power plant as
non-hazardous waste. This paved
the way for the refinery to explore
beneficial uses of its spent
limestone powder, which is
currently disposed to engineered
landfill.
Fenceline communities
and LGUs
Various Petron
stakeholders (schools,
AFP, PNP, PCG, etc.)
Petron employees
Petron is aggressive in pursuing
environment-friendly solutions in
addressing the issue on single-use
plastics.
We will also continue to seek and
explore opportunities for the use and
potential application of its spent
limestone powder, which accounts for
99.86% of the total solid waste disposed
to landfills.
Hazardous Waste
Disclosure Quantity Units
Total weight of hazardous waste generated 1,324,138 kg
Total weight of hazardous waste transported 7,372,618 kg
What is the impact and where
does it occur? What is the
organization’s involvement in
the impact?
Which stakeholders
are affected?
Management Approach
All operating facilities generate
hazardous waste. Petron Bataan
Refinery accounted for 83% of the
total hazardous waste generated in
2021. Waste generated are disposed
through DENR-accredited treaters
in accordance with regulations.
Disposal of hazardous waste entails
cost to the operations. It accounts
for the bulk of the waste
management cost.
Community
Employees
The organization has been implementing
programs to manage and reduce its
footprint on hazardous waste. It has
implemented Project Solhaze in its
Bataan Refinery to characterize
hazardous waste streams and identify
opportunities to reduce generation.
Among the programs implemented are
supplier buy-back of waste catalysts,
dewatering of waste sludge, maximized
use of phenolic caustic treatment unit to
eliminate ex-situ disposal of hazardous
36
spent caustic waste, use of oily sludge as
quenching water in the delayed coker
unit, use of spent activated carbon and
spent clay as fuel in the RSFFB, and more
efficient management of hazardous
wastes generated in various refinery
areas. All these contributed to 69.72%
reduction in hazardous waste generation
at the Refinery in 2021 versus 2020.
In the terminals, implementation of
waterless receiving of fuel products in
some pier facilities also eliminated
generation of oily water. Furthermore,
bulk delivery of fuel additives has been
implemented in the terminals eliminating
the generation of empty steel drums,
which are classified as hazardous waste in
the regulation (RA 6969).
The research and testing center has also
shifted to test methods that generates
lower or eliminates hazardous waste. An
example is the alternative method for
determining the TBN of fresh lube oil
using FTIR instead of chlorobenzene,
thereby reducing TBN hazardous waste,
minimizing risk of hazwaste exposure to
personnel, workplace and environment.
Such alternative test methods resulted to
the 32% reduction of chlorinated
hazwastes. Proper segregation of product
samples tested in the laboratory helped
us significantly reduce the waste
generated from retained samples at
laboratory. We have also implemented
programs to minimize solvent washing
wastes, a mixture of fuels, lubes, used oil
and chemical reagents. We had 15.5%
reduction of solvent washing wastes
generated last year versus the previous
year.
Our facilities will continue to monitor
their hazardous waste footprint, and
benchmark performance within and
outside the organization to ensure
optimum operations and continuous
improvement.
What are the Risk/s Identified? Which stakeholders
are affected?
Management Approach
The organization is dependent on
the services of third party DENR-
accredited hazardous waste
transporters/treaters for the
Petron Bataan Refinery
and Terminal Operations
DENR
The organization has a rigorous vetting
process for selecting third party service
providers for the transport and disposal
of its hazardous waste. Due diligence and
37
disposal of hazardous wastes. It is
jointly liable if environmental
incidents (e.g. spills) occur during
transport or if wastes are not
treated properly.
Accredited hazardous
waste transporters/
treaters
regular performance evaluation are done
to ensure that all hazardous wastes are
disposed in accordance to regulations.
What are the Opportunity/ies
Identified?
Which stakeholders
are affected?
Management Approach
The cost of disposal of hazardous
waste accounts for the bulk of
waste management expenditure of
the organization. Since 2018,
Petron Bataan Refinery has reused
3,017 metric tons of hazardous
waste in its process. This program,
including improvements in its
waste handling process, was able
to reduce cost of disposal by P28.1
Million.
Petron Corporation will continue
to explore opportunities to reduce
its waste generation and cost of
disposal.
Petron Bataan Refinery
and Terminal Operations
Petron Corporate
Environment Group
DENR-EMB
Petron Corporation will continuously
explore opportunities to reduce its
hazardous waste generation by using its
hazardous wastes as feed or raw
materials for its refinery process.
Effluents
Disclosure Quantity Units
Total volume of water discharges 96,105,200 m3
Percent of wastewater recycled* 0.45 % *Recycling of treated wastewater is not practiced, but we have programs to reuse/recycle wastewater generated within the
process units to reduce wastewater generation and water consumption
What is the impact and where
does it occur? What is the
organization’s involvement in
the impact?
Which stakeholders
are affected?
Management Approach
Petron Bataan Refinery and the
terminals discharge treated
wastewater to coastal surface
waters. It accounted for 99.67% of
the total volume of wastewater
discharged in 2021. The organization
ensures that all wastewater
discharge complies with the
wastewater effluent standards of the
Clean Water Act.
Wastewater discharge, especially if
untreated, contributes to water
pollution.
Community Reduction of water consumption and
wastewater generation has been a
priority of Petron Corporation. Beginning
2010, it implemented Project CODy at
the Petron Bataan Refinery to identify all
waste streams, characterize its quality,
and identify opportunities to reduce,
reuse/recycle, or eliminate wastewater
generation. The project was further
reinforced in 2016 after the completion
of its major expansion program. Among
the projects implemented are:
• reuse of stripped sour water
• reduction of condensable blowdown
38
• reduction of wastewater from crude
desalter.
Since 2018, Petron has reused a total of
6,068,677 m3 of wastewater equivalent to
around 1.5% of the total wastewater
discharged.
The installation of dedicated receiving
pipelines at the pier facility of terminals
has eliminated the generation of
wastewater from product pushing.
Coastal cleanups are also done regularly
by Petron terminals nationwide in
partnership with the host community and
other government institutions to reduce
marine pollution in areas where it
operates.
What are the Risk/s Identified? Which stakeholders
are affected?
Management Approach
The issuance of DENR
Administrative Order 2021-19 on
relaxation of effluent standards for
certain parameters applicable to
Petron Bataan Refinery has
eliminated the risk of non-
compliance with effluent standards
and upgrade of wastewater
treatment facility is no longer
necessary. Current programs are
sufficient to address environmental
impacts. There are currently no
potential risks identified with the
current regulatory environment.
Petron Bataan Refinery
and Terminal Operations
DENR-EMB
Petron Corporation will continue to be
proactive in its approach on wastewater
management.
It will continue to invest in treatment
technologies and in the efficient operations
of its wastewater treatment facilities to
ensure consistent compliance with
regulatory requirements.
What are the Opportunity/ies
Identified?
Which stakeholders
are affected?
Management Approach
The organization is exploring
technologies to increase the
percentage of wastewater recycled.
This is also aligned with the
managements goal to reduce raw
water consumption for the
operations.
Petron Bataan Refinery
and Terminal Operations
Petron Corporate
Environment Group
DENR-EMB
Petron Management encourages
personnel to be innovative and make out-
of-the box solutions to opportunities and
challenges. The Corporate Environment
Group has an annual program dubbed
Best Environmental Initiative to
recognize facilities that implement
programs that can reduce environment
footprint and thereby increase
operational efficiency.
Our facilities will continue to monitor
water and wastewater footprint, and
benchmark performance within and
outside the organization to ensure
optimum operations and continuous
improvement.
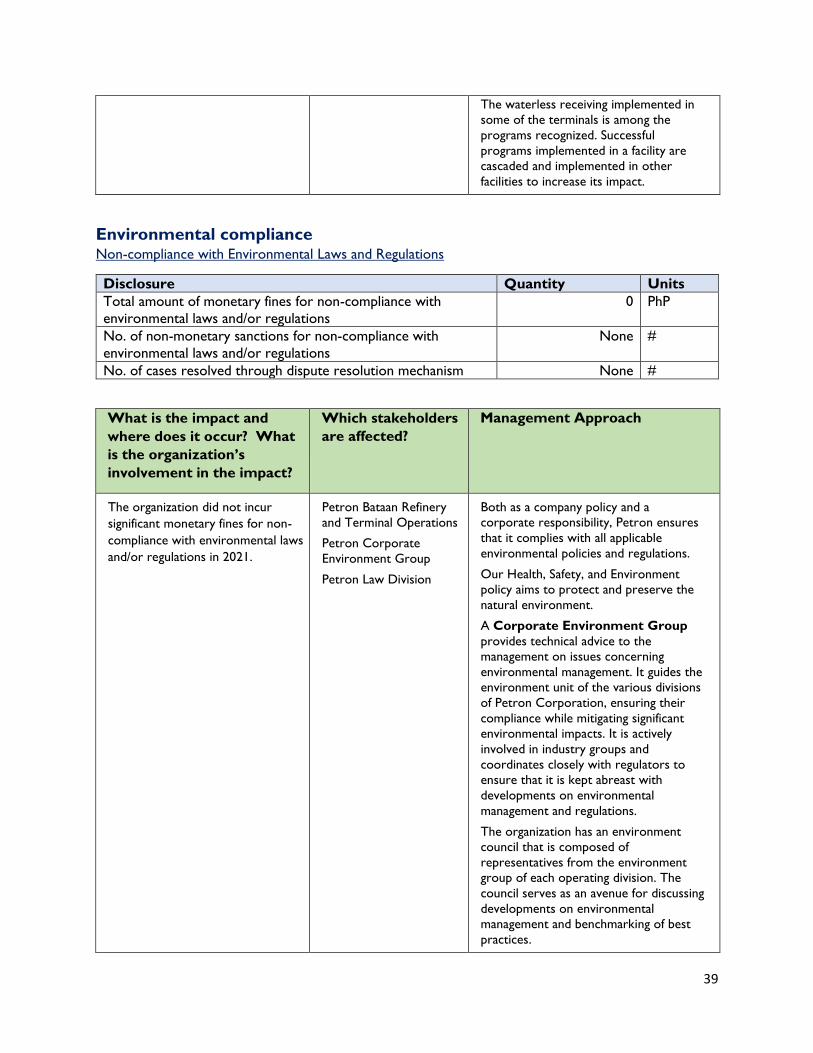
39
The waterless receiving implemented in
some of the terminals is among the
programs recognized. Successful
programs implemented in a facility are
cascaded and implemented in other
facilities to increase its impact.
Environmental compliance Non-compliance with Environmental Laws and Regulations
Disclosure Quantity Units
Total amount of monetary fines for non-compliance with
environmental laws and/or regulations
0 PhP
No. of non-monetary sanctions for non-compliance with
environmental laws and/or regulations
None #
No. of cases resolved through dispute resolution mechanism None #
What is the impact and
where does it occur? What
is the organization’s
involvement in the impact?
Which stakeholders
are affected?
Management Approach
The organization did not incur
significant monetary fines for non-
compliance with environmental laws
and/or regulations in 2021.
Petron Bataan Refinery
and Terminal Operations
Petron Corporate
Environment Group
Petron Law Division
Both as a company policy and a
corporate responsibility, Petron ensures
that it complies with all applicable
environmental policies and regulations.
Our Health, Safety, and Environment
policy aims to protect and preserve the
natural environment.
A Corporate Environment Group
provides technical advice to the
management on issues concerning
environmental management. It guides the
environment unit of the various divisions
of Petron Corporation, ensuring their
compliance while mitigating significant
environmental impacts. It is actively
involved in industry groups and
coordinates closely with regulators to
ensure that it is kept abreast with
developments on environmental
management and regulations.
The organization has an environment
council that is composed of
representatives from the environment
group of each operating division. The
council serves as an avenue for discussing
developments on environmental
management and benchmarking of best
practices.
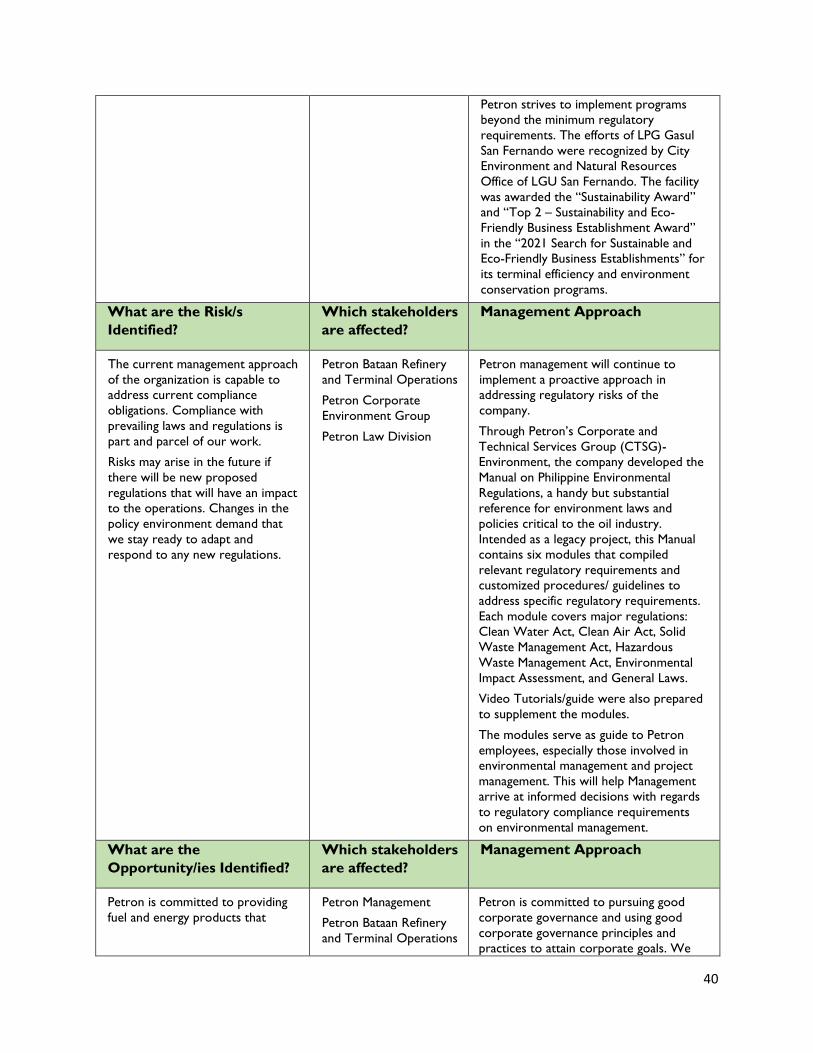
40
Petron strives to implement programs
beyond the minimum regulatory
requirements. The efforts of LPG Gasul
San Fernando were recognized by City
Environment and Natural Resources
Office of LGU San Fernando. The facility
was awarded the “Sustainability Award”
and “Top 2 – Sustainability and Eco-
Friendly Business Establishment Award”
in the “2021 Search for Sustainable and
Eco-Friendly Business Establishments” for
its terminal efficiency and environment
conservation programs.
What are the Risk/s
Identified?
Which stakeholders
are affected?
Management Approach
The current management approach
of the organization is capable to
address current compliance
obligations. Compliance with
prevailing laws and regulations is
part and parcel of our work.
Risks may arise in the future if
there will be new proposed
regulations that will have an impact
to the operations. Changes in the
policy environment demand that
we stay ready to adapt and
respond to any new regulations.
Petron Bataan Refinery
and Terminal Operations
Petron Corporate
Environment Group
Petron Law Division
Petron management will continue to
implement a proactive approach in
addressing regulatory risks of the
company.
Through Petron’s Corporate and
Technical Services Group (CTSG)-
Environment, the company developed the
Manual on Philippine Environmental
Regulations, a handy but substantial
reference for environment laws and
policies critical to the oil industry.
Intended as a legacy project, this Manual
contains six modules that compiled
relevant regulatory requirements and
customized procedures/ guidelines to
address specific regulatory requirements.
Each module covers major regulations:
Clean Water Act, Clean Air Act, Solid
Waste Management Act, Hazardous
Waste Management Act, Environmental
Impact Assessment, and General Laws.
Video Tutorials/guide were also prepared
to supplement the modules.
The modules serve as guide to Petron
employees, especially those involved in
environmental management and project
management. This will help Management
arrive at informed decisions with regards
to regulatory compliance requirements
on environmental management.
What are the
Opportunity/ies Identified?
Which stakeholders
are affected?
Management Approach
Petron is committed to providing
fuel and energy products that
Petron Management
Petron Bataan Refinery
and Terminal Operations
Petron is committed to pursuing good
corporate governance and using good
corporate governance principles and
practices to attain corporate goals. We
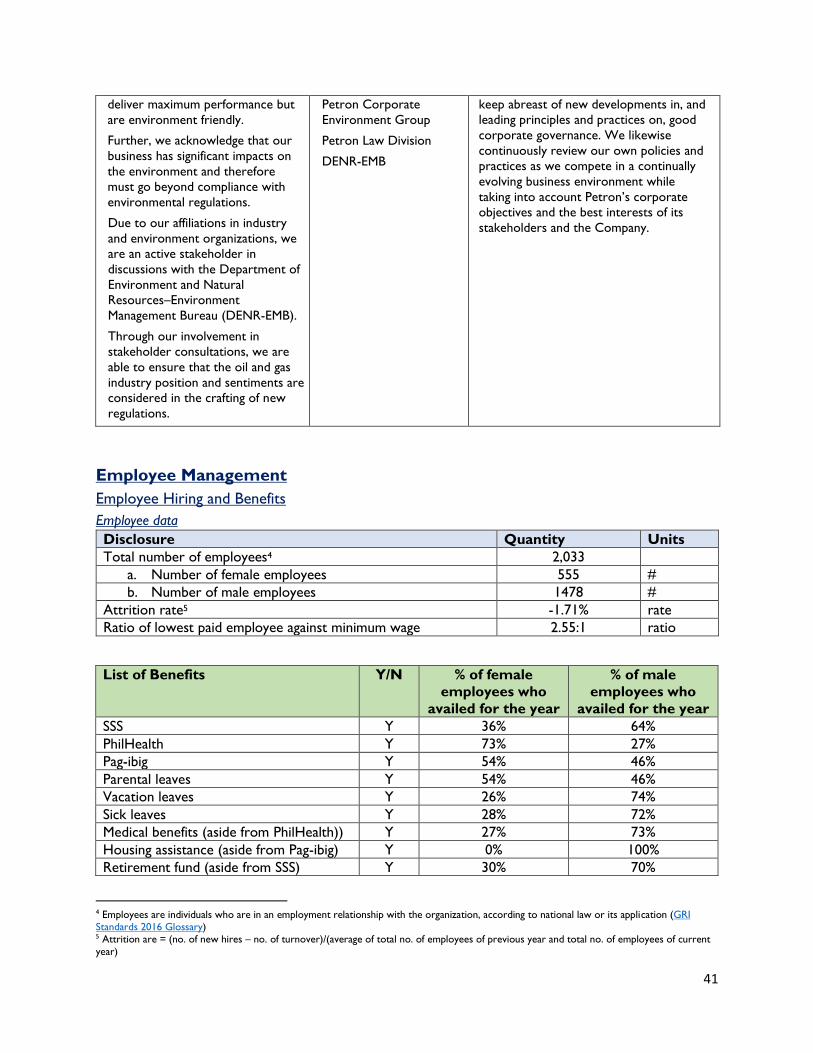
41
deliver maximum performance but
are environment friendly.
Further, we acknowledge that our
business has significant impacts on
the environment and therefore
must go beyond compliance with
environmental regulations.
Due to our affiliations in industry
and environment organizations, we
are an active stakeholder in
discussions with the Department of
Environment and Natural
Resources–Environment
Management Bureau (DENR-EMB).
Through our involvement in
stakeholder consultations, we are
able to ensure that the oil and gas
industry position and sentiments are
considered in the crafting of new
regulations.
Petron Corporate
Environment Group
Petron Law Division
DENR-EMB
keep abreast of new developments in, and
leading principles and practices on, good
corporate governance. We likewise
continuously review our own policies and
practices as we compete in a continually
evolving business environment while
taking into account Petron’s corporate
objectives and the best interests of its
stakeholders and the Company.
Employee Management
Employee Hiring and Benefits
Employee data
Disclosure Quantity Units
Total number of employees4 2,033
a. Number of female employees 555 #
b. Number of male employees 1478 #
Attrition rate5 -1.71% rate
Ratio of lowest paid employee against minimum wage 2.55:1 ratio
List of Benefits Y/N % of female
employees who
availed for the year
% of male
employees who
availed for the year
SSS Y 36% 64%
PhilHealth Y 73% 27%
Pag-ibig Y 54% 46%
Parental leaves Y 54% 46%
Vacation leaves Y 26% 74%
Sick leaves Y 28% 72%
Medical benefits (aside from PhilHealth)) Y 27% 73%
Housing assistance (aside from Pag-ibig) Y 0% 100%
Retirement fund (aside from SSS) Y 30% 70%
4 Employees are individuals who are in an employment relationship with the organization, according to national law or its application (GRI Standards 2016 Glossary) 5 Attrition are = (no. of new hires – no. of turnover)/(average of total no. of employees of previous year and total no. of employees of current
year)
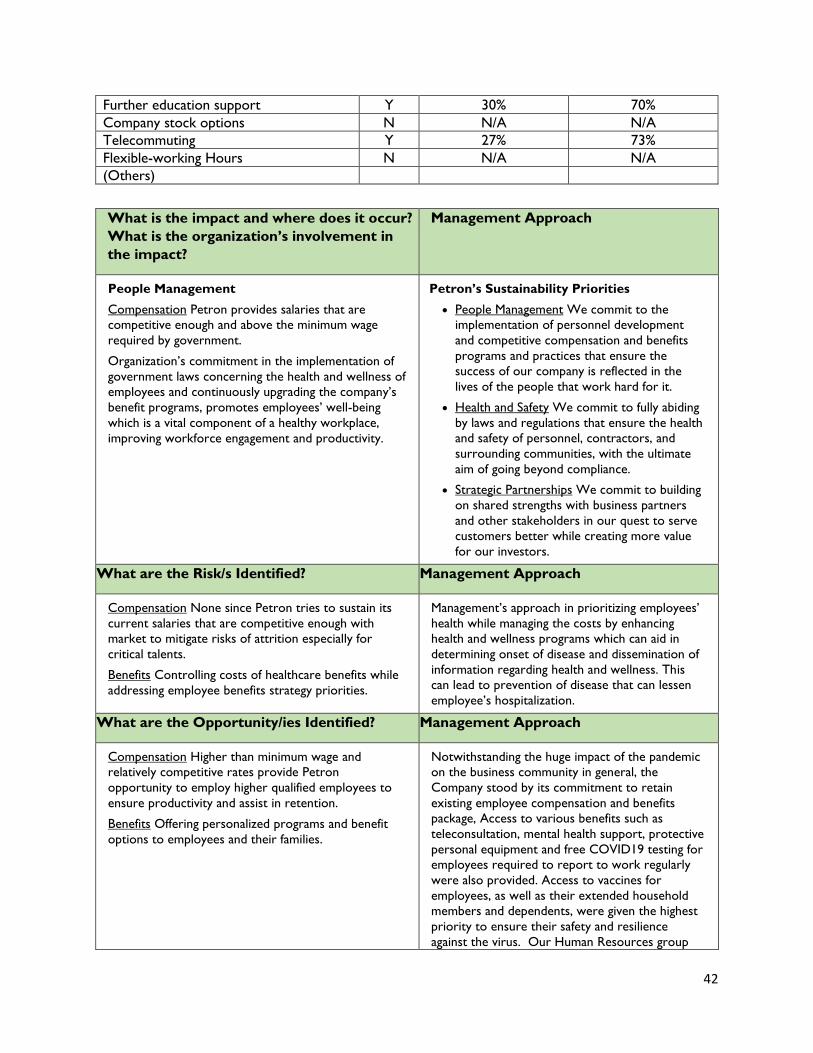
42
Further education support Y 30% 70%
Company stock options N N/A N/A
Telecommuting Y 27% 73%
Flexible-working Hours N N/A N/A
(Others)
What is the impact and where does it occur?
What is the organization’s involvement in
the impact?
Management Approach
People Management
Compensation Petron provides salaries that are
competitive enough and above the minimum wage
required by government.
Organization’s commitment in the implementation of
government laws concerning the health and wellness of
employees and continuously upgrading the company’s
benefit programs, promotes employees’ well-being
which is a vital component of a healthy workplace,
improving workforce engagement and productivity.
Petron’s Sustainability Priorities
• People Management We commit to the
implementation of personnel development
and competitive compensation and benefits
programs and practices that ensure the
success of our company is reflected in the
lives of the people that work hard for it.
• Health and Safety We commit to fully abiding
by laws and regulations that ensure the health
and safety of personnel, contractors, and
surrounding communities, with the ultimate
aim of going beyond compliance.
• Strategic Partnerships We commit to building
on shared strengths with business partners
and other stakeholders in our quest to serve
customers better while creating more value
for our investors.
What are the Risk/s Identified? Management Approach
Compensation None since Petron tries to sustain its
current salaries that are competitive enough with
market to mitigate risks of attrition especially for
critical talents.
Benefits Controlling costs of healthcare benefits while
addressing employee benefits strategy priorities.
Management’s approach in prioritizing employees’
health while managing the costs by enhancing
health and wellness programs which can aid in
determining onset of disease and dissemination of
information regarding health and wellness. This
can lead to prevention of disease that can lessen
employee’s hospitalization.
What are the Opportunity/ies Identified? Management Approach
Compensation Higher than minimum wage and
relatively competitive rates provide Petron
opportunity to employ higher qualified employees to
ensure productivity and assist in retention.
Benefits Offering personalized programs and benefit
options to employees and their families.
Notwithstanding the huge impact of the pandemic
on the business community in general, the
Company stood by its commitment to retain
existing employee compensation and benefits
package, Access to various benefits such as
teleconsultation, mental health support, protective
personal equipment and free COVID19 testing for
employees required to report to work regularly
were also provided. Access to vaccines for
employees, as well as their extended household
members and dependents, were given the highest
priority to ensure their safety and resilience
against the virus. Our Human Resources group
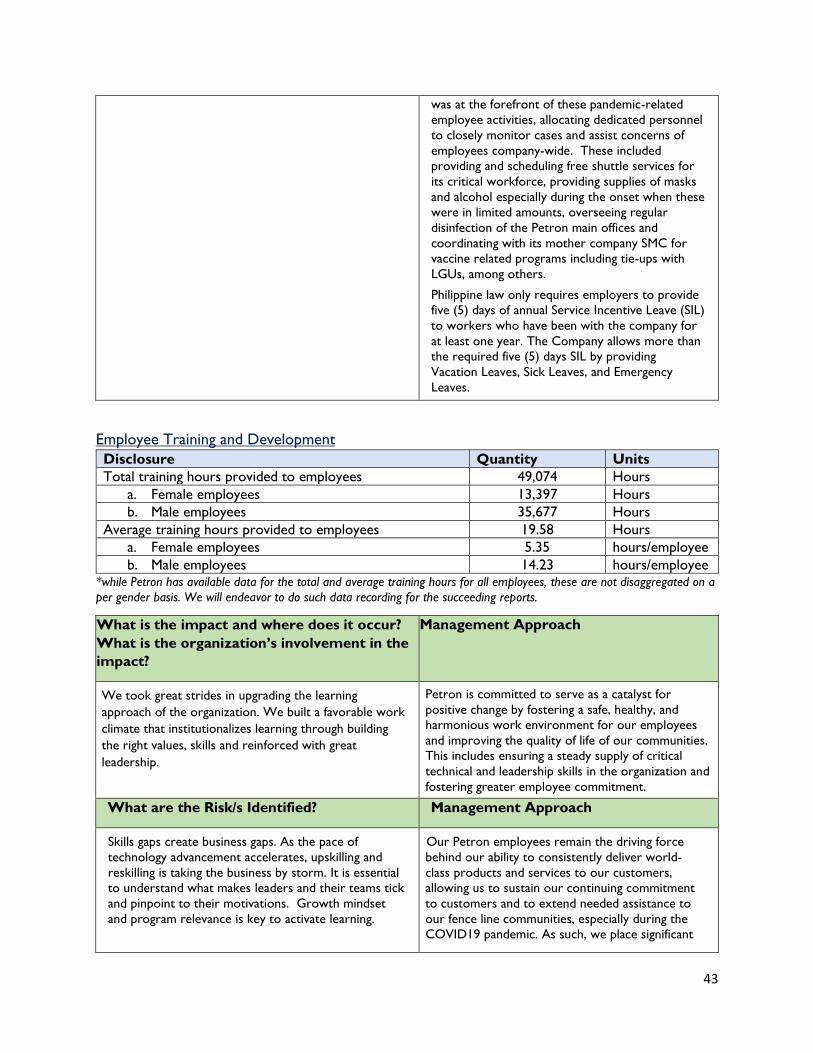
43
was at the forefront of these pandemic-related
employee activities, allocating dedicated personnel
to closely monitor cases and assist concerns of
employees company-wide. These included
providing and scheduling free shuttle services for
its critical workforce, providing supplies of masks
and alcohol especially during the onset when these
were in limited amounts, overseeing regular
disinfection of the Petron main offices and
coordinating with its mother company SMC for
vaccine related programs including tie-ups with
LGUs, among others.
Philippine law only requires employers to provide
five (5) days of annual Service Incentive Leave (SIL)
to workers who have been with the company for
at least one year. The Company allows more than
the required five (5) days SIL by providing
Vacation Leaves, Sick Leaves, and Emergency
Leaves.
Employee Training and Development
Disclosure Quantity Units
Total training hours provided to employees 49,074 Hours
a. Female employees 13,397 Hours
b. Male employees 35,677 Hours
Average training hours provided to employees 19.58 Hours
a. Female employees 5.35 hours/employee
b. Male employees 14.23 hours/employee *while Petron has available data for the total and average training hours for all employees, these are not disaggregated on a
per gender basis. We will endeavor to do such data recording for the succeeding reports.
What is the impact and where does it occur?
What is the organization’s involvement in the
impact?
Management Approach
We took great strides in upgrading the learning
approach of the organization. We built a favorable work
climate that institutionalizes learning through building
the right values, skills and reinforced with great
leadership.
Petron is committed to serve as a catalyst for
positive change by fostering a safe, healthy, and
harmonious work environment for our employees
and improving the quality of life of our communities.
This includes ensuring a steady supply of critical
technical and leadership skills in the organization and
fostering greater employee commitment.
What are the Risk/s Identified? Management Approach
Skills gaps create business gaps. As the pace of
technology advancement accelerates, upskilling and
reskilling is taking the business by storm. It is essential
to understand what makes leaders and their teams tick
and pinpoint to their motivations. Growth mindset
and program relevance is key to activate learning.
Our Petron employees remain the driving force
behind our ability to consistently deliver world-
class products and services to our customers,
allowing us to sustain our continuing commitment
to customers and to extend needed assistance to
our fence line communities, especially during the
COVID19 pandemic. As such, we place significant
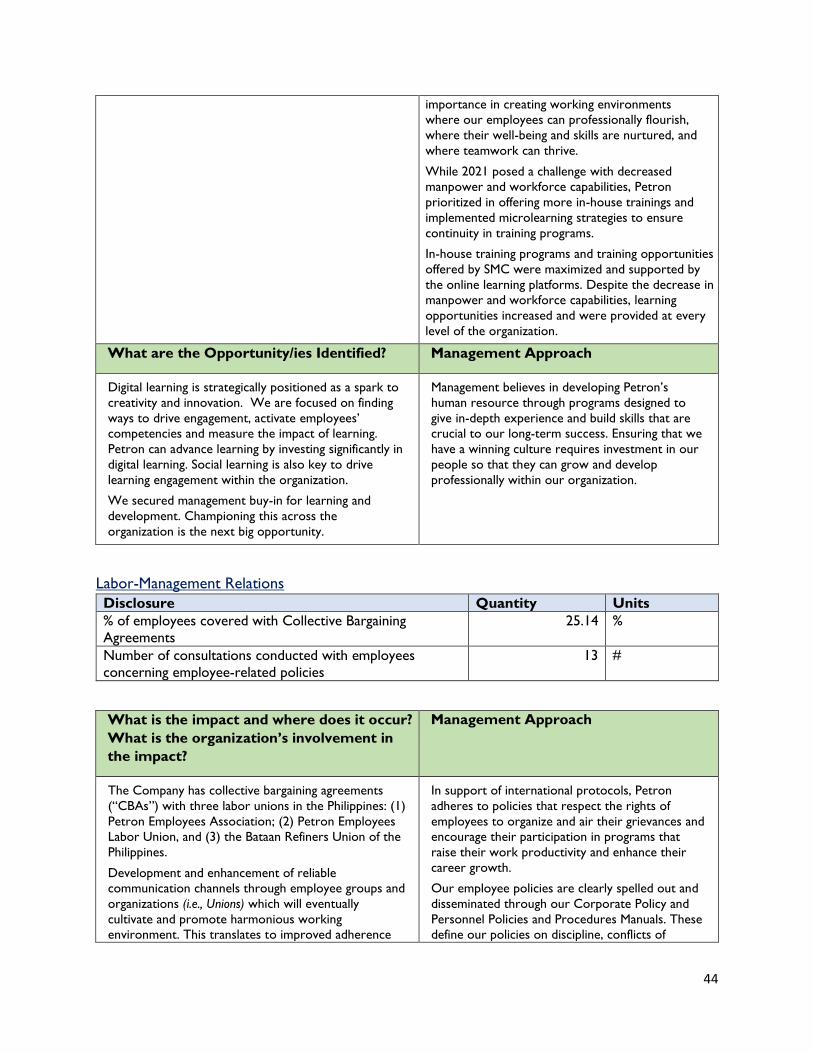
44
importance in creating working environments
where our employees can professionally flourish,
where their well-being and skills are nurtured, and
where teamwork can thrive.
While 2021 posed a challenge with decreased
manpower and workforce capabilities, Petron
prioritized in offering more in-house trainings and
implemented microlearning strategies to ensure
continuity in training programs.
In-house training programs and training opportunities
offered by SMC were maximized and supported by
the online learning platforms. Despite the decrease in
manpower and workforce capabilities, learning
opportunities increased and were provided at every
level of the organization.
What are the Opportunity/ies Identified? Management Approach
Digital learning is strategically positioned as a spark to
creativity and innovation. We are focused on finding
ways to drive engagement, activate employees’
competencies and measure the impact of learning.
Petron can advance learning by investing significantly in
digital learning. Social learning is also key to drive
learning engagement within the organization.
We secured management buy-in for learning and
development. Championing this across the
organization is the next big opportunity.
Management believes in developing Petron’s
human resource through programs designed to
give in-depth experience and build skills that are
crucial to our long-term success. Ensuring that we
have a winning culture requires investment in our
people so that they can grow and develop
professionally within our organization.
Labor-Management Relations
Disclosure Quantity Units
% of employees covered with Collective Bargaining
Agreements
25.14 %
Number of consultations conducted with employees
concerning employee-related policies
13 #
What is the impact and where does it occur?
What is the organization’s involvement in
the impact?
Management Approach
The Company has collective bargaining agreements
(“CBAs”) with three labor unions in the Philippines: (1)
Petron Employees Association; (2) Petron Employees
Labor Union, and (3) the Bataan Refiners Union of the
Philippines.
Development and enhancement of reliable
communication channels through employee groups and
organizations (i.e., Unions) which will eventually
cultivate and promote harmonious working
environment. This translates to improved adherence
In support of international protocols, Petron
adheres to policies that respect the rights of
employees to organize and air their grievances and
encourage their participation in programs that
raise their work productivity and enhance their
career growth.
Our employee policies are clearly spelled out and
disseminated through our Corporate Policy and
Personnel Policies and Procedures Manuals. These
define our policies on discipline, conflicts of
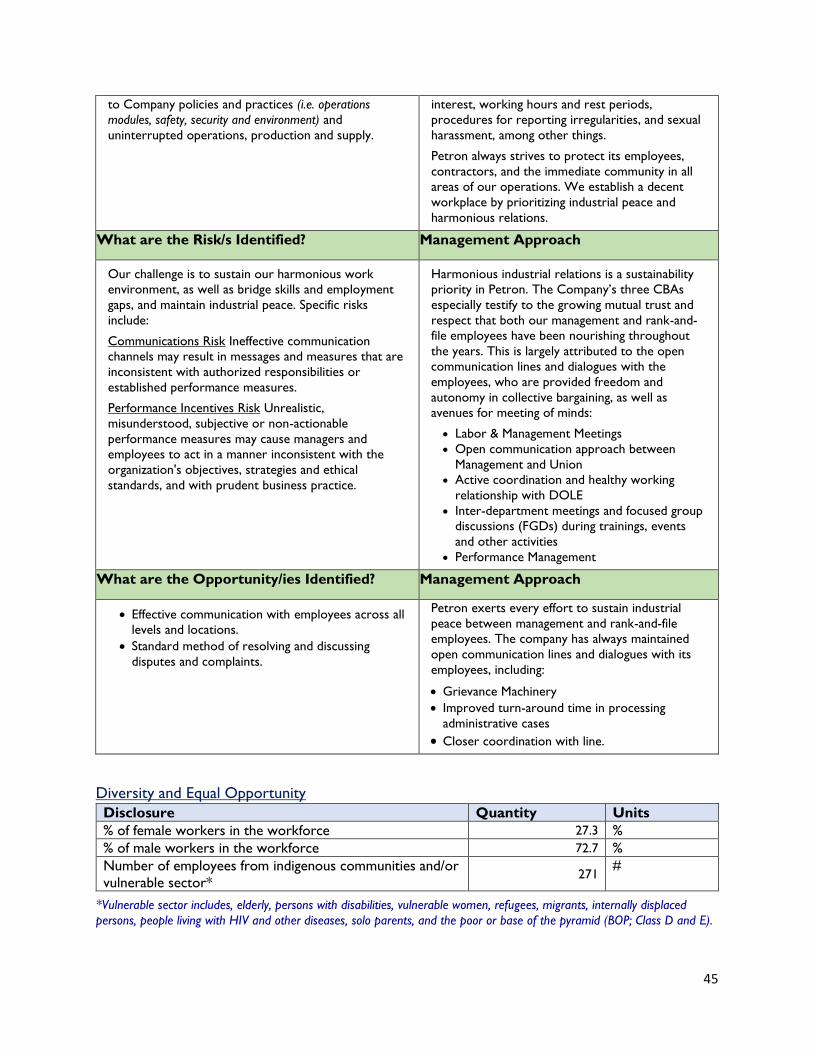
45
to Company policies and practices (i.e. operations
modules, safety, security and environment) and
uninterrupted operations, production and supply.
interest, working hours and rest periods,
procedures for reporting irregularities, and sexual
harassment, among other things.
Petron always strives to protect its employees,
contractors, and the immediate community in all
areas of our operations. We establish a decent
workplace by prioritizing industrial peace and
harmonious relations.
What are the Risk/s Identified? Management Approach
Our challenge is to sustain our harmonious work
environment, as well as bridge skills and employment
gaps, and maintain industrial peace. Specific risks
include:
Communications Risk Ineffective communication
channels may result in messages and measures that are
inconsistent with authorized responsibilities or
established performance measures.
Performance Incentives Risk Unrealistic,
misunderstood, subjective or non-actionable
performance measures may cause managers and
employees to act in a manner inconsistent with the
organization's objectives, strategies and ethical
standards, and with prudent business practice.
Harmonious industrial relations is a sustainability
priority in Petron. The Company’s three CBAs
especially testify to the growing mutual trust and
respect that both our management and rank-and-
file employees have been nourishing throughout
the years. This is largely attributed to the open
communication lines and dialogues with the
employees, who are provided freedom and
autonomy in collective bargaining, as well as
avenues for meeting of minds:
• Labor & Management Meetings
• Open communication approach between
Management and Union
• Active coordination and healthy working
relationship with DOLE
• Inter-department meetings and focused group
discussions (FGDs) during trainings, events
and other activities
• Performance Management
What are the Opportunity/ies Identified? Management Approach
• Effective communication with employees across all
levels and locations.
• Standard method of resolving and discussing
disputes and complaints.
Petron exerts every effort to sustain industrial
peace between management and rank-and-file
employees. The company has always maintained
open communication lines and dialogues with its
employees, including:
• Grievance Machinery
• Improved turn-around time in processing
administrative cases
• Closer coordination with line.
Diversity and Equal Opportunity
Disclosure Quantity Units
% of female workers in the workforce 27.3 %
% of male workers in the workforce 72.7 %
Number of employees from indigenous communities and/or
vulnerable sector* 271
#
*Vulnerable sector includes, elderly, persons with disabilities, vulnerable women, refugees, migrants, internally displaced
persons, people living with HIV and other diseases, solo parents, and the poor or base of the pyramid (BOP; Class D and E).
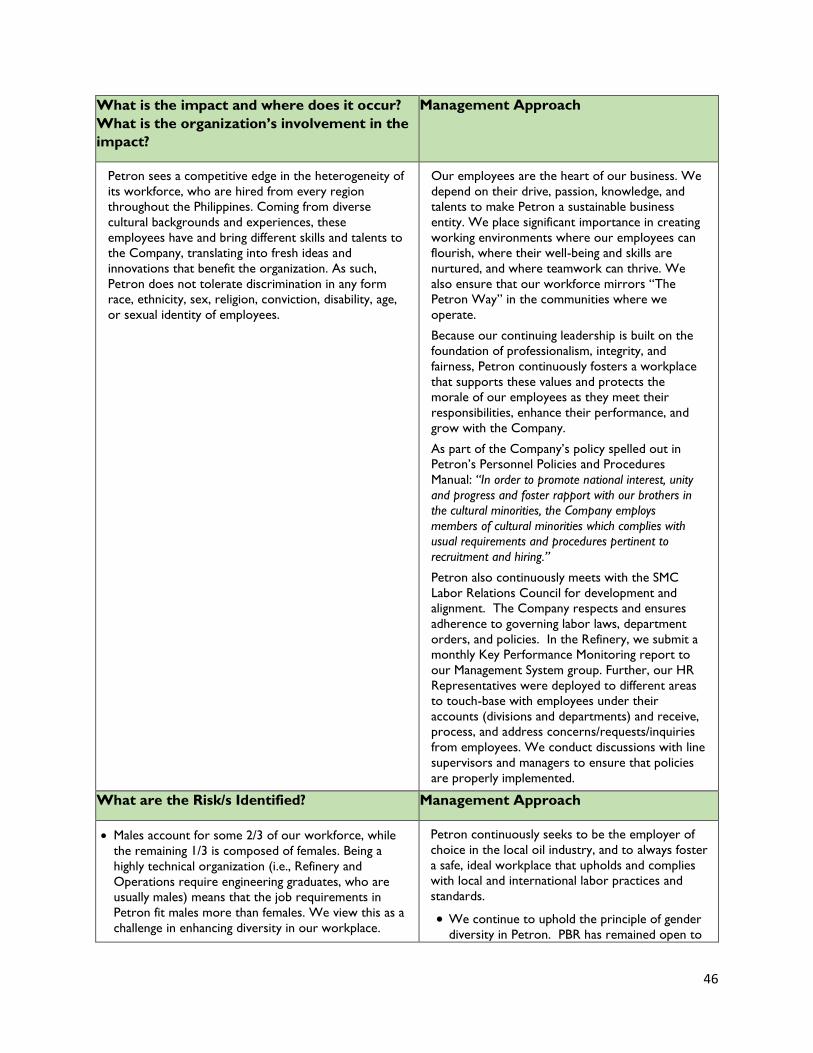
46
What is the impact and where does it occur?
What is the organization’s involvement in the
impact?
Management Approach
Petron sees a competitive edge in the heterogeneity of
its workforce, who are hired from every region
throughout the Philippines. Coming from diverse
cultural backgrounds and experiences, these
employees have and bring different skills and talents to
the Company, translating into fresh ideas and
innovations that benefit the organization. As such,
Petron does not tolerate discrimination in any form
race, ethnicity, sex, religion, conviction, disability, age,
or sexual identity of employees.
Our employees are the heart of our business. We
depend on their drive, passion, knowledge, and
talents to make Petron a sustainable business
entity. We place significant importance in creating
working environments where our employees can
flourish, where their well-being and skills are
nurtured, and where teamwork can thrive. We
also ensure that our workforce mirrors “The
Petron Way” in the communities where we
operate.
Because our continuing leadership is built on the
foundation of professionalism, integrity, and
fairness, Petron continuously fosters a workplace
that supports these values and protects the
morale of our employees as they meet their
responsibilities, enhance their performance, and
grow with the Company.
As part of the Company’s policy spelled out in
Petron’s Personnel Policies and Procedures
Manual: “In order to promote national interest, unity
and progress and foster rapport with our brothers in
the cultural minorities, the Company employs
members of cultural minorities which complies with
usual requirements and procedures pertinent to
recruitment and hiring.”
Petron also continuously meets with the SMC
Labor Relations Council for development and
alignment. The Company respects and ensures
adherence to governing labor laws, department
orders, and policies. In the Refinery, we submit a
monthly Key Performance Monitoring report to
our Management System group. Further, our HR
Representatives were deployed to different areas
to touch-base with employees under their
accounts (divisions and departments) and receive,
process, and address concerns/requests/inquiries
from employees. We conduct discussions with line
supervisors and managers to ensure that policies
are properly implemented.
What are the Risk/s Identified? Management Approach
• Males account for some 2/3 of our workforce, while
the remaining 1/3 is composed of females. Being a
highly technical organization (i.e., Refinery and
Operations require engineering graduates, who are
usually males) means that the job requirements in
Petron fit males more than females. We view this as a
challenge in enhancing diversity in our workplace.
Petron continuously seeks to be the employer of
choice in the local oil industry, and to always foster
a safe, ideal workplace that upholds and complies
with local and international labor practices and
standards.
• We continue to uphold the principle of gender
diversity in Petron. PBR has remained open to
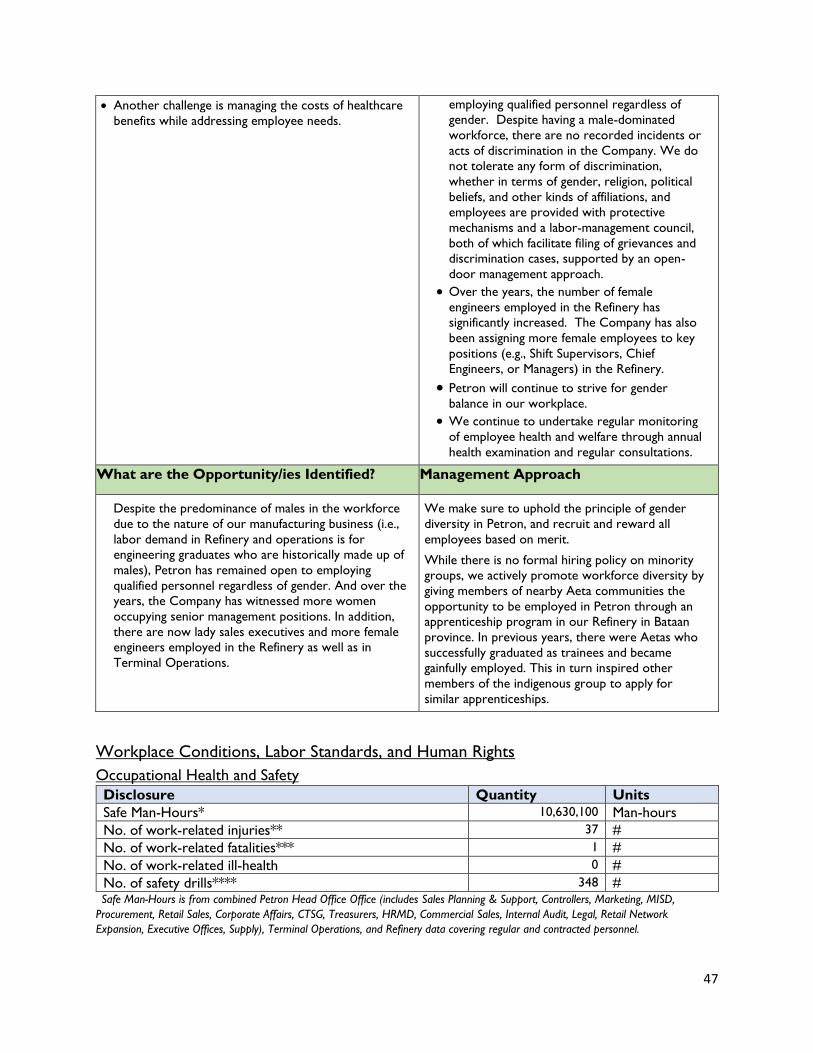
47
• Another challenge is managing the costs of healthcare
benefits while addressing employee needs.
employing qualified personnel regardless of
gender. Despite having a male-dominated
workforce, there are no recorded incidents or
acts of discrimination in the Company. We do
not tolerate any form of discrimination,
whether in terms of gender, religion, political
beliefs, and other kinds of affiliations, and
employees are provided with protective
mechanisms and a labor-management council,
both of which facilitate filing of grievances and
discrimination cases, supported by an open-
door management approach.
• Over the years, the number of female
engineers employed in the Refinery has
significantly increased. The Company has also
been assigning more female employees to key
positions (e.g., Shift Supervisors, Chief
Engineers, or Managers) in the Refinery.
• Petron will continue to strive for gender
balance in our workplace. • We continue to undertake regular monitoring
of employee health and welfare through annual
health examination and regular consultations.
What are the Opportunity/ies Identified? Management Approach
Despite the predominance of males in the workforce
due to the nature of our manufacturing business (i.e.,
labor demand in Refinery and operations is for
engineering graduates who are historically made up of
males), Petron has remained open to employing
qualified personnel regardless of gender. And over the
years, the Company has witnessed more women
occupying senior management positions. In addition,
there are now lady sales executives and more female
engineers employed in the Refinery as well as in
Terminal Operations.
We make sure to uphold the principle of gender
diversity in Petron, and recruit and reward all
employees based on merit.
While there is no formal hiring policy on minority
groups, we actively promote workforce diversity by
giving members of nearby Aeta communities the
opportunity to be employed in Petron through an
apprenticeship program in our Refinery in Bataan
province. In previous years, there were Aetas who
successfully graduated as trainees and became
gainfully employed. This in turn inspired other
members of the indigenous group to apply for
similar apprenticeships.
Workplace Conditions, Labor Standards, and Human Rights
Occupational Health and Safety
Disclosure Quantity Units
Safe Man-Hours* 10,630,100 Man-hours
No. of work-related injuries** 37 #
No. of work-related fatalities*** 1 #
No. of work-related ill-health 0 #
No. of safety drills**** 348 # *Safe Man-Hours is from combined Petron Head Office Office (includes Sales Planning & Support, Controllers, Marketing, MISD,
Procurement, Retail Sales, Corporate Affairs, CTSG, Treasurers, HRMD, Commercial Sales, Internal Audit, Legal, Retail Network
Expansion, Executive Offices, Supply), Terminal Operations, and Refinery data covering regular and contracted personnel.
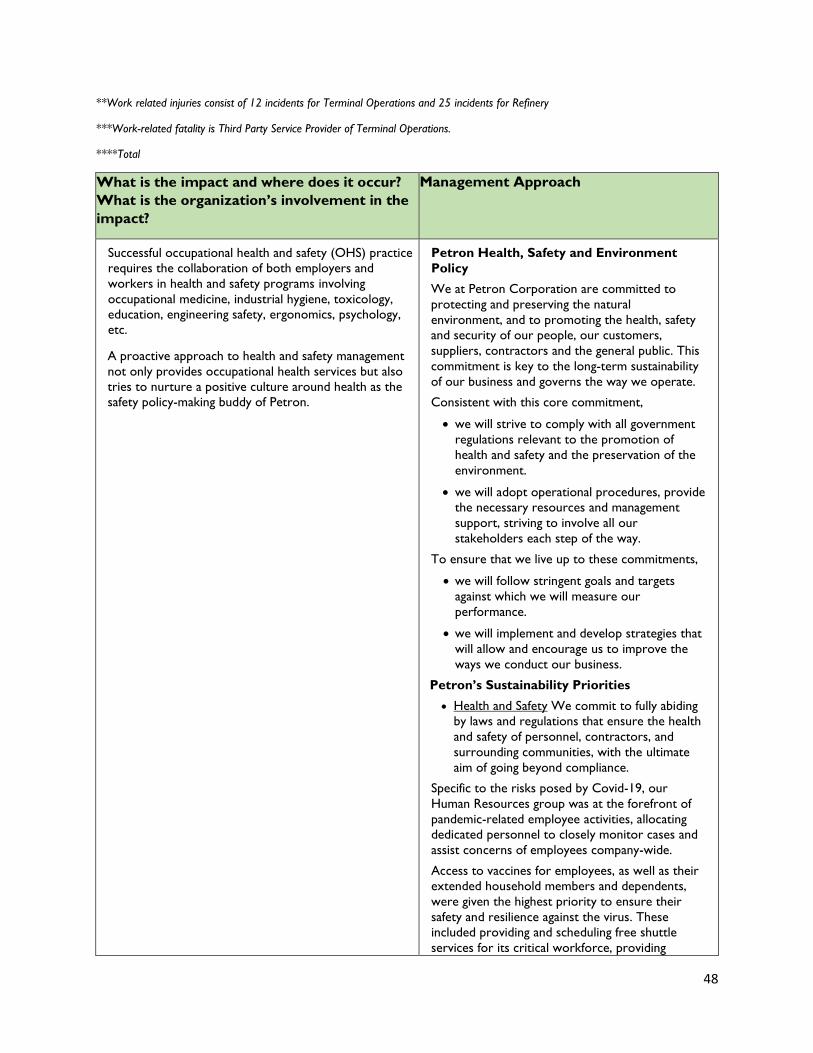
48
**Work related injuries consist of 12 incidents for Terminal Operations and 25 incidents for Refinery
***Work-related fatality is Third Party Service Provider of Terminal Operations.
****Total conducted by Terminal Operations and Refinery.
What is the impact and where does it occur?
What is the organization’s involvement in the
impact?
Management Approach
Successful occupational health and safety (OHS) practice
requires the collaboration of both employers and
workers in health and safety programs involving
occupational medicine, industrial hygiene, toxicology,
education, engineering safety, ergonomics, psychology,
etc.
A proactive approach to health and safety management
not only provides occupational health services but also
tries to nurture a positive culture around health as the
safety policy-making buddy of Petron.
Petron Health, Safety and Environment
Policy
We at Petron Corporation are committed to
protecting and preserving the natural
environment, and to promoting the health, safety
and security of our people, our customers,
suppliers, contractors and the general public. This
commitment is key to the long-term sustainability
of our business and governs the way we operate.
Consistent with this core commitment,
• we will strive to comply with all government
regulations relevant to the promotion of
health and safety and the preservation of the
environment.
• we will adopt operational procedures, provide
the necessary resources and management
support, striving to involve all our
stakeholders each step of the way.
To ensure that we live up to these commitments,
• we will follow stringent goals and targets
against which we will measure our
performance.
• we will implement and develop strategies that
will allow and encourage us to improve the
ways we conduct our business.
Petron’s Sustainability Priorities
• Health and Safety We commit to fully abiding
by laws and regulations that ensure the health
and safety of personnel, contractors, and
surrounding communities, with the ultimate
aim of going beyond compliance.
Specific to the risks posed by Covid-19, our
Human Resources group was at the forefront of
pandemic-related employee activities, allocating
dedicated personnel to closely monitor cases and
assist concerns of employees company-wide.
Access to vaccines for employees, as well as their
extended household members and dependents,
were given the highest priority to ensure their
safety and resilience against the virus. These
included providing and scheduling free shuttle
services for its critical workforce, providing
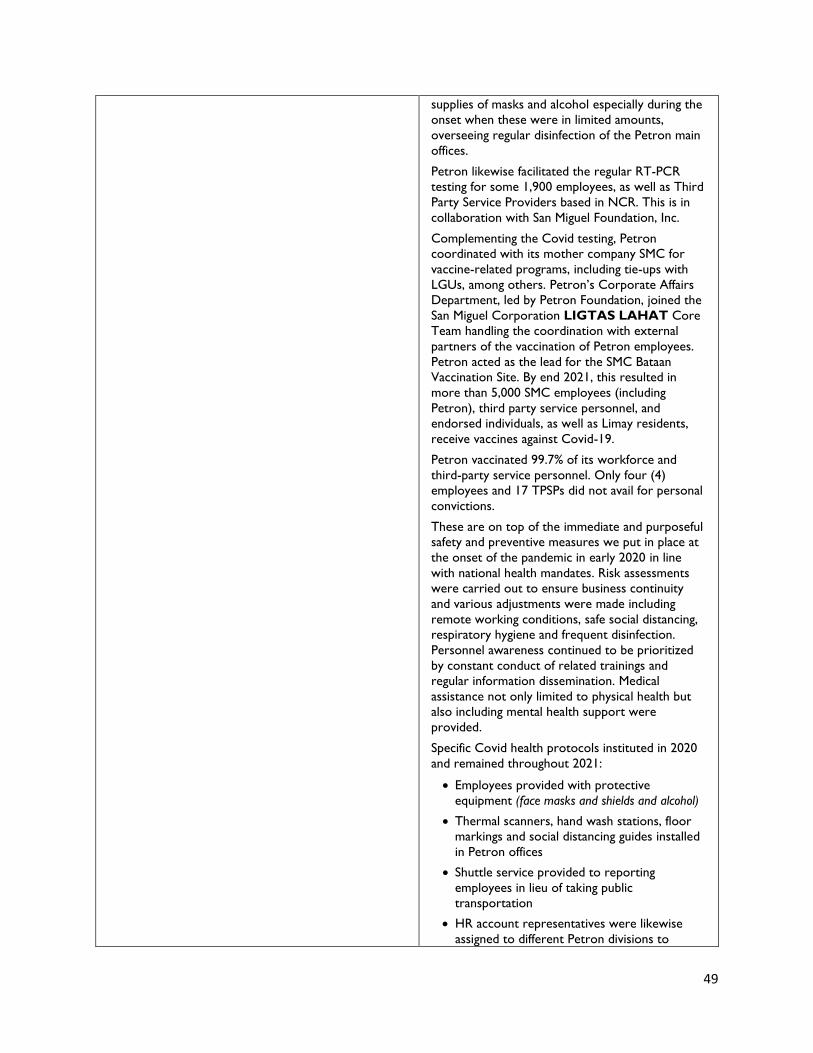
49
supplies of masks and alcohol especially during the
onset when these were in limited amounts,
overseeing regular disinfection of the Petron main
offices.
Petron likewise facilitated the regular RT-PCR
testing for some 1,900 employees, as well as Third
Party Service Providers based in NCR. This is in
collaboration with San Miguel Foundation, Inc.
Complementing the Covid testing, Petron
coordinated with its mother company SMC for
vaccine-related programs, including tie-ups with
LGUs, among others. Petron’s Corporate Affairs
Department, led by Petron Foundation, joined the
San Miguel Corporation LIGTAS LAHAT Core
Team handling the coordination with external
partners of the vaccination of Petron employees.
Petron acted as the lead for the SMC Bataan
Vaccination Site. By end 2021, this resulted in
more than 5,000 SMC employees (including
Petron), third party service personnel, and
endorsed individuals, as well as Limay residents,
receive vaccines against Covid-19.
Petron vaccinated 99.7% of its workforce and
third-party service personnel. Only four (4)
employees and 17 TPSPs did not avail for personal
convictions.
These are on top of the immediate and purposeful
safety and preventive measures we put in place at
the onset of the pandemic in early 2020 in line
with national health mandates. Risk assessments
were carried out to ensure business continuity
and various adjustments were made including
remote working conditions, safe social distancing,
respiratory hygiene and frequent disinfection.
Personnel awareness continued to be prioritized
by constant conduct of related trainings and
regular information dissemination. Medical
assistance not only limited to physical health but
also including mental health support were
provided.
Specific Covid health protocols instituted in 2020
and remained throughout 2021:
• Employees provided with protective
equipment (face masks and shields and alcohol)
• Thermal scanners, hand wash stations, floor
markings and social distancing guides installed
in Petron offices
• Shuttle service provided to reporting
employees in lieu of taking public
transportation
• HR account representatives were likewise
assigned to different Petron divisions to
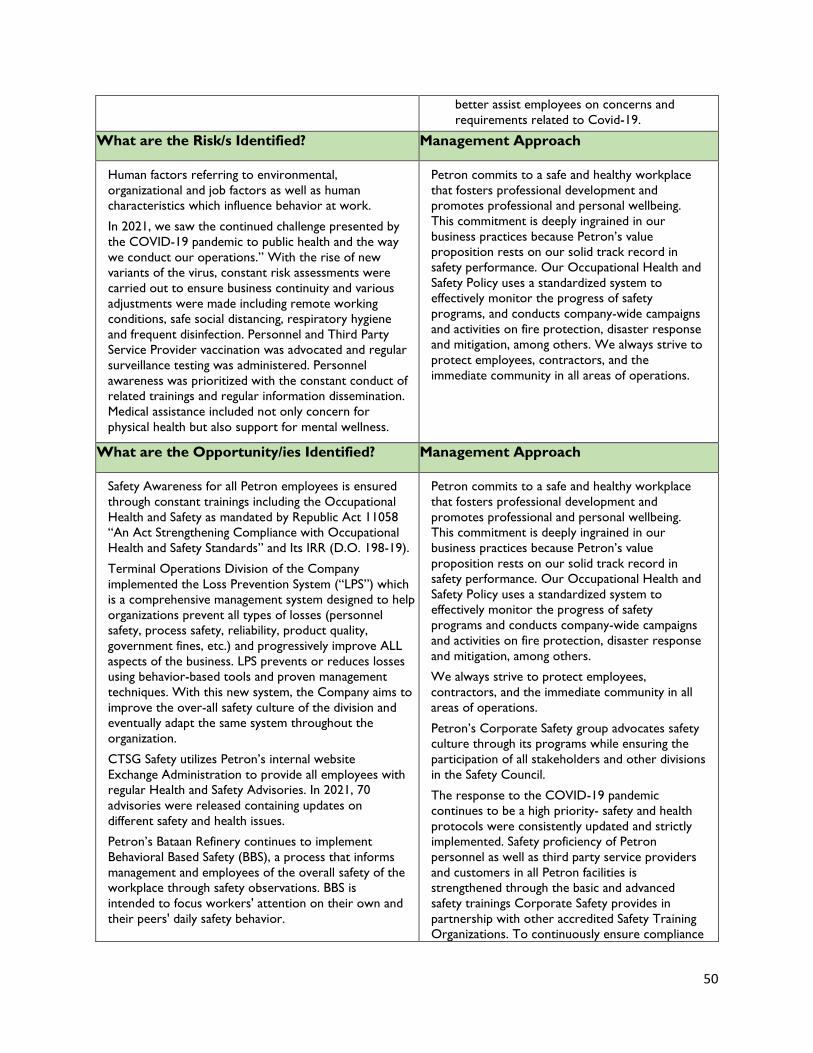
50
better assist employees on concerns and
requirements related to Covid-19.
What are the Risk/s Identified? Management Approach
Human factors referring to environmental,
organizational and job factors as well as human
characteristics which influence behavior at work.
In 2021, we saw the continued challenge presented by
the COVID-19 pandemic to public health and the way
we conduct our operations.” With the rise of new
variants of the virus, constant risk assessments were
carried out to ensure business continuity and various
adjustments were made including remote working
conditions, safe social distancing, respiratory hygiene
and frequent disinfection. Personnel and Third Party
Service Provider vaccination was advocated and regular
surveillance testing was administered. Personnel
awareness was prioritized with the constant conduct of
related trainings and regular information dissemination.
Medical assistance included not only concern for
physical health but also support for mental wellness.
Petron commits to a safe and healthy workplace
that fosters professional development and
promotes professional and personal wellbeing.
This commitment is deeply ingrained in our
business practices because Petron’s value
proposition rests on our solid track record in
safety performance. Our Occupational Health and
Safety Policy uses a standardized system to
effectively monitor the progress of safety
programs, and conducts company-wide campaigns
and activities on fire protection, disaster response
and mitigation, among others. We always strive to
protect employees, contractors, and the
immediate community in all areas of operations.
What are the Opportunity/ies Identified? Management Approach
Safety Awareness for all Petron employees is ensured
through constant trainings including the Occupational
Health and Safety as mandated by Republic Act 11058
“An Act Strengthening Compliance with Occupational
Health and Safety Standards” and Its IRR (D.O. 198-19).
Terminal Operations Division of the Company
implemented the Loss Prevention System (“LPS”) which
is a comprehensive management system designed to help
organizations prevent all types of losses (personnel
safety, process safety, reliability, product quality,
government fines, etc.) and progressively improve ALL
aspects of the business. LPS prevents or reduces losses
using behavior-based tools and proven management
techniques. With this new system, the Company aims to
improve the over-all safety culture of the division and
eventually adapt the same system throughout the
organization.
CTSG Safety utilizes Petron’s internal website
Exchange Administration to provide all employees with
regular Health and Safety Advisories. In 2021, 70
advisories were released containing updates on
different safety and health issues.
Petron’s Bataan Refinery continues to implement
Behavioral Based Safety (BBS), a process that informs
management and employees of the overall safety of the
workplace through safety observations. BBS is
intended to focus workers' attention on their own and
their peers' daily safety behavior.
Petron commits to a safe and healthy workplace
that fosters professional development and
promotes professional and personal wellbeing.
This commitment is deeply ingrained in our
business practices because Petron’s value
proposition rests on our solid track record in
safety performance. Our Occupational Health and
Safety Policy uses a standardized system to
effectively monitor the progress of safety
programs and conducts company-wide campaigns
and activities on fire protection, disaster response
and mitigation, among others.
We always strive to protect employees,
contractors, and the immediate community in all
areas of operations.
Petron’s Corporate Safety group advocates safety
culture through its programs while ensuring the
participation of all stakeholders and other divisions
in the Safety Council.
The response to the COVID-19 pandemic
continues to be a high priority- safety and health
protocols were consistently updated and strictly
implemented. Safety proficiency of Petron
personnel as well as third party service providers
and customers in all Petron facilities is
strengthened through the basic and advanced
safety trainings Corporate Safety provides in
partnership with other accredited Safety Training
Organizations. To continuously ensure compliance
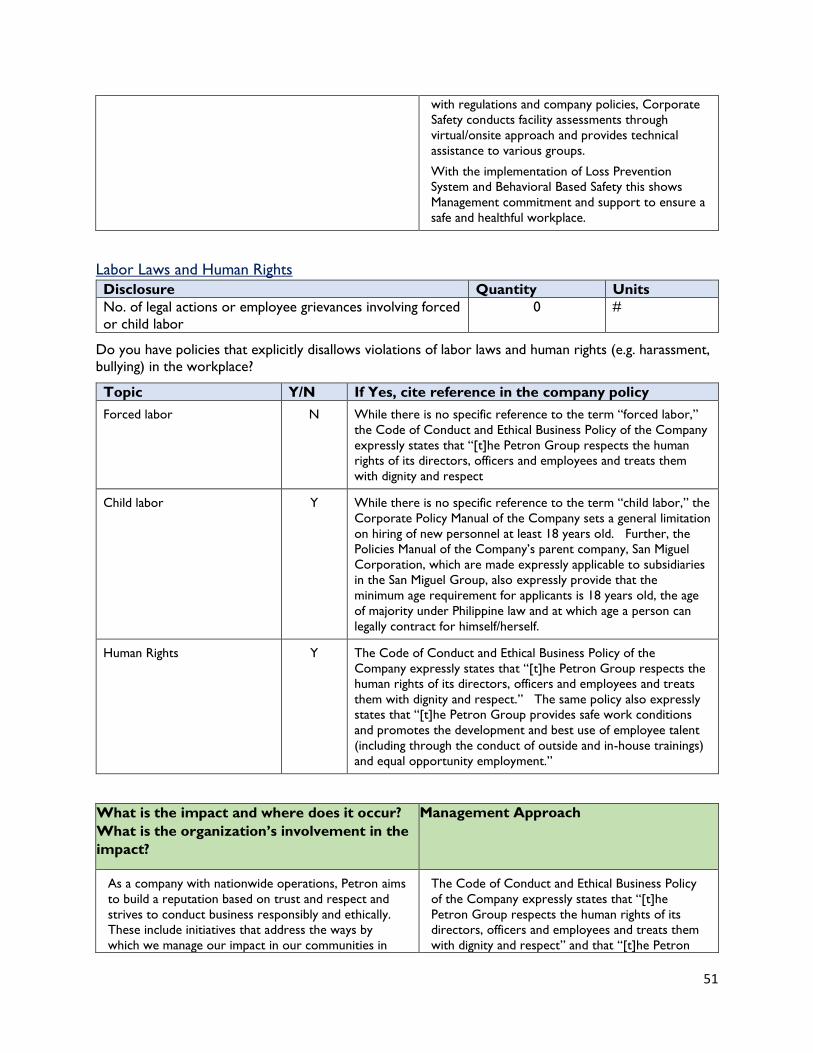
51
with regulations and company policies, Corporate
Safety conducts facility assessments through
virtual/onsite approach and provides technical
assistance to various groups.
With the implementation of Loss Prevention
System and Behavioral Based Safety this shows
Management commitment and support to ensure a
safe and healthful workplace.
Labor Laws and Human Rights
Disclosure Quantity Units
No. of legal actions or employee grievances involving forced
or child labor
0 #
Do you have policies that explicitly disallows violations of labor laws and human rights (e.g. harassment,
bullying) in the workplace?
Topic Y/N If Yes, cite reference in the company policy
Forced labor N While there is no specific reference to the term “forced labor,”
the Code of Conduct and Ethical Business Policy of the Company
expressly states that “[t]he Petron Group respects the human
rights of its directors, officers and employees and treats them
with dignity and respect
Child labor Y While there is no specific reference to the term “child labor,” the
Corporate Policy Manual of the Company sets a general limitation
on hiring of new personnel at least 18 years old. Further, the
Policies Manual of the Company’s parent company, San Miguel
Corporation, which are made expressly applicable to subsidiaries
in the San Miguel Group, also expressly provide that the
minimum age requirement for applicants is 18 years old, the age
of majority under Philippine law and at which age a person can
legally contract for himself/herself.
Human Rights Y The Code of Conduct and Ethical Business Policy of the
Company expressly states that “[t]he Petron Group respects the
human rights of its directors, officers and employees and treats
them with dignity and respect.” The same policy also expressly
states that “[t]he Petron Group provides safe work conditions
and promotes the development and best use of employee talent
(including through the conduct of outside and in-house trainings)
and equal opportunity employment.”
What is the impact and where does it occur?
What is the organization’s involvement in the
impact?
Management Approach
As a company with nationwide operations, Petron aims
to build a reputation based on trust and respect and
strives to conduct business responsibly and ethically.
These include initiatives that address the ways by
which we manage our impact in our communities in
The Code of Conduct and Ethical Business Policy
of the Company expressly states that “[t]he
Petron Group respects the human rights of its
directors, officers and employees and treats them
with dignity and respect” and that “[t]he Petron
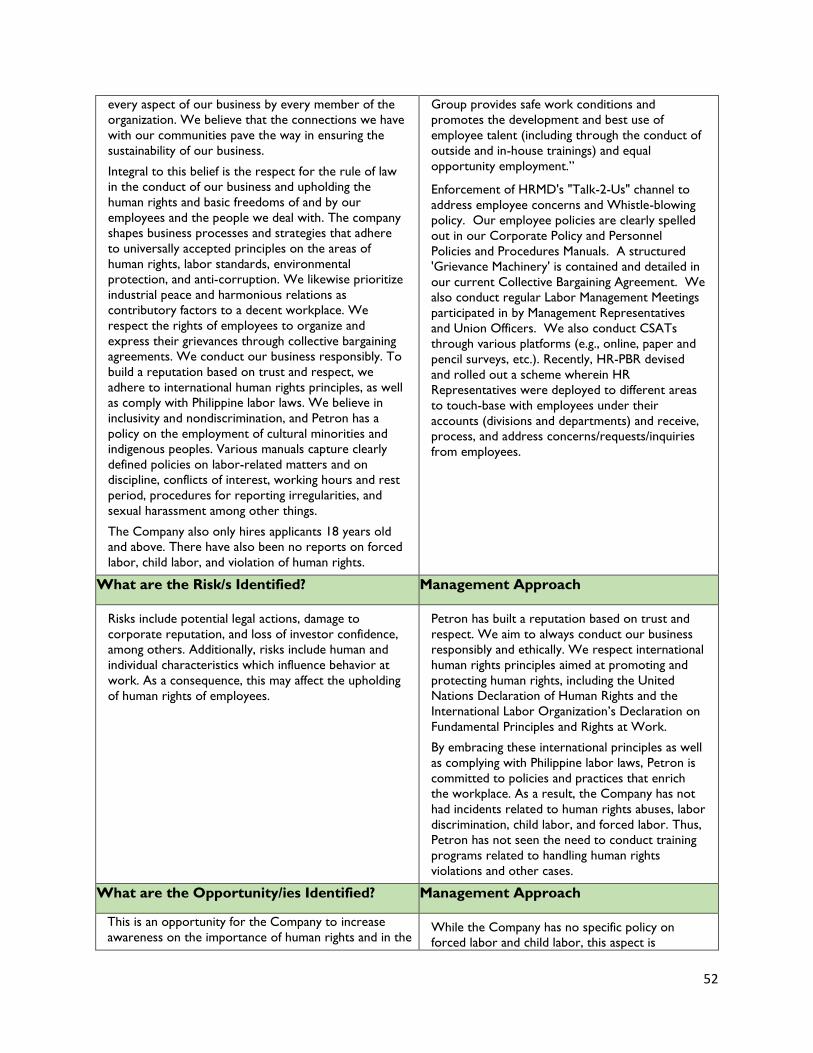
52
every aspect of our business by every member of the
organization. We believe that the connections we have
with our communities pave the way in ensuring the
sustainability of our business.
Integral to this belief is the respect for the rule of law
in the conduct of our business and upholding the
human rights and basic freedoms of and by our
employees and the people we deal with. The company
shapes business processes and strategies that adhere
to universally accepted principles on the areas of
human rights, labor standards, environmental
protection, and anti-corruption. We likewise prioritize
industrial peace and harmonious relations as
contributory factors to a decent workplace. We
respect the rights of employees to organize and
express their grievances through collective bargaining
agreements. We conduct our business responsibly. To
build a reputation based on trust and respect, we
adhere to international human rights principles, as well
as comply with Philippine labor laws. We believe in
inclusivity and nondiscrimination, and Petron has a
policy on the employment of cultural minorities and
indigenous peoples. Various manuals capture clearly
defined policies on labor-related matters and on
discipline, conflicts of interest, working hours and rest
period, procedures for reporting irregularities, and
sexual harassment among other things.
The Company also only hires applicants 18 years old
and above. There have also been no reports on forced
labor, child labor, and violation of human rights.
Group provides safe work conditions and
promotes the development and best use of
employee talent (including through the conduct of
outside and in-house trainings) and equal
opportunity employment.”
Enforcement of HRMD's "Talk-2-Us" channel to
address employee concerns and Whistle-blowing
policy. Our employee policies are clearly spelled
out in our Corporate Policy and Personnel
Policies and Procedures Manuals. A structured
'Grievance Machinery' is contained and detailed in
our current Collective Bargaining Agreement. We
also conduct regular Labor Management Meetings
participated in by Management Representatives
and Union Officers. We also conduct CSATs
through various platforms (e.g., online, paper and
pencil surveys, etc.). Recently, HR-PBR devised
and rolled out a scheme wherein HR
Representatives were deployed to different areas
to touch-base with employees under their
accounts (divisions and departments) and receive,
process, and address concerns/requests/inquiries
from employees.
What are the Risk/s Identified? Management Approach
Risks include potential legal actions, damage to
corporate reputation, and loss of investor confidence,
among others. Additionally, risks include human and
individual characteristics which influence behavior at
work. As a consequence, this may affect the upholding
of human rights of employees.
Petron has built a reputation based on trust and
respect. We aim to always conduct our business
responsibly and ethically. We respect international
human rights principles aimed at promoting and
protecting human rights, including the United
Nations Declaration of Human Rights and the
International Labor Organization’s Declaration on
Fundamental Principles and Rights at Work.
By embracing these international principles as well
as complying with Philippine labor laws, Petron is
committed to policies and practices that enrich
the workplace. As a result, the Company has not
had incidents related to human rights abuses, labor
discrimination, child labor, and forced labor. Thus,
Petron has not seen the need to conduct training
programs related to handling human rights
violations and other cases.
What are the Opportunity/ies Identified? Management Approach
This is an opportunity for the Company to increase
awareness on the importance of human rights and in the While the Company has no specific policy on
forced labor and child labor, this aspect is
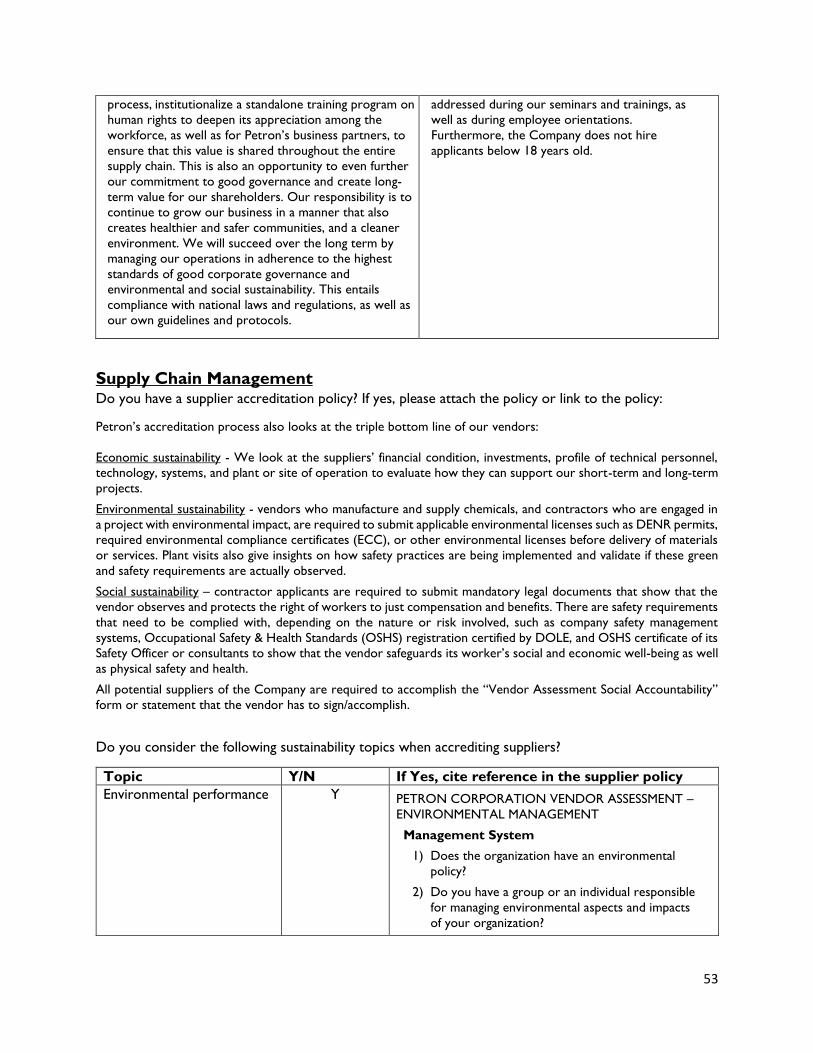
53
process, institutionalize a standalone training program on
human rights to deepen its appreciation among the
workforce, as well as for Petron’s business partners, to
ensure that this value is shared throughout the entire
supply chain. This is also an opportunity to even further
our commitment to good governance and create long-
term value for our shareholders. Our responsibility is to
continue to grow our business in a manner that also
creates healthier and safer communities, and a cleaner
environment. We will succeed over the long term by
managing our operations in adherence to the highest
standards of good corporate governance and
environmental and social sustainability. This entails
compliance with national laws and regulations, as well as
our own guidelines and protocols.
addressed during our seminars and trainings, as
well as during employee orientations.
Furthermore, the Company does not hire
applicants below 18 years old.
Supply Chain Management Do you have a supplier accreditation policy? If yes, please attach the policy or link to the policy:
Petron’s accreditation process also looks at the triple bottom line of our vendors:
Economic sustainability - We look at the suppliers’ financial condition, investments, profile of technical personnel,
technology, systems, and plant or site of operation to evaluate how they can support our short-term and long-term
projects.
Environmental sustainability - vendors who manufacture and supply chemicals, and contractors who are engaged in
a project with environmental impact, are required to submit applicable environmental licenses such as DENR permits,
required environmental compliance certificates (ECC), or other environmental licenses before delivery of materials
or services. Plant visits also give insights on how safety practices are being implemented and validate if these green
and safety requirements are actually observed.
Social sustainability – contractor applicants are required to submit mandatory legal documents that show that the
vendor observes and protects the right of workers to just compensation and benefits. There are safety requirements
that need to be complied with, depending on the nature or risk involved, such as company safety management
systems, Occupational Safety & Health Standards (OSHS) registration certified by DOLE, and OSHS certificate of its
Safety Officer or consultants to show that the vendor safeguards its worker’s social and economic well-being as well
as physical safety and health.
All potential suppliers of the Company are required to accomplish the “Vendor Assessment Social Accountability”
form or statement that the vendor has to sign/accomplish.
Do you consider the following sustainability topics when accrediting suppliers?
Topic Y/N If Yes, cite reference in the supplier policy
Environmental performance Y PETRON CORPORATION VENDOR ASSESSMENT –
ENVIRONMENTAL MANAGEMENT
Management System
1) Does the organization have an environmental
policy?
2) Do you have a group or an individual responsible
for managing environmental aspects and impacts
of your organization?
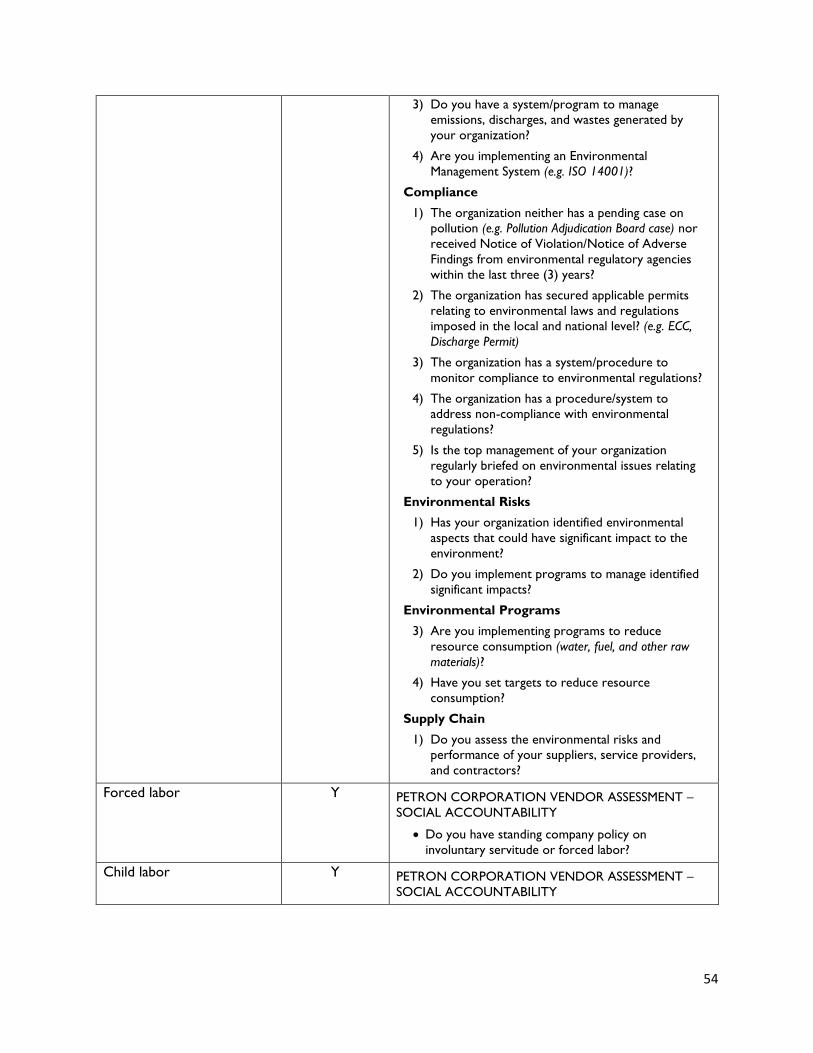
54
3) Do you have a system/program to manage
emissions, discharges, and wastes generated by
your organization?
4) Are you implementing an Environmental
Management System (e.g. ISO 14001)?
Compliance
1) The organization neither has a pending case on
pollution (e.g. Pollution Adjudication Board case) nor
received Notice of Violation/Notice of Adverse
Findings from environmental regulatory agencies
within the last three (3) years?
2) The organization has secured applicable permits
relating to environmental laws and regulations
imposed in the local and national level? (e.g. ECC,
Discharge Permit)
3) The organization has a system/procedure to
monitor compliance to environmental regulations?
4) The organization has a procedure/system to
address non-compliance with environmental
regulations?
5) Is the top management of your organization
regularly briefed on environmental issues relating
to your operation?
Environmental Risks
1) Has your organization identified environmental
aspects that could have significant impact to the
environment?
2) Do you implement programs to manage identified
significant impacts?
Environmental Programs
3) Are you implementing programs to reduce
resource consumption (water, fuel, and other raw
materials)?
4) Have you set targets to reduce resource
consumption?
Supply Chain
1) Do you assess the environmental risks and
performance of your suppliers, service providers,
and contractors?
Forced labor Y PETRON CORPORATION VENDOR ASSESSMENT –
SOCIAL ACCOUNTABILITY
• Do you have standing company policy on
involuntary servitude or forced labor?
Child labor Y PETRON CORPORATION VENDOR ASSESSMENT –
SOCIAL ACCOUNTABILITY
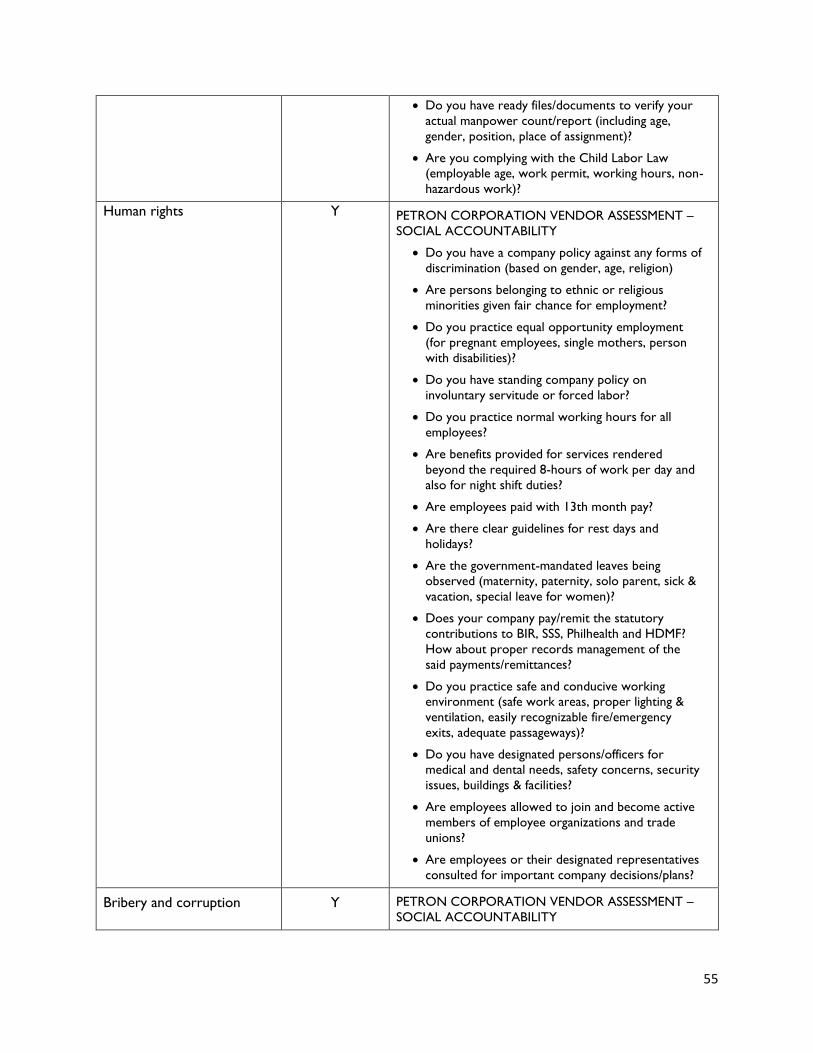
55
• Do you have ready files/documents to verify your
actual manpower count/report (including age,
gender, position, place of assignment)?
• Are you complying with the Child Labor Law
(employable age, work permit, working hours, non-
hazardous work)?
Human rights Y PETRON CORPORATION VENDOR ASSESSMENT –
SOCIAL ACCOUNTABILITY
• Do you have a company policy against any forms of
discrimination (based on gender, age, religion)
• Are persons belonging to ethnic or religious
minorities given fair chance for employment?
• Do you practice equal opportunity employment
(for pregnant employees, single mothers, person
with disabilities)?
• Do you have standing company policy on
involuntary servitude or forced labor?
• Do you practice normal working hours for all
employees?
• Are benefits provided for services rendered
beyond the required 8-hours of work per day and
also for night shift duties?
• Are employees paid with 13th month pay?
• Are there clear guidelines for rest days and
holidays?
• Are the government-mandated leaves being
observed (maternity, paternity, solo parent, sick &
vacation, special leave for women)?
• Does your company pay/remit the statutory
contributions to BIR, SSS, Philhealth and HDMF?
How about proper records management of the
said payments/remittances?
• Do you practice safe and conducive working
environment (safe work areas, proper lighting &
ventilation, easily recognizable fire/emergency
exits, adequate passageways)?
• Do you have designated persons/officers for
medical and dental needs, safety concerns, security
issues, buildings & facilities?
• Are employees allowed to join and become active
members of employee organizations and trade
unions?
• Are employees or their designated representatives
consulted for important company decisions/plans?
Bribery and corruption Y PETRON CORPORATION VENDOR ASSESSMENT –
SOCIAL ACCOUNTABILITY
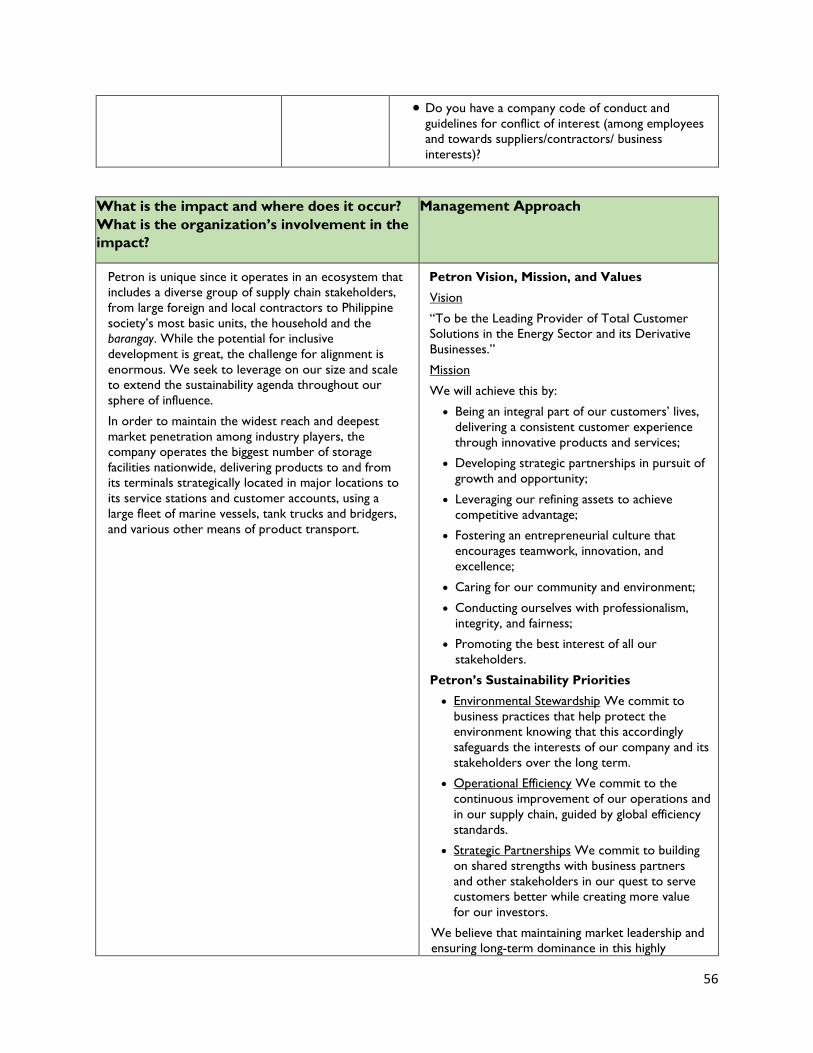
56
• Do you have a company code of conduct and
guidelines for conflict of interest (among employees
and towards suppliers/contractors/ business
interests)?
What is the impact and where does it occur?
What is the organization’s involvement in the
impact?
Management Approach
Petron is unique since it operates in an ecosystem that
includes a diverse group of supply chain stakeholders,
from large foreign and local contractors to Philippine
society’s most basic units, the household and the
barangay. While the potential for inclusive
development is great, the challenge for alignment is
enormous. We seek to leverage on our size and scale
to extend the sustainability agenda throughout our
sphere of influence.
In order to maintain the widest reach and deepest
market penetration among industry players, the
company operates the biggest number of storage
facilities nationwide, delivering products to and from
its terminals strategically located in major locations to
its service stations and customer accounts, using a
large fleet of marine vessels, tank trucks and bridgers,
and various other means of product transport.
Petron Vision, Mission, and Values
Vision
“To be the Leading Provider of Total Customer
Solutions in the Energy Sector and its Derivative
Businesses.”
Mission
We will achieve this by:
• Being an integral part of our customers’ lives,
delivering a consistent customer experience
through innovative products and services;
• Developing strategic partnerships in pursuit of
growth and opportunity;
• Leveraging our refining assets to achieve
competitive advantage;
• Fostering an entrepreneurial culture that
encourages teamwork, innovation, and
excellence;
• Caring for our community and environment;
• Conducting ourselves with professionalism,
integrity, and fairness;
• Promoting the best interest of all our
stakeholders.
Petron’s Sustainability Priorities
• Environmental Stewardship We commit to
business practices that help protect the
environment knowing that this accordingly
safeguards the interests of our company and its
stakeholders over the long term.
• Operational Efficiency We commit to the
continuous improvement of our operations and
in our supply chain, guided by global efficiency
standards.
• Strategic Partnerships We commit to building
on shared strengths with business partners
and other stakeholders in our quest to serve
customers better while creating more value
for our investors.
We believe that maintaining market leadership and
ensuring long-term dominance in this highly
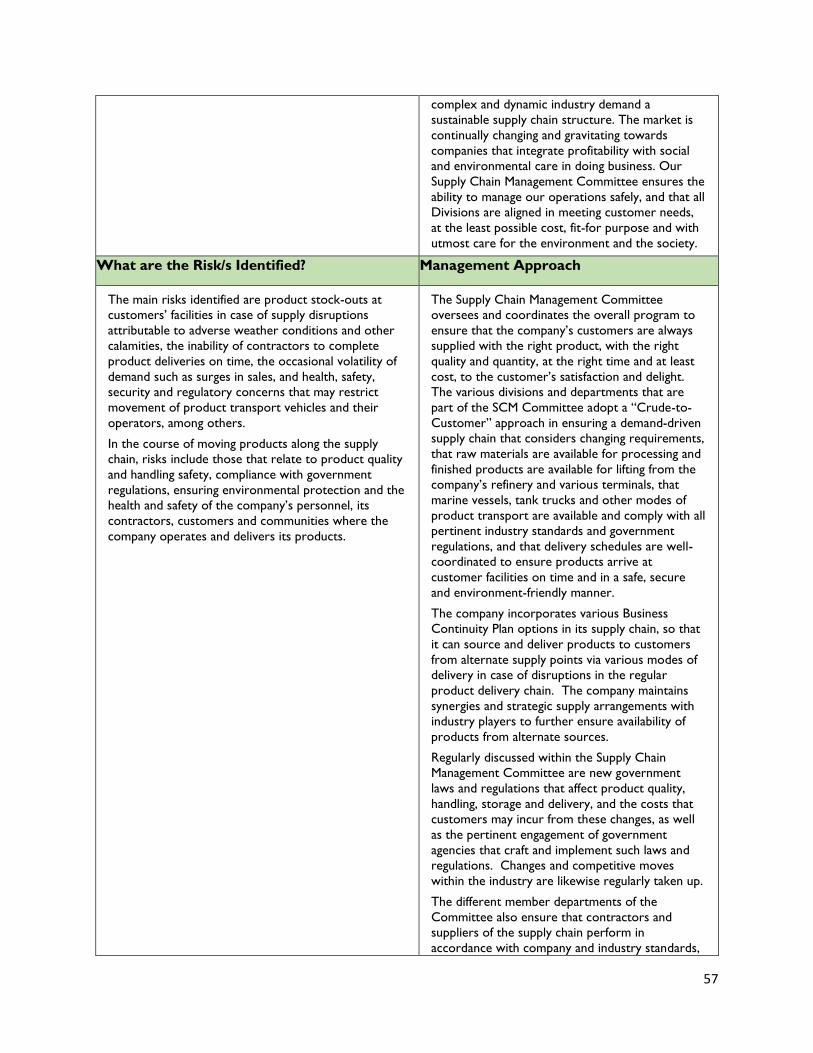
57
complex and dynamic industry demand a
sustainable supply chain structure. The market is
continually changing and gravitating towards
companies that integrate profitability with social
and environmental care in doing business. Our
Supply Chain Management Committee ensures the
ability to manage our operations safely, and that all
Divisions are aligned in meeting customer needs,
at the least possible cost, fit-for purpose and with
utmost care for the environment and the society.
What are the Risk/s Identified? Management Approach
The main risks identified are product stock-outs at
customers’ facilities in case of supply disruptions
attributable to adverse weather conditions and other
calamities, the inability of contractors to complete
product deliveries on time, the occasional volatility of
demand such as surges in sales, and health, safety,
security and regulatory concerns that may restrict
movement of product transport vehicles and their
operators, among others.
In the course of moving products along the supply
chain, risks include those that relate to product quality
and handling safety, compliance with government
regulations, ensuring environmental protection and the
health and safety of the company’s personnel, its
contractors, customers and communities where the
company operates and delivers its products.
The Supply Chain Management Committee
oversees and coordinates the overall program to
ensure that the company’s customers are always
supplied with the right product, with the right
quality and quantity, at the right time and at least
cost, to the customer’s satisfaction and delight.
The various divisions and departments that are
part of the SCM Committee adopt a “Crude-to-
Customer” approach in ensuring a demand-driven
supply chain that considers changing requirements,
that raw materials are available for processing and
finished products are available for lifting from the
company’s refinery and various terminals, that
marine vessels, tank trucks and other modes of
product transport are available and comply with all
pertinent industry standards and government
regulations, and that delivery schedules are well-
coordinated to ensure products arrive at
customer facilities on time and in a safe, secure
and environment-friendly manner.
The company incorporates various Business
Continuity Plan options in its supply chain, so that
it can source and deliver products to customers
from alternate supply points via various modes of
delivery in case of disruptions in the regular
product delivery chain. The company maintains
synergies and strategic supply arrangements with
industry players to further ensure availability of
products from alternate sources.
Regularly discussed within the Supply Chain
Management Committee are new government
laws and regulations that affect product quality,
handling, storage and delivery, and the costs that
customers may incur from these changes, as well
as the pertinent engagement of government
agencies that craft and implement such laws and
regulations. Changes and competitive moves
within the industry are likewise regularly taken up.
The different member departments of the
Committee also ensure that contractors and
suppliers of the supply chain perform in
accordance with company and industry standards,
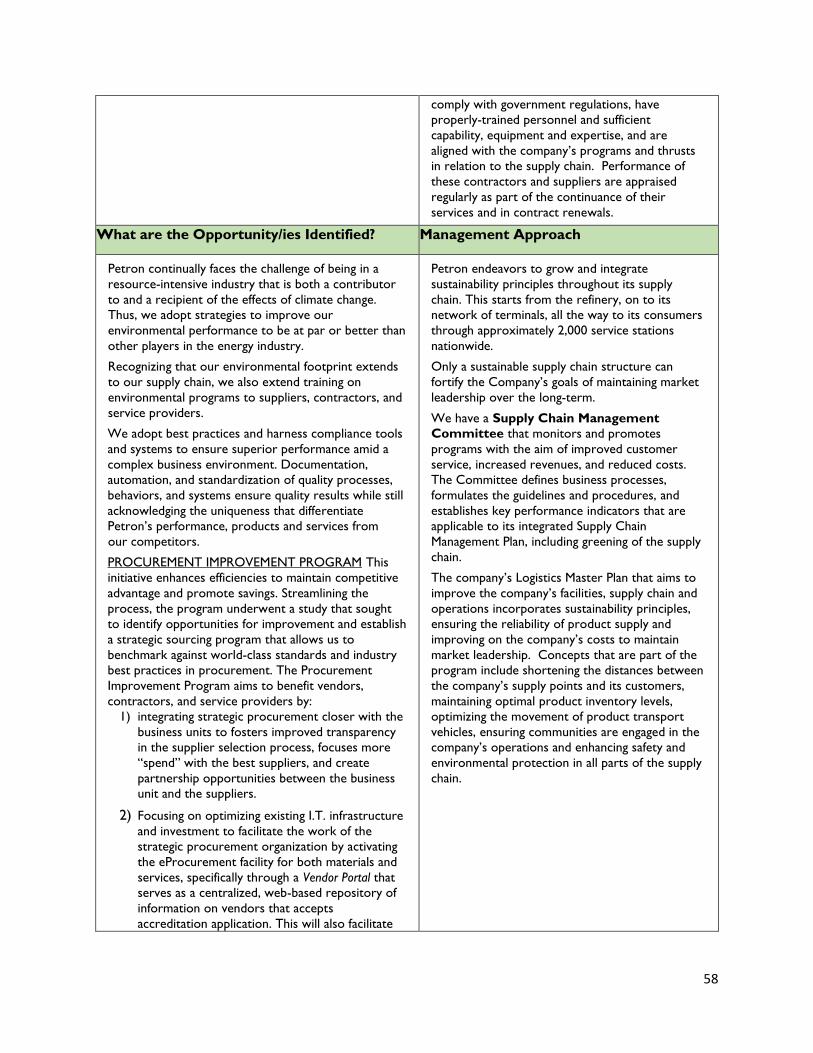
58
comply with government regulations, have
properly-trained personnel and sufficient
capability, equipment and expertise, and are
aligned with the company’s programs and thrusts
in relation to the supply chain. Performance of
these contractors and suppliers are appraised
regularly as part of the continuance of their
services and in contract renewals.
What are the Opportunity/ies Identified? Management Approach
Petron continually faces the challenge of being in a
resource-intensive industry that is both a contributor
to and a recipient of the effects of climate change.
Thus, we adopt strategies to improve our
environmental performance to be at par or better than
other players in the energy industry.
Recognizing that our environmental footprint extends
to our supply chain, we also extend training on
environmental programs to suppliers, contractors, and
service providers.
We adopt best practices and harness compliance tools
and systems to ensure superior performance amid a
complex business environment. Documentation,
automation, and standardization of quality processes,
behaviors, and systems ensure quality results while still
acknowledging the uniqueness that differentiate
Petron’s performance, products and services from
our competitors.
PROCUREMENT IMPROVEMENT PROGRAM This
initiative enhances efficiencies to maintain competitive
advantage and promote savings. Streamlining the
process, the program underwent a study that sought
to identify opportunities for improvement and establish
a strategic sourcing program that allows us to
benchmark against world-class standards and industry
best practices in procurement. The Procurement
Improvement Program aims to benefit vendors,
contractors, and service providers by:
1) integrating strategic procurement closer with the
business units to fosters improved transparency
in the supplier selection process, focuses more
“spend” with the best suppliers, and create
partnership opportunities between the business
unit and the suppliers.
2) Focusing on optimizing existing I.T. infrastructure
and investment to facilitate the work of the
strategic procurement organization by activating
the eProcurement facility for both materials and
services, specifically through a Vendor Portal that
serves as a centralized, web-based repository of
information on vendors that accepts
accreditation application. This will also facilitate
Petron endeavors to grow and integrate
sustainability principles throughout its supply
chain. This starts from the refinery, on to its
network of terminals, all the way to its consumers
through approximately 2,000 service stations
nationwide.
Only a sustainable supply chain structure can
fortify the Company’s goals of maintaining market
leadership over the long-term.
We have a Supply Chain Management
Committee that monitors and promotes
programs with the aim of improved customer
service, increased revenues, and reduced costs.
The Committee defines business processes,
formulates the guidelines and procedures, and
establishes key performance indicators that are
applicable to its integrated Supply Chain
Management Plan, including greening of the supply
chain.
The company’s Logistics Master Plan that aims to
improve the company’s facilities, supply chain and
operations incorporates sustainability principles,
ensuring the reliability of product supply and
improving on the company’s costs to maintain
market leadership. Concepts that are part of the
program include shortening the distances between
the company’s supply points and its customers,
maintaining optimal product inventory levels,
optimizing the movement of product transport
vehicles, ensuring communities are engaged in the
company’s operations and enhancing safety and
environmental protection in all parts of the supply
chain.
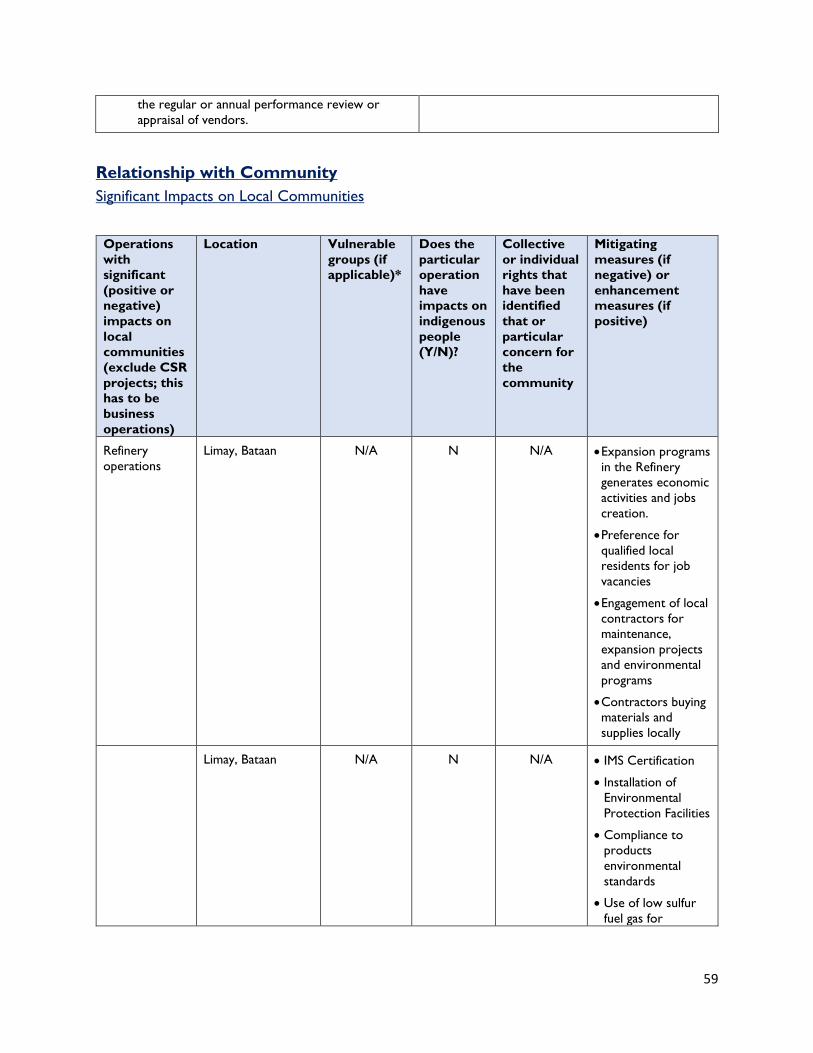
59
the regular or annual performance review or
appraisal of vendors.
Relationship with Community
Significant Impacts on Local Communities
Operations
with
significant
(positive or
negative)
impacts on
local
communities
(exclude CSR
projects; this
has to be
business
operations)
Location Vulnerable
groups (if
applicable)*
Does the
particular
operation
have
impacts on
indigenous
people
(Y/N)?
Collective
or individual
rights that
have been
identified
that or
particular
concern for
the
community
Mitigating
measures (if
negative) or
enhancement
measures (if
positive)
Refinery
operations
Limay, Bataan N/A N N/A • Expansion programs
in the Refinery
generates economic
activities and jobs
creation.
• Preference for
qualified local
residents for job
vacancies
• Engagement of local
contractors for
maintenance,
expansion projects
and environmental
programs
• Contractors buying
materials and
supplies locally
Limay, Bataan N/A N N/A • IMS Certification
• Installation of
Environmental
Protection Facilities
• Compliance to
products
environmental
standards
• Use of low sulfur
fuel gas for
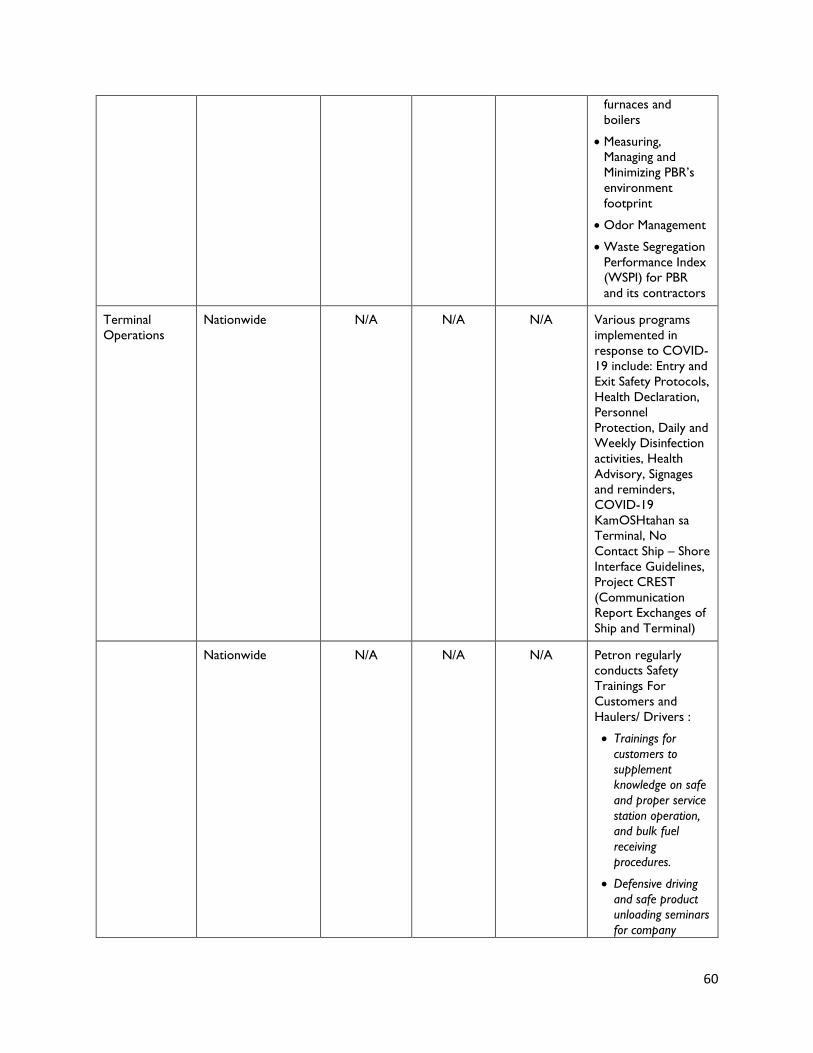
60
furnaces and
boilers
• Measuring,
Managing and
Minimizing PBR’s
environment
footprint
• Odor Management
• Waste Segregation
Performance Index
(WSPI) for PBR
and its contractors
Terminal
Operations
Nationwide N/A N/A N/A Various programs
implemented in
response to COVID-
19 include: Entry and
Exit Safety Protocols,
Health Declaration,
Personnel
Protection, Daily and
Weekly Disinfection
activities, Health
Advisory, Signages
and reminders,
COVID-19
KamOSHtahan sa
Terminal, No
Contact Ship – Shore
Interface Guidelines,
Project CREST
(Communication
Report Exchanges of
Ship and Terminal)
Nationwide N/A N/A N/A Petron regularly
conducts Safety
Trainings For
Customers and
Haulers/ Drivers :
• Trainings for
customers to
supplement
knowledge on safe
and proper service
station operation,
and bulk fuel
receiving
procedures.
• Defensive driving
and safe product
unloading seminars
for company
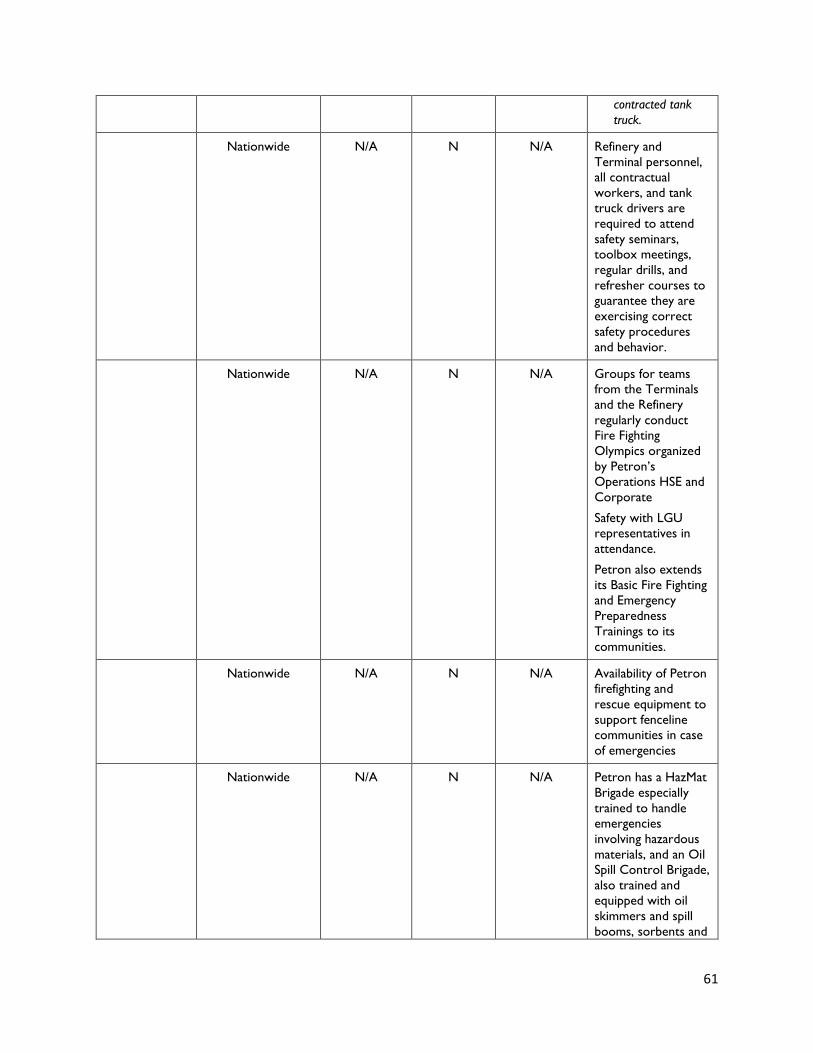
61
contracted tank
truck.
Nationwide N/A N N/A Refinery and
Terminal personnel,
all contractual
workers, and tank
truck drivers are
required to attend
safety seminars,
toolbox meetings,
regular drills, and
refresher courses to
guarantee they are
exercising correct
safety procedures
and behavior.
Nationwide N/A N N/A Groups for teams
from the Terminals
and the Refinery
regularly conduct
Fire Fighting
Olympics organized
by Petron’s
Operations HSE and
Corporate
Safety with LGU
representatives in
attendance.
Petron also extends
its Basic Fire Fighting
and Emergency
Preparedness
Trainings to its
communities.
Nationwide N/A N N/A Availability of Petron
firefighting and
rescue equipment to
support fenceline
communities in case
of emergencies
Nationwide N/A N N/A Petron has a HazMat
Brigade especially
trained to handle
emergencies
involving hazardous
materials, and an Oil
Spill Control Brigade,
also trained and
equipped with oil
skimmers and spill
booms, sorbents and
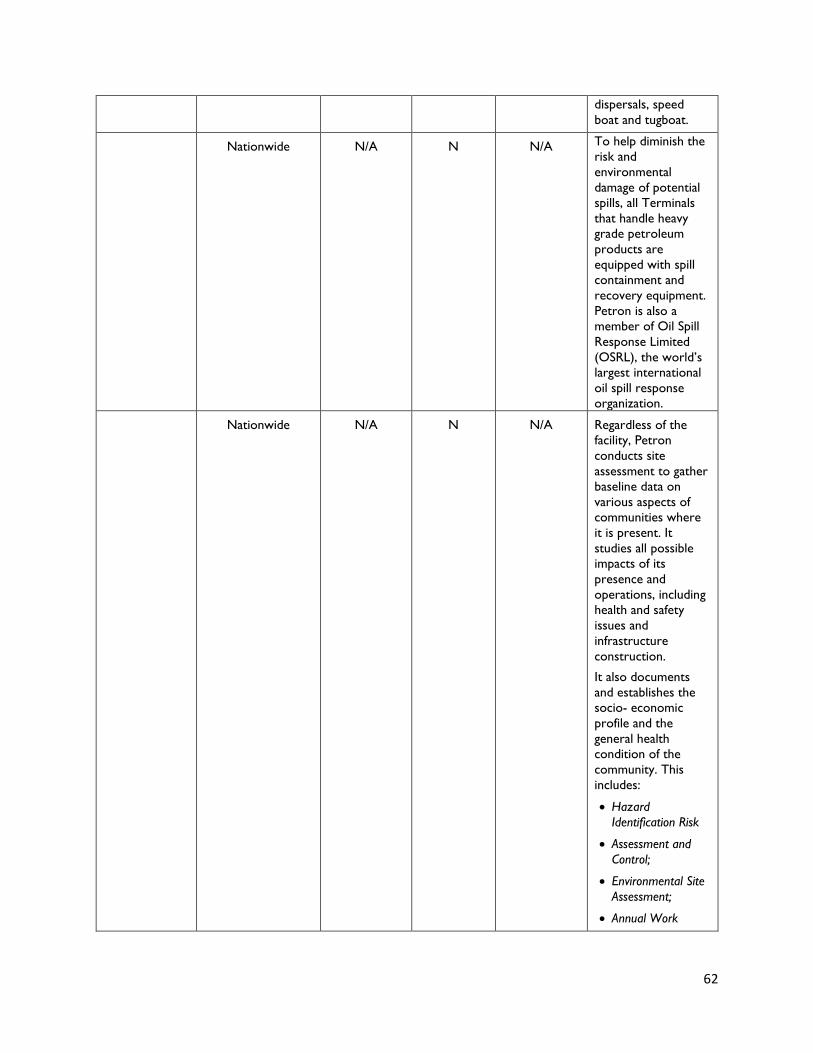
62
dispersals, speed
boat and tugboat.
Nationwide N/A N N/A To help diminish the
risk and
environmental
damage of potential
spills, all Terminals
that handle heavy
grade petroleum
products are
equipped with spill
containment and
recovery equipment.
Petron is also a
member of Oil Spill
Response Limited
(OSRL), the world’s
largest international
oil spill response
organization.
Nationwide N/A N N/A Regardless of the
facility, Petron
conducts site
assessment to gather
baseline data on
various aspects of
communities where
it is present. It
studies all possible
impacts of its
presence and
operations, including
health and safety
issues and
infrastructure
construction.
It also documents
and establishes the
socio- economic
profile and the
general health
condition of the
community. This
includes:
• Hazard
Identification Risk
• Assessment and
Control;
• Environmental Site
Assessment;
• Annual Work
63
• Environmental
Measurement to
establish noise
levels, air quality,
and soil quality;
• Hazard Operability
Studies and fire
scenario heat
models per project.
Nationwide N/A N N/A Petron’s Terminal
EcoWatch build on
and greatly enhances
the Industrial
EcoWatch Rating
System or IERS, an
initiative under
DENR AO 2003-36
that promotes self-
regulation among
industries for
improved
environmental
compliance and
performance through
a rating system. The
EcoWatch assesses
environmental
performances in
terms of maturity of
environmental
management.
In its 8th year of
implementation, the
Ecowatch program
for terminals
achieved an 86%
increase in
environmental
management and
compliance rating
compared to baseline
rating in 2014.
Corporate
Technical
Services Group
Nationwide N/A N N/A Project TRACIE
(Tracking and
Recognizing All
COVID-19 Infection
in the workplace
Environment) utilized
QR code scanning
technology to
minimize physical
contact of using
manual forms, pens
64
and long queues and
shortens the
processing time of
accomplishing the
form. Aside from
serving as an
effective tool for
contact tracing, this
ensures the
immediate
assessment and
response of our
medical personnel
should the need
arise. This program is
in coordination with
HRMD, HOC Admin
and MISD, and
implemented in the
Petron Head Office
and in all Terminals.
Nationwide N/A N N/A Corporate Safety
advocates safety
culture by ensuring
the participation of
all stakeholders and
other divisions in the
Safety Council. In
response to the
Covid-19 pandemic,
safety guidelines
were issued to
ensure strict
enforcement of
social distancing and
strengthen
awareness of Petron
personnel as well as
third party service
providers in all
Petron Facilities. To
continuously ensure
compliance with
regulations and
company policies,
Corporate Safety
conducts facility
assessments through
virtual/ onsite
approach and
provides relevant
safety and technical
trainings.
65
Nationwide N N N/A Conducted
training/seminars for
employees,
contractors and
customers as
prescribed by
government agencies
(i.e. DOLE, BFP) and/
or required as
defined by the
policies of the
company. These
include advanced
safety courses for
the development of
technical skills of
safety personnel,
such as Mandatory 8-
hr OSH Seminar
among Petron
employees in
compliances with
R.A. 11058.
Nationwide N N N/A Through Petron’s
Contractor Safety
Management (CSM)
Manual, the
Company provides a
practical and
relevant system for
the contract
administrator/ site
management
overseeing the work
of our contractors,
to integrate health
and safety
requirements into
contractor
management and to
fulfill the company’s
health and safety
obligations to its
contractors.
In coordination with
Petron’s
Procurement group,
CTSG Safety
conducted six (6)
sessions of
Contractor Safety
Orientations in 2021
attended by a total
66
of 677 contractors.
This is one of the
requirements for the
Contractor Safety
Management System
and Procurement
accreditation.
CTSG Safety also
conducted the Safety
Evaluation of 13
Third Party Service
Providers (TPSP) for
Contractor
Accreditation in
coordination with
Procurement.
Retail
Operations
Nationwide N/A N N/A Petron introduced a
number of industry
firsts for
environment-friendly
products, beginning
with the early rollout
of unleaded gasoline
and low-sulfer diesel
in the 90s. It also
pioneered in meeting
the highly stringent
European fuel quality
standards with
Blaze 100 EURO
6, the country’s first
premium plus
gasoline that meets
both Philippines and
European standards.
Nationwide N/A N N/A All operating facilities
of Petron are
required to have
Pollution Control
Officers (PCO).
CTESG-Environment
assists in complying
with this
requirement. This
group renewed its
recognition as a
Training
Organization for
Category A Pollution
Control Officers
until October 22,
2022. This will allow
the continued
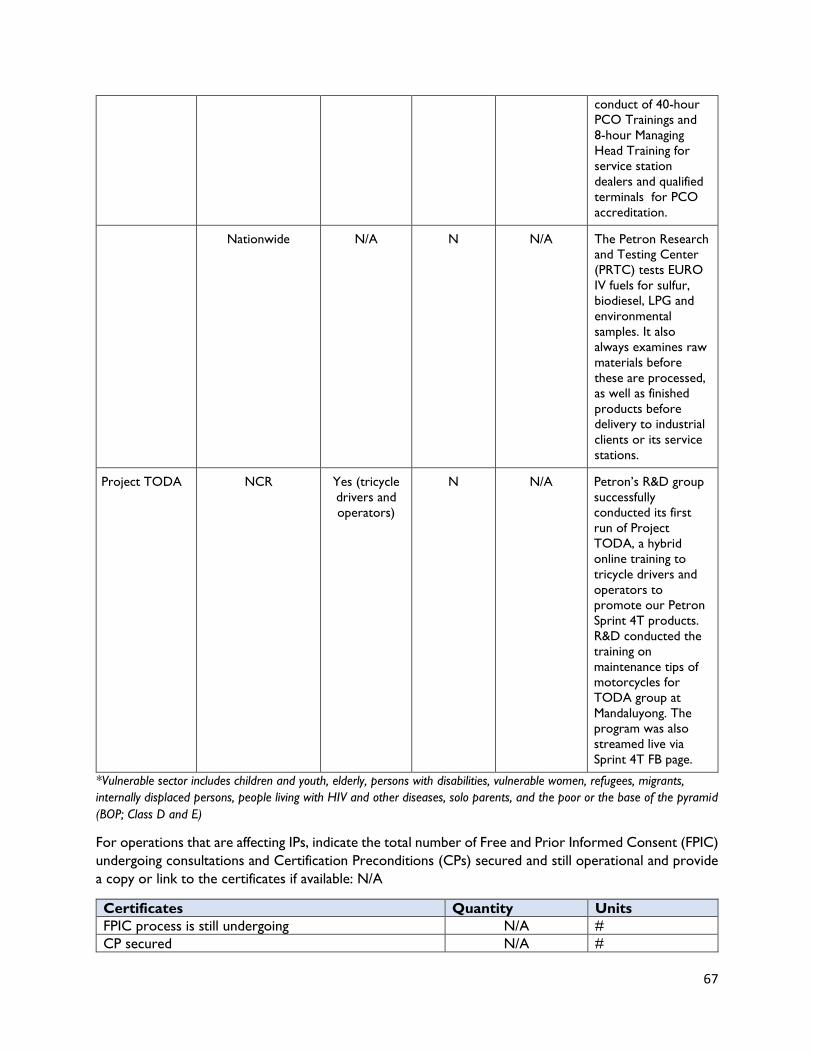
67
conduct of 40-hour
PCO Trainings and
8-hour Managing
Head Training for
service station
dealers and qualified
terminals for PCO
accreditation.
Nationwide N/A N N/A The Petron Research
and Testing Center
(PRTC) tests EURO
IV fuels for sulfur,
biodiesel, LPG and
environmental
samples. It also
always examines raw
materials before
these are processed,
as well as finished
products before
delivery to industrial
clients or its service
stations.
Project TODA
NCR Yes (tricycle
drivers and
operators)
N N/A Petron’s R&D group
successfully
conducted its first
run of Project
TODA, a hybrid
online training to
tricycle drivers and
operators to
promote our Petron
Sprint 4T products.
R&D conducted the
training on
maintenance tips of
motorcycles for
TODA group at
Mandaluyong. The
program was also
streamed live via
Sprint 4T FB page.
*Vulnerable sector includes children and youth, elderly, persons with disabilities, vulnerable women, refugees, migrants,
internally displaced persons, people living with HIV and other diseases, solo parents, and the poor or the base of the pyramid
(BOP; Class D and E)
For operations that are affecting IPs, indicate the total number of Free and Prior Informed Consent (FPIC)
undergoing consultations and Certification Preconditions (CPs) secured and still operational and provide
a copy or link to the certificates if available: N/A
Certificates Quantity Units
FPIC process is still undergoing N/A #
CP secured N/A #
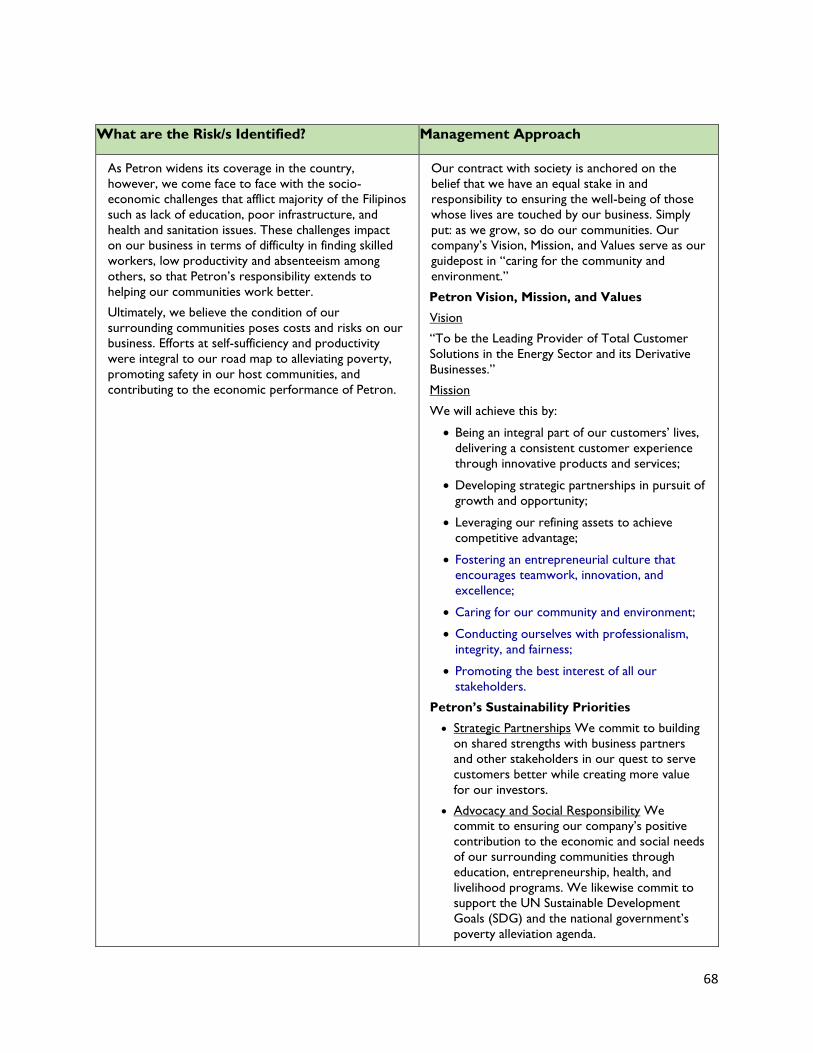
68
What are the Risk/s Identified? Management Approach
As Petron widens its coverage in the country,
however, we come face to face with the socio-
economic challenges that afflict majority of the Filipinos
such as lack of education, poor infrastructure, and
health and sanitation issues. These challenges impact
on our business in terms of difficulty in finding skilled
workers, low productivity and absenteeism among
others, so that Petron’s responsibility extends to
helping our communities work better.
Ultimately, we believe the condition of our
surrounding communities poses costs and risks on our
business. Efforts at self-sufficiency and productivity
were integral to our road map to alleviating poverty,
promoting safety in our host communities, and
contributing to the economic performance of Petron.
Our contract with society is anchored on the
belief that we have an equal stake in and
responsibility to ensuring the well-being of those
whose lives are touched by our business. Simply
put: as we grow, so do our communities. Our
company’s Vision, Mission, and Values serve as our
guidepost in “caring for the community and
environment.”
Petron Vision, Mission, and Values
Vision
“To be the Leading Provider of Total Customer
Solutions in the Energy Sector and its Derivative
Businesses.”
Mission
We will achieve this by:
• Being an integral part of our customers’ lives,
delivering a consistent customer experience
through innovative products and services;
• Developing strategic partnerships in pursuit of
growth and opportunity;
• Leveraging our refining assets to achieve
competitive advantage;
• Fostering an entrepreneurial culture that
encourages teamwork, innovation, and
excellence;
• Caring for our community and environment;
• Conducting ourselves with professionalism,
integrity, and fairness;
• Promoting the best interest of all our
stakeholders.
Petron’s Sustainability Priorities
• Strategic Partnerships We commit to building
on shared strengths with business partners
and other stakeholders in our quest to serve
customers better while creating more value
for our investors.
• Advocacy and Social Responsibility We
commit to ensuring our company’s positive
contribution to the economic and social needs
of our surrounding communities through
education, entrepreneurship, health, and
livelihood programs. We likewise commit to
support the UN Sustainable Development
Goals (SDG) and the national government’s
poverty alleviation agenda.
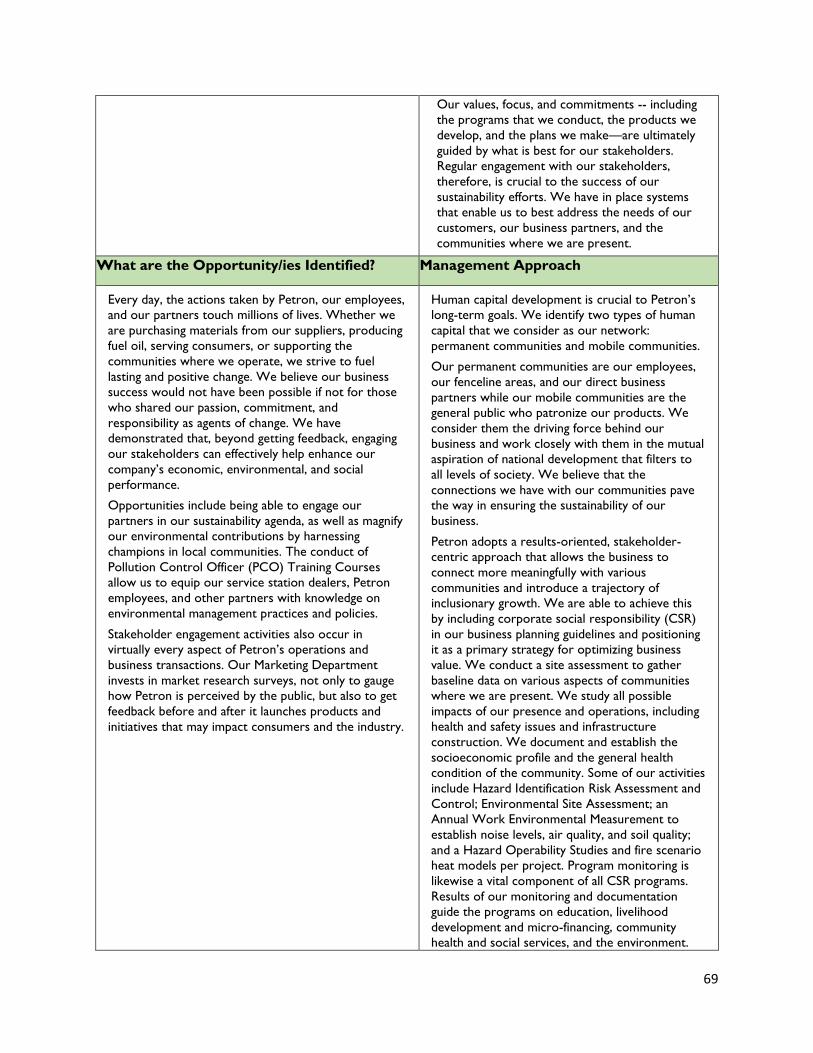
69
Our values, focus, and commitments -- including
the programs that we conduct, the products we
develop, and the plans we make—are ultimately
guided by what is best for our stakeholders.
Regular engagement with our stakeholders,
therefore, is crucial to the success of our
sustainability efforts. We have in place systems
that enable us to best address the needs of our
customers, our business partners, and the
communities where we are present.
What are the Opportunity/ies Identified? Management Approach
Every day, the actions taken by Petron, our employees,
and our partners touch millions of lives. Whether we
are purchasing materials from our suppliers, producing
fuel oil, serving consumers, or supporting the
communities where we operate, we strive to fuel
lasting and positive change. We believe our business
success would not have been possible if not for those
who shared our passion, commitment, and
responsibility as agents of change. We have
demonstrated that, beyond getting feedback, engaging
our stakeholders can effectively help enhance our
company’s economic, environmental, and social
performance.
Opportunities include being able to engage our
partners in our sustainability agenda, as well as magnify
our environmental contributions by harnessing
champions in local communities. The conduct of
Pollution Control Officer (PCO) Training Courses
allow us to equip our service station dealers, Petron
employees, and other partners with knowledge on
environmental management practices and policies.
Stakeholder engagement activities also occur in
virtually every aspect of Petron’s operations and
business transactions. Our Marketing Department
invests in market research surveys, not only to gauge
how Petron is perceived by the public, but also to get
feedback before and after it launches products and
initiatives that may impact consumers and the industry.
Human capital development is crucial to Petron’s
long-term goals. We identify two types of human
capital that we consider as our network:
permanent communities and mobile communities.
Our permanent communities are our employees,
our fenceline areas, and our direct business
partners while our mobile communities are the
general public who patronize our products. We
consider them the driving force behind our
business and work closely with them in the mutual
aspiration of national development that filters to
all levels of society. We believe that the
connections we have with our communities pave
the way in ensuring the sustainability of our
business.
Petron adopts a results-oriented, stakeholder-
centric approach that allows the business to
connect more meaningfully with various
communities and introduce a trajectory of
inclusionary growth. We are able to achieve this
by including corporate social responsibility (CSR)
in our business planning guidelines and positioning
it as a primary strategy for optimizing business
value. We conduct a site assessment to gather
baseline data on various aspects of communities
where we are present. We study all possible
impacts of our presence and operations, including
health and safety issues and infrastructure
construction. We document and establish the
socioeconomic profile and the general health
condition of the community. Some of our activities
include Hazard Identification Risk Assessment and
Control; Environmental Site Assessment; an
Annual Work Environmental Measurement to
establish noise levels, air quality, and soil quality;
and a Hazard Operability Studies and fire scenario
heat models per project. Program monitoring is
likewise a vital component of all CSR programs.
Results of our monitoring and documentation
guide the programs on education, livelihood
development and micro-financing, community
health and social services, and the environment.
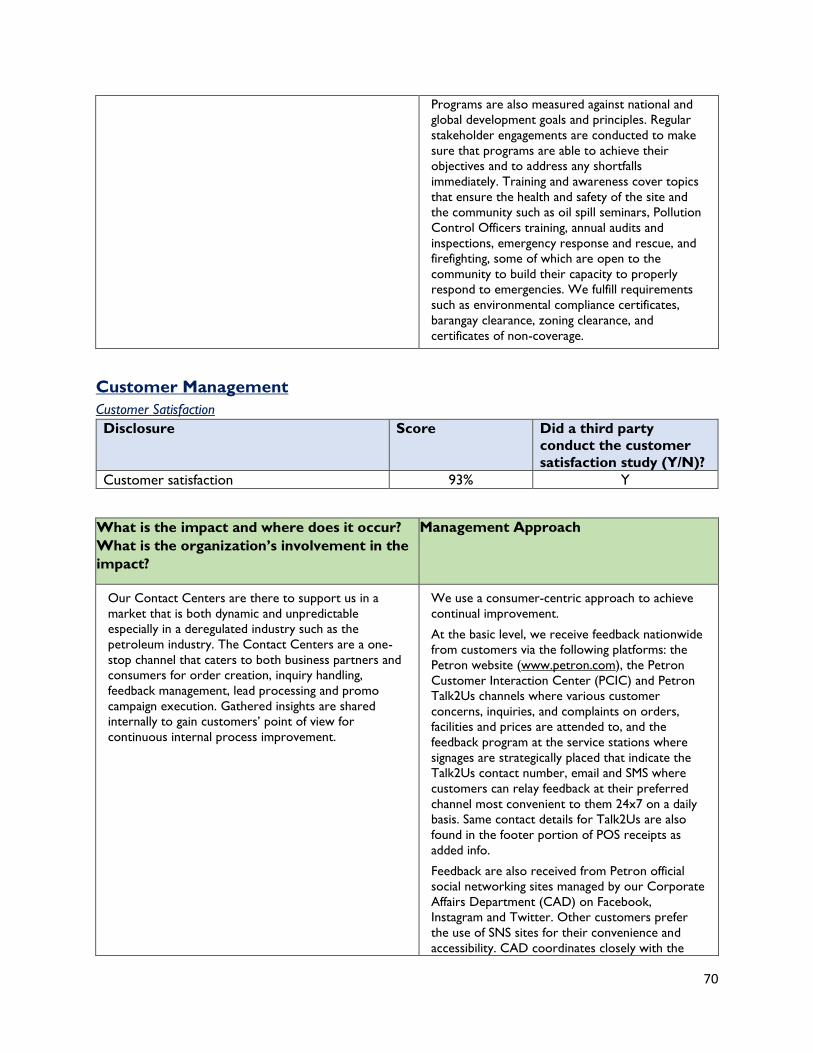
70
Programs are also measured against national and
global development goals and principles. Regular
stakeholder engagements are conducted to make
sure that programs are able to achieve their
objectives and to address any shortfalls
immediately. Training and awareness cover topics
that ensure the health and safety of the site and
the community such as oil spill seminars, Pollution
Control Officers training, annual audits and
inspections, emergency response and rescue, and
firefighting, some of which are open to the
community to build their capacity to properly
respond to emergencies. We fulfill requirements
such as environmental compliance certificates,
barangay clearance, zoning clearance, and
certificates of non-coverage.
Customer Management
Customer Satisfaction
Disclosure Score Did a third party
conduct the customer
satisfaction study (Y/N)?
Customer satisfaction 93% Y
What is the impact and where does it occur?
What is the organization’s involvement in the
impact?
Management Approach
Our Contact Centers are there to support us in a
market that is both dynamic and unpredictable
especially in a deregulated industry such as the
petroleum industry. The Contact Centers are a one-
stop channel that caters to both business partners and
consumers for order creation, inquiry handling,
feedback management, lead processing and promo
campaign execution. Gathered insights are shared
internally to gain customers’ point of view for
continuous internal process improvement.
We use a consumer-centric approach to achieve
continual improvement.
At the basic level, we receive feedback nationwide
from customers via the following platforms: the
Petron website (www.petron.com), the Petron
Customer Interaction Center (PCIC) and Petron
Talk2Us channels where various customer
concerns, inquiries, and complaints on orders,
facilities and prices are attended to, and the
feedback program at the service stations where
signages are strategically placed that indicate the
Talk2Us contact number, email and SMS where
customers can relay feedback at their preferred
channel most convenient to them 24x7 on a daily
basis. Same contact details for Talk2Us are also
found in the footer portion of POS receipts as
added info.
Feedback are also received from Petron official
social networking sites managed by our Corporate
Affairs Department (CAD) on Facebook,
Instagram and Twitter. Other customers prefer
the use of SNS sites for their convenience and
accessibility. CAD coordinates closely with the
71
Customer Relations Group (CRG) in the
monitoring of customer feedback – inquiries,
complaints, suggestions – for their proper and
prompt disposition.
All concerns are recorded in a CRM software and
these concerns are farmed out to respective
resolving parties such as service station dealers
thru our Areas Sales Executives and other internal
Petron parties. Once settled, resolving parties
inform feedback handlers who in turn confirm
customer satisfaction by conducting actual callouts
to customers and document results of callouts
either for closure or non-closure.
What are the Risk/s Identified? Management Approach
In a highly competitive industry, Petron needs to
constantly be aware of how our brand measures up to
the expectations of our consumers, our shareholders,
and our stakeholders. There is a need to regularly
assess customer loyalty and satisfaction, measure
Petron’s brand health versus competition, and
understand the demands of the industry/market. With
the rise of social media platforms that allow access to
and sharing of information in real-time, there is a major
risk to the brand for inquiries, complaints and other
concerns that are not readily attended to.
On the corporate side, failure to appreciate the pulse
of the public impacts on:
Corporate reputation - Our public
image/perception and trustworthiness strongly
influences stakeholder (government, business
partners, potential investors, etc.) support and buy-in
for our plans and programs and is essential to
consumer preference. Reputation drives sales and
sustainability. Reputation accounts for about 65 %
of an average company’s market value and can
account for up to 95 % of market capital for
companies that are primarily brand driven.
Stakeholder Management - managing
expectations by our various publics through
sustained good relations with opinion-makers and
influencers.
Information Management – our ability to keep
abreast with pertinent developments (public
attitudes, sensitivities, expectations, concerns and
needs) related to Petron’s business and make
informed and strategic decisions accordingly CAD
is. It not only packages and sends out information
to appropriate parties, it also counsels upper
management on.
Crisis Management – our ability to help Petron
respond quickly and properly to crisis situations
by anticipating potential reputational hazards and
We value our customers. We commit to being an
integral part of their lives by consistently
delivering innovative products and services. This
commitment binds us to conducting
business with excellence, as underscored by our
own Corporate Quality Policy that states,
“We, at Petron, are guided by the basic philosophy of
quality in all our business undertakings while taking
responsible care of the environment and maintaining
our competitiveness. Achieving this, we believe, is the
true measure of corporate success.”
We are unceasing in our commitment to ensure
that all aspects of our operations practice the
highest standards of safety and responsibility, and
that the products and services we provide meet
not only most stringent quality mandate of both
local and international standards, but are also
shaped by the needs of our consumers.
We have our Corporate Affairs Department
(CAD) which maintains a favorable corporate
image and environment that allows Petron to
effectively pursue its vision and business objectives
through the effective use of communications,
management of issues, and nurturing of
relationships with stakeholders.
To ensure the continued protection of the
consumer rights of our customers, our Marketing
Division ensures that all our advertising campaigns
and communications programs subscribe to the
standards set by governing bodies such as the
Advertising Board of the Philippines Ad Standards
Council, and the Philippine Association of National
Advertisers. These groups harness the various
sectors of the industry to achieve professional
excellence through effective self-regulation; and
promulgate self-regulatory rules, standards, and
procedures of the advertising industry such as a
Code of Ethics. These bodies also establish,
72
recommending appropriate courses of action to
avert full-blown crises that will erode corporate
reputation.
Despite challenges on current limitations of the
system, we continue to do follow-ups until resolution
of complaints from resolving parties. In line with this,
we also evaluate handling and assessing of work
efficiencies from all parties involved in the resolution
process.
maintain, and implement programs aimed at
maximizing the growth potential of the advertising
industry and promote public responsibility among
advertising practitioners thereby protecting the
interest of the customers.
What are the Opportunity/ies Identified? Management Approach
• Results of our consumer market research initiatives
allow us to determine the strength of our brands
among our customers.
• Our social media sites (website, Facebook, Twitter,
and Instagram) managed by CAD provide platforms
for instant communication and engagement with our
customers and the public in general. This allows us
to immediately act on their concerns and inquiries
and gauge their preferences. These also give us
multiple venues to post announcements, promos,
and other relevant information about the Company,
our products and events.
Internal challenges will always be there but the group
see these as opportunities to further elevate the
overall customer experience. These include periodic
review of service level agreements (SLA) for more
efficient handling and resolution of complaints as well
as enhancing collaboration among resolving groups.
This is to map out activities should be there be extra
hours needed to be invested to handle the current
situation
Regularly, Petron conducts market research
studies that identify our strengths as well as areas
for improvement, engaging customers from all
economic and social backgrounds, from rural areas
to urban centers nationwide. Various mechanisms
are in place to assess customer satisfaction.
Internal and external customer feedback studies
profile the users of Petron products, specifically
their perception, usage, habits, and satisfaction
levels among others.
Results of these surveys are integrated into our
Marketing programs so that the Petron brand
remains top of mind.
From April to May 2021, Petron engaged 3rd party
group SCMI (Strategic Consumer and Media
Incites Inc.), an independent full-service market
research and professional consulting firm offering
Technology-based Media Monitoring, Qualitative
and Quantitative Market Research, Data Analysis,
and Marketing Consulting Services. Their 2021
Fuel UAI study aimed to measure the brand health
of Petron’s fuel brands vs. competition, assess
customer loyalty and satisfaction, and identify
critical factors to help Petron respond to
customer needs or wants. Results showed 93%
satisfaction among those who have tried Petron.
The company also implemented a Customer
Satisfaction program starting November 2021
through its Customer Relations Group (CRG).
This is an in-house (Petron initiated) initiative
which was piloted in 37 sites and will be expanded
to more Petron service stations in 2022. The
program allowed our customers to conveniently
scan via their smartphones QR Code that are
made available thru posters/signages located in
strategic locations within the service station
premises such as cashier’s booth, rest rooms,
shops and lube bays. In this way, they can easily fill
out the survey forms to share their Petron
experience at the said retail outlet. This forms
part of enhancing the current talk2us program by
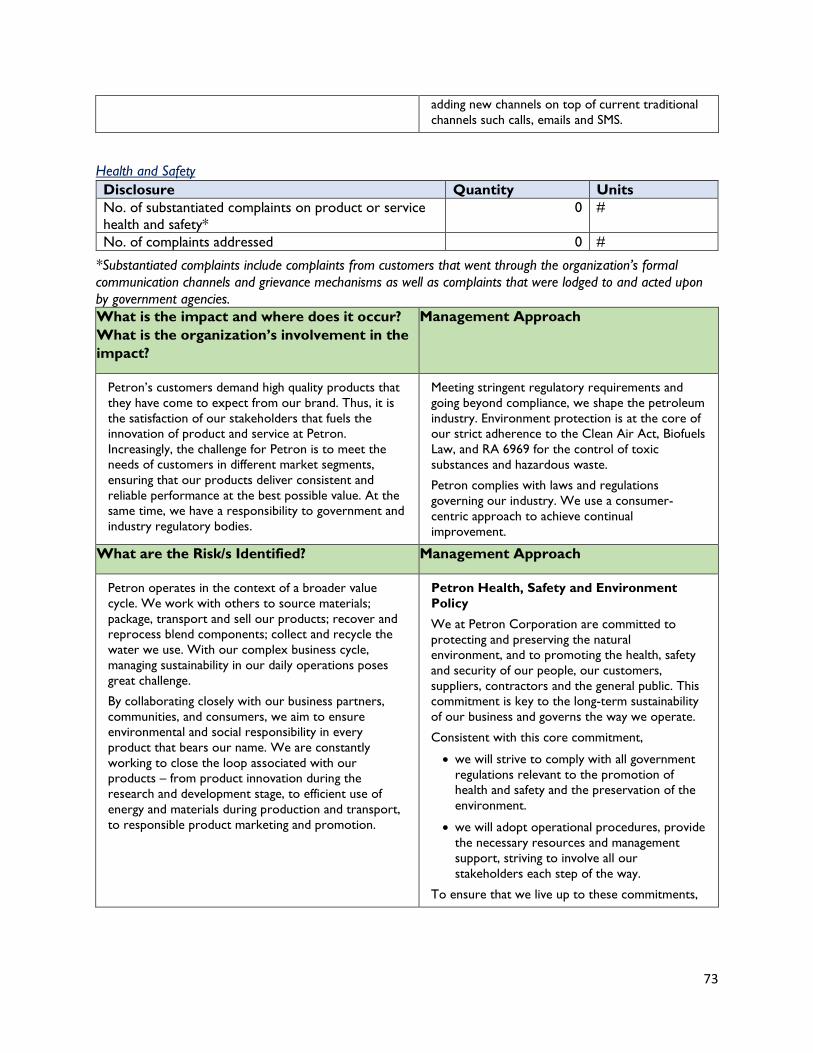
73
adding new channels on top of current traditional
channels such calls, emails and SMS.
Health and Safety
Disclosure Quantity Units
No. of substantiated complaints on product or service
health and safety*
0 #
No. of complaints addressed 0 #
*Substantiated complaints include complaints from customers that went through the organization’s formal
communication channels and grievance mechanisms as well as complaints that were lodged to and acted upon
by government agencies.
What is the impact and where does it occur?
What is the organization’s involvement in the
impact?
Management Approach
Petron’s customers demand high quality products that
they have come to expect from our brand. Thus, it is
the satisfaction of our stakeholders that fuels the
innovation of product and service at Petron.
Increasingly, the challenge for Petron is to meet the
needs of customers in different market segments,
ensuring that our products deliver consistent and
reliable performance at the best possible value. At the
same time, we have a responsibility to government and
industry regulatory bodies.
Meeting stringent regulatory requirements and
going beyond compliance, we shape the petroleum
industry. Environment protection is at the core of
our strict adherence to the Clean Air Act, Biofuels
Law, and RA 6969 for the control of toxic
substances and hazardous waste.
Petron complies with laws and regulations
governing our industry. We use a consumer-
centric approach to achieve continual
improvement.
What are the Risk/s Identified? Management Approach
Petron operates in the context of a broader value
cycle. We work with others to source materials;
package, transport and sell our products; recover and
reprocess blend components; collect and recycle the
water we use. With our complex business cycle,
managing sustainability in our daily operations poses
great challenge.
By collaborating closely with our business partners,
communities, and consumers, we aim to ensure
environmental and social responsibility in every
product that bears our name. We are constantly
working to close the loop associated with our
products – from product innovation during the
research and development stage, to efficient use of
energy and materials during production and transport,
to responsible product marketing and promotion.
Petron Health, Safety and Environment
Policy
We at Petron Corporation are committed to
protecting and preserving the natural
environment, and to promoting the health, safety
and security of our people, our customers,
suppliers, contractors and the general public. This
commitment is key to the long-term sustainability
of our business and governs the way we operate.
Consistent with this core commitment,
• we will strive to comply with all government
regulations relevant to the promotion of
health and safety and the preservation of the
environment.
• we will adopt operational procedures, provide
the necessary resources and management
support, striving to involve all our
stakeholders each step of the way.
To ensure that we live up to these commitments,
74
• we will follow stringent goals and targets
against which we will measure our
performance.
• we will implement and develop strategies that
will allow and encourage us to improve the
ways we conduct our business.
Petron’s Sustainability Priorities
Health and Safety We commit to fully abiding by
laws and regulations that ensure the health and
safety of personnel, contractors, and surrounding
communities, with the ultimate aim of going
beyond compliance.
What are the Opportunity/ies Identified? Management Approach
We make sure that throughout all the stages of the life
cycle of our products—from introduction to growth
and maturity to “decline”— the health and safety
impacts on users and consumers, as well as the
environment are considered. During its maturity stage
for instance, fuel products are subjected to
reformulations and enhancements necessary to ensure
that they comply with the latest local and international
standards. The decline of a product, when it is no
longer marketable, is considered an opportunity for
innovation. Product development at this stage is driven
by updates in the market as well as changes in fuels
technology.
Providing for venues to feedback on health and safety
concerns of our business on the other hand gives us
the opportunity to properly and promptly address
issues that we may have been remiss in or have not
thoroughly considered. As we aspire for continual
improvement, we welcome feedback from our
stakeholders on how we can make our services better
and safer to provide the full Petron experience.
Again, the rise of social media platforms that allow
access to and sharing of information in real-time causes
a major risk to the Petron brand for inquiries,
complaints and other concerns that are not readily
attended to.
On the corporate side, failure to receive and act on
safety and health concerns by the public regarding our
operations, products and/or services impact on our
ability to:
maintain a favorable corporate image and
environment that allows Petron to effectively
pursue its corporate vision and business
objectives.
manage the expectations by our various publics.
Petron Health, Safety and Environment
Policy
We at Petron Corporation are committed to
protecting and preserving the natural
environment, and to promoting the health, safety
and security of our people, our customers,
suppliers, contractors and the general public. This
commitment is key to the long-term sustainability
of our business and governs the way we operate.
Consistent with this core commitment,
• we will strive to comply with all government
regulations relevant to the promotion of
health and safety and the preservation of the
environment.
• we will adopt operational procedures, provide
the necessary resources and management
support, striving to involve all our
stakeholders each step of the way.
To ensure that we live up to these commitments,
• we will follow stringent goals and targets
against which we will measure our
performance.
• we will implement and develop strategies that
will allow and encourage us to improve the
ways we conduct our business.
Petron’s Sustainability Priorities
Health and Safety We commit to fully abiding by
laws and regulations that ensure the health and
safety of personnel, contractors, and surrounding
communities, with the ultimate aim of going
beyond compliance.
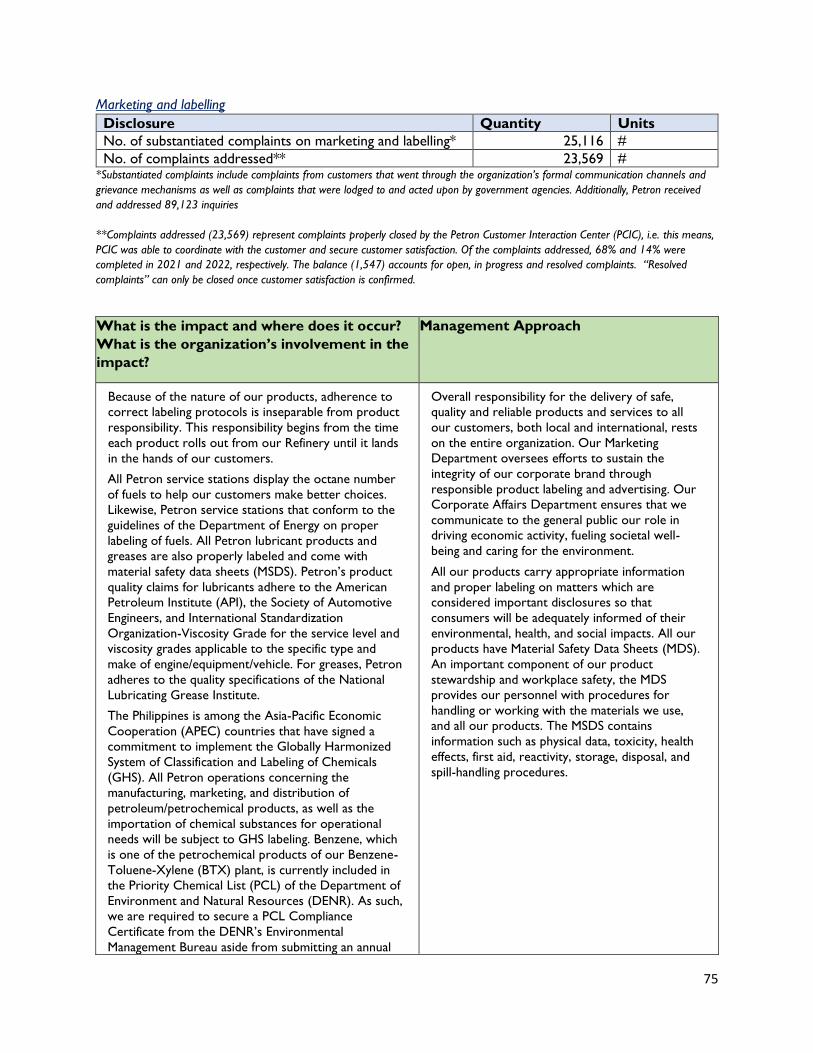
75
Marketing and labelling
Disclosure Quantity Units
No. of substantiated complaints on marketing and labelling* 25,116 #
No. of complaints addressed** 23,569 # *Substantiated complaints include complaints from customers that went through the organization’s formal communication channels and
grievance mechanisms as well as complaints that were lodged to and acted upon by government agencies. Additionally, Petron received
and addressed 89,123 inquiries
**Complaints addressed (23,569) represent complaints properly closed by the Petron Customer Interaction Center (PCIC), i.e. this means,
PCIC was able to coordinate with the customer and secure customer satisfaction. Of the complaints addressed, 68% and 14% were
completed in 2021 and 2022, respectively. The balance (1,547) accounts for open, in progress and resolved complaints. “Resolved
complaints” can only be closed once customer satisfaction is confirmed.
What is the impact and where does it occur?
What is the organization’s involvement in the
impact?
Management Approach
Because of the nature of our products, adherence to
correct labeling protocols is inseparable from product
responsibility. This responsibility begins from the time
each product rolls out from our Refinery until it lands
in the hands of our customers.
All Petron service stations display the octane number
of fuels to help our customers make better choices.
Likewise, Petron service stations that conform to the
guidelines of the Department of Energy on proper
labeling of fuels. All Petron lubricant products and
greases are also properly labeled and come with
material safety data sheets (MSDS). Petron’s product
quality claims for lubricants adhere to the American
Petroleum Institute (API), the Society of Automotive
Engineers, and International Standardization
Organization-Viscosity Grade for the service level and
viscosity grades applicable to the specific type and
make of engine/equipment/vehicle. For greases, Petron
adheres to the quality specifications of the National
Lubricating Grease Institute.
The Philippines is among the Asia-Pacific Economic
Cooperation (APEC) countries that have signed a
commitment to implement the Globally Harmonized
System of Classification and Labeling of Chemicals
(GHS). All Petron operations concerning the
manufacturing, marketing, and distribution of
petroleum/petrochemical products, as well as the
importation of chemical substances for operational
needs will be subject to GHS labeling. Benzene, which
is one of the petrochemical products of our Benzene-
Toluene-Xylene (BTX) plant, is currently included in
the Priority Chemical List (PCL) of the Department of
Environment and Natural Resources (DENR). As such,
we are required to secure a PCL Compliance
Certificate from the DENR’s Environmental
Management Bureau aside from submitting an annual
Overall responsibility for the delivery of safe,
quality and reliable products and services to all
our customers, both local and international, rests
on the entire organization. Our Marketing
Department oversees efforts to sustain the
integrity of our corporate brand through
responsible product labeling and advertising. Our
Corporate Affairs Department ensures that we
communicate to the general public our role in
driving economic activity, fueling societal well-
being and caring for the environment.
All our products carry appropriate information
and proper labeling on matters which are
considered important disclosures so that
consumers will be adequately informed of their
environmental, health, and social impacts. All our
products have Material Safety Data Sheets (MDS).
An important component of our product
stewardship and workplace safety, the MDS
provides our personnel with procedures for
handling or working with the materials we use,
and all our products. The MSDS contains
information such as physical data, toxicity, health
effects, first aid, reactivity, storage, disposal, and
spill-handling procedures.
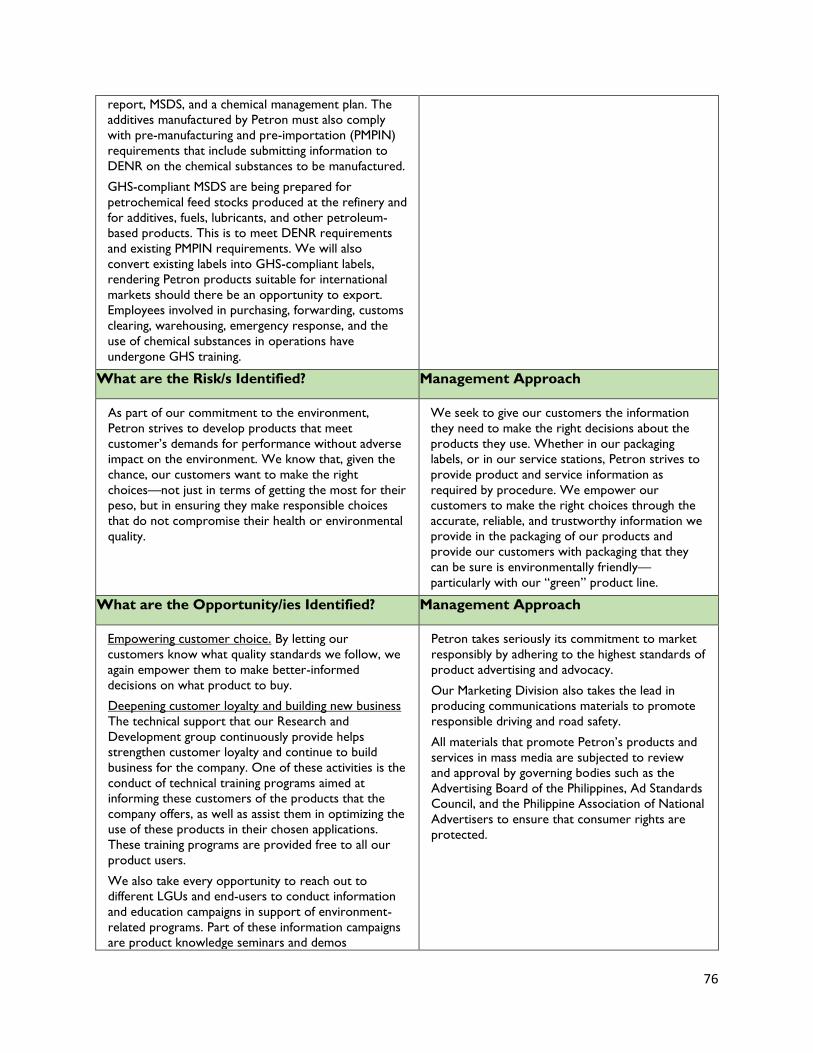
76
report, MSDS, and a chemical management plan. The
additives manufactured by Petron must also comply
with pre-manufacturing and pre-importation (PMPIN)
requirements that include submitting information to
DENR on the chemical substances to be manufactured.
GHS-compliant MSDS are being prepared for
petrochemical feed stocks produced at the refinery and
for additives, fuels, lubricants, and other petroleum-
based products. This is to meet DENR requirements
and existing PMPIN requirements. We will also
convert existing labels into GHS-compliant labels,
rendering Petron products suitable for international
markets should there be an opportunity to export.
Employees involved in purchasing, forwarding, customs
clearing, warehousing, emergency response, and the
use of chemical substances in operations have
undergone GHS training.
What are the Risk/s Identified? Management Approach
As part of our commitment to the environment,
Petron strives to develop products that meet
customer’s demands for performance without adverse
impact on the environment. We know that, given the
chance, our customers want to make the right
choices—not just in terms of getting the most for their
peso, but in ensuring they make responsible choices
that do not compromise their health or environmental
quality.
We seek to give our customers the information
they need to make the right decisions about the
products they use. Whether in our packaging
labels, or in our service stations, Petron strives to
provide product and service information as
required by procedure. We empower our
customers to make the right choices through the
accurate, reliable, and trustworthy information we
provide in the packaging of our products and
provide our customers with packaging that they
can be sure is environmentally friendly—
particularly with our “green” product line.
What are the Opportunity/ies Identified? Management Approach
Empowering customer choice. By letting our
customers know what quality standards we follow, we
again empower them to make better-informed
decisions on what product to buy.
Deepening customer loyalty and building new business
The technical support that our Research and
Development group continuously provide helps
strengthen customer loyalty and continue to build
business for the company. One of these activities is the
conduct of technical training programs aimed at
informing these customers of the products that the
company offers, as well as assist them in optimizing the
use of these products in their chosen applications.
These training programs are provided free to all our
product users.
We also take every opportunity to reach out to
different LGUs and end-users to conduct information
and education campaigns in support of environment-
related programs. Part of these information campaigns
are product knowledge seminars and demos
Petron takes seriously its commitment to market
responsibly by adhering to the highest standards of
product advertising and advocacy.
Our Marketing Division also takes the lead in
producing communications materials to promote
responsible driving and road safety.
All materials that promote Petron’s products and
services in mass media are subjected to review
and approval by governing bodies such as the
Advertising Board of the Philippines, Ad Standards
Council, and the Philippine Association of National
Advertisers to ensure that consumer rights are
protected.
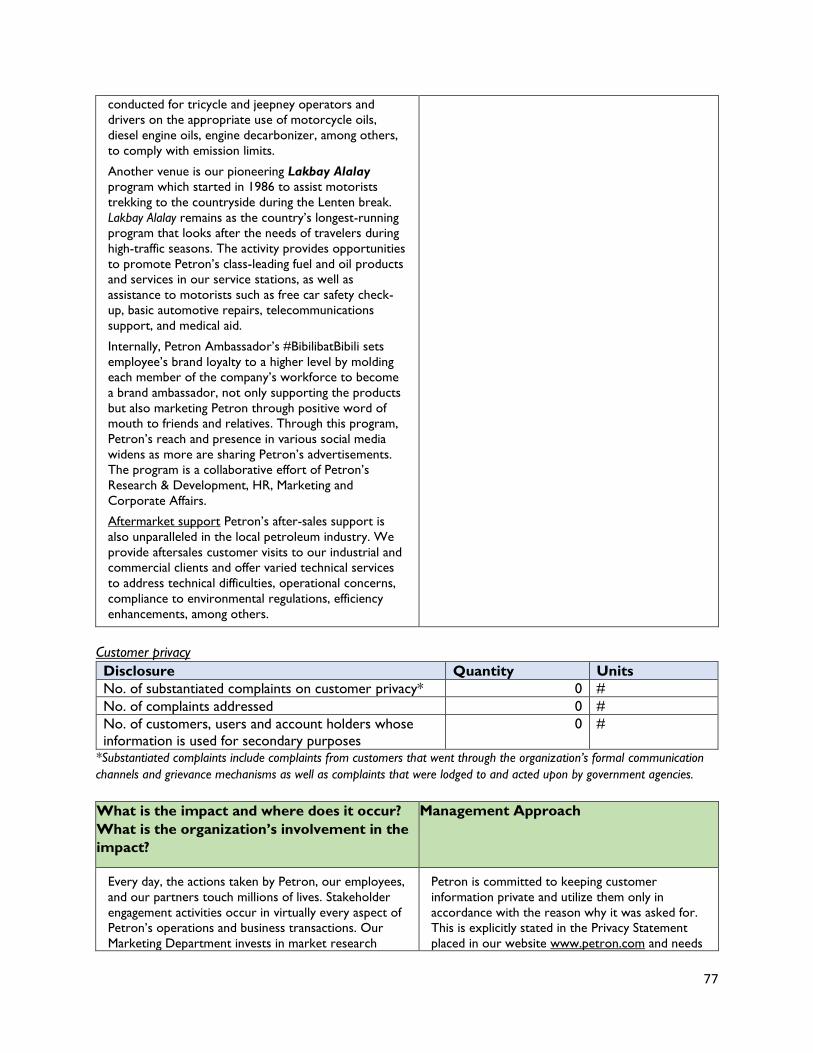
77
conducted for tricycle and jeepney operators and
drivers on the appropriate use of motorcycle oils,
diesel engine oils, engine decarbonizer, among others,
to comply with emission limits.
Another venue is our pioneering Lakbay Alalay
program which started in 1986 to assist motorists
trekking to the countryside during the Lenten break.
Lakbay Alalay remains as the country’s longest-running
program that looks after the needs of travelers during
high-traffic seasons. The activity provides opportunities
to promote Petron’s class-leading fuel and oil products
and services in our service stations, as well as
assistance to motorists such as free car safety check-
up, basic automotive repairs, telecommunications
support, and medical aid.
Internally, Petron Ambassador’s #BibilibatBibili sets
employee’s brand loyalty to a higher level by molding
each member of the company’s workforce to become
a brand ambassador, not only supporting the products
but also marketing Petron through positive word of
mouth to friends and relatives. Through this program,
Petron’s reach and presence in various social media
widens as more are sharing Petron’s advertisements.
The program is a collaborative effort of Petron’s
Research & Development, HR, Marketing and
Corporate Affairs.
Aftermarket support Petron’s after-sales support is
also unparalleled in the local petroleum industry. We
provide aftersales customer visits to our industrial and
commercial clients and offer varied technical services
to address technical difficulties, operational concerns,
compliance to environmental regulations, efficiency
enhancements, among others.
Customer privacy
Disclosure Quantity Units
No. of substantiated complaints on customer privacy* 0 #
No. of complaints addressed 0 #
No. of customers, users and account holders whose
information is used for secondary purposes
0 #
*Substantiated complaints include complaints from customers that went through the organization’s formal communication
channels and grievance mechanisms as well as complaints that were lodged to and acted upon by government agencies.
What is the impact and where does it occur?
What is the organization’s involvement in the
impact?
Management Approach
Every day, the actions taken by Petron, our employees,
and our partners touch millions of lives. Stakeholder
engagement activities occur in virtually every aspect of
Petron’s operations and business transactions. Our
Marketing Department invests in market research
Petron is committed to keeping customer
information private and utilize them only in
accordance with the reason why it was asked for.
This is explicitly stated in the Privacy Statement
placed in our website www.petron.com and needs
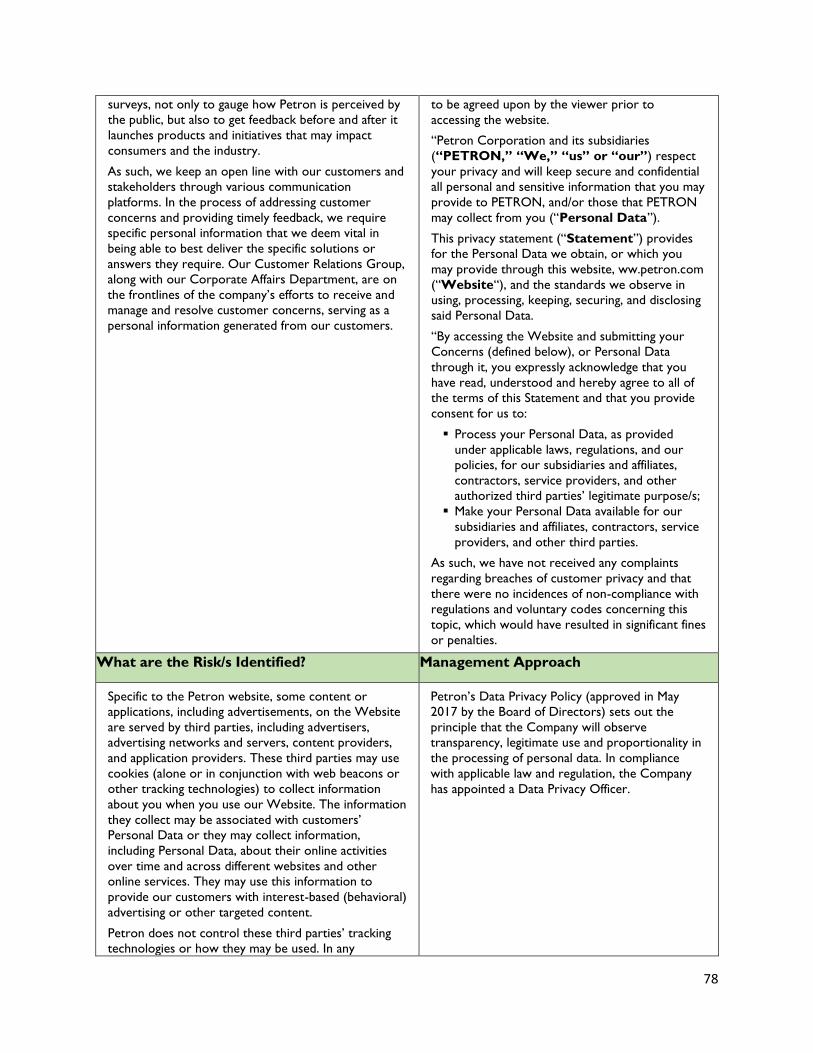
78
surveys, not only to gauge how Petron is perceived by
the public, but also to get feedback before and after it
launches products and initiatives that may impact
consumers and the industry.
As such, we keep an open line with our customers and
stakeholders through various communication
platforms. In the process of addressing customer
concerns and providing timely feedback, we require
specific personal information that we deem vital in
being able to best deliver the specific solutions or
answers they require. Our Customer Relations Group,
along with our Corporate Affairs Department, are on
the frontlines of the company’s efforts to receive and
manage and resolve customer concerns, serving as a
personal information generated from our customers.
to be agreed upon by the viewer prior to
accessing the website.
“Petron Corporation and its subsidiaries
(“PETRON,” “We,” “us” or “our”) respect
your privacy and will keep secure and confidential
all personal and sensitive information that you may
provide to PETRON, and/or those that PETRON
may collect from you (“Personal Data”).
This privacy statement (“Statement”) provides
for the Personal Data we obtain, or which you
may provide through this website, ww.petron.com
(“Website“), and the standards we observe in
using, processing, keeping, securing, and disclosing
said Personal Data.
“By accessing the Website and submitting your
Concerns (defined below), or Personal Data
through it, you expressly acknowledge that you
have read, understood and hereby agree to all of
the terms of this Statement and that you provide
consent for us to:
Process your Personal Data, as provided
under applicable laws, regulations, and our
policies, for our subsidiaries and affiliates,
contractors, service providers, and other
authorized third parties’ legitimate purpose/s;
Make your Personal Data available for our
subsidiaries and affiliates, contractors, service
providers, and other third parties.
As such, we have not received any complaints
regarding breaches of customer privacy and that
there were no incidences of non-compliance with
regulations and voluntary codes concerning this
topic, which would have resulted in significant fines
or penalties.
What are the Risk/s Identified? Management Approach
Specific to the Petron website, some content or
applications, including advertisements, on the Website
are served by third parties, including advertisers,
advertising networks and servers, content providers,
and application providers. These third parties may use
cookies (alone or in conjunction with web beacons or
other tracking technologies) to collect information
about you when you use our Website. The information
they collect may be associated with customers’
Personal Data or they may collect information,
including Personal Data, about their online activities
over time and across different websites and other
online services. They may use this information to
provide our customers with interest-based (behavioral)
advertising or other targeted content.
Petron does not control these third parties’ tracking
technologies or how they may be used. In any
Petron’s Data Privacy Policy (approved in May
2017 by the Board of Directors) sets out the
principle that the Company will observe
transparency, legitimate use and proportionality in
the processing of personal data. In compliance
with applicable law and regulation, the Company
has appointed a Data Privacy Officer.
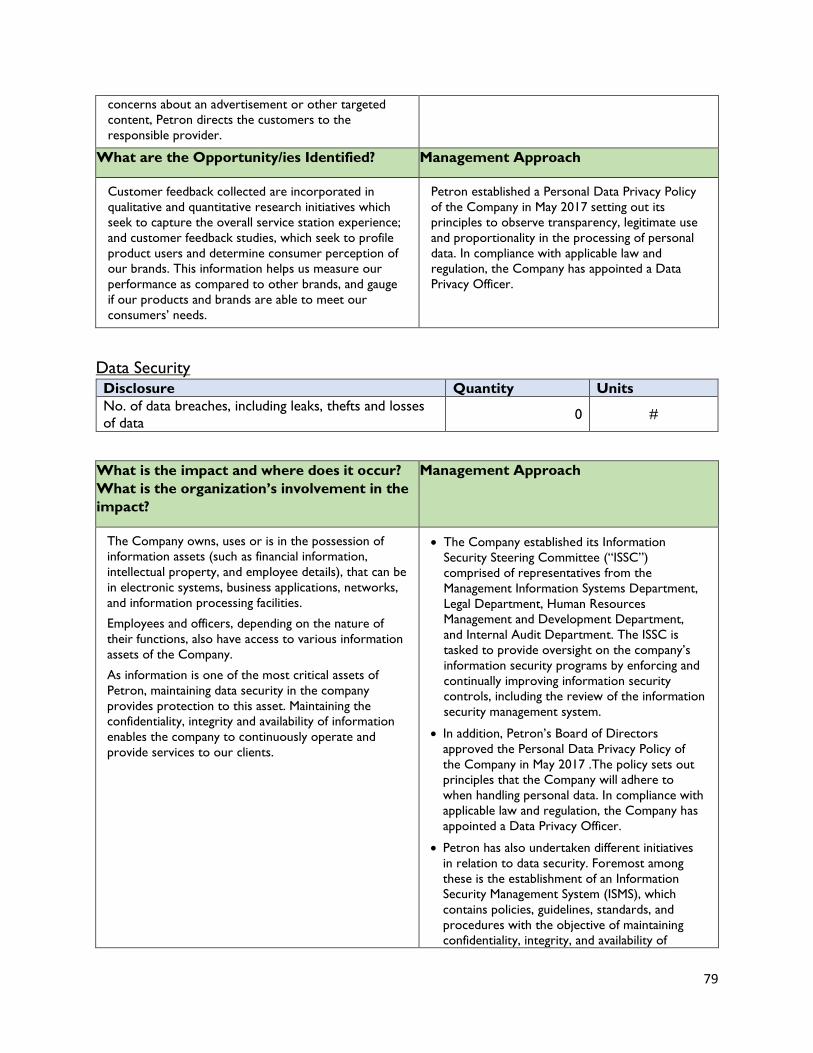
79
concerns about an advertisement or other targeted
content, Petron directs the customers to the
responsible provider.
What are the Opportunity/ies Identified? Management Approach
Customer feedback collected are incorporated in
qualitative and quantitative research initiatives which
seek to capture the overall service station experience;
and customer feedback studies, which seek to profile
product users and determine consumer perception of
our brands. This information helps us measure our
performance as compared to other brands, and gauge
if our products and brands are able to meet our
consumers’ needs.
Petron established a Personal Data Privacy Policy
of the Company in May 2017 setting out its
principles to observe transparency, legitimate use
and proportionality in the processing of personal
data. In compliance with applicable law and
regulation, the Company has appointed a Data
Privacy Officer.
Data Security Disclosure Quantity Units
No. of data breaches, including leaks, thefts and losses
of data 0 #
What is the impact and where does it occur?
What is the organization’s involvement in the
impact?
Management Approach
The Company owns, uses or is in the possession of
information assets (such as financial information,
intellectual property, and employee details), that can be
in electronic systems, business applications, networks,
and information processing facilities.
Employees and officers, depending on the nature of
their functions, also have access to various information
assets of the Company.
As information is one of the most critical assets of
Petron, maintaining data security in the company
provides protection to this asset. Maintaining the
confidentiality, integrity and availability of information
enables the company to continuously operate and
provide services to our clients.
• The Company established its Information
Security Steering Committee (“ISSC”)
comprised of representatives from the
Management Information Systems Department,
Legal Department, Human Resources
Management and Development Department,
and Internal Audit Department. The ISSC is
tasked to provide oversight on the company’s
information security programs by enforcing and
continually improving information security
controls, including the review of the information
security management system.
• In addition, Petron’s Board of Directors
approved the Personal Data Privacy Policy of
the Company in May 2017 .The policy sets out
principles that the Company will adhere to
when handling personal data. In compliance with
applicable law and regulation, the Company has
appointed a Data Privacy Officer.
• Petron has also undertaken different initiatives
in relation to data security. Foremost among
these is the establishment of an Information
Security Management System (ISMS), which
contains policies, guidelines, standards, and
procedures with the objective of maintaining
confidentiality, integrity, and availability of
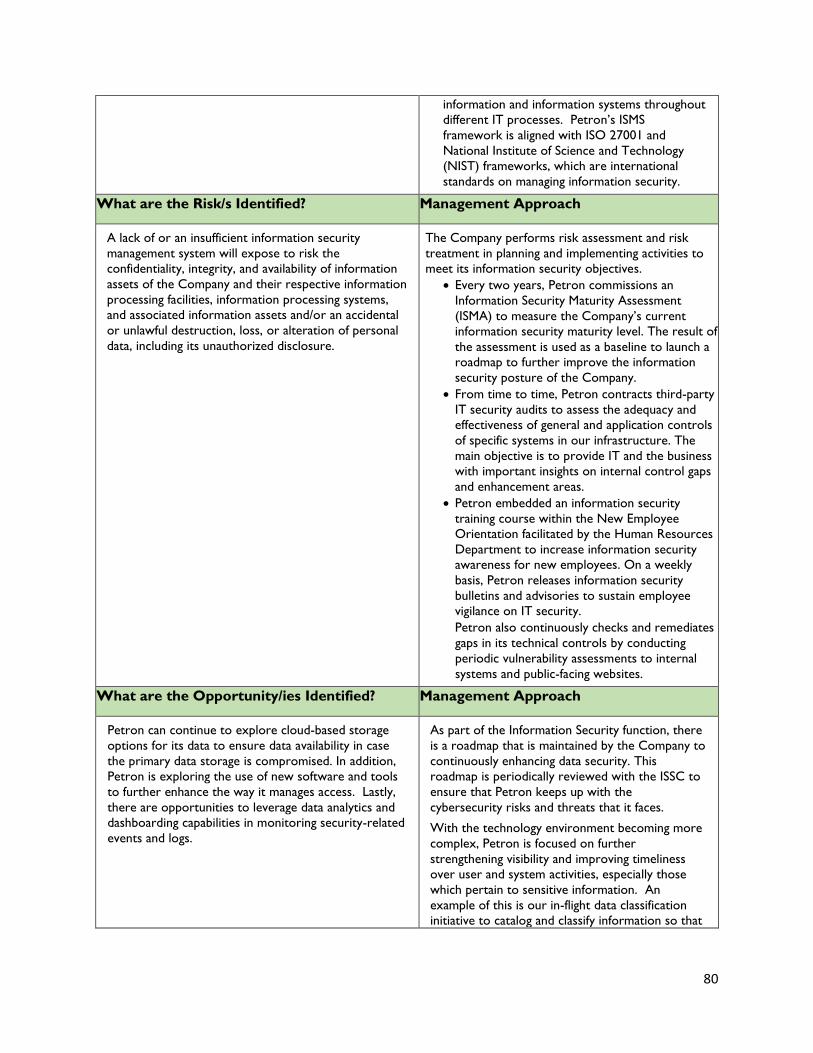
80
information and information systems throughout
different IT processes. Petron’s ISMS
framework is aligned with ISO 27001 and
National Institute of Science and Technology
(NIST) frameworks, which are international
standards on managing information security.
What are the Risk/s Identified? Management Approach
A lack of or an insufficient information security
management system will expose to risk the
confidentiality, integrity, and availability of information
assets of the Company and their respective information
processing facilities, information processing systems,
and associated information assets and/or an accidental
or unlawful destruction, loss, or alteration of personal
data, including its unauthorized disclosure.
The Company performs risk assessment and risk
treatment in planning and implementing activities to
meet its information security objectives.
• Every two years, Petron commissions an
Information Security Maturity Assessment
(ISMA) to measure the Company’s current
information security maturity level. The result of
the assessment is used as a baseline to launch a
roadmap to further improve the information
security posture of the Company.
• From time to time, Petron contracts third-party
IT security audits to assess the adequacy and
effectiveness of general and application controls
of specific systems in our infrastructure. The
main objective is to provide IT and the business
with important insights on internal control gaps
and enhancement areas.
• Petron embedded an information security
training course within the New Employee
Orientation facilitated by the Human Resources
Department to increase information security
awareness for new employees. On a weekly
basis, Petron releases information security
bulletins and advisories to sustain employee
vigilance on IT security.
• Petron also continuously checks and remediates
gaps in its technical controls by conducting
periodic vulnerability assessments to internal
systems and public-facing websites.
What are the Opportunity/ies Identified? Management Approach
Petron can continue to explore cloud-based storage
options for its data to ensure data availability in case
the primary data storage is compromised. In addition,
Petron is exploring the use of new software and tools
to further enhance the way it manages access. Lastly,
there are opportunities to leverage data analytics and
dashboarding capabilities in monitoring security-related
events and logs.
As part of the Information Security function, there
is a roadmap that is maintained by the Company to
continuously enhancing data security. This
roadmap is periodically reviewed with the ISSC to
ensure that Petron keeps up with the
cybersecurity risks and threats that it faces.
With the technology environment becoming more
complex, Petron is focused on further
strengthening visibility and improving timeliness
over user and system activities, especially those
which pertain to sensitive information. An
example of this is our in-flight data classification
initiative to catalog and classify information so that
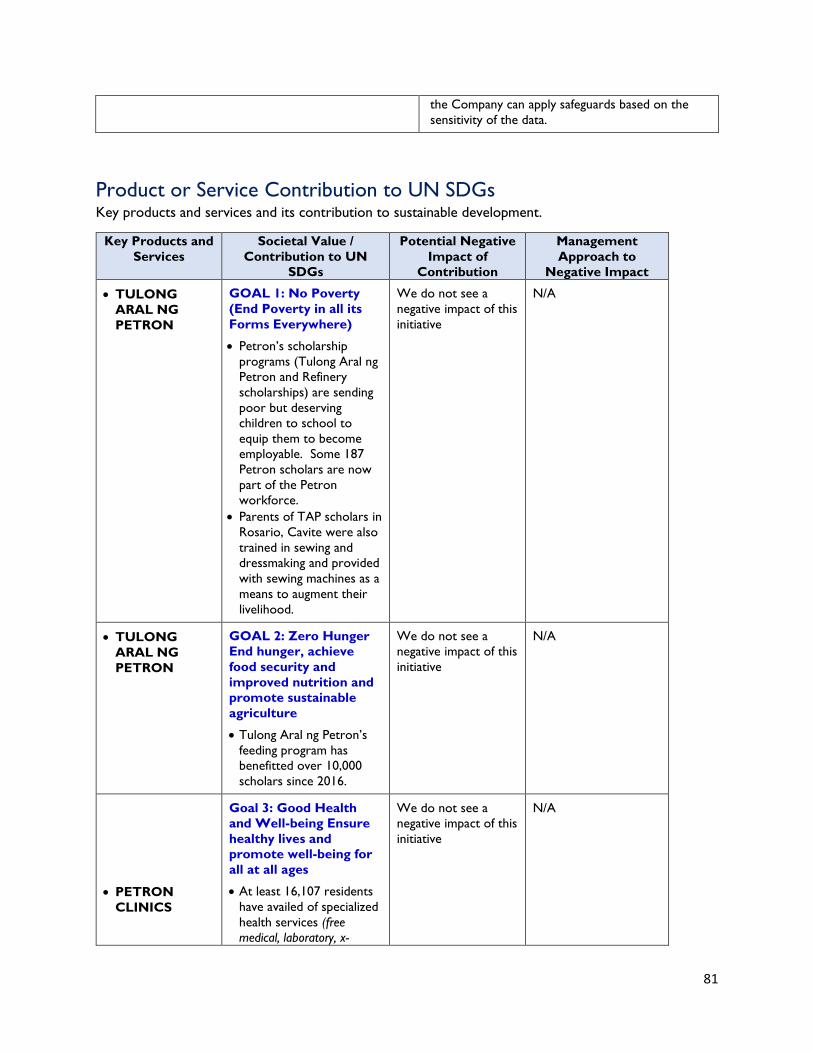
81
the Company can apply safeguards based on the
sensitivity of the data.
UN SUSTAINABLE DEVELOPMENT GOALS
Product or Service Contribution to UN SDGs Key products and services and its contribution to sustainable development.
Key Products and
Services
Societal Value /
Contribution to UN
SDGs
Potential Negative
Impact of
Contribution
Management
Approach to
Negative Impact
• TULONG
ARAL NG
PETRON
GOAL 1: No Poverty
(End Poverty in all its
Forms Everywhere)
• Petron’s scholarship
programs (Tulong Aral ng
Petron and Refinery
scholarships) are sending
poor but deserving
children to school to
equip them to become
employable. Some 187
Petron scholars are now
part of the Petron
workforce.
• Parents of TAP scholars in
Rosario, Cavite were also
trained in sewing and
dressmaking and provided
with sewing machines as a
means to augment their
livelihood.
We do not see a
negative impact of this
initiative
N/A
• TULONG
ARAL NG
PETRON
GOAL 2: Zero Hunger
End hunger, achieve
food security and
improved nutrition and
promote sustainable
agriculture
• Tulong Aral ng Petron’s
feeding program has
benefitted over 10,000
scholars since 2016.
We do not see a
negative impact of this
initiative
N/A
• PETRON
CLINICS
Goal 3: Good Health
and Well-being Ensure
healthy lives and
promote well-being for
all at all ages
• At least 16,107 residents
have availed of specialized
health services (free
medical, laboratory, x-
We do not see a
negative impact of this
initiative
N/A
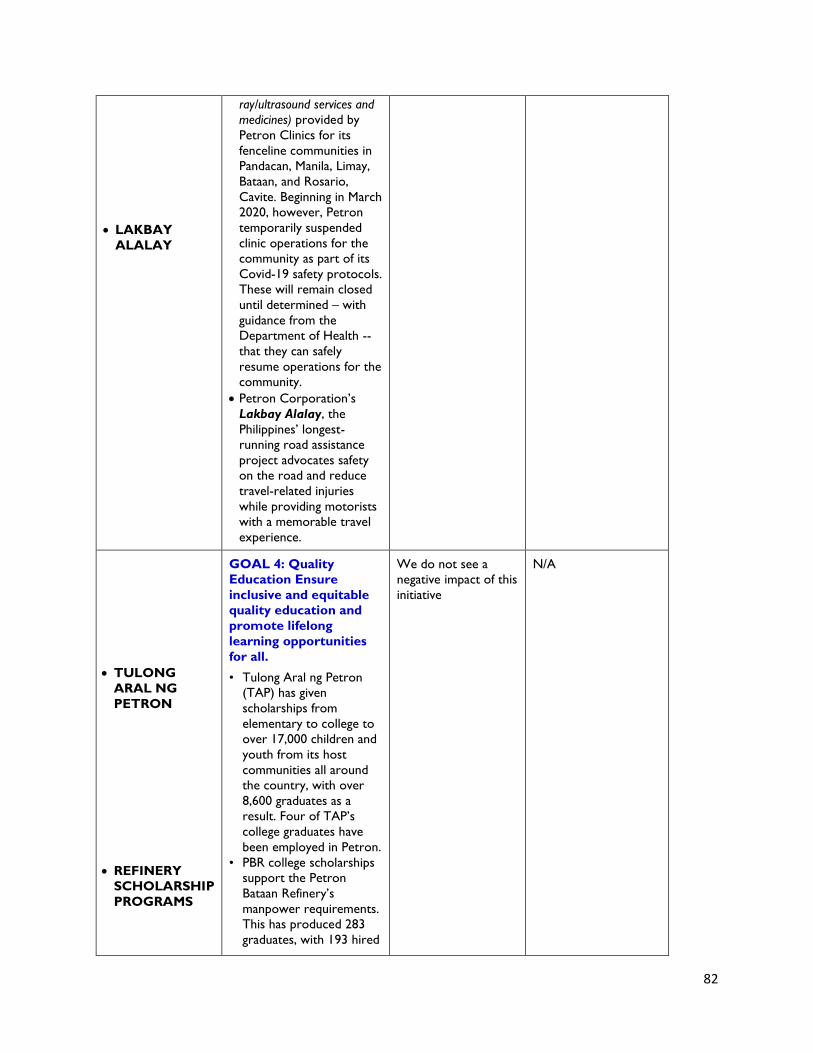
82
• LAKBAY
ALALAY
ray/ultrasound services and
medicines) provided by
Petron Clinics for its
fenceline communities in
Pandacan, Manila, Limay,
Bataan, and Rosario,
Cavite. Beginning in March
2020, however, Petron
temporarily suspended
clinic operations for the
community as part of its
Covid-19 safety protocols.
These will remain closed
until determined – with
guidance from the
Department of Health --
that they can safely
resume operations for the
community.
• Petron Corporation’s
Lakbay Alalay, the
Philippines’ longest-
running road assistance
project advocates safety
on the road and reduce
travel-related injuries
while providing motorists
with a memorable travel
experience.
• TULONG
ARAL NG
PETRON
• REFINERY
SCHOLARSHIP
PROGRAMS
GOAL 4: Quality
Education Ensure
inclusive and equitable
quality education and
promote lifelong
learning opportunities
for all.
• Tulong Aral ng Petron
(TAP) has given
scholarships from
elementary to college to
over 17,000 children and
youth from its host
communities all around
the country, with over
8,600 graduates as a
result. Four of TAP’s
college graduates have
been employed in Petron.
• PBR college scholarships
support the Petron
Bataan Refinery’s
manpower requirements.
This has produced 283
graduates, with 193 hired
We do not see a
negative impact of this
initiative
N/A
83
• PETRON
SCHOOL
• BRIGADA
ESKWELA
in various positions at the
Refinery. Of this number,
86 continue to be
employed in Petron.
• Since 2002, a total of 108
Petron Schools equivalent
to 258 classrooms have
been built.
• Volunteer employees and
stakeholders from Petron
facilities nationwide have
repaired/ refurbished at
least 1,600 classrooms
since 2007 to benefit
over 100,000 students as
part of DepEd’s Brigada
Eskwela National Schools
Maintenance Week.
• Project CODy
at the Petron
Refinery in
Limay, Bataan
GOAL 6: Clean Water
and Sanitation
• This is a water footprint
initiative for water
reduction and reuse while
minimizing wastewater
treatment expenses.
We do not see a
negative impact of this
initiative
N/A
• Support to San
Miguel
Corporation’s
“Water For All
Program”
GOAL 6: Clean Water
and Sanitation
• Petron aligns its
program on water use
with San Miguel
Corporation’s “Water
For All Program” that
aims to reduce scarce
water consumption.
• In 2021, Petron attained
13.78% reduction in
scarce water
consumption versus
2016 baseline data. This
is 24.8% higher than the
reduction achieved in
2020. A total of
15,294,473.54 m3 of
scarce water was saved
from its water
conservation programs
since 2016. The volume
saved is equivalent to
monthly consumption of
509,816 households.
• Petron has further
intensified its program on
We do not see a
negative impact of this
initiative
N/A
84
rainwater harvesting. It
was able to collect and
utilize 13,260 m3 of
rainwater in 2021, 82.8%
higher than the volume
reported in 2020.
• Petron’s 140-
MW Refinery
Solid Fuel-Fired
Boiler (RSFFB)
in Limay,
Bataan
GOAL 7: Affordable and
Clean Energy
• allows the grid to
maximize its supply of
power to the energy
requirements of the
region. It also produces
surplus energy –
approximately 10 MW –
to contribute to the grid.
• RSFFB is one of the first
in the Philippines to use
clean coal technology
such as the Circulating
Fluidized Bed, which
reduces emissions by
roughly 95% compared to
normal coal plants.
Continued reliance on
coal as energy source
Petron’s health,
safety, and
environment policy
commits to protect
and preserve the
natural environment,
and to promoting
the health, safety,
and security of our
people, customers,
contractors, and the
general public.
Petron has invested
in the use of the
more efficient
Circulating Fluidized
Bed Technology for
its power and steam
generation that has
contributed in the
reduction of air
pollutant emissions.
GOAL 9: Industry,
Innovation and
Infrastructure
• Generates electrical and
steam energy sufficient to
sustain the full operations
of the Petron Bataan
Refinery without taking
from the Luzon grid,
allowing the grid to
maximize its supply of
power to the energy
requirements of the
Philippines’ Central Luzon
Region.
• Also produces surplus
energy (approximately 10
MW) to contribute to the
grid.
• The RSFFB also utilizes
petroleum coke, a by-
product of RMP-2, as
feedstock for the power
plant. Equally important,
Continued reliance on
coal as energy source
Petron’s health,
safety, and
environment policy
commits to protect
and preserve the
natural environment,
and to promoting
the health, safety,
and security of our
people, customers,
contractors, and the
general public.
The company has
invested in the use
of the more efficient
Circulating Fluidized
Bed Technology for
its power and steam
generation that has
contributed in the
reduction of air
pollutant emissions.
85
the power plant is one of
the first in the Philippines
to use clean coal
technology such as the
Circulating Fluidized Bed,
which reduces emissions
by roughly 95% versus
normal coal plants.
Petron Refinery
Master Plan 2
(RMP-2) in
Limay, Bataan
GOAL 9: Industry,
Innovation and
Infrastructure
• RMP 2’s increased
production capabilities
improves the country’s
supply security and lessen
our dependence on
higher-costing fuel
products. It also increases
our capacity to produce
more stringent and
environment-friendly fuels
to help improve the
country’s air quality.
Increase in water and
air emission and
waste generation
Implementation of
waste prevention,
minimization,
recycling/reuse
programs, where
possible, and waste
treatment technologies
from design stage until
operational stage, as
well as continuous
monitoring of
environmental
indicators (Materials,
Energy, Water,
Emissions, Transport,
Biodiversity, Products
& Services, and
Compliance).
Petron
Environment
Summit 2021
GOAL 13: Climate
Action
Organized and conducted
the FIRST
ENVIRONMENT
SUMMIT of Petron
Corporation. The online
summit was conducted to
coincide with four key
environmental celebrations
observed in November
(Clean Air Month, National
Climate Change
Consciousness Week,
Environmental Awareness
Month, and National Day
for Youth in Climate
Action).
The summit had 250
participants from select San
Miguel Corporation (SMC)
and Petron management
executives, managing head
and pollution control
officers from PBR and
terminals, and employees
from other units.
We do not see a
negative impact of this
initiative
N/A
86
Major resource persons
included Department of
Science and Technology
Undersecretary and
Philippine Institute of
Vulcanology and Seismology
(Phivolcs) Director Renato
Solidum, which highlighted
the potential physical
impacts of climate change
and how to prepare and
mitigate its impacts as well
as Department of
Environment and Natural
Resources-Environmental
Management Bureau
(DENR-EMB) Assistant
Director Vizminda Osorio
who discussed updates on
thrust and directions of
EMB on implementation of
environment regulations.
The whole day session also
discussed best practices on
environmental management
implemented by Petron
Malaysia, Petron Bataan
Refinery, Operations,
REND, and Industrial Trade,
together with those of San
Miguel Corporation, with
focus on its WATER FOR
ALL program.
Petron Terminal
EcoWatch
program
GOAL 13: Climate
Action
• Builds on and greatly
enhances the Industrial
EcoWatch Rating System
or IERS, an initiative
under DENR
Administrative Order
2003-36.
• Promotes self-regulation
among industries for
improved environmental
compliance and
performance through a
rating system.
• Petron’s Terminal
EcoWatch assesses
environmental
performances in terms of
maturity of environmental
We do not see a
negative impact of this
initiative
N/A
87
management, providing
higher score for
environmental programs
that lead to improved key
indicators, and even more
points for continual
improvement.
• In Year 8 of
implementation (2021).
The Petron Ecowatch
program has matured and
has achieved 84.6%
increase in environmental
management and
compliance rating among
all Petron terminals
nationwide vs. 2014
baseline rating.
Project Legacy GOAL 13: Climate
Action
Through Petron’s
Corporate and Technical
Services Group (CTSG)-
Environment, the company
developed the Manual on
Philippine Environmental
Regulations, a handy but
substantial reference for
environment laws and
policies critical to the oil
industry. Intended as a
legacy project, this Manual
contains six modules that
compiled relevant
regulatory requirements
and customized procedures/
guidelines to address
specific regulatory
requirements. Each module
covers major regulations:
Clean Water Act, Clean Air
Act, Solid Waste
Management Act,
Hazardous Waste
Management Act,
Environmental Impact
Assessment, and General
Laws.
The modules will serve as
guide to Petron employees,
especially those involved in
environmental management
and project management.
We do not see a
negative impact of this
initiative
N/A
88
This will help Management
arrive at informed decisions
with regards to regulatory
compliance requirements
on environmental
management.
In 2021, 14 videos were
prepared to supplement the
Project Legacy Manuals
launched in 2020. The
videos are self-help
instructional material to
assist Managing Heads and
Pollution Control Officers
in preparation of reports
and permit applications, and
in addressing issues (e.g.
Notice of Violations, Land Use
Plan). Four sessions were
conducted with Operations
to cascade the videos.
Project ACESS GOAL 13: Climate
Action
Initiated and jointly
conceptualized with Retail
Expansion and Network
Development (REND), this
aims to establish the
compliance level of Petron
service stations with
environmental regulations
and establish a reference
database.
Two training sessions were
conducted by CTSG-
Environment to train REND
Engineers on regulatory
requirements to be
monitored. By end 2021,
995 out of 2,593 stations
were already assessed on
environmental compliance.
We do not see a
negative impact of this
initiative
N/A
Pollution Control
Officers (PCO)
Training
GOAL 13: Climate
Action
• All operating facilities of
Petron are required to
have Pollution Control
Officers (PCO).
• To assist service stations
in complying with this
requirement, CTESG-
Environment conducts a
Conflict with other
DENR-recognized
PCO Training
organizations.
Petron is committed
to the continued
improvement of its
environmental
practices across its
operations. We see
the PCO Training
Course as a pivotal
environmental
management training
program that enables
89
customized PCO training
exclusive for appointed
PCOs of Petron Service
Stations.
• In 2021, CTSG-
Environment conducted
six (6) batches of 40-hr
Online Pollution Control
Officer Training as a pre-
requisite for Pollution
Control Officer
accreditation. A total of
471 participants from
service stations, terminals,
and Petron Bataan
Refinery were trained.
Since the program was
launched in 2010, a total
of 3,479 participants were
already trained.
us to share our
passion for
environment
preservation and
shape the minds of
our service station
dealers.
Through this program,
we are able to
promote awareness of
various environmental
laws and local and
global environmental
issues among
stakeholders, among
them service station
dealers or their
representatives,
contractors, Petron
employees, and local
government units.
In addition to
compliance with
environmental
regulations, the course
was organized to
eventually accredit
Service Station
Managers as certified
Pollution Control
Officers (PCO) who
will be in-charge of
monitoring site
activities with regard
to environmental
performance. Through
this program, we are
able to share our
operating and
technical experience
with our supply chain
and external
stakeholders.
At the same time, we
will continue to work
with the relevant
government agencies
to secure their
approval to continue
conducting the PCO
training.
90
Outstanding
Pollution Control
Officer and
Environmental
Initiative Award
GOAL 13: Climate
Action
• This recognition
program aims to
highlight the role of the
Pollution Control
Officers (PCOs) in the
implementation of
Petron’s initiatives on
pollution prevention,
resource efficiency,
compliance with legal
requirements, social
development program
and similar
environmental
management practices as
key approaches for
business sustainability for
the Company’s
competitive advantage.
• The program has two
parts – a national award
for most outstanding
PCO and a national
award for environmental
initiative. The Petron
Environment council
reviews all nominations
for the Outstanding
Pollution Control
Officer award and all
applications for the
Environmental Initiative
Award.
• The program takes into
consideration the
following:
• All accredited
Pollution Control
Officers of Petron
Corporation in its
Operations Terminals
and Refinery
• All Pollution Control
Officers accredited by
DENR-EMB Regional
Offices and/or LLDA
• Personnel assigned as
PCO in the
establishment
represented for at
We do not see a
negative impact of this
initiative
N/A
91
least one (1) year by
January 1, 2022
Petron Home
Gardening
Program-Sow
Green
GOAL 13: Climate
Action
• This advocacy initiative
aims to spread
awareness among Petron
employees of sustainable
gardening and producing
eco-friendly practices at
home throughout the
duration of the Covid-19
lockdowns.
• Home gardening tips are
shared twice a week
through Petron’s internal
web platform (Exchange
Admin) and a dedicated
Viber Group.
• Employees are
encouraged to adopt
these practices and share
ideas and experiences
with home gardening
during the pandemic to
Increase awareness on
sustainable gardening and
eco-friendly methods on
how to grow produce at
home
We do not see a
negative impact of this
initiative
N/A
Support to
Pawikan Festival
as part of the
Bataan
Integrated
Coastal
Management
(ICM) Program
GOAL 14: Life Below
Water
Petron continued to
support the implementation
of the Bataan Integrated
Coastal Management
Program in 2021.
Specifically, we sustained
our partnership with the
Provincial Government of
Bataan in the hosting of the
annual Pawikan Festival.
Support to the annual
Pawikan Festival is centered
on the Pawikan
Conservation Center in the
town of Morong in Bataan,
which has long been a site
for the nesting of pawikans
(Olive Ridleys). Considered
as endangered species,
these marine turtles have
been making Morong a
Potential health risk
due to exposure of
participants to Covid-
19.
This year’s event was
again conducted
virtually given the
continued concerns of
Covid. Despite this,
our Environmental
Forum reached an
online audience of at
least 2,700 public
school students and
teachers and DepEd
officials from Bataan,
who listened to talks
given by environmental
professionals.
92
nesting site. Their presence
attests to a healthy
environment, as the
pawikans thrive only in
clean waters, and reflects
Petron’s sustainable
development efforts in
Bataan through the
Integrated Coastal
Management Program.
• PUNO NG
BUHAY
• Support to
NATIONAL
GREENING
PROGRAM
GOAL 15: Life on Land
Petron is actively pursuing
programs aimed at
protecting the environment:
• Through Puno ng
Buhay, Petron has
adopted a total of 85
hectares for mangroves
and bamboo plantation.
It has already
successfully captured a
total of 1,089 tons of
carbon from a
combined 30 hectares
of reforestation sites in
Leyte and Roxas
provinces.
• National Greening
Program supports the
goal of the National
Government to restore
the country’s forest
cover. Since 2000,
volunteers from
Petron’s Bataan refinery
and Terminal
operations nationwide
have collectively planted
over one million
mangrove and tree
seedlings.
We do not see a
negative impact of this
initiative
N/A
GOAL 17: Partnerships
to achieve the Goal
Strengthen the means
of implementation and
revitalize the global
partnership for
sustainable
development.
• Petron is an active
member of a number of
like-minded organizations
such as the Philippine
We do not see a
negative impact of this
initiative
N/A
93
Business for Social
Progress (PBSP) and is a
founding member of the
Philippine Business for the
Environment (now the
Business for Sustainable
Development).
• Petron Foundation is also
active member of the
Association of
Foundations and the
Philippine Council for
NGO Certification
(PCNC).
• Petron has sustained
partnership in multi-
stakeholder initiatives
with various national
government agencies such
as DOE, DENR DepEd,
DSWD, PNP, DOTr,
TESDA, etc.
* None/Not Applicable is not an acceptable answer. For holding companies, the services and products of its
subsidiaries may be disclosed.


