Embed Size (px)
Citation preview
CAA-SR-84-12
UNCLASSIFIED
>■
SECURITY CLASSIFICATION OF THIS PAGE (W>>ii 0,im ^ntarisd)
REPORT DOCUMENTATION PAGE READ INSTRUCTIONS BEFORE COMPLETING FORM
1. REPORT NUMBER
CAA-SR-84-12 2. GOVT ACCESSION NO. 3. RECIPIENT'S CATALOG NUMBER
4. TITLE (and Subtitto)
Aircraft Spare Stockage Methodology (AIRCRAFT SPARES) Study
5. TYPE OF REPORT i PERIOD COVERED
Final Report Aug 83 - Mar 84 6. PERFORMING ORG. REPORT NUMBER CAA-SR-84-1?
7. AUTHORfs)
Mr. Saul L. Penn, MAJ Ronald D. McAdoo, Mr. Harold D. Frear, Mr. Walter A. Bauman, Ms. Vivian E. Jugan, Mr. Thomas A. Rose
a. CONTRACT OR GRANT NUMBERfsJ
3. PERFORMING ORQANIZATION NAME AND AOORESS
US Army Concepts Analysis Agency^ 812b Woodmont Avenue Bethesda, MD 20814
10. PROGRAM ELEMENT. PROJECT, TASK AREA 4 WORK UNIT NUMBERS
It. CONTROLLING OFFICE NAME AND ADDRESS U. REPORT DATE April 1984 '3. NUMBER OF PAGES
163 14. MONITORING AGENCY NAME 4 AODne.SS(ll dlHsrmt Imm Controlline Otilct) IS. SECURITY CLASS, fof Ui/. rsport)
UNCLASSIFIED ISa. OECLASSIFICATION/ DOWNGRADING
SCHEDULE ^^^
IS. DISTRIBUTION ST ATEMEN T fo/ Uii. i!.porO
Approved for public release. Distribution is unlimited.
17. DISTRIBUTION STATEMENT (ol tha abattact atitarad In Block 20, If ditterant from Raport)
18. SUPPLEMENTARY NOTES
19. KEY WORDS (Contlnua on tavataa aida it nacaaaary and idantily by btock numbar)
Aircraft; Spares; Spare Parts; Logistics; War Reserves; Stockage Requirements; Inventory Management; Overview; PARCOM; SESAME; ACIM; Dyna-METRIC
20^ ABSTT^ACT fCaoffrTif ma rawaraa wdB ff nrncaaamry xni Idenltfy by btock numbar)
The Aircraft Spare Stockage Methodology Study was conducted primarily to provide the Army with an analytical tool for quick reaction, gross estimation of wartime spare parts requirements and costs as they relate to flying hour and availability objectives. An ability to identify problem parts and possible causes of the problems was also desired. The study compares the potential of five models- Overview, PARCOM, SESAME, ACIM, and Dyna-METRIC—to meet the study objectives. Overview and PARCOM are recommended for complementary use in estimating wartime
(See continuation)
DO 1 j>u, 73 1473 EDITION OF t MOV S5 IS OBSOLETE UNCLASSIFIED SECU,RITY Cl_AS5IF!CATrow OF THtS PAGE (WJrvn Data Entar«d)
CAA-SR-84-12
UNCl.A.S.STFTFn SECURITY CLASSIFICATION OF THIS PAOEflWun Dmtm Enlmrtd)
20. ABSTRACT (continued) spare parts requirements, while Dyna-METRIC is recornmended for more in-depth evaluation before its suitability for application to the problem is determined Data collection and validation problems associated with all the models examined are discussed.
r
UNCLASSIFIED SECURITY CLASSIFICATION OF THIS PAOEflWi.n D«(. EnttreO)
RESEARCH REPORTS DIVISION
CAA-SR-84-12
AD
AIRCRAFT SPARE STOCKAGE METHODOLOGY
(AIRCRAFT SPARES) STUDY
APRIL 1984
n'
PREPARED BY
FORCE SYSTEMS DIRECTORATE
US^ARMY CONCEPTS ANALYSIS AGENCY^
8120 WOODMONT AVENUE
BETHESDA, MARYLAND 20814
DISCLAIMER
The findings of this report are not to be construed as an official
Department of the Army position, policy, or decision unless so designated by
other official documentation. Comments or suggestions should be addressed
to:
Director
US Army Concepts Analysis Agency
AHN: CSCA-FS
8120 Woodmont Avenue
Bethesda, MD 20814
'^i
-%
STUDY REPORT CAA-SR-84'12
AIRCRAFT SPARE STOCKAGE METHODOLOGY (AIRCRAFT SPARES) STUDY
APRIL 1984
PREPARED BY
FORCE SYSTEMS DIRECTORATE
US ARMY CONCEPTS ANALYSIS AGENCY
-! 8120 WOODMONT AVENUE m
% BETHESDA, MARYLAND 20814
CAA-SR-84-12
DEPARTMENT OF THE ARMY us ARMY CONCEPTS ANALYSIS AGENCY
8120 WOODMONT AVENUE BETHESDA, MARYLAND 20814
SEPI.Y TO ATTENTION OF:
CSCA-FSC 11 JUN 1984
SUBJECT: Aircraft Spare Stockage Methodology (Aircraft Spares) Study
Deputy Chief of Staff for Logistics Department of the Army ATTN: DALO-ZD Washington, D.C. 20310
1. Reference:
a. Letter, DALO-ZD, 31 August 1983, subject as above.
b. Letter, CSCA-FSC, US Army Concepts Analysis Agency, 10 April 1984, subject as above.
2. Letter, reference la, directed the US Army Concepts Analysis Agency to develop candidate methodologies for predicting Army aircraft spare parts requirements as related to wartime capability. In response to this request, our draft study report was provided for your comments, reference lb.
3. The attached Aircraft Spares Study Final Report includes your reply and incorporates or addresses both your formal and informal suggestions.
4. This Agency appreciates the support by all the activities which contributed to this project. Questions and inquiries should be directed to the Assistant Director, Force Systems Directorate (ATTN: CSCA-FS), US Army Concepts Analysis Agency, 8120 Woodmont Avenue, Bethesda, Maryland 20814, AUTOVON 295-1507.
Ti 1 Incl as
0^^ C. \X^^, DAVID C. HARD ISDN Di rector
m
CAA '0 sik\'C^
AIRCRAFT SPARE STOCKAGE METHODOLOGY
(AIRCRAFT SPARES) STUDY
ONE SHEET
STUDY GIST CAA-SR-84-12
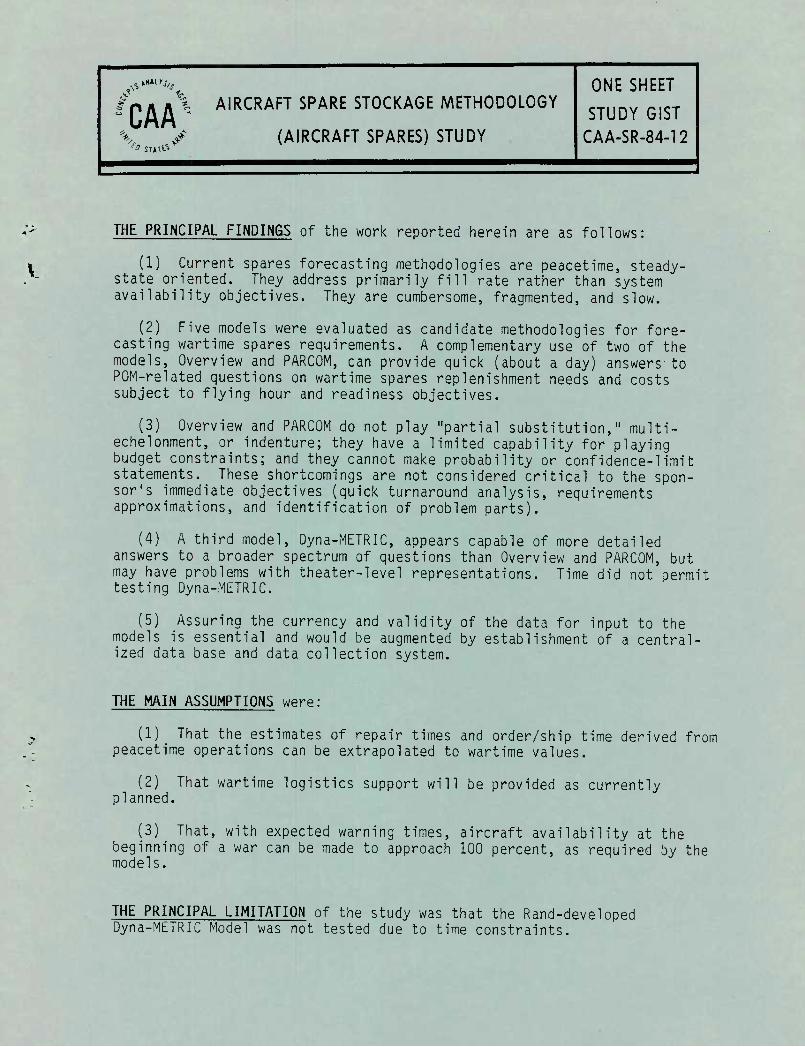
THE PRINCIPAL FINDINGS of the work reported herein are as follows:
(1) Current spares forecasting methodologies are peacetime, steady- state oriented. They address primarily fill rate rather than system availability objectives. They are cumbersome, fragmented, and slow.
(2) Five models were evaluated as candidate methodologies for fore- casting wartime spares requirements. A complementary use of two of the models. Overview and PARCOM, can provide quick (about a day) answers to POM-related questions on wartime spares replenishment needs and costs subject to flying hour and readiness objectives.
(3) Overview and PARCOM do not play "partial substitution," multi- echelonment, or indenture; they have a limited capability for playing budget constraints; and they cannot make probability or confidence-limit statements. These shortcomings are not considered critical to the spon- sor's immediate objectives (quick turnaround analysis, requirements approximations, and identification of problem parts).
(4) A third model, Dyna-METRIC, appears capable of more detailed answers to a broader spectrum of questions than Overview and PARCOM, but may have problems with theater-level representations, testing Dyna-METRIC.
Time did not permit
(5) Assuring the currency and validity of the data for input to the models is essential and would be augmented by establishment of a central- ized data base and data collection system.
THE MAIN ASSUMPTIONS were:
(1) That the estimates of repair times and order/ship time derived from peacetime operations can be extrapolated to wartime values.
(2) That wartime logistics support will be provided as currently planned.
(3) That, with expected warning times, aircraft availability at the beginning of a war can be made to approach 100 percent, as required by the models.
THE PRINCIPAL LIMITATION of the study was that the Rand-developed Dyna-METRIC Model was not tested due to time constraints.
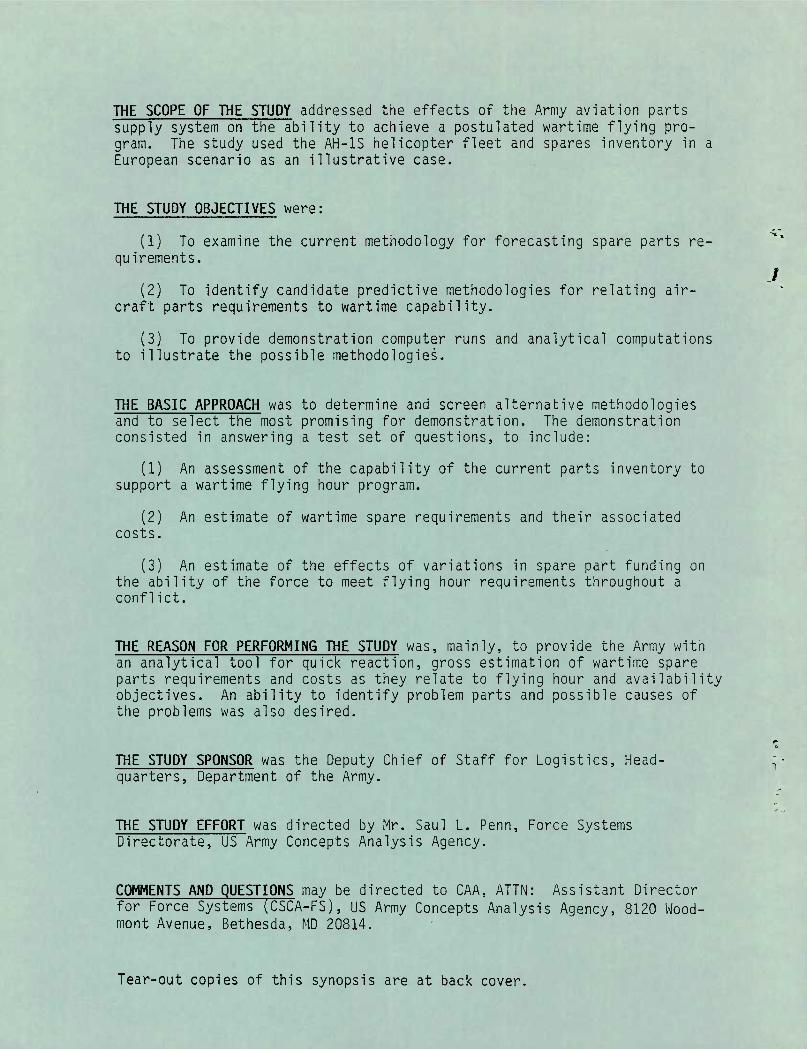
THE SCOPE OF THE STUDY addressed the effects of the Army aviation parts supply system on the ability to achieve a postulated wartime flying pro- gram. The study used the AH-lS helicopter fleet and spares inventory in a European scenario as an illustrative case.
THE STUDY OBJECTIVES were:
(1) To examine the current methodology for forecasting spare parts re- quirements.
(2) To identify candidate predictive methodologies for relating air- craft parts requirements to wartime capability.
(3) To provide demonstration computer runs and analytical computations to illustrate the possible methodologies.
THE BASIC APPROACH was to determine and screen alternative methodologies and to select the most promising for demonstration. The demonstration consisted in answering a test set of questions, to include:
(1) An assessment of the capability of the current parts inventory to support a wartime flying hour program.
(2) An estimate of wartime spare requirements and their associated costs.
(3) An estimate of the effects of variations in spare part funding on the ability of the force to meet flying hour requirements throughout a conflict.
THE REASON FOR PERFORMING THE STUDY was, mainly, to provide the Army with an analytical tool for quick reaction, gross estimation of wartime spare parts requirements and costs as they relate to flying hour and availability objectives. An ability to identify problem parts and possible causes of the problems was also desired.
THE STUDY SPONSOR was the Deputy Chief of Staff for Logistics, Head- quarters, Department of the Army.
THE STUDY EFFORT was directed by Mr. Saul L. Penn, Force Systems Directorate, US Army Concepts Analysis Agency.
COMMENTS AND QUESTIONS may be directed to CAA, ATTN: Assistant Director for Force Systems (CSCA-FS), US Army Concepts Analysis Agency, 8120 Wood- mont Avenue, Bethesda, MD 20814.
Tear-out copies of this synopsis are at back cover.
CHAPTER
CAA-SR-84-12
CONTENTS
Page
INTRODUCTION 1_1
Purpose ]__]_ Approach [\ ]__]_ Measures of Effectiveness I.4 Essential Elements of Analysis (EEA) i_4 Guide to the Remainder of the Report i_5
ARMY METHODOLOGY 2-1
General 2-1 Current Procedures 2-5 Developmental Procedures 2-9 Army Methodology Summary 2-10
AIR FORCE METHODOLOGY 3_1
Introduction 3_]_ Current Procedures ] 3_]_ Developmental Procedures - Wartime Assessment and
Requirements System 3.7 Use of Overview 3_3
ALTERNATIVE METHODOLOGIES EVALUATION 4-1
Introduction 4_2 Models Selected .']!!!!.' 4-1 Evaluation Criteria ]* 4.2 Data Requirements 4_5 Conclusions [[ 4_5
OVERVIEW/PARCOM APPLICATIONS AND TEST 5_l
Introduction 5_j_ Overview Capabilities S-2 Overview Answers to Demonstration Test Questions .... 5-5 Overview Summary/Observations 57 PARCOM Capabilities '.'.'.'.'.'.'.'. 5.7 PARCOM Answers to Demonstration Test Questions ...... 5-9 PARCOM Summary/Observations 5_13
FINDINGS AND RECOMMENDATIONS 6-1
General _ Q_-^ Findings " !!!!!!.* 6-1 Recommendations c c
vli
CAA-SR-84-12
APPENDIX Page
A Study Contributors A-1 B Study Directive B-1 C Model and Data Descriptions C-1 D PARCOM Applicability Demonstration D-1 E References E_l F Bibliography P_l G Sponsor's Comments G_l H Distribution List H-1
GLOSSARY Glossary-1
GIST (tear-out copies)
FIGURES
FIGURE
1-1 Study Methodology 1_2
2-1 Aircraft Parts Logistics System 2-2 2-2 Peacetime Requirement Methodology 2-5 2-3 War Reserve Requirement Methodology 2-7
3-1 The Component Support System 3-2 3-2 Current AF Wartime and Peacetime Spares Requirement
Methodology (D014) ' 3.5 3-3 F-XX Capabi 1 ity Assessment 3_8
4-1 Models Comparison Matrix 4_5
5-1 Required versus Achieved Flying Hour Program 5-2 5-2 Percent Daily Required Flying Hours Achieved 5-4
C-1 Overview Logic Schematic C-3 C-2 PARCOM Processing Sequence C-10 C-3 PARCOM Computation Algorithm for Allowable NMCS
Aircraft Q^H C-4 PARCOM Requirements Computation Algorithm for
Unconstrained Costs, "Full Substitution," "No Substitution," and "NMCS = 0" C-12
C-5 PARCOM Requirements Computation Algorithm for Constrained Cost with "No Substitution" C-15
C-6 PARCOM Computation Algorithm for Unconstrained Cost Capability Assessment C-16
V i i i
CAA-SR-84-12
FIGURE
C-7
C-8 C-9
D-1
D-2
D-3
D-4
D-5
PARCOM Computation Algorithm for Constrained Cost Capability Assessment
Cases Processed in a PARCOM Run Type Outputs Produced for Each Case Within
a PARCOM Scenario
Achievable Flying Hours as a Function of Budget Constraint
Achievable Aircraft Availability as a Function of Budget Constraint
Flying Hour Potential - Unconstrained Budget Solution versus Constrained Budget Solution
Aircraft Availability - Unconstrained Budget Solution versus Constrained Budget Solution
Number of Days of 100 Percent Flying Hour Program Sustainable versus Add-on Cost
Page
C-17 C-19
C-22
D-20
D-21
D-22
D-23
D-24
TABLES
TABLE
1-1
5-1 5-2 5-3
5-4
5-5 5-6 5-7
5-8
5-9 5-10
5-11
C-1
D-1
Question Set for Demonstration Test ,
Sample Overview Output - Summary of 16 Iterations ... Test Run: Demand Rate Factor (DRF) Current Spares Inventory Effects on Meeting Aircraft
Wartime Flying Hour Objectives, Full Substitution
Wartime Spares Inventory Requirements Based Upon Air- craft Flying Hour Objectives, Full Substitution ...
Dominant Spares (by cost). Full Substitution Key Attributes of Requirements Cases Capability Assessment of AH-IS Fleet with Current
Spare Inventory, "No Substitution" Policy (Assessment Case 1)
Wartime Spare Inventory Requirements, Unconstrained Cost, No Substitution (Requirements Case 1)
Dominant Spares for Requirements Case 1 Wartime Spare Inventory Requirements, Constrained
Cost ($10M), No Substitution (Requirements Case 6)
Dominant Spares for Requirements Case 5
Data Elements for Each Part Contained in Overview Parts Data Base
Key Attributes of Capability Assessment Cases
1-3
5-3 5-5
5-6
5-6 5-6 5-8
5-9
5-10 5-11
5-11 5-12
C-7
D-1
ix
CAA-SR-84-12
TABLE Page
D-2 Key Attributes of Requirements Cases D-2 D-3 Current Inventory Cost 0-6 D-4 Least Cost Add-on Requirements - Unconstrained Budget
Initial Inventory = Current Inventory D-7 D-5 Add-on Requirement Costs - Unconstrained Budget
Current Inventory Base D_8 D-6 Dominant Add-on Requirements - Unconstrained Budget,
Current Inventory Base, $K Cost/Percent Total D-9 D-7 Daily AC Availability Given that Solution Requirement
is Stocked - Unconstrained Budget, Initial Inventory = Current Inventory D-10
D-8 Total Inventory Requirement - Unconstrained Budget, Initial Inventory = 0 [)_12
D-9 Total Inventory (Add-on + Current) - Unconstrained Budget, Initial Inventory = Current Inventory D-12
D-10 Total Inventory Costs (Add-on + Initial) - Uncon- strained Budget D_13
D-U Dominant Total Requirements - Unconstrained Budget, Initial Inventory = 0, $M Cost/Percent Total D-15
D-12 Daily Aircraft Availability Given that Solution Requirement is Stocked - Unconstrained Budget, Initial Inventory = 0 0-16
D-13 Requirements Costs - Flying Hour Objective with Availability Constraints - Unconstrained Budget, Initial Inventory = Current Inventory 0-17
D-14 Number of Part Types with Add-on as a Function of Budget Constraint 0-18
D-15 Achievable Flying Hours and Aircraft Availability as' a Function of Budget Constraint 0-19
D-16 Capability Potential of Solutions with Sustained versus Cumulative Performance Objectives D-26
/ ' CAA-SR-84-12
AIRCRAFT SPARE STOCKAGE METHODOLOGY (AIRCRAFT SPARES) STUDY
CHAPTER 1
INTRODUCTION
1-1. PURPOSE. The purpose of this study was to provide the Army with a methodology for determining wartime aircraft spare parts requirements in relation to flying hour, aircraft availability, and cost objectives.
a. The Army has a limited methodology for relating required aircraft spare parts stockage levels to combat readiness and flying hour capability;! but the calculation of spare parts requirements and of the effects of budgeting changes has been primarily a peacetime-oriented exercise and has been slow and cumbersome. The principal criterion for spares stockage has been the achievement of acceptable stockout, or fill rate, levels. To more realistically predict wartime spare parts requirements, and to better justify budget requests for spare parts procurement, the Army needs a more responsive methodology based on wartime flying hour expectations and system readiness/availability requirements.
b. The study objectives, as set forth in the Study Directive (Appendix B), were:
(1) Analyze and evaluate the current methodology for forecasting air- craft spare parts requirements.
(2) Develop predictive methodologies to compute total aircraft spare parts requirements in relation to readiness and flying hour objectives.
(3) Provide demonstration computer runs and/or analytical computations, as appropriate, to illustrate the possible methodologies.
1-2. APPROACH
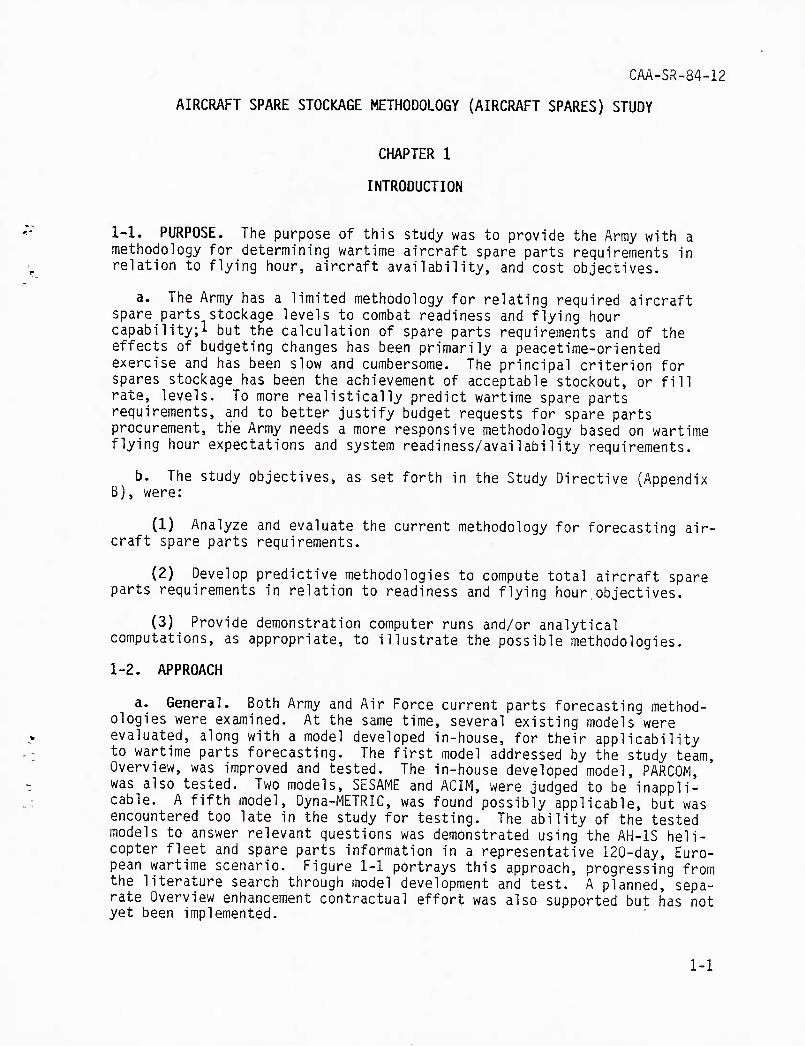
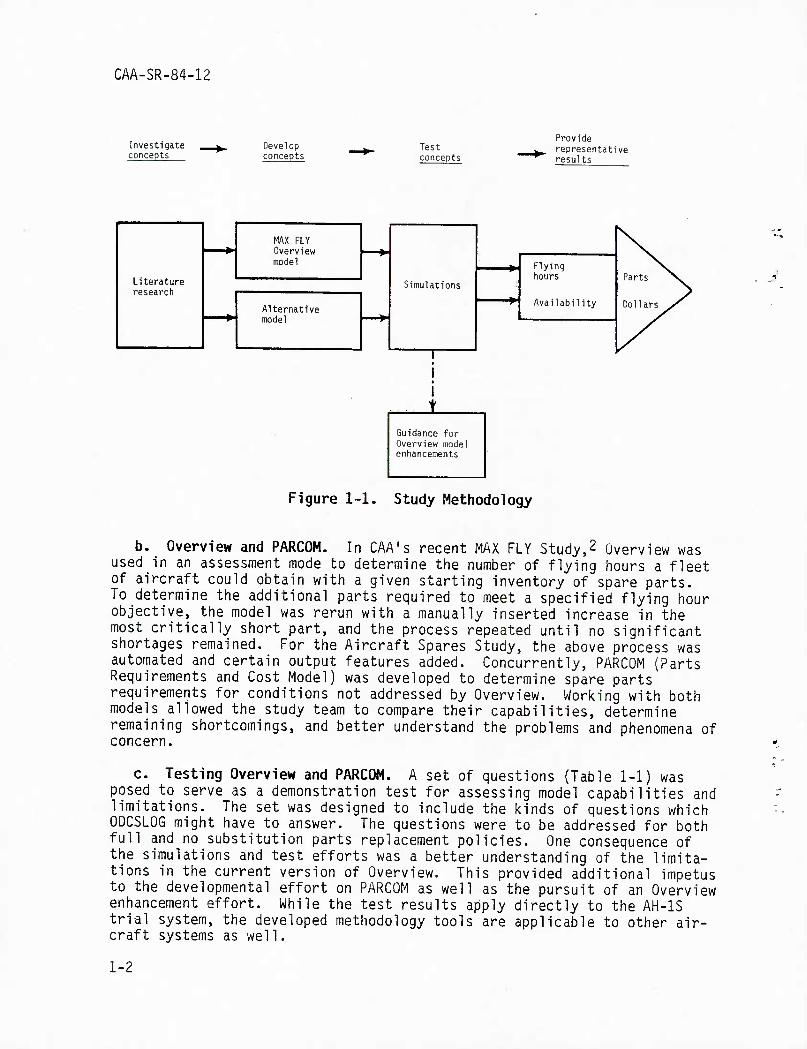
a. General. Both Army and Air Force current parts forecasting method- ologies were examined. At the same time, several existing models were evaluated, along with a model developed in-house, for their applicability to wartime parts forecasting. The first model addressed by the study team. Overview, was improved and tested. The in-house developed model, PARCOM, was also tested. Two models, SESAME and ACIM, were judged to be inappli- cable. A fifth model, Dyna-METRIC, was found possibly applicable, but was encountered too late in the study for testing. The ability of the tested models to answer relevant questions was demonstrated using the AH-IS heli- copter fleet and spare parts information in a representative 120-day, Euro- pean wartime scenario. Figure 1-1 portrays this approach, progressing from the literature search through model development and test. A planned, sepa- rate Overview enhancement contractual effort was also supported but has not yet been implemented.
1-1
CAA-SR-84-12
Investigate concepts
Develop concepts
Test concepts
Provide representative results
Literature research
MAX FLY Overview model
Simulations
N Flyinq hours
Availabi lity
\ Parts
Alternative model
Dollars
/
■^
Guidance for Overview model enhancements
Figure 1-1. Study Methodology
b. Overview and PARCOM. In CAA's recent MAX FLY Study,2 Overview was used in an assessment mode to determine the number of flying hours a fleet of aircraft could obtain with a given starting inventory of spare parts. To determine the additional parts required to meet a specified flying hour objective, the model was rerun with a manually inserted increase in the most critically short part, and the process repeated until no significant shortages remained. For the Aircraft Spares Study, the above process was automated and certain output features added. Concurrently, PARCOM (Parts Requirements and Cost Model) was developed to determine spare parts requirements for conditions not addressed by Overview. Working with both models allowed the study team to compare their capabilities, determine remaining shortcomings, and better understand the problems and phenomena of concern.
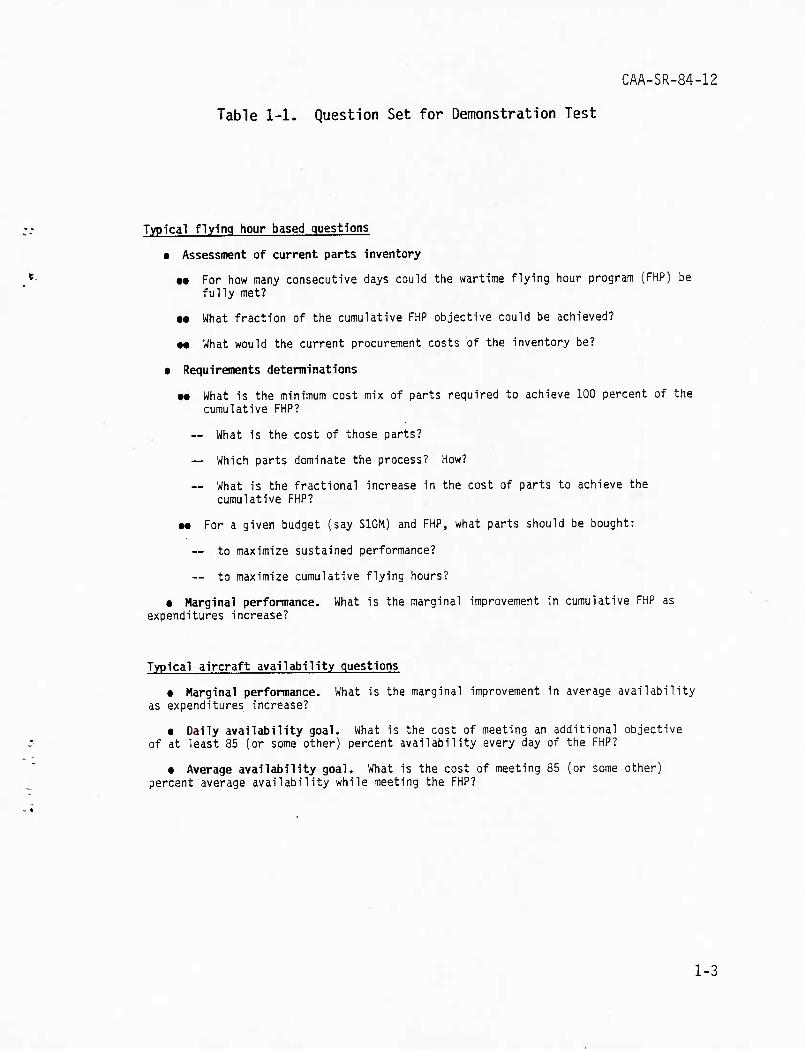
c. Testing Overview and PARCOM. A set of questions posed to serve as a demonstration test for assessing mod limitations. The set was designed to include the kinds ODCSLOG might have to answer. The questions were to be full and no substitution parts replacement policies. On the simulations and test efforts was a better understand tions in the current version of Overview. This provided to the developmental effort on PARCOM as well as the pur enhancement effort. While the test results apply direct trial system, the developed methodology tools are applic craft systems as well.
(Table 1-1) was el capabilities and of questions which addressed for both e consequence of ing of the limita- additional impetus
suit of an Overview ly to the AH-IS able to other air-
1-2
CAA-SR-84-12
Table 1-1. Question Set for Demonstration Test
Typical flying hour based questions
• Assessment of current parts inventory
M For how many consecutive days could the wartime flying hour program (FHP) be fully met?
M What fraction of the cumulative FHP objective could be achieved?
M What would the current procurement costs of the inventory be?
• Requirements determinations
M What is the minimum cost mix of parts required to achieve 100 percent of the cumulative FHP?
— What is the cost of those parts?
— Which parts dominate the process? How?
— What is the fractional increase in the cost of parts to achieve the cumulative FHP?
M For a given budget (say $10M) and FHP, what parts should be bought:
— to maximize sustained performance?
~ to maximize cumulative flying hours?
• Marginal performance. What is the marginal improvement in cumulative FHP as expenditures increase?
Typical aircraft availability questions
• Marginal performance. What is the marginal improvement in average availability as expenditures increase?
• Dally availability goal. What is the cost of meeting an additional objective of at least 85 (or some other) percent availability every day of the FHP?
• Average availability goal. What is the cost of meeting 85 (or some other) percent average availability while meeting the FHP?
1-3
CAA-SR-84-12
1-3. MEASURES OF EFFECTIVENESS
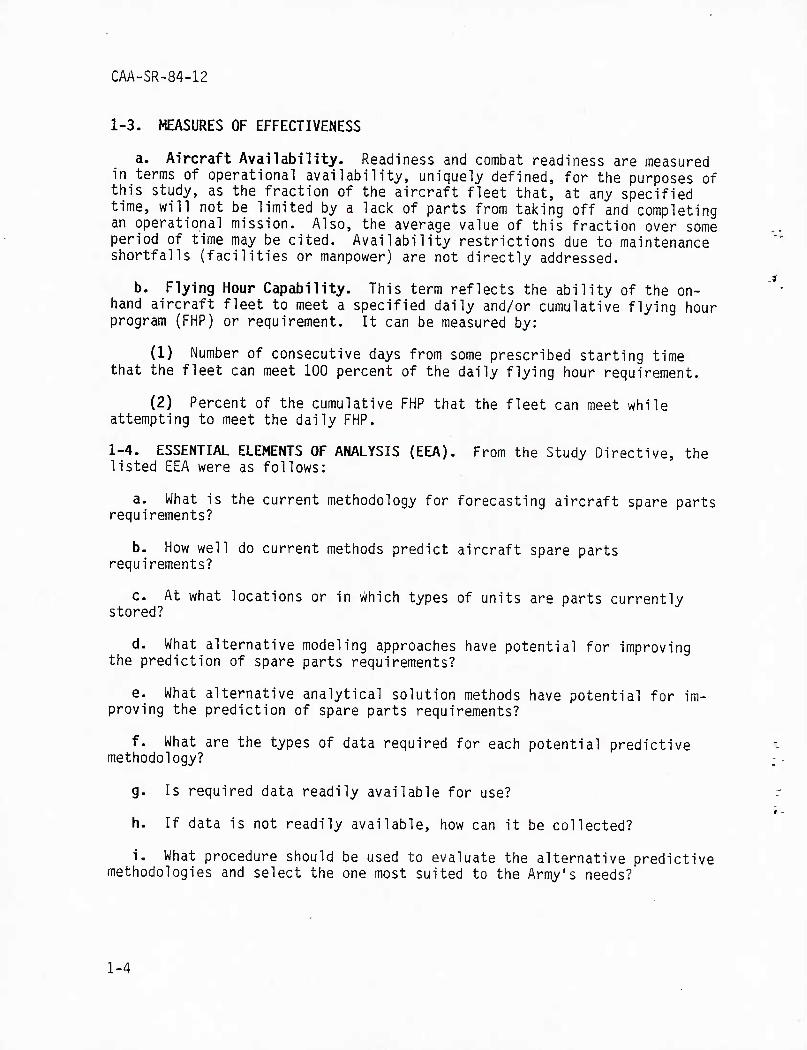
a. Aircraft Availability. Readiness and combat readiness are measured in terms of operational availability, uniquely defined, for the purposes of this study, as the fraction of the aircraft fleet that, at any specified time, will not be limited by a lack of parts from taking off and completing an operational mission. Also, the average value of this fraction over some period of time may be cited. Availability restrictions due to maintenance shortfalls (facilities or manpower) are not directly addressed.
b. Flying Hour Capability. This term reflects the ability of the on- hand aircraft fleet to meet a specified daily and/or cumulative flying hour program (PHP) or requirement. It can be measured by:
(1) Number of consecutive days from some prescribed starting time that the fleet can meet 100 percent of the daily flying hour requirement.
(2) Percent of the cumulative PHP that the fleet can meet while attempting to meet the daily PHP.
1-4. ESSENTIAL ELEMENTS OF ANALYSIS (EEA). From the Study Directive, the listed EEA were as follows:
a. What is the current methodology for forecasting aircraft spare parts requirements?
b. How well do current methods predict aircraft spare parts requirements?
c. At what locations or in which types of units are parts currently stored?
d. What alternative modeling approaches have potential for improving the prediction of spare parts requirements?
e. What alternative analytical solution methods have potential for im- proving the prediction of spare parts requirements?
f. What are the types of data required for each potential predictive methodology?
g. Is required data readily available for use?
h. If data is not readily available, how can it be collected?
i. What procedure should be used to evaluate the alternative predictive methodologies and select the one most suited to the Army's needs?
1-4
CAA-SR-84-12
1-5. GUIDE TO THE REMAINDER OF THE REPORT. Chapters 2 and 3 describe and assess the Army and Air Force methodologies for aircraft spares fore- casting. The models considered either as current or future candidates for parts requirements forecasting or analysis are reviewed and evaluated in Chapter 4. along with their data requirements and the criteria for model selection The application and test of the two models adopted and Z .ff,H l^^'J^'^ '*!j^^ ^""^ addressed in Chapter 5. Chapter 6 summarizes the study findings and recommendations.
1-5
CAA-SR-84-12
CHAPTER 2
ARMY METHODOLOGY
2-1. GENERAL
a. Governing Regulations. Policy and procedural guidance for the Army's inventory management efforts is largely contained in two regulations:
t AR 710-1 Centralized Inventory Management of the Army Supply System
• AR 710-2 Supply Policy Below the Wholesale Level
(1) AR 710-1 establishes responsibilities and procedures for central- ized inventory management of Army materiel by the Major Subordinate Commands (MSC) of the US Army Materiel Development and Readiness Command (DARCOM). The US Army Aviation Systems Command (AVSCOM) in St. Louis, Missouri, is the DARCOM MSC with primary responsibility for management of aircraft spare parts. Army wholesale policy for computing peacetime requirements for secondary items of supply is described in Chapter 4 of AR 710-1. Unclassified procedures for computation of war reserve requirements are contained in Chapter 8, AR 710-1. Reference to the classified Defense Consolidated Guidance and AR 11-11 (Army Programs, War Reserves) is also required for war reserve computations.
(2) AR 710-2 prescribes supply procedures to be used at the retail level, including methods for determining authorized stockage lists and ap- propriate stockage levels.
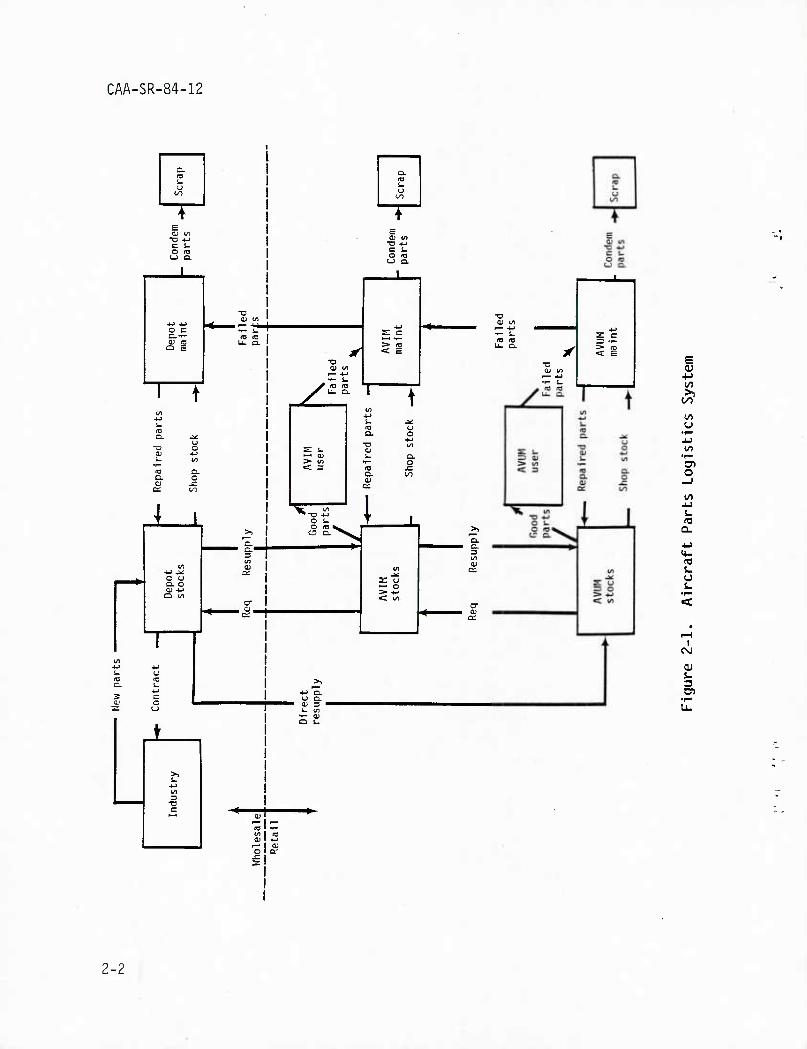
b. Maintenance System Structure. Figure 2-1 Illustrates the interaction of supply, maintenance, and industrial activities within the aircraft parts logistics system.
(1) Parts Storage Locations. Aircraft spare parts are stored with using units at the Aviation Unit Maintenance (AVUM) and the Aviation Inter- mediate Maintenance (AVIM) levels. Aircraft spare parts are stored in var- ious CONUS depots for shipment to users upon requisition. Additionally, war reserve parts are stored in various CONUS depots or prepositioned in the appropriate theater.
2-1
CAA-SR-84-12
a. to
u
Q. re o
on
i 1 E
1^ e fc.
u o. 5£ > 1
■o i
■
O C s^ re re 1
o; ro u. o. 1
1— +->
< £
1 1/)
F 1 V re re T
1. re a. ^ 1 Q. o
4-1
"O c => ^ s. ■o (/)
1— at u o. > w
IL 1 < 3 re
OJ j
1 L 1 1
1 i t O l- T
>i 1 c 1
t3 CL^S^^ Q.
Res
up
Vl
3 (/I
O U Q. O 1 s: u
1 =. £ o- 1 <: i/i
-• <g 1
1 ^ .. u
CL 4^
>> 4-» Q. U O.
^ O
t
>) !.. ■M W 3
"a
to -r-
o ctr .c 3
=1 •.- => re
r- 4^
E 0)
■M
o
CO •M
(0
u I.
I
CT) •r- U.
2-2 *
CAA-SR-84-12
(2) Participating Organizations and Responsibilities. AVUM facilities are organic to the lower echelon aviation units which actually fly and main- tain the Army's aircraft. These user units stock a prescribed load list (PLL) of repair parts at the AVUM level. PLLs are sized to sustain the unit's anticipated wartime flight operations for a specified number of days (usually 15). Stockage levels and reordering procedures are governed by AR 710-2. AVIM units develop their own authorized stockage lists (ASL) based on demands for parts received from supported AVUM units and from their own AVIM operations. AVIM ASLs are exclusive of subordinate unit PSLs. The development of ASLs is also governed by AR 710-2. Part types are selected for PLL and ASL stockage based upon a combination of experienced demand frequency and mission essentiality. The AVIM/AVUM (retail) parts require- ments are supported by stocks maintained in supply depots (wholesale) in CONUS. Automated inventory management techniques are employed by AVSCOM to authorize and record fill of retail requisitions by the appropriate wholesale depot. Depot stocks are replenished through procurement of new parts or repair of returned unserviceables.
(3) Item vis-a-vis System Management. The AVSCOM item manager is primarily responsible for ensuring that the Army has enough of the parts managed on hand to fill an established supply availability goal. AVSCOM weapons system managers strive to ensure the operational availability of their weapon systems. They provide necessary Information on density, usage, deployment dates, costs, and other system related data which is used by the item manager in the automated forecast of spare parts requirements. Weapons system managers in turn monitor requirements forecasts and identify potential inaccuracies, based upon most current information, which could affect the readiness of their weapon system. The item manager and the weapons system manager work together to ensure that spare parts requirements forecasts based on past demand appropriately reflect future weapons system employment plans.
c. Areas of Consideration
(1) Peacetime versus Wartime. Peacetime requirements for spare parts are computed based upon experienced annual demand and projected peacetime usage. AVSCOM uses an automated system of data bases and models to fore- cast these requirements, and bases its computations on a supply avail- ability goal. Wartime requirements are computed and funded separately from peacetime requirements, and address those parts required to sustain the force during the initial stages of war until lines of conmunication and supply can be established. The primary consideration for peacetime requirements is meeting supply availability goals, while that for war reserve requirements is meeting sustainability goals.
(2) Initial Provisioning versus Replenishment. Computation of the spare parts requirement for initial provisioning of new weapons systems is necessarily based on less concrete data than is that for replenishment parts for already fielded systems. No demand history has yet been developed, so engineering estimates of parts failure factors are used instead. In many cases, all the parts to be included in the new aircraft
2-3
CAA-SR-84-12
have not been fully identified, and their cost must be extrapolated from that of a list of major assemblies. AVSCOM has an automated capability to compute initial provisioning requirements based on these projected data. Over the first 2 years of a system's life, actual demand data is accumulated and given increasing weight in spare parts management decisions. After a system has been fielded for 2 years, its replenishment spare parts require- ments are computed using actual demand data to the maximum extent possible.
(3) Retail versus Wholesale. The Army splits its inventory management into "retail" and "wholesale" activities. In the aviation logistics context, AVUM- and AVIM-level parts stockages are termed "retail," while those at the depot level are termed "wholesale." The methodologies used to compute spare parts requirements for the retail and wholesale levels are entirely different and essentially unrelated. Retail stockage levels are computed and authorized based upon a combination of demand experience, combat essen- tiality, and mobility requirements. AR 710-2 establishes computational procedures used by retail parts managers to determine their stockage levels and appropriate reorder points. Wholesale parts requirements are computed based upon average monthly demand experienced at the wholesale level. Whole- sale item managers have little visibility of retail spare parts postures or weapons system availabilities. Rather, wholesale parts are procured or repaired at rates calculated to achieve a chosen demand satisfaction per- centage without backorders.
(4) Programing versus Execution. AVSCOM computes wholesale level aircraft spare parts requirements for programing purposes twice annually for input into the Army's Program Objective Memorandum (POM) and budget developments. Programing requirements are computed using a mix of actual demand and estimated failure factors applied against projected weapons sys- tem densities. Execution requirements are computed using the same method- ology, but with a differing frequency, based upon the projected annual procurement cost of a given part. AR 710-1 specifies cost criteria for determining the frequency of these Supply Control Studies (SCS). The item manager uses SCS recommended "buy" and/or "repair" quantities to assist him in maintaining stockage levels which are consistent with a stated supply availability goal.
(5) Fill Rate versus System Availability Criteria. AVSCOM computes spare parts requirements with the objective of achieving a target fill rate. Its goal is to fill a selected percentage of all demands received without having to backorder parts. The item manager does not base his parts manage- ment decisions on weapons system availability and, in fact, has little or no visibility of this retail level criterion. While models have been de- veloped which forecast parts requirements and recommend cost-optimized parts stockage mixes to achieve target weapons system availabilities, none is currently in use at AVSCOM. Department of Defense (DOD) has expressed its support for implementation of system availability-driven parts requirements computation methodologies in all the armed services.^ The primary diffi- culty for the Army is the collection of accurate data to drive such automated models.
2-4
CAA-SR-84-12
d. Similarity of Aircraft and Other Spares Procurement. Each of the MSCs uses the Commodity Command Standard System (CCSS) to meet its inventory management responsibilities. The processes used are essentially the same for all types of spares.
2-2. CURRENT PROCEDURES. Aircraft spare parts which are secondary items—both Army Stock Fund (ASF) purchased and Procurement Appropriation, Army, Secondary Items (PAA-2) funded--are managed through the CCSS, the standard data processing and logistics management system used throughout DARCOM. The CCSS consists of a number of data bases and computational programs and is maintained for DARCOM by the Automated Logistics Management Systems Activity (ALMSA), St. Louis, Missouri.
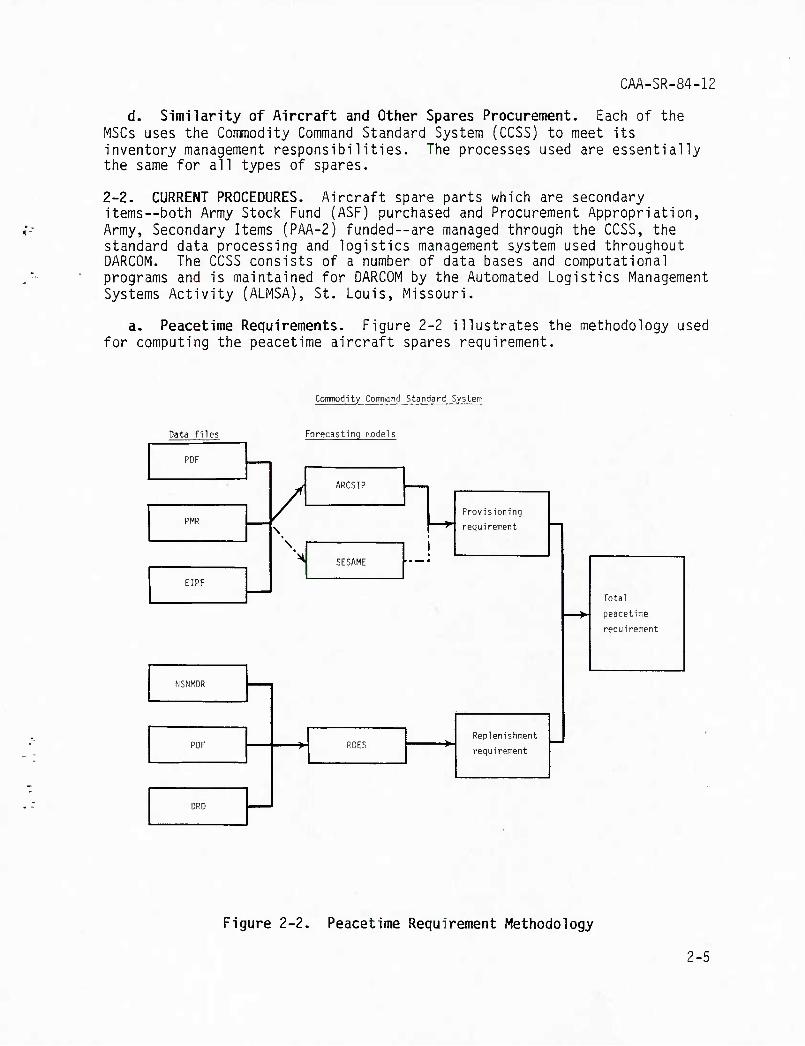
a. Peacetime Requirements. Figure 2-2 illustrates the methodology used for computing the peacetime aircraft spares requirement.
Commodity Command Standard System
Data files Forecasting models
PMR
EIPF
ARCSIP
SESAME
Provisioning
reguirement
NSNMDR
Replenishment
requirement PDF RDES
DRO
Total
peacetime
requirement
Figure 2-2. Peacetime Requirement Methodology
2-5
CAA-SR-84-12
(1) Initial Provisioning. Each program manager must ensure that suf- ficient quantities of spare parts are programed for and procured to support a new system during its first 2 years in the field. Requirements must be calculated early in the life cycle management process to allow sufficient time for funds to be programed, contracts to be let, and parts to be re- ceived prior to a system's fielding date. Current policy requires that 100 percent of the AVUM and AVIM requirement be on hand in using units 90 days prior to fielding, while 90 percent of the wholesale requirement must be on hand in depot stocks by the fielding date. Spare parts requirements are projected for a system's first 2 years in the field using a subelement of cess called the Automated Requirements Computation System for Initial Provisioning (ARCSIP). ARCSIP combines information such as engineers' estimates of failure factors, projected flying hour programs, system fielding dates, and quantities to be fielded to arrive at estimates of the spare part requirement over the first 2 years of a system's life. As the first 2 years go by, demand information begins to be accumulated as parts are ordered from the field. A weighted mix of actual demand rates and failure factors is used during the first 2 years after a system is fielded, with actual demands gradually increasing in weight until, at the end of 2 years, they form the complete basis for spare parts requirements computa- tions. ARCSIP uses the Provisioning Master Record (PMR) as its primary source of data. The PMR is a file within CCSS which is built through requirements placed on the vendor by contract. The most important type of data in the PMR is the failure factor (number of failures/100 end items/year), but 166 other data items are included as well for each part. The Program Data File (PDF) is another important data source for ARCSIP; it contains projected deployment dates, quantities of systems to be fielded, and standard usage rate modifiers to compensate for different levels of usage in different theaters. ARCSIP uses these data to project retail and wholesale repair parts quantities (known as "pipeline") required, by quarter and fiscal year, as well as the demand rate which will be experienced at the wholesale level (failures not repaired in the field). These pipeline requirements and demand rates are converted to average monthly demand and placed into the National Stock Number Master Data Record (NSNMDR) after the system is fielded.
(2) Replenishment Spares. The period after the initial 2 years from fielding is called the replenishment stage of a weapon system's life. Dur- ing the replenishment stage, aircraft spare parts requirements are projected using the Requirements Determination and Execution System (RDES) of the CCSS. The RDES uses average monthly demands (AMD) as the basis for its computations rather than engineers' estimates of failure factors. The AMD is considered in conjunction with assets on hand and all projected lead times (administrative, production, safety levels, etc.) to determine recom- mended frequency and quantity of procurement and/or repair of spare parts. For each part, the RDES produces a Supply Control Study (SCS) which is given to the appropriate item manager as an advisory document. The SCS specifies on-hand quantities, the normally requested quantities, and how many to buy and/or repair based on corresponding assets on hand, lead times, projected usage rates, etc. The RDES is supported by a number of data bases within CCSS including the Demand/Return/Disposal (DRD) File
2-6
CAA-SR-84-12
and the PDF. The DRD is a record of all transactions on AVSCOM-managed items over the most recent 2-year period, and is the source of demand data for the RDES. In addition to providing the previously described data used by ARCSIP in initial provisioning computations, the PDF maintains a 5-year record of the flying hours and support items needed by helicopter type, for fielded systems. These data are combined with projected usage factors to predict replenishment requirements over the next 7 years.
b. Wartime Requirements
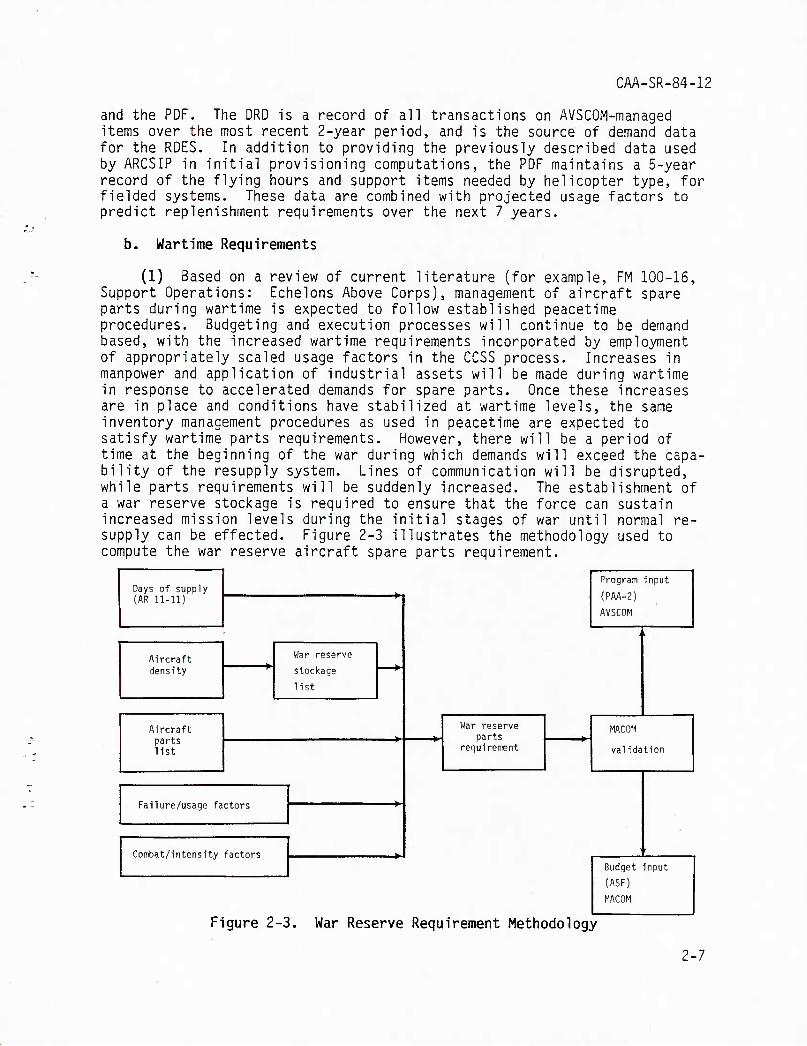
(1) Based on a review of current literature (for example, FM 100-16, Support Operations: Echelons Above Corps), management of aircraft spare parts during wartime is expected to follow established peacetime procedures. Budgeting and execution processes will continue to be demand based, with the increased wartime requirements incorporated by employment of appropriately scaled usage factors in the CCSS process. Increases in manpower and application of industrial assets will be made during wartime in response to accelerated demands for spare parts. Once these increases are in place and conditions have stabilized at wartime levels, the same inventory management procedures as used in peacetime are expected to satisfy wartime parts requirements. However, there will be a period of time at the beginning of the war during which demands will exceed the capa- bility of the resupply system. Lines of communication will be disrupted, while parts requirements will be suddenly increased. The establishment of a war reserve stockage is required to ensure that the force can sustain increased mission levels during the initial stages of war until normal re- supply can be effected. Figure 2-3 illustrates the methodology used to compute the war reserve aircraft spare parts requirement.
Days of supply (AR 11-11)
Program input
AVSCOM
'
Aircraft density
War reserve
stockage
list
Aircraft parts list
War reserve parts
requirement
MACOM
validation
Failure/usage factors
Combat/intensity factors •
Budget input
(ASF)
MACOM
Figure 2-3. War Reserve Requirement Methodology
2-7
CAA-SR-84-12
(2) Computation of the war reserve requirement for aircraft spare parts is an annual AVSCOM responsibility which requires three main factors:
(a) Aircraft Densities and Deployment Dates. These dates are ex- tracted from the ODCSOPS Logistics Structure and Computation System (LOGSACS) tape by the Depot Systems Command (DESCOM), an MSC of DARCOM. The LOGSACS tape lists units, equipment, and strengths to be deployed by day in selected wartime scenarios. DESCOM "filters" the equipment listed through the War Reserve Stockage List (WARSL) (SB 700-40) to determine which items are authorized for stockage in war reserves. The aircraft and associated secondary items listed in the WARSL are identified and the LOGSACS densities and deployment dates for those equipments are provided to AVSCOM. AVSCOM analysts may amend density data if they have access to more recent information. AVSCOM then determines which parts are necessary to support the listed aircraft and secondary items.
(b) Attrition/Failure Factors. Aircraft attrition factors are pro- vided by ODCSOPS. Parts failure factors and demand data are extracted from appropriate CCSS data bases at AVSCOM. These demand rates are increased by multiplicative combat factors developed by ODCSLOG to appropriately reflect increased failures under wartime conditions,
(c) The Period of Time for Which a Force is to be Supported. This classified information is extracted from the Defense Consolidated Guidance and AR 11-11.
(3) War reserve requirements are computed in the following manner:
(a) Day-by-day item densities are determined from the LOGSACS. Ex- pected attrition rates are applied and daily usage is estimated,
(b) Failure rates are appropriately adjusted for combat conditions and applied to the equipment density/usage data, producing a daily require- ment for the item being examined,
(c) This process is repeated for each day of war to be supported by war reserves, then each day's requirements are summed to estimate the over- all war reserve requirement,
(4) AVSCOM provides its derived war reserve parts requirement to each supported major Army command (MACOM) for validation. Validated require- ments are then included in appropriate program and budget inputs by AVSCOM and each MACOM.
(5) War reserve requirements are computed and programed separately from requirements for peacetime operating stocks. Historically, only a small percentage of the forecast requirement has been funded and procured.
2-8
CAA-SR-84-12
2-3. DEVELOPMENTAL PROCEDURES. The Defense Guidance published in March 1982 contained the following paragraph on page 75:
"(U) Our objective is to size and fund peacetime operating stocks (PCS) secondary item inventories to support programed weapons systems availa- bility rates and operating tempos. Since analytic methodologies to achieve this do not exist, the services will develop and institute, by end FY 1985, the ability to size weapon system initial and replenishment secondary item inventories to meet explicit weapon system availability and operating tempo objectives."
A 10 March 1982 memorandum signed by Principal Deputy Assistant Secretary of Defense Juliano, Office of Manpower, Reserve Affairs and Logistics, sub- ject: Consideration of End Item Readiness in Inventory Management, stated in part:
"The traditional approaches to determining inventory levels and measur- ing supply performance have been related to the satisfaction of demands for items of supply. Such approaches do not normally identify the degree to which various secondary items contribute to the operational availability of weapon systems. We are now attempting to relate stockage decisions to the effect they have on weapon system readiness. This concept represents a significant departure from traditional supply management in that it shifts the materiel manager's concern from item- oriented inventory performance to weapon system performance. Adoption of the concept will mean a move toward visibility and management of spare and repair parts requirements by weapon system. The Army, Navy, and Air Force are in various stages of using sparing-to-availability models to compute spare parts requirements for selected weapons systems."
The spare parts requirements forecasting methodologies currently in use at AVSCOM continue to use supply availability goals rather than weapons system availability goals. That is, the current goal is to fill a selected per- centage of requisitions without having to backorder parts, rather than to fill those requisitions which will maintain the operational availability of the Army's helicopters at or above selected levels. However, the Inventory Research Office (IRO), a subelement of the Army Materiel Systems Analysis Activity (AMSAA), has developed the Selected Essential-Item Stockage for Availability Method (SESAME) Model, which has the capability to generate spare parts mixes which maximize weapons system availability over time under given cost constraints. SESAME is an automated program currently associated primarily with provisioning of systems/end items scheduled for introduction into the Army's inventory (as in Figure 2-2). It is a DA- approved model that has two primary applications: the budget forecast application, which includes peacetime and war reserve requirements, and the essential repair parts stockage list (ERPSL) application. Because of the high cost associated with sparing to availability, DA approval is currently required before ERPSL outputs (derived using weapons system availability as a goal) can be used in the provisioning process. However, because SESAME is a DA-approved model with a degree of interoperability with CCSS, it may
2-9
CAA-SR-84-12
play a larger role in the Army's peacetime spare parts requirements deter- mination, as the process evolves toward an operational availability-based system. Its applicability for generating wartime aircraft spares require- ments will be discussed later in this report. Other sparing-to- availability models have been developed by civilian firms for Service use, including the Rand Corporation's Dyna-METRIC Model and CACI's Availability Centered Inventory Model (ACIM). Synergy, Inc. has developed the Overview Model, which can be used to assess flying hour capabilities given any parts mix, and to generate parts requirements to achieve improved performance. Each of these models was examined in this study to assess its applicability to the Army's wartime aircraft spare parts requirements determination process. Results of these assessments are presented later in this report.
2-4. ARMY METHODOLOGY SUMMARY. The Army's current process for computing aircraft spares requirements is directed toward filling a target percentage of requisitions without backorders. The target is an average of the fill rates for each item managed by AVSCOM. Weapon system availability is not a management objective in the current process. AVSCOM uses the automated cess, which combines information on past demands, projected item usage, and applicable leadtimes to derive future wholesale requirements. Retail level (AVIM and AVUM) stockages are authorized and ordered based on experienced demand, anticipated use, estimated order/ship times, and combat essentiality. Aircraft spare parts requirements for war reserve stocks are determined for authorized items using peacetime demand rates which have been adjusted for selected wartime scenarios, and are computed and funded separately from peacetime operating stock requirements. AVSCOM currently lacks the capability to relate its derived parts stockage requirements to weapons system availability or to combat sustainability. The current system lacks the capability to estimate effects of varied funding levels on the Army's flying capability and, therefore, cannot be responsive to the types of readiness and sustainability questions which often arise during the programing cycle. There are a number of existing availability-based models which have potential for Army use. A selection of these models is assessed in later chapters of this report.
2-10
CAA-SR-84-12
CHAPTER 3
AIR FORCE METHODOLOGY
3-1. INTRODUCTION. This chapter describes the methods used by the Air Force to forecast aircraft spare parts requirements. First current and then planned Air Force methods are discussed, using as the principal source extracts from a Rand report written by Dr. J. H. Bigelow.^ The chapter concludes by discussing Air Force applications of the Overview Model.
a. Expendables. Air Force items of inventory are classified as either expendables or recoverables. Expendables are, typically, low cost items which are consumed in use. Usually, failed expendables are physically or economically infeasible to repair. Expendables lose their self-identity when installed on higher assemblies. Air Force forecasting of expendable spare parts requirements is based upon demand. Since the procurement of expendables is not a principal subject of this study, it is not treated further in this chapter.
b. Recoverables. Recoverables are, typically, high cost items which are not consumed in use. Failed recoverables usually are mechanically and economically feasible to repair. They retain their self-identity when in use, and are items such as radios and radar units. The Air Force uses dif- ferent subsystems of the same overall requirements determination system to forecast peacetime and wartime recoverable component (spare parts) require- ments. The current methods are described next, followed by a discussion of their shortcomings and planned improvements.
3-2. CURRENT PROCEDURES
a. The Component Support System
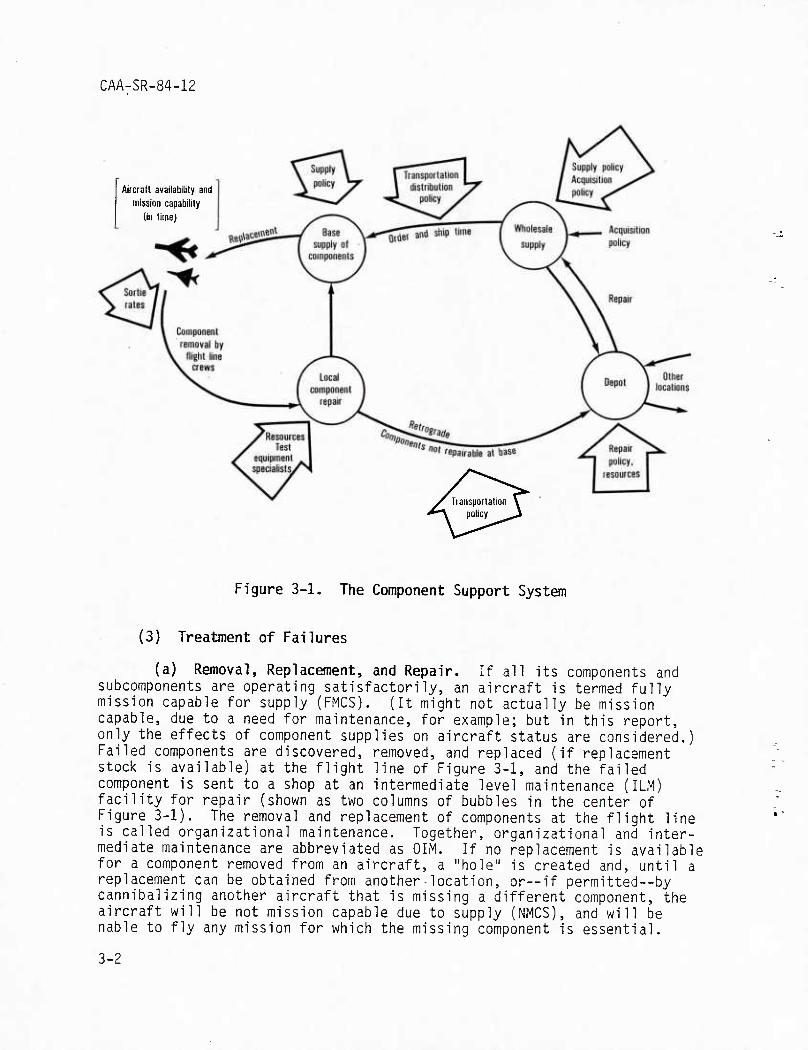
(1) Hierarchical Structure. The world of recoverable components may be represented as two interacting hierarchical structures. One, the inden- ture structure, relates components to aircraft. The other, the component support structure, describes the flow of components through the logistics system, which is composed of maintenance and supply functions, and the transportation system, which moves components from place to place. Figure 3-1 depicts both interacting hierarchies in a single diagram.
(2) Components and Subcomponents. Aircraft are composed of components, which in turn may be composed of subcomponents. Examples of components are guns, gunnery and bombing fire control systems, structural components (such as bulkheads and canopies), control surfaces (such as stabilizers), landing gear struts, wheels and brakes, jet engine components (such as fuel control assemblies, fan blades, pumps, and valves), radars, and navigational instruments. An aircraft is typically composed of thousands of components and subcomponents.
3-1
CAA-SR-84-12
Aircraft availability and mission capability
(in time)
-Jt
yT Transportation V^ ^"^ policy ^^
Figure 3-1. The Component Support System
(3) Treatment of Failures
(a) Removal, Replacement, and Repair. If all its components and subcomponents are operating satisfactorily, an aircraft is termed fully mission capable for supply (FMCS). (It might not actually be mission capable, due to a need for maintenance, for example; but in this report, only the effects of component supplies on aircraft status are considered.) Failed components are discovered, removed, and replaced (if replacement stock is available) at the flight line of Figure 3-1, and the failed component is sent to a shop at an intermediate level maintenance (ILM) facility for repair (shown as two columns of bubbles in the center of Figure 3-1). The removal and replacement of components at the flight line is called organizational maintenance. Together, organizational and inter- mediate maintenance are abbreviated as OIM. If no replacement is available for a component removed from an aircraft, a "hole" is created and, until a replacement can be obtained from another-location, or--if permitted--by cannibalizing another aircraft that is missing a different component, the aircraft will be not mission capable due to supply (NMCS), and will be nable to fly any mission for which the missing component is essential.
3-2
CAA-SR-84-12
(b) Component Failures. At the ILM, the failed component is sched- uled into the repair process. During repair, it may be found that one or more of its subcomponents are defective. They will be removed, and the resulting "holes" in the parent component will be filled by replacement subcomponents, if available, or by cannibalizing other components at the ILM, if they are available and cannibalization is allowed. If subcom- ponents cannot be obtained from either of these sources, the parent com- ponent must remain in awaiting parts (AWP) status until subcomponents can be obtained from another location.
(c) Subcomponent Failures. Meanwhile, the defective subcomponents may themselves enter the repair process at the ILM, and failed sub-subcom- ponents may be discovered. There is no theoretical limit to the number of levels of indenture that can be considered, but at the ILM it is not common to encounter more than two levels. (Note the similarity between an aircraft and its components at the flightline and a component and its subcomponents at the ILM. In both cases there is a need for replacement stock; cannibali- zation is a potential source of supply; and the penalty for having too lit- tle supply is a nonoperable hulk--an NMCS aircraft in the one case, and an AWP component in the other.)
(4) Indenture Structure. It is important to distinguish between the indenture structure as described by engineering drawings of an aircraft and that implied by maintenance practices. For example, the engineering drawings of the C-5A nose landing gear show that a component called an arm assembly is a subcomponent of the nose strut. But the organizational maintenance crew will often remove the arm assembly directly from the aircraft; they will rarely remove the entire strut and send it to the ILM to have the arm assembly taken off. This distinction between two kinds of indenture is recognized in the terminologies used; there are line replaceable units, or LRU, that are removed and replaced at the flightline, and shop replaceable units, or SRU, that may be detached from their parent components at the ILM but not at the flightline. For stockage analysis, the indenture structure defined by maintenance practices is the one of interest.
(5) Echelon Structure
(a) Organizational, Intermediate, and Wholesale. The most usual topology for the component support structure has three echelons, which are connected by transportation links. The first echelon is organizational maintenance at the flightline (Figure 3-1). The flightline is supported by a usually collocated ILM and supply point, which is the second echelon of Figure 3-1. Any support that the ILM cannot provide--e.g., if a component is beyond repair by the means available at an ILM—must be provided by the wholesale part of the system, the third echelon of Figure 3-1. The whole- sale echelon, like the echelon before it, consists of a supply function (wholesale supply) and a repair function (depot level repair). As at the ILM, the indenture structure affects activity at the wholesale echelon; a component in repair at the depot may yield failed subcomponents. The depot generally, carries repair to deeper levels of indenture than the ILM.
3-3
CAA-SR-84-12
(b) Linkage. Echelon one is connected to echelon two, and echelon two to echelon three, by transportation links in both directions. The times required for components to traverse these links are understood to include administrative delays as well as the time used actually moving items from place to place. (Indeed, the administrative delays typically account for the lion's share of the total "transportation" time.) The links from echelon one to two, and from two to three, carry failed (repairable) com- ponents; the links in the other direction carry serviceable components.
(c) PACOM Exception. Other topologies are possible, even encoun- tered. In the Air Force Pacific Command, the individual bases have surren- dered most of their ILM capability to a centralized intermediate repair facility (CIRF). Because some capability remains at each flightline, this has the effect of adding a fourth echelon to the system. Other arrangements can be readily imagined. .
(d) Stockage - Pipeline, Safety, and War Reserve. To work smoothly, this system must have sufficient stocks to fill the transportation and re- pair "pipelines," and to provide contingency stocks--a "safety level"-- against periods of unexpectedly high demands. The system must also own war reserve stockpiles at the flightline and retail echelon (prepositioned war reserve materiel, PWRM) and at the wholesale echelon (other war reserve materiel, OWRM) from which demands can be satisfied while the wartime pipe- lines are filling. Losses of components through condemnation and increases in pipeline requirements due to changes in flying activity will periodi- cally necessitate the purchase of new components. The system must also be able to transport and repair components as needed to meet demands at the flightline.
b. Day-to-day Management
(1) Description. The day-to-day management of the component support system is now considered. In the Air Force there are "item managers" who are responsible for the day-to-day management of individual components, and "system managers" who are responsible (in some ways) for day-to-day manage- ment of weapon systems. The item manager relies on a huge computerized data system known as D041. The purpose of the D041 system is to estimate the number of each component that should be repaired at the depot, the num- ber that should be bought, and the number that should be disposed of, at various times in the future. Each quarter, D041 projects required purchases and depot level repairs of each item between 2-1/2 and 3-1/4 years into the future, the length depending on the quarter. The requirements for each component are based on programed future activity rates and on factors such as demands per unit of activity and repair times. Factor values may be standards, historically observed values, or forecasts. Future activities and programed capabilities that may generate demands for components include peacetime flying hours and wartime planning scenarios (established by HQ USAF), as well as programed depot maintenance (PDM) of aircraft, and engine overhaul programs (maintained by the Air Logistics Centers, ALC).
3-4
v^: . ■ CAA-SR-84-12
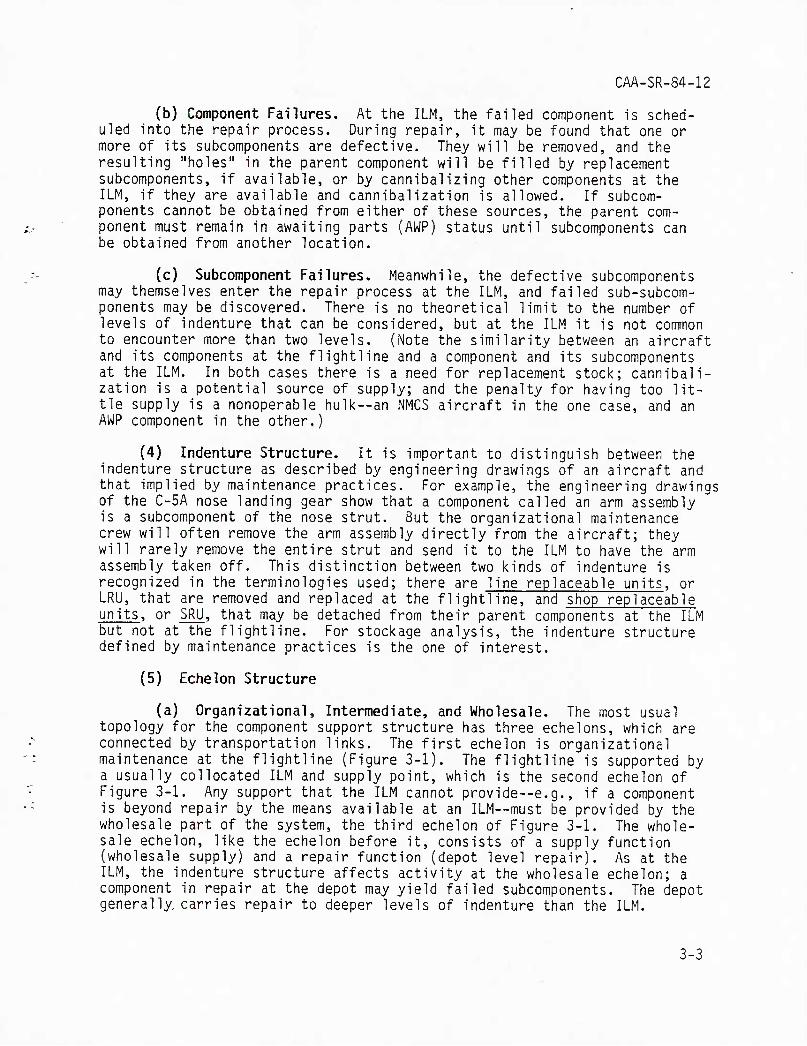
(2) Computation Outline and Operating Requirements. In broad outline, the computation method is as follows. First the gross requirement for reserviceable components is calculated at all times of interest. The gross requirement for a particular component consists of five different kinds of quantities: operating requirements, pipeline requirements, safety levels, war reserve requirements, and additive requirements as shown in Figure 3-2. Operating requirements consist of the number of components that fail during an interval of time and which must be replaced by serviceable components. Operating requirements accumulate over time as more and more components fail; but most failed components can be repaired and returned to service. Thus, operating requirements measure the rate at which the components will circulate through the system.
War reserve rqmts
• War mobilization plan
Program rqmts
• Operating rqmts
Flying hours
Depot
Engine overhaul
• Pipeline
X
Additional rqmts
• Foreign military sales
• Interservice support
Assets
On hand
Due in
Ly
Factors (demand rates) Standards Historical Forecast
■ •
Recoverable consumption
item rqmts
computation system
D041
1 - 1 1
'
■< \
Va riable lev
comput
safet el ation
y
Item by item
rqmts
over time
Purchase
Depot repair
POM inputs
$ purchase
$ depot repair
Figure 3-2. Current AF Wartime and Peacetime Spares Requirement Methodology (D041)
3-5
CAA-SR-84-12
(3) Pipeline Requirements. Peacetime pipeline requirements consist of the number of components expected to be in the various transportation and repair pipelines during peacetime. Safety levels are provided because the pipeline contents vary randomly, and sometimes exceed the expected number. If there were no safety stock and the pipelines temporarily contained more components than expected, the incremental stock would have to be taken from war reserves or from aircraft. Safety stock cannot prevent this alto- gether, but can reduce its frequency of occurrence.
(4) War Reserve. In the event of war, demands for many components are expected to increase beyond peacetime levels, and wartime pipelines will be larger than their peacetime counterparts. War reserve stocks pro- vide the incremental stock needed to fill the wartime pipelines, and to satisfy demand during the interval when the pipelines are filling.
(5) Additive Requirements. Finally, additive requirements consist of all requirements not identified as belonging in one of the previous cate- gories. They include requirements to support foreign military sales (FMS), special training programs, interservice agreements, etc.
(6) Time Related Requirements. The total gross requirement is calcu- lated for each quarter of each year in the D041 projection. Serviceable assets are subtracted from the gross requirements. Unserviceable assets which can be repaired are also subtracted. On-order assets are the last resources to be subtracted. If requirements still remain after the three subtractions, buy orders must be placed, with appropriate lead times, to meet them.
(7) Quarterly D041 Results. D041 is run twice during each quarterly exercise. The first time it is run, the results are passed out to the in- dividual item managers for review. They have about one month to locate errors and to revise the forecast values of the various factors, such as demands per flying hour, condemnation rates, etc., on which the require- ments depend. Each suggested change is scrutinized by several people and, if it passes scrutiny, is entered into the D041 data base. D041 is then run a second time, using the updated data base; these are the D041 results that are used in managing components.
(8) Planning, Programing, Budgeting, and Execution System (PPBES) Input. Both the buy and repair requirements are produced in two forms: they are presented to each item manager for the individual items he manages; and they are produced in an aggregate form called the central secondary item stratification (CSIS), which by DOD instruction is a required input into the PPBES.
c. Shortcomings
(1) Fragmented. When considered solely as a system for assisting day-to-day management of components, D041 has a number of shortcomings. One lies in the fragmented nature of the computation. Prepositioned war reserve requirements are computed in the 0029 system, which is separate
3-6
CAA-SR-84-12
from D041. Other war reserve requirements are computed in a model called LOGRAMS. D041 calculates pipeline requirements and safety levels, and com- bines them with the quantities obtained elsewhere. It is clear that when requirements are calculated by such a widely distributed process, there is increased risk that something will "fall between the cracks." Consistency in assumptions from one part of the computation to another is hard to main- tain.
(2) Cumbersome. A second shortcoming of D041 is its cumbersome nature. The system, and any replacement system, will need access to so much data, and this data will require so much effort for collection and verification that the system can never be very responsive. The quarterly cycle for updating the data base and computing new requirements estimates will always take weeks or months; but, a real-time capability could be added to simulate individual items, and historical data could be retained to make possible statistical and other analyses of individual items.
(3) System Availability Not Assessed. A third shortcoming, one more susceptible to correction, is the inability of the present system to target buy and repair recommendations at individual weapon systems. The recom- mendations are made item by item and, early in the computation, the link between item and weapon system is lost. Moreover, the recommendation is based on a fill rate criterion (i.e., likelihood that a requisition can be filled immediately upon receipt), which, if followed, may enable the support system to achieve exemplary fill rates but mediocre aircraft performance.
3-3. DEVELOPMENTAL PROCEDURES - WARTIME ASSESSMENT AND REQUIREMENTS SYSTEM
a. Simplification and Consolidation. The fragmented and cumbersome nature of D041 can only be corrected in the long term; no "quick fix" is possible. A remedy is currently being developed by the Air Force-- WARS/RDB, the Wartime Assessment and Requirements System and the Require- ments Data Base. Air Force Logistics Command's (AFLC) present position is that WARS will only be used to calculate war reserve requirements and D041 will continue to compute the peacetime requirements. WARS treats all scenarios in the same way, whether peacetime or wartime, so there are two parallel systems. WARS is capable of running a wartime scenario to esti- mate a total requirement for wartime and, separately, a peacetime scenario, to compute the peacetime portion of the requirement. War reserve materiel can be taken as the difference. WARS also distinguishes between loca- tions--flightline, ILM, wholesale--and positions the stock where it is needed, so there is no need to compute PWRM separately from OWRM as the present system does.
b. Meeting System Availability Objectives. WARS is also designed to compute requirements to meet aircraft availability objectives stated for different times in the planning scenario. These objectives will be stated separately for each weapon system, so the buy and repair recommendations of WARS can be targeted at specific weapon systems. Thus, the replacement of D041 by WARS will address two of the three identified shortcomings-- fragmentation and nonconsideration of availability.
3-7
CAA-SR-84-12
c. Automated Data Processing Equipment. If AFLC is able to obtain new automated data processing equipment, and to configure the WARS software to take advantage of its capabilities, then WARS also can be made less cumber- some than the present system.
3-4. USE OF OVERVIEW
• ?: Relating Inventory to Performance. The Logistics Concepts Division
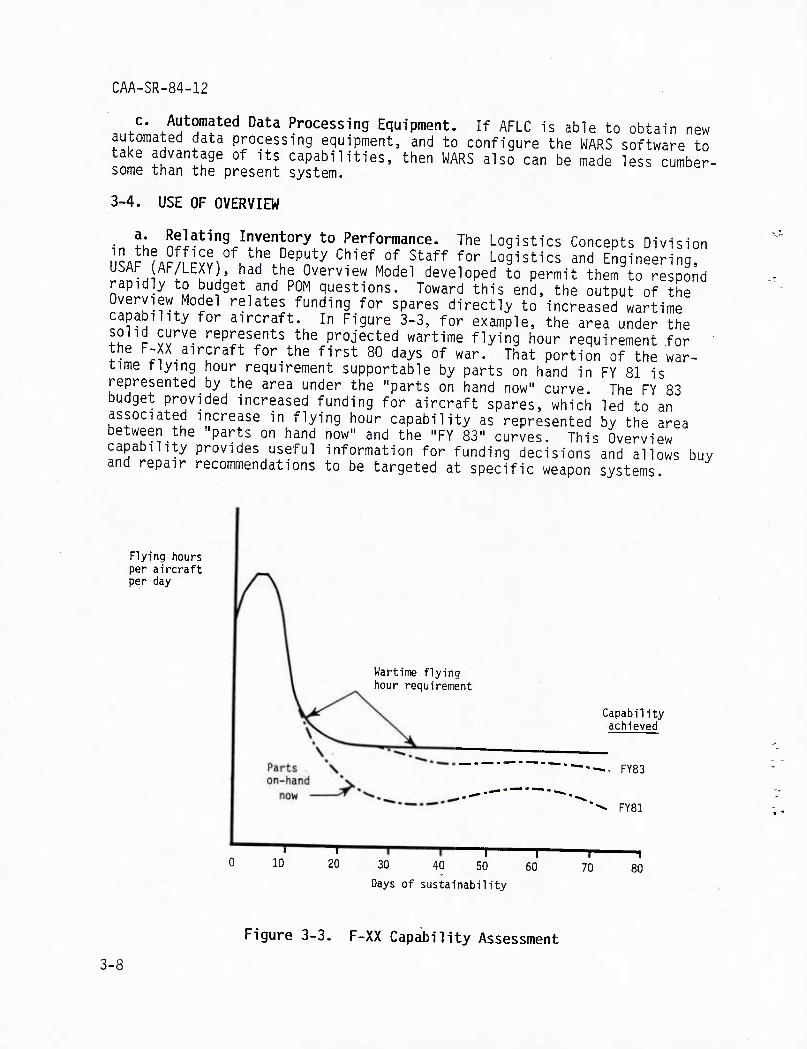
KAP ?A?^f;vv^°^.^5^?^P!^*^ ^^'^^ °^ ^^^^^ ^°^ Logistics and Engineering, USAF AF/LEXY), had the Overview Model developed to permit them to respond rapidly to budget and POM questions. Toward this end, the output of the Overview Model relates funding for spares directly to increased wartime capability for aircraft. In Figure 3-3, for example, the area under the solid curve represents the projected wartime flying hour requirement for ' the F-XX_aircraft for the first 80 days of war. That portion of the war- time flying hour requirement supportable by parts on hand in FY 81 is represented by the area under the "parts on hand now" curve. The FY 83 budget provided increased funding for aircraft spares, which led to an associated increase in flying hour capability as represented by the area between the "parts on hand now" and the "FY 83" curves. This Overview capability provides useful information for funding decisions and allows buy and repair recommendations to be targeted at specific weapon systems
Flying hours per aircraft per day
Wartime flying hour requirement
Capability achieved
■~-. FY83
FY81
I
20 —1 r
30 40 50 60
Days of sustainability
70 80
Figure 3-3. F-XX Capability Assessment
3-8
CAA-SR-84-12
b. Strategic Lift Example. A good example of Air Force use of the Overview Model is found in the generation of sortie rates for strategic lift aircraft. The capability of the Military Airlift Command (MAC) to generate strategic lift sorties at current logistics support levels is estimated jointly by MAC and by HQ USAF using the Overview Model. This estimate of sortie capability is included in the Joint Strategic Capa- bilities Plan, from which it is extracted and used in strategic mobility studies (such as the TRANSMO deployment analysis at CAA).
c. Responsiveness. The Air Force values highly the utility of Overview for quick turnaround spare parts inventory assessment. The short response time of Overview is enhanced by its relationship to the Mechanized Item Requirements Computation System (D041 and D041A) at AFLC. Overview was designed to use the D041 data base for its inputs. Since D041 inputs are collected quarterly by the AFLC, the Air Force has current input data available for Overview.
d. Operation. The Logistics Concepts Division (AF/LEXY) analysis cell does the problem formulation for Overview applications and controls the model's operational variables. The division has been feeding back desired Overview improvements to the developer for implementation, but also works on the model in-house.
e. AF Overview Summary. In summary, the Overview Model enables the Air Force to relate the spare parts inventory to the wartime flying hour requirement for each aircraft system. The Army should be able to use Overview to do the same for its aircraft.
3-9
CAA-SR-84-12
CHAPTER 4
ALTERNATIVE METHODOLOGIES EVALUATION
4-1. INTRODUCTION. This chapter provides a review and evaluation of the models considered as potential methodologies for predicting Army aircraft parts wartime requirements. The goal in selecting candidate models and methodologies was to identify and evaluate all those with potential appli- cation to the problem. Identification of candidate methods was accomplished through a systematic literature search and contacts with logistics experts. Four models developed elsewhere and one model developed in-house were ex- amined. A more detailed discussion of these models is presented in Appendix C.
4-2. MODELS SELECTED, The models selected for examination were (1) Over- view/ARLCAP (Army Logistics Capability), hereafter referred to simply as Overview; (2) PARCOM (Parts Requirements and Cost Model), a study team con- cept; (3) SESAME (Selected Essential-item Stockage for Availability Method); (4) ACIM (Availability Centered Inventory Model); and (5) Dyna-METRIC (Dy- namic Multi-Echelon Technique for Recoverable Item Control). Overview and PARCOM are based on one type of methodology; SESAME, ACIM, and Dyna-METRIC are based on a second.
a. Overview and PARCOM Synopsis. Overview and PARCOM are straight- forward, deterministic, time-stepped simulations in which flyable aircraft attempt to meet a daily flying hour objective. Expected-value part failure rates, based on historical data and stated as a function of flying hours, are applied to flying aircraft to generate part failures. Wholesale part stocks, and failed parts, are processed through pipelines which account for various delay times. The models monitor on a daily basis levels of parts in each status of availability and determine resulting aircraft availability rates and the corresponding ability to meet flying requirements.
b. SESAME, ACIM, and Dyna-METRIC Synopsis. SESAME, ACIM, and Dyna- METRIC are based on an assumed probabilistic distribution for pipeline as- sets. Using logic related to Palm's Theorem,5 the models formulate mathe- matical expressions for the quantities and arrivals of parts in the pipe- lines. Dyna-METRIC differs substantially from SESAME and ACIM in that Dyna- METRIC has generalized its mathematics to account for the dynamic aspects of wartime, to include variable daily flying hours, variable daily attri- tion, and phased deployment of aircraft and parts, while SESAME and ACIM treat these factors as constant.
c. Why Overview? Overview was selected for examination based on: (1) promising past experience with the model in the MAX FLY Study performed by .CAA for ODCSLOG, (2) successful use by USAF, and (3) positive regard from OASD-MRA&L (Office of the Assistant Secretary of Defense for Manp/Dwer, Reserve Affairs, and Logistics).
4-1
CAA-SR-84-12
d. Why PARCOM? PARCOM grew out of an attempt by study team members to independently simulate parts requirements forecasting based on fundamental principles. The PARCOM effort was pursued: (1) as a means for the study team to fully understand the concepts used in determining parts require- ments; (2) as a means of verifying Overview results; and (3) as a way of extending capabilities to cover some perceived Overview limitations.
e. Why SESAME? SESAME was selected because it is an established model developed by the Inventory Research Office (IRO) of the Army Materiel Sys- tems Analysis Activity (AMSAA) for use in initial provisioning, and because it has been used by IRO and the Aviation Systems Command (AVSCOM) in studies of the broad implications of requirements versus availability. In particu- lar, SESAME has been employed for war reserve materiel requirement (WRMR) computations and therefore was considered to be potentially applicable to the problem in question.
f. Why ACIM? ACIM was brought to the study team's attention in a meet- ing with CACI, Inc. personnel, who had developed it to meet the general spares requirements modeling needs of the Navy. ACIM was said to be com- petitive with models like SESAME and Overview and to be superior in its treatment of several logistics system features.
g. Why Dyna-METRIC? Dyna-METRIC was selected because of its known use by the Air Force Logistics Command (AFLC) and other USAF logistics elements for detailed logistics analysis. However, the position of the model devel- oper (Rand Corporation) was that while Dyna-METRIC could be used for war- time spares forecasting, it offered no substantial benefit over Overview. Rand argued that Dyna-METRIC is probably too high a resolution model for use by ODCSLOG management--that a more aggregated approach is required. Furthermore, Rand seemed to prefer a long-term solution in which the whole- sale requirements and execution system is modified to be consistent with the adopted headquarters programing and budgeting system.
4-3. EVALUATION CRITERIA. The models described above, when combined with the existing, in-place processes used by the services to perform their rou- tine peacetime requirements and execution functions, represent the estab- lished methodologies for forecasting parts needs. Overview, PARCOM, SESAME, ACIM, and Dyna-METRIC were examined from the standpoint of how well they might support the determination of wartime needs. They were initially evaluated through comparison of such criteria as their data requirements, labor requirements, modification needs, output usefulness, measures used, assumptions, limitations, perceived value by decisionmakers, and how well they accounted for some key real-world factors such as variations in de- ployment, combat intensity, and attrition. As the evaluation progressed, specific features were seen to be of particular significance. Ultimately, the following set of 16 specific factors evolved and was used for compara- tive evaluation purposes.
a. Multiservice User. This factor refers to the degree to which a model has been accepted for use by various organizations in the Army, Navy
4-2
CM-SR-84-12
and Air Force. This degree of acceptance is considered an indication of the credibility the user community associates with the model.
b. Operational. This factor rates the extent of the model's develop- ment. Is development of the model completed? Has the model been exercised sufficiently to identify and correct mistakes? To what degree is the model written in standard language, and is it transportable to different user's hardware?
c. Fast Running. This factor evaluates the computer time required to run an application with the model.
d. Data Availability. This factor refers to the relative difficulty of obtaining values for the data elements required to describe a problem to the model for the subject applications. Are currently established data collection programs sufficient, or will new ones have to be established in order to implement the model?
e. Variable Flying Hour Program. Flying hour requirements change daily in wartime. Many peacetime logistics models have not simulated such flex- ibility in the flying hour program. This factor measures whether the model allows for direct specification of a variable daily flying hour program.
f. Phased Deployment. This factor recognizes another dynamic parameter in modeling wartime conditions. Does the model allow for direct specifi- cation of a phased schedule of deployment of aircraft units and related ASL and PLL parts stocks throughout the period of the simulated war?
g. Aircraft Attrition. In war, aircraft assets will be lost at variable rates according to enemy capabilities and the intensity of the conflict. This factor asks if the model allows for direct specification of either a variable daily aircraft attrition rate or a variable daily quantity of at- trited aircraft.
h. Availability Goals. Anticipated daily flying hour requirements, when considered with maximum daily flying hours per aircraft and the number of aircraft on hand, dictate a minimum acceptable operational availability rate. It is desirable to achieve higher availability to improve responsive- ness and readiness. This factor addresses whether the model determines parts requirements needed to meet a flying hour target only, or can also attempt to achieve a specified operational availability level.
1. Constrained Budgets. The simplest and most straightforward parts requirement determination calculates what is needed to fully meet the fleet flying hour and availability targets assuming unlimited funding. This fac- tor measures whether the model also provides a capability to determine parts requirements under the additional (and more realistic) constraint of limited funding.
4-3
CAA-SR-84-12
j. Probabilistic Answers. Most factors in the logistics process are variable in nature. Examples are order-ship times, repair times, unit costs, and attrition rates. This factor addresses the degree to which the model represents stochastic aspects of the logistics functions by presenting its results in terms of confidence levels and probabilities of accomplishment.
k. Controlled Substitution. Part substitution becomes a consideration when an aircraft needs a part which is not available in stock, but could be obtained by removal from another inoperative aircraft which is awaiting a different part. The simplest substitution cases to model are the extremes, where either no substitution or full substitution is allowed. It is much more complex to represent partial substitution, where substitution of parts is sometimes allowed and sometimes prohibited (based upon various constraints such as remove-and-replace time, part type, and geographical proximity of the aircraft with the part to the aircraft with the need). This factor measures the extent to which the model plays various policies for part substitution.
1. Documentation. The degree to which a model is documented internally (within the code) and externally contributes to the ease and accuracy of its operation, to the effort required in debugging and enhancing the code, and to the overall credibility of the model as a tool. This factor is a measure of the completeness and quality of documentation.
m. In-house. Is the model up and running on the user agency's computer system, or elsewhere on the same hardware configuration? This factor in- dicates the effort required to install and certify a model as operational. Such an effort can be substantial if a model is not written in standard language, but is tailored to a specific vendor's hardware or some other user's installation.
n. Multi-indenture. Failure of a major assembly (such as an engine) is usually attributable to the failure of one or more of its subassemblies. These subassemblies fail, in turn, because of failure of one or more com- ponents. This factor indicates the extent to which the model represents the interrelationship between these major assemblies, subassemblies, and components and accounts for the associated supply and repair procedures at each of these so-called "levels of indenture."
0. Multiechelon. The Army aviation logistics and maintenance structure consists of three echelons; AVUM, AVIM, and depot. This factor indicates whether the model discretely represents the organizational elements at each echelon.
p. Maintenance. Parts availability is one requirement for achieving flyable aircraft; another is availability of maintenance resources. This factor considers the extent to which the model includes in its calculation the limited personnel and equipment resources associated with maintenance activities.
4-4
CAA-SR-84-12
4-4. DATA REQUIREMENTS
a. Centralized Data Collection. A substantial centralized data collec- tion effort is required on a continuing basis to support whichever models are ultimately selected for use. This effort would probably be implemented best by the establishment of a centralized data base and data collection system. Currently, each commodity command maintains its own CCSS data base for parts it manages. While the data base structures are standardized, the treatment of parts is not. One cannot always trace parts and their per- formance histories to the applicable weapon system. For example, to AVSCOM an end item is indeed an aircraft, but to the Communications-Electronics Command (CECOM) an end item is a radio set. CECOM knows how many demands there are for radio parts, but cannot ascribe those demands to specific aircraft types or even to weapon systems.
b. Collection Difficulties. The collection process which was used to support Overview for the MAX FLY Study, and to support both Overview and PARCOM for this study, was labor intensive, not automated, and did not in- clude adequate quality assurance. Some key data elements are not routinely collected; others are not current.
c. Need for Retail Data. Models which assess aircraft capability as related to parts requirements must have data which describes the supply, stockage, repair, failure, and consumption of parts at the unit (retail) level. DARCOM up until now has not needed to collect this data to fulfill its wholesale mission, as judged by peacetime wholesale performance meas- ures. This retail data would be required if the DARCOM Requirements Deter- mination and Execution System (RDES) were to be reoriented to consider war- time measures of sustainability and mission performance (cumulative flying hours).
4-5. CONCLUSIONS
a. Models Evaluation
(1) Comparison Matrix. Figure 4-1 provides a subjective summary of the evaluation of the five models examined in this study. The figure indi- cates ratings of good (G), fair (F), or poor (P) for each of the five models rated against the 16 evaluation factors. The ratings which are highlighted correspond to evaluation factors considered to be of greater importance than the others. Evaluation factors marked with one asterisk were subjectively felt to be of significance to the study purpose (earliest possible implementation of responsive forecasting of wartime requirements). Those marked with two asterisks were judged of greatest significance.
4-5
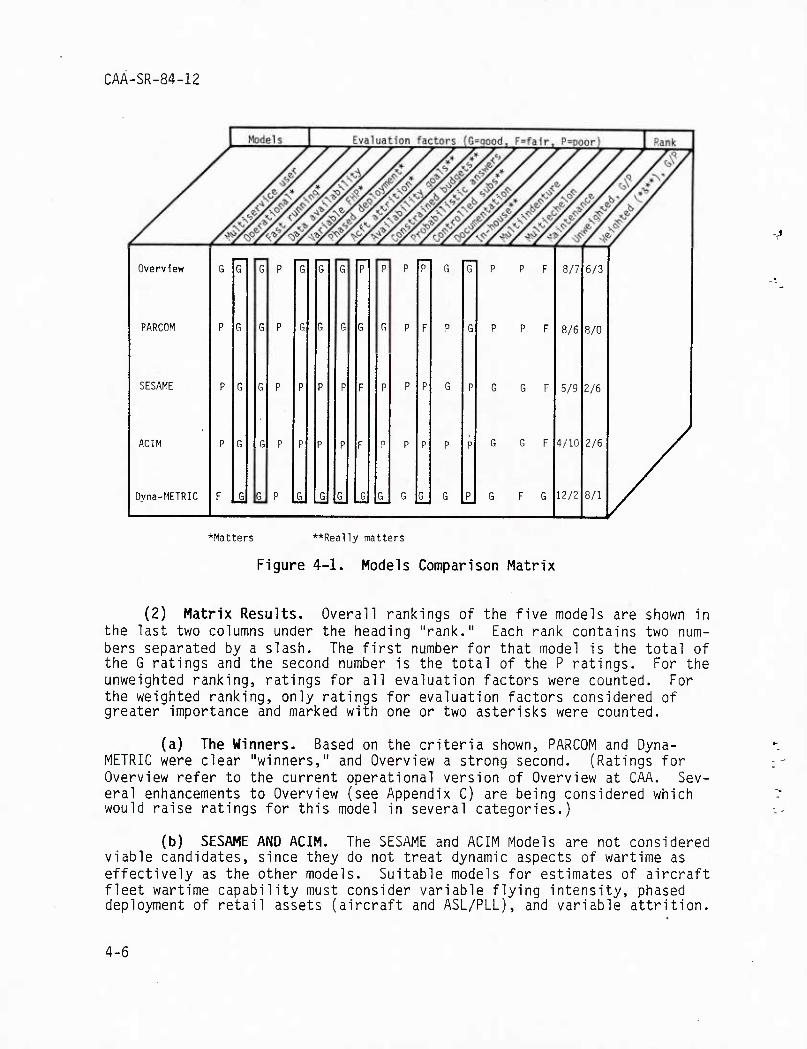
CAA-SR-84-12
Overview
PARCOM
SESAME
ACIM
Dyna-METRIC
G G G P G G G P P P F G G"
P G G P G G G G G P F P G
P G G P P P P F P P P G P
P G G P P P P F n P P P P
F _G G_ P _G _G G_ G_ G_ G G_ G L
8/7
8/6
5/9
4/10
12/2
6/3
8/0
2/6
2/6
8/1
♦Matters **Really matters
Figure 4-1. Models Comparison Matrix
(2) Matrix Results. Overall rankings of the five models are shown in the last two columns under the heading "rank." Each rank contains two num- bers separated by a slash. The first number for that model is the total of the G ratings and the second number is the total of the P ratings. For the unweighted ranking, ratings for all evaluation factors were counted. For the weighted ranking, only ratings for evaluation factors considered of greater importance and marked with one or two asterisks were counted.
(a) The Winners. Based on the criteria shown, PARCOM and Dyna- METRIC were clear "winners," and Overview a strong second. (Ratings for Overview refer to the current operational version of Overview at CAA. Sev- eral enhancements to Overview (see Appendix C) are being considered which would raise ratings for this model in several categories.)
(b) SESAME AND ACIM. The SESAME and ACIM Models are not considered viable candidates, since they do not treat dynamic aspects of wartime as effectively as the other models. Suitable models for estimates of aircraft fleet wartime capability must consider variable flying intensity, phased deployment of retail assets (aircraft and ASL/PLL), and variable attrition.
4-6
1 . CM-SR-84-12
(c) Dyna-METRIC. The Dyna-METRIC Model was assessed as capable of providing more detailed answers to a broader spectrum of questions than does Overview or PARCOM. Study time constraints precluded testing whether the additional promise of Dyna-METRIC is worth its added complexity. A test program is needed to more fully assess: (1) the capability of Dyna- METRIC to do theater-level wartime requirements determination and performance assessment, and (2) the difficulties involved with providing the necessary data and executing the model. However, such testing may only be warranted if the Overview/PARCOM shortfalls are considered critical.
b. Parts Forecasting Methodologies
(1) Detailed Requirements. A major multiyear effort is believed re- quired to establish a process to accurately and in detail relate the fore- casting of spare parts requirements to wartime capability and sustainability. The effort would involve restructuring the current forecasting systems used at the commodity commands which both generate requirements and execute the logistics functions (buy and distribute parts and schedule depot repairs). The DARCOM Requirements Determination and Execution System should be re- oriented to consider wartime sustainablity and mission performance (cumu- lative flying hours) in addition to its current peacetime measures of ef- fectiveness (fill rate and average backorders). The new systems must have direct knowledge of stockage and repair actions down to the unit level.
(2) Rough Estimate Requirements. An immediate solution is available for relating, in an approximate manner, a given inventory and repair re- quirement for existing DARCOM systems to wartime capability. This viable, demonstrated methodology for responsive determination of gross, wartime spare replenishment requirements is the combined use of the Overview Model and the Parts Requirements and Cost Model (PARCOM). Overview and PARCOM can be used to provide quick turnaround (about a day) answers to many pert- inent spares requirement and cost questions (assuming availability of a prepared data base). In this study a set of test questions, typical of those the sponsor might have to address, was posed. As shown in the next chapter. Overview and PARCOM together answered most, though not all, of the questions.
(3) Centralized Modeling Capability. It was a study team perception, peripheral to the study objectives, that the Army needs a centralized com- putation and modeling capability to predict aircraft spares for the POM and to continue methodology improvements. Full-time responsibility should be established there for maintaining, improving, and executing Overview and PARCOM. Work on the models should be ongoing, to improve the models and to uproot errors and inconsistencies in logic and data.
c. Data Requirements
(1) Centralized Collection. A substantial centralized data col- lection effort is required on a continuing basis to support Overview and PARCOM. The collection process used to date was labor intensive, not
4-7
CAA-SR-84-12
automated, and inaccurate in areas. Retail data collection is not adequate. Much essential data is not directly available. Data which is available requires considerable preparation for the models.
(2) Nonflying Hour Demands. Spares forecasting for nonflying hour dependent demands, such as failures due to combat damage, is undefined. Consideration should be given to the need for generating this data and for including it in analyses performed with Overview and PARCOM.
4-8
CAA-SR-84-12
CHAPTER 5
OVERVIEW/PARCOM APPLICATIONS AND TEST
5-1. INTRODUCTION. The basic purpose of the Overview and PARCOM Models adopted for testing in this study is to generate cost effective mixes of add-on spare parts needed to permit an aircraft fleet of specified type to achieve a specified flying program under various cost constraints, part replacement policies, and aircraft availability objectives.
a. Cost Constraints. The two cost constraint modes are:
(1) Unconstrained Funds, where unlimited funds for procurement of additional required parts are assumed available.
(2) Constrained Funds, where a funding limit for add-on spares is set. If unable to meet the flying hour and, possibly, availability ob- jectives with the limited funds, the models should generate a "best" so- lution with the funds available.
b. Part Replacement Policies. The two basic part replacement policies are:*
(1) Full Substitution, where a failed part on an aircraft may be re- placed by either a spare (if available) or by a serviceable part from a "not mission capable" (NMC) aircraft (if a spare is not available).
(2) No Substitution, where a failed part on an aircraft may only be replaced by a spare part.
c. Aircraft Availability Objectives. An aircraft availability objective is a requirement for a specific minimum aircraft availability on each day (different days may have different minimum required availabilities). In this context, aircraft availability = 1 - NMCS, where NMCS = the fraction of surviving aircraft in "not mission capable supply" status. An aircraft is in an NMCS status if it is nonoperational because spare parts are needed but are not available to restore it to serviceability. Specification of availability objectives is in addition to the flying hour objective. Speci- fication of a zero availability objective is equivalent to no objective at all.
*"NMCS = 0" is treated as a third part replacement policy in Appendix D but is really a special case of "no substitution" in which aircraft availa bility is constrained to be 100 percent.
5-1
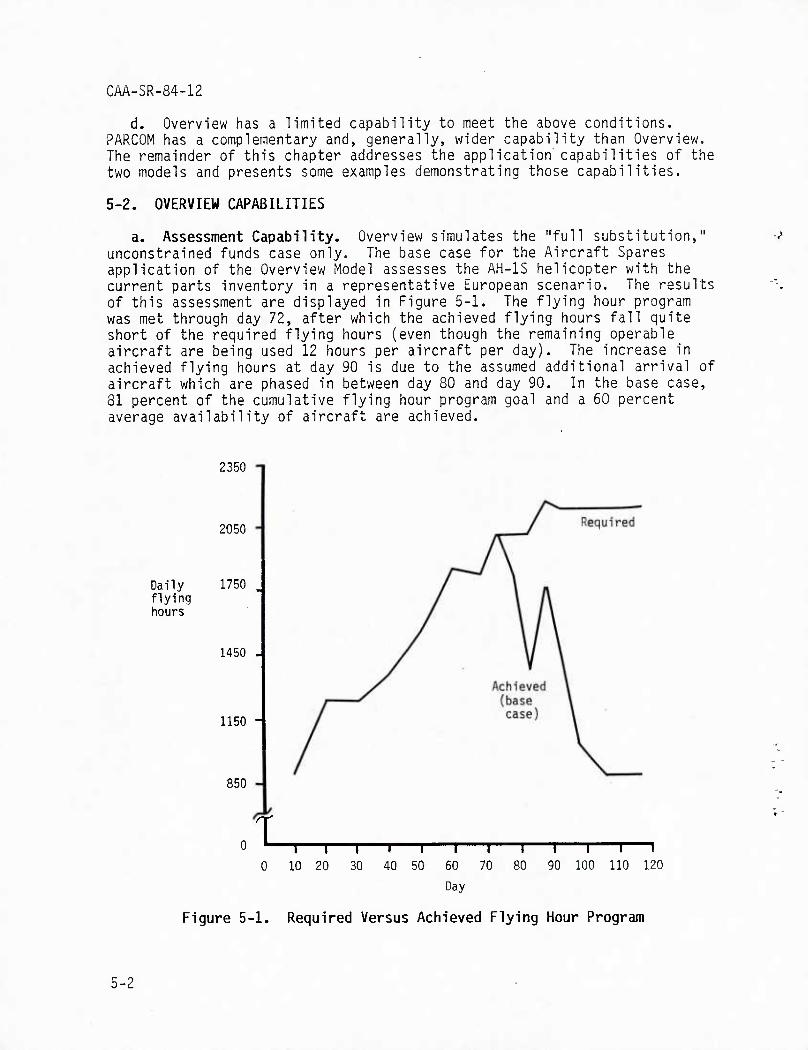
CAA-SR-84-12
d. Overview has a limited capability to meet the above conditions. PARCOM has a complementary and, generally, wider capability than Overview. The remainder of this chapter addresses the application capabilities of the two models and presents some examples demonstrating those capabilities.
5-2. OVERVIEW CAPABILITIES
a. Assessment Capability. Overview simulates the "full substitution," unconstrained funds case only. The base case for the Aircraft Spares application of the Overview Model assesses the AH-IS helicopter with the current parts inventory in a representative European scenario. The results of this assessment are displayed in Figure 5-1. The flying hour program was met through day 72, after which the achieved flying hours fall quite short of the required flying hours (even though the remaining operable aircraft are being used 12 hours per aircraft per day). The increase in achieved flying hours at day 90 is due to the assumed additional arrival of aircraft which are phased in between day 80 and day 90. In the base case, 81 percent of the cumulative flying hour program goal and a 50 percent average availability of aircraft are achieved.
Daily flying hours
2350 T
2050
1750
1450 -
1150 -
850 -
0 t I I I I I I I I I I I I 0 10 20 30 40 50 60 70 80 90 100 110 120
Day
Figure 5-1. Required Versus Achieved Flying Hour Program
5-2
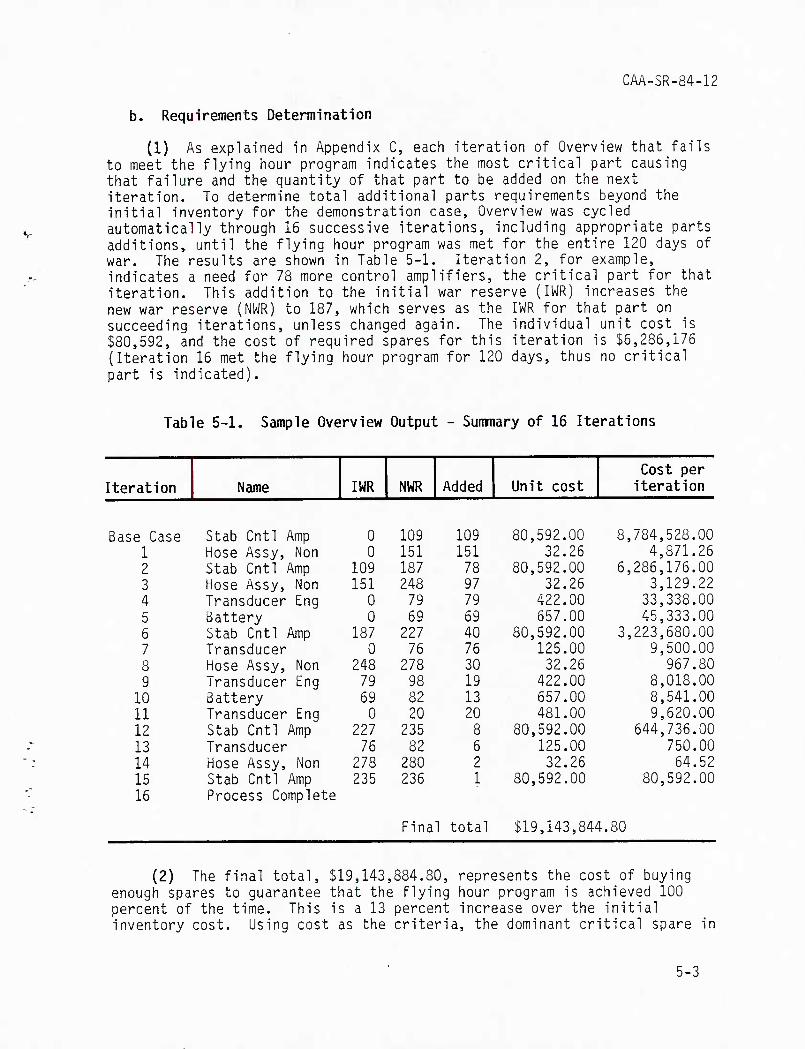
f'.
CAA-SR-84-12
b. Requirements Determination
(1) As explained in Appendix C, each iteration of Overview that fails to meet the flying hour program indicates the most critical part causing that failure and the quantity of that part to be added on the next iteration. To determine total additional parts requirements beyond the initial inventory for the demonstration case, Overview was cycled automatically through 15 successive iterations, including appropriate parts additions, until the flying hour program was met for the entire 120 days of war. The results are shown in Table 5-1. Iteration 2, for example, indicates a need for 78 more control amplifiers, the critical part for that iteration. This addition to the initial war reserve (IWR) increases the new war reserve (NWR) to 187, which serves as the IWR for that part on succeeding iterations, unless changed again. The individual unit cost is $80,592, and the cost of required spares for this iteration is $5,285,176 (Iteration 15 met the flying hour program for 120 days, thus no critical part is indicated).
Table 5-1. Sample Overview Output - Summary of 16 Iterations
Cost per Iteration Name IWR NWR Added Unit cost iteration
Base Case Stab Cntl Amp 0 109 109 80,592.00 8 784,528.00 1 Hose Assy, Non 0 151 151 32.26 4,871.25 2 Stab Cntl Amp 109 187 78 80,592.00 5 286,175.00 3 Hose Assy, Non 151 248 97 32.25 3,129.22 4 Transducer Eng 0 79 79 422.00 33,338.00 5 Battery 0 59 69 557.00 45,333.00 6 Stab Cntl Amp 187 227 40 80,592.00 3 ,223,680.00 7 Transducer 0 75 76 125.00 9,500.00 .8 Hose Assy, Non 248 278 30 32.25 967.80 9 Transducer Eng 79 98 19 422.00 8,018.00
10 • Battery 69 82 13 557.00 8,541.00 11 Transducer Eng 0 20 20 481.00 9,620.00 12 Stab Cntl Amp 227 235 8 80,592.00 644,736.00 13 Transducer 76 32 6 125.00 750.00 14 Hose Assy, Non 278 280 2 32.26 64.52 15 Stab Cntl Amp 235 236 1 80,592.00 80,592.00 16 Process Complete
Fina 1 total $19,143,844.80
(2) The final total, $19,143,884.80, represents the cost of buying enough spares to guarantee that the flying hour program is achieved 100 percent of the time. This is a 13 percent increase over the initial inventory cost. Using cost as the criteria, the dominant critical spare in
5-3
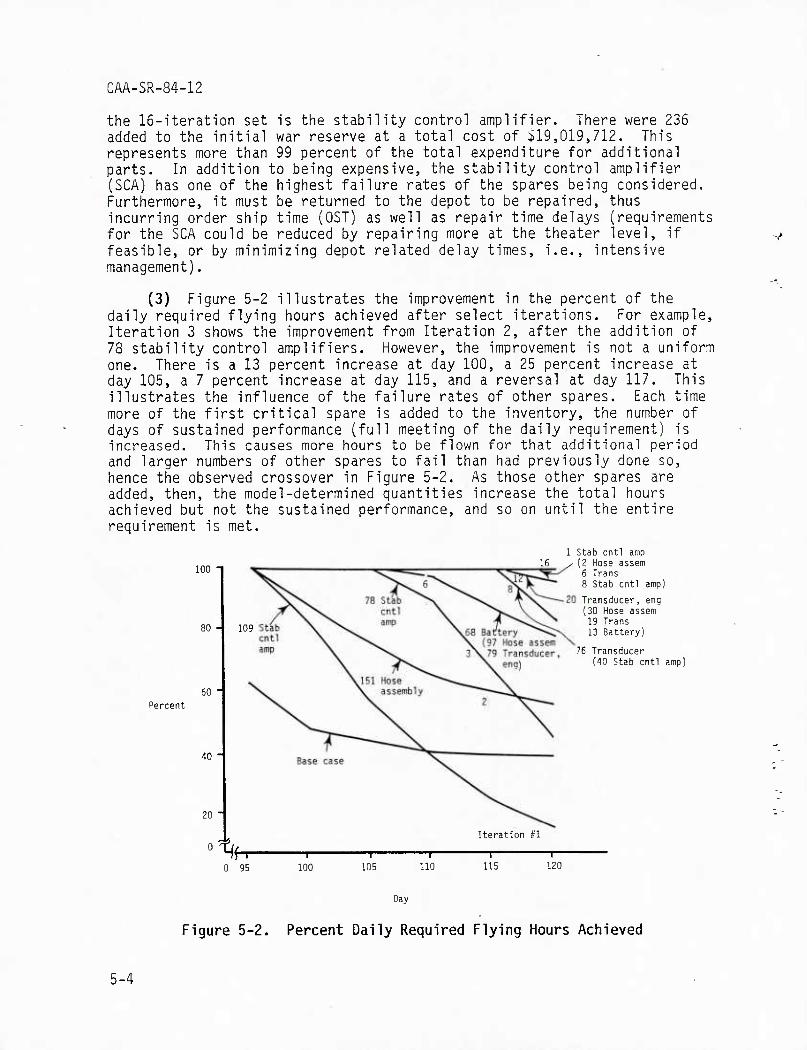
CAA-SR-84-12
the 16-iteration set is the stability control amplifier. There were 236 added to the initial war reserve at a total cost of $19,019,712. This represents more than 99 percent of the total expenditure for additional parts. In addition to being expensive, the stability control amplifier (SCA) has one of the highest failure rates of the spares being considered. Furthermore, it must be returned to the depot to be repaired, thus incurring order ship time (OST) as well as repair time delays (requirements for the SCA could be reduced by repairing more at the theater level, if feasible, or by minimizing depot related delay times, i.e., intensive management).
(3) Figure 5-2 illustrates the improvement in the percent of the daily required flying hours achieved after select iterations. For example. Iteration 3 shows the improvement from Iteration 2, after the addition of 78 stability control amplifiers. However, the improvement is not a uniform one. There is a 13 percent increase at day 100, a 25 percent increase at day 105, a 7 percent increase at day 115, and a reversal at day 117. This illustrates the influence of the failure rates of other spares. Each time more of the first critical spare is added to the inventory, the number of days of sustained performance (full meeting of the daily requirement) is increased. This causes more hours to be flown for that additional period and larger numbers of other spares to fail than had previously done so, hence the observed crossover in Figure 5-2. As those other spares are added, then, the model-determined quantities increase the total hours achieved but not the sustained performance, and so on until the entire requirement is met.
-#
100 n
Percent 60 -
40
109
20
0 ^'r 0 95
—P- 100
1 stab cntl amp 16 / (2 Hose assem
6 Trans 8 Stab cntl amp)
Transducer, eng (30 Hose assem 19 Trans 13 Battery)
76 Transducer (40 Stab cntl amp)
Iteration *1
105 110 115 120
Day
Figure 5-2. Percent Daily Required Flying Hours Achieved
5-4
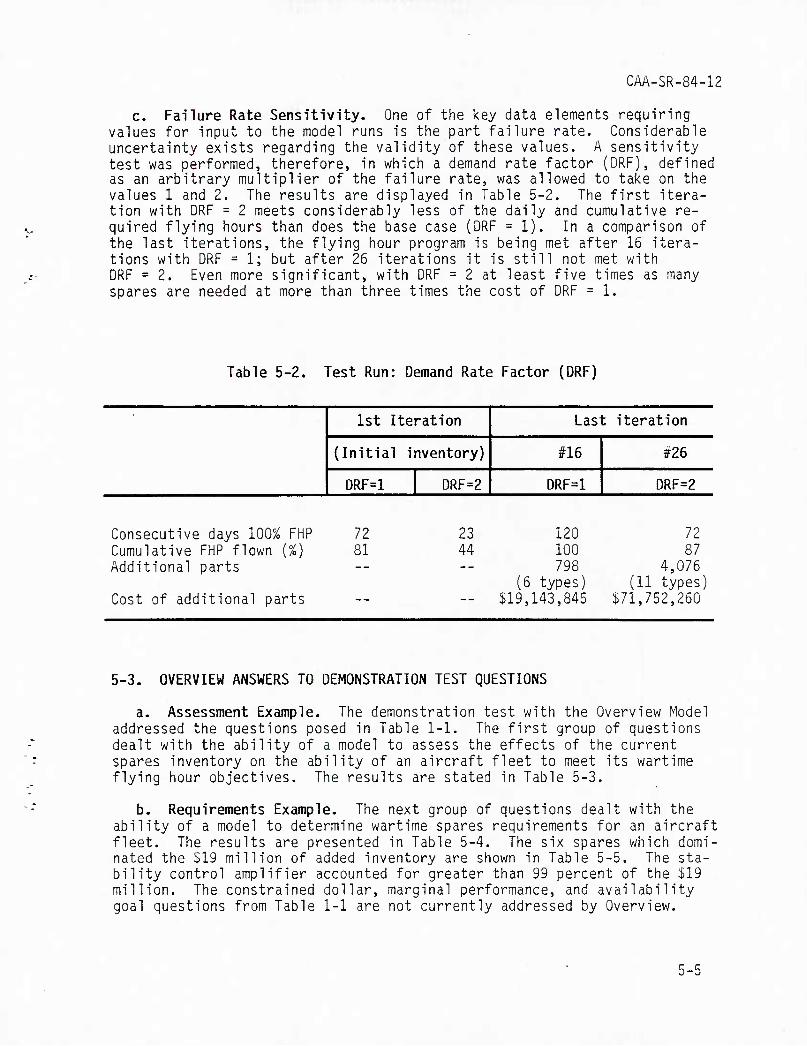
■il. hi ■■■■■ !?■ ■J- ta ;|
CAA-SR-84-12
c. Failure Rate Sensitivity. One of the key data values for input to the model runs is the part failure uncertainty exists regarding the validity of these val test was performed, therefore, in which a demand rate as an arbitrary multiplier of the failure rate, was al values 1 and 2. The results are displayed in Table 5- tion with DRF = 2 meets considerably less of the daily quired flying hours than does the base case (DRF = 1). the last iterations, the flying hour program is being tions with DRF = 1; but after 25 iterations it is stil DRF = 2. Even more significant, with DRF = 2 at least spares are needed at more than three times the cost of
elements requi rate. Consid
ues. A sensit factor (DRF), lowed to take 2. The first and cumulativ In a compari
met after 15 i 1 not met with five times as DRF = 1.
ring erable ivity defined on the itera- e re- son of tera-
many
Table 5-2. Test Run: Demand Rate Factor (DRF)
1st Iteration Last iteration
(Initial inventory) #16 #26
DRF=1 DRF=2 DRF=1 DRF=2
Consecutive days 100% FHP Cumulative FHP flown (%) Additional parts
Cost of additional parts
72 23 120 72 81 44 100 87 — 798 4,076
(5 types) (11 types — -- $19,143,845 $71,752,260
5-3. OVERVIEW ANSWERS TO DEMONSTRATION TEST QUESTIONS
a. Assessment Example. The demonstration test with the Overview Model addressed the questions posed in Table 1-1. The first group of questions dealt with the ability of a model to assess the effects of the current spares inventory on the ability of an aircraft fleet to meet its wartime flying hour objectives. The results are stated in Table 5-3.
b. Requirements Example. The next group of questions dealt with the ability of a model to determine wartime spares requirements for an aircraft fleet. The results are presented in Table 5-4. The six spares which domi- nated the $19 million of added inventory are shown in Table 5-5. The sta- bility control amplifier accounted for greater than 99 percent of the $19 million. The constrained dollar, marginal performance, and availability goal questions from Table 1-1 are not currently addressed by Overview.
5-5
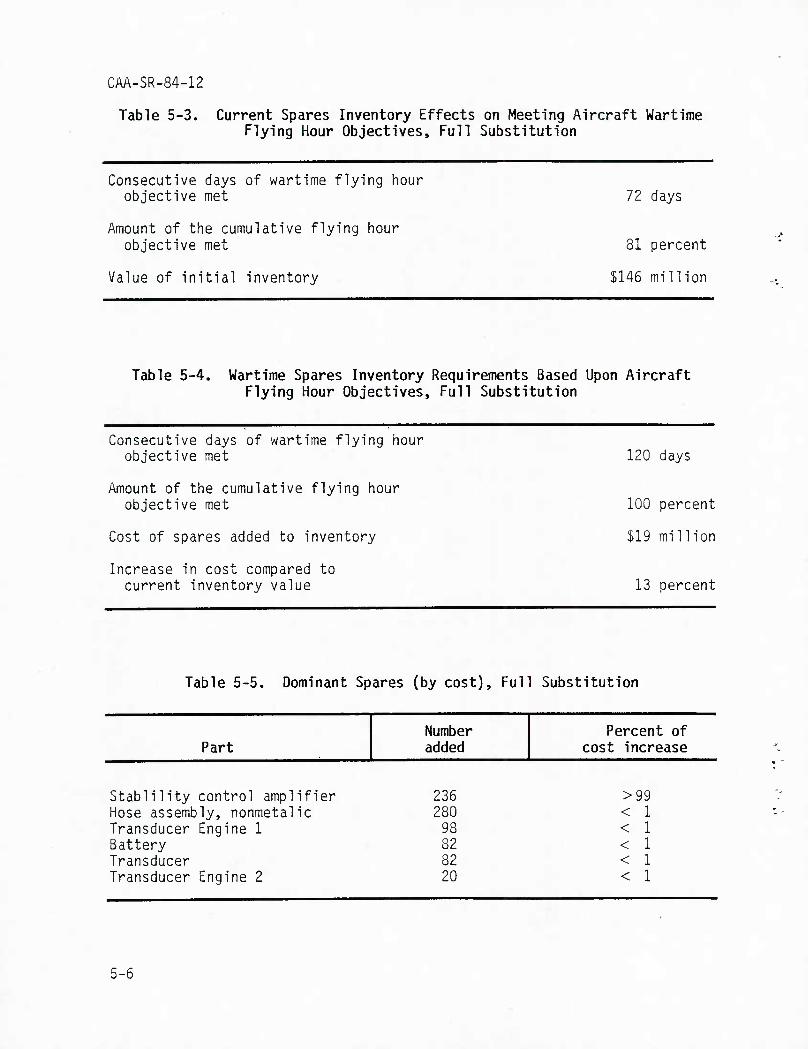
CAA-SR-84-12
Table 5-3. Current Spares Inventory Effects on Meeting Aircraft Wartime Flying Hour Objectives, Full Substitution
Consecutive days of wartime flying hour objective met
Amount of the cumulative flying hour objective met
Value of initial inventory
72 days
81 percent
$146 million
Table 5-4. Wartime Spares Inventory Requirements Based Upon Aircraft Flying Hour Objectives, Full Substitution
Consecutive days of wartime flying hour objective met
Amount of the cumulative flying hour objective met
Cost of spares added to inventory
Increase in cost compared to current inventory value
120 days
100 percent
$19 million
13 percent
Table 5-5. Dominant Spares (by cost). Full Substitution
Number Part added
Stablility control amplifier 236 Hose assembly, nonmetalic 280. Transducer Engine 1 98 Battery 82 Transducer 82. Transducer Engine 2 20
Percent of cost increase
>99 < 1 < 1 < 1 < 1 < 1
5-6
CAA-SR-84-12
5-4. OVERVIEW SUMMARY/OBSERVATIONS
a. The Overview Model uses only 22 seconds of CPU time per iteration. The total time, including all possible output, is about 3 minutes per iter- ation. The model handles aircraft deployment schedules, attrition, and variable flying hour programs. Thus the model provides a quick solution to the question of what spares should be purchased to achieve the FHP goals for all 120 days of war.
b. Overview's approach to "full substitution" limits the interpretations of its intermediate results. It would be incorrect, for example, to buy half of all the spares in the 120-day solution in order to provide an answer for the first 60 days of war. The Overview solution pertains only to an unconstrained cost criterion for the full period considered--120 days.
c. For each iteration. Overview identifies a single, critical spare part. For the next iteration the model "buys" the indicated number of the critical spare part regardless of its cost. Also, the model is very sensitive to the quality of the input data. For example, the results are "driven" by the failure rates (demand rates) which are input for each spare part.
d. The Overview Model estimates the flying hour capability of the Army's helicopters for a given inventory of spare parts. It simulates the "full substitution" case and assumes unlimited funds. It does not, however, ad- dress the cases of "no substitution" or constrained funds. These cases, and others, are addressed by the PARCOM Model.
5-5. PARCOM CAPABILITIES
a. Assessment Capability. Given a specified wartime flying hour program objective, PARCOM can assess the number of consecutive (from D-day) days of 100 percent flying program achievement and the fraction of the cumulative program hours achievable with any starting inventory and a "no substitution" replacement policy (Assessment Case 1). It can also assess consecutive days of 100 percent achievement for a "full substitution" policy, but not the fraction of the program achieved (Assessment Case 2). Case 1 is discus- sed in this chapter.
b. Requirements Determination
(1) General. Table 5-6 shows the key attributes which define require- ments cases. The "X" entries under "requirement attributes" denote the simultaneous assignment of conditions for each case. An "X" in the "feasible' column indicates that the current PARCOM can process that case. A blank indicates infeasibility, as is the case for all "full substitution" con- strained funds combinations. The entry in the last column indicates a re- quirements case number for demonstration/example cases which were completed and are described in either this chapter (Cases 1 and 5) or in Appendix D.
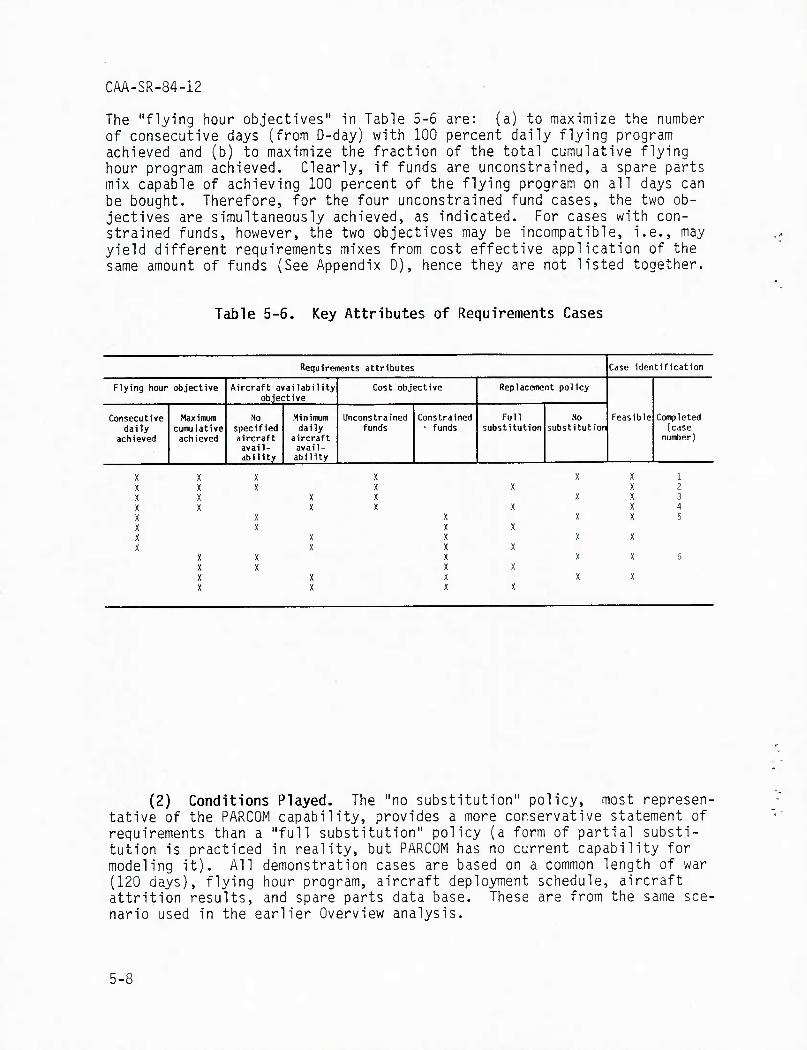
CAA-SR-84-12
The "flying hour objectives" in Table 5-6 are: (a) to maximize the number of consecutive days (from D-day) with 100 percent daily flying program achieved and (b) to maximize the fraction of the total cumulative flying hour program achieved. Clearly, if funds are unconstrained, a spare parts mix capable of achieving 100 percent of the flying program on all days can be bought. Therefore, for the four unconstrained fund cases, the two ob- jectives are simultaneously achieved, as indicated. For cases with con- strained funds, however, the two objectives may be incompatible, i.e., may yield different requirements mixes from cost effective application of the same amount of funds (See Appendix D), hence they are not listed together.
Table 5-6. Key Attributes of Requirements Cases
Requirements attributes Case identification
Flying hour objective Aircraft availability objective
Cost objective Replacement policy
Feasible Consecutive Maximum No Minimum Unconstrained Constrained Full No Completed daily cumulative specified daily funds - funds substitution substitution (case
achieved achieved aircraft avail- ability
aircraft avail- ab i1i ty
number)
X X X X X X 1 X X X X X X 2 X X X X . X X 3 X X X X X X 4 X X X X X 5 X X X X X X X X X X X X X
X X X X X 6 X X X X X X X X X X • X X X
(2) Conditions Played. The "no substitution" policy, most represen- tative of the PARCOM capability, provides a more conservative statement of requirements than a "full substitution" policy (a form of partial substi- tution is practiced in reality, but PARCOM has no current capability for modeling it). All demonstration cases are based on a common length of war (120 days), flying hour program, aircraft deployment schedule, aircraft attrition results, and spare parts data base. These are from the same sce- nario used in the earlier Overview analysis.
5-8
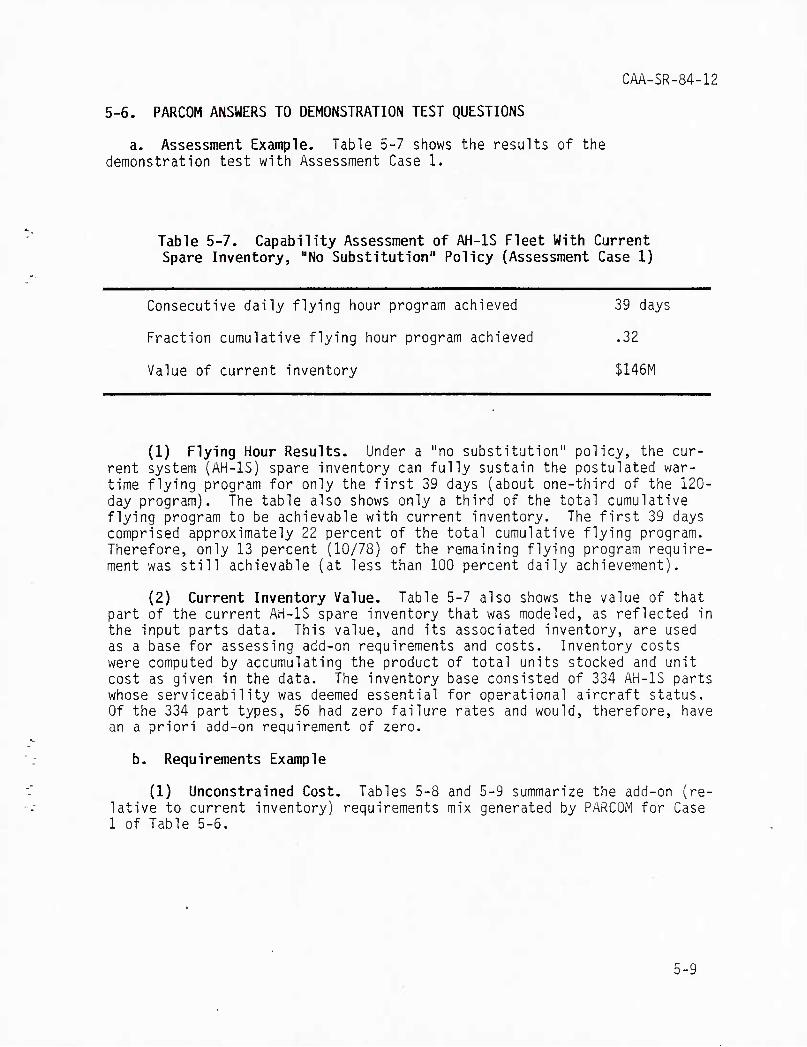
CAA-SR-84-12
5-6. PARCOM ANSWERS TO DEMONSTRATION TEST QUESTIONS
a. Assessment Example. Table 5-7 shows the results of the demonstration test with Assessment Case 1.
Table 5-7. Capability Assessment of AH-IS Fleet With Current Spare Inventory, "No Substitution" Policy (Assessment Case 1)
Consecutive daily flying hour program achieved 39 days
Fraction cumulative flying hour program achieved .32
Value of current inventory $145M
(1) Flying Hour Results. Under a "no substitution" policy, the cur- rent system (AH-IS) spare inventory can fully sustain the postulated war- time flying program for only the first 39 days (about one-third of the 120- day program). The table also shows only a third of the total cumulative flying program to be achievable with current inventory. The first 39 days comprised approximately 22 percent of the total cumulative flying program. Therefore, only 13 percent (10/78) of the remaining flying program require- ment was still achievable (at less than 100 percent daily achievement).
(2) Current Inventory Value. Table 5-7 also shows the value of that part of the current AH-IS spare inventory that was modeled, as reflected in the input parts data. This value, and its associated inventory, are used as a base for assessing add-on requirements and costs. Inventory costs were computed by accumulating the product of total units stocked and unit cost as given in the data. The inventory base consisted of 334 AH-IS parts whose serviceability was deemed essential for operational aircraft status. Of the 334 part types, 56 had zero failure rates and would, therefore, have an a priori add-on requirement of zero.
b. Requirements Example
(1) Unconstrained Cost. Tables 5-8 and 5-9 summarize the add-on (re- lative to current inventory) requirements mix generated by PARCOM for Case 1 of Table 5-5.
5-9
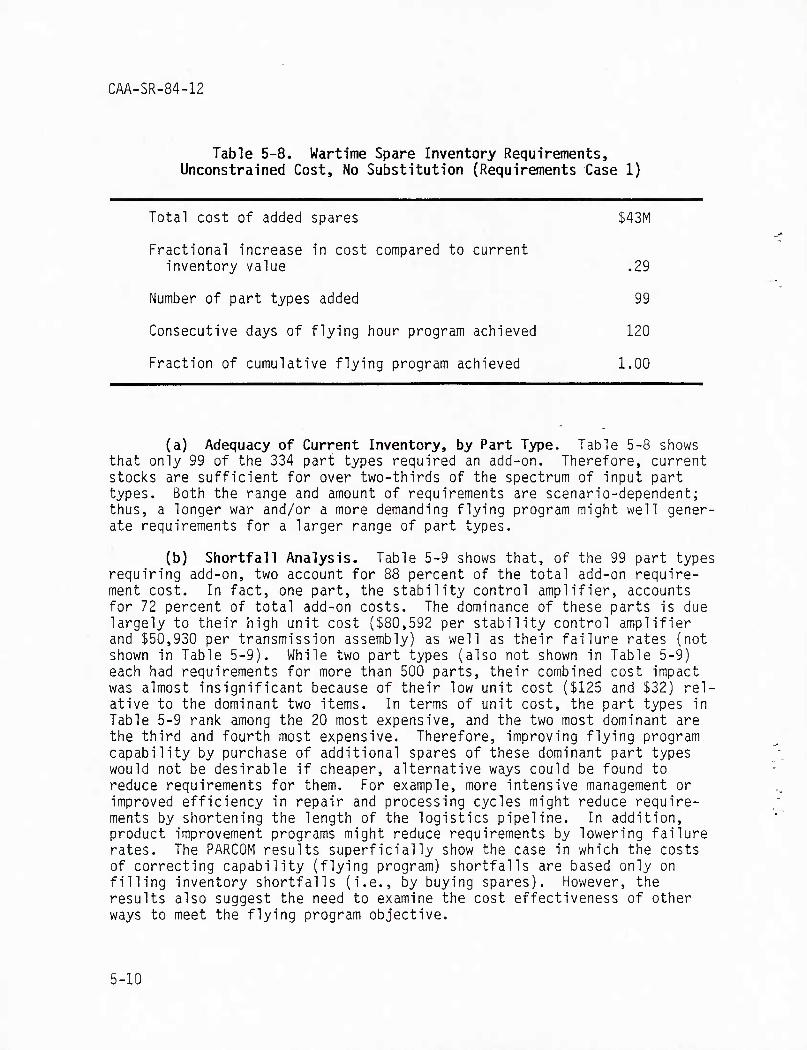
CAA-SR-84-12
Table 5-8. Wartime Spare Inventory Requirements, Unconstrained Cost, No Substitution (Requirements Case 1)
Total cost of added spares $43M
Fractional increase in cost compared to current inventory value .29
Number of part types added 99
Consecutive days of flying hour program achieved 120
Fraction of cumulative flying program achieved 1.00
(a) Adequacy of Current Inventory, by Part Type. Table 5-8 shows that only 99 of the 334 part types required an add-on. Therefore, current stocks are sufficient for over two-thirds of the spectrum of input part types. Both the range and amount of requirements are scenario-dependent; thus, a longer war and/or a more demanding flying program might well gener- ate requirements for a larger range of part types.
(b) Shortfall Analysis. Table 5-9 shows that, of the 99 part types requiring add-on, two account for 88 percent of the total add-on require- ment cost. In fact, one part, the stability control amplifier, accounts for 72 percent of total add-on costs. The dominance of these parts is due largely to their high unit cost ($80,592 per stability control amplifier and $50,930 per transmission assembly) as well as their failure rates (not shown in Table 5-9). While two part types (also not shown in Table 5-9) each had requirements for more than 500 parts, their combined cost impact was almost insignificant because of their low unit cost ($125 and $32) rel- ative to the dominant two items. In terms of unit cost, the part types in Table 5-9 rank among the 20 most expensive, and the two most dominant are the third and fourth most expensive. Therefore, improving flying program capability by purchase of additional spares of these dominant part types would not be desirable if cheaper, alternative ways could be found to reduce requirements for them. For example, more intensive management or improved efficiency in repair and processing cycles might reduce require- ments by shortening the length of the logistics pipeline. In addition, product improvement programs might reduce requirements by lowering failure rates. The PARCOM results superficially show the case in which the costs of correcting capability (flying program) shortfalls are based only on filling inventory shortfalls (i.e., by buying spares). However, the results also suggest the need to examine the cost effectiveness of other ways to meet the flying program objective.
5-10
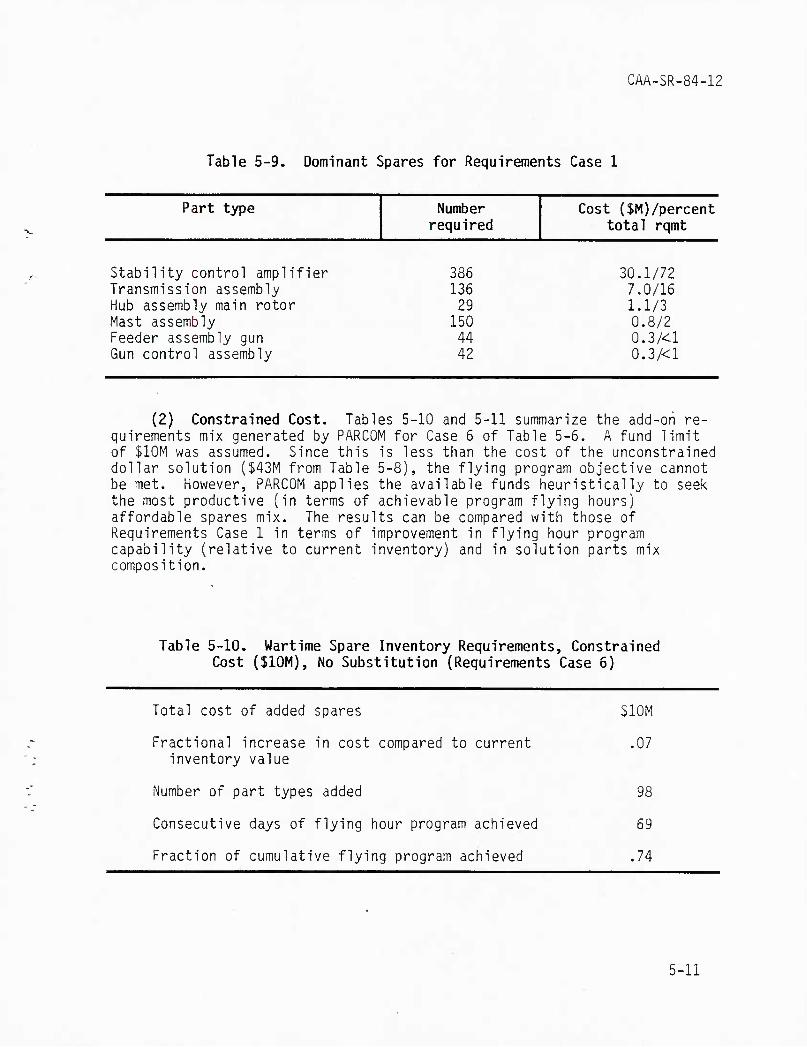
CAA-SR-84-12
Table 5-9. Dominant Spares for Requirements Case 1
Part type Number Cost ($M)/percent required total rqmt
386 30.1/72 136 7.0/15 29 1.1/3
150 0.8/2 44 0.3/<l 42 0.3/<l
Stability control amplifier Transmission assembly Hub assembly main rotor Mast assembly Feeder assembly gun Gun control assembly
(2) Constrained Cost. Tables 5-10 and 5-11 summarize the add-on re- quirements mix generated by PARCOM for Case 5 of Table 5-6. A fund limit of SIOM was assumed. Since this is less than the cost of the unconstrained dollar solution ($43M from Table 5-8), the flying program objective cannot be met. However, PARCOM applies the available funds heuristically to seek the most productive (in terms of achievable program flying hours) affordable spares mix. The results can be compared with those of Requirements Case 1 in terms of improvement in flying hour program capability (relative to current inventory) and in solution parts mix composition.
Table 5-10. Wartime Spare Inventory Requirements, Constrained Cost ($10M), No Substitution (Requirements Case 6)
Total cost of added spares
Fractional increase in cost compared to current inventory value
Number of part types added
Consecutive days of flying hour program achieved
Fraction of cumulative flying program achieved
SIOM
.07
98
69
.74
5-11
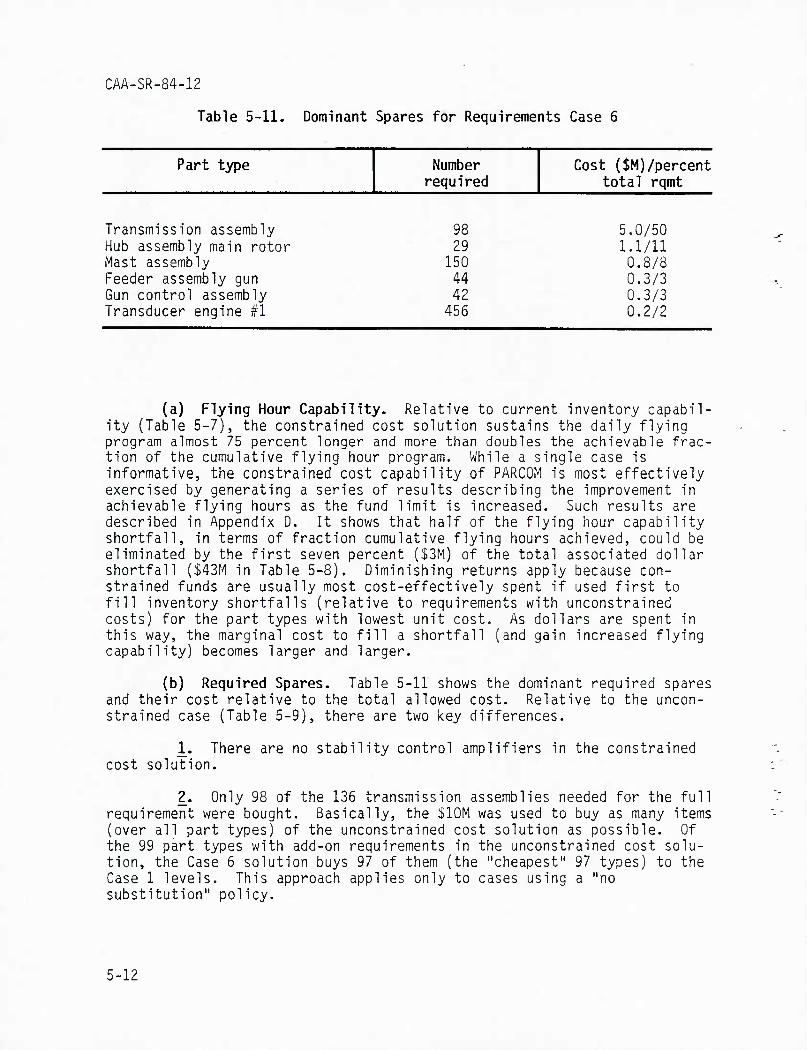
CAA-SR-84-12
Table 5-11. Dominant Spares for Requirements Case 6
Part type Number Cost ($M)/percent required total rqmt
98 5.0/50 29 1.1/11
150 0.8/8 44 0.3/3 42 0.3/3
456 0.2/2
Transmission assembly Hub assembly main rotor Mast assembly Feeder assembly gun Gun control assembly Transducer engine #1
(a) Flying Hour Capability. Relative to current inventory capabil- ity (Table 5-7), the constrained cost solution sustains the daily flying program almost 75 percent longer and more than doubles the achievable frac- tion of the cumulative flying hour program. While a single case is informative, the constrained cost capability of PARCOM is most effectively exercised by generating a series of results describing the improvement in achievable flying hours as the fund limit is increased. Such results are described in Appendix D. It shows that half of the flying hour capability shortfall, in terms of fraction cumulative flying hours achieved, could be eliminated by the first seven percent ($3M) of the total associated dollar shortfall ($43M in Table 5-8). Diminishing returns apply because con- strained funds are usually most cost-effectively spent if used first to fill inventory shortfalls (relative to requirements with unconstrained costs) for the part types with lowest unit cost. As dollars are spent in this way, the marginal cost to fill a shortfall (and gain increased flying capability) becomes larger and larger.
(b) Required Spares. Table 5-11 shows the dominant required spares and their cost relative to the total allowed cost. Relative to the uncon- strained case (Table 5-9), there are two key differences.
1_. There are no stability control amplifiers in the constrained cost solution.
2. Only 98 of the 136 transmission assemblies needed for the full requirement were bought. Basically, the SIOM was used to buy as many items (over all part types) of the unconstrained cost solution as possible. Of the 99 part types with add-on requirements in the unconstrained cost solu- tion, the Case 5 solution buys 97 of them (the "cheapest" 97 types) to the Case 1 levels. This approach applies only to cases using a "no substitution" policy.
5-12
CAA-SR-84-12
(c) Shortfall Analysis. PARCOM, in the constrained cost mode, could be used to compare improvements in flying hour program capability from applying a fixed number of dollars, C, to "pipeline/failure rate improvement" as opposed to "buying spares." The capability with a qualitatively improved current inventory would be compared to the capability resulting from the constrained cost solution obtained by using the C dollars to efficiently "buy spares."
5-7. PARCOM SUMMARY/OBSERVATIONS
a. Potential for Comparative Analyses. The preceding demonstration test questions and answers illustrate specific application cases. In a general sense, the solution mixes generated by PARCOM should not be treated as literal "shopping lists" for spares purchases, but as tools for guiding the logistics budget planner to potential problem areas. In terms of com- parative analyses, PARCOM output, as demonstrated above, includes:
(1) Analysis of Inventory Shortfalls. PARCOM can assess spares inventory shortfalls relative to (least cost) levels needed to achieve a specified flying hour program (with a specified minimum aircraft availability). The magnitude'of add-on requirement costs and amounts for individual part types indicates problem areas where current inventory falls short of requirements. Also, analysis of the relative requirements for different part types can reveal components for which product improvement programs can have a high payoff in terms of "saved" spares investment dollars. Related improvement programs could include reductions in item failure rates and/or repair cycle time.
(2) Analysis of Cost Versus Capability. For a "no substitution" part replacement policy, PARCOM can determine the "best" buyable capability (in terms of program flying hours) which can be obtained from expenditure of a specified amount of budget dollars for add-on spares. Evaluation of parts requirements lists associated with a given budget amount can guide a planner to the subset of part types which will yield especially high returns per dollars invested.
(3) Analysis of Sustainability Costs. As a side product, PARCOM de- termines the (least) add-on spares cost to sustain a flying program through any day of the war. The number of days sustainable (i.e., 100 percent flying program) by current inventory is equal to the maximum number of days for which sustainability cost is zero.
b. Caveats and Limitations. The principal caveats and limitations on the PARCOM Model, as applied in the study, are noted below. Program modification and/or restructuring is required to extend model capabilities beyond the cited limits. Each limitation will be briefly discussed or defined.
(1) Number of Part Types Processed. The PARCOM Model version demon- strated herein can process at most 300 different part types. Structured modification of the program can significantly increase this capacity.
5-13
CAA-SR-84-12
(2) No "Partial Substitution". PARCOM currently processes only "full substitution," "no substitution," and "NCMCS = 0" policies. There is no definitive logic yet for a "partial substitution" policy. In light of underlying data and process uncertainties, the bounds of costs and amounts reflected in the "no substitution" and "full substitution" solutions may well be sufficient.
(3) No "Full Substitution" Constrained Cost Solution. Additional programing effort might enable a "full substitution" constrained cost solu- tion. However, methodological complications/complexities may restrict the degree of optimality (best buy for the dollar) obtained.
(4) Only Two Centralized Supply Levels. PARCOM shares the Overview Model "world view" of a retail level and a wholesale level. Each level has full cross-leveling (lateral transferability of parts).
(5) No Indenture Levels. Part types in the PARCOM (and Overview) data base are non-overlapping modular units, i.e., no part is a subcomponent of another listed part type. Therefore, the failures and repair of parts are independent of each other. Use of indentured data is not processable in PARCOM.
(6) No Direct Maintenance Modeling. As with Overview, PARCOM treats maintenance only indirectly, by incorporation in the repair time or by using an aircraft deployment/attrition data base which is adjusted for aircraft down ("lost") due to maintenance constraints. Such adjustments could be based on results of a separate high resolution simulation model (e.g., TARMS) which previously processed a "slice" of the scenario.
(7) No Stochastic Results. All PARCOM results are "expected value." Neither input nor results have variable probabilistic aspects (e.g., confidence levels). Safety levels would have to be treated separately as an addon to PARCOM quantities. However, use of expected values is meaningful for comparisons and parametric evaluations. Methodology for incorporating stochastic considerations into PARCOM would be complex. Conversion of the model into a stochastic simulation could entail high risk for an uncertain payoff.
5-14
CAA-SR-84-12
CHAPTER 6
FINDINGS AND RECOMMENDATIONS
6-1. GENERAL
a. Purpose. The Aircraft Spares Study was conducted to provide ODCSLOG with an analytical tool for estimating wartime spares requirements and costs for use in POM development, and for responsively (within about a day) answering related questions. The desired methodology was to relate spares requirements to combat flying hour and aircraft availability objectives, subject to least-cost or specified cost constraints.
b. Approach. Meeting the study purpose entailed a straightforward ap- proach, from examination of current methodologies, to identification of new or improved methodologies, to selection and demonstration testing of the preferred methods. Both Army and Air Force current methodologies were re- viewed. Several models--Overview, SESAME, ACIM, and Dyna-METRIC--were de- termined to have possible applicability. Need was also seen, and the requirement met, for developing an additional model,- PARCOM, in house. Having been designed primarily for capability assessment. Overview was modified to accomplish automated requirements determination. PARCOM was designed both to validate Overview and to address some of the latter's limitations for modeling "no substitution" and constrained cost problems. All five models were evaluated, and two--Overview and PARCOM--subjected to demonstration tests. The findings of the study are set forth in paragraph 6-2 and the recommendations in paragraph 6-3.
6-2. FINDINGS
a. Current Methodologies
(1) Many models and computer-assisted methodologies contribute to the spares determination processes of the services. .
(2) Some key questions that influence the selection of a spares re- quirements methodology are whether the requirements to be determined are principally for peacetime or war, initial provisioning or replenishment, fill-rate goals or systems availability goals, retail or wholesale levels, and planning or procurement purposes.
(3) Current Army spares methodology lacks quick response capability for estimating funding effects on readiness and sustainability and does not address weapons system availability objectives (except, recently, for ap- plication of the SESAME Model to initial provisioning and combat ASL/PLL levels).
6-1
CM-SR-84-12
(4) The Air Force spares forecasting methodology suffers similar shortcomings (cumbersome, fragmented, and fill-rate based) to those of the Army. While the Air Force is undertaking fixes to address these problems, when rapid response is required to answer program and budget questions. Overview is used.
b. Alternative Methodologies
(1) Models Selected - Overview and PARCOM
(a) General. A viable, demonstrated methodology for responsive determination of gross, wartime spare replenishment requirements is the combined usage of the Overview and PARCOM Models (Overview was developed on contract for the Air Force, modified by the contractor for the Army's MAX FLY Study, and then modified further, by CAA, for this study. PARCOM was developed by CAA for this study). Overview and PARCOM can be used to provide quick turnaround (about a day) answers to many pertinent spares requirement and cost questions, assuming availability of a prepared data base. In this study a set of test questions, typical of those the sponsor might have to address, was posed. Overview and PARCOM together satisfac- torily answered most, though not all, of the questions.
(b) Overview and PARCOM Capabilities
1. Assessment Mode. Both models yield flying hour and avail- ability achieved; Overview for "full substitution" and PARCOM for "no substitution." PARCOM can also assess days of FHP sustainability for "full substitution."
2. Requirements Mode
a. Both models determine wartime parts and costs required, and associated fleet availability, to meet a theater flying hour objective. PARCOM does it for all three replacement policies ("full substitution," "no substitution," and "NMCS = 0"), Overview for "full substitution" only. Overview and PARCOM both do it for specified aircraft arrivals and for variable attrition. PARCOM assumes all parts are in theater at the beginning of the war. Overview schedules parts arrival over time. With expected aircraft deployment schedules and inventories, this difference is less likely to affect "full substitution" simulation results than "no substitution" results (where days of sustainability with current inventory is much less than with "full substitution").
b. Only PARCOM provides parts requirements for constrained funding cases; however, it does so for "no substitution" only. Both models may be used manually to give good, but probably not optimum, mixes for constrained funding, "full substitution" cases.
^
6-2
CAA-SR-84-12
(c) Overview and PARCOM Limitations
1. Overview does not treat constrained funding problems, "no" or "partial substitution" parts replacement policies, or system availability goals.
2. PARCOM does not address constrained funding problems for "full substitution" nor does it address "partial substitution" policies. While operable at CAA, PARCOM needs more documentation to allow its transfer to another site.
3. Neither model can represent more than two levels of stockage and repair nor more than one level of indenture. The models cannot directly represent the effects of queuing associated with maintenance surges and maintenance personnel shortages. Also, they are not designed to address parts demands generated by factors other than flying hour-associated failure rates. Neither model treats chance variations and associated confidence and safety levels. Both models produce "expected value" results.
(2) Models Not Selected - SESAME, ACIM, and Dyna-METRIC
(a) SESAME and ACIM do not directly address variable flying hour requirements, phased deployment of aircraft and spares, and aircraft attri- tion. They were therefore judged less appropriate for wartime spares fore- casting than the other models considered.
(b) Dyna-METRIC appears capable of more detailed answers to a broader spectrum of questions than Overview and PARCOM, but may also have problems with theater level representation. Testing Dyna-METRIC would permit a more definitive evaluation, but is only warranted if the Overview/PARCOM shortfalls are deemed critical by the sponsor. The study team does not view these limitations as critical to the study's purpose.
(3) Data Problems. Retail data collection is not adequate to support wartime spares forecasting methodologies based on flying hour and readiness requirements. The data collection process is labor Intensive and slow, and the results are of questionable accuracy. Much essential data is unavailable. The available data requires considerable reformatting for modeling. Also, a better understanding of, and sources for, failure data not related to flying hours (for example, combat damage data) is required.
c. Parts Replacement Policies
(1) Overview and PARCOM together address the bounding conditions of parts requirements determinat1on--"fuH" and "no substitution." "Full sub- stitution" Is an optimistic policy, especially when applied as If the theater had a single pot of aircraft and parts. Those parts for which a requirement
5-3
CAA-SR-84-12
is indicated under this assumption are indeed critically short and the rea- sons for those shortages should be addressed. "No substitution" is a con- servative, worst case replacement policy. It assumes that parts must always be purchased to satisfy shortfalls and may never be removed from another, inoperable aircraft. While neither of the above models addresses safety levels, the "no substitution" policy provides a safety level of sorts, since some substitution will usually take place.
(2) Under a "no substitution" policy, the demonstration tests showed an. initial small expenditure on spares to yield substantial FHP improvement. This is because the cheapest parts are purchased first, and each purchased part (of any type) prevents an aircraft from being NMCS due to a lack of that part.
(3) For "full substitution," the most critical part (the one causing the most aircraft down) must be purchased first, no matter what its cost, until it and another part become equally critical. Then both are bought until another part joins that category (or until funds run out), and so forth. With any current inventory, "full substitution" starts from a higher performance base (days of FHP sustainability or cumulative FHP achievement) than does "no substutition," but usually improves less rapidly with expend- itures since the cheapest parts are not necessarily bought first, and several parts may be required to prevent an aircraft from becoming NMCS.
(4) As the availability requirement approaches 1.0 (NMCS = 0), "full" and "no substitution" requirements become equal, since the "full substitu- tion" pool of NMCS aircraft from which parts may be drawn approaches zero.
d. Other Findings. Not central to achievement of the study purpose, but still of interest, were the following:
(1) In the test cases run, it was noted that parts required to meet wartime FHP were high demand rate parts sent back to depot for repair. Order/ship and repair times at depot were key problems. Requirements for these parts would be reduced by fixing more of them in theater, if practic- able, or by cutting depot delay times through, say, intensive management.
(2) Aircraft availability goals are not as useful for determining spare requirements for war as they are for peace. Relatively constant in peace, availability is dynamic in war, depending on flying hour requirements, attrition, and parts and aircraft deployment schedules. Wartime spares forecasting should be based on predicted mission requirements for specified numbers of flyable aircraft and not on aircraft availability, since, then, the on-hand aircraft must also be known.
6-4
CM-SR-84-12
6-3. RECOfWENDATIONS. In consideration of the reported findings, it is recommended that:
a. ODCSLOG implement Overview now to provide quick reaction aircraft spares stockage assessment and requirements forecasting for wartime.
b. CAA fully document PARCOM and assure its transportability to allow its earliest possible use along with Overview.
c. ODCSLOG assign an organization responsibility for improving, main- taining, and operating Overview and PARCOM, to include:
(1) Uprooting errors and inconsistencies in logic and data.
(2) Eliminating key shortfalls.
d. The Army establish a centralized data base and collection system to provide timely and accurate data for the selected methodologies.
5-5
CAA-SR-84-12
APPENDIX A
CONTRIBUTORS
1. STUDY TEAM
a. Study Director
Mr. Saul Penn, Force Systems Directorate
b. Study Team Members
MAJ Ronald McAdoo, Deputy Study Director Mr. Walter Bauman Mr. Harold Frear Ms. Vivian Jugan Mr. Thomas Rose Ms. Sue Van Demark
c. Other Contributors
Mr. Carl Steinhagen LTC Ronald Bailey MAJ Robert Blake Mr. Richard Brown Mr. John Kato Mr. Robert Malay
2. PRODUCT REVIEW BOARD
MAJ John Affeldt (Chairman), Analysis Support Directorate MAJ Dan Noonan MAJ Stanley Jozwiak, Strategy, Concepts and Plans Directorate
A-1
CAA-SR-84-12
APPENDIX B
STUDY DIRECTIVE
DEPARTMENT OF THE ARMY OFFICE OF THE DEPUTY CHIEF OF STAFF FOR LOGISTICS
WASHINGTON, D.C. 20310
DALO-ZD t3.1 AUG i2S2
SUBJECT: Aircraft Spare Stockage Methodology (Aircraft Spares) Study
Director US Army Concepts Analysis Agency 8120 Woodmont Avenue Bethesda, MD 20814
1. PURPOSE OF DIRECTIVE. This directive establishes objectives and provides guidance for conduct of the Aircraft Spare Stockage Methodology (Aircraft Spares) Study.
2. BACKGROUND. The Army has no methodology directly relating required aircraft spare parts stockage levels to combat readiness and flying hour capability. Spare parts requirements are computed based on historical wholesale demands, projected peacetime flying hour levels, and various anticipated lead times and safety levels. To more realistically predict wartime spare parts requirements and to better justify budget requests for spare parts procurement, the Army needs a methodology defining the effects of variations in spare parts availability on the force's abilty to meet daily flying hour requirements throughout a conflict.
3. STUDY SPONSOR AND STUDY SPONSOR'S DIRECTOR. Office of the Deputy Chief of Staff for Logistics, Aviation Logistics Office (DALO-AV).
4. STUDY AGENCY. US Army Concepts Analysis Agency (CAA).
5. TERMS OF REFERENCE
a. Scope
(1) This study will focus on aircraft spare parts. It will de- velop candidate methodologies and contributive factors for computation of aircraft spare parts requirements which will provide a clearer pic- ture of the relationship of resources to readiness and capability. Com- plete evaluation of candidate methodologies and selection of a solution will require a subsequent effort.
(2) These candidate methodologies may also serve as the basis for changes to the cyrrent Army resource management process which should further enhance readiness and supply availability.
(3) The study will focus on the AH-IS helicopter in order to com- pare and evaluate candidate methodologies.
B-1
CAA-SR-84-12
DALO-ZD SUBJECT: Aircraft Spare Stockage Methodology (Aircraft Spares) Study
b. Objectives
(1) Analyze and evaluate the current methodology for forecasting * aircraft spare parts requirements.
(2) Develop predictive methodologies to compute total aircraft spare parts requirements in relation to readiness and flying hour objec- tives.
(3) Provide demonstration computer runs and/or analytical computa- tions, as appropriate, to illustrate the possible methodologies.
c. Timeframe. FY 84-88.
d. Assumpti ons
(1) All units considered will be configured as currently fielded to include equipment, personnel, maintenance facilities, and prescribed load list/authorized stockage list (PLL/ASL).
(2) In-theater logistic support operations will be conducted as described in FM 100-16, Support Operations: Echelons Above Corps.
e. Essential Elements of Analysis (EEA)
(1) What is the current methodology for forecasting aircraft spare parts requirements?
(2) How well do current methods predict aircraft spare parts requirements?
(3) At what locations or in which types of units are parts cur- rently stored?
(4) What alternative modeling approaches have potential for improving the prediction of spare parts requirements?
(5) What alternative analytical solution methods have potential for improving the prediction of spare parts requirements?
(6) What are the types of data required for each potential predic- tive methodology?
(7) Is required data readily available for use? »"
(8) If data is not readily available, how can it be collected?
(9) What procedure should be used to evaluate the alternative pre- dictive methodologies and select the one most suited to the Army's needs.
B-2
CAA-SR-84-12
DALO-ZD SUBJECT: Aircraft Spare Stockage Methodology (Aircraft Spares) Study
f. Enviromental and Threat Guidance
(1) Existing studies of wartime attrition of aircraft will be used. An updated threat is not required,
(2) No environmental consequences are envisioned; however, the study agency is required to surface and address any environmental con- siderations that develop in the course of the study effort.
6. RESPONSIBILITIES
a. DARCOM wi11 provide technical data,
b. TSARCOM wi11 provide detailed information on aircraft spares.
c. US Army Transportation Center will provide information on mainte- nance and repai r.
d. US Army Aviation School and Center will provide data regarding employment of aviation resources as required.
e. US Army Logistics Center will provide logistics and maintenance data as requi red.
f. TRADOC wi11 provide input and assistance as later defined.
g. CAA wi11 provide study team and computer time; conduct literature search; and conduct and publish the study.
h. HODA, QDCSLOG wi11 provide study monitorship, establish a Study Advisory Group (SAG), and provide support for contractual effort to enhance the Overview Model.
1. AMSAA, Inventory Research Office will provide assistance in com- paring and validating models,
7, LITERATURE SEARCH
a. DTIC. Defense Technical Information Center (DTIC) search will be conducted,
b. Related Studies
(1) Maximizing Daily Helicopter Flying Hours Study (MAX FLY Study),
(2) Wartime Requirements for Ammunition and Materiel for the Pro- •gram Force 1988, Europe (P88E).
5-3
CM-SR-84-12
DALO-ZD SUBJECT: Aircraft Spare Stockage Methodology (Aircraft Spares) Study
(3) Wartime Requirements for Ammunition and Materiel for the Pro- gram Force 1986 (P86E).
(4) Army Force Planning Data and Assumptions (AFPDA).
(5) Apache, Black Hawk, and Chinook Helicopter Self-Deployment Cost and Benefit Study (ABCD).
(6) Cobra/Black Hawk in Support of the RDF Study.
8. REFERENCES. To be published with the study plan.
9. ADMINISTRATION
a. Support. Funds for travel, per diem, and overtime will be pro- vided by the parent organization of each participant.
b. Milestone Schedule
(1) Initial results will be provided to DA by December 1983 with a final report provided no later than February 1984.
(2) Other milestones will be identified in the study plan.
c. Control Procedures
(1) ODCSLOGwill establish a SAG. Members will include represen- tatives from the following agencies or staffs:
(a) ODCSOPS AND ODCSRDA
(b) HQ, DARCOM
(c) TSARCOM
(d) HQ, TRADOC
(e) USA Aviation Center
(f) USA Transportation Center
(g) USA Logi sties Center
(2) CAA will prepare and submit DD Form 1498 to DTIC.
d. Coordination and Other Communications. CAA is authorized direct coordination with all organizati ons. 1 i sted in paragraph 6.
B-4
CM-SR-84-12
DALO-ZD SUBJECT: Aircraft Spare Stockage Methodology (Aircraft Spares) Study
10. COORDINATION. This tasking directive has been coordinated with CAA in accordance with procedures contained in AR 10-38.
FOR THE DEPUTY CHIEF OF STAFF FOR LOGISTICS:
JOSEP^P. CRIBBINS Special Assistant to the Deputy
Chief of Staff for Logistics
B-5
CAA-SR-84-12
APPENDIX C
MODEL AND DATA DESCRIPTIONS
C-1. INTRODUCTION. This appendix presents historical and descriptive in- formation on each of the five models studied--Overview, PARCOM, SESAME, ACIM, and Dyna-METRIC. No dedicated attempt is made to provide parallel topics and treatment, since the level of interest in and areas of concern with each model were different. The appendix also reviews some of the data requirements of the two models (Overview and PARCOM) tested in the study.
C-2. OVERVIEW
a. Introduction
(1) Air Force Use. The Overview Model was developed by Synergy, Inc. for the Air Force. As pointed out in Chapter 3, it enables the Air Force to rapidly determine, for planning and budgeting purposes, the operational performance impacts' of logistics resource changes by relating spare parts and dollars to sorties flown. The model was intended primarily for response to DOD and Congressional staff logistics inquiries but has been adapted since to a variety of Air Force programing and capability assessment tasks.
(2) Army Use. In FY 83, Synergy modified the Overview Model to adapt it for its initial Army use in the ODCSLOG-sponsored CAA MAX FLY Study.5,/ This model adaptation was encouraged and sponsored by OASD(MRA&L) under contract MDA 903-82-C-0243. In the MAX FLY Study, Overview provided daily and cumulative flying hours achieved for a given starting inventory as well as the daily percent of aircraft which were "not mission capable supply" (NMCS). It indicated the critical spare part (the spare causing the largest number of unavailable aircraft) for each day of the war. After each run, the analysts manually determined which spare was the most critical (for the entire run) and estimated the number of that spare that would be added in an attempt to meet the flying hour goals. The war reserve level of the selected spare was changed in the data base to reflect the required addition. The model was rerun, and the process repeated, until the flying hour goals were met. The MAX FLY Study showed Overview to be a potentially valuable tool but, at the same time, identified several limitations in its current form, the principal one being the need for manual preparation of successive iterations to determine parts requirements.
C-1
CM-SR-84-12
(3) Aircraft Spares Enhancement
(a) Automated Iterative Run Process. For the Aircraft Spares Study, an automated iterative run process was designed. The critical day is determined as the one on which the number of aircraft shortages is highest. The critical spare for that day is identified, and the number of spares to be added is calculated (number of spares to be added = number of aircraft shortages on the critical day x the quantity per aircraft of the critical spare, as required by Overview's "full substitution" assumption). This information is transferred to a file which contains edit commands, thus enabling the data base to be edited without the analysts' assistance. The runstream continues to execute the model and update the data base until the 100 percent flying hour goal is achieved. With the last iteration, a chart is created and printed providing a record of the parts and costs required.
(b) Additional Output Provided. The Overview output content and format were also improved. For an individual run, the following additional information is now provided directly: the cumulative flying hours required, the percent required cumulative flying hours achieved, the daily aircraft availability, the average availability (for that iteration), the number of consecutive days the required flying hour program is met, the critical day of the war, the critical spare for that day, the number of aircraft shortages for that day, the number of spares which should be added to proceed toward the flying hour goals, and the resulting cost of such additions,
b. Logic and Parts Flow
(1) Figure C-1 is a schematic which illustrates the underlying assumptions and logic of Overview. It shows serviceable and unserviceable spare parts bins in both the US and Europe. The bins in the US represent the inventory of helicopter spare parts maintained at the wholesale level. Within Overview, it is assumed that there is one depot at which all the spare parts at the wholesale level of maintenance are stored. The spare parts contained in the serviceable bin are those which are ready for use, while those in the unserviceable bin are either in the process of being repaired or waiting to be repaired.
C-2
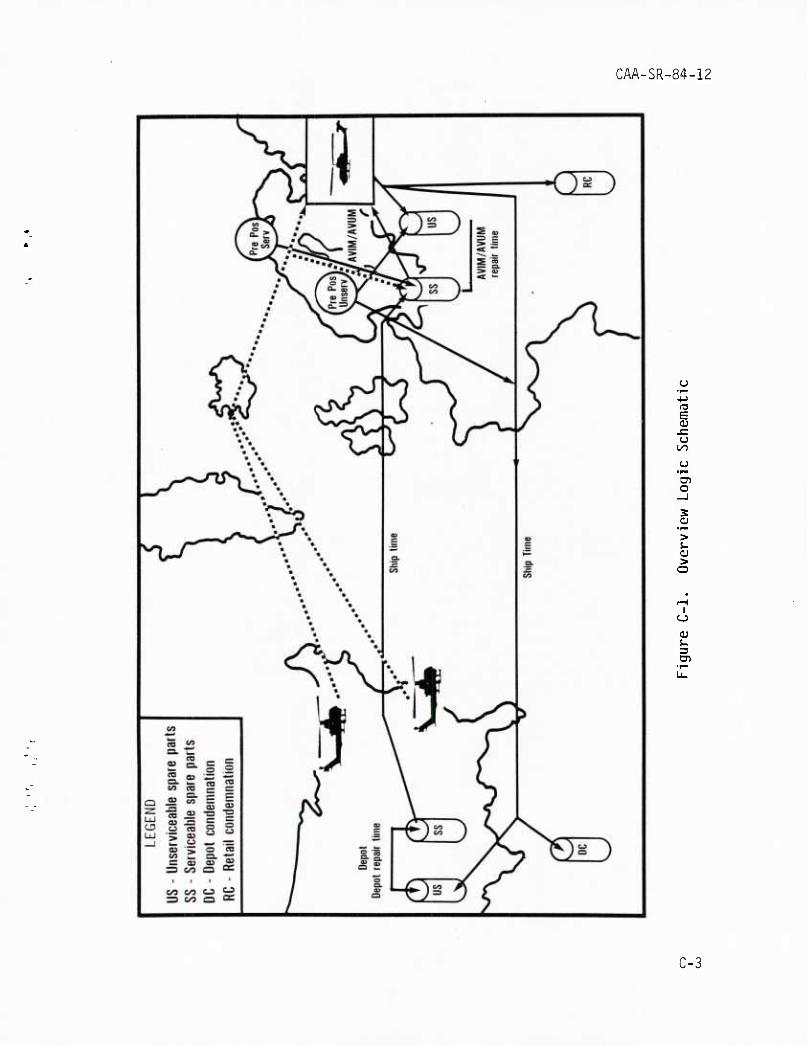
CAA-SR-84-12
a ■r— 4J
s O)
u (/I
u
o
2
> I.
> o
I
a;
en
C-3
CAA-SR-84-12
(2) The two bins shown in Europe represent the sum of all the retail spare parts in Europe other than the prepositioned war reserves. This re- flects the assumption made within the model that one large maintenance shop exists at the retail level. The model does not distinguish between repairs made at the aviation unit maintenance (AVUM) shops and those performed at aviation intermediate maintenance (AVIM) shops. The serviceable and un- serviceable spare parts bins at the large retail maintenance shop, the AVIM/AVUM, have interpretations similar to those of the depot. These con- tain the serviceable and unserviceable spare parts of the authorized stock- age lists (ASL) and prescribed load lists (PLL) of all aviation units based in Europe.
(3) At the outset of a hypothetical war in Europe, the serviceable prepositioned war reserves, represented by the circle above the AVIM/AVUM, are placed in the serviceable spare parts bin at the AVIM/AVUM.* These spare parts are immediately available for use on aircraft located in the theater. After some time lag, specified by the user of Overview, the spare parts in the serviceable inventory at the depot arrive in Europe and are placed in the serviceable spare parts bin at the AVIM/AVUM. The box above and to the right of the AVIM/AVUM represents the battlefield. At the beginning of the conflict, all of the aircraft stationed in the theater are assumed to be flyable and begin flying according to a wartime flying pro- gram supplied by the user. The flying program contains both the hours re- quired of the flyable helicopters and attrition rates for various periods of the war.
(4) Th units static Europe on th Associated w which repres unit. In ei spare parts parts bin at immediately the wartime
e helicopter unit ned in the US in e day of the war ith each of the h ents either a PLL ther case, when a are also deployed the AVIM/AVUM available to help flying program.
s stationed in Europe will be reinforced by peacetime. These US-based units appear in on which they are scheduled to arrive, elicopter units is a group of spare parts or an ASL, depending on the nature of the helicopter unit is deployed to Europe, its and are deposited in the serviceable spare
The newly arrived aircraft are assumed to be meet the mission requirements set forth in
*Those war reserve spare parts which are in an unserviceable condition at the start of the war (circle to the left of the AVIM/AVUM) are added to the unserviceable bin at the AVIM/AVUM if they can be repaired at the retail level. Those that cannot be fixed in the theater will be placed in the depot unserviceable bin after a lag. This lag is intended to represent the ship time between Europe and the US.
C-4
CAA-SR-84-12
(5) During the simulation, the aircraft in action in the theater will suffer parts failures. The specific parts which fail will be determined by the failure rates for the parts which compose the aircraft. When a part fails, the model will check to see if there is a replacement available within the serviceable spare parts inventory at the AVIM/AVUM. If there is an available replacement, it will be applied to the aircraft which needs it and that aircraft will immediately become mission capable. If a replacement is not to be found in the serviceable bin, the helicopter with the failed part will be incapable of flying. It will be "not mission capable" (NMC) until a unit of the needed spare part appears in the serviceable bin.*
(6) The disposal of a failed part will depend on its retail condem- nation percentage, its depot condemnation percentage, and its "not repair- able this station" (NRTS) rate. The retail and depot condemnation percent- ages indicate the percentage of failed units for a particular spare part which are discarded at the AVIM/AVUM and depot, respectively.** The NRTS rate denotes the percentage of failed units for a particular part which cannot be repaired at a retail maintenance shop and are shipped to the depot.
(7) Within the Overview Model, parts are assumed to be perfectly divisible. When a part fails, a fraction equal to its retail condemnation percentage will be removed from the simulation. The remainder will be sent to be repaired at the retail maintenance shop, the depot, or some combi- nation of the two, depending on the NRTS rate of the part. If the NRTS rate of the part is zero, the portion of the helicopter part which was not condemned will be placed in the unserviceable spare parts inventory at the AVIM/AVUM. After a number of days, equal to the AVIM/AVUM repair time for the part, the remaining fraction of the part will move from the unserviceable spare parts bin to the serviceable spare parts bin. At this point, the fractional part is ready to be combined with another fractional part in the serviceable spare parts bin to form a complete unit which may be applied to a helicopter.
(8) The uncondemned portion of parts with NRTS rates of one will be sent back to the US to be repaired. There, a fraction equal to the depot condemnation percentage will be subtracted and removed from the simulation. After a time lag, equal to the ship time, these fractional parts will
*In Overview that part may come either from the repair and supply system pipeline or from another aircraft that may be down due to the lack of a different part.
**These failed parts are discarded because they are either impossible or impractical to repair.
C-5
CAA-SR-84-12
appear in the unserviceable spare parts inventory at the depot. Following another lag, equal to the depot repair time for the failed part, the frac- tional part will be transferred to the depot serviceable spares bin before being shipped back to the theater.
(9) Some parts have NRTS rates that fall between zero and one. When one of these parts fails, a fraction equal to its retail condemnation per- centage is discarded. A portion of the remainder equal to the NRTS rate of the part will be sent to the depot and the rest will be repaired at the AVIM/AVUM maintenance shop. Once again, a fraction of that which was sent to the depot will be condemned. This fraction is the depot condemnation percentage.
(10) The two bins at the bottom of Figure C-1 represent the two groups of condemned parts, retail and depot condemnations. These parts are removed from the simulation. Another way that parts leave the simulation is through aircraft attrition. When an aircraft is shot down, it is assumed that all of its parts are lost. Attrition of the logistics system is not modeled.
(11) Given a force structure, a schedule of phased deployment of heli- copters, an initial inventory of helicopter spare parts, and the flow of these parts described above, the model computes the number of flying hours that may be accomplished during the simulated war. All of the information required by the model to generate its estimates of mission capability are stored in three computer files--the parts data base, the force file, and the flying program file.
c. Data Requirements
(1) Data Base. The parts data base contains logistics data by national stock number (NSN) for each helicopter part included in the Over- view Model run. Data elements include unit repair costs and purchase prices, inventory levels, failure rates, repair times, and condemnation rates. Table C-1 contains a complete list of the data elements within the parts data base. The quality of the capability estimates generated by Overview is directly related to the quality of the data contained in the parts data base.
(2) Common Parts. The original model development plan called for five data bases for each of five different aircraft types to be merged to form one large parts data base. This would have allowed the model to generate capability estimates for each of five weapon systems simultaneously and to deal explicitly with parts shared by two or more different aircraft.
C-6
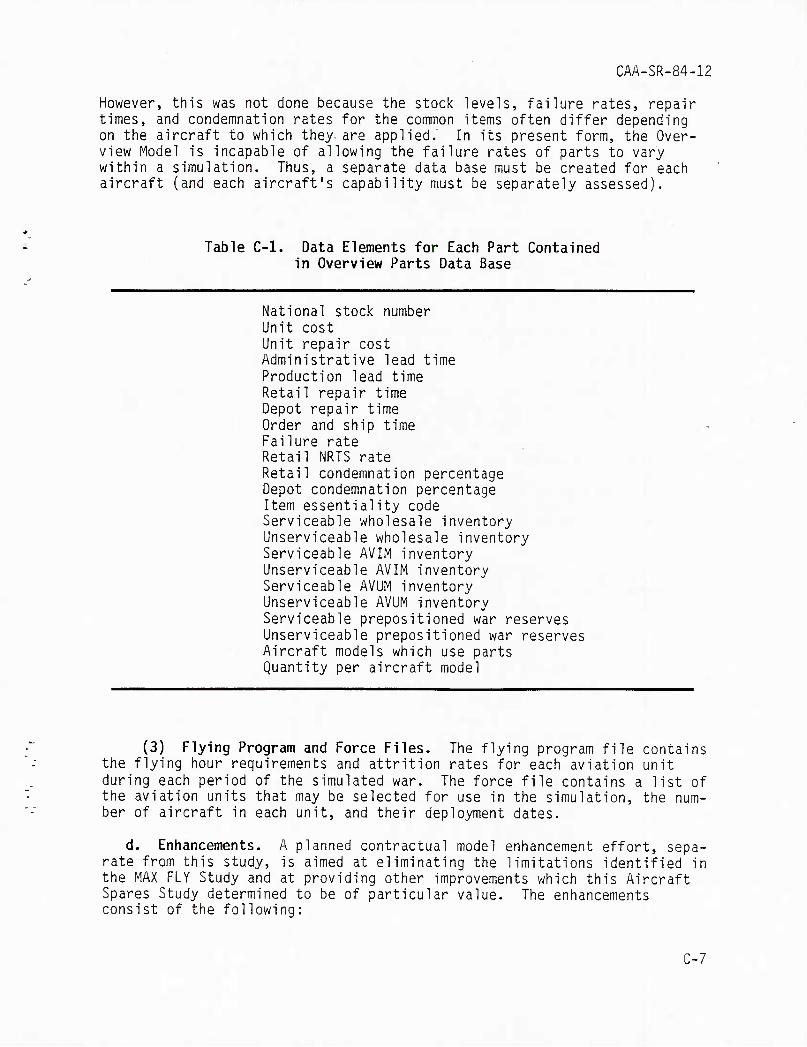
CAA-SR-84-12
However, this was not done because the stock levels, failure rates, repair times, and condemnation rates for the common items often differ depending on the aircraft to which they- are applied. In its present form, the Over- view Model is incapable of allowing the failure rates of parts to vary within a simulation. Thus, a separate data base must be created for each aircraft (and each aircraft's capability must be separately assessed).
Table C-1. Data Elements for Each Part Contained in Overview Parts Data Base
National stock number Unit cost Unit repair cost Administrative lead time Production lead time Retail repair time Depot repair time Order and ship time Failure rate Retail NRTS rate Retail condemnation percentage Depot condemnation percentage Item essentiality code Serviceable wholesale inventory Unserviceable wholesale inventory Serviceable AVIM inventory Unserviceable AVIM inventory Serviceable AVUM inventory Unserviceable AVUM inventory Serviceable prepositioned war reserves Unserviceable prepositioned war reserves Aircraft models which use parts Quantity per aircraft model
(3) Flying Program and Force Files. The flying program file contains the flying hour requirements and attrition rates for each aviation unit during each period of the simulated war. The force file contains a list of the aviation units that may be selected for use in the simulation, the num- ber of aircraft in each unit, and their deployment dates.
d. Enhancements. A planned contractual model enhancement effort, sepa- rate from this study, is aimed at eliminating the limitations identified in the MAX FLY Study and at providing other improvements which this Aircraft Spares Study determined to be of particular value. The enhancements consist of the following:
C-7
CAA-SR-84-12
(1) Fully automate a requirements mode to supplement the existing capability assessment mode.
(2) Improve maintenance resources modeling.
(3) Improve controlled substitution modeling.
(4) Incorporate minimum availability targets.
(5) Allow for nonflying hour driven demands such as battle damage.
(6) Improve graphics.
(7) Update and expand documentation.
C-3. PARCOM
a. Introduction. The basic purpose of the Parts Requirements and Cost Model (PARCOM) is to generate cost effective mixes of spare parts needed to achieve a specified flying program under various cost constraints, initial inventory conditions, part replacement policies, and aircraft availability objectives. The options for each of the above are as follows:
(1) Cost Constraints. For certain combinations of part replacement policies, initial inventory conditions, and aircraft availability objectives, PARCOM generates a solution under one of two cost constraint modes:
(a) Unconstrained Dollars. In this mode PARCOM generates the ex- pected least-cost spare parts requirements and costs (item purchase costs only) needed to achieve the specified flying program.
(b) Constrained Dollars. In this mode, for the "no substitution" policy only, a limit on total spare purchase costs is specified, and PARCOM generates "best" spares mix obtainable to meet the specified flying program. It does this by first computing the unconstrained cost requirements mix and then purchasing the maximum number of items possible from that mix. Such a goal tends to produce the maximum flying hours (as opposed to maximum sustainability) with the constrained funds.
(2) Initial Inventory Conditions. For each case PARCOM generates a least-cost solution under two initial inventory conditions:
(a) Initial spares inventory = 0, i.e., the "total" requirement to achieve the flying program is generated.
(b) Initial spares inventory = current inventory, i.e., the "resid- ual" requirement or "added buy" to achieve the flying program is determined.
C-8
CAA-SR-84-12
(3) Part Replacement Policies. PARCOM computes a solution for uncon- strained dollar cases for each of three policies for replacing failed parts. The policies are:
(a) "Full Substitution." A failed part on an aircraft may be re- placed by either a spare (if available) or by a serviceable part from a not mission capable (NMC) aircraft (if a spare is not available).
(b) "No Substitution." A failed part on an aircraft may only be replaced by a spare part.
(c) "NMCS = 0." All failures must be replaced by spares. Basically this is a "no substitution" policy under a 100 percent aircraft availability constraint. An aircraft is in an NMCS status if it is nonoperational because spare parts are needed, but are not available, to restore it to serviceability. The fraction of aircraft in NMCS status sometimes is also denoted "NMCS." One hundred percent availability corresponds to NMCS (fraction) = 0. For a given scenario the "full substitution" policy generates the smallest (i.e, cheapest) spare part requirement while the "NMCS = 0" policy generates the largest (most expensive) requirement.
(4) Aircraft Availability Objectives. For each part replacement policy in a scenario, PARCOM will generate the expected least-cost spare requirements to achieve the flying hour program and maintain a designated (input) aircraft availability on each day (different days may have different availability objectives). Aircraft availability is the fraction of surviving aircraft which are not in NMCS status. Although availability objectives must always be input, they can be set low enough (e.g., 0) to be inoperative.
b. Logic. PARCOM is a series of expected value simulations of the spare part requirements generation process for cases defined by a combination of parameters noted in the previous paragraph. In addition, the model computes the capability potential of the force when operated with each computed spares mix. The assessed capability potential is in terms of achievable aircraft availability and fraction of the flying hour program (daily and whole war) which can be accomplished. Figure C-2 illustrates the general nature and sequence of PARCOM processing. Each block, with logic diagrams as appropriate, is described in the following subparagraphs.
C-9
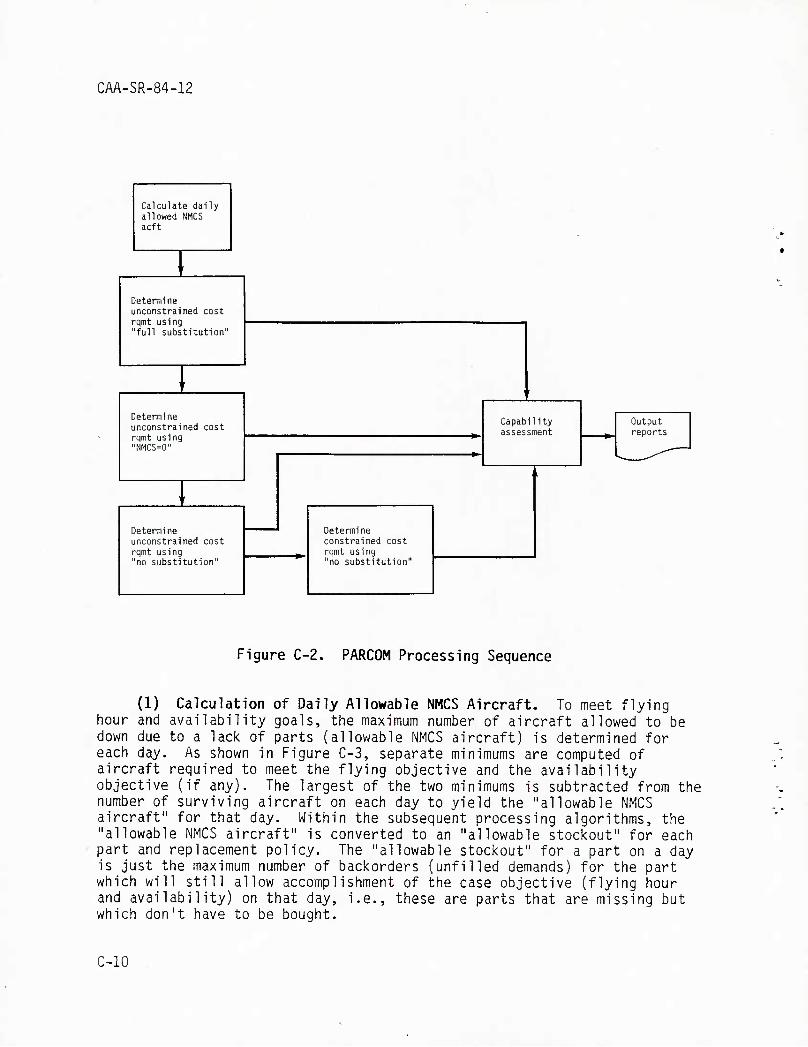
CAA-SR-84-12
Calculate daily allowed NMCS acft
Determine unconstrained cost rqmt using "full substitution"
Determine unconstrained cost rqmt using "NMCS=0"
Capability assessment
Output reports
' ^ ^
'
Determine unconstrained cost rqmt using
Determine constrained cost rqmt using "no substitution" no substi tution"
Figure C-2. PARCOM Processing Sequence
(1) Calculation of Daily Allowable NMCS Aircraft. To meet flying hour and availability goals, the maximum number of aircraft allowed to be down due to a lack of parts (allowable NMCS aircraft) is determined for each day. As shown in Figure C-3, separate minimums are computed of aircraft required to meet the flying objective and the availability objective (if any). The largest of the two minimums is subtracted from the number of surviving aircraft on each day to yield the "allowable NMCS aircraft" for that day. Within the subsequent processing algorithms, the "allowable NMCS aircraft" is converted to an "allowable stockout" for each part and replacement policy. The "allowable stockout" for a part on a day is just the maximum number of backorders (unfilled demands) for the part which will still allow accomplishment of the case objective (flying hour and availability) on that day, i.e., these are parts that are missing but which don't have to be bought.
C-10
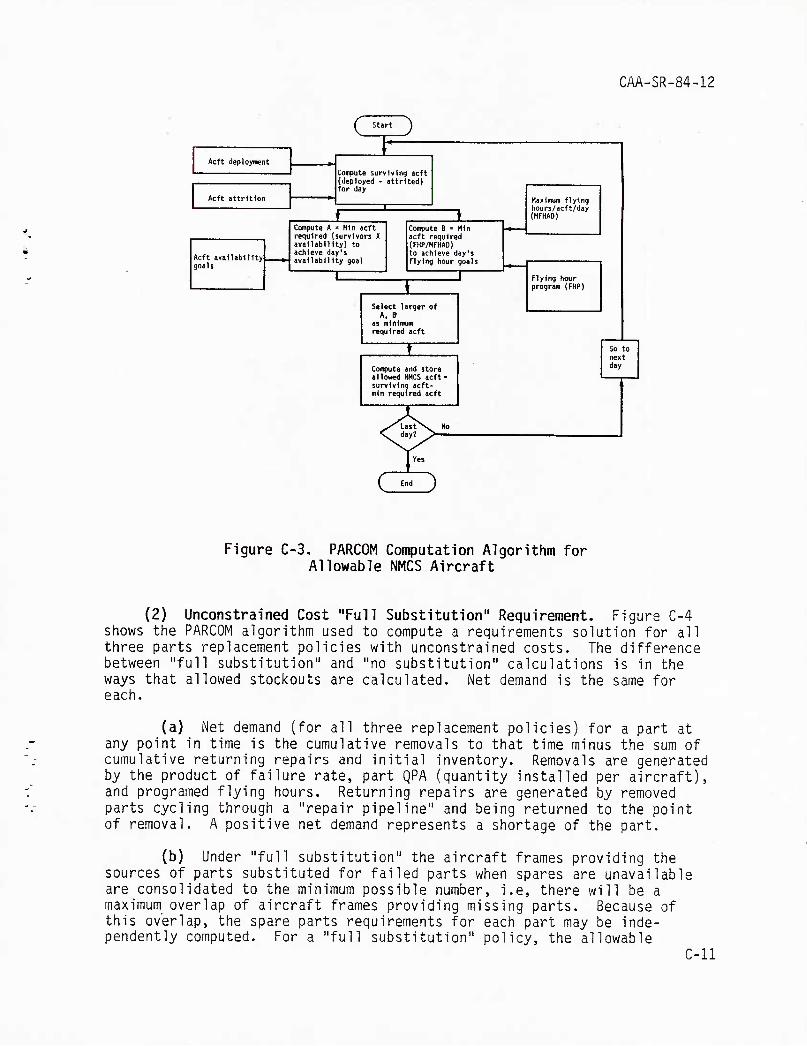
CAA-SR-84-12
( Start
)
Acft deployment 1 ^
CouDute surviving acft (deployed - attritcd) for day
Acft attrition Maximum flying liours/acft/day (HFHAD)
*
\ Compute A - H1n acft required (survivors X availability) to achieve day's availability goal
Compute B » Min acft required (FHP/MFHAD) to achieve day's flying hour goals Acft availability
goals
Flying hour program (FHP)
1 J 1
Select larger of A. »
as minimum required acft
t Go to next day Ccwnpute and store
allowed NHCS acft - surviving acft- jnln required acft
< /ustN. No
Figure C-3. PARCOM Computation Algorithm for Allowable NMCS Aircraft
(2) Unconstrained Cost "Full Substitution" Requirement. Figure C-4 shows the PARCOM algorithm used to compute a requirements solution for all three parts replacement policies with unconstrained costs. The difference between "full substitution" and "no substitution" calculations is in the ways that allowed stockouts are calculated. Net demand is the same for each.
(a) Net demand (for all three replacement policies) for a part at any point in time is the cumulative removals to that time minus the sum of cumulative returning repairs and initial inventory. Removals are generated by the product of failure rate, part QPA (quantity installed per aircraft), and programed flying hours. Returning repairs are generated by removed parts cycling through a "repair pipeline" and being returned to the point of removal. A positive net demand represents a shortage of the part.
(b) Under "full substitution" the aircraft frames providing the sources of parts substituted for failed parts when spares are unavailable are consolidated to the minimum possible number, i.e, there will be a maximum overlap of aircraft frames providing missing parts. Because of this overlap, the spare parts requirements for each part may be inde- pendently computed. For a "full substitution" policy, the allowable
C-11
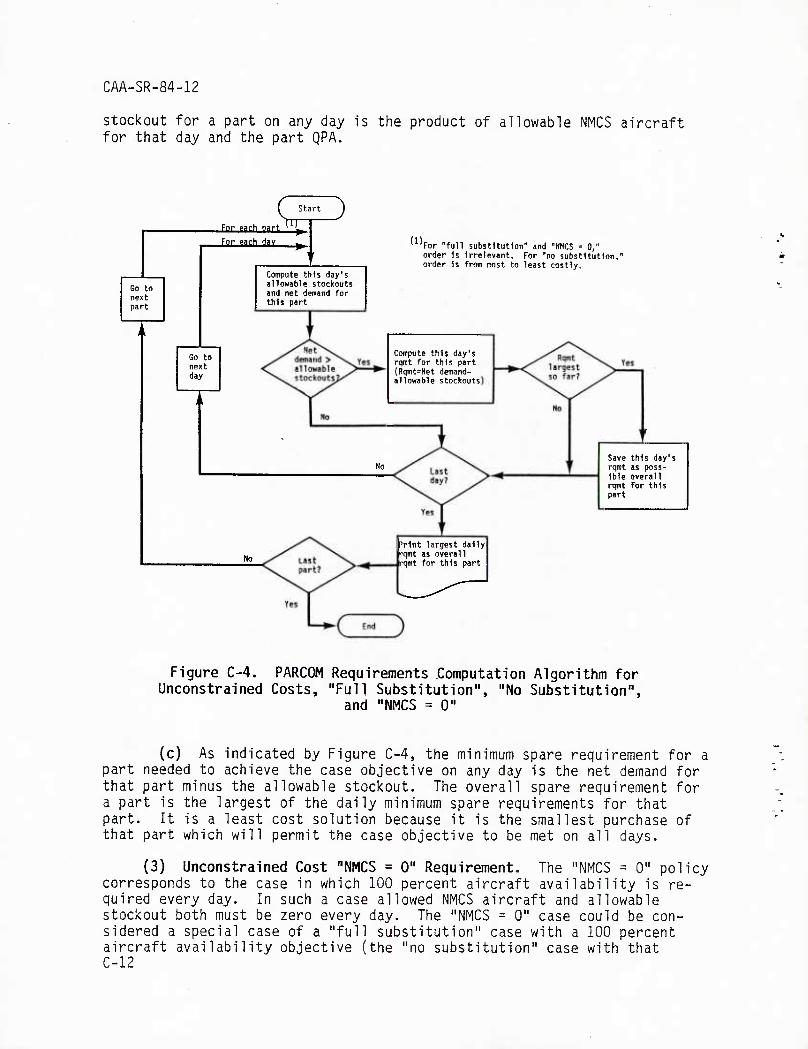
CAA-SR-84-12
stockout for a part on any day is the product of allowable NMCS aircraft for that day and the part QPA.
Fnr fMh mrl
( start )
.Vn—
Go to next part
For gach day
Go to next day
Compute this day's allowable stockouts and net demand for this part
(1) For "full substitution" and "NMCS « 0," order Is Irrelevant. For "no substitution, order is from most to least costly.
No
Compute this day's rqmt for this part (Rqmt=Net demand- allowable stockouts
No Save this day' rqmt as poss- ible overall npt for this part
Print largest daily rqmt as overal1 rqmt for this part
Figure C-4. PARCOM Requirements .Computation Algorithm for Unconstrained Costs, "Full Substitution", "No Substitution",
and "NMCS = 0"
(c) As indicated by Figure C-4, the minimum spare requirement for a part needed to achieve the case objective on any day is the net demand for that part minus the allowable stockout. The overall spare requirement for a part is the largest of the daily minimum spare requirements for that part. It is a least cost solution because it is the smallest purchase of that part which will permit the case objective to be met on all days.
(3) Unconstrained Cost "NMCS = 0" Requirement. The "NMCS = 0" policy corresponds to the case in which 100 percent aircraft availability is re- quired every day. In such a case allowed NMCS aircraft and allowable stockout both must be zero every day. The "NMCS = 0" case could be con- sidered a special case of a "full substitution" case with a 100 percent aircraft availability objective (the "no substitution" case with that C-12
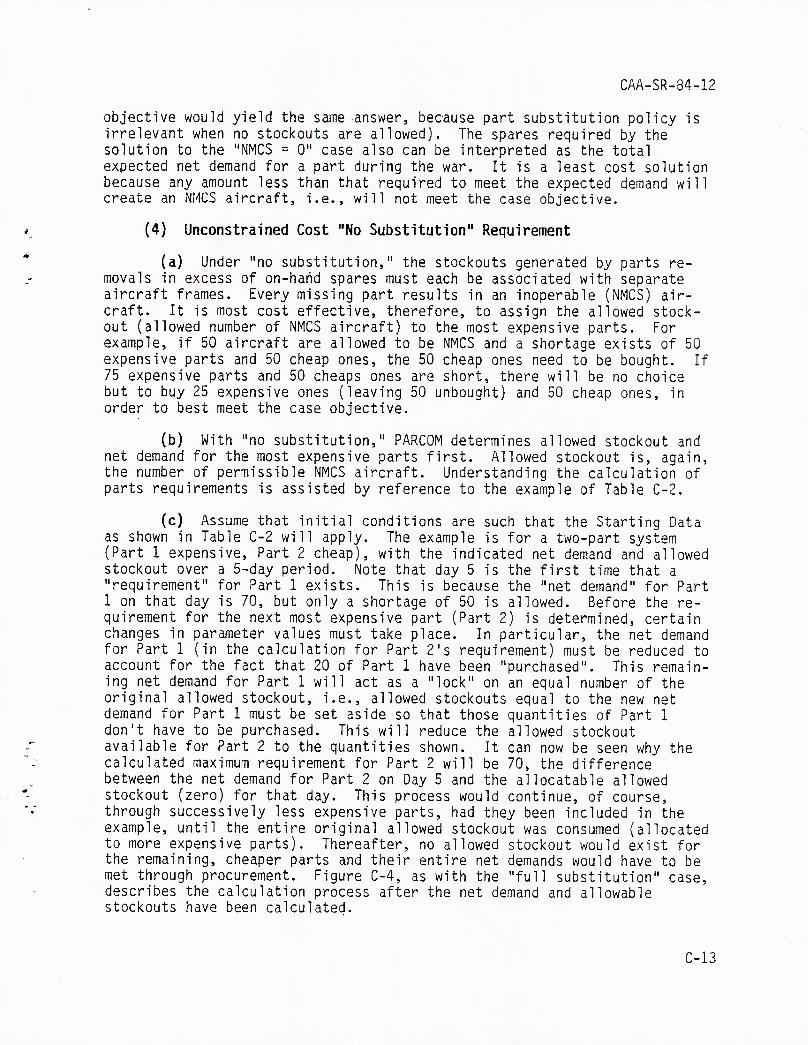
CAA-SR-84-12
objective would yield the same answer, because part substitution policy is irrelevant when no stockouts are allowed). The spares required by the solution to the "NMCS = 0" case also can be interpreted as the total expected net demand for a part during the war. It is a least cost solution because any amount less than that required to meet the expected demand will create an NMCS aircraft, i.e., will not meet the case objective.
(4) Unconstrained Cost "No Substitution" Requirement
(a) Under "no substitution," the stockouts generated by parts re- movals in excess of on-hahd spares must each be associated with separate aircraft frames. Every missing part results in an inoperable (NMCS) air- craft. It is most cost effective, therefore, to assign the allowed stock- out (allowed number of NMCS aircraft) to the most expensive parts. For example, if 50 aircraft are allowed to be NMCS and a shortage exists of 50 expensive parts and 50 cheap ones, the 50 cheap ones need to be bought. If 75 expensive parts and 50 cheaps ones are short, there will be no choice but to buy 25 expensive ones (leaving 50 unbought) and 50 cheap ones, in order to best meet the case objective.
(b) With "no substitution," PARCOM determines allowed stockout and net demand for the most expensive parts first. Allowed stockout is, again, the number of permissible NMCS aircraft. Understanding the calculation of parts requirements is assisted by reference to the example of Table C-2.
(c) Assume that initial conditions are such that the Starting Data as shown in Table C-2 will apply. The example is for a two-part system (Part 1 expensive. Part 2 cheap), with the indicated net demand and allowed stockout over a 5-day period. Note that day 5 is the first time that a "requirement" for Part 1 exists. This is because the "net demand" for Part 1 on that day is 70, but only a shortage of 50 is allowed. Before the re- quirement for the next most expensive part (Part 2) is determined, certain changes in parameter values must take place. In particular, the net demand for Part 1 (in the calculation for Part 2's requirement) must be reduced to account for the fact that 20 of Part 1 have been "purchased". This remain- ing net demand for Part 1 will act as a "lock" on an equal number of the original allowed stockout, i.e., allowed stockouts equal to the new net demand for Part 1 must be set aside so that those quantities of Part 1 don't have to be purchased. This will reduce the allowed stockout available for Part 2 to the quantities shown. It can now be seen why the calculated maximum requirement for Part 2 will be 70, the difference between the net demand for Part 2 on Day 5 and the allocatable allowed stockout (zero) for that day. This process would continue, of course, through successively less expensive parts, had they been included in the example, until the entire original allowed stockout was consumed (allocated to more expensive parts). Thereafter, no allowed stockout would exist for the remaining, cheaper parts and their entire net demands would have to be met through procurement. Figure C-4, as with the "full substitution" case, describes the calculation process after the net demand and allowable stockouts have been calculated.
C-13
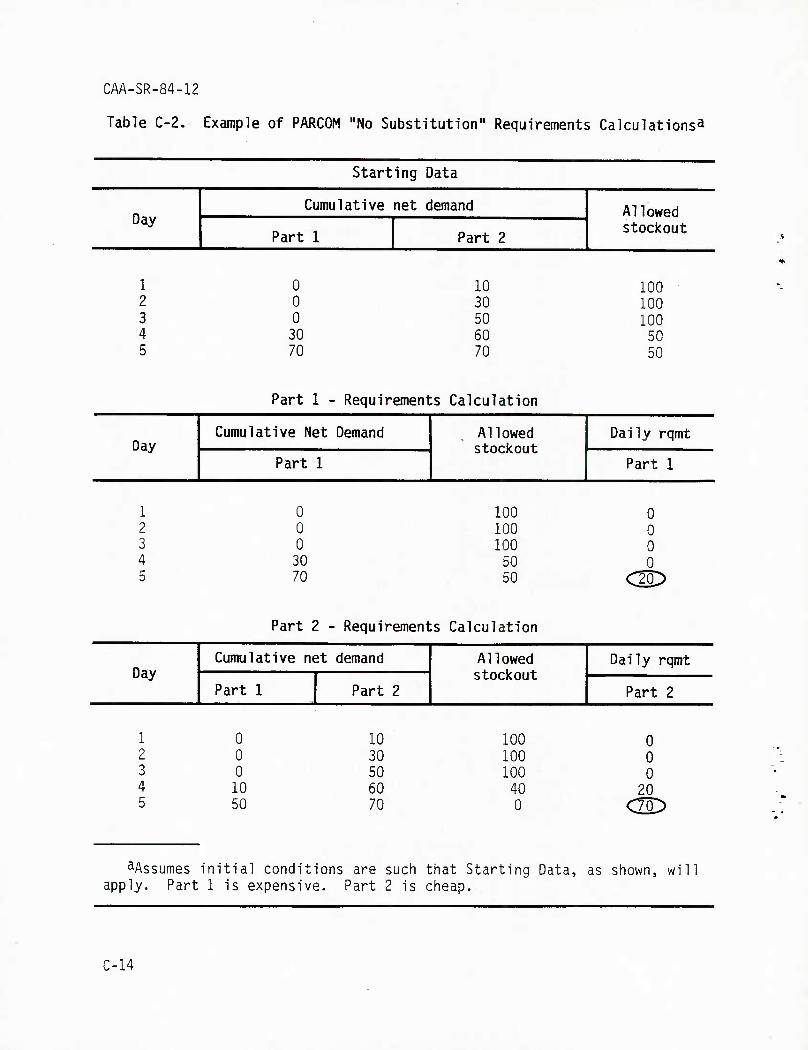
CAA-SR-84-12
Table C-2. Example of PARCOM "No Substitution" Requirements Calculations^
Day
1 2 3 4 5
Starting Data
Cumulative net demand
Part 1 Part 2
0 0 0 30 70
10 30 50 60 70
Allowed stockout
100 lOO 100 50 50
4
Part 1 - Requirements Calculation
Day Allowed Daily rqmt
Part 1
100 0 100 0 100 0 50 0 50 cm
1 2 3 4 5
0 0 0 30 70
Part 2 - Requirements Calculation
Day Cumulative net demand Allowed
stockout Daily rqmt
Part 1 Part 2 Part 2
1 0 10 100 0 2 0 30 100 0 3 0 50 100 0 4 10 60 40 20 5 50 70 0 C^
^Assumes initial conditions are such that Starting Data, as shown, will apply. Part 1 is expensive. Part 2 is cheap.
C-14
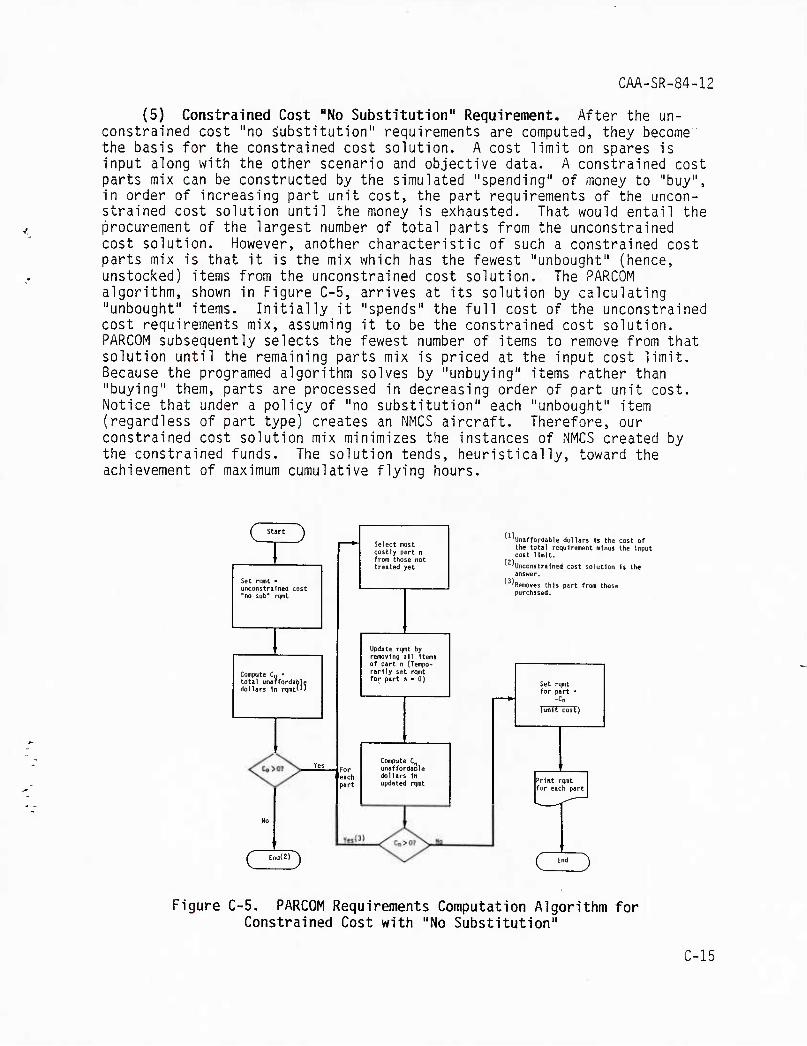
CAA-SR-84-12
(5) Constrained Cost "No Substitution" Requirement. After the un- constrained cost "no substitution" requirements are computed, they become" the basis for the constrained cost solution. A cost limit on spares is input along with the other scenario and objective data. A constrained cost parts mix can be constructed by the simulated "spending" of money to "buy", in order of increasing part unit cost, the part requirements of the uncon- strained cost solution until the money is exhausted. That would entail the procurement of the largest number of total parts from the unconstrained cost solution. However, another characteristic of such a constrained cost parts mix is that it is the mix which has the fewest "unbought" (hence, unstocked) items from the unconstrained cost solution. The PARCOM algorithm, shown in Figure C-5, arrives at its solution by calculating "unbought" items. Initially it "spends" the full cost of the unconstrained cost requirements mix, assuming it to be the constrained cost solution, PARCOM subsequently selects the fewest number of items to remove from that solution until the remaining parts mix is priced at the input cost limit. Because the programed algorithm solves by "unbuying" items rather than "buying" them, parts are processed in decreasing order of part unit cost. Notice that under a policy of "no substitution" each "unbought" item (regardless of part type) creates an NMCS aircraft. Therefore, our constrained cost solution mix minimizes the instances of NMCS created by the constrained funds. The solution tends, heuristically, toward the achievement of maximum cumulative flying hours.
C start\
Set rqint - unconstrained cost "no sub" rqmt
Compute Cq ■ total unaffordable dollars In rqmtU)
Co>07
c
For each part
Select most costly part n from those not treated yet
Update rqmt by removing all Items of part n (Tempo- rarily set rqmt for part n - 0)
Compute C unaffordable dollars In updated rqmt
End(2)
(1),
(3)
Unaffordable dollars ts the cost of the total requirement minus the Input cost Itmlt.
■) 'Unconstrained cost solution Is the answer.
Removes this part from those purchased.
Set rqmt for part -
-Cn
(unit cost)
Print rqmt for each part
( '"' )
Figure C-5. PARCOM Requirements Computation Algorithm for Constrained Cost with "No Substitution"
C-15
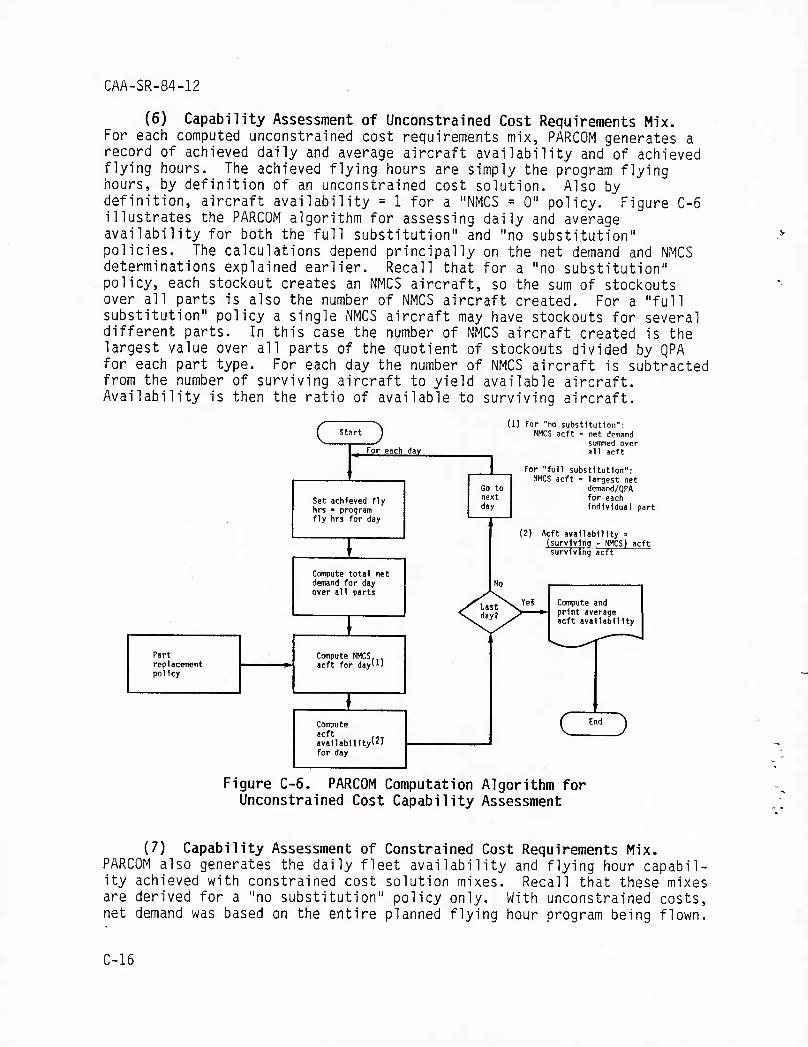
CAA-SR-84-12
(6) Capability Assessment of Unconstrained Cost Requirements Mix. For each computed unconstrained cost requirements mix, PARCOM generates a record of achieved daily and average aircraft availability and of achieved flying hours. The achieved flying hours are simply the program flying hours, by definition of an unconstrained cost solution. Also by definition, aircraft availability = 1 for a "NMCS = 0" policy. Figure C-6 illustrates the PARCOM algorithm for assessing daily and average availability for both the full substitution" and "no substitution" policies. The calculations depend principally on the net demand and NMCS determinations explained earlier. Recall that for a "no substitution" policy, each stockout creates an NMCS aircraft, so the sum of stockouts over all parts is also the number of NMCS aircraft created. For a "full substitution" policy a single NMCS aircraft may have stockouts for several different parts. In this case the number of NMCS aircraft created is the largest value over all parts of the quotient of stockouts divided by QPA for each part type. For each day the number of NMCS aircraft is subtracted from the number of surviving aircraft to yield available aircraft. Availability is then the ratio of available to surviving aircraft.
C start j ( 1) For "no substitution": NMCS acft - net demand
summed over all acft . For each day
1 , For "full substitution":
Go to next day
NMCS acft ' largest net demand/QPA for each Individual part
Set achieved fly hrs = program fly hrs for day
Hn
(2) Acft availability '
\ (surviving - NMCS) acft surviving acft
Compute total net demand for day over all parts
/last^ V. day? ^
Compute and print average acft availability
(
Part replacement policy
Compute NMCS,,, acft for dayll'
♦ - Compute C '"' ) for day
Figure C-6. PARCOM Computation Algorithm for Unconstrained Cost Capability Assessment
(7) Capability Assessment of Constrained Cost Requirements Mix. PARCOM also generates the daily fleet availability and flying hour capabil- ity achieved with constrained cost solution mixes. Recall that theSe mixes are derived for a "no substitution" policy only. With unconstrained costs, net demand was based on the entire planned flying hour program being flown.
C-16
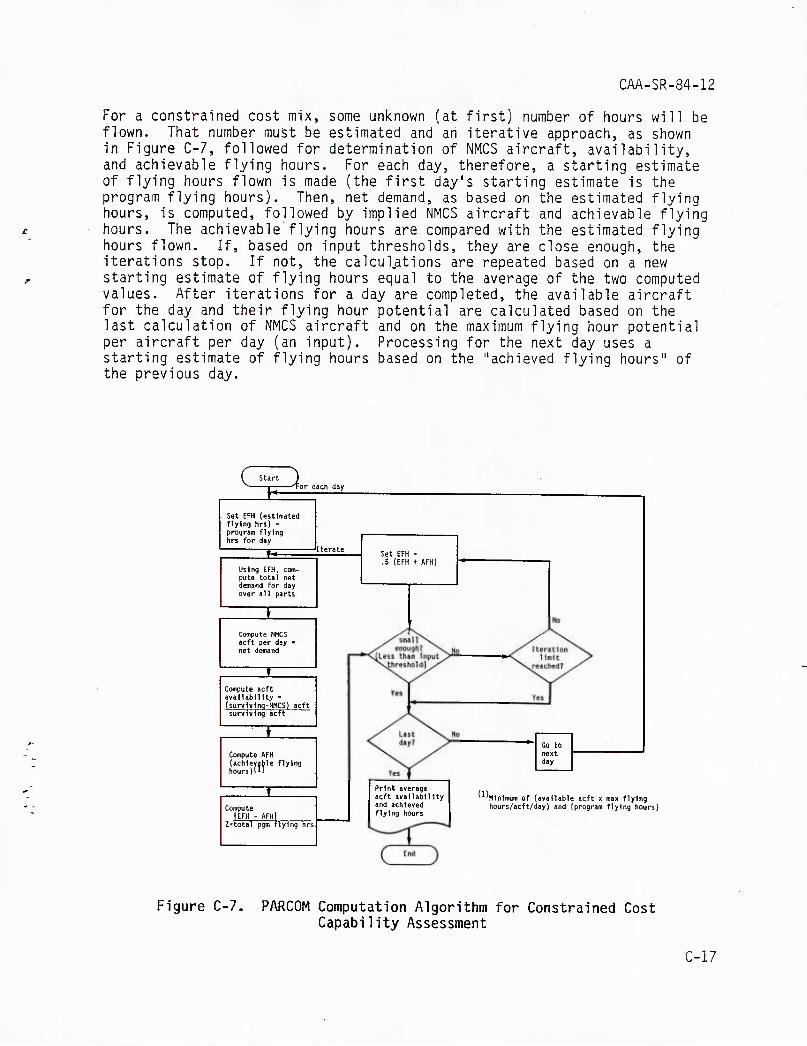
CAA-SR-84-12
For a constrained cost mix, some unknown (at first) number flown. That number must be estimated and an iterative app in Figure C-7, followed for determination of NMCS aircraft and achievable flying hours. For each day, therefore, a s of flying hours flown is made (the first day's starting es program flying hours). Then, net demand, as based on the hours, is computed, followed by implied NMCS aircraft and hours. The achievable flying hours are compared with the hours flown. If, based on input thresholds, they are clos iterations stop. If not, the calculations are repeated ba starting estimate of flying hours equal to the average of values. After iterations for a day are completed, the ava for the day and their flying hour potential are calculated last calculation of NMCS aircraft and on the maximum flyin per aircraft per day (an input). Processing for the next starting estimate of flying hours based on the "achieved f the previous day.
of hours will be roach, as shown , availability, tarting estimate timate is the estimated flying achievable flying estimated flying e enough, the sed on a new the two computed ilable aircraft based on the
g hour potential day uses a lying hours" of
( "r' ) or each day Set EFH (estimated flying hrs) - program flying hrs for day
j^ Using EFH, com- pute total net demand for day over all parts
Compute NMCS acft per day ■ net demand
Compute acft availability => survlving-NHCS) acft surviving acft
I Compute AFH (achievable flying hours) (U
X Compute
IEFH - AFHl Z"total pgm flying hrs
Set EFH .5 (EFH + AFH)
Go to next day
Print average acft availability and achieved flying hours
(1), Minimum of (available acft x max flying hours/acft/day) and (program flying hours)
Figure C-7. PARCOM Computation Algorithm for Constrained Cost Capability Assessment
C-17
CAA-SR-84-12
(8) Capability Assessment for Current Inventory. The previous dis- cussion of capability assessment addressed the capability that would be achieved by adding parts to meet a specified case objective. It was seen that the problem became more difficult when cost constraints prevented the objective from being met. The capability of the fleet when no additional parts are purchased, i.e., the fleet with just the current inventory, is a special case of the constrained cost case where procurement funds are limited to zero. PARCOM can do limited assessments of force capability with current inventory as follows:
(a) "Full Substitution". Only the expected period (consecutive days from day 1) that the flying hour program is fully sustainable by the current inventory is assessable. The user operates PARCOM in any standard run with current inventory. The unconstrained cost "full substitution" output from that run gives cumulative cost, by day of war, of the add-on "full substitution" requirement for a scenario truncated at the specified day. The last day for which there is a zero add-on requirement cost is the last day of the period of sustainability with current inventory.
(b) "No Substitution". The number of consecutive days sustainable with current inventory is determined similarly to the "full substitution" solution, but with the unconstrained cost "no substitution" output from a standard run. The flying hour and availability assessment of current in- ventory may be obtained by running PARCOM in a constrained cost "no sub- stitution" mode with a zero cost limit.
c. Scope of Application
(1) Cases Processed. Figure C-8 shows the eight cases processed in a single PARCOM run. The subdivisions represent parametric variations in:
(a) Cost constraints - with and without. '
(b) Initial inventory of parts - zero or as selected (usually current).
(c) Part replacement policy - "full substitution," "no sub-stitu- tion," or "NMCS = 0." Entries shown as "XXX" indicate user-defined input values. Figure C-8 graphically represents a "nested umbrella" of condi- tions defining each of the eight cases identified at the bottom, i.e., all blocks above Case ID in the chart state the defining conditions of that case. These are also implicit in the Case ID, interpreted as follows:
C-18
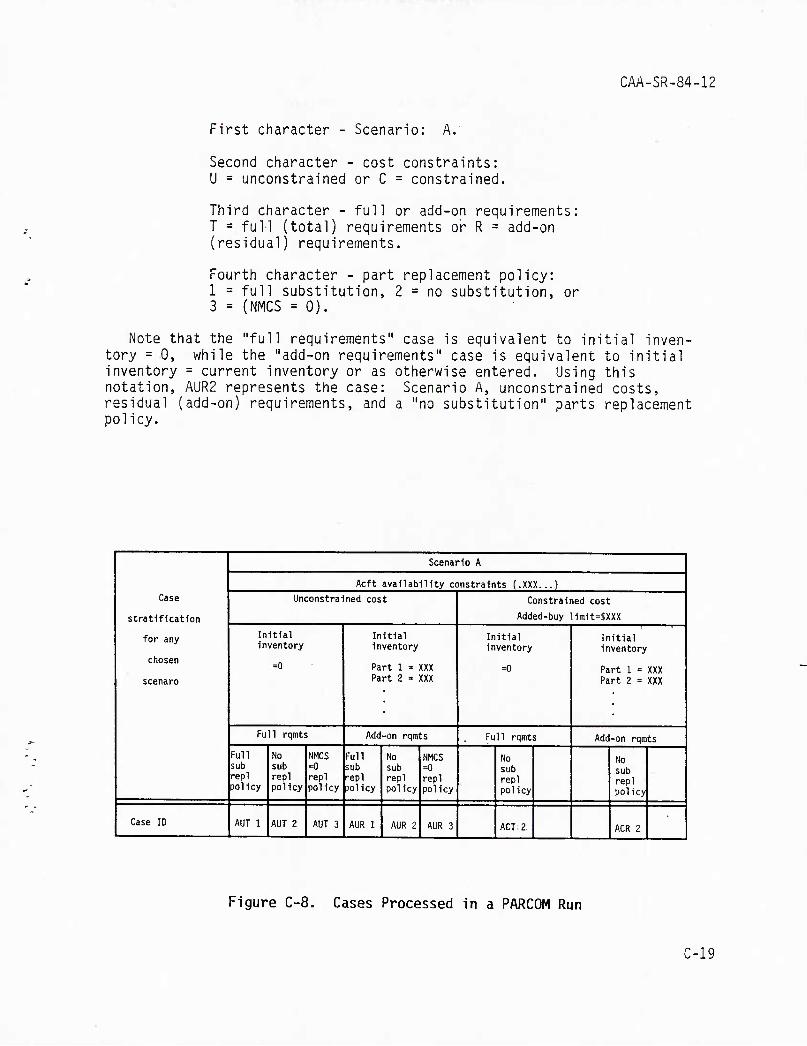
;» (T T ^r^r I ■
CAA-SR-84-12
First character - Scenario: A. .
Second character - cost constraints: U = unconstrained or C = constrained.
Third character - full or add-on requirements: T = full (total) requirements or R = add-on (residual) requirements.
Fourth character - part replacement policy: 1 = full substitution, 2 = no substitution, or 3 = (NMCS =0).
Note that the "full requirements" case is equivalent to initial inven- tory = 0, while the "add-on requirements" case is equivalent to initial inventory = current inventory or as otherwise entered. Using this notation, AUR2 represents the case: Scenario A, unconstrained costs, residual (add-on) requirements, and a "no substitution" parts replacement policy.
Case
stratification
for any
chosen
scenaro
Scenario A
Acft availability constraints (.XXX...)
Unconstrained cost Constrained cost
Added-buy limit=$XXX
Initial inventory
=0
Initial inventory
Part 1 = XXX Part 2 = XXX
Initial inventory
=0
Initial Inventory
Part 1 = XXX Part 2 = XXX
Full rqmts Add-on rqmts Ful1 rqmts Add-on rqmts
Full sub repl policy
No sub repl policy
NMCS =0 repl policy
Full sub repl jolicy
No sub repl policy
NMCS =0 repl policy
No sub repl policy
No sub repl policy
Case ID AUT 1 AUT 2 AUT 3 AUR 1 AUR 2 AUR 3 ACT. 2 ACR 2
Figure C-8. Cases Processed in a PARCOM Run
C-19
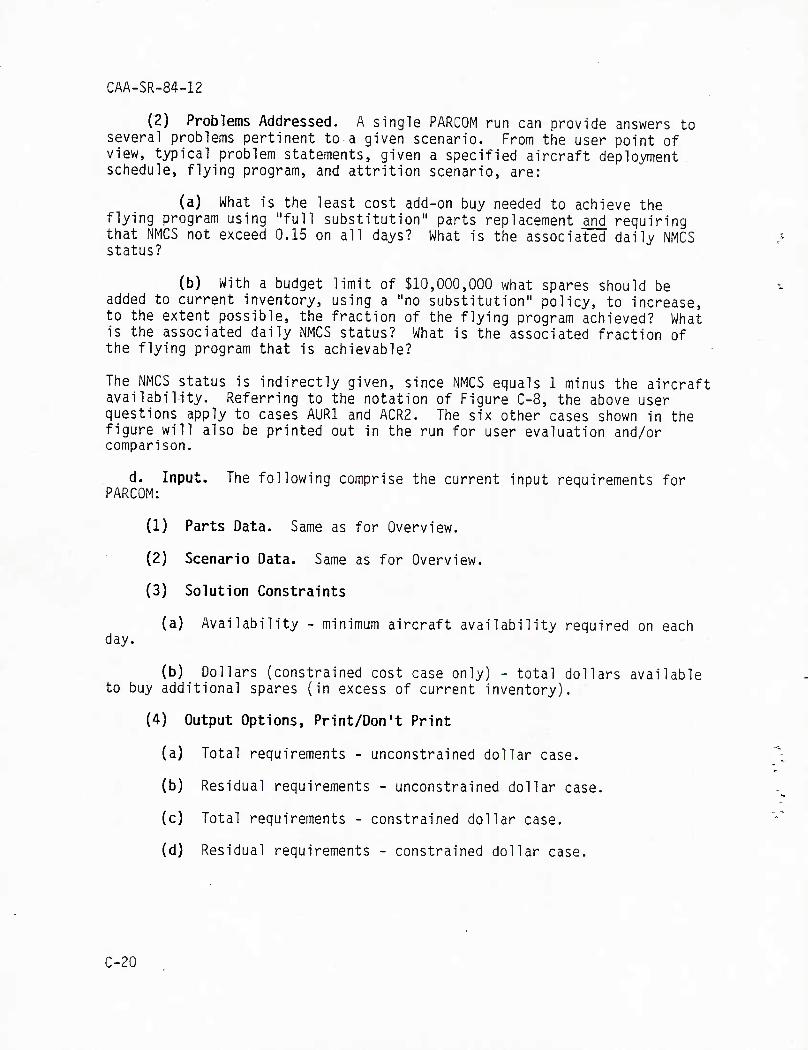
CAA-SR-84-12
(2) Problems Addressed. A single PARCOM run can provide answers to several problems pertinent to a given scenario. From the user point of view, typical problem statements, given a specified aircraft deployment . schedule, flying program, and attrition scenario, are:
(a) What is the least cost add-on buy needed to achieve the flying program using "full substitution" parts replacement and requiring that NMCS not exceed 0.15 on all days? What is the associated daily NMCS status?
(b) With a budget limit of $10,000,000 what spares should be added to current inventory, using a "no substitution" policy, to increase, to the extent possible, the fraction of the flying program achieved? What is the associated daily NMCS status? What is the associated fraction of the flying program that is achievable?
The NMCS status is indirectly given, since NMCS equals 1 minus the aircraft availability. Referring to the notation of Figure C-8, the above user questions apply to cases AURl and ACR2. The six other cases shown in the figure will also be printed out in the run for user evaluation and/or comparison.
d. Input. The following comprise the current input requirements for PARCOM:
(1) Parts Data. Same as for Overview.
(2) Scenario Data. Same as for Overview.
(3) Solution Constraints
(a) Availability - minimum aircraft availability required on each day.
(b) Dollars (constrained cost case only) - total dollars available to buy additional spares (in excess of current inventory).
(4) Output Options, Print/Don't Print
(a) Total requirements - unconstrained dollar case.
(b) Residual requirements - unconstrained dollar case.
(c) Total requirements - constrained dollar case.
(d) Residual requirements - constrained dollar case.
C-20
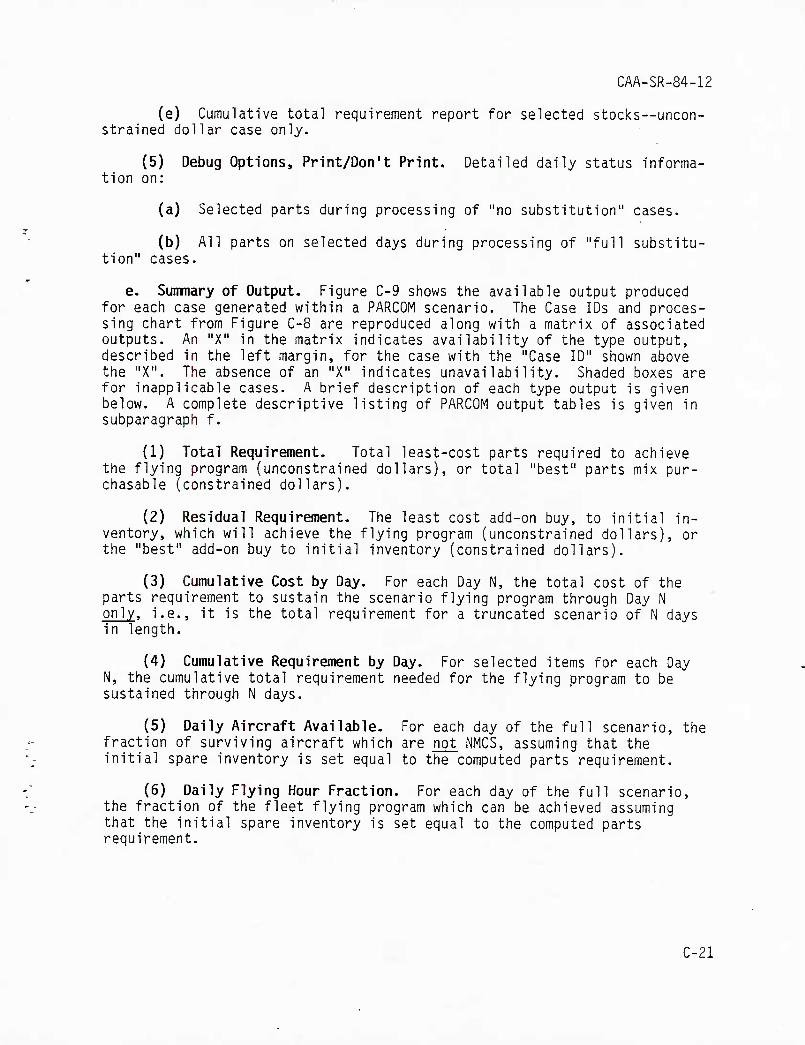
CAA-SR-84-12
(e) Cumulative total requirement report for selected stocks--uncon- strained dollar case only.
(5) Debug Options, Print/Don't Print. Detailed daily status informa- tion on:
(a) Selected parts during processing of "no substitution" cases.
(b) All parts on selected days during processing of "full substitu- tion" cases.
e. Summary of Output. Figure C-9 shows the available output produced for each case generated within a PARCOM scenario. The Case IDs and proces- sing chart from Figure C-8 are reproduced along with a matrix of associated outputs. An "X" in the matrix indicates availability of the type output, described in the left margin, for the case with the "Case ID" shown above the "X". The absence of an "X" indicates unavailability. Shaded boxes are for inapplicable cases. A brief description of each type output is given below. A complete descriptive listing of PARCOM output tables is given in subparagraph f.
(1) Total Requirement. Total least-cost parts required to achieve the flying program (unconstrained dollars), or total "best" parts mix pur- chasable (constrained dollars).
(2) Residual Requirement. The least cost add-on buy, to initial in- ventory, which will achieve the flying program (unconstrained dollars), or the "best" add-on buy to initial inventory (constrained dollars).
(3) Cumulative Cost by Day. For each Day N, the total cost of the parts requirement to sustain the scenario flying program through Day N only, i.e., it is the total requirement for a truncated scenario of N days in length.
(4) Cumulative Requirement by Day. For selected items for each Day N, the cumulative total requirement needed for the flying program to be sustained through N days.
(5) Daily Aircraft Available. For each day of the full scenario, the fraction of surviving aircraft which are not NMCS, assuming that the initial spare inventory is set equal to the computed parts requirement.
(6) Daily Flying Hour Fraction. For each day of the full scenario, the fraction of the fleet flying program which can be achieved assuming that the initial spare inventory is set equal to the computed parts requirement.
C-21
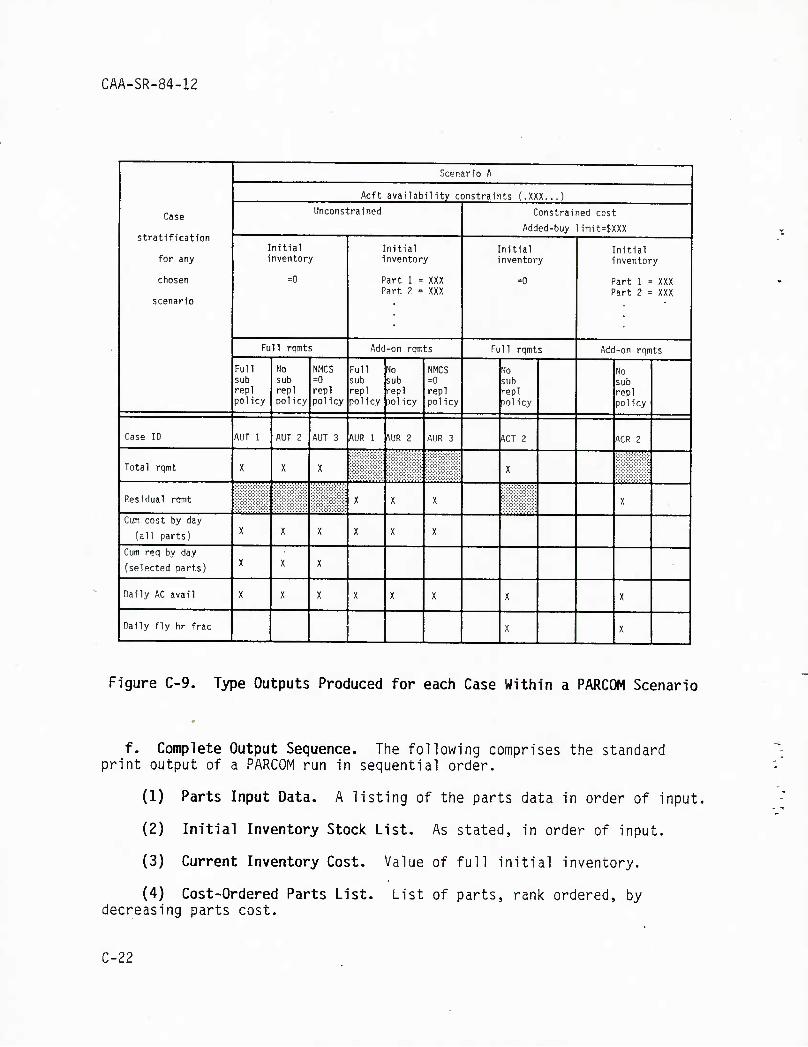
CAA-SR-84-12
Case
stratification
for any
chosen
scenario
Scenario A
Acft availability constraints (.XXX...)
Unconstrained Constrained cost
Added-buy limit=$XXX
Initial inventory
=0
Initial inventory
Part 1 = XXX Part 2 = XXX
Initial inventory
=0
Initial inventory
Part 1 = XXX Part 2 = XXX
Full rqmts Add-on rqmts Full rqmts Add-on rqmts
Full sub repl policy
Mo sub repl policy
NMCS =0 repl policy
Full sub repl policy
to sub repl 3olicy
NMCS =0 repl policy
No sub repl policy
No sub repl policy
Case ID AUT 1 AUT 2 AUT 3 AUR 1 ^UR 2 AUR 3 ACT 2 ACR 2
Total rqmt X X X X
Residual rqmt X X X X
Cum cost by day
(all parts) X X X X X X
Cum req by day
(selected parts) X X X
Daily AC avail X X X X X X X X
Daily fly hr frac X X
Figure C-9. Type Outputs Produced for each Case Within a PARCOM Scenario
f. Complete Output Sequence. The following comprises the standard print output of a PARCOM run in sequential order.
(1) Parts Input Data. A listing of the parts data in order of input.
(2) Initial Inventory Stock List. As stated, in order of input.
(3) Current Inventory Cost. Value of full initial inventory.
(4) Cost-Ordered Parts List. List of parts, rank ordered, by decreasing parts cost.
C-22
CAA-SR-84-12
(5) Unconstrained Dollar Total Requirements Costs. Total cost of least-cost requirements for the unconstrained dollar case, with initial inventory = 0 and using each of the three part replacement policies.
(6) Unconstrained Dollar Residual Requirements Costs. Total cost of add-on buy for the unconstrained dollar case, with initial inventory as selected (e.g., current inventory) and using each of the three part replacement policies.
(7) Constrained Dollar Cost Limits. Add-on buy limit (input). Could also be used for constrained cost limit for initial provisioning.
(8) Unconstrained Dollar Total Requirements List. Total least-cost parts requirements in the unconstrained dollar case, with initial inventory = 0 and using each of the three part replacement policies.
(9) Unconstrained Dollar Residual Requirements List. Least-cost parts requirements for the add-on buy in the unconstrained dollar case, with initial inventory as selected for each part replacement policy.
(10) Force Capability Using Unconstrained Dollar Total Requirements. Aircraft availability (fraction surviving aircraft not in NMCS status) on each day for the "full substitution" and "no substitution" replacement policies, assuming that the computed "unconstrained dollar total requirement" is stocked and available on Day 1. The minimum aircraft availability required on each day in order to achieve the flying program is also given.
(11) Force Capability Using Unconstrained Dollar Residual Require- ments. The same daily aircraft availability data as (10), but under the assumption that the computed residual requirement is added to the initial (selected) inventory.
(12) Cumulative Stock Requirements for Selected Items. Cumulative least-cost stock required through each day for each of (up to) five parts (designated in input) for each part replacement policy in the unconstrained dollar case with initial stock = 0 only.
(13) Cumulative Total Stock Requirement Costs. The cumulative cost of the total (initial inventory = 0) requirements solution through each day for each part replacement policy in the unconstrained dollar case.
(14) Cumulative Residual Stock Requirement Costs. The cumulative cost of the add-on (over initial inventory) cost of the residual (initial inven- tory as selected) solution through each day for each part replacement policy in the unconstrained dollar case.
(15) Constrained Dollar Total Requirements List. Total "best" requirements (each part) in the constrained dollar case with a "no substitution" policy and with initial inventory = 0, and solution cost
C-23
CAA-SR-84-12
limit = cost of current inventory plus add-on buy limit. A "best" mix of parts is one which, for a fixed cost, maximizes the number of purchasable ■ items from the unconstrained cost requirement. For a "no substitution" policy, such a goal tends toward maximum flying hour productivity.
(16) Constrained Dollar Residual Requirements List. Add-on require- ments (additions to the initial inventory) in the constrained dollar case with a "no substitution" policy and with solution cost limit = add-on buy limit.
(17) Force Capability Using Constrained Dollar Total Requirements. The daily aircraft availability and fraction of daily flying hour requirement which are achievable (on average) using a "no substitution" replacement policy, and assuming that the initial spare pool stock is the total stock requirement computed in the constrained cost case.
(18) Force Capability Using Constrained Dollar Residual Requirements. The daily aircraft availability and fraction of daily flying hour require- ment which are achievable using a "no substitution" replacement policy, and assuming that initial spare pool stock is the sum of the initial (selected) inventory and the residual cost-constrained requirement shown in (16) above.
C-4. SESAME AND ACIM
a. Introduction. This section combines a discussion of two models, SESAME (Selected Essential-Item Stockage for Availability Method)8 and ACIM (Availability Centered Inventory Model), because of some common features and limitations.
(1) SESAME. SESAME is a recently established model, developed by IRQ. It is being used successfully for initial provisioning computations and for evaluation of ASL and PLL inventories of fielded weapon systems. The model lends itself well to peacetime computations and has several features (such as modeling of the indenture relationship of parts) which make it suitable for detailed computations of parts requirements. SESAME has also been employed for war reserve materiel requirements (WRMR) computations but, for reasons discussed later, is not as suitable for this purpose. For wartime analyses SESAME assumes constant multiplier factors to account for increased intensities and asset changes during the war period. A postprocessor program makes approximate adjustments to compensate for daily fluctuations. Detailed operational documentation exists.
(2) ACIM. ACIM is based on the same methodological assumptions as SESAME and was judged, for the wartime objectives of this study, to be essentially equivalent. ACIM was developed for the Naval Sea Systems Command by CACI, Inc. It has been approved by the Chief of Naval Operations for computing ship level stockage for select systems. No formal documentation of the model was identified. Information for this study was
C-24
CAA-SR-84-12
obtained through a briefing by CACI personnel and through verbal and written follow-up communications.
b. Logic. SESAME and ACIM assume closed-form mathematical expressions for the distribution of assets in the repair and supply pipelines, requiring that certain parameters be stable or constant over the time analyzed. As such, the methods do not allow for daily variations in demands due to varying flying hour requirements (due to changes in combat intensity), aircraft levels (due to deployment or attrition), and parts inventory levels (due to phased deployment). Part demands are based on failures per day for a given constant flying intensity. The models specify availability for a constant flying intensity and force level with no attrition.
c. Limitations. SESAME and ACIM, although good models for peacetime analysis and, perhaps, wartime unit (ASL/PLL) stockage computations, were judged to be less appropriate for fleet wartime analysis than the other candidate models. This judgment is based on the fact that SESAME and ACIM at present do not directly model: (1) phased deployment of aircraft and AVIM/AVUM stocks, (2) daily varying flying intensities, and (3) daily air- craft attrition rates. Further, it was judged that modification of either of the models to relieve these limitations would involve a major effort.
(1) Phased Deployment. Since the majority of the Army aviation assets (including National Guard and Reserve assets) are maintained in CONUS during peacetime, it is common to all predicted Army wartime scenarios that a majority of aircraft and their supporting maintenance capability (including AVIM and AVUM spare parts) are deployed on a phased schedule after hostilities commence. In particular, the primary scenarios (e.g., Europe and Southwest Asia theaters) call for phased deployments over a substantial period of time. It is felt, therefore, that any model used to assess wartime capability and requirements must account for the daily variations in fleet levels and aircraft maintenance/supply. SESAME and ACIM do not allow for specification of a detailed deployment schedule.
(2) Variable Flying Hours. Primarily because of the phased deployment of aviation assets and changing combat intensity, most if not all Army wartime scenarios project wide variations in the required daily fleet flying hours. It is believed that a wartime capability/requirements model must treat these daily variations directly, rather than assume a constant level and attempt to adapt the results to wartime afterwards, as would be necessary with SESAME or ACIM.
(3) Variable Attrition. Aircraft attrition is an inherent attribute of combat, although expected attrition rates are controversial and predic- tions vary widely. Most predictions of attrition are high enough to significantly affect calculations of spare parts needs. SESAME and ACIM do not presently allow for specification of varying attrition rates.
d. Conclusion. Since SESAME and ACIM were determined to be less than desirable in the above areas, and since the other models examined did not
C-25
CAA-SR-84-12
have comparable limitations, study emphasis was placed on the other models. No operational evaluation was performed with SESAME or ACIM.
C-5. DYNA-METRIC
a. Introduction. The Dyna-METRIC (Dynamic Multi-Echelon Technique for Recoverable Item Control) Model^JO ^as developed, and is maintained, by the Rand Corporation for the Air Force. The model, like SESAME and ACIM, is a derivative of the METRIC Model methodology. Dyna-METRIC (as suggested by its name), however, has been improved to model certain dynamic aspects characteristic of wartime (variable daily flying intensity, variable daily attrition, and phased deployment of aircraft and parts),
(1) USAF Experience. Dyna-METRIC is used by the Air Force Logistics Command and other USAF logistics elements for detailed logistics analysis, although it is not a routine part of the Air Force planning, programing, budgeting, or execution processes. As indicated earlier, HQ USAF employs Overview for gross estimates of budgeting effects on wartime capability. On the other hand, the formal Air Force requirements process uses the D041 and related systems, which are similar in methodological approach to the Army's CCSS process.
(2) Basis for Evaluation. Time did not permit an operational test of Dyna-METRIC in this study. The model was evaluated based on research of the published literature and lengthy contact with knowledgeable Rand staff.
b. Logic - Comparisons with Overview and PARCOM
(1) Probabilistic Distributions. Dyna-METRIC treats failure rates and repair times as probabilistic distributions. There are arguments that wartime distributions are more complex than assumed by Dyna-METRIC. However, while Dyna-METRIC distribution assumptions are still approximations, they represent a significant improvement over the more simplistic expected value assumptions of Overview/PARCOM.
(2) Maintenance. Dyna-METRIC in its present form allows for some improvement in the modeling of maintenance resources over Overview and PARCOM. Dyna-METRIC allows for specification of support test equipment and for delaying the availability of certain levels of maintenance at repair facilities. None of the models account for increased wartime queuing delays associated with heavier loads on repair personnel.
(3) Indenture. Dyna-METRIC allows for modeling the indenture rela- tionship of parts. The user defines parts as line replaceable units (LRU), shop replaceable units (SRU), or subSRUs and specifies the associated re- pair patterns at each echelon of repair. This is a capability not available with Overview and PARCOM. While such a capability would allow for a more accurate solution, it is questionable if the required supporting data could be obtained with a reasonable effort.
(4) Controlled Substitution. Dyna-METRIC includes a controlled sub- stitution mode not available with Overview and PARCOM. In this mode full C-25
CAA-SR-84-12
substitution is allowed but only at maintenance facilities common to a geo- graphic location. This fairly realistic substitution policy is difficult to implement in Overview or PARCOM, since their AVUM and AVIM level mainte- nance is aggregated at a single location.
c. Limitations
(1) Scenario Size. The major limitations of Dyna-METRIC are: (1) its orientation toward the Air Force operating structure, and (2) its added complexity and associated lengthy computer execution times and additional data requirements. The model supports three echelons of maintenance: base, CIRF (Centralized Intermediate Repair Facility), and depot. For Army purposes aviation units would usually have to be represented as bases, since they are geographically separate from each other and their AVIMs. AVIMs would be modeled as CIRFs. Analyzing a theater force would push the practical limitations of the model, as more base and CIRF equivalents would be needed than to represent the largest Air Force problem. It is likely that the modeler would need to make some simplifying assumptions concerning the force structure. This would introduce inaccuracies in the solution and partially offset the benefits of the model's extra features.
(2) Phased Deployment. In Dyna-METRIC phased deployment of aircraft and AVUM/AVIM parts stocks would be "jery cumbersome, possibly because deployment of substantial assets over an extended period was not considered important for Air Force scenarios.
(3) Indenture. Because of difficulties in obtaining supporting data and because of large central memory demands for an Army theater level analysis, multi-indenture part definition would probably not be practical for quick turnaround analyses with Dyna-METRIC (or any model).
(4) Flying Hours and Attrition. Flying hour requirements and attri- tion specification is not as flexible as with Overview and PARCOM. With Dyna-METRIC, flying hours and attrition are interrelated with specifications of required aircraft sortie rates.
d. Status
(1) Run Time. Dyna-METRIC ran quickly (less than 1 minute central processor execution time) for two sample demonstration runs during a CAA visit to Rand, but execution time increases dramatically for larger prob- lems. Run time is dependent on the number of different part types, the number of AVUMs, AVIMs, and depots, and the duration of the time period being analyzed. The estimated execution time for a theater level run in- cluding 1,400 aircraft, 300 part types, 1 depot, 35 AVIMs, and 120 AVUMs analyzed over 120 days of wartime is 3 hours.
(2). Operability. The model is fully operational in its present form. However, minor modifications (such as increasing the number of units allowed at each echelon) would be required for use on Army problems.
C-27

CAA-SR-84-12
Anticipated modification needs are judged to be low risk and requiring mod- erate to low effort, if performed by the model developer.
(3) Support and Transportability. Integrity and transportability of Dyna-METRIC are judged to be excellent. The model is documented, and the documentation is updated along with changes to the model. The developer serves as a central point for distributing the model and documentation to assure consistency among its users. Applications assistance is provided. Software problems are reported to the developer, who locates the trouble and disseminates appropriate corrections to the software and documentation. Ongoing improvements are normal and result periodically in new versions, which are distributed to the user community. Current versions are written in ANSI FORTRAN 77 and are presently operational on IBM, Honeywell 6000, Wang, Cyber, and VAX hardware.
e. Evaluation
(1) Comparison with SESAME AND ACIM. Dyna-METRIC is preferable to SESAME and ACIM. It shares their primary attributes and does not suffer their key limitations described in paragraph C-4.
(2) Comparison with Overview and PARCOM. While Dyna-METRIC appears to be as effective as OVERVIEW and PARCOM for the objectives of this study and may be capable of more detailed answers to a broader spectrum of questions, it may also have problems with theater-level representation. Lack of testing precludes a more definitive evaluation.
f. Conclusions. Dyna-METRIC appears to be an improvement over Overview and PARCOM for answering certain questions. Some of its positive features may be offset by difficulties in obtaining accurate supporting data and by possible size limitations for theater representation. However, model modifications may permit circumvention or alleviation of some of these problems. Only through testing could the question of added capability versus added complexity be resolved. If the Overview/PARCOM shortcomings are not felt to be critical, testing Dyna-METRIC may not be warranted.
C-6. DATA REQUIREMENTS
a. Required Data Elements. The following data is required by Overview and PARCOM to describe the simulated problem (Dyna-METRIC would require some additional data elements and constraint specifications, depending on the additional features to be modeled):
(1) Scenario
(a) Flying Hours - The forecast required flying hours for each type of aircraft simulated, by day or group of days (if constant over a group of days).
(b) Attrition - The forecast attrition for each type of aircraft simulated, specified as either a daily quantity of aircraft lost or as a daily rate per mission. C-28
CAA-SR-84-12
(c) Force Structure - The planned force structure giving, for each aircraft type, the quantity of aircraft per company, the supporting AVIM, and the deployment dates.
(2) Parts. There will be a set of values for these data elements for each part:
(a) NSN - National Stock Number or some other unique 15-digit (or less) numerical identifier.
(b) Unit Cost - estimated current unit purchase cost, in cents.
(c) Unit Repair Cost - estimated current unit cost to repair, in cents. This data element is not important if repair cost analyses are not being performed.
(d) Administrative Lead Time - the time delay between the decision to buy and the signing of a purchase contract, in days.
(e) Production Lead Time - the time delay between signing of a pur- chase contract and delivery, in days.
(f) Retail Repair Time - the mean time required at the retail level (AVIM and AVUM) to repair the specified part, in days. This is turnaround time; the period from when the part arrives at the repair facility to when it has been repaired and is ready to be shipped. It includes actual repair time, unpacking/packing time, time waiting for parts, time waiting for re- pair, coffee breaks, etc.
(g) Depot Repair Time - the mean time required at the depot to re- pair the specified part, in days. This is total turnaround time as described in (f). Retail Repair Time.
(h) Order and Ship Time - the mean time from issuing a requisition at the retail level until the part is delivered to the retail level, in days.
(1) Failure Rate - the number of removals per million flying hours.
(j) Retail NRTS Rate - the percentage of times this part is not repairable at this station, i.e., sent from the retail level (AVIM and AVUM) to the depot for repair.
(k) Retail Condemnation Percentage - the percentage of times this part is judged not repairable and is discarded at the retail level.
(1) Depot Condemnation Percentage - the percentage of times this part is judged not repairable and is discarded at the depot level.
C-29
CAA-SR-84-12
(m) Item Essentiality Code - an integer from 1 to 9 indicating the essentiality of this part for various missions, where 1 indicates the high- est essentiality. No fixed assignment scheme exists. The scheme would be defined for a specific model application.
(n) Serviceable Wholesale Inventory - the quantity of these parts in stock and serviceable at the depot level. Availability of these assets to the retail units during the simulation involves a shipping delay and a time distribution; both are specified in the model run control parameters and are constant for all parts. Due-ins at retail can be aggregated and included with the serviceable wholesale inventory or can be phased in separately by treating them as deployed retail stocks. Other war reserve materiel stocks stored at depot would be included here.
(o) Unserviceable Wholesale Inventory - the initial quantity of this part in unserviceable condition at the depot level.
(p) Serviceable Retail Inventory - the quantity of these parts stocked in the ASL or PLL of each AVIM and AVUM being simulated. A separate value is required for each AVIM and AVUM for each part.
(q) Unserviceable Retail Inventory - the initial quantity of this part in unserviceable condition at the retail level (in past applications this data was not available).
(r) Serviceable Prepositioned War Reserves - the quantity of this part stocked in theater as prepositioned war reserves and in serviceable condition.
(s) Unserviceable Prepositioned War Reserves - the quantity of this part stocked in theater as prepositioned war reserves and in an unservice- able condition. In past applications war reserves could not be distin- guished as serviceable and unserviceable. In those applications all parts were assumed serviceable.
(t) Aircraft Model Application - the aircraft mission design series (MDS) for which this part applies.
(u) Quantity per Aircraft MDS - the quantity of this part used on each applicable MDS.
part. (v) Part Name - an abbreviated 16-character English label for the
(3) File Format. The above described data elements, as presently used by Overview and PARCOM, are loaded into three files designated: (1) the flying program file, (2) the force file, and (3) the parts data base file. A fourth file, the option file, contains run control parameters. A detailed description of the format of these four files is contained in the Overview User's Manual (section 5.1).5
C-30
CAA-SR-84-12
b. Selection of Parts Sets
(1) General. The set of parts selected for past applications of Overview and PARCOM (300-500 parts per aircraft) did not represent all parts on the aircraft. They represented instead a truncated, key set of parts, selected for reasons other than model speed (Overview and PARCOM are fast models, and could easily and quickly handle a much larger set of parts). For example, the availability of data and the labor involved in collecting and adapting the data is one reason for using less than a total set of parts. Also, the difficulties in determining data values for inden- tured assemblies of parts is another major consideration in parts selection.
(2) Past and Present Sets Used. The parts set used for the MAX FLY Study was defined by requirements of another model (TARMS) used in that study. The same parts set was used by Overview so as to allow comparisons and interactions with TARMS. The Overview runs made for this study used that same parts set for consistency and to avoid the labor involved in generating new data. One precaution to be observed in using any given parts set is, if absolute rather than relative dollar conclusions are to be drawn, one must know the relationship between the cost of the parts set used and the cost of all parts.
c. Limitations
(1) Inherent Inaccuracies. Some data elements are not current due to limitations of the contractual process. For example, one must estimate part costs and production lead times based on past purchases, purchase quantities, and educated guesses. One cannot determine accurately the terms for contracts that do not exist. Other data elements also must be estimated because pertinent information does not exist. Wartime order, ship, and repair times, for example, must be estimated based on historical peacetime information.
(2) Unavailable Elements. Key data elements, which are not routinely collected or are not current, are:
(a) Failure rates--only wholesale demands are well known and only for steady-state peacetime.
(b) Future parts costs, production lead times--based on last orders.
(c) Order, ship, and repair times--based on peacetime experience.
(d) Certain retail data only collected on a sample basis, e.g., failure rates, unit repair cost, unit repair time, NRTS rates, unit condem- nation rates, and AVIM/AVUM stock levels.
C-31
CAA-SR-84-12
(3) Nonflying Hour Demands. One last point that should be addressed is the need to account for part demands that are not flying hour related, such as those due to combat damage, and are not otherwise accounted for in the data previously discussed. Data on these types of failures is not readily available. In particular, battle damage data is certainly necessary for a complete analysis of wartime capability and parts requirements. The Army Ballistics Research Laboratory (BRL) performed considerable work in this area in support of the MAX FLY Study. Data resulting from that work was incorporated into MAX FLY TARMS simulations. The predictions performed by BRL required a labor intensive and complex computer prediction process. The need for inclusion of battle damage data should be considered for future wartime applications of Overview and PARCOM.
C-32
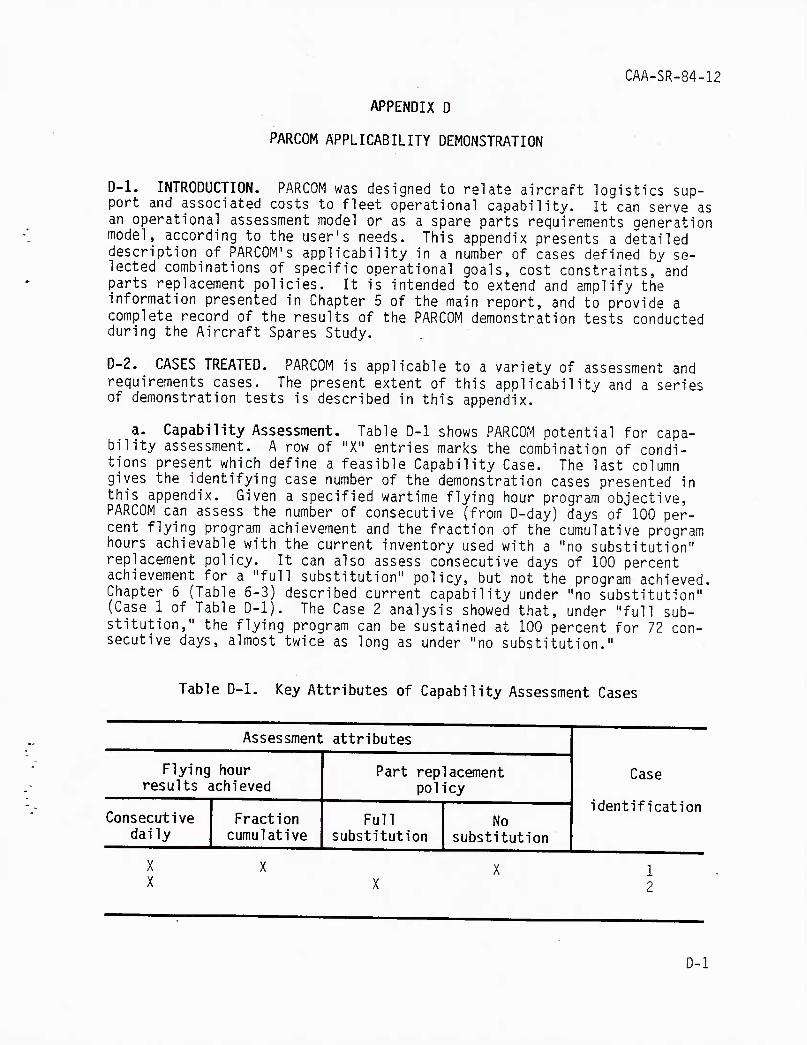
APPENDIX D
PARCOM APPLICABILITY DEMONSTRATION
CAA-SR-84-12
D-1. INTRODUCTION. PARCOM was designed to relate aircraft logistics sup- port and associated costs to fleet operational capability. It can serve as an operational assessment model or as a spare parts requirements generation model, according to the user's needs. This appendix presents a detailed description of PARCOM's applicability in a number of cases defined by se- lected combinations of specific operational goals, cost constraints, and parts replacement policies. It is intended to extend and amplify the information presented in Chapter 5 of the main report, and to provide a complete record of the results of the PARCOM demonstration tests conducted during the Aircraft Spares Study.
D-2. CASES TREATED. PARCOM is applicable to a variety of assessment and requirements cases. The present extent of this applicability and a series of demonstration tests is described in this appendix.
a. Capability Assessment. Table D-1 shows PARCOM potential for capa- bility assessment. A row of "X" entries marks the combination of condi- tions present which define a feasible Capability Case. The last column gives the identifying case number of the demonstration cases presented in this appendix. Given a specified wartime flying hour program objective, PARCOM can assess the number of consecutive (from D-day) days of 100 per- cent flying program achievement and the fraction of the cumulative program hours achievable with the current inventory used with a "no substitution" replacement policy. It can also assess consecutive days of 100 percent achievement for a "full substitution" policy, but not the program achieved. Chapter 6 (Table 5-3) described current capability under "no substitution" (Case 1 of Table D-1). The Case 2 analysis showed that, under "full sub- stitution," the flying program can be sustained at 100 percent for 72 con- secutive days, almost twice as long as under "no substitution."
Table D-1. Key Attributes of Capability Assessment Cases
Assessment attributes
Flying hour results achieved
Part replacement policy
Case
Consecutive daily
Fraction cumulative
Full substitution
No substitution
identification
X X X
X X
1 2
D-1
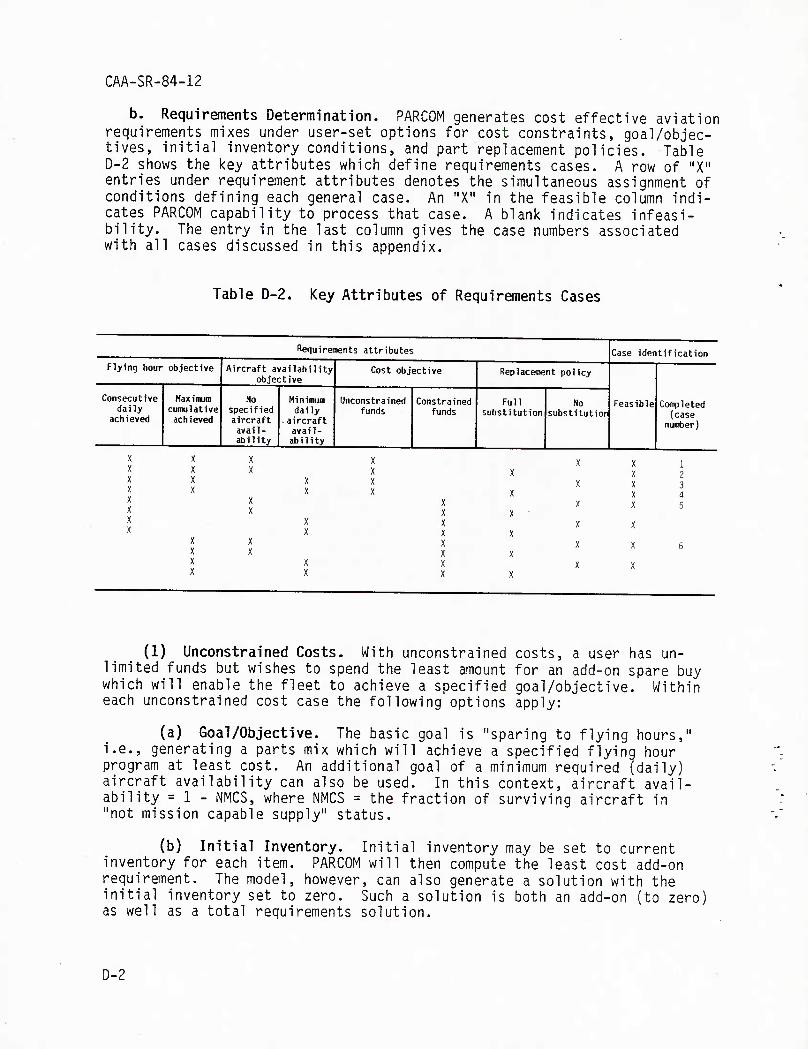
CAA-SR-84-12
b. Requirements Determination. PARCOM generates cost effective aviation requirements mixes under user-set options for cost constraints, goal/objec- tives, initial inventory conditions, and part replacement policies. Table D-2 shows the key attributes which define requirements cases. A row of "X" entries under requirement attributes denotes the simultaneous assignment of conditions defining each general case. An "X" in the feasible column indi- cates PARCOM capability to process that case. A blank indicates infeasi- bility. The entry in the last column gives the case numbers associated with all cases discussed in this appendix.
Table D- 2. Key Attributes of Requirements Cases
Requirements attri butes Case 1 dentlfication
Flying hour objective Aircraft availability Cost objective Replacement policy objective
Feasi Nip Consecutive Maximum No Minimum Unconstrai ned Constrained Full No Cofroleted daily cumulative specified daily funds funds substitution substitution achieved achieved aircraft
avail- ability
aircraft avail- ability
number)
X X X X X X 1 X X X X X X 2 X X X X X X 3 X X X X X X 4 X X
X X
X X
X X
X 5
X X X X X X X X X X X X X X 6 X X X X X X X X X X X X X
(1) Unconstrained Costs. With unconstrained costs, a user has un- limited funds but wishes to spend the least amount for an add-on spare buy which will enable the fleet to achieve a specified goal/objective. Within each unconstrained cost case the following options apply:
(a) Goal/Objective. The basic goal is "sparing to flying hours," i.e., generating a parts mix which will achieve a specified flying hour program at least cost. An additional goal of a minimum required (daily) aircraft availability can also be used. In this context, aircraft avail- ability = 1 - NMCS, where NMCS = the fraction of surviving aircraft in "not mission capable supply" status.
(b) Initial Inventory. Initial inventory may be set to current inventory for each item. PARCOM will then compute the least cost add-on requirement. The model, however, can also generate a solution with the initial inventory set to zero. Such a solution is both an add-on (to zero) as well as a total requirements solution.
D-2
CAA-SR-84-12
(c) Part Replacement Policy. Whether or not a failed critical part degrades aircraft flying hour productivity depends on the part replacement policy used. Under a "no substitution" policy only a spare may replace a failed part. Under a "full substitution" policy a failed part may be re- placed by either a spare or, if a spare is not readily available, by a ser- viceable part removed from an aircraft which is already NMC (not mission capable). A third part replacement policy is "NMCS = 0," which has, as a goal, the replacement of alj_ failed parts with spares. Basically the "NMCS = 0" policy is just a "no substitution" policy with an additional require- ment that daily aircraft availability be 1.00. This variation is of in- terest since it represents the most expensive plausible policy. In a sense, all else being equal, a "full substitution" policy is associated with the "cheapest" buy while fulfilling the flying program, while the "NMCS = 0" policy is associated with the "most expensive" buy ("covering" all failures with spares).
(2) Constrained Costs. While the unconstrained cost solution is the one that "best" meets the flying program, a "total requirements" buy may not be affordable if funds are limited. With constrained costs, a user wishes to apply limited funds to buy a cost effective slice of the total requirements best buy. The associated options are:
(a) Goal/Objective. With a "no substitution" policy (see (c) below), the basic goal is to maximize the number of "required" parts (given uncon- strained funds) which are purchased with the constrained budget. Such a goal tends toward maximizing the fraction of the flying program achievable with the constrained budget. Thus, the flying program (possibly in con- junction with aircraft availability constraints) is a part of the goal/ objective.
(b) Initial Inventory. The basic constrained cost solution assumes initial inventory = current inventory and computes an add-on solution. As an option, the model also computes a solution with the initial inventory = 0, and with the total cost constraint equal to the value of the current inventory plus the add-on cost constraint. Such a solution is predicated on getting a refund for current inventory—a case of limited practical interest.
(c) Part Replacement Policy. Only a "no substitution" part re- placement policy is treated in constrained cost cases. Study resource lim- itations and methodological complications precluded Inclusion of a con- strained cost mode with "full substitution".
D-3. PRESENTATION SEQUENCE. The application cases discussed herein were developedin response to the Question Set for Demonstration Test, Table 1-1 of the main text. The approach taken was to revise and order the questions for ease of address with PARCOM, then to state and answer the questions, and finally to analyze the results. The cases presented are cross-refer- enced with the case numbers of Tables D-1 and D-2. The specific sequence and nature of the questions treated are:
D-3
CAA-SR-84-12
a. Initial Inventory Value. The question is "What is the value (cost) of current inventory?" The answer does not need a requirements calculation: it is merely a summary of part of the input data base.
b. Unconstrained Cost with Current Inventory Base. This section treats only cases which assume that initial inventory equals current (real-world) inventory, i.e., the model starts with a "sunk" investment in spare stocks. Such an assumption corresponds to conditions prevailing when replenishment (as opposed to initial provisioning) is computed. The cases treated are subcases of Requirements Cases 1, 2, and 3 in Table D-2.
(1) Quantity/Types of Parts Required. The question is "What addition- al spare parts are required to achieve the flying program at least cost?" Answers are computed for all three part replacement policies.
(2) Cost of Required Mixes. The question is "What is the cost of the least cost add-on requirement?"
(3) Dominant Part Types. The question is "What are the costs of requirements for each part type, and which parts dominate costs?"
(4) Resulting Aircraft Availability. The question is "What aircraft availability is reflected in the solution mixes generated in (1) above?" The answer requires a capability assessment assuming that the computed add- on requirements are added to retail stocks.
c. Unconstrained Cost with Zero Inventory Base. This section treats only cases which assume a zero (empty) initial spare inventory. Such an assumption corresponds to conditions prevailing under initial provisioning (as opposed to replenishment) spare requirement computations. The cases treated are subcases of Requirements Cases 1, 2, and 3 of Table D-2.
(1) Quantity/Types of Parts Required. The question again is "What spare parts are needed to achieve the flying program at least cost?" But also desired is "How are these different from the solution for initial inventory = current inventory?"
(2) Cost of Required Mixes. The question is "What is the cost of the least-cost "total requirement" solution? How does this answer compare with the solution for initial inventory = current inventory?"
(3) Dominant Part Types. The question is "What are the costs of requirements for each part type, and which parts dominate?"
(4) Resulting Aircraft Availability. The question is "What aircraft availability is reflected in the solution mixes generated?" The answer requires a capability assessment under the assumption that total spare inventory is equal to the "total requirements" mix generated by PARCOM.
D-4
CAA-SR-84-12
d. Constrained Aircraft Availability. A user may wish to determine the best requirements mix which will achieve the specified flying program and will maintain a minimum daily aircraft availability. Different days may" have different availability requirements. The questions to be answered are: "What is the add-on cost of a requirements mix meeting an 85 percent minimum daily aircraft availability objective in addition to the flying program? How much does a 100 percent availability objective cost?" Initial inventory is set equal to current inventory and results generated for the two basic part replacement policies. The cases treated are subcases of Requirements Cases 3 and 4 in Table D-2.
e. Constrained Cost with Current Inventory Base. Given a limit on funds available for add-on spare procurement and a "no substitution" policy, PARCOM calculates an affordable cost-effective "slice" of the unconstrained cost requirements mix. Typical applications are given below. The cases treated are subcases of Requirement Case 6 in Table D-2.
(1) Quantity/Types of Parts Required. The question is "What are the relationships between the solution part mixes and the available money?" The change in composition of solution mixes is examined as the expenditure constraint is varied.
(2) Cost Versus Achieved Flying Hours. The question is "With the "no substitution" policy, what is the improvement in achievable program flying hours as the expenditure constraint (on add-on spares) decreases?" The answer is generated from a sample of constrained cost cases with a goal of maximizing the supply of required parts (and, in turn, the flying hours produced). ^
(3) Cost Versus Aircraft Availability. The question is "With the 'no substitution' policy, what is the improvement in achievable aircraft avail- ability as the expenditure constraint (on add-on spares) decreases'?" The answer is generated from the results of the cases treated in (2) above.
^ f. Comparison - Constrained Versus Unconstrained Cost. The question is using a 'no substitution' policy, what is the difference in achievable
daily program flying hours and aircraft availability reflected in the uncon- strained cost solution vis-a-vis a constrained cost solution with an add-on limit of $1QM?" The answer requires a comparison of solutions generated in paragraphs e and b above.
g. Cost Versus Days of Sustainability. The question is "What is the least add-on spares cost to sustain the first N days at 100 percent of the flying program for N = 1, 2, ..., 120?" The answer is a byproduct of the solution process for the questions of paragraph b. Unconstrained costs and initial inventory = current inventory are assumed. The cases treated are subcases of Requirements Cases 1, 2, and 3 in Table D-2.
D-5
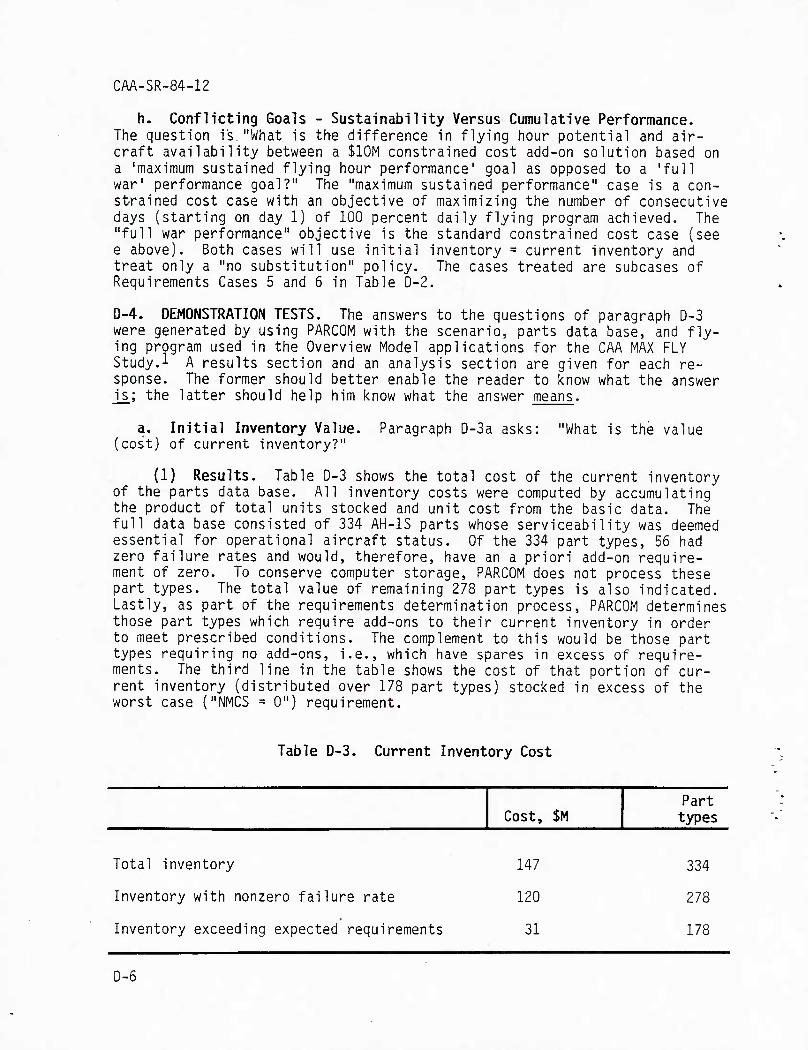
CAA-SR-84-12
h. Conflicting Goals - Sustainability Versus Cumulative Performance. The question is "What is the difference in flying hour potential and air- craft availability between a $10M constrained cost add-on solution based on a 'maximum sustained flying hour performance' goal as opposed to a 'full war' performance goal?" The "maximum sustained performance" case is a con- st-rained cost case with an objective of maximizing the number of consecutive days (starting on day 1) of 100 percent daily flying program achieved. The "full war performance" objective is the standard constrained cost case (see e above). Both cases will use initial inventory = current inventory and treat only a "no substitution" policy. The cases treated are subcases of Requirements Cases 5 and 6 in Table D-2.
D-4. DEMONSTRATION TESTS. The answers to the questions of paragraph D-3 were generated by using PARCOM with the scenario, parts data base, and fly- ing program used in the Overview Model applications for the CAA MAX FLY Study.1 A results section and an analysis section are given for each re- sponse. The former should better enable the reader to know what the answer is; the latter should help him know what the answer means.
a. Initial Inventory Value. Paragraph D-3a asks: "What is the value (cost) of current inventory?"
(1) Results. Table D-3 shows the total cost of the current inventory of the parts data base. All inventory costs were computed by accumulating the product of total units stocked and unit cost from the basic data. The full data base consisted of 334 AH-IS parts whose serviceability was deemed essential for operational aircraft status. Of the 334 part types, 56 had zero failure rates and would, therefore, have an a priori add-on require- ment of zero. To conserve computer storage, PARCOM does not process these part types. The total value of remaining 278 part types is also indicated. Lastly, as part of the requirements determination process, PARCOM determines those part types which require add-ons to their current inventory in order to meet prescribed conditions. The complement to this would be those part types requiring no add-ons, i.e., which have spares in excess of require- ments. The third line in the table shows the cost of that portion of cur- rent inventory (distributed over 178 part types) stocked in excess of the worst case ("NMCS = 0") requirement.
Table D-3. Current Inventory Cost
Cost, $M Part types
Total inventory 147 334
Inventory with nonzero failure rate 120 278
Inventory exceeding expected requirements 31 178
D-5
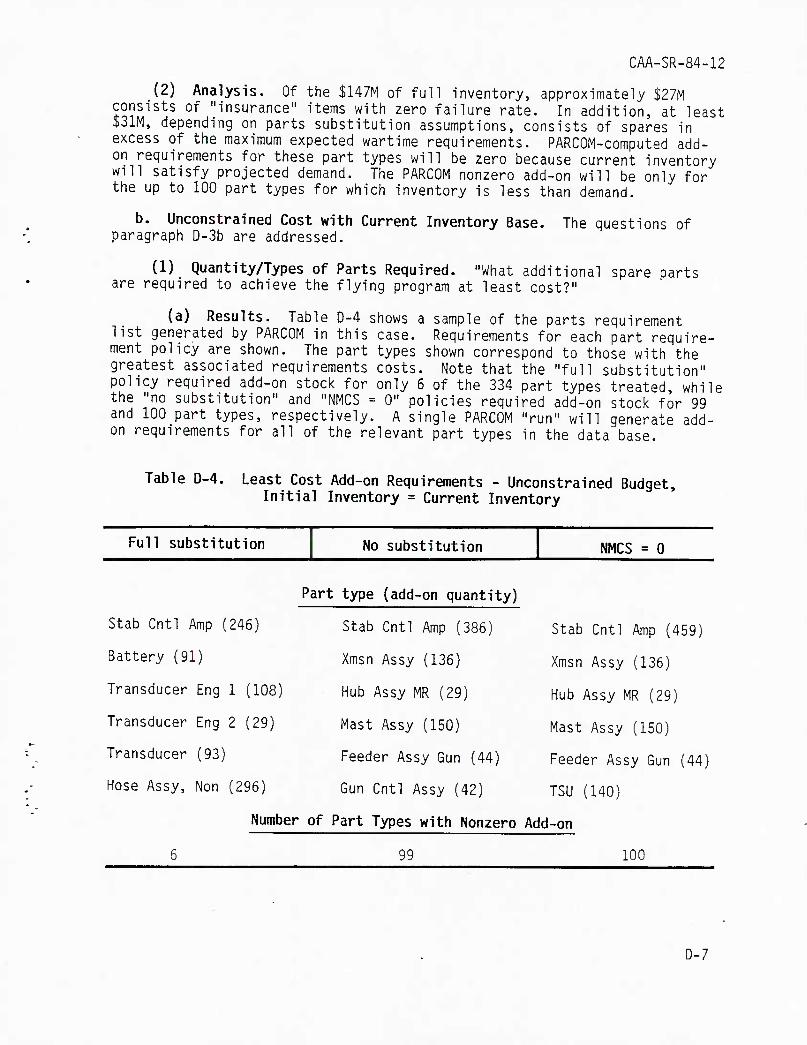
CAA-SR-84-12
(2) Analysis. Of the $147M of full inventory, approximately $27M consists of "insurance" items with zero failure rate. In addition, at least $31M, depending on parts substitution assumptions, consists of spares in excess of the maximum expected wartime requirements. PARCOM-computed add- on requirements for these part types will be zero because current inventory will satisfy projected demand. The PARCOM nonzero add-on will be only for the up to 100 part types for which inventory is less than demand.
b. Unconstrained Cost with Current Inventory Base. paragraph D-3b are addressed.
The questions of
(1) Quantity/Types of Parts Required. "What additional are required to achieve the flying program at least cost?"
spare parts
(a) Results. Table D-4 shows a sample of the parts requirement list generated by PARCOM in this case. Requirements for each part require- ment policy are shown. The part types shown correspond to those with the greatest associated requirements costs. Note that the "full substitution" policy required add-on stock for only 5 of the 334 part types treated, while the "no substitution" and "NMCS = 0" policies required add-on stock for 99 and 100 part types, respectively. A single PARCOM "run" will generate add- on requirements for all of the relevant part types in the data base.
Table D-4. Least Cost Add-on Requirements - Unconstrained Budget, Initial Inventory = Current Inventory
Full substitution No substitution NMCS = 0
Stab Cntl Amp (246)
Battery (91)
Transducer Eng 1 (108)
Transducer Eng 2 (29)
Transducer (93)
Hose Assy, Non (296)
Part type (add-on quantity)
Stab Cntl Amp (386)
Xmsn Assy (136)
Hub Assy MR (29)
Mast Assy (150)
Feeder Assy Gun (44)
Gun Cntl Assy (42) -
Stab Cntl Amp (459)
Xmsn Assy (136)
Hub Assy MR (29)
Mast Assy (150)
Feeder Assy Gun (44)
TSU (140)
Number of Part Types with Nonzero Add-on
99 100
D-7
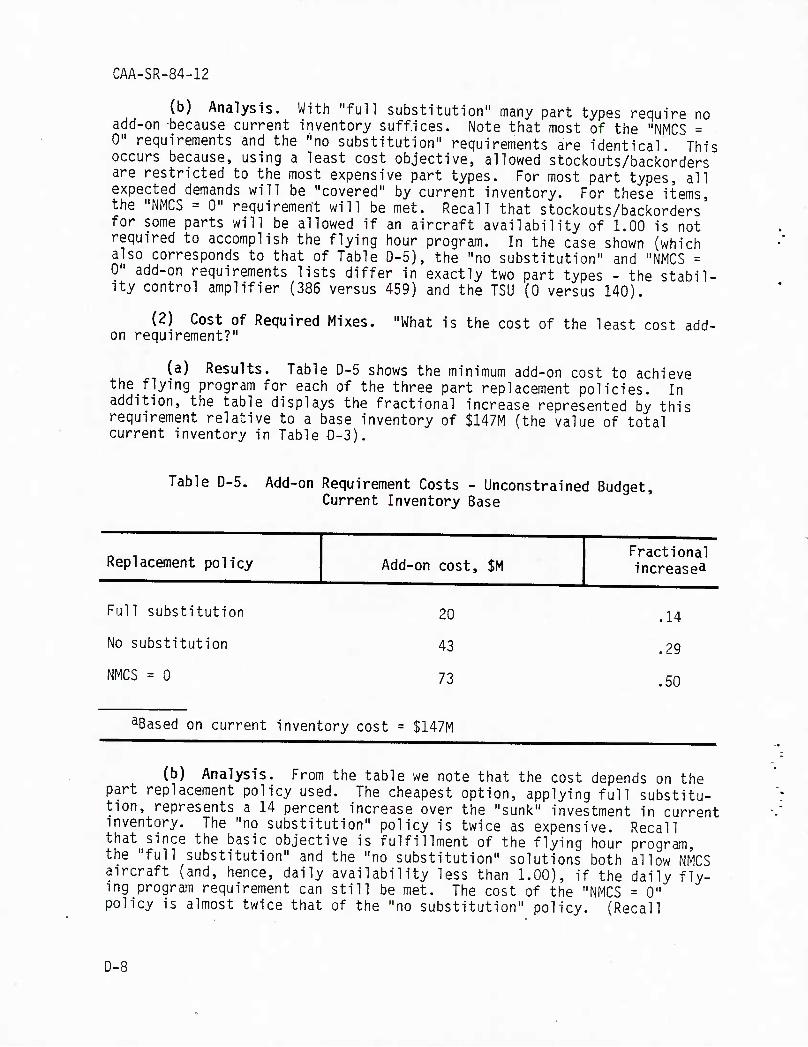
CAA-SR-84-12
(b) Analysis. With "full substitution" many part types require no add-on because current inventory suffices. Note that most of the "NMCS = 0" requirements and the "no substitution" requirements are identical. This occurs because, using a least cost objective, allowed stockouts/backorders are restricted to the most expensive part types. For most part types, all expected demands will be "covered" by current inventory. For these items, the "NMCS = 0" requirement will be met. Recall that stockouts/backorders for some parts will be allowed if an aircraft availability of 1.00 is not required to accomplish the flying hour program. In the case shown (which also corresponds to that of Table D-5), the "no substitution" and "NMCS = 0" add-on requirements lists differ in exactly two part types - the stabil- ity control amplifier (386 versus 459) and the TSU (0 versus 140).
(2) Cost of Required Mixes. "What is the cost of the least cost add- on requirement?"
(a) Results. Table D-5 shows the minimum add-on cost to achieve theflying program for each of the three part replacement policies. In addition, the table displays the fractional increase represented by this requirement relative to a base inventory of $147M (the value of total current inventory in Table 0-3).
Table D-5. Add-on Requirement Costs - Unconstrained Budget, Current Inventory Base
Replacement policy Add-on cost, $M Fractional increase^
Full substitution 20 .14
No substitution 43 _29
NMCS =0 73 .50
^Based on current inventory cost = $147M
(b) Analysis. From the table we note that the cost depends on the part replacement policy used. The cheapest option, applying full substitu- tion, represents a 14 percent increase over the "sunk" investment in current inventory. The "no substitution" policy is twice as expensive. Recall that since the basic objective is fulfillment of the flying hour program, the "full substitution" and the "no substitution" solutions both allow NMCS aircraft (and, hence, daily availability less than 1.00), if the daily fly- ing program requirement can still be met. The cost of the "NMCS = 0" policy is almost twice that of the "no substitution" policy. (Recall
D-8
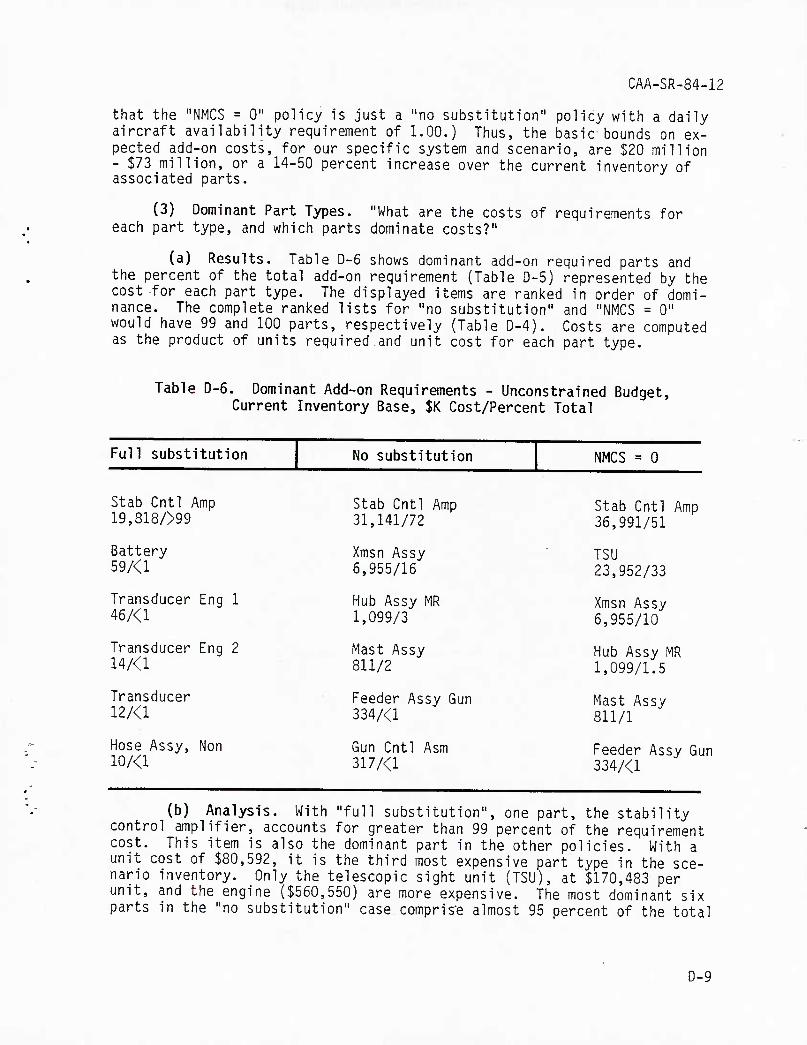
CAA-SR-84-12
that the "NMCS = 0" policy is just a "no substitution" policy with a daily aircraft availability requirement of 1.00.) Thus, the basic bounds on ex- pected add-on costs, for our specific system and scenario, are $20 million - $73 million, or a 14-50 percent increase over the current inventory of associated parts.
(3) Dominant Part Types. "What are the costs of requirements for each part type, and which parts dominate costs?"
(a) Results. Table D-6 shows dominant add-on required parts and the percent of the total add-on requirement (Table D-5) represented by the cost for each part type. The displayed items are ranked in order of domi- nance. The complete ranked lists for "no substitution" and "NMCS = Q" would have 99 and 100 parts, respectively (Table D-4). Costs are computed as the product of units required and unit cost for each part type.
Table D-6. Dominant Add-on Requirements - Unconstrained Budget, Current Inventory Base, $K Cost/Percent Total
Full substitution No substitution NMCS = 0
Stab Cntl ^ 19,818/>99
\mp
Battery 59/<l
Transducer 46/<l
Eng 1
Transducer 14/<1
Eng 2
Transducer 12/<1
Hose Assy, 10/<1
Non
Stab Cntl Amp 31,141/72
Xmsn Assy 6,955/16
Hub Assy MR 1,099/3
Mast Assy 811/2
Feeder Assy Gun 334/<l
Gun Cntl Asm 317/<1
Stab Cntl Amp 36,991/51
TSU 23,952/33
Xmsn Assy 6,955/10
Hub Assy MR 1,099/1.5
Mast Assy 811/1
Feeder Assy Gun 334/<l
(b) Analysis. With "full substitution", one part, the stability control amplifier, accounts for greater than 99 percent of the requirement cost. This item is also the dominant part in the other policies. With a unit cost of $80,592, it is the third most expensive part type in the sce- nario inventory. Only the telescopic sight unit (TSU), at $170,483 per unit, and the engine ($560,550) are more expensive. The most dominant six parts in the "no substitution" case compris'e almost 95 percent of the total
D-9
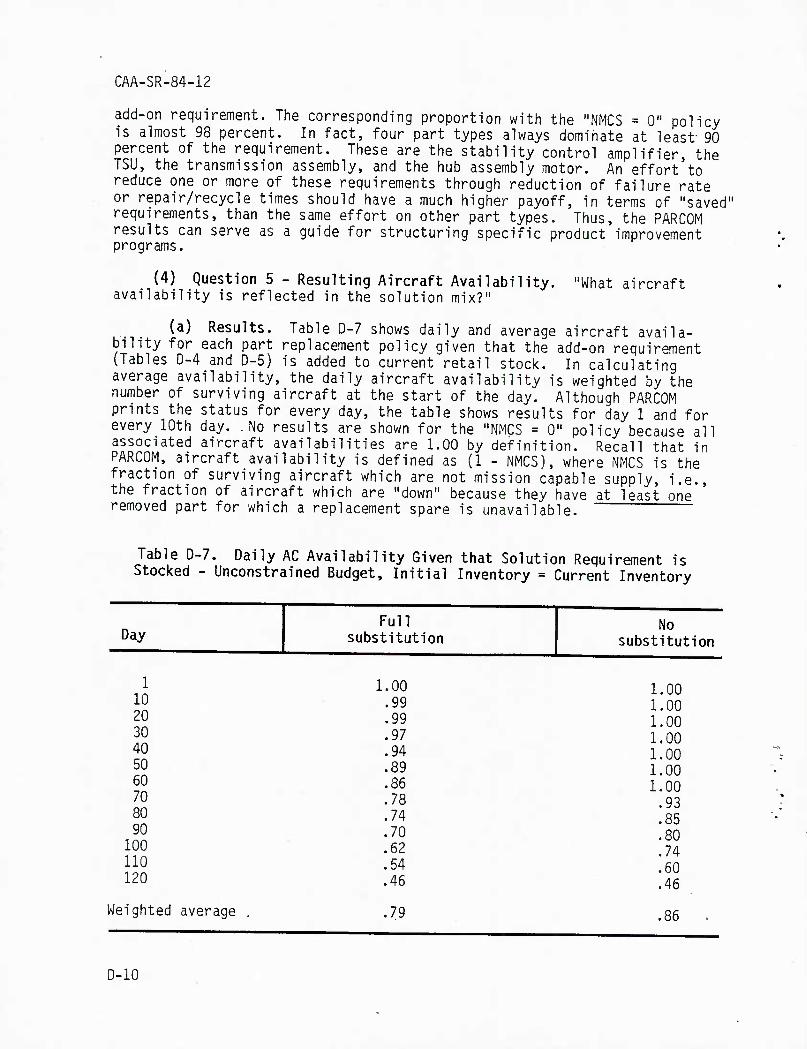
CAA-SR-84-12
add-on requirement. The corresponding proportion with the "NMCS = 0" policy is almost 98 percent. In fact, four part types always dominate at least 90 percent of the requirement. These are the stability control amplifier, the TSU, the transmission assembly, and the hub assembly motor. An effort'to reduce one or more of these requirements through reduction of failure rate or repair/recycle times should have a much higher payoff, in terms of "saved" requirements, than the same effort on other part types. Thus, the PARCOM results can serve as a guide for structuring specific product improvement programs.
(4) Question 5 - Resulting Aircraft Availability. availability is reflected in the solution mix?"
"What aircraft
(a) Resu bility for each (Tables D-4 and average availabi number of surviv prints the statu e^ery 10th day associated aircr PARCOM, aircraft fraction of surv the fraction of removed part for
Its. Table D-7 shows dai part replacement policy g D-5) is added to current lity, the daily aircraft ing aircraft at the start s for every day, the tabl No results are shown for
aft availabilities are 1. availability is defined
iving aircraft which are aircraft which are "down" which a replacement spar
ly and average aircraft availa- iven that the add-on requirement retail stock. In calculating availability is weighted by the of the day. Although PARCOM
e shows results for day 1 and for the "NMCS = 0" policy because all
GO by definition. Recall that in as (1 - NMCS), where NMCS is the not mission capable supply, i.e., because they have at least one
e is unavailable.
Table D-7. Daily AC Availability Given that Solution Requirement is Stocked - Unconstrained Budget, Initial Inventory = Current Inventory
Day Full
substitution No
substitution
1 10 20 30 40 50 60 70 80 90
100 no 120
Weighted average
1.00 .99 .99 .97 .94 .89 .86 .78 .74 .70 .62 .54 .46
.79
1.00 1.00 1.00 1.00 1.00 1.00 1.00 .93 .85 .80 .74 .60 .46
.86
D-10
CAA-SR-84-12
(b) Analysis. The solution mix for each policy always meets the daily flying hour program. Availabilities less than 1.00 arise because the least cost solution could often fulfill the daily flying hour program with less than the full complement of aircraft. The case in which the user speci- fies a minimum daily availability in conjunction with a flying program objec- •^^.''^.M^o'^^^^^'^ ^'" PS'^ag'^aph d below. Under a "no substitution" policy a
single NMCS aircraft can have only a single "removed part" (in the context SL?'^''- x?^^^ categorization of part). Under "full substitution" a single NMCS aircraft may have a number of "removed parts" (most of these being transfers of serviceable parts used to "bring up" aircraft with a failed part). In a sense an NMCS aircraft, under "full substitution," can serve as a sponge" which can absorb a number of part failures (in the fleet) without further degradation of short term aircraft availability. Therefore the decrease in availability, as stocks are depleted, is more gradual under' full substitution. In general, an availability of less than the tabulated value will often be sufficient to fulfill a day's flying program. However, the solution mix is such that, for at least one day, under each tabulated policy, the resulting availability is the minimum needed to accomplish that day s program. An underlying assumption of the table is that a "removed part IS always replaced if a spare is available at retail. NMCS aircraft are generated because of stockouts, not because of an assumed policy of allowing NMCS aircraft in spite of spares being available.
^: ^'Unconstrained Cost with Zero Inventory Base. The questions of para- graph D-3(c) are addressed. ^
(1) Quantity/Types of Parts Required. "What spare parts are needed to achieve the flying program at least cost in the initial inventory = 0 case? How are these different from the case with initial inventory = current inventory?"
. ^^J Results. Table D-8 shows the total inventory requirement for the six dominant part types when the initial inventory = 0. Table D-9 shows analogous results for the same part types in the case with initial inventory = current inventory. For parts common to Table D-4, Table D-9 is the sum of the Table D-4 entry and the current inventory stock
D-11
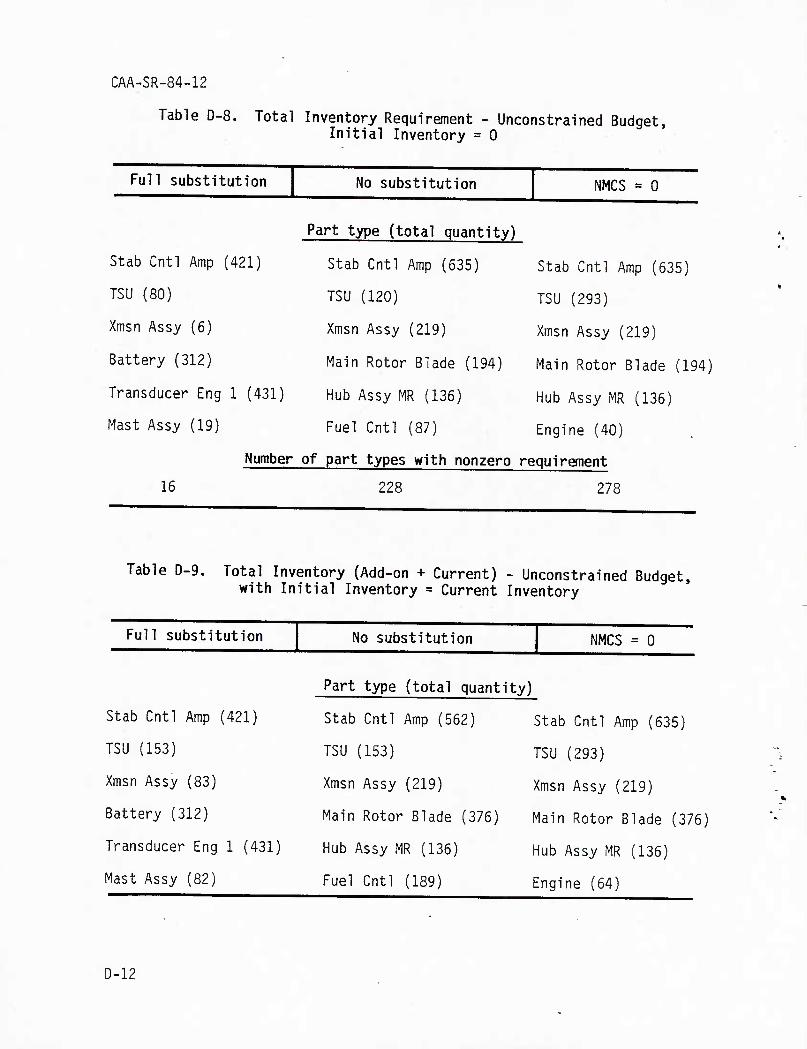
CAA-SR-84-12
Table D-8. Total Inventory Requirement - Unconstrained Budget, Initial Inventory = 0
Full substitution
Stab Cntl Amp (421)
TSU (80)
Xmsn Assy (6)
Battery (312)
Transducer Eng 1 (431)
Mast Assy (19)
16
No substitution NMCS = 0
Part type (total quantity)
Stab Cntl Amp (635)
TSU (120)
Xmsn Assy (219)
Main Rotor Blade (194)
Hub Assy MR (136)
Fuel Cntl (87)
Number of part types with nonzero requirement
228 278
Stab Cntl Amp (635)
TSU (293) ,
Xmsn Assy (219)
Main Rotor Blade (194)
Hub Assy MR (136)
Engine (40)
Table D-9. Total Inventory (Add-on + Current) - Unconstrained Budget, with Initial Inventory = Current Inventory
Full substitution
Stab Cntl Amp (421)
TSU (153)
Xmsn Assy (83)
Battery (312)
Transducer Eng 1 (431)
Mast Assy (82)
No substitution NMCS = 0
Part type (total quantity)
Stab Cntl Amp (562) Stab Cntl Amp (635)
TSU (153)
Xmsn Assy (219)
Main Rotor Blade (376)
Hub Assy MR (136)
Fuel Cntl (189)
TSU (293)
Xmsn Assy (219)
Main Rotor Blade (376)
Hub Assy MR (136)
Engine (64)
D-12
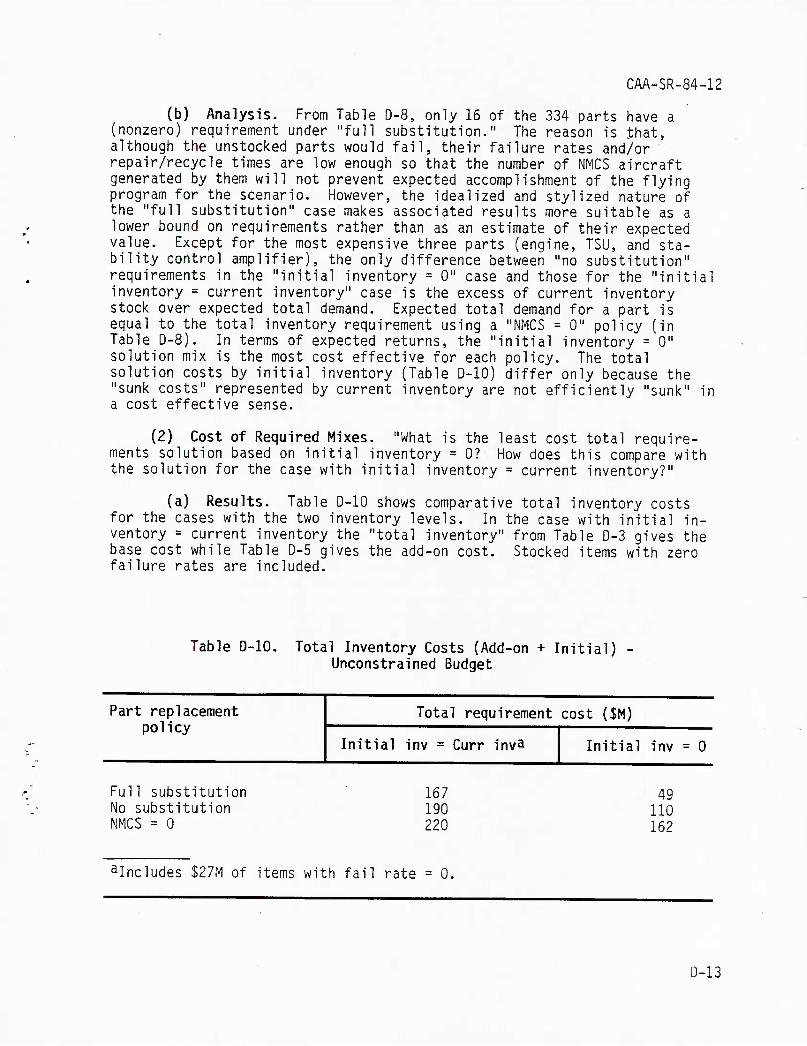
CAA-SR-84-12
(b) Analysis. From Table D-8, only 16 of the 334 parts have a (nonzero) requirement under "full substitution." The reason is that, although the unstocked parts would fail, their failure rates and/or repair/recycle times are low enough so that the number of NMCS aircraft generated by them will not prevent expected accomplishment of the flying program for the scenario. However, the idealized and stylized nature of the "full substitution" case makes associated results more suitable as a lower bound on requirements rather than as an estimate of their expected value. Except for the most expensive three parts (engine, TSU, and sta- bility control amplifier), the only difference between "no substitution" requirements in the "initial inventory = 0" case and those for the "initial inventory = current inventory" case is the excess of current inventory stock over expected total demand. Expected total demand for a part is equal to the total inventory requirement using a "NMCS = 0" policy (in Table D-8). In terms of expected returns, the "initial inventory = 0" solution mix is the most cost effective for each policy. The total solution costs by initial inventory (Table D-10) differ only because the "sunk costs" represented by current inventory are not efficiently "sunk" in a cost effective sense.
(2) Cost of Required Mixes. "What is the least cost total require- ments solution based on initial inventory = 0? How does this compare with the solution for the case with initial inventory = current inventory?"
(a) Results. Table D-10 shows comparative total inventory costs for the cases with the two inventory levels. In the case with initial in- ventory = current inventory the "total inventory" from Table D-3 gives the base cost while Table D-5 gives the add-on cost. Stocked items with zero failure rates are included.
Table D-10. Total Inventory Costs (Add-on + Initial) - Unconstrained Budget
Part replacement policy
Total requirement cost ($M)
Initial inv = Curr inva Initial inv = 0
Full substitution No substitution NMCS = 0
167 190 220
49 110 162
^Includes $27M of items with fail rate = 0.
D-13
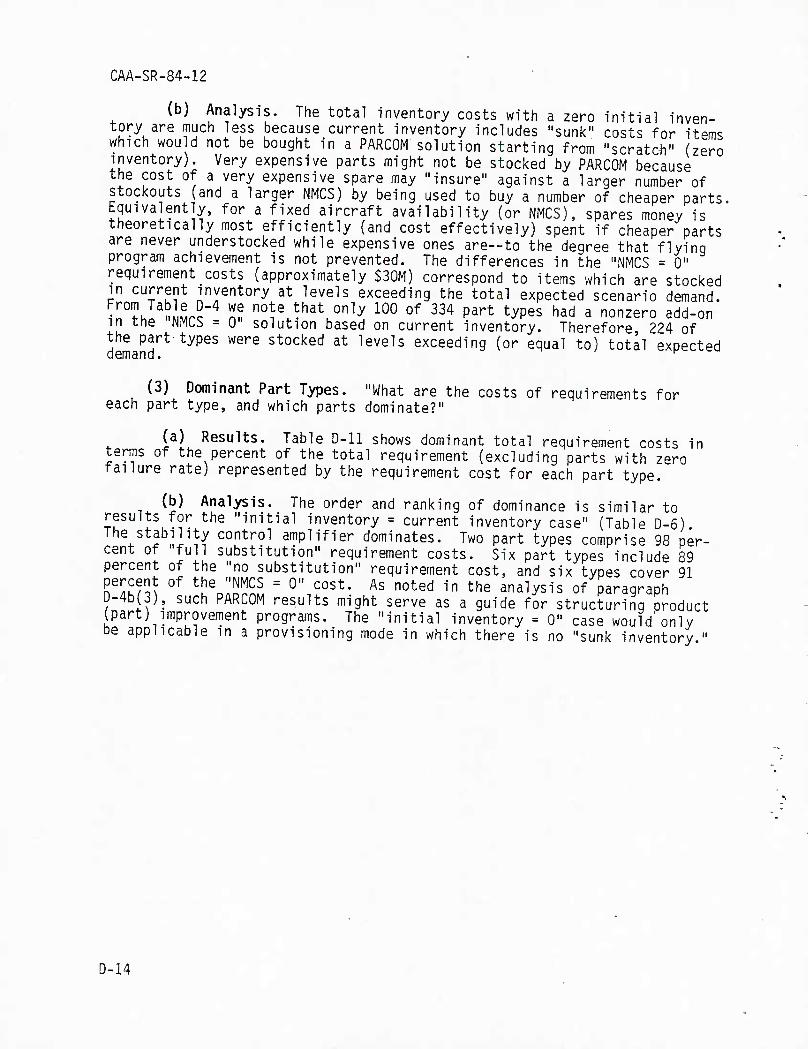
CAA-SR-84-12
(b) Analysis. The total inventory costs with a zero initial inven- tory are much less because current inventory includes "sunk" costs for items which would not be bought in a PARCOM solution starting from "scratcli" (zero inventory), yery expensive parts might not be stocked by PARCOM because the cost of a very expensive spare may "insure" against a larger number of stockouts (and a larger NMCS) by being used to buy a number of cheaper parts. Equivalent y, for a fixed aircraft availability (or NMCS), spares money is theoretically most efficiently (and cost effectively) spent if cheaper parts are never understocked while expensive ones are-to the degree that flying program achievement is not prevented. The differences in the "NMCS = 0" requirement costs (approximately $30M) correspond to items which are stocked in current inventory at levels exceeding the total expected scenario demand. ^;;°'?h !^ iMrc nn "ote that only 100 of 334 part types had a nonzero add-on in tne NMLS = O solution based on current inventory. Therefore 224 of the part types were stocked at levels exceeding (or equal to) total expected demand. ^
(3) Dominant Part Types. "What are the costs of requirements for each part type, and which parts dominate?"
(a) Results. Table D-11 shows dominant total requirement costs in terms of the percent of the total requirement (excluding parts with zero failure rate) represented by the requirement cost for each part type.
(b) Analysis. The order and ranking of dominance is similar to results for the "initial inventory = current inventory case" (Table D-6) The stability control amplifier dominates. Two part types comprise 98 per- cent of "full substitution" requirement costs. Six part types include 89 percent of the "no substitution" requirement cost, and six types cover 91 percent of the "NMCS = 0" cost. As noted in the analysis of paragraph D-4b(3), such PARCOM results might serve as a guide for structuring product (part) improvement programs. The "initial inventory = 0" case would only be applicable in a provisioning mode in which there is no "sunk inventory "
D-14
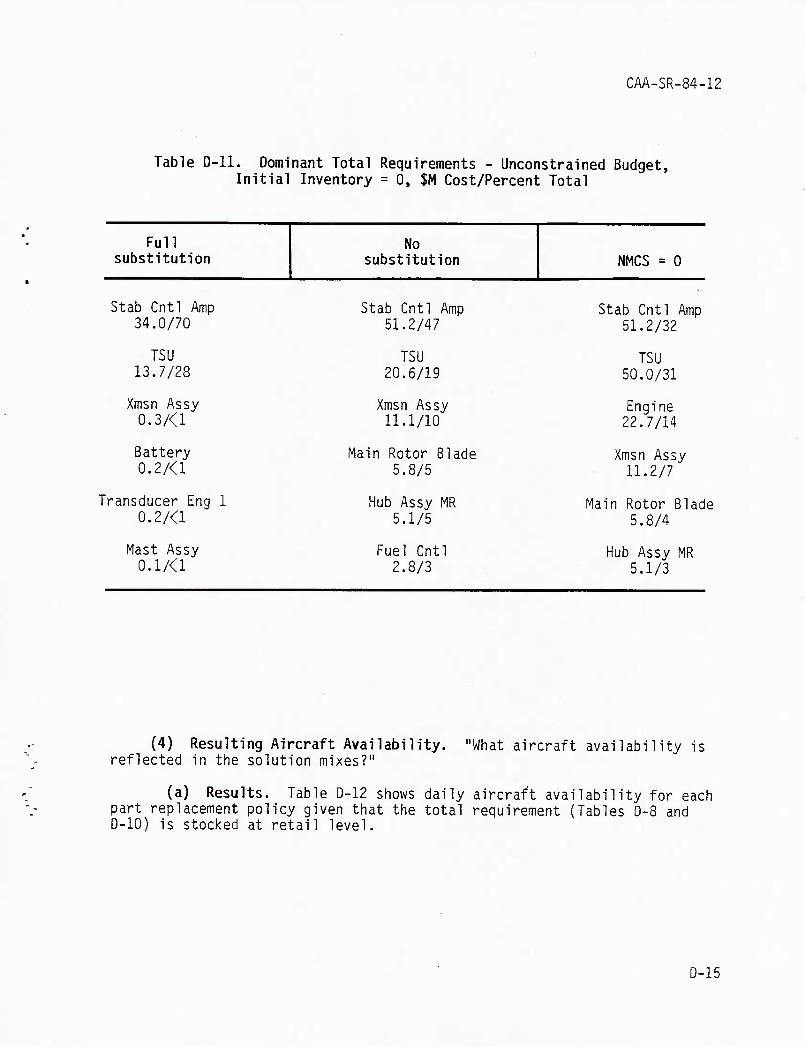
CAA-SR-84-12
Table D-11. Dominant Total Requirements - Unconstrained Budget, Initial Inventory = 0, $M Cost/Percent Total
Full substitution
No substitution NMCS = 0
Stab Cntl Amp 34.0/70
TSU 13.7/28
Xmsn Assy 0.3/<l
Battery 0.2/<l
Transducer Eng 1 0.2/<l
Mast Assy 0.1/<1
Stab Cntl Amp 51.2/47
TSU 20.6/19
Xmsn Assy 11.1/10
Main Rotor Blade 5.8/5
Hub Assy MR 5.1/5
Fuel Cntl 2.8/3
Stab Cntl Amp 51.2/32
TSU 50.0/31
Engine 22.7/14
Xmsn Assy 11.2/7
Main Rotor Blade 5.8/4
Hub Assy MR 5.1/3
(4) Resulting Aircraft Availability. "What aircraft availability is reflected in the solution mixes?"
(a) Results. Table D-12 shows daily aircraft availability for each part replacement policy given that the total requirement (Tables D-8 and D-10) is stocked at retail level.
D-15
CAA-SR-84-12
Table D-12. Daily Aircraft Availability Given that Solution Requirement is Stocked - Unconstrained Budget,
Initial Inventory = 0
Day
1 10 20 30 40 50 50 70 80 90
100 no 120
Full No substitution substitution
1.00 1.00 .96 .99 .92 .98 .85 .97 .82 .96 .11 .95 .73 .89 .65 - .77 .53 .69 .61 .65 .55 .58 .50 .52 .46 .46
Weighted average ,70 78
(b) Analysis. The same comments apply as were noted in the discus- sion of paragraph D-4b(4). .
d. Constrained Aircraft Availability. "What is the add-on cost of a requirements mix meeting an 85 percent minimum daily aircraft availability Objective in addition to the flying program? How much does a 100 percent availability objective cost?"
(1) Results. Table D-13 shows comparative add-on requirements costs with minimum daily aircraft availability constraints of .00, .85, and 1 00 in addition to the flying hour program objective. The entries are add-on least cost solutions for the unconstrained cost case with initial inventory = current inventory (Table D-4).
D-16
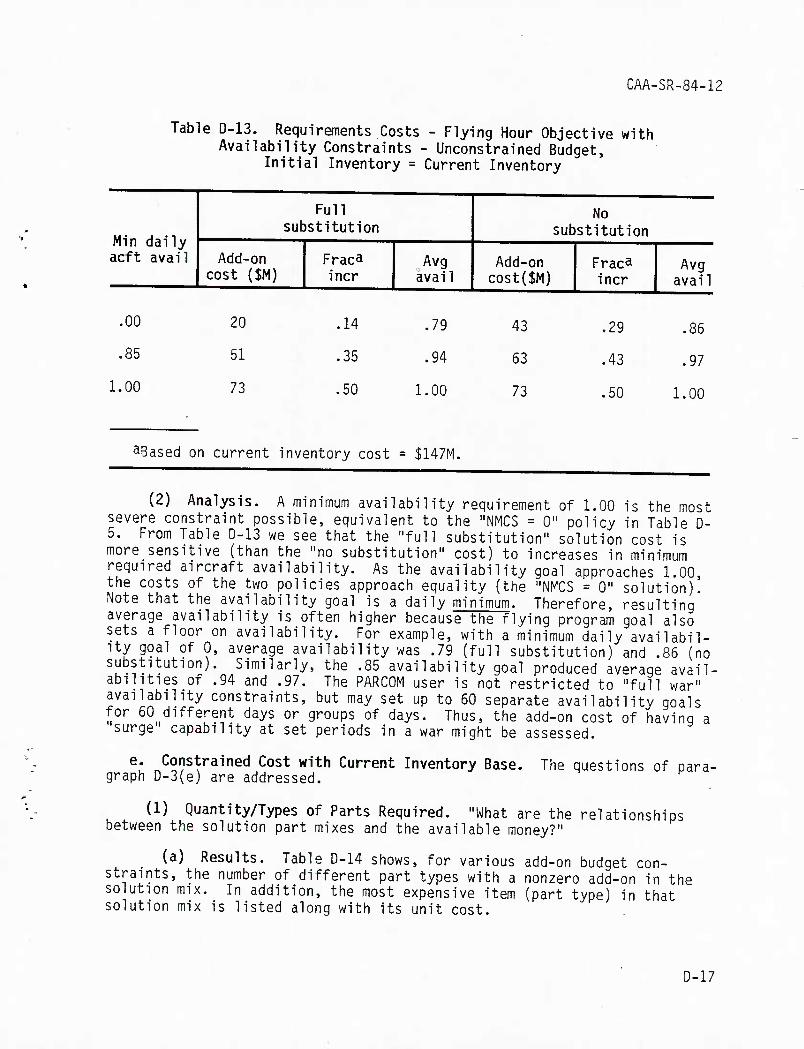
CAA-SR-84-12
Table D-13. Requirements Costs - Flying Hour Objective with Availability Constraints - Unconstrained Budget,
Initial Inventory = Current Inventory
Min daily acft avail
Full substitution
No substitution
Add-on cost ($M)
Fraca incr
Avg avail
Add-on cost($M)
Frac3 incr
Avg avail
.00 . 20 .14 .79 43 .29 .86
.85 51 .35 .94 63 .43 .97
1.00 73 .50 1.00 73 .50 1.00
3Based on current inventory cost = $147M.
(2) Analysis. A minimum availability requirement of 1.00 is the most severe constraint possible, equivalent to the "NMCS = 0" policy in Table D- 5. From Table D-13 we see that the "full substitution" solution cost is more sensitive (than the "no substitution" cost) to increases in minimum required aircraft availability. As the availability goal approaches 1.00, the costs of the two policies approach equality (the "NMCS = 0" solution)! Note that the availability goal is a daily minimum. Therefore, resulting average availability is often higher because the flying program goal also sets a floor on availability. For example, with a minimum daily availabil- ity goal of 0, average availability was .79 (full substitution) and .86 (no substitution). Similarly, the .85 availability goal produced average avail- abilities of .94 and .97. The PARCOM user is not restricted to "full war" availability constraints, but may set up to 60 separate availability goals for 60 different days or groups of days. Thus, the add-on cost of having a surge capability at set periods in a war might be assessed.
e. Constrained Cost with Current Inventory Base. graph D-3(e) are addressed.
The questions of para-
(1) Quantity/Types of Parts Required. "What are the relationships between the solution part mixes and the available money?"
(a) Results. Table D-14 shows, for various add-on budget con- straints, the number of different part types with a nonzero add-on in the solution mix. In addition, the most expensive item (part type) in that solution mix is listed along with its unit cost.
D-17
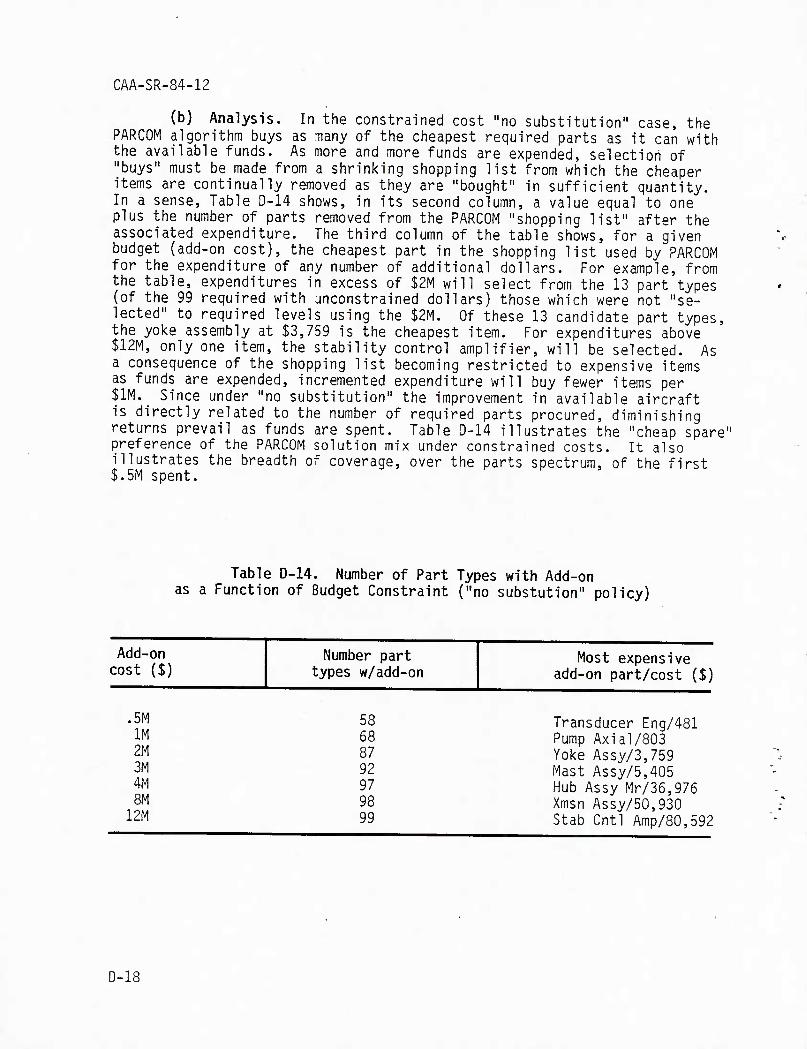
CAA-SR-84-12
(b) Analysis. In the constrained cost "no substitution" case, the PARCOM algorithm buys as inany of the cheapest required parts as it can with the available funds. As more and more funds are expended, selection of "buys" must be made from a shrinking shopping list from which the cheaper items are continually removed as they are "bought" in sufficient quantity. In a sense. Table D-14 shows, in its second column, a value equal to one plus the number of parts removed from the PARCOM "shopping list" after the associated expenditure. The third column of the table shows, for a given budget (add-on cost), the cheapest part in the shopping list used by PARCOM for the expenditure of any number of additional dollars. For example, from the table, expenditures in excess of $2M will select from the 13 part types (of the 99 required with unconstrained dollars) those which were not "se- lected" to required levels using the $2M. Of these 13 candidate part types, the yoke assembly at $3,759 is the cheapest item. For expenditures above $12M, only one item, the stability control amplifier, will be selected. As a consequence of the shopping list becoming restricted to expensive items as funds are expended, incremented expenditure will buy fewer items per $1M. Since under "no substitution" the improvement in available aircraft is directly related to the number of required parts procured, diminishing returns prevail as funds are spent. Table D-14 illustrates the "cheap spare" preference of the PARCOM solution mix under constrained costs. It also illustrates the breadth of coverage, over the parts spectrum, of the first $.5M spent.
Table D-14. Number of Part Types with Add-on as a Function of Budget Constraint ("no substution" policy)
Add-on cost ($)
Number part types w/add-on
Most expensive add-on part/cost ($)
•fM 58 Transducer Eng/481 IM 68 Pump Axial/803 2M 87 Yoke Assy/3,759 3M .92 Mast Assy/5,405 4M 97 Hub Assy Mr/36,976 8M 98 Xmsn Assy/50,930
12M 99 Stab Cntl Amp/80,592
D-18
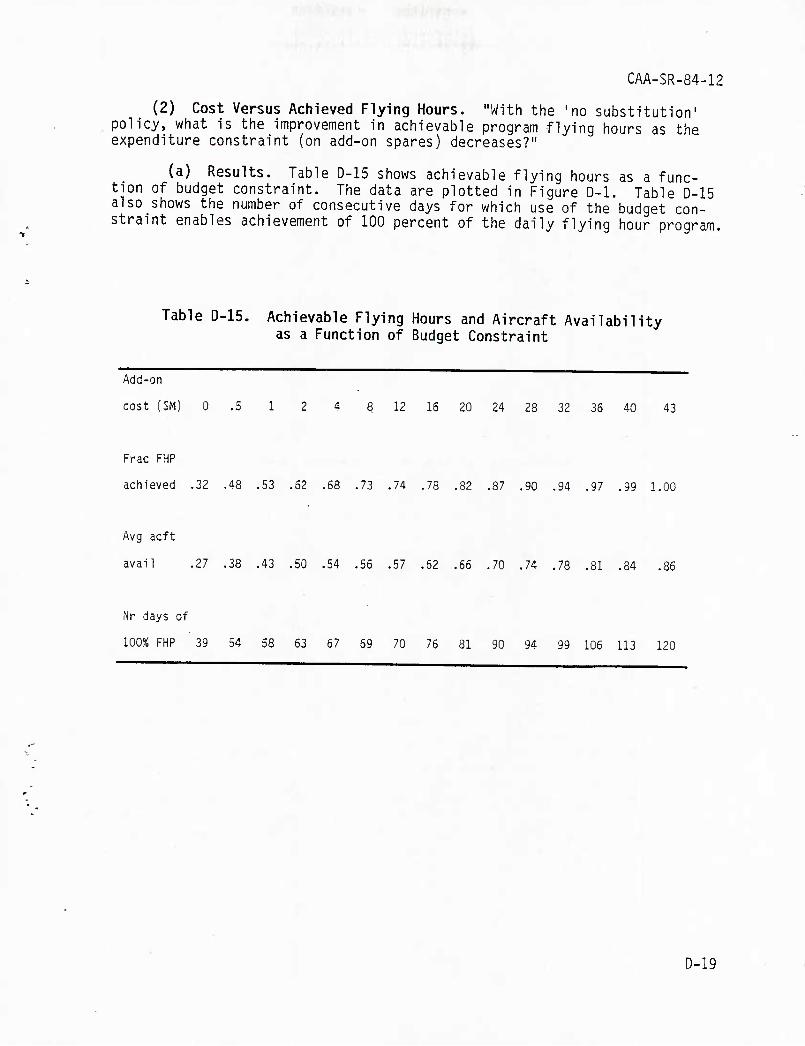
CAA-SR-84-12
(2) Cost Versus Achieved Flying Hours. "With the 'no substitution' policy, what is the improvement in achievable program flying hours as the expenditure constraint (on add-on spares) decreases?"
(a) Results. Table D-15 shows achievable flying hours as a func- tion of budget constraint. The data are plotted in Figure D-1. Table D-15 also shows the number of consecutive days for which use of the budget con- straint enables achievement of 100 percent of the daily flying hour program.
Table D-15. Achievable Flying Hours and Aircraft Availability as a Function of Budget Constraint
Add-on
cost ($M) 0 .5 1 2 4 8 12 16 20 24 28 32 36 40 43
Frac FHP , , . ,.•,.:.....,
achieved .32 .48 .53 .62 .58 .73 .74 .78 .82 .87 .90 .94 .97 .99 1.00
Avg acft
avail .27 .38 .43 .50 .54 .56 .57 .62 .66 .70 ,74 .78 .81 .84 .86
Nr days of
100% FHP 39 54 58 63 67 69 70 75 81 90 94 99 105 113 120
D-19
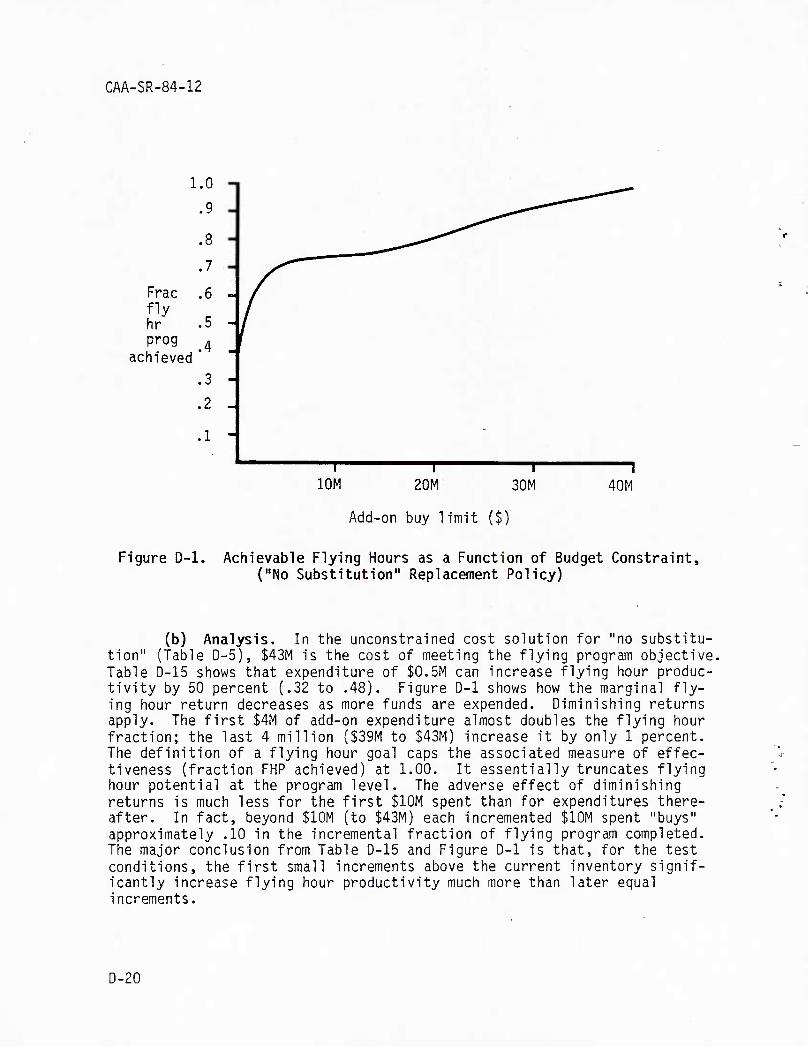
CAA-SR-84-12
1.0
.9
.8
.7
Frac . 6 fly hr .5 prog ^4
achieved *
.3
,2 -
,1 -
lOM 20M 30H 40M
Add-on buy limit ($)
Figure D-1. Achievable Flying Hours as a Function of Budget Constraint, ("No Substitution" Replacement Policy)
(b) Analysis. In the unconstrained cost solution for "no substitu- tion" (Table D-5), $43M is the cost of meeting the flying program objective. Table D-15 shows that expenditure of $0.5M can increase flying hour produc- tivity by 50 percent (.32 to .48). Figure D-1 shows how the marginal fly- ing hour return decreases as more funds are expended. Diminishing returns apply. The first $4M of add-on expenditure almost doubles the flying hour fraction; the last 4 million ($39M to $43M) increase it by only 1 percent. The definition of a flying hour goal caps the associated measure of effec- tiveness (fraction FHP achieved) at 1.00. It essentially truncates flying hour potential at the program level. The adverse effect of diminishing returns is much less for the first $10M spent than for expenditures there- after. In fact, beyond $10M (to $43M) each incremented $10M spent "buys" approximately .10 in the incremental fraction of flying program completed. The major conclusion from Table D-15 and Figure D-1 is that, for the test conditions, the first small increments above the current inventory signif- icantly increase flying hour productivity much more than later equal increments.
D-20
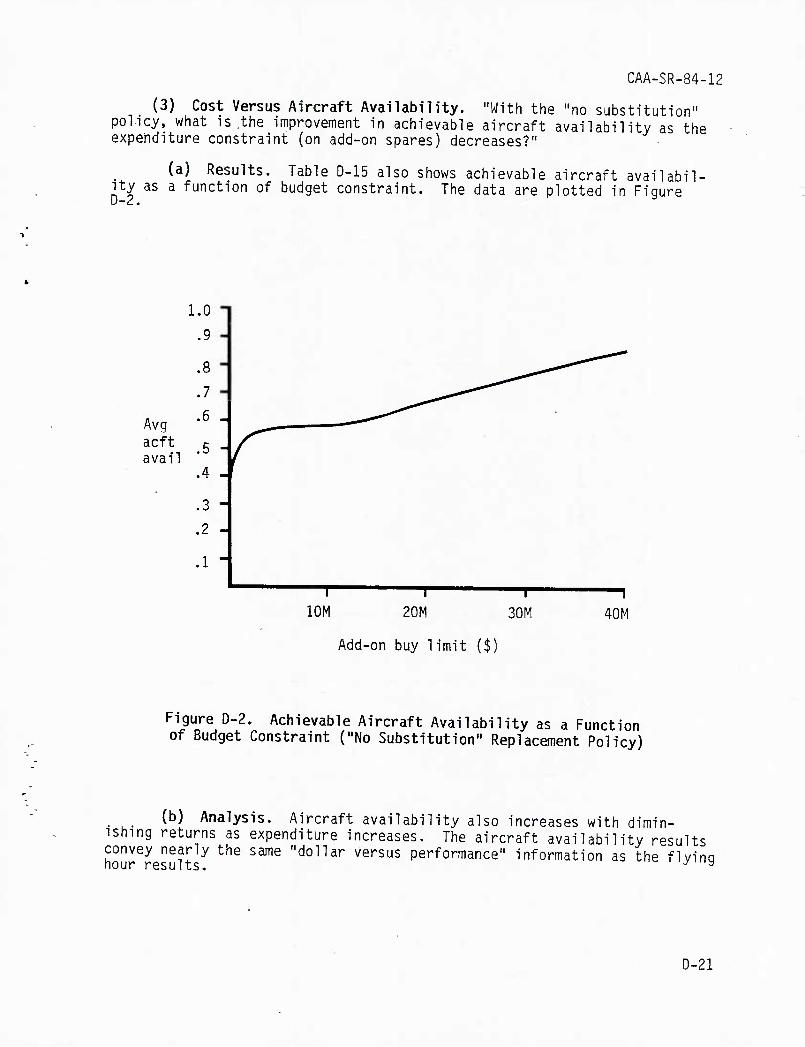
CAA-SR-84-12
(3) Cost Versus Aircraft Availability. "With the "no substitution" policy, what is the improvement in achievable aircraft availability as the expenditure constraint (on add-on spares) decreases?"
(a) Results. Table D-15 also shows achievable aircraft availabil- ity as a function of budget constraint. The data are plotted in Figure
Avg acft avail
1.0
.9
.8
.7
.6
.5
.4
.3
.2
.1 1
—r im
T T 20M 30M
Add-on buy limit ($)
40M
Figure D-2. Achievable Aircraft Availability as a Function of Budget Constraint ("No Substitution" Replacement Policy)
(b) Analysis. Aircraft availability also increases with dimin- ishing returns as expenditure increases. The aircraft availability results convey nearly the same "dollar versus performance" information as the flyinq hour results. -/a
D-21
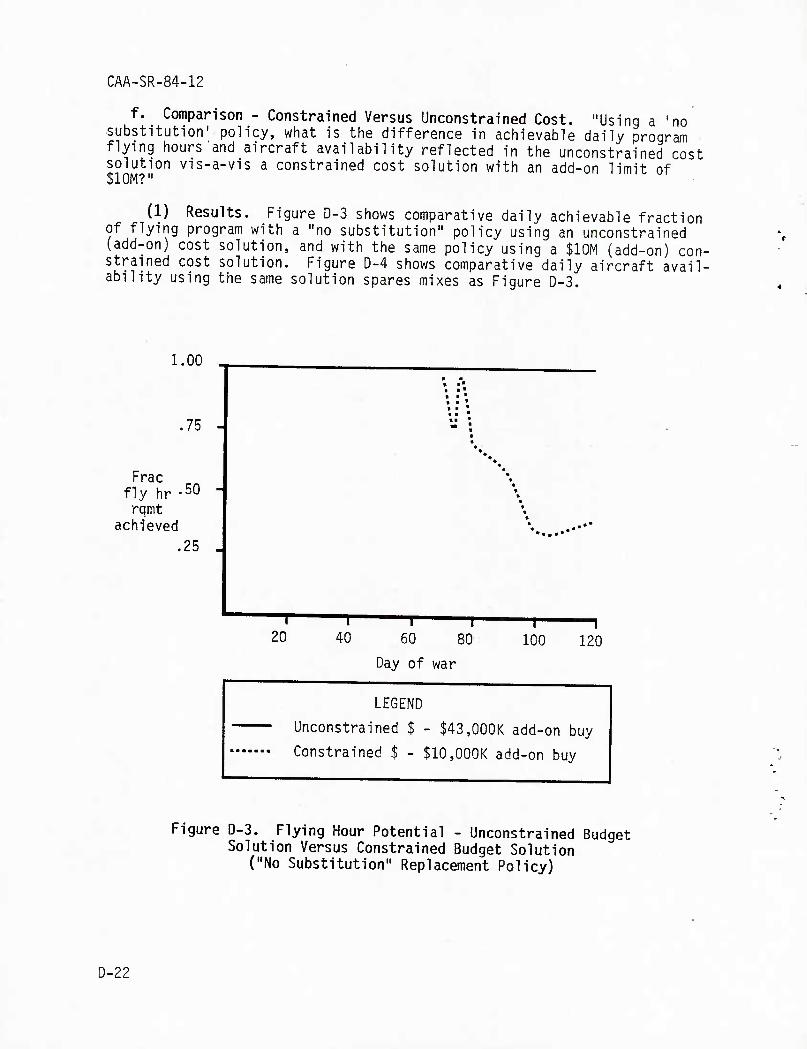
CAA-SR-84-12
f. Comparison - Constrained Versus Unconstrained Cost. "Using a 'no substitution' policy, what is the difference in achievable daily program flying hours and aircraft availability reflected in the unconstrained cost solution vis-a-vis a constrained cost solution with an add-on limit of $10M?"
(1) Results. Figure D-3 shows comparative daily achievable fraction of flying program with a "no substitution" policy using an unconstrained (add-on) cost solution, and with the same policy using a $10M (add-on) con- strained cost solution. Figure D-4 shows comparative daily aircraft avail- ability using the same solution spares mixes as Figure D-3.
1.00
.75 -
Frac fly hr -50 rqmt
achieved .25
20 40 1
60
Day of war
80 100 120
LEGEND
Unconstrained $ - $43,000K add-on buy
Constrained $ - $10,000K add-on buy
Figure D-3. Flying Hour Potential - Unconstrained Budget Solution Versus Constrained Budget Solution
("No Substitution" Replacement Policy)
D-22
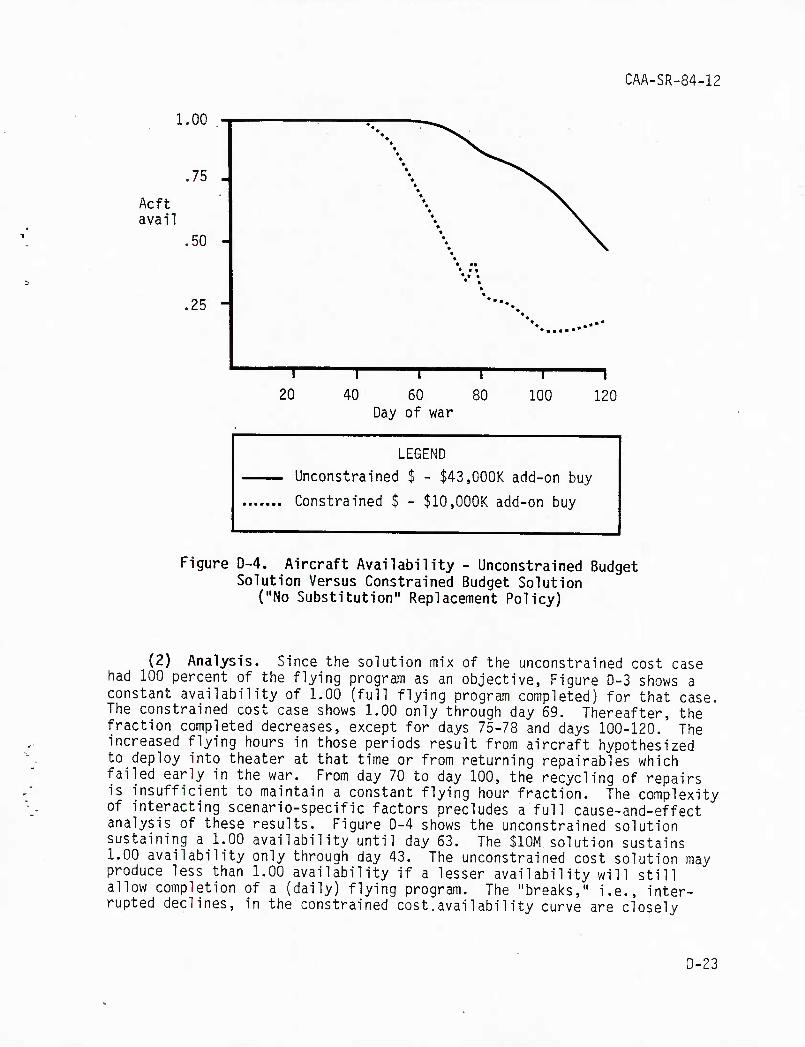
CAA-SR-84-12
1.00
Acft avail
.75
,50 -
,25
-T 1 1 r
20 40 60 80 Day of war
100 120
LEGEND
Unconstrained $ - $43,COOK add-on buy
Constrained $ - $10,000K add-on buy
Figure D-4. Aircraft Availability - Unconstrained Budget Solution Versus Constrained Budget Solution
("No Substitution" Replacement Policy)
(2) Analysis. Since the solution mix of the unconstrained cost case had 100 percent of the flying program as an objective, Figure D-3 shows a constant availability of 1.00 (full flying program completed) for that case. The constrained cost case shows 1.00 only through day 69. Thereafter, the fraction completed decreases, except for days 75-78 and days 100-120. The increased flying hours in those periods result from aircraft hypothesized to deploy into theater at that time or from returning repairables which failed early in the war. From day 70 to day 100, the recycling of repairs is insufficient to maintain a constant flying hour fraction. The complexity of interacting scenario-specific factors precludes a full cause-and-effect analysis of these results. Figure D-4 shows the unconstrained solution sustaining a 1.00 availability until day 63. The $10M solution sustains 1.00 availability only through day 43. The unconstrained cost solution may produce less than 1.00 availability if a lesser availability will still allow completion of a (daily) flying program. The "breaks," i.e., inter- rupted declines, in the constrained cost.availability curve are closely
D-23
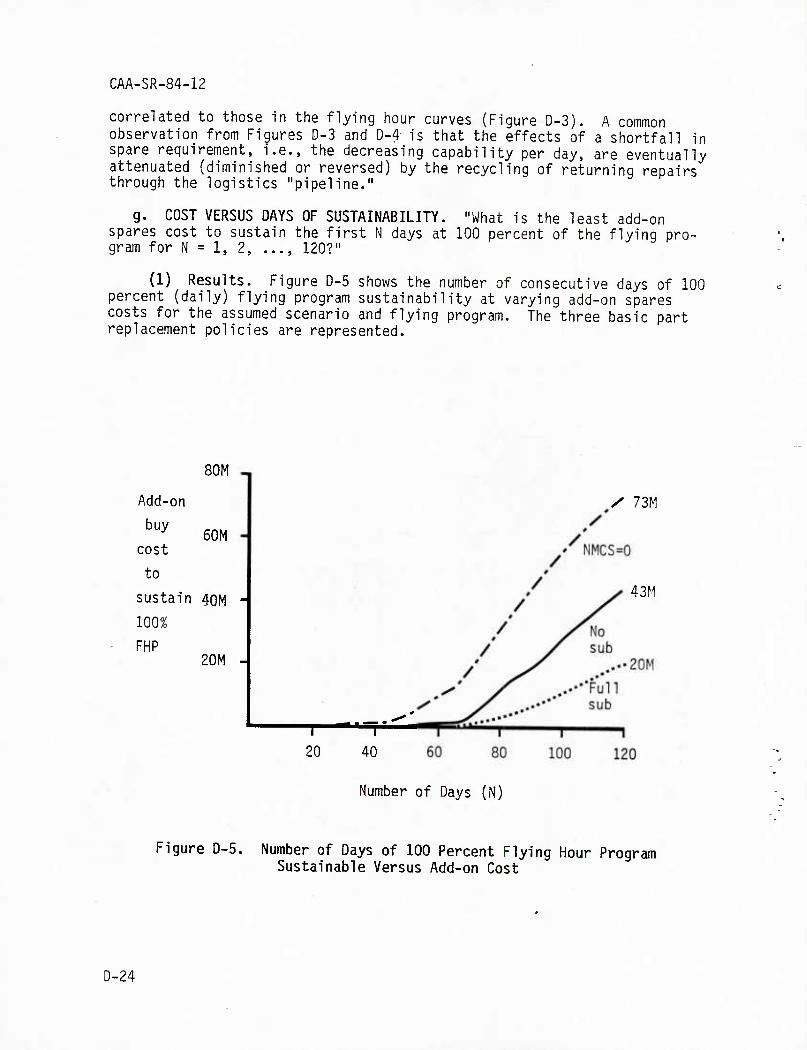
CAA-SR-84-12
correlated to those in the flying hour curves (Figure D-3). A common observation from Figures D-3 and D-4 is that the effects of a shortfall in spare requirement, i.e., the decreasing capability per day, are eventually attenuated (diminished or reversed) by the recycling of returning repairs through the logistics "pipeline."
g. COST VERSUS DAYS OF SUSTAINABILITY. "What is the least add-on spares cost to sustain the first N days at 100 percent of the flying pro- gram for N = 1, 2, ..., 120?"
(1) Results. Figure D-5 shows the number of consecutive days of 100 percent (daily) flying program sustainability at varying add-on spares costs for the assumed scenario and flying program. The three basic part replacement policies are represented.
80M -.
60M -
Add-on
buy
cost
to
sustain 40M
100%
FHP 20M -
/ 73M
43M
1^
20 40
Number of Days (N)
Figure D-5. Number of Days of 100 Percent Flying Hour Program Sustainable Versus Add-on Cost
D-24
CAA-SR-84-12
(2) Analysis. In effect. Figure D-5 gives the total add-on cost of the least-cost solution to an unconstrained cost problem for a truncated (at N days) scenario. Note that the costs for 120 days correspond to the costs in Table D-3. Note also that, using a "no substitution" policy, cur- rent inventory will sustain the flying program for the first 39 days with- out any add-on. Under "full substitution" the first 72 days can be sus- tained. The "NMCS = 0" policy has add-on costs needed from day 1, but these are too small to be portrayed on the graph until they become substan- tial ($50,000 at day 30). The rate of increase in each curve is driven by the flying program, part failure rates, initial inventory, and the part replacement policy. Costs increase as spares are demanded in excess of supply (available inventory). The more expensive the shortfall items the greater the total cost shortfall. For both "full substitution" and "no substitution" policies, the sustainability shortfall is yery small (0 - $100,000) through the first 60 days. The cost of any "partial substitu- tion" policy must lie between the "full substitution" and "no substitution" bounds. Figure D-5 can serve as a guide for assessing the approximate cost to meet a sustainability shortfall (e.g., $1M to meet 60 days) in current inventory. Actual required parts to alleviate the shortfall must be gener- ated by running PARCOM for a truncated scenario which "ends" at the last day of full sustainability. However, the user should be aware that use of constrained funds to alleviate such a sustainability shortfall may be cost ineffective in a total war sense because of overemphasis (excessive weight- ing) on supporting the first N days (the sustainability period) at the ex- pense of support in the last (120 - N) days. The next paragraph addresses the potential weaknesses of such an approach.
h. Conflicting Goals - Sustainability Versus Cumulative Performance. "What is the difference in flying hour potential and aircraft availability between a $10M constrained cost add-on solution based on a 'maximum sus- tained flying hour performance' goal as opposed to a 'full war' cumulative performance goal"?
(1) Results. Table D-16 shows the comparative capability potential of solutions with "sustained" versus "full war" performance objectives. Three basic measures are shown. The first shows the number of consecutive days of 100 percent flying program which are achievable with the solution mix for the indicated objective. The second shows the fraction of the full (total war) flying hour program achievable for each solution. The third shows the average (over the full war) aircraft availability for each solu- tion. Also shown is the number of parts with a nonzero add-on in each solu- tion mix. All results are for a constrained cost case with a $10M limit to add-on costs. Only a "no substitution" policy is treated.
D-25
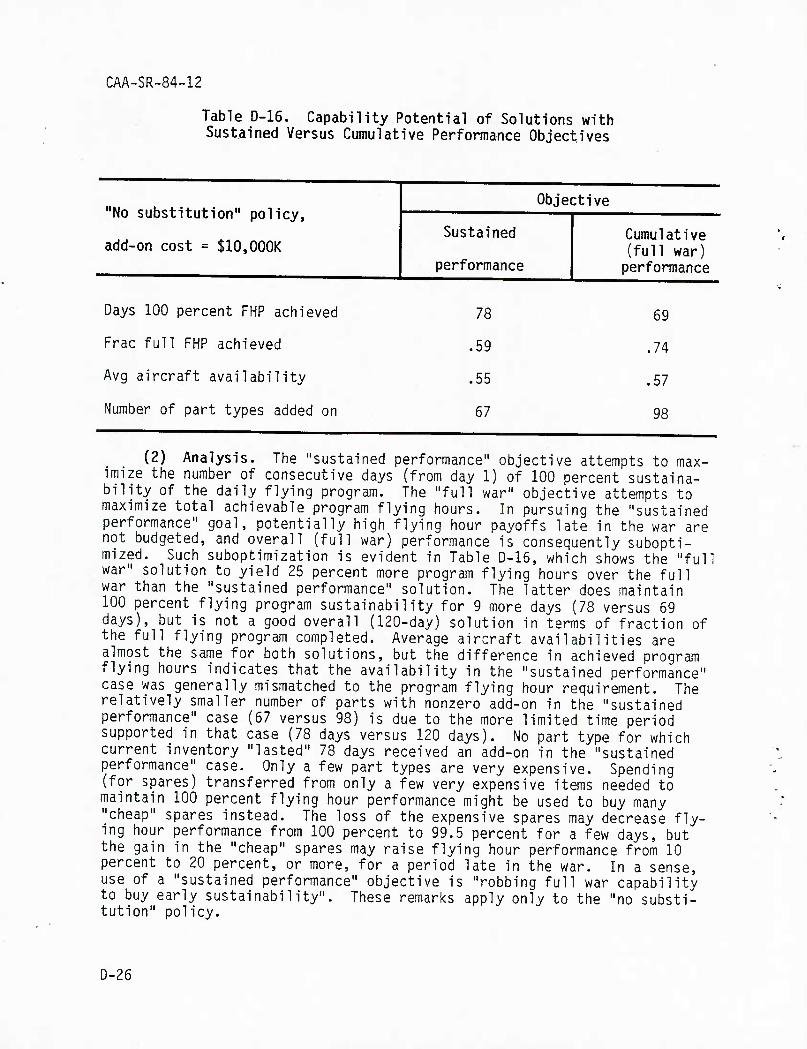
CAA-SR-84-12
Table D-16. Capability Potential of Solutions with Sustained Versus Cumulative Performance Objectives
"No substitution" policy,
add-on cost = $10,000K
Days 100 percent FHP achieved
Frac full FHP achieved
Avg aircraft availability
Number of part types added on
Objective
Sustained
performance
Cumulative (full war) performance
78
,59
,55
67
69
.74
.57
98
(2) Analysis. The "sustained performance" objective attempts to max- imize the number of consecutive days (from day 1) of 100 percent sustaina- bility of the daily flying program. The "full war" objective attempts to maximize total achievable program flying hours. In pursuing the "sustained performance" goal, potentially high flying hour payoffs late in the war are not budgeted, and overall (full war) performance is consequently subopti- mized. Such suboptimization is evident in Table D-16, which shows the "full war" solution to yield 25 percent more program flying hours over the full war than the "sustained performance" solution. The latter does maintain 100 percent flying program sustainability for 9 more days (78 versus 69 days), but is not a good overall (120-day) solution in terms of fraction of the full flying program completed. Average aircraft availabilities are almost the same for both solutions, but the difference in achieved program flying hours indicates that the availability in the "sustained performance" case was generally mismatched to the program flying hour requirement. The relatively smaller number of parts with nonzero add-on in the "sustained performance" case (67 versus 98) is due to the more limited time period supported in that case (78 days versus 120 days). No part type for which current inventory "lasted" 78 days received an add-on in the "sustained performance" case. Only a few part types are very expensive. Spending (for spares) transferred from only a few \/ery expensive items needed to maintain 100 percent flying hour performance might be used to buy many "cheap" spares instead. The loss of the expensive spares may decrease fly- ing hour performance from 100 percent to 99.5 percent for a few days, but the gain in the "cheap" spares may raise flying hour performance from 10 percent to 20 percent, or more, for a period late in the war. In a sense, use of a "sustained performance" objective is "robbing full war capability to buy early sustainability". These remarks apply only to the "no substi- tution" policy.
D-26
CAA-SR-84-12
D-5. SUMMARY OF PARCOM APPLICABILITY. The preceding demonstration test questions and answers i1lustrate. specific application capabilities. In a general sense, the solution mixes generated by PARCOM should not be treated as literal "shopping lists" for spares purchases, but should be used as guidance for the logistics budget planner to spot potential problem areas. In terms of applicability, PARCOM output, as demonstrated above, includes:
a. Analysis of Inventory Shortfalls. PARCOM can determine spares inven- tory shortfalls relative to least-cost levels needed to achieve a specified flying hour program (with or without a specified minimum aircraft avail- ability). Add-on spares amounts and costs are generated, along with an assessment of aircraft availability, using the solution mix. The magnitude of add-on requirement amounts and costs for individual part types indicates problem areas where current inventory falls short of requirements. Also, analysis of the relative requirements for different part types can reveal parts for which product improvement programs can have a high payoff in terms of "saved" spares investment dollars. Related improvement programs could include reductions in item failure rates and/or repair cycle time.
b. Analysis of Cost Versus Capability. For a "no substitution" part replacement policy, PARCOM can assess the "best" buyable capability (in terms of program flying hours) which can be obtained from expenditure of a specified amount of budget dollars for add-on spares. Evaluation of parts requirements lists associated with a given budget amount can guide a planner to the subset of part types which will yield especially high returns per dollar invested.
c. Analysis of Sustainability Costs. As a side product PARCOM outputs the (least) add-on spares cost to sustain a flying program through each day of the war. The number of days sustainable (at 100 percent flying program) by current inventory is equal to the maximum number of days for which sus- tainability cost is zero.
D-6. CAVEATS AND LIMITATIONS. The principal caveats and limitations on PARCOM Model applicability are noted below. Program modification and/or restructuring is required to extend model capabilities beyond the cited limits. Each limitation will be briefly discussed or defined.
a. Number of Part Types Processed. The PARCOM Model demonstrated herein can process at most 300 different part types (only 278 were needed for this study). A minor structured modification of the program could significantly increase this capacity.
b. No Partial Substitution. PARCOM currently processes only "full sub- stitution," "no substitution," and "NMCS = 0" policies. There is no defin- itive logic for a partial substitution policy. In light of underlying data and process uncertainties, the bounds or costs and amounts reflected in the "no substitution" and "full substitution" solutions may well be sufficient.
D-27
CAA-SR-84-12
c. No "Full Substitution" Constrained Cost Solution. Additional pro- graming effort might enable a "full substitution" constrained cost solution. However, methodological complications/complexities may restrict the degree of optimality (best buy for the dollar) obtained.
d. Only Two Centralized Supply Levels. PARCOM shares the Overview Model "world view" of a retail level and a wholesale level. Each level has full cross-leveling (lateral transferability of parts).
e. No Indenture Levels. Part types in the PARCOM (and Overview) data base are non-overlapping modular units, i.e., no part is a repair part which is a subcomponent of another listed part type. Therefore, the failures and repair of treated parts are independent of each other. Use of indentured data is not processable in PARCOM.
f. No Direct Maintenance Modeling. As with Overview, PARCOM treats maintenance only indirectly by using an aircraft deployment/attrition data base which is adjusted for aircraft down ("lost") due to maintenance con- straints. Such adjustments could be based on results of a separate high resolution simulation model (e.g., TARMS) which previously processed "slices" of the scenario.
g. No Stochastic Results. All PARCOM results are "expected value." Neither input nor results have variable probabilistic aspects (e.g., con- fidence levels). Safety levels would have to be treated separately as an add-on to PARCOM quantities. However, use of expected values is meaningful for comparisons and parametric evaluations. Methodology for incorporating stochastic considerations into PARCOM would be complex. Conversion of the model into a stochastic simulation could entail high risk for an uncertain payoff.
D-28
CAA-SR-84-12
APPENDIX E
REFERENCES . .
1. OOD Instruction 4140.47, Secondary Item War Reserve Requirements Development, 11 Jul 79 (UNCLASSIFIED)
2. Maximizing Daily Helicopter Flying Hours Study (MAX FLY Study), CAA- SR-83-11, Aug 83 (SECRET)
3. 1982 Defense Guidance Memorandum, Office of the Secretary of Defense, 20 Mar 82 (SECRET)
4. Bigelow, James H., Improving the Management of Recoverable Aircraft Components in the PP8 and Related Processes, Vol. 2, Technical Details, The Rand Corporation, R-3094-MRAL, to be published (UNCLASSIFIED)
5. Pankonin, G. C, and Peterson, D. K., A Spares Stockage Algorithm for Low-Density Equipment, Air Force Institute of Technology (Masters Thesis), Sep 82 (UNCLASSIFIED) ....
6. Pickard, W. C, Zellner, P. A., and Bailey, D. R., Overview/ARLCAP User's Manual, Synergy, Inc., Aug 83 (UNCLASSIFIED)
7. Zellner, P. A., Pickard, W. C, Overview/ARLCAP, Final Report for MAX FLY Study, US Army Concepts Analysis Agency, Synergy, Inc., Jul 83 (UNCLASSIFIED)
8. User's Guide for the Selected Essential-Item Stockage for Availability Method (SESAME) Model, DARCOM Pamphlet 700-18, Sep 83 (UNCLASSIFIED)
9. Hillestad, R. J., Dyna-METRIC: Dynamic Multi-Echelon Technique for Recoverable Item Control, Rand Corp Report R-2785-AF, Jul 82 (UNCLASSIFIED)
10. Pyles, Raymond, The Dyna-METRIC Readiness Assessment Model: Motivation, Capabilities, and Uses, Rand Corp Draft Report WD-892-1-AF (to be published as R-2886-AF), Jan 84 (UNCLASSIFIED)
E-1
CAA-SR-84-12
APPENDIX F "
BIBLIOGRAPHY
DEPARTMENT OF DEFENSE
Department of Defense Publications
DOD Instruction 4140.39, Procurement Cycles and Safety Levels of Supply for Secondary Items (UNCLASSIFIED)
DOD Instruction 4140.44, Supply Management of the Intermediate and Con- sumer Levels of Inventory (UNCLASSIFIED)
DOD Instruction 4140.45, Standard Stockage Policy for Consumable Secon- dary Items at the Intermediate and Consumer Levels of Inventory (UNCLAS- SIFIED)
DOD Instruction 4140.46, Standard Stockage Policy for Reparable Secondary Items at the Intermediate and Consumer Levels of Inventory (UNCLASSIFIED)
Memorandum, Principal Deputy Assistant Secretary of Defense Juliano, Office of Manpower, Reserve Affairs, and Logistics, Subject: Consideration of End Item Readiness in Inventory Management, 10 March 1982 (UNCLASSIFIED)
DEPARTMENT OF THE ARMY
Department of the Army Publications
AR 11-11, Army Programs, War Reserves (CONFIDENTIAL)
AR 700-9, Policies of the Army Logistics System (UNCLASSIFIED)
AR 700-18, Provisioning of US Army Equipment (UNCLASSIFIED)
AR 710-1, Centralized Inventory Management of the Army Supply System (UNCLASSIFIED)
AR 710-2, Supply Policy Below the Wholesale Level (UNCLASSIFIED)
FM 38-704, Logistics Control Activity and Its Role in Management of the Army's Supply Distribution Pipeline (UNCLASSIFIED)
FM 38-725, Direct Support Supply (DSS) Management and Procedures (UNCLAS- SIFIED)
FM 100-15, Support Operations: Echelons Above Corps (UNCLASSIFIED)
F-1
CAA-SR-84-12
US Army Logistics Management Center Publications
- Introduction to Commodity Command Standard Systems (CCSS), ALM-54E802- RB, undated (UNCLASSIFIED)
New Concepts for Provisioning Parameter Estimates: Part I: Maintenance Factors and Replacement Rates, December 1976 (UNCLASSIFIED)
DEPARTMENT OF THE AIR FORCE
Air Force Systems Command Publication
Wartime Assessment and Requirements System (WARS), Vol I, Introduction, and Vol. II, Mathematical Section, March 1981 (UNCLASSIFIED)
Air Force Logistics Command Publication
Presutti, V. J., Stochastic Aircraft Availability Sensitivity Model, AFLC Working Paper XRS-80-2, February 1980 (UNCLASSIFIED)
Air Force Institute of Technology Publications
Engel, J. E., Quantitative Tools for the Logistics Manager, April 1980 (UNCLASSIFIED)
Kutzke, J. H., and Turner, G. A., The Effects of Item Usage Variation on Inventory Stockage Models, thesis, US Air Force Air University, LSSR 77-82, September 1982 (UNCLASSIFIED)
Air Force Logistics Management Center Publication
Nolte, L. H., Jr., Survey of Air Force Logistics Capability Assessment Concepts - Definitions - Techniques, AFLMC Report 781029-1, August 1980 (UNCLASSIFIED)
Air Conmand and Staff College Publication
Sweeny, B. D., Spares Provisioning for the Project Manager, thesis. Air University Report 82-2395, March 1982 (UNCLASSIFIED)
F-2
CAA-SR-84-12
MISCELLANEOUS
Logistics Managers Need to Consider Operational Readiness in Setting Safety Level Stocks, US General Accounting Office, August 1981 (UNCLASSIFIED)
Requirements and Production Capabilities are Uncertain for Some Air Force, Navy, and Marine Corps Aircraft Spares and Repair Parts, US General Account- ing Office, July 1982 (UNCLASSIFIED)
The Services Should Improve Their Processes for Determining Requirements for Supplies and Spare Parts, US General Accounting Office, November 1981 (UNCLASSIFIED)
Horowitz, S., Is the Military Budget Out of Balance, Center for Naval Analyses, pp-362, September 1982 (UNCLASSIFIED)
Abell, J. B., et al.. The Use of Availability Model in Initial Provisioning, Logistics Management Institute, April 1981 (UNCLASSIFIED)
Abell, J. B., and Lengel, J. E., Toward the Use of Availability Models for Spares Computations in the Department of Defense, Logistics Management Institute, June 1982 (UNCLASSIFIED)
Richards, L. D., Eirich, P. L., and Geisler, M. A., A Concept for the Management of Readiness, Logistics Management Institute, January 1980 (UN- CLASSIFIED)
Brooks, R. G., Gillen, C. A., and Lu, J. Y., Alternative Measures of Supply Performance: Fills, Backorders, Operational Rate, and NORS, Rand Corporation, RM-8094-PR, August 1969 (UNCLASSIFIED)
Carrillo, Manuel, and Pyles, Raymond, FlOO Engine Capability Assessment in PACAF: Effects on F-15 Wartime Capability, Rand Corporation Report No. N-1795-AF, March 1982 (CONFIDENTIAL)
Dyna-METRIC Version 4.3 Input Formats, Rand Corporation, unpublished report (UNCLASSIFIED)
Pyles, Raymond, and Tripp, Robert (LTC USAF), Measuring and Managing Readiness: The Concept and Design of the Combat Support Capability Manage- ment System, Rand Corporation Report No. N-1840-AF, April 1982 (UNCLASSIFIED)
Sherbrooke, C. C, A Management Perspective on METRIC - Multi-Echelon Technique for Recoverable Item Control, Rand Corporation Report No. RM- 5078/1-PR, DTIC No. AD664324, April 1958 (UNCLASSIFIED)
Pickard, W. C, Zellner, P. A., and Bailey, D. R., DOD Assimilation of US Air Force Methodologies for Relating Logistics Resources to Materiel Readiness, SYNERGY, Inc., August 1983 (UNCLASSIFIED)
F-3
CAA-SR-84-12
STUDY CRITIQUE
(This document may be modified to add more space for responses to questions,)
1. Were there any editorial comments? Yes if so, please list on separate page and attach to the critique sheet.
2. Was the work accomplished in a timely manner? Yes , If not, please comment.
3. Does the work report address adequately the issues planned for the analysis? ^^s . if not, please comment.
4. Were appropriate analysis techniques used? Yes . if not, please comment. ~
5. Are the findings fully supported by good analysis based on sound assumptions? Yes if not, please explain.
6. Does the report contain the preferred level of details of the analysis? "^^^ . If not, please comment,
7. Is the written material fully satisfactory in terms of clarity of presentation, completeness, and style? "^es jf ^Q^^ please comment.
G-3
CAA-SR-84-12
■ STUDY CRITIQUE (CONTINUED)
8. Are all Figures and Tables clear and helpful to the reader?'_jfes_ If not, please comment.
9. Does the report satisfy fully the expectations that were present when the work was directed? "^^^ . If not, please explain how not.
10. Will the Findings in this report be helpful to the organization which directed that the work be done? ^^^ . If so, please indicate how, and if not, please explain why not. Models developed by CAA for this
study are being prepared for transfer to AVSCOM, the user Agency, where they
will enable responsive analysis of ODCSLOG generated or transmitted POM and budgm cype quegcioflg.
11. Judged overall, how do you rate the study? (circle one)
Poor Fair Average Good (jxcellent^
G-4
CAA-SR-84-12
EDITORIAL COMMENTS
L. Para 1-La. Suggest reference be made to DODI 4140.47, "Secondary Item War Reserve Requirements Development," as a methodology, even if limited, for the preparation of war reserve requirements. Draft report implied that no such methodology existed.
2. Para l-3a. Should be modified to state clearly the restriction of the study's use of "operational availability" to "supply availability" only.
3. Para 2-lc(4). Should have the following added to the first sentence "and budget development."
6-5
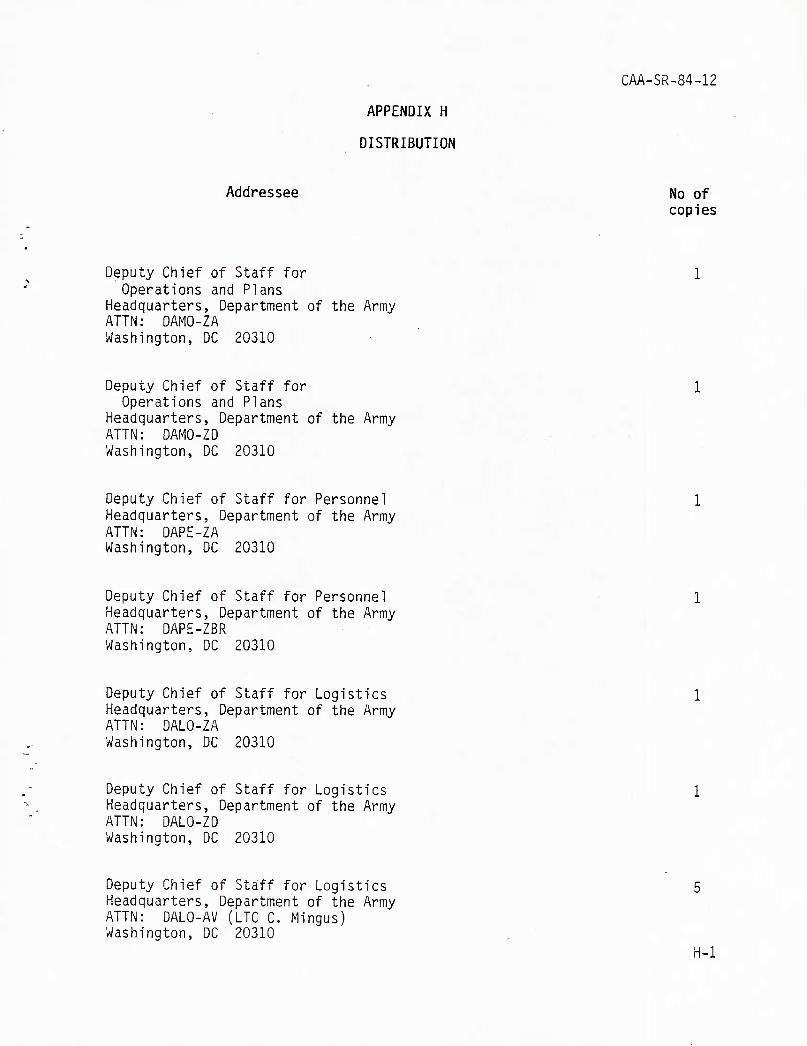
CAA-SR-84-12
APPENDIX H
DISTRIBUTION
Addressee No of copies
Deputy Chief of Staff for 1 Operations and Plans
Headquarters, Department of the Army ATTN: DAMO-ZA Washington, DC 20310
Deputy Chief of Staff for 1 Operations and Plans
Headquarters, Department of the Army ATTN: DAMO-ZD .... Washington, DC 20310
Deputy Chief of Staff for Personnel 1 Headquarters, Department of the Army ATTN: DAPE-ZA Washington, DC 20310
Deputy Chief of Staff for Personnel - 1 Headquarters, Department of the Army ATTN: DAPE-ZBR Washington, DC 20310
Deputy Chief of Staff for Logistics > 1 Headquarters, Department of the Army ATTN: DALO-ZA Washington, DC 20310
Deputy Chief of Staff for Logistics 1 Headquarters, Department of the Army ATTN: DALO-ZD Washington, DC 20310
Deputy Chief of Staff for Logistics 5 Headquarters, Department of the Army ATTN: DALO-AV (LTC C. Mingus) Washington, DC 20310
H-1
CAA-SR-84-12
Addressee No of copies
Commander 1 ■ US Army Logistics Center Fort Lee, VA 23801
Deputy Chief of Staff for Research, 1 Development, and Acquisition ^
Headquarters, Department of the Army ATTN: DAMA-ZA Washington, DC 20310
Deputy Chief of Staff for Research, 2 Development, and Acquisition
Headquarters, Department of the Army ATTN: DAMA-WSA (MAJ J. Verity) Washington, DC 20310 , , .. .
Deputy Under Secretary of the Army 1 (Operations Research)
Washington, DC 20310
Director of the Army Staff Headquarters, Department of the Army ATTN: DACS-ZD Washington, DC 20310
Chief of Staff, Army ATTN: DACS-DMO Washington, DC 20310
Chief of Staff, Army ATTN: DMZ-A Washington, DC 20310
Chief of Staff, Army ATTN: DACS-DPZ-A Washington, DC 20310
H-2
. . CAA-SR-84-12
Addressee No of copies
Assistant Secretary of the Army (Research, Development, and Acquisition)
Washington, DC 20310
Director US Army TRADOC Systems Analysis Activity
White Sands Missile Range, NM 88002
Director US Army Materiel Systems Analysis Activity
Aberdeen Proving Ground, MD 21005
Director US Army Ballistic Research Laboratory Building 305 Aberdeen Proving Ground, MD 21005
Commander Army Research Institute 5001 Eisenhower Avenue Alexandria, VA 22333
Commander US Army Logistics Evaluation Agency New Cumberland Army Depot New Cumberland, PA 17070
Director Defense Logistics Studies Information
Exchange US Army Logistics Management Center Fort Lee, VA 23801
Defense Technical Information Center ATTN: DTIC-DDA Cameron Station Alexandria, VA 22314
H-3
CAA-SR-84-12
Addressee No of copies
Director Applied Technology Laboratory US Army Research and Technology
Laboratories (AVSCOM) Fort Eustis, VA 23604
Commander 1 US Army Research, Development, and Acquisition Information Systems Agency
Radford, VA 24141
The Pentagon Library (Army Studies Section) ATTN: ANRAL-RS The Pentagon Washington, DC 20310
Commandant US Army War College ATTN: Library Carlisle Barracks, PA 17013
Commandant US Air War College Maxwell Air Force Base, AL 36112
Commandant US Navy War College Newport, RI 02840
Commandant Industrial College of the Armed Forces Fort McNair Washington, DC 20319
Commandant National War College Fort McNair Washington, DC 20319
H-4
CAA-SR-84-12
Addressee No of copies
Superintendent Naval Postgraduate School Monterey, CA 93940
Commandant US Army Air Defense School Fort Bliss, TX 79916
Commandant US Army Aviation School Fort Rucker, AL 36360
Commandant US Army Aviation Logistics School ATTN: ATSPQ-CMT Fort Eustis, VA 23604
Commandant US Army Aviation Logistics School ATTN: ATSQ-CD Fort Eustis, CA 23604
Defense Systems Management School Concepts, Studies, and Simulations Building 202 Fort Belvoir, VA 22060
Commandant US Army Quartermaster School Fort Lee, VA 23801
Commander US Army Missile Command Redstone Arsenal, AL 35809
Commander-in-Chief US Army, Europe & Seventh Army ATTN: AEAGX-OR (Mr. Dwarkin) APO New York 09403
H-5
CAA-SR-84-12
Addressee No of copies
Commander US Army Materiel Development and
Readiness Command 5001 Eisenhower Avenue Alexandria, VA 22333
Commander US Army Aviation Systems Command ATTN: DRSAV-BB 4300 Goodfellow Boulevard St. Louis, MO 63120
Commander US Army Aviation Systems Command ATTN: DRSAV-SP 4300 Goodfellow Boulevard St. Louis, MO 63120
Commander US Army Troop Support Command ATTN: DRSTR-BT 4300 Goodfellow Boulevard St. Louis, MO 63120
US Army CE Command Program Analysis and Evaluation Systems Analysis Division Fort Monmouth, NJ 07703
Assistant Chief of Staff for Studies and Analyses
US Air Force Room 1E388, Pentagon Washington, DC 20330
H-6
Addressee
CAA-SR-84-12
No of copies
Deputy Chief of Staff for Logistics and Engineering
Headquarters, US Air Force ATTN: AF/LEXY The Pentagon Washington, DC 20330
Commandant Air Force Institute of Technology ATTN:. AFIT-CC Wright-Patterson Air Force Base, OH 45433
President Center for Naval Analyses 2000 North Beauregard Street Alexandria, VA 22311
H-7
GLOSSARY
1. ABBREVIATIONS, ACRONYMS, AND SHORT TERMS
CAA-SR-84-12
acft
ADP
AF
AFH
AFLC
ALC
ALMSA
AMD
AMSAA
ANSI
AR
ASF
ASL
assy
avail
avg
AVIM
AVSCOM
AVUM
AWP
BRL
aircraft
automated data processing
Air Force
achievable flying hours
Air Force Logistics Command
Air Logistics Center
Automated Logistics Management Systems Activity
average monthly demand
US Army Materiel Systems Analysis Activity
American National Standards Institute, Incorporated
Army regulation
Army Stock Fund
authorized stockage list(s)
assembly
availability
average
aviation intermediate maintenance
US Army Aviation Systems Command
aviation unit maintenance
awaiting parts
Ballistics Research Laboratory
Glossary-1
CAA-SR-84-12
CAA
CECOM
CIRF
CNO
CONUS
condem parts
cont
CPU
CSIS
cum
curr
DA
DARCOM
DESCOM
DOD
dom pt
DRD
DRF
EEA
EFH
EIPF
eng
ERPSL
FHP
US Army Concepts Analysis Agency
US Army Communications-Electronics Command
centralized intermediate repair facility
Chief of Naval Operations
Continental United States
condemned and/or consumable parts
continued
central processing unit
central secondary item stratification
cumulative
current
Department of the Army
US Army Materiel Development and Readiness Command
US Army Depot Systems Command
Department of Defense
dominant part
Demand/Return/Disposal File
demand rate factor
essential element(s) of analysis
estimated flying hours
End Item Parameter File
engine
essential repair parts stockage list
flying hour program
j *
Glossary-2
'■>", i-^-f^-
FMCS
FMS
frac
hr
hub assy MR
ID
ILM
incr
inv
IRO
IWR
K
LRU
M
MAC
MACOM
maint
MAX FLY
MDS
MFHAD
min
MSC
NMC
NMCS
no.
NRTS
CAA-SR-84-12
fully mission capable for supply
foreign military sales '
fraction
hour . I \
hub assembly, main rotor ■1
identifier '|
intermediate level maintenance
increase
inventory
US Army Inventory Research Office
initial war reserve
thousand
line replaceable unit(s)
million
US Air Force Military Airlift Command
major Army command
maintenance ' , .
Maximizing Daily Helicopter Flying Hours (study)
mission design series
maximum flying hours per aircraft per day
minimum
major subordinate command
not mission capable
not mission capable due to supply
number
not repairable at this station
Glossary-3
CAA-SR-84-12
NSN
NSNMDR
NWR
OASD-MRA&L
ODCSLOG
ODCSOPS
OSD
OIM
OST
OWRM
PAA-2
PACOM
PDM
PLL
PMR
POM
PPBES
prog
PWRM
QPA
national stock number
National Stock Number Master Data Record
new war reserve
Office of the Assistant Secretary of Defense for • Manpower, Reserve Affairs, and Logistics
Office of the Deputy Chief of Staff for Logistics (Department of the Army)
Office of the Deputy Chief of Staff for Operations and Plans (Department of the Army)
Office of the Secretary of Defense
organizational and intermediate maintenance
order and ship time
other war reserve materiel
Procurement Appropriation, Army - Secondary Items
US Air Force Pacific Command
Program Data File
programed depot maintenance
prescribed load list(s)
Provisioning Master Record
Program Objective Memorandum
Planning, Programing, Budgeting, and Execution System
program
prepositioned war reserve materiel
quantity per application
■»
Glossary-4
CAA-SR-84-12
RDB Requirements Data Base
i"qnit(s) requirement(s)
rqn requisition
rqr required
SAG Study Advisory Group
SCA stability control amplifier
SCS Supply Control Study(ies)
SRU shop replaceable unit(s)
stab cntl amp stability control amplifier
sub substitution
transd transducer
transd eng transducer, engine
TSU telescopic sight unit
USAF United States Air Force
WARSL War Reserve Stockage List
WRMR war reserve materiel requirement
xmsn transmission
Glossary-5
CAA-SR-84-12
2. MODELS, ROUTINES, AND SIMULATIONS
ACIM
ARCSIP
ARLCAP
cess
D029
D041
Dyna-METRIC
LOGRAMS
LOGSACS
Overview
PARCOM
RDES
SESAME
TARMS
TRANSMO
WARS
Availability Centered Inventory Model
Automated Requirements Computation System for Initial Provisioning
Army Logistics Capability (model)
Commodity Command Standard System
US Air Force War Readiness Spares Kit/Base-level Self- sufficiency Spares
US Air Force Recoverable Consumption Item Requirements Computation System
Dynamic Multi-Echelon Technique for Recoverable Item Control
Logistics Requirements Assessment/Analysis Model
Logistics Structure and Composition System
Model developed by Synergy, Inc. to relate aircraft logistics resources to operational capabilities
Parts Requirements and Cost Model
Requirements Determination and Execution System
Selected Essential-Item Stockage for Availability Method Model
TRASANA (US Army Training and Doctrine Command Systems Analysis Activity) Aircraft Reliability and Maintainability Simulation
Transportation Model '
Wartime Assessment and Requirements System
Glossary-6

1)21255?
«


