Embed Size (px)
Citation preview

UNCORRECTED PROOF
ARTICLE IN PRESS
1 Calanus spp. grazing affects egg production and vertical carbon
2 flux (the marginal ice zone and open Barents Sea)
3 Anna Pasternak a,*, Christian Wexels Riser b, Elena Arashkevich a,4 Tatjana Rat’kova a, Paul Wassmann b
5 aP.P. Shirshov Institute of Oceanology, Russian Academy of Science, 36 Nakhimov av., Moscow 117851, Russia
6 bNorwegian College of Fishery Science, University of Tromsø, 9037, Tromsø, Norway78 Received 6 July 2001; accepted 22 May 2002
9 Abstract
10 Concentration of faecal pellets of Calanus finmarchicus, Calanus glacialis, and Calanus hyperboreus, as well as eggs and
11 nauplii of the first two species in the upper 0–100 m layer, were estimated during 24-h stations in the marginal ice zone and the
12 open Barents Sea in March, May, and July. The importance of Calanus spp. as major contributors to suspended matter and
13 vertical flux was confirmed, as the proportion of their faecal pellets was high and rather stable in the upper 100 m layer
14 throughout the study period, varying between 48% and 95% of total suspended pellet carbon (maximum dimension >50 Am)
15 and comprising more than 50% of sediment matter. Feeding activity of calanoid copepods was not correlated with the seasonal
16 changes in total phytoplankton carbon, but with assumed preferred food. Egg production was correlated with feeding activity
17 depending on the temporal scales of the study (monthly, daily, hourly). A significant positive correlation between egg and faecal
18 pellet concentration on a monthly scale, a weak significant (C. finmarchicus), or, insignificant (C. glacialis) positive correlation
19 between daily egg and faecal pellet production, and a significant negative correlation between hourly egg and faecal pellet
20 production (C. finmarchicus) were obtained. Significant correlations between indices of current feeding activity (or, available
21 food), egg production and nauplii concentration obtained in the field suggest that current feeding, not lipid reserves, played a
22 major role in supplying the energy for reproduction of C. finmarchicus and C. glacialis.
2324 D 2002 Elsevier Science B.V. All rights reserved.25
26 Keywords: Feeding activity; Egg production; Faecal pellets; Calanus finmarchicus; Calanus glacialis; Calanus hyperboreus; Barents Sea
272829 1. Introduction
30 Three sibling species of calanoid copepods, Cala-
31 nus finmarchicus, Calanus glacialis, and Calanus
32 hyperboreus, play an essential role in trophodynamics
33of the pelagic systems of the North Atlantic and
34adjacent seas. They are recognized as important prey
35organisms for larvae and juveniles of a number of
36commercially exploited fish (Kane, 1984; Astthorsson
37and Gislason, 1997), and it has been suggested that
38the recruitment in various fish stocks may be related
39to abundance of these species (Cushing, 1984). C.
40finmarchicus is also the dominant species in the North
41Atlantic zooplankton biomass (Batchelder et al.,
421995).
0924-7963/02/$ - see front matter D 2002 Elsevier Science B.V. All rights reserved.
PII: S0924 -7963 (02 )00174 -4
* Corresponding author. Tel.: +7-95-124-5983; fax: +7-95-421-
6378.
E-mail address: [email protected] (A. Pasternak).
www.elsevier.com/locate/jmarsys
Journal of Marine Systems 881 (2002) xxx–xxx
UNCORRECTED PROOF
ARTICLE IN PRESS
43 The life cycle strategies in copepods of high lat-
44 itudes are generally adjusted to seasonal changes in
45 phytoplankton abundance. Lipid storage is a part of the
46 normal life cycle of many high-latitude species,
47 including the three related calanid species studied.
48 Following accumulation of lipid reserves, copepods
49 descend to the depth, where they spend the unfavour-
50 able winter period, reducing their metabolism (Øst-
51 vedt, 1955; Hirche, 1996a; Kaartvedt, 1996; and
52 references therein). When they ascend to the surface
53layers in spring, they have to use the short period of
54phytoplankton abundance, giving rise to the new
55generations, and storing energy depots. Presumably,
56foraging activity should be very high at that period
57(Pasternak et al., 2001). However, recent studies sug-
58gest that feeding, growth and development of Calanus
59sp. is only weakly associated with the abundance of
60large phytoplankton, as other food, such as micro-
61zooplankton, may be important (Kleppel et al., 1991,
621998; Ohman and Runge, 1994; Runge and Plourde,
Fig. 1. Map of the study area of the Barents Sea. Three cruises, in March and May 1998 and July 1999, are indicated.
A. Pasternak et al. / Journal of Marine Systems 881 (2002) xxx–xxx2

UNCORRECTED PROOF
ARTICLE IN PRESS
63 1996). Changes in the food environment might also
64 have prolonged effects on subsequent reproduction
65 (Bamstedt et al., 1999). Reproduction of copepods
66 usually depends on both the previously accumulated
67 energy reserves and current feeding success. However,
68 the largest of the three species C. hyperboreus was
69 shown to reproduce before the phytoplankton bloom,
70 using only its lipids reserves for reproduction Sømme,
71 1934; Østvedt, 1955; Conover, 1967; Smith, 1990;
72 Hirche and Niehoff, 1996). The connection between
73 reproduction activity and current feeding was many
74 times shown in laboratory experiments, but is usually
75 not so evident from the field data. A part of the
76 discrepancy is reproduction dependence not only on
77 current feeding, but also on lipid reserves, another—
78 spatial and temporal variability of the environment. A
79 temporal scale of research may also influence the result
80 of comparison between reproduction and feeding
81 activity, as there is always a lag between ingestion
82 and egg production. Responses to changes in food
83 concentrations, effects of season on egg production
84 have to be studied thoroughly. The easiest, although
85 indirect, way to estimate feeding activity of copepods
86 in the field is to evaluate the subsequent products of
87 their feeding, that is, faecal pellet matter egested by
88 them. It was shown to be an appropriate index of
89 feeding activity (Drits, 1985; Ayukai and Nishizawa,
90 1986; Tsuda and Nemoto, 1990; Rey et al., 1999;
91 Frangoulis et al., 2001).
92 A major loss of phytoplankton-derived organic
93 carbon from the euphotic zone occurs through zoo-
94 plankton faecal pellets, detritus and settling of phyto-
95plankton cells (Wassmann, 1989). The sinking of
96particulate organic matter supplies the inhabitants of
97the deeper layers and benthic communities with
98energy (Smetacek, 1984). The studied copepods pro-
99duce relatively large faecal pellets with high sinking
100rates. As they are membrane covered, they do not
101disintegrate as quickly as others. This increases their
102role in the vertical pellet flux. Bearing in mind a
103significant role of Calanus spp. in zooplankton bio-
104mass in the Barents Sea (Skjoldal and Rey, 1989;
105Tande, 1991), a considerable impact of their faecal
106pellets on the vertical flux could be assumed.
107The main objectives of this study were:
1081. How was Calanus spp. feeding activity related to
109seasonal changes in food availability?
1102. How did the proportion of Calanus spp. pellets in
111the vertical carbon flux change during the season?
1123. How was Calanus egg production related to
113grazing on different temporal scales (monthly,
114daily, hourly)?
1152. Materials and methods
116Data were collected during three cruises of R/V
117‘‘Jan Mayen’’ to the Barents Sea in March 1998, May
1181998 and July 1999. Each cruise started with a trans-
119ect running from Nordkapp at the south over the
120Central Bank to the Marginal Ice Zone (Fig. 1). On
121the way back, three to five 24-h stations were carried
122out (Table 1). Deployment of sediment traps, rate
t1.1 Table 1
Dates and locations of the 24-h stations. Total depth and water bodies indicatedt1.2
Cruise Station Date Location (jN jE) Depth, m Water bodyt1.3
I 1 23 March 1998 72j55V 30j98V 300 Atlantict1.42 21 March 1998 73j77V 31j88V 350 Polar Frontt1.53 19 March 1998 76j39V 33j21V 256 MIZt1.6
II 1 28 May 1998 72j50V 30j95V 301 Atlantict1.72 26 May 1998 73j79V 31j64V 340 Atlantict1.83 24 May 1998 74j80V 32j46V 168 Polar Frontt1.94 22 May 1998 75j61V 33j06V 239 Arctict1.105 20 May 1998 76j02V 32j99V 323 Arctict1.11
III 1 9 July 1999 73j80V 31j78V 342 Atlantict1.122 8 July 1999 75j12V 32j29V 250 Polar Frontt1.133 6 July 1999 77j08V 33j82V 169 Arctict1.144 4 July 1999 77j65V 34j21V 190 Arctict1.155 2 July 1999 78j24V 34j23V 194 Arctict1.16
A. Pasternak et al. / Journal of Marine Systems 881 (2002) xxx–xxx 3

UNCORRECTED PROOF
ARTICLE IN PRESS
123 measurements, stratified zooplankton sampling were
124 performed at these stations. The present study is based
125 on the data from these stations. Water temperature
126 changed at the 24-h- stations from 2–3 to 3 jC and
127 4–5 jC in the Atlantic water in March, May and July
128 in the upper 100 m layer, and was almost constantly
129 around 1 jC in the Arctic water (Reigstad et al., this
130 issue).
131 Sampling of the suspended matter with water bot-
132 tles, sedimented matter with traps, and zooplankton
133 with a plankton net has been in detail described else-
134 where (Wexels Riser et al., this issue; Arashkevich et
135 al., this issue). Samples of suspended matter were
136 collected from 10, 30, 75 and 90 m in March 1998
137and from 10, 30, 50, 100 and 150 m in May 1998 and
138July 1999. Samples were taken twice a day, at noon
139and midnight, with 10-l Niskin bottles. They were
140concentrated with a 20-Am sieve and preserved with
141glutaraldehyde (2% final concentration). Faecal pel-
142lets, eggs and nauplii from suspended samples were
143identified, counted and measured under a dissecting
144microscope in a plankton counting chamber. The
145length and width of the pellets were measured and
146the pellet volume calculated using appropriate stereo-
147metrical configurations (Edler, 1979). A volumetric
148carbon conversion factor of 69.4 Ag C mm� 3 (Riebe-
149sell et al., 1995) was applied to estimate the faecal
150carbon.
Fig. 2. Seasonal changes in concentration of the ‘‘preferred’’ food at the 24-h stations in the 0–90 m layer (see Materials and Methods for
explanation of the composition of ‘‘preferred food’’). Solid circles—Stn. 1, open circles—Stn. 2, solid triangles—Stn. 3, open squares—Stn. 4,
open triangles—Stn. 5.
A. Pasternak et al. / Journal of Marine Systems 881 (2002) xxx–xxx4

UNCORRECTED PROOF
ARTICLE IN PRESS
151 The whole samples of suspended matter were
152 analyzed to assess the concentration of eggs, nauplii
153 and faecal pellets of Calanus spp. Usually 30–300
154 specimens of each distinguished category of these
155 items per sample were counted. However, due to a
156 low abundance of suspended particles in March, these
157 numbers were not more than 6–30. Total abundance
158 of pellets, eggs and nauplii were estimated for the
159 upper 0–100 m, in March cruise, 0–90 m layer. Mean
160 daily values (an average for the noon and midnight
161 values) were used. Calanus spp. faecal pellets carbon
162 was used as an index of feeding activity (Drits, 1985;
163 Ayukai and Nishizawa, 1986; Tsuda and Nemoto,
164 1990; Rey et al., 1999; and reference therein; Fran-
165 goulis et al., 2001). We distinguished Calanus spp.
166 faecal pellets on the basis of their general appearance
167 and dimensions (Gonzalez et al., 1994 and references
168 therein; Pasternak et al., 2000). Faecal pellets of
169 Calanus spp. have cylindrical shape, a well-developed
170 peritrophic membrane, that forms usually one rounded
171 and another elongated end. Four size classes of
172 cylindrical pellets were distinguished. Average length
173 and width and size range of the smallest pellets of this
174 category was 100� 20 and (50–100)� (10–20) Am,
175 and they were assumed to be produced by small
176 copepods; larger pellets of the mean length and width
177 of 200� 35 and size range (150–250)� (30� 40) Am
178were produced byMetridia spp. and younger stages of
179Calanus spp. The two largest size classes, (250–
180550)� (50� 70) and (550–1000)� (70� 80) Am,
181belonged to the older copepodite stages of Calanus
182spp. Metridia spp. faecal pellets are wider and shorter,
183and usually more dense and dark than Calanus spp.
184However, to reduce the potential errors connected
185with separating their pellets, we took into consider-
186ation only the two largest size classes. There could be
187some further errors, if the pellets were broken and
188badly disrupted. However, there were not many of
189those during our cruises.
190Sediment traps on a drifter were deployed at 30,
19140, 50, 60, 90, 120, 150 and 200 m. The material was
192collected in Plexiglas cylinders of 450 mm length and
193with an aspect ratio of 6.2. The content of each trap
194(1.75 l) was collected after 24-h deployment and 100
195ml subsamples for microscopic examination and
196counting of faecal pellets were preserved with gluta-
197raldehyde (2% final concentration). The whole sub-
198samples of 100 ml from sediment traps were analyzed.
199Usually 30–150 specimens of each distinguished
200category per sample were counted. However, due to
201a low abundance of sedimented particles in March,
202these numbers were not more than 5–20.
203Mezozooplankton was collected with a WP-2
204plankton net (0.5 m mouth diameter, 180 Am mesh).
Fig. 3. Seasonal changes in total zooplankton faecal pellet carbon content in the upper 0–100 m layer at the 24-h stations. Symbols—as in Fig. 1.
A. Pasternak et al. / Journal of Marine Systems 881 (2002) xxx–xxx 5

UNCORRECTED PROOF
ARTICLE IN PRESS
205 Vertical tows from 0–50, 50–100, and 100–bottom
206 layers were taken at the 24-h stations. The samples
207 were preserved with a mixture of borax-buffered
208 formaldehyde (4% final concentration) and propan-
209 diol solution (5% by volume). Identification and
210 counting of zooplankton was carried out under a
211 dissecting microscope.
212 The experiments on egg and faecal pellet produc-
213 tion of the three copepod species were carried out
214during the May 1998 cruise. Ten (if available) freshly
215caught females of each of the three species (C.
216finmarchicus, C. glacialis, C. hyperboreus) at every
21724-h station were sorted immediately for egg and
218faecal pellet production experiments. Females picked
219up at random were placed individually into a 200-ml
220glass dish with natural sea water in a temperature-
221controlled room at 1–3 jC. Experiments lasted for 3–
2225 days, but to determine clutch size and egg produc-
Fig. 4. Seasonal changes in abundance of Calanus spp. in the 0–100 m layer. Upper panel—abundance of all copepodite stages; median
panel—abundance of older copepodite stages (CIV–CVI); lower panel—abundance of adult females.
A. Pasternak et al. / Journal of Marine Systems 881 (2002) xxx–xxx6

UNCORRECTED PROOF
ARTICLE IN PRESS
223 tion per female per day, we used only data from the
224 first 2 days, as clutch size decreased considerably after
225 that in some replicates. To determine assumed de-
226 pendence of egg production on feeding on daily basis,
227 experimental dishes were checked twice a day, pro-
228 duced eggs and faecal pellets collected with a fine
229 pipette, counted and removed, and water replaced.
230 Means and standard errors for each experiment were
231 calculated. To study relationship between egg produc-
232 tion and feeding on an hourly basis, two experiments,
233 where eggs and pellets from individual C. finmarch-
234 icus females were counted and removed every 2 h,
235 were carried out at 24-h stations 4 and 5.
236We compared concentration of Calanus spp. fae-
237cal pellets and eggs with the data on phytoplankton
238and Protozoa presented by Ratkova and Wassmann
239(this issue). Phytoplankton species composition can
240strongly influence actual feeding conditions of cope-
241pods. Calanus’ preference of diatoms and, some-
242times, of dinoflagellates, was confirmed in some
243recent studies (Meyer-Harms et al., 1999; Irigoien
244et al., 2000), as well as avoidance of cyanobacteria,
245pelagophytes, and ‘‘green algae’’. There is no clear
246indication whether Phaeocystis sp. is a suitable
247source for Calanus feeding; recent studies showed
248that Phaeocystis pouchetii and cryptophytes were
Fig. 5. Seasonal changes in feeding and reproduction output of Calanus spp. at the 24-h stations in the 0–100 m layer. Upper panel—
concentration of faecal pellet carbon; median panel—concentration of suspended eggs; lower panel—concentration of nauplii. Symbols—as in
Fig. 1.
A. Pasternak et al. / Journal of Marine Systems 881 (2002) xxx–xxx 7
UNCORRECTED PROOF
ARTICLE IN PRESS
249 ingested according to their abundance (Meyer-Harms
250 et al., 1999). Some studies have demonstrated inges-
251 tion of Phaeocystis by calanoid copepods (Huntley et
252 al., 1987; Tande and Bamstedt, 1987; Sargent and
253 Falk-Petersen, 1988), others have inferred that it was
254 not ingested (Bautista et al., 1992). As shown by
255 Estep et al. (1990), predation upon P. pouchetii is a
256 function of the physiological state of the colonies.
257 For simplicity, we excluded P. pouchetii from the
258 calculation of the assumed ‘‘preferred’’ phytoplank-
259 ton food. Concentration of the ‘‘preferred’’ phyto-
260plankton food, including diatoms, dinoflagellates,
261silicoflagellates, coccolithoforides (all >5 Am) was
262obtained for the 0–90 m layer. There is no indication
263whether silicoflagellates and coccolithoforides are
264selected by Calanus spp.; however, their biomass
265was much less than that of the first two groups
266(Ratkova and Wassmann, this issue), and we did not
267include them in the calculation of the ‘‘preferred’’
268food.
269Omnivory, especially feeding on protozoans, could
270play an important role for C. finmarchicus when
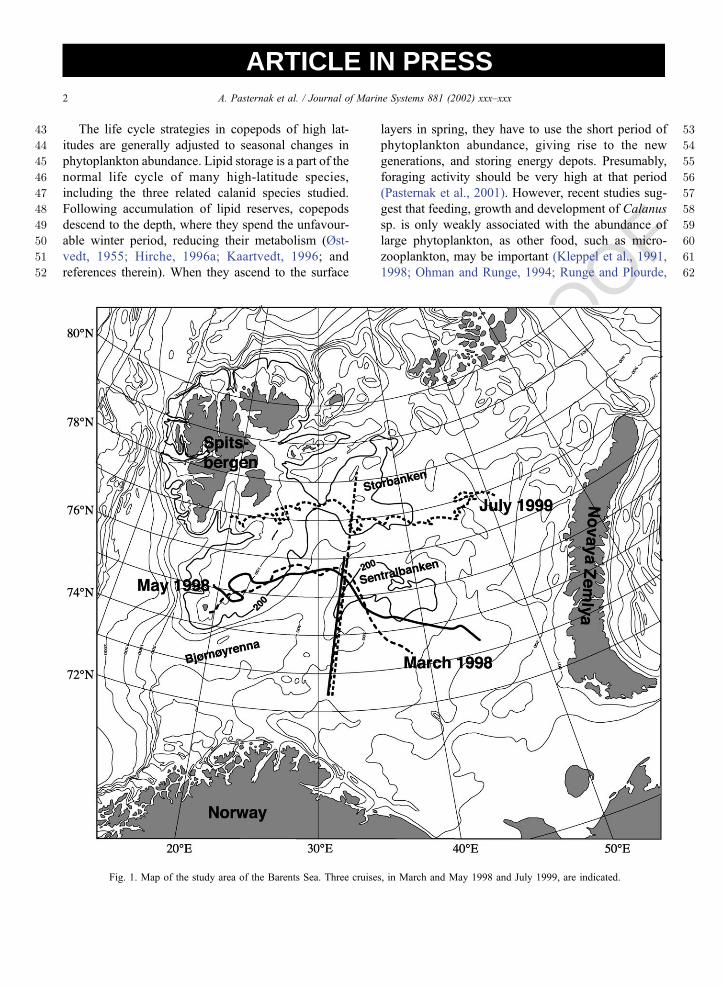
Fig. 6. Seasonal changes in specific indices of Calanus spp. feeding and reproduction activity. Upper panel—faecal pellet carbon per older
copepodite of the three Calanus species; lower panel—number of eggs per female (C. finmarchicus and C. glacialis).
A. Pasternak et al. / Journal of Marine Systems 881 (2002) xxx–xxx8

UNCORRECTED PROOF
ARTICLE IN PRESS
271 phytoplankton resources are not abundant (Ohman
272 and Runge, 1994). Thus, we made two calculations
273 of the ‘‘preferred’’ food, with and without Protozoa
274 (data from Ratkova and Wassmann, this issue).
275 Spearman rank order correlations were calculated
276 between total phytoplankton carbon, ‘‘preferred’’
277 food (with and without Protozoa), and suspended
278 faecal pellets, ova and nauplii of Calanus spp. We
279 also calculated specific values, that is, number of
280 eggs per female and faecal pellet carbon per older
281 copepodite.
282 3. Results
283
284 3.1. Seasonal changes in food availability
285 Chlorophyll concentration was low during the
286 March cruise (0.01–0.04 mg m� 3 in the upper 40
287 m, Reigstad et al., this issue). Phytoplankton bloom
288 was observed in May, with chlorophyll concentrations
289 about 8–14 mg m� 3, which decreased in July (1–4.5
290 mg m � 3, Reigstad et al., this issue). Auto- and
291 heterotrophic forms in the samples of the suspended
292 pico-, nano- and microplankton were not distin-
293 guished and their combined biomass is later termed
294 PNMC (pico-, nano- and microplankton carbon).
295 There was no clear seasonal pattern in the changes
296 of PNMC in the upper 0–90 m layer (Ratkova and
297 Wassmann, this issue). Several groups such as P.
298 pouchetii, probably heterotrophic flagellates, chryso-
299 monades were responsible, forming occasional peaks
300 at certain depths and stations (Ratkova and Wass-
301 mann, this issue).
302 The changes in the ‘‘preferred’’ food are shown in
303 Fig. 2. The concentration of the ‘‘preferred’’ food was
304 low in March; it increased in May and July. In July,
305 the concentrations at the southernmost stations 1 and
306 2 were higher than those in May. No consistent pattern
307 in concentration of the ‘‘preferred’’ food between
308 stations was observed.
309 Protozoa were scarce in March and May (Ratkova
310 and Wassmann, this issue) and their role in the
311 ‘‘preferred’’ food biomass was negligible at that time
312 (Fig. 2, upper and lower panels). Their abundance
313 increased by July (Ratkova and Wassmann, this issue)
314 and the pattern of their spatial distribution was the
315 same as of the other ‘‘preferred’’ food.
316
3173.2. Seasonal changes in concentration of faecal
318pellets
319During the cruise in March, most of the zooplank-
320ton, and large copepods in particular, resided at the
321deep layers (Arashkevich et al., this issue). At that time,
322phytoplankton bloom had not yet started. Feeding
323activity of ascended zooplankton increased consider-
324ably during the bloom in May, which could be sup-
Fig. 7. Proportion of Calanus spp. faecal pellet carbon in total
vertical flux. Data for 24-h stations are given. Means are along the
lines.
A. Pasternak et al. / Journal of Marine Systems 881 (2002) xxx–xxx 9

UNCORRECTED PROOF
ARTICLE IN PRESS
325 posed from an increased concentration of faecal pellet
326 carbon (Fig. 3). Abundance of different copepodite
327 stages of Calanus spp. in the upper 100 m layer was
328 very low inMarch and increased inMay, remaining at a
329 similar level in July (Fig. 4, upper panel). However, the
330 age structure was different in May and July, and older
331 copepodite stages (CIV–CVI, the producers of pellets
332 we estimated) and, especially, adult females were more
333 numerous in May (Fig. 4, median and lower panel).
334 Feeding activity of Calanus spp. in March as evaluated
335 from faecal pellets in the samples of suspended matter
336 (Fig. 5, upper panel) and from the visual estimates of
337 gut fullness was very low. On average, 8F 9.6%
338 (meanF S.D.) of the Calanus spp. older stages at
339 different 24-h stations in March contained food inside.
340 The ratio of Calanus faecal pellets to older copepodites
341 also was low in March (less than 1 Ag C ind � 1, Fig. 6,
342 upper panel). During the bloom in May, about 85% of
343 Calanus spp. contained food in the guts. The ratio of
344 Calanus faecal pellets to older copepodites increased
345 considerably (up to 29 Ag C ind � 1, Fig. 6, upper
346 panel). The highest concentration of total suspended
347 zooplankton faecal pellets in the upper 0–100 m layer
348 was found at the 24-h stations 5 and 4 (close to the ice).
349 Pellet concentration decreased southward. In July,
350 concentration of Calanus faecal pellets was generally
351 lower, with the exception of Stn. 2, where a pro-
352 nounced increase was noted. However, the specific
353 values for the older copepodites were similar to those in
354 May (Fig. 6, upper panel).
355 Calanus pellets changed similarly to the total
356 faecal pellet carbon (Figs. 3 and 5, upper panel).
357 The peak of Calanus spp. faecal pellets at Stn. 2 in
358 July was not so pronounced as in total faecal carbon;
359 otherwise, there was a remarkable coincidence.
360Indeed, the average proportion of Calanus spp. pellets
361suspended in the upper water layer was fairly stable
362and high throughout the study period, varying from
36348% to 95% of total FP carbon. Thus, Calanus spp.
364egestion accounted, usually, for a major portion of the
365suspended total FP concentration (of the size >than 50
366Am) in the 0–100 m water layer. Calanus faecal
367pellets usually comprised also more than 50%, on
368average, of sediment faecal material in the upper
369water layer, and their role decreased only in deeper
370layers (Fig. 7). However, the March data should be
371treated with caution, as both the Calanus spp. FP and
372the total zooplankton FP abundance were low. Fili-
373form pellets from krill, whose role increased at the
374deep layers, dominated the sediment traps at Stns. 1
375and 4 in May and were also important in July, being
376the second main contributor to the vertical pellet flux
377(Wexels Riser et al., this issue).
378There was no correlation between Calanus faecal
379pellet and total phytoplankton carbon, but a weak but
380significant correlation with ‘‘preferred’’ phytoplank-
381ton was found (Table 2). Addition of heterotrophic
t2.1 Table 2
Spearman rank order correlations, RS ( p), between concentration of phytoplankton carbon, preferred food carbon, Calanus spp. suspended
faecal pellets, ova and nauplii, sampled during March, May and July cruisest2.2
t3.1Table 3
Spearman rank order correlations, RS ( p), between phytoplankton
carbon, preferred food carbon, specific values of Calanus spp.
faecal pellets (micrograms per older copepodite) and ova (number
per female), sampled during March, May and July cruises t3.2
Food Faecal pellets Ova t3.3
Total phytoplankton � 0.01
(0.966)
0.34
(0.276) t3.4Preferred food:
phytoplankton
0.40
(0.199)
0.85
(0.0004) t3.5Preferred food:
phytoplankton + Protozoa
0.45
(0.088)
0.87
(0.0002) t3.6
A. Pasternak et al. / Journal of Marine Systems 881 (2002) xxx–xxx10

UNCORRECTED PROOF
ARTICLE IN PRESS
382 microplankton carbon to the preferred food slightly
383 strengthened the correlation (Table 2). The correla-
384 tions between the individual specific values (faecal
385 pellet carbon per older copepodite) and the food
386 resources were not significant (Table 3).
387
3883.3. Seasonal variations in abundance of eggs and
389nauplii
390Reproduction had just started during the March
391cruise; concentration of eggs and nauplii of Calanus
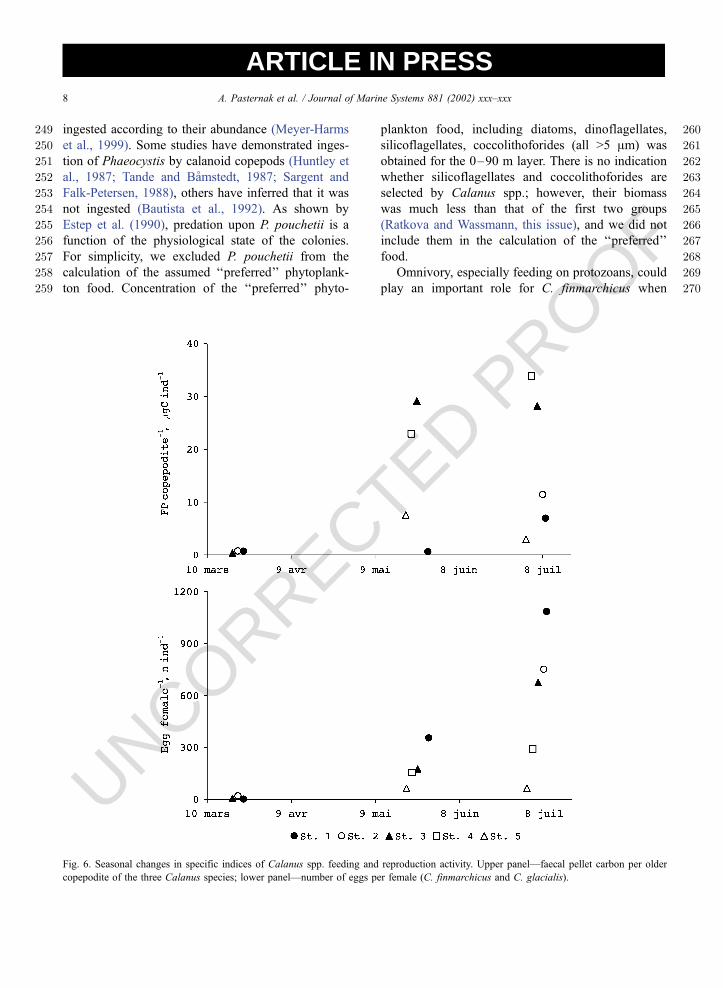
Fig. 8. Relationship between feeding activity and egg production of Calanus spp. Upper panel—concentration of suspended eggs vs. faecal
pellets, field data. Median panel—number of eggs vs. number of faecal pellets produced daily by a female in the experiment. Dark circles: C.
finmarchicus, open triangles: C. glacialis. Lower panel—number of eggs vs. number of faecal pellets produced hourly by a female C.
finmarchicus. Spearman rank order correlation coefficients (RS) and p-levels are given. Trend lines are shown.
A. Pasternak et al. / Journal of Marine Systems 881 (2002) xxx–xxx 11

UNCORRECTED PROOF
ARTICLE IN PRESS
392 spp. was low (Fig. 5, median and lower panels). Both
393 C. glacialis and C. finmarchicus were actively repro-
394 ducing in May. About 90% females were at gonad
395 stage 4, that is, fully mature, and were filled with
396 eggs. C. hyperboreus females, on the contrary, were
397 unripe (gonad stage 1) and did not contain eggs.
398 Concentration of eggs and nauplii in the ambient
399 water considerably increased, peaking at the northern-
400 most Stn. 5 (ice station) and gradually decreasing
401 southward (Fig. 5, median and lower panels).
402 Although the reproduction of the two Calanus species
403 continued in July, the concentration of eggs and
404 nauplii dropped down at almost all of the 24-h
405 stations, except Stn. 2, where they exceeded the
406 May values. However, the number of eggs per female
407 consistently increased from March to July (Fig. 6,
408 lower panel). Anyway, the peak of reproduction was
409 observed in May, as the number of reproducing adult
410 females was then the highest (Fig. 5, lower panel).
411 In our field data, abundance of Calanus ova and
412 nauplii closely followed the same seasonal trend as the
413 concentration of FP, which was regarded as an index of
414 feeding activity (Fig. 5, upper panel). In an attempt to
415 understand how reproductive and feeding activities in
416 Calanus were connected, we plotted ova versus faecal
417 pellet concentration. Correlation between suspended
418 Calanus ova and FP from different cruises is signifi-
419 cant (Fig. 8, upper panel; Table 2).
420
421 3.4. Production of eggs and faecal pellets in experi-
422 ments
423 In experiments, C. finmarchicus females produced,
424 on average, from 28 to 53 eggs day � 1, and C.
425 glacialis—from 16 to 66 eggs day � 1 in different
426 experiments (Table 4). This difference was significant
427 (Kruskal–Wallis test, H = 5.229, p = 0.022). Maxi-
428 mum number of eggs was produced by C. finmarch-
429 icus at Stn. 3 (150 eggs fem� 1 day � 1 at day 3) and
430 by C. glacialis at Stn. 5 (130 eggs fem � 1 day � 1 at
431 day 3). C. hyperboreus never produced eggs during
432 the experiments in May, all females possessed unde-
433 veloped gonads. Mean production of faecal pellets by
434 C. finmarchicus varied from 25 to 51 FP ind � 1, C.
435 glacialis 15 to 40, C. hyperboreus 14 to 48 (FP
436 production of C. finmarchicus and C. glacialis dif-
437 fered significantly: Kruskal–Wallis test, H = 7.85,
438 p = 0.005; FP production of C. glacialis and C. hyper-
439boreus did not: H = 2.27, p = 0.322). A slight signifi-
440cant positive connection was found between mean
441daily production of eggs and egested faecal pellets of
442C. finmarchicus (Spearman rank order correlation:
443RS = 0.44, p = 0.013) and slight insignificant C. gla-
444cialis (Spearman rank order correlation: RS = 0.18,
445p = 0.344) (Fig. 8, median panel).
446In the experiments, when produced eggs were
447counted every second hour, we noted that during
448egg release, females usually stopped feeding and
449egesting pellets. A slight, but significant negative
450correlation was found between egg and faecal pellet
451production on the short-term (hourly) basis (Fig. 8,
452lower panel). Thus, the correlations between Calanus
453egg production and feeding activity changed depend-
454ing on the scale of analysis from positive significant
455(monthly scale) through positive significant with a
456lower coefficient of correlation (C. finmarchicus), or,
457positive insignificant (C. glacialis) (daily scale) to
458negative significant (hourly scale) (Fig. 8).
4594. Discussion
460Low abundance of Calanus spp. faecal pellets in
461March reflects the fact that most of these copepods
462still inhabited the overwintering depth layers (Ara-
463shkevich et al., this issue). Moreover, feeding activity
464of those ascended to the upper layer in spite of a high
t4.1Table 4
Calanus spp. egg and faecal pellet daily production in experiments.
MeansF standard errors (S.E.) and number of replicates are given t4.2
Station Species N, Eggs Faecal pellets t4.3replicate
Mean S.E. Mean S.E. t4.4
1 C. finmarchicus 9 35.7 3.35 24.8 3.37 t4.5C. glacialis 2 16.5 21.90 13 14.10 t4.6
2 C. finmarchicus 7 28.3 4.09 31.8 3.84 t4.7C. glacialis 3 49.2 11.89 15.5 3.41 t4.8
3 C. finmarchicus 10 53.0 7.72 42.4 5.29 t4.9C. glacialis 12 52.5 9.40 24.4 5.79 t4.10C. hyperboreus 5 0 0 38 7.54 t4.11
4 C. finmarchicus 10 32.0 8.57 34.2 4.93 t4.12C. glacialis 3 53.7 6.73 23.2 8.69 t4.13C. hyperboreus 7 0 0 14 5.36 t4.14
5 C. finmarchicus 14 43.9 4.24 51 3.03 t4.15C. glacialis 8 66.6 10.14 39.6 4.56 t4.16C. hyperboreus 6 0 0 48.5 8.15 t4.17
A. Pasternak et al. / Journal of Marine Systems 881 (2002) xxx–xxx12

UNCORRECTED PROOF
ARTICLE IN PRESS
465 PNM carbon (from 51 to 388 mg m � 3 versus 101–
466 301 in May and 125–216 in July, Ratkova and
467 Wassmann, this issue) was not high. It seems Cala-
468 nus’ populations were yet in the state of transition
469 from winter to spring. Another aspect is that the high
470 concentration of PNMC was formed mainly by chrys-
471 ophytes, P. pouchetii, flagellates, and picophytoplank-
472 ton, which do not belong to the group of ‘‘preferred’’
473 food items.
474 At the majority of the 24-h stations, the concen-
475 tration of Calanus spp. faecal pellets was the high-
476 est in May. This reflects the abundance of Calanus
477 populations and their feeding activity. After an
478 increase of the abundance in the upper layer in
479 May, Calanus spp. population remained rather sim-
480 ilar in numbers with the exceptions of Stn. 1 in
481 May and Stn. 2 in July (Fig. 4; Arashkevich et al.,
482 this issue), where Calanus was about three times
483 more abundant. However, if the difference in Cal-
484 anus abundance between stations in July was
485 reflected in the FP data (both Calanus and their
486 faecal pellets were extremely abundant at Stn. 2), it
487 was not in the May data (Figs. 4 and 5, upper
488 panel). Neither the abundance of Calanus (Fig. 4),
489 nor the concentration of the preferred food, which
490 was high (Fig. 2), can explain the low FP concen-
491 tration at Stn. 1 in May. Consequently, the specific
492 value (faecal pellet carbon per older copepodite)
493 was extremely low at Stn. 1 in May (Fig. 6, upper
494 panel). Perhaps, this could be connected with the
495 high proportion of P. pouchetii, as at both stations
496 (Stn. 2 with high and Stn. 1 with low ‘‘preferred’’
497 phytoplankton carbon), where faecal pellet concen-
498 tration was low, Phaeocystis impact on the total
499 phytoplankton carbon exceeded that of the preferred
500 phytoplankton by a factor of 5 and 7. P. pouchetii
501 produced plenty of mucous matter, which could
502 cause a decrease in feeding activity. The results of
503 the recent paper by Frangoulis et al. (2001) sup-
504 ported the idea of lower feeding of copepods under
505 Phaeocystis sp. bloom conditions. Faecal pellet
506 distribution in July coincided with the ‘‘preferred’’
507 food concentration.
508 Among the variables which influence feeding and
509 assimilation/pellet production in copepods, food qual-
510 ity is certainly the most difficult to describe. In the
511 recent review on the biology of calanoid copepods,
512 Mauchline (1998) wrote: ‘‘The percentage weight of
513ingested food that is assimilated varies greatly. Assim-
514ilation efficiencies vary (primarily) with the ash con-
515tent of the food. . .Assimilation efficiency of 60 to
51670% is usually assumed for herbivorous species’’. In
517the classic paper by Marshall and Orr (1955), assim-
518ilation of the four diatom species by C. finmarchicus
519was tested, the average being always over 50%. Mean
520assimilation varied from 47% to 98% between five
521tested dinoflagellates species. Thus, assimilation effi-
522ciency varied approximately by a factor of 2 between
523different species within diatoms and dinoflagellates
524similarly. Flagellates were utilized usually at a lower
525rate. Mayzaud et al. (1998) indicated that ‘‘Assimila-
526tion is. . .a function of nutrient content in food, gut
527fullness, digestibility, availability of organic com-
528pounds, digestive enzyme activity and assimilation
529capability of the copepod’’. Recently, the relationship
530between the rates of ingestion and defecation and
531assimilation efficiency of the omnivorous copepod
532Aractia tonsa was examined experimentally with
533different diets (Besiktepe and Dam, 2002). However,
534the experiments carried out on the herbivorous species
535C. glacialis, which was also studied in the present
536paper, showed that the number of faecal pellets
537produced daily by copepods fed with different species
538of diatoms, dinoflagellates, and detritus at superabun-
539dant concentrations, was almost equal (90F 11 pellets
540ind � 1 day� 1) (Arashkevich and Sergeeva, 1991).
541This allowed the authors to suggest that changes in
542assimilation efficiency could influence primarily not
543the number of egested pellets, but density of packing
544of evacuated matter. An assessment of seasonal
545changes in assimilation efficiency (or, pellet produc-
546tion per unit of ingested food) connected with the
547change of the diet because of a different phytoplank-
548ton composition is a goal for a special and serious
549research.
550Diets of calanoid copepods feeding in the sea were
551not unialgal; they included different groups and spe-
552cies (our unpublished data on gut content analysis). In
553the sea, diatoms made up from 3.5% to 24.5% of the
554total phytoplankton at different stations in May and
555from 0.5% to 19.8% in July. So, on the one hand,
556assimilation efficiency, which determines the relation-
557ship between feeding activity and pellet production, is
558highly variable, and we have no ground to apply
559different values during the season. On the other hand,
560although mean proportion of diatoms decreased in
A. Pasternak et al. / Journal of Marine Systems 881 (2002) xxx–xxx 13

UNCORRECTED PROOF
ARTICLE IN PRESS
561 July compared with May, this decrease was not a
562 dramatic one, and could not play a considerable role
563 in the approach used here.
564 While no correlation was found between faecal
565 pellet and total phytoplankton carbon, a weak but
566 significant correlation with ‘‘preferred’’ phytoplankton
567 was (Table 2). As the proportion of Protozoa in micro-
568 plankton biomass was not high (Ratkova and Wass-
569 mann, this issue), addition of this group to the
570 preferred food only slightly changed the correlation
571 making it more close (Table 2). However, the correla-
572 tions between the individual specific values (faecal
573 pellet carbon per older copepodite) and the food
574 resources were not significant (Table 3). Perhaps, the
575 main reason for this discrepancy was that in spite of the
576 highest food concentration at Stns. 1 and 2 in July,
577 many of the C. finmarchicus older copepodites were
578 not feeding in July. At that time, they stopped feeding
579 and commenced the descent to the overwintering
580 depths (Arashkevich et al., this issue). As we have
581 no data on the proportion of feeding copepods in July,
582 we had to use the total concentration of older Calanus
583 copepodites, which could cause an underestimation.
584 Another factor could be further reduction of the
585 number of not numerous cases for statistical analyses
586 (there are no data on zooplankton at Stn. 2 in May).
587 The proportion of eggs per Calanus female, on the
588 other hand, is closely correlated with the potential
589 food (Table 3). Under other circumstances (females
590 feeding during the spring phytoplankton bloom), egg
591 production in C. finmarchicus in the Norwegian Sea
592 was clearly related not only to the phytoplankton
593 ingestion but also to the total phytoplankton concen-
594 tration (>5 Am) (Irigoien et al., 1998).
595 The observed decrease in the total number of
596 suspended eggs in July was clearly connected with a
597 pronounced decrease in abundance of females (Fig. 4,
598 lower panel). The number of eggs per female was even
599 higher than in May (Fig. 6, lower panel). A reduced
600 hatching time due to increased temperature could be
601 suggested in July. However, water temperature was
602 almost the same in the Arctic water during all three
603 cruises (around 1 jC), and changed only in the Atlantic604 water: from 2–3 jC to 3 jC and 4–5 jC in March,
605 May and July, accordingly, in the upper 100 m layer
606 (Reigstad et al., this issue). This difference is too small
607 to influence noticeably the sort of estimation we
608 carried out in this study, taking into account the
609dependence of hatching time on temperature (Corkett
610et al., 1986; McLaren et al., 1988), as well as the fact
611that only one of the 24-h stations was performed in the
612Atlantic water in July, when the temperature increase
613occurred.
614The ingestion and reproduction of copepods are
615basically closely coupled. Gonad formation and matu-
616ration were shown to be fuelled by internal energy
617reserves (previous feeding success), but major egg-
618laying activities were suggested to rely on external
619sources (e.g., Tande, 1982; Plourde and Runge, 1993;
620Hagen and Schnack-Schiel, 1996; Hirche, 1996b).
621Thus, egg production should be the result of inter-
622actions of the two factors: (a) previous lipid storage
623and (b) presently available food, or actual ingestion,
624which explains the relation between ingestion and egg
625production rate frequently observed (Marshall and
626Orr, 1952; Runge, 1985; Hirche, 1990, 1996b; Hirche
627et al., 1991, 1997; Niehoff et al., 1999). In the present
628study, abundance of Calanus ova and nauplii were
629closely and significantly correlated with the concen-
630tration of their faecal pellets, that is, their feeding
631activity (Fig. 5, Table 2). The individual specific value
632(concentration of Calanus eggs to adult females) is
633even more closely correlated with the potential food
634(Table 3). This points to the important role of the
635actual ingestion versus stored lipid reserves in supply-
636ing reproduction with energy in the studied area of the
637Barents Sea.
638C. glacialis and C. finmarchicus were actively
639reproducing during the phytoplankton bloom in May.
640April–May was reported to be the spawning period of
641C. finmarchicus in the Barents Sea (review in Hirche,
6421996b). Both C. glacialis and C. finmarchicus were
643indicated to start spawning in mid-April at the polar
644front of the Barents Sea (Tande, 1991). Other authors
645(Hansen et al., 1996) found that egg production of C.
646glacialis was practically ended for a year from the data
647of the cruise conducted to the same region in May
6481993. The coupling of Calanus reproduction with
649phytoplankton bloom was monitored in various
650regions (Marshall and Orr, 1955; Diel and Tande,
6511992; Gaard, 1996; Gislason and Astthorsson, 1996;
652Niehoff et al., 1999; Niehoff and Hirche, 2000). Mean
653and maximum individual daily egg production rates
654obtained in our experiments are close to the highest
655rates usually reported (Marshall and Orr, 1952; Hirche,
6561989; Diel and Tande, 1992; Kosobokova, 1993;
A. Pasternak et al. / Journal of Marine Systems 881 (2002) xxx–xxx14

UNCORRECTED PROOF
ARTICLE IN PRESS
657 Plourde and Runge, 1993; Hansen et al., 1996; Hirche
658 et al., 1997; Niehoff et al., 1999). C. hyperboreus did
659 not produce eggs; all females possessed undeveloped
660 gonads. This is no surprise, as this species is known to
661 reproduce earlier, well in advance of the spring bloom
662 (Sømme, 1934; Østvedt, 1955; Conover, 1967; Smith,
663 1990; Hirche and Niehoff, 1996).
664 The general relationship between mean daily pro-
665 duction of eggs and ingestion could be masked by
666 various influences. The often observed lack of corre-
667 lation between mean daily production of eggs and
668 egested faecal pellets could be explained by a delay
669 response in egg production to feeding conditions
670 which indicates the existence of a buffer of nutrients
671 (Hirche, 1990; Hirche et al., 1997). Patchiness in
672 distribution of both food and copepods as well as a
673 feeding history of reproducing females could also
674 influence the relationship between individual egg and
675 faecal pellet production rate. The results of mesocosm
676 experiments showed that the effect of feeding history
677 on ingestion rate could last up to 15 days (Rey et al.,
678 1999). In these experiments, females of C. finmarch-
679 icus produced the same number of eggs after being
680 transferred from different feeding conditions to super-
681 abundant food. However, females transferred from the
682 low-food conditions produced significantly more fae-
683 cal pellets. The authors concluded that both age and
684 feeding history might be as important as other environ-
685 mental factors such as temperature or food supply in
686 explaining the variability in fecundity and egestion
687 (Rey et al., 1999). In our experiments, a significant
688 correlation was found for C. finmarchicus, and insig-
689 nificant for C. glacialis. This may be caused by several
690 reasons: fewer females of the latter species were
691 analyzed (28 versus 50 of C. finmarchicus); the buffer
692 of nutrients could be of more importance in C. glacia-
693 lis, than in C. finmarchicus. One more possibility is
694 that the egg production season of C. glacialis was, as it
695 was mentioned above, close to the end (Hansen et al.,
696 1996), and the population might contain a high pro-
697 portion of ageing females which decrease the egg
698 production rate (Diel and Tande, 1992; Plourde and
699 Runge, 1993; Hirche 1996b).
700 A slight but significant negative correlation found
701 between egg and faecal pellet production on the short-
702 term (hourly) basis confirms that during spawning
703 events, female feeding ceased. Perhaps, the coefficient
704 of correlation would be higher if eggs and pellet
705production could be estimated more often (e.g., in
706half-an-hour intervals). Anyway, the correlations
707between Calanus egg production and feeding activity
708changed depending on the scale of analysis from
709positive significant (monthly scale) through positive
710significant with lower coefficient of correlation (C.
711finmarchicus), or positive insignificant (C. glacialis)
712(daily scale) to negative significant (hourly scale).
713Thus, relationship between reproduction and feeding
714of Calanus spp. could be different depending on a
715temporal scale.
716Egg production rate of Calanus spp. depends on
717the season (Hirche et al., 1997), phase of spawning
718activity (Diel and Tande, 1992; Hirche, 1996b; Rey et
719al., 1999), temperature (Runge, 1984, 1985; Hirche,
7201996b; Hirche et al., 1997), food quality (Marshall
721and Orr, 1952; Kleppel, 1993). Anyway, a consider-
722able part of variability (68%) in our study was con-
723nected with feeding activity.
7245. Conclusion
725The results of this study confirmed the importance
726of Calanus spp. as major contributors to the sus-
727pended matter and vertical flux in the marginal ice
728zone and the open Barents Sea in March–July. Pro-
729portion of Calanus spp. faecal pellets in suspended
730matter and in the total flux in the upper 100 m layer
731was high and rather stable throughout the study
732period. Feeding of calanoid copepods was correlated
733with the seasonal changes in their preferred food.
734Basically dependent on feeding success, egg produc-
735tion could be differently correlated with feeding
736activity depending on the temporal scales of the study
737(monthly, daily, hourly). Significant correlations
738between indices of current feeding activity (or, avail-
739able food) and egg production and nauplii concen-
740tration obtained in the field suggest that current
741feeding played a major role in supplying of reproduc-
742tion with energy, compared to the lipid reserves.
743Acknowledgements
744The authors are grateful to the crew of the R/V
745‘‘Jan Mayen’’ for their valuable assistance. This
746research was supported by the Norwegian Research
A. Pasternak et al. / Journal of Marine Systems 881 (2002) xxx–xxx 15

UNCORRECTED PROOF
ARTICLE IN PRESS
747 Council through the ALV programme (project number
748 121521/720 to P. Wassmann) and by the Russian
749 Foundation for Basic Research (project number 01-
750 04-48701 to A. Pasternak). We thank two anonymous
751 referees for their constructive comments.
752 References
753 Arashkevich, E., Sergeeva, O., 1991. Ingestion rate of Calanus
754 glacialis (the White Sea) on different species of phytoplankton,
755 number of egested faecal pellets and their sedimentation rate
756 (Skorost’ potrebleniya razlichnykh vidov fitoplanktona, koli-
757 chestvo vydelyaemykh fekal’nykh pellet i skorost’ ikh oseda-
758 niya u belomorskogo Calanus glacialis). In: Agarova, A.I.,
759 Gupalo, E.A. (Eds.), Phytoplankton Studies in the Monitoring
760 of the Seas, With Reference to the Baltic Sea. Hydrometeoizdat,
761 Moscow, pp. 285–293 (in Russian, with English Abstr.).
762 Arashkevich, E., Pasternak, A., Wexels Riser, C., Wassmann, P., this
763 issue. Seasonal variation in zooplankton abundance in the mar-
764 ginal ice zone and the central Barents Sea. J. Mar. Sys.
765 Astthorsson, O.S., Gislason, A., 1997. On the food of capelin in the
766 subarctic waters north of Iceland. Sarsia 82, 81–86.
767 Ayukai, T., Nishizawa, S., 1986. Defecation rate as a possible meas-
768 ure of ingestion rate of Calanus pacificus (Copeoda: Calanoida).
769 Bull. Plankton Soc. Jpn. 33, 3–10.
770 Bamstedt, U., Nejstgaard, J.C., Solberg, P.T., 1999. Utilisation of
771 small-sized food algae byCalanus finmarchicus (Copepoda: Cal-
772 anoida) and the significance of feeding history. Sarsia 84, 19–38.
773 Batchelder, H.P., Van Keuren, J.R., Vaillancourt, R., Swift, E., 1995.
774 Spatial and temporal distributions of acoustically estimated
775 zooplankton biomass near the Marine Light—Mixed Layers sta-
776 tion (59j50VN, 21j00VW) in the north Atlantic in May 1991.
777 J. Geophys. Res. 100, 6549–6563.
778 Bautista, B., Harris, R.P., Tranter, P., Harbour, D., 1992. In situ
779 copepod feeding and grazing rates during a spring bloom domi-
780 nated by Phaeocystis sp. in the English Channel. J. Plankton
781 Res. 14, 691–703.
782 Besiktepe, S., Dam, H.G., 2002. Coupling of ingestion and defeca-
783 tion as a function of diet in the calanoid copepod Acartia tonsa.
784 Mar. Ecol. Prog. Ser. 229, 151–164.
785 Conover, R.J., 1967. Reproductive cycle, early development, and
786 fecundity in laboratory populations of the copepod Calanus
787 hyperboreus. Crustaceana 13, 61–72.
788 Corkett, C.J., McLaren, I.A., Sevigny, J.-M., 1986. The rearing
789 of the marine calanoid copepods Calanus finmarchicus
790 (Gunnerus), C. glacialis Jashnov and C. hyperboreus Kroyer
791 with comment on the equiproportional rule. Syllogeus 58,
792 539–546.
793 Cushing, D.H., 1984. The gadoid outburst in the North Sea. J. Cons.
794 Int. Explor. Mer 41, 159–166.
795 Diel, S., Tande, K.S., 1992. Does the spawning of Calanus fin-
796 marchicus in high latitudes follow a predictable pattern? Mar.
797 Biol. 113, 21–31.
798 Drits, A.V., 1985. The dependence of Calanus australis ingestion
799rate on food concentration in natural habitat. Okeanologiya 25,
800150–154.
801Estep, K.W., Nejstgaard, J.C., Skjoldal, H.R., Rey, F., 1990. Pre-
802dation by copepods upon natural populations of Phaeocystis
803pouchetii as a function of the physiological state of the prey.
804Mar. Ecol. Prog. Ser. 67, 235–249.
805Frangoulis, C., Belkhiria, S., Goffart, A., Hecq, J.-H., 2001. Dy-
806namics of copepod faecal pellets in relation to a Phaeocystis
807dominated phytoplankton bloom: characteristics, production
808and flux. J. Plankton Res. 23, 75–88.
809Gaard, E., 1996. Life cycle, abundance and transport of Calanus
810finmarchicus in Faroese waters. Ophelia 44, 59–70.
811Gislason, A., Astthorsson, O., 1996. Seasonal development of Cal-
812anus finmarchicus along an inshore–offshore gradient south-
813west of Iceland. Ophelia 44, 71–84.
814Gonzalez, H.E., Gonzalez, S.R., Brummer, J.-G., 1994. Short term
815sedimentation pattern of zooplankton, faeces and microplankton
816ar a station in the Bjørnafjorden (Norway) during April –May
8171992. Mar. Ecol. Prog. Ser. 105, 31–45.
818Hagen, W., Schnack-Schiel, S.B., 1996. Seasonal lipid dynamics in
819dominant Antarctic copepods: energy for overwintering or re-
820production? Deep-Sea Res. 43, 139–158.
821Hansen, B., Christiansen, S., Pedersen, G., 1996. Plankton dynam-
822ics in the marginal ice zone of the central Barents Sea during
823spring: carbon flow and structure of the grazer food chain. Polar
824Biol. 16, 115–128.
825Hirche, H.-J., 1989. Egg production of the Arctic copepod Calanus
826glacialis—laboratory experiments. Mar. Biol. 103, 311–318.
827Hirche, H.-J., 1990. Egg production of Calanus finmarchicus at low
828temperature. Mar. Biol. 106, 53–58.
829Hirche, H.-J., 1996a. Diapause in the marine copepod, Calanus
830finmarchicus—a review. Ophelia 44, 71–84.
831Hirche, H.-J., 1996b. The reproductive biology of the marine cope-
832pod, Calanus finmarchicus—a review. Ophelia 44, 111–128.
833Hirche, H.-J., Niehoff, B., 1996. Reproduction of the Arctic cope-
834pod Calanus hyperboreus in the Greenland Sea-field and labo-
835ratory observations. Polar Biol. 16, 209–219.
836Hirche, H.-J., Baumann, M.E.M., Kattner, G., Gradinger, R., 1991.
837Plankton distribution and the impact of copepod grazing on pri-
838mary production in Fram Strait, Greenland Sea. J. Mar. Sys. 2,
839477–494.
840Hirche, H.-J., Meyer, U., Niehoff, B., 1997. Egg production of
841Calanus finmarchicus: effect of temperature, food and season.
842Mar. Biol. 127, 609–620.
843Huntley, M., Tande, K., Eilertsen, H.C., 1987. On the trophic fate of
844Phaeocystis pouchetii: II. Grazing rates of Calanus hyperboreus
845on diatoms and different size categories of P. pouchetii. J. Exp.
846Mar. Biol. Ecol. 110, 197–212.
847Irigoien, X., Head, R., Klenke, U., Meyer-Harms, B., Harbour, D.,
848Niehoff, B., Hirche, H.-J., Harris, R., 1998. A high frequency
849time series at weathership M, Norwegian Sea, during the 1997
850spring bloom: feeding of adult female Calanus finmarchicus.
851Mar. Ecol. Prog. Ser. 172, 127–137.
852Irigoien, X., Head, R.N., Harris, R.P., Cummings, D., Harbour, D.,
853Meyer-Harms, B., 2000. Feeding selectivity and egg production
854of Calanus helgolandicus in the English Channel. Limnol. Oce-
855anogr. 45, 44–54.
A. Pasternak et al. / Journal of Marine Systems 881 (2002) xxx–xxx16

UNCORRECTED PROOF
ARTICLE IN PRESS
856 Kaartvedt, S., 1996. Habitat preference during overwintering and
857 timing of seasonal vertical migration of Calanus finmarchicus.
858 Ophelia 44, 145–156.
859 Kane, J., 1984. The feeding habits of co-occurring cod and haddock
860 larvae from Georges Bank. Mar. Ecol. Prog. Ser. 16, 9–20.
861 Kleppel, G.S., 1993. On the diets of calanoid copepods. Mar. Ecol.
862 Prog. Ser. 99, 183–195.
863 Kleppel, G.S., Holliday, D.V., Pieper, R.E., 1991. Trophic interac-
864 tions between copepods and microplankton: a question about the
865 role of diatoms. Limnol. Oceanogr. 36, 172–178.
866 Kleppel, G.S., Burkart, C.A., Houchin, L., 1998. Nutrition and the
867 regulation of egg production in the calanoid copepod Acartia
868 tonsa. Limnol. Oceanogr. 43, 1000–1007.
869 Kosobokova, K.N., 1993. Reproduction and fecundity of the White
870 Sea copepod Calanus glacialis in experimental conditions.
871 Okeanologiya 33, 392–396.
872 Marshall, S.M., Orr, A.P., 1952. On the biology of Calanus fin-
873 marchicus: VII. Factors affecting egg production. J. Mar. Biol.
874 Assoc. U. K. 30, 527–547.
875 Marshall, S.M., Orr, A.P., 1955. The Biology of a Marine Copepod
876 Calanus finmarchicus (Gunnerus). Oliver and Boyd, Edinburgh.
877 Mauchline, J., 1998. The biology of calanoid copepods. Adv. Mar.
878 Biol. 33.
879 Mayzaud, P., Tirelli, V., Bernard, J.M., Roche-Mayzaud, O., 1998.
880 The influence of food quality on the nutritional acclimation of
881 the copepod Acartia clausi. J. Mar. Sys. 15, 483–494.
882 McLaren, I.A., Sevigny, J.-M., Corkett, C.J., 1988. Body sizes,
883 development rates, and genome sizes among Calanus species.
884 Hydrobiologia 167/168, 275–284.
885 Meyer-Harms, B., Irigoien, X., Head, R., Harris, R., 1999. Selective
886 feeding on natural phytoplankton by Calanus finmarchicus be-
887 fore, during, and after the 1997 spring bloom in the Norwegian
888 Sea. Limnol. Oceanogr. 44, 154–165.
889 Niehoff, B., Hirche, H.-J., 2000. The reproduction of Calanus fin-
890 marchicus in the Norwegian Sea in spring. Sarsia 85, 15–22.
891 Niehoff, B., Klenke, U., Hirche, H.-J., Irigoinen, X., Head, R.,
892 Harris, R., 1999. A high frequency time series at Weathership
893 M, Norwegian Sea, during the 1997 spring bloom: the repro-
894 ductive biology of Calanus finmarchicus. Mar. Ecol. Prog. Ser.
895 176, 81–92.
896 Ohman, M.D., Runge, J.A., 1994. Sustained fecundity when phy-
897 toplankton resources are in short supply: omnivory by Calanus
898 finmarchicus in the Gulf of St. Lawrence. Limnol. Oceanogr. 39,
899 21–36.
900 Østvedt, O.J., 1955. Zooplankton investigations from weathership
901 M in the Norwegian Sea 1948–1949. Hvalradets Skr. 40, 1–93.
902 Pasternak, A., Arashkevich, E., Wexels Riser, C., Ratkova, T.,
903 Wassmann, P., 2000. Seasonal variation in zooplankton and
904 suspended faecal pellets in the subarctic Norwegian Balsfjorden,
905 in 1996. Sarsia 85, 439–452.
906 Pasternak, A., Arashkevich, E., Tande, K., Falkenhaug, T., 2001.
907 Seasonal changes in feeding, gonad development and lipid
908 stores in Calanus finmarchicus and C. hyperboreus from Ma-
909 langen, northern Norway. Mar. Biol. 138, 1141–1152.
910Plourde, S., Runge, J.A., 1993. Reproduction of the planktonic
911copepod Calanus finmarchicus in the lower St. Lawrence Estu-
912ary—relation to the cycle of phytoplankton production and evi-
913dence for a Calanus pump. Mar. Ecol. Prog. Ser. 102, 217–227.
914Ratkova, T., Wassmann, P., this issue. Seasonal variation in phyto-
915plankton species and abundance in the marginal ice zone and the
916central Barents Sea. J. Mar. Sys.
917Rey, C., Carlotti, F., Tande, K., Hygum, B.H., 1999. Egg and faecal
918pellet production of Calanus finmarchicus females from con-
919trolled mesocosms and in situ populations: influence of age
920and feeding history. Mar. Ecol. Prog. Ser. 188, 133–148.
921Runge, J.A., 1984. Egg production of the marine, planktonic cope-
922pod, Calanus pacificus Brodsky: laboratory observations. J.
923Exp. Mar. Biol. Ecol. 74, 53–66.
924Runge, J.A., 1985. Egg production rates of Calanus finmarchicus in
925the sea of Nova Scotia. Arch. Hydrobiol. (Beih. Ergebn. Lim-
926nol.) 21, 33–40.
927Runge, J.A., Plourde, S., 1996. Fecundity characteristics of Calanus
928finmarchicus in coastal waters of eastern Canada. Ophelia 44,
929171–187.
930Sargent, J.R., Falk-Petersen, S., 1988. The lipid biochemistry of
931calanoid copepods. Hydrobiologia 167/168, 101–114.
932Skjoldal, H.R., Rey, F., 1989. Pelagic production and variability of
933the Barents Sea ecosystem. In: Sherman, K., Alexander, L.A.
934(Eds.), Biomass Yields and Geography of Large Marine Eco-
935systems. Westview Press, Boulder, pp. 243–283.
936Smetacek, V.C., 1984. The supply of food to the benthos. In: Fa-
937sham, M.J.R. (Ed.), Flow of Energy and Materials in Marine
938Ecosystems. Plenum, New York, pp. 517–548.
939Smith, S.L., 1990. Egg production and feeding by copepods prior to
940the spring bloom of phytoplankton in the Fran Strait area of the
941Greenland Sea. Mar. Biol. 106, 59–69.
942Sømme, J.D., 1934. Animal plankton of the Norwegian coast waters
943and the open sea: I. Production of Calanus finmarchicus (Gun-
944nerus) and C. hyperboreus (Krøyer) in the Lofoten area. Fisker-
945idir. Skr., Havunders. 4, 1–163.
946Tande, K.S., 1982. Ecological investigation on the zooplankton
947community of Balsfjorden, northern Norway: general life
948cycles, and variations in body weight and body content of car-
949bon and nitrogen related to overwintering and reproduction in
950the copepod Calanus finmarchicus (Gunnerus). J. Exp. Mar.
951Biol. Ecol. 62, 129–142.
952Tande, K.S., 1991. Calanus in North Norwegian fjords and in the
953Barents Sea. Polar Res. 10, 389–407.
954Tande, K.S., Bamstedt, U., 1987. On the trophic fate of Phaeocystis
955pouchetii: 1. Copepod feeding rates on solitary cells and colo-
956nies of P. pouchetii. Sarsia 72, 313–320.
957Tsuda, A., Nemoto, T., 1990. The effect of food concentration on
958the faecal pellet size of the marine copepod Pseudocalanus new-
959mani Frost. Bull. Plankton Soc. Jpn. 37, 83–90.
960Wassmann, P., 1989. Sedimentation of organic matter and silicate
961from the euphotic zone of the Barents Sea. Rapp. P.-V. Reun. -
962Cons. Int. Explor. Mer 188, 108–114.
963
A. Pasternak et al. / Journal of Marine Systems 881 (2002) xxx–xxx 17