Embed Size (px)
Citation preview
Int. J. Mol. Sci. 2014, 15, 3842-3859; doi:10.3390/ijms15033842
International Journal of
Molecular Sciences ISSN 1422-0067
www.mdpi.com/journal/ijms
Review
Calcium Imaging Perspectives in Plants
Chidananda Nagamangala Kanchiswamy 1,*, Mickael Malnoy 1, Andrea Occhipinti 2 and
Massimo E. Maffei 2
1 Research and Innovation Centre Genomics and Biology of Fruit Crop Department,
Fondazione Edmund Mach (FEM), Istituto Agrario San Michele (IASMA), Via Mach 1,
38010 San Michele all’Adige (TN), Italy; E-Mail: [email protected] 2 Department of Life Sciences and Systems Biology, Innovation Centre, University of Turin,
Via Quarello 15/A, 10135 Turin, Italy; E-Mails: [email protected] (A.O.);
[email protected] (M.E.M.)
* Author to whom correspondence should be addressed; E-Mail: [email protected];
Tel.: +39-461-615-133; Fax: +39-461-650-956.
Received: 23 December 2013; in revised form: 18 February 2014 / Accepted: 20 February 2014 /
Published: 4 March 2014
Abstract: The calcium ion (Ca2+) is a versatile intracellular messenger. It provides
dynamic regulation of a vast array of gene transcriptions, protein kinases, transcription
factors and other complex downstream signaling cascades. For the past six decades,
intracellular Ca2+ concentration has been significantly studied and still many studies are
under way. Our understanding of Ca2+ signaling and the corresponding physiological
phenomenon is growing exponentially. Here we focus on the improvements made in the
development of probes used for Ca2+ imaging and expanding the application of Ca2+
imaging in plant science research.
Keywords: calcium; transcription factors; calcium probes; imaging
1. Introduction
Knowledge of Ca2+ signaling and its corresponding physiological phenomenon from prokaryotes to
eukaryotes and from tissues to whole organisms has grown significantly. For the past six decades,
calcium signaling has been a focus of study with a level of investigation higher than that of any other
signaling molecule. In plants, numerous endogenous stimuli and stress signals of both biotic and
OPEN ACCESS

Int. J. Mol. Sci. 2014, 15 3843
abiotic nature lead to transient variation in intracellular Ca2+ concentration, which in turn activate
respective downstream signaling cascades [1–6]. Studying the role of intracellular Ca2+ requires the
ability to monitor the dynamics of its concentration in plant cells with both spatial and temporal
accuracy [7–9].
In plants, the concentration of cytosolic Ca2+ ([Ca2+]cyt) is maintained in the nano molar range
(100–200 nM) while in many organelles it may reach micro molar to mili molar
concentrations [10,11]. Vacuole and apoplast shows mili molar Ca2+ concentration [12]. The use of
new generation cameleon and aequorin (AEQ) has led to the discovery of Ca2+ dynamics at micor
molar level in ER lumen and at nM level in mitochondria and peroxisomes [13–19]. In plant cells,
the spatial and temporal dynamic changes of [Ca2+]cyt induced by various stimuli determine the
final functional outcome [9,20]. Therefore, in plant cells, determining changes of [Ca2+]cyt is largely
dependent on the development of methodologies that can be used to accurately measure
[Ca2+]cyt [21,22].
Here, we describe the development of various Ca2+ probes from the past six decades and the
improvements that have been developed in this field. We also discuss the limitations of each probe and
important points to consider while planning ideal Ca2+ imaging experiments in plant science.
2. Measuring [Ca2+]cyt in Living Plant Cells
Confocal microscopy is an optical sectioning method used to reduce the image blur that is caused
by inclusion of light from outside the plane-of-focus in a cross-section of a thick sample. In confocal
microscopy, the path of out-of-focus light is physically blocked before detection [23]. As a
comparatively non-destructive imaging technique, confocal laser scanning microscopy (CLSM) has a
number of distinct advantages over alternative imaging modalities; primarily CLSM facilitates the in situ
characterization of the 3D architecture of tissue microstructure [24]. Several papers addressed the
benefits that CLSM affords during analysis of the spatial properties of intracellular [Ca2+] signals [20].
However, it is generally difficult to measure [Ca2+] in a non-invasive method and without artifacts. It is
also particularly tricky to measure [Ca2+] in a physiologically relevant context, which allows the
comparison of results obtained in the laboratory with the physiological status of plants in the field.
CLSM makes extensive use of Ca2+ probes. However, not only CLSM can offer the possibility to
couple the use of Ca2+ probes with in vivo microscopy analyses. Wide-field fluorescent microscopy has
been used for both dyes and genetically encoded probes. [Ca2+]cyt was determined using the dye Fura-2
by either fluorescence ratio with a Cairn micro photometer [25] or fluorescence ratio imaging with a
GenIV-intensified Pentamax-512 charge-coupled device camera [26]. By using high-resolution
deconvolution microscopy, Allen and co-workers [27] assessed the cytoplasmic localization and auto
fluorescence at both emission wavelengths of cameleon, YC2.1. Recently, Costa and co-workers used
Selective Plane Illumination Microscopy (SPIM) which is an imaging technique particularly suited for
long term in vivo analysis of transparent specimens, able to visualize small organs or entire organisms,
at cellular and eventually even subcellular resolution. SPIM was successfully used in calcium imaging
based on Förster Resonance Energy Transfer (FRET) in Arabidopsis seedlings expressing the cytosolic
(NES-YC3.6) or nuclear (NLS-YC3.6) localized Cameleon YC3.6 [28].
Int. J. Mol. Sci. 2014, 15 3844
3. Origin and Evolution of Synthetic Ca2+ Indicators
In the early 1960s to 1970s, many synthetic indicators such as murexide, azo dyes, and
chlortetracycline were used as Ca2+ indicators [29]. Among the limitations of these synthetic indicators
are a low sensitivity (azo dyes), the impossibility to be used to measure Ca2+ in living cells (murexide)
and a low accuracy (chlorotetracycline) [30]. The first fluorescent Ca2+ probe ideal for intracellular
Ca2+ measurement was synthesized by Roger Tsien in the late 1980s [29]. Later on, a range of
synthetic dyes was developed with desirable sensitivity, selectivity and responsiveness to measure Ca2+
in living plant cells [8,21]. Moreover, the evolution of AEQ [31,32], green fluorescent protein
(GFP) [33] and FRET [34,35] based Ca2+ fluorescent imaging became more popular because of their
user friendly Ca2+ measurement methods; however, Ca2+ fluorescent dyes have the advantages of being
applicable to plants not suitable for transformation.
4. Measurement of Ca2+ Using Non-Ratiometric Dyes or Single Wavelength Probes
Ca2+ probes (also referred as sensors or reporters) are small molecules that show desirable features
of sensitivity, selectivity and responsiveness to Ca2+. These probes form selective complexes with Ca2+
ions, which enable measurement of the differences in free and bound [Ca2+] using absorbance and
emission light [36–38]. Most of the Ca2+ imaging probes interact with Ca2+ through carboxylic acid
groups. This interaction causes variation in indicator properties such as fluorescent intensity and its
excitation. [Ca2+] is not measured directly; rather the indicator monitors the amount of free and
complexed probe. The concentration of free Ca2+ is then measured based on effective dissociation
constant (Kd) measured in vitro of the probe for Ca2+ in the specific environment.
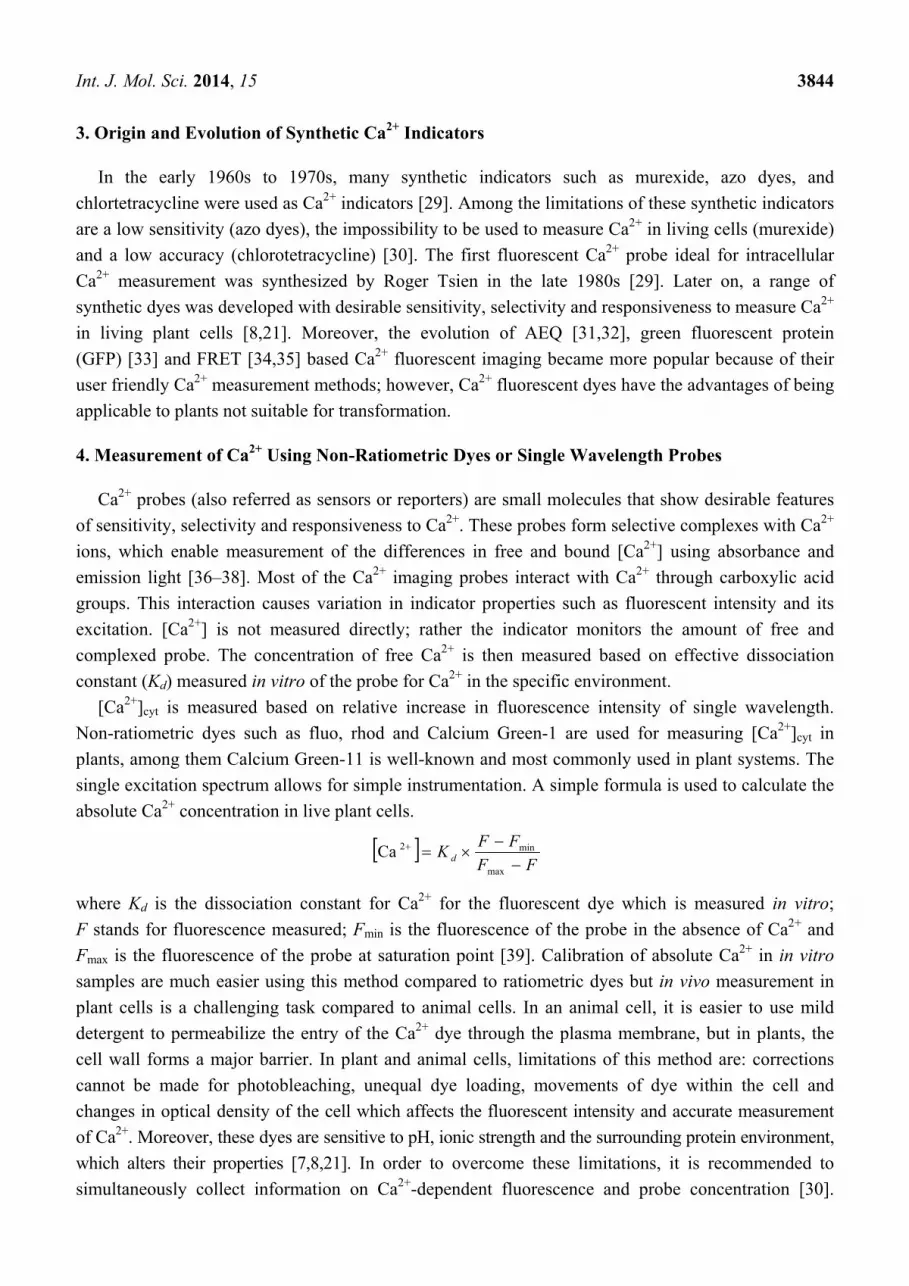
[Ca2+]cyt is measured based on relative increase in fluorescence intensity of single wavelength.
Non-ratiometric dyes such as fluo, rhod and Calcium Green-1 are used for measuring [Ca2+]cyt in
plants, among them Calcium Green-11 is well-known and most commonly used in plant systems. The
single excitation spectrum allows for simple instrumentation. A simple formula is used to calculate the
absolute Ca2+ concentration in live plant cells.
where Kd is the dissociation constant for Ca2+ for the fluorescent dye which is measured in vitro;
F stands for fluorescence measured; Fmin is the fluorescence of the probe in the absence of Ca2+ and
Fmax is the fluorescence of the probe at saturation point [39]. Calibration of absolute Ca2+ in in vitro
samples are much easier using this method compared to ratiometric dyes but in vivo measurement in
plant cells is a challenging task compared to animal cells. In an animal cell, it is easier to use mild
detergent to permeabilize the entry of the Ca2+ dye through the plasma membrane, but in plants, the
cell wall forms a major barrier. In plant and animal cells, limitations of this method are: corrections
cannot be made for photobleaching, unequal dye loading, movements of dye within the cell and
changes in optical density of the cell which affects the fluorescent intensity and accurate measurement
of Ca2+. Moreover, these dyes are sensitive to pH, ionic strength and the surrounding protein environment,
which alters their properties [7,8,21]. In order to overcome these limitations, it is recommended to
simultaneously collect information on Ca2+-dependent fluorescence and probe concentration [30].
FF
FFK d
max
min2Ca

Int. J. Mol. Sci. 2014, 15 3845
Other limitations such as optical artifacts could be overcome by using ratiometric dyes. These dyes
offer robust approaches for in vivo quantitative measurement of Ca2+ based on fluorescence changes.
5. Measurement of Ca2+ Using Ratiometric Dyes
The excitation spectrum of ratiometric dyes Fura-2 and Indo-1, varies according to the free Ca2+
concentration. The Ca2+ concentration is measured as the ratio between two fluorescence intensity
values that are taken at two wavelengths; i.e., increasing wavelength λ1 and decreasing wavelength λ2.
The absolute [Ca2+] can be calculated using the following formula:
where Kd is the dissociation constant, which is measured in vitro; R is the fluorescence ratio at both
wavelengths Fλ2/Fλ1; Rmin is the minimum ratio value (it can be at minimum or maximum calcium
concentration, depending on the wavelength used in the denominator); Rmax is the maximum ratio
value; Fλ1 max/F
λ1 min is a scaling factor, also known as β (Fλ1 is the fluorescence used in the denominator at
its maximum and minimum value).
Ratiometric dyes can be corrected for unequal dye loading, photobleaching and focal plane shift,
between two cells that have the same [Ca2+]cyt. Therefore using ratios avoids many of the problems
related to absolute fluorescence values. On the other hand, acquisition and data manipulation is
more complex due to the use of fluorescence ratios. Not all microscopes are suitable for these
measurements (changing excitation/emission wavelength at suitable rates is required) and many
ratiometric indicators require the use of UV excitation, which is an expensive option for confocal laser
scanning microscopy.
It is important to note that dyes are available at different ranges of Kd values and spectral properties,
that make them suitable for commonly used lasers [40].
6. Techniques of Loading Ca2+-Sensing Dyes into Plant Cells
Most of the Ca2+ interacting dyes used for Ca2+ measurement have highly charged groups, hence
they are relatively membrane impermeable; therefore, loading probes in living plant cells is a
challenging task [21]. Many loading techniques have been successfully adopted to breach the plasma
membrane such as microinjection, electroporation, patch clump pipette and biolistic delivery [41–44].
Acid and ester methods are also adopted to introduce Ca2+ dyes; the acid method is based on pH
changes. Acid loading for a 1–2 h incubation causes a drop in pH to 4.5 and protonates the dye to
breach the plasma membrane in a relatively uncharged form [45,46]. Samples are incubated for 1–2 h
at low pH, which might cause adverse effects on plant cells and tissues. In case of ester loading,
acetoxymethyl esters are generally used for intracellular cellular cleavage by cellular esterases to
deliver the Ca2+ dye into cytosol [30]. Ester loading causes significant hydrolysis in the plant cell wall
but loading and incubation at low temperature may limit this problem [47]. Another major problem
of Ca2+ interacting dyes is their compartmentalization in cellular organelles, mainly in the
vacuole [45,48]. Compartmentalization means that the indicator is trapped within cellular organelles
and not homogenously distributed throughout the plant cell [22].
1
1
min
max
max
min2Ca
F
F
RR
RRKd

Int. J. Mol. Sci. 2014, 15 3846
It is hard to indicate which is the most efficient or the most effective dye. This mainly depends on
the overlapping of emissions with autofluorescence from the tissue or the ability of the dye to penetrate
the plant tissues. For example, in a recent paper, Fluo-3, which was successfully used for the calcium
localization in Lima bean [49], was found to strongly interfere with the cuticular autoflourescence of
Ginkgo biloba leaves. In this case, Calcium Orange was selected because of a different fluorescence
emission [50].
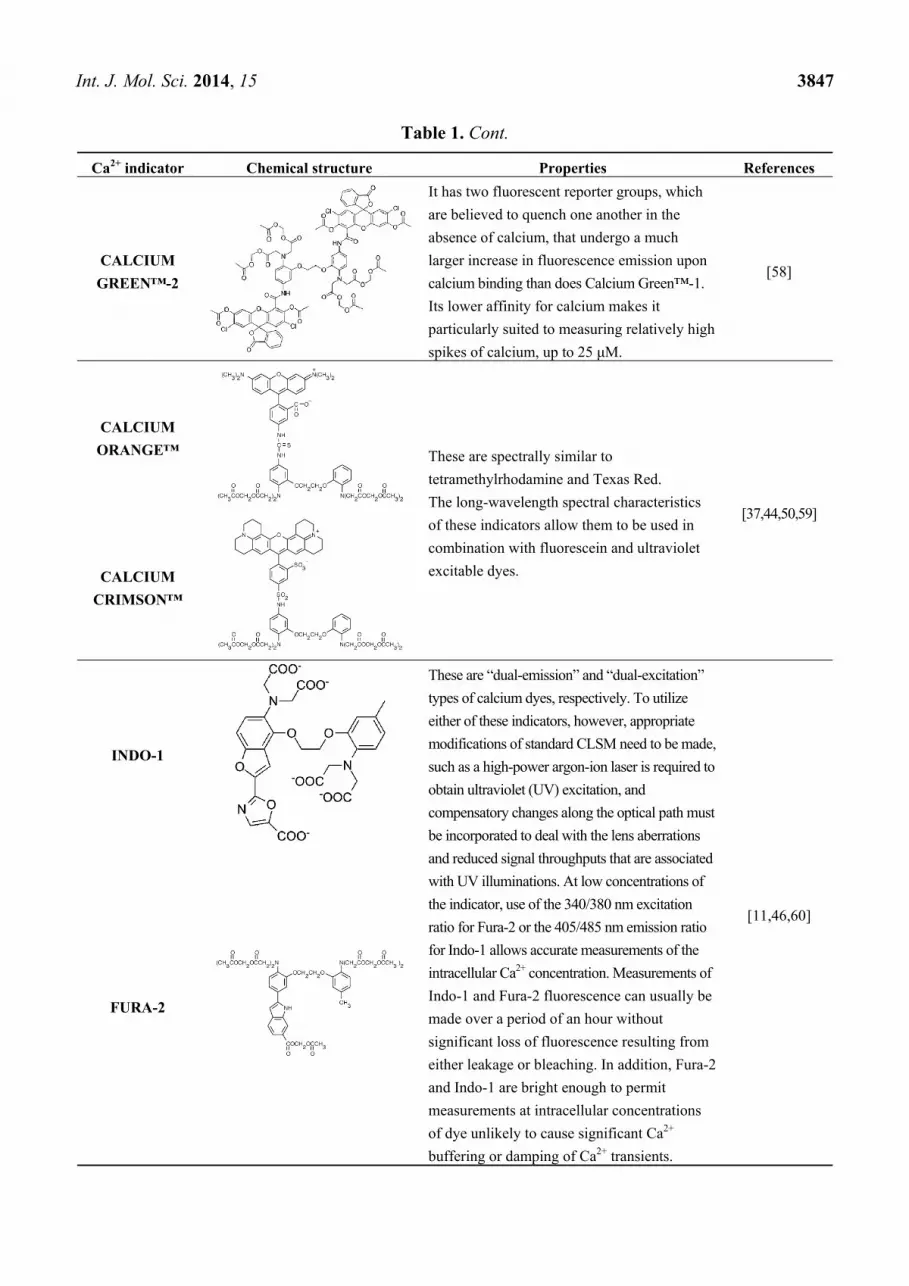
Table 1 lists some of the most used Ca2+ dyes.
Table 1. Main calcium indicators used in plant science.
Ca2+ indicator Chemical structure Properties References
FLUO-3
The most important properties of Fluo-3 are an
absorption spectrum compatible with
excitation at 488 nm by argon-ion laser
sources and a very large fluorescence intensity
increase in response to Ca2+ binding.
[49,51–53]
FLUO-4
Fluo-4 and its esterified form Fluo4-AM, has a
visible wavelength excitation (compatible with
argon-ion laser sources) and a large
fluorescence increase upon binding Ca2+.
[54]
FLUO-4FF,
FLUO-5F,
FLUO-5N
These are analogs of Fluo-4 with lower Ca2+-
binding affinity, making them suitable for
detecting intracellular calcium levels in the
1 μM to 1 mM range that would saturate the
response of Fluo-3 and Fluo-4
[11]
FLUO-4
DEXTRANS
These are Fluo-4 coupled to a biologically
inert dextran carrier (molecular weight =
10,000), providing a new and potentially
valuable tool for measuring Ca2+ transients.
[55]
CALCIUM
GREEN™-1
Structurally similar to Fluo-3, but is more
fluorescent at low calcium concentrations,
facilitating the determination of base line
Ca2+ levels and increasing the visibility of
resting cells
[56,57]
Int. J. Mol. Sci. 2014, 15 3847
Table 1. Cont.
Ca2+ indicator Chemical structure Properties References
CALCIUM
GREEN™-2
It has two fluorescent reporter groups, which
are believed to quench one another in the
absence of calcium, that undergo a much
larger increase in fluorescence emission upon
calcium binding than does Calcium Green™-1.
Its lower affinity for calcium makes it
particularly suited to measuring relatively high
spikes of calcium, up to 25 μM.
[58]
CALCIUM
ORANGE™ These are spectrally similar to
tetramethylrhodamine and Texas Red.
The long-wavelength spectral characteristics
of these indicators allow them to be used in
combination with fluorescein and ultraviolet
excitable dyes.
[37,44,50,59]
CALCIUM
CRIMSON™
INDO-1
These are “dual-emission” and “dual-excitation”
types of calcium dyes, respectively. To utilize
either of these indicators, however, appropriate
modifications of standard CLSM need to be made,
such as a high-power argon-ion laser is required to
obtain ultraviolet (UV) excitation, and
compensatory changes along the optical path must
be incorporated to deal with the lens aberrations
and reduced signal throughputs that are associated
with UV illuminations. At low concentrations of
the indicator, use of the 340/380 nm excitation
ratio for Fura-2 or the 405/485 nm emission ratio
for Indo-1 allows accurate measurements of the
intracellular Ca2+ concentration. Measurements of
Indo-1 and Fura-2 fluorescence can usually be
made over a period of an hour without
significant loss of fluorescence resulting from
either leakage or bleaching. In addition, Fura-2
and Indo-1 are bright enough to permit
measurements at intracellular concentrations
of dye unlikely to cause significant Ca2+
buffering or damping of Ca2+ transients.
[11,46,60]
FURA-2

Int. J. Mol. Sci. 2014, 15 3848
Table 1. Cont.
Ca2+ indicator Chemical structure Properties References
RHODAMINE-
BASED
INDICATORS.
Rhod-2 has fluorescence excitation and
emission maxima at 552 and 581 nm,
respectively. Variants with longer-wave length
excitation and emission (X-Rhod-1) and lower
Ca2+-binding affinity (Rhod-5N, Rhod-FF, etc.)
have been developed (i.e., at Molecular Probes).
Rhod-2 is used as a selective indicator for
mitochondrial Ca2+ in most eukaryotic cells.
[11]
7. Protein Based Ca2+ Indicators
7.1. Aequorin–Based Ca2+ Indicators
Aequorin (AEQ) photoprotein has been extensively used in the Ca2+ signaling field for almost
40 years. AEQ is a Ca2+-binding photoprotein composed of an apoprotein (apoaequorin), which has an
approximate molecular weight of 22 kDa and a prosthetic group, a luciferin molecule, coelenterazine
(Mr 432). In the presence of molecular oxygen, the functional holoprotein, aequorin, reconstitutes
spontaneously. The protein contains three EF-hand Ca2+-binding sites. When these sites are occupied
by Ca2+, aequorin undergoes a conformational change and behaves as an oxygenase that converts
coelenterazine into excited coelenteramide, which is released together with carbon dioxide. When the
excited coelenteramide relax to its ground state, blue light (λ = 469 nm) is emitted [20]. This emitted
light can be easily detected with a luminometer and correlates with the particular [Ca2+]. Identification
of Ca2+ sensitive AEQ from Aequorea victoria offers enormous advantage to carry out
bioluminescence research. This protein was carefully extracted and purified from jelly fish to prevent
the contact with Ca2+ as this would cause chemiluminescence, there by rendering the protein unsuitable
for Ca2+ measurements [61]. These proteins have been extensively engineered to obtain several
luminescent probes with different biological parameters [62–64]. With the advanced genetic
engineering and cloning strategies, it is possible to specifically localize them within the cell by
including specific targeting amino acid sequences [41].
In the last two decades the study of Ca2+ dynamics in living cells has been enhanced by a significant
improvement of genetically encoded protein based indicators [62]. AEQ allows their endogenous
production in cell system as diverse as bacteria, yeast, fungi, plants and mammalian cells.
The new generation of bioluminescent probes coupled with Ca2+ sensitive AEQ allows real time
measurement of Ca2+ changes [65,66]. Recently, AEQ based luminescent recording system has been
developed to monitor spatiotemporal Ca2+ dynamics to various stimuli in Arabidopsis plants [63].
A major advantage of AEQ is that it can be selectively targeted to subcellular compartments by
insertion of signal sequences unlike chemical compound dyes (excluding rhod-2, which is largely
retained in the mitochondrial matrix). Use of recombinant AEQ facilitated the understanding of Ca2+
signaling interplay between different cellular compartments [67–72]. AEQ became less popular
because of its small inherent signal; although the amount of signal emitted by the cell population is
quite adequate to measure Ca2+ concentration, the signal from single cell is very low. Adequate

Int. J. Mol. Sci. 2014, 15 3849
quantity of signal is needed to overcome background noise at the expense of space and time
resolutions. One of the limitations of AEQ use is that it usually overestimates the real response of cells,
especially when cell suspensions are used instead of whole tissues. For instance, when comparing
Fluo-3AM responses in Lima bean leaf tissues and AEQ signals in soybean cell suspensions, the upper
level of estimated level of Ca2+ in soybean cell culture responsiveness to H2O2 corresponds to the
lower level in both mechanically damaged and herbivore wounded Lima bean leaves. This situation
reflects the higher sensitivity of cell suspensions cultures compared to plant tissues, and should be
considered for further comparisons when AEQ is used to evaluate activities of molecules involved in
signaling processes [73]. However, not only suspension cell cultures expressing AEQ have been used,
but also seedlings or leaf discs. For example, Matrí and co-workers [74] used GAL4 transactivation of
AEQ to analyze [Ca2+]cyt signaling in specific cell types, including those of the leaves. Therefore, AEQ
can offer tissue specificity if placed under control of tissue-specific promoters.
Figure 1. Mechanism of light emission by AEQ upon Ca2+-binding. The apoprotein
(Apoaequorin) binds the prosthetic group Coelenterazine, a luciferine molecule. In the
presence of oxygen, the holoprotein AEQ reconstitutes spontaneously. The EF-hand
Ca2+-binding site on AEQ binds free Ca2+, which cause conformational changes in the
aequorin. Through oxygenase activity, aequorin converts Coelenterazine into excited
Coelenteramide and carbon dioxide. Coelenteramide relaxes to ground state by releasing
blue light (469 nm).
In AEQ assays the emitted light is calibrated into Ca2+ concentrations by a method based on the
calibration curve of Allen and coworkers [75]:
where L0 is the luminescence intensity per second and Lmax is the total amount of luminescence present
in the entire sample over the course of the experiment. [Ca2+] is the calculated Ca2+ concentration,
31
max
0
31
max
03
1
max
0
2
1
Ca
L
LKRKR
L
LKTR
L
L

Int. J. Mol. Sci. 2014, 15 3850
KR is the dissociation constant for the first Ca2+ ion to bind, and KTR is the binding constant of the
second Ca2+ ion to bind to AEQ [20]. Figure 1 shows the principle of the AEQ reaction.
7.2. GFP–Based Ca2+ Indicators
GFP based Ca2+ sensors are immediate alternatives to synthetic dyes and AEQ described above. In
1997 the first GFP based recombinant Ca2+ probe was developed [33,76]. Even though there are many
indicators, a limited number of those have been used in plants [77]. Currently there are three main
types of this Ca2+ sensor: cameleons, camgaroos and pericams [61,78,79]. All these sensors were based
on calmodulin (CaM) as a regulator, which changes its confirmation and alters fluorescence properties
upon binding to Ca2+. The cameleon probe has been extensively used in plant science research as
compared to camagaroos and pericams [7,8,21,27]. These probes are chimeric proteins designed on the
property called change of FRET, first synthesized by Tsien and co-workers [79,80]. FRET occurs
between two different colored GFP mutants, with spectral overlap of the donor emission spectrum and
the acceptor absorption spectrum. In the probe, the two GFP mutants are linked together by CaM and
CaM binding peptide [80]. Binding of Ca2+ to the Ca2+- responsive elements alters the efficiency of
FRET. Like AEQ, several generations of FRET-based Ca2+ were synthesized with different biological
parameters, sensitivity and efficiency; among them yellow cameleon (YC2.1) is the most popular for
their use under different physiological conditions [80,81]. The YC2.1 version of cameleon has been
widely used in plants for measurements of Ca2+ fluxes in guard cells, Nod factor responses, rhizobium
and fungal colonization in the roots [27,82–85]. Later on various modified version of cameleon sensors
were used to dissect subcellular Ca2+ dynamics; for example, D3cpv cameleon sensor for peroxisome
Ca2+ flux and YC4.6 for pollen tube endoplasmic reticulum Ca2+ dynamics [17,19]. Two recent works
report the use of D3cpv for mitochondrial Ca2+ analysis and D4ER for ER Ca2+ analysis [14,15].
Considering their importance in measuring Ca2+ dynamics at subcellular levels, efforts were made to
develop a new generation of YC2.1 with significantly increased FRET signal to provide efficient Ca2+
measurements while reducing signal to noise ratio, this modified version was named YC3.6 [61,79,86].
This new generation with high-resolution signal has been widely used in plants for spatiotemporal
imaging of cytoplasmic Ca2+ fluxes [87,88]. Recently YC3.6 has been successfully used to measure the
cytosolic Ca2+ upon mechanical damage and herbivory in Arabidopsis leaves [89]. A wide range of
YC sensors were successfully employed in plant science to analyze the spatiotemporal Ca2+ flux
in different cell types such as guard cells, root, root hairs, pollen tube and different subcellular
compartments [13,17,90–92]. Successes of the cameleon-based sensors are limited by CaM binding
peptide as part of the sensing mechanism. Endogenous CaM could interfere with the sensor and could
possibly change FRET signal.
Leaves of plants expressing FRET-based Ca2+ sensor YC3.6 can be ratio-imaged by CLSM. The
YC3.6 Ca2+ sensor is usually excited at 458-nm wavelength by using an argon laser. The cyan
fluorescent protein (CFP) and FRET-dependent Venus emission are assayed using a krypton/argon
laser at 458 nm with a 473–505 and 526–536 nm emission filters. In situ calibration is performed
through raising Ca2+ to saturating levels for YC3.6. Cells are usually permeabilized to allow a massive
free diffusion of calcium inside the cell to get the Rmax. EGTA and EDTA can trap the free calcium
released from the cells. Therefore, the maximum FRET/CFP ratio is obtained by treatment with

Int. J. Mol. Sci. 2014, 15 3851
1 molar CaCl2 in response to mechanical perturbation. The minimum FRET/CFP ratio is recorded by
treatment with 1 molar Tris 100 mM EDTA and 50 mM EGTA solution. [Ca2+]cyt variations are then
calculated according to the equation:
where R represents the FRET/CFP ratio measured during the experiment, n the Hill coefficient for
YC3.6 (usually = 1), while Kd values are assessed for a given concentration of Ca2+ [88]. Figure 2
illustrates the determination of [Ca2+]cyt variations using a cameleon probe.
Figure 2. (A) Fluorescence emission spectrum of cameleon YC 3.6 FRET-based Ca2+
sensor. The increase of Ca2+ concentration increase the emission from YFP (FRET-acceptor);
(B) In absence of free Ca2+, the donor protein (CFP) releases the absorbed energy as
fluorescence at 480 nm. In the presence of Ca2+, the calmodulin and M13 domains bind the
free Ca2+. The conformational change of chimeric protein allows FRET to occur between
the donor fluorescent protein CFP and the acceptor fluorescent protein YFP with light
emission at 530 nm.
n
d
RR
RRK1
max
min2Ca

Int. J. Mol. Sci. 2014, 15 3852
Table 2 lists some of the most used GFP-based Ca2+ indicators in plant sciences.
Table 2. Main GFP-based Ca2+ indicators used in plant science.
Cameleon family
Suitability Stimulus/response References
YC2.1
Suitable to use under various
physiological condition
because of their lower
sensitivity to pH.
Ca2+ fluxes in Arabidopsis guard cells,
Ca2+ elicitation in NOD factor of
medicago tranculata, Ca2+ role in
plant interaction with symbiotic
bacteria (rhizobium) and fungal
(mycorrhizal) root colonization.
[27,33,82–85,93–96]
Nucleoplasmin-
YC2.1
Suitable for nuclear matrix
localization study
Sieberer and colleague showed that
Ca2+ spiking localized to nuclear
matrix in the root hairs in response to
external nodulation factors.
[97]
D3cpv Suitable for studying
peroxisomal Ca2+ dynamics
Costa and colleagues showed
peroxisomal Ca2+ dynamics under
stress signaling.
[17]
YC4.6
Suitable for studying
endoplasmic reticulum
Ca2+ dynamics
Iwano and colleagues showed
pollen tube endoplasmic reticulum
Ca2+ dynamics
[19]
YC3.6
Substitution of acceptor
yellow fluorescent protein
yielded five fold increased
signal sensitivity, which
allowed imaging of both
temporal and dynamic
signaling of cytosolic
Ca2+ fluxes.
Used to study Ca2+ dynamics ranging
from roots and root hairs, guard cells,
pollen and leaves upon mechanical
and herbivore damage.
[19,27,61,79,82,84,
86–89,92,94,96,98–101]
8. Conclusions and Future Perspectives
Imaging Ca2+ in living cells has seen a tremendous development in the last two decades with the
evolution of genetically encoded Ca2+ indicators. Despite these improvements, we are still far from
having an ideal Ca2+ probe. Here we give emphasis on future directions on the improvements of
synthetic and fluorescent Ca2+ probes.
Currently, there are only two ratiomatric dyes fura-2 and indo-1 available since thirty years after
their synthesis. Both these dyes requires UV spectrum for their excitation. As a result, there is the need
for the use of expensive UV lasers for confocal microscopes, with the results of toxicity of UV
illumination, lower penetration and background fluorescence. Therefore, it is necessary to develop new
indicators that absorb light in the visible range.
The advent of a new generation of protein-based Ca2+ indicators has reduced the demand to develop
new optimized dyes. Although these protein-based probes offer many advantages over synthetic dyes
they are still far from being ideal probes. Most of the GFP-based probes have CaM as Ca2+ sensing
component. CaMs are also known to be important for many physiological processes in plant system.

Int. J. Mol. Sci. 2014, 15 3853
Overexpression of GFP-based probes might results in the substantial alteration of endogenous
physiological processes that depend on CaM activity [81,102]. Therefore, efforts should focus on
designing new protein-based constructs as selective and sensitive as CaM but characterized by a
lower or negligible interference with the endogenous components of the plant cell [102]. Further
improvements on GFP-based probes should face the problem of bleaching and photoisomerization of
GFP upon illumination [103]. Finding novel fluorescent protein from other organisms (other than
Aeuuorea) would provide solutions to these problems. All these efforts will allow us to understand
the complex subcellular interplay of Ca2+ signals underlying many plant physiological and
developmental processes.
Acknowledgments
The research leading to the results reported here has received funding from the Autonomous
Province of Trento, Italy, with reference to the Call 1-post-doc 2012–Incoming, approved with
provincial government resolution No. 1023 of 5/7/10.
Conflicts of Interest
The authors declare no conflict of interest.
References
1. Whalley, H.J.; Knight, M.R. Calcium signatures are decoded by plants to give specific gene
responses. New Phytol. 2013, 197, 690–693.
2. Arimura, G.; Maffei, M.E. Calcium and secondary CPK signaling in plants in response to
herbivore attack. Biochem. Biophys. Res. Commun. 2010, 400, 455–460.
3. McAinsh, M.R.; Pittman, J.K. Shaping the calcium signature. New Phytol. 2009, 181, 275–294.
4. White, P.J.; Broadley, M.R. Calcium in plants. Ann. Bot. 2003, 92, 487–511.
5. Monshausen, G.B. Visualizing Ca(2+) signatures in plants. Curr. Opin. Plant Biol. 2012, 15,
677–682.
6. Quiles-Pando, C.; Rexach. J.; Navarro-Gochicoa, M.T.; Camacho-Cristobal, J.J.;
Herrera-Rodriguez, M.B.; Gonzalez-Fontes, A. Boron deficiency increases the levels of cytosolic
Ca(2+) and expression of Ca(2+)-related genes in Arabidopsis thaliana roots. Plant Physiol. Biochem.
2013, 65, 55–60.
7. Swanson, S.J.; Gilroy, S. Imaging changes in cytoplasmic calcium using the Yellow Cameleon
3.6 biosensor and confocal microscopy. Methods Mol. Biol. 2013, 1009, 291–302.
8. Choi, W.G.; Swanson, S.J.; Gilroy, S. High-resolution imaging of Ca2+, redox status, ROS and
pH using GFP biosensors. Plant J. 2012, 70, 118–128.
9. Batistic, O.; Kudla, J. Analysis of calcium signaling pathways in plants. Biochim. Biophys. Acta
2012, 1820, 1283–1293.
10. Dodd, A.N.; Kudla, J.; Sanders, D. The language of calcium signaling. Ann. Rev. Plant Biol.
2010, 61, 593–620.

Int. J. Mol. Sci. 2014, 15 3854
11. McAinsh, M.R.; Ng, C.K. Measurement of cytosolic-free Ca2+ in plant tissue. Methods Mol. Biol.
2013, 937, 327–341.
12. Stael, S.; Wurzinger, B.; Mair, A.; Mehlmer, N.; Vothknecht, U.C.; Teige, M. Plant organellar
calcium signalling: An emerging field. J. Exp. Bot. 2012, 63, 1525–1542.
13. Behera, S.; Krebs, M.; Loro, G.; Schumacher, K.; Costa, A.; Kudla, J. Ca2+ imaging in plants
using genetically encoded Yellow Cameleon Ca2+ indicators. Cold Spring Harb. Protoc. 2013,
2013, 700–703.
14. Loro, G.; Ruberti, C.; Zottini, M.; Costa, A. The D3cpv Cameleon reports Ca2+ dynamics in plant
mitochondria with similar kinetics of the YC3.6 Cameleon, but with a lower sensitivity.
J. Microsc. 2013, 249, 8–12.
15. Bonza, M.C.; Loro, G.; Behera, S.; Wong, A.; Kudla, J.; Costa, A. Analyses of Ca2+
accumulation and dynamics in the endoplasmic reticulum of Arabidopsis root cells using a
genetically encoded Cameleon sensor. Plant Physiol. 2013, 163, 1230–1241.
16. Loro, G.; Drago, I.; Pozzan, T.; Schiavo, F.L.; Zottini, M.; Costa, A. Targeting of Cameleons to
various subcellular compartments reveals a strict cytoplasmic/mitochondrial Ca2+ handling
relationship in plant cells. Plant J. 2012, 71, 1–13.
17. Costa, A.; Drago, I.; Behera, S.; Zottini, M.; Pizzo, P.; Schroeder, J.I.; Pozzan, T.; Lo Schiavo, F.
H2O2 in plant peroxisomes: An in vivo analysis uncovers a Ca2+-dependent scavenging system.
Plant J. 2010, 62, 760–772.
18. Logan, D.C.; Knight, M.R. Mitochondrial and cytosolic calcium dynamics are differentially
regulated in plants. Plant Physiol. 2003, 133, 21–24.
19. Iwano, M.; Entani, T.; Shiba, H.; Kakita, M.; Nagai, T.; Mizuno, H.; Miyawaki, A.; Shoji, T.;
Kubo, K.; Isogai, A.; et al. Fine-tuning of the cytoplasmic Ca2+ concentration is essential for
pollen tube growth. Plant Physiol. 2009, 150, 1322–1334.
20. Mithofer, A.; Mazars, C.; Maffei, M.E. Probing Spatio-temporal Intracellular Calcium Variations
in Plants. Methods Mol. Biol. 2009, 479, 79–92.
21. Swanson, S.J.; Choi, W.G.; Chanoca, A.; Gilroy, S. In vivo imaging of Ca2+, pH, and reactive
oxygen species using fluorescent probes in plants. Ann. Rev. Plant Biol. 2011, 62, 273–297.
22. Joy, M.J.; Pyniarlang, N.; Ralf, O.; Irena, S. Calcium signaling and cytosolic calcium
measurements in plants. J. Endocytobiosis Cell Res. 2011, 21, 64–76.
23. Reddy, G.V.; Gordon, S.P.; Meyerowitz, E.M. Unravelling developmental dynamics: Transient
intervention and live imaging in plants. Nat. Rev. Mol. Cell Biol. 2007, 8, 491–501.
24. Foldes-Papp, Z.; Demel, U.; Tilz, G.P. Laser scanning confocal fluorescence microscopy:
An overview. Int. Immunopharmacol. 2003, 3, 1715–1729.
25. Kohler, B.; Blatt, M.R. Protein phosphorylation activates the guard cell Ca2+ channel and is a
prerequisite for gating by abscisic acid. Plant J. 2002, 32, 185–194.
26. Garcia-Mata, C.; Gay, R.; Sokolovski, S.; Hills, A.; Lamattina, L.; Blatt, M.R. Nitric oxide
regulates K+ and Cl− channels in guard cells through a subset of abscisic acid-evoked signaling
pathways. Proc. Natl. Acad. Sci. USA 2003, 100, 11116–11121.
27. Allen, G.J.; Kwak, J.M.; Chu, S.P.; Llopis, J.; Tsien, R.Y.; Harper, J.F.; Schroeder, J.I. Cameleon
calcium indicator reports cytoplasmic calcium dynamics in Arabidopsis guard cells. Plant J.
1999, 19, 735–747.

Int. J. Mol. Sci. 2014, 15 3855
28. Costa, A.; Candeo, A.; Fieramonti, L.; Valentini, G.; Bassi, A. Calcium dynamics in root cells of
Arabidopsis thaliana visualized with selective plane illumination microscopy. PLoS One 2013,
8, e75646.
29. Tsien, R.Y. New calcium indicators and buffers with high selectivity against magnesium and
protons: design, synthesis, and properties of prototype structures. Biochemistry 1980, 19,
2396–2404.
30. Rudolf, R.; Mongillo, M.; Rizzuto, R.; Pozzan, T. Looking forward to seeing calcium. Nat. Rev.
Mol. Cell Biol. 2003, 4, 579–586.
31. Shimomura, O.; Johnson, F.H.; Saiga, Y. Extraction, purification and properties of aequorin, a
bioluminescent protein from the luminous hydromedusan. Aequorea. J. Cell Comp. Physiol.
1962, 59, 223–239.
32. Knight, M.R.; Read, N.D.; Campbell, A.K.; Trewavas, A.J. Imaging calcium dynamics in living
plants using semi-synthetic recombinant aequorins. J. Cell Biol. 1993, 121, 83–90.
33. Miyawaki, A.; Llopis, J.; Heim, R.; McCaffery, J.M.; Adams, J.A.; Ikura, M.; Tsien, R.Y.
Fluorescent indicators for Ca2+ based on green fluorescent proteins and calmodulin. Nature 1997,
388, 882–887.
34. Jares-Erijman, E.A.; Jovin, T.M. FRET imaging. Nat. Biotechnol. 2003, 21, 1387–1395.
35. Sekar, R.B.; Periasamy, A. Fluorescence resonance energy transfer (FRET) microscopy imaging
of live cell protein localizations. J. Cell Biol. 2003, 160, 629–633.
36. Arimura, G.; Kopke, S.; Kunert, M.; Volpe, V.; David, A.; Brand, P.; Dabrowska, P.;
Maffei, M.E.; Boland, W. Effects of feeding Spodoptera littoralis on lima bean leaves: IV.
Diurnal and nocturnal damage differentially initiate plant volatile emission. Plant Physiol. 2008,
146, 965–973.
37. Kanchiswamy, C.N.; Mohanta, T.K.; Capuzzo, A.; Occhipinti, A.; Verrillo, F.; Maffei, M.E.;
Malnoy, M. Differential expression of CPKs and cytosolic Ca2+ variation in resistant and
susceptible apple cultivars (Malus × domestica) in response to the pathogen Erwinia amylovora
and mechanical wounding. BMC Genomics 2013, 14, 760.
38. Kanchiswamy, C.N.; Takahashi, H.; Quadro, S.; Maffei, M.E.; Bossi, S.; Bertea, C.;
Zebelo, S.A.; Muroi, A.; Ishihama, N.; Yoshioka, H.; et al. Regulation of Arabidopsis defense
responses against Spodoptera littoralis by CPK-mediated calcium signaling. BMC Plant Biol.
2010, 10, 97.
39. Grynkiewicz, G.; Poenie, M.; Tsien, R.Y. A new generation of Ca2+ indicators with greatly
improved fluorescence properties. J. Biol. Chem. 1985, 260, 3440–3450.
40. Pierson, E.S.; Miller, D.D.; Callaham, D.A.; Shipley, A.M.; Rivers, B.A.; Cresti, M.;
Hepler, P.K. Pollen tube growth is coupled to the extracellular calcium ion flux and the
intracellular calcium gradient: effect of BAPTA-type buffers and hypertonic media. Plant Cell
1994, 6, 1815–1828.
41. Bothwell, J.H.; Brownlee, C.; Hetherington, A.M.; Ng, C.K.; Wheeler, G.L.; McAinsh, M.R.
Biolistic delivery of Ca2+ dyes into plant and algal cells. Plant J. 2006, 46, 327–335.
42. Romano, L.A.; Jacob, T.; Gilroy, S.; Assmann, S.M. Increases in cytosolic Ca2+ are not required
for abscisic acid-inhibition of inward K+ currents in guard cells of Vicia faba L. Planta 2000,
211, 209–217.

Int. J. Mol. Sci. 2014, 15 3856
43. Zebelo, S.A.; Matsui, K.; Ozawa, R.; Maffei, M.E. Plasma membrane potential depolarization
and cytosolic calcium flux are early events involved in tomato (Solanum lycopersicon)
plant-to-plant communication. Plant Sci. Biol. 2012, 196, 93–100.
44. Bricchi, I.; Occhipinti, A.; Bertea, C.M.; Zebelo, S.A.; Brillada, C.; Verrillo, F.; de Castro, C.;
Molinaro, A.; Faulkner, C.; Maule, A.J.; et al. Separation of early and late responses to herbivory
in Arabidopsis by changing plasmodesmal function. Plant J. 2012, doi:10.1111/j.1365-313X.
2012.05103.x.
45. Bush, D.S. Regulation of cytosolic calcium in plants. Plant Physiol. 1993, 103, 7–13.
46. Dauphin, A.; Gerard, J.; Lapeyrie, F.; Legue, V. Fungal hypaphorine reduces growth and induces
cytosolic calcium increase in root hairs of Eucalyptus globulus. Protoplasma 2007, 231, 83–88.
47. Zhang, W-H.; Rengel, Z.; Kuo, J. Determination of intracellular Ca2+ in cells of intact wheat
roots: Loading of acetoxymethyl ester of Fluo-3 under low temperature. Plant J. 1998, 15,
147–151.
48. Bush, D.S.; Biswas, A.K.; Jones, R.L. Gibberellic-acid-stimulated Ca2+ accumulation in
endoplasmic reticulum of barley aleurone: Ca2+ transport and steady-state levels. Planta 1989,
178, 411–420.
49. Maffei, M.; Bossi, S.; Spiteller, D.; Mithofer, A.; Boland, W. Effects of feeding
Spodoptera littoralis on lima bean leaves. I. Membrane potentials, intracellular calcium
variations, oral secretions, and regurgitate components. Plant Physiol. 2004, 134, 1752–1762.
50. Mohanta, T.K.; Occhipinti, A.; Zebelo, S.A.; Foti, M.; Fliegmann, J.; Bossi, S.; Maffei, M.E.;
Bertea, C.M. Ginkgo biloba responds to herbivory by activating early signaling and direct
defenses. PLoS One 2012, 7, e32822.
51. Qu, H.; Jiang, X.; Shi, Z.; Liu, L.; Zhang, S. Fast loading ester fluorescent Ca2+ and pH
indicators into pollen of Pyrus pyrifolia. J. Plant Res. 2012, 125, 185–195.
52. Zhao, X.; Wang, Y.J.; Wang, Y.L.; Wang, X.L.; Zhang, X. Extracellular Ca2+ alleviates
NaCl-induced stomatal opening through a pathway involving H2O2-blocked Na+ influx in
Vicia guard cells. J. Plant Physiol. 2011, 168, 903–910.
53. Liu, G.; Dang, L.; Wang, D.M. The influence of elicitor on the distribution pattern of
microtubule and the cytosolic calcium in mesophyll protoplast of wheat. Fen Zi Xi Bao Sheng
Wu Xue Bao 2007, 40, 205–213.
54. Nair, R.; Raina, S.; Keshavarz, T.; Kerrigan, M.J. Application of fluorescent indicators to analyse
intracellular calcium and morphology in filamentous fungi. Fungal Biol. 2011, 115, 326–334.
55. Schulz, A.; Woolley, R.; Tabarin, T.; McDonagh, C. Dextran-coated silica nanoparticles for
calcium-sensing. Analyst 2011, 136, 1722–1727.
56. Wu, X.; Chen, T.; Zheng, M.; Chen, Y.; Teng, N.; Samaj, J.; Baluska, F.; Lin, J. Integrative
proteomic and cytological analysis of the effects of extracellular Ca2+ influx on Pinus bungeana
pollen tube development. J. Proteome Res. 2008, 7, 4299–4312.
57. Lu, Y.; Paige, M.F. An ensemble and single-molecule fluorescence spectroscopy investigation of
Calcium Green 1, a calcium-ion sensor. J. Fluoresc. 2007, 17, 739–748.
58. Bagh, S.; Paige, M.F. Ensemble and single-molecule fluorescence spectroscopy of a calcium-ion
indicator dye. J. Phys. Chem. A 2006, 110, 7057–7066.

Int. J. Mol. Sci. 2014, 15 3857
59. Braun, M.; Richter, P. Relocalization of the calcium gradient and a dihydropyridine receptor is
involved in upward bending by bulging of Chara protonemata, but not in downward bending by
bowing of Chara rhizoids. Planta 1999, 209, 414–423.
60. Bunney, T.D.; Shaw, P.J.; Watkins, P.A.; Taylor, J.P.; Beven, A.F.; Wells, B.; Calder, G.M.;
Drobak, B.K. ATP-dependent regulation of nuclear Ca2+ levels in plant cells. FEBS Lett. 2000,
476, 145–149.
61. Baird, G.S.; Zacharias, D.A.; Tsien, R.Y. Circular permutation and receptor insertion within
green fluorescent proteins. Proc. Natl. Acad. Sci. USA 1999, 96, 11241–11246.
62. Ottolini, D.; Cali, T.; Brini, M. Measurements of Ca2+ concentration with recombinant targeted
luminescent probes. Methods Mol. Biol. 2013, 937, 273–291.
63. Zhu, X.; Feng, Y.; Liang, G.; Liu, N.; Zhu, J.K. Aequorin-based luminescence imaging reveals
stimulus- and tissue-specific Ca2+ dynamics in Arabidopsis plants. Mol. Plant 2013, 6, 444–455.
64. Knight, H.; Knight, M.R. Recombinant aequorin methods for intracellular calcium measurement
in plants. Methods Cell Biol. 1995, 49, 201–216.
65. Brini, M.; Cali, T.; Ottolini, D.; Carafoli, E. Intracellular calcium homeostasis and signaling.
Met. Ions Life Sci. 2013, 12, 119–168.
66. Cali, T.; Ottolini, D.; Brini, M. Calcium and endoplasmic reticulum-mitochondria tethering in
neurodegeneration. DNA Cell Biol. 2013, 32, 140–146.
67. Bonora, M.; Giorgi, C.; Bononi, A.; Marchi, S.; Patergnani, S.; Rimessi, A.; Rizzuto, R.;
Pinton, P. Subcellular calcium measurements in mammalian cells using jellyfish photoprotein
aequorin-based probes. Nat. Protoc. 2013, 8, 2105–2118.
68. Pozzan, T.; Rizzuto, R. Imaging calcium dynamics using targeted recombinant aequorins.
CSH Protoc. 2008, 2008, doi:10.1101/pdb.top26.
69. Rizzuto, R.; Pinton, P.; Brini, M.; Chiesa, A.; Filippin, L.; Pozzan, T. Mitochondria as biosensors
of calcium microdomains. Cell Calcium 1999, 26, 193–199.
70. Brini, M.; Pinton, P.; Pozzan, T.; Rizzuto, R. Targeted recombinant aequorins: Tools for
monitoring [Ca2+] in the various compartments of a living cell. Microsc. Res. Tech. 1999, 46,
380–389.
71. Pinton, P.; Brini, M.; Bastianutto, C.; Tuft, RA.; Pozzan, T.; Rizzuto, R. New light on
mitochondrial calcium. BioFactors 1998, 8, 243–253.
72. Pinton, P.; Pozzan, T.; Rizzuto, R. The Golgi apparatus is an inositol 1,4,5-trisphosphate-
sensitive Ca2+ store, with functional properties distinct from those of the endoplasmic reticulum.
EMBO J. 1998, 17, 5298–5308.
73. Maffei, M.E.; Mithofer, A.; Arimura, G.; Uchtenhagen, H.; Bossi, S.; Bertea, C.M.;
Cucuzza, L.S.; Novero, M.; Volpe, V.; Quadro, S.; et al. Effects of feeding Spodoptera littoralis
on lima bean leaves. III. Membrane depolarization and involvement of hydrogen peroxide.
Plant Physiol. 2006, 140, 1022–1035.
74. Marti, M.C.; Stancombe, M.A.; Webb, A.A. Cell- and stimulus type-specific intracellular free
Ca2+ signals in Arabidopsis. Plant Physiol. 2013, 163, 625–634.
75. Allen, D.G.; Blinks, J.R.; Prendergast, F.G. Aequorin luminescence: Relation of light emission to
calcium concentration—A calcium-independent component. Science 1977, 195, 996–998.

Int. J. Mol. Sci. 2014, 15 3858
76. Romoser, V.A.; Hinkle, P.M.; Persechini, A. Detection in living cells of Ca2+-dependent changes
in the fluorescence emission of an indicator composed of two green fluorescent protein variants
linked by a calmodulin-binding sequence. A new class of fluorescent indicators. J. Biol. Chem.
1997, 272, 13270–13274.
77. Whitaker, M. Genetically encoded probes for measurement of intracellular calcium.
Methods Cell Biol. 2010, 99, 153–182.
78. Tozawa, Y.; Nozawa, A.; Kanno, T.; Narisawa, T.; Masuda, S.; Kasai, K.; Nanamiya, H.
Calcium-activated (p)ppGpp synthetase in chloroplasts of land plants. J. Biol. Chem. 2007, 282,
35536–35545.
79. Nagai, T.; Sawano, A.; Park, E.S.; Miyawaki, A. Circularly permuted green fluorescent proteins
engineered to sense Ca2+. Proc. Natl. Acad. Sci. USA 2001, 98, 3197–3202.
80. Miyawaki, A.; Griesbeck, O.; Heim, R.; Tsien, R.Y. Dynamic and quantitative Ca2+
measurements using improved cameleons. Proc. Natl. Acad. Sci. USA 1999, 96, 2135–2140.
81. Palmer, A.E.; Tsien, R.Y. Measuring calcium signaling using genetically targetable fluorescent
indicators. Nat. Protoc. 2006, 1, 1057–1065.
82. Allen, G.J.; Chu, S.P.; Harrington, C.L.; Schumacher, K.; Hoffmann, T.; Tang, Y.Y.; Grill, E.;
Schroeder, J.I. A defined range of guard cell calcium oscillation parameters encodes stomatal
movements. Nature 2001, 411, 1053–1057.
83. Sun, J.; Miwa, H.; Downie, J.A.; Oldroyd, G.E. Mastoparan activates calcium spiking analogous
to Nod factor-induced responses in Medicago truncatula root hair cells. Plant Physiol. 2007,
144, 695–702.
84. Miwa, H.; Sun, J.; Oldroyd, G.E.; Downie, J.A. Analysis of Nod-factor-induced calcium signaling
in root hairs of symbiotically defective mutants of Lotus japonicus. Mol. Plant-Microbe Interact.
2006, 19, 914–923.
85. Kosuta, S.; Hazledine, S.; Sun, J.; Miwa, H.; Morris, R.J.; Downie, J.A.; Oldroyd, G.E.
Differential and chaotic calcium signatures in the symbiosis signaling pathway of legumes.
Proc. Natl. Acad. Sci. USA 2008, 105, 9823–9828.
86. Nagai, T.; Yamada, S.; Tominaga, T.; Ichikawa, M.; Miyawaki, A. Expanded dynamic range of
fluorescent indicators for Ca2+ by circularly permuted yellow fluorescent proteins.
Proc. Natl. Acad. Sci. USA 2004, 101, 10554–10559.
87. Monshausen, G.B.; Bibikova, T.N.; Messerli, M.A.; Shi, C.; Gilroy, S. Oscillations in
extracellular pH and reactive oxygen species modulate tip growth of Arabidopsis root hairs.
Proc. Natl. Acad. Sci. USA 2007, 104, 20996–21001.
88. Monshausen, G.B.; Messerli, M.A.; Gilroy, S. Imaging of the Yellow Cameleon 3.6 indicator
reveals that elevations in cytosolic Ca2+ follow oscillating increases in growth in root hairs of
Arabidopsis. Plant Physiol. 2008, 147, 1690–1698.
89. Verrillo, F.; Occhipinti, A.; Kanchiswamy, C.N.; Maffei, M.E. Quantitative analysis of
herbivore-induced cytosolic calcium by using a Cameleon (YC 3.6) calcium sensor in
Arabidopsis thaliana. J. Plant Physiol. 2014, 171, 136–139.
90. Behera, S.; Kudla, J. High-resolution imaging of cytoplasmic Ca2+ dynamics in Arabidopsis
roots. Cold Spring Harb. Protoc. 2013, 2013, doi:10.1101/pdb.prot073023.

Int. J. Mol. Sci. 2014, 15 3859
91. Behera, S.; Kudla, J. Live cell imaging of cytoplasmic Ca2+ dynamics in Arabidopsis guard cells.
Cold Spring Harb. Protoc. 2013, 2013, 665–669.
92. Monshausen, G.B.; Bibikova, T.N.; Weisenseel, M.H.; Gilroy, S. Ca2+ regulates reactive oxygen
species production and pH during mechanosensing in Arabidopsis roots. Plant Cell 2009, 21,
2341–2356.
93. Gjetting, S.K.; Schulz, A.; Fuglsang, A.T. Perspectives for using genetically encoded fluorescent
biosensors in plants. Front. Plant Sci. 2013, 4, 234.
94. Allen, G.J.; Murata, Y.; Chu, S.P.; Nafisi, M.; Schroeder, J.I. Hypersensitivity of abscisic
acid-induced cytosolic calcium increases in the Arabidopsis farnesyltransferase mutant era1-2.
Plant Cell 2002, 14, 1649–1662.
95. Allen, G.J.; Chu, S.P.; Schumacher, K.; Shimazaki, C.T.; Vafeados, D.; Kemper, A.;
Hawke, S.D.; Tallman, G.; Tsien, R.Y.; Harper, J.F.; et al. Alteration of stimulus-specific guard
cell calcium oscillations and stomatal closing in Arabidopsis det3 mutant. Science 2000, 289,
2338–2342.
96. Allen, G.J.; Kuchitsu, K.; Chu, S.P.; Murata, Y.; Schroeder, J.I. Arabidopsis abi1-1 and abi2-1
phosphatase mutations reduce abscisic acid-induced cytoplasmic calcium rises in guard cells.
Plant Cell 1999, 11, 1785–1798.
97. Sieberer, B.J.; Chabaud, M.; Timmers, A.C.; Monin, A.; Fournier, J.; Barker, D.G.
A nuclear-targeted cameleon demonstrates intranuclear Ca2+ spiking in Medicago truncatula root
hairs in response to rhizobial nodulation factors. Plant Physiol. 2009, 151, 1197–1206.
98. Iwano, M.; Shiba, H.; Miwa, T.; Che, F.S.; Takayama, S.; Nagai, T.; Miyawaki, A.; Isogai, A.
Ca2+ dynamics in a pollen grain and papilla cell during pollination of Arabidopsis. Plant Physiol.
2004, 136, 3562–3571.
99. Miwa, H.; Sun, J.; Oldroyd, G.E.; Downie, J.A. Analysis of calcium spiking using a cameleon
calcium sensor reveals that nodulation gene expression is regulated by calcium spike number and
the developmental status of the cell. Plant J. 2006, 48, 883–894.
100. Richter, G.L.; Monshausen, G.B.; Krol, A.; Gilroy, S. Mechanical stimuli modulate lateral root
organogenesis. Plant Physiol. 2009, 151, 1855–1866.
101. Rincon-Zachary, M.; Teaster, N.D.; Sparks, J.A.; Valster, A.H.; Motes, C.M.; Blancaflor, E.B.
Fluorescence resonance energy transfer-sensitized emission of yellow cameleon 3.60 reveals root
zone-specific calcium signatures in Arabidopsis in response to aluminum and other trivalent
cations. Plant Physiol. 2010, 152, 1442–1458.
102. Palmer, A.E.; Giacomello, M.; Kortemme, T.; Hires, S.A.; Lev-Ram, V.; Baker, D.; Tsien, R.Y.
Ca2+ indicators based on computationally redesigned calmodulin-peptide pairs. Chem. Biol.
2006, 13, 521–530.
103. Patterson, G.H.; Knobel, S.M.; Sharif, W.D.; Kain, S.R.; Piston, D.W. Use of the green
fluorescent protein and its mutants in quantitative fluorescence microscopy. Biophys. J. 1997, 73,
2782–2790.
© 2014 by the authors; licensee MDPI, Basel, Switzerland. This article is an open access article
distributed under the terms and conditions of the Creative Commons Attribution license
(http://creativecommons.org/licenses/by/3.0/).


