Embed Size (px)
Citation preview
Kongens Nytorv 6 1050 Copenhagen K
Denmark Tel.: +45 3336 7100 Fax: +45 3336 7199
eea.europa.eu
Calculating the coverage of Corine land cover classes inside Natura 2000 sites aggregated by NUTS regions: The raster approach
Author: Alberto Telletxea and Alex Garitaonandia
Bilbomatica, September 2016
EEA project manager: Mette Palitzsch Lund
European Environment Agency
Natura2000v15-CLCv16-NUTS3 area calculcution methodology.docx Page | 2
Contents
Contents ........................................................................................................................................ 2
1 Introduction ........................................................................................................................... 3
2 Input datasets ........................................................................................................................ 3
3 Methodology of surface area calculation .............................................................................. 4
4 Output datasets ................................................................................................................... 12
5 Appendix (Model builder) .................................................................................................... 13
Natura2000v15-CLCv16-NUTS3 area calculcution methodology.docx Page | 3
1 Introduction
This document explains the methodology behind the raster based statistics on the Corine land cover (CLC) in the Natura 2000 network aggregated by NUTS3 regions. The resulting statistic has three pivot tables, one for the CLC area in Natura 2000 sites designated under the Birds Directive (SPAs) only, one for the CLC area in Natura 2000 sites designated under the Habitats Directive (SCIs/SACs) only and one for the CLC area in the full Natura 2000 network, i.e. sites designated under both Directives.
2 Input datasets
The input datasets for the area calculation are the Natura2000 network, the Corine land cover and the NUTS regions. The first two datasets are publicly available from the EEA website while the NUTS regions are license restricted and only the metadata is publicly available.
The Natura 2000 network v2015 (.shp format)
http://www.eea.europa.eu/data-and-maps/data/natura-7#tab-gis-data.
Corine land cover version 2006 (CLCv2006) 100m raster, http://www.eea.europa.eu/data-and-maps/data/corine-land-cover-2006-raster-3, was gapfilled with Corine land cover version 2000 (CLCv2000) 100m raster, http://www.eea.europa.eu/data-and-maps/data/corine-land-cover-2000-raster-3, as Greece and Azores was not included in the CLC2006 version at the time.
The resulting dataset is internally available at EEA, the metadata can be accessed from http://sdi.eea.europa.eu/catalogue/srv/eng/catalog.search;jsessionid=2A4B78F79FDCD45C27521CD4C223C2F3#/metadata/2d6f67b9-c912-4ba5-94ee-1af821a24729 .
Administrative units from Euroboundary map (EBMv5) 100m. The metadata is available from http://sdi.eea.europa.eu/catalogue/srv/eng/catalog.search;jsessionid=2A4B78F79FDCD45C27521CD4C223C2F3#/metadata/a6a9ee28-028e-4782-a3b1-369b1dbc5d9b.
The coordinate reference systems of the three datasets are EPSG:3035 which is best suited for area calculations as it has an equal area projection.
Natura2000v15-CLCv16-NUTS3 area calculcution methodology.docx Page | 4
3 Methodology of surface area calculation
The area calculations are based on raster analysis carried out in ArcGIS 10.2, the processing steps are managed using the ArcGIS Model builder.
The Corine land cover (CLC) data is in 100m raster format when downloaded from the EEA website. Also the NUTS layer is available in 100m raster format. The Natura 2000 network data comes in a vector format (shape file) and requires rasterization by site designation type. Three raster layers are needed before calculating the statistics. One layer with Bird Directive areas: SPA sites = A types; one with Habitat Directive areas: SCI/SAC sites = B types; and one with the sites that are designated as both SPA and SCI/SAC = C types. This means that 1) all Bird Directive sites are calculated by combining the A + C types, 2) all Habitat Directive sites are calculated by combining the B + C types and 3) the full Natura 2000 network is calculated by combining all types (A + B + C).
There are six processing steps:
Step 1: Iteration by Member State, selection of site type, dissolving by site type and rasterisation in a 100 meter resolution.
Step 2: Reclassification of the attribute values of all input data.
Step 3: Intersection of the NUTS3 regions, the CLC and each of the Natura 2000 layers with multiplication of attributes values.
Step 4: Disaggregation of the value by Nuts3 region (5 digits), Natura2000 (100 or 0 value) and CLC (45 classes) and respective joins to recover their alphanumeric attribute values.
Step 5: Area calculation in km2
Step 6: Merge of tables of by the respective site type, NUTS3 code and CLC class by Member State and export to Excel.
Natura2000v15-CLCv16-NUTS3 area calculcution methodology.docx Page | 5
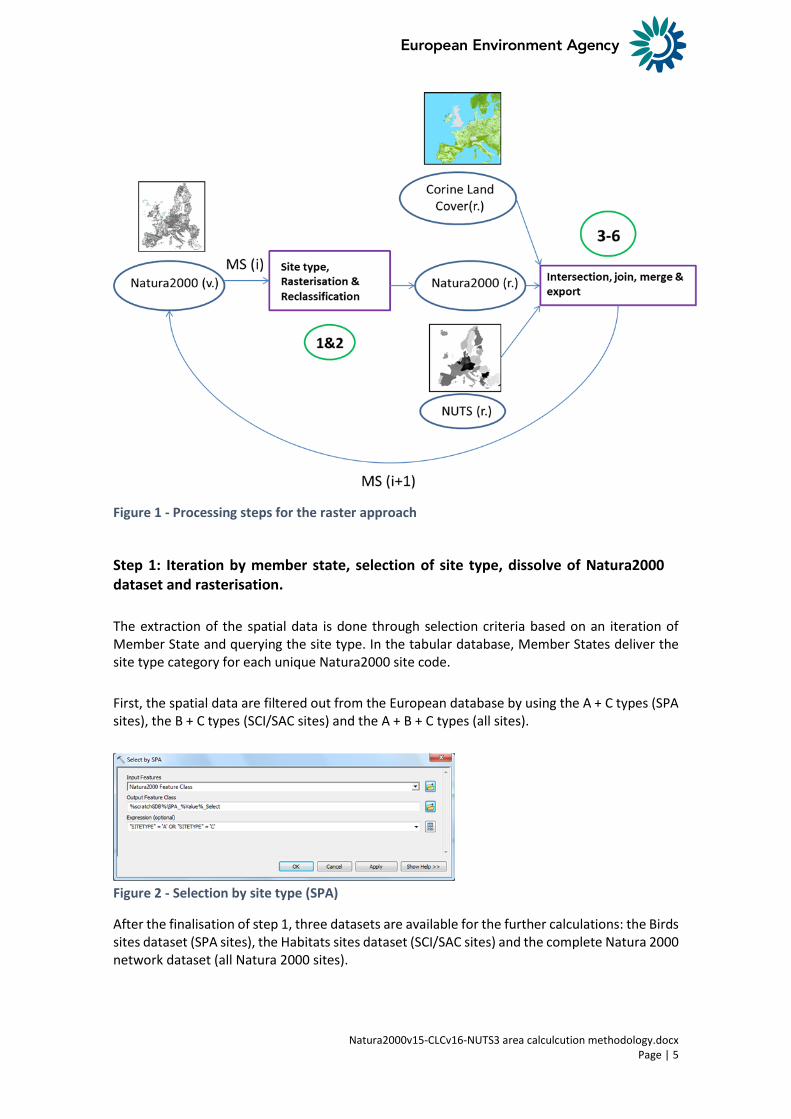
Figure 1 - Processing steps for the raster approach
Step 1: Iteration by member state, selection of site type, dissolve of Natura2000 dataset and rasterisation.
The extraction of the spatial data is done through selection criteria based on an iteration of Member State and querying the site type. In the tabular database, Member States deliver the site type category for each unique Natura2000 site code.
First, the spatial data are filtered out from the European database by using the A + C types (SPA sites), the B + C types (SCI/SAC sites) and the A + B + C types (all sites).
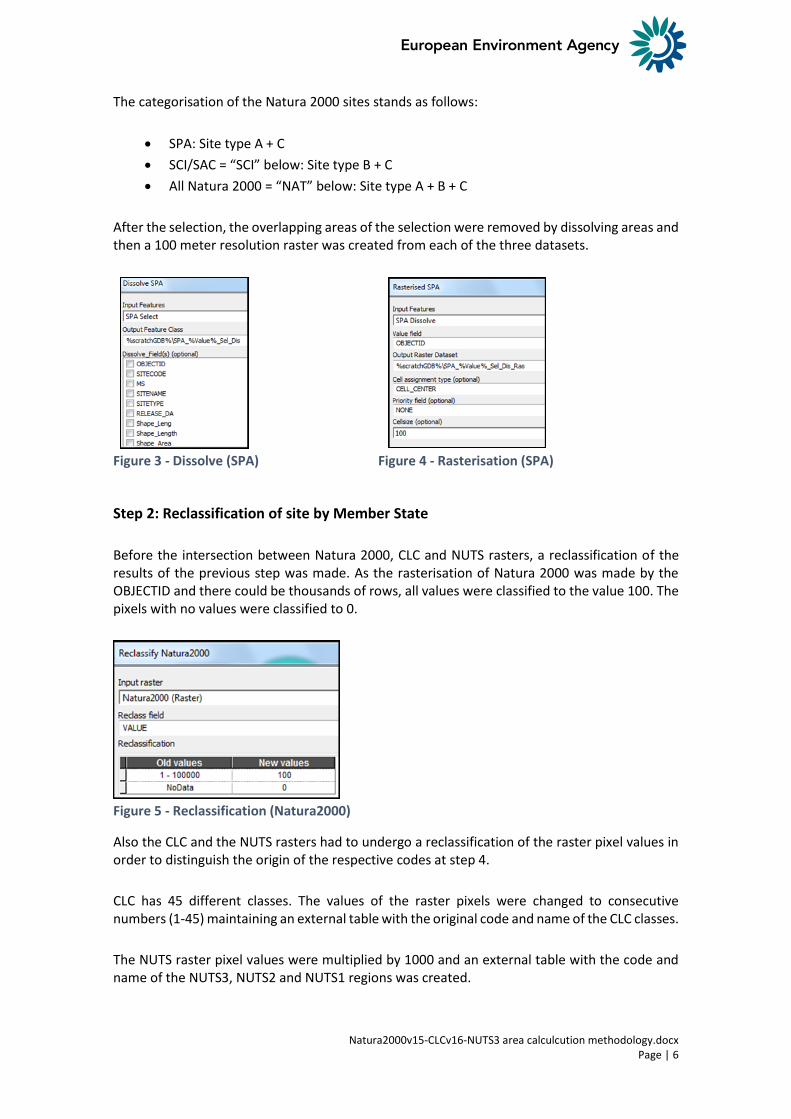
Figure 2 - Selection by site type (SPA)
After the finalisation of step 1, three datasets are available for the further calculations: the Birds sites dataset (SPA sites), the Habitats sites dataset (SCI/SAC sites) and the complete Natura 2000 network dataset (all Natura 2000 sites).
Natura2000v15-CLCv16-NUTS3 area calculcution methodology.docx Page | 6
The categorisation of the Natura 2000 sites stands as follows:
SPA: Site type A + C
SCI/SAC = “SCI” below: Site type B + C
All Natura 2000 = “NAT” below: Site type A + B + C
After the selection, the overlapping areas of the selection were removed by dissolving areas and then a 100 meter resolution raster was created from each of the three datasets.
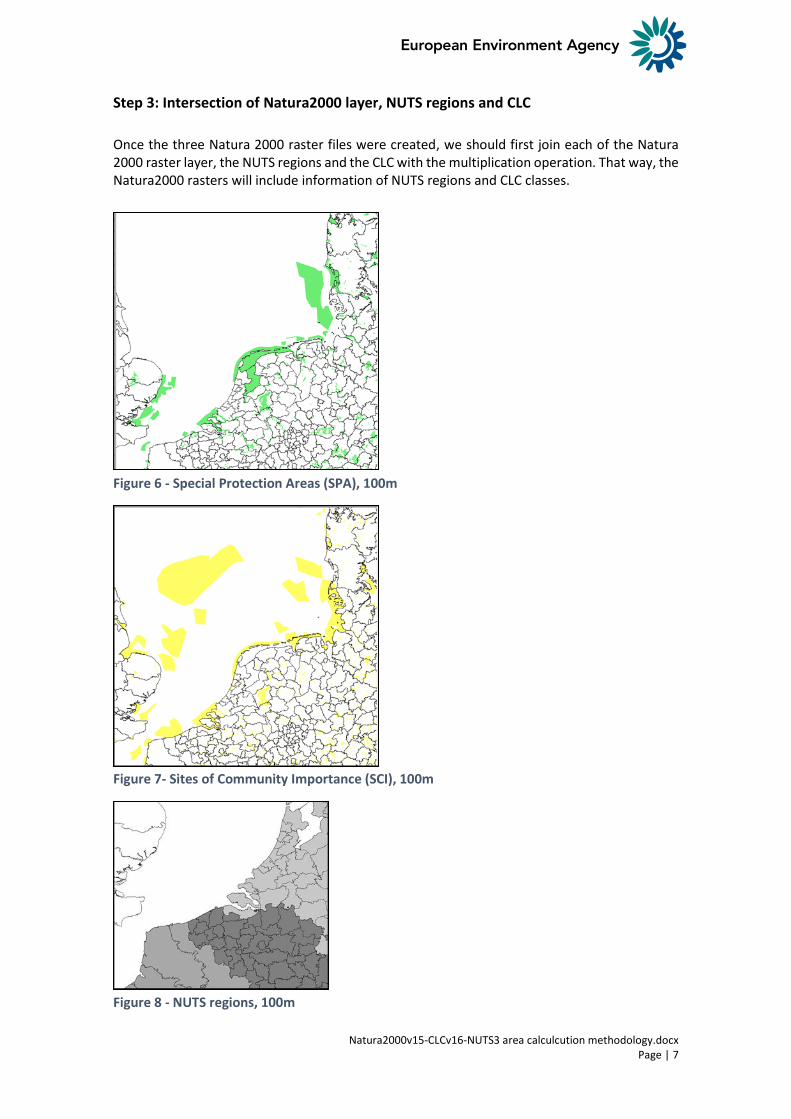
Figure 3 - Dissolve (SPA) Figure 4 - Rasterisation (SPA)
Step 2: Reclassification of site by Member State
Before the intersection between Natura 2000, CLC and NUTS rasters, a reclassification of the results of the previous step was made. As the rasterisation of Natura 2000 was made by the OBJECTID and there could be thousands of rows, all values were classified to the value 100. The pixels with no values were classified to 0.
Figure 5 - Reclassification (Natura2000)
Also the CLC and the NUTS rasters had to undergo a reclassification of the raster pixel values in order to distinguish the origin of the respective codes at step 4.
CLC has 45 different classes. The values of the raster pixels were changed to consecutive numbers (1-45) maintaining an external table with the original code and name of the CLC classes.
The NUTS raster pixel values were multiplied by 1000 and an external table with the code and name of the NUTS3, NUTS2 and NUTS1 regions was created.
Natura2000v15-CLCv16-NUTS3 area calculcution methodology.docx Page | 7
Step 3: Intersection of Natura2000 layer, NUTS regions and CLC
Once the three Natura 2000 raster files were created, we should first join each of the Natura 2000 raster layer, the NUTS regions and the CLC with the multiplication operation. That way, the Natura2000 rasters will include information of NUTS regions and CLC classes.
Figure 6 - Special Protection Areas (SPA), 100m
Figure 7- Sites of Community Importance (SCI), 100m
Figure 8 - NUTS regions, 100m
Natura2000v15-CLCv16-NUTS3 area calculcution methodology.docx Page | 8
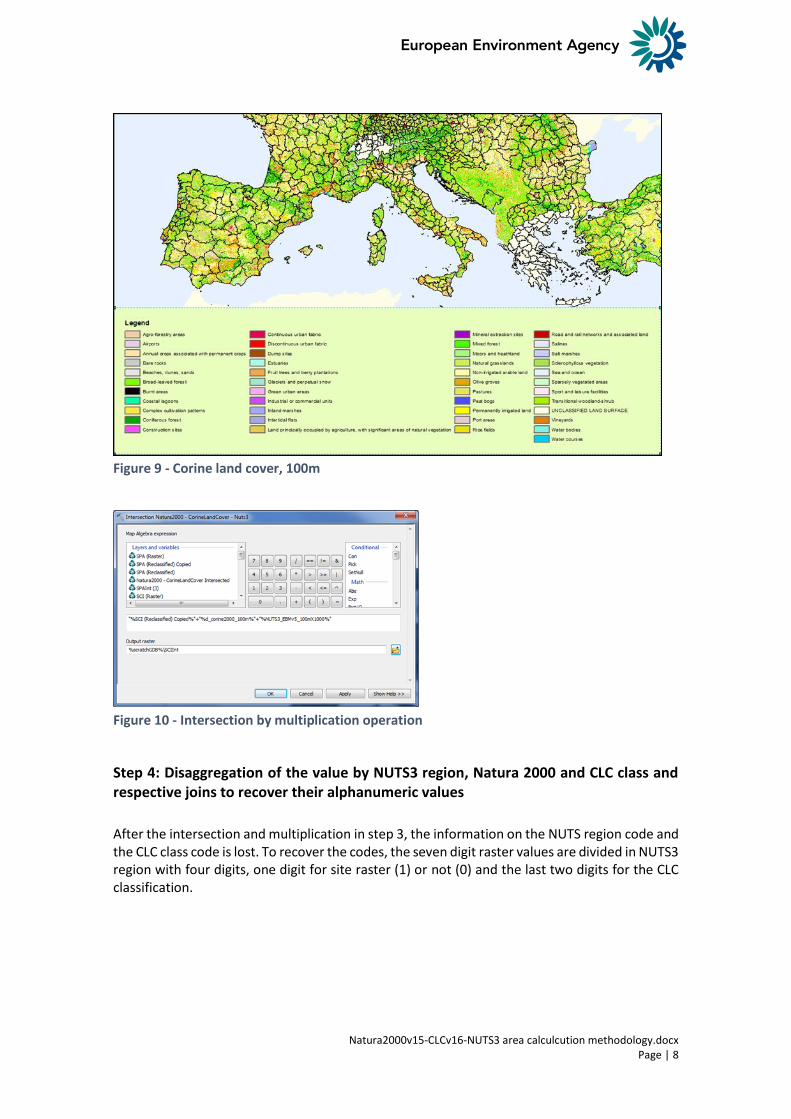
Figure 9 - Corine land cover, 100m
Figure 10 - Intersection by multiplication operation
Step 4: Disaggregation of the value by NUTS3 region, Natura 2000 and CLC class and respective joins to recover their alphanumeric values
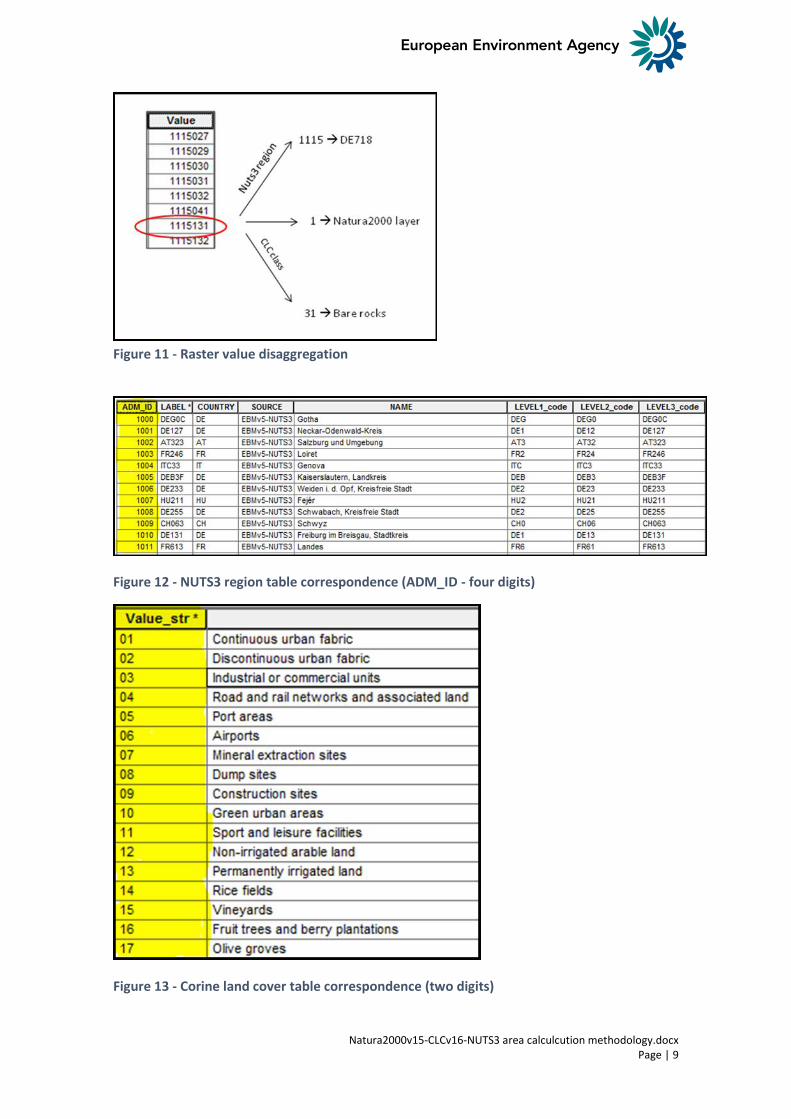
After the intersection and multiplication in step 3, the information on the NUTS region code and the CLC class code is lost. To recover the codes, the seven digit raster values are divided in NUTS3 region with four digits, one digit for site raster (1) or not (0) and the last two digits for the CLC classification.
Natura2000v15-CLCv16-NUTS3 area calculcution methodology.docx Page | 9
Figure 11 - Raster value disaggregation
Figure 12 - NUTS3 region table correspondence (ADM_ID - four digits)
Figure 13 - Corine land cover table correspondence (two digits)
Natura2000v15-CLCv16-NUTS3 area calculcution methodology.docx Page | 10
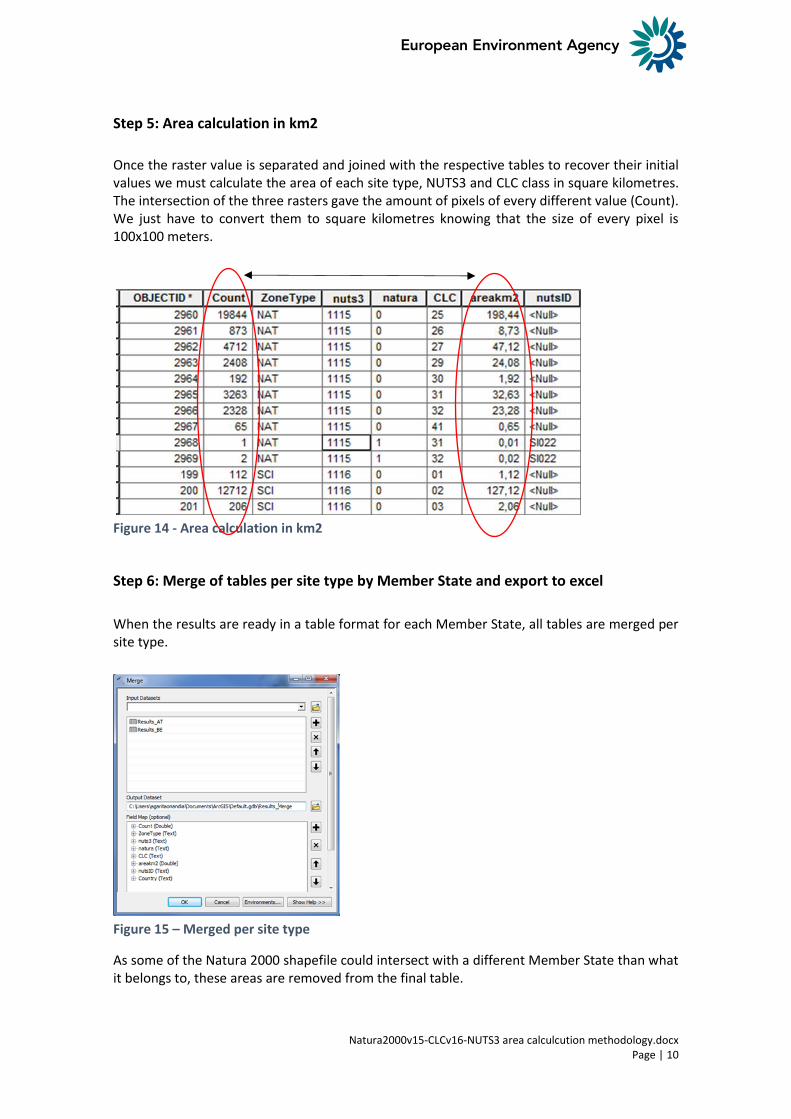
Step 5: Area calculation in km2
Once the raster value is separated and joined with the respective tables to recover their initial values we must calculate the area of each site type, NUTS3 and CLC class in square kilometres. The intersection of the three rasters gave the amount of pixels of every different value (Count). We just have to convert them to square kilometres knowing that the size of every pixel is 100x100 meters.
Figure 14 - Area calculation in km2
Step 6: Merge of tables per site type by Member State and export to excel
When the results are ready in a table format for each Member State, all tables are merged per site type.
Figure 15 – Merged per site type
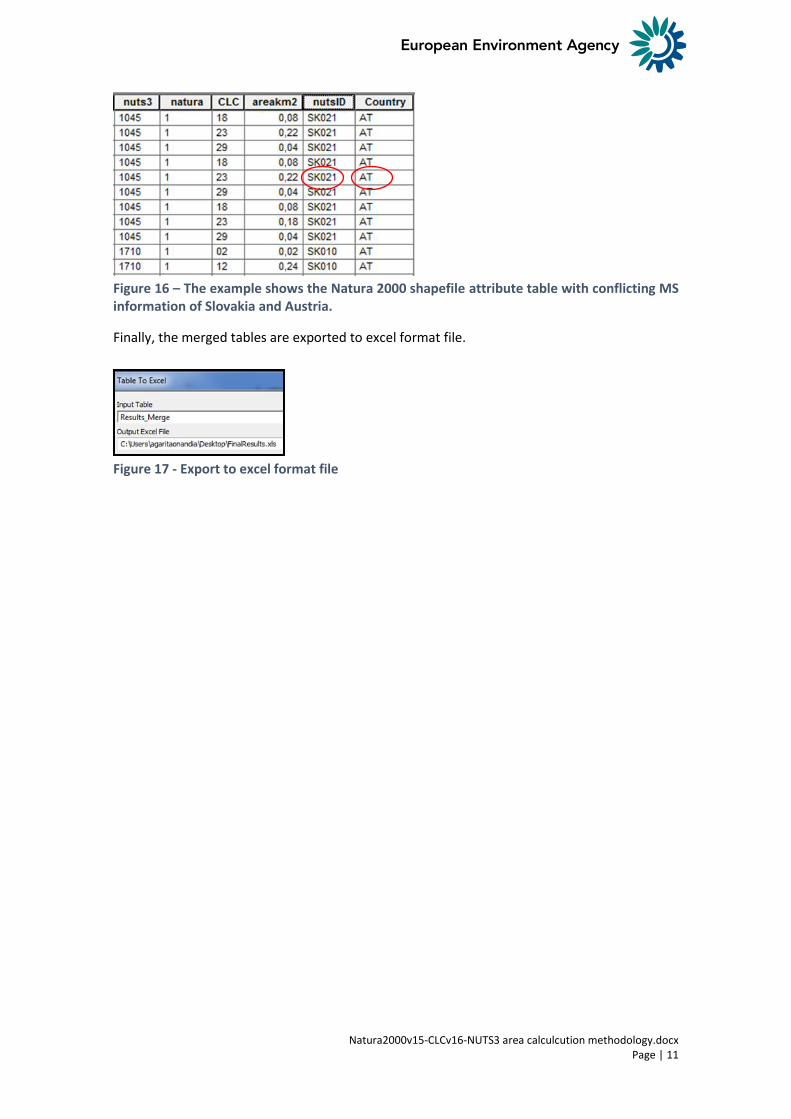
As some of the Natura 2000 shapefile could intersect with a different Member State than what it belongs to, these areas are removed from the final table.
Natura2000v15-CLCv16-NUTS3 area calculcution methodology.docx Page | 11
Figure 16 – The example shows the Natura 2000 shapefile attribute table with conflicting MS information of Slovakia and Austria.
Finally, the merged tables are exported to excel format file.
Figure 17 - Export to excel format file
Natura2000v15-CLCv16-NUTS3 area calculcution methodology.docx Page | 12
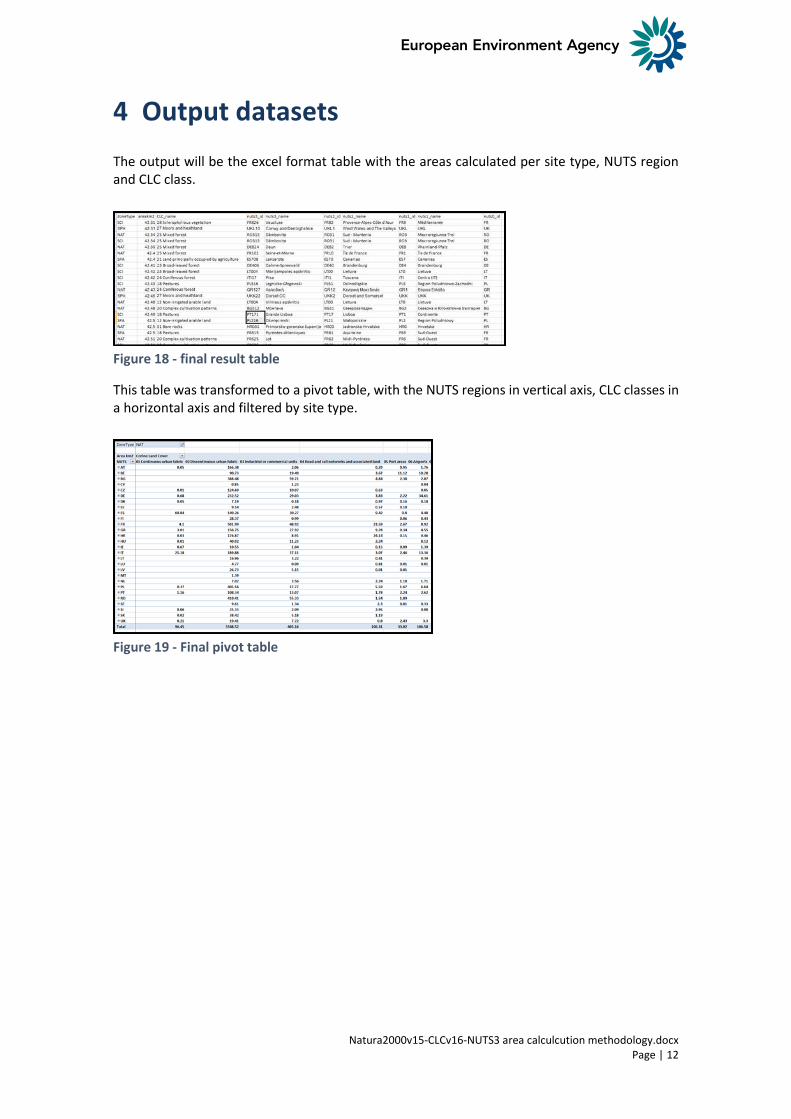
4 Output datasets
The output will be the excel format table with the areas calculated per site type, NUTS region and CLC class.
Figure 18 - final result table
This table was transformed to a pivot table, with the NUTS regions in vertical axis, CLC classes in a horizontal axis and filtered by site type.
Figure 19 - Final pivot table
Natura2000v15-CLCv16-NUTS3 area calculcution methodology.docx Page | 13
5 Appendix (Model builder)
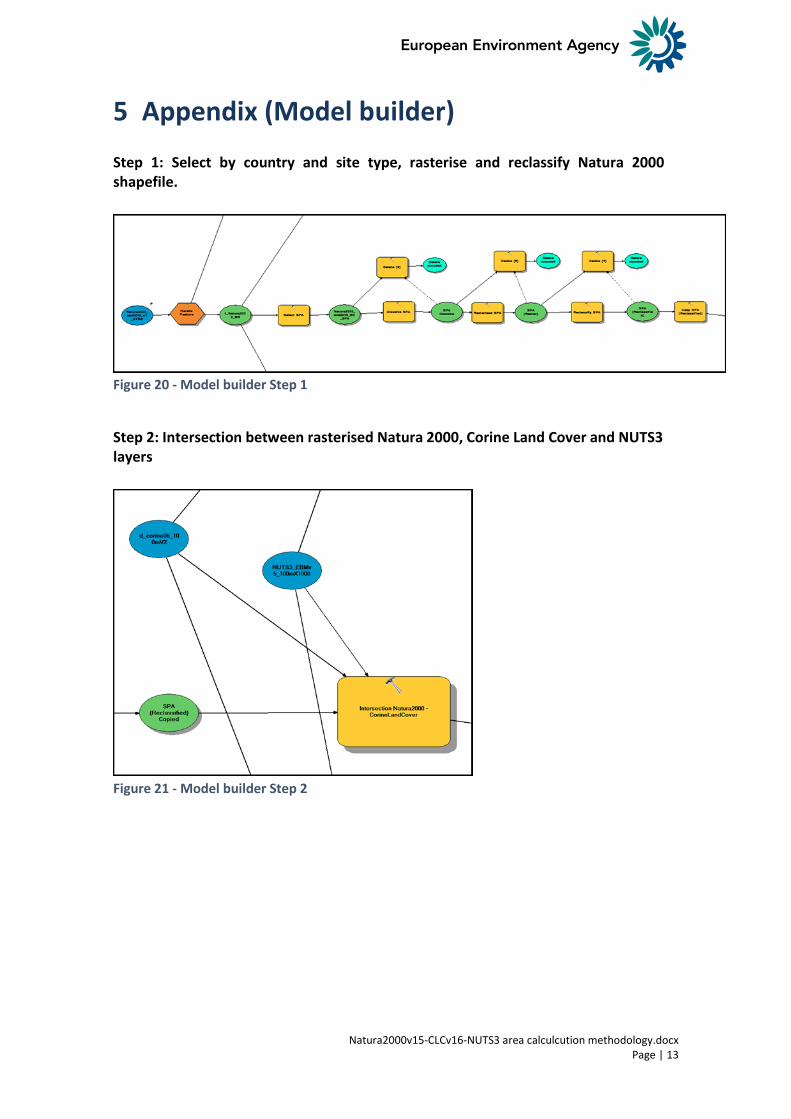
Step 1: Select by country and site type, rasterise and reclassify Natura 2000 shapefile.
Figure 20 - Model builder Step 1
Step 2: Intersection between rasterised Natura 2000, Corine Land Cover and NUTS3 layers
Figure 21 - Model builder Step 2
Natura2000v15-CLCv16-NUTS3 area calculcution methodology.docx Page | 14
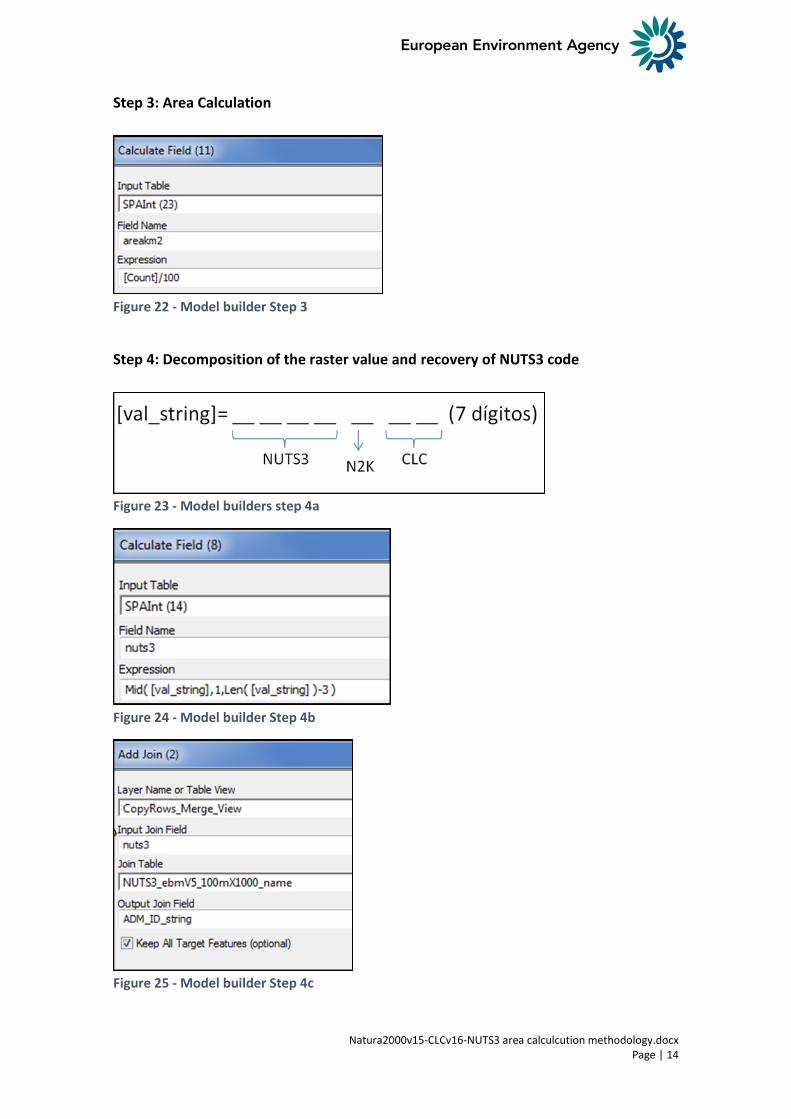
Step 3: Area Calculation
Figure 22 - Model builder Step 3
Step 4: Decomposition of the raster value and recovery of NUTS3 code
Figure 23 - Model builders step 4a
Figure 24 - Model builder Step 4b
Figure 25 - Model builder Step 4c


