Embed Size (px)
Citation preview
Z. Phys. B - Condensed Matter 71, 139-148 (1988) Condensed Zeitschrift Matter for Physik B
�9 Springer-Verlag 1988
Calibration and applications of polarized neutron thermometry at milli- and microkelvin temperatures
T.A. Jyrkki61 , , M.T. Huikn 1 , , K.N. Clausen 2, K. Siemensmeyer 3, , K. Kakurai 3, , and M. Steiner 3
1 Low Temperature Laboratory, Helsinki University of Technology, Espoo, Finland 2 Physics Department, Riso National Laboratory, Roskilde, Denmark 3 Hahn-Meitner-Institut, Berlin, Germany
Received November 30, 1987
We have utilized the polarized neutron scattering technique for the determination of the nuclear temperature in copper from 20 mK down to 100 gK. Using a cooling facility where two adiabatic demagnetization stages work in series we have calibrated the flipping ratio of neutrons scattered from the (200) Bragg-peak against the nuclear polarization over the whole polarization range. The observed calibration curve deviates considerably from the curve expected for an extinction-free sample. The polarized neutron thermometer is discussed and applied in measurements of the spin-lattice relaxation in copper.
1. Introduction
Several types of thermometers have been used in low temperature studies below 20 mK [1]. The most com- mon one extending to submillikelvin temperatures is the Pt-NMR thermometer. A major difficulty at these temperatures is to assure good thermal contact be- tween the sytem under study and the thermometer. In studies of nuclear magnetism another problem ap- pears: a large temperature difference can appear be- tween the nuclei and the lattice. Depending on the strength of the coupling between them, the time scales for reaching thermal equilibrium can be very long. It is then of great importance to determine directly the nuclear temperature T,.
The principles of all magnetic thermometers are based on the relation between the nuclear polariza- tion and the temperature. In the paramagnetic regime this is given by the Brillouin function. Thermometers based on this principle can be considered primary. D c and a c susceptibility measurements and NMR- techniques are most frequently used. They measure the susceptibility of the nuclear spins, which obeys the Curie-Weiss law down to the microkelvin range.
* Present address: Physics Department, Riso National Laboratory, DK-4000 Roskilde, Denmark
Recently, a new technique for measuring nuclear tem- peratures by determining the nuclear polarization by neutron scattering techniques has been used [2, 3].
Neutrons probe the nuclear polarization via the spin-dependent part of the scattering length which is due to the strong interaction between the neutron and the nucleus. For many nuclei the spin-dependent part is comparable to the spin-independent part of the scattering length E4]. Therefore, the thermal neu- tron scattering cross section is strongly affected by the size of the nuclear polarization and the relative orientation between the neutron and the nuclear spin. A measurement of Bragg-intensities thus give direct information on the nuclear polarization of the sample. The strength of the magnetic interactions between the magnetic moments of the nuclei and the neutrons is six orders of magnitude smaller than that of the nucle- ar interactions. In neutron scattering experiments, the environment producing electrical and mechanical no- ise, is far from ideal for the high sensitive susceptom- eters. Furthermore the resonance condition usually restricts the NMR technique to certain magnetic fields. For neutrons this restriction does not exist and this technique can also be applied at very high fields. Due to other difficulties such as a small skin-depth of the NMR excitations in metallic single crystals the neutron technique often remains the only practical
140
way to determine the nuclear temperature in neutron diffraction experiments at low temperatures.
So far neutron techniques have been used for nu- clear temperature measurements only in a few cases. Passel and Schermer [5] determined the nuclear sus- ceptibility in 3He layers by measuring the spin depen- dent absorption of polarized neutrons in their target. Neutron diffraction techniques were first used by Steiner et al. [2] to determine the spin-temperature of Co-nuclei, aligned in the hyperfine field of CoF2. The same group used polarized neutron diffraction to determine the nuclear temperature in HoVO4, where both the Ho and V nuclei were polarized in a high magnetic field at temperatures around 15 mK [6, 7]. Benoit et al. [3] used polarized neutron ther- mometry in connection with their neutron diffraction studies on solid 3He. They measured the nuclear tem- perature in a Cu crystal attached to their experimen- tal 3He cell in order to determine the container tem- perature.
For the use of the neutron thermometer it is cru- cial that the nuclear polarization is correctly obtained from the neutron scattering data. In principle this technique is self calibrating and temperatures are ob- tained directly from measured integrated intensities of a Bragg-reflection. In practice the situation is more complicated. In single crystals, in general, the neutron beam is attenuated due to scattering when passing through the sample. This effect is called extinction and must be taken into account when establishing the relation between the scattered intensities and the nuclear temperature.
In this paper we study the problem of establishing this relation between the scattered intensities and the nuclear temperature. Benoit et al. [3] suggested the use of this method without calibration. We have cali- brated our thermometer in the entire polarization range, which turns out to be crucial because of extinc- tion. In particular, we discuss, what corrections for extinction are necessary to obtain reliable calibration for our copper crystal and show how the calibration is carried out in this case. In the measurements we have used polarized neutrons to determine the nuclear temperature of copper in the range between 100 gK and 20 mK and applied the technique for spin lattice relaxation measurements at high fields.
Calibration throughout the entire polarization range is possible because of the flexibility of our ex- perimental setup. The main feature of our device is that we use two magnets, where one magnet deter- mines the lattice temperature of the whole two stage nuclear cooling system and the other magnet pro- duces the field at the sample. Since the two fields can be varied independently, we are able to cover large ranges of temperature and magnetic field. The
sample field can always be adjusted in such a way that the best sensitivity is obtained for the tempera- tures of interest.
2. Experimental techniques
a) Principles
In the absence of any electronic moment, the neutron nucleus scattering length a consists of two terms [8, 9],
a = b o + b I . s (1)
where b0 is the spin-independent part and bI .s the spin-dependent part of the scattering length. I is the nuclear and s the neutron spin. The two constants b 0 and b can, in case of a single isotope, be written as
bo = ( ( I + 1) b + + I b - ) / ( 2 i + 1) (2)
and
b=2(b + - b - ) / ( 2 I + l) (3)
where b + and b- are the scattering lengths for the interacting system of a nucleus and a neutron in total spin states I + �89 and I - �89 respectively. In case of more than one isotope, as in natural copper consisting of two isotopes, the generalization of (2) and (3) is straightforward. The average value weighted accord- ing to the relative abundance of the isotopes is then used for bo and b.
The scattered intensity Is from a Bragg reflection is proportional to the square of the structure factor, i.e. I,,,~[F(P)[ 2. In case of copper which has a face centered cubic lattice with four atoms per unit cell, we can write for all allowed Bragg reflections.
IF_+ (P)I 2 = 16 (b 2 +_ bo b l p P + (I2/4) b 2 p2) (4)
where P is the nuclear and p the beam polarization. The flipping ratio FR, i.e. the ratio between the
intensity of scattered neutrons in the two spin states, is
FR (P) - IF+ (P)I 2 b 2 + bo bI pP + (I2/4) b 2 p2 ~ _ ~ ] ~ b g - b o b l p P + ( I 2 / 4 ) b 2P2"
(5)
This equation gives the relationship between the nu- clear polarization and the flipping ratio, a quantity which is less sensitive to experimental errors than the measurement of absolute intensities. Equation (5) is, however, valid only for an extinction-free sample. In real crystals corrections due to extinction must be
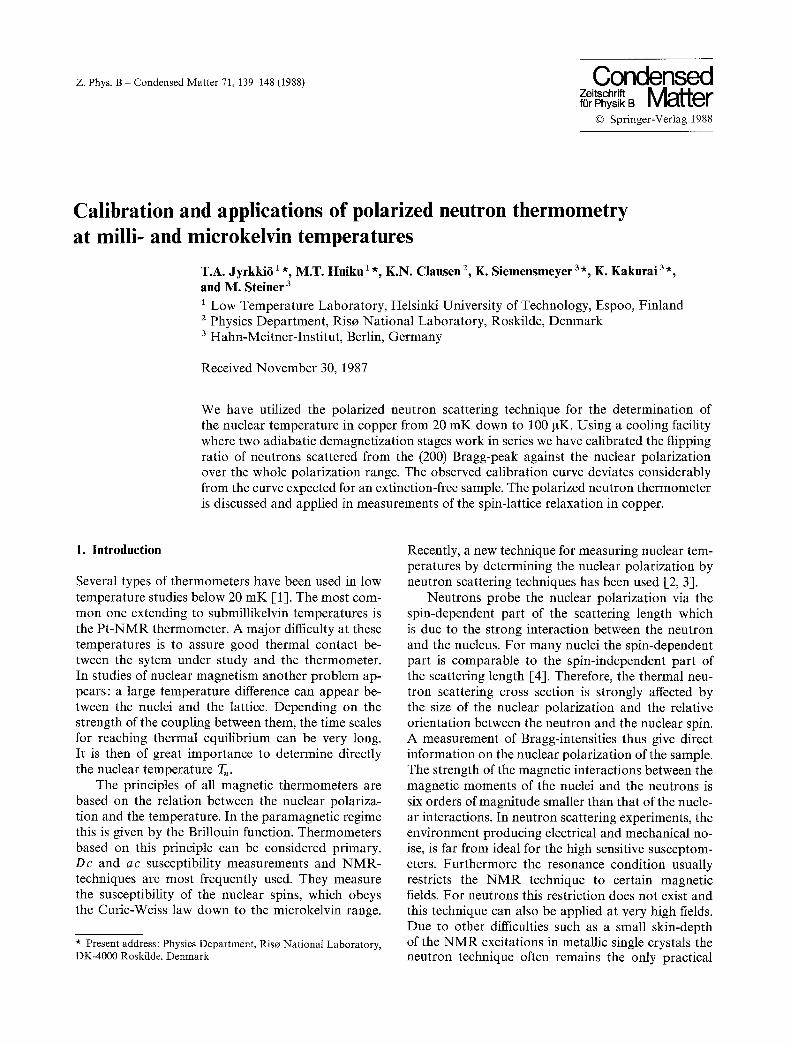
~__ Mixing chamber of the dilution refrigerator
Superconducting heat switch
Nuclear cooling stage
- - - 8T - solenoid
Liquid 4He bath
Thermal link Asymmetric split pair magnet Beam path Sample
fa- metal tail section of the inner vacuum can
Uquid N 2- shield Dewar outer wall
Fig. 1. Schematic drawing of the lower section of the cryostat show- ing the nuclear stages and the magnets around them
taken into account. The scattered intensity Is then increases slower than ]F+(P)I 2 and causes a decrease in the observed flipping ratios relative to those calcu- lated by (5). The magnitude of the extinction correc- tion depends on the wavelength and the crystal quali- ty. The effect of extinction in our experiments and the calibration procedure will be described in Chap. 3.
In the paramagnetic regime the nuclear polariza- tion P is related to the nuclear temperature T~ via the Brillouin function, Bt :
P = BI (Yn h lB /k 7".) (6)
where 7. is the gyromagnetic ratio of the nucleus and B is the applied external field. By using (5) and (6) the directly measurable quantity FR is related to the nuclear temperature T..
b) Cryogenics
Our measurements were carried out in a two-stage nuclear demagnetization cryostat, expecially designed for neutron diffraction experiments. The operating principles of this cooling facility are the same as for the similar apparatus in Helsinki [10]. The nuclear stages and their surroundings are schematically illus- trated in Fig. 1. The system consists of a commercial high power dilution refrigerator and two copper nu- clear stages, the cooling stage (first stage) and the sample itself (second stage), working in series.
The large (2.5 kg) nuclear cooling stage was made of bulk copper with slots, to reduce eddy-current
141
heating, and it is connected to the mixing chamber via a superconducting heat switch. The sample, in turn, is connected to the first nuclear stage by a cop- per link, welded to its bottom end. Good thermal contact between the two nuclear stages is thereby achieved. The most important feature of our setup is the possibility of adjusting the fields in the two magnets separately. The field of the first stage deter- mines the equilibrium temperature of the whole two- stage system, whereas the sample magnet can be ad- justed to a field most suitable for the experiment on hand. This magnet is a compensated split pair, able to produce up to 4.6 T at the sample position. The field is asymmetric in such a way that there are no field free volumes in the split region, thus enabling a polarized beam to get through.
The #-metal tail section of the inner vacuum can must be fully magnetized, otherwise depolarization of the beam will result. This condition is fulfilled only when B > 0.4 T. Below this field the polarization de- creases but can still be maintained above 90% down to 0.2 T. For still lower fields the beam polarization decreases rapidly. The purpose of the #-metal tube is to shield the sample against the remanent field of the split-coil when it is demagnetized to zero, the situ- ation realized in studies of nuclear ordering. Our sam- ple is a natural copper single crystal with dimensions 0.5 x 5 x 20 mm 3.
The experimental temperatures were obtained in the following way. First the nuclear stages, both in a high magnetic field, were pre-cooled by the dilution refrigerator to 11-20 mK. Then the thermal path, be- tween the dilution unit and the first nuclear cooling stage is interrupted by making the heat switch super- conducting. After this, the temperature needed was obtained by adiabatically demagnetizing the first nu- clear stage to a suitable field. For details about adia- batic nuclear demagnetization see [11]. The magnetic field on the sample (and thereby P) could be adjusted at any stage of the experiment without changing the temperature of the first stage since the specific heat of the very small Cu specimen in most practical cases is negligible, compared to that of the large first stage.
c) Neutron diffraction setup
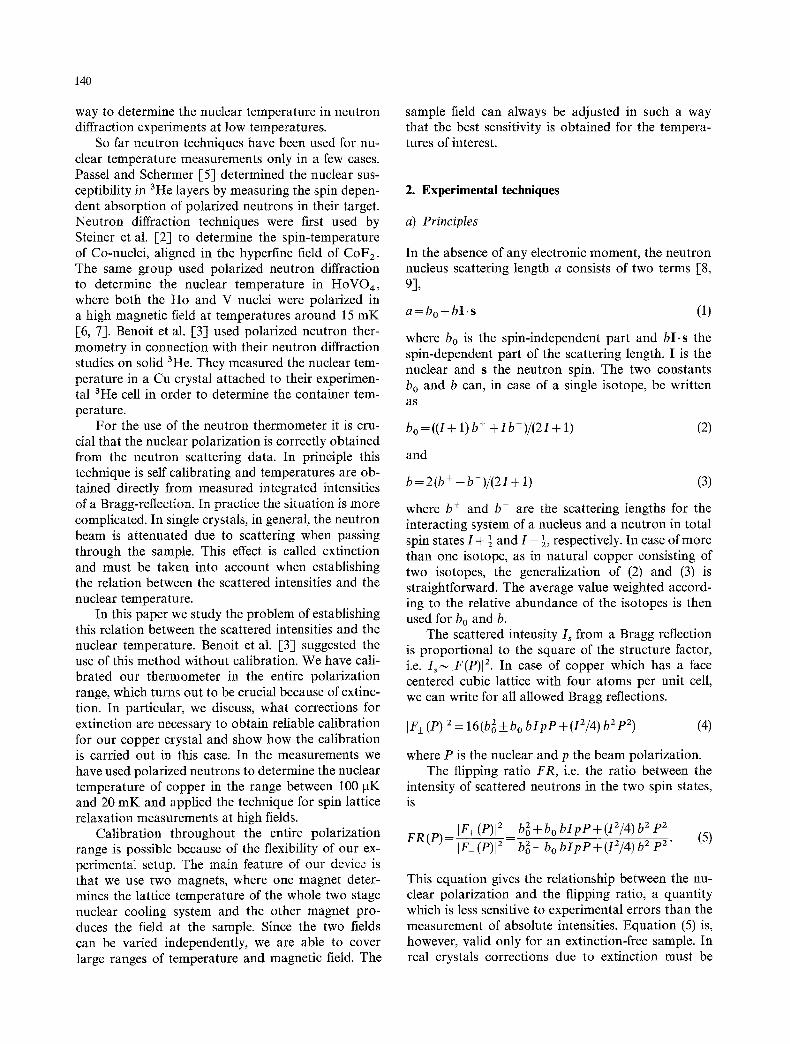
The neutron diffractometer is located at a cold beam in the neutron guide hall adjacent to the DR 3 steady state reactor at Riso. The set up is shown in Fig. 2. A similar setup has been used in the Hahn-Meitner Institute to study nuclear magnetism in HoVO 4. Us- ing a pyrolytic graphite monochromator, a wave- length in the range from 2 to 5 ~, is available. The monochromator is vertically bent, the incident beam
142
3. Calibration
NEUTRON GUIDE
-VERTICALLY FOCUSED GRAPNITEMONOCROMATOR
POLARIZER
~TECTOR
COPPER SAMPLE IN- AN ASYMMETRIC SPLIT-PAIR MAGNET
GUIDE
MAGNETIZED CogzFe o8 ~,-~,, , ,~'~ DETECTOR ANALYZER CRYSTAL ~
~"BEAM STOP
Fig. 2. The neutron diffraction setup
is thus focused on the sample. At 2.4 ~ the unpolar- ized flux at the sample is approximately 8. l0 s neu- trons cm -2 s -z, deduced from gold foil activation measurements at the sample position. The curvature of the neutron guide ensures a negligible fast neutron contamination of the beam. The beam is polarized after the monochromator by a supermirror-system. The polarization is approximately 95% and the trans- mission ~ 10%. The polarizer and the neutron guide reduces the second order contamination of the beam to less than 1% at a wavelength of 2.4 ,~. Permanent magnets are used to magnetize the vertical guide- fields before and after the cryostat.
The dc-flipper, located in the guide-field in front of the cryostat is shielded against stray fields from the two magnets. The measured efficiency of the flip- per is better than 99%. The beam polarization is mon- itored by an analyzer system in the through going beam behind the cryostat; it measures the flipping- ratio of the (200) reflection from a magnetically satu- rated Co92Feo8 crystal.
Measurements are made by first counting with flipper currents set to zero (flipper off) and then re- peating with the flipped beam (flipper on). The ratio of the peak counts from the copper (200) reflection, corrected for background, is then calculated. Simulta- neously, the flipping ratio, at the analyzer crystal is measured to monitor the beam polarization. For the analyzer the background was corrected separately for both spin directions whereas for the (200) Bragg re- flection the background was very small and the same correction applied for both eases.
As pointed out in the previous section the neutron thermometer must be calibrated over the entire polar- ization range. We used a 6~ nuclear orientation thermometer between 2 and 30 mK. To obtain high polarization in this temperature range, a field of 4 T was applied at the sample.
The cobalt single crystal having a v-activity of 0.35 ~tCi, was soft soldered to a 2 mm thick copper plate, which was connected to a 10 cm long copper rod screwed onto the first nuclear stage. The tempera- ture indicated by the 6~ thermometer followed tem- perature changes in the first nuclear stage with a time constant of about 10 rain. The intensity of the V rays radiated along the c-axis of the crystal was detected by a high resolution Ge-detector.
Two adjustments were made to the ideal equation for the anisotropic emission of v-rays from the Co crystal [12]. We first corrected for the aperture of the detector. Secondly, we observed that the smallest signal, seen at temperatures well below 1 inK, was still about 8% of the maximum; We corrected for it by assuming a polarization of 98.5% in the crystal, instead of the ideal 100%. The loss of polarization can be explained by small misalignments of magnetic domains at the sharp edges of our Co crystal. This effect is explained in [12]. We counted typically 10 min for each point and an accuracy of ___ 3% was obtained in 30 rain for temperatures between 3 and 15 mK. Below and above this range longer measuring times were needed for similar precision. A small de- crease in the accuracy at the lowest temperatures is caused by the difficulty of orienting the detector abso- lutely parallel to the c-axis of the Co-crystal.
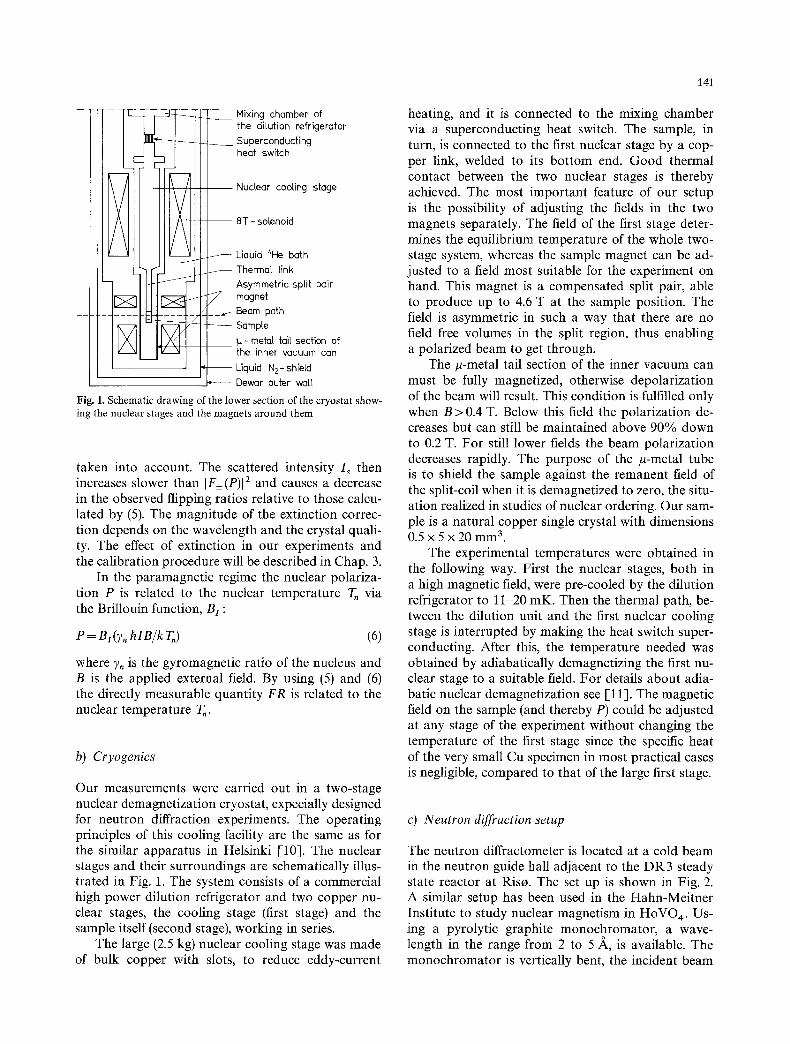
The first calibration was performed using our nor- mal measuring wavelength of 2.4 A. The experimental data are shown in Fig. 3, by open symbols. The mea- sured value for the beam polarization was p=0.94_+0.02. Typically we counted at each point for about 1 h after reaching thermal equilibrium. This corresponds to 6 points for the Co thermometer and to about 10 points each 6 min for the neutron ther- mometer. The neutron intensity was around 1000 c/s and the error bars on FR for the circles are based on the counting statistics. For P the error bars are less than the size of the symbols unless otherwise indi- cated. In 4 T field 3 mK corresponds to about 50% nuclear polarization. For lower temperatures the sen- sitivity of the Co thermometer disappears and the temperatures were determined by extrapolating the warm-up curve to these low temperatures after having first cooled the system below 1 mK. The warm-up curve is, under a constant heat leak, almost a linear function of 1/T, for several hours, thus enabling us
B/Tn [T/K)
0 400 1000 2000 4000
' ' ' ' I i ' ' ~ A 1.30
1.25
/ * J -
r .+-- 1.oo *
5 I I I I 1 I I I I
0.0 0.2 0.4 0.6 0.8 1.0 NUCLEAR POLARIZATION P
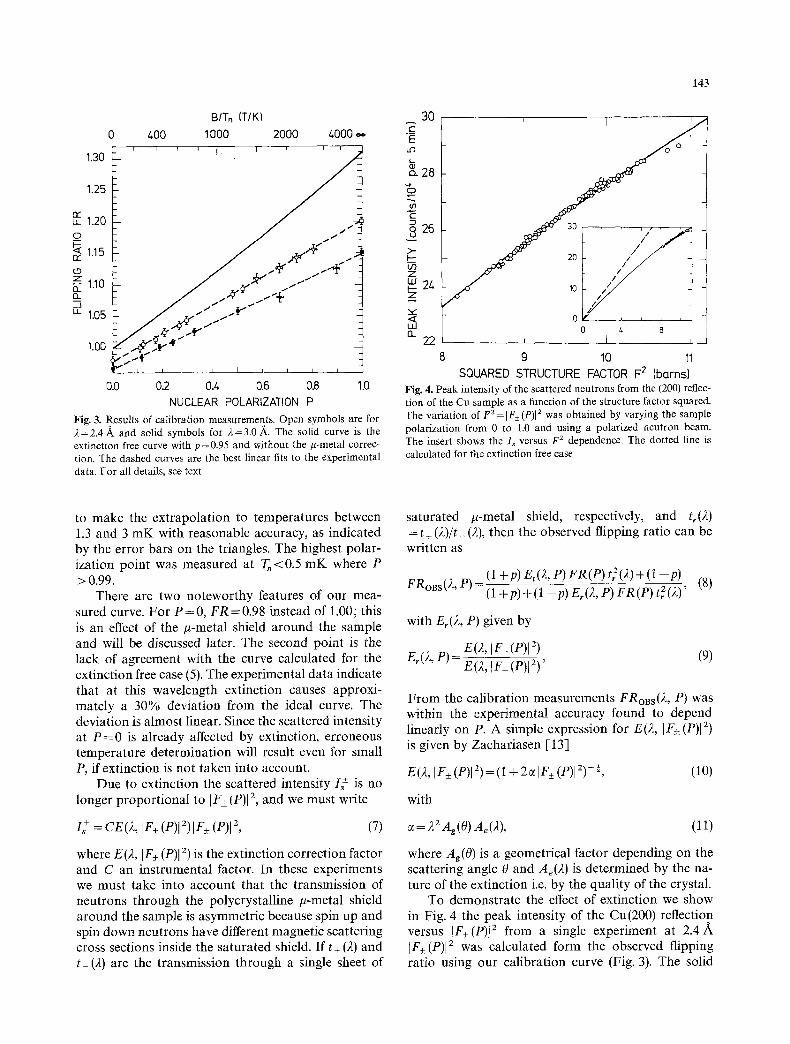
Fig. 3. Results of calibration measurements. Open symbols are for 2=2.4 A and solid symbols for 2=3.0 .~. The solid curve is the extinction free curve with p=0.95 and without the ~-metal correc- tion. The dashed curves are the best linear fits to the experimental data. For all details, see text
1.20 o
1.15
1.10
1.05
143
30 A C
E t . O
(,q -e g t O
>.. I.--
z LtJ I-- z ,r
Lid n
28
26
24
22
' I '
o O
f i / ; / f t /5/ / ,0
0 1 r ~ , r , ,
o 4 8 i I i
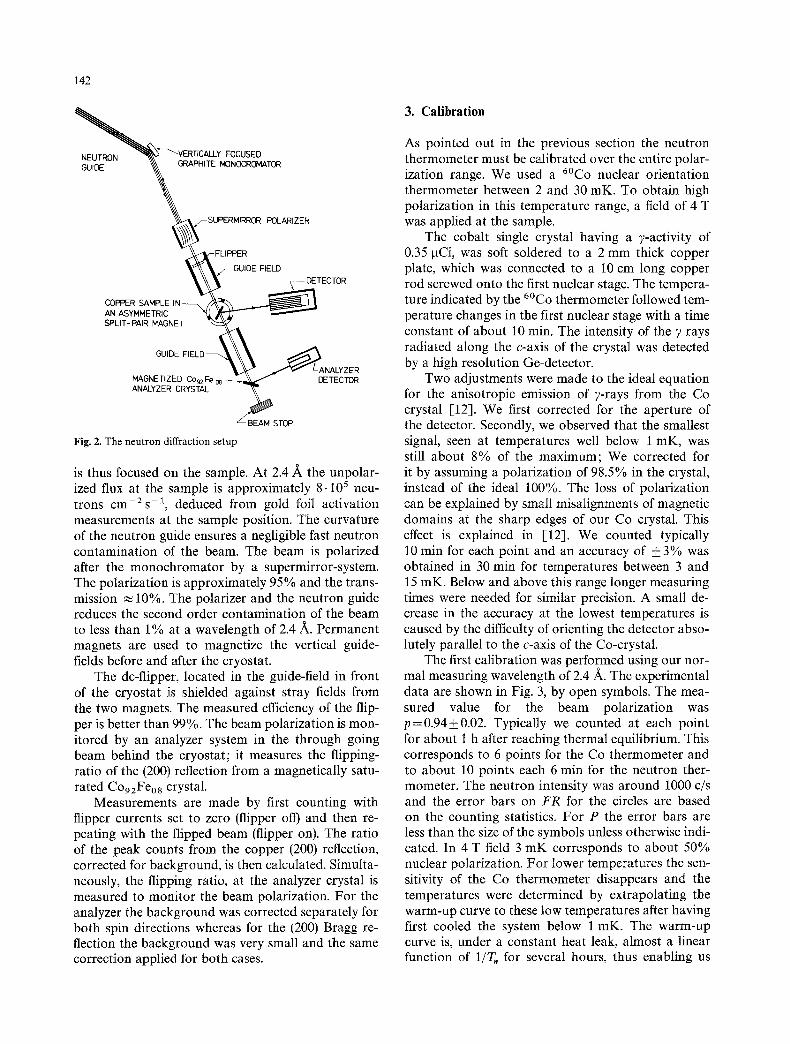
8 9 10 11 SQUARED STRUCTURE FACTOR F 2 (barns)
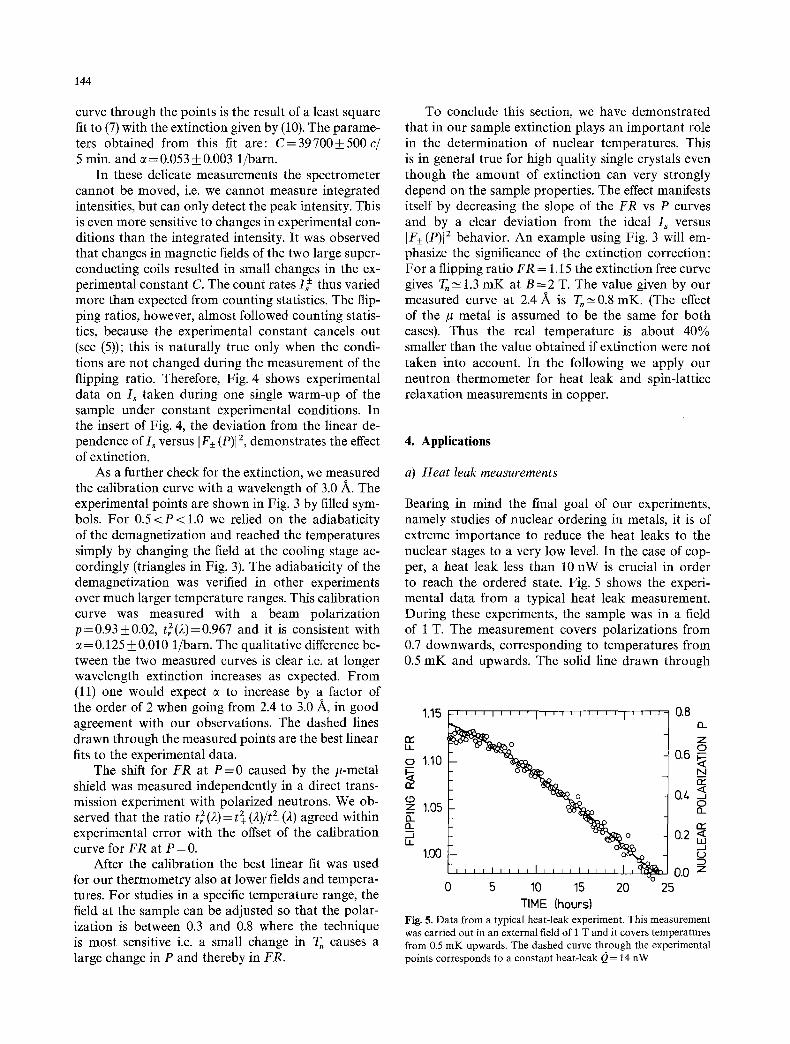
Fig. 4. Peak intensity of the scattered neutrons from the (200) reflec- tion of the Cu sample as a flmction of the structure factor squared. The variation of F 2= [F• (p)12 was obtained by varying the sample polarization from 0 to 1.0 and using a polarized neutron beam. The insert shows the Is versus F z dependence. The dotted line is calculated for the extinction free case
to make the extrapolation to temperatures between 1.3 and 3 m K with reasonable accuracy, as indicated by the error bars on the triangles. The highest polar- ization point was measured at T~<0.5 m K where P > 0.99.
There are two noteworthy features of our mea- sured curve. For P = 0 , FR=0.98 instead of 1.00; this is an effect of the #-metal shield around the sample and will be discussed later. The second point is the lack of agreement with the curve calculated for the extinction free case (5). The experimental data indicate that at this wavelength extinction causes approxi- mately a 30% deviation from the ideal curve. The deviation is almost linear. Since the scattered intensity at P = 0 is already affected by extinction, erroneous temperature determination will result even for small P, if extinction is not taken into account.
Due to extinction the scattered intensity I f is no longer proport ional to IF_+ (P)[ 2, and we must write
I + = CE (2, IF+_ (P)I Z) IF_+ (P)I z, (7)
where E(2, IF+ (P)I z) is the extinction correction factor and C an instrumental factor. In these experiments we must take into account that the transmission of neutrons through the polycrystalline #-metal shield around the sample is asymmetric because spin up and spin down neutrons have different magnetic scattering cross sections inside the saturated shield. If t+ (2) and t_ (2) are the transmission through a single sheet of
saturated #-metal shield, respectively, and tr(2) = t + (2)/t_ (2), then the observed flipping ratio can be written as
(1 +p) Et(2, P) FR(P) t2(2) + (1 --p) FRoBs ()., P) - _ _
(1 + p)+(1 --p) E, (2, P) FR (P) t 2 (2)'
with Er(2, P) given by
(s)
E(2, IF+ (P)[ 2) E~(2, P ) - E(Z, IF-(P)I2) ' (9)
F rom the calibration measurements FRoBs(2, P) was within the experimental accuracy found to depend linearly on P. A simple expression for E(2, IF+ (p)[2) is given by Zachariasen [13]
E() , , IF+ (P)J2) = ( i + 2 g iF+ (P)I2) -~, (10)
with
= 22 Ag(O) Ae (2), (11)
where A~(O) is a geometrical factor depending on the scattering angle 0 and Ae(2) is determined by the na- ture of the extinction i.e. by the quality of the crystal.
To demonstrate the effect of extinction we show in Fig. 4 the peak intensity of the Cu(200) reflection versus ]F+(P)I 2 from a single experiment at 2 .4A [F+(P)I z was calculated form the observed flipping ratio using our calibration curve (Fig. 3). The solid
144
curve through the points is the result of a least square fit to (7) with the extinction given by (10). The parame- ters obtained from this fit are: C = 39 700_+ 500 c~ 5 min. and c~ = 0.053_ 0.003 1/barn.
In these delicate measurements the spectrometer cannot be moved, i.e. we cannot measure integrated intensities, but can only detect the peak intensity. This is even more sensitive to changes in experimental con- ditions than the integrated intensity. It was observed that changes in magnetic fields of the two large super- conducting coils resulted in small changes in the ex- perimental constant C. The count rates I f thus varied more than expected from counting statistics. The flip- ping ratios, however, almost followed counting statis- tics, because the experimental constant cancels out (see (5)); this is naturally true only when the condi- tions are not changed during the measurement of the flipping ratio. Therefore, Fig. 4 shows experimental data on I~ taken during one single warm-up of the sample under constant experimental conditions. In the insert of Fig. 4, the deviation from the linear de- pendence of Is versus IF_+ (P)] 2, demonstrates the effect of extinction.
As a further check for the extinction, we measured the calibration curve with a wavelength of 3.0 ~. The experimental points are shown in Fig. 3 by filled sym- bols. For 0 . 5 < P < l . 0 we relied on the adiabaticity of the demagnetization and reached the temperatures simply by changing the field at the cooling stage ac- cordingly (triangles in Fig. 3). The adiabaticity of the demagnetization was verified in other experiments over much larger temperature ranges. This calibration curve was measured with a beam polarization p=0.93__0.02, t~z(2)=0.967 and it is consistent with
--0.125 __ 0.010 1/barn. The qualitative difference be- tween the two measured curves is clear i.e. at longer wavelength extinction increases as expected. From (11) one would expect c~ to increase by a factor of the order of 2 when going from 2.4 to 3.0 ~, in good agreement with our observations. The dashed lines drawn through the measured points are the best linear fits to the experimental data.
The shift for F R at P - - 0 caused by the #-metal shield was measured independently in a direct trans- mission experiment with polarized neutrons. We ob- served that the ratio t~z (2)= tz+ (2)/t 2_ (2) agreed within experimental error with the offset of the calibration curve for F R at P = 0.
After the calibration the best linear fit was used for our thermometry also at lower fields and tempera- tures. For studies in a specific temperature range, the field at the sample can be adjusted so that the polar- ization is between 0.3 and 0.8 where the technique is most sensitive i.e. a small change in T, causes a large change in P and thereby in FR.
To conclude this section, we have demonstrated that in our sample extinction plays an important role in the determination of nuclear temperatures. This is in general true for high quality single crystals even though the amount of extinction can very strongly depend on the sample properties. The effect manifests itself by decreasing the slope of the F R vs P curves and by a clear deviation from the ideal I~ versus IF+_ (p)[2 behavior. An example using Fig. 3 will em- phasize the significance of the extinction correction: For a flipping ratio F R = 1.15 the extinction free curve gives To ~- 1.3 mK at B = 2 T. The value given by our measured curve at 2.4 A is TO-~0.8 inK. (The effect of the # metal is assumed to be the same for both cases). Thus the real temperature is about 40% smaller than the value obtained if extinction were not taken into account. In the following we apply our neutron thermometer for heat leak and spin-lattice relaxation measurements in copper.
4. Appl icat ions
a) Heat leak measurements
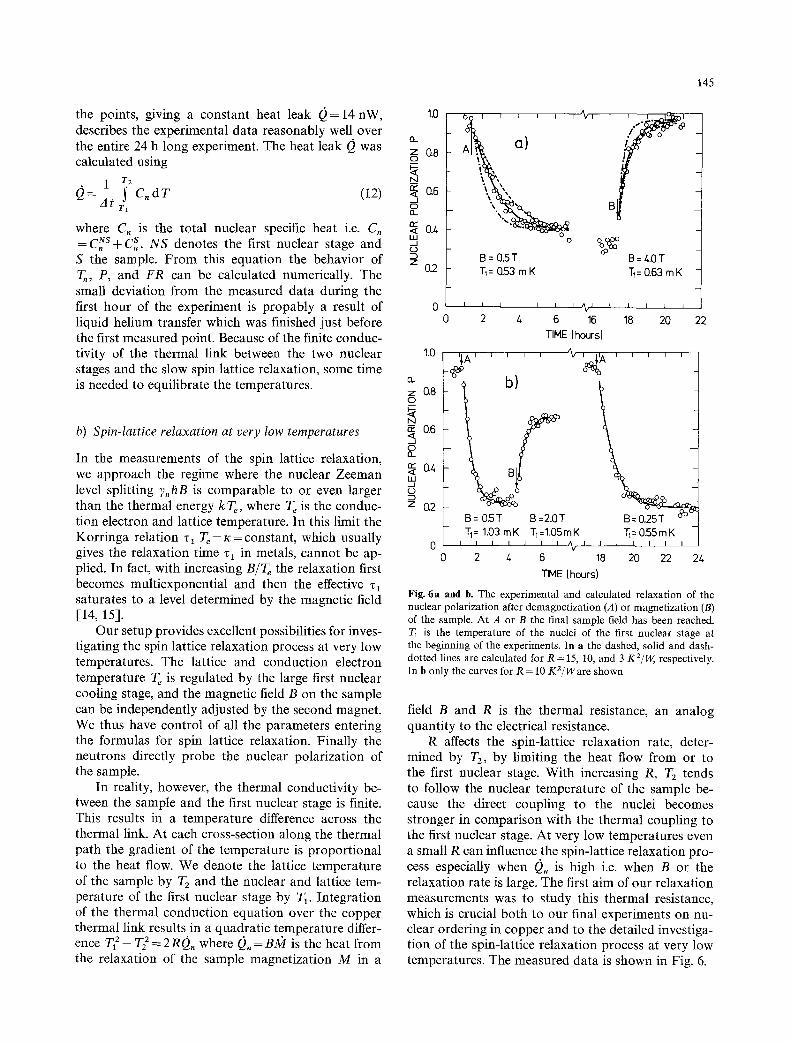
Bearing in mind the final goal of our experiments, namely studies of nuclear ordering in metals, it is of extreme importance to reduce the heat leaks to the nuclear stages to a very low level. In the case of cop- per, a heat leak less than 10 nW is crucial in order to reach the ordered state. Fig. 5 shows the experi- mental data from a typical heat leak measurement. During these experiments, the sample was in a field of 1 T. The measurement covers polarizations from 0.7 downwards, corresponding to temperatures from 0.5 m K and upwards. The solid line drawn through
1.15
LL
o 1.10
1 . 0 s o_ o_ . d LL
1.00
_ l i l i l I I l I i I i I i 1 ; I I I I l l ,
_- ~ ~
- O O
0 5 10 15 20 TIME (hours)
, 0.8 12-
Z O
0.6 ,~ N K- <, o 13_
0.2 .._1
0.0 z 25
Fig. 5. Data from a typical heat-leak experiment. This measurement was carried out in an external field of 1 T and it covers temperatures from 0.5 mK upwards. The dashed curve through the experimental points corresponds to a constant heat-leak Q = 14 nW
145
the points, giving a constant heat leak 0 = 14 nW, describes the experimental data reasonably well over the entire 24 h long experiment. The heat leak (~ was calculated using
1 T2
C. dT (12 ) 0=57T, where C, is the total nuclear specific heat i.e. C,
NS S = C, + C,. NS denotes the first nuclear stage and S the sample. From this equation the behavior of T,, P, and FR can be calculated numerically. The small deviation from the measured data during the first hour of the experiment is propably a result of liquid helium transfer which was finished just before the first measured point. Because of the finite conduc- tivity of the thermal link between the two nuclear stages and the slow spin lattice relaxation, some time is needed to equilibrate the temperatures.
b) Spin-lattice relaxation at very low temperatures
In the measurements of the spin lattice relaxation, we approach the regime where the nuclear Zeeman level splitting 7,hB is comparable to or even larger than the thermal energy k Te, where T e is the conduc- tion electron and lattice temperature. In this limit the Korringa relation zl T~= ~c=constant, which usually gives the relaxation time zl in metals, cannot be ap- plied. In fact, with increasing B/T~ the relaxation first becomes multiexponential and then the effective z~ saturates to a level determined by the magnetic field [14, 15].
Our setup provides excellent possibilities for inves- tigating the spin lattice relaxation process at very low temperatures. The lattice and conduction electron temperature Te is regulated by the large first nuclear cooling stage, and the magnetic field B on the sample can be independently adjusted by the second magnet. We thus have control of all the parameters entering the formulas for spin lattice relaxation. Finally the neutrons directly probe the nuclear polarization of the sample.
In reality, however, the thermal conductivity be- tween the sample and the first nuclear stage is finite. This results in a temperature difference across the thermal link. At each cross-section along the thermal path the gradient of the temperature is proportional to the heat flow. We denote the lattice temperature of the sample by T= and the nuclear and lattice tem- perature of the first nuclear stage by T~. Integration of the thermal conduction equation over the copper thermal link results in a quadratic temperature differ- ence T 2 -- T2 2 = 2 R(~. where 0 . = BA)/is the heat from the relaxation of the sample magnetization M in a
1.0
n
z a8
N
a6
13_
0.4 I.H ...1 t.D
Z 0.2
0 0
1.0
O.-
z 0.8 O
N E: 0.6 .< d 0
a4 lad d O
z &2
o, l :',,% ~. a2,, \~.. a B
o %oo
B= 0.5T B= 4.0T T~ = 053 rn K T~ = 0.63 m K
I I I I I I ~ . l I I I I I
2 4 6 16 18 20 22 TIME (hours]
. . . . . ~ , , ,,^ , , , , ,
= ,
TI= 0.55m K I I I I I I
18 20 22 24
'IA'
b)
B= 0.5T B =2.0T ]-1= 1.03 mK TI=I.05mK
I I I I I I I A v I
2 4 6
TIME (hours)
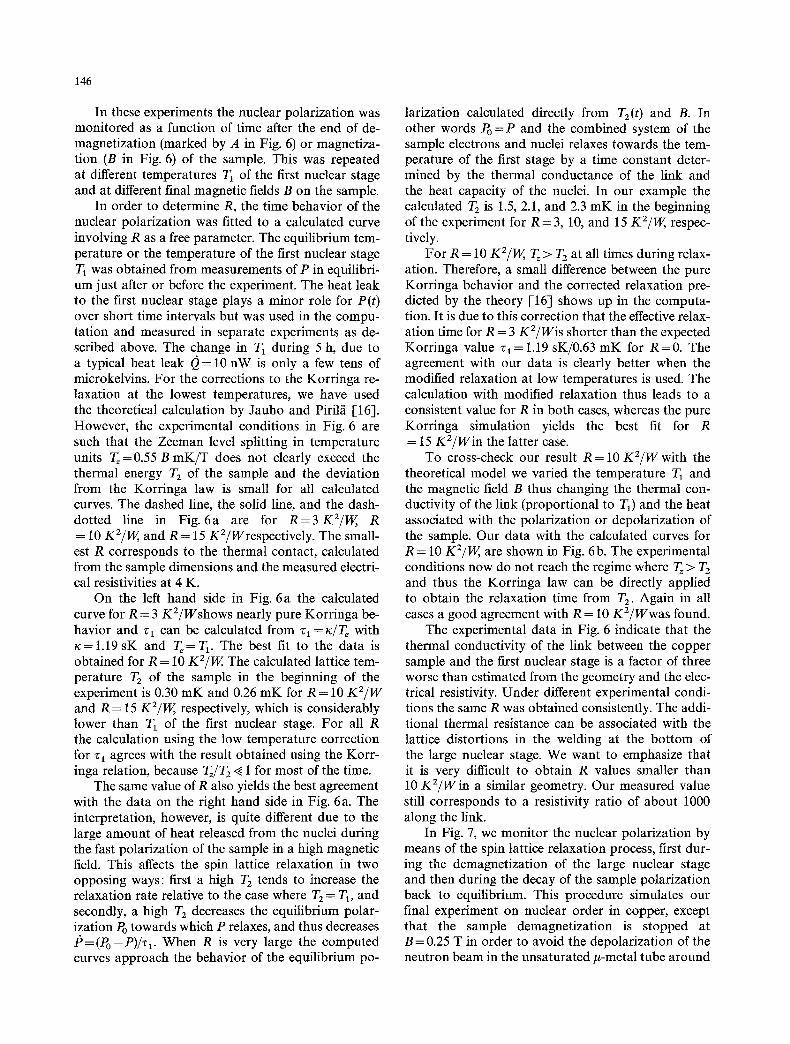
Fig. 6 a and b. The experimental and calculated relaxation of the nuclear polarization after demagnetization (A) or magnetizat ion (B) of the sample. At A or B the final sample field has been reached. T1 is the temperature of the nuclei of the first nuclear stage at the beginning of the experiments. In a the dashed, solid and dash- dotted lines are calculated for R = 15, 10, and 3 K2/W, respectively. In b only the curves for R = 10 K2/Ware shown
field B and R is the thermal resistance, an analog quantity to the electrical resistance.
R affects the spin-lattice relaxation rate, deter- mined by T2, by limiting the heat flow from or to the first nuclear stage. With increasing R, T2 tends to follow the nuclear temperature of the sample be- cause the direct coupling to the nuclei becomes stronger in comparison with the thermal coupling to the first nuclear stage. At very low temperatures even a small R can influence the spin-lattice relaxation pro- cess especially when 0 , is high i.e. when B or the relaxation rate is large. The first aim of our relaxation measurements was to study this thermal resistance, which is crucial both to our final experiments on nu- clear ordering in copper and to the detailed investiga- tion of the spin-lattice relaxation process at very low temperatures. The measured data is shown in Fig. 6.
146
In these experiments the nuclear polarization was monitored as a function of time after the end of de- magnetization (marked by A in Fig. 6) or magnetiza- tion (B in Fig. 6) of the sample. This was repeated at different temperatures T 1 of the first nuclear stage and at different final magnetic fields B on the sample.
In order to determine R, the time behavior of the nuclear polarization was fitted to a calculated curve involving R as a free parameter. The equilibrium tem- perature or the temperature of the first nuclear stage T~ was obtained from measurements of P in equilibri- um just after or before the experiment. The heat leak to the first nuclear stage plays a minor role for P(t) over short time intervals but was used in the compu- tation and measured in separate experiments as de- scribed above. The change in T1 during 5 h, due to a typical heat leak 0 = 10 nW is only a few tens of microkelvins. For the corrections to the Korringa re- laxation at the lowest temperatures, we have used the theoretical calculation by Jauho and Piril/i [16]. However, the experimental conditions in Fig. 6 are such that the Zeeman level splitting in temperature units Tz=0.55 B m K / T does not clearly exceed the thermal energy T 2 of the sample and the deviation from the Korringa law is small for all calculated curves. The dashed line, the solid line, and the dash- dotted line in Fig. 6a are for R=3K2/W, R = 10 Kz/w, and R = 15 KZ/Wrespectively. The small- est R corresponds to the thermal contact, calculated from the sample dimensions and the measured electri- cal resistivities at 4 K.
On the left hand side in Fig. 6a the calculated curve for R = 3 KZ/Wshows nearly pure Korringa be- havior and zl can be calculated from zl = ~/T~ with ~c=1.19 sK and Te= T~. The best fit to the data is obtained for R = 10 KE/W. The calculated lattice tem- perature T2 of the sample in the beginning of the experiment is 0.30 mK and 0.26 mK for R = 10 Kz/w and R = 15 Kz/w, respectively, which is considerably lower than 7"1 of the first nuclear stage. For all R the calculation using the low temperature correction for "q agrees with the result obtained using the Korr- inga relation, because TJT2 ~ 1 for most of the time.
The same value of R also yields the best agreement with the data on the right hand side in Fig. 6a. The interpretation, however, is quite different due to the large amount of heat released from the nuclei during the fast polarization of the sample in a high magnetic field. This affects the spin lattice relaxation in two opposing ways: first a high T 2 tends to increase the relaxation rate relative to the case where Tz = T1, and secondly, a high T2 decreases the equilibrium polar- ization Po towards which P relaxes, and thus decreases J6=(V O-P)/ 'c 1. When R is very large the computed curves approach the behavior of the equilibrium po-
larization calculated directly from Tz(t ) and B. In other words Po = P and the combined system of the sample electrons and nuclei relaxes towards the tem- perature of the first stage by a time constant deter- mined by the thermal conductance of the link and the heat capacity of the nuclei. In our example the calculated T2 is 1.5, 2.1, and 2.3 m K in the beginning of the experiment for R = 3, 10, and 15 Kz/W, respec- tively.
For R = 10 Kz/w, Tz> T 2 at all times during relax- ation. Therefore, a small difference between the pure Korringa behavior and the corrected relaxation pre- dicted by the theory [-16] shows up in the computa- tion. It is due to this correction that the effective relax- ation time for R = 3 K2/Wis shorter than the expected Korringa value z l = 1.19 sK/0.63 mK for R = 0 . The agreement with our data is clearly better when the modified relaxation at low temperatures is used. The calculation with modified relaxation thus leads to a consistent value for R in both cases, whereas the pure Korringa simulation yields the best fit for R = 15 KZ/Win the latter case.
To cross-check our result R = 10 K2/W with the theoretical model we varied the temperature T1 and the magnetic field B thus changing the thermal con- ductivity of the link (proportional to T0 and the heat associated with the polarization or depolarization of the sample. Our data with the calculated curves for R = 10 K2/W, are shown in Fig. 6b. The experimental conditions now do not reach the regime where T~ > T2 and thus the Korringa law can be directly applied to obtain the relaxation time from T2. Again in all cases a good agreement with R = 10 KZ/Wwas found.
The experimental data in Fig. 6 indicate that the thermal conductivity of the link between the copper sample and the first nuclear stage is a factor of three worse than estimated from the geometry and the elec- trical resistivity. Under different experimental condi- tions the same R was obtained consistently. The addi- tional thermal resistance can be associated with the lattice distortions in the welding at the bot tom of the large nuclear stage. We want to emphasize that it is very difficult to obtain R values smaller than 10 K2/W in a similar geometry. Our measured value still corresponds to a resistivity ratio of about 1000 along the link.
In Fig. 7, we monitor the nuclear polarization by means of the spin lattice relaxation process, first dur- ing the demagnetization of the large nuclear stage and then during the decay of the sample polarization back to equilibrium. This procedure simulates our final experiment on nuclear order in copper, except that the sample demagnetization is stopped at B = 0.25 T in order to avoid the depolarization of the neutron beam in the unsaturated #-metal tube around
147
O O 1.0
a_ 0.9 ~ "\.
o z 0.8 oo D o ~ " ' \ . / 0 , 2 = O2 nW ,~ 0.7 o ~ "~&o < . N o o C ~ , o ~ , ~ 0.6 ~' ~ o \ .
o 0.5 /
LU Q2 = 0.9 nW ~ o ' ~ d 0.3 ,O
o o z 0.2
0 . 1 I J q I ~ I I ~ I ~ I I I I I J I I [ i i i r I i i i i
0 5 10 15 20 25 30 TIME (hours)
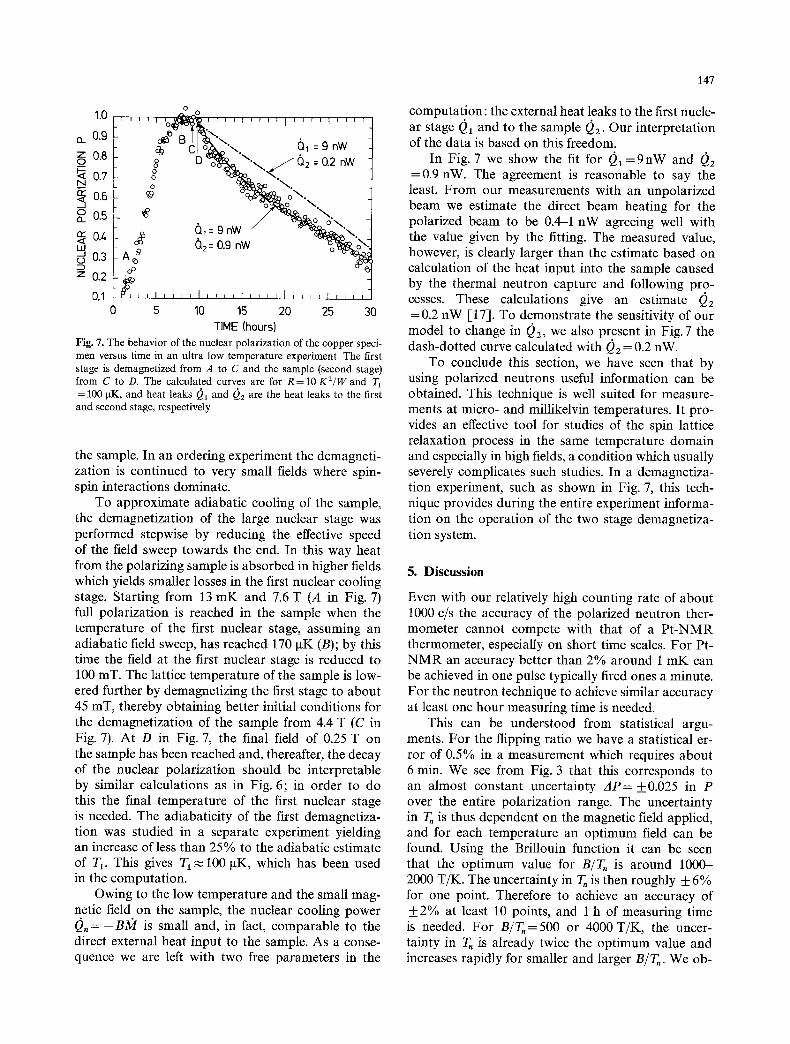
Fig. 7. The behavior of the nuclear polarization of the copper speci- men versus time in an ultra low temperature experiment. The first stage is demagnetized from A to C and the sample (second stage) from C to D. The calculated curves are for R= 10 K2/W and TI = 100 pK, and heat leaks Q1 and Q2 are the heat leaks to the first and second stage, respectively
the sample. In an ordering experiment the demagneti- zation is continued to very small fields where spin- spin interactions dominate.
To approximate adiabatic cooling of the sample, the demagnetization of the large nuclear stage was performed stepwise by reducing the effective speed of the field sweep towards the end. In this way heat from the polarizing sample is absorbed in higher fields which yields smaller losses in the first nuclear cooling stage. Starting from 13 mK and 7.6 T (A in Fig. 7) full polarization is reached in the sample when the temperature of the first nuclear stage, assuming an adiabatic field sweep, has reached 170 pK (B); by this time the field at the first nuclear stage is reduced to 100 mT. The lattice temperature of the sample is low- ered further by demagnetizing the first stage to about 45 mT, thereby obtaining better initial conditions for the demagnetization of the sample from 4.4 T (C in Fig. 7). At D in Fig. 7, the final field of 0.25 T on the sample has been reached and, thereafter, the decay of the nuclear polarization should be interpretable by similar calculations as in Fig. 6; in order to do this the final temperature of the first nuclear stage is needed. The adiabaticity of the first demagnetiza- tion was studied in a separate experiment yielding an increase of less than 25% to the adiabatic estimate of T1. This gives T1 ~ 100 pK, which has been used in the computation.
Owing to the low temperature and the small mag- netic field on the sample, the nuclear cooling power (~, = - B ) t ; / is small and, in fact, comparable to the direct external heat input to the sample. As a conse- quence we are left with two free parameters in the
computation: the external heat leaks to the first nucle- ar stage 01 and to the sample 02. Our interpretation of the data is based on this freedom.
In Fig. 7 we show the fit for 01 = 9 n W and (~2 =0.9 nW. The agreement is reasonable to say the least. From our measurements with an unpolarized beam we estimate the direct beam heating for the polarized beam to be 0.4-1 nW agreeing well with the value given by the fitting. The measured value, however, is clearly larger than the estimate based on calculation of the heat input into the sample caused by the thermal neutron capture and following pro- cesses. These calculations give an estimate 02 =0.2 nW [17]. To demonstrate the sensitivity of our model to change in 02, we also present in Fig. 7 the dash-dotted curve calculated with 02 =0.2 nW.
To conclude this section, we have seen that by using polarized neutrons useful information can be obtained. This technique is well suited for measure- ments at micro- and millikelvin temperatures. It pro- vides an effective tool for studies of the spin lattice relaxation process in the same temperature domain and especially in high fields, a condition which usually severely complicates such studies. In a demagnetiza- tion experiment, such as shown in Fig. 7, this tech- nique provides during the entire experiment informa- tion on the operation of the two stage demagnetiza- tion system.
5. Discussion
Even with our relatively high counting rate of about 1000 c/s the accuracy of the polarized neutron ther- mometer cannot compete with that of a P t -NMR thermometer, especially on short time scales. For Pt- N M R an accuracy better than 2% around 1 mK can be achieved in one pulse typically fired ones a minute. For the neutron technique to achieve similar accuracy at least one hour measuring time is needed.
This can be understood from statistical argu- ments. For the flipping ratio we have a statistical er- ror of 0.5% in a measurement which requires about 6 min. We see from Fig. 3 that this corresponds to an almost constant uncertainty AP= 4-0.025 in P over the entire polarization range. The uncertainty in To is thus dependent on the magnetic field applied, and for each temperature an optimum field can be found. Using the Brillouin function it can be seen that the optimum value for B/TO is around 1000- 2000 T/K. The uncertainty in TO is then roughly 4- 6% for one point. Therefore to achieve an accuracy of 4-2% at least 10 points, and 1 h of measuring t ime is needed. For BIT,=500 or 4000 T/K, the uncer- tainty in T, is already twice the optimum value and increases rapidly for smaller and larger B/TO. We ob-
148
serve slightly worse accuracy than expected from these arguments.
In neutron thermometry, no thermalization diffi- culties appear if the sample itself is used as the ther- mometer. In cases where a separate thermometer crys- tal is anchored to the specimen, the heating effect of the beam must be taken into account. For our crystal we measured the beam heating in a polarized flux of , ~ l . 1 0 S c m - 2 s -1, to be less than l n W . If thermal contact between the thermometer and the sample is not good enough, even a heat input as small as this can lead to considerable temperature differ- ences. The beam heats mainly through absorption of neutrons, but also through possible contamination of the beam by y-rays, epithermal and fast neutrons. The neutron absorption is followed by y-emission and by the radioactive decay of the newly formed nuclei. Part of the v-energy and most of the kinetic energy of the decay particles (for copper/%particles) are absorbed by the crystal. The amount of beam heating is thus also dependent on factors such as the size and shape of the crystal and its absorption cross-section.
In our setup the #-metal shield restricts the ther- mometry to fields above 0.2 T. Replacing this shield by one 'made of aluminium will enable us to study the behavior of the nuclear system down to much lower fields and temperatures.
The calibration curves illustrated in this paper are from a single cool-down. During one run the data are very reproducible since nothing is changed in the neutron set-up. However, when the cryostat is de- mounted and cooled down again, great care should be taken to check for the beam polarization, since this can vary slightly from run to run. With our setup and copper sample, the relationship between the flip- ping ratio and the polarization was found to be very close to linear. Therefore, measuring the P = 0 and P = 1 flipping ratios provides a convenient check for the calibration before it is applied for temperature determination in a new series of experiments.
Conclusion
We have applied polarized neutrons to determine nu- clear temperatures in copper down to 100 gK. It has been demonstrated that extinction plays an important role when establishing the relation between the nucle- ar polarization and the measured scattering intensi- ties. Large errors in temperature determination can result if this is not taken into account. We have ap- plied a simple extinction correction which explains the experimental data reasonably well. The calibrated thermometer has then been applied for spin lattice relaxation measurements in copper at high magnetic
fields, and for testing the operation of the two stage nuclear demagnetization refrigerator.
We are indebted to O.V. Lounasmaa for his support and interest in the experiments, and for comments on the manuscript. We have benefited from discussions with J. Als-Nielsen, J. Bossy, H. Dachs, J.K. Kjems, P.R. Roach and K. Sk61d. Scholarships from the Emil Aaltonen Foundation and The Finnish Cultural Foundation are gratefully acknowledged by two of us (TAJ and MTH). Technical support from the participating institutes, in particular by G. Rahn and K.D. Ohlhoff (HMI), J. Kaasinen and S. Kaivola (Helsinki), L.G. Jensen and B. Breiting (Ris~) is gratefully acknowledged. This work was in part financially supported by the Academy of Finland.
References
1. Lounasmaa, O.V.: Experimental principles and methods below 1 K, pp. 189-242. New York: Academic Press 1972
2. Steiner, M., Bevaart, L., Ajiro, Y., Millhouse, A.J., Ohlhoff, K., Rahn, G., Dachs, H., Scheer, U., Wanklyn, B.: J. Phys. (Paris) C 14, L597 (1981)
3. Benoit, A., Flouquet, J., Rufin, D., Schweitzer, J.: J. Phys. C 7, 43, 311 (1982)
4. Koester, L., Rauch, H.: Summary of neutron scattering lengths. IAEA Contract 2517/RB (1981)
5. Passell, L., Schermer, R.I.: Phys. Rev. 150, 146 (1966) 6. Steiner, M., Siemensmeyer, K., Ohlhoff, K.D., Rahn, G., Kubota,
M., Smith, S.M.: J. Magn. Magn. Mater 54-57, 133 (1986) 7. Steiner, M.: Neutron scattering in the nineties. IAEA, Vienna,
185 (1985) 8. Schermer, R.I., Blume, M.: Phys. Rev. 166, 554 (1968) 9. Abragam, A., Goldman, M.: Nuclear magnetism: Order and
disorder, pp. 419-469. Oxford: Clarendon Press 1982 10. Huiku, M.T., Jyrkki6, T.A., Kyyn/ir~iinen, J.M., Loponen, M.T.,
Lounasmaa, O.V., Oja, A.S.: J. Low Temp. Phys. 62, 433 (1986) 11. Andres, K., Lounasmaa, O.V.: Progress in low temperature
physics, Vol. 8, p. 221. Brewer, D.F. (ed.). Amsterdam: North Holland 1982
12. Berglund, P.M., Collan, H.K., Ehnholm, G.J., Gylling, R.G., Lounasmaa, O.V.: J. Low Temp. Phys. 6, 357 (1972)
13. Zachariasen, W.H.: Acta Crystallogr. 23, 558 (1967) 14. Bacon, F., Barclay, J.A., Brewer, W.D., Shirley, D.A., Templeton,
J.E.: Phys. Rev. B5, 2397 (1972) 15. Shibata, F., Hamano, Y.: Solid State Commun., 44, 921 (1982) 16. Jauho, P., Piril/i, P.V.: Phys. Rev. B1, 21 (1970) 17. Clausen, K., Huiku, M.T., Jyrkki6, T.A., Loponen, M.T., Loun-
asmaa, O.V., Roach, P.R., Sk61d, K.: Report TKK-F-A 529, Hel- sinki University of Technology (1983)
T.A. Jyrkki6, M.T. Huiku Low Temperature Laboratory Helsinki University of Technology SF-02150 Espoo Finland
K.N. Clausen Physics Department Riso National Laboratory P.O. Box 49 DK-4000 Roskilde Denmark
K. Siemensmeyer, K. Kakurai, M. Steiner Hahn-Meitner-Institut Glienicker Strasse 100 D-1000 Berlin 39 Germany


