Embed Size (px)
Citation preview

APJCN 2006: 15, Number 4: 443 - 582 ISSN 0964-7058
2006 Volume 15 Number 4
APCNS • IUNS • NSNZ
Asia Pacific
Journal of
Clinical Nutrition
Editor-in-Chief Mark Wahlqvist, Melbourne
Co-Editors Akira Okada, Osaka Duo Li, Hangzhou
HEC PRESS
www.healthyeatingclub.org/APJCN/

APJCN 2006: 15, Number 4: 443 - 582 ISSN 0964-7058
2006 Volume 15 Number 4
APCNS • IUNS • NSNZ
Asia Pacific Journal of Clinical Nutrition
2006, HEC PRESS, Melbourne, Australia ISSN 0964-7058

Visit the journal website at: http://www.healthyeatingclub.org/APJCN
Asia Pacific
Journal of
Clinical Nutrition
THE JOURNAL OF THE ASIA PACIFIC CLINICAL NUTRITION SOCIETY
APJCN 2006: Volume 15 (4): 443-582 ISSN 0964-7058
EDITOR-IN-CHIEF: Professor Mark Wahlqvist MD, Asia Pacific Health and Nutrition Centre, Monash Asia Institute, Monash University, Level 8, Building H, 900 Dandenong Road, Caulfield East, Melbourne, Victoria 3145 , AUSTRALIA, Email: [email protected]. CO-EDITORS: Professor Akira Okada MD, President, Osaka Medical Center and Research Institute for Maternal and Child Health, 840 Murodo-cho, Izumi City, Osaka, 594-1101, JAPAN. Fax: (+81) 725 56 5682; Email: [email protected]. Professor Duo Li MD, Professor of Nutrition & Food Safety, Dept of Food Science & Nutrition, Zhejiang University, 268 Kaixuan Road, Hangzhou 310029, CHINA. Fax: (+86) 571 86971024; Email: [email protected] Managing Editor: Dr Antigone Kouris-Blazos, HEC PRESS, PO Box 4121, McKinnon, Melbourne, Victoria 3204, AUSTRALIA Email: [email protected] Manuscript Submission: Asia Pacific Journal of Clinical Nutrition, Email: [email protected] or P.O. Box 90048-509, Neihu, Taiwan, ROC, Tel/Fax: +886-2-87910704 Administration officer: Yi-Chen Huang, MPH Business Manager (Accounts/Subscriptions/Publishing fees/Advertising/Sponsorship): Dr Antigone Kouris-Blazos, HEC PRESS, PO Box 4121, McKinnon, Melbourne, Victoria 3204, AUSTRALIA; Email: [email protected]
Asia Pacific Journal of Clinical Nutrition (APJCN) is a peer-reviewed journal published for the Asia Pacific Clinical Nutrition Society (APCNS). The journal publishes original research reports, short communications, reviews, and letters to the editors. Letters to the editors may be either very short articles (500 words) containing new material, case reports, or comments on previous papers or on other topics of current interest. News, book reviews and other items may also be included. All articles are peer-reviewed by at least two researchers expert in the field of the submitted paper. For detailed instructions concerning the submission of manuscripts, please refer to the Instructions to Authors at the back of this issue or visit the journal web page, listed below.
The aims of the Asia Pacific Clinical Nutrition Society (APCNS) are to promote the education and training of clinical nutritionists in the region and to enhance the practice of human nutrition and related disciplines in their application to health and the prevention of disease.
The journal is also an organ of The Nutrition Society of New Zealand and of The Nutrition Society of Australia, whose members receive APJCN as part of their society membership. The International Union of Nutritional Sciences (IUNS) is acknowledged as a non-financial co-sponsor of the journal.
Abstracting and Indexing Services: The Journal is indexed by Australasian Medical Index, CAB Abstracts, Chemical Abstracts Service, Current Contents/Clinical Medicine, Current Opinion, Index Medicus/MEDLINE, ISI Alerting Services, Science Citation Index, SciSearch and SUBIS Current Awareness in Biomedicine. The Journal is also indexed selectively in APAIS. Business Correspondence and Advertisement Booking: All matters relating to orders, subscriptions, back issues, offprints, advertisement booking and general enquiries should be addressed to: HEC PRESS, Dr A Kouris, PO Box 4121, McKinnon, Melbourne, Victoria 3204, Australia. Mobile: +61 (0)408551702
[email protected]; http://www.healthyeatingclub.org Subscription Rates (1/7/2006): The journal is published four times per year and the prices per annum for 2006 are as follows:
Personal: Hard copy (including on-line access) AU$195; On-line access only AU$150. Institution: Hard copy (including on-line access) AU$450; On-line access only AU$300.
The journal is despatched to subscribers outside Australia by surface air-lifted delivery.
Copyright and Photocopying: © 2006 HEC PRESS, Healthy Eating Club Pty Ltd. Authorization to photocopy items for internal or personal use, or the internal or personal use of specific clients, is granted by HEC PRESS, Healthy Eating Club Pty Ltd for libraries and other users registered with the Copyright Clearance Center (CCC) Transactional Reporting Service, provided that the base fee of US$15 per copy is paid directly to: CCC, 222 Rosewood Drive, Danvers, MA 01923, USA. This consent does not extend to other kinds of copying, such as copying for general distribution, for advertising or promotional purposes, for creating new collective works or for resale. Special requests should be addressed to the Publisher.
APJCN online & CD-ROM Past Issues: Once issues have been published for one year, they are available free-of-charge via the website http://www. healthyeatingclub.org. Current subscribers have on-line access to full papers on the website www.healthyeatingclub.org (password access).
Disclaimer: The Publisher, the Society and the Editors cannot be held responsible for errors or any consequences arising from the use of information contained in this journal; the views and opinions expressed do not necessarily reflect those of the Publisher, the Society or the Editors, neither does the publi-cation of advertisements constitute any endorsement by the Publisher, the Society or the Editors of the products advertised.

APJCN Editorial Advisory Board
Australia Professor Paul J Nestel
Baker Institute, Alfred Hospital, Commercial Rd, Prahran, VIC 3181 Tel: +61-3-9522-4333 Fax: +61-3-9521-1362 Email: [email protected]
Professor Boyd Swinburn Physical Activity and Nutrition Research Unit, School of Health Sciences, Deakin University, 221 Burwood Highway, Burwood, VIC 3125 Tel: +61-3-9251-7096 Fax: +61-3-9244-6017 Email: [email protected]
Professor A Stewart Truswell Human Nutrition Unit, Biochemistry Dept, University of Sydney, Sydney, NSW 2006 Tel: +61-2-9351-3726 Fax: +61-2-9351-6022 Email: [email protected]
China Professor Gu Jing-Fan
Professor of Nutrition, Institute of Hygiene and Environment Medicine, 1 Da Li Dao, Tianjin, 300050 Tel: +86-22-846-55402 Fax: +86-22-846-55402 Email: [email protected]
Fiji Professor Sitaleki Finau
Head, School of Public Health & Primary Care, Fiji School of Medicine, Private Mail Bag Suva, Fiji Islands Tel: +679-311-700 Fax: +679-303-469
Dr Jimaima Veisikiaki Lako c/o Professor Subramaniam Sotheeswaran, Department of Chemistry, University of the South Pacific, Suva, Fiji Email:[email protected]
Guatemala Dr Noel W Solomons
Centre for Studies of Sensory Impairment, Aging and Metabolism, PO Box 02-5339 Section 3162/Guatemala Miami, FL 33102-5339 Tel: +502-473-3942 Fax: +502-473-3942 Email: [email protected]
Indonesia Assoc. Professor Widjaja Lukito
SEAMEO-TROPMED* National Centre Indonesia, Regional Center of Community Nutrition, University of Indonesia, Jalan Salemba Raya 6, Jakarta 10430, Indonesia Tel: +62-21-330-205 Fax: +62-21-390-7695
Email: [email protected] Professor Soemilah Sastroamidjojo
(for SEAMEO-TROPMED Nutrition Centre) Faculty of Medicine, University of Indonesia, 6 Salemba Raya, Jakarta 10430
Japan Professor Kazuo Kondo
Institute of Environmental Science for Human Life, Ochanomizu University, 2-1-1 Ohtsuka, Bunkyo-ku, Tokyo 112-8610 Tel: +81-3-5978-5812 Fax: +81-3-5978-2694 Email: [email protected]
Korea Professor Hee Young Paik Dept. of Food and Nutrition Seoul National University San 56-1 Shillim-dong Gwanak-ku Seoul 151-742, Korea Tel. +82-2-880-6834 Fax. +82-2-884-0305 Email: [email protected]
Malaysia
Professor B Abdul K Khalid Professor of Medicine, Universiti Kebangsaan Malaysia, Jalan Raja Muda Abdul Aziz, 50300 Kuala Lumpur Tel: +60-3-440-5000 Fax: +60-3-291-2659 Email: [email protected]
New Zealand Professor Jim Mann Department of Nutrition, University of Otago, PO Box 56, Dunedin Tel: +64-9-795-780 Fax: +64-9-770-956 Email: [email protected] Philippines Dr Rodolfo Florentino
Food & Nutrition Research Institute, Pedro Gil Street, PO Box EA-467, Emita, Manila 1000 Tel: +63-2-823-8071 Fax: +63-2-823-8934
Email: [email protected] Singapore Dr Paul Deurenberg
135, Serangoon Avenue 3, #10–01, Chiltern Park, Singapore 556114 Tel: +65- 91251425 Fax: +65-68585985 Email: [email protected]
Taiwan Professor Wei-Jao Chen
National Taiwan University 1 Section 4, Roosevelt Road Taipei, Taiwan, ROC 106 Tel: +886-2-23634090 Fax: +886-2-23621877 Email: [email protected]
Thailand Professor Prasong Tienboon
Division of Nutrition, Dept of Paediatrics, Faculty of Medicine, Chiang Mai University, Chiang Mai 50002 Tel: + 66-53-895269 Fax: + +66-53-214437 Email: [email protected]
Vietnam Professor Ha Huy Khoi
National Institute of Nutrition, 48 Tang Bat Ho, Hanoi Tel: +84-4971-7090 Fax: +84-4971-7885
Email: [email protected]
* SEAMO-TROPMED = South East Asia Ministry of Education, Tropical Medicine

APCNS Editorial Advisory Board
Asia Pacific Clinical Nutrition Society www.apcns.org
President: Professor Prasong Tienboon, Thailand
Immediate Past President: Professor Widjaja Lukito, Indonesia
Vice President: Professor Zhu-Ming Jiang, China
Secretary: Dr Irene Darmadi, Australia
Treasurer: Professor Mark Wahlqvist, Australia
Councillor: Professor Kazuo Kondo, Japan
Webmaster: Dr Antigone Kouris-Blazos, Australia
Asia Pacific Clinical Nutrition Society is established to create links between clinical nutritionists in the Asia Pacific region. The Society seeks thereby to promote the contribution of nutritionists to the health of the populations in Asia Pacific countries. Asia Pacific Clinical Nutrition Society will encourage continuing nutrition and training in the region so as to promote the highest possible level of research and practical innovation. Asia Pacific Journal of Clinical Nutrition, along with the sponsorship by Asia Pacific Clinical Nutrition Society of regional and local clinical nutrition meetings, is expected to assist greatly in the achievement of these aims. Membership of Asia Pacific Clinical Nutrition Society, for which there is a modest annual fee and which includes on-line access to Asia Pacific Journal of Clinical Nutrition, is open to all clinical nutritionists in the region. The Society will consider application for membership based on submission of a curriculum vitae and a statement of support from one of the officers and the individuals listed below. The Asia Pacific Clinical Nutrition Society representatives should state: 'On behalf of Asia Pacific Clinical Nutrition Society I support the application of [Name and address] for membership in the Society'. After the applicant has obtained this endorsement from the representative it should be forwarded with the applicant's curriculum vitae for consideration and acknowledgement to: The Secretary, Asia Pacific Clinical Nutrition Society, Asia Pacific Health and Nutrition Centre, Monash Asia Institute, 8th Floor, Menzies Building, Monash University, Wellington Road, Clayton, Victoria 3168, Australia.

ASIA PACIFIC CLINICAL NUTRITION SOCIETY (APCNS)
Society Membership
AU$100 per annum
Asia Pacific Clinical Nutrition Society (APCNS) was established to create links between clinical nutritionists in the Asia Pacific region and to promote their contribution to the health of the populations of Asia Pacific countries. APCNS encourages continuing nutrition education and training in the region in order to support the highest possible levels of research and practical innovation. APCNS sponsorship of local and regional meetings along with the publication of Asia Pacific Journal of Clinical Nutrition, is expected to assist greatly in the achievement of these aims. President: Professor Prasong Tienboon, Thailand Immediate Past President: Professor Widjaja Lukito, Indonesia Vice President: Professor Zhu-Ming Jiang, China
Membership Application You will need your membership application endorsed by one of the members of the Advisory Board listed at the front of the journal. Please use the Endorsement Form below. Send the completed endorsement form, your curriculum vitae and bankdraft for AU$100 (made payable to APCNS) or credit card details (use the form below) to the society. Membership Application & Endorsement I wish to apply for membership of the Asia Pacific Clinical Nutrition Society Title ………………. Name……………………………………………………………………………………………………
Mailing Address……………..…………………………………………………………………………………………………
……………………………………………………………………………………………Postcode…………………………..
Tel: ………………………………………………………..Fax………………………………………………………………..
Email ……………………………………………………………………………………………………………………………
I support the application of ………………………………………………………………for membership of the Asia Pacific Clinical Nutrition Society.
Name of Endorser…………………………………………Signature of Endorser……………………………………... CREDIT CARD PAYMENT I wish to pay by Visa MasterCard (Other cards are not accepted) Amount $ …………….. Expiry Date ……./……….Signature …………………………………………………………. Name on Card ………………………………………………………………………………………………………………. On-line access: Please provide preferred Username..................................................…………......Password...........................................……………………. Send your membership application to: The Secretary, Asia Pacific Clinical Nutrition Society, Asia Pacific Health and Nutrition Centre, Monash Asia Institute, 8th Floor, Menzies Building, Monash University, Wellington Road, Clayton, Melbourne, Victoria 3800, AUSTRALIA Fax: (+61) 3 9905 8146. Email: [email protected].
receive ON-LINE ACCESS
to Asia Pacific Journal of Clinical Nutrition as part of your membership

Asia Pac J Clin Nutr 2006;15 (4): 443-450 443
Original Article High protein high fibre snack bars reduce food intake and improve short term glucose and insulin profiles compared with high fat snack bars Gemma Williams MND,
Manny Noakes PhD, Jennifer Keogh MSc, Paul Foster PhD, and Peter Clifton PhD
CSIRO Human Nutrition PO Box 10041 BC Adelaide 5000 Australia
The replacement in the diet of refined carbohydrate and fat with fibre and protein has been shown to promote satiety and improve glucose and insulin profiles. It is less clear whether the macronutrient composition of individual foods such as snacks have any meaningful impact on metabolic parameters and satiety. We examined if the consumption of higher protein higher fibre snack bars would result in reducing outcome measures such as food intake and glucose and insulin patterns compared to a conventional isocaloric high fat high refined carbohydrate snack bar. Twenty three women were randomized in a single blind cross over study with 2 interventions, a high fat high sugar snack bar and a comparatively higher protein, higher fibre snack bar intervention. Snack bars were eaten at mid morning and mid afternoon, and a standard breakfast and ad libitum buffet lunch. The glucose and insulin responses over 9 hours were significantly lower (P = 0.014 and P = 0.012 respectively) during the high protein snack bar intervention. Peak glucose levels were also 16% lower after the morning HP bar (P <0.001). The morning high protein bar reduced the energy intake at the buffet lunch meal by 5% (4657 ± 1025KJ vs 4901 ± 1186KJ, P < 0.05). Altering the macronutrient composition of a snack bar can assist in reducing the energy intake at a subsequent meal and improve short term glucose and insulin profiles.
Keywords: snack foods, satiety, high protein, glucose, insulin response Introduction Previous studies have shown that meals with a high protein/carbohydrate ratio (ie lower GL) may contribute to improved post meal and diurnal glucose profiles in subjects with Type 2 diabetes and insulin resistance.1,2 Although dietary protein is known in controlled experimental studies to result in greater satiation than carbohydrate or fat during meals,3-6 the effects of protein enriched whole food snacks on subsequent food intake and metabolic profile is less clear and poorly studied. Whole foods comprise a mixture of macronutrients, have varying fibre content and vary in physical form and taste, the totality of which may con-tribute to their satiating effects. Nine out of 10 Australians regularly consume confectionary including food bars7 and altering the macronutrient composition of snack bars for health benefits is a priority for food producers and con-sumers. The aim of this study was to compare the impact of higher protein higher fibre (HP) snack bars with a commer-cial high fat high refined carbohydrate (HFC) snack bar on daily glucose and insulin profiles, subjectively assessed appetite control over a day, and objectively assessed appe-tite control as assessed by food consumed at lunch and at an evening meal. We hypothesised that the consumption of the HP bars would result in reduced diurnal glucose and insulin patterns and provide superior appetite control com-pared to the HFC bars in overweight younger women.
Materials and Methods Subjects Subjects were recruited by public advertisement and se-lected on the basis of the following criteria: overweight to moderately obese women (BMI 27-34kg/m2) and aged be-tween 25 - 45 years. Volunteers were not previously diag-nosed with type 1 or 2 diabetes, did not have active liver and kidney disease, current gastrointestinal disease or past history of gastrointestinal surgery which may have affected study outcomes. They had no history of hyper-sensitivity to the study foods (casein, whey or wheat) and were not taking any medications which may have affected GI mo-tility or hunger /appetite. All subjects signed an informed written consent to participate in the study which was approved by the Commonwealth Scientific and Industrial Research Organisation (CSIRO), Division of Human Nutrition Human Ethics Committee. Twenty nine subjects were selected to participate in the study. Six subjects with-drew before study commencement due to work commit-ments, unforseen travel or illness. Twenty three women
Correspondence address: Gemma Williams, CSIRO Human Nutrition PO Box 10041 BC Adelaide 5000 Australia Tel: 61 8 83038863; Fax 61 8 83038899 Email: [email protected] Accepted 12 April 2006

444 G Williams, M Noakes, J Keogh, P Foster and P Clifton
aged 42 ± 8y (mean ± SD) and BMI 30 ± 4kg/m2 com-pleted the trial. Women only were chosen in order to narrow the range of energy intake at the buffet lunch and improve the power of the study. Study design The design was an acute study, spanning one whole day, performed on 2 occasions with the different snack foods being assessed on separate days. There was a 7 day inter-val between study days. Volunteers were randomized in a single blind cross over study with 2 treatments as depicted in Figure 1. Blood samples were taken hourly from 8am to 5pm and ad libitum food intake was assessed by the amount of food consumed at a buffet lunch and weighed food records after 5pm. The order of the snack food interventions was fully randomised to avoid effects of habituation to the procedure and the snacks were provided in unlabelled form. Breakfast was consumed after the fasting blood sample was collected (T0). The morning snack (AM) was consumed just after the T2 blood sample. The buffet lunch was commenced after the T5
blood sample and subjects were exposed to the buffet un-til the T6 blood sample. The afternoon snack (PM) was consumed after the T7 blood sample. Post-prandial glu-cose and insulin responses to the test bars were assessed by calculating the change in subsequent time points after consumption of bars. Study meals The HP bars were commercially produced by Aussie Bodies snack bars (Aussie Bodies 282 Normanby Road Port Melbourne 3207). The nutrient profile of the HP bars and commercial HFC bar are outlined in Table 1. The manufacturer of the HP bars designed the afternoon HP bar (HP-PM) to have a greater protein to carbohydrate ratio than the morning HP bar (HP-AM) to promote satiety later in the day. Because of the study design the effect of the morning HP bar dominated the controlled part of the experiment. The breakfast was standardised in type and quantity and consisted of 2 slices white bread, 1 teaspoon margarine, 20g jam, 1 cup tea/coffee, 30ml fat reduced milk. Lunch was standardised in type and
Breakfast snack Lunch snack
0800 0900 1000 1100 1200 1300 1400 1500 1600 1700 T0 T1 T2 T3 T4 T5 T6 T7 T8 T9
Blood sample, VAS
Leave clinic and food record kept for the rest of the day
Figure 1. Schematic diagram of study design where T = timepoints.
HP-AM 50g
HP-PM 50g
HFC 40g
Energy 750kJ (170Cal) 15kJ/g
770kJ (180Cal) 15.4kJ/g
771kJ (181kCal) 17.1kJ/g
Protein 10.1g (21.9%) 18.6g (39.7%) 1.5 (<0.1%)
Fat - Total - Saturated
3.9g (19.4%)
2.9g
4.9g (24.1%)
4.6g
7.2g (35.5%)
4.0g Carbohydrate
- Total - Sugars
25.6g (58.7%)
17.0g
16.0g (36.2%)
9.2g
28.4g (64.4%)
23.1g
Dietary fibre 4.0g 2.6g <1g
Test bar Ingredients: Protein blend (soy protein isolate, whey protein concentrate, tapioca starch), fructose, apple pieces, glucose syrup, polydextrose, rolled oats, unsalted butter, emulsifier (472c), water, rice starch, flavours, hydrogenated palm oil, salt, preservative (220), antioxidant (306). Commercial bar Ingredients: Milk chocolate 40% (sugar, milk solids, cocoa butter, cocoa mass, emulsifier (soy lecithin), flavour), nougat 32% (sugar, wheat glucose syrup, partially hydrogenated vegetable fat, barley malt extract, cocoa powder, milk solids, egg white, salt), caramel 28% (wheat glucose syrup, sugar, milk solids, partially hydrogenated vegetable fat, salt, flavour). Milk chocolate contains a minimum of 22% cocoa solids and 25% milk solids
Table 1. Nutrient composition of snack bars

Snack foods and metabolism 445
consumed ad libitum. Subjects were provided with a tray of attractive food items, to which they were exposed for 1 hour. The buffet lunch was designed to reflect usual lunch practices. There was variety to optimise choice and foods were available in excess of consumption. Up to 4 subjects were seated at the same table with their separate trays to attempt to mimic normal social conditions. Food intake after 5pm was not controlled. These conditions remained consistent for both the volunteers’ study days.
Satiety measures Objective satiety was assessed by calculating energy con-tent of food intake at the buffet and subsequently over the day. Subjects were instructed how to keep a food record by a dietitian. The food intake for the reminder of the day was analysed using FoodWorks software package (Xyris Software, Highgate Hill, Australia). Subjective assess-ment of satiety was measured hourly over the day. This was assessed using a visual analogue scale (VAS) from
0.0
1.0
2.0
3.0
4.05.0
6.0
7.0
8.0
9.0
0 1 2 3 4 5 6 7 8 9
time (hours)
mm
ol/
L
HFC
HP
Figure 2. Plasma glucose levels (mean ± SD), N = 18, completers. Significant differences at T (timepoint) 3, P<0.001; T8, P<0.001; and T9, P=0.005.
Control Test
Mean Std. Dev. Mean Std. Dev.
Energy kJ Ψ 4901 1186.3 4656 1024.8
Weight g Ψ 789 269.9 705 216.4
Protein %kJ 16.8 1.7 17.1 1.9
Protein g 48.5 12.0 46.8 10.5
Fat %kJ 35.1 4.4 35.9 4.4
Fat g 46.4 12.2 45.6 12.1
Carbohydrate %kJ 44.8 5.1 43.6 5.0
Carbohydrate g Ψ 137.2 38.0 125.9 29.9
Saturated fat %kJ 15.9 3.7 16.4 3.5
Saturated fat g 21.2 6.7 21.0 6.5
Fibre g 8.2 2.2 7.9 1.6
Sugars g Ω 63.3 25.2 52.9 20.9
Starch g 73.2 16.6 72.2 16.2
Ψ = significantly different, P<0.05; Ω = significantly different, P =0.005
Table 2. Nutrient intake for buffet meal (N=18), completers; paired t tests between groups

446 G Williams, M Noakes, J Keogh, P Foster and P Clifton
from 8am to 5pm. The VAS is a validated short question-naire with a linear scale of 100mm for rating hunger, full-ness, satiety, nausea, desire to eat and the amount of food that could be eaten at the next meal.8 The changes in ratings from baseline were quantified following the method described by Porrini et al.,19959 and analysis was performed on N=23. Palatability measures Subjects were provided with a 10 point scale to assess perceived palatability of the snack bars after each snack
was consumed where the higher the number the greater the palatability. Blood analysis Blood samples for plasma insulin and glucose were collected at baseline before breakfast and then hourly over the day until 5pm. Samples were collected in sodium fluoride/EDTA (1g/L) and stored on ice until processed. The plasma was isolated by centrifuging for 10 minutes at 1500g at 4ºC (Beckman GS-6R Centrifuge CA) and stored at -80ºC. All samples for each individual were
Control Test
Mean Std. Dev. Mean Std. Dev.
Energy kJ 10275 1765.0 9970 1982.2
Weight g 1479.0 291.4 1456.0 342.0
Protein %kJ Ψ 14.8 2.8 19.5 2.5
Protein g Ω 89.8 24.3 112.9 20.3
Fat %kJ χ 36.1 5.2 31.3 4.5
Fat g 101.9 30.7 84.7 23.1
Carbohydrate %kJ 45.3 5.2 44.7 4.1
Carbohydrate g 287.2 37.4 279.3 66.1
Saturated fat %kJ 15.5 2.5 14.5 2.8
Saturated fat g 43.6 12.8 39.1 11.5
Fibre g * 17.9 4.4 24.2 6.3
Sugars g Ψ 146.1 23.7 118.3 31.1
Starch g 140.2 31.0 159.7 45.0
Ψ = significantly different, P = 0.000; Ω = significantly different, P = 0.003; χ = significantly different, P < 0.05 * = significantly different, P = 0.001
Table 3. Nutrient intake for the whole day (N=18), completers; paired t tests between groups
0
20
40
60
80
100
120
0 1 2 3 4 5 6 7 8 9
time (hours)
uU
/L HFC
HP
Figure 3. Plasma insulin levels (mean ± SD), N = 18, completers. Significant difference at T9, P = 0.057.

Snack foods and metabolism 447
measured in one assay at the end of the study. Plasma glucose was measured on a Hitachi 902 Automatic Ana-lyzer (Roche) and insulin concentration was measured using Mercodia Insulin ELISA kit (ALPCO, American Laboratory Products). Data analysis Statistical analysis was completed using SPSS V11.5 for Windows with significance set at P<0.05. All the data are presented as means ± SD. Comparisons between macro-nutrients were calculated using paired t-test. VAS was analysed by using repeated measures general linear mo-del. Glucose and insulin analyses were done using re-peated measures ANOVA with bar type (2 levels-control or test) and time (10 levels) as the within subject factors. Palatability ratings were analysed as means ± SD and comparisons between bars calculated using paired t-test. Results Of the twenty three women who completed the study, 5 did not consume the entire snack bar on one or both occasions on the same or different days. Therefore, the data was analysed with only those subjects who com-pletely consumed both bars (N=18). Non completion of the HFC bars was due to fullness, or feeling unwell; and the HP snack bars due to fullness or a dislike of the flavour (choc-orange). Plasma glucose and insulin responses There was a significant interaction of bar type with glu-cose response over 9 hours (P = 0.014; Fig. 2) which was lower on the day that the HP bars were consumed. When individual time points between treatments were compared by paired t test, significantly lower glucose values were observed after T3 (P<0.001), T8 (P<0.001), and T9 (P = 0.005), which corresponded to the blood samples following the HP-AM bar (T3) and the HP-PM bar (T8 and T9). Peak glucose levels (T3) were 16% lower after the HP-AM than the HFC. The 9 hour insulin response was also significantly lower (P = 0.012, Fig. 3) on the day that the HP bars
were consumed. When individual time points between treatments were compared by paired t test, lower insulin values were observed at 8 of the 10 time points in the test intervention, though it was only at T9 that this approached statistical significance (P = 0.057). The change in glucose response to the HP-AM was significantly lower compared to the HFC (P <0.001). The changes in glucose response to the HP-PM were not sig-nificantly different from the HFC. The change in insulin response to the HP-AM was significantly lower compared to the HFC (P <0.037). The changes in insulin response to the HP-PM were not significantly different to the HFC. Nutrient intake Kilojoule intake of individuals for the buffet lunch was highly correlated between visits (r=0.9, P <0.01). When snack type was considered, subjects consumed 5% fewer kilojoules at the buffet lunch after eating the HP-AM at morning tea (T2) than after the HFC (P <0.05, Table 2). This was due to a significantly greater intake of carbo-hydrate as sugars after the HFC which on analysis of amounts of foods consumed was due to a greater con-sumption of yoghurt. Total energy intake over the day, including consumption of snack bars, was 3% lower on the HP bar intervention but this did not reach statistical significance (Table 3). Protein intake in absolute terms was 26% greater over the total day on the HP bar intervention (P = 0.000) but was not different at the lunch buffet. Total carbohydrate intake was 8% lower at the buffet lunch after the HP-AM (P <0.05) but total carbo-hydrate intake was not significantly different for the day. Total fat intake as a percent energy was 13% lower for the whole day on the HP bar intervention (P <0.05) but not different in terms of foods consumed at the lunch buffet. Fibre intake was 35% higher over the whole day on the HP intervention (P = 0.001) (Table 3). Subjective appetite rating The appetite ratings for nausea, hunger (Fig. 4), fullness, satiety, desire to eat and amount of food that could be eaten at the next meal all tended towards greater satiation
1 2 3 4 5 6 7 8 9
-30
-10
10
30
50
70
90HFC HP
hungry
not hungry
Time (h)
scor
e
Figure 4. Visual analogue scale (mean ± SD), n=23.

448 G Williams, M Noakes, J Keogh, P Foster and P Clifton
on the HP intervention compared with the HFC bars. However, none of these parameters reached statistical significance. Palatability ratings Palatability ratings for the control bar versus the HP bar were statistically different for both morning (P<0.01) and afternoon (P<0.01) periods. The average rating for the control bar when consumed in the morning was 4 (range 1-5) whereas the average rating for the HP-AM was 1 (range -5 to +4). The average rating for the control bar when consumed in the afternoon was 4 (range -2 to +5) whereas the average rating for the HP-PM was -2 (range -5 to +5) which was highly statistically different (P<0.01). Discussion The main outcome of this study is that differences in the macronutrient composition of a snack bar had an impact on energy intake three hours after consumption and glucose and insulin levels over the whole day. The HP-AM was associated with a 5% reduction in energy intake at the next meal. This was due to a significantly greater intake of carbohydrates as sugars after the HFC and more specifically a greater consumption of yoghurt. It is difficult to determine which attribute caused the reduction in energy intake at the lunch meal given that the control and intervention snack bars varied in several ways. They had a different macronutrient composition, the HP bars weighed slightly more which may have contributed to gastric distension and consequently satiety10 and there were markedly superior palatability ratings for the control bar. It is therefore possible that there may have been a number of reasons for the results we obtained. However, previous studies have shown that protein exerts a greater inhibitory effect on appetite than either carbohydrate or fat3,4,11-16 and the protein in the HP bars may have there-fore contributed to this reduction in energy intake. How-ever, the reduction in energy intake over the whole day in our study was not significant at 3%. Similarly, Stubbs et al. 19963 found that while a high protein breakfast led to detectable changes in hunger compared with high fat and high carbohydrate breakfasts this did not correspond to energy intake at lunch or over the rest of the day. Johnstone et al., 200017 also found that snack composition did not differentially affect total daily energy intake or hunger. The test and control bars in our study contributed 15% of total energy intakes. Total energy consumed (9970kJ in the HP intervention) would be sufficient for weight maintenance in this group of subjects assuming light-moderate activity. The palatability ratings of the bars in our study indi-cated that the HFC bars were more favourably received. There is mixed opinion on whether the palatability of food affects subsequent food intake. Some studies18-21
suggest subjects were hungrier after a preferred meal while others22,23 indicate there is no effect on satiety at the next meal. It may be that increased palatability effects satiation (termination of the current meal) but not sub-sequent satiety.22 Subjective perception of hunger, desire to eat and amount of food that could be consumed was measured using the visual analogue scale indicated that subjects
were less hungry on the HP intervention however these measures did not reach significance. This is in contrast with Poppitt et al., 19985 and Porrini et al., 199524, both finding that a protein pre-load resulted in a significant reduction in subjective measures of hunger as well as re-duced subsequent energy intake. The lack of statistical significance in our results may have been due, in part, to there not being adequate time for a difference to be ob-served from when the snack bars were consumed in the morning until lunch time (3 hours later) and in the after-noon until the end of recording (2 hours). The role of snacks in energy intake and weight re-duction is much debated. Some studies indicate that the avoidance of foods consumed as snacks is not associated with weight loss25,26 and that snacking in some people can assist in regulating excessive energy intake.27 While other studies show that the inclusion of any snack whether it is high in protein, fat or carbohydrate is detrimental to weight loss as the consumption of energy at subsequent meals is unchanged compared with no snack con-sumption.5,28 Marmonier et al., 20004 showed that a high protein snack delayed the request for the subsequent meal longer than the high fat or high carbohydrate snack. In those individuals who currently consume snacks, the present study lends support to the argument for choosing snacks that have a higher protein and higher fibre content than the conventional high fat high sugar variety that are commonly available. However, we did not include a “no snack” group making it impossible to know if the addition of snack bars in general affected total energy intake.
The present study used protein enriched whole foods in contrast to the majority of studies in this area3,4 that have used different food components to make a highly controlled macronutrient intake. The snack bars used in this study are whole foods with varying taste, textures, energy densities, weights and appearances. A benefit of such an approach is that foods in the real world are not as rigidly controlled as in the controlled experimental studies and we are therefore obtaining data using a more free living approach. The limitation of such an approach is that causal effects are more difficult to determine. As new food products are developed with higher protein/ carbo-hydrate ratios and lower GL aimed at the weight con-scious consumer, it is important to establish the validity of such products in offering advantages to metabolic, satiation and satiety profiles. This information will in-form product development of new foods which may have a meaningful impact on satiety and subsequent weight control. In conclusion, there is evidence from this study that higher protein higher fibre snack bars have a superior influence on short term metabolic parameters and may assist in appetite control compared with the conventional high fat high refined carbohydrate snack bars. The con-sumption of high fat high sugar snack bars is very common and it would appear that by altering their macro-nutrient composition we may see health benefits in people who regularly consume these products. Acknowledgements Funding for this study was provided by Aussiebodies 282 Normanby Road, Port Melbourne Australia 3207. We thank

Snack foods and metabolism 449
Kathryn Bastiaans, Anne McGuffin, Rosemary McArthur, Mark Manu, Candida Sullivan for their assistance in performing these studies. References 1. Gannon MC, Nuttall FQ, Saeed A, Jordan K, Hoover H.
An increase in dietary protein improves the blood glucose response in persons with type 2 diabetes. Am J Clin Nutr 2003; 78: 734-41.
2. Farnsworth E, Luscombe ND, Noakes M, Wittert G, Argyiou E, Clifton PM. Effect of a high-protein, energy-restricted diet on body composition, glycemic control, and lipid concentrations in overweight and obese hyper-insulinemic men and women.Am J Clin Nutr 2003;78:31-9.
3. Stubbs RJ, van Wyk MC, Johnstone AM, Harbron CG. Breakfasts high in protein, fat or carbohydrate: effect on within-day appetite and energy balance. Eur J Clin Nutr 1996; 50: 409-17.
4. Marmonier C, Chapelot D, Louis-Sylvestre J. Effects of macronutrient content and energy density of snacks consumed in a satiety state on the onset of the next meal. Appetite 2000; 34: 161-8.
5. Poppitt SD, McCormack D, Buffenstein R. Short-term effects of macronutrient preloads on appetite and energy intake in lean women. Physiol Behav 1998; 64: 279-85.
6. Weigle DS, Breen PA, Matthys CC, Callahan HS, Meeuws KE, Burden VR, Purnell JQ. A high-protein diet induces sustained reductions in appetite, ad libitum caloric intake, and body weight despite compensatory changes in diurnal plasma leptin and grehlin concentrations. Am J Clin Nutr 2005; 82: 41-8.
7. Confectionary Manufacturers of Australasia website. [http://www.candy.net.au/cma/content] Accessed 15/3/ 2005.
8. Flint A, Raben A, Blundell JE, Astrup A.. Reproducibility, power and validity of visual analogue scales in assessment of appetite sensations in single test meal studies. Int J Obesity 2000; 24: 38-48.
9. Porrini M, Crovetti R, Testolin G, Silva S. Evaluation of satiety sensations and food intake after different preloads. Appetite 1995; 25: 17-30.
10. Porrini M, Santangelo A, Crovetti R, Riso P, Testolin G, Blundell JE. Weight, protein, fat and timing of pre-loads affect food intake. Physiol Behav 1997; 62: 563-570.
11. Barkeling B, Rossner S, Bjorvell H. Efficiency of a high protein meal (meat) and a high carbohydrate meal (vegetarian) on satiety measured by automated com-puterised monitoring of subsequent food intake, motivation to eat and food preferences. Int J Obes 1990; 14: 743-751.
12. Holt SH, Brand-Miller JC, Petocz P, Farmakalidis E. A satiety index of common foods. Euro J Clin Nutr 1995; 49: 675-690.
13. Latner JD, Schwartz M. The effects of a high-carbohydrate, high-protein or balanced lunch upon later food intake and hunger ratings. Appetite 1999; 33: 119-128.
14. Booth DA, Chase A, Campbell AT. Relative effectiveness of protein in the late stages of appetite suppression in man. Physiol Behav 1970; 5: 1299-1302.
15. Teff KL, Young SN, Blundell JE. The effect of protein or carbohydrate breakfasts on subsequent plasma amino acid levels, satiety and nutrient selection in normal males. Pharmacol Biochem Behav 1989; 34: 829-837.
16. De Graaf C, Hulshof T, Weststrate JA, Jas P. Short-term effects of different amounts of protein, fats and carbo-hydrates on satiety. Am J Clin Nutr 1992; 55: 33-38.
17. Johnstone AM, Shannon E, Whybrow S, Reid CA, Stubbs RJ. Altering the temporal distribution of energy intake with isoenergetically dense foods given as snacks does not affect total daily energy intake in normal-weight men. B J Nutr 2000; 83: 7-14.
18. Blundell JE. Pharmacological approaches to appetite suppression. Trends Pharmacol Sci 1993; 12: 147-157.
19. Hill AJ, Magson LD, Blundell JE. Hunger and palatability: Tracking ratings of subjective experience before, during and after the consumption of preferred and less preferred food. Hum Nutr Appl Nutr 1986; 53A: 361-371.
20. Perez C, Dalix AM, Guy-Grand B, Bellisle F. Human responses to five concentrations of sucrose in a dairy pro-duct: Immediate and delayed palatability effects. Appetite 1994; 23: 165-178.
21. Rogers PJ, Schutz G. Influence of palatability on sub-sequent hunger and food intake: A retrospective replica-tion. Appetite 1992; 19: 155-156.
22. De Graaf C, De Jong CS, Lambers AC. Palatability effects satiation not satiety. Physiol Behav 1999; 66: 681-688.
23. Johnson J, Vickers Z. Factors influencing sensory-specific satiety. Appetite 1992; 19: 15-31.
24. Porrini M, Crovetti R, Riso P, Santangelo A, Testolin G. Effects of physical and chemical characteristics of food on specific and general satiety. Physiol Behav 1995; 57: 461-468.
25. Conner M, Norman P. Body weight and shape control: exa-mining component behaviours. Appetite 1996; 27:135-150.
26. Booth DA, Blair AJ, Lewis VJ, Baek SH. Patterns of eating and movement that best maintain reduction in overweight. Appetite 2004; 43: 277-283.
27. Waller SM, Vander Wal JS, Klurfeld DM, McBurney MI, Cho S, Bijlani S, Dhurandhar NV. Evening ready-to-eat cereal consumption contributes to weight management. J Am Coll Nutr 2004; 23: 316-321.
28. Basadevant A, Craplet C, Guy-Grand B. Snacking patterns in obese French women. Appetite 1993; 21: 17-23.

450 G Williams, M Noakes, J Keogh, P Foster and P Clifton
Original Article High protein high fibre snack bars reduce food intake and improve short term glucose and insulin profiles compared with high fat snack bars Gemma Williams PhD,
Manny Noakes PhD, Jennifer Keogh PhD, Paul Foster PhD and Peter Clifton PhD
CSIRO Human Nutrition PO Box 10041 BC Adelaide 5000 Australia
高蛋白高纖維點心棒比高脂點心棒能減少高蛋白高纖維點心棒比高脂點心棒能減少高蛋白高纖維點心棒比高脂點心棒能減少高蛋白高纖維點心棒比高脂點心棒能減少食物攝取並改善短期食物攝取並改善短期食物攝取並改善短期食物攝取並改善短期葡萄糖及胰島素狀況葡萄糖及胰島素狀況葡萄糖及胰島素狀況葡萄糖及胰島素狀況
以富含纖維及蛋白質替代飲食中的精製碳水化合物及脂質,可增加飽足感及改善葡萄糖及胰島素狀況。然而像點心等單項食物中的巨量營養素組成,是否也可益於代謝參數與飽足感則並不清楚。我們評估攝取高蛋白質高纖維點心棒與等熱量的傳統高脂高精製碳水化合物點心棒,是否能降低食物的攝取與葡萄糖及胰島素狀況?此單盲交叉研究共有23名女性參與,研究對象隨機分配到高脂高糖點心棒或高蛋白高纖維點心棒的兩組。點心棒食用的時間是在早午餐間及午晚餐間,早餐為標準早餐,而午餐為不限量的自助午餐。葡萄糖跟胰島素反應在高蛋白點心棒介入九小時後顯著的較低(P值分別為0.014及0.012)。而葡萄糖的高峰發生在早上的食用高蛋白(HP)棒之後,也低了16%(P<0.001)。早上吃了高蛋白棒之後,可減少午餐大約5%的熱量攝取(4657±1025KJ vs. 4901±
1186KJ,P<0.05)。改變點心棒的巨量營養素組成有助於減少之後正餐熱量攝取並改善短期葡萄糖及胰島素的狀況。
關鍵字:點心食品、飽足感、高蛋白、葡萄糖、胰島素反應。

Asia Pac J Clin Nutr 2006;15 (4): 451-458 451
Original Article Precision in nutritional information declarations on food labels in Australia Stefan U Fabiansson BVSc, PhD
NSW Food Authority, 6 Avenue of the Americas, Newington NSW 2127, Australia
Nutrition labels guide consumers in making their food choice. New requirements for mandatory nutrition labelling have been in force in Australia since late 2002. The present study, analysing 350 samples comprising 70 different products for nutritional compounds declared on the label, is the first larger attempt to quantify the precision in nutrition labelling of food products on the Australian market. A significant discrepancy between actual and declared values was detected with an average variation in precision of -13% to +61% for individual nutritional components. There is no tolerance limit established in the Australian food legislation but a ± 20% discrepancy is allowed in some countries and others have separate upper and lower limits and allow a maximum discrepancy of –20% for beneficial nutritional compounds and +20% for unfavourable compounds. Only 16% of the 70 products in the study would fully comply should a leeway of ±20% be introduced for any nutritional compound on the label. With separate upper and lower limits, 51% of products would fully comply. Compliance improved to 27% and 70% of products, respectively, when excluding variations in minor amounts irrelevant to consumers (counting all variations of less than 1g/100g, or 10kJ/100g for energy and 10mg/100g for sodium, potassium, calcium and cholesterol, as compliant). It is proposed that adoption of an upper and lower tolerance limit, excluding minor amounts, be considered as a way of better assisting the consumer in making relevant comparisons of product nutritional value and that any nutritional component should comply with the limit for the product to comply. Applying such a limit, 30% of products in the survey would not be compliant.
Key Words: Australia, nutrition labelling, food standards, analytical precision. Introduction Nutrition labels describe the nutrient content of foods and are intended to guide consumers in making the right food choice. Recognising the importance of nutrition labelling as a public health tool, the Codex Alimentarius Commission (Codex) and many food authorities worldwide have established guidelines or regulations on nutrition labelling for consumer protection.1 Codex adopted its Guidelines on Nutrition Labelling in 1985 and later amended them in 1993. They state that information supplied should be for the purpose of provi-ding consumers with a suitable profile of nutrients con-tained in the food and considered to be of nutritional im-portance. Tolerance limits are not specified but should be set in relation to public health concerns, shelf life, accuracy of analysis, processing variability and inherent lability and variability of the nutrient in the product, and, according to whether the nutrient has been added or is naturally occurring in the product.2
Over forty countries/regions have a nutrition-labelling program in place or are in the process of introducing such a system. Three general approaches can be identified, name-ly mandatory nutrition labelling for all pre-packaged foods (Argentina, Australia/New Zealand, Brazil, Canada, Hong Kong/China - in progress, Israel, Paraguay, the United States of America, Uruguay); mandatory nutrition labelling for specified foods and food with claims (Malaysia,
Thailand, Korea, Taiwan); and mandatory nutrition labelling only for pre-packaged foods with claims (Brunei, Chile, Ecuador, the European Union, Hungary, Indonesia, Japan, Mexico, the Philippines, Singapore, South Africa, Switzer-land, Thailand, Vietnam).3-5
In Australia, up until a few years ago nutrition labelling had only been compulsory where a food manufacturer made a nutrition claim such as 'low salt' or for food de-signed for a special purpose such as infant formula or a sports food. Many, but not all, food manufacturers in-cluded this information voluntarily because they recog-nised that there was consumer interest in nutrition and health. However, nutrition information was not appearing consistently in terms of content or format. Australian and New Zealand Health Ministers agreed to changes to food labelling requirements in November 2000. These changes apply to all foods manufactured or packaged after 20 December 2002. From this date nearly all manufactured foods must carry a nutrition information panel.6
Correspondence address: Stefan Fabiansson, PO Box 4196, Castlecrag, NSW 2068, Australia Tel: + 61 2 9958 4918; Fax: + 61 2 9958 2280 Email: [email protected] Accepted 14th February 2006

452 SU Fabiansson
Nutrition information panels provide information on the amount of energy (kilojoules), protein, total fat, satu-rated fat, carbohydrate, sugars and sodium (salt), as well as any other nutrient about which a claim is made. The food manufacturer can use average quantities when describing the nutritional composition allowing for sea-sonal variability and other known factors that could cause actual values to vary with the quantity determined from one or more of the following: • the manufacturer's analysis of the food; • calculation from the actual or average quantity of
nutrients in the ingredients used; • calculation from generally accepted data. Enforcement of the labelling requirements is the re-sponsibility of State and Territory Governments, the New Zealand Food Safety Authority, and the Australian Quarantine and Inspection Service. In New South Wales, this is the responsibility of the NSW Food Authority. Standards enforcement agencies have discussed the issue of enforceability of the Standard with the leeway given by the definition of ‘average values’ and how they may be determined for the nutritional information panel.7 The consensus view seems to be that there are flaws in the way the Standard is worded that hamper enforcement of the requirements and that considerable misinformation could be given to consumers through current labels. This could be particularly serious because of the current obesity debate where consumers now deliberately try to avoid energy dense food. The wrong label information could mislead consumers. The Authority decided in the second half of 2004 to check the accuracy of nutrition information panels pro-vided on a range of food for sale in New South Wales. The purpose of the study was to ascertain the precision of mandatory nutritional information provided on retail food products to determine if consumers get the intended information to make an informed choice. Materials and methods The NSW Food Authority bought quintuplicate samples of 70 different food products from ordinary supermarkets during October 2004 to May 2005. It only bought one sample at a time of each product to increase the likelihood
of sampling different batches of the product. It attempted to sample low claim as well as the conventional variety of products where available to check if extra attention was given to low claim labelling. Low claim products are foods that carry claims that they are ‘low’ in a particular undesirable nutrient such as sodium or fat. The overall sample comprised three bread products, six breakfast products, six dairy products, ten dessert products, four canned fruit products, eight jams and spreads, two noodle products, nine meat products, five condiments, two soup products, three prepared meals and eleven snack products. The Authority was successful in getting five samples from each product except for one where two of the samples were substituted for a closely related product from the same manufacturer of a similar composition. Samples were submitted to NSW Health’s Division of Analytical Laboratories for analysis of all nutritional components declared in the nutrition information panel. All methods used were accredited by the National Asso-ciation of Testing Authorities and as defined in AOAC or ISO official standards, as specified in the Australia New Zealand Food Standards Code (ANZFSC) or in some cases through systematic in-house validation. The energy value in kJ/100g was calculated by adding 37kJ/g of fat, 17kJ/g of protein and carbohydrate and 8kJ/g of total dietary fibre values (ANZFSC 1.2.8). Total carbohydrate was determined by subtracting from 100 the percentage moisture, protein, fat, fibre and ash (ANZFSC 1.2.8). Total solids and ash (indirectly moisture) was determined by measuring weight loss after drying of the sample in an oven (AOAC 935.36 & 923.03). Protein was determined by combustion (AOAC 935.36 & 923.03). Fat was determined through fat extraction after either acid or alkaline hydrolysis or through Soxhlet extraction de-pending on the material (AOAC 954.02, 922.06, 960.39 & AS 2300.1.3). Fatty acid composition was determined by gas chromatography of the methylated sample (AOAC 969.33). Cholesterol was saponified before gas chroma-tography (JAOAC vol. 72, 5, 1989). Total sugars were determined through high-pressure liquid chromatography. Total dietary fibre was determined through a combination enzymatic digestion and gravimetric method (AOAC 985.29). Sodium, potassium and calcium samples were
-300
-200
-100
0
100
200
300
400
500
600
Energy
Protein
Total fa
t
Satur
ated fa
t
Carbo
hydrate
s
Suga
rs
Sodiu
mFibre
Mon
ouns
atura
ted fat
Polyu
nsat
urate
d fat
Tran
s fatty ac
ids
Choleste
rol
Calcium
Potassium
Varia
tion (%
)
1200%
Figure 1. Precision in labelling for individual nutritional components on a sample basis. (The midpoint of the thick white bars indicates the mean with end points indicating positive and negative standard deviation. The thin black bars indicate the minimum and maximum variation.)

Nutritional information on food labels in Australia 453
digested in nitric acid and quantified using inductively coupled plasma-atomic emission spectroscopy ('modified' AOAC 984.27). Information given on the nutritional information panels was compared with results of the official analyses. Protein, total fat, total sugar, sodium, energy and total carbohydrate contents were determined for all 350 sam-ples. In addition, when the information was given on the label, sample results for total dietary fibre (118), saturated fat (269), monounsaturated fat (30), polyunsaturated fat (25), trans fatty acids (15), cholesterol (11), calcium (42), and potassium (60) were compared with the label infor-mation. All in all 2670 analytical results were recorded for the 350 samples. Results Precision in nutritional component information The overall precision in food label information for indi-vidual nutritional components is shown in Figure 1. The thick white bar indicates the mean (midpoint of bar) with positive and negative standard deviation. The thin black bar indicates the minimum and maximum variation de-tected. The information is based on analysis of the 350 food samples as separate entities and represents the situa-tion that would face a consumer buying the products in the survey. Of the 2670 individual analytical results, 183 (7%) corresponded exactly with the information given on the sample label. For individual nutritional components the difference between the analytical results and the declared values varied between an average of -13% (potassium) to +61% (trans fatty acids). Most accurate were cholesterol levels with 55% showing full equivalence between the label information and the analytical results with a range of -31.5% to 0%. However, only a minority of labels (11) included cholesterol levels and all of the accurate results
related to cholesterol free claims. Least accurate was trans fatty acid information with no label fully correct and a range of -98% to 1200%. Analytical results for a chips product varied between 0.05 to 1.3 g/100g against a. a de-clared value of 0.1 g/100g. A cookie product varied between 0.05 to 0.42 g/100g against a declared value of 0.5 g/100g. Again only a minority of panels (15) contained information on trans fatty acids. Variations of 19% in total carbohydrates between the analytical results and the label information could be partly caused by the use of the two different methods allowed in ANZFSC 1.2.8 for quantifying the constituent, the differential method used in this study or the additive method. Product average precision was calculated for the five analytical results for each nutritional component to allow for permitted ingredient and batch variations between samples. There is no indication in the Food Standards Code of the precision expected for the information given in nutritional information panels. Figure 2 illustrates in-formation reliability for individual compounds should a leeway of ±20% be applied (hatched bar), and the same leeway counting all variations of less than 1g/100g (10kJ/ 100g for energy and 10mg/100g for sodium, potassium, calcium and cholesterol) as compliant (dotted bar). Overall, 71% of the label information for the indi-vidual nutritional components as averaged across pro-ducts was within ± 20% of the actual results, increasing to 86% when excluding variations in minor amounts as de-fined above. However, there are large variations between the different nutritional components with compounds compulsory on all labels (the seven compounds to the left in Fig. 2) more accurate than compounds compulsory only when there are nutritional claims in relation to the product (the seven compounds to the right in Fig. 2). Fat seemed to be the most difficult to get accurate, although Figure 2. Precision in labelling for individual compounds as product averages applying a ±20% leeway. (The hatched bars represent all
samples and the dotted bars represent compounds with variations of less than 1g/100g - 10kJ/100g for energy, 10mg/100g for sodium, potassium, calcium and cholesterol excluded.)
0%
10%
20%
30%
40%
50%
60%
70%
80%
90%
100%
Energ
y
Prote
in
Total
fat
Satur
ated
fat
Carboh
ydra
tes
Sugars
Sodium Fibr
e
Mon
ouns
atur
ated f
at
Polyun
satu
rate
d fa
t
Trans f
atty a
cids
Choles
terol
Calciu
m
Potass
ium
Non
-com
plia
nce
(%)
All samples
Small variations excluded

454 SU Fabiansson
for several products this involved variations in minor amounts only. Another way of prescribing data precision is to use a maximum/minimum approach. Figure 3 illustrates the same information as in Figure 2 but applying a leeway of -20% of declared values for protein, carbohydrate, fibre, polyunsaturated and monounsaturated fat, potassium and calcium (lower limit compounds) and +20% of declared values for energy, total fat, saturated fat, trans fat, cho-lesterol, sugars and sodium (upper limit compounds). In other words, there is no upper limit for beneficial nutri-tional components and no lower limit for unfavourable nutritional components. As expected, reliability was improved when separately applying either an upper or a lower limit depending on the nutritional component. For compounds with mandatory labelling (the seven compounds to the left in Figure 3) there is 89% conformity with the suggested limit and for compounds where labelling is required only when a claim is made (the seven compounds to the right in Figure 3) the conformance is 80%, giving an average conformance of 88%. Again by excluding variations in minor amounts the conformance increased to 96% and 91%, respectively, with an average of 95%. Product inferred compliance The number of products that would fail should a leeway of ±20% or a separate upper limit of +20% or lower limit of -20% be introduced for any or several individual nu-tritional components on the product label was calculated. Results of this analysis are presented in Figure 4. The results have been split according to the number of com-pounds on a label exceeding the above limits. Only 16%
of the products would fully comply should a leeway of ± 20% be introduced for any nutritional compound on the label. By excluding compounds with variations in minor amounts as described previously, the proportion of com-pliant products increased to 27%. With separate upper and lower limits, 51% of products would fully comply, increasing to 70% when variations in minor amounts were removed from the analysis.
Low claim products There were 19 products in the sample with low energy or low fat claims. Of the 19 low claim products tested or 95 samples, 18 samples (19%) exceeded the value given for fat content, 63 samples (66%) exceeded the value given for energy, and 31 samples (33%) exceeded the value given for total sugar. The maximum variation in fat con-tent was 85%, in energy 183%, and in sugar 110%. A comparison was made between the label accuracy for low claim products compared to all other products without a claim. The number of products that would fail should a leeway of ±20% or a separate upper limit of +20% or lower limit of -20% be introduced for any or several individual nutritional components on the product label was calculated. Results of this analysis are presented in Figure 5. There is no better label accuracy for low claim products.
Discussion New food labelling requirements for mandatory nutrition labelling have been in force since late 2002 and com-panies are still finding the optimum way of arriving at accurate information. It seems very reasonable that
Figure 3. Precision in labelling for individual compounds as product averages applying a maximum of +20% for unfavourable compounds or a minimum of -20% for beneficial compounds. (The hatched bars represent all samples and the dotted bars represent products with variations of less than 1g/100g - 10kJ/100g for energy, 10mg/100g for sodium, potassium, calcium and cholesterol excluded.)
0%
10%
20%
30%
40%
50%
60%
70%
80%
90%
100%
Energy
Prote
in
Total fa
t
Satu
rated
fat
Carboh
ydrat
es
Sugars
Sodium
Fibre
Mon
ouns
atur
ated
fat
Polyun
satu
rated
fat
Trans
fatty
acid
s
Cholestero
l
Calciu
m
Potass
ium
Non
-com
plia
nce
(%)
All samples
Small variations excluded

Nutritional information on food labels in Australia 455
companies are allowed to use an average composition of their food products when calculating the nutrition infor-mation to be provided to consumers. However, there are no clear guidelines in the Australian nutrition information legislation of what variations are tolerable between what is declared on the label and the actual content. Tolerance limits can be found in some nutrition labelling regu-lations/guidelines worldwide.8 There are two approaches used: • the label value should fall within a specified range
(e.g ± 20% of the label value); • the label value should be equal/less than or equal/
more than a maximum or minimum value (e.g ≤ 120% of the label value or ≥ 80% label value).
The European Council Directive on nutrition labelling for foodstuffs9 is currently as vague as the Australian legislation although a specified range approach of 1.5g if the value is less than 10g/100g, 15% if the value is between 10-20g/100g and 3g if the value is more than 20g/100g for carbohydrates, protein and fat has been discussed and has been incorporated in some country legislation.10 More common is a specified range of ± 20% as is used in Japan, Taiwan and Thailand for macro-nutrients.8
The maximum/minimum approach is applied so that for nutrients that have a negative impact on health (e.g., total fat, saturated fat, cholesterol, sodium, etc.), the tolerance limit is generally set at ≤120% of the label value. On the other hand, for those that are positive to health (e.g protein, dietary fibre, vitamins, etc.), the tolerance limit is commonly set at ≥80% of the label value.
The United States Food and Drug Administration published final rules codifying the Nutrition Labelling and Education Act in 1993.11 These rules include com-pliance provisions stating that declarations of protein, total carbohydrate, other carbohydrate, polyunsaturated and mono-unsaturated fat or potassium must be at least equal to 80% of the value for that nutrient. The nutrient content of a food with a label declaration of calories, sugars, total fat, saturated fat, cholesterol, or sodium shall not be greater than 20% in excess of the value for that nutrient declared on the label. On January 1, 2003, Health Canada published similar label requirements listing 13 nutrients and calories.12 Mandatory nutrition labelling for most pre-packaged foods is required by 12 December 2005 for companies with greater than $1M in sales in the 12-month period prior to 12 December 2002. If less than $1M in sales, then the deadline is 12 December 2007. The principal acceptance criterion requires that the analysed nutrient content would have to be at least 80% of declared value for protein, carbohydrate, fibre, vitamins and minerals and not more than 120% of declared value for calories, fat, saturated fat, trans fat, cholesterol, sugars and sodium. The overall precision in nutrition labelling information found in this survey varies considerably from compound to compound. It was disappointing to see that as many as 84% of product labels using the specified range approach or 49% using the maximum or minimum approach missed international targets for at least one compound each. This improved to 73% and 30% when excluding variations smaller than 1g/100g (10kJ/100g for energy, 10mg/100g
Figure 4. Proportion of products compliant to (thick hatched) or exceeding (open and thin hatched) a leeway of ±20% (two-sided) or a maximum of +20% for unfavourable compounds or a minimum of -20% for beneficial compounds (one-sided). The second set of bars for each pair (marked limit) represents products with major variations (less than 1g/100g - 10kJ/100g for energy, 10mg/100g for sodium, potassium, calcium and cholesterol excluded).
0%10%20%30%40%50%60%70%80%90%
100%
Two-sided(all)
Two-sided(limit)
One sided(all)
One sided(limit)
Pro
por
tion
wit
hin
res
pec
tive
lim
it
Fully comp liant 1 non-compliant >1 non-compliant

456 SU Fabiansson
for sodium, potassium, calcium and cholesterol). In a similar study based on more than 2,000 laboratory tests on 300 samples of food products purchased off retail shelves in the USA, 91% percent of tests correctly listed nutrition information to within the 20% of upper and lower limits.13 Results varied somewhat for different nu-trients between the two studies with the following accu-racy (US results in brackets): • 97 (93) percent for energy • 81 (96) percent for total fat • 81 (93) percent for saturated fat • 86 (90) percent for sodium • 97 (98) percent for total carbohydrates, • 89 (95) percent for sugar • 100 (80) percent for cholesterol • 83 (80) percent of dietary fibre and • 100 (88) percent for calcium There was no indication in the US study of how many of the individual product labels that accurately listed all nutritional components. Companies must be accurate in the claims they make in relation to their low claim products. However, there was even a slight tendency for the accuracy to be worse in the present study. In several cases where large variations in precision were detected the actual amounts were less than 1g/100g. Such variations could be irrelevant to consumers. However, in many other cases, particularly in relation to low claim products, the label information could seriously mislead the consumer. Under the current legislation with no tolerance limits specified, there is no compliance role for enforcement agencies in relation to the actual nutrition panel infor-mation. It is proposed that adoption of the maximum/ minimum approach be considered as a way of better
assisting the consumer in making relevant comparisons of product nutritional value but leeway be given to varia-tions involving only small amounts. Acknowledgement We acknowledge the excellent work of the Food Chemistry Laboratory at the Division of Analytical Laboratories, Lid-combe, NSW under the leadership of Mounir Azer. We also thank all staff at the NSW Food Authority involved in field sampling. References 1. Van den Wijngaart AWEM. Nutrition labelling: purpose,
scientific issues and challenges. Asia Pac J Clin Nutr 2002; 11(2): S68-S71.
2. Codex guidelines on nutrition labelling. CAC/GL 2-1985 (Rev. 1 – 993). Codex Alimentarius Commission, Rome. Accessed 11 November 2005 at: http://www.codex alimentarius.net/download/standards/34/CXG_002e.pdf
3. Updates on overseas practice on nutrition information on food labels. Food and Environmental Hygiene Division, Health, Welfare and Food Bureau, the Government of the Hong Kong Special Administrative Region. Accessed 11 November 2005 at: http://www.hwfb.gov.hk/ download/ press_and_publications/otherinfo/050826_labelling/tech_meeting3_overseas_updates.pdf
4. Tee E-S, Tamin S, Ilyas R, Ramos A, Tan W-L, Lai DK-S, Kongchuntuk H. Current status of nutrition labelling and claims in the South-East Asian region: are we in harmony? Asia Pac J Clin Nutr 2002; 11(2): S80-S86.
5. Hurt E. Nutrition labelling: European Union and United Kingdom perspectives. Asia Pac J Clin Nutr 2002; 11(2): S77-S79.
6. Curran MA. Nutrition labelling: perspectives of a bi-national agency for Australia and New Zealand. Asia Pac J Clin Nutr 2002; 11(2): S72-S76.
0%
10%
20%
30%
40%
50%
60%
70%
80%
90%
100%
Two-side
d
Low cl
aim tw
o-side
d
Two-side
d (l im
i t)
Low cl
aim tw
o-side
d (lim
it)
One si
ded
Low cl
aim on
e side
d
One si
ded (
l imi t)
Low cl
aim on
e side
d (l im
it)
Pro
por
tion
wit
hin
res
pec
tive
lim
it
Fully compliant Non-compliant
Figure 5. Comparison of low claim and other products compliant to (thick hatched) or exceeding (open) a leeway of ±20% (two-sided) or a maximum of +20% for unfavourable compounds or a minimum of -20% for beneficial compounds (one-sided) with major variations only marked limit (less than 1g/100g - 10kJ/100g for energy, 10mg/100g for sodium, potassium, calcium and cholesterol excluded)

Nutritional information on food labels in Australia 457
7. Accuracy of Nutrition Information Panels. Department of Health, Government of Western Australia, Perth. Accessed 11 November 2005 at: http://www.population.health. wa.gov.au/environmental/resources/Accuracy nutrition info panels 051024.pdf
8. Tolerance limits for energy and nutrients declarations on nutrition labels. Food and Environmental Hygiene Department, Hong Kong. Accessed 11 November 2005 at: http://www.hwfb.gov.hk/download/press_and_publications/otherinfo/050826_labelling/tech_meeting3_tolerance_limits_table.pdf
9. Council of European Communities (1990) European Council Directive 90/496/EEC, Brussels. Accessed 11 November 2005 at: http://europa.eu.int/smartapi/cgi/sga_ doc?smartapi!celexapi!prod!CELEXnumdoc&lg-EN& numdoc=31990L0496&model=guichett
10. Livsmedelsverkets föreskrifter och allmänna råd om näringsvärdesdeklaration - SLVFS (1993:21). Swedish Food Administration, Uppsala. Accessed 11 November 2005 at: http://www.slv.se/upload/ dokument/ Lagstiftning/ 1990-1995/1993_21.pdf
11. Nutrition labeling of food – 21CFR§101.9. Food and Drug Administration, Department of Health and Human Services, Washington DC. Accessed 11 November 2005 at: http://www.accessdata.fda.gov/scripts/cdrh/cfdocs/cfcfr/CFRSearch.cfm?FR'101.9
12. Regulations amending the Food and Drug Regulations (nutrition labelling, nutrient content claims and health claims). Health Canada, Ottawa. Accessed 11 November 2005 at: http://canadagazette.gc.ca/ partII/2003/ 20030101/ html/sor11-e.html
13. Whitmore A. Nutrition facts labels getting it right. Food and Drug Administration, Washington DC. Accessed 11 November 2005 at: www.cfsan.fda.gov/~lrd/ hhsfacts.html

458 SU Fabiansson
Original Article Precision in nutritional information declarations on food labels in Australia Stefan U Fabiansson BVSc, PhD
NSW Food Authority, 6 Avenue of the Americas, Newington NSW 2127, Australia
澳洲澳洲澳洲澳洲的的的的食品標籤食品標籤食品標籤食品標籤上的上的上的上的營養營養營養營養資訊聲明資訊聲明資訊聲明資訊聲明的精確性的精確性的精確性的精確性
營養標示導引消費者對食物的選擇。自2002年底,澳洲已經強制要求使用新規範的營養標示。本研究分析涵蓋70個不同產品的350個樣本中的營養標示上所宣稱的營養成分。這是第一個企圖定量在澳洲市場上食品類商品營養標示精確性的大型研究。研究發現實際值與宣稱值存在顯著的差異,平均個別營養成分的平均精確性變異度在-13%到+61%之間。 澳洲食品法 規並未 規範忍
受上限,但是有一些國家允許±20%的不一致性,而部份國家則分別規範上限跟下限,並且允許有益的營養成份最大不一致性在-20% 及不 好的 成分 在
+20%。在研究的70個產品中只有16%的商品所標示的任一營養成分能完全符合±20%。若有不同的上下限,則有51%的產品能完全遵守規範。當去除與消費者不相關的小量變異(將所有變異小於1g/100g或是熱量100KJ/g及鈉、鉀、鈣及膽固醇10mg/100g記算在內,當作遵從),則各有27%及70%產品的遵從度獲得改善。本研究建議應採用上下限,但去除小變異者,這樣才是協助消費者做產品與營養相關比較的較好的方式,而且任何營養組成份均應符合該規範。應用這樣的上下限規範,本研究中有30%的產品是不合格的。
關鍵字:澳洲、營養標示、食品標準、分析精確度。

Asia Pac J Clin Nutr 2006;15 (4): 459-464 459
Original Article Under-reporting of energy intake affects estimates of nutrient intakes Parvin Mirmiran PhD, Ahmad Esmaillzadeh MS and Fereidoun Azizi MD
Endocrine Research Center, Shaheed Beheshti University of Medical Sciences, Tehran, Iran
Under-reporting of energy intake is a common problem in nutritional epidemiological studies. The aim of the present study was to determine the effect of under-reporting of energy intake on the estimates of nutrient intakes. In this cross-sectional study, 901 subjects aged >16 y were randomly selected from participants of the Tehran Lipid and Glucose Study. Dietary intake was assessed by means of two 24-hour dietary recalls. Basal metabolic rate (BMR) was determined according to age, sex and weight. The ratio of energy intake (EI) to BMR was calculated. Under-reporting of energy intake was defined as EI:BMR<1.35 and normal-reporting of dietary intake as EI : BMR = 1.35 - 2.39. To obtain energy-adjusted amounts of macro- and micronutrients, the residual method was used. Under-reporting of energy intake was revealed in 31% of the subjects and was more common among females (40%) than males (19%, P <0.01). The mean age of females who under-reported was significantly lower than the normal-reporting females (32 ± 13 vs. 35 ± 14 y, P <0.05); however, the age difference between the two groups was not significant in men. Under-reporters had higher BMIs compared to normal-reporters in both genders. The absolute intakes of macro- and micronutrients (except for B12 in females and B6 and zinc in both genders) were lower in under-reporters, but following adjustment, no significant differences were seen. The results have revealed that under-reporting of energy intake affects the estimates of nutrient intakes; thus in studies aimed at determining the association between a certain chronic disease and a nutrient intake, we suggest adjustments be made for energy intake.
Key Words: Under-reporting, energy intake, nutrients, diet, Iran. Introduction Accurate assessment of energy intake is particularly impor-tant in nutritional epidemiology. The search for the identi-fication of a gold standard for assessing the validity of reported energy intake, lead to the introduction of Doubly Labelled Water (DLW) method as an accurate method for determining energy expenditure. However, because of the high cost and complexity involved in the use of this tech-nique in large epidemiological studies, Goldberg et al.,1 suggested the ratio of energy intake to basal metabolic rate (EI: BMR) for detecting misreporting of energy intake. Other investigators have confirmed this index.2 Several studies have assessed the accuracy of reported energy intakes at population levels and demonstrated that under-reporting of energy intake is more prevalent, par-ticularly among obese people.3-5 Others reported that some foods were under-reported more than others.6-7 As obesity is the underlying cause of many of chronic diseases and under-reporting of energy intake is more prevalent among obese people, research on the issue of diet-disease relation-ship may not yield precise answers. When the research topic is the association between a macronutrient or micro-nutrient intake with a certain chronic disease, it should be kept in mind whether or not the estimates of that nutrient intake are affected by under-reporting of energy intake. Limited studies conducted on this issue have focused on macronutrients8-10 and it remains unknown whether the
estimates of micronutrient intakes are affected by under-reporting. This study was therefore conducted to assess the effect of under-reporting of energy intake on the estimates of macro- and micronutrient intake in a group of Tehran-ian participants of the Tehran Lipid and Glucose Study (TLGS). Subjects and methods Subjects This cross-sectional study was conducted within the frame-work of the Tehran Lipid and Glucose Study (TLGS), a prospective study performed on residents of district 13 of Tehran with the aim of determining the prevalence of non-communicable disease risk factors and developing a healthy lifestyle to curtail these risk factors.11,12 In the TLGS, 15005 people aged 3 years and over, living in district 13 of Tehran, were selected by the multistage cluster random sampling method. A subsidiary population aged 16-80 years old consisting of 901 subjects (390 males and 511 females) were selected randomly for dietary Correspondence address: Dr Fereidoun Azizi, Endocrine Research Center, Shaheed Beheshti University of Medical Sciences, P.O. Box: 19395-4763, Tehran, I.R. Iran Tel: +98 21 2409309; Fax: + 98 21 2402463 Email: [email protected] Accepted February 1st 2006

460 P Mirmiran, A Esmaillzadeh and F Azizi
assessment. It should be kept in mind that this sample also includes those who were on a weight-reducing diet. The proposal of this study was approved by the research council of the Endocrine Research Center of Shaheed Beheshti University of Medical Sciences and informed written consent was obtained from each subject. Methods Subjects were interviewed privately, face-to-face. Inter-views were conducted by trained dietitians using a pre-tested questionnaire. Initially information on socio-demographic variables was collected. Anthropometric measurements of weight and height were determined using a digital electronic weighing scale and tape meter while the subjects were lightly clothed and wearing no shoes or restrictive underwear. Weight was recorded to 100g and height to the nearest 1cm. All measurements were made by the same individual to reduce subjective error and maintain uniformity.13 Body mass index (BMI) was calculated as weight in kilograms divided by height in meters squared. Obesity was defined as BMI≥ 30 kg/ m2. Trained nutritionists, who had at least 5 years of experience in the Nationwide Household Food Con-sumption Survey Project, collected dietary data using two quantitative 24-hour dietary recalls. The first recall was completed at the subject’s home and the second at the TLGS Research Unit within 3 days after the first one by the same interviewer. Subjects were asked to recall all foods and beverages consumed during the preceding 24-hours. To assist subjects to recall accurately, household utensils were used. Mothers were asked about the type and quantity of meals and snacks when subjects were unable to recall. Food values were usually recorded as household measures in details. Portion sizes of consumed foods were converted to grams using household mea-sures.14 Each food and beverage was then coded accor-ding to the prescribed protocol and analyzed for content of energy and the other nutrients using the Nutritionist III software program modified for Iranian foods. The basal Metabolic Rate (BMR) was calculated based on weight, age and sex according to Schofield’s equations.15 Goldberg et al.,1 calculated the minimum requirement of energy based on measuring total energy expenditure by whole-body calorimetry and coefficients for physical activity levels suggested by FAO/WHO/UNU.16
They found that an EI: BMR <1.35 was not consistent
with usual dietary intake. We therefore defined under-reporting of energy intake as EI: BMR <1.35. Since a cut-off point of EI: BMR ≥2.4 has been suggested by Black et al., as over-reporting of energy intake, we used a range of 1.35-2.39 as normal-reporting of dietary intake.1 Statistical Methods Findings are shown as mean ± SD. Student t test was used to detect any differences between quantitative varia-bles. The residual method was used to obtain energy-adjusted amounts of macro-and micronutrient intakes; therefore total energy intake was considered as an inde-pendent variable and absolute amounts of macro- and micro-nutrients were considered as dependent variables in linear regression models. Pearson correlation coefficients were used to assess the relationship between quantitative variables. The qui-square test was applied for detecting differences in proportions. The P value was considered significant at <0.05. All statistical analyses were con-ducted using SPSS (SPSS, Inc. Chicago, IL: Version 9.05) for windows.
Results Men were older (37±14 vs. 33±14 y, P<0.01) and had a lower BMI (25.0±4.4 vs. 26.0±5.4 kg/m2, P<0.01) com-pared to women. Total energy intake (2747±616 vs. 2016±549 kcal/d, P<0.01) and EI: BMR (1.64±0.34 vs. 1.43±0.39, P<0.01) was higher in men than women. Men also had higher BMR than women (1674±206 vs. 1411±123 kcal, P<0.01). The body mass index was in-versely associated with EI: BMR in both men (R=-0.45, P<0.01) and women (R=-0.49, P<0.01). Under-reporting (40% VS. 19%, P<0.01) and obesity (23% vs. 12%, P <0.01) was more prevalent among women than men. General characteristics of under-reporters compared to normal-reporters are shown in Table 1. Female under-reporters were older compared to normal-reporters (35 ± 14 vs. 32 ± 13 y, P<0.05), whereas there was no sig-nificant difference between male under- and normal-reporters with regards to age. Under-reporters had a higher BMI compared to normal-reporters in either gender (males: 26.7±4.5 vs. 24.5±4.3 kg/m2, P<0.01 and females: 27.7±5.4 vs. 24.8±5.1 kg/m2, P<0.01). The pre-valence of under-reporting of energy intake increased with BMI in both genders, such that the highest preva-lence was seen among obese subjects (data not shown).
EI: BMR Males Females
Variables <1.35
(n=77) 1.35-2.39 (n= 313)
<1.35 (n=209)
1.35-2.39 (n=302)
Age (y) 39 ± 14 37 ± 14 35 ± 14 32 ± 13† Weight (kg) 79 ± 13 71 ± 13* 69 ± 14 62 ± 12* Height (cm) 172 ± 6 170 ± 6 157 ± 6 158 ± 6 BMI (kg/m2) 26.7 ± 4.5 24.5 ± 4.3* 27.7 ± 5.4 24.8 ± 5.1* Energy intake (kcal) 2014 ± 341 2926 ± 529* 1517 ± 323 2362 ± 387* BMR (kcal) 1748 ± 207 1655 ± 201* 1441 ± 113 1391 ± 112* EI: BMR 1.15 ± 0.13 1.77 ± 0.26* 1.05 ± 0.21 1.70 ± 0.26* * P<0.01 and † P<0.05 compared to <1.35 group.
Table 1. General characteristic of under- and normal-reporters by gender

Under-reporting and nutrient estimates 461
Table 2 shows absolute and calorie-adjusted amounts of macronutrient intakes in under- and normal-reporters. Absolute amounts of carbohydrate, protein and fat intake were significantly lower in under-reporters compared to normal-reporters, both in males and females, whereas calorie-adjusted amounts of these macronutrients were not significantly different between these two groups. This was also the case for most of the micronutrient intakes in males (Table 3) and females (Table 4). Absolute amounts of all micronutrient intakes, except for B2 intake in females and B6 and zinc intakes in both genders were lower in under-reporters than normal-reporters, while after controlling for the effect of energy intake, there was no significant difference between under- and normal-reporters with regards to micronutrient intakes.
Discussion The present study, conducted in an urban population of Tehran, showed that under-reporting of energy intake affects estimates of macro- and micronutrient intakes. Under-reporting of energy intake was positively asso-ciated with body mass index and obese subjects had the highest rate of under-reporting. Absolute amounts of nutrient intakes were positively related to EI: BMR. Absolute amounts of macro- and micronutrient intakes were lower in under-reporters compared to normal-reporters, whereas after controlling for the effect of energy intake, there was no significant difference between under- and over-reporters with regard to nutrient intakes.
Table 2. Absolute and energy-adjusted amounts of macronutrients intakes in under- and normal-reporters
EI: BMR Males Females
<1.35 (n=77)
1.35-2.39 (n= 313)
<1.35 (n=77)
1.35-2.39 (n= 313)
Absolute amounts (g/d)
Carbohydrate 311 ± 62 432 ± 84* 277 ± 55 342 ± 65* Protein 60 ± 15 84 ± 20* 46 ± 11 65 ± 13* Fat 62 ± 18 99 ± 33* 49 ± 16 85 ± 27*
Energy-adjusted amounts (g/d)
Carbohydrate 348 ± 11 351 ± 17 308 ± 14 307 ± 17 Protein 77 ± 6 76 ± 8 55 ± 8 57 ± 10 Fat 87 ± 11 88 ± 13 80 ± 12 79 ± 10 * P<0.01 compared to <1.35 group.
Table 3. Absolute and energy-adjusted amounts of micronutrients intakes in male under- and normal-reporters
EI: BMR (Absolute amounts) EI: BMR (Energy-adjusted amounts) Dietary intakes <1.35 1.35-2.39 <1.35 1.35-2.39
Vitamin C (mg) 100 ± 60 130 ± 68* 120 ± 9 125 ± 4 Thiamine (mg) 1.4 ± 0.4 2.1 ± 0.6* 2.0 ± 0.07 1.9 ± 0.03 Riboflavin (mg) 1.1 ± 0.4 1.5 ± 0.6† 1.5 ± 0.07 1.4 ± 0.03 Vitamin B6 (mg) 0.5 ± 0.2 0.7 ± 0.3 0.7 ± 0.03 0.7 ± 0.01 Vitamin B12 (µg) 1.8 ± 1.4 2.3 ± 1.8† 2.3 ± 0.2 2.2 ± 0.1 Iron (mg) 21 ± 7 28 ± 8 27 ± 1 26 ± 1 Zinc (mg) 4 ± 2 5 ± 2 4 ± 1 5 ± 1 Calcium (mg) 598 ± 215 716 ± 253* 727 ± 31 685 ± 14 Phosphorus (mg) 644 ± 198 856 ± 298* 857 ± 33 805 ± 15 Magnesium (mg) 170 ± 40 135 ± 65† 135 ± 8 129 ± 4 Potassium (mg) 1955 ± 638 2427 ± 816† 2397 ± 100 2320 ± 43 * P<0.01 and † P<0.05 compared to <1.35 group.
Table 4. Absolute and energy-adjusted amounts of micronutrients intakes in female under- and normal-reporters
EI: BMR (Absolute amounts) EI: BMR (Energy-adjusted amounts) Daily dietary intakes <1.35 1.35-2.39 <1.35 1.35-2.39
Vitamin C (mg) 98 ± 59 130 ± 63* 120 ± 5 114 ± 4 Thiamine (mg) 1.1 ± 0.3 1.6 ± 0.3* 1.4 ± 0.02 1.4 ± 0.02 Riboflavin (mg) 1.0 ± 0.3 1.3 ± 0.4 1.2 ± 0.03 1.2 ± 0.02 Vitamin B6 (mg) 0.5 ± 0.2 0.6 ± 0.2 0.6 ± 0.02 0.5 ± 0.01 Vitamin B12 (µg) 1.4 ± 1.2 1.8 ± 1.7† 1.5 ± 0.1 1.7 ± 0.1 Iron (mg) 15 ± 5 22 ± 6* 19 ± 1 19 ± 1 Zinc (mg) 3 ± 2 4 ± 2 4 ± 1 4 ± 1 Calcium (mg) 512 ± 210 636 ± 243† 603 ± 20 574 ± 16 Phosphorus (mg) 537 ± 177 736 ± 220* 649 ± 17 658 ± 13 Magnesium (mg) 99 ± 72 122 ± 50* 118 ± 5 109 ± 4 Potassium (mg) 1755 ± 586 2264 ± 686* 2121 ± 54 2011 ± 43 * P<0.01 and † P<0.05 compared to <1.35 group.

462 P Mirmiran, A Esmaillzadeh and F Azizi
We used two 24-hour dietary recalls for collecting dietary data to obtain more detailed data for research purposes. Other epidemiologic studies such as the Ten State Nutrition Survey,17 NHANES I18 and the Multiple Risk Factor Intervention Trial19 have used the recall me-thod alone or in combination with other dietary assess-ment methods for gathering dietary data. Collecting die-tary data for two days could provide more accurate esti-mates of dietary intake as compared to just for one day. The validity of data provided by this method has been reported previously20 and it has been shown that estimates obtained from recalls are comparable to those obtained with more precise methods such as dietary records.21,22 In the present study, the ratio of EI: BMR has been used for assessing the accuracy of reported energy intake data. Goldberg et al.,1 calculated the minimum require-ment of energy based on measuring of total energy expenditure by whole-body calorimetry and coefficients for physical activity levels suggested by FAO/WHO/ UNU16 and found that an EI: BMR<1.35 was not con-sistent with usual dietary intake. Other studies also have used EI: BMR to identify under-reporters, but the difference between methods used in various studies for gathering dietary data and different equations for BMR and different cut- off points to identify under-reporters could lead to the difference in findings of these studies. Overall prevalence of under-reporting of energy intake in the TLGS using a cut-off point of 1.35 was 31% that was related to age, sex, obesity and smoking.23 Therefore, under-reporters are not randomly distributed among our population and this phenomenon is exclusive to some special groups of the population. In the present study, nutrient intakes were lower in under-reporters than normal-reporters, but the energy-adjusted amounts of these nutrients were not significantly different between these two groups. Voss et al.,8 also showed that absolute amounts of macronutrients were lower in under-reporters compared to those with higher EI: BMR, but after controlling for the effect of energy intake, they have reported no difference between under-reporters and those with high EI: BMR with regard to macronutrients intake. Pryer et al.,24 reported lower amounts of macronutrient intakes among under-reporters, whereas after adjusting for energy intake with the nutrient density method, they showed that under-reporters ate diets with a lower density of carbohydrate and higher densities of protein, starch, cholesterol, MUFA, PUFA and most micronutrients compared to normal-reporters. Similar findings were also reported by Samaras et al.,25 Other investigators have suggested that after controlling for energy intake, under-reporters can be used in the analysis.26 Contradictory to our findings, Hirvonen et al.,27 have shown that in Finnish subjects, after excluding under-reporters, the contribution of macronutrients to energy did not change significantly and they reported that an in-creasing prevalence of under-reporting does not ne-cessarily distort dietary surveys. Such a finding has also been reported by Australian investigators.28 However it should be kept in mind that different studies have used different methods of energy adjustment. Some studies
have used the residual method and others used the nu-trient density method for controlling the effect of energy. The nutrient density method is used as an absolute amount of nutrients divided by total energy intake. This method of adjustment is dependent on changes in energy intake,29 such that calorie-adjusted amounts of nutrients obtained by using this method are still correlated with energy intake. Therefore, using the nutrient density method is not appropriate in studies looking for the diet-disease relationship and it is recommended that investi-gators use energy-adjusted amounts of nutrients by resi-dual method in assessing this relationship, because these amounts are independent of total energy intake. The results of the present study also showed that the energy-adjusted amounts of nutrients are independent of the EI: BMR ratio. As total energy intake is related to most chronic dis-eases and under-reporting of energy intake affects esti-mates of most nutrients, therefore, the method of ob-taining energy-adjusted amounts of nutrients is necessary in studies looking for diet-disease associations. Acknowledgement This study was supported by grant No. 121 from the National Research Council of the Islamic Republic of Iran and by the combined support of the National Research Council of Islamic Republic of Iran and Endocrine Research Center of Shaheed Beheshti University of Medical Sciences. We thank the participants of the Tehran Lipid and Glucose Study for their enthusiastic support and the staff of the Endocrine research Center, Tehran Lipid and Glucose Study unit, for their valuable help in conducting this study. None of the authors had any personal or financial conflicts of interest. References 1 Goldberg GR, Black AE, Jebb SA, Cole TJ, Murgatroyd
PR, Coward WA, Prentice AM. Critical evaluation of energy intake data using fundamental principals of energy physiology: Derivation of cut-off limits to identify underreporting. Eur J Clin Nutr 1991; 45:569-81.
2 Black AE, Coward WA, Cole TJ, Prentice AM. Human energy expenditure in affluent societies: an analysis of 574 doubly-labeled water measurements. Eur J Clin Nutr 1996; 50: 72-92.
3 Johansson L, Soluoll K, Bjorneboe GEA, Drevon CA. Under- and over-reporting of energy intake related to weight status and lifestyle in a nationwide sample. Am J Clin Nutr 1998: 68:266-74.
4 Luehrmann PM, Herbert BM, Neuhauser- Berthold M. Underreporting of energy intake in an elderly German population. Nutrition 2001; 17: 912-6.
5 Johansson G, Wikman A, Ahren AM, Hallmans G, Johansson I. Underreporting of energy intake in repeated 24-hour recalls related to gender, age, weight status, day of interview, educational level, reported food intake, smoking habits and area of living. Public Health Nutr 2001; 4: 919-27.
6 Lafay L, Mennen L, Basdevant A, Charles MA, Borys JM, Eschwege E, Roman M. Does energy intake underreporting involve all kinds of food or only specific food items? Int J Obes Relat Metab Disord 2000; 24: 1500-6.
7 Goris AH, Westerterp-Plantenga MS, Westerterp KR. Undereating and underrecording of habitual food intake in obese men: selective underreporting of fat intake. Am J Clin Nutr 2000; 71: 130-4.

Under-reporting and nutrient estimates 463
8 Voss S, Kroke A, Klipstein-Grobusch K, Boeing H. Is macronutrient composition of dietary intake data affected by underreporting? Results from the EPIC-Potsdam study. Eur J Clin Nutr 1998; 52:119-26.
9 Lissner L, Lindroos AK. Is dietary underreporting macronutrient-specific. Eur J Clin Nutr 1994; 48: 453-4.
10 Rutishauser IH. Is dietary underreporting maconutrient-specific. Eur J Clin Nutr 1995; 49: 219-20.
11 Azizi F. Rahmani M, Emami H, Madjid M. Tehran Lipid and Glucose Study: rationale and design. CVD prevention 2000; 3: 242-7.
12 Azizi F, Allahverdian S, Mirmiran P, Rahmani M and Mohammadi F. Dietary factors and body mass index in a group of Iranian adolescents: Tehran Lipid and Glucose Study-2. Int J Vitam Nutr Res 2001; 71,123-7.
13 Jelliffe DB, Jelliffe EFP. Community nutritional assess-ment. Oxford University Press, 1989; 36-110.
14 Ghaffarpour M, Houshiar-Rad A and Kianfar H. The manual for household measures, cooking yields factors and edible portion of foods, Keshavarzi Press, Tehran. 1999; 1-46 (in Farsi).
15 Commission of the European Communities. Reports of the Scientific Committee for Food: nutrient and energy intakes for the European community. Luxembourg: Office for Official Publications of the European Communities, 1992.
16 FAO/WHO/UNU. Report of joint expert consultation. Energy and protein requirements. WHO Tech Rep Series. No 724, Geneva.
17 Ten-State Nutrition Survey 1968 –70. V. Dietary. DHEW puble (HSM) 72-8133, U.S. Dept. Health, Education and Welfare, Atlanta, Ga: Center for Disease Control.
18 Kant AK. Nature of dietary reporting by adults in third NHANES. J Am Coll Nutr 2002; 21: 315-27.
19 Grandits GA, Bartsch GE, Stamler J. Method issues in dietary data analyses in the Muliple Risk Factor Intervention Trial. Am J Clin Nutr 1997; 65: 211 S-27S.
20 Gersovitz M, Madden JP, Smiciklas-Wright H. Validity of the 24- hour dietary recall and seven-day record for group comparisons. J Am Diet Assoc 1987; 45: 469-75.
21 Aluwalia N, Lammi-Keefe CJ. Estimating the nutrient intake of older adults: components of variation and the effect of varying the number of 24-hour recalls. J Am Diet Assoc 1991; 91: 1438-9.
22 McAvay G, Rodin J. Inter-individual and intra-individual variation in repeated measures of 24-hour dietary recall in the elderly. Appetite 1988; 97-110.
23 Azizi F, Esmaillzadeh A, Mirmiran P. Correlates of under- and over-reporting of energy intake in Tehranians: body mass index and lifestyle-related factors. Asia Pac J Clin Nutr 2005;14: 54-9.
24 Pryer JA, Vrijheid M, Nichols R, Kiggins M, Elliott P. Who are the low energy reporters in the dietary and nutritional survey of British adults? Int J Epidemiol 1997; 26: 146-54.
25 Samaras K, Kelly PJ, Campbell LV. Dietary underreporting is prevalent in middle-aged British women and is not related to adiposity. Int J Obes Relat Metab Disord 1999; 23: 881-8.
26 Gnardellis C, Boulou C, Trichopoulou A. Magnitude, determinants and impact of under-reporting of energy intake in a cohort study in Greece. Public Health Nutr 1998; 1: 131-7.
27 Hirvonen T, Mannisto S, Roos E, Pietinen P. Increasing prevalence of underreporting does not necessarily distort dietary surveys. Eur J Clin Nutr 1997; 51: 297-301.
28 Smith WT, Webb KL, Heywood PF. The implications of underreporting in dietary studies. Aust. J. Public Health. 1994; 18: 311-14. (Abstract).
29 Willett WC, Stampfer MJ. Total energy intake: implications for epidemiologic analysis. Am J Epidemiol 1986; 124: 17-27.

464 P Mirmiran, A Esmaillzadeh and F Azizi
Original Article Under-reporting of energy intake affects estimates of nutrient intakes Parvin Mirmiran PhD, Ahmad Esmaillzadeh MS and Fereidoun Azizi MD
Endocrine Research Center, Shaheed Beheshti University of Medical Sciences, Tehran, Iran
熱量攝取量低報影響營養素攝取的評熱量攝取量低報影響營養素攝取的評熱量攝取量低報影響營養素攝取的評熱量攝取量低報影響營養素攝取的評估估估估 熱量攝取量低報在營養流行病學的研究中是個普遍存在的問題。本研究的目的為評估熱量攝取量低報對營養素攝取量估計的影響。在這個橫斷性研究中,從「德黑蘭脂質及葡萄糖研究」中隨機選取 901名年齡大於 16 歲的研究對象。採用兩次 24 小時飲食回憶評估飲食攝取量。依據年齡、性別及體重去估算基礎代謝率(BMR),並計算能量攝取(EI)與 BMR 的比值。EI:BMR<1.35 定義為熱量攝取量低報,而 EI:BMR=1.35-2.39為合理的飲食攝取估算。使用殘差法進行能量校正,計算出巨量及微量營養素的攝取量。有 31%的研究對象有低報熱量攝取量的現象,女性(40%)高於男性(19%,P<0.01)。低報熱量攝取量的女性其年齡顯著低於確實報告的女性(32±13 vs. 35±14歲,P<0.01);但是,在男性中兩組的年齡卻沒有顯著的差異。不論男女性中,低報者較確實報告者有較高的BMI。低報者巨量及微量營養素的絕對攝取量均較低(女性的 B12及男女性的 B6
及鋅),但是經過校正之後則沒有顯著差異。本研究結果顯示出低報熱量攝取量會影響到營養素攝取量的估算,因此本研究建議當進行慢性疾病及營養素攝取量的相關性評估時,需校正熱量攝取量。
關鍵字:低報、熱量攝取量、營養素、飲食、伊朗。

Asia Pac J Clin Nutr 2006;15 (4): 465-473 465
Original Article Calibration and reliability of a school food checklist: a new tool for assessing school food and beverage consumption Peter J Kremer BA, BSc (Hons), Grad Dip (Mntl Hlth Sc), PhD, A Colin Bell BSc (Hons), MSc,
PhD and Boyd A Swinburn MB ChB, MD, FRACP Centre for Physical Activity and Nutrition Research, Deakin University – Waterfront Campus Gheringhap Street, Geelong, AUSTRALIA 3217
There is a pressing need in Australia and other countries to develop systems for monitoring secular trends in childhood obesity and related behavioural and environmental determinants. Energy from foods and beverages consumed at school is an accessible indicator of children’s eating patterns and we have developed a school food checklist (SFC) to measure this. The SFC records the number of serves and source (home, canteen, vending machine) of 20 food and beverage categories. This study aims to assess the accuracy and to calibrate the SFC by comparing it to a weighed record (WR) and to evaluate inter-recorder reliability. Participants were 910 primary school children aged 5 to 12 years from a rural township in Victoria, Australia. WR were collected from a non-random sub-sample of 106 and a second sub-sample (n=46) had intake measured twice using the SFC to assess inter-recorder reliability. Mean energy values were 2992 kJ ± 924 and 3008 kJ ± 952 for the SFC and WR respectively and the correlation coefficient was strong (Pearson r = 0.77). The mean difference between the WR and SFC methods was 15 kJ (95% CI, -107 kJ to 138 kJ) and the limits of agreement (+2 standard deviations) were ± 1270 kJ. The SFC overestimated the energy/serve of breads and fruit drinks and under-estimated energy/serve from fat spreads, biscuits/crackers, muesli/fruit bars and fruit. Inter-recorder reliability was good (kappa 0.51). The SFC was designed to measure energy from food and beverages in schools. It has good accuracy and reliability and the revised version should further improve accuracy of the instrument.
Key Words: dietary assessment, schools, obesity prevention, children Introduction The prevalence of childhood obesity is increasing in Australia and it is likely that inappropriate eating patterns are a major contributor. This is difficult to demonstrate however, because we do not have a system in place to regularly monitor children’s eating patterns. For other epidemics, such as tobacco and road injuries, monitoring has been invaluable for benchmarking current status, tracking prevalence and informing decision makers.1,2 Unfortunately, this is not the case for obesity. The last national health and nutrition survey in Australia was in 1995. Moreover, very few instruments exist to indicate current status and trends in obesity promoting behaviours or environments. Consequently, there have been very few studies describing what children eat at schools in Australia. The lack of tools, and therefore data, not only hinders our ability to monitor key determinants of obesity but it also hinders our ability to evaluate the effectiveness of obesity prevention initiatives. To be of value for monitoring population health, an indicator needs to be related to health outcomes (in this case obesity) and be simple, reliable (repeatable), cost effective, sensitive (to measure change), easy to understand and relevant to decision-makers.3
Using these criteria, our goal was to develop an indicator of children’s school food and beverage con-sumption that could be used to monitor eating patterns. We were particularly interested in schools because they offer ready access to children and food and beverages consumed at school are likely to reflect a child’s overall eating patterns4 – particularly in Australia, where most children bring lunches that have been packed at home.5 Moreover, there is growing evidence to suggest that schools and other settings can have an important influence on children’s eating behaviours.6,7 The instru-ment we developed was an administered school food checklist (SFC) designed to record foods and beverages consumed (or at least intended to be consumed) at school. The SFC allows information about observed foods and beverages to be recorded quickly (≈3 minutes per child). Aside from clarifying information about foods and be-verages that may have already been consumed and whether
Corespondence address: Dr Colin Bell, Population Health Hunter New England Area Health Service, Locked Bag 10, WALLSEND NSW 2287, Booth Building, Longworth Avenue, Wallsend NSW 2287, [email protected]
Accepted 30 April 2006

466 P J Kremer , C Bell and A Swinburn
foods or beverages will be obtained via another source (ie. school canteen), it requires minimal interaction with the child. Furthermore, it is inexpensive and the infor-mation collected can be analysed easily and efficiently. The aims of this study were to assess the accuracy (compared to a weighed record) and reliability of the checklist and also to calibrate the energy per serve and serve sizes of the food and beverage categories. Methods Participants Participants in this study came from six primary schools participating in a community based intervention project in Colac, Victoria. Written consent was obtained from parents or guardians of all participants and ethics approval was given by the Deakin University Human Research Ethics Committee. A convenience sub-sample of 106 participants (41 boys and 65 girls, 5-12 yo) was drawn to assess the accuracy of the SFC instrument. A second convenience sub-sample of 46 participants (19 boys and 27 girls, 5-12 yo) was drawn to assess inter-recorder reliability. These two sub-samples represented 12% and 5% of all 5-12 yo children (N = 910) par-ticipating in the baseline survey. The SFC and WR data were collected during May – July, 2003. Instruments The SFC is a single page checklist. It includes 20 food and beverage categories that are coded according to the number of serves (including space to write down the actual weight available on the packaging), specific descriptors (eg. reduced fat), and food source (home, canteen or vending machine). Specific foods in each of the categories were included based on frequency of consumption at school by children aged 5 to 15 years of age in the National Nutrition Survey (NNS95). In the fruit category for example, we included apples (consumed by 18.3% of children), bananas (6.7%) and oranges (5.0%), other citrus (4.1%), stone fruit (2.8%), pears (1.4%), pineapple (0.9%) and berry fruit (0.6%). Serve sizes were based on standard serves included in FoodWorks Professional Edition (version 3; Xyris Software, Highgate Hill, QL, Australia). Where these were not available, recommended serves from specific food and beverage products were used or, where several foods with varying serve sizes were included in a food group (eg. fast foods), an average serve size was calculated based on typical serve sizes from NNS95. Energy per serve was calculated from the energy density (kJ/g) of each of the foods included in the food (or beverage) category, weighted by their frequency of consumption by children aged 5 to 15 years in NNS95. In this way, foods consumed most commonly in the category contributed the most to the energy density value for that category. For single food item categories, energy per serve was obtained from FoodWorks. WR information was recorded on a separate sheet specifying the food/beverage type and amount. A set of Masscal® Food Scales (Model 331, Scoresby Australia) were used to weigh the food and beverage items. We considered the WR our reference method for the purpose
of assessing the accuracy of total energy estimated by the SFC.
Protocol Data were collected at each school in the morning, prior to children consuming food at either recess or lunch. One recorder entered the foods and beverages from the child’s lunch box and/or lunch order using the SFC and a second, separately located, recorder weighed each food and recorded the information on the WR sheets. We recorded foods from all sources including those from home, vending machines, school canteen or lunch services and shops. For sandwiches, we recorded the type of bread (white or brown) and the fillings or spreads included. Where it was difficult to determine what a sandwich contained we asked the child to open the sandwich for viewing (where possible) and/or to describe the contents. Our protocol for unusual foods was to place them in the most appropriate category or omit them based on consensus between at least two recorders. During the recording procedure children were asked if they had previously consumed any food/beverage from their school lunch and if they had, these were included on their record (and in the case of the weighed record, the weight was estimated from information about the size of the food or amount of beverage). Similarly, children were also asked if they had consumed or would be consuming food or beverage obtained from a vending machine, school can-teen or lunch order service. Where this occurred the in-formation was recorded as usual and the source noted (ie. Vending Machine or Canteen) in a corresponding column on the SFC. Few children reported that they would be consuming food and beverages at home, and those that did were excluded from the study. Children were unaware that records relating to their lunch food and beverages were to be collected, and recording was con-ducted for 1 day only. Four research staff acted as SFC recorders and one as the WR recorder (same person for all WRs). Each recorder had attended a training session outlining data collection procedures and had experience recording die-tary information. A serve-size manual containing pictures of a standard serve for various foods and beverages was also provided to each of the SFC recorders. Analysis and statistics Energy values were computed from the SFC by mul-tiplying the total number of serves by the pre-calculated energy per serve. For the WR, energy was calculated using FoodWorks. Energy values for foods and beverages not contained in this program were obtained from a local dietary reference manual.8 A number of statistical tests were used as a means of determining the accuracy of the total energy as assessed by the two methods. Means and standard deviations were compared and a correlation coefficient (Pearson’s r) was computed to examine the strength of the relationship between energy assessed by the two methods. We also calculated the percentage of participants who fell into the same and opposite tertiles for energy. If there is no agreement between methods

467
School Food Checklist* Weighed Record* Category Serve size
(g/ml) Energy/serve
(kJ/serve) Frequency in lunch
boxes (%)
Total serves (n)
Total energy (kJ)
Total weight (g)
Energy density (kJ/g)
Total energy (kJ)
Total weight (g)
Energy density (kJ/g)
Bread/Roll 70 697 93 103.5 72139 7245 9.9 67591 6565 10.3 Fillings - Meat etc 30 170 27 33.0 5618 990 5.7 4927 776 6.4
- Cheese 20 322 23 27.0 8694 540 13.1 10582 681 15.5
- Vegetable/Salad 20 14 8 9.0 129 180 0.7 288 276 1.1
- Peanut butter 20 496 15 19.0 9424 380 24.8 5316 214 24.8
- Vegemite/Marmite 5 41 24 25.0 1037 125 8.3 1305 220 5.9
- Sweet spreads 20 312 22 23.5 7325 470 15.6 6607 458 14.4
- Butter/Margarine 7 155 80 97.5 15171 682 22.2 3802 605 27.7
Fast Food 140 1389 1 1.0 1384 140 9.9 0 421 9.0
Leftovers/Mixed dishes 160 883 0 0.0 0 0 13.6 0 0 NA
Noodles 65 1133 0 0.0 0 0 17.4 21605 0 NA
Packaged snacks 25 527 39 44.5 23454 1137 21.1 52750 1019 21.2
Biscuits/Crackers 12 230 65 208.8 48104 2505 19.2 13990 2751 20.6
Chocolates/lollies 25 410 26 28.5 11671 712 16.4 2863 742 18.8
Cheese/Eggs/Dried fruit/Nuts 20 283 7 14.0 3963 280 14.1 19631 250 11.5
Muesli bars/Fruit bars 30 448 33 33.8 15169 1014 14.9 20568 1267 15.5
Cakes/Buns/Muffins/Scones 80 1211 26 21.4 25875 1712 15.1 1307 1358 15.2 Pastries 70 1223 1 1.0 1223 70 17.5 1491 81 16.1 Desserts 90 466 3 4.2 1933 378 5.2 4090 377 4.0
Yoghurt- Reduced Fat? 200 751 [N] 640 [Y]
9 1
1.0 5.1
3817 640
1020 200
3.8 3.2
29056 949 200
4.3 3.2
Fruit 140 296 69 83.0 24547 11620 2.1 393 13125 2.2
Vegetables 40 29 4 5.5 158 220 0.7
0.0
526 0.7
Milk - Low fat? 250 ml 788 [N] 537 [Y]
0 0
0.0 0.0
0 0
0 0
3.1 2.1
0 0
0 0
NA NA
Soft drinks - Diet? 375 ml 727 [N] 7 [Y]
0 0
0.0 0.0
0 0
0 0
1.9 0.0
32562
0 0
NA NA
Fruit juice/Cordials 250 ml 409 43 87.3 35723 21825 1.6 0 20916 1.6
Water 250 ml 0 22 45.0 0 11250 0.0 11785 0.0
* Includes foods and beverages from home, vending machine and school canteen/lunch order service.
Table 1. Total energy, food weight and energy density of the 20 school food checklist food and beverage categories as assessed by the school food checklist and the weighed record (N = 106).

468 P J Kremer , C Bell and A Swinburn
then, by chance, 33% would fall into the same tertiles, 44% into adjacent tertiles, and 22% into opposite tertiles. With perfect agreement between methods the percentage of people in each of these categories would be 100, 0, and 0% respectively. Finally, Bland-Altman tests of agree-ment between methods were computed.9 These tests provide a comparison between two methods of measure-ment. Differences between methods are plotted against means for the two methods. Agreement is assessed by evaluating the overall bias (the mean of the differences between methods), the differential bias (the relationship between the difference and the mean values) and the spread of the agreement between the two methods (± 2 standard deviations). We were also interested in calibrating, where ne-cessary, energy per serve and serve size in the SFC using information from the WR. To do this, total energy, food weight and energy density were computed for each of the 20 food and beverage categories in the SFC. For com-parison, foods recorded in the WR were grouped into these same categories. We then adjusted the energy per serve or serve size in the SFC where the difference in weight or energy between the WR and the SFC was larger than one serve per category or where energy density was lower or higher than expected for that category. Inter-recorder reliability was evaluated using two methods. We used the kappa statistic to compare how frequently the recorders classified the number of serves per lunch box into the same or opposite tertiles. We then used a method to identify major or minor errors in coding for the following categories: bread (including bread type); fillings; biscuits; beverages; and all other foods. Each en-try (or non-entry in the case of an omission error) was coded as ‘same’ (identical coding by the two recorders), ‘minor error’ (the two entries varied by ≤ 1 serve or white bread was ticked instead of brown), and ‘major error’ (the two entries varied by more than 1 serve, or entries were either added, omitted or misclassified). Data entry was
performed by two of the authors (PK and CB). All analyses were performed using SPSS, version 11 (SPSS Inc, Chicago, IL, USA). Statistical significance was accepted at P < 0.05. Results Comparisons between the two methods Mean energy was similar between the SFC method (2992 kJ, SE 90 kJ) and the WR method (3008 kJ, SE 92 kJ). Moreover, the correlation coefficient for energy values obtained via the two methods was strong (Pearson’s r = 0.77, P<0.01). The tertile cross-classification of energy values revealed that the percentage of children classified into the same tertile was substantively different (65%) to the percentages expected by chance (33%). Furthermore, the percentage of children misclassified into opposite ter-tiles was low (4%). Figure 1 shows the Bland-Altman plot. This figure reveals a similar level of agreement. Overall, the mean of the difference between the methods (ie. bias) was 15.26 kJ (95% confidence interval, -107 kJ to 138 kJ) and the limits of agreement (± 2 standard deviations) were ± 1270 kJ around the bias. The rela-tionship between the difference and the average values for energy was not statistically significant. SFC calibration The information used for calibrating the SFC is shown in Table 1. Overall, food and beverage category differences in total energy, food weight or energy density between the SFC and the WR were not large. However, there were seven food and beverage categories where frequency of consumption was high enough (consumed by more than 30% of children) that we could make judgements about SFC accuracy. Total energy from bread/rolls and the total weight of food in this category were higher by 4539 kJ and 680g respectively in the SFC compared with the WR. Energy per serve and serve size values for this category Average (Weighed + SFC) kJ
70006000500040003000200010000
Diff
eren
ce (
Wei
ghed
- S
FC
) kJ
3000
2000
1000
0
-1000
-2000
-3000
Figure 1. Bland-Altman plot of the difference in total energy (kJ) for the WR and SFC methods.

469
were calculated using average values for sliced bread, a white bread roll and pita bread. The WR data suggest that most children had sliced white bread so we have adjusted the SFC serve size value for this category to 65 g and the estimated energy to 650 kJ to reflect this. The total weight of butter/margarine was also over-estimated (+ 77.5 g) in the SFC compared to the WR, however, energy was lower (-1566 kJ). This was accounted for by the reduced fat spreads in the original calculation of energy per serve. To more accurately represent fat spreads in the SFC, we used an energy density of 28 kJ/g (the energy density of re-gular fat spreads) and adjusted energy per serve accor-dingly to 196 kJ. For the biscuits/crackers category, total energy, weight and energy density were lower in the SFC. The energy density of biscuits and crackers sold in Australia typically ranges from 17 kJ/g to 21 kJ/g. Data from the WR suggest that children were bringing more energy dense biscuit types to school than we had allowed for. Therefore, we adjusted the energy per serve for biscuits/crackers to 247 kJ/serve based on a 12 g serve size and an energy density of 21 kJ/g. The total energy, weight and energy density of muesli and fruit bars were also lower in the SFC compared to the WR. In the original energy per serve calculation for this category, fruit bars (with a lower energy density) were weighted more heavily than muesli bars. In the WR however, children were much more likely to consume muesli bars. So, using an energy density value of 15 kJ/g that better reflected muesli bars and a serve size of 35 g (the WR and other data suggested that a serve size of 30 g was too low) we adjusted the energy per serve up to 524 kJ. There were also differences between the methods for fruit. A com-parison of the serve size data suggested that we were under-estimating the average serve size of fruit by ~20g. Thus, we adjusted the average serve size to 160g. We also adjusted the energy per serve to 340 kJ to maintain an energy density of ~2.1 kJ/g. Finally, the WR data indicated that we were overestimating energy from fruit drinks so we reduced the energy per serve from fruit drinks and cordials to 400 kJ based on an ED of 1.6 kJ/g. When analysing the WR we realised that a food cate-gory (sauces, chutney, pickles, and mayonnaise) had been omitted from the SFC. While only a few children had lunches containing these foods (total energy from this category was 716 kJ), we have added them as an ‘extras’ category to the revised SFC with a serve size of 10 g and energy per serve of 75 kJ. There were no other foods that we were unable to allocate to a food category. The revised instrument containing the amendments described
is included as Appendix 1. Inter-recorder reliability Table 2 is a cross-tabulation of three categories of total number of serves per lunch box as reported by two re-corders. The kappa statistic for overall agreement was 0.51 and agreement was good for small lunches and for large lunches. Agreement was poorer for medium sized lunches with recorder 2 either under- (21%) or over-coding (43%) compared with recorder 1. Our alternative method for assessing inter-recorder reliability was iden-tifying the number of minor and major coding errors that occurred when two recorders coded the same lunches (Table 3). Overall, 74% of all food and beverage items (total N = 343 items) were coded identically by the two recorders. Of the coding errors that did occur, half of these were minor although this varied with the food category in question. Major errors were most likely to occur for beverages or sandwich fillings and minor errors for beverages, biscuits/crackers and the composite group of all other foods. Discussion The results of this study indicated that the SFC had good accuracy and reliability. Also, using the WR as our reference, we were able to improve our estimates of ener-gy from breads, fat spreads, biscuits/crackers, muesli/ fruit bars, fruit and fruit drinks. Moreover, from the inter-recorder reliability tests, we identified that most of the errors of omission or addition occurred for beverages and sandwich fillings and that most of the serve size esti-mation errors occur for beverages and biscuits/ crackers. Use of the revised SFC and additional training for re-corders on recording beverage, sandwich filling and biscuit/cracker information should improve the accuracy of the instrument. The accuracy of the SFC was assessed by comparing estimated total energy against the same value derived from a weighed record reference. Overall, we found that the SFC method provided a good estimate of the total energy value derived by the WR method. Tertile classi-fication of total energy values for the two methods was generally high. The Bland-Altman results indicated that overall the mean difference between methods was small and the limits of agreement sufficiently tight to suggest good agreement between the methods. This is especially true since dietary record data is invariably characterised by high inter-individual variability. Moreover, in our
Recorder 2
Small lunch Medium lunch Large lunch Total
Small 13 87% 2 13% 0 0% 15 100%
Recorder 1 Medium 3 21% 5 36% 6 43% 14 100%
Large 1 6% 3 18% 13 77% 17 100%
Total 17 37% 10 22% 19 41% 46 100% * Cut-offs for the three groups were, small (0.0 – < 7.0 serves), medium (≥ 7.0 - < 9.0 serves) and large (≥ 9.0 serves)
Table 2. Cross-classification of tertiles of lunch size (based on total serves* ) derived by recorder 1 and recorder 2 (N, row %)

470 P J Kremer , C Bell and A Swinburn
view, the relative ease of recording food and beverage data using the SFC is much more practical and efficient than having to weigh and record each individual item. In addition to the tertile classification and Bland-Altman test, the correlation coefficient obtained for total energy values derived by the two methods was also high (ie. r= 0.77). This comparatively high correlation between energy values determined by the two methods can be explained by a number of factors, including the relative similarity of the methods for estimating energy. For the SFC, energy was computed from checklist observations about the number of serves for various foods and beverages which were then multiplied by a standard energy value. The values for each food and beverage category were then summed to produce total energy. The weighed record method also relied on observation and recording of the foods, however, each food and beverage was weighed and energy values determined on the basis of actual weight. Other factors include the relatively narrow range of foods included on the SFC, the narrow range of foods available for consumption at school and the fact that serve sizes are generally well quantified in the school environment. Accuracy will also have been enhanced by using an independent assessor rather than child self-report. While children from 8 years of age and over self-report food intake reasonably well, having an independent interviewer complete the SFC is likely to reduce the error due to under-reporting that typically occurs with self-reports10 and the error introduced when children have to recall intake.11 Finally, many of the foods in children’s lunchboxes are pre-packaged and Food Standards Australia New Zealand (FSANZ) requires that the average quantity be reported on the packaging.12 The design of the SFC allows for this information to be recorded directly into the checklist. Although the results demonstrate the accuracy of the SFC, they do not demonstrate validity. Willett and Lenart13 have noted that in the absence of an absolute gold standard determination of the validity of a dietary assessment technique can only be based on comparison with a second technique – referred to as the ‘validation standard’.14 Where evaluation of instrument validity is proposed it is important that errors associated with the two methods are independent otherwise this will produce an exaggerated estimate of validity.13 In the present study, as the two methods were similar (ie. observed, with energy computed on basis of actual amount vs observed,
and energy computed on basis of estimated amount), errors were presumed to be correlated and thus we were unable to properly evaluate the validity of the SFC. How-ever, we are mindful of the need for this work to be per-formed and intend to test the validity of the instrument in Australian children and also with other cultures. Another limiting factor was the small sample size. This limits the generalisability of the data and prevented us from cali-brating categories of food where frequency of con-sumption was low, such as fast food or confectionary. It is important to comment on the purpose and use-fulness of the SFC. Firstly, it is not designed to be re-presentative of usual individual intake. This would re-quire multiple days of 24-hour measurement to capture day-to-day variability15, and we only have one. Rather, it is designed to estimate children’s average energy intake from foods and beverages available in a school setting. The instrument can also rank food and beverage cate-gories based on their contribution to energy and deter-mine the sources of these foods and beverages (home, school canteen or vending machine). Using this infor-mation, specific recommendations can be made on changes in the school food environment. Repeat measures will allow schools to measure progress on these re-commendations over time and, where surveys are done in multiple schools, also provide cross-school comparisons. Alongside other indicators of physical activity and nu-trition and other settings, the SFC could be used as a benchmarking or monitoring tool to directly inform policy makers at a school, state or national level.16 In con-clusion, we have shown that the SFC provides accurate estimates of energy and further has good inter-recorder reliability for assessing school food intake. The SFC is a simple and efficient method of accurately quantifying in-formation about food available in the school environment. Acknowledgements The authors would like to thank the staff, students and parents from the participating schools. We would also like to thank Ruth Cuttler and Anne Simmons for their assistance with the data collection. The BAEW project was funded by The Department of Human Services, Victoria. Funding for the support and evaluation of the BAEW project (including this study) was provided by the Commonwealth Department of Health and Ageing and the Department of Human Services Victoria. Colin Bell was supported by a VicHealth Public Health Fellowship.
Same Minor error Major error Total
Breads 78 92.9% 4 4.8% 2 2.4% 84 100.0%
Sandwich fillings 68 73.1% 2 2.2% 23 24.7% 93 100.0%
Biscuits/crackers 21 61.8% 7 20.6% 6 17.6% 34 100.0%
All other foods 70 71.4% 22 22.4% 6 6.1% 98 100.0%
Beverages 16 47.1% 9 26.5% 9 26.5% 34 100.0%
Total all foods and beverages 253 73.8% 44 12.8% 46 13.4% 343 100.0%
* Same = identical coding by the two recorders; Minor error = entries varied by ≤ 1 serve or by food type; Major error = entries varied by > 1 serve or errors of omission, addition or misclassification.
Table 3. Inter-recorder coding errors for the school food checklist (n observations and percentages)*

471
Appendix 1: School Food Checklist – Revised Instrument (SFC-R)
Deakin University School Food Checklist
Child’s name: ________________________ Pre/school: ________________________ [Information to be removed]
† Date: - - † Child ID Code:
† DOB: - - † Yr/Grade (K/P/1-6): †Gender: M F ‡ Home for lunch:
Y N ‡ Recorder’s Initials:
Description Number of serves Canteen or
Vend Machine Food Category
1 serve equals
1 2 3 4 Other (s/mls/gms)
Bread / Roll
__ White __ Brown
2 Slices / 1 roll / ½ flat bread 650.00
Filling
Meat etc meat / seafood / egg 1 slice / layer = 30 g 170.25
Cheese 1 slice / layer = 20 g 322.00
Vegetable / Salad 2 different veg / salad 20 g 14.38
Peanut butter Med spread = 20 g 496.0
Vegemite or Marmite Thin spread = 5 g 41.50
Sweet spreads Honey, jam, nutella, frosting Med spread = 20 g 311.70
Extras Sauces, chutney, pickles, mayonnaise
Med spread = 10g 75.00
Butter / Margarine 7g per slice of bread 196.00
Fast Food
Hot chips, pies /pasties/s rolls Hotdogs, hamburger, pizza Dim Sims, chicken nuggets
Bucket chips, pie/pastie, 2 slice pizza, plain hamburger 3 Dim Sims = 140g, 7 nuggets
1383.90
Leftovers / mixed dishes Pasta, noodles (including packet), rice, meat or mixed dishes
160g 883.04
Noodles 2-min noodles Eaten dry 1 Packet = 65g 1132.95
Packaged snacks Potato chips, corn chips pretzels, popcorn
Small snack pack = 25g
527.05
Biscuits & Crackers Sweet, savoury or chocolate biscuits, rice cakes or other crackers
1 biscuit / 1 rice cake / 6 rice crackers = 12g LeSnack = 2 serves
247.00
Chocolate & Lollies 25g 410.10
Cheese, eggs, dried fruit,
nuts
Egg, cheese, raisins, dried apricots, peanuts
½ an egg or 20g 283.04
Muesli & Fruit bars Fruit sticks, muesli 1 bar = 35g 524.00
Cakes & Buns
Muffins & Scones
Cakes, buns, slices, scone, muffin donuts, tarts
80g, 2 sm. Donuts, 2 tarts 1211.36
Pastries Danish, Croissants 70 g 1223.25
Desserts Icy poles, ice cream, dairy desserts
1 icy pole or ½ a dairy dessert = 90g
465.75
Yoghurt Reduced fat (≤ 2%)? Y N 1 tub = 200g 751.22 640.00
Fruit Apple, pear, banana, orange Sm. Stone fruit, kiwifruit, mandarin Fruit Snack Tub
1 piece = 160g 2 pieces = 160g 1 tub = 160g
340
Vegetables Carrot sticks, celery sticks, broccoli
40g 28.76
Milk
Plain, flavoured milk
Reduced fat (≤ 2%)? Y N
1 tetra-pack = 250ml
787.75 537.50
Soft drinks Diet? Y N
1 can = 375 ml 726.75 7.50
Fruit juice, cordial All fruit juices / cordials 1 tetra-pack / popper = 250ml 400.00
Water Bottled water, mineral water Equiv. to = 250ml 0.00
NB. Energy (kJ) value per serve for each food/beverage category are shown in the ‘canteen/vending machine’ column

472 P J Kremer , C Bell and A Swinburn
References 1. Scollo M, Younie S, Wakefield M, Freeman J & Icasiano
F. Impact of tobacco tax reforms on tobacco prices and tobacco use in Australia. Tobacco Control 2003: (Suppl II) ii59-ii66.
2. Berkelmann RL, Stroup DF, Buehler JW. Public health surveillance. In: Detels R, McEwen J, Beaglehole R, Tanaka H, eds. Oxford textbook of public health, 4th ed., vol. 2, New York: Oxford University Press, 2002: 759-778.
3. Swinburn BA, Egger G. Influence of obesity-producing environments. In: Bouchard C, Bray G, eds. The handbook of obesity. New York: Marcel Dekker, 2004: 97-114.
4. St-Onge MP, Keller KL, Heymsfield SB. Changes in childhood food consumption patterns: a cause for concern in light of increasing body weights. Am J Clin Nutr 2003; 76: 1068-1073.
5. Sanigorski AM, Bell AC, Kremer PK, Swinburn BA. Lunchbox contents of Australian school children: room for improvement. Eur J Clin Nutrt 2005; 59: 1310-6.
6. Lytle LA, Fulkerson JA. Assessing the dietary environ-ment: examples from school-based nutrition interventions. Public Health Nutr 2002; 5: 893-899.
7. Micucci S, Thomas H, Vohra J. The effectiveness of school-based strategies for the primary prevention of obesity and for promoting physical activity and nutrition, the modifiable risk factors for type 2 diabetes: a review of reviews. Hamilton, ON: Public Health Research, Education and Development Program, Ministry of Health and Long-Term Care, 2002.
8. Boruschek A. Doctor’s pocket calorie, fat and carbohydrate
counter, 2003 ed. Nedlands, WA: Family Health Publications, 2002.
9. Bland JM, Altman DG. Statistical methods for assessing agreement between two methods of clinical measurement. Lancet 1986; 8476: 306-310.
10. Livingstone MB, Robson PJ. Measurement of dietary intake in children. Proc Nutr Soc 2000; 59: 279-293.
11. Baxter SD, Thompson WO, Litaker MS, Frye FH, Guinn CH. Low accuracy and low consistency of fourth graders’ school breakfast and school lunch recalls. J Am Diet Assoc 2002; 102: 386-395.
12. Food Standards Australia New Zealand. http://www. foodstandards.gov.au/_srcfiles/Standard111_Interpretationv62.pdf. 2004
13. Willett W, Lenart E. Reproducibility and validity of food-frequency questionnaires. In: Willett W, Nutritional epidemiology, 2nd ed. New York: Oxford University Press, 1998: 101-147.
14. Serdula MK, Alexander MP, Scanlon KS, Bowman BA. What are preschool children eating? A review of dietary assessment. Annu Rev Nutr 2001; 21: 475-498.
15. Willett W. Nature of variation in diet. In: Willett W, Nutritional epidemiology, 2nd ed. New York: Oxford University Press, 1998: 33-49.
16. Department of Health and Ageing. http://www. Healthy andactive.health.gov.au/docs/healthy_weight08.pdf. 2004.

473
Original Article Calibration and reliability of a school food checklist: a new tool for assessing school food and beverage consumption Peter J Kremer BA, BSc (Hons), Grad Dip (Mntl Hlth Sc), PhD, A Colin Bell BSc (Hons), MSc,
PhD and Boyd A Swinburn MB ChB, MD, FRACP Centre for Physical Activity and Nutrition Research, Deakin University – Waterfront Campus Gheringhap Street, Geelong, AUSTRALIA 3217
學校食物清單的校正與信度:一個評估學校食物與飲料的攝學校食物清單的校正與信度:一個評估學校食物與飲料的攝學校食物清單的校正與信度:一個評估學校食物與飲料的攝學校食物清單的校正與信度:一個評估學校食物與飲料的攝取新工具取新工具取新工具取新工具
澳洲及其他國家迫切需要發展一個能監測兒童肥胖及其相關行為與環境決定因素長期趨勢的系統。兒童在學校攝取的食物與飲料的熱量是一個兒童飲食型態的可用指標,我們發展了一份學校食物清單(SFC)去測量這些。SFC記錄2
0類食物及飲料的攝取份數及其來源(家裡、福利社、販賣機)。本研究旨在評估SFC的精確度,並與稱重紀錄(WR)比較,以校正SFC並評估記錄者間的信度。參與者為910名年齡在5至12歲,來自澳洲維多利亞鄉村城鎮的國小學童。WR的資料是收集自106名非隨機的子樣本;而第二個子樣本(n=46)則使用S
FC測量受試者兩次的攝取量以此去評估紀錄者間信度。SFC及WR測量的平均熱量值分別為2992 KJ±924及3008 KJ ± 952,兩者有強的相關係數(皮爾森
r=0.77)。WR與SFC之平均差異為15 KJ (95% CI,-107 KJ到138 KJ) 及一致
性區間(±2個標準差)為±1270 KJ。 SFC高 估麵包及果汁 飲料的熱 量/ 份
數,並低估塗抹的脂肪、餅乾、堅果果乾穀物/水果棒及水果。記錄者間的信度良好(kappa 0.51)。 SFC被設計來 測量 學校中的 食物及 飲料的 熱量。
其具有良好的精確度與信度,經過修改後的版本應可進一步改善工具的精確度。
關鍵字:飲食評估、學校、肥胖預防、小孩。

474 Asia Pac J Clin Nutr 2006;15 (4):474-481
Original Article Primary school children from northeast Thailand are not at risk of selenium deficiency Woravimol Krittaphol MSc
1, Karl B Bailey PhD1, Tippawan Pongcharoen MSc
2, Pattanee Winichagoon PhD
2, Christine Thomson PhD1 and Rosalind S Gibson PhD
1
1 Department of Human Nutrition, University of Otago, Dunedin, New Zealand. 2 Institute of Nutrition, Mahidol University, Salaya, Thailand,
Selenium has important roles as an antioxidant, in thyroid hormone metabolism, redox reactions, reproduction and immune function, but information on the selenium status of Thai children is limited. We have assessed the selenium status of 515 northeast Thai children (259 males; 256 females) aged 6 to 13 years from 10 rural schools in Ubon Ratchthani province. Serum selenium (n=515) was analyzed by Graphite Furnace Atomic Absorption Spectrophotometry and dietary selenium intake by Hydride Generation Absorption Spectrophotometry from one-day duplicate diet composites, from 80 (40 females; 40 males) randomly selected children. Inter-relationships between serum selenium and selenium intakes, and other biochemical micronutrient indices were also examined. Mean (SD) serum selenium was 1.46 (0.24) µmol/L. Concentrations were not affected by infection or haemoglobinopathies, but were dependent on school (P<0.001), sex (P=0.038), and age group (P=0.003), with serum zinc as a significant covariate. None of the children had serum selenium concentrations indicative of clinical selenium deficiency (i.e. < 0.1 µmol/L). Significant correlations existed between serum selenium and serum zinc (r= 0.216; P < 0.001), serum retinol (r = 0.273; P < 0.001), urinary iodine (r = –0.110; P = 0.014), haemoglobin (r = 0.298; P <0.001), and haematocrit (r = 0.303; P<0.001). Mean (SD) dietary selenium intake was 46 (22) µg/d. Children with low serum selenium concentrations had a lower mean selenium intake than those with high serum selenium concentrations (38 ± 17 vs. 51 ± 24 µg/d; P<0.010). In conclusion, there appears to be no risk of selenium deficiency among these northeast Thai children.
Key Words: selenium, serum, diet, zinc, children, Thailand. Introduction Selenium is an essential trace element for animals and humans, with important roles in antioxidant defense, thy-roid hormone metabolism, and redox control of enzymes and proteins.1 Severe endemic selenium deficiency has been associated with two diseases: a cardiomyopathy known as Keshan disease2,3, and an endemic osteoarticular disorder known as Kashin-Beck disease.4 Selenium responsive conditions, including cardiomyopathy, muscle pain, and muscular weakness, have also been described in some patients receiving long-term total parenteral nutrition (TPN), but no selenium supplements.5 However, not all TPN patients with a low selenium status develop clinical symptoms of selenium deficiency, suggesting other inter-acting factors may be involved.6 Among children in developing countries, including Thailand, selenium deficiency has been associated with protein energy malnutrition.7 The deficiency has been attributed to co-existing dietary inadequacies of protein and selenium, exacerbated by an increased need for selenium and other antioxidants induced by malnutrition and in-fection. Inter-relationships with other micronutrients, no-tably iodine8-11 and to a lesser extent, zinc and iron12-14,
have also been reported, although to date only the
mechanism for iodine has been firmly elucidated. These micronutrient interactions may be important among children in northeast Thailand because several micro-nutrient deficiencies (i.e. iodine, zinc, iron, and vitamin A) have been documented among school-aged children in this region15-19; the poorest region in the country, with 28% of the population living below the poverty line compared with only 7% in central Thailand.20 To our knowledge, there have been no studies on the selenium status of Thai children. Therefore, we have assessed the selenium status of a sample of primary school children attending ten schools in rural northeast Thailand, based on serum selenium concentrations (n=515), and diet-ary selenium intakes analyzed from one-day diet com-posites collected from a subsample (n=80) of the children. Inter-relationships between serum selenium and bio-chemical indices of iodine, zinc, iron, and vitamin A status were also examined.
Correspondence address: Rosalind S. Gibson, Department of Human Nutrition, University of Otago, PO Box 56, Dunedin, New Zealand. Tel: +64-3-479-7955. Fax: +64-3-479-7958 Email: [email protected] Accepted 1 February 2006

W Krittaphol, K B Bailey, T Pongcharoen, P Winichagoon, C Thomson and RS Gibson 475
Subjects and methods Subjects The school children in this study participated in the baseline data collection of an intervention trial conducted between June 2002 and March 2003 in Ubon Ratchathani province, northeast Thailand. The school with the largest roll in each of the ten sub-districts of Trakarn Phutphon, Ubon Ratchathani province was selected for participation in the trial. All the districts are of low socio-economic status. Details of the subject selection have been published earlier.19 Of a total of 567 children aged 6.0 to 12.99 y who participated at baseline, serum samples from 515 of these children were available for selenium anal-ysis. Only 80 children (40 males; 40 females) were randomly selected for the collection of duplicate diet composites for selenium analysis, after stratifying the 567 children by age (grades 1 to 3; grades 4 to 6), sex, and treatment group. The Human Ethics committees of the University of Otago (New Zealand) and Mahidol University (Thailand) approved the study protocol. Permission from local school boards and Thai health workers was also given, following meetings in which the purpose and methods of the study were clearly explained by one of the principal investigators (PW). Informed written consent was ob-tained from the parents or guardians of the participating children. Details of the socio-demographic, anthropo-metric, health, and haematological status of the children, prevalence of haemoglobinopathies, and their biochem-ical iron, zinc, iodine and vitamin A status have been reported earlier.19,21
Blood collection and serum selenium analysis The blood collection and separation procedure has also been described elsewhere.19,21 Briefly, morning non-fasting venipuncture blood samples were taken for sele-nium analyses using trace-element free evacuated tubes (Becton Dickinson, Franklin Lakes, NJ). Blood was refrigerated immediately after collection and separated within one hour using trace-element free techniques.22 Serum was frozen immediately at –20°C in trace-element free polyethylene vials, and later at –70°C for subsequent biochemical analysis. Serum selenium concentration was analyzed in du-plicate by graphite furnace atomic absorption spectro-photometry (AA-800, Perkin-Elmer Corp, Norwalk, Connecticut, USA) in the Trace Element Laboratory, Department of Human Nutrition, University of Otago, based on a modified method of Jacobson and Lockitch.23 Accuracy and precision of serum selenium analysis was assessed during each batch of analysis using two certified reference materials (CRM): UTAK Reference Plasma (Cat #66816, UTAK Laboratories Inc, Valencia, CA), and Seronorm (Lot #MI0181 SeronormTM Trace Element Serum, Laboratories of SERO AS, Billingstad, Norway). The means ± SD (%CV) were 1.55 ± 0.08 µmol/L (CV 5.2%) (n= 62) for UTAK and 1.04 ± 0.03 µmol/L (CV 2.9%) (n=59) for Seronorm, compared to the correspon-ding certified mean and expected range given by the manufacturers of 1.52 (1.14–1.90) µmol/L and 1.05 (0.97–1.13) µmol/L, respectively. Multiple aliquots of a pooled serum control were also included with each batch
of analysis to assess precision. The mean (±SD) and CV (%) for aliquots of this pooled serum was 1.25 ± 0.06 µmol/L (CV 4.8 %) (n=65) for selenium. Haematological variables and biochemical indices of iron, zinc, vitamin A, and iodine Concentrations of ferritin, transferrin receptor, C-reactive protein (CRP) (as an index of acute infection and inflammation), and retinol were also analyzed in serum using methods described earlier.19,21 A sample of EDTA-anticoagulated blood was used for the haemoglobinopathy analysis and complete blood cell counts.19 Casual urine samples were also collected for urinary iodine analysis.21
Collection and analysis of diet composites Research assistants collected diet composites from the 80 children in such a way that all days of the week were rep-resented. The diet composites consisted of an exact du-plicate portion of all food and beverage items consumed by each child on the pre-selected day. Each portion was weighed and transferred into a weighed polyethylene jar with a wide mouth, lined with a trace-element free poly-ethylene bag. Each collection included the child’s break-fast, lunch-time meal consumed at school, evening meal, and any snacks eaten during the day or night of the designated 24-hour period. Diet composites were weighed, and then frozen as soon as possible after collection at –20οC. Money was given to the parents of the children to reimburse them for the cost of the food. Duplicate diet composites were blended in an acid-washed blender to yield homogenous slurries. After homogenization, four 50 mL aliquots of each slurry were transferred into weighed, acid-washed polyethylene jars, reweighed, and then frozen at –20οC. Each frozen aliquot was later freeze-dried to constant weight, and ground to a fine powder using an agate ball and mill (Brinkman Model 2MN, Brinkman Instruments Division, Sybron, Canada). One of the freeze-dried diet composites was contaminated by mould, so that only 79 diet composites were analyzed for selenium. Duplicate samples of each of the freeze-dried pow-dered diet composites (approximately 0.3g) were acid-digested using a modification of the method of Friel and Ngyuen24 and others.25-27 To avoid contamination from adventitious sources of selenium during the digestion and analysis, sterile powder-free disposable plastic gloves were worn, and all glassware was soaked overnight in 10% high grade nitric acid, and then rinsed thoroughly six times in distilled, deionized water. After digestion, the solutions were quantitatively trans-ferred into acid-washed 25 mL volumetric flasks, and adjusted to volume with 20% hydrochloric acid. Aliquots were then analyzed for selenium by flow injection hydride generation atomic absorption spectro-photometry using an atomic absorption spectrophotometer (AA-800, Perkin-Elmer Corp, Norwalk, Connecticut, USA) in combination with an MHA-FIAS-400 flow injection hydride generation system and AS-90 plus autosampler. Standard solutions were prepared from selenium stock standard solutions (BDH Laboratory supplies) in the following concentrations: 2.5, 5, and 10µg/L. To check on the accuracy and precision of the analytical procedures, a

476 Selenium status of Thai school children
National Institute of Standards and Technology Standard Reference Material (SRM) Rice flour (SRM 1568a) (n=21) was analyzed. The mean ± SD (%CV) for SRM 1568a was 4.81 ± 0.25 nmol/g (5.0%) compared with the certified value (mean ± SD) of 4.81 ± 0.51 nmol/g. Collection and analysis of selected food samples Subsamples (n=3) of 13 foods, frequently consumed by the NE Thai school children, were purchased from local markets and vendors in the Trakarn Phutphon district. Edible portions of each subsample were then combined to form one composite sample per food type, frozen at – 20OC, and then freeze-dried to constant weight. For the analyses, each composite sample was ground to a fine homogenous powder, after which duplicate samples were removed for acid digestion followed by selenium analysis by flow injection hydride generation atomic absorption spectrophotometry, as described for the diet composites. Statistical analyses Statistical analyses were carried out using SPSS version 12 (USD Inc, Stone Mountain, GA). Data were checked for normality by using the Komogorov-Smirnov test. The Student’s two-tailed t-test for non-paired data was used to test for differences by sex, haemoglobinopathy status (i.e., AA versus AE haemoglobin type), and infection (i.e., serum CRP ≥10 mg/L), and to test for differences in the selenium intakes of children with high (above median) and low (below median) serum selenium concentrations. Correlations between serum selenium and biochemical indices of iodine, zinc, iron, and vitamin A status were examined using Spearman’s Rank Correlations test. Analysis of variance (ANOVA) was used to investigate whether serum selenium concentrations were dependent on sex, school, and age group when serum zinc was treated as a covariate. A P value of <0.05 indicated statistical significance. Results Serum selenium concentrations Mean (SD) serum selenium concentration was 1.46 (0.24)
µmol/L. Serum selenium concentrations correlated po-sitively and significantly with serum zinc, haemoglobin, mean cell volume, and serum retinol concentrations but negatively with urinary iodine. In contrast, serum sele-nium concentrations were independent of serum ferritin (Table 1). No significant correlations were found be-tween serum selenium and socio-economic status, haem-oglobin type (AA or AE), or infection status (i.e., CRP < or ≥10 mg/L). Analysis of variance (Table 2) shows that serum selenium concentrations were dependent on school (P <0.001), sex (P = 0.038), and age group (P = 0.003), with serum zinc concentrations as a significant covariate (P <0.001). Females had a significantly lower mean serum selenium concentration than males (1.45 vs. 1.49 µmol/L) and children less than 9 years of age had a significantly lower mean serum selenium concentration than those greater than 9 years of age (Table 2). Dietary selenium intakes and selenium content of selected food samples Mean (SD) dietary selenium intake was 46 (22) µg/d. Females tended to have a slightly lower mean intake of selenium than males (41 (3.5) vs. 51 (3.5) µg/d; P = 0.05, n = 79), but this tendency disappeared when intakes were expressed per kg body weight. No significant associa-tions with school or age were apparent. The mean diet-ary selenium intake of children with low serum selenium concentrations (below median value) was significantly lower than the mean for children with high serum sele-nium concentrations (above the median value) (mean ± SD; 38 ± 17 vs. 51 ± 24 µg /day; P<0.010). The selenium content of locally grown glutinous rice was very variable, and ranged from 2.8 to 28 µg/100g dry weight. Several foods rich in selenium were identified, including frogs (boiled) (Se concentration = 232 µg/100g dry weight), silkworms (fried) (Se concentration = 49.0 µg/100g dry weight), grasshoppers (fried) (Se concen-tration = 25.2 µg/100g dry weight), mushrooms (boiled) (Se concentration ranged from 62.4 to 608.6 µg/100g dry weight), and bamboo shoots (boiled) (Se content = 29.6 µg/100g dry weight). In contrast foods such as swamp cabbage (boiled) and hairy basil leaves (boiled) were low in selenium, with levels of 3.2 and 3.5 µg/100g dry weight, respectively. Discussion There have been very few studies on the selenium status of population groups in Thailand, and to our knowledge, this is the first report on the selenium status of Thai children. Our results indicate there is no risk of selenium deficiency among these northeast Thai children, based on selenium concentrations in serum. Indeed, for 61% of the children (n=312), serum levels were indicative of maxi-mal activity of plasma glutathione peroxidase (GSHPx) and selenoprotein P, and for 38% (n=194), levels were above those suggested as necessary to protect against some cancers, based on the cut-offs for adequate selenium status by Thomson.28 The mean serum selenium con-centration of these NE Thai children (1.46 µmol/L) was higher than those reported for children in Poland29 and from national surveys conducted in New Zealand30 and
Table 1. Spearman’s correlation coefficients for relationships between serum selenium (µmol/L) and other biochemical variables
n r P
Haemoglobin (g/L) 467 0.276 <0.001
Haematocrit 467 0.277 <0.001
Serum zinc (µmol/L) 446 0.216 <0.001
Serum retinol (µmol/L) 464 0.250 <0.001
Log serum ferritin (µg/L) 468 –0.031 0.497
Mean cell volume (fL) 471 0.093 0.044
Log urinary iodine (µg/L) 464 –0.131 0.005
NB. All children with serum CRP ≥10 mg/L were excluded from the above analysis.

W Krittaphol, K B Bailey, T Pongcharoen, P Winichagoon, C Thomson and RS Gibson 477
the United Kingdom31 (Table 3). Dietary selenium in-takes for NE Thai children were also higher than those for children in New Zealand32, and the other countries33, with the exception of the United States34 (Table 4). It is of interest that despite the higher selenium intakes of the
U.S.children, their mean serum selenium concentration35 was slightly lower than those of the NE Thai children. It is possible that differences in the bioavailability of selenium from children’s diets in the United States and NE Thailand may be responsible for this discrepancy. Selenium from seleno-methionine, the major source in plant foods, is better retained in body tissues than other forms of selenium due to its non-specific incorporation into tissue protein in place of methionine.1,36 It is likely that the proportion of selenium from plant foods in the diets of NE Thai children is higher than that in US diets. It is noteworthy, that despite the relatively small num-ber of duplicate diet composites analyzed, a relationship between serum selenium and selenium intakes was noted: children with high serum selenium concentrations had a greater mean selenium intake than those with low serum selenium concentrations. Several37-40 but not all41,42 in-vestigators have reported a positive relationship between serum/plasma selenium and selenium intakes. In this study, a positive relationship was noted be-tween school and serum selenium concentrations but not with school and selenium intakes. This discrepancy may be associated with variations in the major food sources of selenium by school, and thus bioavailability of selenium, despite similar intakes of total selenium. Unfortunately, knowledge of the bioavailability of selenium from selenium-rich indigenous foods such as frogs and insects analyzed in this study is limited. In general, absorption of selenium from food is high, about 80%, although there is some evidence that in mushrooms it may be poor.43 We also collected one-day weighed diet records from the children on the day of the diet composite collection. However, it was not possible to identify the major food
Table 2. Univariate analysis of variance; dependent variable = serum selenium (µmol/L)
Source Type III sum
of squares df F Sig
Corrected model 3.649 12 8.431 <0.001
Intercept 18.654 1 517.276 <0.001
School 2.236 9 6.891 <0.001
Sex 0.156 1 4.319 0.038
Serum zinc 0.781 1 21.658 <0.001
Age group 0.312 1 8.649 0.003
Error 15.615 443
Adjusted r squared = 0.189
Estimated marginal means*
95% Confidence interval
Mean Lower bound
Upper bound
Sex = female 1.451 1.425 1.476
Sex = male 1.488 1.463 1.513
Age group = < 9y 1.443 1.416 1.469
Age group = > 9y 1.496 1.472 1.520
* Evaluated at serum zinc = 9.84 µmol/L
Table 3. Comparison of serum selenium concentrations of children from selected countries
Country Reference Methodology Age Serum selenium
(sample size) concentration (µmol/L)
Mean SD
Thailand This study Se concentrations determined in Northeast Thai children by GFAAS
6–12 years (n=515)
1.46 0.24
USA (NHANES III)
35 Se concentrations determined in NHANES III (1988–1994) population by AAS
4–16 years (n=5305)
1.48 0.18
UK (NDNS) 31 Se concentration determined in NDNS by ICP-MS
4–18 years (n=1127)
0.87 0.15
New Zealand (NCNS)
30 Se concentration determined in NCNS (2002) population by GFAAS
5–14 years (n=1547)
0.97 0.67
Poland 29 Se concentration determined in healthy Polish population (1990–1991) by the flurometric method
7–15 years (n=74)
0.46 0.09
GFAAS – graphite furnace atomic absorption spectrometry; HGAAS – hydride generation atomic absorption spectrometry; ICP–MS – inductively coupled plasma mass spectrometry; NHANES III – the National Health and Nutrition Examination Survey; NDNS – National Diet and Nutrition Survey; NCNS – National Children's Nutrition Survey

478 Selenium status of Thai school children
sources of selenium from these diet records because of limited data on the selenium content of indigenous foods in northeast Thailand44; levels depend on local soil selenium levels. Instead we identified several foods rich in selenium, based on our analyses of foods frequently consumed by these NE Thai children. The richest food sources of selenium were certain species of mushrooms and frogs, followed by silk worms, bamboo shoots, and grasshoppers. The selenium content of the major food staple of these NE Thai children, glutinous rice, was very variable. Reasons for this discrepancy are uncertain. It is possible that when the glutinous rice is rinsed and then soaked overnight prior to steaming, some selenium is lost by leaching. Alternatively, some of the purchased rice samples may have been cooked at the same time with foods rich in selenium (e.g., mushrooms or frogs), and thus become contaminated with selenium. Inter-relationships between selenium status and bio-chemical indices of zinc, iron, vitamin A, and iodine status The existence of a strong positive correlation between se-rum selenium and serum zinc (r= 0.22; P<0.001) has been reported earlier in both animal and human studies.45-48
The finding that the gene expression of GSHPx, a seleno- protein, can be up-regulated by zinc49 supports the assumption implicit in the ANOVA shown in Table 2. Selenium may also be linked to the role of cellular Zn in redox reactions.50,51 Selenium compounds regulate the delivery of zinc from metallothionein (MT) to zinc en-zymes, specifically copper, zinc superoxide dismutase. Alternatively, the strong positive correlation between se-rum zinc and serum selenium may be because protein-rich foods contain high levels of both zinc and selenium.52 In this study we also noted positive correlations be-tween serum selenium and haemoglobin (r=0.30; P< 0.001) and haematocrit (r=0.30; P <0.001), but not with the biochemical iron indices MCV and serum ferritin (Table 1). These findings suggest that a factor other than iron may be responsible for the positive correlation with haemoglobin. This factor may be vitamin A, because of the positive association between serum selenium and serum retinol (r=0.27; P<0.001) noted here, and our earlier observation of an inter-relationship between serum retinol and haemoglobin among these NE Thai children.19 Very few other studies in animals or humans have ob-served any relationship between selenium and vitamin A
status (based on serum retinol), although in a study of adults in Singapore, a positive relationship between serum selenium and serum retinol concentrations was reported after adjusting for age.53 In summary we suggest that there may be no direct relationship linking serum sele-nium and haemoglobin. Both selenium and iodine are required for thyroid hor-mone synthesis, activation, and metabolism.8 Hence, it is not surprising that some54,55 but not all56-59 researchers have reported a high prevalence of Iodine Deficiency Disorders among populations with a relatively low sele-nium status. In our study, however, we showed a nega-tive correlation between serum selenium and log urinary iodine concentrations (r = –0.11; P = 0.014). In some ani-mal studies, relatively high intakes of selenium have been associated with low urinary iodine concentrations,60 but
these findings have not been confirmed in human studies. In conclusion, these NE Thai children were not at risk of selenium deficiency, and indeed for about a third of the children serum selenium levels were above those suggested to protect against some cancers. Some highly significant, positive inter-relationships were observed between serum selenium and zinc, haemoglobin, haema-tocrit, and retinol, although the mechanisms involved and the significance of these inter-relationships is uncertain. Acknowledgement This research was supported by the Micronutrient Initiative Fund, Ottawa, Canada; the Institute of Nutrition, Mahidol University, Salaya, Thailand; and a University of Otago Research Grant. We thank all the school teachers and the children and their families who participated in the study, and all the dedicated research assistants who helped collect the data both in the field and in the laboratory. References 1. Behne D, Kyriakopoulos A. Mammalian selenium-
containing proteins. Ann Rev Nutr 2001; 21: 453–473. 2. Keshan Disease Research Group. Observations on effect of
sodium selenite in prevention of Keshan disease. Chin Med J 1979; 92: 471–476.
3. Beck MA, Levander OA, Handy J. Selenium deficiency and viral infection. J Nutr 2003; 133: 1463S–1467S.
4. Moreno-Reyes R, Suetens C, Mathieu F, Begaux F, Zhu D, Rivera MT, Boelaert M, Néve J, Perlmutter N, Vanderpas J. Kashin-Beck osteoarthropathy in rural Tibet in relation to selenium and iodine status. New Eng J Med 1998; 339: 1112–1120.
Table 4. Comparison of selenium intakes (µg/day) of children from selected countries
Country Reference Dietary methods Age (sample size) Selenium intake (µg/day)
Mean SD Thailand This study One-day diet composite 6–12 years (n=79) 45.9 22.4
USA (NHANES III)
34 24-hour dietary recall 6–11 years (n=3134) 96.0 1.7
New Zealand (NCNS)
32 24-hour dietary recall 5–14 years (n=3275) 37.1 48.1
Papua New Guinea 33 Interactive 24-hour diet recall
6–10 years (n=67) 20.0* –
Malawi 33 3-day weighed intakes 4–6 years (n=62) 15.0* –
* median; NCNS – National Children's Nutrition Survey

W Krittaphol, K B Bailey, T Pongcharoen, P Winichagoon, C Thomson and RS Gibson 479
5. Van Rij AM, Thomson CD, McKenzie JM, Robinson MF. Selenium deficiency in total parenteral nutrition. Am J Clin Nutr 1979; 32: 2076–2085.
6. Jochum F, Terwolbeck k, Meinhold H, Behne D, Menzel H, Lombeck I. Is there any health risk of low dietary selenium supply in PKU-children? Nutr Res 1999; 19: 349–360.
7. Levine RJ, Olson RE. Blood selenium in Thai children with protein-calorie malnutrition. Proc Soc Exp Biol Med 1970; 134: 1030–1034.
8. Arthur JR. Functional indicators of iodine and selenium status. Proc Nutr Soc 1999; 58: 507–512.
9. Zagrodzki P, Szmigiel H, Ratajczak R, Szybinski Z, Zachwieja Z. The role of selenium in iodine metabolism in children with goiter. Environ Health Perspect 2000; 108: 67–71.
10. Derumeaux H, Valeix P, Castetbon K, Bensimon M, Boutron-Ruault MC, Arnaud J, Hercberg S. Association of selenium with thyroid volume and echostructure in 35- to 60-year-old French adults. Eur J Endocrinol 2003; 148: 309–315.
11. Giray B, Hincal F. Selenium status in Turkey–possible link between status of selenium, iodine, antioxidant enzymes and oxidative DNA damage. J Radioanalyt Nucl Chem 2004; 259: 447–451.
12. Chmielnicka J, Zareba G, Witasik M, Brzeznicka E. Zinc-selenium interaction in the rat. Biol Trace Elem Res 1988; 15: 267–276.
13. House WA, Welch RM. Bioavailability of and interactions between zinc and selenium in rats fed wheat grain intrinsically labeled with 65Zn and 75Se. J Nutr 1989; 119: 916–921.
14. Giray B, Riondel J, Arnaud J, Ducros V, Favier A, Hincal F. Iodine and/or selenium deficiency alter tissue distri-bution pattern of other trace elements in rats. Biol Trace Elem Res 2003; 95: 247–258.
15. Udomkesmalee E, Dhanamitta S, Yhoung-Aree J, Rojroongwasinkul N, Smith JC Jr. Biochemical evidence suggestive of suboptimal zinc and vitamin A status in schoolchildren in northeast Thailand. Am J Clin Nutr 1990; 52: 564–567.
16. Bloem MW, Wedel M, Egger RJ, Speek AJ, Chusilp K, Saowakontha S, Schreurs WH. A prevalence study of vitamin A deficiency and xerophthalmia in northeastern Thailand. Am J Epidemiol 1989; 129: 1095–1103.
17. Hathirat P, Valyasevi A, Kotchabhakdi NJ (1992): Effects of an iron supplementation trial on the Fe status of Thai school children. Br J Nutr 1992; 68: 245–252.
18. Pongpaew P, Tungtrongchitr R, Phonrat B, Supawan V, Schelp FP, Intarakhao C, Mahaweerawat U, Saowakontha S. Nutritional status of school children in an endemic area of iodine deficiency disorders (IDD) after one year of iodine supplementation. Southeast Asian J Trop Med Public Health 1998; 29: 50–57.
19. Thurlow RA, Winichagoon P, Green T, Wasantwisut E, Pongcharoen T, Bailey KB, Gibson RS. Only a small proportion of anemia in northeast Thai school children is associated with iron deficiency. Am J Clin Nutr 2005; 82: 380–387.
20. Department of Health (Nutrition Division) The fourth national nutrition survey of Thailand. Ministry of Public Health, Bangkok, Thailand, 1995.
21. Thurlow RA, Winichagoion P, Pongcharoen T, Gowachirapant S, Boonpraderm A, Manger MS, Bailey KB, Wasantwisut E, Gibson RS. Risk of zinc, iodine, and other micronutrient deficiencies among school children in N.E. Thailand. Eur J Clin Nutr 2006; 60: 623–632.
22. Tamura T, Johnston KE, Freeberg LE, Perkins LL, Goldenberg RL. Refrigeration of blood samples prior to separation is essential for the accurate determination of plasma or serum zinc concentrations. Biol Trace Elem Res 1994; 41: 165–173.
23. Jacobson BH, Lockitch G. Direct determination of selenium in serum by graphite-furnace atomic absorption spectrometry with deuterium background detection and a reduced palladium modifier: age specific reference ranges. Clin Chem 1988; 34: 709–714.
24. Friel JK, Ngyuen CD. Dry- and wet-ashing techniques compared in analyses for zinc, copper, manganese, and iron in hair. Clin Chem 1986; 32/5: 739–742.
25. Pettersson J, Hansson L, Örnemaric U, Olln A. Fluorimetry of selenium in body fluids after digestion with nitric acid, magnesium nitrate hexahydrate, and hydrochloric acid. Clin Chem 1988; 34/9: 1906–1910.
26. Tinggi U, Reilly C, Patterson CM. Determination of selenium in food stuffs using spectrofluorometry and hydride generation atomic absorption spectrometry. J Food Comp Anal 1992; 5: 269–280.
27. Tiran B, Tiran A, Rossipal E, Lorenz O, Nikitin DO. Simple decomposition procedure for determination of selenium in whole blood, serum and urine by hydride generation atomic absorption spectroscopy. J Trace Elem Electrolytes Health Dis 1993; 7: 211–216.
28. Thomson CD. Assessment of requirements for selenium and adequacy of selenium status: a review. Eur J Clin Nutr 2004; 58: 391–402.
29. Wasowicz W, Gromadzinska J, Rydzynski K, Tomczak J. Selenium status of low selenium area residents: Polish experience. Toxicol Lett 2003; 137: 95–101.
30. McLachlan SK, Thomson CD. Serum selenium con-centrations in New Zealand children. Asia Pac J Clin Nutr 2004; 13(Suppl): S86.
31. Bates CJ, Thane CW, Prentice A, Delves HT, Gregory J. Selenium status and associated factors in a British National Diet and Nutrition Survey: young people aged 4–18 y. Eur J Clin Nutr 2002; 56: 873–881.
32. ParnellW, Scragg R,Wilson N, Schaaf D, Fitzgerald E. (2003) NZ Food, NZ Children: Key Results of the 2002 National Children’s Nutrition Survey. Ministry of Health, Wellington.
33. Donovan UM, Gibson RS, Ferguson EL, Ounpuu S, Heywood P. Selenium intakes of children from Malawi and Papua New Guinea consuming plant-based diets. J Trace Elem Electrolytes Health Dis 1992; 6: 39–43.
34. Bialostosky K, Wright JD, Kennedy-Stephenson J, McDowell M, Johnson CL. Dietary intake of macronutrients, micronutrients, and other dietary con-stituents: United States 1988–94. Vital Health Stat 11 2002; 245: 1–158.
35. IOM (Institute of Medicine) (2000) Dietary reference intakes for vitamin C, vitamin E, Se, and carotenoids. National Academy Press, Washington DC
36. Sunde R. Selenium. In: Bowman B, Russell RM, eds. Present Knowledge in Nutrition. 8th Edition. Washington, DC: International Life Sciences Press, 2001; 352-365.

480 Selenium status of Thai school children
37. Lombeck I, Kasperek K, Harbisch HD, Becker K, Chumann E, Schroter W, Feinendegen LE, Bremer HJ, The selenium state of children. II. Selenium content of serum, whole blood, hair and the activity of erythrocyte glutathione peroxidase in dietetically treated patients with phenylketonuria and maple-syrup-urine disease. Eur J Pediatr 1978; 128: 213–223.
38. Acosta PB, Stepnick-Gropper S, Clarke-Sheehan N, Wenz E, Cheng M, Anderson K, Koch R. Trace element status of PKU children ingesting an elemental diet. J Parenter Enteral Nutr 1987; 11: 287–292.
39. Reilly C, Barrett JE, Patterson CM, Tinggi U, Latham SL, Marrinan A. Trace element nutrition status and dietary intake of children with phenylketonuria. Am J Clin Nutr 1990; 52: 159–165.
40. Jochum F, Terwolbeck K, Meinhold H, Behne D, Menzel H, Lombeck I. Effects of a low selenium state in patients with phenylketonuria. Acta Paediatr 1997; 86: 775 –777.
41. Snook JT, Palmquist DL, Moxon AL, Cantor AH, Vivian VM. Selenium status of a rural (predominantly Amish) community living in a low-selenium area. Am J Clin Nutr 1983; 38: 620–630.
42. Lane HW, Warren DC, Taylor BJ, Stool E. Blood selenium and glutathione peroxidase levels and dietary selenium of free-living and institutionalized elderly subjects. Proc Soc Exp Biol Med 1983; 173: 87–95.
43. Mutanen M. Bioavailability of selenium in mushrooms, Boletus edulis, to young women. Int J Vitam Nutr Res 1986; 56: 297–301.
44. Sirichakwal PP, Puwastein P, Polngam J, Kongkachuichai R. Selenium content of Thai foods. J Food Comp Anal 2005; 18: 47–59.
45. Chmielnicka J, Zareba G, Witasik M, Brzeznicka E. Zinc-selenium interaction in the rat. Biol Trace Elem Res 1988; 15: 267–276.
46. Schrauzer GN, Sacher J. Selenium in the maintenance and therapy of HIV-infected patients. Chem Biol Interact 1988; 91: 199–205.
47. Federico A, Iodice P, Federico P, Del Rio A, Mellone MC, Catalano G, Federico P. Effects of selenium and zinc sup-plementation on nutritional status in patients with cancer of digestive tract. Eur J Clin Nutr 2001; 55: 293–297.
48. Berger MM, Shenkin A, Revelly JP, Roberts E, Cayeux MC, Baines M, Chioléro RL. Copper, selenium, zinc, and thiamine balances during continuous venovenous hemo-diafiltration in critically ill patients. Am J Clin Nutr 2004; 80: 410–416.
49. Blessing H, Kraus S, Heindl P, Bal W, Hartwig A. Interaction of selenium compounds with zinc finger proteins involved in DNA repair. Eur J Biochem 2004; 271: 3190–3199.
50. Maret W. The function of zinc metallothionein: a link between cellular zinc and redox state. J Nutr 2000; 130: 1455S–1458S.
51. Klotz L-O, Kroncke K-D, Buchczyk DP, Sies H. Role of copper, zinc, selenium and tellurium in the cellular defense against oxidative and nitrosative stress. J Nutr 2003; 133: 1448S–1451S.
52. de Jong N, Gibson RS, Thomson CD, Ferguson EL, McKenzie JE, Green TJ, Horwath CC. Selenium and zinc are suboptimal in sample of older New Zealand women in a community-based study. J Nutr 2001; 131: 2677–2684.
53. Hughes K, Ong CN. Vitamins, selenium, iron, and coronary heart disease risk in Indians, Malays, and Chinese in Singapore. J Epi Comm Health 1998; 52: 181–185.
54. Vanderpas JB, Contempre B, Duale NL, Diplock AT, Dumont JE. Selenium deficiency mitigates hypothyroxin-emia in iodine-deficiency subjects. Am J Clin Nutr 1993; 57: 271S—275S.
55. Thilly C, Swennen B, Bourdoux P, Ntambue K, Moreno-Reyes R, Gillies J, Vanderpas JB. The epidemiology of iodine-deficiency disorders in relation to goitrogen factors and thyroid-stimulating-hormone regulation. Am J Clin Nutr 1993; Suppl 57: 267S–270S.
56. Burk RF, Pearson WN, Wood RP, Viteri F. Blood-selenium levels and in vitro red blood cell uptake of Se in Kwashiorkor. Am J Clin Nutr 1967; 20: 723–733.
57. Fondu P, Hariga-Muller C, Mozes N, Nève J, Van Steirteghem A, Mandelbaum IM. Protein-energy malnutri-tion and anemia in Kivu. Am J Clin Nutr 1978; 31: 46–56.
58. Golden MHN, Ramdath D. Free radicals in the pathogenesis of Kwashiorkor. In: Taylor TG, Jenkins NK, eds. Proceedings of the XIII International Congress of Nutrition. Paris: John Libbey Eurotext Ltd, 1986; 597–598.
59. Lombeck I, Menzel H. Selenium in neonates and children, In: Nève J, Favier A, eds. Selenium in medicine and biology. New York, Walter de Gruyter, 1989; 197–206.
60. Behne D, Kyriakopoulos A, Gessner H, Walzog B, Meinhold H. Type I iodothyronine deiodinase activity after high selenium intake, and relations between selenium and iodine metabolism in rats. J Nutr 1992; 122: 1542–1546.

W Krittaphol, K B Bailey, T Pongcharoen, P Winichagoon, C Thomson and RS Gibson 481
Original Article Primary school children from northeast Thailand are not at risk of selenium deficiency Woravimol Krittaphol MSc
1, Karl B Bailey PhD1, Tippawan Pongcharoen MSc
2, Pattanee Winichagoon PhD
2, Christine Thomson PhD1 and Rosalind S Gibson PhD
1
1 Department of Human Nutrition, University of Otago, Dunedin, New Zealand. 2 Institute of Nutrition, Mahidol University, Salaya, Thailand,
泰國東北部的國小學童沒有硒缺乏的危險泰國東北部的國小學童沒有硒缺乏的危險泰國東北部的國小學童沒有硒缺乏的危險泰國東北部的國小學童沒有硒缺乏的危險
不論是甲狀腺荷爾蒙代謝、氧化還原反應、生殖及免疫作用,硒都扮演抗氧化劑的重要角色,但是有關於泰國學童硒營養狀況方面的資訊卻相當有限。我們評估515名(259男生;256女生)6歲到13歲居住在泰國東北部Ubon
Ratchthani城的十個鄉村學校的學童。血清硒使用石墨爐式原子吸收光譜法(Gr
aphite Furnace Atomic Absorption Spectrophotometry) 分析, 飲食硒 攝取量
的評估則是隨機選取80名學童(40名男生;40名女生)採用 Hydride Generation
收光譜分析複製一天飲食的混合樣本。血清硒、飲食硒攝取量及其他生化微量營養素指數之間的相關性也同時檢視。血清硒濃度平均值(標準差)為1.46(0.24)
µmol/L,其濃度不受感染或是血紅素病變影響,但會受就讀學校(P<0.001)、性別(P<0.038)及年齡組別(P=0.003)影響,血清鋅是顯著的共變項。沒有任何一個學童的血清硒濃度顯示有臨床上硒缺乏的現象(亦即<0.1µmol/L)。血清硒與血清鋅(r=0.216;P<0.001)、血清視網醇(r=0.273;P<0.001)、尿碘(r=-
0.110;P=0.014)、血紅素(r=0.298;P<0.001)及血比容(r=0.303;P<0.001)有顯著的相關。飲食硒平均(標準差)攝取量為46(22) µg/天。 血清 硒濃度 較低的 學
童比起血清硒濃度較高的學童其硒平均攝取量較低(38 ± 17 vs. 51 ± 24 µg/天;
P<0.010)。總而言之,此研究顯示在泰國東北部的學童沒有硒缺乏的危險。
關鍵字:硒、血清、飲食、鋅、兒童、泰國。

482 Asia Pac J Clin Nutr 2006;15 (4): 482-490
Original Article
Obesity and undernutrition in sub-Saharan African immigrant and refugee children in Victoria, Australia
André MN Renzaho MPH, PhD, Carl Gibbons MSc, Boyd Swinburn MB, ChB, MD, FRACP
Damien Jolley MSc and Cate Burns PhD School of Exercise & Nutrition Sciences, Deakin University, 221 Burwood Highway, Burwood 3125 Victoria, Australia
The study assessed the anthropometric status of 337 sub-Saharan African children aged between 3-12 years who migrated to Australia. These children were selected using a snowball sampling method stratified by age, gender and region of origin. The prevalence rates for overweight and obesity were 18.4% (95%CI: 14 - 23%) and 8.6% (95%CI: 6% -12%) respectively. The prevalence rates for the indicators of undernutrition were: wasting 4.3% (95%CI: 1.6%-9.1%), underweight 1.2% (95%CI: 0.3%-3.0%), and stunting 0.3 (95%CI: 0.0%-1.6%). Higher prevalence of overweight/obesity was associated with lower household income level, fewer siblings, lower birth weight, western African background, and single parent households (after controlling for demographic and socio-economic factors). Higher prevalence rates for underweight and wasting were associated with lower household income and shorter lengths of stay in Australia respectively. No effect was found for child’s age, gender, parental education and occupation for both obesity and undernutrition indices. In conclusion, obesity and overweight are very prevalent in SSA migrant children and undernutrition, especially wasting, was also not uncommon in this target group.
Key Words: obesity, undernutrition, sub-Saharan Africa, children, migration, refugees Introduction Undernutrition, defined as growth failure due to in-sufficient dietary intake and/or infectious disease1, remains the biggest public health challenge in Africa. Various forms of undernutrition have been documented across Africa.1,2 Stunting or chronic undernutrition (a height de-ficit that develops over a long period of time as a result of prolonged poor nutrition1) has been estimated to affect 35.2% of children across the continent (including Northern Africa) compared to 41.5% in sub-Saharan Africa (SSA).2,3 Current estimates indicate that stunting declined globally by 8.9 percentage points for the period from 1980 to 1995 but there was no decrease in stunting in SSA during this period.4 As with stunting, progress has been made in reducing the prevalence of underweight (a combination of chronic and acute undernutrition and measured by the weight-for-age index) globally over the last 2 decades except in SSA. While the prevalence of underweight for all developing countries averaged 26.7% in 2000, decreasing from 37.4% in 1980, in SSA rates have increased from 24.9% in 1980 in Eastern Africa to 35.9% in 2000, and from 30.1% in Western Africa in 1980 to 36.5% in 2000.2,3 In contrast, the prevalence of wasting or acute under-nutrition (a condition reflecting recent rapid weight loss or a failure to gain weight as a result of sudden food shortage and/or infectious disease outbreak such as measles)5 has been relatively lower than rates for stunting in non-
emergency settings, with the highest prevalence being re-ported in western Africa (15.6%).2,3 The rates for Africa vary between 2.9% and 15.6%, averaging 9.6%. How-ever, higher rates have been reported in refugee settings, as a consequence of ethnic conflicts, natural disasters and war6. For example, Manoncourt and colleagues7 reported acute undernutrition prevalence as high as 47-75% among displaced people in Somalia. In southern Sudan acute undernutrition prevalence has been reported to be about 21.2%.8 In the countries that provide the bulk of refugees and migrants to Australia from the Sub-Saharan region9 there is a coexistence of undernutrition and overweight/obe-sity.10-12 In these countries, prevalence rates for stunting, wasting and underweight among children vary between 30-58%, 4-12% and 12-48% respectively while the prevalence of overweight and obesity range from 5-17% and 1-5% respectively.10,12 Prior to migration, causes of under-nutrition in these countries have varied considerably
Correspondence address: Dr André M.N. Renzaho, Honorary and Senior Research Fellow, School of Health and Social Development, Deakin University, 221 Burwood Highway, Burwood 3125, Victoria, Australia Tel/fax: 61 3 9466 9648 Email: [email protected] or [email protected] Accepted 2 December 2005

AMN Renzaho, C Gibbons, B Swinburn, D Jolley and C Burns 483
and have included food insecurity triggered by poverty, drought, armed conflicts, inadequate agricultural policies, poor governance, and the current HIV/ AIDS epidemic13, inadequate social and care environment such as feeding practices, women’s right and responsibilities, and im-paired public health environment such as poor immu-nization status or poor access to clean water.1,14 Studies of migrant children from poor countries with an impaired health environment15,16 indicate that the nutri-tional status of the children improves dramatically once they migrate to wealthier countries. However, this can also lead to childhood obesity and adult chronic disease.15 Studies exploring the risk of obesity and the risk of developing chronic diseases later in life in migrants from poor countries have identified an array of risk factors and these include: genetic predisposition17-20, length of stay in the host country, generation and acculturation,19,21-25 cul-tural beliefs and values,26,27 provenance status,25,28-30 parity and stress,31 poor quality of housing, physical in-activity and high alcohol consumption23,31 and language barriers, religion and discrimination.32 Studies that have examined migrants from Africa spe-cifically have shown that obesity and its consequences are the main nutritional issues33-35 and that the above deter-minants also generally apply.19,25,31,35 Migrants from Africa, however, seem to be more affected than from other regions of the world,26,35 and, within African mi-grants, those from the west African countries appear to be the most affected by obesity.35 Despite the pre-and post-migration nutritional risk of SSA migrants, there is a scarcity of data assessing the nutritional status of the various SSA refugees and mi-grants who migrate to a wealthy country such as Austra-lia. Therefore, the purpose of this study was to assess the anthropometric status of migrant and refugee children from sub-Sahara Africa. It is postulated that the popu-lation of migrant and refugee children in Australia from SSA exhibit a mixture of undernutrition and obesity with undernutrition being related to shorter time in Australia and obesity being related to a longer length of stay. Methods Participants Anthropometric data were collected on 337 children aged between 3 and 12 years. Children were selected using the United Nations’ classification of African regions and sub-regions (eastern, central western and southern Africa).36 Although Sudan has been classified as a Northern African country36, refugees and migrants from south Sudan were included in this study given their similarities to other Sub-Saharan Africans in terms of ethnicity and migration history. They were classified as central Africans given their linguistic and cultural similarities.37 For South Africa and Zimbabwe, white families were excluded since they are known to be more economically and socially ad-vantaged than their black counterparts.38 This project was approved by Deakin University’s Ethics Committee, and informed consent from parents was acquired. Sampling strategy A snowball sampling technique was used to recruit eli- gible members of Victoria’s minority SSA population.39
A series of consultative meetings with key community leaders and African social workers was carried out. The first step involved talking to African workers in the primary health care sector who created the links with key community leaders. In consultation with both African workers and community leaders, a committee called “African Review Panel” was established. The role of the panel was to facilitate access to SSA communities. Parti-cipants located through community health workers or African community organisations’ networks were asked to nominate friends from their own networks. To enhance representativeness, the sampling was stratified by age, gender, and region. A matrix of 3 age-groups, gender, and 3 regions of origin was constructed. In each layer, an initial family with eligible children by age was identified. Then, the identified family was asked to identify or recommend other families from their region of origin that have children who meet the study age-related inclusion criteria. The next identified family was only visited after the preceding procedure was implemented across clusters. The process continued until the cluster was exhausted or saturated, that is, no more families could be identified. However, while cell sizes were proportional to the SSA population in Australia for eastern, central and western Africa, migrants of southern African origin were difficult to locate as the majority of them are white South Africans and Zimbabweans. Hence, only three households from this region were identified from which seven children were eligible for the study. Consequently, our coding of African regions merged southern with eastern Africa. The subsequent analysis was based on three regions: Central Africa, Eastern/Southern Africa and Western Africa. Anthropometric measurements Weight was measured by portable electronic scales (UC-321 Co Ltd, London) to the nearest 50g. Children were measured without shoes and in light clothing. Height was measured to the nearest millimetre with a portable Harpenden Stadiometer (British Indicators Ltd, London). Body mass index (BMI-for-age) was used to define over-weight and obesity, height-for-age (H/A) was used for stunting, weight-for-height (W/H) for wasting, and weight-for-age (W/A) for underweight. BMI-for-age was interpreted using published international standards40 and W/A, H/A, and W/H indices were interpreted using the new National Center for Health Statistics/Center for Disease control reference values.41 These references are published in age-specific Z-score values for W/A and H/A and height-specific Z-score values for W/H. How-ever, for W/H, values are provided only for children whose height was less or equal to 121cm. W/H refer-ences for greater heights tend to be confounded by, and otherwise made unreliable by, pubertal growth factors, and are not widely used (Prof. Michael Golden, personal communication, 2001). Children were defined as suffering from wasting, stunting, or underweight if their respective z-scores for W/H, H/A, or W/A were cal-culated to be below –2. Birth-weight was assessed by a 4-point scale question where parents indicated whether the child was born very small, small, average or larger than normal.

484 Obesity and malnutrition in immigrant African children in Australia
Socio-demographic factors Parents reported their child’s age; their occupation; their educational attainment; the household annual income; the number of children living at home, and the household length of stay (LOS) in Australia Data analysis Data were entered using SPSS for Windows, version 10.0 (SPSS Inc. Chicago, III, USA) and analysed using Stata version 7.0 (Stata Corporation, Texas, USA). Because of the high correlation between the study variables, standard multiple regression was used to determine the best pre-diction of a dependent variable from several demo-graphic and socio-economic variables. Where standard multiple regression was used, the “svyset command” in Stata was used to specify clustering within the household, stratification, and weighting prior to analysis. Where the outcome was binary, logistic regression was used. All analyses of the children’s data have standard errors adjusted for clustering within household. For both stan-dard and logistic regression the predictors were either continuous themselves, or they were categorical variables which were then transformed into a set of ‘dummy’ va-riables all of which were binary. For all the categorical variables, the lowest coded category was the reference. The relationship between two categorical variables (i.e. study outcome versus independent variable) was exa-mined by chi-square test. The level of statistical sig-nificance was set at a probability of p<0.05 for all tests.
Results Demographic characteristics In total, 337 children were measured and weighed. The length of stay in Australia averaged 5.9 years (95% CI: 5.4 year-6.4 years). The majority of the sample came from eastern Africa (68.8%) mainly from the Horn of Africa (Table 1). Nearly three quarters came from countries that were not under British colonial rule. Wasting, stunting and underweight The prevalence rates for wasting, underweight and stunting were 4.3% (95%CI: 1.6%-9.1%), 1.2% (95%CI:
0.3%-3.0%) and 0.3 (95%CI: 0.0%-1.6%) respectively (Table 2). The relationship between W/A, H/A, and W/H and socio-demographic factors was assessed by linear regression (Table 3). The model incorporating all socio-demographic factors explained 10.9% (p<0.01) of the variance for W/A Z-score, 8.2% (p<0.05) of the variance for H/A Z-score, and 18.4% (p<0.05) of the variance for W/H Z-score (Table 4). W/A Z-scores tended to decrease as the number of siblings increased. Underweight and wasting were inversely associated with household income and length of stay (LOS) respectively (Table 4). Children with a higher than average birth weight had higher W/A, W/H and H/A z-scores than children with a lower than average birth weight. Parental occupation and education did not explain any more of the variance for W/A, H/A and W/H Z-scores. Obesity and overweight The overall prevalence rates for overweight and obesity were 18.4% (95%CI: 14 - 23%) and 8.6% (95%CI: 6% -12%) respectively. Therefore, 27% of the study popu-lation were overweight or obese. The prevalence of over-weight and obesity was similar among boys and girls of the same age. Univariate analysis indicated that a high prevalence of overweight and obesity was associated with: children born larger than normal (χ2=11.74; p = 0.008); parents who migrated for educational oppor-tunities and/or for financial/economic reasons (χ2= 14.37, p=0.002); migration from former British colonies (χ2 = 7.83, p=0.005); migration from western Africa χ2=16.46, p=0.000); parents who were unemployed or not in labour force (χ2=11.06, p=0.044); living in Australia for 5 years or more (χ2=4.75, p=0.029); and household composed of two children or less (χ2= 8.34, p=0.015). The trends indicated by non-parametric tests did not mirror the multivariate analysis. Using logistic regression, data presented in Table 4 show the crude and adjusted odds ratios describing the association between overweight and obesity, and potential risk factors. In the adjusted model, overweight/obesity was inversely related to house-hold income level, child’s birth-weight and the number of children (siblings) but positively associated with parental cohabitation. Although the risk of overweight/obesity in-creased with length of stay in the unadjusted model, this difference disappeared after controlling for other factors. Children of a western African background were more likely to be overweight/obese than children of a central African background. No effect was found for child’s age, gender, parental education and occupation. Discussion This study assessed anthropometric indices in 3-to-12-year old SSA migrant children who had migrated to Victoria, Australia. The study found a coexistence of a relatively higher than expected prevalence of overweight/ obesity and undernutrition among this target group. Such a pattern is consistent with findings of anthropometric studies among migrant children settling in developed countries42-44 and among children in countries undergoing economic transition.10,45 A study of Mexican-Indian migrant children settling in the US42 found that the pre-valence of combined overweight/obesity was 38% while
Table 1. Characteristics of participants
Factor Description N
(337) %
Gender Male 165 49.0
Female 172 51.0
Age group 3-5 years 118 35.0
6-8 years 102 30.3
9-12 years 117 34.7 Length of stay 1 year or less 9 2.7
1-5 years 153 45.4
6-10 years 126 37.4
11 years or more 49 14.5 Region of origin Central 63 18.7
Eastern/Southern 239 70.9
Western 35 10.4 Ex-colonial rule Ex-English colony 92 27.3
Non ex-English colony 245 72.7

AMN Renzaho, C Gibbons, B Swinburn, D Jolley and C Burns 485
the prevalence rates for underweight and stunting were 1.2% and 4.8% respectively. A coexistence of a high pre-valence of undernutrition and overweight/obesity has also been reported in various countries in sub-Saharan Afri-ca,10,12,45 Middle East, North America and Latin Ame-rica.11 Even in wealthy countries such as the UK or Australia despite the high prevalence of obesity, signi-ficant pockets of undernutrition have been reported in these countries.46,47 In the current study, wasting was mainly in young boys who were recent arrivals to Australia (less than two years). The observed prevalence for wasting was probably underestimated because the prevalence was computed for only children whose height was less than or equal to 121cm (N=140) for which references values for W/H are available.41 Amongst migrant SSA children with a longer stay in Australia, the nutritional status was substantially different, with obesity
becoming more prevalent. Increasing obesity with in-creased length of stay has been previously descri-bed.15,19,21-25 In addition, the findings that children of a western African background have a higher risk of obesity than children from other African regions have been re-ported in other studies.35 This will be a major public health challenge for this population. An inverse relationship between overweight/obesity prevalence and SES is typical of the pattern in wealthy countries.48-50 This pattern was found in SSA migrant children using household income but not parental edu-cation or occupation as markers of SES. In fact there seem to be inconsistencies regarding the relationship be-tween SES and the risk of obesity among migrants from sub-Saharan Africa to the developed world. Studies exa-mining relationship between obesity and its risk factors, and income and educational level of African Americans
Boys
Age-group (years)
(N)
3-5 years
(57)
6-8 years
(58)
9-12 years
(50)
Total
(165)
Mean weight (Kg) 19.5 (18.3, 20.7) 27.1 (25.6, 28.7) 42.3 (39.0, 45.7) 29.1 (27.2, 31.0)
Mean height (cm) 108.6 (106.1, 111.0) 126.4 (124.5, 128.3) 146.6 (143.4, 149.7) 126.4 (123.6, 129.1)
Mean BMI 16.4 (15.9, 17.0) 16.9 (16.1, 17.6) 19.5 (18.4, 20.7) 17.5 (17.0, 18.0)
Mean H/A Z-score 1.3 (0.9, 1.7) 1.0 (0.7, 1.2)) 0.7 (0.4, 1.1) 1.0 (0.8, 1.2)
Mean W/A Z-score 1.8 (1.2, 2.3) 1.6 (1.1, 2.2) 1.7 (1.1, 2.3) 1.7 (1.4, 2.0)
Mean W/H Z-score (a) 0.6 (0.1, 1.1) 1.1 (-0.3, 2.5) - - - 0.9 (0.3, 1.4)
Obesity (%) 5.3 (1.0, 15.0) 8.6 (3.0, 19.0) 14.0 (6.0, 27.0) 9.1 (5.0, 15.0)
Overweight (%) 19.3 (10, 32) 20.7 (11.0, 33.0) 12.0 (5.0, 24.0) 17.6 (12.0, 24.0)
Stunting (%) 0.0 - - 0.0 - - 2.0 (0.1, 10.6) 0.6 (0.0, 3.3)
Underweight (%) 5.3 (1.1 14.6) 1.7 (0.0, 9.2) 0.0 - - 2.4 (0.7, 6.1)
Wasting (%) (a) 7.8 (2.2 18.9) 7.1 (0.2, 33.8) - - - 7.6 (2.5, 16.8)
Girls
Age-group (years)
(N)
3-5 years
(61)
6-8 years
(44)
9-12 years
(67)
Total
(172)
Mean weight (Kg) 17.9 (17.1, 18.8) 26.7 (24.4, 29.0) 38.6 (36.4, 40.7) 28.2 (26.5, 29.9)
Mean height (cm) 105.4 (103.4, 107.5) 124.2 (121.8, 126.5) 143.7 (141.5, 145.8) 125.1 (122.3, 127.9)
Mean BMI 16.0 (15.6, 16.4) 17.1 (16.1, 18.2) 18.6 (17.7, 19.4) 17.3 (16.8, 17.8)
Mean H/A Z-score 1.0 (0.7, 1.3) 0.8 (0.4, 1.1) 0.7 (0.4, 0.9) 0.8 (0.6, 1.0)
Mean W/A Z-score 1.2 (0.8, 1.6) 1.6 (0.8, 2.4) 1.1 (0.6, 1.5) 1.3 (1.0, 1.5)
Mean W/H Z-score (a) 0.6 (0.2, 0.9) 0.4 (-0.4, 1.1) - - - 0.5 (0.2, 0.9)
Obesity (%) 6.6 (2.0, 16.0) 13.6 (5.0, 27.0) 6.0 (2.0, 15.0) 8.5 (5.0, 13.0)
Overweight (%) 11.5 (5.0, 22.0) 25.0 (13.0, 34.7) 22.4 (13.0, 34.0) 19.2 (14.0, 26.0)
Stunting (%) 0.0 - - 0.0 - - 0.0 - - 0.0 - -
Underweight (%) 0.0 - - 0.0 - - 0.0 - - 0.0 - -
Wasting (%) (a) 0.0 - - 6.7 (0.2, 31.9) - - - 1.4 (0.0, 7.3)
(a) Based on children whose height is less or equal to 121 cm for which reference values are available. References values were not available for older children. % of total are based on N boys= 66; N girls=74, Boys; 3-5: N=51; 6-8: N=15; 9-12: N=0. Girls; 3-5:N=59; 6-8; N=15 and 9-12: N=0
Table 2. Summary of means (or % for prevalence) of anthropometric variables (95%CI) in SSA children

486 Obesity and malnutrition in immigrant African children in Australia
have reported a positive relationship,51,52 while others found no relationship.53-55 This inconsistency could be due to the difficulties of measuring SES in studies of recent immigrants and diffe-rences in LOS and age-groups of the target population. In the developed world, SES is usually defined by income level, educational attainment, occupation or location of residence (based on deprivation indices).26,56-58 Among SSA populations, SES is culturally defined and usually refers to wealth and body sizes have traditionally been used as a marker of social rank.27,59,60 Brown has reported that African American women view bigness as a sign “of health, prosperity and a job well done.”26 Renzaho has reported that for SSA “big body size characterizes social rank, status and power and such views determine how
food rules are defined and sustained”.27 Consistent with these findings is the fact that health behaviours of SSA are culturally determined independent of educationally attainment.37,61,62 And as a result of corruption, income level is neither dependent on nor commensurate with occupation due to corrupt governments and political instability.63-65 Furthermore, occupation is not a function of educational attainment due to nepotism.63,66 The diffi-culty associated with measuring SES among migrant and minority populations has been recognized by various re-searchers.67-71 Despite these difficulties in measuring SES, various studies have consistently reported a positive relationship between income level (as measure of SES) and the risk of obesity but an inverse relationship between undernutrition
Overweight/obesity
Unadjusted Overweight/obesity
Adjusted *
N (%) OR (95%CI) O.R (95% CI)
Age (years) 337 (27.0) 1.04 (0.95, 1.13) 1.04 (0.92, 1.17)
Number of children a 337 (27.0) 0.85 (0.75, 0.96)# 0.82 (0.70, 0.96)#
LOS (years)** 337 (27.0) 1.06 (1.01, 1.12)# 1.02 (0.93, 1.12)
Gender Girls 172 (26.7) ref ref
Boys 165 (27.3) 0.97 (0.60, 1.58) 1.13 (0.63, 2.01)
Living with partner b
Single parent 73 (31.5) ref ref
Nuclear family 264 (25.8) 1.33 (0.75, 2.33) 2.39 (1.13, 5.04)#
Place of birth
Refugee camps/COO** 213 (23.9) ref ref
Australia 124 (32.3) 0.66 (0.41, 1.08) 0.81 (0.34, 1.96)
Birth-weight
Very small/Small 61 (13.1) ref ref
Normal 208 (28.4) 0.23 (0.09, 0.57)# 0.23 (0.08, 0.68)#
Larger than normal 61 (39.3) 0.61 (0.34, 1.10) 0.49 (0.25, 0.97#)
Household income level
$46,000 or more 52 (40.4) ref ref
$30,000-$45,000 104 (28.8) 2.26 (1.12, 4.38)# 3.36 (1.41, 8.01)#
$29,000 or less 165 (23.0) 1.36 (0.78, 2.36) 2.14 (1.07, 4.30)#
Parents' education prior to migration
Tertiary/Further education 108 (28.7) ref
High school 144 (30.6) 1.74 (0.88, 3.44) 1.07 (0.41, 2.80)
Primary or less 85 (18.8) 1.90 (0.99, 3.63) 1.49 (0.70, 3.17)
Occupation
Unemployed/not in labour force 240 (23.3) ref ref
Labour (skilled and unskilled) 27 (44.4) 0.62 (0.35, 1.11) 1.65 (0.67, 4.06)
Professional/Admin 70 (32.9) 1.63 (0.66, 4.05) 2.76 (0.86, 8.84)
Region of Origin
Central Africa 63 (11.1) ref ref
Eastern/Southern Africa 239 (28.0) 3.12 (1.44, 7.23)# 2.25 (0.82, 6.21)
Western Africa 35 (48.6) 7.61 (2.74, 21.11)# 4.62 (1.09, 19.66)#
* Model adjusted for factors in the table; ** LOS= Length of stay, COO=country of origin; aNumber of children living in the households at the time of
the survey; bLiving with partner? Yes=1 (nuclear family), No=0 (single parent); # Bold and Italic means significantly different from reference at p<0.05
Table 3. Odds ratios (OR) and 95% confidence interval (CI) of overweight and obesity and socio-demographic variables

AMN Renzaho, C Gibbons, B Swinburn, D Jolley and C Burns 487
and income level among African populations in their na-tive environment.72 The observed prevalence of overweight and obesity in the current study is comparable to the pre-valence reported among Australian children.73 Studies of childhood obesity in Australia showed that the prevalence of overweight/obesity more than doubled while that of obesity tripled between 1985 and 1995.73,74 A study by Goodman et al.,74 found that, among 7-to-11-year old boys, the prevalence of combined overweight/obesity in-creased more that doubled over a 15-year period, from 11.2% in 1985 to 26.2% in 2000. For girls, the increase over a 15-year period was from 12.9% in 1985 to 28.4% in 2000. The same data indicate that obesity increased from 1.5% in 1985 to 9.9% in 2000 among boys and from 1.9% in 1985 to 7.1% in 2000 among girls. These data
suggest that the rate of childhood obesity in Australia is rising at an annual rate of 1 percentage point. Hence, the fact that SSA migrant children recorded a high overweight/obesity prevalence over a short period of time seems unsurprising. The current study has several methodological limita-tions associated with interpreting the observed anthro-pometric measurements of SSA migrant children. This study used new reference standards and may not be com-parable to previous studies using different definitions. In addition, snowball sampling strategy, and the age of the 1995 NNS dataset does not permit a well-informed com-parison between populations. Nevertheless, we can hypo-thesize from the study findings that a substantial pro-portion of SSA migrant children arrive in Australia under-
W/A H/A W/H
β (95% CI) β (95% CI) β (95% CI)
Age (years) -0.02 (-0.11, 0.08) -0.06 (-0.12, 0.00) 0.42 (-0.12, 0.97) Number of children -0.14 (-0.25, -0.04)# -0.03 (-0.10, 0.04) -0.17 (-0.40, 0.06) LOS (years) 0.04 (-0.05, 0.12) 0.01 (-0.04, 0.06) -0.12 (-0.23, -0.01)# Gender
Girls ref ref ref
Boys 0.25 (-0.21, 0.71) 0.06 (-0.21, 0.33) 0.21 (-0.56, 0.98) Living with partners
Single parents ref ref ref
Nuclear family -0.67 (-1.31, -0.04)# 0.07 (-0.32, 0.47) -0.71 (-2.08, 0.67) Birth place
Refugee camps/COO ref ref ref
Australia 0.30 (-0.43, 1.03) 0.21 (-0.23, 0.64) 0.71 (-0.36, 1.77)
Birth-weight
Very small/small 1 (ref) 1 (ref) 1 (ref)
Average 0.53 (-0.12, 1.18) 0.30 (-0.09, 0.70) 1.07 (0.21, 1.94)# Larger than normal 1.62 (0.81, 2.42)# 0.88 (0.42, 1.34)# 0.97 (0.06, 1.87)#
Household income level
$46,000 or more ref ref ref
$30,000-$45,000 -0.41 (-1.20, 0.38) -0.01 (-0.46, 0.43) -1.00 (-2.38, 0.37) $29,000 or less -0.85 (-1.63, -0.08)# 0.01 (-0.47, 0.49) -1.08 (-2.29, 0.13)
Parent's educational level Tertiary/Further education ref ref ref
High school -0.49 (-1.09, 0.10) -0.43 (-0.92, 0.06) -0.15 (-1.17, 0.87) Primary or less -0.22 (-0.92, 0.48) -0.13 (-0.67, 0.40) -0.84 (-2.17, 0.49)
Occupation
Unemployed/not in labour force ref ref ref
Labour (skilled/unskilled) -0.12 (-1.08, 0.83) -0.15 (-0.77, 0.46) -0.37 (-1.84, 1.10) Professional/Admin -0.02 (-0.75, 0.71) -0.06 (-0.63, 0.51) -0.25 (-1.37, 0.87)
Region Central Africa ref ref ref Eastern/Southern Africa 0.17 (-0.49, 0.82) -0.48 (-0.88, -0.08)# 0.57 (-0.51, 1.65)
Western Africa 0.52 (-0.57, 1.61) -0.19 (-0.86, 0.48) 0.94 (-0.75, 2.63)
r2= 0.109, p<0.01 r2= 0.082, p<0.05 r2= 0.184, p<0.05
Note: Los= Length of stay (LOS), age and number of children entered as continuous variables. a Model adjusted for factors in the table. # Bold and italic means significantly different from reference at p<0.05
Table 4. Adjusted regression coefficients and 95% confidence interval (CI) of W/H, W/A and H/A Z-scores and socio-demographic variables a
488 Obesity and malnutrition in immigrant African children in Australia
nourished but very quickly become overweight or obese. Such a trend highlights the need for screening, nutritional support and advice programs aimed at preventing increase of overweight/obesity in migrant children from nutri-tionally impaired backgrounds. However, although it seems clear that SSA children are likely to be at higher risks of undernutrition and overweight/obesity, empirical and contemporary evidence is required to inform policy change in Australia. Hence, there is an urgent need for more detailed interventions to manage wasting among newly arrived migrants and to reduce of obesity in established migrants, especially those who have been in Australia five years or longer. Current nutritional initiatives in Australia would benefit from increased awareness of the potential range of nutritional problems identified among this sample of migrants. Nutritionists working with child migrants should be espe-cially conscious of the coexistence of obesity and under-nutrition among migrants or refugees from SSA or com-parably nutritionally-impaired backgrounds. They should endeavour, within their current framework, toward pre-venting the negative effects of post-migration nutrition problems. Culturally appropriate obesity interventions are needed for migrant children. These must be informed by research that explores the determinants of the lifestyle changes that drive the rapid development of obesity observed in migrant children in the current study. Acknowledgements The authors acknowledge a grant assistance provided by the Ian Potter Foundation and a financial assistance in the early stage of data collection by Dr. Cate Burns, assistance without which this study would not have been possible. We would like to thank the following: Anastasia Mwangi, Amina Hussein, Elisabeth Ngari, Munira Muhamed, Nabiha Muhamed, and Wemi Oyekanni for their help with data collection, the African Review Panel for mobilizing the SSA migrant population and the overall SSA community living in Victoria for endorsing the study and generously taking part in it. References 1. WHO/UNHCR/International Federation of Red Cross and
Red Crescent Societies/World Food Program. The management of nutrition in major emergencies; WHO: Geneva, 2000.
2. UN ACC/SCN 4th report on the world nutrition situation: Nutrition throughout the life cycle; ACC/SCN in collaboration with the International Food Policy Research Institute: Geneva, 2000.
3. WHO Global Database on Child Growth and Malnutrition: Forecast of Trends; WHO: Geneva, 2000.
4. UN ACC/SCN Third report on the world nutrition situation; ACC/SCN: Geneva, 1997.
5. Renzaho AMN, Burns C, Reidpath D. Measuring malnutrition in the under-fives: Pitfalls in practice; No 21 ed.; Mots Pluriels: www.arts.uwa.edu.au/ MotsPluriels/ MP2102rbr.html, 2002.
6. Renzaho AMN. Human right to food security in refugee settings: rhetoric versus reality. Australian J Human Right 2002; 8: 43-55.
7. Manoncourt S, Doppler B, Enten F, Nur Ae, Mohamed Ao, Vial P, Moren A. Public health consequences of the civil war in Somalia, April. Lancet 1992; 340: 176-177. 8. UN ACC/SCN Report on the nutrition situation of refugees
and displaced population; ACC/SCN: Geneva, 1997.
9. DIMIA Customised Matrix Table CS202 1996 Census population and housing; Australian Bureau of Statistics: Melbourne, 2001.
10. Martorell R, Khan LK, Hughes ML, Grummer-Straw LM. Overweight and obesity in preschool children from developing countries. Int J Obesity 2000; 24: 959-967.
11. de Onis M, Blossner M. Prevalence and trends of overweight among preschool children in developing countries. Am J Clin Nutr 2000; 72: 1032-1039.
12. de Onis M, Monteiro C, Akre J, Clugston G. The worldwide magnitude of protein-energy malnutrition: an overview from the WHO Global Database on Child Growth; www.who.int/whosis/cgrowth/bulletin.htm, 2002.
13. Southern Africa Development Community Regional Emergency Food Security Assessment Report; SADC: Food, Agriculture and Natural Resources Vulnerability Assessment Committee: Harare, 2002.
14. The Sphere Project The Humanitarian Charter and Minimum Standards in Disaster Response: Geneva, 2004.
15. Yip R, Scanion K, Trowbridge F. Improving growth status of Asian refugee children in the United states. JAMA 1992, 267, 937-940.
16. Chumacher LB, Pawson G, Kretchmer N. Growth of immigrant children in the newcomer schools of San Francisco. Pediatrics 1987; 80: 861-868.
17. Appuccio F. Ethnicity and cardiovascular risk: variations in people of African ancestry and south Asian origin. J Human Hypertension 1997; 11: 571-576.
18. Fernández J, Shriver M, Beasley M, Rafla-Demetrious N, Parra E, Albu J, Nicklas B, Ryan A, McKeigue P, Hoggart C, Weinsier R, Allison D. Association of African genetic admiture with resting metabolic rate and obesity amon women. Obsity Research 2003; 11: 904-910.
19. Sharma S, Cade J, Riste L, Cruickshank K. Nutrient intake trends among African-Caribbeans in Britain: a migrant population and its second generation. Public Health Nutrition 1999; 2: 469-476.
20. Tomisaka K, Lako J, Maruyama C, Anh NTL, Lien DTK, Khoi HH, Chuyen NV. Dietary patterns and risk factors for type 2 diabetes mellitus in Fijian, Japanese and Vietnamese populations. Asia Pac J Clin Nutr 2002; 11: 8-12.
21. Rissel C, Russell C. Heart disease risk factors in the Vietnamese community of Southern Sydney. Australian J Public Health 1993; 17: 71-73.
22. Popkin BM, Udry JR. Adolescent obesity increases significantly in second and third generation U.S. immigrants: the National Longitudinal Study of Adolescent Health. J Nutr 1998; 128: 701-706.
23. Brussaard J, van Erp-Baart M, Brants H, Hulshof K, Löwik M. Nutrition and healath among migrants in the Netherlands. Public Health Nutr 2001; 4: 659-664.
24. Lindström M, Sundquist J. Immigration and leisure-time physical inactivity: a population-based study. Ethnicity and Health 2001; 6: 77-85.
25. Landman J, Cruickshank JK. A review of ethnicity, health and nutrition-related diseases in relation to migration in the United Kingdom. Public Health Nutrition 2001; 4: 647-657.
26. Brown J. Cultural perspectives on the etiology and treatment of obesity. Obesity: Theory and therapy. 2nd ed. Raven Press, Ltd.: New York, 1993; 179-193.
27. Renzaho AMN. Fat, rich and beautiful: changing socio-cultural paradigms associated with obesity risk, nutritional status and refugee children from sub-Saharan Africa. Health and Place 2004; 10: 115-113.

AMN Renzaho, C Gibbons, B Swinburn, D Jolley and C Burns 489
28. Kaufman JS, Durazo-Arvizu RA, Rotimi CN, McGee DL, Cooper RS. Obesity and hypertension prevalence in population of African origin. Epidemiology 1996; 7: 398-405.
29. King H, Revers M, Zimmet P, Dowse G. WHO Adhoc Reporting Group-Global estimates for prevalence of diabetes mellitus and impaired glucose tolerance in adults. Diabetes Care 1993; 16: 157-177.
30. Porter G. Living in a walking world: rural mobility and social equity in sub-Saharan Africa. World development 2002; 30: 285-300.
31. Lean M, Han T, Bush H, Anderson A, Bradby H, Williams R. Ethnic differences in anthropometric and lifestyle measures related to coronary heart disease risk between South Asian, Italian and general-population British women living in the west of Scotland. Int J Obesity 2001; 25: 1800-1805.
32. Gurin P, Diiriye R, Corrigan C, Guerin B. Physical activity programs for refugee Somali women: working out in a new country. Women and Health 2003; 38: 83-99.
33. Gil A, Vioque J, Torija E. Usual diet in Bubis, a rural immigrant population of African origin in Madrid. J Hum Nutr Diet 2005; 18: 25-32.
34. Cooper RS, Rotimi CN, Kaufman JS, Owoaje EE, Fraser H, Forrester T, Wilks R, Riste L, Cruickshank K. Prevalence of NIDDM among populations of the African Diaspora. Diabetes Care 1997; 20: 343-348. 35. Cooper RS, Rotimi CN, Ataman S, McGee DL, Osotimehin B, Kadiri S, Muna W, Kingue S, Fraser H, Forrester T, Bennett F, Wilks R. The prevalence of hypertension in seven population of West African origin. Am J Pub Health 1997, 87, 160-168. 36. United Nations World Population Prospects 1950-2050 (the
1998 revision). Fourth Report on the World Nutrition Situation; ACC/SCN in collaboration with IFPRI: Geneva, 1998.
37. Finlay H, Fitzpatrick M, Fletcher M, Ray N. East Africa. 5th ed. Lonely Planet Publications: Melbourne, 2000.
38. Wongibe E. Land Reform and Poverty Eradication in Africa: Towards a New Agricultural Paradigm. In D+C Development and Cooperation: Frankfurt, 2002; 19-20.
39. Hawe P, Degeling D, Hall J. Evaluating health promotion: a health worker's guide. MacLennan and Pretty: Sydney, 1990.
40. Cole TJ, Bellizzi MC, Flegal KM, Dietz WH. Establishing a standard definition for child overweight and obesity worldwide: international survey, BMJ 2000; 320: 1240-1243.
41. National Centre for Health Statistics CDC Growth Charts; http://www.cdc.gov/nchs/about/major/nhanes/growthcharts/zscore/zscore.htm., 2000. (Accessed 12/03/2002)
42. Jimenez-Cruz A, Bacardi-Gascon M, Spindler A. Obesity and hunger among Mexican-Indian migrant children to the US-Mexico border. Int J Obes Relat Disord 2003; 27: 740-747.
43. Sanjur D, Immink MD, Colon M, Bentz L, Burgos M, Alicea-Santana S. Trends and differentials in dietary patterns and nutrient intake among migrant Puerto Rican families. Arch Latinoam Nutr 1986; 36: 625-641.
44. Flores G, Fuentes-Afflick E, Barbot O, Carter-Pokras O, Claudio L, Lara M, McLaurin JA, Pachter L, Ramos-Gomez FJ, Mendoza F, Valdez RB, Villarruel AM, Zambrana RE, Greenberg R, Weitzman M. The health of Latino children: urgent priorities, unanswered questions, and a research agenda. JAMA 2002; 290: 756.
45. Mamabolo RL, Alberts M, Steyn NP, Delemarre-van de Waal HA, Levitt NS. Prevalence and determinants of stunting and overweight in 3-year-old black South African children residing in the Central Region of Limpopo Province, South Africa. Public Health Nutr 2005; 8: 501-508.
46. Australian Bureau of Statistics Nutrient intakes and physical measurements, Australia 1995. ABS Catalogue No. 4805.0; ABS: Canberra, 1998.
47. Armstrong J, Dorosty AR, Reilly JJ, Emmett PM. Child Health Information Team Coexistence of social inequalities in undernutrition and obesity in preschool children: population based cross sectional study. Archives of Disease in Childhood 2003; 88: 671-675.
48. Stunkard AJ, Sorensen TI. Obesity and Socioeconomic Status -- A Complex Relation. The New Engl J Med 1993; 329: 1036-1037.
49. Gortmaker SL, Must A, Perrin JM, Sobol AM, Dietz WH. Social and economic consequences of overweight in adolescence and young adulthood. The New Engl J Med 1993; 329: 1008-1012.
50. Ball K, Crawford D. Socioeconomic status and weight change in adults: a review. Soc Sci Med 2005; 60: 1987-2010.
51. Jonnalagada JS, Earnest SG, Baxter DH, Cody MN, Mullis RM. Dietary intake, socio-economic status and cardio-vascular disease risk in African-American women. Nutr Res 2000; 20: 491-503.
52. Gordon-Larsen P, Adair LS, Popkin B M. The relationship of ethnicity, socioeconomic factors, and overweight in US adolescents. Obes Res 2003; 11: 121-129.
53. Saleh A, Amanatidis S, Samman S. The effect of migration on dietary intake, type 2 diabetes and obesity: the Ghanaian Health and Nutrition Analysis in Sydney, Australia (GHANAISA). Ecology Food Nutr 2002; 41: 255-270.
54. Khan L, Sobal J, Martorell R. Acculturation, socio-economic status, and obesity in Mexican American, Cuban Americans and Puerto ricans. Int J Obesity 1997; 21: 91-96.
55. Kimm S, Obarzanek E, Barton BA, Aston CE, Similo SL, Morrison JA, Sabry ZI, Schreiber GB, McMahon RP. Race, socioeconomic status, and obesity in 9- to 10-year-old girls: the NHLBI Growth and Health Study. Ann Epidemiol 1996; 6: 266-275.
56. Lauderdale DS, Rathouz PJ. Body mass index in a US national sample of Asian Americans: effects of nativity, years since immigration and socio-economic status. Int J Obesity 2000; 24: 1188-1194.
57. Sobal J, Stunkard AJ. Socio-economic status and obesity: a review of the literature. Psychol Bull 1989; 105: 260-275.
58. Stunkard AJ. Socio-economic status and obesity. Ciba Found Symp 1996; 201: 174-187.
59. Faber M, Kruger HS. Dietary intake, perceptions regarding body weight, and attitudes toward weight control of normal weight, overweight, and obese Black females in a rural village in South Africa. Ethn Dis 2005; 15: 238-245.
60. Kruger HS, Puoane T, Senekal M, van der Merwe MT. Obesity in South Africa: challenges for government and health professionals. Pub Health Nutr 2005; 8: 491-500.
61. Barer-Stein T. You eat what you are: a study of ethnic food traditions. McClelland and Stewart Ltd, Toronto, 1981.
62. Agbessi Dos Santos H, Damon M. Manuel de Nutrition Africaine. Tome 1.; Agence de Cooperation Culturelle et Technique (ACCT), IPD and Edition Karthala: Condé-sur-Noireau, 1987; 107-115.

490 Obesity and malnutrition in immigrant African children in Australia
63. Hochschild A. King Leopold's ghost: a story of greed, terror, and heroism in colonial Africa; Houghton Mifflin Company: New York, 1998.
64. Wrong M. In the footsteps of Mr. Kurtz: Living on the brink of disaster in Mobutu's Congo; Harper Collins Publishers: New York, 2001.
65. Reader J. Africa: a bibliography of the continent; Hamish Hamilton: London, 1997.
66. Taylor D. Africa: the portrait of power; Robert Hale: London, 1967.
67. Kumanyika S. Obesity in minority populations: an epidemiologic assessment. Obesity Research 1994, 2, 166-182.
68. Sobal J, Rauschenbach B, Frongillo E. Marital status, fatness and obesity. Soc Sci Med 1992, 35.
69. Hazuda HP, Stern MP, Haffner SM. Acculturation and assimilation among Mexican Americans: scales and population beased data. Soc Sci Q 1988; 69: 687-706.
70. Cuellar I, Harris L, Jasso R. An acculturation scale for Mexican American normal to clinical populations. Hispanic J Behavioural Sci 1980; 2: 199-217.
71. Liberatos P, Link B, Kelsey JL. The measurement of social class in empidemiology. Epidemiol Rev 1988; 10: 87-121.
72. Arteaga P, Dos Santos J, Dutr de Oliviera J. Obesity among schoolchildren of different socio-economic levels in developing country. Int J Obes 1982; 6: 291-297.
73. Magarey AM, Daniels LA, Boulton TJ. Prevalence of overweight and obesity in Australian children and adolescents: reassessment of 1985 and 1995 data against new standard international definitions. MJA 2001; 174: 561-564.
74. Goodman S, Lewis P, Dixon A, Travers C. Childhood obesity: of growing urgency. Med J Aust 2002; 176: 400-401.
Original Article
Obesity and undernutrition in sub-Saharan African immigrant and refugee children in Victoria, Australia
André MN Renzaho MPH, PhD, Carl Gibbons MSc, Boyd Swinburn MB, ChB, MD, FRACP
Damien Jolley MSc and Cate Burns PhD School of Exercise & Nutrition Sciences, Deakin University, 221 Burwood Highway, Burwood 3125 Victoria, Australia
澳洲維多利亞來自撒哈拉沙漠地區澳洲維多利亞來自撒哈拉沙漠地區澳洲維多利亞來自撒哈拉沙漠地區澳洲維多利亞來自撒哈拉沙漠地區之之之之非洲移民與難民非洲移民與難民非洲移民與難民非洲移民與難民兒童的肥胖與營養不良狀況兒童的肥胖與營養不良狀況兒童的肥胖與營養不良狀況兒童的肥胖與營養不良狀況 此研究評估337名年齡3-12 歲由 撒哈拉 沙漠之 非洲移 民(SSA) 到澳 洲的 兒
童體位狀況。受檢兒童採用雪球選樣方法,並以年齡、性別及原生地區分層。這 些兒童的過重及肥胖的盛行率分別為18.4% (95% CI=14-23%)及8.6% (95%
CI=6-12%)。營養不良的各種指標盛行率:耗損4.3% (95% CI=1.6%-9.1%)、
過輕 1.2% (95% CI=0.3%-3.0%)及發育遲緩0.3% (95% CI=0.0%-1.6%)。 過重/
肥的高盛行率與家庭收入較低、兄弟姐妹人數較少、出生體重較低、西非背景及單親家庭 (在控制人口學變項及社經因素) 有關。 體 重過輕及 耗損 的高
盛行率分別與家庭收入較低及居住在澳洲時間較短有關。而兒童的年齡、性別、父母親教育程度及職業對肥胖及營養不良則沒有影響。總而言之,肥胖與過重在SSA移民兒童中有極高的盛行率,而營養不良,尤其是耗損,在這個目標族群也並非不普遍。
關鍵字:肥胖、營養不良、撒哈拉沙漠非洲地區、兒童、移民、難民。

Asia Pac J Clin Nutr 2006;15 (14): 491- 495 491
Original Article Risk factors for malnutrition among rural Nigerian children Senbanjo Idowu Odunayo MBChB, FWACP and Adeodu Oluwagbemiga Oyewole MBBS, FWACP
Department of Paediatrics, Obafemi Awolowo University Teaching Hospitals Complex, Ile-Ife, Osun State, Nigeria
Protein Energy Malnutrition (PEM) remains a major public health problem in the developing world. The aim of this study was to determine the current nutritional status and the influence of feeding practices and family characteristics on the nutritional status of under-five rural Nigerian children. It was conducted using a cross sectional, community based survey design. From 344 households, 420 children were studied. Using the modified Wellcome Classification, the prevalence of PEM was 20.5 percent whereas the prevalence of underweight, wasting and stunting using the World Health Organization/ National Centre for Health Statistics (WHO/ NCHS) standards were 23.1 percent, 9 percent and 26.7 percent respectively. Young age was significantly associated with a higher prevalence of underweight (P = 0.004). Overcrowding, low maternal income and the use of infant formula feeds in children who have attained the age of 6 months and above were associated with a higher prevalence of wasting (P = 0.029, P = 0.031 and P = 0.005 respectively). Improved living standard of families, empowerment of mothers with the aim of augmenting family income and parental education on appropriate feeding practices may help in reducing the incidence of under-five malnutrition in communities. The low prevalence rate of malnutrition was probably due to activities of the NGO in this community. This method of intervention is similarly achievable in any other community.
Key Words: malnutrition, risk factors, children, rural, Nigeria, Africa Introduction The World Health Organization estimates that approxi-mately 150 million children younger than 5 years in deve-loping countries are underweight and an additional 200 million children are stunted.1 Recent data in Nigeria showed that 34 percent, 16 percent and 27 percent of the under-fives in rural areas are reportedly underweight, wasted and stunted respectively while 22 percent, 14 percent and 25 percent of those in urban areas are also reportedly underweight, wasted and stunted respectively.2 Malnutrition remains a major public health problem and it appears to be getting worse in selected settings.3 Poverty and ignorance play important roles at the background in the causation of malnutrition especially in the developing world. Poor feeding practices have been identified in the developing world to arise from ignorance about adequate breastfeeding and appropriate weaning practices.4 All these are closely related to the socioeconomic status and sizes of families. These factors are most expectedly prominent in the rural, under-developed settings where finances and knowledge about food choices are alarmingly poor. There-fore, this study was carried out to determine the current prevalence of malnutrition and the relationships between childhood feeding practices and family characteristics existing in a rural Nigerian community. This is expected to serve as an index of the well being of rural children and to provide data that should assist in the formulation of the
necessary preventive and treatment strategies, particularly in this community. Subjects and Methods Location The study was carried out in Ifewara, a rural community located in Atakunmosa West Local Government Area, of Osun State, south-western Nigeria. Ifewara with the esti-mated population of 3, 927 and household count of 1,849 is located 18 kilometers from Osu, the headquarters of the local government area, 36 kilometers from Osogbo, the capital of Osun State and 200 kilomaters from Lagos, a former federal capital city. The people of this community are basically mostly farmers, traders and craftsmen. A Non Governmental Organization (NGO) provides free health care for the under-fives through a privately owned clinic. The multistage cluster and random sampling techniques were used to select households and subjects. All under-five children in the entire households of the selected houses were studied. In each household, information was obtained on demographic, socio-economic and environmental cha-racteristics. The anthropometric parameters of every child
Correspondence address: Senbanjo Idowu Odunayo P.O Box 10894, Dugbe, Ibadan, Oyo State, Nigeria. E-mail: [email protected] Accepted 26 May 2006

492 S Idowu Odunayo and A Oluwagbemiga
were recorded and each child was clinically examined for gross evidence of malnutrition. Standardization checks on the tools for anthropometric measurements were done periodically. Children with evidences of chronic diseases were excluded. Malnutrition was diagnosed clinically using the mo-dified Wellcome System of Classification.5 The National Centre for Health Statistics/World Health Organization (NCHS/WHO) guidelines and cut off points6 were also used to determine the degree of stunting, underweight and wasting. Underweight, wasting and stunting were diag-osed when the Weight-for-Age (WA), Weight-for-Height (WH) and Height-for-Age (HA) were equal to minus two Standard Deviation (-2 SD) or below the mean of this reference international standards respectively.6 Data ana-ysis was done using the Epi info 2002 and the SPSS for windows version 11 softwares.7,8 Personal and family data were separately analyzed to avoid data duplication. Pro-ortions and rates were compared using the Pearson Chi squared (χ2) test. P values less than 0.05 were accepted as statistically significant. Results Age and sex distribution A total of 420 children were studied from 344 households consisting of 348 mothers and 344 fathers. There were 218 (51.9 %) females and 202 (48.1 %) males giving a female: male ratio of 1.1: 1. The prevalence of under-eight, wasting and stunting was similar in both sexes (P > 0.1 in each case).
Prevalence and types of PEM Using the modified Wellcome classification, 334 (79.5%) children were normal while 86 (20.5%) children were malnourished. While there was no cases of kwashiorkor, underweight kwashiorkor, marasmic kwashiorkor and overweight, 82 (19.5%) of these children were under-eight while 4 (1%) had marasmus. Table I shows the nu-tritional status according to the World Health Organiza-tion/National Centre for Health Statistics (WHO/NCHS)
standard. Relationship between age and nutritional status The influence of age on the WAZ, HAZ and WHZ scores were as shown in Tables II. The prevalence of under-weight was highest in the second year of life (35.2 %) and this was statistically significantly (P = 0.004). Relationship between feeding practices and nutritional status Four hundred and nineteen (99.8%) children were commenced on breast milk immediately after birth and 131 (31.2%) of these were exclusively breastfed for six months. The duration of breastfeeding varied between 3 and 36 months with the mean of 20.2+5.5 months. Chil-dren not exclusively breastfed had higher but non-significant prevalence of underweight, wasting and stun-ting compared to those who were exclusively breast-fed (P = 0.416, 0,157 and 0.645 respectively). Also, there was no statistically significant relationship between the total duration of breastfeeding and the prevalence of underweight (P = 0.965), wasting (P = 0.553) and stun-ting (P = 0.856). However, children who were breastfed for 12 to 24 months had consistently lower prevalence rates of malnutrition than those breastfed for shorter period or longer periods. Of the 158 (37.6%) children who were given infant formula feeds, 149 (94.3%) children were introduced to infant formula feeds before the age of 6 months. The pre-valence of underweight and stunting were non- significantly higher in those given infant formula feeds than in those that were not while wasting was slightly more prevalent in those not given formula feeds than the comparison group but without significance. Table III shows that children who were commenced on formula feeds before the age of six months had consistently lower prevalence rates of malnutrition compared to those who started after six months. However, the difference was only statistically significant with respect to wasting (P = 0.005).
Nutritional status WAZ HAZ WHZ Normal (>- 2.00 SD) 323 (76.9) 308 (73.3) 382 (91.0) Malnourished (- 2.00 to - 2.99 SD) 65 (15.5) 78 (18.6) 29 (6.9) Severely Malnourished (-3.00 SD and above) 32 (7.6) 34 (8.1) 9 (2.1) Total 420 (100.0) 420 (100.0) 420 (100.0)
Figures in parenthesis are percentages of the total in the respective column.
Table 1. Nutritional status of the study population using the Weight-for-Age Z-score (WAZ), Height-for-age Z- scores (HAZ) and Weight-for-Height Z-score
Age group (months) Z – Score (< - 2) 12 – 23 24 – 35 36 – 47 48 – 59 P value (n = 105) (n = 94) (n = 120) (n = 101) Weight for Age 37 (35.2) 22 (23.4) 19 (15.8) 19 (18.8) 0.004 Weight for Height 14 (13.3) 7 (7.4) 7 (5.8) 10 (9.9) 0.237 Height for Age 31 (29.5) 29 (30.9) 29 (24.2) 23 (22.8) 0.485 Figures in parenthesis are percentages of the total in the respective column.
Table 2. Nutritional status in relation to the age of children

Risk factors for malnutrition among rural African children 493
The proportion of children who were still breast feeding between 12 to 24 months of age (80.8%) was higher than the national figure of 35%6 as well as 56.9% recorded in rural South Africa.14 However, the duration of breastfeeding in this study did not significantly affect nutritional status of these children contrary to the findings of other workers.9 This could be because the resultant Relationship between family setting and nutritional status Two hundred and thirty-one (67.2%) families were mono-gamous. There were similarities in the prevalence of underweight (P = 0.321), wasting (P= 0.479) and stunting (P = 0.83) among children in both monogamous and polygamous homes (n 113). The numbers of children from the mothers ranged between 1 and 11 with the mean of 3.09 + 1.58 while the numbers of children in the families ranged between 1 and 25 with 4.41 + 3.44 as the mean. Two hundred and eighty-two (81 %) mothers had less than 4 children each and children of mothers who had less than 4 issues had a slightly lower prevalence of under-weight and wasting compared to those who had more than 4 children (23.8% vs. 24.2%, P = 0.934 and 8.9 %vs. 12.1%, P= 0.416 respectively). The prevalence of stunting was higher among 77 (27.3%) children of mothers with less than 4 issues compared with 16 (24.2%) of those from mothers with more than 4 issues but without significance (P = 0.613). Stunting, underweight and wasting were present among 30 (30.9%), 24 (24.7%) and 8 (8.2%) children in the first birth order respectively. These forms of malnutrition were also present among 24.6%, 20.7% and 7.8% respectively of the 222 children in the second to fourth birth orders. These were also present among 22.7%, 27.5% and 13.2% respectively of the 136 children in the fifth birth order and above. Two hundred and eighty-eight mothers had more than one child each. The mean birth interval between the chil-dren of these mothers was 38.4 + 16.2 months. When children of mothers with birth space of more than 3 years were compared with those of birth space less than 3 years, the prevalence of underweight (21.8% Vs 27.1%; P = 0.299), wasting (7.5% Vs 9.7%; P = 0.517) and stunting (26.3% Vs 30.3%; P = 0.453) were lower among the former but without significance. Two hundred and fifty-three (73.5%) children lived in rooms with less than four people while 91 (26.5%) lived in rooms with more than 4 people. There was a signi-ficantly higher prevalence of wasting among children with more than four occupants per room (χ
2 = 4.79, P = 0.029). The prevalence rates of underweight and stunting were comparable in the two groups ((χ
2 = 0.76, p = 0.385 and χ2 = 0.029, P = 0.868 respectively). Table IV shows
the relationship between the income of the parents and nutritional status. While the earning power of the father bear no significant relationship to child nutritional status that of the mother was significantly associated with wasting ((χ2 = 4.63, P = 0.031). Discussion This study identified prevalence of PEM in Ifewara using the modified Wellcome Classification as 20.5%. This is lower than the prevalence of 37.8% and 41.6% docu-mented for an urban ghetto area of Lagos and rural area in Benue State of Nigeria respectively.9,10 It is also lower than the prevalence of 48% for urban children in Ethio-pia11. The finding of 23.1% of underweight and 9% of wasting compares well with the national figure of 27% underweight and 12 % wasting.6 However, the prevalence of stunting (26.7%) in this study is much lower than the national figure of 46%.6 Protein Energy Malnutrition is expected to be more prevalent in rural areas like Ifewara. It therefore appears paradoxical that the results of this study compare favourably with and are in some respects better than those of other composite Nigerian figures. In Ifewara, the availability of social amenities and access to basic medical care provided by a comprehensive health centre and a Non Governmental Organization may ex-plain the low prevalence of PEM in this area. The relationship between the age and the prevalence of malnutrition is shown by the observation in this study that, the children in the second year of life are most prone to malnutrition. This is probably due to inadequate and inappropriate complimentary feeding. The period between the ages of 6 and 18 months of life is critical especially with respective to childhood feeding. This is the time when complimentary feeding is usually introduced. If the caloric content of such foods is inadequate or the pre-paration and storage of food in the home are not hygienic, malnutrition will result. Breastfeeding is widely practiced by the mothers in the community studied. The rate of exclusive breastfeeding over the first six months of life observed in this study (31.2%) was higher than the 9% previously reported from an urban area of Lagos,9 than the national figure of 17% 6
as well as the rate reported from Chile.12 This study did not reveal any definite relationship between exclusive breastfeeding and nutritional status. This could be ex-plained by the fact that a lot of the children who were not exclusively breastfed actually had breast milk as their predominant diet in the first 6 months of life. This may not be too different from the findings in a comparative study of the growth performance of exclusively breast-fed babies and those given token amount of water but still having breast milk as their predominant diet. In the latter, it was observed that the anthropometric parameters did
Age of child (months) Z – Score (< - 2) Less than 6 months More than 6 months P value (n = 149) (n = 9) Weight for Age 37 (24.8) 4 (44.4) 0.192 Weight for Height 10 (6.7) 3 (33.3) 0.005 Height for Age 43 (28.9) 3 (33.3) 0.774
Figures in parenthesis are percentages of the total in the respective column.
Table 3. Nutritional status and age of child at onset of introduction of infant formula feeds
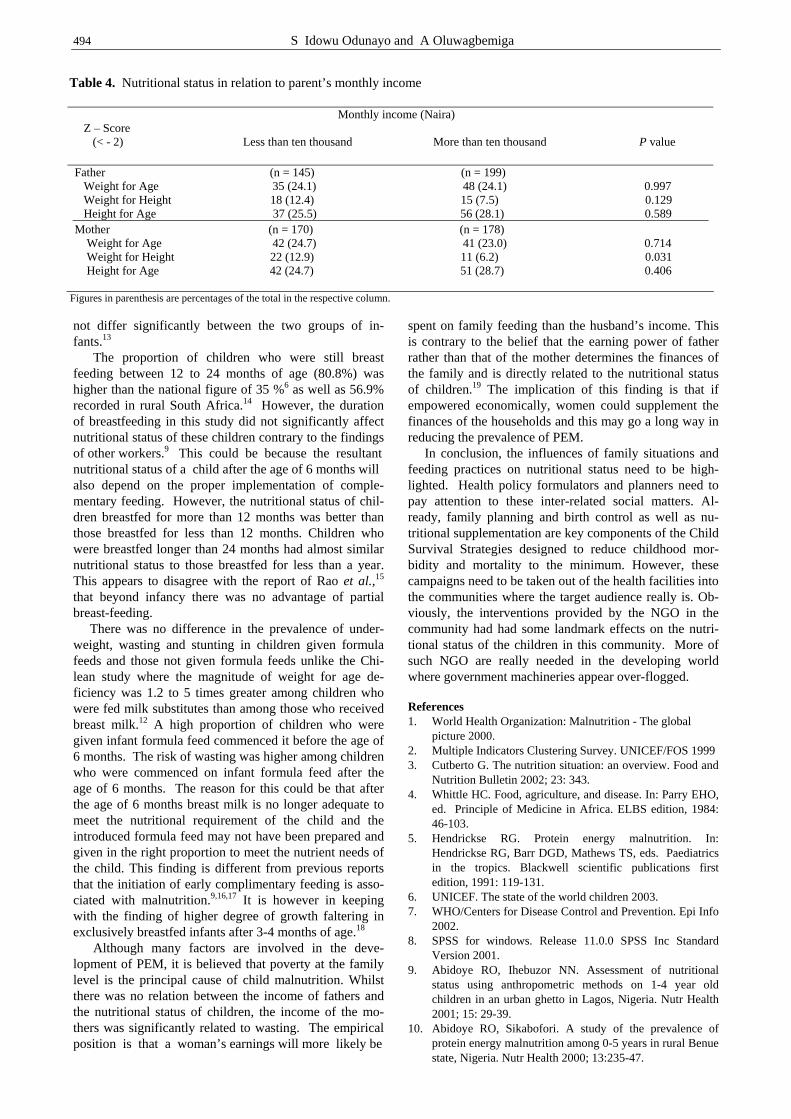
494 S Idowu Odunayo and A Oluwagbemiga
not differ significantly between the two groups of in-fants.13 The proportion of children who were still breast feeding between 12 to 24 months of age (80.8%) was higher than the national figure of 35 %6 as well as 56.9% recorded in rural South Africa.14 However, the duration of breastfeeding in this study did not significantly affect nutritional status of these children contrary to the findings of other workers.9 This could be because the resultant nutritional status of a child after the age of 6 months will also depend on the proper implementation of comple-mentary feeding. However, the nutritional status of chil-dren breastfed for more than 12 months was better than those breastfed for less than 12 months. Children who were breastfed longer than 24 months had almost similar nutritional status to those breastfed for less than a year. This appears to disagree with the report of Rao et al.,15 that beyond infancy there was no advantage of partial breast-feeding. There was no difference in the prevalence of under-weight, wasting and stunting in children given formula feeds and those not given formula feeds unlike the Chi-lean study where the magnitude of weight for age de-ficiency was 1.2 to 5 times greater among children who were fed milk substitutes than among those who received breast milk.12 A high proportion of children who were given infant formula feed commenced it before the age of 6 months. The risk of wasting was higher among children who were commenced on infant formula feed after the age of 6 months. The reason for this could be that after the age of 6 months breast milk is no longer adequate to meet the nutritional requirement of the child and the introduced formula feed may not have been prepared and given in the right proportion to meet the nutrient needs of the child. This finding is different from previous reports that the initiation of early complimentary feeding is asso-ciated with malnutrition.9,16,17 It is however in keeping with the finding of higher degree of growth faltering in exclusively breastfed infants after 3-4 months of age.18
Although many factors are involved in the deve-lopment of PEM, it is believed that poverty at the family level is the principal cause of child malnutrition. Whilst there was no relation between the income of fathers and the nutritional status of children, the income of the mo-thers was significantly related to wasting. The empirical position is that a woman’s earnings will more likely be
spent on family feeding than the husband’s income. This is contrary to the belief that the earning power of father rather than that of the mother determines the finances of the family and is directly related to the nutritional status of children.19 The implication of this finding is that if empowered economically, women could supplement the finances of the households and this may go a long way in reducing the prevalence of PEM. In conclusion, the influences of family situations and feeding practices on nutritional status need to be high-lighted. Health policy formulators and planners need to pay attention to these inter-related social matters. Al-ready, family planning and birth control as well as nu-tritional supplementation are key components of the Child Survival Strategies designed to reduce childhood mor-bidity and mortality to the minimum. However, these campaigns need to be taken out of the health facilities into the communities where the target audience really is. Ob-viously, the interventions provided by the NGO in the community had had some landmark effects on the nutri-tional status of the children in this community. More of such NGO are really needed in the developing world where government machineries appear over-flogged. References 1. World Health Organization: Malnutrition - The global
picture 2000. 2. Multiple Indicators Clustering Survey. UNICEF/FOS 1999 3. Cutberto G. The nutrition situation: an overview. Food and
Nutrition Bulletin 2002; 23: 343. 4. Whittle HC. Food, agriculture, and disease. In: Parry EHO,
ed. Principle of Medicine in Africa. ELBS edition, 1984: 46-103.
5. Hendrickse RG. Protein energy malnutrition. In: Hendrickse RG, Barr DGD, Mathews TS, eds. Paediatrics in the tropics. Blackwell scientific publications first edition, 1991: 119-131.
6. UNICEF. The state of the world children 2003. 7. WHO/Centers for Disease Control and Prevention. Epi Info
2002. 8. SPSS for windows. Release 11.0.0 SPSS Inc Standard
Version 2001. 9. Abidoye RO, Ihebuzor NN. Assessment of nutritional
status using anthropometric methods on 1-4 year old children in an urban ghetto in Lagos, Nigeria. Nutr Health 2001; 15: 29-39.
10. Abidoye RO, Sikabofori. A study of the prevalence of protein energy malnutrition among 0-5 years in rural Benue state, Nigeria. Nutr Health 2000; 13:235-47.
Monthly income (Naira) Z – Score (< - 2) Less than ten thousand More than ten thousand P value
Father (n = 145) (n = 199) Weight for Age 35 (24.1) 48 (24.1) 0.997 Weight for Height 18 (12.4) 15 (7.5) 0.129 Height for Age 37 (25.5) 56 (28.1) 0.589 Mother (n = 170) (n = 178) Weight for Age 42 (24.7) 41 (23.0) 0.714 Weight for Height 22 (12.9) 11 (6.2) 0.031 Height for Age 42 (24.7) 51 (28.7) 0.406
Figures in parenthesis are percentages of the total in the respective column.
Table 4. Nutritional status in relation to parent’s monthly income

Risk factors for malnutrition among rural African children 495
11. Getaneh T, Assefa A, Tadesse Z. Protein energy mal-nutrition in urban children: prevalence and determinants. Ethiop Med J 1998; 36: 153-66.
12. Castillo C, Atalah E, Riumallo J, Castro R. Breastfeeding and the nutritional status of Chilean children. Bol Oficina Sanit Panam 1995; 119: 494 – 502.
13. Ahmed H, Ekele BA, Oyeshola OA. Growth performance of healthy exclusively breast-fed and non-exclusively breast-fed infants in the first six months of life: A com-parative study. Nig J Paediatr 1998; 25: 42 – 48.
14. Faber M, Benade AJ. Nutritional status and dietary prac-tices of 4 – 24 month old children from a rural South African Community. Public Health Nutr. 1999; 2:179– 185.
15. Rao S, Kanade AN. Prolonged breast feeding and mal-nutrition among rural Indian children below 3 years of age. Eur J Clin Nutr. 1992; 46: 187 – 195.
16. Davies–Adetugbo AA, Adetugbo K. Effect of early compli-mentary feeding on nutritional status in term infants in rural Nigeria. Nutr Health 1997; 12: 25 – 31.
17. Haider R, Islam A, Kabir I, Habte D. Early complementary feeding is associated with low nutritional status of young infants recovering from diarrhea. J Trop Paediatr 1996; 42: 170 – 172.
18. Ogbu CN. Policy of exclusive breast-feeding for six months: A re-examination. Nig J Paediatr 2001; 28: 53-60.
19. Ighogboja SI. Some factors contributing to protein energy malnutrition in the middle belt of Nigeria. East Afr Med J 1992; 69: 566-71.
Original Article Risk factors for malnutrition among rural Nigerian children Senbanjo Idowu Odunayo MBChB, FWACP and Adeodu Oluwagbemiga Oyewole MBBS, FWACP
Department of Paediatrics, Obafemi Awolowo University Teaching Hospitals Complex, Ile-Ife, Osun State, Nigeria
奈及利亞鄉村兒童營養不良之危險因子奈及利亞鄉村兒童營養不良之危險因子奈及利亞鄉村兒童營養不良之危險因子奈及利亞鄉村兒童營養不良之危險因子
蛋白質熱量營養不良(PEM) 仍然是開發中國家的主要公共衛生問題。 本研究目
的為評估奈及利亞鄉村五歲以下兒童目前的營養狀況及哺餵狀況與家庭特性的影響。本研究為一個橫斷性社區調查設計,共有來自344個家戶的420名兒童被調查。使用修正過的Wellcome Classification 當作標準, PEM的盛行率為20.5%, 續
以世界衛生組織/衛生統計國際中心(WHO/NCHS)制定的標準,體重過輕、耗損及發育遲緩的盛行率分別為23.1%、9%及26.7%。年齡愈小有較高的體重過輕盛行率(P=0.004)。六個月及以上的兒童中,住處過度擁擠、母親收入低及使用嬰兒配方餵食小孩有較高的耗損盛行率(P值分別為0.029、0.031及0.005)。改善家庭居住標準、增強母親賺錢能力以提高家庭收入及對父母進行適當的餵食行為教育,可能有助於降低這些社區五歲以下兒童營養不良的發生。該社區營養不良盛行率較低,可能是由於非政府組織(NGO)的活動所致,這種介入方法在任何其他社區同樣可以做到。 關鍵字:營養不良、危險因子、小孩、鄉村、奈及利亞、非洲。

496 Asia Pac J Clin Nutr 2006;15 (4):496-501
Original Article
Low density lipoprotein subclasses in Asian and Caucasian adolescent boys Verena Raschke MSc
1, Ibrahim Elmadfa PhD1, Margaret A. Bermingham PhD
2, and Kate Steinbeck PhD
3
1 Institute of Nutritional Sciences, University of Vienna, Austria 2 School of Biomedical Sciences, Faculty of Health Sciences, University of Sydney, Australia 3 Endocrinology and Adolescent Medicine, Royal prince Alfred Hospital, Sydney, Australia
South Asian adults are known to have very high rates of Coronary heart disease (CHD) and insulin resistance and, even as adolescents, may show higher risk factors for CHD. The aim of this study was to investigate the prevalence of small, dense low density lipoprotein (sdLDL) subclasses in a cohort of adolescent boys. The specific objective was to investigate the relationship between measures of fatness, ethnicity and LDL diameter in this cohort. Preformed native (non-denaturing) polyacrylamide 3-13% gradient gels and a multipurpose vertical electrophoresis system were used for the separation of LDL sub-fractions in a single school year cohort of boys aged 15-16 years (n=135). Latex beads and thyroglobulin standards were used to construct a calibration curve in order to calculate LDL particle diameters by regression (Total Lab Software v1.11). ANOVA was used to compare LDL size among different ethnic groups (SPSS and Stat View). The study sample was comprised of 45.2% Caucasians, 41.5% East Asians and 13.3% from the Indian subcontinent (South Asians).There was a non-significant trend for South Asians to have a lower LDL diameter than either Caucasians or East Asian boys which was independent of % total body fat (%TBF) and body mass index (BMI). This is the first adolescent cohort to examine sdLDL which included Caucasians, East and South Asians. It appears that the higher risk profile for CHD and diabetes noted in South Asian adults may be evident even during adolescence.
Key Words: adolescence, coronary heart disease, arteriosclerosis, small dense low density lipoproteins, LDL size, lipoprotein subtractions, non-denaturing gradient gel electrophoresis, Caucasian, Asian, Australia. Introduction Low density lipoproteins (LDL) are composed of hetero-geneous particles differing in size, density and chemical composition. Two phenotypes, A (predominantly large buoyant particles) and B (predominantly small dense particles), have been characterized, and it has been demon-strated that the B phenotype (also called pattern B) may be a genetic marker for CHD.1 Compared to large buoyant LDL particles, small dense LDL particles are associated with a more atherogenic type of lipoprotein profile2, with increased plasma triglyceride, apolipoprotein (apo) B-100, and reduced levels of high density lipoprotein cholesterol and apo A-I.3 Even among children, racial and gender differences in lipids have been noted and may be attri-butable to environmental influences such as diet, exercise and obesity.4-6 The factors often associated with the de-creased LDL size are male gender, increased triglyceride concentrations, and decreased HDL cholesterol concen-trations.7 Levels of lipids and lipoproteins among children vary by sex, race/ethnicity, and are correlated with age, obesity, and other characteristics.8 However, most previous studies investigating the relationship between LDL particle size and CAD risk factors have been limited to adults, and little information is available in regard to adolescents.9
Based on studies in largely Caucasian American popu-lations, the prevalence of pattern B is 10-15% in males under 20 years of age.3 One recent study of children aged 13-16 years found a prevalence of small dense LDL of 54% among 80 obese youths.9 Another study which inve-stigated the relationship between insulin sensitivity, lipo-protein distribution, and LDL patterns in young adults found no participants with LDL phenotype pattern B.10 The aim of this study is to investigate the prevalence of LDL subclasses in a cohort of Australian adolescent boys from Caucasian, East Asian and South Asian background and to determine whether there are any differences by eth-nicity in LDL subclasses when measures of fatness are controlled for. Correspondence address: Mag. Verena Raschke Institute of Nutritional Sciences University of Vienna, Austria E mail: [email protected] Accepted 3 March 2006

V Raschke, I Elmadfa, MA Bermingham and K Steinbeck 497
Methods Subjects The LDL size determination was carried out on plasma collected from a single school year cohort of boys aged 15-16 years (n=135) who were recruited from a metro-politan boys high school for a cohort study, see Mehta S, Mahajan D, Steinbeck KS, Bermingham MA. Relation-ship between measures of fatness, lipids and ethnicity in a cohort of adolescent boys. Annals of Nutrition & Meta-bolism. 2002; 46:1.11 Clinical data Fasting blood samples had been analysed for glucose, insulin, total cholesterol, HDL cholesterol, triglyceride concentration, apolipoprotein A-I, apolipoprotein B-100 and low-density lipoprotein cholesterol. The anthro-pometric measurements of weight, height, waist and hip circumferences were used to calculate BMI (weight in kg/height in m2) and waist to hip ratio (WHR). Percent total body fat (%TBF) was estimated by bioelectric impe-dance analysis. Demographic and behavioural variables (age, country of origin, parent's medical history, eating habits, smoking, alcohol intake, and level of physical acti-vity including vigorous and non vigorous and sedentary life style i.e. watching TV and computer or video games) were assessed by questionnaire. The classification of ethnic background was made from information provided in the questionnaire. Boys whose families originated either from India, Bangladesh or Sri Lanka, were grouped together as "South Asians". Those from China, Taiwan, Korea and the other countries of Indochina were grouped as "East Asians". Boys whose families originated from Europe were classified as Caucasians. Biochemistry Pre-formed native (non-denaturing) polyacrylamide 3-13% gradient gels and a multipurpose vertical electro-phoresis system were used for the electrophoretic separa-tion of LDL subfractions on plasma stored at -80°C and never thawed until just before use. After a short pre-electrophoresis of the gel, thyroglobulin and latex bead standards were located on to the gel with the standards
applied at either side of the samples. Samples and stan-dards were mixed with BPB-sucrose solution and tracking dye respectively, before loading on to the gel. Electro-phoresis was performed for at total of 2670 volt hours at increasing voltage in a cabinet controlled at 4°C. In order to determine LDL size, on completion of electrophoresis, the gel was cut into separate sections for standards and specimens. The portion containing standards was then stained for protein with Coomassie Brilliant Blue G in perchloric acid and destained with acetic acid. The two parts of the gel were reassembled and scanned on a Total Lab Image scanner (Model Nr: Power Look III). The gel-images were scanned in 8-bit grayscale and analysed with the Total Lab Software v1.11 (Amersham Pharmacia Biotech AB, Sweden), which was used to determine the height of the peaks (in pixel). Latex beads and thyroglobulin standards were used to construct a calibration curve in order to calculate the LDL particle diameters by linear regression. The analysed gels were permanently preserved in sealed plastic bags containing bacteriostatic preservative. Pattern B was defined as a peak particle diameter (PPD) of ¾ 25.5 nm and pattern A as more than 25.5 nm. These values are used for adult data and may be inappropriate for children. A slightly higher cut off ¾ 26.0 nm for pattern B could be used. Statistical analysis All variables were first examined for normality. Variables with skewed distribution were log transformed before analysis, which achieved a normal distribution. Descrip-tive statistics (means, SD) were computed for all anthro-pometric, biochemical and behavioural variables. Variabi-lity between the groups was tested by Levenne's test. One-way-analysis of variance (ANOVA) was used to compare the difference in continuous variables between tertiles of LDL size (using tertiles as grouping variables). The Kruskal-Wallis-Procedure (Non-parametric test for K-independent samples) was used for non-normal distri-buted data. Furthermore, the Post-Hoc test (Scheffe) was used to examine whether there were any differences between the ethnic groups among the tertiles of LDL size concerning the test variables. The data was also analysed
Total group (n=135)
Caucasian (n=61)
East Asian (n=56)
South Asian (n=18)
P value
Total cholesterol (mmol/l) 4.0 ± 0.8 3.9 ± 0.7 4.1 ± 0.9 4.1 ± 0.6 0.387+
HDL-C (mmol/l) 1.3 ± 0.4 1.3 ± 0.4 1.4 ± 0.4 1.3 ± 0.3 0.286+
LDL-C (mmol/l) 2.3 ± 0.8 2.2 ± 0.7 2.3 ± 1.0 2.4 ± 0.6 0.636+
TC/HDL ratio 3.3 ± 1.0 3.3 ± 0.9 3.2 ± 1.1 3.4 ± 1.0 0.803+
Triglycerides (mmol/l) 0.9 ± 0.2 0.9 ± 0.3 0.9 ± 0.1 0.9 ± 0.2 0.835+
TG/HDL-C 0.7 ± 0.3 0.8 ± 0.4 0.7 ± 0.3 0.7 ± 0.3 0.500+
APO A-1 (mg/dl) 118.9 ± 34.2 114.9 ± 32.1 125.6 ± 35.7 111.4 ± 34.4 0.146+
Apo B (mg/dl) 77.3 ± 26.4 72.6 ± 24.4 82.5 ± 29.5 76.9 ± 20.4 0.128+
Apo A1/ B ratio 1.7 ± 0.6 1.7 ± 0.6 1.7 ± 0.7 1.5 ± 0.4 0.461+
Insulin (pmole/l) 71.6 ± 43.6 93.6 ± 85.5 69.3 ± 29.9 93.6 ± 85.5 0.491*
Insulin (log transformed) 4.1 ± 0.5 4.1 ± 0.5 4.2 ± 0.4 4.3 ± 0.6 0.234+ + One Way ANOVA; * Kruskal Wallis test
Table 1. Biochemical parameters of the cohort of adolescent boys. (Means ±SD)

498 Low density lipoproteins in Australian adolescent boys
by independent samples t-test using LDL-size as a grouping variable. Chi-squared test and Mann Whitney U test were used for non-continuous variables to compare the LDL-size between the 3 ethnic groups. Pearson's correlation analysis was performed to investigate the association between anthropometric, biochemical, beha-vioural variables and LDL-size. Risk was estimated by the calculation of odds ratios of categorical variables, and adjusted for confounding by logistic regression analysis. Two ethnic groups were used as categorical variables (group1: Caucasians and East Asians, group 2: South Asians). Caucasians and East Asians were combined for analysis as they had the same LDL size while South Asians tended to have a smaller LDL-size than either Caucasians or East Asians. In all statistical procedures, significance was reported at 95% confidence interval (CI) or probability value (P value) of less than 0.05. The statistical software packages Statview for Windows ver-sion 5.0 (SAS Institute Inc.), SPSS (Statistical Packages for Social Sciences) for Windows student version (SPSS Inc.) and SPSS for Macintosh version 10.0 (SAS Institute Inc.), were employed for the foregoing procedures. Results The study sample was comprised of 45.2% Caucasians, 41.5% East Asians and 13.3% from the Indian sub-continent (South Asians). The particle diameter for LDL (LDLPPD) was determined on one hundred and thirty-five (n=135) adolescent boys. The mean age of the sub-jects was 15.7 ± 0.45 years (range 14-16). The basic anthropometric, behavioural and biochemical profiles (Table 1) have already been determined and published.11
These results showed that mean BMI for the total group was 21.3 ± 3.2 kg/m2 with no significant diffe-rence by ethnicity while mean WHR was significantly higher in the South Asian group (0.83 ± 0.50) compared with both the Caucasians and East Asians, 0.80 ± 0.50 (P =0.03) and 0.79 ± 0.58 (P=0.006), respectively; however, mean waist (74.2 ± 8.7cm), was not significantly different. The mean %TBF for the total group was 17.3 ± 7.1, with corresponding values of 16.8 ± 7.9, 17.3 ± 6.2, and 19.3 ± 7.0 for the Caucasians, East Asians and South Asians, respectively. Although South Asians showed a trend to-wards a higher value of %TBF compared to the Caucasian and East Asian group these differences did not reach statistical significance. It is common to define pattern B phenotype in adults as a peak particle diameter of <25.5 nm, and pattern A as >25.5 nm. The values of LDL particle diameter were normally distributed and the mean LDL size of the study group was 26.9 ± 0.4 nm, hence no participant had LDL phenotype B according to the above classification. To further investigate the distribution of lipoprotein sub-classes (sdLDL) the values of LDL diameter were strati-fied by tertiles at the 33rd and 67th percentile bands, which were used as cut off points as the number of subjects could not be evenly divided among the tertiles. LDL particle diameters, of the total group and stratified by ethnicity are shown in Table 2. There was a non-significant trend for South Asians to have a lower LDL size, than both Caucasians and East Asians, respectively (P=0.065). When the tertiles of LDL diameter were examined, it was found that 50% (n=9) of South Asians were in the lowest tertile of measurement (25.95-26.69nm) compared to 29.5% (n=18) and 28.6%
Figure 1. LDL size (nm) between 3 different ethnic groups Graph is resubmitted and was also put straight into the original article
25.75
26
26.25
26.5
26.75
27
27.25
27.5
27.75
28
LDL- size
0 20 40 60 80
100
Percentiles
South Asians
East Asians
Caucasians
Percentiles Plot
Split by: Ethnic background

V Raschke, I Elmadfa, MA Bermingham and K Steinbeck 499
(n=16) of Caucasians and East Asians respectively. As can be seen from the percentile plot shown in figure 1 South Asians tended to have a smaller LDL size distri-bution than either Caucasians or East Asians at every per-centile band. Boys in the lowest tertile (25.95-26.69nm) of LDL peak particle diameter (LDLPPD) had significantly lower HDL (high density lipoprotein cholesterol,), compared to boys in the highest tertile of measurement, (1.2 vs. 1.4 mmol/l, (P=0.008). The triglyceride/HDL ratio, some-times used as an index of atherogenicity, was significantly higher in boys of tertile 3, than in boys of tertile 1 (0.8 CI 0.69-0.97 vs. 0.6 CI 0.58-0.68, P=0.012). Furthermore, the apolipoprotein A-1 concentration was significantly (P=0.029) lower in the lowest compared to the highest tertile of the LDL range, (110.0 mg/dl CI 100.85-119.27 vs. 129.0 mg/dl CI 117.31-140.61). As mentioned earlier11 mean BMI, %TBF and waist were not different among the ethnic groups, but WHR was significantly higher in South Asians, who also had significantly higher %TBF than Caucasians when adjus-ted for BMI. At the mean BMI of the cohort, South Asians had an average of 4.5% more body fat than Cau-casians and the evidence suggests this fat is centrally distributed. The distribution of sdLDL by ethnicity was examined by ANCOVA using BMI, %TBF and WHR, as covariates and no relationship between them was found. Using the logistic regression analysis (odds ratio and 95% CI) and 26.69 nm as cut off point, the relative risk of different ethnic groups having a smaller LDL size was calculated. South Asians have a 2.4 higher risk of having an LDL size less than 26.6 nm compared with Caucasians and East Asians. (P=0.082). Discussion The evidence that adult disease may have its origins in childhood and adolescence is solid.12-14 People with an-cestry in the countries of the Indian subcontinent (South Asians), comprising more than one fifth of the global population, are highly susceptible to insulin resistance and CHD. This is the first adolescent cohort to include Caucasians, East and South Asians. Half the South Asian boys were in the lowest tertile of LDL diameter compared to 30% the other two ethnic groups; there was also a trend for South Asians to have a lower mean LDL diameter than either Caucasian or East Asian boys. This was not statistically significant (0.06) but the numbers of South Asian subjects were small and the diameter of the LDL for South Asians was lower at every percentile band Levels of lipids and lipoproteins among children vary by sex, race/ethnicity, and are correlated with age, obe-sity, and other characteristics.8 Data currently available on LDL diameter in adolescents are extremely limited.
Based on studies in largely Caucasian American popu-lations, the prevalence of pattern B is 10-15% in males under 20 years of age.3 One recent study of children aged 13-16 years found a prevalence of small dense LDL of 54% among 80 obese youths. In this study, the small, dense LDL phenotype group (SDLDL) had significantly higher weight, waist circumference and VAT (visceral adipose tissue) than the large, buoyant LDL (LBLDL) phenotype group. Taken together, Owen et al., found peak particle diameter (PPD) to be significantly correlated with visceral adipose tissue, TG and TG/HDL ratio.9 These observations are not directly comparable with our study as all these subjects were obese. A study of healthy Japanese children, age range 7-13 years, did not report mean values, but found a prevalence of 9.3% pattern B with no gender differences.15 The Bogalusa Heart study16 which examined a subsample of 449 young adults aged 20-37 years showed no race differences between the LDL subclass pattern, but males had relatively less LDL1 (large, buoyant) and more LDL3 (small, dense) than females. This confirms the finding of Freedman et al.,8 and other studies17,18 which show that compared with girls, boys had a smaller mean LDL particle size; this highlights the fact that even in adolescence, boys are at higher risk. In the Bogalusa Heart study the LDL subclass pattern was associated significantly with BMI, waist cir-cumference, triglycerides, HDL2 cholesterol, insulin, and glucose, with levels increasing from LDL1 pattern to LDL3 pattern. In our study, no significant association was found between LDL size and any indices of obesity (including percent body fat, BMI and WHR), however this is almost certainly due to the smaller numbers in our study where most boys were not obese or metabolically abnormal. In contrast, the study by Owen et al., of LDL particle size in obese children (n=41), found PPD to be significantly correlated with visceral adipose tissue (mea-sured by magnetic resonance imaging (MRI)). In the current study, adolescent boys of South Asian origin have been shown to have a significantly higher mean WHR and a trend towards higher %TBF compared to their Cau-casian and East Asian counterparts. Furthermore, South Asians had a greater %TBF for the same BMI. These findings point to higher abdominal obesity among South Asian boys compared with Caucasians and East Asians. Studies over the last decade have shown increased tri-glyceride and decreased HDL to be a consistent pattern in South Asians in general, and in Asian Indians in par-ticular.19-21 These findings were not confirmed in the current South Asian cohort, which did not find significant differences in HDL-C among the tertiles of LDL size. This finding could be due to the much smaller sample (n=18) of South Asians compared to Caucasians and East Asians. Interestingly, Caucasians in the lower tertile of
Total group (n=135)
Caucasian (n=61)
East Asian (n=56)
South Asian (n=18)
P value+
LDL-size (nm) 26.9±0.4 26.9±0.4 26.9±0.4 26.7±0.4 0.065
+ One Way ANOVA
Table 2. LDL diameter of adolescent boys stratified by ethnicity (mean ±SD).

500 Low density lipoproteins in Australian adolescent boys
LDL diameter tended to have a significantly lower con-centration of HDL-C, significantly higher TG/HDL ratio and showed a trend towards a smaller concentration of apolipoprotein A-I. This finding agrees with the results of Arisaka et al., where children with small dense LDL subclass showed decreased HDL-C and apo A-I con-centrations.15 As this study showed, South Asian were more than twice as likely to have a smaller LDL size than the other two ethnic groups. In this study, the cut off point for sdLDL was obtained by examining all the data. Similarly, Rainwater et al.,22 used 26.2 nm as a cut off point for the investigation of LDL diameter, a point which is somewhat higher than the 25.5 nm which is usually used to separate pattern A from pattern B. In our study, the 33rd and 67th percentiles were used as cut off values, which was deemed to be more appropriate for a distribution of sdLDL in the ado-lescent cohort. In addition, 26.69 nm was used as a cut off point when the relative risk of different ethnic groups having a smaller LDL size was calculated. Austin et al., has proposed that the inheritance of LDL subclass pheno-types is controlled by a single major genetic locus.23 In addition to familial studies, evaluation of the LPL gene has also shown evidence for linkage to LDL subclass.24 Although these studies mainly involved Caucasians, they point to a strong genetic influence on the occurrence of LDL sub-class. Thus, it is reasonable to assume that the genetic component has contributed towards the trend of South Asian adolescent boys to have a lower LDL dia-meter than either Caucasians or East Asians boys which was independent of % TBF and BMI. In conclusion, our study shows that the higher risk profile for CHD and diabetes noted in South Asian adults may be evident even during adolescence. In this study, which was the first adolescent cohort to include Cau-casians, East and South Asians, it was found that the risk of South Asians having smaller LDL diameter is more than doubled compared to Caucasian and East Asian boys. Although the magnitude of the increased risk is high, it is necessary to confirm our findings in a larger sample size. Our understanding of the risk factors involved in the excess of CHD found in Asian Indians is not complete, but this study has highlighted some possible contributions of important metabolic and genetic risk factors which may be influential even in childhood and adolescence and may eventually lead to intervention which will focus on young age groups and take account of ethnic differences.
Acknowledgement We would like to gratefully acknowledge the support from the Institute of Nutritional Sciences, University of Vienna and the Faculty of Health Sciences, University of Sydney. References 1. Austin M, King MC, Vranizan KM, Krauss RM. Athero-
genic lipoprotein phenotype - a proposed genetic marker for coronary heart disease risk. Circulation 1990; 82:495-506.
2. Slyper A: Low-density lipoprotein density and athero-sclerosis: unravelling the connection. JAMA 1994; 272: 305-308.
3. Krauss R. Dense low density lipoproteins and coronary artery disease. Am J Cardiol 1995; 75:53B-57B.
4. Berenson G, Srinivasan SR, Frank GC, Webber LS: Serum lipid and lipoprotein in infants and children and their relationship with diet. Prog Clin Biol Res 1981; 61:73-94.
5. Durant R, Linder CW, Harkess JW, Gray RG: The relationship between physical activity and serum lipids and lipoproteins in black children and adolescents. J Adolesc Health Care 1983; 4:55-60.
6. Connor S, Connor WE, Sexton G, Calvin L, Bacon S: The effects of age, body weight and family relationships on plasma lipoproteins and lipids in men, women and children of randomly selected families. Circulation 1982; 65: 1290- 1294.
7. Campos H, Blijlevens E, McNamara JR, Ordovas JM, Posner BM, Wilson PWF, Castelli WP, Schaefer EJ.: LDL particle-size distribution – results from the Framingham Offspring Study. Arterioscler Thromb 1992; 12: 1410-1419.
8. Freedman D, Bowmanm BA, Otvos JD, Srinivasan SR, Berenson GS. Levels and correlates of LDL and VLDL, particle sizes among children: the Bogalusa Heart Study. Atherosclerosis 2000; 152: 441-449.
9. Kang H, Gutin B, Barbeau P, Litaker MS, Allison J, Le NA. Low-density lipoprotein particle size, central obesity, cardiovascular fitness, and insulin resistance syndrome markers in obese youths. Int J Obes 2002; 26:1030-1035.
10. Ambrosch A, Muhlen I, Kopf D, Augustin W, Dierkes J, Konig W, Luley C, Lehnert H. LDL size distribution in relation to insulin sensitivity and lipoprotein pattern in young and healthy subjects. Diabetes Care 1998; 21: 2077-84.
11. Mehta S, Mahajan D, Steinbeck KS, Bermingham MA. Relationship between measures of fatness, lipids and ethnicity in a cohort of adolescent boys. Annals of Nutrition & Metabolism 2002; 46:192-9.
12. Klag M, Ford DE, Mead LA, He J, Whelton PK, Liang KY, Levine DM. Serum cholesterol in young men and subsequent cardiovascular disease. New England J Med 1993; 328:313-318.
13. Lauer R, Lee J, Clarke WR.: Factors affecting the relation-ship between childhood and adult cholesterol levels - the Muscatine Study. Pediatrics 1988; 82:309-318.
14. Bao W, Srinivasan SR, Berenson GS: Tracking of serum apolipoprotein A-I and B in children and young adults: the Bogalusa Heart Study. J Clin Epidemiol 1993; 46:609-616.
15. Arisaka O, Fujiwara S, Yabuta K, Mokuno H, Mitugi Y, Miyake N. Characterization of low-density lipoprotein subclasses in children. Metabolism Clin Exp 1997; 46:146-148.
16. Srinivasan SR, Segrest JP, Elkasabany AM, Berenson GS. Distribution and correlates of lipoproteins and their subclasses in black and white young adults. The Bogalusa Heart Study. Atherosclerosis 2001; 159(2): 391-39
17. McNamara J, Campos H, Ordovas JM, Peterson J, Wilson PWF, Schaefer EJ. Effect of gender, age, and lipid status on low-density-lipoprotein subfraction distribution: results from the Framingham Offspring Study. Arteriosclerosis 1987; 7:483-490.
18. Gardner C, Fortmann SP, Krauss RM.: Association of small low-density lipoprotein particles with the incidence of coronary artery disease in men and women. JAMA 1996; 276:875-81.
19. Thomas I, Gupta S, Sempos C, Cooper R.: Serum lipids of Indian physicians living in the U.S. compared to U.S. born physicians. Atherosclerosis 1986; 61:99-106.

V Raschke, I Elmadfa, MA Bermingham and K Steinbeck 501
20. Hughes L, Woijciechowiski AP, Raftery EB.: Relationship between plasma cholesterol and coronary artery disease in Asians. Atherosclerosis 1990; 83:15-20.
21. Enas E, Yusuf S, Mehta JL.: Prevalence of coronary artery disease in Asian Indians. Am Heart J 1992; 70:945-949.
22. Rainwater D. Lipoprotein correlates of LDL particle size. Atherosclerosis 2000; 148:151-158.
23. Austin M, Breslow JL, Hennekens CH, Buring JE, Willett WC, Krauss RM. Low-density lipoprotein subclass patterns and risk of myocardial-infarction. JAMA 1988; 260:1917-1921.
24. Austin M, Stephens K, Walden CE, Wijsman E.: Linkage analysis of candidate genes and the small, dense low-density lipoprotein phenotype. Atherosclerosis 1999; 142: 79-87.
Original Article Low density lipoprotein subclasses in Asian and Caucasian adolescent boys Verena Raschke MSc
1, Ibrahim Elmadfa PhD1, Margaret A. Bermingham PhD
2, and Kate Steinbeck PhD
3
1 Institute of Nutritional Sciences, University of Vienna, Austria 2 School of Biomedical Sciences, Faculty of Health Sciences, University of Sydney, Australia 3 Endocrinology and Adolescent Medicine, Royal prince Alfred Hospital, Sydney, Australia
亞洲及高加索青亞洲及高加索青亞洲及高加索青亞洲及高加索青春期男孩其春期男孩其春期男孩其春期男孩其低密度脂蛋白低密度脂蛋白低密度脂蛋白低密度脂蛋白之之之之次分類次分類次分類次分類 已知有極高比例的南亞成年人罹患冠心病(CHD)及胰島素阻抗,甚至當他們在青少年時可能已顯示有較高的CHD危險因子。本研究目的為探討一個男性青少年世代中的小而密低密度脂蛋白(sdLDL)的次分類盛行情形。具體的目標是去探討這個世代中的男性青少年之肥胖測量值、種族及LDL直徑間的相關。單一學校年級世代的15-16歲 男孩(135名)的LDL次片段分離,使用原始的(未變性) 聚丙 烯醯
胺 3-13% 的梯 度膠 體及多 目垂 直電 泳系 統法。 為 了 用 迴歸 去 計 算 LDL
粒子直徑,以乳膠粒子與甲狀腺球蛋白抗體的標準去建立標準曲線 (Total Lab
Software v1.11)。 使用 ANOVA 去比 較不 同種族之間的LDL大小(SPSS and Stat
View)。 這個研究樣本中 涵蓋 45.2% 高加 索 人、 41.5% 東 亞 人 及 13.3% 來
自印度次大陸(南亞)的研究對象。南亞人比起高加索人及東亞男孩,在控制身體總脂肪(%TBF)及身體質量指數(BMI)後,其LDL直徑較低,雖然並不顯著。本研究是第一個評估包含高加索人、東亞及南亞人的sdLDL的研究。本研究結果指出南亞成年人有較高罹患CHD及糖尿病危險性的狀況,可能在其青春期時就已經看得出來。
關鍵字:青春期、冠心病、動脈粥狀腫、小而密低密度脂蛋白、LDL大小、脂蛋白次片段、未變性梯度膠體電泳、高加索人、亞洲人、澳洲。

502 Asia Pac J Clin Nutr 2006;15 (4):502-507
Original Article
Is the BMI cut-off level for Japanese females for obesity set too high? – A consideration from a body composition perspective
Masaharu Kagawa PhD1, Kazuhiro Uenishi RD PhD
2, Chiharu Kuroiwa RPT MSc3,
Miki Mori RD BSc2 and Colin W Binns MBBS MPH PhD
1
1 School of Public Health, Curtin University of Technology, Perth, Australia 2 Kagawa Nutrition University, Saitama, Japan
3 Department of Physical Therapy, Koriyama Institute of Health Science, Fukushima, Japan
The aim of the study was to determine the sensitivity and specificity of the BMI cut-off points that have been applied in the National Nutritional Survey in Japan (NNS-J) for young Japanese females. The relationship between the body mass index (BMI) and percentage body fat (%BF) of 139 young Japanese females (aged 18-27 years old) was examined using dual energy x-ray absorptiometry (DXA) and anthropometry. The sensitivity and specificity of the BMI cut-off point that has been in use in Japan was compared with the cut-off point proposed for Asia-Pacific population (the WPRO classification). The regression equation calculated for the relationship between the BMI and %BF using the DXA scan data was %BF = -15.152+2.058*BMI; R2 = 0.612, SEE = 3.66. From this equation the BMI value that corresponded with %BF of 30% was calculated to be 21.9kg/m2 (95%CI: 16.9-28.6). From the sensitivity and specificity analysis, it was found that more than 90% of Japanese females with %BF >30% were misclassified as “not obese” when the BMI value of 25kg/m2 was used to identify obese individuals. The misclassification reduced to 60% when the BMI value of 23kg/m2 was used as a cut-off point. The results indicate that the current classification used in the NNS-J may not precisely reflect the obesity status of young Japanese females and a considerable proportion of females with a large fat deposition would be misclassified as not obese. The current study shows the importance of including detailed body composition assessments to determine obesity level of individuals.
Key Words: Body Mass Index, body fat, BMI cut-off points, Japanese, females Introduction Obesity is a well known risk factor of a number of health problems including hypertension, diabetes, high blood glucose and cholesterol levels and cardiovascular diseases. The World Health Organization (WHO) has proposed using body mass index (BMI: body mass (kg)/stature(m)2) as a simple screening tool of obesity with the value of 25kg/m2 as a cut-off point of “pre-obese”.1 While its application to individuals may be problematic2,3 BMI has been shown to have a high correlation with these obesity-related health problems in epidemiological studies.4,5 Pre-vious studies have suggested that Asians have a higher percent body fat (%BF) than Caucasians at the same BMI value and they are likely to develop health problems at lower BMI values than Caucasians.6-11 This may be asso-ciated with ethnic differences in body proportion (i.e pro-portion of limb or trunk lengths in relation to stature).12 Considering ethnic differences in the BMI and risk of developing obesity-related health problems, the Regional Office for the Western Pacific Region of WHO, together with the International Association for the Study of Obesity (IASO) and the International Obesity Task Force (IOTF) proposed BMI cut-off points that are suitable for popu-lations living in the Asia-Pacific region (the WPRO
classification).13 In 2004, WHO proposed additional BMI cut-off points of 23kg/m2, 27.5kg/m2, 32.5kg/m2 and 37.5kg/m2 as levels to provide appropriate health advice, depend on ethnic background of the target population.14 The National Nutrition Survey in Japan (NNS-J) has shown that obesity has been more prevalent among males than females. Only 7% of the females aged 20-29 years old in the 2002 survey were classified as “obese”.15 The NNS-J classified obesity using the BMI classification defined by the Japan Society for the Study of Obesity (JASSO),16 which used the same BMI cut-off points for “underweight” as the WHO classification (ie, 18.5kg/m2) but classified individuals with the BMI value of 25kg/m2 as “obese” instead of “pre-obese”.
Correspondence address: Professor Colin Binns School of Public Health, Curtin University of Technology GPO Box U1987 Perth WA 6845 Tel: +61-8-9266-2952; Fax: +61-8-9266-2958 E-mail: [email protected] Accepted 30th April 2006

M Kagawa, K Uenishi, C Kuroiwa, M Mori and CW Binns 503
Individuals who had their BMI ≥25kg/m2 are advised to undergo further assessment on their waist circumference in order to examine abdominal fat distribution. However, the JASSO classification was not proposed with consi-deration of the actual relationship between BMI and body fat deposition (BMI-%BF relationship) of Japanese popu-lation. As the BMI itself does not reflect the actual amount of body fat of individuals and also because of ethnic differences in the BMI-%BF relationship, it is possible that the JASSO classification may underestimate the proportion of Japanese females with a considerable amount of body fat. Several Japanese studies have de-scribed obese individuals who were misclassified as “normal” using the WHO or the JASSO classifications as “masked obese”.17-19 It is possible that misclassifications reported in previous studies are because of the application of inappropriate BMI cut-off points that do not reflect their actual body fatness.
The aim of the current study was to determine sensitivity and specificity of the JASSO classification in young Ja-panese females by assessing the BMI-%BF relationship of the group based on the body composition results obtained from whole-body dual energy x-ray absorptiometry (DXA) and anthropometry. Method The study was approved by the Human Research Ethics Committees of Curtin University of Technology and Ka-gawa Nutrition University. The study adhered to the prin-ciples of medical research established by the National Health and Medical Research Council.20 In the current study 139 healthy Japanese females volunteers aged 18-27years old were recruited. Each subject was provided with a written informed consent form in which the pur-pose of the study and the radiation exposure involved in the study were explained. The confidentiality of the re-sults was guaranteed. Participants were asked if they were pregnant prior to undergo body composition assess-ment. Dual energy x-ray absorptiometry (DXA) Body composition of subjects was assessed using dual energy x-ray absorptiometry (DXA; Lunar® DPX-LIQ). This method is based on multi-compartment model and considered as one of the methods that provide relatively valid estimation of %BF.21-23 A whole-body DXA scan provides information on bone mineral density (BMD), bone mineral content (BMC), fat mass, lean mass, and %BF of the entire body and different body sections (eg., head, trunk and limbs). Every subject was asked to re-move all accessories and metallic items before their body composition measurements. The DXA measurements were completed in approximately 10 min and all measure-ments were conducted by an accredited technician.
Japanese females (N = 139) mean ± standard deviation
Age (years) 20.4 ± 1.3
Stature (cm) 158.8 ± 5.0
Body mass (kg) 52.5 ± 6.1
BMI (kg/m2) 20.8 ± 2.2
Percent body fat using DXA (%)
27.6 ± 5.9
BMD (g/cm2) 1.14 ± 0.07
BMC (g) 2351.6 ± 266.5
Sum of skinfolds (mm) 124.5 ± 35.5
Height-corrected sum of skinfolds (mm)
133.5 ± 38.3
Table 1. Physical characteristics of Japanese females obtained from anthropometry and whole-body DXA scan
0
5
10
15
20
25
30
35
40
45
50
10 15 20 25 30 35
BMI
%B
F Japanese females
%BF = -15.152+2.058*BMI
R2 = 0.612
SEE = 3.6632
Figure 1. The BMI-%BF relationship of Japanese females

504 The BMI cut-off level for Japanese females
Anthropometry Anthropometry measurements include stature, body mass, eight skinfolds measurements (triceps, subscapular, bi-ceps, iliac crest, supraspinale, abdominal, front thigh and medial calf), five girths measurements (relaxed arm, flexed and tensed arm, waist, gluteal and maximum calf), and four bone breadths measurements (biacromial, biilio-cristal, biepicondylar humerus and biepicondylar femur). All sites were measured using the protocol of the International Society for the Advancement of Kinanthro-pometry (ISAK).24 The measurements were conducted by a Level 3 and a Level 1 anthropometrists who were accre-dited by ISAK and their technical error of measurements (TEM) were within the acceptable limits proposed elsewhere.25 All measurement sites for each subject were located by the Level 3 anthropometrist prior to the mea-surements. From the measurements BMI, sum of eight skinfolds and height-corrected sum of eight skin-folds (sum of skinfolds*(170.18/stature)) were calculated. All statistical analyses were conducted using the SPSS® (version 10.05, 1999, Chicago) statistical pack-age. A stepwise regression analysis was conducted to de-velop the regression equation using %BF results from DXA scan as a dependent variable and BMI and age as independent variables. In addition, cross-tabulation was also used to assess specificity and sensitivity of different BMI classifications. Based on previous recommen-dations26,27 %BF of 30% was used as a cut-off point of obesity for Japanese females. The sensitivity and speci-ficity results obtained from the JASSO classification was compared with the results using the WPRO cut-off point. Results Results of body composition assessments using DXA and anthropometry are shown in Table 1. Figure 1 shows the relationship between BMI and %BF obtained from DXA scan. The BMI-%BF relationship of Japanese young females was determined by a stepwise regression analysis using %BF as the dependent variable. While age was
initially considered as an independent variable, it was ex-cluded from the final model. The final equation was %BF = -15.152+2.058*BMI with R2=0.612 and SEE = 3.6632. Using this equation, the BMI value at which the corresponding %BF was 30% was calculated to be 21.9 (95%CI: 16.9kg/m2-28.6kg/m2). The results indicate a possible misclassification of Japanese females who have a considerable amount of body fat even though their BMI’s are below 25, which the JASSO classification used as a cut-off point of obesity. Differences in magnitudes of misclassification be-tween the JASSO and the WPRO classifications were compared using sensitivity and specificity analysis (Table 2). While the BMI value of 25kg/m2 has been used as a cut-off point of “overweight” for the WHO classification and “obese” for the JASSO classification, the current study showed that 91% of Japanese females who had a %BF or more than 30% were classified as not overweight or obese using this value as a cut-off point. In com-parison, a proportion of misclassified individuals reduced to 60% when the BMI value of 23kg/m2, the cut-off point of “overweight (at risk)” in the WPRO classification, was used. Discussion Results from the current study showed that young Japa-nese females are likely to have a large amount of fat deposition in relation to their BMI values. This is similar to the pattern observed in young Japanese males28 and supports previous findings that Asians have high %BF at lower BMI values when compared to Caucasian sub-jects.12,29 The stature and body mass of Japanese females who participated in the current study were comparable to the 20 years old age category of the 2002 NNS-J.15 This suggests that the current sample is typical of young Japanese women and the current findings may represent the normative trend of the BMI %BF relationship of young Japanese females. The current results showed that young Japanese fe-males could have a considerable level of %BF at a rela-tively low BMI. Based on the JASSO classification, the NNS-J conducted in 2002 reported only 7% of young Ja-panese females as “obese”. However the current findings suggest that it is highly likely that there will be a higher proportion of young Japanese females who should be classified as “obese” and reported in the NNS-J. The results obtained in the current study was consistent to the result using Japanese males living in Australia30, suggesting that young Japanese are likely to be mis-classified if the BMI value of 25kg/m2 was used as a cut-off point of obesity. The BMI value of 23kg/m2 that has been proposed as the cut-off point of “overweight (at risk)” in the WPRO classification13 and recently proposed as a one of the cut-off points to recommend public health action by WHO.14 From the results obtained from the current study it appears that the BMI value of 23kg/m2 reflects actual body fat level of young Japanese females better than the BMI value of 25kg/m2 and therefore maximizes effective-ness of the BMI as a screening tool for the obesity for this specific population.
The JASSO classification (%)1
%BF < 30% %BF ≥ 30%
BMI < 25kg/m2 98.9 91.1
BMI ≥ 25kg/m2 1.1 8.9
The WPRO classification (%)2
%BF < 30% %BF ≥ 30%
BMI < 23kg/m2 94.7 60.0
BMI ≥ 23kg/m2 5.3 40.0 1 The BMI classification proposed by the Japanese Society for the Study of Obesity. 2 The BMI classification proposed by the Regional Office for the Western Pacific Region of WHO, together with the International Association for the Study of Obesity (IASO) and the International Obesity Task Force (IOTF).
Table 2. A comparison of specificity and sensitivity of the JASSO and the WPRO BMI cut-off points for obesity and overweight (at risk) in relation to estimated %BF using a whole-body DXA scan

M Kagawa, K Uenishi, C Kuroiwa, M Mori and CW Binns 505
By saying that, still 60% of young Japanese females were misclassified as “not obese” using the BMI value of 23kg/m2 as the cut-off point. This result illustrates a pro-portion of body fat deposition among young Japanese females in relation to their body size and weight. Al-though the current study was unable to clarify the causes of the observed results, it is possible that strong pre-occupation toward thinness and dieting behaviours with-out regular physical exercise are associating to the results. There are Japanese studies that have focused on an issue of “masked obesity”, which defined as a condition which one has considerable amount of body fat without having high BMI that classify the individual as “overweight” or “obese”.31 Although a phenomenon of “masked obesity” could derived from inappropriate BMI cut-off points as in the current study, some studies have suggested that an attempt to lose body mass without regular physical exercise has been suggested as one of the causes for “masked obesity”32 and a greater proportion of females compared to males are “masked obese”.31 These previous results may indicate a reliance of diet restriction as their weight-loss method among young Japanese females and also a possibility of depletion of muscle mass and in-crease in fat mass by experiencing repeated reduction and regaining of their body mass. As more than 50% of sub-jects with an excessive level of body fat were mis-classified, it is possible that relatively large proportion of young Japanese females may develop health problems at their later stage of life. Recently a Japanese committee that consists of mem-bers from eight medical societies, which include the JASSO and the Japanese Society of Internal Medicine (JSIM), has proposed a screening guideline for a meta-bolic syndrome.33 The new guideline proposed using waist circumference measured at the umbilical level with cut-off points of 85cm for males and 90cm for females as the standard criteria and individuals were classified as at risk of metabolic syndrome if they have high waist cir-cumference with any combination of high triglyceride or cholesterol levels, hypertension, or high blood glucose levels. The effectiveness of waist circumference as an index of cardiovascular disease risk has been suggested in several studies34-36 and the proposed waist circumference values in Japan were based on the study using 1,193 subjects (418 women) that equate with a visceral fat area of 100cm2, the value that considered as a cut-off point of developing coronary heart disease in Japanese.37 How-ever, it is important to acknowledge that the females participated in the study were mainly middle-aged (mean age: 55 ± 12 years) and it is unlikely for young Japanese females to have a waist circumference of 90cm. The average waist circumference value in the current study was 66.3 ± 4.9cm and the range was 57.3-82.3cm. Al-though the definition of waist measurement site was not exactly the same, none of the subjects who had excessive level of body fat in the current study had waist values ≥90cm. Therefore it may be appropriate to determine waist circumference level specifically for young Japanese females and its application together with the appropriate BMI cut-off point (i.e BMI value of 23kg/m2) in order to improve detection of young Japanese females who require
improvement in their lifestyle to reduce their health risks later in their life. The current study found that a considerable proportion of young Japanese females with an excessive amount of body fat are likely to being misclassified as not obese using the current classification used in the NNS-J. Future research should be conducted on children and adolescents to examine if the current classification is appropriate to detect individuals with childhood obesity in Japan. In addition, the current study showed a wide 95% CI that ranged from 16.9kg/m2 to 28.6kg/m2. In order to increase the precision of the BMI %BF relationship as well as sensitivity and specificity using different BMI cut-off points, further studies using greater sample size may be required. Conclusion This study aimed to assess sensitivity and specificity of the BMI cut-off points that have been applied in the National Nutritional Survey in Japan (NNS-J) for young Japanese females based on the relationship between the BMI and %BF. While the NNS-J reports a proportion of obese individuals based on the BMI classification using the value of 25kg/m2 as a cut-off point of “obese”, the NNS-J report may misclassify young Japanese females who are in fact obese. The current study suggests an application of lower BMI cut-off point would improve screening ability of the BMI. The study also recommends inclusion of body composition and fat distribution assessments in a screening procedure to obtain precise information of body fatness of individuals. References 1. Obesity epidemic puts millions at risk from related
diseases. http://www.who.int/archives/inf-pr-1997/en/pr97-46.html.
2. Garn SM, Leonard WR, Hawthorne VM. Three limitations of the body mass index. The American Journal of Clinical Nutrition 1986;44:996-997.
3. Ross WD, Crawford SM, Kerr DA, Ward R. Relationship of the Body Mass Index with skinfolds, girths, and bone breadths in Canadian men and women aged 20-70 years. Am J Physical Anthropology 1988; 77: 169-173.
4. Stevens J, Cai J, Pumuk ER, Williamson DF, Thun MJ. The effect of age on the association between body mass index and mortality. New Engl J Med 1998;338(1):1-7.
5. Yoshiike N, Nishi N, Matsushima S, Itou C, Ikeda Y, Kashiwara H, Yoshinaga H, Ogura H, Komine S, Satou Y, Satou N, Sasaki Y, Fujioka S, Oku J, Amamiya T, Sakata T, Inoue S. Body mass index ni motozuku himan no teido to tounyoubyou, kouketsuatsu, koushikesshou no kikeninshi tono kanren -tashisetsu kyoudou kenkyu ni yoru ekigaku teki kentou- [Jap]. J Japan Soc Study Obesity 2000; 6 (1):4-17.
6. Wang J, Thompson JC, Russel M, Burastero S, Heymsfield S, Pierson Jr. RN. Asians have lower body mass index (BMI) but higher percent body fat than do whites: comparisons of anthropometric measurements. The Am J Clin Nutr 1994;60:23-28.
7. Deurenberg P, Yap M, Staveren WAv. Body mass index and percent body fat: a meta analysis among different ethnic groups. Int J Obesity 1998; 22: 1164-1171.

506 The BMI cut-off level for Japanese females
8. Deurenberg-Yap M, Schmidt G, Staveren WAv, Deurenberg P. The paradox of low body mass index and high body fat percentage among Chinese, Malays and Indians in Singapore. Int J Obesity 2000; 24:1011-1017.
9. Lee ZSK, Critchley JAJH, Ko GTC, Anderson PJ, Thomas GN, Young RP, Chan TYK, Cockram CS, Tomlinson B, Chan JCN. Obesity and cardiovascular risk factors in Hong Kong Chinese. Obesity Reviews 2002; 3:173-182.
10. Deurenberg P, Bhaskaran K, Lian PL. Singaporean Chinese adolescents have more subcutaneous adipose tissue than Dutch Caucasians of the same age and body mass index. Asia Pac J Clin Nutr 2003; 12 (3): 261-265.
11. Chang C-J, Wu C-H, Chang C-S, Yao W-J, Yang Y-C, Wu J-S, Lu F-H. Low body mass index but high percent body fat in Taiwanese subjects: implications of obesity cutoffs. Int J Obesity Related Metabolic Disorders 2003; 27 (2): 253-259.
12. Deurenberg P, Deurenberg-Yap M, Guricci S. Asians are different from Caucasians and from each other in their body mass index/body fat per cent relationship. Obesity Reviews 2002;3:141-146.
13. WHO/IASO/IOTF. Asia-Pacific perspective: Redefining obesity and its treatment: Health Communications Australia Pty Ltd; 2000.
14. WHO. Appropriate body-mass index for Asian populations and its implications for policy and intervention strategies. Lancet 2004; 363 (10): 157-163.
15. Kenkou Eiyou Jouhou Kenkyukai. Kokumin eiyou no genjou-The National Nutrition Survey in Japan, 2002 [Jap]. 1 ed. Tokyo: Daiichi Shuppan; 2004.
16. Matsuzawa Y, Inoue S, Ikeda Y, Sakata T, Saito Y, Satou Y, Shirai K, Ohno M, Miyazaki S, Tokunaga K, Fukagawa K, Yamanouchi K, Nakamura T. Atarashii himan no hantei to himanshou no shindan kijun [Jap]. J Japan Soc Study Obesity 2000; 6 (1):18-28.
17. Kajioka T, Ohsawa I, Yoshida T, Sato Y. Body and lifestyle characteristics in normal weight obesity (masked obesity) in Japanese female high school students [Jap]. Jap J School Health 1996; 38: 263-269.
18. Urata H, Tahara Y, Nishiyama K, Fukuyama Y, Tsunawake N, Moji K, Yukawa K. Validity of various obesity indices calculated from height and weight in adult females using the underwater-weighing method as a reference [Jap]. Nihon Koushu Eisei zasshi 2000; 47 (8): 621-629.
19. Takahashi R, Ishii M, Fukuoka Y. A method for evaluating the masked obesity in young females [Jap]. Nihon Seiri Jinrui Gakkaishi 2002;7(4):59-63.
20. NHMRC. National Statement on Ethical Conduct in Research Involving Humans; 1999.
21. Heymsfield SB, Lichtman S, Baumgartner RN, Wang J, Kamen Y. Body composition of humans: comparison of two improved four-compartment models that differ in expense, technical capacity, and radiation exposure. Am J Clin Nutr 1990; 52: 52-58.
22. Wellens R, Chumlea WC, Guo S, Roche AF, Reo NV. Body composition in white adults by dual-energy x-ray absorptiometry. densitometry, and total body water. Am J Clin Nutr 1994; 59:547-555.
23. Van Loan MD. Estimates of fat-free mass (FFM) by densitometry, dual energy x-ray absorptiometry (DXA), and bioimpedance spectroscopy (BIS) in Caucasian and Chinese-American women. Applied Radiation and Isotopes 1998; 49 (5/6):751-752.
24. ISAK. International standards for anthropometric assessment. Canberra: ISAK; 2001.
25. Gore C, Norton K, Olds T, Whittingham N, Birchall K, Clough M, Dickerson B, Downie L. Accreditation in anthropometry: an Australian model. In: Norton K, Olds T, editors. Anthropometrica. Sydney: University of New South Wales Press, 1996; 395-411.
26. Nagamine S. Hikashibou kara no himan no hantei [Jap]. Nihon Ishikai Zasshi 1972; 68 (9): 919-924.
27. Wilmore JH, Buskirk ER, DiGirolamo M, Lohman TG. Body composition-a round table. The Physician and Sports Med 1986; 14 (3):144-162.
28. Kagawa M, Kerr D, Uchida H, Binns C. Ethnic differences in the BMI-%BF relationship: A comparative study of Japanese and Australian Caucasian males. In: The 35th Asia Pacific Academic Consortium for Public Health; 2003; Shanghai, China; 2003.
29. Deurenberg P. Universal cut-off points for obesity are not appropriate. Br J Nutr 2001;85:135-136.
30. Kagawa M, Kerr D, Binns C. Ethnic differences in the BMI-%BF relationships between young Japanese and Australian-Caucasian males living in Australia using dual-energy x-ray absorptiometry. Asia Pac J Public Health 2003; 15 (Suppl): S27-S32.
31. Fujise T, Nagasaki K. Characteristics of anthropometry and physical fitness of masked obesity in young men and women [Jap]. Japanese J Physical Fitness and Sports Med 1999; 48: 631-640.
32. Suzuki H, Matsuo T. Jakunen josei ni okeru himando to taishibouritsu tono kanrensei [Jap]. Tairyoku Kagaku 1996; 45: 756.
33. Yakuji Nippo Limited. Proposal of guideline for metabolic syndrome - eight medical societies including the Japanese Society of Internal Medicine involved [Jap]. http://www.yakuji.co.jp/contents/headlinenews/hln2005040804.html.
34. Bei-Fan Z. Predictive values of body mass index and waist circumference for risk factors of certain related diseases in Chinese adults: study on optimal cut-off points of body mass index and waist circumference in Chinese adults. Asia Pac J Clin Nutr 2002; 11 (Suppl 8):S685-S693.
35. Dalton M, Cameron AJ, Zimmet PZ, Shaw JE, Jolley D, Dunstan DW, Welborn TA. Waist circumference, waist-hip ratio and body mass index and their correlation with cardiovascular disease risk factors in Australian adults. J Int Med 2003; 254 (6): 555-63.
36. Welborn TA, Dhaliwal SS, Bennett SA. Waist-hip ratio is the dominant risk factor predicting cardiovascular death in Australia. Med J Australia 2003; 179(11-12):580-585.
37. The Examination Committee of Criteria for 'Obesity Disease' in Japan. New criteria for 'obesity disease' in Japan. Circulation J 2002; 66 (11): 987-992.

M Kagawa, K Uenishi, C Kuroiwa, M Mori and CW Binns 507
Original Article
Is the BMI cut-off level for Japanese females for obesity set too high? – A consideration from a body composition perspective
Masaharu Kagawa PhD1, Kazuhiro Uenishi RD PhD
2, Chiharu Kuroiwa RPT MSc3,
Miki Mori RD BSc2 and Colin W Binns MBBS MPH PhD
1
1 School of Public Health, Curtin University of Technology, Perth, Australia 2 Kagawa Nutrition University, Saitama, Japan
3 Department of Physical Therapy, Koriyama Institute of Health Science, Fukushima, Japan
日本女日本女日本女日本女性性性性肥胖的標準肥胖的標準肥胖的標準肥胖的標準的的的的身體質量指數切點是否身體質量指數切點是否身體質量指數切點是否身體質量指數切點是否訂訂訂訂太高太高太高太高了了了了?-從體組成的從體組成的從體組成的從體組成的觀點來思考觀點來思考觀點來思考觀點來思考
本研究的主旨為評估已經被運用在日本國民營養調查(NNS-J)中的身體質量指數(BMI)切點,在年輕日本女性的敏感度跟特異度。使用雙能量 X 光吸收儀(DXA)
及體位測量評估 139 名年輕日本女性(18-27 歲)的 BMI 與體脂肪率(%BF)的相關。比較目前日本使用的 BMI 切點的敏感度跟特異度與建議使用於亞太族群的切點(WPRO分類)。使用 DXA 掃描結果的數據去計算 BMI 與體脂肪率的相關,得到的迴歸方程式為%BF=-15.152+2.058*BMI;R2=0.612,SEE=3.66。依照這個方程式,當體脂肪率為 30%時所對應的 BMI 為 21.9 kg/m2 (95% CI=16.9-28.6)。敏感度跟特異度分析發現,以 BMI 值為 25 kg/m2 當作肥胖的切點時,有超過90%體脂肪率>30%的日本女性被錯誤分類為非肥胖。當 BMI 值以 23 kg/m2為切點時,錯誤分組降低到 60%。此結果指出在 NNS-J 使用目前的分組可能無法確實反映出年輕的日本女性的肥胖狀態,有一大部分身體囤積大量脂肪的女性將被錯誤分組當為非肥胖者。本研究指出在裁定個體肥胖的程度時涵蓋詳細的體組成測量的重要性。
關鍵字:身體質量指數、體脂肪、BMI 切點、日本人、女性。

508 Asia Pac J Clin Nutr 2006;15 (4):508-515
Original Article The relationship between obesity and health related quality of life of women in a Turkish city with a high prevalence of obesity Gönül Dinç MD, Erhan Eser MD, Gül Saatli MSc, Ümit Atman Cihan MD,
Ahmet Oral MD, Hakan Baydur MSc and Cemil Özcan MD, PhD
Celal Bayar University, Faculty of Medicine, Department of Public Health, Manisa, Turkey
The purpose of this study was to demonstrate the relationship between body weight and HRQOL in a representative sample of nonpregnant women in reproductive age period. The data of this cross-sectional study was extracted from a survey: Manisa Demographic and Health Survey (MDHS) conducted in Manisa city in 2000. The study population of MDHS is a representative sample of 1602 reproductive (15-49) age women. World Health Organization Quality of Life Questionnaire abbreviated version (WHOQOL-BREF), which was composed of four domain factors (physical, psychological, social relations and the environment), was used to assess HRQOL. Each of four domains had a possible score ranged between 0 (poor HRQOL) and 20 (excellent HRQOL). The mean age of the women was 35.29 ± 8.19 years. Among them, 35.8 % had normal weight (BMI 18.5 to 24.9), 32.3 % were overweight (BMI 25.0 to 29.9) while 31.9 % were moderate and 3.4% were morbidly obese. After adjusting for age, level of education and co-morbid illnesses, subjects with a BMI higher than normal value, had significantly lower HRQOL scores, compared to normal-weight individuals on each of the domains, except for the environmental domain. Our results suggested that the body weight alone could negatively affect HRQOL. In other words, obesity not only increased the risk of morbidity and mortality, but also affected the perceived health and life quality negatively. In conclusion, in addition to age, socioeconomic status and co-morbid illnesses, body weight should also be controlled in studies examining HRQOL.
Key words: Health Related Quality of Life, obesity, women, WHOQOL, general health-related quality, Turkey. Introduction The prevalence of overweight and obesity have increased in Europe and the Mediterranean region during the last de-cades, regardless of the level of development.1-11 Obesity also contributes to the burden of disease in the community, due to its association with a number of chronic conditions such as; hyperlipidemia, non-insulin dependent diabetes, hypertension and coronary artery disease.12 Obesity has become one of the leading preventable causes of mortality, through the vision of public health.13-14 Although it is well documented that obesity is strongly associated with morbidity and mortality, less is known about the impact of obesity on the functional status and health-related quality of life (HRQL). The majority of published studies indicate that obesity impairs HRQL, and that higher degrees of obesity are associated with greater impairment.15-32 Most of the studies, enrolled participants from obesity clinics, who most likely attend these clinics as a result of undesirable effects caused by their body weight.16,17,30-33 Unfortunately there are very few population-based studies which are free of referral bias; as in the hospital-based ones that investigate the relationship between obesity and HRQOL.34-36
However, almost all these studies were conducted in de-veloped countries. Developing countries, like Turkey, were reported to be experiencing the double burden of disease (both communicable and chronic diseases) in the 2002 Annual Report of the World Health Organization.37 The prevalence of obesity is extremely high in women, and the impact of obesity on the HRQOL of the population has never been studied before in countries located in the Eastern Mediterranean region. Obesity and QOL relation-ship has been reported with measures of general health-related QOL and measures of obesity-specific QOL. The most popular obesity-specific QOL instruments can be listed as Impact of Weight Loss Scale, Impact of Weight on Quality of Life-Lite, Obesity and Weight-Loss Quality of Life measure and Weight-Related Symptom Measure.38 Since obesity has a potential multidimensional effect on QOL, the use of generic scales and selection of the appro-priate generic scale is crucial in the obesity related QOL Correspondence address: Dr. Gonul Dinc, CBU Tip Fak. İstasyon mevkii, 45020 Manisa / Turkey Tel: + 90 236 239 13 19 (work); Fax: + 90 236 232 00 58 Email: [email protected],[email protected] Accepted 3 March 2006

G Dinç, E Eser, G Saatli, Ü Atman Cihan, A Oral, H Baydur and C Özcan 509
studies. SF 36 was used in most of the HRQOL studies on obese subjects as a generic instrument. Though SF 36 was proved to be a very effective tool in assessing the HRQOL of the subjects with a variety of diseases, it is widely known as a generic tool, which spans functional health status, while WHOQOL is a relatively newly deve-loped scale, defined as a profile which has a good under-lying theoretical conceptualization of quality of life.39
WHOQOL was cross-culturally validated simultaneously in more than 40 cultures and languages around the world.40,41
The purpose of this study was to demonstrate the rela-tionship between body weight and HRQOL, in a repre-sentative sample of nonpregnant reproductive aged wo-men, using WHO body weight classification, by exclu-ding cases with chronic disease and by adjusting HRQOL scores for age, level of education and co-morbid illness. Materials and methods Setting The study was conducted in the City of Manisa, which was one of the well-developed provinces (11th biggest province for both population size and per capita Gross Domestic Product) of Turkey and located in the Eastern Mediterranean, Aegean region of the country. The mid-year census of Manisa city was 218,314 in the year 2000. Subjects A representative sample of 1669 reproductive (15-49) age women, were used in the study. The data of this cross-sectional study was extracted from a representative sur-vey: Manisa Demographic and Health Survey (MDHS) conducted in Manisa city in 2000. Sample size and sample selection The sample size of MDHS was calculated using an esti-mated infant mortality rate (the least frequent dependent variable of the survey): 43.0% 0. A 95% CI, a precision of 8% 0 and 2.0 of a design effect were used. The mini-mum sample size was calculated as 1680 households.42 A total of 168 clusters by 10 households per cluster was selected by probability proportional to size sampling approach. The initial households of each cluster were chosen randomly from a sampling frame, and the rest of the households were determined systematically by every fifth household for each cluster. All reproductive age women, present in the household on the night before the interview, were eligible for the study. Of the 1680 selected households, 2.4 % (N = 40) were considered to be unoccupied and 2.7 % (N = 46) refused the interview. A total of 1728 ever-married women living in the selected households were interviewed in MDHS. Eighty-eight women who were pregnant or who were in the 3 months post-partum period, were excluded from the analysis, since in these periods Body Mass Index would be affected by transient hormonal causes and could not be regarded as a real obesity. The subjects were divided into five BMI categories according to the WHO classification system.43 As the goal of the study was to examine the association between HRQOL and higher BMI, subjects in the underweight category (BMI < 18.5 kg/m2) were excluded from the analysis (N =38). Finally,
1602 healthy women aged between 15-49 years were used in the analysis. Study measures In the original study, data was collected by six trained teams; each consisted of two interviewers, a field editor and a supervisor. The interviewers measured height by a wall-mounted stadiometer, sensitive to 0.5cm, and weight by a 0.1kg sensitive calibrated balance scale; with the subjects wearing no shoes and only light clothing. BMI was calculated by dividing weight in kilograms by square of the height in meters. World Health Organization Quality of Life Questionnaire abbreviated version (WHOQOL-BREF):
The World Health Organization Quality of Life Assess-ment (WHOQOL) is a generic quality of life instru-ment, designed to be applicable to people living under different circumstances, conditions and cultures.40,41 The WHOQOL sets out to be a purely subjective evaluation, assessing perceived HRQOL, and in this way it differs from many other instruments used to assess HRQOL. WHOQOL also accepts HRQOL as a multidimensional concept. Hence, assessment of a number of domains is necessary to derive a com-prehensive view of a person’s HRQOL. Two versions are available: the full WHOQOL with 100 items and the WHOQOL-BREF with 26 items. WHOQOL-BREF, the generic profile instrument, useful in clinical and service evaluations was used in this study for reasons of brevity. It is suggested that the WHOQOL-BREF provides a valid and reliable alternative to the assessment of domain profiles using the WHOQOL-100. It provides un-weighted measure-ment on four domains: physical, psychological, social and environ-ment. The physical domain has questions related to daily activities such as, pain and discomfort, sleep and rest, energy and fatigue, dependence to the medi-cations and mobility and work. In the psychological domain, there are questions of positive and negative feelings, meaning of life, self-esteem, body image and physical appearance, personal beliefs and ability to concentrate. The social relationship domain is related to personal relationships, social support and sexual activity. The environmental domain explores physical security and safety, financial resources, physical environment, home environment, health and social care and their availability, leisure activities, oppor-tunities for acquiring new information and skills and participation in and opportunities for recreation and transport. A scoring algorithm (a SPSS syntax) was used to transform the sum of the WHOQOL-BREF item scores within each domains, to a scale ranging from 0 (poor HRQOL) to 20 (excellent HRQOL).
Validity and reliability of WHOQOL for the Turkish population were completed.44 The psychometric analysis of the Turkish version was deemed highly satisfactory. Data analysis Comparison of age means between BMI categories were done by ANOVA while comparisons between categorical variables were performed by using the Chi Square test.

510 Obesity and health related quality of life in Turkish women
WHOQOL domain mean scores with SDs were calculated for the entire sample and for each BMI classification. Raw WHOQOL Domain scores were adjusted by three potential confounding variables such as age, level of edu-cation and self-reported co-morbid illnesses, by using Multiple Linear Regression models. The domain scores and age were added into the models as continuous varia-bles, while the level of education and the co-morbid ill-nesses were used as categorical variables. The two additional variables that might be regarded as other con-founding variables such as social class and health service utilization were not added to the multivariate analysis to avoid multi-co-linearity, since both had significant sta-tistical associations with their peers. The level of edu-cation and the social class category revealed a non-parametric correlation coefficient higher than 0.4 and the co-morbid illnesses and health service utilization showed a significant agreement, tested with Kappa statistics (P <0.001). The comparisons of WHOQOL domain scores accor-ding to BMI categories were done with two different statistical approaches. Unadjusted and adjusted mean domain scores of BMI categories were compared by ANOVA. We also analyzed the data in a risk approach; each of the four adjusted WHOQOL domain scores were categorized by two cut-off points. One is the minus 1 (-1) standard deviation (SD) value of the standard normal dis-tribution and the other one is the plus 1 (+1) standard deviation value. The subjects having a domain score value between –1 and +1 standard deviation values were excluded from the risk approach analysis. Odds Ratios having a value below –1SD value were calculated by regarding normal BMI category (BMI <18.5 kg/m2) as reference. A P value of <0.05 was considered to be sta-tistically significant. Analysis was performed using SPSS version 10.0.
Results The mean age of the women were 35.29 ± 8.19 years. Only about one third of the subjects (N = 573, 35.8%) were of normal weight (BMI 18.5 to 24.9), slightly less than one third (N = 517, 32.3 %) were overweight (BMI 25.0 to 29.9) and an additional one third (N = 512,31.9 %) were either moderately (BMI 30.0 to 39.9; N = 457, 28.5 %) or morbidly obese (BMI> 40.0; N = 55, 3.4%). The prevalence of obesity could be regarded as extremely high in the study group. Overweight prevalence was elevated with aging and lower level of education. Belonging to lower social class elevated the overweight prevalence, as well (P<0.001). Among the respondents, 14.7% reported suffering from prolonged illnesses. The risk of suffering from any prolonged illness was associated with the in-crease of BMI, with the proportion of subjects reporting a prolonged illness, increased linearly from 9.4% of those who had normal weight to 23.6% of those who were morbidly obese (Table 1). Unadjusted domain scores of WHOQOL were sta-tistically different in overweight and obese subjects, com-pared to those who had normal weight, except for the environment domain. P values were: < 0.001 for physical and psychological well-being domains; 0.016 for social relations domain and 0.158 for the environmental domain. After adjusting for age, level of education and co-morbid illness, subjects with a BMI value higher than 30.0, had significantly lower HRQOL scores on each of the do-mains, except for the environmental domain. On the con-trary, the environmental domain score was significantly higher in overweight and obese subjects, compared to those who had normal-weight. The higher the BMI value, the lower the environmental domain score (Table 2). As an alternative way of expressing the relationship between the WHOQOL domain scores and the BMI, the adjusted WHOQOL domain scores were categorized by two cut-off points: –1 standard deviation value and +1
Body Mass Index Classification (kg/m2) Characteristic (N) Total Sample 18.5 to <25 25 to <30 30 to <35 35 to <40 > 40 P Value N (%) 1602 (100.0) 573 (35.8) 517 (32.3) 313 (19.5) 144 (9.0) 55 (3.4) Mean age in years (SD)
35.2 (8.1)
32.0 (7.5)
35.3 (7.9)
38.4 (7.7)
39.2 (7.7)
40.1 (6.6)
<0.001†
Level of Education, % < 0.001* No education (293) 18.3 12.6 16.4 24.0 28.5 36.4 Primary (904) 56.3 51.9 57.8 61.9 59.0 54.5 Secondary and higher (405) 25.2 35.5 25.7 14.1 12.5 9.1 Social Class, % < 0.001* High (87) 5.4 7.5 6.0 3.2 2.1 0.0 Moderate (738) 46.1 44.5 45.5 49.2 50.7 38.2 Low (777) 48.5 48.0 48.5 47.6 47.2 61.8 Reported Comorbid Illness, % < 0.001* No comorbid illness (1366) 85.3 90.6 87.0 79.6 73.6 76.4 At least one comorbid illness (236) 14.7 9.4 13.0 20.4 26.4 23.6 *P value is overall comparison of proportions among BMI classifications by Chi square; † P value is overall comparison of means among BMI classifications by ANOVA, Post hoc results: 18.5 to 24.99 < 25 to 29.99 < 30 and over, Tukey’s HSD test
Table 1. Descriptive characteristics of study population

G Dinç, E Eser, G Saatli, Ü Atman Cihan, A Oral, H Baydur and C Özcan 511
standard deviation value of standard normal distribution of each of the four domains. The risks of having a quality of life score lower than –1 standard deviation value were constantly elevated concordant with the increase in BMI class. This regular trend could be observed in all WHOQOL domains, except for the environment domain. Having a BMI value higher than normal value could pro-tect individuals for having a lower environment quality of life score (Table 3). Discussion The results of this study have shown that 32.3% of the reproductive age women were overweight and 31.9% were obese in the center of Manisa. The findings were si-milar with the results of other previous studies conducted in other regions of Turkey45-47 and similar or slightly higher than those conducted in Europe and Mediterranean countries.1,3,5, 48-50 The scope of this study was to probe the association between body weight and the health related quality of life (HRQOL); therefore, the possible relationship between obesity prevalence and other variables was not analyzed in this paper. Here, a negative linear association was found between obesity and HRQOL in a representative sample of reproductive-aged women. Even after con-trolling the possible confounding variables such as age, education and presence of any co-morbid illnesses, indi-viduals with obesity had lower WHOQOL scores on three of the four domains of WHOQOL (physical, psy-chological and social), than those with normal weight. These results showed that obesity could have an inde-pendent impact on HRQOL in a representative sample of the population with high obesity. The results of this study are consistent with many other studies17,19,27-31,33,51 that noted the relationship be-tween HRQOL and BMI. A reversible relationship be-tween obesity and HRQOL was also demonstrated in a number of weight loss intervention studies which show that weight loss was associated with improvement in HRQOL, and weight regain was associated with de-teriorations in HRQOL.21,18,32,52-55
The strong relationship in each BMI category with HRQOL may be due to the gender property of our sam-ple, since the results of the studies showed that the inverse
relationship between body weight and HRQOL was more apparent in women.51,56,57 Though many other studies suggested that the burden of obesity was primarily per-ceived as physical in nature,19,58-60 this study showed that physical, psychological and social dimensions of quality of life had persistent negative associations with the degree of overweight and obesity. Nevertheless, the results of this study revealed a more powerful association between BMI and the Physical component, compared to the Psy-chological component consistent with the literature above. The results of this study could be considered quite re-liable, since measurements of body weight and height were actually performed, rather than obtaining by par-ticipants’ self-reports, as in some other studies19,33,51 as women were shown to underestimate their body weight consistently, resulting in a systematic bias. Non response bias was negligible since the response rate was very high (97%). In addition, age, level of education and presence of co-morbid illnesses which are the obvious confounders to obesity, were controlled when measuring HRQOL. In many studies, it was shown that the low socioeconomic status and especially low education level worsened HRQOL.2,8,48-50, 60-63 On the other hand, co-morbid illness was considered to be an important confounder in almost every HRQOL study in a variety of settings, including the community or hospital levels. Although some other variables such as social class, frequency of health service utilization19and parity62 were reported to be the confounders of obesity, their peers were used in the adjustment analysis to avoid multi-co-linearity when measuring HRQOL. Age was used in adjustment, instead of parity; co-morbidity instead of frequency of health service utilization and education level instead of social class. However, some psychosocial determinants that might have a strong effect on HRQOL such as, type of personality, smoking, alcohol drinking, was not con-trolled in the analysis, since both smoking and alcohol drinking prevalence were found to be very low in this study: Less than 0.1 % of women were regular alcohol drinkers, while 27.2% were introduced to smoking, but their lifelong exposure to tobacco was of median value, 3.5 package/years and may be considered as negligible. Therefore, not adjusting for the above variables might not affect the relationship between obesity and HRQOL.
Body Mass Index Classification (kg/m2) Domain Total
Sample (N =1602 )
18.5 to <25 (N=573 )
(a)
25 to <30 (N =517 )
(b)
30 to <35 (N =313 )
(c)
35 to 40 (N =144)
(d)
> 40 (N =55)
(e)
P *
P **
Physical 15.08 (2.33)
15.33(2.30) 15.19 (2.24) 14.75(2.22) 14.60(2.79) 14.60(2.46) < 0.001 < 0.001
Psychological 13.65 (2.47)
13.93(2.46) 13.66 (2.48) 13.45(2.49) 13.39(2.21) 12.50(2.57) < 0.001 < 0.001
Social Relationship
14.87 (2.45)
15.06 (2.56) 14.82 (2.48) 14.89(2.18) 14.59(2.42) 14.01 (2.41) 0.016 < 0.001
Environmental 13.52 (2.20)
13.56(2.27) 13.58(2.16) 13.45(2.13) 13.52(2.12) 12.81 (2.51) 0.158 < 0.001
*P value is overall comparison of mean unadjusted domain scores among BMI classifications by ANOVA - Post hoc comparisons (Tukey’s HSD test): For Physical domain: a >(b=c)> (d=e), For Psychological domain: (a=b=c=d) > e, For Social Relationship domain: a=b=c >d= e ** P value is overall comparison of adjusted mean domain scores among BMI classifications by ANOVA. The domain scores were adjusted by age, level of education and presence of any chronic condition. Age was used as a continuous variable, while education as categorical and presence of chronic condition as a dichotomous variable. Post hoc comparisons (Tukey’s HSD test): For Physical domain: a >b >(c =d=e) For Psychological domain: a>b>(c=d) > e, For Social Relationship domain: a >b >(c =d= e), For Environmental domain: a <b < (c =d= e)
Table 2. Mean (SD) WHOQOL-BREF Domain Scores by Body Mass Index

512 Obesity and health related quality of life in Turkish women
Aigner et al., suggested the adjustment of HRQOL scores for the influence of depressive symtoms.64 In our study, QOL scores were adjusted by age, level of edu-cation and self reported co-morbid illness including dia-gnosed "depression". Neither physical non-specific com-plaints nor depressive complaints (symptoms) of the pa-tients were elicited from the patients thus the QOL scores were not adjusted by either of these factors. If the QOL scores had been adjusted for these variables then we may have lost the identity of obesity which can be regarded as a kind of syndrome-like clinical condition that may comprise physical, psychological and social components. Further evidence of the casuality between obesity and HRQOL was seen in the dose response relationships between obesity and HRQOL, which was clearly demon-strated in our study. One of the findings of this study that needs some ex-planation is the positive relationship between adjusted environmental domain score and BMI. In other words, the more obese the women, the better environmental qua-lity of life score they have. Unadjusted score comparisons revealed no association between BMI and Environmental domain score. This is an expected result since the Envi-ronmental domain score of WHOQOL did not show ade-quate discriminative activities, opportunities for acqui-ring new information and skills, and participation in and opportunities for recreation and transport.44 These items can be regarded as proxy socioeconomic variables. Evi-dence for this decision is that the environmental domain reveals the highest correlation coefficient, (r=0.28) with the conventional socioeconomic variables such as educa-tion and social class, compared to the other three domains of WHOQOL. As such, the environmental domain itself, might act as a socioeconomic composite index, and so we might not need to adjust it by any of the socioeconomic variables. When we adjust environmental domain scores for socioeconomic variables such as age and education, the contribution of some of the proxy socioeconomic items of this domain might decrease on total domain score, increasing the impact of some individual items to the total domain score such as physical security and safety and leisure activities. These two items for instance may be better perceived in lower socio-economic groups that higher SES groups.
A few limitations are present in this study. The data of co-morbid illness were collected in a dichotomous (yes – no) fashion. However, the lack of assessment of the severity of co-morbid illnesses may be regarded as a li-mitation. In addition, it would be useful to record the du-ration of illness which might seriously affect HRQOL. The main reason for these limitations are based on the fact that, it would not be possible to obtain reliable co-morbidity related information in such a low educated sample (75% have less that 6 years of education). Ano-ther limitation is the lack of data regarding the duration of obesity or whether the subject had ever attempted to lose weight. Such data could be useful in examining the association between BMI and health-related quality of life. In conclusion, the body weight alone was shown to have a negative impact on HRQOL, indicating that obe-sity not only elevated the risk of morbidity and mortality, but also affected the perceived health and life quality of the subject negatively. According to the results of the study, socioeconomic status, co-morbid illnesses and body weight should also be controlled in studies exami-ning HRQOL. References 1. Seidell JC, Verschuren WM, Kromhout D. Prevalence and
trends of obesity in The Netherlands 1987-1991. Int J Obes Relat Metab Disord 1995; 19 (12): 924-7.
2. Mamalakis G, Kafatos A. Prevalence of obesity in Greece. Int J Obes Relat Metab Disord 1996; 20 (5): 488-92.
3. Gutierrez-Fisac JL, Banegas Banegas JR, Artalejo FR, Regidor E. Increasing prevalence of overweight and obesity among Spanish adults, 1987-1997. Int J Obes Relat Metab Disord 2000; 24 (12): 1677-82.
4. Hardy R, Wadsworth M, Kuh D. The influence of child-hood weight and socioeconomic status on change in adult body mass index in a British national birth cohort. Int J Obes Relat Metab Disord 2000; 24 (6): 725-34.
5. Martinez-Ros MT, Tormo MJ, Navarro C, Chirlaque MD, Perez-Flores D. Extremely high prevalence of overweight and obesity in Murcia, a Mediterranean region in south-east Spain. Int J Obes Relat Metab Disord 2001; 25(9):1372-80.
6. Kaluski DN, Chinich A, Leventhal A, Ifrah A, Cohen-Mannheim I, Merom D, Green MS. Overweight, stature, and socioeconomic status among women--cause or effect: Israel National Women's Health Interview Survey, 1998. J Gend Specif Med 2001; 4 (4): 18-24.
Body Mass Index Classification (kg/m2) WHOQOL-BREF Domain (n) ‡ 18.5 to <25 † 25 to <30 30 to <35 35 to 40 > 40 Physical ( 356 vs 331) 1.00 4.30
(2.80-6.59) § 12.11
(7.17-20.44) 16.08
(7.87-32.87) 32.64
(7.47-142.59) Psychological (298 vs 342) 1.00 3.25
(2.08-5.08) 11.51
(6.68-19.83) 19.62
(8.96-42.93) 29.34
(8.48-101.51) Social Relat. ( 493 vs 330) 1.00 3.63
(2.49-5.29) 9.00
(5.53-14.63) 11.36
(5.72-22.54) 24.30
(5.65-104.36) Environmental(331 vs 364) 1.00 0.25
(0.16-0.38) 0.09
(0.05-0.15) 0.07
(0.03-0.14) 0.07
(0.02-0.23) * The values were generated from the adjusted score distributions. The domain scores were adjusted by age, level of education and presence of any chronic condition.; † Reference category , BMI= 18.5 to <25; ‡ number of subjects with QOL values lower than –1SD - number of subjects with QOLvalues higher than +1SD; § 95% Confidence Interval
Table 3. Estimated risks (Odds Ratios) of having quality of life scores lower than –1 standard deviation value, compared to having a value higher than +1 standard deviation value for each of the BMI classification with reference to normal BMI category*

G Dinç, E Eser, G Saatli, Ü Atman Cihan, A Oral, H Baydur and C Özcan 513
7. Liese AD, Doring A, Hense HW, Keil U. Five year changes in waist circumference, body mass index and obesity in Augsburg, Germany. Eur J Nutr 2001; 40 (6): 282-8.
8. Rodriguez Artalejo F, Lopez Garcia E, Gutierrez-Fisac JL, Banegas Banegas JR, Lafuente Urdinguio PJ, Dominguez Rojas V. Changes in the prevalence of overweight and obesity and their risk factors in Spain, 1987-1997. Prev Med 2002; 34 (1): 72-81.
9. Lipowicz A, Gronkiewicz S, Malina RM. Body mass index, overweight and obesity in married and never married men and women in Poland. Am J Human Biol 2002; 14 (4): 468-75.
10. Sibai AM, Hwalla N, Adra N, Rahal B. Prevalence and Covariates of Obesity in Lebanon: Findings from the First Epidemiological Study. Obesity Research 2003; 11 (11): 1353-1361.
11. Belahsen R, Mziwira M, Fertat F. Anthropometry of women of childbearing age in Morocco: body composition and prevalence of overweight and obesity. Public Health Nutr 2004; 7 (4): 523-30.
12. Must A, Spadano J, Koakley EH, Field AE, Colditz G, Dietz WH. The disease burden associated with overweight and obesity. JAMA 1999; 282 (16): 1523-9.
13. Allison DB, Fontaine KR, Manson JE, Stevens J, VanItallie TB. Annual deaths attributable to obesity in the United States. JAMA 1999; 282 (16): 1530-8.
14. Solomon CG, Manson JE. Obesity and mortality: a review of the epidemiologic data. Am J Clin Nutr 1997; 66 (4 Suppl): 1044-1050.
15. Sullivan M, Karlsson J, Sjöström L, Backman L, Bengtsson C, Bouchard C, Dahlgren S, Jonsson E, Larsson B, Lindstedt S, Näslund I, Olbe L, Wedel H. Swedish obese subjects (SOS)--an intervention study of obesity. Baseline evaluation of health and psychosocial functioning in the first 1743 subjects examined. Int J Obes Relat Metab Disord 1993; 17 (9): 503-12.
16. Kolotkin RL, Head S, Hamilton M, Tse CK. Assessing Impact of Weight on Quality of Life. Obes Res 1995; 3 (1): 49-56.
17. Fontaine KR, Cheskin LJ, Barofsky I. Health-related quality of life in obese persons seeking treatment. J Fam Pract 1996; 43 (3): 265-70.
18. Fontaine KR, Barofsky I, Andersen RE, Bartlett SJ, Wiersema L, Cheskin LJ, Franckowiak SC. Impact of weight loss on health-related quality of life. Qual Life Res 1999; 8 (3): 275-7.
19. Doll HA, Petersen SEK, Stewaed-Brown SL. Obesity and physical and emotional well-being: Associations between body mass index, chronic illness, and the physical and mental components of the SF-36 Questionnaire. Obes Res 2000; 8 (2): 160-170.
20. Finkelstein MM.Body mass index and quality of life in a survey of primary care patients. J Fam Pract 2000; 49 (8): 734-7.
21. Kolotkin RL, Crosby RD, Williams GR, Hartley GG, Nicol S. The relationship between health-related quality of life and weight loss. Obes Res 2001; 9 (9): 564-71.
22. Fontaine KR, Barofsky I. Obesity and health-related quality of life. Obes Rev 2001; 2 (3): 173-82.
23. Larsson U, Karlsson J, Sullivan M. Impact of overweight and obesity on health-related quality of life--a Swedish population study. Int J Obes Relat Metab Disord 2002; 26 (3): 417-24.
24. Hulens M, Vansant G, Claessens AL, Lysens R, Muls E, Rzewnicki R.Health-related quality of life in physically active and sedentary obese women. Am J Human Biol 2002; 14 (6): 777-85.
25. Damush TM, Stump TE, Clark DO. Body-mass index and 4-year change in health-related quality of life. J Aging Health 2002; 14 (2): 195-210.
26. Kolotkin RL, Crosby RD, Williams GR. Health-related quality of life varies among obese subgroups. Obes Res 2002; 10 (8): 748-56.
27. Yancy WS Jr, Olsen MK, Westman EC, Bosworth HB, Edelman D. Relationship between obesity and health-related quality of life in men. Obes Res 2002; 10 (10): 1057-64.
28. Marchesini G, Bellini M, Natale S, Belsito C, Isacco S, Nuccitelli C, Pasqui F, Baraldi L, Forlani G, Melchionda N. Psychiatric distress and health-related quality of life in obesity. Diabetes Nutr Metab 2003; 16 (3): 145-54.
29. Lopez-Garcia E, Banegas Banegas JR, Gutierrez-Fisac JL, Perez-Regadera AG, Ganan LD, Rodriguez-Artalejo F. Relation between body weight and health-related quality of life among the elderly in Spain. Int J Obes Relat Metab Disord 2003; 27 (6): 701-9.
30. Fontaine KR, Bartlett SJ, Barofsky I. Health-related quality of life among obese persons seeking and not currently seeking treatment. Int J Eat Disord. 2000; 27(1): 101-5.
31. Han TS, Tijhuis MAR, Lean ME, Seidell JC. Quality of life in relation to overweight and body fat distribution. Am J Public Health 1998; 88 (12): 1814-20.
32. Fine JT, Colditz GA, Coakley EH, Moseley G, Manson JE, Willett WC, Kawachi I. A prospective study of weight change and health related quality of life in women. JAMA 1999; 282 (22): 2136-42.
33. Coakley EH, Kawachi I, Manson JE, Speizer FE, Willet WC, Colditz GA. Lower levels of phsical functioning are associated with higher body weight among middle-aged and older women. Int J Obes Relat Metab Disord 1998; 22 (10): 958-65.
34. Hassan MK, Joshi AV, Madhavan SS, Amonkar MM. Obesity and health-related quality of life: a cross-sectional analysis of the US population. Int J Obes Relat Metab Disord 2003; 27 (10): 1227-32.
35. Groess EJ, Kaplan RM, Barrett-Connor E, Ganiats TG. Body mass index and quality of well-being in a community of older adults. Am J Prev Med 2004; 26(2): 126-9.
36. Fontaine KR, Barofsky I, Bartlett SJ, Franckowiak SC, Andersen RE. Weight loss and health-related quality of life: results at 1-year follow-up. Eat Behav 2004;5 (1):85-8.
37. WHO. The World Health Report 2002. http://www. who. int/whr/2002/en/index.html
38. Mapi Research Institute. The Patient-Reported Outcome and Quality of Life Instruments Database (PROQOLID). http://www.proqolid.org/
39. Carr AJ, Higginson IJ. Are quality of life measures patient centred? BMJ 2001; 322 (7298): 1357-60.
40. The WHOQOL Group. Development of the World Health Organization WHOQOL-BREF quality of life assessment. Psychol Med. 1998; 28 (3): 551-8.
41. The WHOQOL Group. The World Health Organization quality of life assessment (WHOQOL): Development and general psychometric properties. Soc Sci Med 1998; 46 (12): 1569-1585.
42. Bennet S, Woods TA. Simplified General Method for Cluster-Sample Surveys of Health in Developing Countries. Rapp Trimest Statist Sanit Mond. 1991; 44: 98-106.
514 Obesity and health related quality of life in Turkish women
43. World Health Organization. Obesity: Preventing and Managing the Global Epidemic. Geneva: World Health Organization Publication WHO/NUT/NCD/98.1, 1997.
44. Eser E, Fidaner H, Fidaner C, Eser SY, Elbi H, Göker E. Psychometric properties of the WHOQOL-100 and WHOQOL-BREF. Journal of Psychiatry, Psychology and Psychopharmacology (Turkey) 1999; 7 (2): 23-40.
45. Onal AE, Erbil S, Ozel S, Aciksari K, Tumerdem Y. The prevalence of and risk factors for hypertension in adults living in Istanbul. Blood Press 2004; 13 (1): 31-6.
46. Tezcan S, Altintas H, Sonmez R, Akinci A, Dogan B, Cakir B, Bilgin Y, Klor HU, Razum O. Cardiovascular risk factor levels in a lower middle-class community in Ankara, Turkey. Trop Med Int Health. 2003; 8 (7): 660-7.
47. Erem C, Arslan C, Hacihasanoglu A, Deger O, Topbas M, Ukinc K, Ersoz HO, Telatar M. Prevalence of obesity and associated risk factors in a Turkish population (trabzon city, Turkey). Obes Res. 2004; 12 (7): 1117-27.
48. Stam-Moraga MC, Kolanowski J, Dramaix M, De Backer G, Kornitzer MD. Sociodemographic and nutritional deter-minants of obesity in Belgium. Int J Obes Relat Metab Disord 1999; 23 (1):1-9.
49. Aranceta J, Perez Rodrigo C, Serra Majem L, Ribas L, Quiles Izquierdo J, Vioque J, Foz M. Prevalence of obesity in Spain: the SEEDO'97 study. Spanish Collaborative Group for the Study of Obesity. Med Clin (Barc) 1998; 111 (12): 441-5.
50. Martinez JA, Kearney JM, Kafatos A, Paquet S, Martinez-Gonzalez MA Variables independently associated with self-reported obesity in the European Union. Public Health Nutr 1999; 2 (1A): 125-33.
51. Katz DA, McHorney CA, Atkinson RI. Impact of obesity on health related quality of life in patients with chronic illness. J Gen Intern Med 2000; 15 (11): 789-96.
52. Engel SG, Crosby RD, Kolotkin RL, Hartley GG, Williams GR, Wonderlich SA, Mitchell JE. Impact of weight loss and regain on quality of life: mirror image or differential effect? Obes Res 2003; 11 (10): 1207-13.
53. Kolotkin RL, Crosby RD, Kosloski K, Williams GR. Development of a brief measure to assess quality of life in obesity. Obes Res 2001; 9 (2): 102–11.
54. Karlsson J, Sjostrom L, Sullivan M. Swedish obese sub-jects (SOS) - an intervention study of obesity. Two-year follow-up of health-related quality of life (HRQL) and eating behavior after gastric surgery for severe obesity. Int J Obes Relat Metab Disord 1998; 22 (2): 113-26.
55. Choban PS, Onyejekwe J, Burge JC, Flancbaum L. A health status assessment of the impact of weight loss following Roux-en-Y gastric bypass for clinically severe obesity. J Am Coll Surg 1999; 188 (5): 491–7.
56. White MA, O'Neil PM, Kolotkin RL, Byrne TK. Gender, race, and obesity-related quality of life at extreme levels of obesity. Obes Res 2004; 12 (6): 949-55.
57. Carpenter KM, Hasin DS, Allison DB, Faith MS. Rela-tionships between obesity and DSM-IV major depressive disorder, suicide ideation, and suicide attempts: results from a general population study. Am J Public Health. 2000; 90 (2): 251–7.
58. Fontaine KR, Barofsky I, Cheskin IJ. Predictors of quality of life for obese persons. J Nerv Ment Dis 1997; 185 (2): 120-2.
59. Palinkas LA, Wingard DL, Barrett-Connor E. Deppressive symptoms in overweight and obese older adults: a test of the “jolly fat” hypothesis. J Psychosomat Res 1996; 40 (1): 59-66.
60. Le Pen C, Levy E, Loos F, Banzet MN, Basdevant A. “Specific” scale compared with “generic” scale: a double measurement of the quality of life in a French community sample of obese subjects. J Epidemiol Community Health 1998; 52 (7): 445-50.
61. Aranceta J, Perez-Rodrigo C, Serra-Majem L, Ribas L, Quiles-Izquierdo J, Vioque J, Foz M; Spanish Colla-borative Group for the Study of Obesity. Influence of sociodemographic factors in the prevalence of obesity in Spain. The SEEDO'97 Study. Eur J Clin Nutr 2001; 55(6): 430-5.
62. Rissanen AM, Heliovaara M, Knekt P, Reunanen A, Aromaa A. Determinants of weight gain and overweight in adult Finns. Eur J Clin Nutr 1991; 45 (9): 419-30.
63. Gutierrez-Fisac J, Regitor E, Rodriguez C. Trends in obesity differences by educational level in Spain. J Clin Epidemiol 1996; 49 (3): 351-4.
64. Aigner M, Forster-Streffleur S, Prause W, Freidl M, Weiss M, Bach M. What does the WHOQOL-Bref measure? Measurement overlap between quality of life and de-pressive symptomatology in chronic somatoform pain dis-order. Soc Psychiatry Psychiatr Epidemiol. 2006; 41 (1): 81-6.

G Dinç, E Eser, G Saatli, Ü Atman Cihan, A Oral, H Baydur and C Özcan 515
Original Article The relationship between obesity and health related quality of life of women in a Turkish city with a high prevalence of obesity Gönül Dinç MD, Erhan Eser MD, Gül Saatli MSc, Ümit Atman Cihan MD,
Ahmet Oral MD, Hakan Baydur MSc and Cemil Özcan MD, PhD
Celal Bayar University, Faculty of Medicine, Department of Public Health, Manisa, Turkey
土耳其高肥胖盛行率城市土耳其高肥胖盛行率城市土耳其高肥胖盛行率城市土耳其高肥胖盛行率城市婦女婦女婦女婦女肥胖與健康相關生活品質肥胖與健康相關生活品質肥胖與健康相關生活品質肥胖與健康相關生活品質之之之之相關相關相關相關
本研究的目的為呈現一有代表性的育齡但非懷孕婦女樣本,其體重與HRQOL
之間的相關性。這個橫斷性研究的數據來自於:2000年在Manisa城市進行的Ma
nisa人口統計及健康調查(MDHS)。MDHS的研究族群為1602名育齡(15-49歲)
的婦女組成的代表性樣本。世界衛生組織的生活品質問卷精簡版本(WHOQOL-
BREF)由四個構面所構成(生理、心理、社會相關因子以及環境),用來評估HR
QOL。每一個構面的計分從0分(差的HRQOL)到20分(佳的HRQOL)之間。這些婦女的平均年齡為35.29±8.19歲。其中有35.8%的女性體重正常 (BMI 18.5-
24.9)、32.3%過重 (BMI 25.0-29.9)、31.9%中度肥胖 及3.4% 為病態肥胖。
在校正年齡、教育程度及合併疾病後,除了環境構面外,身體質量指數較高者比起體重正常者,皆有顯著較低的HRQOL分數。我們的結果指出僅體重一項即對HROQL有負面的影響。換言之,肥胖不只增加罹病及死亡的危險,同時對自覺健康及生活品質也有負面的影響。總而言之,除了年齡、社經狀況及合併疾病之外,在討論HRQOL時也應該控制體重這個變項。
關鍵字:健康相關生活品質、肥胖、女性、WHOQOL、ㄧ般健康相關品質、土耳其。

516 Asia Pac J Clin Nutr 2006;15 (4): 516-520
Original Article Obesity among university students, Tehran, Iran Marzieh Nojomi MD, MPH and Shahandokht Najamabadi MSc
Department of Community Medicine, School of Medicine . Iran University of Medical Sciences
Evaluating the nutritional status of individuals and population groups is an important tool in public health and a feasible indicator of standards of living. The objective of this study was to determine the frequency of obesity and present nutritional status of university students of Iran University of Medical Sciences in Tehran. The survey was conducted between Oct 2004 and June 2005. The statistical population included all students from School of medicine, nursing and midwifery, health services, management, science, and rehabilitation. The method of sampling was multistage random. The sample size for the survey was 1150 students. We used a self-administered 24h food recall questionnaire. We categorized BMI to two groups in bivariate analysis (BMI ≥ 25 kg m-2 as obese and less than 25 kg m-2 as non-obese). Mean BMI for all subjects was 21.7 ± 2.9 kg m-2. Almost 88% of the subjects were classified into a non-obese group (BMI <25 kg m-2). About 10% were underweight and 12.4% of the students had a BMI more than 25 kg m-2. A significant difference was observed for BMI between males and females; 7.9% of males versus 22.5% of females had BMIs over 25. About 18% of students aged 23 years and over had BMIs over 25 versus 7.7% of students aged under 18. Intakes of fiber, pre-vitamin A, folacin and iron were significantly different between BMI groups. Intakes of these nutrients were higher in the obese students than the students with BMIs less than 25 kg m-2. Our results indicate that about 12.4% of the students had a BMI more than 25 kg m-2. There was a significant association between BMI, and smoking habits, age, sex, place of resident and having specific dietary regimen.
Key Words: obesity , BMI, University students, nutrients intakes, Iran Introduction Nutrition is an important factor in health and disease. High risk groups in most populations are known to be children, pregnant women, infants and breast feeding mothers. These groups are the first priority in many public health programs. However, the role of nutrition in young adults is under less consideration. Evaluating the nutritional status of individuals and population groups is a vital tool in public health initiatives and a feasible indicator of stan-dards of living.1 An unvaried diet with macronutrient excess and inadequate micronutrient density is closely related to a higher prevalence of overweight, obesity, car-diovascular illness and cancer 2. A nutritious diet, espe-cially in young adulthood can affect health status in later life. A divergance between energy intake and total energy expenditure can lead to either over or underweight.3 Malnutrition is frequently diagnosed in adults by means of anthropometric variables, such as body weight, height or body composition. Height is a useful indicator of chronic malnutrition in developing countries.4 However, body weight, as an indicator of nutritional status, reveals more accurately short-term effects and alterations in body com-position. Thus, establishing a range of body mass indices (BMI) in order to diagnose malnutrition is important when analysing the prevalence of malnutrition in a certain popu-lation.5 In Iran, such as other developing countries, studies on nutritional status have mainly focused on the most vul-nerable population groups (e.g elderly, children). The uni-versity population was of particular interest because it
was a convenient sample for the study of the health of a sub-group of young adults. Students usually have un-desirable food habits which could result in a different frequency of obesity and malnutrition when compared with the average young adult Iranian. The object of the present study was to determine the frequency of obesity and current nutritional status of university students of Iran University of Medical Sciences in Tehran . Methods and Materials The survey was conducted between Oct 2004 and June 2005 at Iran University of Medical Sciences located in Tehran, Iran. The statistical population included all students from several schools i.e School of Medicine, Nursing and Mid-wifery, Health Services management, Science and Reha-bilitation. The method of sampling was multistage random. Iran university of Medical Sciences (IUMS) is a government university with six schools, all of which were included in the study. The sample size for the survey was 1150 students . The total number of students sampled from each school was based on the proportion of students in each school out of the total number of students. For example, there were Correspondence address: Dr Nojomi, Marzieh. Community Medicine Specialist. Fellowship of Clinical Epidemiology. Department of Community Medicine . School of Medicine . Iran University of Medical Sciences . Tel : +98 21 88602225; Fax : +98 21 88602217 Email : [email protected] or [email protected] Accepted 22 February 2006

M Nojomi and S Najamabadi 517
250 students from the school of medicine, 200 from nursing and midwifery, 200 from the school of health services, 150 from the school of management, 150 from the school of science and 200 from the school of rehabilitation. Students were excluded from the survey if they refused to participate and if they handed in in- complete questionnaires. A total of 1000 questionnaires from 1150 were selected for final analysis. The response rate was 86%.
A self-administered 24 hour food recall questionnaire was used as a method of data collection. The students completed questionnaires in the presence of a member of the research team. It consisted of two parts. The first section of the questionnaire included the items related to personality characteristics (age, sex , self reported height and weight to the nearest kg and cm, respectively, most permanent place of residence, participation in sport, supplement use, smoking habits, history of chronic dis-eases, having specific dietary regimen). Place of resi-dence was divided into two categories: home and dorm. Supplement use, history of chronic diseases, and smoking habits were divided into two categories: “ yes” and “no”. For smoking habits, “yes” was defined as current smoker. Supplement use was defined as, consumption of vitamin, or mineral, or a combination, and or body building supplements. Using one of these once or more per week was categorized as “yes”, and the others as “no”. Only 5 students were recorded to be using body building supple-
ments, and were excluded in the final analyses. There were 3 pregnant students who were also excluded from analysis. The participation in sports was assessed by the monthly frequency of sports club activity, without in-quiring into the types of sports, their intensity or duration. The subjects who engaged in sports club activities at least once per week in the previous month were defined as "high physical activity", those with once per month, as "low physical activity", and the others as "sedentary". Subjects who were on long-term medications for their disorders, were defined as having a history of chronic diseases such as diabetes, heart and renal diseases. Some students were on vegetarian diets, or on weight loss diets, or some other special diet. These students were cate-gorized as "specific regimen", and the others as "not having specific regimens". We calculated the body mass index (BMI) and classi-fied it into five categories according to the BMI classi-fication of NIH (National Institutes of Health): 1) underweight <18.5 kgm-2; 2) normal 19-24.9 kgm-2; 3) overweight 25-29.9 kgm-2; 4) obese 30-39.9 kgm-2 and 5) extreme obesity +40 kgm-2.6 There were no students in the fifth group. We categorized BMIs into two groups for the bivariate analysis: BMI ≥ 25 kg m-2 as "obese" and less than 25 kg m-2 as "non-obese". The second part of the questionnaire included 24 hours of recall of foods based on a sample 24-Hour recall Form.7 The 24-hour recall method requires individuals to remember the specific foods and amounts of foods they consumed in the past 24 hours. Energy, protein, fat, carbohydrate, vitamin and mineral intakes were calculated using the locally developed Dorosty Food Processor (DFP) software. This software is based on Iranian food habits and used for the assessment of macronutrient and micronutrient intakes by 24-hour recall food question-naire. For the purpose of statistical analysis we used SPSS (version 13, SPSS Inc., Chicago, Illinois). Frequency, mean, and standard deviation (SD) were calculated. T-test and Mann-whitney U-test were used to compare means and mean ranks of nutritional intakes between dichotomous variables. ANOVA was used to test categorical variables. Chi-square examined the relation-ship between general characteristics. The statistical sig-nificance was considered at P≤ 0.05. Results The characteristics of the subjects are shown in Table 1. Mean BMI was 21.7 ± 2.9 kg m-2 . Almost 88% of the subjects were classified into a non-obese group (BMI <25 kg m-2). About 10% were underweight of which the majority were male (69.3%). Regarding smoking habits, most of the subjects (94.4%) were current non-smokers. The frequency of moderate participation in sports (at least once per month engaged in sports club activity) was 68.9%. About 27% of students reported that they used supplements (multivitamins) at least once or more per week. Males were found to be significantly taller and heavier than females (175 ± 0.42 cm versus 161.9 ± 0.21 cm) (P = 0.000). The correlation coefficient between weight and height displayed low values for both sexes and was statistically significant in the both (P = 0.000). The
Age( years) 22.3 ± 3.5 Body weight (kg) 60.4 ± 11.1 Body height (cm) 166.7 ± 8.9 BMI(kgm-2) 21.7 ± 2.9 <18.5(%) 10.3 19-24.9(%) 77.3 25-29.9(%) 10.8 30-39.9(%) 1.6 +40 (%) 0 Smoking habits (%) Yes 5.6 No 94.4 Supplement use (%)* Yes 26.6 No 73.4 Place of residence (%) Home 53.3 Dorm 46.7 Sex (%) Male 69.3 Female 30.7 Disease history (%)* Yes 3.4 No 96.6 Having specific regimen (%)* Yes 10.4 No 89.6 Sports activity (%)* Sedentary 23.7 Moderate 68.9 High 7.4
* Definition is in the methods and materials part
Table 1. Characteristics of the subjects (n = 1000). Values are expressed as mean ± standard deviation, unless specified otherwise

518 Obesity among Iranian University students
correlation value between BMI and weight were high and identical for both sexes (r = 0.80, P = 0.000). Table 2 shows BMI categories based on some demo-graphic and other measured variables. A significant diffe-rence was observed for BMI between males and females; 7.9% of males versus 22.5% of females had BMIs 25 and over (P = 0.000). A significant increasing trend from lowest to highest age groups was observed for BMIs 25 and over. About 18% of students aged 23 years and older had BMIs 25 and over, versus 7.7% for stuents aged under 18. As for sporting activity, the proportion of the physically active group increased with increasing BMI (non significant). Between smokers, 35.7% had a BMI 25 and over versus 11% of nonsmokers (P=0.000). Students who were living with family were more obese than dorm’s students (slightly significant, 14.3% versus 10.3 respectively) (P = 0.057). Table 3 presents the mean energy and nutrient intakes by BMI groups. Intake of fibre, previtamin A, folacin and iron were significantly different between BMI groups. There was a higher intake of these nutrients in the obese students than the students with BMIs less than 25 kgm-2. For other nu-trients there were no significant difference BMI groups. Discussion This survey allowed the assessment of the prevalence of obesity in a sample of university students from different departments. Our results indicate that about 12.4% of the students have a BMI more than 25 kg m-2. While our findings are compatible with some other study results, it is not with others: Bellisle et al.,8 found that about 9% of university students were overweight and obese. A survey of 842 Kuwait university students by al-Isa et al.,9
reported obesity rates as high as 32% and Stefanska et al.,10 reported a prevalence of 17% in their study popu-lation. In this survey, 22.5% of females were overweight and obese. Amine et al.,11 reported 10.8% overweight and 3.6% obesity in female university students. Musaiger et al.,12 reported that out of 215 university female students, 19% were overweight and 9.8% were obese. One expla-nation for these differences in obesity prevalence between university students could be the variation in how height and weight were measured. A more important possibility could be due to the individual’s socioeconomic characte-ristics, such as race or ethnicity, education, income, cul-ture, food habits and lifestyle variables such as exercising We found that 5.6% of university students were current smokers. We observed a significant association between BMI and current smoking habits with 35.7% of smokers being obese compared with 11% of nonsmokers. One explanation for this result could be the desire of obese students to smoke due to belief that smoking has an negative effect on appetite. In this survey, a positive association was seen to exist between age and obesity. These findings show increasing trends in the BMI with a corresponding increase in age (7.7% in ≤18 to 18.1 in ≥23 year old students). This result is obvious and compatible with some other studies.7,13 There was a slight non-significant association between physical activity and BMI. The proportion of obese stu-dents increased slightly (not significant), with the increase in physical activity. This result is not compatible with other studies.11,14 One explanation for this finding could be the preference of obese students to exercise more for weight management. The other possibility is the way in
Variables
BMI < 25 kg m-2 n (%)
876 (87.6)
BMI +25 kg m-2 n (%)
124 (12.4)
Total n (%)
1000 (100.0)
P value
Sex 0.000 Male 638 (92.1) 55 (7.9) 693 (69.3) Female 238 (77.5) 69 (22.5) 307 (3.7) Age 0.000 ≤ 18 60(92.3) 5 (7.7) 65 (6.5) 19-20 243 (91.0) 24 (9.0) 267 (26.7) 21-22 266 (90.8) 27 (9.2) 293 (29.3) ≥ 23 307 (81.9) 68 (18.1) 375 (37.5) Sports activity ns Sedentary 209 (88.2) 28 (11.8) 237 (23.7) Moderate 606 (88.0) 83 (12.0) 689 (68.9) High 61 (82.4) 13 (17.6) 74 (7.4) Smoking habits 0.000 Yes 36 (64.3) 20 (35.7) 56 (5.6) No 840 (89.0) 104 (11.0) 944 (94.40 Supplement use ns Yes 236 (88.7) 30 (11.3) 266 (26.6) No 640 (87.2) 94 (12.8) 734 (73.4) Place of residence 0.057 Home 457 (85.7) 76 (14.3) 533 (53.3) Dorm 419 (89.7) 48 (10.3) 467 (46.7) Specific regimen 0.000 Yes 80 (76.9) 24 (23.1) 104 (10.4) No 796 (88.8) 100 (11.2) 896 (89.6)
Table 2. Frequency distribution of subjects’ characteristics based on BMI categories (n = 1000)

M Nojomi and S Najamabadi 519
which physical activity was categorised or the errors involved in self-assessment of physical activity. We found that 10.3% of dorm students versus 14.3% of students who lived with their family had BMIs greater than 25 kg m-2. Even though students in dorms have a regular food program, food and nutrient intakes may not be ideal. For example, home students had a higher calorie intake which may be due to the family support in feeding them foods they like and enjoy. In this survey, we showed that 23.1% of students with a specific dietary regimen (e.g vegetarian, weight loss diet) were obese versus 11.2% of students with ordinary regimens. However, the explanation could be due to the preference of obese students to have a specific diet for weight management. The current survey found that out of 1000 students, 26.6% reported past or current use of vitamin supplements. The high rate of supplement usage may be due to media reports or advertisements in some newspapers or television about provision of vitality, the retarding of aging and the reduction of the risk of chronic diseases such as osteoporosis and cancer. Intakes of folacin, iron, previtamin A, and fiber were significantly different between the two BMI groups. We could not find any reasonable interpretation for this
finding. The thinner students had a lower intake of these nutrients than the heavier students. One explanation could be the way in which BMI was classified into two groups. To understand these findings, we re-classified BMI into four groups (as mentioned in the methods), and performed the statistical analyses again. There were no significant differences between the four BMI groups and intakes of these nutrients. In conclusion, we found a moderate prevalence of obesity in this population of uni-versity students. The older students, males, smokers, students following a specific dietary regimen and students living with family were more likely to be overweight. References 1. Nube M, Asenso-Okyere WK, Van den Boom G.J.M.
Body mass index as indicator of standard of living in developing countries . Eur J Clin Nutr 1998;52:136-44 .
2. Rebato E, Rosique J, Vinagre A, Salces I, San Martin L, Susanne C. Nutritional status by socioeconomic level in a urban sample from Bilbao (Basque Country). Am J Hum Biol 2001; 13: 668-78 .
3. Herrera H, Rebato E, Arechabaleta G, Lagrange H, Salces I, Susanne C. Body mass index and energy intake in Venezuelan University students. Nutrition Research 2003; 3: 389-400.
Variables BMI < 25 kg m-2 n = 876
BMI +25 kg m-2 n = 124
P value
Calorie (Kcal) 1810 ± 646.4 1814 ± 639.0 Ns
Protein (gr) 60.5 ± 0.86 63.2 ± 2.4 ns
Carbohydrate(gr) 226.5 ± 3.3 230.5 ± 8.6 ns
Fiber (gr) 13.9 ± 0.27 15.8 ± 0.83 0.02
Fat total (gr) 76.7 ± 0.95 73.9 ± 2.4 ns
Fat saturated (gr) 26.0 ± 0.38 24.7 ± 0.93 ns
MUF* (gr) 28.9 ± 0.34 27.8 ± 0.85 ns
PUFA** (gr) 17.2 ± 0.38 16.0 ± 0.70 ns
Cholesterol (mg) 215.4 ± 6.6 216.7 ± 19.2 ns
Vit. A total (µg) 607 ± 49.0 795 ± 238.3 ns
Vit.B1 (mg) 1.2 ± 0.1 1.3 ± 0.05 ns
Pre-vitamin A(µg)† 281.6 ± 44.5 378.1 ± 232.0 0.01
Vit. B2 (mg) 1.5 ± 0.2 1.6 ± 0.09 ns
Vit. B3 (mg) 14.5 ± 0.23 15.6 ± 0.72 ns
Vit. B6 (mg) 1.1 ± 0.01 1.1 ± 0.04 ns
Vit. B12 (µg) 3.7 ± 0.26 4.2 ± 1.2 ns
Folacin (µg) 177.8 ± 3.9 198.4 ± 12.0 0.05
Pantothenic (mg) 3.9 ± 0.06 4.0 ± 0.19 ns
Vit. C (mg) 68.8 ± 3.2 78.9 ± 12.6 ns
Vit. E (mg) 6.0 ± 0.14 5.9 ± 0.33 ns
Calcium (mg) 642.7 ± 13.3 632.8 ± 30.8 ns
Copper (mg) 1.2 ± 0.03 1.3 ± 0.16 ns
Iron (mg) 12.0 ± 0.15 13.1 ± 0.46 0.01
Magnesium (mg) 210.4 ± 3.2 214.3 ± 7.8 ns
Phosphorus (mg) 936.1 ± 14.7 934.7 ± 35.1 ns
Selenium (mg) 128.5 ± 4.3 133.4 ± 6.3 ns
Potassium (mg) 1808.6 ± 34.1 1808.2 ± 88.7 ns
Zinc (mg) 9.3 ± 0.13 9.8 ± 0.36 ns
Sodium (mg) 1438.5 ± 29.8 1495.3 ± 81.5 ns * Monounsaturated fat ; ** Polyunsaturated fat; † Beta carotene
Table 3 . Intakes of energy and nutrients by BMI categories. Values are expressed as mean ± standard deviation, unless specified otherwise (n = 10000 )

520 Obesity among Iranian University students
4. Gopalan C . Heighst of population . an index of their nutrition and socio-economic development. Bull Nutr Found Ind 1987; 8:1-5.
5. Norgan NG. Body mass index and body energy stores in developing countries . Eur J Clin Nutr 1990; 44: supply 1: 79-84 .
6. National Institutes of Health/ National Heart, Lung, and Blood Institute, Clinical guidelines on the identification, evaluation, and treatment of overweight and obesity in adults: the evidence report. NIH, June 1998 .
7. Grounder M, Anderson SL, DeYoung S. foundations and Clinical Applications of Nutrition; A Nursing Approach. Second edition . Mosbey Inc. USA. 2000, 775.
8. BEllisle F, Monneuse MO, Stepoe A, Wardle J. Weight Concerns and eating patterns: a survey of university students in Europe. Int J obes Relat Metab Disord 1995; 10: 723-30.
9. Al- Isa AN. Obesity among Kuwait university students : an explorative study . J R Soc Heath 1999; 4: 223-7.
10. Stefaska E, Ostrowska L, Czapska D, Karczewski J, Goldwska E. Qualitative evaluation of the diet with normal body mass and overweight at the Medical University in Bialystok . Prezegl Lek 2033; 60 (Supp 6): 31-5.
11. Amine EK, Samy M. Obesity among female university students in the United Arab Emirates. J R Soc Health 1996; 2: 91-6.
12. Musaiger AO, Radwan HM. Social and dietary factors associated with obesity in university female students in United Arab Emirates. J R Soc Health 1995; 2: 96-99.
13. Lissau I, Overpeck MD, Ruan WJ, Due P, Holestin BE, Hediger ML; Health Behaviour in School-aged Children Obesity Working Group. Body mass index and overweight in adolescents European countries, Israel, and the United States. Arch Pediatr Adolesc Med 2004; 1: 27-33.
14. Butler SM, Black DR, Blue CI, Gretebeck RJ. Change in diet, physical activity, and body weight in female college freshman. Am J Heath Behav 2004; 1: 24-32.
Original Article Obesity among university students, Tehran, Iran Marzieh Nojomi MD, MPH and Shahandokht Najamabadi MSc Department of Community Medicine, School of Medicine . Iran University of Medical Sciences
伊朗德黑蘭大學生伊朗德黑蘭大學生伊朗德黑蘭大學生伊朗德黑蘭大學生之之之之肥胖肥胖肥胖肥胖狀況狀況狀況狀況 評估個體及族群的營養狀況是公共衛生的重要的工具,也是可行的生活條件標指標。本研究目的為評估德黑蘭伊朗大學醫學科學系的大學生肥胖的盛行率及目前的營養狀況。此調查是在 2004年 10 月到 2005年 6 月進行。統計的族群包括所有來自醫學、護理暨助產、衛生服務、管理、科學及復健等系的學生,採多步驟隨機抽樣,共 1150名學生。我們採用自填式 24小時回憶問卷。在雙變項分析中將 BMI 分成兩組(BMI≧ 25 kg/m2為肥胖組,BMI<25 kg/m2為非肥胖組)。所有學生之平均 BMI 值為 21.7±2.9 kg/m2。大約有 88%的研究對象為非肥胖(BMI>25
kg/m2)。大約有 10%的學生體重過輕,12.4%的學生 BMI 超過 25 kg/m2。男女性的 BMI 有顯著的差異;其中 BMIs 大於 25者,女性為 7.9%,男性則為 22.5%。大約有 18%年齡在 23 歲及以上的學生 BMI 大於 25,年齡在 18 歲以下則為7.7%。不同的 BMI 組別其纖維、維生素 A、葉酸及鐵的攝取有顯著的差異。肥胖的學生的這些營養素攝取量顯著較 BMI<25 kg/m2 的學生多。我們得研究結果指出約有 12.4%的學生 BMI 大於 25 kg/m2;BMI 與抽菸習慣、年齡、性別、居住地及使用特殊飲食療法有顯著相關。
關鍵字:肥胖、身體質量指數、大學生、營養素攝取、伊朗。

Asia Pac J Clin Nutr 2006;15 (4):521-527 521
Original Article Alternative anthropometric measurements for the Thai elderly: Mindex and Demiquet Prasert Assantachai MD, FRCP
1, Preyanuj Yamwong MD, MSc2 and
Somsong Lekhakula MSc3
1 Department of Preventive and Social Medicine, Faculty of Medicine, Siriraj Hospital, Mahidol University, Bangkok, Thailand. 2 Department of Research Development, Faculty of Medicine, Siriraj Hospital. 3Department of Biochemistry, Faculty of Medicine, Siriraj Hospital, Mahidol University, Bangkok, Thailand.
This cross-sectional study examined the relationship between alternative anthropometric indices and the nutritional and metabolic status of the Thai elderly. Four rural communities, each from the 4 main regions of Thailand were surveyed. A total of 2324 subjects, 60 years old and over were included in the study. Mindex and Demiquet had a very strong relationship to body mass index with the r values of 0.93 and 0.88, respectively. Fat weight had the highest correlation with body mass index in older women, r = 0.94 (P<0.001) and with Mindex, r = 0.93 (P<0.001). In regard to anthropometric measurements, the mid-arm circumference had the strongest relationship to all three Quetelet indices, r = 0.76-0.87 (P<0.001), while subscapular skinfold thickness performed best among skinfold measurements, r = 0.69-0.74 (P<0.001). BMI achieved a significantly higher degree of correlation with triceps and supra-iliac skinfold thickness, mid-arm circumference and fat weight than Demiquet (P<0.001 for all variables). The lymphocyte count was the only laboratory test that related rather well to all three Quetelet indices. All three Quetelet indices had nearly the same pattern of relationship to various nutritional parameters. The cut-off points of Mindex denoting under-nutrition, overweight and obesity I in women were 55.95, 69.55 and 75.60 kilogram/metre, respectively. At the same time, the cut-off points of Demiquet denoting under-nutrition, overweight and obesity I in men were 75.60, 93.98 and 102.16 kilogram/metre2, respectively. All this information supports the benefit of using Mindex and Demiquet as alternatives to body mass index for nutritional assessment in older Asian people, especially for the malnourished ones.
Key Words: Mindex, Demiquet, anthropometric, elders, rural, Thai Introduction Apart from nutritional assessment, there is an increasing use of anthropometric indices among older people to predict physical functions and mobility.1 According to a recommendation given by the Report of a WHO Expert Committee on the use of anthropometry in the elderly in 1995, future research should seek a better index than body mass index (BMI) which would be one in which body weight is related to some parameters other than height.2 The three main reasons for the disadvantage of BMI are, firstly, the loss of height with age due to age-related osteo-porosis, kyphoscoliosis and degenerative disc changes, secondly the inconvenience of measuring height in non-ambulant elderly patients or those who may not be able to stand erect with their eyes at right angles to the ground and, finally, an increase in the fat to lean ratio in older people.3 The COMA committee (1992) recommended that a demi-span measurement should be included in all nutri-tional surveys of older people as it declines less with age than does height.4 According to a survey in 890 men and women aged over 65 years, weight has been shown to increase proportionately with arm-span squared in men and
arm-span in women.5 Two alternative anthropometric measurements designed for older men (Demiquet = body weight divided by arm-span squared) and older women (Mindex = body weight divided by arm-span) were se-quentially developed.5
Although there were some studies indicating the use-fulness of Demiquet and Mindex in older adults,6-7 there is a paucity of population-specific reference data for older Asian people. Even the anthropometric reference data for assessing the nutrition of elderly people in Britain could not be used in Edinburgh.8 In addition, because the body mass index has been widely used, to verify the validity of these alternative measurements for older Thai adults needs the study of the relationship patterns of correlation between these two alternative measurements and the standard one, Correspondence address: Dr. Prasert Assantachai, Dept of Preventive & Social Medicine, Faculty of Medicine Siriraj Hospital, 2 Prannok Road, Bangkoknoi District, Bangkok 10700, Thailand Tel: + (662)-419-7284; Fax: +(662)-411-5034 Email: [email protected] Accepted 1 February 2006

522 P Assantachai, P Yamwong and S Lekhakula
body mass index, to other nutritional parameters speci- fically relating to older Thai people.
Although abdominal obesity is well recognized as the main risk factor of metabolic syndrome and waist circum-ference can be easily measured, the alternative Quetelet indices, if their validity is proved, can still be useful for nutritional assessment in a malnourished older adult. Materials and methods This cross-sectional study was done after it was approved by the Research Committee of Mahidol University. The whole project finished in the year 2000. One district in each of the four regions of the country was randomly selected, namely, Huay-Plu District in Nakorn Pathom Province representing the central region, Hang-Chat District in Lumpang Province representing the northern region, Muang District in Sakolnakorn Province represen-ting the northeastern region and Graburi District in Ra-nong Province representing the southern region. Approxi-mately 500 older people aged 60 years old and over in each region were randomly recruited, leading to a total number of 2336 subjects. Twelve subjects were excluded due to an inability to stand erect, resulting in a total number of 2324 subjects. However, because the survey was done separately in each region, and was subject to the availability of human resources and laboratory services, the number of each laboratory tests varied. After back-ground characteristics were assessed, the subjects under-went anthropometric measurements and body composi-tion analysis as well as blood tests to measure bioche-mical data and various vitamin levels, namely, vitamin A, beta-carotene, thiamin, cyanocobalamin, folic acid, ascor-bic acid and α-tocopherol. Weight was measured to the nearest 0.1 kilogram in the morning before breakfast, with the subject clothed only in light clothes. Calibrated balancing scales placed on firm ground were used. Standing height was measured to the nearest 0.1 cm. with the examinee wearing no shoes, standing straight on a horizontal surface with the heels together, the shoulders relaxed, arms at the sides and the head in the Frankfort horizontal plane. The height scale was attached to the weighing scale so the subject would have weight and height measured at the same time. To measure demi-span, the examinee stood against a flat wall, with the arms extended laterally and kept at shoulder height during the measurement. A standard measuring tape approved by the Ministry of Commerce, number: 11596-25 at least 2 metres long, was used. The starting point was at the center of the suprasternal notch stretching laterally and ending at the metacarpophalangeal joint between the third and fourth fingers. The reading was recorded to the nearest 0.1 cm. Sequentially, Demi-quet and Mindex could be calculated as follows:5
Demiquet (for older men) = body weight (kilogram)/ demi-span (metre)2 Mindex (for older women) = body weight (kilogram)/ demi-span(metre)
The circumference of the upper arm (mid-arm circum-ference) was measured at its mid-point, located after bending the right elbow at a 90o angle and placing the forearm palm down across the trunk. By placing a
measuring tape between the tip of the acromion process and the tip of the olecranon process, the mid-point of the upper arm could be identified. The right arm was then extended alongside the body, with the palm facing up-wards. At this mid-point the tape was pulled snug around the arm without compressing the tissue. The circum-ference was recorded to the nearest 0.1 cm. Mid-arm muscle circumference (MAMC) has been used widely as a simple measure of lean body mass using the formula: MAMC = mid-arm circumference - ( π x triceps skinfold) Subcutaneous skinfold thickness was determined at four sites, namely, the triceps, biceps, subscapular and supra-iliac skinfold. A trained nutritional nurse who was skilled in using the Hapenden skinfold caliper did all these measurements throughout the study to avoid any inter-observer bias. The Hapenden skinfold caliper was calibrated before being used in the morning; three successive measurements within 0.5 cm. of each other were required before the actual reading was recorded to the nearest 0.1 mm. Body composition was measured by the near-infrared interactance technique and computerized spec-trophotometer, Futrex-5000/XL®, approved by Human Performance Centers, USA, during the survey.9 Optical Standard and Light Shield were used for zero adjust-ment and to ensure that no external light interfered with the measurement of body fat. The measurement point was located at halfway between the antecubital fossa and the acromion at the belly of the biceps muscle. All the biochemical measurements and complete blood count were done on the day of venipuncture. Low density lipoprotein (LDL) cholesterol was calculated by Friede-wald equation if triglyceride was below 400 mg/dl.10 Whole blood and serum were kept at -20oC before the laboratory measurement of all vitamin levels which were completed within 6 weeks after the day of venipuncture. Vitamin A, beta-carotene, ascorbic acid and α-tocopherol were measured by an isocratic high performance liquid chromatography.11 Erythrocyte transketolase activity and the thiamin pyrophosphate effect (TPP) were used to identify thiamin status.12 A microbiological assay using Lactobacillus casei ATCC 7469 was used to measure the folic acid level.13 Since red cell folate reflects the tissue level of folic acid, it was also included in the analysis. The laboratory technique used in the cyanocobalamin measurement was a radioisotope dilution and coated char-coal technique.14 Serum ascorbic acid was measured by a high performance liquid chromatography.15 SPSS version 10.0 was the main statistical package for statistical analysis and the level of statistical significance was set at P value of less than 0.05. The Pearson product moment correlation coefficient was used to establish a relationship between the two measurements. A very good to excellent relationship was achieved if the correlation coefficient (r) was greater than 0.75.16 As the number of each variable studied varied, the statistical analysis of the correlation between each group of nutritional parameters and Quetelet indices was done separately according to the availability of the data. In addition, the degree of corre-lation between the Quetelet indices and the nutritional and

Alternative anthropometric index for elderly 523
metabolic status were also compared individually be-tween BMI and the alternative anthropometric indices by the MedCalc statistical program. Results The age range and mean age of overall subjects were 60-97 and 68.93 + 6.75 years old. The ratio of male to female was 885: 1439 (1:1.63). The percentages of participants from the central, northeastern, northern and southern regions were 26.1%, 25.3%, 25.5% and 23.1%, respec-tively. Around fifty-seven percent still lived with their spouses while 6.4% lived alone. Regarding the educa-tional background of the subjects, 24.6% had never been to formal school and 65.8% achieved only a primary edu-cation. Although 14.4% had a satisfactory financial status, 18.6% admitted that they had inadequate income for daily life. As far as the underlying medical conditions were con-cerned, 45.1% suffered from arthralgia, 18.2% had chro-nic hypertension and 6.4% had diabetes mellitus while up to 74.8% revealed that they had a chronic illness. As far as the gender difference was concerned, some nutritional variables were higher among the older female adults with statistical significance (P<0.001), namely, body mass index, all skinfold thickness measurements, cholesterol, triglyceride, low-density lipoprotein (LDL), fat weight and percent of body fat. The variables which were lower among the older women with statistical sig-
nificance (P<0.001) were mid-arm muscle circumference, hemoglobin, uric acid and lean weight. The ones without statistically significant differences were lymphocyte count, blood glucose, albumin, globulin and high-density lipoprotein (HDL). Of all vitamin levels, only folic acid levels in both serum and red cell, beta-carotene and α-tocopherol were significantly higher among older women (P<0.01). The 5th,50th and 95th percentiles of BMI in men were 16.1, 21.4 and 28.8 kilogram/metre2 and in women 16.2, 22.8 and 30.8 kilogram/metre2, respectively. Accordingly, the 5th,50th and 95th percentiles of Demiquet were 59.4, 88.1 and 123.6 kilogram/metre2 while they were 45.7, 69.3 and 96.8 kilogram/metre for Mindex. Both Demiquet and Mindex had an excellent relationship with BMI with the r value of 0.88 and 0.93, respectively (Table 2). Regarding the pattern of degree of correlation with various skinfold thicknesses, all three Quetelet in-dices had the same pattern, i.e., the correlation coefficient was the highest at the subscapular site while it was the lowest at the biceps site. Mid-arm circumference achieved the highest correlation with BMI in men (r = 0.85), BMI in women (r = 0.86), Demiquet (r = 0.76) and Mindex (r = 0.87). When the alternative Quetelet indices and BMI were compared in terms of their correlation with skinfold thickness, BMI achieved a higher degree of correlation than Demiquet, significantly at triceps and supra-iliac skinfold thickness and mid-arm circumference.
Male Female N mean + SD N mean + SD Body mass index (kg/m2) 644 21.54 + 3.99 1013 22.76 + 4.45 Demiquet (kg/m2) 644 86.74 + 20.22 n/a n/a Mindex (kg/m) n/a n/a 1013 68.27 + 15.48 Triceps skinfold thickness (mm) 644 9.91 + 4.81 1013 16.12 + 7.23 Biceps skinfold thickness (mm) 644 5.10 + 2.76 1013 8.43 + 5.19 Subscapular skinfold thickness (mm) 644 13.82 + 6.68 1013 16.08 + 7.95 Suprailiac skinfold thickness (mm) 644 14.07 + 9.73 1013 18.40 + 10.30 Mid-arm circumference (mm) 644 267.9 + 36.4 1013 270.8 + 40.4 Mid-arm muscle circumference (mm) 644 236.7 + 28.4 1013 220.2 + 27.0 Hemoglobin (gm/dl) 403 14.49 + 1.82 597 13.04 + 1.66 Lymphocyte count 403 2845.7 + 1046.2 597 2993.5 + 1082.8 Blood glucose (mg/dl) 729 103.7 + 38.1 1177 105.7 + 42.4 Cholesterol (mg/dl) 729 221.1 + 54.4 1177 240.7 + 52.0 Triglyceride (mg/dl) 729 168.4 + 86.1 1177 184.7 + 94.6 High-density lipoprotein (mg/dl) 729 40.39 + 12.21 1177 41.15 + 13.01 Low-density lipoprotein (mg/dl) 729 147.4 + 51.0 1177 162.7 + 50.4 Albumin (gm/dl) 729 4.25 + 0.54 1177 4.27 + 0.48 Globulin (gm/dl) 729 3.53 + 0.62 1177 3.59 + 0.61 Uric acid (mg/dl) 404 6.50 + 1.65 588 5.89 + 1.65 Fat weight (kg) 813 16.01 + 6.46 1311 20.66 + 6.40 Lean weight (kg) 813 38.87 + 6.61 1311 29.99 + 5.52 Percent of body fat (%) 813 28.35 + 6.69 1311 40.12 + 5.29 Thiamin pyrophosphate effect (%) 567 12.35 + 7.93 896 11.74 + 8.19 Serum folate (ng/dl) 567 4.76 + 4.32 896 5.89 + 5.48 Red cell folate (ng/dl) 567 261.0 + 129.6 896 287.1 + 130.9 Cyanocobalamin (pg/dl) 567 673.2 + 247.9 896 689.9 + 230.5 Ascorbic acid (mg/dl) 567 1.11 + 0.53 896 1.07 + 0.54 Beta-carotene (µg/dl) 567 10.06 + 14.15 896 12.86 + 15.96 Vitamin A (µg/dl) 567 66.93 + 34.05 896 65.12 + 32.45 α – tocopherol (µg/dl) 567 549.7 + 340.0 896 604.1 + 367.2
Table 1. Characteristics of subjects recruited during each correlation study regarding anthropometry, blood tests, body composition and vitamin measurements.

524 P Assantachai, P Yamwong and S Lekhakula
Meanwhile, there was no significant difference between BMI and Mindex in this regard (Table 2). This indicated that Mindex was a better index of obesity than Demiquet. In respect to the correlations between Quetelet indices and blood chemistry and hematological results, Demiquet and Mindex had a higher degree of correlation with these parameters than BMI did. However, both of the alter-native Quetelet indices correlated to albumin and globulin in a higher degree than BMI did with statistical signi-ficance (Table 3). All variables of body composition analysis by the near infrared interactance technique revealed a very strong re-lationship with all three Quetelet indices, giving rise to the r value ranging from up to 0.94 between fat weight and BMI in older women to 0.55 between the percentage of body fat and Demiquet. In general, the highest degree of correlation was revealed between fat weight and all three Quetelet indices. The lower degree of correlation was seen between all three Quetelet indices and lean weight and percentage of body fat, respectively.
However, when the alternative Quetelet indices and BMI were compared in terms of their correlation with fat weight and percent of body fat, BMI performed sig-nificantly better than the alternative Quetelet indices (Table 4). On the other hand, Mindex achieved a signifi-cantly higher degree of correlation with lean body weight than BMI. Of all hematological measurements and blood che-mistry, the lymphocyte count related best to all three Que-telet indices with the highest correlation coefficient by Demiquet (r=0.37). Hemoglobin had the poorest rela-tionship with BMI in older men (r=0.12). Blood cho-lesterol and LDL had the best relationship with all three Quetelet indices both in men and women more than any other biochemical variables. In contrast, globulin and HDL had the poorest inverse relationship to all three Que-telet indices both in men and women. Likewise, all the vitamin levels had little or no relationship to all three Quetelet indices (r < 0.25). Most of them also had inverse relationships, especially in older women.
Table 2. The Pearson correlation coefficients of body mass index, Mindex and Demiquet with various anthropometric measurements. The comparisons of correlation coefficients of BMI and Demiquet and Mindex to other anthropometric measurements were also shown in the P value column
Male N = 644
Female N = 1013
BMI Demiquet P BMI Mindex P BMI n/a 0.88* - n/a 0.93* - Mid-arm circumference 0.85* 0.76* <0.001 0.86* 0.87* 0.372 Subscapular skinfold thickness 0.74* 0.69* 0.066 0.72* 0.74* 0.336 Mid-arm muscle circumference 0.71* 0.66* 0.091 0.69* 0.72* 0.180 Triceps skinfold thickness 0.70* 0.59* <0.001 0.71* 0.69* 0.378 Supra-iliac skinfold thickness 0.70* 0.59* <0.001 0.72* 0.73* 0.636 Biceps skinfold thickness 0.60* 0.59* 0.782 0.65* 0.65* 1.0 * P < 0.001
Table 3. The Pearson correlation coefficients of body mass index, Mindex and Demiquet with blood chemistry and hematological measurements. The comparisons of correlation coefficients of BMI and Demiquet and Mindex to blood chemistry and hematological measurements were also shown in the P value column
Male N = 403
Female N = 597
BMI Demiquet P BMI Mindex P Hemoglobin 0.12* 0.18** 0.385 0.23** 0.28** 0.357 Lymphocyte count 0.25** 0.37** 0.060 0.31** 0.35** 0.439 N = 729 N = 1177 Blood glucose 0.23** 0.27** 0.416 0.15** 0.19** 0.318 Cholesterol 0.27** 0.37** 0.034 0.27** 0.31** 0.290 Triglyceride 0.27** 0.21** 0.225 0.14** 0.15** 0.805 High-density lipoprotein -0.22** -0.23** 0.841 -0.09** -0.13** 0.327 Low-density lipoprotein 0.25** 0.37** 0.011 0.24** 0.29** 0.193 Albumin 0.27** 0.42** 0.001 0.19** 0.27** 0.041 Globulin -0.05 -0.16** 0.033 -0.10* -0.19** 0.026 Uric acid 0.18** 0.21** 0.552 0.15** 0.14* 0.805 ** P < 0.001 * P < 0.02
Table 4. The Pearson correlation coefficients of body mass index, Mindex and Demiquet with body compostion measurements. The comparisons of correlation coefficients of BMI and Demiquet and Mindex to body composition measurements were also shown in the P value column
Male N = 813
Female N = 1311
BMI Demiquet P BMI Mindex P Fat weight 0.83* 0.74* <0.001 0.94* 0.93* 0.042 Lean weight 0.65* 0.69* 0.144 0.77* 0.87* <0.001 Percent of body fat 0.68* 0.55* <0.001 0.69* 0.58* <0.001 * P < 0.001

Alternative anthropometric index for elderly 525
Discussion Mindex and Demiquet are good alternative indicators of nutritional status as they are based on the concept that the relationship between arm-span and weight remain con-stant in older adults with normal morphology, since weight has been shown to increase proportionately with arm-span squared in men and arm-span in women.5 According to the study by White et al, the changes in both Mindex and Demiquet with age are similar to those seen for BMI.17 However, due to the ethnic differences leading to different body architecture, to adopt these alternative indices for practical use during nutritional assessment in Asian older adults needs specific study done in older Asian people. Compared to BMI, the current standard method, our results revealed that both Mindex and Demi-quet had nearly the same pattern of relationship to various nutritional parameters as BMI had. In addition, both of them achieved an excellent relationship to BMI with the r value of 0.93 (P<0.001) and 0.88 (P<0.001), respectively. There was a study in Canada which also reported the same high degree of relationship, r = 0.96 and 0.81.18 In view of the poorer correlations between the alter-native Quetelet indices and skinfold thickness and fat weight compared to the correlations between BMI and skinfold thickness and fat weight, these two alternative Quetelet indices did not perform as well as BMI in terms of their correlation with obesity indices, but performed better than BMI as general nutrition and metabolic in-dices, i.e., serum albumin, serum globulin and lean body weight. Our results also agreed with those reported by White et al., which suggested that Mindex was a better index of obesity than Demiquet.17 Although waist cir-cumference is a better index of obesity than BMI,19 to measure waist circumference in older people with severe kyphoscoliosis or those who are bed-ridden might be subject to error. According to the Asia-Pacific regional guideline on using BMI, which suggests the cut-off points of < 18.5, > 23 and > 25 kg/m2 denoting under-nutrition, overweight and obesity I, respectively, for Asian people,20 we can use these cut-off points of BMI to reveal the cut-off points of Mindex and Demiquet from our population data. Because the calculation formula for BMI, Demiquet and Mindex involve body weight, such an equation can be constructed as shown below.
body weight = BMI x (height)2
= Demiquet x (demi-span)2 = Mindex x demi-span
therefore, Demiquet = (height2/demi-span2) x BMI Mindex = (height2/demi-span) x BMI
The mean value of height2/demi-span2 for men was 4.0863 while the mean value of height2/demi-span for women was 3.0241. Sequentially, the cut-off points of Mindex denoting under-nutrition, overweight and obesity I in women were 55.95 (3.0241 x 18.5), 69.55 (3.0241 x 23) and 75.60 (3.0241 x 25) kilogram/metre, respectively. At the same time, the cut-off points of Demiquet denoting under-nutrition, overweight and obesity I in men were 75.60 (4.0863 x 18.5), 93.98 (4.0863 x 23) and 102.16 (4.0863 x 25) kilogram/metre2, respectively. For the purpose of widespread use of screening tools even in a primary health care setting, the best one should be practical and reliable as well as economical. Mindex and Demiquet measurements obviously meet these re-quirements especially in those whose height can not be validly measured, as in cases of severe osteoporosis and bed-ridden status. To measure arm-span with a measuring tape is still much more convenient than to measure height or knee height, since the measuring tape is much cheaper, smaller, lighter and even easier to carry in the pocket than the cumbersome wood board to measure height and knee height. Although skinfold thickness and its derivatives, e.g mid-arm muscle circumference, are also good indica-tors, its use is certainly limited to the research area due to its poor reliability with unskilled users. In addition, the altered compressibility of subcutaneous tissue has also been noted in some older persons as well as significant di-urnal variations in skinfold thickness measurement, which may be attributed to observer error.21 BMI, Demiquet and Mindex were poorly related to various vitamin levels. These findings agreed with those found in a study in Aberdeen which showed that all three Quetelet indices were poor predictors of low micro-nutrient status.22 In conclusion, Mindex and Demiquet may be the ideal indices for older Asian people since they have the same pattern of relationship to other nutritional indices as BMI does while at the same time overcoming some significant disadvantages of BMI in the elderly. These alternative Quetelet indices perform best when they
Table 5. The Pearson correlation coefficients of body mass index, Mindex and Demiquet with various vitamin level measurements. The comparisons of correlation coefficients of BMI and Demiquet and Mindex to various vitamin levels were also shown in the P value column
Male N = 567
Female N = 896
BMI Demiquet P BMI Mindex P Thiamin pyrophosphate effect
-0.09* -0.22* 0.025 -0.10* -0.16* 0.197
Serum folate 0.11* 0.04 0.237 -0.09* -0.15* 0.198 Red cell folate 0.07 0.07 1.0 -0.04 -0.05 0.832 Cyanocobalamin -0.02 0.03 0.401 -0.004 0.02 0.612 Ascorbic acid -0.01 -0.08 0.239 -0.03 -0.05 0.672 Beta-carotene 0.01 0.06 0.400 -0.02 -0.01 0.833 Vitamin A -0.08 -0.20* 0.040 -0.10* -0.18* 0.085 α - tocopherol 0.03 -0.10* 0.029 -0.08* -0.15* 0.134 * P < 0.05
526 P Assantachai, P Yamwong and S Lekhakula
are used to screen for malnourished older people rather than the obese ones. Acknowledgement This study was supported financially by the Thai government. The authors would like to thank Professor Emmeritus Adulya Viriyavejakula, Head of the Comprehensive Survey of Older Thai People Project, Mahidol University. We also thank all medical personnel who work at Huay-Plu District Hospital, Lumpang General Hospital, Sakolnakorn General Hospital and Ranong General Hospital, and Mrs. Ratana Petchurai and her team from the Department of Research Administration, Mahidol University, for project management. Statistical analysis was supervised by Mr.Suthipol Udompunturak, Department of Research Promotion, Faculty of Medicine, Siriraj Hospital. References 1. Bannerman E, Miller MD, Daniels LA, Cobiac L, Giles
LC, Whitehead C, Andrews GR, Crotty M. Anthropometric indices predict physical function and mobility in older Australians: the Australian Longitudinal Study of Ageing. Public Health Nutr 2002; 5: 655-662.
2. WHO Expert Committee on Physical Status: the Use and Interpretation of Anthropometry. Physical status: the use and interpretation of anthropometry: report of a WHO expert committee. Geneva : WHO technical report series, 1995.
3. Wilson MG, Morley JE. The diagnosis and management of protein energy undernutrition in older persons. In: Morley JE, Miller DK. eds. Annual review of gerontology and geriatrics focus on nutrition. New York: Springer, 1995 ; 110-142.
4. COMA Committee on Medical Aspects of Food Policy. The nutritional of elderly people. Report on health and social subjects no. 43. London: HMSO, 1992.
5. Lehmann A, Bassey EJ, Morgan K, Dallosso HM. Normal values for weight, height, skeletal size and body mass indices in 890 men and women aged over 65 years. Clin Nutr 1991; 10: 18-22.
6. Murphy MC, Brooks CN, New SA, Lumbers ML. The use of the Mini-Nutritional Assessment (MNA) tool in elderly orthopaedic patients. Eur J Clin Nutr 2000; 54: 555-562.
7. Donkin AJ, Johnson AE, Morgan K, Neale RJ, Lilley JM. The interaction of physical, psychological, socioeconomic and sociodemographic variables on the body mass index (Mindex) of the community-dwelling elderly. J Nutr Health Aging 1998; 2: 143-148.
8. Bannerman E, Reilly JJ, MacLennan WJ, Kirk T, Pender F. Evaluation of validity of British anthropometric reference data for assessing nutritional state of elderly people in Edinburgh: cross sectional study. Br Med J 1997; 315: 338-341.
9. Klimis-Tavantzis D, Oulare M, Lehnhard H, Cook RA. Near infrared interactance: validity and use in estimating body composition in adolescents. Nutr Res 1992; 12: 427-439.
10. Friedewald WT, Levy RI, Fredricksen DS. Estimation of the concentration of low-density lipoprotein cholesterol in plasma, without use of the preparative ultracentrifuge. Clin Chem 1972; 18: 499-502.
11. Miller KW, Yang CS. An isocratic high-performance liquid chromatography method for the simultaneous analysis of plasma retinol, alpha-tocopherol, and various carotenoids. Anal Biochem 1985; 145:21-26.
12. Brin M. Erythrocyte transketolase in early thiamine deficiency. Ann N Y Acad Sci 1962 ;98:528-541.
13. Baker H, Herbert V, Frank O, Pasher I, Hutner SH, Wasserman LR, Sobotka H. A microbiologic method for detecting folic acid deficiency in man. Clin Chem 1959; 5: 275-280.
14. Lau KS, Gottlieb C, Wasserman LR, Herbert V. Measure-ment of serum vitamin B12 level using radioisotope dilution and coated charcoal. Blood 1965 ;26:202-214.
15. Omaye ST, Schaus EE, Kutnink MA, Hawkes WC. Measurement of vitamin C in blood components by high-performance liquid chromatography. Implication in assessing vitamin C status. Ann N Y Acad Sci 1987; 498: 389-401.
16. Colton T. Statistics in Medicine. Little : Brown, 1974. 17. White A, Nicolaas G, Foster K, Browne F, Careys S.
Health survey for England. 1991. London: HMSO, 1993. 18. Smith WD, Cunningham DA, Paterson DH, Koval JJ. Body
mass indices and skeletal size in 394 Canadians aged 55-86 years. Ann Hum Biol 1995; 22: 305-314.
19. Grievink L, Alberts JF, O'Niel J, Gerstenbluth I. Waist circumference as a measurement of obesity in the Netherlands Antilles; associations with hypertension and diabetes mellitus. Eur J Clin Nutr 2004; 58 :1159-1165.
20. International Obesity Task Force. Asia-Pacific regional obesity guidelines. Sydney: International Obesity Task Force, 1999.
21. Sjostrom L. A computer tomography based multi-compartment body composition technique and anthro-pometric prediction of lean body mass, total and sub-cutaneous adipose tissue. Int J Obesity 1991; 15: 19-30.
22. McNeill G, Vyvyan J, Peace H, McKie L, Seymour G, Hendry J, MacPherson I. Predictors of micronutrient status in men and women over 75 years old living in the commu-nity. Br J Nutr 2002; 88: 555-561.

Alternative anthropometric index for elderly 527
Original Article The study of alternative anthropometric measurements for the Thai elderly: Mindex and Demiquet Prasert Assantachai MD, FRCP
1, Preyanuj Yamwong MD, MSc2 and
Somsong Lekhakula MSc3
1 Department of Preventive and Social Medicine, Faculty of Medicine, Siriraj Hospital, Mahidol University, Bangkok, Thailand. 2 Department of Research Development, Faculty of Medicine, Siriraj Hospital. 3Department of Biochemistry, Faculty of Medicine, Siriraj Hospital, Mahidol University, Bangkok, Thailand.
泰國老年人替代泰國老年人替代泰國老年人替代泰國老年人替代性性性性體位測量方法體位測量方法體位測量方法體位測量方法: Mindex及及及及Demiquet之研究之研究之研究之研究
此橫斷性研究評估泰國老人之替代性體位指標、營養及代謝狀況之間的相關性。本研究調查泰國四個主要區域之四個鄉村社區,總共有2324名≥60歲的老年人納入研究。Mindex及Demiquet與身體質量指數之間具非常強的相關,相關係數分別為0.93及0.88。年齡較大的婦女其體脂重與身體質量指數之相關最高,相關係數為0.94 (P<0.001),與Mindex之相關係數為0.93 (P<0.001)。就體位測量而言,中臂圍與三個Quetelet指數之相關最強,相關係數在0.76-0.87
(P<0.001)之間;而皮脂厚度的測量中以肩胛骨下皮脂厚度表現最好,相關係數在0.69-0.74 (P<0.001)之間。身體質量指數與三頭肌及腸骨上皮脂厚度、中臂圍及體脂重的相關程度顯著高於Demiquet (所有變項P<0.001)。淋巴球數是唯一與三個Quetelet指數相關還算良好的實驗室檢驗值。三個Quetelet指數與不同的營養相關的參數有幾近相同的模式。女性Mindex在營養不足、過重及肥胖I
的切點分別為55.95、69.55及75.60 公斤/公尺;男性Demiquet在營養不足、過重及肥胖I的切點分別為75.60、93.98及102.16公斤/公尺。所有的訊息均支持Mindex及Demiquet當作一個替代身體質量指數來評估亞洲地區的老年人的營養狀況的優勢,尤其是營養不良的老人。
關鍵字:Mindex、Demiquet、體位、老年人、鄉村、泰國。

528 Asia Pac J Clin Nutr 2006;15 (4): 528-532
Original Article Persistence of iodine deficiency in a Gangetic flood-prone area, West Bengal, India Tapas Kumar Sen MAE
1, Akhil Bandhu Biswas MD
2, Indranil Chakrabarty MD
3,
Dilip Kumar Das MD2, Ramachandran Ramakrishnan PhD
4, Punnaih Manickam M.Sc
4,
and Yvan Hutin MD4
1 Department of Health and Family Welfare, Govt. of West Bengal, India 2 Community Medicine, R.G. Kar Medical College, Kolkata, West Bengal, India 3 Department of Biochemistry, Burdwan Medical College, West Bengal, India
4 National Institute of Epidemiology, Chennai, Tamilnadu, India
In 2000, India revoked the ban on production and sale of non-iodised salt. We conducted a study in the north 24 parganas district in the state of West Bengal to assess the prevalence of goitre, status of urinary iodine excretion (UIE) level and to estimate iodine content of salts at the household level. We surveyed 363 school children aged eight to ten years selected using a multistage cluster sampling technique. We estimated goitre prevalence and urinary iodine excretion (UIE) using methods and criteria recommended by the World Health Organization. We estimated the iodine content of salt samples collected from the households of the study subjects using spot iodine testing kit. Of the 363 children, 73 (20%) had goitre. The median UIE was 160 µg/l (normal: ≥ 100 µg/l) and only 6% children had a level below 50 µg/l. Only 253 of 363 salt samples (70%) were sufficiently iodised. The combination of high goitre prevalence with normal median urinary excretion indicates that the North 24 Parganas district is in transition from iodine deficient to iodine sufficient state. However, the persistence of non-iodised salt consumption indicates that an intensification of universal salt iodisation program is needed.
Key Words: goitre, iodine deficiency, total goitre rate (TGR), urinary iodine excretion (UIE), iodine content of the salt, cross-sectional study, India. Introduction Iodine deficiency is one of the most common preventable causes of mental retardation in the world today.1 People living in areas affected by severe iodine deficiency dis-orders may have an intelligence quotient of up to about 13.5 points below that of those from comparable commu-nities in areas where there is no iodine deficiency.2 In 1999, the World Health Organization (WHO) estimated that 130 of its 191 member states had a significant iodine deficiency disorders (IDD) problem. A total of 740 million (13%) of the world’s population is affected by goitre.2 Goitre is usually a manifestation of severe iodine defi-ciency. Thus, it is expected that a greater proportion of the population suffer from IDD and in particular, from some degree of mental retardation. In India, an estimated 167 million people are at risk for IDD.3 Of those, 54 million have goitre, two million suffer from cretinism and 6.6 million children have neurological deficits.3 In 1999, 275 of the 457 districts in the country were surveyed for IDD. Of those 275, 235(85%) were identified as endemic.4 Even in developed countries a decline in iodine nutrition status has been observed e.g. Australia, since reduction in availability/intake of iodised salt.5-7 Universal iodisation of salts is the most effective and cheapest available intervention available. WHO, the United
Nations Children’s Fund (UNICEF) and the International Council for the Control of Iodine Deficiency Disorders (ICCIDD) recommend it. A cost benefit analysis in India quantified the ratio between cost and economic benefits as 1:3, which further justifies the necessity of a universal salt iodisation program in India.8 In 1962, the Government of India initiated a National Goitre Control Program (NGCP), primarily aiming at covering endemic population with iodised salt. In 1992, the Government of India intensified organized efforts with the change of NGCP to National Iodine Deficiency Disorders Control Program (NIDDCP) to reflect broader aspects of iodine deficiency. It led to the initiation of compulsory salt iodisation in 1998. The com-pulsory salt iodisation program included a ban on the sale of non-iodised salt. The ban on non-iodised salt went against a number of local business interests. In the year 2000 it was revoked considering ‘compulsion in such matters of individual choice undesirable’.9
Correspondence address: Dr. Dilip Kumar Das BC – 37, Flat No –7, Bichitra Abason, Sector – 1, Salt Lake City Kolkata – 700064, West Bengal, India. Tel: +91-033-23598496 E-mail: [email protected] Accepted 14 February 2006

T Kumar Sen, A Bandhu Biswas, I Chakrabarty, D Kumar Das, R Ramakrishnan, P Manickam and Y Hutin 529
In a context where iodisation is not universal, the progress of programs to prevent iodine deficiency need to be mo-nitored using standard quantifiable indicators recom-mended by WHO, UNICEF and ICCIDD 10 (Table 1). Of the 19 districts of the state of West Bengal, only two, Malda and Birbhum were surveyed recently using recom-mended indicators and methodology. The prevalence of goitre was reported to be 11.3% and 12.6% respec-tively.11,12 The North 24 Parganas, the largest district of the state, is flood-prone and located in the Gangetic basin. As increased erosion of soil in river valleys and flood-prone area leads to greater degree of leaching of iodine, thus, it is potentially vulnerable to iodine deficiency disorders. We conducted a study in the North 24 Par-ganas district to estimate the magnitude of iodine defi-ciency disorders and the present status of salt iodisation at household level.
Materials and Methods We conducted a cross sectional survey during August-October 2004 among school children aged eight to ten years. WHO recommended using school children of this age group to assess IDD because of their high vulnera-bility to disease, their easy accessibility and the represen-tativeness of their age group in the community.10 High school enrolment and low drop out rates in the district of North 24 Parganas 13 justified this school-based approach. We followed a multistage cluster sampling methodology
to select the study participants.10 First, we enlisted all the villages and wards (defined geographical area in urban locality) in the district with their respective population according to the 2001 census and sampled the clusters with a probability proportional to size. Second, we en-listed all the primary schools in each identified cluster and
selected one using simple random sampling technique. Third, from the sampling frame of all children between eight to ten years of age in the identified school in a cluster, we selected the study children through a simple random sampling technique. This approach maximized the chance to select an equal number of children in each age group. We estimated the sample size using the Right Size software14, anticipating a prevalence of goitre of 15%, aiming for a precision of ± 5% with a confidence interval of 95%, a rate of homogeneity at 0.02 and a cluster size of 30. The calculated sample size was 330 individuals to be selected from 11 clusters with an anticipated design effect of 1.58. Considering 10% of non-response, the final sample size was 363 school children aged eight to ten years (i.e., 33 children per cluster). We used a pre-tested instrument for data collection. We informed the identified school at least one week before the day of survey to ensure a maximum attendance of students. We briefed the teachers and students about the activities to be under-taken. We trained the investigators prior to data collection to minimise inter-observer variation. A team from the department of community medicine, R. G. Kar Medical College, Kolkata assessed the presence of goitre by standard palpation method and graded the goitre according to the criteria jointly recommended by WHO, UNICEF and ICCIDD.10,15 This classification identifies three stages: Grade 0: Goitre neither visible nor palpable; Grade I: A mass in the neck, palpable but not visible when the neck was in normal position, consistent with an enlarged thyroid and moved upwards in the neck as the subject swallowed and Grade II: A swelling in the neck, visible when the neck was in a normal position and was consistent with an enlarged thyroid when we palpated the neck. The overall prevalence of goitre at grades I and II constituted the Total Goitre Rate (TGR). We collected on-the-spot urine samples from all the study subjects in screw-capped plastic bottles to estimate the current level of iodine intake. We stored them at 4oC until analysis. The biochemistry laboratory of Burdwan Medical College, West Bengal estimated the urinary iodine excretion (UIE) levels using the wet digestion method16 and expressed the result in µg/L urine. We asked all study subjects to bring 20 gm of salt routinely consumed in their households in auto-sealed polythene pouches. We estimated the iodine content in parts per million (ppm) of salt samples using a spot testing kit 2. We analysed the data collected using Epi Info 6.04d 17
Indicators Goal (%) 1. Thyroid size In school children 6-12 years age:
- Proportion with enlarged thyroid, by palpation or ultrasound
<5
2. Urinary iodine - Proportion below 100 µg/L - Proportion below 50 µg/L
<50 <20
3. Salt iodisation - Proportion of households consuming effectively iodised salt
>90
Table 1. Indicators recommended by WHO, ICCIDD and UNICEF for tracking progress towards eliminating iodine deficiency disorders
Boys Girls Total
Goitre grade Goitre grade Age
(Years) Number
0 I II
TGR
(%) Number
0 I II
TGR
(%) Number
TGR
(%)
8 75 62 13 0 17 50 41 4 5 18 125 18
9 62 50 11 1 19 66 50 13 3 24 128 22
10 49 41 6 2 16 61 46 9 6 25 110 21
All 186 153 30 3 18 177 137 26 14 23 363 20
Table 2. Goitre prevalence by age and sex, North 24 Parganas district, West Bengal, India (n=363)

530 Iodine deficiency in West Bengal
and performed univariate analysis to examine the associa-tion between the outcome and exposure variables. We used the Yates corrected chi-square (χ2) test and consi-dered ‘P’ values less than 0.05 statistically significant. In addition, we conducted two separate multiple linear regression analysis using Epi Info 200218 to examine the independent association of selected factors with actual values of UIE as the continuous variable and salt iodine level and logistic regression model with the categorical outcome variable, UIE level above and below 100 µg/L. The covariates considered for assessing the association were age, sex, religion and place of residence. Results All 363 selected study subjects agreed to participate in the study. Of them 125 (34%), 128 (35%) and 110 (31%) were eight, nine and ten years of age, respectively. The mean age was 8.9 years (Standard deviation: 0.8) and 177 (49%) were girls. Of the 363 study subjects, 237 (65%) were Hindu, while the 126 others (35%) were Muslim. Among the participants 198 (54%) lived in rural areas. The TGR in the district was 20% (73/363; 95% CI = 17%–23%) with visible goitre rate of five percent (17/73). The prevalence of goitre did not differ significantly by age and sex (Table 2). The TGR did not differ between Hindu (51/237, 21.5%) and Muslim (22/126,17.5%, P = 0.4). There was no difference of the TGR by zone of residence (22% in rural area versus 17% in urban area, P = 0.3). Out of 363 urine samples, we discarded five because of contamination. Thus, we estimated the urinary iodine excretion levels on 358 samples. The median urinary io-dine excretion level was 160 µg/L; almost identical in boys (150µg/L) and girls (160 µg/L). Of the 358 chil-dren, only two (0.6%) had urinary iodine levels in the range of severe iodine deficiency (<20µg/L), while 19 (5.3%) were in the range of moderate (20 to 49µg/L) and 79 (22.1%) in the range of mild iodine deficiency (50 to 99 µg/L) (Table 3). Compared with girls (39/175; 22%), a higher proportion of boys (61/183; 33%) had UIE level below 100 µg/L (P=0.02). A higher proportion of chil-dren residing in rural area (63/195, 32.3%) had UIE values under 100 µg/L compared to urban area (37/163, 22.7%; P =0.04). The UIE values did not differ by age and religion. The logistic regression model indicated that the variables that were significantly associated with UIE level below 100 µg/L in univariate analysis (i.e., sex and the place of residence) were no longer significant when adjusted for the other variables. However, when we con-sidered the actual values of UIE as the continuous variable
and carried out a multiple regression analysis, rural chil-dren had significantly lower UIE values compared with their urban counterparts (Coefficient: 1.95; S.E.: 0.77; F-test: 6.45; P value: 0.01). Of the 363 salt samples tested, 37 (10%) had no iodine and 253 (70%) had iodine levels within normal range (i.e 15 ppm or above). The proportion of households con-suming adequately iodised salts was higher among Hindu than Muslim (78% versus 53%, P<0.001, Table 4), but did not differ according to the area of residence. In mul-tiple linear regressions, religion was the only variable significantly associated with the salt iodine level (coe-fficient: -6.13; S.E.: 1.10;F-test: 30.97; P value: <0.0001). Discussion The WHO, UNICEF and ICCIDD recommended that if more than five percent of school children between 6 and 12 years of age suffer from goitre, the area should be classified as endemic to iodine deficiency.10 The present study estimated a total goitre prevalence rate of 20%. Thus, the North 24 Parganas district is still endemic for iodine deficiency. Various studies in other districts of the state and other states of the country also reported similar observations of high goitre prevalence.11,12,19-21 WHO, UNICEF and ICCIDD recognize urinary iodine excretion as the most important marker to detect current iodine deficiency. The recommended median urinary io-dine excretion level is 100 µg/L or more, and not more than 20% of the samples should have urinary iodine level of 50 µg/L or less.10 Our study suggests that the present iodine nutrition status in the district is satisfactory. Simi-lar findings were reported in the Malda (150 µg/L) and Birbhum (124 µg/L) districts of the state of West Ben-gal11,12 and in earlier studies in other states of India.19-21 The univariate analysis suggested that boys were more likely to have a UIE below 100 µg/L than girls. The pro-portion was also significantly higher among rural children compared with their urban counterparts. Rural population are less likely to access iodised salt for many reasons, including lack of awareness, poverty and poor geo-graphical access to iodised salt. The analysis of salt samples indicated that more than two third (70%) of the children were consuming adequately iodised salt. This proportion is well below the recommended goal (>90%).10 Other studies in the two districts of the state also reported similar findings.11,12 Two factors may explain the in-sufficient iodisation in the present study. These include: (a) the lack of awareness in the community regarding the impact of iodine deficiency disorders and the role of iodised salt to prevent them and (b) the absence of ban on
Children (n=358) Urinary iodine excretion level (µg/L) Frequency %
< 20 2 0.6 20-49 19 5.3 50-99 79 22.1 ≥100 258 72.0
Table 3. Urinary iodine excretion level among children 8-10 years of age, North 24 Parganas district, West Bengal, India (n=358)
Iodine content (ppm)
Hindu (n=237)
Muslim (n=126)
Total (n=363)
No (%) No (%) No (%) Nil 13 (6) 24 (19) 37 (10) <15 38 (16) 35 (28) 73 (20) ≥15 186 (78) 67 (53) 253 (70)
ppm= parts per million
Table 4. Iodine content of salt at household level (n=363), North 24 Parganas district, West Bengal, India

T Kumar Sen, A Bandhu Biswas, I Chakrabarty, D Kumar Das, R Ramakrishnan, P Manickam and Y Hutin 531
the production and sale of non-iodised salt. These two factors may affect the poor more. Furthermore, the pro-portion of households consuming adequately iodised salts was significantly lower among Muslim compared to Hindu. This suggests that they are more vulnerable to iodine deficiency. Factors that may explain this increased vulnerability to iodine deficiency among Muslim include a lower socio-economic status and a lower level of edu-cation than Hindu.22, 23 In the context of IDD elimination, the status of the recommended indicators needs to be interpreted in com-bination. In the present study of school children, the high goitre prevalence suggests moderate endemicity of IDD. In contrast, the median urinary iodine value being well above 100µg/L indicates that there is no current iodine deficiency in the district. Hence, the district North 24 Parganas is in transition from iodine deficient to iodine sufficient state. However, the persistence of non-iodised salt consumption indicates that an intensification of the universal salt iodisation program is needed. Sustained monitoring and intensified awareness generation acti-vities, with particular emphasis to the vulnerable section of the community, are keys to eliminate iodine deficiency disorders in the district. Since this study was conducted, Government of India announced their decision to reinstate the ban on production and sale of non-iodised salt from 15 August 2005. Additional data regarding the vulnera-bility of the poor to iodine deficiency disorders would allow formulating better prevention policy. In this con-text, we propose further study to address the equity in access to universal salt iodisation among different strata of population in respect to their socio-economic charac-teristics and level of awareness about iodine deficiency disorders. This study is being prepared and will be con-ducted in the North 24 Parganas district in 2005.
Acknowledgements We gratefully acknowledge the financial grant from Training in Epidemiology and Public Health Interventions Network (TEPHINET), Atlanta, USA. We also acknowledge the support and cooperation of the district authorities, Department of Health and Family Welfare and Department of Education, North 24 Parganas, West Bengal, India. We thank the faculty members of Community Medicine, R. G. Kar Medical College, Kolkata, and Department of Biochemistry, Burdwan Medical College, West Bengal for their support and cooperation. We are grateful to the school students and schoolteachers for their cooperation. References 1. Kapil U. Goitre in India and its prevalence. Journal of
Medical Sciences and Family Planning 1998; 3:46-50. 2. World Health Organization. Assessment of Iodine
Deficiency Disorders and monitoring their elimination: A guide for program managers. 2nd edition. ICCIDD, UNICEF, WHO. Geneva: World Health Organization; 2001 (WHO/NH/01.1).
3. Ramji S. Iodine deficiency disorders – Epidemiology, clinical profile and diagnosis. In: Sachdev HPS, Choudhury P, eds. Nutrition in children–developing country concern. New Delhi: Dept. of Paediatrics, Moulana Azad Medical College,1995; 245-254.
4. World Health Organization. Eliminations of iodine deficiency disorders in South East Asia. Geneva: World Health Organization 1997; 1-8. (SEA/NUT/138).
5. Hynes KL, Blizzard L, Venn AJ, Dwyer T. Persistent iodine deficiency in a cohort of Tasmanian school children: association with socio-economic status, geographical location and dietary factors. Aust N Z J Public Health 2004; 28 (5): 476-481.
6. Thomson CD. Selenium and iodine intake and status in New Zealand and Australia. Brit J Nutr 2004; 91(5): 661-672.
7. McDonnel CM, Harris M, Zacharin MR. Iodine deficiency and goitre in school children in Melbourne, 2001. Med J Aust 2003; 178(4): 159-162.
8. Pandav CS. The economic benefits of the elimination of IDD. In: Hetzel BS, Pandav CS, editors. S.O.S. for A Billion: The conquest of Iodine Deficiency Disorders. New Delhi: Oxford University Press, 1997; 129-143.
9. Government of India. Press note: Withdrawal of restriction on sale of common salt for direct human consumption, Vaisakha 21, 1922, May 11, 2000. Press Information Bureau, Ministry of Health and family Welfare, (Dept of Health), New Delhi.
10. Joint WHO/UNICEF/ICCIDD Consultation. Indicators of assessing iodine deficiency disorders and their control through salt iodisation. Geneva: World Health Organi-zation; November 1992 (WHO/NUT/94.6).
11. Biswas AB, Chakrabarty I, Das DK, Biswas S, Nandy S, Mitra J. Iodine deficiency disorders among school children of Malda, West Bengal, India. J Health Popul Nutr 2002; 20(2): 180-183.
12. Biswas AB, Chakraborty I, Das DK, Roy RN, Mukhopadhyay S, Chatterjee S. Iodine deficiency disorders among school children of Birbhum, West Bengal. Current Science 2004; 87(1): 78-80.
13. Government of West Bengal. Department of School Education. Annual Report 2003-2004. Bikash Bhavan, Bidhannagar, Kolkata, 2004.
14. White M. Right Size China-Uganda-Zimbabwe, Version 2.0.0.0.2 1/19/2002. Centers for Disease Control and Prevention, Atlanta, USA.
15. Kumar S. Indicators to monitor progress of National Iodine Deficiency Disorders Control Programme (NIDDCP) and some observation on iodised salt in West Bengal. Indian J Public Health 1995; XXXIX, 4: 141-147.
16. Dunn JT, Crutchfield HE, Gutekunst R, Dunn D. Methods of measuring iodine in urine. A joint publication of WHO/ UNICEF/ICCIDD, 1993; 18-23.
17. Epi info version 6.04 d, March 1998. The division of surveillance and epidemiology, Centers for Disease control and Prevention, Atlanta, USA.
18. Epi info 2002, Revision 1, November 4, 2002. The division of surveillance and epidemiology, Centers for Disease control and Prevention, Atlanta, USA.
19. Umesh K. Editorial: Current status of Iodine Deficiency Disorders Control Programme. Indian Paediatrics 1998; 35: 831-836.
20. Bhardwaj AK, Umesh K. Assessment of iodine deficiency in district Bikaner, Rajasthan. Indian J Matern Child Hlth 1997; 8:18-20.
21. Sohal KS, Sharma TD, Umesh K, Tandon M. Assessment of iodine deficiency in district Hamirpur, Himachal Pradesh. Indian Paediatr 1998; 35: 1008-1011.
22. Development and planning department, Government of West Bengal. West Bengal Human Development Report 2004. Government of West Bengal, 2004; 152.
23. The Registrar General of India. Report of Census of India, 2001. New Delhi: Government of India; 2001

532 Iodine deficiency in West Bengal
Original Article Persistence of iodine deficiency in a Gangetic flood-prone area, West Bengal, India Tapas Kumar Sen MAE
1, Akhil Bandhu Biswas MD
2, Indranil Chakrabarty MD
3,
Dilip Kumar Das MD2, Ramachandran Ramakrishnan PhD
4, Punnaih Manickam MSc
4,
and Yvan Hutin MD4
1 Department of Health and Family Welfare, Govt. of West Bengal, India 2 Community Medicine, R.G. Kar Medical College, Kolkata, West Bengal, India 3 Department of Biochemistry, Burdwan Medical College, West Bengal, India
4 National Institute of Epidemiology, Chennai, Tamilnadu, India
印度西孟加拉印度西孟加拉印度西孟加拉印度西孟加拉Gangetic flood-prone地區地區地區地區持續持續持續持續碘缺乏碘缺乏碘缺乏碘缺乏 公元2000年,印度廢除禁止生產與銷售未加碘食鹽的規定。我們評估西孟加拉州北部的24個伯爾格納縣的居民甲狀腺腫盛行率、尿液碘排出量(UIE)狀況並估計在家戶中使用的食鹽碘含量。我們採用多步驟叢集抽樣法選取並調查363名年齡在8-
10歲間的學童。我們採用世界衛生組織所建議的甲狀腺腫盛行率及尿液碘排出量的分析方法與標準。我們使用spot iodine 檢驗套 件估計從研究 對象 的家 戶中
收集來的食鹽樣本的碘含量。363名兒童中有73名(20%)有甲狀腺腫的情形。UIE
中位數為160µg/L (正常值:≥ 100µg/L),只有6% 的兒童其UIE 濃度低於 50µg/ L。 363個食鹽樣本中只有253個(70%)加了足夠的碘。這種高甲狀腺腫盛行率及正常的中位數尿液碘排出量的綜合狀況,顯示24個北伯爾格納縣正由碘缺乏轉變成碘足夠的區域。然而持續攝取未加碘鹽指出有必要加強全球食鹽加碘。
關鍵字:甲狀腺腫、碘缺乏、總甲狀腺腫率(TGR)、尿液碘排出量(UIE)、食鹽碘含量、橫斷性研究、印度。

Asia Pac J Clin Nutr 2006;15 (4):533-537 533
Original Article Status of iodine nutrition in pregnant and lactating women in national capital district, Papua New Guinea Victor J Temple PhD
1, Benjamin Haindapa BMedSci1, Robert Turare PhD
1, Andrew Masta PhD
1, Apeawusu B Amoa FRCPG 2 and Paulus Ripa MMed 3
1 Division of Basic Medical Sciences, School of Medicine and Health Sciences, University of Papua New Guinea 2 Division of Obstetrics and Gynaecology and Port Moresby General Hospital 3Division of Clinical Sciences, School of Medicine and Health Sciences, University of Papua New Guinea,
Urinary Iodine excretion is a useful and important indicator of the iodine status of a population. This study attempts to determine the urinary iodine concentration of non-pregnant, pregnant and lactating women, resident in the National Capital District of Papua New Guinea, so as to evaluate their status of iodine nutrition. The study population was made up of 56 non-pregnant, 40 lactating and 212 pregnant women. Of the 212 pregnant women, 14 were in the first, 64 in the second, and 134 in the third Trimester of pregnancy. Casual urine samples were collected and analysed for urinary iodine by Sandell-Kolthoff reaction. The median urinary iodine concentration for the non-pregnant, lactating and pregnant women was 163.0ug/L, 134.0ug/L and 180.0ug/L, respectively. Median urinary iodine for the first, second and third trimesters were 165.0ug/L, 221.5ug/L and 178.0ug/L, respectively. The 20th percentile urinary iodine values were higher than 50ug/L for all the groups. This indicates adequate intake of dietary iodine and optimal status of iodine nutrition amongst women in the various groups. Mild to severe status of iodine nutrition was found in 30.4% of non-pregnant, 35.0% of lactating, 22.2% of pregnant women, 28.5% of women in the first, 18.8% in the second, and 23.1% in the third trimester of pregnancy. To achieve optimal iodine nutrition in pregnant and lactating women, an increase in their intake of dietary iodine is recommended.
Key Words: urinary iodine, pregnancy, lactation, trimesters, non-pregnant, Papua New Guinea Introduction Urinary Iodine (UI) excretion is a useful and important indicator of the iodine status of a population.1-,3 The UI values obtained can be conveniently expressed either as a range with a median, or as proportions, using a series of cut-off points to indicate the severity of iodine defi-ciency.1,3 Iodine deficiency in women of childbearing age can cause infertility and also set the stage for miscarriage, abor-tion or stillbirth during pregnancy.1 Maternal iodine defi-ciency during pregnancy and lactation can severely com-promise the thyroid status of the fetus and neonate.4,5 Mild iodine deficiency during the first and second trimesters of pregnancy can cause subclinical fetal hypothyroidism, with subtle negative effects on neurodevelopment; the effect is more pronounced in cases of moderate to severe iodine defi-ciency.5,6 According to recent reports4,7-9 there is growing evi-dence that iodine deficiency may be reappearing in some countries, where it was previously under control. This underscores the need to evaluate the iodine status of children, pregnant women, lactating women and women of childbearing age in populations that have been at risk in the past. Universal salt iodization (USI), a policy of iodising all salt used in households, catering, food processing and agriculture, is the internationally agreed strategy for the control of iodine deficiency.1,2 The implementation of the
USI policy in Papua New Guinea (PNG) commenced in June 1995, when the Government of PNG amended the “Pure Food Act”. This amendment promul-gated the PNG Salt Legislation, which effectively put a ban on the importation and sale of non-iodised salt in PNG.10,11 According to the PNG salt legislation, all salt in PNG should be iodised with potassium iodate (KIO3) and the iodine content in all salt should not be less than 30ppm (30 mg of iodine per kilogram of salt).10 Estimated daily per capita salt consumption in PNG was not indicated in the legislation. The Consumer Affairs Council (CAC) was mandated to monitor and implement the salt legisla-tion, promote the use of iodised salt, and take violators of the legislation to task.11 A CAC report in early 199611 stated that the lack of effective transport system and rela-tive inaccessibility of many areas, because of the moun-tainous topography, constituted a major obstacle to the the effective distribution of iodised salt around the coun-try. Thus, iodised salt is not regularly available in most
Correspondence address: Dr Victor J Temple, Division of Basic Medical Sciences, School of Medicine and Health Sciences, University of Papua New Guinea, P. O. Box 5623, Boroko, NCD, Papua New Guinea Tel: + 675 – 3262657; + 675 – 6858324; Fax: + 675 – 3243827 Email: [email protected] Accepted 22 February 2006

534 V J Temple, B Haindapa, R Turare, A Masta, AB Amoa and P Ripa
remote areas of Papua New Guinea. Data on the im-plementation of the salt legislation are scanty.9,13 Recent reports indicate that although the per capita consumption of salt is low, adequately iodised salt is available in over 90 per cent of households and retail shops in Lae city12 and in the Hella Region of Southern Highlands Provinces, PNG.9 There is little information on the impact of the salt iodisation programme on susceptible groups, such as school-age children and pregnant women in PNG.8,9 No published data are available on the status of iodine nutri-tion of non-pregnant and lactating women in PNG. The aim of this study was to assess the status of iodine nu-trition of non-pregnant, pregnant and lactating women resident in the National Capital District (NCD), PNG. Subjects and methods The NCD, with a population of about 250 000, is the incorporated area around Port Moresby, the capital of PNG.13 Port Moresby General Hospital (PMGH) is the major general, specialist and reference hospital in NCD and PNG. It also serves as the teaching hospital for the School of Medicine and Health Sciences (SMHS). The population for this cross-sectional study consisted of healthy 265 pregnant and 54 lactating women resident in NCD and attending antenatal and pediatric clinics respectively at the PMGH. The lactating group was made up of women who have been breastfeeding for less than eight weeks. Seventy age-matched non-pregnant women were recruited from staff and students in PMGH and SMHS. Only staff and students residing in NCD were included in the study. All women with previous history of thyroid disease or medications that affect thyroid status, including those with systemic illness, were excluded from the study. This constituted about 2.0% of all the women that participated in the study. Informed consent was obtained from each participant recruited to the study before collecting 5 to 10 ml casual urine sample in wide-mouth screw-capped plastic bottles.1 Urine samples were stored frozen at about –20oC until required for analysis. Urinary iodine analysis was carried out in the Micronutrient laboratory in the Division of Basic Medical Sciences, SMHS UPNG, using the spectrophotometric method of Sandell-Kolthoff reaction, after digesting the urine with Ammonium Persulfate in a water bath at 100oC.1 The sensitivity (10.0 – 12.50ug/L) and percentage recovery (95 ± 10 percent) of the UI assay were frequently used to assess the performance charac-teristics of the assay method. External quality control assessment of the analytical procedure was carried out by, The Centers for Disease Control and Prevention (CDC) Atlanta Georgia USA EQUIP program and by the Iodine Reference Laboratory for Asia Pacific Region Institute of Clinical Pathology and Medical Research (ICPMR), Westmead Hospital, NSW Australia. Statistical analysis of data was carried out using SPSS-PC software (version 10). ANOVA was used to compare differences in urinary iodine excretion between different groups, with the Scheffe test used for post-hoc analysis. A P value <0.05 was considered as significant.
Ethical clearance and approval for the study were ob-tained from the SMHS Ethics and Research Grant Committee. In addition, permission for the study was obtained from the appropriate authorities in PMGH. The iodine status of women in the various groups was determined using the recommended WHO/UNICEF/ ICCIDD criteria. 1-3 Results A total of 56 non-pregnant (response rate: 80 per cent), 212 pregnant (response rate: 80 per cent) and 40 lactating (response rate: 75 per cent) women participated in the study. Table 1 shows the mean age and UI values for the three groups of women. The median UI concentrations for the non-pregnant, lactating and pregnant groups of women are 163.0ug/L, 134.0ug/L and 180.0ug/L, re-spectively. The 20th Percentile value for each of the groups was greater than 50ug/L. In comparing the UI concentrations between women in the non-pregnant, preg-nant and lactating groups, there was a significant difference between the UI concentrations of women in the pregnant and lactating groups (P<0.05). There was, how-ever, no significant difference between UI concentrations of women in the non-pregnant and pregnant groups, and neither was there any significant difference between the lactating and non-pregnant groups. Further analysis of the UI data (Table 2), indicates mild to moderate status of iodine nutrition in 30.4 per cent of non-pregnant, 32.5 per cent of lactating and 19.4 per cent of pregnant women. In addition, 7.2 per cent of non-pregnant, 17.5 per cent of lactating, and 6.6 per cent of pregnant women, have UI concentration less than 50.0ug/L. This indicates severe status of iodine nutrition, especially in the lactating and pregnant groups. The 212 pregnant women were grouped according to their trimester of pregnancy. Women in the first trimester
Parameters Non-pregnant (n = 56)
Lactating (n = 40)
Pregnant (n = 212)
Mean age yrs (± SD)
25.0 ± 5.6 25.8 ± 3.6 26.4 ± 5.1
Median (ug/L)
163.0 134.0 180.0
Mean (ug/L)
176.6 138.2 188.7
Range 286.0 304.0 304.0 SD 96.0 78.2 96.7 95% CI (ug/L)
150.9–202.3 113.2 – 163.2 175.6–201.8
20th Percentile (ug/L)
82.0 57.6 90.0
Per cent of women with UI ≥ 100ug/L
69.6
65.0
77.8
Per cent of women with UI < 50ug/L
7.2
17.5
6.6
Per cent of women with UI ≥150ug/L
53.6
40.0
61.3
Table 1. Mean age and Urinary Iodine values in non-pregnant, lactating and pregnant women

Iodine nutrition in Papua New Guinea 535
of pregnancy accounted for about 75 per cent of the non-response rate in the pregnant group. In most of the cases, the women needed to obtain approval from their spouses. The mean age and UI values for the women in the first, second and third trimester of pregnancy are shown in Table 3. The median UI concentrations (165.0ug/L, 221.5ug/L and 178.0ug/L) for the First, Second and Third Trimesters, respectively, are greater than 100ug/L, and the 20th Percentile values are greater than 50ug/L. There were no statistically significant differences in the UI concentrations among the three trimesters of pregnancy,
and also between the non-pregnant group and each of the three trimesters of pregnancy. However, the UI con-centration in the lactating group was significantly lower (P<0.05) than the UI concentration in the second trimester of pregnancy. The distribution (per cent) of pregnant women in the various trimesters according to range of UI concentrations and status of iodine nutrition is presented in Table 4. For women in the first, second and third trimesters of preg-nancy, 28.5%, 18.8% and 23.1% respectively, have mild to severe status of iodine nutrition. Discussion In the present study, the median UI concentrations for the non-pregnant, lactating and pregnant groups of women are higher than the recommended minimum adequate UI concentration of 100ug/L. In addition, less than 20 per cent of women in each group have UI concentration below 50ug/L. This, according to the WHO/ UNICEF/ ICCIDD criteria,1-3 indicates adequate dietary iodine in-take and an optimal status of iodine nutrition. There is, however, prevalence of mild to severe status of iodine nutrition in a significant number of women in these groups, indicating inadequate intake of dietary iodine. The median UI concentration (180.0ug/L) for pregnant women obtained in the present study is lower than the 231.0ug/L obtained for pregnant women in Lae PNG.8 Mild to severe status of iodine nutrition was reported in 15 per cent of pregnant women in Lae8 compared to 22.2 per cent in the present study. These differences might be due to a number of factors, including diversity in cultural habits that results in low consumption of iodised salt by pregnant women in NCD compared to those in Lae.8,12 The goitrogen content in the staple foods consumed in NCD might also be higher. The differences might also be due to apparent lack of awareness of the need for preg-nant women to consume adequate amounts of iodine to improve their thyroid function, which is vital for early development of the brain and other tissues in their foetus and neonates.1,6 In NCD, there is a popular belief that high intake of salt is associated with high blood pressure and increased risk of heart disease and stroke. The relatively low UI concentration in the lactating group of women, compared to the women in the pregnant and the second trimester groups, may be due to the loss of iodide in breast milk during lactation. The source of iodine for neonatal thyroid hormone formation is mainly from maternal milk.1,3 Although the median UI concentrations obtained during the first, second and third trimesters indicate opti-mal status of iodine nutrition according to the current WHO/UNICEF/ICCIDD criteria1,3, yet mild to severe sta-tus of iodine nutrition is prevalent in the groups. Our results clearly indicate inadequate consumption of dietary iodine by some of the pregnant and lactating women in the NCD. This is of concern, because of the association between iodine deficiency and the potential risk of irreversible damage to the foetus and neonate.1,3 Thus, it is necessary to regularly evaluate and monitor the im-plementation of the USI strategy in the region. According to the current WHO/UNICEF/ICCIDD1,3 criteria, the recommended indictor of an adequate dietary
Table 2. Distribution (Percent) of non-pregnant, lactating and pregnant women according to range of UI concentration and status of iodine nutrition
Range of UI conc. (ug/L)
Status of Iodine Nutrition1,3
Non-pregnant
Lactating
Pregnant
Distribution (per cent)
< 20 Severe 0 2.5 2.8 20 – 49 Moderate 7.2 15.0 3.8 50 – 99 Mild 23.2 17.5 15.6 100 – 199 Optimal 28.6 42.5 33.5 200 - 299 Risk of IIH 19.6 17.5 23.6 ≥ 300 Risk IIH 21.4 5.0 20.8
Table 3. Mean age and Urinary Iodine values of pregnant women in first, second and third trimester of pregnancy
Trimester of pregnancy Parameters First
(n = 14) Second (n = 64)
Third (n = 134)
Mean age yrs (± SD)
25.6 ± 4.6 26.8 ± 5.4 26.3 ± 5.1
Median (ug/L) 165.0 221.5 178.0 Mean (ug/L) 181.5 204.9 181.7 Range 304.0 294.0 304.0 SD 104.1 98.6 94.9 95% CI 121.4 –
241.6 180.3 – 229.5
165.5 – 197.9
20th Percentile (ug/L) 74.4 107.0 90.0 Per cent of women with UI ≥ 100ug/L
71.4
81.3
76.9
Per cent of women with UI < 50ug/L
7.1
6.3
6.7
Per cent of women with UI ≥ 150ug/L
71.4
64.1
59.0
Table 4. Distribution (per cent) of pregnant women in the various trimesters according to range of UI concentration and status of iodine nutrition
Trimester of pregnancy Range of UI conc (ug/L)
Status of Iodine Nutrition1,3
First Second Third
Distribution (per cent) < 20 Severe 7.1 0 3.7 20 – 49 Moderate 0 6.3 3.0 50 – 99 Mild 21.4 12.5 16.4 100 – 199 Optimal 28.6 26.6 37.3 200 – 299 Risk of IIH 21.4 28.1 21.6 > 300 Risk IIH 21.4 26.6 17.9

536 V J Temple, B Haindapa, R Turare, A Masta, AB Amoa and P Ripa
intake of iodine and optimal status of iodine nutrition in a population is when the median UI concentration in the general population is between 100 to 199ug/L. Currently, there are no WHO/UNICEF/ICCIDD recommendations for the range of UI concentration that indicates optimal iodine nutrition in pregnant and lactating women.14 How-ever, since maternal iodine requirement is higher than normal during pregnancy and lactation,14,15 scientific opi-nion increasingly suggests that the median UI con-centration of 100ug/L used as benchmark for optimal status of iodine nutrition in the general population may have to be raised during pregnancy and lactation.14,16 Delenge14 has recently proposed a range of 150 to 230ug/ L for the median UI concentration to indicate optimal iodine nutrition during pregnancy and lactation. In our present study the percentages of women in the lactating and pregnant groups with UI concentration ≥ 150ug/L are presented in Tables 1 and 3. Further ana-lysis of our results indicates a suboptimal level of iodine nutrition in about 60 per cent of lactating, and between 30 to 40 per cent of pregnant women. In order to achieve optimal iodine nutrition in pregnant and lactating women, an increase in their intake of dietary iodine is recommended. This can be achieved by con-ducting intensive education and awareness campaign in the population on the need for pregnant and lactating women to consume adequate amounts of iodised salt. However, because of local dietary customs that are characterised by low intake of salt, other sources of iodine can be suggested. In the short term, these women can be advised to include seafood, such as seaweeds, kelp, nori, fish and shellfish in their diet once or twice a week. In addition, pregnant and lactating women in particular can be given multivitamin supplements that include appro-priate amounts of iodine and other trace elements. In the long term, iodine can be added to the water supply. Water, adequately iodised with potassium iodide or po-tassium iodate, can provide adequate iodine for nutri-tion.1,17 Such a program exists in Mexico, Chile and other parts of the world.17 Other vehicles such as soy source, vegetable oil, milk, bread, candy, tea and sugar can be used to deliver adequate amount of iodine to the general population.17,18 Some brands of powdered milk sold in NCD are enriched with iodine, but their retail price - is relatively higher than the non-iodised brands. It should be emphasised that supplementation programmes must be accompanied by effective monitoring of urinary iodine, so as to ensure proper adjustment of iodine intake. Our results indicate that about 20 per cent of women in the non-pregnant and pregnant groups are at risk of developing iodine-induced hyperthyroidism (IIH). Some individuals can tolerate relatively high intake of iodine without any obvious adverse effect.1,14,17 However, excessive intake of iodine (over 1000.0ug per day) can be potentially harmful to susceptible individuals.1,14,16,17 Thus, the possibility of IIH and related complications further strengthens the need for USI programme planners and implementers to include effective monitoring of uri-nary iodine concentration in women and children as part of the salt iodization programme in NCD. Universal salt iodization is the approved strategy for achieving optimal iodine nutrition in PNG.10 However,
since the implementation of the Salt Legislation in June 1995, no comprehensive analysis of the status of the salt iodization programme in PNG has been carried out after the report of the CAC in early 1996.11 Analysis of data from various parts of the country indicates that the status of the salt iodization programme can be characterized as “existent but needing strengthening”.8,9,12,18 According to WHO/UNICEF/ICCIDD,1,18 the recommended action needed to improve such programmes includes perio-dically reviewing the programme, to ensure that its tempo is maintained. In addition, to eliminate iodine deficiency permanently, iodization of salt and its distribution should become an integral part of the salt production, importation and distribution system that will run on its own mo-mentum after an initial period of support and moni-toring.1,18 In order to sustain and improve on the current status of the salt iodization programme, especially in NCD, social mobilization, effective education for and communication with all relevant target groups including policy makers is urgently needed. In addition, continuous monitoring of iodine content in salt at the retail shops and households and the urinary iodine levels in the vulnerable groups (such as pregnant, lactating and non-pregnant women of childbearing age, neonates and school-age children) should be mandatory. Conclusion Our results indicate that although iodine deficiency is not a significant public health problem among pregnant and lactating women in NCD, a sizable number of these wo-men have mild to severe status of iodine nutrition. There is therefore an urgent need to assess the implementation of the USI policy and the salt consumption pattern, espe-cially among pregnant and lactating women in NCD. Aggressive advocacy of appropriate and adequate use of iodised salt for the elimination of iodine deficiency must be carried out at all levels in the various communities in NCD, including at antenatal and well-baby clinics in PMGH. Acknowledgement We thank Professor John Vince, who is the Professor of Child Health, Dr. Adulf Saweri who is the Head of Clinical Sciences, Professor Lance Hill, Ms Philomena Sengu and Sam Grant for their support during this project. We also thank Professor Francois Delange of ICCIDD for his invaluable support. We thank the School of Medicine and Health Sciences (SMHS) Research Grant Committee for the funding of the project. We also thank all the Nurses, Pregnant and Lactating mothers at the O&G and Pediatric Wards at PMGH, and all the Staff and Students at SMHS and PMGH.
References 1. WHO, UNICEF, ICCIDD. Assessment of IDD and
monitoring their elimination: A guide for programme mangers, 2nd Edition. WHO/NHD/01.1, 2001
2. WHO. Iodine deficiency. WHO Executive Board 103rd Session, Provisional Agenda item 8. EB103/27, Nov. 1998; 1 – 3.
3. Delange F, de Benoist B, Burgi H, & the ICCIDD working group Determining median urinary iodine concentration that indicates adequate iodine intake at population level. Bulletin of the WHO 2002; 80 (8): 633 – 636.
Iodine nutrition in Papua New Guinea 537
4. Brander L, Buess Als, H, Haldimann F, Harder M, Hangi, Herrmann W U, Lauber K, Niederer U, Zarcher T, Burgi U, Gerber H. Urinary iodine concentration during pregnancy in an area of unstable dietary iodine intake in Switzerland. J Endocrinol Invest 2003; 26 (5): 389 – 396.
5. Kibirige MS, Hutchison S, Owen CJ, Delves HT. Prevalence of maternal dietary iodine insufficiency in the North East of England: Implications for the Fetus. Arch Dis Child Fetal Neonatal Ed 2004; 89: F436 – 439.
6. Hetzel BS. Iodine deficiency and fetal brain damage. N Engl J Med 1994; 331: (6) 1770 – 1771.
7. Guttikonda K, Travers CA, Lewis PR, Boyages S. Iodine deficiency in urban primary school children: A cross-sectional analysis. Med J Aust 2003; 179 (7): 346 – 348.
8. Amoa B, Rubiang L, Iodine status of pregnant women in Lae. Asia Pac J Clin Nutr 2000; 9 (1): 33 – 35.
9. Temple VJ, Mapira P, Adeniyi KO, Sims P. Iodine deficiency in Papua New Guinea (Sub-clinical iodine deficiency and salt iodization in the highlands of Papua New Guinea). J Public Health 2005; 27 (1): 45 – 48.
10. Barter P. Pure Food Act, amendment of Pure Food Standards. Papua New Guinea Govt. National Gazette. Port Moresby 1995; G 47.
11. Government of PNG, UNICEF. Children, women and families in PNG: A situation analysis. Port Moresby; October 1996; APO Production Unit Inc.
12. Amoa B, Pikire T, Tine P. Iodine content in salt in Lae city of Papua New Guinea. Asia Pac J Clin Nutr 1998; 7 (2): 128 – 130.
13. National Health Plan 2001-2010, Health Vision 2010, Provincial and District Health Profiles. Vol. 3 Part 2; 1st edn. Port Moresby: Papua New Guinea Ministry of Health, August 2000; 38 – 44.
14. Delange F. Optimal iodine nutrition during pregnancy, lactation and the neonatal period. Int J Endocrinol Metab 2004; 2: 1 – 12.
15. Delange F. Iodine deficiency as a cause of brain damage. Postgrad Med J 2001; 77: 217 – 220.
16. Thomson CD. Dietary recommendations of iodine around the world, IDD Newsletter 2002; 18 (3): 38-42.
17. Dunn JT. Nutrient composition for fortified complementary foods: Iodine should be routinely added to complementary foods. J Nutr 2003; 133: 3008S – 3010S.
18. Vankatesh Manner MG, Dunn JT. Salt iodisation for the elimination of iodine deficiency. ICCIDD, Netherlands 1995; 79 – 81.
Status of iodine nutrition in pregnant and lactating women in national capital district, Papua New Guinea Victor J Temple PhD
1, Benjamin Haindapa BMedSci1, Robert Turare PhD
1, Andrew Masta PhD
1, Apeawusu B Amoa FRCPG 2 and Paulus Ripa MMed 3
1 Division of Basic Medical Sciences, School of Medicine and Health Sciences, University of Papua New Guinea 2 Division of Obstetrics and Gynaecology and Port Moresby General Hospital 3Division of Clinical Sciences, School of Medicine and Health Sciences, University of Papua New Guinea,
巴布亞新幾內亞首都地區孕婦及哺乳婦女碘的營養狀況巴布亞新幾內亞首都地區孕婦及哺乳婦女碘的營養狀況巴布亞新幾內亞首都地區孕婦及哺乳婦女碘的營養狀況巴布亞新幾內亞首都地區孕婦及哺乳婦女碘的營養狀況 尿液中碘的排出量是評估族群碘營養狀況有用且重要的指標。此研究測量居住在巴布亞新幾內亞首都的未懷孕者、孕婦及哺乳婦女尿液中碘的濃度,以此評估她們碘的營養狀況。此研究族群包括了56名未懷孕者、40名哺乳婦女及212名孕婦。這212
名孕婦中有14名是懷孕第一期、64名是懷孕第二期及134名懷孕第三期。收集研究對象尿液,以Sandell-Kolthoff反應分析尿中碘濃度。未懷孕者、哺乳婦女及孕婦
尿中碘濃度的中位數分別為163.0ug/L、134.0ug/L及180.0ug/L。懷孕者第一期、第二期及第三期的尿中碘濃度中位數分別為165.0ug/L、221.5ug/L及178.0ug/L。而各組的尿液碘之20百分位濃度均超過50ug/L以上,指出不同組別的婦女均能從飲食中攝取到足夠的碘,而碘的營養狀態均達到理想的狀態。碘營養狀況由輕微至嚴重缺乏的情形分別為未懷孕者30.4%、哺乳婦女35.0%、孕婦22.2%、懷孕第一期28.5%、懷孕第二期18.8%及懷孕第三期23.1%。本研究建議懷孕及哺乳的婦女增加飲食中碘的攝取使碘的營養狀況達到理想狀態。
關鍵字:尿液碘、懷孕、哺乳、孕期、未懷孕者、巴布亞新幾內亞。
538 Asia Pac J Clin Nutr 2006;15 (4): 538-543
Original Article The relationship of neonatal serum vitamin B12 status with birth weight
S Muthayya PhD1, P Dwarkanath MSc
1, M Mhaskar MD2, R Mhaskar MD
2, A Thomas MD
2, CP Duggan MD MPH3, WW Fawzi MPH MS Dr PH
3, S Bhat MD4,
M Vaz MD1 and AV Kurpad MD PhD
1
1 Division of Nutrition, Institute of Population Health and Clinical Research, St. John’s National Academy of Health Sciences, Bangalore, India 2 Department of Obstetrics & Gynecology, St. John’s Medical College Hospital, Bangalore, India 3 Department of Nutrition, Harvard School of Public Health, Huntington Avenue, Boston, USA 4 Department of Pediatrics, St. John’s Medical College Hospital, Bangalore, India
Earlier studies have shown a relationship between maternal vitamin B12 status and birth weight. This study extends those findings directly in terms of neonatal vitamin B12 status and birth weight. One hundred and twelve women were followed from the first trimester of pregnancy and maternal blood was obtained in all three trimesters along with cord blood at birth of their neonates. The maternal and cord serum vitamin B12 concentrations were examined in relation to birth weight. There was a significant correlation between vitamin B12 concentration in maternal antenatal serum during each of the trimesters of pregnancy and cord serum (all P<0.01). Neonates that were born with lower birth weights (categories of < 2500 g and 2500-2999 g) had significantly lower mean cord serum vitamin B12 concentrations when compared to those who were ≥ 3000 g (P = 0.02 and P = 0.05 respectively). A similar, however, non significant trend was observed for antenatal vitamin B12 concentrations at first and third trimesters. Cord serum vitamin B12 concentrations were significantly correlated with birth weight, up to 40 weeks of pregnancy (r=0.28, P=0.01) but not beyond that (≥ 40 weeks gestation). Vitamin B12 status in the mother was related to neonatal vitamin B12 status as measured by cord serum vitamin B12 concentration. In addition, low neonatal vitamin B12 concentrations were adversely associated with low birth weights.
Key Words: neonatal vitamin B12, birth weight, India Introduction The prevention of low birth weight (LBW; <2500g), which affects nearly 30% of infants born in India, is a public health priority. Adverse outcomes for mothers and infants during pregnancy have been largely attributed to wide-spread maternal malnutrition. Previous studies have suggested that maternal status of micronutrients may in-fluence the risk of LBW1, and multiple micronutrient supplementation to antenatal women, at the level of once or twice the recommended daily allowance, has been shown to increase birth weight by approximately 100g.2-4 In a prospective observational study, recently carried out in Bangalore, India, we demonstrated a significant rela-tionship between low maternal vitamin B12 status and an increased risk of intra-uterine growth retardation (IUGR) after adjusting for potential confounding factors such as maternal weight, weight gain, age, education and parity.5 In that study, we also demonstrated that vitamin B12 intake was significantly correlated to the antenatal serum vitamin B12 concentrations, implicating poor vitamin B12 intake as a possible cause of low vitamin B12 status. Vitamin B12 intake in this study population was mainly from con-sumption of fish, egg, milk and minimally from red meat.
Other reports from Brazil6 and India7 have also demon-strated low maternal vitamin B12 status in pregnancy. In the general Indian population, low vitamin B12 intakes have been recorded in men and women living in urban slums8 and low vitamin B12 status has been shown in middle class men and women, some of whom were non-vegetarians reporting intakes of egg, poultry and lamb >2 times a week.9 Low cobalamin status has also been demonstrated in Asian Indians living in the USA, due primarily to low dietary intake; interestingly, homocysteine concentration did not always reflect a low cobalamin status.10 Given the relationship between maternal vitamin B12 intake and B12 status, and between status and birth outcome5, it is of interest to confirm that these relationships also extend to more direct measures of vitamin B12 status in the neonate, Correspondence address: Dr S Muthayya, Division of Nutrition, Institute of Population Health and Clinical Research,, St. John’s National Academy of Health Sciences, Bangalore 560 034, India Tel: (91 80) 2205 5059, Ext 134; Fax: (91 80) 2553 2037 E-mail: [email protected] Accepted: 30th April, 2006

S Muthayya, P Dwarkanath, M Mhaskar, R Mhaskar, A Thomas, CP Duggan, WW Fawzi, S Bhat, M Vaz, AV Kurpad 539
such as in the cord serum at birth, in addition to docu-menting the relationship and magnitude of difference between the maternal and cord serum concentrations of vitamin B12. In particular, the relationship between neo-natal serum vitamin B12 status at birth and birth weight has not been documented. Therefore, we investigated neonatal vitamin B12 status at birth using measures of cord serum, its association with maternal status and its direct effect on birth size in an urban hospital-based study, where the mothers came from differing socio-economic strata and had heterogeneous dietary intakes.
Subjects and Methods Study design The study was a prospective cohort study conducted at St. John’s Medical College Hospital, Bangalore, India, from November 2001 to August 2003. This 1200 bed tertiary hospital draws patients of diverse socioeconomic status, from urban slums to high income residential areas. Preg-nant volunteers were enrolled in early pregnancy (base-line) and followed up until delivery. Information on socio-demographic factors at baseline (approximately 12 weeks of gestation, 12.9 ± 3.3 weeks) and on maternal anthropometry, dietary intake, and blood at baseline, 2nd trimester of pregnancy (approximately 24 weeks of gestation, 24.1± 2.0 weeks) and 3rd trimester of pregnancy (approximately 34 weeks of gestation, 33.9 ± 1.2 weeks) and cord blood collected from the placental side of the cut umbilical cord, at delivery, were collected. The Insti-tutional Ethical Review Board at St. John’s Medical College approved all study procedures, and written in-formed consent was obtained from each study subject at enrolment. Study population All pregnant women aged 17-40 years who were below 20 weeks of gestation, and registered for antenatal screening at the Department of Obstetrics and Gyne-cology at St. John’s Medical College Hospital were in-vited to participate in the study. Every effort was made to recruit women as early in their pregnancy to carry out baseline measurements at 12 weeks of gestation. Women with multiple pregnancies, those with a clinical diagnosis of chronic illness such as diabetes mellitus, hypertension, heart disease and thyroid disease, those who tested posi-tive for hepatitis B (HbSAg), HIV or syphilis (VDRL) infections or who anticipated moving out of the city be-fore delivery were excluded. Four hundred and seventy eight women consented to be part of the study and were recruited. Of them, 410 (85.8%) completed the study with a known pregnancy outcome. In a sub-sample of 185 women, in whom blood collections were available for at least two trimesters of pregnancy, micronutrient con-centrations of vitamin B12 were measured from serum samples obtained at all three trimesters of pregnancy and from cord serum at delivery. Cord blood was obtained in 112 cases. Sociodemographic and anthropometric information At the baseline visit, trained research assistants inter-viewed the study subjects to obtain information on age, obstetric history, family composition and socioeconomic
status. Gestational age (in weeks) was calculated from the reported first day of the last menstrual period (LMP). Subsequent ultrasonographic measurements done within 2 weeks of the initial visit and again closer to the time of delivery were used to confirm gestational age calculated by LMP. A digital balance (Soehnle, Germany) was used to record the weights of all mothers to the nearest 100 g. Measurements of height were made using a stadiometer to the nearest 1 cm. Maternal body mass index (BMI) was calculated using weight and height at baseline (kg/m2). None of the women were smokers. Serum vitamin measurement Blood samples drawn from all subjects after an overnight fast by venipuncture using trained personnel or collected at birth from the placental side of the cord, were collected in plain vacutainers (Beckton Dickinson, New Jersey, USA). Serum vitamin B12 was determined using a kit em-ployed on an Automated Chemiluminescence System ACS:180 (Bayer Diagnostics, Tarrytown, USA). The intra batch CV assessed by using multiple determinations of pooled human serum with a vitamin B12 concentration of 348 pmol/L (n = 20) was 2.6% and inter batch CV (n=20) done over a period of 3 weeks (n=15) was 3.4%. Birth data Infants were weighed to the nearest 10 g on a standard beam scale balance immediately after birth. LBW was defined as birth weight <2500g (WHO, 1995). Preterm delivery was defined as delivery before 37 weeks of gestation. Of the 410 women who had a known pregnancy outcome, there were 26 spontaneous abortions, 7 still births, 30 premature deliveries and 347 births at full term. Statistical analysis All analyses were done with the SPSS program (version 11.5, SPSS, Chicago, IL). Only cases who delivered a full-term infant and in whom cord vitamin B12 concen-tration was also available (n=112) are included in this analysis. Results are presented as mean ± SD. Mean values were compared by the one way analysis of vari-ance with post-hoc tests (LSD). Correlations between cord serum vitamin B12 and birth weight was assessed using Pearson’s correlation coefficient. Two sided P va-lues <0.05 were considered statistically significant. Wo-men who delivered full term live babies and in whom cord blood was not collected had similar serum vitamin B12 concentrations (pg/ml) when compared with those used in this analysis at the 1st, 2nd and 3rd trimesters of pregnancy; 255 ± 125 (n=22), 202 ± 55 (n=27) and 206 ± 74 (n=28) vs 229 ± 81 (n=89), 208 ± 57 (n=100) and 197 ± 54 (n=106) respectively. Mean serum vitamin B12 concentrations in mothers who had fetal losses and pre-term babies were not significantly different from the group of mothers used in the main analysis of this report.
Results Demographic characteristics of the study population are listed in Table 1. Approximately 40% of the mothers were educated up to high school and the remaining 60 % had either a post-high school diploma or at least a uni-versity degree. Primiparous women made up 64% of the study cohort. Approximately 20% of the women had a

540 Neonatal serum vitamin B12 and birth weight
BMI less than 18.5 kg/m2 at enrolment. Mean birth weight was 2.90 ± 0.39 kg; 18% of the newborns had low birth weights (<2.5 kg). Concentrations of vitamin B12 in the newborns and their mothers during the 3 trimesters of pregnancy are presented in Figure 1. Neonatal con-centrations were about 27% higher than in maternal sam-ples measured at all times during pregnancy. There was a significant correlation between vitamin B12 concentration in maternal antenatal serum during each of the trimesters of pregnancy and cord serum (Fig. 1); a strong rela-tionship was observed for the 2nd and 3rd trimesters [r=0.54 (P=0.000) and r=0·56 (P=0.000) respectively]. The relationship between neonatal serum B12 levels and birth weight was assessed initially by a group-wise ana-lysis which showed that significant differences existed in cord serum vitamin B12 concentrations between groups of infants, based on birth weight (Table 2). Maternal serum vitamin B12 concentrations at each trimester increased with increasing birth weight. How-ever, these increases in maternal serum B12 were sig-nificant only during the 2nd trimester; here maternal serum vitamin B12 values were significantly higher in the ≥3000 g birth weight group as compared to the LBW (<2500g) group (Table 2). We extended the analysis of the
Table 1. Maternal baseline characteristics (n=112)
Parameter Value
Age (y) 24.2 ± 4.0
Parity1 0 72 (64.3) 1-2 38 (33.9) >3 2 (1.8) Educational level1 Up to high school 44 (39.3) Diploma 33 (29.5) University degree & above 35 (31.3) Anthropometry Weight (kg) 53.1 ± 11.0 Height (m) 1.54 ± 0.06 BMI (kg/m2) 22.2 ± 4.13
Mean ± SD; N (%).
Figure 1. X-axis in the different panels represents maternal serum vitamin B12 status. Upper Left Panel : First trimester, Lower Left Panel: Second trimester, Upper Right Panel: Third trimester. Correlation values (r and P value) given in each panel for respective trimester.
100
200
300
400
500
600
700
100 200 300 400
Maternal B12 concentration (pg/ml)Third trimester
Co
rd B
12 c
on
cen
trat
ion
(p
g/m
l)
r=0.557;p=0.000
Table 2. Neonatal (cord) and maternal (first, second and trimester) serum vitamin B12 status (pg/ml) in relation to birth size
Period Birth weight ANOVA (P value)
Post –hoc group comparisons (P value)
Group 1 <2500 g
Group 2 2500-2999 g
Group 3 >3000 g
Group 1 vs. Group 2
Group 1 vs. Group 3
Group 2 vs. Group 3
Neonate 264 ± 85† (n=20)
268 ± 93‡ (n=45)
320 ± 127 (n=47)
0.038 0.893 0.022 0.054
Mother 1st trimester
211 ± 88 (n=16)
231 ± 78 (n=39)
234 ± 78 (n=39)
0.611 0.395 0.886 0.337
Mother 2nd trimester
188 ± 45† (n=19)
208 ± 56 (n=43)
221 ± 62 (n=44)
0.106 0.208 0.280 0.036
Mother 3rd trimester
186 ± 52 (n=19)
191 ± 45 (n=44)
211 ± 61 (n=42)
0.120 0.725 0.091 0.084
Group 1: < 2500 g; Group 2: 2500-2999 g; Group 3: > 3000 g; †Significant difference by one-way ANOVA between birth weight category <2500 g vs >3000 g. ‡Significant difference by one-way ANOVA between birth weight category 2500-2999 g vs ≥ 3000 g.
100
200
300
400
500
600
700
100 200 300 400 500 600
Maternal B12 concentration (pg/ml) First trimester
Co
rd B
12 c
on
cen
trat
ion
(p
g/m
l)
r=0.289;p=0.005
100
200
300
400
500
600
700
100 200 300 400
Maternal B12 concentration (pg/ml)Second trimester
Co
rd B
12 c
on
cen
trat
ion
(p
g/m
l)
r=0.543; p=0.000

S Muthayya, P Dwarkanath, M Mhaskar, R Mhaskar, A Thomas, CP Duggan, WW Fawzi, S Bhat, M Vaz, AV Kurpad 541
relationship between neonatal serum B12 concentration and birth weight by evaluating whether there was a linear association between these variables (Fig. 2). When cord serum B12 concentrations were plotted against birth weight for all infants, there was no significant relation-ship. However, when cord serum B12 values were corre-lated with birth weights of infants born between 37-39 weeks of gestation, there was a significant correlation (r=0.28, P=0.01, n=76). In contrast, there was no rela-tionship (r= -0.13, P=0.45, n=36) between cord serum B12 concentrations and birth weight when this was assessed in infants who were born at or after 40 weeks of gestation.
Discussion The present study showed that vitamin B12 status in the mothers was correlated to neonatal vitamin B12 status, as measured by cord serum vitamin B12, at all trimesters of pregnancy, similar to what has been shown before.11,12 In general, both maternal and fetal vitamin B12 concen-trations were lower than reported in western subjects11; this may be linked to their lower dietary vitamin B12 intake as has been suggested in ovo-lacto vegetarians and low-meat eaters13 and our earlier report in vegetarian and non-vegetarian Indian pregnant women.5 Cord serum vitamin B12 concentrations were linearly associated with birth weight, such that increasing concentrations were associated with increasing birth weight. In an earlier ana-lysis using the same, but extended, dataset5, we had de-monstrated that a low maternal vitamin B12 concentration throughout pregnancy was independently associated with an increased risk of intrauterine growth retardation (IUGR), after controlling for confounding factors, in urban Indian women. Furthermore, vitamin B12 status was significantly related to vitamin B12 intake at each of the 3 trimesters in these women. The association between vitamin B12 in the mother and neonate as early as in the first trimester suggests that it is important to enhance maternal B12 stores. This may need to be considered as early as the peri-conceptual period, although this would need to be tested prospectively. Previous studies on vitamin B12 sta-
tus and its effect on birth weight have produced con-flicting results. An earlier study reported negative corre-lations between birth weight and maternal vitamin B12
concentration at delivery in smokers in a group of western women.14 More recently, Yajnik et al.,7 reported no relationship between maternal plasma vitamin B12 con-centration and offspring size in rural Indian women. The authors concluded that the lack of an association might have been due to an overall low vitamin B12 status. Ano-ther study conducted in the United Kingdom showed no relationship between maternal vitamin B12 concentrations in early pregnancy and birth weight15; the mean vitamin B12 status in this study was 324 + 132 pg/ml, which was about one and a half times the value observed in the present study, suggesting that it would be difficult to demonstrate a nutrient effect in these women who were vitamin B12 replete. The reason the present study may have shown an association between vitamin B12 and birth size might be related to the relatively wide inter-quartile ranges of vitamin B12 status observed; 132-363 pg/ml across all trimesters of pregnancy compared to 118-203 pg/ml in the rural Indian study.7 Vitamin B12 deficiency has a role in elevating plasma homocysteine (Hcy) and lowering methyl donor levels in pregnancy and has been implicated in adverse pregnancy outcomes including low birth weight.16 Methionine syn-thase is an enzyme which catalyzes the methylation of homocysteine to methionine using vitamin B12 as a co-factor and methyltetrahydrofolate as a substrate.17 The formation of methionine through this pathway represents an important component of the one-carbon metabolism for synthesis of phospholipids, proteins, myelin, cate-cholamines, DNA and RNA. A deficiency of either vita-min B12 and/or folic acid is likely to affect this pathway resulting in an elevation of plasma Hcy with a relatively low methionine level. Low vitamin B12 concentrations in pregnant women and their babies are associated with low S-adenosyl methionine to S-adenosyl homocysteine ratios.6 An earlier report on Indian subjects showed an association between higher plasma homocysteine (Hcy) concentrations and low birth weight, but could not de-monstrate a relationship between vitamin B12 status and birth weight although there was a significant inverse rela-tionship between vitamin B12 status and plasma homo-cysteine (Hcy) status.7 From a speculative view-point, it might also be considered that the antenatal supple-mentation of folate, as is the norm, without vitamin B12 could aggravate the methyl folate trap,18 and decrease the rate of neural growth and myelination in utero, leading to a diminished trophic effect on muscle growth and baby size. This is not unreasonable, as myelination has been shown to be retarded in a vitamin B12 deficient child19 and clinical cobalamin deficiency with growth failure has been reported in 2 breast fed children of vegan mothers20; after treatment for cobalamin deficiency, both children showed marked improvement in cobalamin status and development. An association between low serum and amniotic fluid concentrations of B12 and neural-tube defects has also been reported.21 It is not clear why there was a significant association between birth weight and cord serum B12 of term infants with a gestational age of 37-39 weeks and not in infants
Figure 2. Figure shows a scatter plot of neonatal serum vitamin B12 status and birth weight. Solid line represents the relationship between the variables for babies with gestational age of 37-39 weeks (r=0.3, P=0.013). Dashed line represents the same relationship for babies with gestational age ≥ 40 weeks (r=0.1, P = 0.45).
1500
2000
2500
3000
3500
4000
100 200 300 400 500 600 700 800
Cord Vitamin B12 concentration (pg/mL)
Bir
th w
eig
ht
(g)
542 Neonatal serum vitamin B12 and birth weight
who were delivered ≥ 40 weeks gestation in the present study. It is known that as pregnancy extends post term, the incidence of placental insufficiency and fetal post-maturity (dysmaturity) increases rapidly as a consequence of reduced respiratory and nutritive placental function.22
Postmaturity is correlated with an increased incidence of placental lesions, fetal hypoxia-asphyxia, intrauterine growth retardation, increased perinatal death, and neo-natal morbidity.22 At a biochemical level, placental phy-siopathology in post term, post mature pregnancies is not well understood. However, it can be speculated that the relationship between blood nutrient concentrations and birth weight might be confounded by poor placental function in late term pregnancies. In summary, the present study extends and confirms our earlier observations that there is a relationship be-tween increasing antenatal vitamin B12 concentrations and birth weight in Indian babies. The low maternal vitamin B12 status translates into a low neonatal vitamin B12 status as evinced by cord serum vitamin B12 concentrations. The neonatal vitamin B12 status – birth weight relation-ship seems to operate up to a term gestation of 40 weeks. Beyond this age, there appears to be no relationship between neonatal vitamin B12 status and birth weight. Acknowledgement We greatly appreciate the assistance of Nancy Nanditha, V Manjula, MN Selvi and Mercy in the collection and entry of data and of JV Gnanou for sample handling and all laboratory measurements. We thank the women and their infants who participated in this study and the doctors, nurses and laboratory technicians who made this study possible. References 1. Rao S, Yajnik CS, Kanade A, Fall CH, Margetts BM,
Jackson AA, Shier R, Joshi S, Rege S, Lubree H, Desai B. Intake of micronutrient-rich foods in rural Indian mothers is associated with the size of their babies at birth: Pune Maternal Nutrition Study. J Nutr 2001; 131: 1217-24.
2. Fawzi WW, Msamanga GI, Spiegelman D, Urassa EJ, McGrath N, Mwakagile D, Antelman G, Mbise R, Herrera G, Kapiga S, Willett W, Hunter DJ. Randomised trial of effects of vitamin supplements on pregnancy outcomes and T cell counts in HIV-1-infected women in Tanzania. Lancet 1998; 351: 1477-82.
3. Kaestel P, Michaelsen KF, Aaby P, Friis H. Effects of prenatal multimicronutrient supplements on birth weight and perinatal mortality: a randomised, controlled trial in Guinea-Bissau. Eur J Clin Nutr. 2005; 6.
4. Osrin D, Vaidya A, Shrestha Y, Baniya RB, Manandhar DS, Adhikari RK, Filteau S, Tomkins A, Costello AM. Effects of antenatal multiple micronutrient supple-mentation on birthweight and gestational duration in Nepal: double-blind, randomised controlled trial. Lancet 2005; 365: 955-62.
5. Muthayya S, Kurpad AV, Duggan CP, Bosch RJ, Dwarkanath P, Mhaskar A, Mhaskar R, Thomas A, Vaz M, Bhat S, Fawzi WW. Maternal vitamin B12 status is a risk factor for intrauterine growth retardation in South Indians. Eur J Clin Nutr 2006; 60: 791-801.
6. Guerra-Shinohara EM, Morita OE, Peres S, Pagliusi RA, Sampaio Neto LF, D'Almeida V, Irazusta SP, Allen RH, Stabler SP. Low ratio of S-adenosylmethionine to S-adenosylhomocysteine is associated with vitamin defi-ciency in Brazilian pregnant women and newborns. Am J Clin Nutr 2004; 80: 1312 - 21
7. Yajnik CS, Deshpande SS, Panchanadikar AV, Naik SS, Deshpande JA, Coyaji KJ, Fall C, Refsum H. Maternal total homocysteine concentration and neonatal size in India. Asia Pac J Clin Nutr 2005; 14: 179-81
8. Misra A, Vikram NK, Pandey RM, Dwivedi M, Ahmad FU, Luthra K, Jain K, Khanna N, Devi JR, Sharma R, Guleria R. Hyperhomocysteinemia, and low intakes of folic acid and vitamin B12 in urban North India. Eur J Nutr 2002; 41: 68-77.
9. Refsum H, Yajnik CS, Gadkari M, Schneede J, Vollset SE, Orning L, Guttormsen AB, Joglekar A, Sayyad MG, Ulvik A, Ueland PM. Hyperhomocysteinemia and ele-vated methylmalonic acid indicate a high prevalence of cobalamin deficiency in Asian Indians. Am J Clin Nutr 2001; 74: 233-41.
10. Carmel R, Mallidi PV, Vinarskiy S, Brar S, Frouhar Z. Hyperhomocysteinemia and cobalamin deficiency in young Asian Indians in the United States. Am J Hematol 2002; 70: 107-14.
11. Bjorke Monsen AL, Ueland PM, Vollset SE, Guttormsen AB, Markestad T, Solheim E, Refsum H. Determinants of cobalamin status in newborns. Pediatrics 2001; 108: 624-30.
12. Obeid R, Munz W, Jager M, Schmidt W, Herrmann W. Biochemical indexes of the B vitamins in cord serum are predicted by maternal B vitamin status. Am J Clin Nutr 2005; 82: 133 – 39
13. Koebnick C, Hoffmann I, Dagnelie PC, Heins UA, Wickramasinghe SN, Ratnayaka ID, Gruendel S, Lindemans J, Leitzmann C. Long-term ovo-lacto vege-tarian diet impairs vitamin B-12 status in pregnant women. J Nutr 2004; 134: 3319-26.
14. Frery N, Huel G, Leroy M, Moreau T, Savard R, Blot P, Lellouch J. Vitamin B12 among parturients and their newborns and its relationship with birthweight. Eur J Obstet Gynecol Reprod Biol 1992; 45: 155-63.
15. Relton CL, Pearce MS, Parker L. The influence of erythrocyte folate and serum vitamin B12 status on birth weight. Br J Nutr 2005; 93: 593-9.
16. Vollset SE, Refsum H, Irgens LM, Emblem BM, Tverdal A, Gjessing HK, Monsen ALB, Ueland PM. Plasma total homocysteine, pregnancy complications, and adverse pregnancy outcomes: the Hordaland Homocysteine Study. Am J Clin Nutr 2000; 71: 962-68.
17. Finkelstein JD Methioine metabolism in mammals. J Nutr Biochem 1990; 1: 228-37.
18. Scott JM, Dinn JJ, Wilson P, Weir DG. Pathogenesis of subacute combined degeneration: a result of methyl group deficiency. Lancet 1981; 2: 334–7.
19. Lovblad K, Ramelli G, Remonda L, Nirkko AC, Ozdoba C, Schroth G. Retardation of myelination due to dietary vitamin B12 deficiency: cranial MRI findings. Pediatr Radiol 1997; 27: 155-8.
20. Anonymous. Neurologic impairment in children asso-ciated with maternal dietary deficiency of cobalamin-Georgia. MMWR Morb Mortal Wkly Rep 2003; 52: 61-4.

S Muthayya, P Dwarkanath, M Mhaskar, R Mhaskar, A Thomas, CP Duggan, WW Fawzi, S Bhat, M Vaz, AV Kurpad 543
21. Steen MT, Bodie AM, Fisher AJ, MacMahon W, Saxe D, Sullivan KM, Dembure PP, Elsas LJ. Neural-tube defects are associated with low concentrations of cobalamin (Vitamin B12) in amniotic fluid. Prenatal. Diagnosis 1998; 18: 545-55.
22. Vorherr H. Placental insufficiency in relation to postterm pregnancy and fetal postmaturity. Evaluation of feto-placental function; management of the postterm gravida. Am J Obstet Gynecol 1975; 123: 67-103.
Original Article The relationship of neonatal serum vitamin B12 status with birth weight
S Muthayya PhD
1, P Dwarkanath MSc1, M Mhaskar MD
2, R Mhaskar MD2,
A Thomas MD2, CP Duggan MD MPH
3, WW Fawzi MPH MS Dr PH3, S Bhat MD
4, M Vaz MD
1 and AV Kurpad MD PhD1
1 Division of Nutrition, Institute of Population Health and Clinical Research, St. John’s National Academy of Health Sciences, Bangalore, India 2 Department of Obstetrics & Gynecology, St. John’s Medical College Hospital, Bangalore, India 3 Department of Nutrition, Harvard School of Public Health, Huntington Avenue, Boston, USA 4 Department of Pediatrics, St. John’s Medical College Hospital, Bangalore, India
新生兒血清維生素新生兒血清維生素新生兒血清維生素新生兒血清維生素B12狀況與出生體重的相關性狀況與出生體重的相關性狀況與出生體重的相關性狀況與出生體重的相關性
早期研究指出母親的維生素B12營養狀況與嬰兒出生體重具相關性。本研究延伸先前的發現,針對新生兒維生素B12營養狀況與出生體重。112名女性從懷孕第一期即開始追蹤,並且取得其三個孕期的血液及其新生兒出生時的臍帶血。評估母親及新生兒臍帶血中的血清維生素B12濃度與出生體重的相關性。懷孕三個時期與臍帶的血清均與母親產前的血清維生素B12濃度具有顯著相關(所有P<0.01)。新生兒出生時體重較輕者(分<2500公克及2500-2999 公克 兩類) 比起出 生時 體重
≥3000公克者,其臍帶血清的維生素B12平均濃度顯著較低(P值分別為0.02及0.05)
。然而,產前第一孕期跟第三孕期之維生素B12濃度雖有類似的趨勢,但是不顯著。懷孕週數40週以前,臍帶血清中維生素B12濃度與出生體重達統計顯著相關
(r=0.28,P=0.01),但是之後就沒有此現象(懷孕週數≥40週)。母親維生素B12的營養狀況與新生兒的維生素B12的營養狀況(以臍帶血清中的維生素B12濃度代表)相關。此外,低新生兒維生素B12濃度與低出生體重呈相關負相關。
關鍵字:新生兒維生素B12、出生體重、印度。

544 Asia Pac J Clin Nutr 2006;15 (14): 544-550
Original Article Anti-inflammatory and anticatabolic effects of short-term ββββ-hydroxy-ββββ-methylbutyrate supplementation on chronic obstructive pulmonary disease patients in intensive care unit Lan-Chi Hsieh MS
1, Shu-Ling Chien MS2, Ming-Shong Huang BS
3, Hung-Fu Tseng PhD
4 and Chen-Kang Chang PhD5
1 Department of Dietetics, 2Intensive Care Unit, 3Medical Laboratory, Kaohsiung Municipal United Hospital, Kaohsiung, Taiwan, R.O.C. 4 Institute of Medical Research, Chang-Jung Christian University, Tainan, Taiwan, R.O.C. 5 Department of Sport Management and Sport Science Research Center, National Taiwan College of Physical Education, Taichung, Taiwan, R.O.C.
Elevated inflammatory markers and muscle wasting were common in chronic obstructive pulmonary disease (COPD) patients. The purpose of this study was to investigate the effect of 7-day β-hydroxy-β-methylbutyrate (HMB) supplementation on inflammation, protein metabolism, and pulmonary function in COPD patients in an intensive care unit. Thirty-four COPD patients who required mechanical ventilators were randomly assigned to HMB (n=18) or control (n=16) groups. The HMB group received ΗΜΒ 3 g/d for 7 days. White blood cell count, C-reactive protein, and creatinine were significantly lower, while cholesterol and total protein were significantly higher after ΗΜΒ supplementation. The body weight remained unchanged in both groups. Ten subjects (55.6%) in the HMB group and 4 subjects (25.0%) in the control group had improved pulmonary function, indicated by their ventilator modes. This short-term study suggests that ΗΜΒ supplementation may have anti-inflammatory and anticatabolic effect and improve pulmonary function in COPD patients in an intensive care unit setting.
Key Words: ββββ-hydroxy-ββββ-methylbutyrate, inflammation, C-reactive protein, chronic obstructive pulmonary disease Introduction Chronic obstructive pulmonary disease (COPD) is a major cause of morbidity worldwide and affects more than 14 million patients in the United States alone.1 It is estimated to become the fifth leading cause of death and disability worldwide by the year 2020.2 Several inflammatory mar-kers, including C-reactive protein (CRP),3 leukocyte count,3 tumor necrosis factor (TNF)-α4-6, soluble TNF-α receptors,3,6 and lipopolysaccharide binding protein,3,7 have been shown to be elevated in patients with COPD. The increased TNF-α production was thought be linked to tissue hypoxia.6 Muscle wasting is also common in COPD patients8 and has been linked to increased mortality, inde-pendent of lung function.9 In addition to increased basal metabolism, resulting from higher energy cost of brea-thing,10,11 systemic inflammation, tissue hypoxia, physical inability,12 elevated whole-body protein turnover,13 and imbalance in plasma and muscle amino acid concen-trations7 were all thought to play a role in muscle wasting in these patients. Nutritional support, with the aim to prevent muscle wasting and/or increase lean body mass, have had limited success in COPD patients. The weight gains after 1 to 4 months of aggressive nutritional support were usually less
than 5 kg.12 The high dietary calorie intake was into-lerable in many COPD patients due to the increased CO2 production and breath load.14 A high incidence of gastro-intestinal complications, such as bloating, early satiety and postprandial dyspnea, further limited the consumption of calories and nutrients.15 Therefore, other therapeutic agents or methods may be considered in combination with regular nutritional support to prevent muscle wasting in COPD patients. β-hydroxy-β-methylbutyrate (HMB) is a derivative of
leucine, metabolized from its transamination product, β-ketoisocaproate.16 Several animal and human studies have implicated anticatabolic effect of HMB on skeletal muscles.16-18 Most human studies have showed that supple-mentation of HMB for 2-7 weeks during weight training programs can increase muscle mass and/or decrease muscle
Correspondence address: Dr Chen-Kang Chang, Sport Science Research Center, National Taiwan College of Physical Education, 16, Sec 1, Shuan-Shih RD, Taichung, 404, Taiwan, R.O.C. Tel: +886 (4) 22213108 Ext 2210, Fax: +886 (4) 22256937 Email: [email protected] Accepted 2 December 2005

L-Chi Hsieh, S-L Chien, M-S Huang, H-F Tseng and C-K Chang 545
breakdown.17,19-21 A clinical study suggested that in hu-man immunodeficiency virus (HIV)-infected patients, a combination of 3g HMB, 14g glutamine, and 14g arginine resulted in significant increases in body weight, fat free mass, and immune status, compared to the placebo group after 8 weeks.22 It has been speculated that the anti-catabolic effect of HMB was to reduce skeletal muscle proteolysis, although no specific mechanism has been demonstrated.18 In addition, HMB has been suggested to enhance lymphocyte blastogenesis in vitro16,23 and nitrite production in macrophage and antibody production in chickens.24
The potential anticatabolic effect of HMB may re-duce muscle wasting and help the weaning from venti-lators in COPD patients. The purpose of this study was to investigate the effect of 3 g/d HMB supplementation for 7 days on inflammation, protein metabolism, and pul-monary function in COPD patients in an intensive care unit (ICU) setting. The dose of 3 g/d was selected for this study because it has been shown to be effective in most literatures17,19-21 and well-tolerated even in very weak patients.22
Materials and methods Subjects COPD patients were recruited from the ICU of Kaohsiung Municipal United Hospital, Kaohsiung, Taiwan. All subjects were clinically diagnosed with COPD and free of cancer, liver disease, chronic renal failure and sepsis. All subjects had a history of COPD for at least 5 years. They were admitted to ICU due to complications requiring me-chanical ventilators. The first 36 COPD patients admitted to ICU, after the beginning of the study period, were recruited. The randomization was achieved by assigning the subjects to HMB or control groups in alternative order of their admission to ICU. That is, the odd-numbered admissions were assigned to HMB group, whilst the even-numbered were assigned to control group. Thirty-four subjects, including 18 in HMB (11 males, 7 females) and 16 in control (10 males, 6 females) groups, completed the study. Two female subjects in the control group trans-ferred to other hospitals for personal reasons during the study period. The HMB group received HMB (calcium
salt, Musashi, Vicoria, Australia) 3g/d for 7 days, in 2 equal daily doses given through a nasogastric feeding tube after lunch and dinner by nurses under the super-vision of dietitians. This study was approved by the re-view board of Kaohsiung Municipal United Hospital. All subjects signed an informed consent after the nature of the procedures had been explained. The procedures followed were in accordance with the Declaration of Helsinki in 1995, as revised in Edinburgh 2000. All subjects gave in-formed consent after the procedure and risks of the study were clearly explained.
The settings of ventilators, including inspired oxygen concentration (FiO2), mode of ventilation, pressure, vo-lume, and respiration rate were determined by physicians and respiratory technicians according to each patient’s physiological conditions. The physicians and respiratory technicians were completely blind to which group the subjects were in. All subjects were fed mixed commer-cial formulas, containing 30% calorie from carbohydrate, 47% from fat, and 23% from protein (1330 kcal/L). The daily intake was recorded by nurses. Body weight was measured with bed scales. Biochemical parameters, pul-monary function, and body weight were measured before and after the 7-day study period. Blood analysis Biochemical parameters of fasting venous blood were measured in the clinical laboratory of the hospital with standard protocols using an automatic analyzer (Hitachi, Japan). CRP was measured with an immunoturbidimetric method using a commercial kit (DiaSys diagnostic, Hol-zheim, Germany).
Pulmonary functions The blood sampling and measurement of minute venti-lation and static inspiratory and expiratory pressure (PI and PE, respectively) were performed by a trained nurse. Arterial blood was withdrawn in the morning after an overnight fast when the patients were breathing air from ventilators. The arterial oxygen tension (PaO2), arterial carbon dioxide tension (PaCO2), and pH were measured with a blood gas analyzer (AVL, Graz, Austria). Minute ventilation was measured with a respirometer (Ferraris
HMB (N = 18) Control (N = 16)
Baseline After Baseline After
PI (cm H2O) -19.44 ± 10.86 -19.83 ± 13.01 -15.69 ± 7.98 -13.63 ± 7.97
PE (cm H2O) 20.11 ± 8.36 21.50 ± 11.69 19.63 ± 9.21 21.94 ± 6.24
FiO2 (%) 54.44 ± 23.07 40.00 ± 16.33 51.25 ± 23.98 46.45 ± 24.51
PaO2 (mm Hg) 101.69 ± 40.43 91.21 ± 16.88 126.85 ± 49.08 107.35 ± 28.07
PaCO2 (mm Hg) 43.13 ± 15.89 40.68 ± 5.60 35.89 ± 11.93 41.16 ± 15.22*
SaO2 (%) 96.75 ± 3.18 97.17 ± 1.45 97.77 ± 1.67 97.39 ± 1.45
PI, static inspiratory pressure; PE, static expiratory pressure; FiO2, inspired oxygen concentration; PaO2, arterial oxygen pressure; PaCO2, arterial carbon dioxide pressure; SaO2, oxygen saturation. *After vs baseline within the same group; P<0.01.
Table 1. Pulmonary functions and arterial blood gases of HMB and control groups at baseline and after the 7-day study period (mean ± standard deviation)

546 HMB supplementation on COPD in ICU
Medical Inc., Louisville, CO, USA). PI and PE were measured with an inspiratory force meter (Boehringer Laboratories Inc., Norristown, PA, USA).
Statistical analysis The variables before and after the treatment within each group were analyzed by paired t-test. The percentages of subjects with improved and maintained or deteriorated pulmonary functions in the 2 groups were compared with Fisher’s exact test. Baseline levels of all variables be-tween the 2 groups were analyzed by t-test. The magni-tude of change of variables was calculated as (after – baseline)/baseline. The magnitude of change of the 2 groups was analyzed by regression analysis, controlling for baseline BMI. All analysis was performed using SPSS 11.0 for Windows (Chicago, IL, USA). A P value <0.05 was considered significant. All measured variables are expressed as mean ± SD.
Results The age of subjects in HMB and control groups was 78.8 ± 9.7 and 78.3 ± 7.4 years, respectively (data not shown). The height of subjects was 1.58 ± 0.09 m in HMB group and 1.62 ± 0.09 m in control group (data not shown). There was no significant difference in age or height between the groups. Table 1 shows the pulmonary function and arterial blood gas measurements of HMB and control groups at the baseline and after the study period. PaCO2 was significantly higher after 7 days in the control group. There was no significantly difference at baseline between the HMB and control groups in all pulmonary parameters.
Blood parameters and body weight of HMB and con-trol groups before and after the study period are presented in Table 2. The HMB group had significantly higher body weight (P = 0.048) and marginally significantly higher BMI (P = 0.056) at baseline than the control group. To avoid the potential effect of the difference in nutritional status on biochemical parameters, regression analysis was used to control for baseline BMI. White blood cell count and creatinine were significantly lower
and cholesterol significantly higher after HMB, supplementation compared to baseline. The magnitude of change between the 2 groups were marginally signi-ficantly different in white blood cell count (P = 0.074) and cholesterol (P = 0.063), after controlling for baseline BMI. The body weight remained unchanged after the study in both groups. There was no significant difference in average daily caloric intake during the study period (2066.5 ± 362.4 and 2175.3 ± 399.6 kcal for HMB and control group, respectively). CRP was significantly lower after HMB supplementation, but remained unchanged in the control group (baseline vs after: 111.56 ± 91.47 vs 46.19 ± 45.29 mg/L in HMB group; 110.59 ± 81.35 vs 72.65 ± 64.72 mg/L in control group) (Fig. 1). The magnitude of change in CRP between the 2 groups was similar after controlling for baseline BMI.
Ten subjects in the HMB group and 4 subjects in control group had improved pulmonary functions since their ventilators were changed from pressure control ven-tilation (PCV) or assist/control (A/C) mode to pressure support ventilation (PSV) or synchronized intermittent mandatory ventilation (SIMV)+PSV mode (Table 3). Seven subjects (38.9%) in HMB group and 12 subjects (75%) in the control group remained at the same ven-tilator mode after the study. One subject (5.6%) in the HMB group showed deteriorated pulmonary function as his ventilator was changed from SIMV+PSV mode to A/C mode. When the subjects with maintained and deteriorated pulmonary functions were pooled together, the percentage of subjects with improved pulmonary function in HMB group was marginally significantly higher than that in the control group (P =0.092).
Discussion In this group of elderly COPD patients, supplementation of HMB at 3 g/d for 7 days may reduce inflammation and improve pulmonary function. CRP and white blood cell count were significantly reduced in the HMB group after the study period. The acute-phase protein CRP, a sen-sitive marker for early inflammation,25 has been shown to be elevated in COPD patients,3 especially during exacer-bation.26 Several other markers of inflammation were
0
50
100
150
200
250
HMB Control
mg
/L
*
Figure 1. Plasma CRP concentration at baseline and after the 7-day study period in HMB and control groups. Open bar: baseline, close bar: after supplementation. *p<0.05, after vs baseline within the same group.
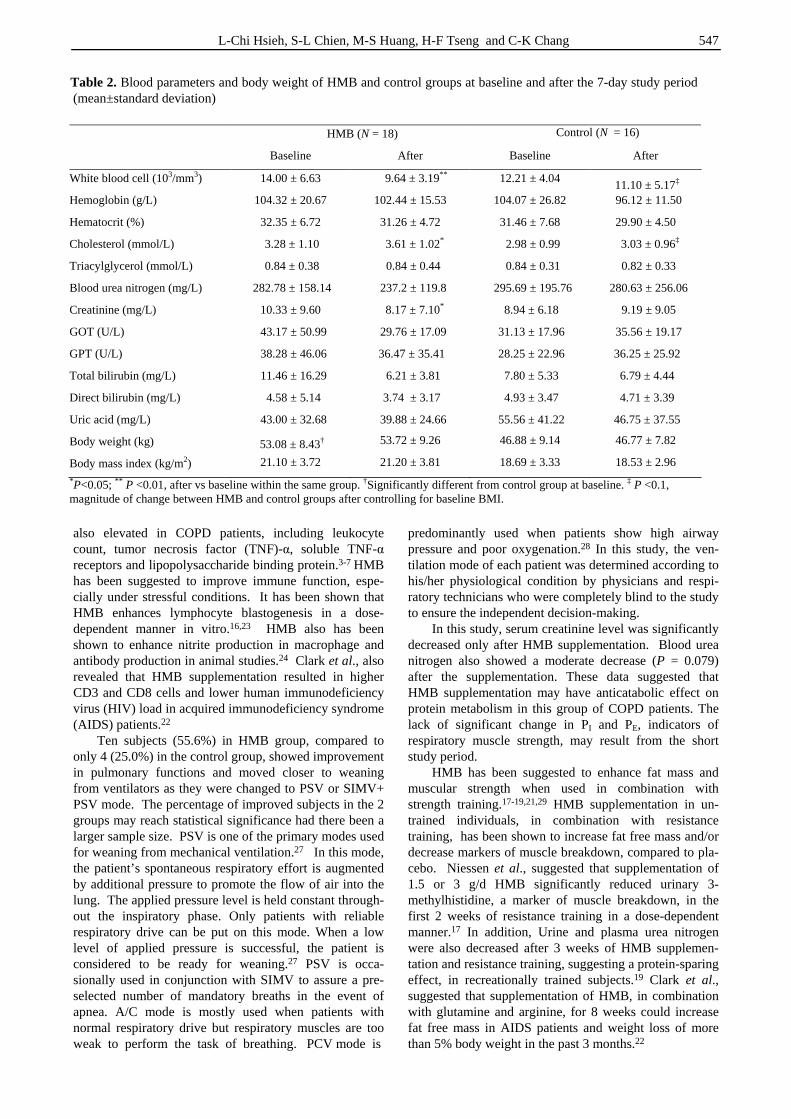
L-Chi Hsieh, S-L Chien, M-S Huang, H-F Tseng and C-K Chang 547
also elevated in COPD patients, including leukocyte count, tumor necrosis factor (TNF)-α, soluble TNF-α receptors and lipopolysaccharide binding protein.3-7 HMB has been suggested to improve immune function, espe-cially under stressful conditions. It has been shown that HMB enhances lymphocyte blastogenesis in a dose-dependent manner in vitro.16,23 HMB also has been shown to enhance nitrite production in macrophage and antibody production in animal studies.24 Clark et al., also revealed that HMB supplementation resulted in higher CD3 and CD8 cells and lower human immunodeficiency virus (HIV) load in acquired immunodeficiency syndrome (AIDS) patients.22
Ten subjects (55.6%) in HMB group, compared to only 4 (25.0%) in the control group, showed improvement in pulmonary functions and moved closer to weaning from ventilators as they were changed to PSV or SIMV+ PSV mode. The percentage of improved subjects in the 2 groups may reach statistical significance had there been a larger sample size. PSV is one of the primary modes used for weaning from mechanical ventilation.27 In this mode, the patient’s spontaneous respiratory effort is augmented by additional pressure to promote the flow of air into the lung. The applied pressure level is held constant through-out the inspiratory phase. Only patients with reliable respiratory drive can be put on this mode. When a low level of applied pressure is successful, the patient is considered to be ready for weaning.27 PSV is occa-sionally used in conjunction with SIMV to assure a pre-selected number of mandatory breaths in the event of apnea. A/C mode is mostly used when patients with normal respiratory drive but respiratory muscles are too weak to perform the task of breathing. PCV mode is
predominantly used when patients show high airway pressure and poor oxygenation.28 In this study, the ven-tilation mode of each patient was determined according to his/her physiological condition by physicians and respi-ratory technicians who were completely blind to the study to ensure the independent decision-making.
In this study, serum creatinine level was significantly decreased only after HMB supplementation. Blood urea nitrogen also showed a moderate decrease (P = 0.079) after the supplementation. These data suggested that HMB supplementation may have anticatabolic effect on protein metabolism in this group of COPD patients. The lack of significant change in PI and PE, indicators of respiratory muscle strength, may result from the short study period.
HMB has been suggested to enhance fat mass and muscular strength when used in combination with strength training.17-19,21,29 HMB supplementation in un-trained individuals, in combination with resistance training, has been shown to increase fat free mass and/or decrease markers of muscle breakdown, compared to pla-cebo. Niessen et al., suggested that supplementation of 1.5 or 3 g/d HMB significantly reduced urinary 3-methylhistidine, a marker of muscle breakdown, in the first 2 weeks of resistance training in a dose-dependent manner.17 In addition, Urine and plasma urea nitrogen were also decreased after 3 weeks of HMB supplemen-tation and resistance training, suggesting a protein-sparing effect, in recreationally trained subjects.19 Clark et al., suggested that supplementation of HMB, in combination with glutamine and arginine, for 8 weeks could increase fat free mass in AIDS patients and weight loss of more than 5% body weight in the past 3 months.22
HMB (N = 18) Control (N = 16)
Baseline After Baseline After
White blood cell (103/mm3) 14.00 ± 6.63 9.64 ± 3.19** 12.21 ± 4.04 11.10 ± 5.17‡
Hemoglobin (g/L) 104.32 ± 20.67 102.44 ± 15.53 104.07 ± 26.82 96.12 ± 11.50
Hematocrit (%) 32.35 ± 6.72 31.26 ± 4.72 31.46 ± 7.68 29.90 ± 4.50
Cholesterol (mmol/L) 3.28 ± 1.10 3.61 ± 1.02* 2.98 ± 0.99 3.03 ± 0.96‡
Triacylglycerol (mmol/L) 0.84 ± 0.38 0.84 ± 0.44 0.84 ± 0.31 0.82 ± 0.33
Blood urea nitrogen (mg/L) 282.78 ± 158.14 237.2 ± 119.8 295.69 ± 195.76 280.63 ± 256.06
Creatinine (mg/L) 10.33 ± 9.60 8.17 ± 7.10* 8.94 ± 6.18 9.19 ± 9.05
GOT (U/L) 43.17 ± 50.99 29.76 ± 17.09 31.13 ± 17.96 35.56 ± 19.17
GPT (U/L) 38.28 ± 46.06 36.47 ± 35.41 28.25 ± 22.96 36.25 ± 25.92
Total bilirubin (mg/L) 11.46 ± 16.29 6.21 ± 3.81 7.80 ± 5.33 6.79 ± 4.44
Direct bilirubin (mg/L) 4.58 ± 5.14 3.74 ± 3.17 4.93 ± 3.47 4.71 ± 3.39
Uric acid (mg/L) 43.00 ± 32.68 39.88 ± 24.66 55.56 ± 41.22 46.75 ± 37.55
Body weight (kg) 53.08 ± 8.43† 53.72 ± 9.26 46.88 ± 9.14 46.77 ± 7.82
Body mass index (kg/m2) 21.10 ± 3.72 21.20 ± 3.81 18.69 ± 3.33 18.53 ± 2.96
*P<0.05; ** P <0.01, after vs baseline within the same group. †Significantly different from control group at baseline. ‡ P <0.1, magnitude of change between HMB and control groups after controlling for baseline BMI.
Table 2. Blood parameters and body weight of HMB and control groups at baseline and after the 7-day study period (mean±standard deviation)

548 HMB supplementation on COPD in ICU
Supplementation of HMB may provide a better way
to help these patients maintain adequate body weight, as even aggressive nutrition supplementations have mostly been ineffective.30 HMB was converted to β-hydroxy-β-methyl-glutaryl-CoA (HMG-CoA), a precursor for cho-lesterol synthesis, in cytosol.17 In muscle cells where the major supply of cholesterol comes from a de novo path-way, the increased cholesterol synthesis resulted from dietary supplementation of HMB may help the growth, production, or repair of the tissue in stressful or overload conditions.17 This hypothesis is supported by the fact that several cholesterol synthesis inhibitors can cause severe myopathy.31 In our study, the HMB group showed signi-ficant increase in plasma cholesterol after supple-mentation, indicating potentially elevated cholesterol syn-thesis.
Other proposed mechanisms of anticatabolic effects of HMB included modulation of hormonal receptor effects of cortisol, testosterone, growth hormone, insulin-like growth factor-1 (IGF-1), and enzymes responsible for muscle tissue breakdown.18 However, urinary testo-sterone to epitestosterone ratio did not change after con-sumption of 3g HMB in healthy males.32 IGF-1 and insulin levels also remained unchanged after HMB supplementation in lambs.33 The detailed mechanism of HMB requires further research.
HMB at the doses of 3-6 g/d appeared to be well-tolerated in humans with no obvious adverse effect. Nissen et al., reported a series of studies in healthy young and old subjects lasting from 3 to 8 weeks, in which the supplementation of 3 g HMB/d showed no adverse effect on psychological, blood chemistry, and hematology para-meters.34 At the consumption level of 3 and 6 g/d for 8 weeks, no adverse change was observed in blood glu-cose, urea nitrogen, hemoglobin, hepatic enzymes, lipid profile, leukocyte subpopulations, urine pH, glucose, and protein.29 Total and LDL cholesterol were decreased in both studies,29,34 suggesting potential health benefit and possible feedback inhibition of liver cholesterol synthesis in healthy subjects. No change in plasma lipid profiles, hepatic enzyme activities, and markers of kidney function was discovered in HIV-infected patients supplemented with HMB/glutamine/arginine complex.22 A significant 6% decrease in total white blood cell was reported, with the major reductions in neutrophils and eosinophils.16 However, Gallagher et al., revealed a significant increase in basophils after supplementation of 3g/d.29 The physio-logical effect of the changes at these magnitudes was unclear. Our subjects did not show any signs of gastro-
intestinal complications during the HMB supplementation period. The blood analysis results did not show any ad-verse effect on HMB supplementation. The subjects in this study were randomly assigned to HMB or control group on the alternative order of ad-mission to ICU to prevent any bias in subject selection. Unexpectedly, a significant difference appeared in base-line body weight and BMI between the 2 groups. We used regression analysis to control baseline BMI in analyzing the magnitude of change between the 2 groups.
This short-term study suggested that HMB supple-mentation may have anti-inflammatory and anticatabolic effect and improve pulmonary function in COPD patients in an ICU setting. The small sample size may limit the statistical power as the differences in magnitude of change between the 2 groups were only moderately sig-nificant in white blood cell count and cholesterol and insignificant in CRP and creatinine after controlling for baseline BMI. Nevertheless, the changes in the HMB group indicated that there had been reduced inflammation and protein catabolism. The duration of this study may be too short to show significant improvement in respiratory muscle function. However, improved pulmonary function in the HMB group has been suggested according to the ventilator modes of the subjects. A long-term study with a larger sample size on the effects of HMB on muscle metabolism and physiological functions in patients with COPD or other muscle wasting diseases is warranted.
Acknowledgement
This study was financially supported by Kaohsiung Municipal United Hospital, Kaohsiung, Taiwan, R.O.C.
References 1. American Thoracic Society. Standards for the diagnosis
and care of patients with chronic obstructive pulmonary disease. Am J Respir Crit Care Med 1995; 152: S77-121.
2. Murray CJ, Lopez AD. Alternative projections of mortality and disability by cause 1990-2020: Global Burden of Disease Study. Lancet 1997; 349: 1498-1504.
3. Dentener MA, Creutzberg EC, Schols AM, Mantovani A, van't Veer C, Buurman WA, Wouters EF. Systemic anti-inflammatory mediators in COPD: increase in soluble interleukin 1 receptor II during treatment of exacerbations. Thorax 2001; 56: 721-726.
4. Di Francia M, Barbier D, Mege JL, Orehek J. Tumor necrosis factor-alpha levels and weight loss in chronic obstructive pulmonary disease. Am J Respir Crit Care Med 1994; 150: 1453-1455.
Modes Number of subjects
Baseline After HMB Control
PCV or A/C PSV or SIMV+PSV 10 (55.6%) 4 (25.0%)
PSV or SIMV+PSV PSV or SIMV+PSV 6 (33.3%) 9 (56.3%)
PCV PCV 1 (5.6%) 3 (18.8%)
SIMV+PSV A/C 1 (5.6%) 0 (0.0%)
PCV, pressure control ventilation; A/C, assist/control; PSV, pressure support ventilation; SIMV, synchronized intermittent mandatory
Table 3. Modes of ventilator at baseline and after the 7-day study period in HMB and control groups (mean ± standard deviation)

L-Chi Hsieh, S-L Chien, M-S Huang, H-F Tseng and C-K Chang 549
5. de Godoy I, Donahoe M, Calhoun WJ, Mancino J, Rogers RM. Elevated TNF-alpha production by peripheral blood monocytes of weight-losing COPD patients. Am J Respir Crit Care Med 1996; 153: 633-637.
6. Takabatake N, Nakamura H, Abe S, Inoue S, Hino T, Saito H, Yuki H, Kato S, Tomoike H. The relationship between chronic hypoxemia and activation of the tumor necrosis factor-alpha system in patients with chronic obstructive pulmonary disease. Am J Respir Crit Care Med 2000; 161: 1179-1184.
7. Pouw EM, Schols AM, Deutz NE, Wouters EF. Plasma and muscle amino acid levels in relation to resting energy expenditure and inflammation in stable chronic obstructive pulmonary disease. Am J Respir Crit Care Med 1998; 158: 797-801.
8. Schols AM, Soeters PB, Dingemans AM, Mostert R, Frantzen PJ, Wouters EF. Prevalence and characteristics of nutritional depletion in patients with stable COPD eligible for pulmonary rehabilitation. Am Rev Respir Dis 1993; 147: 1151-1156.
9. Schols AM, Slangen J, Volovics L, Wouters EF. Weight loss is a reversible factor in the prognosis of chronic obstructive pulmonary disease. Am J Respir Crit Care Med 1998; 157: 1791-1797.
10. Donahoe M, Rogers RM, Wilson DO, Pennock BE. Oxygen consumption of the respiratory muscles in normal and in malnourished patients with chronic obstructive pulmonary disease. Am Rev Respir Dis 1989; 140: 385-391.
11. Jounieaux V, Mayeux I. Oxygen cost of breathing in patients with emphysema or chronic bronchitis in acute respiratory failure. Am J Respir Crit Care Med 1995; 152: 2181-2184.
12. Donahoe M. Nutritional support in advanced lung disease. The pulmonary cachexia syndrome. Clin Chest Med 1997; 18: 547-561.
13. Engelen MP, Deutz NE, Wouters EF, Schols AM. Enhanced levels of whole-body protein turnover in patients with chronic obstructive pulmonary disease. Am J Respir Crit Care Med 2000; 162: 1488-1492.
14. Talpers SS, Romberger DJ, Bunce SB, Pingleton SK. Nutritionally associated increased carbon dioxide production. Excess total calories vs high proportion of carbohydrate calories. Chest 1992; 102: 551-555.
15. Browning R, Olsen A. The functional gastrointestinal disorders of pulmonary emphysema. Mayo Clin Proc 1961; 36: 537-543.
16. Nissen SL, Abumrad NN. Nutritional role of the leucine metabolite beta-hydroxy beta-methylbutyrate (HMB). J Nutr Biochem 1997; 8: 300-311.
17. Nissen S, Sharp R, Ray M, Rathmacher JA, Rice D, Fuller JC, Connelly AS, Abumrad N. Effect of leucine metabolite beta-hydroxy-beta-methylbutyrate on muscle metabolism during resistance-exercise training. J Appl Physiol 1996; 81: 2095-2104.
18. Slater GJ, Jenkins D. Beta-hydroxy-beta-methylbutyrate (HMB) supplementation and the promotion of muscle growth and strength. Sports Med 2000; 30: 105-116.
19. Jowko E, Ostaszewski P, Jank M, Sacharuk J, Zieniewicz A, Wilczak J, Nissen S. Creatine and beta-hydroxy-beta-methylbutyrate (HMB) additively increase lean body mass and muscle strength during a weight-training program. Nutrition 2001; 17: 558-566.
20. Kreider RB, Ferreira M, Wilson M, Almada AL. Effects of calcium beta-hydroxy-beta-methylbutyrate (HMB) supplementation during resistance-training on markers of catabolism, body composition and strength. Int J Sports Med 1999; 20: 503-509.
21. Panton LB, Rathmacher JA, Baier S, Nissen S. Nutritional supplementation of the leucine metabolite beta-hydroxy-beta-methylbutyrate (hmb) during resistance training. Nutrition 2000; 16: 734-739.
22. Clark RH, Feleke G, Din M, Yasmin T, Singh G, Khan FA, Rathmacher JA. Nutritional treatment for acquired immunodeficiency virus-associated wasting using beta-hydroxy beta-methylbutyrate, glutamine, and arginine: a randomized, double-blind, placebo-controlled study. J Parent Enter Nutr 2000; 24: 133-139.
23. Ichihara A. Isozyme patterns of branched-chain amino acid transaminase during cellular differentiation and carcino-genesis. Ann N Y Acad Sci 1975; 259: 347-354.
24. Peterson AL, Qureshi MA, Ferket PR, Fuller JC, Jr. In vitro exposure with beta-hydroxy-beta-methylbutyrate enhances chicken macrophage growth and function. Vet Immunol Immunopathol 1999; 67: 67-78.
25. Okamura JM, Miyagi JM, Terada K, Hokama Y. Potential clinical applications of C-reactive protein. J Clin Lab Anal 1990; 4: 231-235.
26. Dev D, Wallace E, Sankaran R, Cunniffe J, Govan JR, Wathen CG, Emmanuel FX. Value of C-reactive protein measurements in exacerbations of chronic obstructive pulmonary disease. Respir Med 1998; 92: 664-667.
27. Hess D. Ventilator modes used in weaning. Chest 2001; 120: 474S-476S.
28. Pierce LN. Guide to mechanical ventilation and intensive respiratory care. Philadelphia: W.B. Saunders, 1995.
29. Gallagher PM, Carrithers JA, Godard MP, Schulze KE, Trappe SW. Beta-hydroxy-beta-methylbutyrate ingestion, part II: effects on hematology, hepatic and renal function. Med Sci Sports Exerc 2000; 32: 2116-2119.
30. Kotler DP, Grunfeld C. Pathophysiology and treatment of the AIDS wasting syndrome. AIDS Clin Rev 1995; 229-275.
31. London SF, Gross KF, Ringel SP. Cholesterol-lowering agent myopathy (CLAM). Neurology 1991; 41: 1159-1160.
32. Slater GJ, Logan PA, Boston T, Gore CJ, Stenhouse A, Hahn AG. Beta-hydroxy beta-methylbutyrate (HMB) supplementation does not influence the urinary testosterone: epitestosterone ratio in healthy males. J Sci Med Sport 2000; 3: 79-83.
33. Papet I, Ostaszewski P, Glomot F, Obled C, Faure M, Bayle G, Nissen S, Arnal M, Grizard J. The effect of a high dose of 3-hydroxy-3-methylbutyrate on protein metabolism in growing lambs. Br J Nutr 1997; 77: 885-896.
34. Nissen S, Sharp RL, Panton L, Vukovich M, Trappe S, Fuller JC, Jr. beta-hydroxy-beta-methylbutyrate (HMB) supplementation in humans is safe and may decrease cardiovascular risk factors. J Nutr 2000; 130: 1937-1945.
550 HMB supplementation on COPD in ICU
Original Article Anti-inflammatory and anticatabolic effects of short-term ββββ-hydroxy-ββββ-methylbutyrate supplementation on chronic obstructive pulmonary disease patients in intensive care unit Lan-Chi Hsieh MS
1, Shu-Ling Chien MS2, Ming-Shong Huang BS
3, Hung-Fu Tseng PhD
4 and Chen-Kang Chang PhD5
1 Department of Dietetics, 2Intensive Care Unit, 3Medical Laboratory, Kaohsiung Municipal United Hospital, Kaohsiung, Taiwan, R.O.C. 4 Institute of Medical Research, Chang-Jung Christian University, Tainan, Taiwan, R.O.C. 5 Department of Sport Management and Sport Science Research Center, National Taiwan College of Physical Education, Taichung, Taiwan, R.O.C.
短期補充短期補充短期補充短期補充β-hydroxy-β-methylbutyrate對對對對加護病房的慢性阻塞性肺病加護病房的慢性阻塞性肺病加護病房的慢性阻塞性肺病加護病房的慢性阻塞性肺病
病病病病人人人人的的的的抗發炎及抗異化抗發炎及抗異化抗發炎及抗異化抗發炎及抗異化作用影響作用影響作用影響作用影響
發炎標記上升及肌肉耗損是慢性阻塞性肺病(COPD)的病人常見的問題。本研究的目的為研究7天的β-hydroxy-β-methylbutyrate(HMB)補充 對加 護病房 的
COPD病人之發炎反應、蛋白質代謝及肺部功能的效應。34名需要使用呼吸機的COPD病人被隨機分配為HMB(n=18)或是控制組(n=16)。HMB組接受H
MB每天3公克,共七天。在經過HMB的補充之後,病人的白血球計數、C反應蛋白及肌酸酐顯著的較低,而膽固醇及總蛋白質顯著的較高。兩組的體重則都沒有改變。10名HMB組(55.6%)及4名控制組(25.0%)的研究對象,從他們的呼吸器模式顯示出肺部功能有改善。這個短期的研究指出給予加護病房的CO
PD病人補充HMB,可能具有抗發炎及抗異化的作用並改善肺部功能。
關鍵字:β-hydroxy-βmethylbutyrate、發炎、C反應蛋白、慢性阻塞性肺病。

Asia Pac J Clin Nutr 2006;15 (4): 551-555 551
Original Article Effects of dietary supplements on the Fischer ratio before and after pulmonary rehabilitation Hirokazu Kubo MD, Noritsugu Honda RPT, Fumio Tsuji MD, Takashi Iwanaga MD, Masato Muraki MD and Yuji Tohda MD
Kinki University School of Medicine, Respiratory Medicine and Allergology Department of Internal Medicine, 377-2 Ohnohigashi, Osakasayama, Osaka, Japan
Recently, efforts in comprehensive pulmonary rehabilitation for COPD have been made, including education, physical therapy, occupational therapy, nutrition, nursing, medication and counseling. Each patient focuses on a different element. Supplying adequate nutrition, among others, is essential for comprehensive pulmonary rehabilitation, as well as survival. In this study, the utility of efficient nutritional supplement therapy before and after pulmonary physical therapy was investigated by adding an amino acid drink with a high Fisher ratio to comprehensive pulmonary rehabilitation. The subjects were eight patients with COPD with obstructive ventilation disorder as severe as 31.5 ± 6% of FEV 1.0%. Pulmonary physical therapy was performed for eight weeks in a group administered one bottle of dietary supplement with a high Fisher ratio abundant in branched chain amino acids once daily (200 kCal/200 mL, Fisher ratio 40), and in another group without administration. Before and after the physical therapy, six-minute waking examination, QOL assessment (using CRQ), serum protein and serum Fisher ratio were comparatively examined between the two groups. After the eight weeks of pulmonary physical therapy, serum Fisher ratios were evidently reduced and serum protein measurements were also decreased in the group without dietary supplement abundant in branched chain amino acids. Accordingly, more amino acid is needed due to enhanced consumption of muscular protein during pulmonary physical therapy, during which nutrient ingestion including a sufficient amount of branched amino acid is necessary. It is an important element in continuing comprehensive pulmonary rehabilitation for a longer period.
Key Words: chronic obstructive pulmonary disease, branched-chain amino acid, Fisher ratio, nutrition assessment, pulmonary rehabilitation Introduction An epidemiological study on "emaciation” or weight loss, one of the clinical characteristics of COPD, reports that patients with weight loss have a high incidence of respi-ratory failure or high cumulative mortality.1 In Western counties, it is considered that there is a close relationship between COPT and emaciation. In Japan, there are a num-ber of patients with pulmonary emphysema and emacia-tion among COPD patients. Emaciation due to nutritional disturbance severely affects the structure and function of the respiratory muscles.2,3 The weight and thickness of the respiratory muscles are reduced and atrophied, attenuating their con-tractility solely due to weight loss. For example, weight loss has a good correlation with muscle mass reduction of the diaphragm in results from a classical study in human autopsy cases by Arora.4 In addition, weight loss affects the diaphragm more significantly than the myocardium. That is, it seems that the myocardium may be resistant to nutritional disturbance, but the diaphragm may be suscep-tible. Also in animal studies, the weight of the total ske-letal muscles including the respiratory muscles such as the diaphragm was decreased, and atrophy of the skeletal muscle fibers in the skeletal muscles (including the diaphragm) was found in fasting hamsters.5 More
importantly, dysfunction of the respiratory muscles is more significant with reduction in respiratory muscle weight in a sub-nutritional state. For example, the respiratory muscle tension of a human with weight loss of 71% of the standard weight is reduced as much as 37% compared with a human of normal weight both in the expiratory and aspiratory muscles.4 That is, reduction in respiratory muscle tone is far more significant than reduction in body weight or muscle mass. Respiratory muscle reduction in subjects with subnutrition is attributed to disturbance in electrolytes and minerals. Hypophosphatemia, hypocalcemia and hypo-kalemia reduce the contractive force of the diaphragm muscle.6,7 In addition, subnutrition can decrease various enzymes in the glycolysis pathway, oxidases and accumu-lated phosphorylation energy and increase intracellular calcium levels in the respiratory myocytes, provoking reduction of the respiratory muscles. That is, significant
Correspondence address: Dr Hirokazu Kubo, Kinki University School of Medicine, Respiratory Medicine and Allergology Department of Internal Medicine, Ohnohigashi, Osakasayama, Osaka, Japan 589-8511 Tel.: (81-72)3660221; Fax: (81-72)3677772 E-mail: [email protected] Accepted 22 February 2006

552 H Kubo, N Honda, F Tsuji, T Iwanaga, M Muraki and Y Tohda
subnutrition attenuates energy supply during muscle con-traction by reducing glycolytic energy activity in the muscle tissue.8 It is also thought that reduction of accu-mulated energy in the muscular fiber is another cause of muscle power reduction in a subnutritional state. How-ever, in patients with anorexia nervosa, reduced respira-tory muscle tone due to subnutrition is recovered by nu-rition supply at a much earlier period than muscle mass.9 This shows that muscle power reduction associated with subnutrition can be corrected by recovering electrolytes, minerals and the energy generating system by instituting nutrition at an earlier phase (the period before the reco-very of respiratory muscle mass). What nutrients are effective for nutrition in COPD patients who are underweight. Odessey and coworkers10 reported that hydrocarbons were depleted and branched chain amino acids (BCAA) are used 10-20 fold more in the diaphragms of fasting mice than in the diaphragms of normal mice, indicating the importance of BCAA as an energy substrate. Another study11 reported that amino acid imbalance reflecting the reduction of the Fischer ratio (BCAA/AAA) was found in half of patients with stable pulmonary emphysema. Serum amino acid imbalance in patients with pulmo-nary emphysema is thought to be a result of using BCAA from muscle protein as energy due to the decomposition of muscle protein including the respiratory muscles themselves in order to cope with the increase in energy consumption in the respiratory muscles due to reduced ventilation efficacy. When amino acids are energy source for protein synthesis, three amino acids called branched chain amino acids are often particularly used. In this case, even though sufficient protein can be ingested from a normal diet, the amino acid balance in the normal diet barely improves the amino acid imbalance in which branched chain amino acids are lacking. Therefore, this study investigates the effect of intake of BCAA-abundant food on the Fisher ratio during pulmonary rehabilitation for eight weeks. Subjects and method Subjects The subjects were eight patients with chronic pulmonary emphysema, who repeatedly visited the respiratory/ aller-gy medicine clinic and whose symptoms were stable. Seven patients were male and one was female. The mean age was 70.8, the mean body weight was 49.4 kg, and the mean height was 162.5 cm. A once-a-week pulmonary re-habilitation program was performed in these patients un-der an ambulatory setting for eight weeks. The pulmonary
rehabilitation consisting of a 45-minute lecture and 45-minute physical therapy was performed once a week. The topics of the lecture were nutritional instruction, medica-tion instruction and lifestyle instruction. The patients were then divided into two groups each containing four patients: one was administered a bottle of BCAA enriched dietary supplement once daily and the other was only gi-ven nutritional instruction. BCAA enriched dietary sup-plement is a liquid dietary supplement not necessary to masticate, which can be ingested in a short time. There was emaciation both in the ingestion group and in the no-ingestion group without significant difference in age or body weight. Significant obstructive ventilation disorder was found; the %VC was 86 ± 13 and 83 ± 15, respectively, and the FEV 1.0% was 31 ± 5 and 32 ± 7, respectively (Table 1). Dietary supplement BCAA enriched dietary supplement was used as a dietary supplement BCAA enriched dietary supplement (Clinico, Tokyo, Japan) is mainly used in cirrhosis or hepatitis cases where liver function is depressed. As the Fischer ratio for amino acid composition in a normal diet was limited to the range of about 2 - 4, it is not easy to prevent reduction in the Fischer ratio. Therefore, a bottle of BCAA enriched die-tary supplement containing 200 mL per bottle was given once daily. BCAA enriched dietary supplement has 200 kcal per bottle and 4g of protein per 100mL, characterized by the abundance of branched chain amino acids and as high a Fisher ratio as 40. In addition, as the dietary supplement is liquid and does not need to be masticated, it can be ingested in a short time. Essential amino acids are classified into branched chain amino acids such as valine, leucine, isoleucine and aromatic amino acids such as tryptamine, tyrosine and phenylalanine. The Fischer ratio is calculated by dividing the branched chain amino acid value by the aromatic amino acid value among these amino acids.
Comprehensive pulmonary rehabilitation Pulmonary rehabilitation was performed in these patients under an ambulatory setting. The program was: a once-a-week visit for pulmonary rehabilitation with respiratory physical therapy for about one hour in hospital, in parallel with additional exercises performed at home. This con-tinued for eight weeks. Physical therapy was performed focusing on breathing instruction and muscle streng-thening exercises for the lower limbs.
Ingestion group
(4 patients)
No-ingestion
group (4 patients)
Age (years) 70.2 ± 6.7 71.5 ± 3.4
Body weight (kg) 50.2 ± 4.8 48.2 ± 12.2
Height (cm) 163 ± 3.8 161.9 ± 7.9
%VC 86 ± 13 83 ± 15
FEV 1.0% 31 ± 5 32 ± 7
Table 1. Patient characteristics
Ingestion group
(4 patients)
No-ingestion
group (4 patients) %IBW 86 ± 6 83 ± 15 Calories ingested (before)
1600 ± 1500 1650 ± 120
Calories ingested (8 weeks after)
1900 ± 180 1820 ± 110
BEE 1090 ± 52 1076 ± 153 Calories ingested /BEE 175 ± 19 171 ± 21
Table 2. Nutritional status

Fischer ratio/pulmonary rehabilitation 553
Endpoints Measurement of 6-minute walking distance (6 MWD), QOL assessment using CRQ (Chronic Respiratory disease Questionnaire) and serum tests (serum Fischer ratio and serum protein) were performed before and after the investigation. The HRQL of COPD patients are disturbed to a substantial degree. In the QOL assessment used in the investigation, CRQ was employed including four cate-gories: dyspnea, fatigue, emotional function and mastery. This study approved by the Ethics Committee of Research Council of Kinki University School of Medicine. In-formed written consent was obtained by each subject. Results There was no difference between the ingestion group and the no-ingestion group in the %IBW and the daily calorie ingestion before the rehabilitation. After the nutritional instruction of the rehabilitation program, the daily calorie intake increased compared to that before the rehabi-litation. Although BCAA enriched dietary supplement containing 200 kcal was administered each day, there was no difference between the two groups (Table 2). In this investigation, a dietitian calculated the calorie intake based on the meals described by the patients for three days. The basal energy expenditure (EEE) was calculated using the Harris-Benedict formula. Dyspnea measurement in the QOL assessment by CRQ significantly improved after 8 weeks by performing pulmonary rehabilitation both in the ingestion group and in the no-ingestion group (Fig. 1). In addition, the six-minute walking distance (6MWD) significantly improved after 8 weeks by per-forming pulmonary rehabilitation both in the ingestion group and in the no-ingestion group (Fig. 2). However, there were evident differences in the Fischer ratio be-tween the ingestion group and the no-ingestion group. That is, in the BCAA enriched dietary supplement-ingestion group, ingestion of the dietary supplement with a high Fischer ratio increased the ratio even after pul-monary rehabilitation. However, in the no- BCAA en-riched dietary supplement-ingestion group, the ratio was obviously depressed by performing pulmonary rehabi-litation focusing on muscle strengthening exercises for the lower extremities for eight weeks, even though there was
no difference in total calorie ingestion between the two groups (Fig. 3). In addition, serum albumin measure-ments were not decreased in the BCAA enriched dietary supplement-ingestion group due to the ingestion of a dietary supplement with a high Fischer ratio. However, in the no-BCAA enriched dietary supplement-ingestion group, the serum albumin measurements were depressed by pulmonary rehabilitation focusing on muscle streng-thening exercises for the lower extremities for eight weeks because of amino acid deficit (Fig. 4).
Discussion Recently, there have been efforts to analyze muscle tissue and serum amino acid kinetics as indices for evaluation of skeletal muscle degeneration or protein catabolic action in COPD. In the skeletal muscles, there were increases in glutamine as well as in arginine, ornithine and citrumine and a decrease in glutamic acid. In the serum, reduction in total amino acids was seen, particularly in alanine, glu-tamine, glutamic acid, asparagine, etc. In cases where in-crease was seen in lipopolysaccharide binding protein (LBP), an index of acute inflammatory reaction, enhance-ment in REE was found and, on the other hand, the total serum amino acid was reduced. Reductions in glutamic acid, glutathion and glutamine in the skeletal muscles increase the levels of lactic acid and pyruvic acid, anae-robic metabolites. These abnormal protein meta-bolisms in the serum and the skeletal muscles and findings re-garding abnormalities in steroids and amino acids are use-ful in clarifying the pathology of abnormal muscle protein metabolism in COPD, and may possibly prove the vali-dity of the therapy during amino acid nutrition therapy. Fischer and coworkers12 reported a reduction of the BCAA/AAA ratio in patients with hepatic encephalo-pathy, and the Fischer ratio has thereafter been considered as an index showing serum amino acid imbalance. Muto and coworkers13 reported that reduction in the Fischer ratio is a highly specific index of protein nutritional dis-turbance because of the correlation between the reduction in the Fischer ratio and the degree of hypoproteinemia in cirrhosis. The degree of amino acid imbalance in patients with pulmonary emphysema is relatively mild compared
*
0
5
10
15
20
25
30
Ingestion group No-ingestion group
* : p<0.01
Before After
Figure 1. Changes in CRQ before and after pulmonary rehabilitation
Figure 2. Changes in 6MD before and after pulmonary rehabilitation
Ingestion group No-ingestion group
* : p<0.01
Before After
*(m )
250
300
350
400
450
500

554 H Kubo, N Honda, F Tsuji, T Iwanaga, M Muraki and Y Tohda
to that in patients with hepatic encephalopathy, but the Fischer ratio correlates with morphometric measurements, and thus, it is assumed that amino acid imbalance is also associated with nutritional disturbance in pulmonary emphysema. Another study11 reported that amino acid im-balance reflects reduction in the Fischer ratio (BCAA/ AAA) was found in a half of patients with stable pul-monary emphysema. According to a report by Yoneda and coworkers11, FEV 1% showed a significant positive correlation with the Fischer ratio. These results suggest the greater asso-ciation between the progress of respiratory dysfunction and the enhancement of amino acid imbalance and its im-portance, because the more severe the airway obstruction in patients with pulmonary emphysema, the more sig-nificant their amino acid imbalance is. Serum amino acid imbalance in patients with pul-monary emphysema is thought to be a result of using BCAA from muscle protein due to the decomposition of muscle protein including the respiratory muscles them-selves in order to cope with increase in energy con-sumption in the respiratory muscles due to reduced ven-tilation efficacy. The two findings, the correlation be-tween respiratory muscle power and muscle mass and the correlation between FEV 1% and amino acid imbalance, suggest that metabolic enhancement in the respiratory muscles associated with obstructive ventilation disorder may provoke amino acid imbalance, which in turn may enhance respiratory fatigue.11 In order to compensate energy that is insufficient from meals, muscular protein is decomposed in the body and used as an energy source, and thus, the muscles become emaciated. When amino acids are used as an energy source, as the three amino acids called branched chain amino acids are often particularly used, the branched chain amino acids are consumed more than the other amino acids, resulting in the disturbance of balance among the 20 amino acids in the body. Thus, the ability to synthesize the necessary proteins is reduced and various harmful effects such as immuno-suppression develop. In this case, even though sufficient protein can be ingested from a normal diet, amino acid balance in the
normal diet barely improves the amino acid imbalance in which branched chain amino acids are lacking. Thus, efficiently administrating branched chain amino acids with a high Fischer ratio during exercise therapy leads to reinforcement of the respiratory muscles, but on the other hand, exercise therapy solely might reduce the Fischer ratio and affect protein synthesis in patients with COPD, leading to the development of amino acid im-balance. Therefore, amino acid imbalance develops in COPD, and comprehensive pulmonary rehabilitation should be performed in parallel with exercise therapy as well as appropriate branched amino acid substitution. However, nowadays, the importance of nutritional ma-nagement is barely recognized in daily medical practice. Nevertheless, eating is an essential requirement for the survival of human beings, and is performed more fre-quently by humans than taking medicine. If we recognize and clarify the importance of nutrition in the prog-nosticate of COPD, a new treatment strategy can be developed. References 1. Vandenbergh E, Van de Woestijne KP, Gyselen A. Weight
changes in the terminal stages of chronic obstructive pul-monary disease. Relation to respiratory function and prog-nosis. Am Rev Respir Dis 1967; 95(4):556-66.
2. Dureuil B, Matuszczak Y. Alteration in nutritional status and diaphragm muscle function. Reprod Nutr Dev 1998; 38 (2): 175-80.
3. Lewis MI, Belman MJ. Nutrition and the respiratory muscles. Clin Chest Med 1988; 9 (2): 337-48.
4. Arora NS, Rochester DF. Respiratory muscle strength and maximal voluntary ventilation in undernourished patients. Am Rev Respir Dis 1982; 126 (1):5-8.
5. Kelsen SG, Ference M, Kapoor S. Effects of prolonged undernutrition on structure and function of the diaphragm. J Appl Physiol 1985; 58 (4): 1354-9.
6. Aubier M, Murciano D, Lecocguic Y, Viires N, Jacquens Y, Squara P, Pariente R. Effect of hypophosphatemia on diaphragmatic contractility in patients with acute respiratory failure. N Engl J Med 1985; 313 (7):420-4.
7. Aubier M, Viires N, Piquet J, Murciano D, Blanchet F, Marty C, Gherardi R, Pariente R. Effects of hypocalcemia on diaphragmatic strength generation. J Appl Physiol 1985; 58 (6): 2054-61.
Figure 3. Changes in the Fischer ratio before and after pulmonary rehabilitation
Figure 4. Changes in serum albumin before and after pulmonary rehabilitation
2
2.5
3
3.5
4
(BC AA/AAA)
*
Ingestion group No-ingestion group
* : p<0.01
Before After
2.5
3
3.5
4
4.5
5
(g/dl)
*
Ingestion group No-ingestion group
* : p<0.01
Before After

Fischer ratio/pulmonary rehabilitation 555
8. Layman DK, Merdian-Bender M, Hegarty PV, Swan PB. Changes in aerobic and anaerobic metabolism in rat cardiac and skeletal muscles after total or partial dietary restrictions. J Nutr 1981; 111 (6): 994-1000.
9. Murciano D, Rigaud D, Pingleton S, Armengaud MH, Melchior JC, Aubier M. Diaphragmatic function in se-verely malnourished patients with anorexia nervosa. Effects of renutrition. Am J Respir Crit Care Med 1994; 150 (6 Pt 1): 1569-74.
10. Odessey R. Amino acid and protein metabolism in the diaphragm. Am Rev Respir Dis 1979; 119 (2 Pt 2): 107-12.
11. Yoneda T, Yoshikawa M, Fu A, Tsukaguchi K, Okamoto Y, Takenaka H. Plasma levels of amino acids and hyper-metabolism in patients with chronic obstructive pulmonary disease. Nutrition 2001; 17 (2): 95-9.
12. Fischer JE, Yoshimura N, Aguirre A, James JH, Cummings MG, Abel RM, Deindoerfer F. Plasma amino acids in patients with hepatic encephalopathy. Effects of amino acid infusions. Am J Surg 1974; 127 (1): 40-7.
13. Muto Y. Specially combined amino acid solutions for liver failure-varieties, relative concentrations and methods of administration. Nippon Rinsho 1982; 40 (4): 817-823.
Original Article Effects of dietary supplements on the Fischer ratio before and after pulmonary rehabilitation Hirokazu Kubo MD, Noritsugu Honda RPT, Fumio Tsuji MD, Takashi Iwanaga MD, Masato Muraki MD and Yuji Tohda MD
Kinki University School of Medicine, Respiratory Medicine and Allergology Department of Internal Medicine, 377-2 Ohnohigashi, Osakasayama, Osaka, Japan
膳膳膳膳食補充食補充食補充食補充劑劑劑劑對肺部復健前後對肺部復健前後對肺部復健前後對肺部復健前後 Fisher ratio 的的的的影響影響影響影響 最近,針對慢性阻塞性肺部疾病(COPD)的全面性肺部復健已經有相當的努力,包括教育、物理治療、職能治療、營養、護理、藥物及諮詢。每一個病人雖有不同的重點,其中供應足夠的營養對全面的肺部復健以及存活則是必須的。本研究利用增加含高 Fisher ratio的胺基酸飲料,探討肺部物理治療前後營養補充劑治療的可用性。八名 COPD 合併阻塞性呼吸失調的病人,其嚴重度為 FEV1.0%只有31.5±6%。肺部物理治療共進行八週,其中一組每日服用ㄧ瓶高 Fisher ratio並富含支鏈胺基酸(200大卡/200毫升,Fisher ratio40)的膳食補充劑;而另一組則沒有服用。物理治療前後會進行 6 分鐘的清醒評估、QOL 評估(使用 CRQ)、血清蛋白質及血清 Fisher ratio,並比較兩組的結果。八週肺部物理治療之後,沒有補充支鏈胺基酸的組別其血清 Fisher ratio明顯的降低,而血清蛋白質也下降。據此,在進行肺部物理治療時由於肌肉蛋白的消耗,所以需要更多的胺基酸,而在營養素攝取時,包含足量的支鏈胺基酸是需要的。這對於長期且連續的全面性肺部復健而言是個重要的因素。
關鍵字:慢性阻塞性肺部疾病、支鏈胺基酸、Fisher ratio、營養評估、肺部復健。

456 Asia Pac J Clin Nutr 2006;15 (4):456-457
Original Article Influencing health through intestinal microbiota modulation and probiotics Introduction to the NSA Probiotic Symposium, Nov/Dec 2006
Andrew Sinclair PhD
1 and Seppo Salminen PhD
2 1 School of Exercise & Nutrition Sciences, Deakin University, Burwood, Australia 2 Functional Foods Forum, University of Turku, Turku, Finland
Science has progressed fast in providing answers to probiotic health benefits to the consumers. This symposium also proves that progress is fast. However, several challenges still need to be solved and more effective strains and strain combinations discovered. This will pave the way from good probiotics to specific products for clearly identified target populations. The intestinal microbiota and its interaction(s) with probiotics challenges researchers to turn to the next new page to discover new approaches and treatment modalities that utilize probiotics as means of providing good nutrition with clear health benefits to all consumers.
Key Words: probiotics, microbiota, probiotic bacteria, safety, clinical trials, intestinal microbiota, genomics, nutrition The healthy human microbiota is a metabolic organ which provides a defence system against harmful environmental exposures. This active complex community consists of more cells than can be found in our body and contains about 1.5 kg of viable microbes. Deviations in composition can be related to multiple disease states within the intestine but also beyond it. Similarly, components of the human intestinal microbiota or organisms entering the intestine may have both harmful and beneficial effects on human health. A probiotic has been defined by the ILSI Europe (International Life Sciences Insitute Europe) working group as “a viable microbial food supplement which bene-ficially influences the health of the host”.1 This definition has been refined by the FAO/WHO expert group in 20022
to include the required dose. Both definitions require scientifically demonstrated efficacy and safety. Selection criteria for future probiotics have been developed towards target-specific criteria, but they also include adhesion to intestinal mucosa, and acid and bile tolerance as the key selection factors. The benefits of probiotics have been ana-lysed in meta-analysis studies published elsewhere.1 In order to demonstrate health effects and benefits, research has been conducted on mechanisms of action and clinical intervention studies with human subjects belonging to the target groups. As an example, a meta-analysis of effects in acute diarrhoea has been published recently.3 The issues covered in this symposium include studies of well-established probiotic strains and strain combinations which have been demonstrated to have additive and synergistic in vitro properties, discussion of the issue of safety of pro-biotics for use in foods, the best methods for delivering probiotics to the gut, and clinical studies on use of
probiotics in inflammatory bowel disease. The future tar-get is to increase the genomic information on both pro-biotics and microbiota to improve the understanding of specific intestinal diseases. Thereafter, the goal is to apply the knowledge of microbiota composition and aberrancies on selecting the right probiotic combinations for defined target populations to maintain healthy gut microbiota and to improve human health and well-being.
Probiotic science has developed rapidly during the last decade. In this issue we again see a variety of scientific studies, both intervention and other studies, on probiotics. Data on potential health effects is accumulating and faci-litates the understanding of interactions of specific pro-biotics and intestinal microbiota. There are still several unanswered questions including the following: 1. Could smaller probiotic doses be administered to
infants and children with a less complex microbiota than for adults with a stable, diverse and more com-plex microbiota?
2. Are larger doses, longer treatment times and perhaps specific probiotic combinations required for elderly subjects or subjects with specific intestinal micro-biota deviations?
3. How important is the viability of the probiotics for health effects? These are among the key issues for future research.
Correspondence address: Prof Andrew Sinclair, School of Exercise & Nutrition Sciences, Deakin University, Australia [email protected]
Accepted 30th August 2006

A Sinclair and AS Salminen 457
Genome and function studies of current probiotics will increase our understanding on the biological mechanisms in cases where clinical efficacy has been demonstrated. Clinical data on the beneficial role of specific probiotic strains, and combinations has increased significantly and is accumulating at a rapid pace. Combining together the genomic data with host-microbe interaction studies will enable us to develop future probiotics using metabolomic approaches. This will facilitate development of probiotic preparations which are more specific for both maintaining healthy intestinal microbiota and designed for particular target populations to promote health and to reduce the risk of specific diseases. Such information will redefine the way we select, characterize and assess future probiotics and especially probiotic combinations in a scientifically valid manner.4
References 1. Salminen S, Bouley C, Boutron-Ruault MC, Cummings
JH, Franck A, Gibson GR, Isolauri E, Moreau MC, Roberfroid M, Rowland I. Functional food science and gastrointestinal physiology and function. Br J Nutr 1998; Aug 80 Suppl 1: S147-71.
2. WHO 2001. http://www.who.int/foodsafety/ publications/fs_management/en/probiotics.pdf
3. Sazawal S, Hiremath G, Dhingra U, Malik P, Deb S, Black RE. Efficacy of probiotics in prevention of acute diarrhoea: a meta-analysis of masked, randomised, placebo-controlled trials. Lancet Infect Dis 2006; 6: 374-82.
4. De Vos WM, Castenmiller JJ, Hamer RJ, Brummer RJ. Nutridynamics: studying the dynamics of food components in products and in the consumer. Curr Opin Biotechnol. 2006 ; 17: 217-25.
Original Article Influencing health through intestinal microbiota modulation and probiotics Introduction to the NSA Probiotic Symposium, Nov/Dec 2006
Andrew Sinclair PhD
1 and Seppo Salminen PhD
2 1 School of Exercise & Nutrition Sciences, Deakin University, Burwood, Australia 2 Functional Foods Forum, University of Turku, Turku, Finland
透過腸道菌群調整及益生菌來影響健康透過腸道菌群調整及益生菌來影響健康透過腸道菌群調整及益生菌來影響健康透過腸道菌群調整及益生菌來影響健康 NSA益生菌研討會引言,益生菌研討會引言,益生菌研討會引言,益生菌研討會引言,Nov/Dec 2006
科學已經快速進步提供關於益生菌健康益處的答案給消費者,這個研討會同樣證明那個快速進步。然而,有好幾個挑戰仍待解決,而更多的有效菌株及菌株結合體也有待發現。這個將為從好的益生菌產品到清楚定義的目標族群鋪路。腸道菌群及其與益生菌的交互作用挑戰研究者,轉向去發現利用益生菌以提供好的營養及清楚的健康益處給所有的消費者的新方法及治療形式的新頁。
關鍵字:益生菌、菌群、益生菌細菌、安全、臨床試驗、腸道菌群、基因體學、營養

558 Asia Pac J Clin Nutr 2006;15 (4):558-562
Original Article Intestinal colonisation, microbiota and future probiotics? Seppo Salminen PhD,1 Yoshimi Benno DVM PhD
2 and Willem de Vos PhD3
1Functional Foods Forum, University of Turku, 20014 Turku, Finland 2Japan Collection of Microorganisms, RIKEN BioResource Center, Wako, Saitama 3510198, Japan 3Laboratory of Microbiology, Wageningen University, 6700 EV Wageningen, The Netherlands
The human intestine is colonized by a large number of microorganisms, collectively termed microbiota, which support a variety of physiological functions. As the major part of the microbiota has not yet been cultured, molecular methods are required to determine microbial composition and the impact of specific dietary components including probiotics. Probiotics are viable microbial food supplements, which have a beneficial impact on human health. Health-promoting properties have been demonstrated for specific probiotic products. The most significant demonstrations for probiotic efficacy include prevention and treatment of antibiotic associated diarrhea, rotavirus diarrhea and allergy prevention. Lactobacillus rhamnosus GG (=ATCC 53103) and Bifidobacterium lactis Bb12 are the among the best-characterized and most studied probiotic strains with demonstrated impact on human health. New complex targets for probiotics include irritable bowel syndrome and Helicobacter pylori infection. For future probiotics the most important target is a demonstrated clinical benefit supported by knowledge on the mechanistic actions in the microbiota of the target population. Molecular and genomics-based knowledge of the composition and functions of the microbiota, as well as deviations from the balanced microbiota, will advance the selection of new and specific probiotics. Potential combinations of specific probiotics may prove to be the next step to reduce the risk on intestinal diseases and reconstruct specific microbial deviations.
Key Words: Intestinal microbiota, diversity, genomics, probiotic, clinical studies, Lactobacillus GG Introduction The development of intestinal microbiota in the human gastrointestinal tract depends on the original inoculum at birth, living environment and the early feeding practises. Microbial colonization of the human infant begins at birth and continues during the early feeding and weaning pe-riods, and results in relatively stable microbial commu-nities in adults.1 The mature intestinal microbiota forms a physical and immunological barrier between the host and the environment. The barrier function of microbiota appears to support the intestinal health and protect the host by a healthy microecology in the gut.1 The early and matured intestinal microbiota are unique to each human being. From birth on, during breast feeding and weaning the microbiota diversifies and becomes stable with complex metabolic functions and it facilitates a barrier protecting the host against microbial and other invasions from the environment.1-4 There is a great need to further characterize the normal and aberrant microbiota in humans. New molecular methods have been developed for this work and more details are revealed at present. The importance of resident bacteria for the host's physiology include meta-bolic activities, trophic effects on the intestinal epithelium and protection of the host against the overgrowth of potential pathogens in the gastro-intestinal tract.2,3 Above these effects, specific strains of the gut microbiota have
been found to elicit anti-inflammatory responses in the intestinal epithelial cells thus strengthening the intestinal homeostasis. Probiotics are defined as “viable microbial food supple-ments, which, when taken in the right doses, beneficially influence human health”.5,6 These definitions require that safety and efficacy have to be scientifically demonstrated for each strain. Probiotics often act upon modifying the process of intestinal microbiota development or the com-position and activity of fully developed microbiota. Pro-biotics can also act by direct contact with the mucosal cells facilitating cross talk between the host and microbes. Current probiotics have several demonstrated beneficial effects on human health. These include maintenance of healthy intestinal microbiota development and counter-acting deviations observed in gut inflammatory diseases or preceding them. Correspondence address: Dr Seppo Salminen, Fucntional Foods Forum, University of Turku, 20014 Turku, Finland Tel: +358-400-601394; Fax: +358-2-3336884 Email: [email protected] Accepted 30th August 2006

S Salminen, Y Benno and W de Vos 559
Aberrant intestinal microbiota – can we define and influence it? Several deviations in the intestinal microbiota render us vulnerable to intestinal inflammatory diseases. Various deviations that predispose us to gastrointestinal problems have been characterised. As the methods to characterize the microbiota improve, more targets for intervention will be described to form a basis for probiotic action. Specific Bifidobacterium species in the healthy infant gut are most predominant and metabolically active and also specific Clostridium spp. are often present.1 Changes in their quantitative and qualitative composition appear to serve as useful indicators of deviations from the balanced microbiota, denoted here as abberrancies. However, other specific bacterial genera and species remain to be defined among the developing intestinal microbiota that impact on both early and later infant health. It has been reported that specific deviations in intestinal microbiota (such as, for example, decreased numbers and an atypical compo-sition of bifidobacteria and aberrancies in the Clostridium content and composition) may predispose infants to allergic disease.7 In a similar manner, deviations from the normal microbiota are associated with frequent antibiotic side-effects and microbiota changes. Aberrant microbiota during childhood may comprise a factor predisposing to both inflammatory gut diseases and diarrhoea.7,8 The
differences in faecal bacterial population between irritable bowel syndrome (IBS), one of the most common gastro-intestinal disorders, and control subjects have been re-ported in several studies. These observations suggest that Clostridium spp., some Bifidobacterium spp. and the in-stability of the active predominant faecal bacterial popu-lation, may be involved in IBS.8-10 Such deviations again, may form the target for probiotics in the future. In conclusion, advanced understanding of the quantitative and qualitative aspects of microbiota composition is ex-pected to enhance our knowledge basis for gut-associated diseases and their clinical impact. Developing future probiotic combinations It has been suggested that the intestinal microbiota con-sists of mainly symbiotic microorganisms.11 These de-dicate part of their genomes to processes that are bene-ficial to the host. Identification of such processes along with aberrancies in intestinal microbiota will help in the identification and development of new probiotics. The combination of specific probiotics to target new micro-biota aberrancies offers the next challenge to the research and development, as single strains have not always been effective for particular target populations. Negative out-comes for probiotic interventions have been reported for irritable bowel syndrome, Helicobacter pylori eradi-
Selection of specificprobiotic strains orstrain combination
Microbiotadevelopment
Microbiotamaintenance
Identification ofaberrancies
Strain assessment
In vivo assessment ofcombination and itsproperties
Target identification forspecific probioticcombinations
Demonstration ofefficacy in clinicalintervention studies
Health benefitdocumentation andclaims
Figure 1. Steps for selecting new target-specific probiotics and probiotic combinations.

560 Intestinal colonisation, microbiota and future probiotics?
cation, travellers diarrhoea and Crohn’s disease patients. Probiotic combinations may have additive and synergistic effects, but at times different strains and species may also counteract each other’s beneficial effects. These effects have been described in vitro and also in this issue.12 Thus, new in vitro tests and innovative approaches are re-quired to facilitate the design of probiotic combinations, as is illustrated here following the outline of Fig. 1. The properties of probiotic combinations have been studied in detail with two different mixtures of strains and reported also in this issue.12 Two of the strains in the combinations have been assessed as effective in different types of gastroenteritis.13,14 These have combined the well-characterized strains Lactobacillus rhamnosus GG (=ATCC 53103) and Bifidobacterium lactis Bb12, as well as Bifidobacterium breve BB99. Additional strains in the combinations assessed include Lactobacillus rhamnosus LC 705 and Propionibacterium freudenreichii subsp. shermanii, which have provided health benefits in human studies on toxin binding and metabolic activity enhance-ment.15 Several meta-analysis studies attest to the efficacy of L. rhamnosuss GG in clinical trials and efficacy data is available on B. lactis either alone or in combination with other probiotics. These are some times additive in their in vitro properties and for instance adhesion can be in-creased in probiotic combinations. The presence of L. rhamnosus s GG significantly enhances the adhesion of B. lactis Bb-12 and P. freudenreichii strain.16 The combina-tions have demonstrated efficacy in the treatment of irritable bowel syndrome17 (Kajander et al., 2006) and Helicobacter pylori infection.18 In meta-analysis studies also Lactobacillus plantarum has been reported to have a trend in decreasing irritable bowel syndrome symptoms. 19 Although clinical intervention trials provide important proof of efficacy for different probiotics and combina-tions in various disease states, advancing molecular and genomics-based research will provide data on identi-fication of key processes related to microbiota develop-ment and maintenance. These include nutrient-microbe interactions and more detailed chatacterization of the transfer of microbial communities from parent to the infant. Incorporating microbial meta- and post-genomics approaches together with host gene expression data from the exposed mucosal sites or aberrant microbiota activity will advance the understanding the roles of probiotics, microbiota and microbe-microbe and host-microbe in-teractions. The availability of probiotic genomes will be important for the prediction of the intestinal functions and potential to be used as single strains or in strain com-binations. It will also provide information about the me-chanisms of action of probiotics, facilitating the de-velopment or selection of a new generation of specific probiotic combinations with enhanced and more site-specific and target disorder-specific properties. Such data will reveal new rational improvement of probiotic strains for long-term use. Comparative genomics in combination with expression analysis will allow the assessment of interaction between probiotic, symbiotic, pathogenic microorganisms, providing valuable insight in the fea-tures of these different lifestyles. Ultimately, this would increase our understanding of the functional properties of
probiotics and their safety as well as the evolutionary relation among them. Conclusion The intestinal microbiota in healthy humans is a metabolic organ which provides a defence system against harmful environmental exposures. Deviations in com-position can be related to multiple disease states within the intestine but also beyond it. Similarly, components of the human intestinal microbiota or organisms entering the intestine may have both harmful and beneficial effects on human health. This is illustrated with a specific com-bination of well-established probiotic strains which in this issue of the journal have been demonstrated to have additive and synergistic in vitro properties, have safe history of use and have verified clinical benefits for humans. The future target is to increase the genomic information on both probiotic combinations and micro-biota activities to improve the understanding of specific intestinal diseases. Then the goal is to apply the know-ledge of intestinal microbiota composition and aberran-cies on selecting the right probiotic combinations for defined target populations to maintain healthy intestinal microbiota and to improve human health and well-being.
References 1. Guarner F, Malagelada JR. Gut flora in health and disease.
Lancet 2003; 381: 512-519. 2. Benno Y, Mitsuoka T. Development of intestinal micro-
flora in humans and animals. Bifidobateria Microflora 1986; 5: 13-25.
3. Grönlund MM, Arvilommi H, Kero P, Lehtonen OP, Isolauri E. Importance of intestinal colonisation in the maduration of humoral immunity in early infancy: a prospective follow up study of healthy infants aged 0-6 months. Arch Dis Child 2000; 83: 186-192.
4. Kirjavainen PV, Apostolou E, Arvola T, Salminen SJ, Gibson GR, Isolauri E. Characterizing the composition of intestinal microflora as a prospective treatment target in infant allegic diseases. FEMS Immunol Med Microbiol 2001; 32: 1-7.
5. Salminen S, Bouley C, Bouton-Ruault MC, Cummings JH, Franck A, et al. Functional food science and gastro-intestinal physiology and function. Br J Nutr 1998; 80: S147–S171.
6. WHO 2002.Guidelines for the evaluation of probiotics in food. http://www.who.int/foodsafety/ fs_management/ en/ probiotic_guidelines.pdf.
7. Kalliomaki M, Kirjavainen P, Eerola E, Kero P, Salminen S, Isolauri E. Distinct patterns of neonatal gut microflora in infants in whom atopy was and was not developing. J Allergy Clin Immunol 2001; 107:129-34.
8. Malinen E, Rinttila T, Kajander K, Matto J, Kassinen A, Krogius L, Saarela M, Korpela R, Palva A. Analysis of the fecal microbiota of irritable bowel syndrome patients and healthy controls with real-time PCR. Am J Gastroenterol. 2005;100:373-82.
9. Maukonen J, Satokari R, Matto J, Soderlund H, Mattila-Sandholm T, Saarela M. Prevalence and temporal stability of selected clostridial groups in irritable bowel syndrome in relation to predominant faecal bacteria. J Med Microbiol. 2006;55: 625-33.

S Salminen, Y Benno and W de Vos 561
10. Matto J, Maunuksela L, Kajander K, Palva A, Korpela R, Kassinen A, Saarela M. Composition and temporal stability of gastrointestinal microbiota in irritable bowel syndrome--a longitudinal study in IBS and control subjects. FEMS Immunol Med Microbiol 2005; 43: 213-22.
11. Bäckhed F, Ley RE, Sonnenburg JL, Peterson DA, Gordon JI. Host-bacterial mutualism in the human intestine. Science 2005; 307: 1915-1920.
12. Collado MC, Gueimonde M, Hernandez M, Sanz Y, Salminen S. Adhesion of selected Bifidobacterium strains to human intestinal mucus and its role in enteropathogen exclusion. J Food Prot 2005; 68 (12): 2672–2678.
13. Szajewska H, Ruszczynski M, Radzikowski A. Probiotics in the prevention of antibiotic-associated diarrhea in children: A meta-analysis of randomized controlled trials. J Pediatr. 2006; 149: 367-372.
14. McFarland LV. Meta-analysis of probiotics for the prevention of antibiotic associated diarrhea and the treat-ment of Clostridium difficile disease. Am J Gastroenterol. 2006; 101: 812-22.
15. El-Nezami HS, Polychronaki NN, Ma J, Zhu H, Ling W, Salminen EK, Juvonen RO, Salminen SJ, Poussa T, Mykkanen HM. Probiotic supplementation reduces a biomarker for increased risk of liver cancer in young men from Southern China. Am J Clin Nutr. 2006; 83:1199-203.
16. Ouwehand AC, Isolauri E, Kirjavainen PV, Tolkko S, Salminen SJ. The mucus binding of Bifidobacterium lactis Bb12 is enhanced in the presence of Lactobacillus GG and Lact. delbrueckii subsp. bulgaricus. Lett Appl Microbiol 2000;30:10-13.
17. Kajander K, Hatakka K, Poussa T, Farkkila M, Korpela R. A probiotic mixture alleviates symptoms in irritable bowel syndrome patients: a controlled 6-month intervention. Aliment Pharmacol Ther 2005; 22: 387-94.
18. Myllyluoma E, Veijola L, Ahlroos T, Tynkkynen S, Kankuri E, Vapaatalo H, Rautelin H, Korpela R. Probiotic supplementation improves tolerance to Helicobacter pylori eradication therapy - a placebo-controlled, double-blind randomized pilot study. Aliment Pharmacol Ther 2005; 21: 1263-72.
19. Floch MH. Use of diet and probiotic therapy in the irritable bowel syndrome: analysis of the literature. J Clin Gastroenterol 2005; 39 (Suppl): S243-6.

562 Intestinal colonisation, microbiota and future probiotics?
Original Article Intestinal colonisation, microbiota and future probiotics? Seppo Salminen PhD,1 Yoshimi Benno DVM PhD
2 and Willem de Vos PhD3
1Functional Foods Forum, University of Turku, 20014 Turku, Finland 2Japan Collection of Microorganisms, RIKEN BioResource Center, Wako, Saitama 3510198, Japan 3 Laboratory of Microbiology, Wageningen University, 6700 EV Wageningen, The Netherlands
腸道移生性、微生物菌叢及益生菌的未來腸道移生性、微生物菌叢及益生菌的未來腸道移生性、微生物菌叢及益生菌的未來腸道移生性、微生物菌叢及益生菌的未來? 人體腸道有許多的微生物體移生,整體稱之為菌群,提供各種的生理功能。當菌群中主要的部分尚未被培養出來時,需要採用分子方法去測量微生物的組成及特殊飲食成分的影響,其中包含益生菌。益生菌可當作微生物的食物補充品,對人體健康有益。特定的益生菌產品已被指出具有健康促進的特性。益生菌最顯著的功效包括:預防及治療抗生素相關的腹瀉、輪狀病毒腹瀉及預防過敏。Lactobacil
lus rhamnosus GG (=ATCC 53103) and Bifidobacterium lactis
Bb12是兩種對人體的健康研究得最透徹的菌株。益生菌新的標的,包括大腸急躁症及幽門螺旋桿菌感染。對未來的益生菌而言,最重要的標的是對目標族群的菌群,在機械式作用知識支持下,證實其臨床優勢。菌群組成及功能及平衡菌群偏差之分子及基因體相關知識,將促進新的特定益生菌的選擇。潛在的特定益生菌結合體可能是下一步被證實可能降低腸道疾病危險性及重整特定微生物偏差。
關鍵字:益生菌、益生菌結合體、腸道菌群、臨床研究、Lactobacillus GG。

Asia Pac J Clin Nutr 2006;15 (4): 563-569 563
Original Article
Safety of probiotics Diana C Donohue MAppSci (Toxicology)
School of Medical Sciences, RMIT University, Melbourne, Australia
New species and more specific strains of probiotic bacteria are constantly being sought for novel probiotic products. Prior to the incorporation of novel strains into food or therapeutic products a careful evaluation of their efficacy is required and an assessment made as to whether they share the safety status of traditional food organisms. Food organisms intrinsic to the production of traditional foods have been arbitrarily classified as safe in the absence of scientific criteria. Evidence for the safety and efficacy of probiotics has until recently been largely anecdotal or based on relatively little, and often poorly designed research. The demonstration of efficacy in probiotics offers vast opportunities for the development of human and veterinary products. The introduction of a new probiotic culture demands that it be at least as safe as its conventional counterparts. Many bacteria are being tested to find a putative probiotic, yielding conflicting data, sometimes for the same organism. Comparisons between studies and organisms cannot be readily made because of non-standardized dosing procedures. Information is not readily available on the equivalence of formulations for different probiotic preparations. There is vigorous debate on what constitutes appropriate safety testing for novel probiotic strains proposed for human consumption. Conventional toxicology and safety evaluation is of limited value in assessing the safety of probiotics. The addition of novel bacterial strains to foods and therapeutic products requires reconsideration of the procedures for safety assessment. This paper provides an overview of these issues.
Key Words: probiotic, safety, bacteraemia, clinical trial, guidelines, efficacy.
Introduction Probiotics are generally accepted as being live organisms which when administered in adequate amounts confer a health benefit on the host.1 The demonstration of efficacy in probiotics offers vast opportunities for the development of human and veterinary products: new species and more specific strains of bacteria are constantly being sought for novel probiotic products. Their safety cannot be assumed. The incorporation of novel bacterial strains into foods and therapeutic products requires reconsideration of the procedures for safety assessment. Probiotic products which claim specific nutritional, functional or therapeutic characteristics blur the boundaries between food, dietary supplement or medicine, posing challenges for regulators. Their efficacy should be carefully assessed and an evalua-tion made as to whether they share the safety status of traditional organisms. Many of the organisms to which we ascribe probiotic effects have their origins in dairy products and fermented foods. They have been consumed as constituents of these foods without apparent ill effect for centuries. Probiotic organisms are commonly from the genera Lactobacillus and Bifidobacterium, with some strains of Enterococcus and Saccharomyces species being amongst the exceptions. They are not specifically adapted to survive in the gastrointestinal tract and are generally regarded as safe because of their long history of use. They have been associated with disease rarely, usually as opportunistic infections in people with predisposing conditions.2 The
use of 'history of safe use' as a criterion for the safety of food organisms is an arbitrary classification. Probiotics consumed in foods and dietary supplements do not have to comply with more rigorous guidelines for probiotics which claim amelioration or prevention of disease in cli-nical use. Evidence for the efficacy and safety of probiotic or-ganisms has until recently been largely anecdotal or based on relatively little, and often poorly designed research. Lactic acid bacteria (LAB) and yeasts intrinsic to the production of traditional foods have been accepted as safe without any real scientific criteria, partly because they are normal commensal flora, and because of their presence for generations presumably without adverse effect. The concept of genetic manipulation of bacteria to achieve a specific probiotic function has appeal. Con-sumer resistance to genetically modified organisms (GMO) in foods is such that GMO probiotics are unlikely in the near future, with the possible exception of clinical applications. Steidler et al.,3 and Kaur et al.,4 have treated mice models with genetically modified bacteria, to prevent colitis and enhance the efficacy of anti-tumour therapy respectively. Probiotics can thus be designed to Correspondence address: D.C. Donohue, School of Medical Sciences, RMIT University, Bundoora, Victoria 3083, Australia. Tel: + 61 3 9925 7085 Fax: + 61 3 9925 7083 Email: [email protected] Accepted 30th August 2006

564 Diana C Donohue
produce potent bioactive chemicals. However extrapo-lation from proof of principle in a murine model to therapeutic applications for humans will require stringent safety assessment for proposed GMO probiotics. Existing guidelines for probiotic safety Conventional toxicology and safety evaluation is of limited value in assessing the safety of probiotic bacteria. Vigorous debate continues on what constitutes appro-priate safety testing for novel probiotic strains proposed for human consumption. In recent years several organi-sations have formulated approaches to assess the safety of probiotics. The Joint FAO/WHO Working Group on Drafting Guidelines for the Evaluation of Probiotics in Food1 proposed a framework consisting of strain identification and functional characterisation, followed by safety assessment and Phase 1, 2 and 3 human trials. It recommended that probiotic foods be properly labelled with the strain designation, minimum numbers of viable bacteria at the end of shelf-life, storage conditions and manufacturer's contact details. The Working Group further proposed that the use and adoption of the guide-lines should be a prerequisite for calling a bacterial strain ‘probiotic’. The Working Group considered the minimum tests required to characterise safety are: • Determination of antibiotic resistance patterns • Assessment of metabolic activities (e.g. D-lactate
production, bile salt deconjugation) • Assessment of side-effects during human studies. • Post-market epidemiological surveillance of adverse
incidents in consumers. • If the strain being evaluated belongs to a species
known to be either a mammalian toxin producer or to have haemolytic potential, it must be tested for toxin production or haemolytic activity.
The European Food Safety Authority (EFSA) has proposed a scheme based on the concept of qualified presumption of safety (QPS), defined as 'an assumption based on reasonable evidence' and qualified to allow certain restrictions to apply.5 The scheme aims to have consistent generic safety assessment of micro-organisms through the food chain without compromising safety standards. Individual evaluations would be limited to aspects particular to the organism, such as acquired antibiotic resistance determinants in lactic acid bacteria. QPS status would not apply to a micro-organism that commonly causes pathogenicity. A micro-organism would not necessarily be considered a potential pathogen where there are infrequent reports of clinical isolates from severely ill people. Broadly the characteristics to be evaluated for QPS approval are: • Unambiguous identification at the claimed taxonomic
level. • Relationship of taxonomic identity to existing or
historic nomenclature. • Degree of familiarity with organism, based on weight
of evidence. • Potential for pathogenicity to humans and animals.
• The end use of the micro-organism. This will influence any qualifications imposed, depending on whether the organism is to be directly consumed; is a component of a food product not intended to enter the food chain, but which may adventitiously; or is used as a production strain in a product intended to be free of live organisms.
A discussion of aspects of these guidelines follows. Taxonomic identification The introduction of a new probiotic culture demands that it be at least as safe as its conventional counterparts. Is the strain associated with safe food use, an intestinal strain isolated from humans, a strain isolated from animals, or a genetically modified strain? The safety of a putative novel probiotic is contingent on its unequivocal identification at the genus, species and strain level as probiotic effects are strain specific. Sophisticated phenotypic and molecular techniques are available to identify species and discri-minate between closely related strains. Correct taxonomic identification of both species and strain is a safety issue for quality control of the product, consumer or prescriber information, diagnosis and appropriate treatment of sus-pected clinical cases and epidemiological surveillance of the exposed population. The taxonomy of lactic acid and other bacteria has changed significantly with the advent of genetic methods of classification. Strains previously thought to be dis-similar have merged, while other strains have been added or reassigned to different genera. The persistent use of incorrect or non-existent species names on product labels despite taxonomic reassignation is a significant issue for the safety and credibility of probiotics. Yeung et al.,6 used partial 16S rDNA sequencing to identify named commercial strains obtained directly from the manufacturer and found discrepancies in 14 of 29 species designations. Lourens-Hattingh and Viljoen7 concluded that probiotic cultures in South African yogurt were little more than a marketing tool upon finding the initial counts of Bifidobacterium bifidum in three different sources of commercial yogurts were lower than the thera-peutic minimum. Weese8 identified isolates from eight veterinary and five human probiotics to find accurate descriptions of organisms and concentrations for only two of the 13 products. Temmerman et al.,9 found that of isolates from 55 European probiotic products, 47% of food supplements and 40% of dairy products were mislabelled. The food supplements yielded either no viable bacteria (37%) or significantly lower counts than the dairy products, con-tradicting the concept that health benefits derive from the presence of a minimum concentration of live probiotic bacteria. In six products, all species isolated conformed to the label description; in 19 products they differed from those listed. Enterococcus faecium was isolated in such high numbers that contamination was unlikely to be the source. Only two of the 22 food supplements purporting to contain Lactobacillus acidophilus did. Bifidobacteria were isolated from five of 27 products claiming to contain them, despite the use of different selective media. The

Safety of probiotics 565
organism most frequently claimed to be in, and isolated from dairy products was L. acidophilus, though it was not necessarily found where claimed. These and other studies10,11 demonstrate continued inaccurate identification and mislabelling of probiotic products. Inaccurate nomenclature has no scientific or regulatory validity, misinforms or confuses the consumer, and compromises the safety of the product. Consumers are entitled to expect that the label on a probiotic product accurately reflects its contents: the organism is what it purports to be, it is present alive in a specified con-centration range for a stated period, and the suggested ser-ving size contains sufficient organisms to achieve the claimed benefit.
Pathogenicity It is essential that a probiotic should not cause infection. This is a significant issue where the intestinal barrier is immature as in infants; where its integrity is impaired from radiotherapy, antibiotic treatment or disease; and in immunocompromised states, such as human immuno-deficiency virus (HIV) infection. With advances in me-dical care, an increasing proportion of the community may at some time be immunocompromised, or at risk of opportunistic infection. Lactobacillus species in general are thought to have low pathogenicity or be opportunistic pathogens in immu-nocompromised individuals or those with serious under-lying disease. It has been suggested that Lactobacillus rhamnosus in particular warrants surveillance because it is associated with more cases of bacteraemia than other lactobacilli. L. rhamnosus is among the most common Lactobacillus species in the human intestine so this may be relative to its extensive presence in the intestine.12 Two clinical cases have been reported in which a lactobacillus indistinguishable from an ingested probiotic strain has been identified in association with infection. A 74 year old woman with hypertension and diabetes mellitus developed a liver abscess in association with pneumonia and pleural empyema. She had a history of drinking a probiotic milk containing L. rhamnosus GG and a strain indistinguishable from that was isolated from the abscess.13 A 67 year old man with mild mitral regur-gitation developed endocarditis after dental extractions. His blood cultures were positive for a strain of L. rham-nosus indistinguishable from that in probiotic capsules he chewed.14 Wolf et al.,15 assessed the safety of probiotic Lacto-bacillus reuteri in a double-blind, placebo-controlled study in HIV adults, and found the organism to be well tolerated with no significant safety problems. In a review of probiotic safety Borriello et al.,16 found no published evidence that immunocompromised patients had an in-creased risk of opportunistic infection from probiotic lactobacilli or bifidobacteria. Antibiotic resistance and susceptibility There is potential for viable probiotics to colonise the intestinal tract and transfer genetic material. Whether resistance genes can be transferred by a probiotic orga-nism to the endogenous flora, or vice versa, and the
impact this would have on antibiotic treatment has yet to be elucidated. Lactic acid bacteria are naturally resistant to many antibiotics by virtue of their structure or physiology. In most cases the resistance is not transferable and the species are also sensitive to antibiotics in clinical use. However it is possible for plasmid-associated antibiotic resistance to spread to other species and genera. The transmissible resistance of enterococci to glycopeptide antibiotics such as vancomycin and teicoplanin is of particular concern, as vancomycin is one of the remaining effective antibiotics for the treatment of multidrug-resistant pathogens.12 Antibiotic resistance mechanisms, their genetic nature and transfer characteristics of resistance determinants have been studied comparatively recently in anaerobic bacteria. It has been shown that the plasmid which encodes for macrolide resistance can be transferred from L. reuteri to E. faecium and from E. faecium to E. faecalis in the mouse gastrointestinal tract.17 A study by Temmerman et al.,9 found 68.4% of probiotic isolates were resistant to two or more anti-biotics. Strains of lactobacilli were found resistant to kanamycin (81%), tetracycline (29.5%), erythromycin (12%) and chloramphenicol (8.5%). The disc diffusion method showed 38% of E. faecium isolates were resistant to vancomycin, while the PCR based van gene detection assay showed they were susceptible. Salminen et al.,18 characterised 86 clinical Lacto-bacillus blood isolates at species level and tested them for antimicrobial sensitivity. Of the eleven species identified 46 isolates were L. rhamnosus (n=22 L. rhamnosus GG type), Lactobacillus fermentum (n=12) and Lactobacillus casei (n=12). All Lactobacillus isolates showed low minimum inhibitory concentrations (MICs) of imipenem, piperacillin-tazobactam, erythromycin and clindamycin. The range of MICs of cephalosporin varied widely with species while MICs of vancomycin were high except for Lactobacillus gasseri and Lactobacillus jensenii. The antimicrobial susceptibility pattern for probiotic L. rhamnosus GG was similar to those of L. rhamnosus GG type and other L. rhamnosus clinical isolates. This study of a large number of blood culture isolates of Lacto-bacillus indicates their antimicrobial sensitivity to be species dependent. Sullivan and Nord19 characterised the Lactobacillus blood isolates from bacteraemic patients in Stockholm, Sweden, between January 1998 and March 2004 to identify the possible presence of three probiotic strains of Lactobacillus consumed in Sweden. The majority of the 59 isolates were L. rhamnosus (n=17), L. paracasei ssp. paracasei (n=8) and L. plantarum (n=8). No isolates were identical to the probiotic strains. All isolates of L. rhamnosus, L. paracasei ssp. paracasei and L. plantarum were resistant to vancomycin and teicoplanin while the majority of isolates were susceptible to clindamycin. The potential for gene transfer is difficult to assess in vivo. It is also difficult to assess what level of gene transfer, if any, the community may consider acceptable. It is a significant reason to select strains lacking the potential to transfer genetic determinants of antibiotic

566 Diana C Donohue
resistance. There is little basis for scientific regulation of strains with intrinsic resistance, as little is known about the levels of intrinsic resistance in current probiotic and food strains. Systematic screening for antibiotic resistance in probiotic strains is not undertaken at present. It is essential that probiotic organisms be sensitive to broad spectrum and commonly used antibiotics. Immune modulation The gut microflora are the major source of microbial sti-mulus in infancy. The initial colonisation by and com-position of the gut microflora are pivotal to the develop-ment of immune responses and normal gut barrier function. Kalliomäki et al.,20 demonstrated that the com-position of gut microflora differs between healthy and allergic infants. In a standardized double-blind placebo-controlled trial L. rhamnosus GG was given to mothers prenatally for two weeks before delivery and six months postnatally if breast feeding, or to the infant if not. No adverse effects were observed in the mothers and in infants the incidence of atopic eczema in the first two years of life was halved compared to that in infants given placebo. The finding that a specific strain of probiotic bacteria strongly influences immune regulation in infants raises questions about the use of probiotics in infancy. The long-term effects of probiotics on the composition of the gut flora and gut immunity during maturation are unknown. Reid21 questions that probiotic safety be assessed solely by an absence of adverse effects, and proposes longer term endpoints to determine whether there is increased risk of incurring diseases such as diabetes and inflamma-tory disorders. Once a probiotic strain is incorporated into the normal microflora, as has been documented during infancy, the potential to stimulate an immune response may be abo-lished with a consequent loss of probiotic potential. The response of normal gut microflora to probiotic inter-vention varies with age and clinical status of the subject, so immunological effects need to be assessed in specific at-risk populations. The molecular factors modulating immunoregulation need to be elucidated. Safety evalua-tion of long-term health effects will be important in the selection of, and characterisation studies for a probiotic.
Clinical studies Clinical studies in humans have investigated the effect of oral administration of probiotics on the balance of inte-stinal microflora and in a variety of disorders. Until re-cently many studies were of inadequate design and pro-duced unreliable data. Inadequate studies have had an absence of a patient control group; small treatment groups; undefined treatment groups; a wide age range within a treatment group; a diversity of antibiotic treat-ments; an absence of dosing criteria such as dose and duration; or subjects with symptoms of concurrent disease with the potential to confound an observation of adverse effects. The gold standard is a controlled study with stan-dardized, blind assignation to treatment, placebo and untreated groups. Immunosuppressive therapy is considered a risk factor in bacteraemia from opportunistic pathogens. Salminen et
al.,22 evaluated the efficacy and safety of Lactobacillus rhamnosus GG (LGG) in moderating gastrointestinal symptoms of HIV-positive patients on antiretroviral the-rapy in a placebo-controlled double blinded crossover study. Subjects with HIV infection and persistent non-infectious diarrhoea taking highly active antiretroviral therapy were standardized to receive twice daily LGG (viable LGG 1-5 x 10¹⁰ cfu/dose) for two weeks and two weeks placebo in randomized order. No probiotic pro-ducts were permitted during the washout periods before and after each treatment, to reduce the likelihood of a carryover effect from persistent probiotic. Although the LGG preparation was well tolerated it gave no significant reduction in gastrointestinal symptoms. No adverse events or clinical infections were observed in the subjects during the study or in the six month follow-up period. The evidence from this study suggests that LGG is un-likely to be a health risk in HIV patients.
Epidemiological surveillance Two Finnish studies have investigated the incidence of infections associated with lactic acid bacteria. In the first study 16S rRNA methods were used to characterise and identify lactic acid bacteria isolated from blood cultures of bacteraemic patients in Southern Finland.23 The number of infections caused by lactobacilli was extremely low and the infections were not associated with the pro-biotic strain newly introduced in fermented milks. In a subsequent study, lactobacilli isolated from bacte-raemic patients between 1989 and 1994 were compared to common dairy or pharmaceutical strains.24 From a total of 5192 blood cultures 12 were positive for lactobacilli, an incidence of 0.23%. None of the clinical cases could be related to lactobacilli strains used by the dairy industry. In both studies, patients with lactic acid bacteria bacte-raemia had other severe underlying illnesses. Salminen et al.,25 examined the incidence of lacto-bacilli bacteraemia in the Finnish population for the period corresponding to a rapid increase in consumption of the probiotic strain Lactobacillus rhamnosus GG (ATCC 53103). This strain was isolated from human intestinal flora and introduced into dairy products in 1990. By 1999 the annual per capita consumption was estimated at 6L (3 x 10¹¹cfu) per person/year. The Helsinki University Central Hospital collected all Lactobacillus isolates from blood cultures and cerebro-spinal fluid in its catchment area from 1990 to 2000. Blood culture isolates were also collected for all cases of Lactobacillus bacteraemia reported (and unreported) by mandatory notification to the National Infectious Disease Register, from its inception in 1995 to 2000. Species were characterised and compared to L. rhamnosus GG strain by molecular epidemiological methods. Ninety cases of Lactobacillus bacteraemia were iden-tified between 1995 and 2000, when the population in Finland was 5.2 million. Of the 66 isolates available for species-level identification 48 were Lactobacillus isolates, with the most common species being L. rhamnosus (26, 54%), L. fermentum (9, 19%) and L. casei (7, 15%) respectively. In 35 cases more than one additional bacterial species other then Lactobacillus was also iden-tified. Eighteen of the 66 isolates (27%) were organisms

Safety of probiotics 567
other than Lactobacillus. Eleven of the 26 L. rhamnosus strains were indistinguishable by PFGE from the probiotic L. rhamnosus GG. No increase in the incidence or proportion of Lacto-bacillus bacteraemia was observed, despite a clear in-crease in the number of cases of bacteraemia over the period. Lactobacillus isolates as a proportion of all blood culture isolates was 0.24%, consistent with previous Finnish reports.24 The average annual national incidence of Lactobacillus bacteraemia was estimated as 0.29 cases per 100,000 people per year. The study provides evidence that increased consumption of L. rhamnosus GG had not led to a corresponding increase in Lactobacillus bacte-raemia. Borriello et al.,16 was unable to find published medical literature regarding the consumption of viable probiotics by hospital patients, some of whom may be predisposed to infection by probiotic bacteria. They suggested that because of the low incidence of probiotic bacteraemia and the sophisticated methods and experience needed to con-firm it, identification and confirmation of species and strain characteristics of suspect clinical isolates should be referred to national reference centres. A valuable adjunct to future epidemiological studies such as that by Salminen et al.25 would be an analysis of the relationship if any, between the clinical status of the patient and the presence of Lactobacillus bacteraemia. National clinical and epi-demiological databases could include identity of orga-nism, status of patient's underlying conditions, coexisting infections and outcomes. All probiotics are not equal Many bacteria are being tested to find a putative pro-biotic, yielding conflicting data, sometimes for the same organism. Comparisons between studies and organisms cannot be readily made because of non-standardized dosing procedures, particularly for the number of bacteria and the duration of dosing. Pharmacokinetics, pharma-codynamics, safety and the risk of acquisition of antimi-crobial resistance have usually not been evaluated.27 Probiotic effects are strain-specific, illustrating the need to characterise the relationship between the dose, its duration and effect, on a strain by strain basis. When con-sidering the pharmacokinetics of the probiotic organism we need to know if the bacterial strain modifies intestinal flora. In determining the dose-response relationship, if there is failure to elicit an effect is that because the organisms failed to reach effective levels at the site, or is it due to rapid elimination of the bacteria, or non-persistence, or destruction? As far as dose is concerned, it is unclear whether pro-posed consumption of a probiotic is to be on a regular daily basis for whole of life, or irregular and dependent on symptoms. Information is not readily available on the equivalence or comparability of formulations in different preparations; on the distinction between spore or vege-tative forms, powders, granules, tablets, liquids and yo-ghurts; or adult and paediatric products. Intake data are not generally available for those countries where products are used. Nutritional studies may be needed in addition to toxicological studies, depending on the nature of the
product; its intended use; its anticipated intake; the impact of dietary intake on the spectrum of colonic flora, their metabolic functions and bioavailability of nutrients.28 Summary It is only when a probiotic strain has been unequivocally identified; characterised, screened and its mechanisms of action elucidated with scientific rigour; labelled accu-rately and truthfully; tested for safe and efficacious hu-man use in randomized, blinded placebo-controlled cli-nical trials, ideally with independent verification; and undergone a risk-benefit comparison with existing treat-ments that there will be evidence of sufficient quality to support the unjustified beneficial claims made to date for many proposed probiotics. References 1. FAO/WHO. Guidelines for the evaluation of probiotics in
food. Report of a Joint FAO/WHO Working Group on Drafting Guidelines for the Evaluation of Probiotics in Food. London, Ontario, Canada. FAO/WHO, April 30 and May 1, 2002; 1-11.
2. Ouwehand AC, Salminen S. Safety evaluation of probiotics. In: Mattila-Sandholm T, Saarela M, eds. Functional Diary Products. Cambridge, UK: Woodhead Publishing Ltd, 2003; 316-336.
3. Steidler L, Hans W, Schotte L, Neirynck S, Obermeier F, Falk W, Fiers W, Remaut E. Treatment of murine colitis by Lactococcus lactis secreting interleukin-10. Science 2000; 289:1352-1355.
4. Kaur P, Chopra K, Saini A. Probiotics: potential pharmaceutical applications. Eur J Pharm Sci 2002; 15:1-9.
5. European Food Safety Authority, EFSA Colloquium 2 - “Micro-organisms in Food and Feed Qualified Presumption of Safety – QPS”. 2005. www.efsa.europa.eu/en/science/
colloquium_series/no2_qps.html accessed 10-9-06. 6. Yeung PSM, Sanders ME, Kitts CL, Cano R, Tong PS.
Species-specific identification of commercial probiotic strains. J Dairy Sci 2002; 85:1039-1051.
7. Lourens-Hattingh A, Viljoen BC. Survival of probiotic bacteria in South African commercial bio-yogurt. S Afr J Sci 2002; 98:298-300.
8. Weese JS. Microbiologic evaluation of commercial probiotics. J Am Vet Med Assoc 2002; 220:794-797.
9. Temmerman R, Pot B, Huys G, Swings J. Identification and antibiotic susceptibility of bacterial isolates from probiotic products. Int J Food Microbiol 2003; 81:1-10.
10. Hamilton-Miller JMT, Shah S. Deficiencies in microbiological quality and labelling of probiotic supplements. Int J Food Microbiol 2002; 72:175-176.
11. Playne M. Classification and identification of probiotic bacterial strains. Probiotica 1999; 7:1-2, 4. Yakult, Australia.
12. Salminen S, Isolauri E, von Wright A. Safety of probiotic bacteria. In: Preedy VR, Watson R. eds. Reviews in Food and Nutrition Toxicity Vol. 1. London, UK: Taylor and Francis, 2003; 271-283.
13. Rautio M, Jousimies-Somer H, Kauma H, Pietarinen I, Saxelin M, Tynkkynen S, Koskela M. Liver abscess due to a Lactobacillus rhamnosus strain indistinguishable from L. rhamnosus strain GG. Clin Infect Dis 1999; 28:1159-1160.
14. Mackay AD, Taylor MB, Kibbler CC. Hamilton-Miller JMT. Lactobacillus endocarditis caused by a probiotic organism. Clin Infect Dis 1999; 5:290-292.

568 Diana C Donohue
15. Wolf BW, Wheeler KB, Ataya DG, Garleb KA. Safety and tolerance of Lactobacillus reuteri supplementation to a population infected with the human immunodeficiency virus. Food Chem Toxicol 1998; 36:1085-1094.
16. Borriello SP, HammesWP, Holzapfel W, Marteau P, Schrezenmeir J, Vaara M, Valtonen V. Safety of probiotics that contain Lactobacilli or Bifidobacteria. Clin Infect Dis 2003; 36:775-780.
17. Donohue DC, Salminen S. Marteau P. Safety of probiotic bacteria. In: Salminen S, von Wright A, eds. Lactic Acid Bacteria 2nd edn. New York: Marcel Dekker Inc., 1998; 369-383.
18. Salminen MK, Rautelin H, Tynkkynen S, Poussa T, Saxelin M, Valtonen V, Järvinen A. Lactobacillus bacteremia, species identification, and antimicrobial susceptibility of 85 blood isolates. Clin Infect Dis 2006; 42: e36-44.
19. Sullivan A, Nord CE. Probiotic lactobacilli and bacteraemia in Stockholm. Scand J Infect Dis 2006; 38; 327-331.
20. Kalliomäki M, Salminen S, Arvilommi H, Kero P, Koskinen P, Isolauri E. Probiotics in primary prevention of atopic disease: a standardized placebo-controlled trial. Lancet 2001; 357:1076-1079.
21. Reid G. Safe and efficacious probiotics: what are they? Trends Microbiol 2006; 14 (8):348-352.
22. Salminen MK, Tynkkynen S, Rautelin H, Poussa T, Saxelin M, Ristola M, Valtonen V, Järvinen A. The efficacy and safety of probiotic Lactobacillus rhamnosus GG on prolonged, noninfectious diarrhea in HIV patients on antiretroviral therapy: a randomised, placebo-controlled, crossover study. HIV Clin Trials 2004; 5 (4): 183-191.
23. Saxelin M, Chuang N-H, Chassy B. Rautelin H, Mäkelä PH, Salminen S, Gorbach SL. Lactobacilli and bacteremia in southern Finland, 1989-1992. Clin Infect Dis 1996; 22: 564-566.
24. Saxelin M, Rautelin H, Salminen S, Mäkelä PH. The safety of commercial products with viable Lactobacillus strains. Infect Dis Clin Prac 1996; 5:331-335.
25. Salminen MK, Tynkkynen S, Rautelin H, Saxelin M, Vaara M, Ruutu P, Sarna S, Valtonen V, Järvinen A. Lactobacillus bacteremia during a rapid increase in probiotic use of Lactobacillus rhamnosus GG in Finland. Clin Infect Dis 2002; 35:1155-1160.
26. Sullivan A, Nord CE. The place of probiotics in human intestinal infections. Int J Antimicrob Agents 2002; 20 (5):313-319.
27. International Life Sciences Institute. The safety assessment of novel foods 2001; 1-24. ILSI Europe, Belgium.

Safety of probiotics 569
Original Article
Safety of probiotics Diana C Donohue MAppSci (Toxicology)
School of Medical Sciences, RMIT University, Melbourne, Australia
益生菌的安全性益生菌的安全性益生菌的安全性益生菌的安全性
新品種及更多的特定的益生菌菌株,持續被當作開發新益生菌產品的對象。在將新的菌株添加到食品或是治療產品之前,必須謹慎的評估它們的功效,並評估它們是否會享有傳統食品有機體的安全性。在缺乏科學標準的情況下,經傳統的食物生產的固有食物有機體,被武斷的歸為安全的。益生菌的安全性及功效的證據,直到現在仍只是傳聞或根據相對較小且設計不良的研究。論證益生菌的效力可以為人類及獸醫產品的發展提供廣大的機會。培養一個新益生菌,至少要確定它與傳統的同類一樣安全。很多細菌曾被檢驗以找尋可能的益生菌,但是有時即使是相同的細菌也會產生矛盾的數據。因為非標準化的劑量程序,不同的研究及有機體之間無法立即互相比較。不同的益生菌製備方式間的對等公式的訊息並不可得。對於如何適當地測試一個可以被人類食用的新的益生菌菌株的安全性,引發激烈的辯論。傳統的毒物學及安全評估對評估益生菌的安全性價值有限。當要將新的細菌菌株添在食品或是治療產品中,需要重新考慮安全性評估的程序。本文獻針對這些議題提供概要論述。 關鍵字:益生菌、安全性、菌血症、臨床試驗、導引、功效。

570 Asia Pac J Clin Nutr 2006;15 (4):570-575
Original Article Protection mechanism of probiotic combination against human pathogens: in vitro adhesion to human intestinal mucus Maria Carmen Collado PhD,
1 Lotta Jalonen,1 Jussi Meriluoto PhD2 and
Seppo Salminen PhD1
1 Functional Foods Forum, University of Turku, Itäinen Pitkäkatu 4A, 20014 Turku, Finland, 2 Department of Biochemistry and Pharmacy, Åbo Akademi University, Tykistökatu 6A, 20520 Turku, Finland
In this study we evaluated the ability of commercial strains (L. rhamnosus GG, L. rhamnosus LC705, and P. freudenreichii ssp. shermanii JS) in combination with B. breve 99 or B. lactis Bb12 to inhibit, displace and compete with model pathogens in order to test their influence on the adhesion of selected pathogens to immobilized human intestinal mucus. Our results demonstrate that specific probiotic combinations are able to enhance the inhibition percentages of pathogens adhesion to intestinal mucus when compared to individual strains. This suggests that combinations of probiotic strains are useful and more effective in inhibition of pathogen adhesion than individual strains. Such combinations should be assessed in clinical studies in subjects where the intestinal microbiota aberrancies have been identified.
Keywords: Adhesion, pathogens, Lactobacillus, Bifidobacterium, Propionibacterium, combinations, synergy
Introduction The protective role of probiotic bacteria against gastro-intestinal pathogens and the underlying mechanisms are of interest when new targets for probiotics are identified. Mainly single probiotic strains have been used in human interactions but researching probiotic combinations with added benefits is actively assessed. The most extensive studies and clinical applications of probiotics have been related to the management of gastrointestinal infections caused by pathogenic microorganisms on inflammatory microbiota aberrancies. The development of adjuvant or alternative therapies based on bacterial replacement is considered important due to the rapid emergence of antibiotic-resistant pathogenic strains and the adverse consequences of antibiotic therapies on the protective microbiota. 1 Research using single probiotic strains has been reported earlier but at present probiotic combinations with possibly additional health benefits are being assessed prior to use in clinical studies. At present, only a few scientific reports on the effects of probiotic combinations are available.2-6 The best known probiotic combination consisting of a mixture of eight lactic acid bacterial species (VSL#3) analyzed has been reported to be effective in several human diseases.7-9 However, the mechanisms of action have not been clarified. The ability to adhere to the gastrointestinal mucosa and competitive exclusion of pathogens are most frequent mechanism tools for the search of new probiotics10-12 as the most important criteria for selection of probiotics. For instance, adhesion could be influenced by both the normal
microbiota and the specific probiotics included in each preparation. However, few studies are available on the adhesion interactions of probiotics combination in the intestinal mucus system.13 Thus we hypothesized that com-binations of adherent probiotic strains will influence the pathogens adhesion to the human intestinal mucus, either enhancing or decreasing the adhesion and that specific probiotics should be assessed and selected based on in vitro tests to interact together for particular targets. The aim of this study was to assess the adhesive properties and the abilities to inhibit the adhesion, to displace and to compete with pathogens of L. rhamnosus GG, L. rhamnosus LC705, B. breve 99, B. lactis Bb12 and P. freudenreichii ssp. shermanii JS strains alone or in different combinations using the human intestinal mucus model. 14, 15 Materials and Methods Bacterial strains and culture conditions The lactic acid bacteria (LAB) strains used in this study were Lactobacillus rhamnosus GG (ATCC 53103), L. rhamnosus LC705 (DSM 7061), B. breve 99 (DSM 13692), B. lactis Bb12 (DSM 10140), Propionibacterium freudenreichii spp. shermanii JS (DSM 7067). The pathogens Correspondence address: Maria Carmen Collado, Functional Foods Forum, University of Turku, Itäinen Pitkäkatu 4A 5th floor, FI-20520 Turku, Finland. Tel: +358 2 333 6822; Fax: + 358 2 333 6862; E-mail: [email protected] Accepted 30th August 2006

M Carmen Collado, L Jalonen, J Meriluoto and S Salminen 571
pathogen strains used were Bacteroides vulgatus DSM 1447, Clostridium histolyticum DSM 627, C. difficile DSM 1296, Escherichia coli K2, Listeria monocytogenes ATCC 15313, Salmonella enterica serovar Typhimurium ATCC 12028, Staphylococcus aureus DSM 20231. For assays, lactobacilli were cultured in MRS broth, bifidobacteria in MRS with 0.05% w/v cysteine-HCl, propionibacteria and pathogens were grown in Gifu anaerobic medium (GAM Nissui Pharmaceutical, Tokyo, Japan). All microorganisms were metabolically labeled by addition to the media of 10 µl/ml tritiated thymidine (5-3H-thymidine 120 Ci/mM; Amersham Biosciences, UK) and they were incubated for overnight at 37°C under anaerobic conditions (10% H2, 10% CO2, and 80% N2; Concept 400 anaerobic chamber, Ruskinn Technology, Leeds, UK). Then, radiolabelled bacteria were harvested and washed twice with PBS buffer (130 mM sodium chloride, 10 mM sodium phosphate, pH 7.2). Absorbance (A600nm) was adjusted to 0.25±0.05 to standardize the bacterial concentration (108 CFU/ml approximately). Pro-biotic combinations were made by mixing equal amounts of each probiotic strains.
Adhesion assays to human mucus Human intestinal mucus was collected from the healthy part of resected colonic tissue as previously described 11
and was dissolved (0.5 mg/ml protein) in HEPES-Hanks buffer (HH; 10 mM N-2-hydroxyethylpiperazine-N-2-ethanosulphonic acid, pH 7.4) and 100 µl of the mucus were immobilized on polystyrene microtitre plate wells (Maxisorp, Nunc, Denmark) by overnight incubation at 4 °C. The adhesion assessment was carried out as pre-viously described.12 Adhesion was calculated as the percentage of radioactivity recovered after adhesion relative to the radioactivity of the bacterial suspension added to the mucus. Inhibition of pathogen adhesion to intestinal mucus To test the ability of the probiotic combinations to inhibit the adhesion of pathogens, the procedure described by Collado et al.,12 was used. The inhibition was calculated as the difference between the adhesion of the pathogen in the absence and presence of probiotic combinations. Inhibition was determined in three independent experi-ments and each assay was performed in triplicate.
% inhibition of pathogen adhesion
0 20 40 60 80
B. vulgatus
C.histolyticum
St. aureus
C. difficile
S. thypimurium
L.monocytogenes
E. coli
inhibition analysisdisplacement analysiscompetition analysis
Figure 1. Inhibition of pathogen adhesion regarding to inhibition, displacement and competition with L. rhamnosus GG, L. rhamnosus LC705, B. lactis Bb12 and Propionibacterium JS combination. Results are shown as media ± standard deviation. Controls (pathogen adhesion alone without probiotic combination presence) were taken as 0%.

572 Probiotics and intestinal adhesion by pathogenic bacteria
Displacement of pathogens adhered to intestinal mucus The ability of the studied probiotic strains to displace already adhered pathogens was assessed according to Collado et al.12 Displacement of pathogens was calculated as the difference between the adhesion after the addition of the probiotic combinations and the corresponding control buffer. At least three independent experiments were carried out. Each assay was performed in triplicate to calculate intra-assay variation. Competence between pathogens and probiotic strains to adhere to intestinal mucus Competitive exclusion of the pathogens by tested pro-biotics was determined as described previously.16 Com-petitive exclusion was calculated as the percentage of pathogens bound after the combination with probiotic combinations relative to pathogens bound in the absence of LAB (control). Statistical analysis Statistical analysis was done using the SPSS 11.0 soft-ware (SPSS Inc, Chicago, IL, USA). Data were subjected to one-way ANOVA.
Results In vitro adhesion assay to intestinal human mucus All probiotic strains tested were able to adhere to in-testinal mucus. The percentages expressed as mean ± SD were 20.0% ± 2.0 for L. rhamnosus GG, 1.2% ± 0.7 for L. rhamnosus LC705, 0.9% ± 0.5 for P. freudenreichii JS and 2.5% ± 0.3 for B. breve 99. The most adhesive strains was L. rhamnosus GG (20.0%) while the less adhesive strain was P. freudenreichii JS (0.9%). With regard to the pathogenic bacteria, E. coli K2 showed the highest adhesion value (13.8%), while the other patho-gens tested showed adhesion values ranging from 4.6 to 12.6%. The less adhesive pathogens were L. monocytogenes ATCC 15313 and Salmonella enterica serovar Typhimurium ATCC 12028 that just showed a 0.5% and 0.6% of adhesion to human intestinal mucus, respectively. Inhibition of pathogen adhesion to intestinal mucus The inhibition of the adhesion of pathogenic micro-organisms by the assessed probiotic combinations was dependent on the each probiotic strain and the pathogen assayed (Fig. 1 & 2). Probiotic combinations were able to significantly inhibit (P<0.05) the adhesion of all model
% inhibition of pathogen adhesion
0 20 40 60 80
B. vulgatus
C.histolyticum
St. aureus
C. difficile
S. thypimurium
L.monocytogenes
E. coli
inhibition analysisdisplacement analysiscompetition analysis
Figure 2. Inhibition of pathogen adhesion regarding to inhibition, displacement and competition with L. rhamnosus GG, L. rhamnosus LC705, B. breve 99 and Propionibacterium JS combination. Results are shown as media ± standard deviation. Controls (pathogen adhesion alone without probiotic combination presence) were taken as 0%.

M Carmen Collado, L Jalonen, J Meriluoto and S Salminen 573
pathogens in this study. Bacteroides vulgatus were inhibited in 15.0-15.4%, Clostridium histolyticum in 12.0-23.9%, Clostridium difficile in 2.0-26.6%, Staphylococcus aureus (8.6-30.1%). Salmonella enterica serovar Typhimurium was inhibited by all combinations in 10.1-45.3% and Listeria monocytogenes in 13.6-47.1%. The L. rhamnosus LGG, L. rhamnosus LC705, B. lactis Bb12 and P. freudenreichii JS combination was able to significantly inhibit (P >0.05) the adhesion of other pathogens expect E. coli K2. The best combination to inhibit pathogen adhesion was L. rhamnosus GG, L. rhamnosus LC705, B. breve 99 and P. freudenreichii JS combination because it was able to inhibit all pathogens tested in higher percentages than the other combination with B. lactis Bb12. Displacement of pathogens adhered to intestinal mucus Results of pathogen displacement by commercial pro-biotic strains are showed in Figure 1 and 2. Both pro-biotic combinations were able to displace significantly (P <0.05) Bacteroides vulgatus (38.6-55.3%), Clostridium histolyticum (19.1-35.8%), Clostridium difficile (20.8-49.5%), Staphylococcus aureus (28.3-31.0%), Escherichia coli K2 (43.0-48.0%), Salmonella enterica serovar Typhimurium (44.3-54.6%) and Listeria monocytogenes (25.5-48.0%). The best combination to displace the pre-adhered pathogens was L. rhamnosus GG, L. rhamnosus LC705, B. breve 99 and P. freudenreichii JS combination because it was able to displace all pathogens tested in the highest percentages. Competition between pathogens and probiotic com-binations to adhere to intestinal mucus Results of competitive exclusion studies between patho-gens and probiotic strains are presented in Figure 1 and 2. All probiotic combinations were able to compete sig-nificantly (P <0.05) for mucus sites with all pathogen strains tested. Bacteroides vulgatus was inhibited from 25.9% to 35.7% by probiotic combination. Clostridium histolyticum inhibition ranged from 20.7 to 44.4%, Clostridium difficile inhibition from 42.7 to 45.0%, Staphylococcus aureus from 25.4 to 45.3%, Escherichia coli from 44.3 to 48.2%, Salmonella enterica serovar typhimurium from 42.6 to 57.3% and Listeria monocytogenes between 52.2-58.8%. Discussion Our results are among the first to compare the in vitro properties and competitive exclusion abilities of different probiotic combination. Probiotic bacteria selected for commercial use in foods and in therapeutics must retain the characteristics for which they were originally selected. 10,11,17 Bacterial adhesion is a complex process involving contact between the bacterial cell membrane and inter-acting surfaces. In addition, adhesion to different mucosal surfaces, such as gastrointestinal, urogenital and respira-tory tracts, is regarded a prerequisite for probiotic micro-organisms, allowing the colonization, although transient, of the human intestinal tract18 but also, it is an important step in pathogenic infection. Thus, the ability to adhere to epithelial cells and mucosal surfaces has been suggested
to be an important property of probiotic bacterial strains and their combinations.12,19 It can be hypothesized that a combination of probiotic strains may complement each other's effects or improve benefits or properties.3,4 We hypothesized that com-binations of well-known probiotic strains as B. lactis Bb12 and L. rhamnosus GG, will influence pathogen adhesion in the human intestinal mucus, either enhancing or decreasing their adhesion. The objective of this study was therefore to determine if the chosen probiotics in the combinations tested may increase or enhance each other’s beneficial properties and their potential applications in clinical studies. All probiotic strains included and tested in this study have documented health effects and also, the combination of the four strains.3,4 All these strains tested were found to adhere well in the model system; this is in agreement with earlier observations.12,20,21 The adhesion levels of the tested commercial probiotic strains showed a great variability depending on the strain, species and ge-nera. All combinations of four probiotic strains tested were able to reduce the adhesion of all pathogen strains to intestinal mucus. The ability to exclude and displace pathogens from mucus by specific probiotic strains has been reported in other studies12,21,22 but few studies with probiotics com-binations have been related. Interestingly, all the patho-gens tested showed a high adherence to intestinal mucus, with the exception of Listeria monocytogenes that only adhered a 0.5% and Salmonella enterica serovar Typhimurium ATCC 12028 that show only 0.6% of adhesion to mucus. These results suggest that they have the capacity to bind the intestinal mucus, which could assist the pathogens in the invasion into the human intestinal mucosa. In this context, to find appropriate probiotic microorganisms with the ability to prevent the adhesion of these pathogenic bacteria is important, and also, to test new potential probiotic combinations with synergistic in vitro properties would be important. The ability to inhibit the adhesion of pathogens appears to be dependent in both, the probiotic com-bination and the pathogen tested, indicating a very high specificity and requiring identification of the pathogens or related microbiota aberrancies involved in the probiotic target population. The displacement of pre-adhered pathogens was also found to be probiotic combination and pathogen dependent and as in the case of the inhibition of pathogen adhesion no direct correlation was found between adhesion of commercial probiotics strains and displacement of pathogen. Nevertheless, adhesion seems to be one of the factors implied. The displacement pro-files were different from those observed for the inhibition of pathogens. These results, together with previous observations12,22 appear to confirm that different mecha-nisms are implied in both phenomena. Also, no relation was found between the results obtained for the adhesion inhibition and displacement of pathogens, suggesting us that different mechanisms could be implied in both pro-cesses. We were able to demonstrate that both combinations had improved synergistic properties against pathogens than the individual strains.23 However, the combination with better properties against the model pathogens re-

574 Probiotics and intestinal adhesion by pathogenic bacteria
garding to inhibition, displacement and competition beha-viors was L. rhamnosus GG and LC705, B. breve 99 and Propionibacterium JS. Probiotic combinations that inhibit and displace patho-gens may be excellent candidates to use in fermented milk products. Our results demonstrate that all probiotic com-binations tested in this study showed good probiotic characteristics but it is important to take into account the high specificity of these in order to select the best strain combinations to prevent or treat infection by a specific pathogen. This would allow the development of new pro-biotic combinations for specific diseases caused by spe-cific pathogens and they could be useful in their pre-vention or treatment. Our results suggest that it is possible that these combinations could increase the beneficial effects in the health regarding to their pathogens adhesion inhibition properties and their influence in their coloni-zation. It could be suggested that combinations of different probiotic strains may be more effective in in vivo than monostrain probiotics, and there are also other re-ports that demonstrate this hypothesis.3,25-27 The results report a high specificity in the inhibition of the adhesion and displacement of enteropathogens by different pro-biotic strain combinations, belonging to different genus and species, indicating the need of a case-by-case charac-terization of these combinations. However, it must be taken into account that in vivo studies are necessary to confirm their potential effect prior to introducing such combinations to clinical intervention studies. Acknowledgements This work was supported by the Academy of Finland, Research Council for Biosciences and Environment (decision numbers 210309 to Åbo Akademi and 210310 to University of Turku). M.C. Collado is the recipient of Excellence Postdoctoral grant from Conselleria Empresa, Universidad y Ciéncia de la Generalitat Valenciana, Spain (BPOSTDOC 06/016). References 1. Forestier C, De Champs C, Vatoux C, Joly B. Probiotic
activities of Lactobacillus casei rhamnosus: in vitro adherence to intestinal cells and antimicrobial properties. Res Microbiol 2001; 152: 167–173.
2. Femia AP, Luceri C, Dolara P, Giannini A, Biggeri A, Salvadori M, Clune Y, Collins KJ, Paglierani M, Caderni G. Antitumorigenic activity of the prebiotic inulin enriched with oligofructose in combination with the probiotics Lactobacillus rhamnosus and Bifidobacterium lactis on azoxymethane-induced colon carcinogenesis in rats. Carcinogenesis 2002; 23(11):1953-1960.
3. Myllyluoma E, Veijola L, Ahlroos T, Tynkkynen S, Kankuri E, Vapaatalo H, Rautelin H, Korpela R. Probiotic supplementation improves tolerance to Helicobacter pylori eradication therapy - a placebo-controlled, double-blind randomized pilot study. Aliment Pharmacol Ther 2005; 21(10):1263-1272.
4. Kajander K, Hatakka K, Poussa T, Farkkila M, Korpela R. A probiotic mixture alleviates symptoms in irritable bowel syndrome patients: a controlled 6-month intervention. Aliment Pharmacol Ther 2005; 22(5):387-394.
5. Olivares M, Diaz-Ropero MP, Gomez N, Lara-Villoslada F, Sierra S, Maldonado JA, Martin R, Rodriguez JM, Xaus J. The consumption of two new probiotic strains, Lactobacillus gasseri CECT 5714 and Lactobacillus coryniformis CECT 5711, boosts the immune system of healthy humans. Int Microbiol 2006; 9(1):47-52.
6. Roselli M, Finamore A, Britti MS, Mengheri E. Probiotic bacteria Bifidobacterium animalis MB5 and Lactobacillus rhamnosus GG protect intestinal Caco-2 cells from the inflammation-associated response induced by entero-toxigenic Escherichia coli K88. Br J Nutr 2006; 95 (6): 1177-1184.
7. Bibiloni R, Fedorak RN, Tannock GW, Madsen KL, Gionchetti P, Campieri M, De Simone C, Sartor RB. VSL#3 probiotic-mixture induces remission in patients with active ulcerative colitis. Am J Gastroenterol 2005; 100 (7): 1539-1546.
8. Gionchetti P, Lammers KM, Rizzello F, Campieri M. VSL#3: an analysis of basic and clinical contributions in probiotic therapeutics. Gastroenterol Clin North Am 2005; 34(3): 499-513. Review.
9. Kim HJ, Vazquez Roque MI, Camilleri M, Stephens D, Burton DD, Baxter K, Thomforde G, Zinsmeister AR. A randomized controlled trial of a probiotic combination VSL#3 and placebo in irritable bowel syndrome with bloating. Neurogastroenterol Motil 2005; 17 (5): 687-696.
10. Salminen S, Ouwehand AC, Benno Y, Lee YK. Probiotics: how should they be defined?. Trends Food Sci Technol 1999; 10:107-110.
11. Ouwehand AC, Salminen S, Isolauri E. Probiotics: an overview of beneficial effects. Anton Leeuw Int J G 2002; 82: 279–289.
12. Collado MC, Gueimonde M, Hernandez M, Sanz Y, Salminen S. Adhesion of selected Bifidobacterium strains to human intestinal mucus and its role in enteropathogen exclusion. J Food Prot 2005; 68 (12): 2672–2678.
13. Ouwehand AC, Isolauri E, Kirjavainen PV, Tolkko S, Salminen SJ. The mucus binding of Bifidobacterium lactis Bb12 is enhanced in the presence of Lactobacillus GG and Lact. delbrueckii subsp. bulgaricus. Lett Appl Microbiol 2000; 30 (1):10-13.
14. Ouwehand AC, Salminen S. In vitro adhesion assays for probiotics and their in vivo relevance: A review. Microb Ecol Health Dis 2003; 15: 175-184.
15. Vesterlund S, Paltta J, Karp M, Ouwehand AC. Measurement of bacterial adhesion — in vitro evaluation of different methods. J Microbiol Methods. 2005; 60: 225–233.
16. Rinkinen M, Westermarck E, Salminen S, Ouwehand AC. Absence of host specificity for in vitro adhesion of probiotic lactic acid bacteria to intestinal mucus. Vet Microbiol 2003; 97: 55-61.
17. Tuomola E, Crittenden R, Playne M, Isolauri E, Salminen S. Quality assurance criteria for probiotic bacteria. Am J Clin Nutr 2001; 73: 393-398.
18. Alander M, Satokari R, Korpela R, Saxelin M, Vilpponen-Salmela T, Mattila-Sandholm T, von Wright A. Persistence of colonization of human colonic mucosa by a probiotic strain, Lactobacillus rhamnosus GG, after oral con-sumption. Appl Environ Microbiol 1999; 65: 351-354.
19. Ouwehand AC, Isolauri E, Kirjavainen PV, Salminen SJ. Adhesion of four Bifidobacterium strains to human in-testinal mucus from subjects in different age groups. FEMS Microbiol Lett 1999; 172: 61–64.
20. Tuomola EM, Ouwehand AC, Salminen SJ. The effect of probiotic bacteria on the adhesion of pathogens to human intestinal mucus. FEMS Immunol Med Microbiol 1999; 26: 137-142.
21. Gueimonde M, Jalonen L, He F, Hiramatsu M, Salminen S. Adhesion and competitive inhibition and displacement of human enteropathogens by selected lactobacilli. Food Res Int 2006; 39 (4): 467-471.

M Carmen Collado, L Jalonen, J Meriluoto and S Salminen 575
22. Lee Y-K, Puong KY, Ouwehand AC, Salminen S. Displacement of bacterial pathogens from mucus and Caco-2 cell surface by lactobacilli. J Med Microbiol 2003; 52: 925-930.
23. Collado MC, Meriluoto J, Salminen S. Interactions between pathogens and lactic acid bacteria: aggregation properties and adhesion to hydrocarbons. Int J Food Microbiol 2006; in press.
24. Zoppi G, Cinquetti M, Benini A, Bonamini E, Minelli EB. Modulation of the intestinal ecosystem by probiotics and lactulose in children during treatment with ceftriaxone. Curr Ther Res 2001; 62: 418– 435.
25. Perdigon G, Maldonado Galdeano C, Valdez JC, Medici M. Interaction of lactic acid bacteria with the gut immune system. Eur J Clin Nutr 2002; 56 (4):S21-S26.
26. Gionchetti P, Amadini C, Rizzello F, Venturi A, Campieri M. Review article: treatment of mild to mo-derate ulcerative colitis and pouchitis. Aliment Pharmacol Ther 2002; 16 (4): 13– 19.
27. Timmerman HM, Koning CJ, Mulder L, Rombouts FM, Beynen AC. Monostrain, multistrain and multispecies probiotics- A comparison of functionality and efficacy. Int J Food Microbiol 2004; 96: 219-233.
Original Article Protection mechanism of probiotic combination against human pathogens: in vitro adhesion to human intestinal mucus Maria Carmen Collado PhD,
1 Lotta Jalonen BSc,1 Jussi Meriluoto PhD
2 and Seppo Salminen PhD
1
1 Functional Foods Forum, University of Turku, Itäinen Pitkäkatu 4A, 20014 Turku, Finland, 2 Department of Biochemistry and Pharmacy, Åbo Akademi University, Tykistökatu 6A, 20520 Turku, Finland
益生菌結合體對抗益生菌結合體對抗益生菌結合體對抗益生菌結合體對抗人體病原菌在體外實驗中吸附於人類人體病原菌在體外實驗中吸附於人類人體病原菌在體外實驗中吸附於人類人體病原菌在體外實驗中吸附於人類腸黏液的保護機制腸黏液的保護機制腸黏液的保護機制腸黏液的保護機制 本研究我們評估商業菌種(L. rhamnosus LGG, L. rhamnosus LC705, 及 P.
freudenreichii ssp. shermanii PJS)與B. breve Bb99或B. lactis Bb12 結合 後對 於 抑
制、取代和對抗模式病原體的能力,以測試這些益生菌結合體對於吸附在停止不動的人體腸黏液上的病原體之影響。我們的結果指出單一菌種相比,特定的益生菌結合體可以提高抑制病原體黏著於腸黏液的比例。這些結果指出益生菌菌種結合體比起單一菌種,對於抑制病原體的吸附較有用且功效更佳。此結合體應該對那些腸道微生物菌叢異常已經被確認的對象進行臨床研究加以評估。
關鍵字:附著、病原體、乳酸菌、雙歧桿菌、丙酸桿菌、結合體、協同作用。

576 Asia Pac J Clin Nutr 2006;15 (4):576-580
Original Article Clinical studies on alleviating the symptoms of irritable bowel syndrome with a probiotic combination Kajsa Kajander MSc
1,2 and Riitta Korpela PhD1,2,3
1 Institute of Biomedicine, Pharmacology, University of Helsinki, Finland 2 Valio Ltd, Research Centre, Helsinki, Finland 3 Foundation for Nutrition Research, Helsinki, Finland
Irritable bowel syndrome (IBS) is one of the most common diagnoses in gastroenterology, but current therapies are inefficient. Recent clinical trials suggest beneficial effects of certain probiotics in IBS. Because of the heterogeneity of IBS a probiotic combination may be more efficient than a single strain. We screened for optimal strains, and developed a multispecies probiotic combination consisting of L. rhamnosus GG, L. rhamnosus Lc705, P. freudenreichii ssp. shermanii JS and Bifidobacterium breve Bb99. The clinical efficacy of the probiotic combination was evaluated in IBS patients in a randomised, double-blind, placebo-controlled six-month intervention. During six months the subjects received daily either probiotic supplementation or placebo. IBS symptoms were followed by symptom diaries. The probiotic supplementation demonstrated significant value in reducing IBS symptoms. At the end of the study period the total symptom score (abdominal pain + distension + flatulence + rumbling) had reduced with 42% in probiotic group versus 6% in the placebo group. The treatment difference in the baseline-adjusted symptom score between the groups was -7.7 points (95% CI -13.9 to -1.6) in the favour of the probiotic supplementation. The underlying mechanisms could involve for instance anti-inflammatory effects, balancing of the microbiota or motility-related effects induced by the probiotic. The probiotic activity may be enhanced by synergistic effects of the combination that each strain alone would not hold. In conclusion, we found a probiotic combination of LGG and three other strains to be effective in alleviating IBS symptoms.
Key Words: gastrointestinal symptoms, irritable bowel syndrome, probiotics, probiotic combination
Introduction Irritable bowel syndrome (IBS) is one of the most common diagnoses in gastroenterology, since it is estimated that approximately 10-20% of the adult population suffers from this syndrome worldwide.1 IBS is a heterogeneous con-dition that presents as abdominal pain, distension, flatu-lence and irregular bowel movements. Certain probiotics have shown promising beneficial effects in IBS,2-5 but the evidence can not yet be considered consistent. No single abnormality in the microbiota of IBS patients versus healthy controls has been found, but several studies have reported various and different alterations in the bacterial composition of subjects with IBS.6-10 This finding com-bined with the diverse nature of IBS symptoms may indi-cate that a probiotic combination could be more efficient than a single strain in this particular disease. Timmerman and co-workers11 have in a recent review defined a multi-species probiotic as “containing strains of different pro-biotic species that belong to one or preferentially more genera”. They suggest that multispecies probiotics may in some conditions be more efficient than monostrain pro-biotics due to for instance enhanced adhesion and a greater variety of antimicrobial compounds. With similar thoughts, our aim was to develop a multispecies probiotic com-bination that could alleviate symptoms of IBS.
Selection of efficient probiotic strains Lactobacillus rhamnosus GG (ATCC 53103; LGG®) is one of the most studied probiotics worldwide. Its beneficial effects have been well-documented in the prevention and treatment of various gastrointestinal disorders, especially diarrhea.12 In addition to this, LGG has been shown to possess immunomodulatory effects, e.g the lowering of proinflammatory cytokines, such as tumour necrosis factor (TNF)-α in allergic children13 and interleukin (IL) -6 and TNF-α in healthy volunteers.14 There is a growing body of evidence that IBS might be a state of low-grade mucosal inflammation,15 and consequently a probiotic lowering pro-inflammatory responses may be hypothesised to be useful in IBS. LGG alone has, nonetheless, not been successful in alleviating IBS symptoms.16,17 Therefore three other strains were, based on their promising in vitro properties, selected to be combined with LGG. Other strains selected Correspondence address: Dr Riitta Korpela, Foundation for Nutrition Research, PO Box 30, FIN-00039 Helsinki, Finland Tel. +358 10381 3026; Fax. +358 10381 3019 E-mail: [email protected] Accepted 30th August 2006

K Kajander and R Korpela 577
to the combination were Lactobacillus rhamnosus Lc705 (DSM 7061; Lc705), Propionibacterium freudenreichii ssp. shermanii JS (DSM 7067; PJS) and Bifidobacterium breve Bb99 (DSM 13692; Bb99). Lc705 has been shown to produce an antimicrobial agent, 2-pyrrolidone-5-carboxylic acid.18 Together with PJS it inhibits yeasts and moulds in food and feed18 and seems slightly to alleviate constipation.20 Other strains of P. freudenreichii have in earlier experiments showed successful in vitro and in vivo adhesion to intestinal epithelial cells21 as well as beneficial activity in the GI tract via producing apoptosis-inducing SCFA.22 B. breve was isolated from a normal gut microbiota of a healthy infant, and there is an increasing amount of data indi-cating that bifidobacteria are advantageous probiotic agents.23,24 Regarding synergistic effects especially adhe-sion can be remarkably increased in probiotic combi-nations: the presence of LGG more than doubled the ad-hesion of Bifidobacterium Bb-12 and tripled the adhesion of a P. freudenreichii strain. 25,26 Clinical trial with a multispecies probiotic combination A randomized, double-blind, placebo-controlled six-month trial was conducted in order to investigate the therapeutic value of the probiotic combination (LGG, Lc705, PJS and Bb99) in IBS.4 Altogether 103 IBS patients with a well-established IBS diagnosis took part in the trial, and 86 subjects completed the study. All the patients fulfilled the Rome criteria I27 and the majority (68%) also fulfilled the Rome criteria II.28 During the six-month intervention period all subjects took daily either one multispecies probiotic capsule (Valio Ltd, Helsinki, Finland; total amount of bacteria 8-9 x 10⁹ cfu/day; equal amount of each strain) or one placebo capsule. Abdo-minal symptoms and bowel habits were followed by a
symptom diary that the subjects were instructed to fill in regularly. The RAND-36 questionnaire29 was used to monitor health related quality of life. The probiotic supplementation demonstrated sig-nificant value in reducing IBS symptoms. At the end of the intervention the total symptom score (abdominal pain + distension + flatulence + rumbling; possible range 0-112) had reduced with 42% in probiotic group versus 6% in the placebo group. At six month the treatment difference in the baseline-adjusted total symptom score was -7.7 points (95% CI -13.9 to -1.6) when the probiotic group was compared to placebo (P=0.015; Fig. 1). There were no significant differences between the groups re-garding changes in bowel habits or quality of life. Con-sistently, a pilot-trial involving subjects under H. pylori eradication has shown the beneficial GI effects of the pro-biotic combination, since the probiotic supplementation improved tolerance to eradication.30 Possible mechanisms of probiotic therapy Several putative mechanisms have been suggested to play a role in the IBS symptom-relieving effects of probiotics. Probiotics could influence IBS directly through balancing the microbiota, and hence normalising an aberrant gas-production or production of short chain fatty acids observed in some cases of IBS.31,32 An inflammatory component seems also to be one possible deviance in IBS, especially in so-called post-infectious IBS, a form of the disease that affects 10–15% of patients after acute in-fectious enteritis.33 LGG alone is able to modulate the immune response.13,14 Also the probiotic combination has in other trials involving atopic children been shown to be immunomodulatory, but in a different way from LGG.34-36 Animal models clearly imply that inflammation could contribute to symptoms of irritable bowel, since there is
0 1 2 3 4 5 6 7-12
-10
-8
-6
-4
-2
0
2
4Probiotic mix
Placebop=0.015
Time (months)
Ch
an
ge
in
sy
mp
tom
sc
ore
Figure 1. Change (mean ± SEM) in total symptom score (abdominal pain + distension + flatulence + rumbling) during the six month intervention (p=0.015 at six months; n=81). Figure reprinted from reference 4 with the permission of Blackwell Publishing.

578 Probiotics and Irritable Bowel Syndrome
an indication of a causal relationship between the pre-sence of mucosal inflammation and altered sensory-motor function.37 In addition to balancing the microbiota and having immunomodulatory effects probiotics may influence intestinal motility. In vitro studies on isolated intestines of guinea pigs have shown that probiotics, especially bifi-dobacteria, have a relaxing effect on the colon.38 L. paracasei seems also to attenuate post-infective dys-motility and visceral hypersensitivity in murine models of IBS.39,40 A recent cell line study also introduces new ideas about possible probiotic mechanisms in the GI tract.41 LGG was shown to modulate the activity of certain signalling pathways in intestinal epithelial cells by activation of MAP kinases. LGG treatment of gut epi-thelial cells seemed to protect them from oxidant stress, possibly by preserving cytoskeletal integrity. Conclusions A multispecies probiotic consisting of LGG, L. rhamnosus Lc705, P. freudenreichii ssp. shermanii JS and B. breve Bb99 seems to alleviate IBS symptoms significantly in a six-month placebo-controlled trial. This is the first long-term clinical intervention to demnostrate efficacy of a certain probiotic in irritable bowel syn-drome. Studies investigating the mechanisms of action are under way.
References 1. Longstreth GF, Thompson WG, Chey WD, Houghton LA,
Mearin F, Spiller RC. Functional bowel disorders. Gastroenterology 2006;130:1480-1491.
2. Nobaek S, Johansson M-L, Molin G, Ahrné S, Jeppsson B. Alteration of intestinal microflora is associated with reduction in abdominal bloating and pain in patients with irritable bowel syndrome. Am J Gastroenterol 2000;95:1231-1238.
3. O'Mahony L, McCarthy J, Kelly P, Hurley G, Luo F, Chen K, O'Sullivan GC, Kiely B, Collins JK, Shanahan F, Quigley EM. Lactobacillus and bifidobacterium in irritable bowel syndrome: symptom responses and relationship to cytokine profiles. Gastroenterology 2005;128:541-551.
4. Kajander K, Hatakka K, Poussa T, Färkkilä M, Korpela R. A probiotic mixture alleviates symptoms in irritable bowel syndrome patients: a controlled 6-month intervention. Aliment Pharmacol Ther 2005;22:387-394.
5. Kim HJ, Camilleri M, McKinzie S, Lempke MB, Burton DD, Thomforde GM, Zinsmeister AR. A randomized controlled trial of a probiotic, VSL#3, on gut transit and symptoms in diarrhoea-predominant irritable bowel syndrome. Aliment Pharmacol Ther 2003;17:895-904.
6. Balsari A, Ceccarelli A, Dubini F, Fesce E, Poli G. The fecal microbial population in the irritable bowel syndrome. Microbiologica 1982; 5:185-194.
7. Malinen E, Rinttilä T, Kajander K, Mättö J, Kassinen A, Krogius L, Saarela M, Korpela R, Palva A. Analysis of the fecal microbiota of irritable bowel syndrome patients and healthy controls with real-time PCR. Am J Gastroenterol 2005;100:373-382.
8. Mättö J, Maunuksela L, Kajander K, Palva A, Korpela R, Kassinen A, Saarela M. Composition and temporal stability of gastrointestinal microbiota in irritable bowel syndrome - a longitudinal study in IBS and control subjects. FEMS Immunol Med Microbiol 2005;43:213-222.
9. Maukonen J, Satokari R, Mättö J, Söderlund H, Mattila-Sandholm T, Saarela M. Prevalence and temporal stability of selected clostridial groups in irritable bowel syndrome in relation to predominant faecal bacteria. J Med Microbiol 2006;55:625-633.
10. Si JM, Yu YC, Fan YJ, Chen SJ. Intestinal microecology and quality of life in irritable bowel syndrome patients. World J Gastroenterol 2004;10:1802-1805.
11. Timmerman HM, Koning CJ, Mulder L, Rombouts FM, Beynen AC. Monostrain, multistrain and multispecies probiotics -A comparison of functionality and efficacy. Int J Food Microbiol 2004;96:219-233.
12. Huang JS, Bousvaros A, Lee JW, Diaz A, Davidson EJ. Efficacy of probiotic use in acute diarrhea in children: a meta-analysis. Dig Dis Sci 2002;47:2625-2634.
13. Majamaa H, Isolauri E. Probiotics: a novel approach in the management of food allergy. J Allergy Clin Immunol 1997;99:179-185.
14. Schultz M, Linde HJ, Lehn N, Zimmermann K, Grossmann J, Falk W, Scholmerich J. Immunomodulatory conse-quences of oral administration of Lactobacillus rhamnosus strain GG in healthy volunteers. J Dairy Res 2003;70:165-173.
15. Bercik P, Verdu EF, Collins SM. Is irritable bowel syndrome a low-grade inflammatory bowel disease? Gastroenterol Clin North Am 2005; 34: 235-245, vi-vii.
16. Bausserman M, Michail S. The use of Lactobacillus GG in irritable bowel syndrome in children: a double-blind randomized control trial. J Pediatr 2005;147:197-201.
17. O'Sullivan MA, O'Morain CA. Bacterial supplementation in the irritable bowel syndrome. A randomised double-blind placebo-controlled crossover study. Dig Liver Dis 2000;32:294-301.
18. Yang Z, Suomalainen T, Mäyrä-Mäkinen A, Huttunen E. Antimicrobial activity of 2-pyrrolidone-5-carboxylic acid produced by lactic acid bacteria. J Food Prot 1997; 60: 786-790.
19. Suomalainen T, Mäyrä-Mäkinen A. Propionic acid bacteria as protective cultures in fermented milks and breads. Lait 1999; 79: 165-174.
20. Ouwehand A, Lagström H, Suomalainen T, Salminen S. Effect of probiotics on constipation, fecal azoreductase activity and fecal mucin content in the elderly. Ann Nutr Metab 2002;46:159-162.
21. Zarate G, Morata de Ambrosini VI, Chaia AP, Gonzalez SN. Adhesion of dairy propionibacteria to intestinal epithelial tissue in vitro and in vivo. J Food Prot 2002; 65: 534-539.
22. Jan G, Belzacq AS, Haouzi D, Rouault A, Metivier D, Kroemer G, Brenner C. Propionibacteria induce apoptosis of colorectal carcinoma cells via short-chain fatty acids acting on mitochondria. Cell Death Differ 2002; 9: 179-188.
23. Orrhage K, Nord CE. Bifidobacteria and lactobacilli in human health. Drugs Exp Clin Res 2000;26:95-111.
24. Picard C, Fioramonti J, Francois A, Robinson T, Neant F, Matuchansky C. Review article: bifidobacteria as probiotic agents -physiological effects and clinical benefits. Aliment Pharmacol Ther 2005; 22: 495-512.
25. Ouwehand AC, Isolauri E, Kirjavainen PV, Tolkko S, Salminen SJ. The mucus binding of Bifidobacterium lactis Bb12 is enhanced in the presence of Lactobacillus GG and Lact. delbrueckii subsp. bulgaricus. Lett Appl Microbiol 2000;30:10-13.
26. Ouwehand AC, Suomalainen T, Tolkko S, Salminen S. In vitro adhesion of propionic acid bacteria to human intestinal mucus. Lait 2002; 82: 123-130.

K Kajander and R Korpela 579
27. Thompson WG, Dotevall G, Drossman DA, Heaton KW, Kruis W. Irritable bowel syndrome: Guidelines for the diagnosis. Gastroenterology International 1989;2:92-95.
28. Thompson WG, Longstreth GF, Drossman DA, Heaton KW, Irvine EJ, Muller-Lissner SA. Functional bowel disorders and functional abdominal pain. Gut 1999;45 Suppl 2:43-47.
29. Hays RD, Sherbourne CD, Mazel RM. The RAND 36-Item Health Survey 1.0. Health Econ 1993;2:217-227.
30. Myllyluoma E, Veijola L, Ahlroos T, Tynkkynen S, Kankuri E, Vapaatalo H, Rautelin H, Korpela R. Probiotic supplementation improves tolerance to Helicobacter pylori eradication therapy -a placebo-controlled, double-blind randomized pilot study. Aliment Pharmacol Ther 2005; 21: 1263-1272.
31. King TS, Elia M, Hunter JO. Abnormal colonic fermentation in irritable bowel syndrome. Lancet 1998; 352: 1187-1189.
32. Treem WR, Ahsan N, Kastoff G, Hyams JS. Fecal short-chain fatty acids in patients with diarrhea-predominant irritable bowel syndrome: In vitro studies of carbohydrate fermentation. J Pediatr Gastroenterol Nutr 1996;23:280-286.
33. Spiller RC. Postinfectious irritable bowel syndrome. Gastroenterology 2003; 124: 1662-1671.
34. Pohjavuori E, Viljanen M, Korpela R, Kuitunen M, Tiittanen M, Vaarala O, Savilahti E. Lactobacillus GG effect in increasing IFN-gamma production in infants with cow's milk allergy. J Allergy Clin Immunol 2004;114:131-136.
35. Viljanen M, Kuitunen M, Haahtela T, Juntunen-Backman K, Korpela R, Savilahti E. Probiotic effects on faecal inflammatory markers and on faecal IgA in food allergic atopic eczema/dermatitis syndrome infants. Pediatr Allergy Immunol 2005;16:65-71.
36. Viljanen M, Savilahti E, Haahtela T, Juntunen-Backman K, Korpela R, Poussa T, Tuure T, Kuitunen M. Probiotics in the treatment of atopic eczema/dermatitis syndrome in infants: a double-blind placebo-controlled trial. Allergy 2005; 60: 494-500.
37. Collins SM. The immunomodulation of enteric neuromuscular function: implications for motility and inflammatory disorders. Gastroenterology 1996;111:1683-1699.
38. Massi M, Ioan P, Budriesi R, Chiarini A, Vitali B, Brigidi P, Lammers K, Gionchetti P, Campieri M. The effects of probiotic bacteria on spontaneous contraction of isolated guinea pig intestine. Gastroenterology 2004; 126:4 suppl 2:A-517.
39. Verdu EF, Bercik P, Bergonzelli GE, Huang XX, Blennerhasset P, Rochat F, Fiaux M, Mansourian R, Corthesy-Theulaz I, Collins SM. Lactobacillus paracasei normalizes muscle hyper-contractility in a murine model of postinfective gut dysfunction. Gastroenterology 2004;127:826-837.
40. Verdu EF, Bercik P, Verma-Gandhu M, Huang XX, Blennerhassett P, Jackson W, Mao Y, Wang L, Rochat F, Collins SM. Specific probiotic therapy attenuates antibiotic induced visceral hypersensitivity in mice. Gut 2006; 55: 182-190.
41. Tao Y, Drabik KA, Waypa TS, Musch MW, Alverdy JC, Schneewind O, et al. Soluble factors from Lactobacillus GG activate MAPKs and induce cytoprotective heat shock proteins in intestinal epithelial cells. Am J Physiol Cell Physiol 2006; 290: C1018-1030.

580 Probiotics and Irritable Bowel Syndrome
Original Article Clinical studies on alleviating the symptoms of irritable bowel syndrome with a probiotic combination Kajsa Kajander MSc
1,2 and Riitta Korpela PhD1,2,3
1 Institute of Biomedicine, Pharmacology, University of Helsinki, Finland 2 Valio Ltd, Research Centre, Helsinki, Finland 3 Foundation for Nutrition Research, Helsinki, Finland
使用益生菌結合體減少大腸急躁症的使用益生菌結合體減少大腸急躁症的使用益生菌結合體減少大腸急躁症的使用益生菌結合體減少大腸急躁症的症狀之症狀之症狀之症狀之臨床研究臨床研究臨床研究臨床研究
大腸急躁症(IBS)是腸胃疾病中最常見的診斷,但是目前的治療效率不夠。最近的臨床試驗建議益生菌對於IBS有好的影響。因為IBS的異質性,益生菌的結合體可能較單一菌株較具有功效。我們篩選理想的菌株,並且發展多菌種益生菌結合體,包括L. rhamnosus GG, L. rhamnosus Lc705, P. freudenreichii ssp.
shermanii JS 及 Bifidobacterium breve Bb99。 益生菌結合 體的臨 床效 力以 IBS
病人的隨機雙盲,安慰劑控制之六個月介入臨床試驗來評估。研究對象在六個月期間,每日接受益生菌補充品或是安慰劑。IBS症狀記載在症狀日記中。益生菌補充品表現出顯著降低IBS症狀的能力。研究終了,益生菌組的總症狀分數(腹痛+腹脹+脹氣+腹鳴)降低42%比上安慰劑組的6%。在校正啟始的症狀分數後,兩組的差異為-7.7分(95% CI -13.9到-1.6), 益生菌補充 品較佳。 基本 的
機制包含如抗發炎、平衡菌群或是被益生菌誘導蠕動相關影響。益生菌的活性可能因為益生菌結合體中各單一菌株間產生的協同作用而增強。總而言之,我們發現包含LGG及其他三種菌株的益生菌結合體可以有效的減少IBS徵狀。
關鍵字:腸胃道症狀、大腸急躁症、益生菌、益生菌結合體。

Book Reviews 581
Book Reviews Olive Oil and Health Edited by J L Quiles, C Ramirez-Tortosa and P Yaqoob Published by CABI Publishing, Wallingford (UK) and Cambridge (MA, USA) in 2006 There is an increasing library of books about olives, the Mediterranean diet and health. When it comes to the anthropology, history, fruit composition, food processing and gastronomy of the olive, books like “The Encyclopaedia of the Olive”1 are abiding references, but the present book offers some interesting detail and insights into these aspects. Of course, the book explicitly sets out to discuss the oil derived from the fatty fruit and its health properties. It is an interesting reflection that there are other fatty fruits,2-4 namely palm, cacao, coconut, avocado and even the seeds of grapes, which are consumed, not only as fruit (cooked or processed in various ways), but as edible oils or spreads (cacao butter, red palm fruit in mixed West African dishes, avocado as a spread, for example). The book espouses the view that the olive is unique in this way, but the wider food cultural view is otherwise. Yet authors in the edited book do draw on “the Mediterranean diet” concept and recognize that this has many sub-types, even providing interesting data about its variations, with health consequences, within Albania, by region. In so doing, the difference between the integrated effects of diet, cuisine or food culture is not always distinguished from the analytical and reductionist approach by way of nutrients like fatty acids or, even, phytonutrients. We already know from the FHILL (Food Habits in Later Life) studies of the IUNS (International Union of Nutritional Sciences) that it is an integral of the Greek diet (as it was in Crete in the mid-20th century) that, better than nutrients or even particular foods, but including olive oil and olives, best predicts and favours survival amongst older people over 5-7 years.5 This concept can be cross-culturally transferred.6 It is, however, becoming increasingly clear that other food cultures, like the Scandinavian, Dutch, Japanese and Yangtze Delta Region of China can allow optimal life expectancies and minimal morbidities.7,8 The editors had the difficult task of choosing between and melding topics which were either organ-disease-specific (eg. cardiovascular disease, obesity, gastrointestinal) or disease-process-related (eg. inflammatory, immunological, neoplastic, insulin resistance). The ones chosen are dealt with in an up-to-date and illuminating fashion – parti-cularly helpful with emerging areas like dietary fat and gut health. There is, however, often lack of clarity about the role of oleic acid (and other fatty acids) on the one hand and the less-refined olive oils (or olive) and their com-ponents. Yet to be tackled in relation to health is the reality that oleic acid is often a major component of ani-mal fat for human consumption, both ruminant and non-ruminant. This book is a useful account of “work-in-progress” in an exciting and consequential area for human health and a sustainable food supply (where trees are an advantage, but monocultures are not).
References 1. World Encyclopaedia of the Olive. Madrid, Spain:
International Olive Oil Council, 1993. 2. Wahlqvist ML. Regional food diversity and human health.
Asia Pacific Journal of Clinical Nutrition 2003; 12(3):304-308.
3. Solomons NW. Diet and long-term health: an African Diaspora perspective. Asia Pacific Journal of Clinical Nutrition 2003; 12(3):313-330.
4. Atinmo T and Bakre AT. Palm fruit in traditional African food culture. Asia Pacific Journal of Clinical Nutrition 2003; 12(3):350-354.
5. Trichopoulou A, Kouris-Blazos A, Wahlqvist ML, Gnardellis C, Lagiou P, Polychronopoulos E, Vassilakou T, Lipworth L & Trichopoulos D. Diet and overall survival of the elderly. British Medical Journal 1995; 311:1457-1460.
6. Darmadi-Blackberry I, Wahlqvist ML, Kouris-Blazos A, Steen B, Lukito W, Horie Y, Horie K. Legumes: the most important dietary predictor of survival in older people of different ethnicities. Asia Pacific Journal of Clinical Nutrition 2004; 13(2):217-220.
7. Lee M-S, Wahlqvist MLK. Population-based studies of nutrition and health in Asia Pacific elderly. (Editorial). Asia Pacific Journal of Clinical Nutrition 2005; 14(4):294-297.
8. Waijers PMCM, Ocké MC, van Rossum CTM, Peeters PHM, Bamia C, Chloptsios Y, van der Schouw YT, Slimani N and Bueno-de-Mesquita HB. Dietary patterns and survival in older Dutch women. American Journal of Clinical Nutrition 2006; 83(5):1170-1176.
By Mark L. Wahlqvist The Glycaemic Index: A Physiological Classification of Dietary Carbohydrate Thomas MS Wolever www.cabi.org, Wallingford, UK (2006) Whilst the physiology of gastric emptying, and the role of dietary fat, for example, on slowing it, had been known for many years, this knowledge had generally compromised diabetes care. Clinicians accepted high fat diets as a way of short term management of the glycae-mic response to food, without regard to the long-term health consequences. That the burden of “chronic di-seases” like coronary heart disease, diabetes, and certain cancers, might be reduced by plant food components, especially non-starch polysaccharides, was advanced by Burkitt and Trowell in the early 1970s, in their Dietary Fibre hypothesis.1-3 In 1970, Jenkins and colleagues showed specifically that unabsorbable carbohydrates decreased postprandial glycaemia.4 Yet a view existed in diabetes practice that it was the chain length of a carbo-hydrate that conferred the property of “fast” or “slow” dietary carbohydrate insofar as its effects on blood glucose response were concerned. The origins of this idea were in the studies of Frederick M Allen, a noted American diabetalogist in the 1920s with pancreatec-tomized dogs which, of course, developed diabetes.5,6 These animals also demonstrated a differential glycaemic

582 News & Views
response to carbohydrate as simple sugar or starch, but this was not a property of the carbohydrate so much as of the lack of an exocrine pancreas and amylase. The myth was ultimately dispelled by Wahlqvist and colleagues in 1978 where, irrespective of chain length, mono- di, penta and poly-saccherides demonstrated no biologically rele-vant difference in glycaemic response, either in healthy subjects or people with diabetes.7 By 1981, Jenkins, Wolever and colleagues formulated the unifying concept of the glycaemic index8 which allowed quantitative com-parisons to be made amongst carbohydrates and foodstuffs in regard to the glycaemic response. A great deal of intensive debate and research followed about the add validity and utility of the concept. With time, mixed meals and whole diets were evaluated, not only for their immediate effect on blood glucose and insulin, but for their effects on longer term indices of glycaemic status (eg. HbA1C), on cardiovascular risk factors more generally, and on health outcomes and mortality. The glycaemic index (GI) has proved remarkably robust. Notable in the compilation of GI indices has been Jenny Brand-Miller.9 In 1997, the FAO/WHO Expert Consul-tation on Carbohydrate10 recommended that, on the one hand, carbohydrates be classified chemically (as simple, oligo- and polysaccherides) and, on the other, that they be classified functionally, in relation to their digestibility on the small intestine and fermentability in the large intestine, and also in regard to their glycaemic response. This gave added stimulus to the GI approach, not only to diabetes management, but also to other health areas, and even to human physical performance (as in sport, with the work of Louise Burke and others.11 The GI concept has its limitations, especially insofar as a more comprehensive descriptor of nutritious and healthful food is concerned. But it has paved the way for such future development. It is altogether timely that, one of the principal architects of the original GI concept, Tom Wolever has compiled the present book. The book is both highly readable and encyclopaedic for the history and state of the science of human carbohydrate nutrition. References 1. Burkitt DP. Epidemiology of cancer of the colon and
rectum. Cancer 1971; 28:3-13. 2. Burkitt DP and Trowell HC. Refined carbohydrate foods
and disease. London:Academic Press 1975. 3. Trowell HC. Dietary fibre, ischaemic heart disease, and
diabetes mellitus. Proceedings of the Nutrition Society 1973; 32:150-157.
4. Jenkins DJA, Leeds AR, Gassull MA, Wolever TMS, Goff DV, Alberti KGMM and Hockaday TDR. Unabsorbable carbohydrates and diabetes: decreased postprandial hyperglycaemia. Lancet 1976; 2:172-174.
5. Allen FM. Experimental studies on diabetes. Series I. Production and control of diabetes in the dog. 2. Effects of carbohydrate diets. J Experimental Med 1920; 31:381-402.
6. Westman EC, Yancy WS and Humphreys M. Dietary treatment of diabetes mellitus in the pre-insulin era (1914-1922). Perspectives in Biology Med 2006; 49(1):77-83.
7. Wahlqvist ML, Wilmshurst EG and Richardson EN. The effect of chain length on glucose absorption and the related metabolic response. Am J Clin Nutr 1978; 31:1998-2001.
8. Jenkins DJA, Wolever TMS, Taylor RH, Barker HM, Fielden H, Baldwin JM, Bowling AC, Newman HC, Jenkins AL and Golf DV. Glycemic index of foods: a physiological basis for carbohydrate exchange. Am J Clin Nutr 1981a; 34: 362-366.
9. Brand Mill J, Wolever TMS. The use of glycaemic index tables to predict glycaemic index of breakfast meals. Br J Nutr 2005; 94:133-134.
10. Food and Agriculture Organization of the United Nations. FAO food and nutrition paper 66. Carbohydrates in human nutrition. Report of an FAO/WHO Expert Consultation on Carbohydrates, 14-18 April 1997, Room, Italy, FAO, Rome, 1998.
11. Burke LM, Kiens B and Ivy JL. Carbohydrates and fat for training and recovery. Journal of Sports Sciences 2004; 22:15-30.
By Mark L. Wahlqvist
Future Events
November 9, 2006 Aspen 2006 Annual Scientific Meeting, Sydney, NSW www.auspen.org.au November 22, 2006 Australian Association of Gerontology 39th National Conference, Sydney, NSW [email protected] November 29, 2006 Nutrition Society of Australia 30th Annual Scientific Meeting, Sydney, NSW www.fcconventions.com.au December 8-10, 2006 The Asia Pacific Evidence Based Medicine Conference Hong Kong www.hkcochrane.cuhk.edu.hk April 25-26, 2007 3rd International Conference on Traditional Mediterranean Diet - MEDIET 2007, Athens [email protected] May 7-9, 2007 Federations of African Nutrition Societies FANUS meeting in Quazazate, Morocco www.africanutrition.org July 10-13, 2007 10th European Nutrition Conference, Paris www.fens2007.org
Asia Pacific Journal of Clinical Nutrition
Instructions for Authors AIMS AND SCOPE Asia Pacific Journal of Clinical Nutrition is the official journal of the Asia Pacific Clinical Nutrition Society (APCNS). The aims of the APCNS are to promote the education and training of clinical nutritionists in the region and to enhance the practice of human nutrition and related disciplines in their application to health and the prevention of disease. Asia Pacific Journal of Clinical Nutrition will publish original research reports, reviews, short communication, and letters to the editors. Letters to the editors may take several forms: they may be either very short articles (500 words) containing new material, case reports, or comments on previous papers or other topics of current interest. News, book reviews and other items will also be included. The acceptance criteria for all papers are the quality and originality of the research and its significance to our readership. Except where otherwise stated, manuscripts are peer-reviewed by two anonymous reviewers and the Editor. The Editorial Board reserves the right to refuse any material for publication and advises that authors should retain copies of submitted manuscripts and correspondence as material cannot be returned. Final acceptance or rejection rests with the Editorial Board.
SUBMISSION OF MANUSCRIPTS All articles submitted to the journal must comply with these instructions. Failure to do so will result in return of the manu-script and possible delay in publication. Manuscripts should be written so that they are intelligible to the professional reader who is not a specialist in the particular field. Where contri-butions are judged as acceptable for publication on the basis of scientific content, the Editor or the Publisher reserve the right to modify typescripts to eliminate ambiguity and repetition and improve communication between author and reader. If exten-sive alterations are required, the manuscript will be returned to the author for revision.
Covering letter Papers are accepted for publication in the journal on the under-standing that the content has not been published or submitted for publication elsewhere. This must be stated in the covering letter. Authors must also state that the protocol for the research project has been approved by a suitably constituted Ethics Committee of the institution within which the work was undertaken and that it conforms to the provisions of the Declaration of Helsinki in 1995 (as revised in Edinburgh 2000). All investigations on human subjects must include a statement that the subject gave informed consent and patient anonymity should be preserved. Any experiments involving animals must be demonstrated to be ethically acceptable and where relevant conform to National Guidelines for animal usage in research. Authors should declare any financial support or relationships that may pose conflict of interest.
Submission The original manuscript should be emailed to:
[email protected] Professor Mark L Wahlqvist
Editor-in-Chief
Copyright Papers accepted for publication become copyright of HEC PRESS and authors will be asked to sign a transfer of copyright form. In signing the transfer of copyright it is assumed that authors have obtained permission to use any copyrighted or previously published material. All authors must read and agree to the conditions outlined in the Copyright Assignment Form, and must sign the Form or agree that the corresponding author can sign on their behalf. Articles cannot be published until a signed Copyright Assignment Form has been received.
PREPARATION OF THE MANUSCRIPT Manuscripts should be doubled-spaced. The top, bottom and side margins should be 30 mm. All pages should be numbered consecutively in the top right-hand corner, beginning with the title page. Indent new paragraphs. Turn the hyphenation option off, including only those hyphens that are essential to the meaning.
Style Manuscripts should follow the style of the Vancouver agreement detailed in the ‘Uniform Requirements for Manuscripts Submitted to Biomedical Journals’, as presented in JAMA 1997;277:927–34 hhttp://www.acponline.org/ journals/ annals/01jan97/unifreqr.htm). The journal uses US/UK spelling and authors should therefore follow the latest edition of the Merriam–Webster’s Collegiate Dictionary/Concise Oxford Dictionary. Please indicate your pre-ference and use one or the other exclusively. If you do not specify, by default UK spelling will be used. All measurements must be given in SI units as outlined in the latest edition of Units, Symbols and Abbreviations: A Guide for Medical and Scientific Editors and Authors (Royal Society of Medicine Press, London). Abbre-viations should be used sparingly and only where they ease the reader’s task by reducing repetition of long, technical terms. Initially use the word in full, followed by the abbreviation in parentheses. Thereafter use the abbreviation. At the first mention of a chemical substance, give the generic name only. Trade names should not used. Drugs should be referred to by their generic names, rather than brand names.
Parts of the manuscript Manuscripts should be presented in the following order: (i) title page, (ii) abstract and keywords, (iii) text, (iv) acknowledge-ments, (v) references, (vi) figure legends, (vii) tables (each table complete with title and footnotes) and (viii) figures. Footnotes to the text are not allowed and any such material should be incorporated into the text as parenthetical matter.
Title page The title page should contain (i) the title of the paper, (ii) the full names of the authors and (iii) the addresses of the institutions at which the work was carried out together with (iv) the full postal and email address, plus facsimile and telephone numbers, of the author to whom correspondence about the manuscript, proofs and requests for offprints should be sent. In keeping with the latest guidelines of the International Committee of Medical Journal Editors, each author’s contri-bution to the paper is to be quantified. The title should be short, informative and contain the major key words. A short running title (less than 40 characters, including spaces) should also be provided.
Abstract and key words Articles must have an abstract that states in 250 words or less the purpose, basic procedures, main findings and principal conclusions of the study. The abstract should not contain abbre-viations or references. Five key words should be supplied below the abstract and should be taken from those recommended by the Index Medicus Medical Subject Headings (MeSH) browser list (http://www.nlm.nih.gov/mesh/meshhome.html). Text Authors should use subheadings to divide the sections of their manuscript: Introduction, Materials and methods, Results, Discussion, Acknowledgments, References.
Acknowledgements The source of financial grants and other funding should be acknowledged, including a frank declaration of the authors’ industrial links and affiliations. The contribution of colleagues or institution should also be acknowledged. Thanks to anonymous reviewers are not allowed.

Asia Pacific Journal of Clinical Nutrition
References The Vancouver system of referencing should be used. In the text, references should be cited using superscript Arabic numerals in the order in which they appear. If cited only in tables or figure legends, number them according to the first identification of the table or figure in the text. In the reference list, the references should be numbered and listed in order of appearance in the text. Cite the names of all authors. Names of journals should be abbreviated in the style used in Index Medicus. Reference to unpublished data and personal communi-cations should appear in the text only. References should be listed in the following form: Journal article
1. Tomaino RM, Decker EA. High fat meals and endothelial function. Nutr Rev 1998; 56: 334–343.
Book 2. Fildes VA. Breasts, bottles and babies. A history of infant
feeding. Edinburgh: Edinburgh University Press, 1986. Chapter in a Book
3. Willet WC. The use of biomarkers in nutritional epidemiolgy. In: Kok FJ, Veer PV, eds. Biomarkers of dietary exposure. London: Smith-Gordon, 1991; 9–14.
Tables Tables should be self-contained and complement, but not duplicate, information contained in the text. Tables should be numbered consecutively in Arabic numerals. Each table should be presented on a separate sheet of A4 paper with a comprehensive but concise legend above the table. Tables should be double-spaced and vertical lines should not be used to separate columns. Column headings should be brief, with units of measurement in parentheses; all abbreviations should be defined in footnotes. Footnote symbols: †, ‡, §, ¶, should be used (in that order) and *, **, *** should be reserved for P-values. The table and its legend/ footnotes should be understandable without reference to the text. All lettering/numbers used in tables should be font style 'times new roman' and font size 8.5 or 9.
Figures All illustrations (line drawings, bar charts and photographs) are classified as figures. Figures should be cited in consecutive order in the text. Figures should be sized to fit within the column (85 mm), intermediate (114 mm) or the full text width (177mm). Line figures or bar chart figures should be drawn in a computer graphics package (e.g EXCEL). All lettering used in figures should be font style 'times new roman' and font size 9. Important: All figures must be electonically inserted at the end of the manuscript (that has been typed in the word processing package WORD or in a separate file if a different computer program is used. Photographs should be supplied as sharp, glossy, black and white photographic prints and must be unmounted. Individual photographs forming a composite figure should be of equal contrast, to facilitate printing, and should be accurately squared. Photographs need to be cropped sufficiently to prevent the subject being recognized, or an eye bar used; otherwise, written permission to publish must be obtained. Magnifications should be indicated using a scale bar on the illustration. Colour photographs should be submitted as good quality, glossy colour prints. A charge of $A1,100/US$660 for the first three colour figures and $550/US$330 for each extra colour figure thereafter will be charged to the author. Figure legends : Legends should be self-explanatory and typed on a separate sheet. The legend should incorporate definitions of any symbols used and all abbreviations and units of
measurement should be explained so that the figure and its legend is understandable without reference to the text. (Provide a letter stating copyright authorisation if figures have been reproduced from another source.)
EMAILED MANUSCRIPTS: Authors should supply their emailed paper formatted in the computer software WORD and forwarded to Prof. M Wahlqvist, [email protected] The entire article (including tables and figures) should be supplied as a single file. If the figures cannot be inserted into the manuscript, provide as separate files. The following instructions should be adhered to:
• It is essential that the final, revised version of the accepted manuscript and the file emailed are identical.
• Do not use the carriage return (enter) at the end of lines within a paragraph.
• Turn the hyphenation option off. • Specify any special characters used to represent non-keyboard
characters. • Take care not to use l (ell) for 1 (one), O (capital o) for 0
(zero) or ß (German esszett) for b (Greek beta). • Use a tab, not spaces, to separate data points in tables. • If you use a table editor function, ensure that each data point
is contained within a unique cell, i.e. do not use carriage returns within cells.
• Digital figures must be supplied as .tif or .eps files at a resolution of at least 300 d.p.i (high-resolution print-outs are also required).
PROOFS, OFFPRINTS AND CHARGES FOR PAPERS Publishing fees as of 1st January 2007: For accepted papers there is a fee of AU$250 for up to and including 5 pages and thereafter a fee of $35 per page (plus GST if in Australia). This fee also includes on-line subscription to APJCN for year in which paper is published. A discount of $50 per paper is availble if corresponding or first author or their affiliated institution is a current subscriber. A further discount of AU$50 may be claimed if corresponding address can be judged as that of a developing country by the editor.
Proofs: Proofs will be sent via email as a WORD file for-matted in APJCN style with 'tracking' activated so that all changes made to the manuscript by the author are clearly visible. Please also highlight all changes in yellow to ensure all edits are picked up. The edited proofs must be emailed within 5 days of receipt. Alterations to the text and figures (other than the essential correction of errors) are unacceptable at proof stage and authors may be charged for excessive alterations. Authors should therefore supply an email address to which proofs can be emailed. Proofs will be faxed if no email address is available. If absent, authors should arrange for a colleague to access their email, retrieve the emailed manu-script and check and return them to the publisher on their behalf.
Offprints: Free offprints are not provided to authors Charges: 50 offprints - AU$210 for 1-5 pages, $310 for >5 pages; 100 offprints - AU$270, 1-5 pages, AU$370 for>5 pages APJCN online & CD-ROM Past issues: Full papers are available free-of-charge; Journal abstracts and full papers will continue to be available on-line free-of-charge via the website http://www.healthyeatingclub.org/APJCN/ Current issues: subscribers have on-line access to full papers on the website www.healthyeatingclub.org (password access).

.
Past issues - Free on-line access: abstracts and full papers www.healthyeatingclub.org/APJCN/
Current Subscribers : on-line access to full papers from current year www.healthyeatingclub.org/APJCN/
Nutrition Society of Australia 30 years of Conference Proceedings (abstracts) Now available FREE on-line at www.healthyeatingclub.org/APJCN/
SUBSCRIPTIONS
Please tick the boxes below corresponding to the type of subscription, whether you wish to
Hard copy (including on-line access Online access only Personal Price: AU$195 AU$150 as of 1/7/2006 Institution: AU$450 AU$300
Subscriptions are for current calender year only – b ack issues will be supplied for current calen der year for late subscriptions
REPRINTS: Manuscripts 1-5 pages 50 copies AU$210 100 copies AU$270
Manuscripts >5 pages 50 copies AU$310 100 copies AU$370 Reprint details: vol………..issue……….pages……………title…...………………………………………...………………………………
SINGLE ISSUES: Year ………………Volume…………………Issue……………………….............. 1 copy AU$50.00
SINGLE PAPERS (pdf file): Year ………………Volume…………………Issue……………… 1 copy AU$20.00
PUBLICATION FEE (paper submitted after 2006): AU$250 for 1-5 pages and thereafter $35 per page (+GST if in
Australia). Fee includes on-line subscription to APJCN for year in which paper is published. Discounts also apply - please see
instructions for authors Length of your APJCN formatted paper (insert number of pages in box)
List first 2 authors on accepted paper________________________________________________________________________
Title of paper___________________________________________________________________________________________
I enclose CHEQUE payment of ...........................(Australian citizens can pay by personal cheque, others must payby BANK DRAFT in AUSTRALIAN CURRENCY ONLY) payable to HEC PRESS.
Direct Debit to HEC Press account: St George Bank Ltd, 99 Bell St, Preston Vic, Australia, 3072 BSB: 333-037 Account number: 552023032 swift code SGBLAU2S $AU ________________
I wish to pay by Visa MasterCard (Other cards are not accepted) Please debit my card no.
Amount in Australian dollars............................Expiry date on card…....…../.............………………….. …………….
Signature......................................……………………………………………………………………………………………….
Name...............................................................................................................................................................................
Address..............................................................................................................................................................................................
.................................................................................................................................Postcode........................................Telephone..............................................................Fax........................................................................................................... Please send me a receipt……Yes No Date this form was faxed/mailed…….…/………/…………......
Email (compulsory if want receipt or pdf file of paper or on-line access to APJCN)........................………….............................
On-line access Individuals - please provide preferred Username................................. Password....……....…......…..
Institutions – please provide IP address in C.I.D.R notation (network block&netmask)…………………………………..
Return this form to : Asia Pacific Journal of Clinical Nutrition, c/o Yi-Chen Huang P.O. Box 90048-509, Neihu, Taiwan,
ROC, Tel/Fax in Taiwan: +886-2-87910704 Email: [email protected]
Healthy Eating Club Pty Ltd ABN : 93 078 641 906
PO Box 4121,
McKinnon, Victoria 3204
Australia
Mob +61 0408551702
www.healthyeatingclub.org
Asia Pacific Journal of Clinical Nutrition Editors: Prof. Mark Wahlqvist, Australia; Prof. Akira Okada, Japan; Prof Duo Li, China
Print ISSN: 0964-7058; Online ISSN: 1440-6047 Frequency: Quarterly (plus supplements)
HEC PRESS
APJCN ORDER FORM 2007

Asia Pacific Journal of Clinical Nutrition. Volume 15, Number 4, 2006
Contents: Original Articles____________________________________________________________________ High protein high fibre snack bars reduce food intake and improve short term glucose and insulin profiles compared with high fat snack bars GEMMA WILLIAMS, MANNY NOAKES, JENNIFER KEOGH, PAUL FOSTER AND PETER CLIFTON
Precision in nutritional information declarations on food labels STEFAN U FABIANSSON
Under-reporting of energy intake affects estimates of nutrient intakes PARVIN MIRMIRAN, AHMAD ESMAILLZADEH AND FEREIDOUN AZIZI
Calibration and reliability of a school food checklist: a new tool for assessing school food and beverage consumption PETER J KREMER, A COLIN BELL AND BOYD A SWINBURN
443 451
459
465
Primary school children from northeast Thailand are not at risk of selenium deficiency WORAVIMOL KRITTAPHOL, KARL B BAILEY, TIPPAWAN PONGCHAROEN, PATTANEE WINICHAGOON, CHRISTINE THOMSON AND ROSALIND S GIBSON
474
Obesity and undernutrition in sub-Saharan African immigrant and refugee children in Victoria, Australia
ANDRÉ MN RENZAHO, CARL GIBBONS, BOYD SWINBURN, DAMIEN JOLLEY AND CATE BURNS 482
Risk factors for malnutrition among rural Nigerian children SENBANJO IDOWU ODUNAYO AND ADEODU OLUWAGBEMIGA OYEWOLE
Low density lipoprotein subclasses in Asian and Caucasian adolescent boys VERENA RASCHKE, IBRAHIM ELMADFA, MARGARET A BERMINGHAM AND KATE STEINBECK
491
496
Is the BMI cut-off level for Japanese females for obesity set too high? – A consideration from a body composition perspective MASAHARU KAGAWA, KAZUHIRO UENISHI, CHIHARU KUROIWA, MIKI MORI AND COLIN W BINNS
502
The relationship between obesity and health related quality of life of women in a Turkish city with a high prevalence of obesity GÖNÜL DINÇ, ERHAN ESER, GÜL SAATLI, ÜMIT ATMAN CIHAN, AHMET ORAL, HAKAN BAYDUR AND CEMIL ÖZCAN
508
Obesity among university students, Tehran, Iran MARZIEH NOJOMI AND SHAHANDOKHT NAJAMABADI 516
Alternative anthropometric measurements for the Thai elderly: Mindex and Demiquet PRASERT ASSANTACHAI, PREYANUJ YAMWONG AND SOMSONG LEKHAKULA 521
Persistence of iodine deficiency in Gangetic flood-prone area, West Bengal, India TAPAS KUMAR SEN, AKHIL BANDHU BISWAS, INDRANIL CHAKRABARTY, DILIP KUMAR DAS, RAMACHANDRAN RAMAKRISHNAN, PUNNAIH MANICKAM AND YVAN HUTIN
528
Status of iodine nutrition in pregnant and lactating women in national capital district, Papua New Guinea VICTOR J TEMPLE, BENJAMIN HAINDAPA, ROBERT TURARE, ANDREW MASTA, APEWASU B AMOA AND PAULUS RIPA 533
The relationship of neonatal serum vitamin B12 status with birth weight S MUTHAYYA, P DWARKANATH, M MHASKAR, R MHASKAR, A THOMAS, CP DUGGAN, W W FAWZI, S BHAT, M VAZ AND AV KURPAD
538
Anti-inflammatory and anticatabolic effects of short-term ββββ-hydroxy-ββββ-methylbutyrate supplementation on chronic obstructive pulmonary disease patients in intensive care unit LAN-CHI HSIEH, SHU-LING CHIEN, MING-SHONG HUANG, HUNG-FU TSENG AND CHEN-KANG CHANG
544
Effects of dietary supplements on the Fischer ratio before and after pulmonary rehabilitation HIROKAZU KUBO, NORITSUGU HONDA, FUMIO TSUJI, TAKASHI IWANAGA, MASATO MURAKI AND YUJI TOHDA 551
Influencing health through intestinal microbiota modulation and probiotics ANDREW SINCLAIR AND SEPPO SALMINEN
Intestinal colonisation, microbiota and future probiotics? SEPPO SALMINEN, YOSHIMI BENNO AND WILLEM DE VOS
Safety of probiotics DIANA C DONOHUE
Protection mechanism of probiotic combination against human pathogens: in vitro adhesion to human intestinal mucus M CARMEN COLLADO, LOTTA JALONEN, JUSSI MERILUOTO AND SEPPO SALMINEN
Clinical studies on alleviating the symptoms of irritable bowel syndrome KAJSA KAJANDER AND RIITTA KORPELA BOOK REVIEW S "Olive Oil and Health", "The Glycemic Index: A Physiological Classification of Dietary Carbohydrate" News and Views
556 558 563 570 576
581 582
HEC PRESS www.healthyeatingclub.org/APJCN/


