Embed Size (px)
Citation preview

REVIEW OF SCIENTIFIC INSTRUMENTS VOLUME 74, NUMBER 9 SEPTEMBER 2003
Calibration of colloid probe cantilevers using the dynamic viscousresponse of a confined liquid
Shannon M. Notleya) and Simon BiggsCentre for Multiphase Processes, The University of Newcastle, Callaghan, NSW 2308, Australia
Vincent S. J. Craigb)
Department of Applied Mathematics, Research School of Physical Sciences and Engineering, AustralianNational University, Canberra, ACT 0200, Australia
~Received 6 August 2002; accepted 3 June 2003!
A method is described to determine the spring constant of colloid probe cantilevers used in forcemeasurements with the atomic force microscope. An oscillatory drive applied to the substrate iscoupled by viscous interactions to the colloid probe. The dynamic response of the probe, which isunaffected by static interactions, is then used to determine the spring constant of the cantilever. Thusan accurate calibration of the spring constant may be performed simultaneously with a normalcolloidal probe force measurementin situ. © 2003 American Institute of Physics.@DOI: 10.1063/1.1597950#
su
ur, barha
he
diledri
iete
ot
ifourl f
in-e
ilem
ntth
ay
tedpli-icle
s ofeto
uendhodin
hat
chro-
g athehed asns
atictiondach
orces
-is
ofings-
und
dreolai
I. INTRODUCTION
The atomic force microscope~AFM! is routinely used tomeasure a number of interfacial phenomena includingface forces,1–4 friction,5–7 and adhesion.8,9 Of fundamentalimportance to these quantitative measurements is an accknowledge of the cantilever spring constant. Furthermorecontrolling the interaction geometry, it is possible to compthe measured interaction force with theory. Control of tinteraction geometry and chemistry is often achieved bytaching a spherical colloid particle to the end of tcantilever.1,10,11
The spring constant is dependent upon the cantilevermensions and material properties. Microfabricated cantvers from the same batch or wafer often have uniformmensions, but between batches, large variations in the spconstant of the same type of cantilever can occur. Insufficcontrol over the thickness of the cantilever is the greaproblem. The spring constant is proportional to the cubethe thickness, so small variations in thickness give risesignificant changes in the spring constant. These nonunmities in the manufacturing process require that a measment of the spring constant of each cantilever is essentiaaccurate, reproducible force measurements.
A variety of methods have been proposed to determthe cantilever spring constant.12–19 Most are suited to cantilevers in the absence of an attached colloid particle. Indeno existing calibration technique can be used for all cantver and interaction geometries. The two most commonly eployed methods, the thermal noise method13 and the addedmass method,12 determine the spring constant for a poiload at the end of the cantilever. The spring constant can
a!Author to whom correspondence should be addressed; present adDepartment of Fibre and Polymer Technology, Division of Fibre Technogy, Royal Institute of Technology, Stockholm, Sweden; electronic [email protected]
b!Electronic mail: [email protected]
4020034-6748/2003/74(9)/4026/7/$20.00
Downloaded 21 Aug 2003 to 130.237.75.243. Redistribution subject to A
r-
ateyeet-
i--
i-ngntstfor-e-or
e
d,--
en
be corrected for the positioning of the colloidal particle awfrom the end of the cantilever.15 The requirement to performa correction increases the systematic error in the calibraspring constant and fails to account for the altered comancy of the cantilever due to the attachment of the partwith glue.
Recently a number of authors have proposed methodcalibrating AFM cantilever spring constants involving thhydrodynamic drag of the cantilever or a particle attacheda cantilever.18,19 In the method of Maeda and Senden18 asemiempirical relationship between the distributed load dto hydrodynamic drag on the cantilever and its static eloading is used to determine the spring constant. This metis unsuitable for colloid probes as the flow characteristicsthe presence of an attached particle will differ greatly to tof a bare cantilever.
Craig and Neto19 have used a force balance approabetween the restoring force of the cantilever and the hyddynamic drag force on a spherical particle approachinwall. This method requires an accurate knowledge ofparticle radius and solution viscosity. The deflection of tcantilever due to the hydrodynamic drag force is measurea function of surface separation. In order to gain deflectioof the cantilever that are both much greater than the stinteraction force and measurable over a significant separarange, viscous fluids (viscosity@water) such as concentratesucrose solutions and comparatively large surface approvelocities~ramp rates! are required. The asymptotic behaviof the hydrodynamic force at small separations introdudifficulties in the determination of the compliance region~re-quired to calibrate optical sensitivity!. Furthermore, the possibility of boundary slip complicates the analysis. Thmethod provides anin situ, nondestructive measurementthe cantilever spring constant for the specific point of loadof the attached particle. However, in this method it is asumed that the deflection of the cantilever due to backgrosurface forces is negligible.
ss:-l:
6 © 2003 American Institute of Physics
IP license or copyright, see http://ojps.aip.org/rsio/rsicr.jsp

behacymtu
nd
rolownomra
e
fo.nuncoid
a-
s
le
tes
eeatrati
a
ro
ig-
ryonhethepo-illa-
sed90°ea-tudef theara-
s-fanallynaln-atedn aata
cede-pa-ce
or
tion
phase
4027Rev. Sci. Instrum., Vol. 74, No. 9, September 2003 Calibration of colloid probe cantilevers
Here, a spring constant calibration method is descrithat uses the viscous response of a colloidal particle attacto a cantilever due to the normal oscillatory motion of a flplane in a fluid medium. A small amplitude, high frequensinusoidal wave form is superimposed on the normal rasignal applied to the piezo. The dynamic deflection duethe hydrodynamic force and the static deflection due to sface forces are measured concurrently and evaluated ipendently.
Brenner20 has given the exact expression for the hyddynamic drag force on a sphere approaching a wall forReynolds number flow~,1!. It has been shown that whethe distance between the sphere and wall is small in cparison to the radius of the sphere, the hydrodynamic dforce is given by Eq.~1!, whereh is the viscosity of thefluid, R is the radius of the particle,U is the velocity ofapproach, andD is the surface separation21,22
FH56phR2U
D. ~1!
As the interaction geometry in our experimental arrangemis analogous to that in the surface forces apparatus~SFA!, wecan use the equations of motion derived by Israelachvilithe measurement of the viscosity of liquids in thin films23
The oscillatory response of the colloid probe due to the sisoidal motion of the flat surface is measured as a functiomean surface separation. Assuming a no-slip boundarydition and that the liquid is Newtonian, the viscosity of liquis given by Eq.~2!, whereh is the solution viscosity,k is thespring constant,D is the mean surface separation,R is theparticle radius,n is the frequency of oscillation,A0 is thedrive amplitude, andA is the amplitude of the gap separtion. In the SFA,A is measured directly. In the AFM,A canbe determined from measuring the amplitude responsex0
and phase differenceu between the drive and measured ocillatory signals and is given by Eq.~3!
h5kD
12p2R2n F S A0
A D 2
21G1/2
, ~2!
A5uA02x0eiuu. ~3!
For a liquid of known viscosity and for a known particradius the spring constant may be determined using Eq.~2!.Alternatively, once the spring constant is accurately demined, the viscosity of small volumes of liquids in thin filmcan be measured. Equation~2! only holds for low inertialsystems, that is when the driving frequency,n, is much lessthan the resonance frequency of the spring,n0 .
II. EXPERIMENTAL METHODS
A number of modifications to the standard AFM forcexperiment were performed in order to simultaneously msure both static and dynamic forces between the subsand colloid probe. Figure 1 shows a schematic representaof the experimental arrangement. The high voltagez rampfrom the Nanoscope® controller, accessed via the signalcess module~SAM! ~Digital Instruments, CA!, was coupledto a high frequency, small amplitude oscillatory signal p
Downloaded 21 Aug 2003 to 130.237.75.243. Redistribution subject to A
dedt
por-e-
-
-g
nt
r
-ofn-
-
r-
-te
on
c-
-
vided by a dual phase lock-in amplifier~SR 830, StanfordResearch Systems!. A summing audio transformer~FarnellA262A2E! was used to couple the signals. The coupled snal was then connected to the high voltagez input on theNanoscope® SAM.
The hydrodynamic interaction couples the oscillatomotion of the flat surface to the colloid probe. The deflectiof the cantilever due to the induced oscillatory motion of tcolloid probe was measured by the split photodiode ofAFM. The dynamic response of the cantilever is the comnent of the response with the same frequency as the osctory signal. The output from the split photodiode was pasback to the lock-in amplifier where both the in phase andout of phase components of the oscillatory signal were msured. These signals were used to determine the ampliattenuation and phase difference between the motions osubstrate and colloid probe as a function of surface seption.
The output from the lock-in amplifier was measured uing a 16-bit, analog-to-digital~A/D! converter capable osampling at 100 kHz. This sampling rate is far greater threquired and in these experiments the data were typicsampled at 2–5 kHz. The split photodiode output and sigapplied to thez ramp were also sampled using this A/D coverter. The digitized signals were then passed to a dediccomputer for processing. A customized program written icommercial software package, Labview®, was used for dsampling and processing.
The static deflection of the cantilever due to surfaforces was measured simultaneously with the oscillatoryflection due to hydrodynamic interactions. Zero surface seration (D50) was defined as the onset of the complian
FIG. 1. ~a! Flow diagram showing the connections to and from the AFM fthe measurement of dynamic surface forces.~b! Schematic of the experi-mental arrangement for the measurement of hydrodynamic lubricaforces. The bottom surface oscillates at frequencyn and driving amplitudeA0 . Hydrodynamic forces cause the upper surface~colloid probe! to oscil-late at the same frequency, however, the amplitude is attenuated andshifted by an amountu.
IP license or copyright, see http://ojps.aip.org/rsio/rsicr.jsp

zol0
tace
ndaileue
usn
iv-th
ik.
thid
vtror
cuemn
thons
nth
-
nic
ela-30-
a
e-
an
in
thewndal
e toofde-ea-
in-ce
loidncehaseases.aals
re-hethes tothe
herivede-two
s toticOtialedlly
i-
uch
-0b
4028 Rev. Sci. Instrum., Vol. 74, No. 9, September 2003 Notley, Biggs, and Craig
region in the raw output of the static deflection versus pieextension. Thez ramp scan rate from the Nanoscope contrler was typically set at approach velocities of less than 4nm/s. Low ramp rates are employed ensuring that the scomponent of the interaction is attributable to surface forand not to hydrodynamic interactions.
Typically, drive amplitudes of between 2 and 10 nm afrequencies less than 1000 Hz were used. Smaller driveplitudes did not produce significant deflection of the cantver at large surface separations. Furthermore, these freqcies were much less than the resonance frequency of theloaded cantilever in aqueous solution~5–10 kHz! so inertialand acceleration terms can be ignored.
A smooth sphere was attached to an AFM cantilevering the method of Duckeret al.11 Standard, V-shaped siliconitride cantilevers~Digital Instruments, Santa Barbara, CA!were used in this study. Borosilicate glass spheres~DukeScientific! with an approximate radius of 10mm ~surfaceroughness,0.15 nm rms over 1003100 nm2) were attachedto the cantilever with a small amount of epoxy adhes~Araldite, Selleys Co., Australia!. A reverse imaging technique was used prior to the experiment to ensure thatcolloidal probe was free of particulate debris.24 Reverse im-aging involves scanning the probe across an array of spwith radius of curvature much less than that of the probesilicon grating~TGT-01, NT-MDT, Russia! was used in thiscase. An example image of the area of interaction ofcolloid probe is shown in Fig. 2. The radius of the colloprobe was measured~to an accuracy of 0.1mm! by scanningelectron microscopy after the measurements. Freshly cleamuscovite mica was used as the flat substrate. This subsis atomically smooth and requires no further cleaning befuse.
The AFM was housed in a temperature-controlled inbator. All measurements were performed at a constant tperature of 2060.1 °C. Water was used as a viscosity stadard in order to determine the spring constant ofcantilever. Then the viscosity of several sucrose solutiwas measured in order to validate the method. Aqueouslutions of KNO3 under a variety ofpH conditions were usedto alter the magnitude of the static interaction forces athereby any possible effect on the dynamic component of
FIG. 2. AFM reverse image of the colloid probe obtained using the TGTgrating~NT-MDT, Russia!. The presence of small surfaces asperities canobserved. Scan size is 1.531.5mm2, vertical axis is 25 nm/division.
Downloaded 21 Aug 2003 to 130.237.75.243. Redistribution subject to A
o-0tics
m--en-nd
-
e
e
esA
e
edatee
--
-eso-
de
interaction could be investigated. The solutionpH was ad-justed using an appropriate amount of aqueous HNO3 orKOH. All water used was purified using a Milli-Q purification unit. Sucrose~BDH! KOH, HNO3, and KNO3~Sigma-Aldrich! were of AR grade. The KNO3 was baked at 400 °Cfor 2 h before use.
The polymer used in this study was the weak catiopolyelectrolyte poly~2-vinylpyridine!. Two samples of P2VPwere obtained from Polysciences Inc.~Warrington, PA! andused without further purification. These samples were a rtively monodisperse P2VP with a molecular weight ofkDa (MW /MN;1.27) and a higher molecular weight, polydisperse sample of 300–400 kDa.
The P2VP solutions were prepared by dissolvingknown amount of polymer in an aqueous solution of HNO3.The P2VP solution was gently stirred overnight at 35 °C bfore being diluted as required with Milli-Q water. ThepH ofthe P2VP solution was adjusted to 3.2 by the addition ofappropriate amount of KOH or HNO3 and the solution al-lowed to equilibrate for at least 24 h before being usedexperimentation.
III. RESULTS
The measured amplitude of the colloid probe due tomotion of the flat substrate in a typical experiment is shoin Fig. 3~a!. The phase difference between the sinusoimotions of the substrate and probe is also shown in Fig. 3~a!.At large surface separations, the phase difference is clos90° as would be expected for a purely viscous dissipationenergy. As the surfaces approach, the phase differencecreases and this corresponds with an increase in the msured amplitude of the colloid probe response due tocreases in the hydrodynamic interaction. At a surfaseparation of 300 nm the measured amplitude of the colprobe has increased significantly and the phase differehas decreased to 70°. As the surfaces approach the pcontinues to decrease as the amplitude of response increAt a surface separation of less than 20 nm the Van der Wattractive force between the surfaces exceeds the springstoring force and the two surfaces jump into contact. Tphase difference decreases rapidly to 0° implying thattwo surfaces are now moving in concert. This correspondthe onset of the compliance region. The amplitude ofsurface separation@calculated from Eq.~3!# is also presentedin Fig. 3~a!. At large surface separations, no deflection of tprobe is measured so the gap amplitude is simply the damplitude. As the surfaces approach the gap amplitudecreases until at separations less than 25 nm, where thesurfaces are moving together, the gap amplitude tendzero. Figure 3~b! shows the simultaneously recorded staforce profile. The force-distance data is well fitted to DLVtheory in the limits of constant charge and constant potenand furthermore is consistent with previously publishstudies.4,25 This shows that the surfaces are clean and fuwetting.
By rearranging Eq.~2!, the spring constant of the cantlever can be determined from the slope of a plot ofb @Eq.~4!# as a function of surface separation. Figure 4 shows s
1e
IP license or copyright, see http://ojps.aip.org/rsio/rsicr.jsp
0
paoiVo
tacelintaiota
the
de-tion
ofused
ort
l to
ffer-in-
gcalolu-in
obeless
rcebe
tions
redthe
tra
ty.
snnl
1
.srenifi-
4029Rev. Sci. Instrum., Vol. 74, No. 9, September 2003 Calibration of colloid probe cantilevers
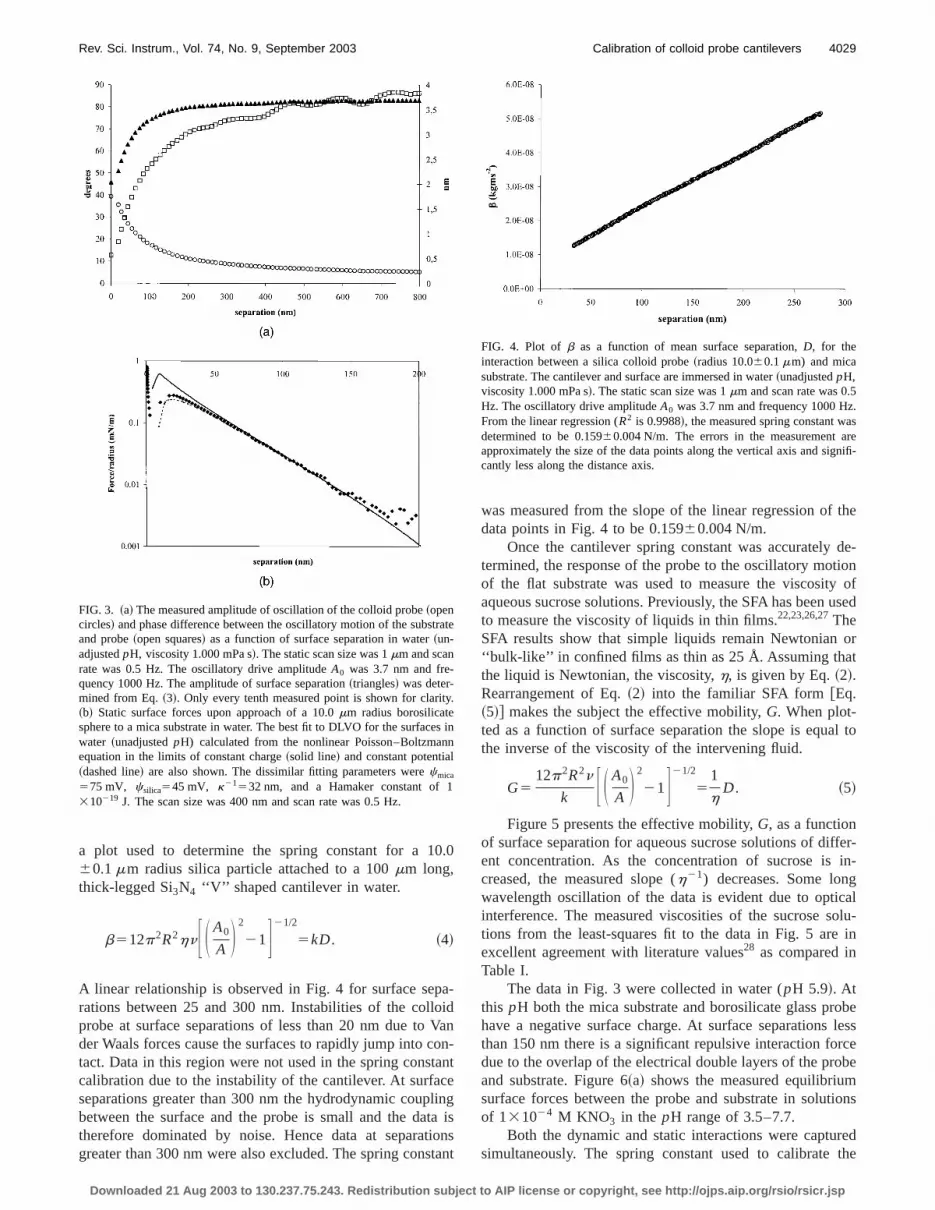
a plot used to determine the spring constant for a 160.1mm radius silica particle attached to a 100mm long,thick-legged Si3N4 ‘‘V’’ shaped cantilever in water.
b512p2R2hnF S A0
A D 2
21G21/2
5kD. ~4!
A linear relationship is observed in Fig. 4 for surface serations between 25 and 300 nm. Instabilities of the collprobe at surface separations of less than 20 nm due toder Waals forces cause the surfaces to rapidly jump into ctact. Data in this region were not used in the spring conscalibration due to the instability of the cantilever. At surfaseparations greater than 300 nm the hydrodynamic coupbetween the surface and the probe is small and the datherefore dominated by noise. Hence data at separatgreater than 300 nm were also excluded. The spring cons
FIG. 3. ~a! The measured amplitude of oscillation of the colloid probe~opencircles! and phase difference between the oscillatory motion of the subsand probe~open squares! as a function of surface separation in water~un-adjustedpH, viscosity 1.000 mPa s!. The static scan size was 1mm and scanrate was 0.5 Hz. The oscillatory drive amplitudeA0 was 3.7 nm and fre-quency 1000 Hz. The amplitude of surface separation~triangles! was deter-mined from Eq.~3!. Only every tenth measured point is shown for clari~b! Static surface forces upon approach of a 10.0mm radius borosilicatesphere to a mica substrate in water. The best fit to DLVO for the surfacewater ~unadjustedpH) calculated from the nonlinear Poisson–Boltzmaequation in the limits of constant charge~solid line! and constant potentia~dashed line! are also shown. The dissimilar fitting parameters werecmica
575 mV, csilica545 mV, k21532 nm, and a Hamaker constant of310219 J. The scan size was 400 nm and scan rate was 0.5 Hz.
Downloaded 21 Aug 2003 to 130.237.75.243. Redistribution subject to A
.0
-dann-nt
gis
nsnt
was measured from the slope of the linear regression ofdata points in Fig. 4 to be 0.15960.004 N/m.
Once the cantilever spring constant was accuratelytermined, the response of the probe to the oscillatory moof the flat substrate was used to measure the viscosityaqueous sucrose solutions. Previously, the SFA has beento measure the viscosity of liquids in thin films.22,23,26,27TheSFA results show that simple liquids remain Newtonian‘‘bulk-like’’ in confined films as thin as 25 Å. Assuming thathe liquid is Newtonian, the viscosity,h, is given by Eq.~2!.Rearrangement of Eq.~2! into the familiar SFA form@Eq.~5!# makes the subject the effective mobility,G. When plot-ted as a function of surface separation the slope is equathe inverse of the viscosity of the intervening fluid.
G512p2R2n
k F S A0
A D 2
21G21/2
51
hD. ~5!
Figure 5 presents the effective mobility,G, as a functionof surface separation for aqueous sucrose solutions of dient concentration. As the concentration of sucrose iscreased, the measured slope (h21) decreases. Some lonwavelength oscillation of the data is evident due to optiinterference. The measured viscosities of the sucrose stions from the least-squares fit to the data in Fig. 5 areexcellent agreement with literature values28 as compared inTable I.
The data in Fig. 3 were collected in water (pH 5.9!. Atthis pH both the mica substrate and borosilicate glass prhave a negative surface charge. At surface separationsthan 150 nm there is a significant repulsive interaction fodue to the overlap of the electrical double layers of the proand substrate. Figure 6~a! shows the measured equilibriumsurface forces between the probe and substrate in soluof 131024 M KNO3 in the pH range of 3.5–7.7.
Both the dynamic and static interactions were captusimultaneously. The spring constant used to calibrate
te
in
FIG. 4. Plot of b as a function of mean surface separation,D, for theinteraction between a silica colloid probe~radius 10.060.1mm) and micasubstrate. The cantilever and surface are immersed in water~unadjustedpH,viscosity 1.000 mPa s!. The static scan size was 1mm and scan rate was 0.5Hz. The oscillatory drive amplitudeA0 was 3.7 nm and frequency 1000 HzFrom the linear regression (R2 is 0.9988!, the measured spring constant wadetermined to be 0.15960.004 N/m. The errors in the measurement aapproximately the size of the data points along the vertical axis and sigcantly less along the distance axis.
IP license or copyright, see http://ojps.aip.org/rsio/rsicr.jsp

ac
F
fit
tiv
stainacrtfilno
m
ricsuthd-ca
. 7.nceh
ericre-areare
esehar-
olefilm
tionm
ngr of
t isnscilTh.8ab
ot
ub-
z forrce
mea-mea-The
nd
4030 Rev. Sci. Instrum., Vol. 74, No. 9, September 2003 Notley, Biggs, and Craig
static interaction was determined from the dynamic intertions as described above. Figure 6~b! showsb as a functionof surface separation for each of the data sets shown in6~a!. Note that the data have been offset to allow easecomparison between the gradients. The least-squaresthe four curves agree to within 2%. The data in Fig. 6~b!show clearly that deflections of the cantilever due to stainteraction forces do not affect the response of the cantiledue to the hydrodynamic interactions.
Limitations of the approach adopted here were invegated using measurements for similar probes carryingsorbed polymer films. In the first example, a molecularly thlayer of polymer was deposited on each surface by freesorption of a low molecular weight highly charged polyeletrolyte from a low concentration solution. Previous repohave concluded, from static force data, that the adsorbedis at most 2 to 3 nm thick.29,30 Such a surface has beepostulated as a good model for a rough surface. In the seccase, a high molecular weight sample of the same polywas adsorbed from a high concentration solution. Thisknown to result in the development of a significant steboundary layer. Previous drainage measurements onsystems have indicated that solvent will penetrate into‘‘soft’’ polymer layer. This surface may therefore be consiered as a model for a soft deformable colloid probe. Typi
FIG. 5. Effective mobility is plotted vs separation. The slope of the ploused to determine the viscosity of a range of aqueous sucrose solutio20 °C. A static scan size was 250 nm and scan rate was 0.5 Hz. An ostory drive amplitude of 3.7 nm and frequency of 200 Hz was used.spring constant was 0.07060.003 N/m and the particle radius was 960.1mm. The measured viscosity of the sucrose solutions is given in TI. Water ~open diamonds!, 10% w/w sucrose/water~triangles!, 15% w/wsucrose/water~crosses!, and 20% w/w sucrose/water~circles!.
TABLE I. Comparison of the measured viscosity determined using Eq.~5!and the data presented in Fig. 4 to the bulk literature viscosity of aquesucrose solutions. Note that the data for water is used to determinespring constant.
Concentration~wt %!
Measured viscosity~mPa s!
Literature viscosity~mPa s!
0 1.0010 1.3460.03 1.3115 1.6060.03 1.5920 1.8960.04 1.92
Downloaded 21 Aug 2003 to 130.237.75.243. Redistribution subject to A
-
ig.ofto
cer
i-d-
d--sm
nderis
chis
l
static force data for these two systems are shown in FigClearly, there is no evidence of a steric layer in the preseof the low molecular weight polymer. In contrast, the higmolecular weight polymer sample shows a long range strepulsion under the conditions of the experiment. Corsponding hydrodynamic data for these force curvesshown in Fig. 8. At large separations, all three data setslinear and the gradient of the best fits to the data in thlinear regions are equivalent suggesting that the surface cacter does not affect the measurement ofk. Clearly, the datafor the two polymer samples are not linear over the whrange of surface separation distances and the adsorbeddoes influence the fluid drainage. The range of this deviais related to the extension of the polymer layer away frothe surface.
IV. DISCUSSION
The calibration of AFM cantilever spring constants usithe viscous response of a confined liquid has a numbe
atla-e
le
ushe
FIG. 6. ~a! Equilibrium surface forces on approach between a mica sstrate and borosilicate glass probe~radius 10.060.1mm) as a function ofsolutionpH. The static scan size was 250 nm and scan rate was 0.5 Hall force experiments. The repulsive electrostatic component of the foincreases withpH due to a corresponding increase in surface charge.pH3.5, circles; 4.5, squares; 5.9, triangles; and 7.7, crosses.~b! A plot of b vsseparation, used to determine the spring constant of the cantilever. Thesured spring constants under different static deflection conditions, assured from least-squares fits to the four data sets, agree to within 2%.curves are offset for clarity.pH 3.5, circles; 4.5, squares; 5.9, triangles; a7.7, crosses.
IP license or copyright, see http://ojps.aip.org/rsio/rsicr.jsp

st
allrinh
obtilpe
oaseosadnt
rcr
tha.-
ut
on,s-hefor
cy of
reda-nceanin-
owust
cu--theob-thate
itudelso,thepar-is
thered.al
tsria-nantdis-op-
ingtoble
ue
ureringing
elya
o a
thethe
ba
de
4031Rev. Sci. Instrum., Vol. 74, No. 9, September 2003 Calibration of colloid probe cantilevers
advantages over other methods. This method determinespring constant with the probe attached and the effect onspring constant of the placement of the probe is internaccounted for. Most existing methods determine the spconstant for a point load at the end tip of the cantilever. Tspring constant is then corrected for distance of the prfrom the end of the cantilever. This assumes that the canver has a uniform cross section and that the material proties of the cantilever are constant throughout the lengththe beam. If the method requires a correction, the systemerror of the measurement of the spring constant is increaAlso other methods fail to adequately account for the psible altered compliancy of the cantilever when a colloidparticle is attached with glue. Using the proposed methoquick, in situ determination of the cantilever spring constacan be made. Indeed, the data required to determinespring constant can be captured concurrently with the fodata of interest. Although nonstandard electronics arequired for the determination of the spring constant usingmethod, the necessary components are readily availableeasily implemented into the experimental instrumentation
Examination of Eq.~4! indicates that there are two contributing sources of error in the determination of absol
FIG. 7. Normalized static surface forces as a function of distance for~closed diamonds!, low molecular weight P2VP~open squares!, and highmolecular weight P2VP covered surfaces~open triangles! at pH 3. A scanrate of 0.5 Hz and scan size of 300 nm was used for all experiments.
FIG. 8. Effective mobility as a function of separation for the systemscribed in Fig. 7.
Downloaded 21 Aug 2003 to 130.237.75.243. Redistribution subject to A
theheygee
e-r-f
ticd.-la
thee
e-isnd
e
values forb and hence the spring constant determinativiz. the particle radius,R, and the surface separation ditance,D. The precise control of temperature afforded by tincubation of the AFM ensures a highly precise viscosityour solvent standard~water!. Typically the radius of the par-ticle in these experiments can be measured to an accura;1% using scanning electron microscopy~SEM!. Since inthe determination of the spring constant the radius is squain the calculation, this introduces an error of 2% in the mesured value. Accurate knowledge of the separation distarelies upon precise calibration of the AFM drive piezo andaccurate definition of the zero distance. Both factors cantroduce error into absolute values ofb. However, it shouldbe noted that to obtain the value ofk, it is not necessary toknow the absolute values ofb, only the variation ofb withdistance. Hence there is no absolute requirement to knzero separation. Of course, the movement of the piezo mstill be accurately known such that a value ofDD can beobtained. Typically, the movement of the piezo can be acrately calibrated with,0.1% error. Hence this is not expected to be significant when compared to the error fromparticle radius. Thus an accurate spring constant can betained at an arbitrary set of separation distances providedthe distance moved (DD) is accurately known and that thresponse ofb with D is linear~Fig. 4!. Obviously, the probeand surface should be close enough to ensure an amplresponse that is sufficiently greater than thermal noise. Athe limitations of the hydrodynamic theory are such thatdistance of surface separation is small compared to theticle radius. For a 10mm radius bead, as used here, thtypically limits us to separations of less that 1mm. Othercontributing sources of error in the measurement ofspring constant using this method need also to be consideFor example, typical errors in the calibration of the opticsensitivity may be of the order of 1% to 2%.
Optical noise can contribute to nonlinearity in the ploof beta versus separation. This can lead to significant vations in the slope~up to 10%! over subsets of the data. Iorder to minimize the error in the determined spring constit is recommended that data be obtained over as large atance range as practicable. When the nonlinearity due totical noise is significant the error in the determined sprconstant will be as large as 10%, which is comparableother methods. Noncoherent light sources are now availathat will remove this source of error allowing the techniqto give spring constants with an accuracy of;4%.
The data in Figs. 7 and 8 indicate clearly that the natof the surface is unimportant in the measurement of a spconstant using this approach, provided that the intervensolvent is Newtonian and that its viscosity is accuratknown. Again, accurate calibration relies upon performingmeasurement in the linear region ofb versusD. Thus itappears that this calibration procedure will be applicable twide range of probe materials whether hard~as in this caseof a silica particle interacting with a mica substrate! or soft~for example, surfaces with adsorbed species!, rough orsmooth.
No attempt has been made to systematically quantifyeffects of surface roughness for the bare particles on
re
-
IP license or copyright, see http://ojps.aip.org/rsio/rsicr.jsp

-setdecl
rino
faabi
obodan
foAoms
em
K.
rum.
A.
k-
vili,
4032 Rev. Sci. Instrum., Vol. 74, No. 9, September 2003 Notley, Biggs, and Craig
measured spring constant. At small surface separations~ofthe order of the roughness! the lubrication force may be influenced by surface roughness. However, data at smallface separations were rejected in the spring constant dmination due to the cantilever instability caused by VanWaals attractive forces. Significant affects from surfaroughness may be expected to cause deviations from theear behavior, as seen for adsorbed polymer films. In pciple, this calibration method can be used for a rangecantilever spring constants and probe sizes. The limitingtor is the hydrodynamic force required to cause a measuroscillatory deflection of the cantilever. Thus this methodideal for most standard contact cantilevers and colloid prsizes of 5mm diameter or greater. However, this methwould be unsuitable for the much stiffer, tapping mode ctilevers.
ACKNOWLEDGMENTS
S.N. and S.B. acknowledge the support of the CenterMultiphase Processes, a Special Research Center of thetralian Research Council. V.C. acknowledges support frthe Australian Research Council for the provision of a Podoctoral Fellowship.
1W. A. Ducker, T. J. Senden, and R. M. Pashley, Langmuir8, 1831~1992!.2I. Larson, C. J. Drummond, D. Y. C. Chan, and F. Grieser, J. Am. ChSoc.115, 11885~1993!.
3S. Biggs and P. Mulvaney, J. Chem. Phys.100, 8501~1994!.4P. G. Hartley, I. Larson, and P. J. Scales, Langmuir13, 2207~1997!.
Downloaded 21 Aug 2003 to 130.237.75.243. Redistribution subject to A
ur-er-rein--f
c-le
se
-
rus-
t-
.
5R. W. Carpick and M. Salmeron, Chem. Rev.~Washington, D.C.! 97, 1163~1997!.
6B. Bhushan, Int. Mater. Rev.44, 105 ~1999!.7S. Biggs, R. Cain, and N. W. Page, J. Colloid Interface Sci.232, 133~2000!.
8M. Radmacher, J. P. Cleveland, M. Fritz, H. G. Hansma, and P.Hansma, Biophys. J.66, 2159~1994!.
9S. Biggs and G. Spinks, J. Adhes. Sci. Technol.12, 461 ~1998!.10H.-J. Butt, Biophys. J.60, 1438~1991!.11W. A. Ducker, T. J. Senden, and R. M. Pashley, Nature~London! 353, 239
~1991!.12J. P. Cleveland, S. Manne, D. Bocek, and P. K. Hansma, Rev. Sci. Inst
64, 403 ~1993!.13J. L. Hutter and J. Bechhoefer, Rev. Sci. Instrum.64, 1868~1993!.14T. J. Senden and W. A. Ducker, Langmuir10, 1003~1994!.15J. E. Sader, I. Larson, P. Mulvaney, and L. R. White, Rev. Sci. Instrum.66,
3789 ~1995!.16D. A. Walters, J. P. Cleveland, N. H. Thomson, P. K. Hansma, M.
Wendman, G. Gurley, and V. Elings, Rev. Sci. Instrum.67, 3583~1996!.17J. E. Sader, J. Appl. Phys.84, 64 ~1998!.18N. Maeda and T. J. Senden, Langmuir16, 9282~2000!.19V. S. J. Craig and C. Neto, Langmuir17, 6018~2001!.20H. Brenner, Chem. Eng. Sci.16, 242 ~1961!.21G. D. M. Mackay and S. G. Mason, J. Colloid Sci.16, 632 ~1961!.22D. Y. C. Chan and R. G. Horn, J. Chem. Phys.83, 5311~1985!.23J. N. Israelachvili, J. Colloid Interface Sci.110, 263 ~1986!.24C. Neto and V. S. J. Craig, Langmuir17, 2097~2001!.25G. Toikka and R. A. Hayes, J. Colloid Interface Sci.191, 102 ~1997!.26J. Klein, Y. Kamiyama, H. Yoshizawa, J. N. Israelachvili, G. H. Fredric
son, P. Pincus, and L. J. Fetters, Macromolecules26, 5552~1993!.27S. E. Campbell, G. Luengo, V. I. Srdanov, F. Wudl, and J. N. Israelach
Nature~London! 382, 520 ~1996!.28CRC Handbook of Chemistry and Physics, 77th ed.~CRC, Boca Raton,
FL, 1996!.29J. Marra and M. L. Hair, J. Phys. Chem.92, 6044~1988!.30S. Biggs and A. D. Proud, Langmuir13, 7202~1997!.
IP license or copyright, see http://ojps.aip.org/rsio/rsicr.jsp


