Embed Size (px)
Citation preview
Capillary electrophoresis-laser induced fluorescence (CE-LIF)assay for measurement of intra-cellular D-Serine and serineracemase activity
Nagendra S. Singh*, Rajib K. Paul*, Megan Sichler, Ruin Moaddel, Michel Bernier, andIrving W. Wainer#
Laboratory of Clinical Investigation, National Institute on Aging, National Institutes of Health,Baltimore, MD 21224, USA.
AbstractAn enantioselective capillary electrophoresis–laser induced fluorescence (CE-LIF) method for theanalysis of D-Serine (D-Ser) in cellular matrices has been developed. The assay involvesderivatization with FITC followed by CE-LIF using 0.5 mM hydroxyl propyl-β-cyclodextrin inborate buffer [80 mM, pH 9.3]. The method was able to resolve D-Ser and L-Ser with anenantioselectivity (α) of 1.03 and a Resolution (Rs) of 1.37. Linearity was established from 0.25μM – 100.00 μM. The assay was also able to enantioselectively resolve 6 additional amino acidracemates. The method was applied to the determination of intra-cellular D-Ser concentrations inPC-12, C6, 1312N1 and HepG2 cell lines. This method was used to determine the concentration-dependent increases in D-Ser and associated EC50 values produced by L-Ser and theconcentration-dependent decreases in D-Ser and associated IC50 values produced by glycine, acompetitive inhibitor of serine racemase (SR). Western blot analysis determined that the PC-12and C6 cell lines contained monomeric and dimeric forms of SR while the 1321N1 and HepG2cells contained only the monomeric form. Although the SR dimer has been identified as the activeform of the enzyme, all four of the tested cell lines expressed enzymatically active SR.
KeywordsD-Ser; L-Ser; glycine; enantioselective resolution; serine racemase monomer; serine racemasedimer
IntroductionD-serine (D-Ser) is an N-methyl D-aspartate (NMDA) receptor co-agonist that plays a keyrole in neurotransmission [1]. D-Ser is found in the mammalian brain [1,2] and elevated anddepressed endogenous levels of the compound have been associated with a number ofcentral nervous system (CNS) diseases and pathological states [2,3], includingschizophrenia, aging, Alzheimer's disease, convulsion, anxiety, cerebellar ataxia, Parkinson's
# Corresponding Author: Irving W. Wainer, Ph.D., Bioanalytical and Drug Discovery Unit, Laboratory of Clinical Investigation,National Institute on Aging, National Institutes of Health, Biomedical Research Center, 251 Bayview Boul., Room 08B133,Baltimore, MD 21224, USA. Phone: (410) 558-8483; Fax: (410) 558-8409; [email protected].*These authors contributed equally to the workPublisher's Disclaimer: This is a PDF file of an unedited manuscript that has been accepted for publication. As a service to ourcustomers we are providing this early version of the manuscript. The manuscript will undergo copyediting, typesetting, and review ofthe resulting proof before it is published in its final citable form. Please note that during the production process errors may bediscovered which could affect the content, and all legal disclaimers that apply to the journal pertain.
NIH Public AccessAuthor ManuscriptAnal Biochem. Author manuscript; available in PMC 2013 February 15.
Published in final edited form as:Anal Biochem. 2012 February 15; 421(2): 460–466. doi:10.1016/j.ab.2011.10.003.
NIH
-PA Author Manuscript
NIH
-PA Author Manuscript
NIH
-PA Author Manuscript
disease, neuropathic pain and depression. For example, increased levels of D-Ser in the CNShave been linked to amyotrophic lateral sclerosis (ALS) and Alzheimer's disease [1] whiledecreased CNS concentrations have been associated with schizophrenia [2,3]. Therelationship between decreased D-Ser levels and schizophrenia have led to clinical trialsinvolving the administration of D-Ser and the initial studies indicated that the compound haspositive effects in this disease [2].
The conversion of L-serine (L-Ser) into D-Ser by the pyridoxal-5’-phosphate-dependentserine racemase (SR) provides the primary source of endogenous D-Ser [2]. In mammals,SR is expressed in a number of central and peripheral tissues [1,2], and western blot analysishas identified SR in the monomeric, dimeric and tetrameric forms, although it has beenassumed that human SR dimer is the active form of the enzyme [2, 5]. The enzymaticactivity of SR can be increased by increasing L-Ser levels [4] or intracellular Ca+2 levelsusing calcium ionophores, like A23187 [5], and decreased using competitive inhibitors suchas glycine (Gly) [6] or by depletion of pyridoxal-5’-phosphate using sulfhydryl compounds[7]. SR expression can also be induced in vitro by incubation with amyloid β-peptide(Aβ1-42) [8] or lipopolysaccharide (LPS) [9] and in vivo by single and chronicintraperitoneal administrations of morphine to male Wistar rats [10,11]. Since increased D-Ser concentrations in the CNS have been associated with ALS and Alzheimer's disease, thedevelopment of SR inhibitors is an emerging field in pharmaceutical research [2].
A number of analytical methods have been reported for the measurement of D-Ser in thepresence of L-Ser in plasma [12,13], brain tissue [12,14], as well as extracellular andintracellular matrices [4]. One experimental approach is based upon the conversion of D-and L-Ser into diastereomeric fluorescent derivatives using o-phthaldialdehyde incombination with a chiral thiol reagent, such as N-acetyl-L-cysteine, N-tert-butyloxycarbonyl-L-cysteine, N-isobutyryl-L-cysteine and N-acetyl-D-penicillaminefollowed by HPLC or GC analysis [12,15,16]. This approach has been utilized in thedetermination of D- and L-Ser levels in plasma [12,13] and brain tissue [12]. Otherdiasteromeric derivatization methods have used dabsyl chloride, 4-fluoro-7-nitro-2,1,3-benzoxadiazole, 1,5-difluoro-2,4-dinitrobenzene and analogues, l-fluoro-2,4-dinitrophenyl-5-L-alanine amide , (+)- 1-(9-fluorenyl)ethyl chloroformate, O-tetraacetyl-/3-Dglucopyranosyl isothiocyanate, (1R,2R)-N-[(2-isothiocyanato)cyclohexyl]-6-methoxy-4-quinolinylamide) and R(2)-4-(3-isothiocyanatopyrrolidin-1-yl)-7-(N,Ndimethylaminosulfonyl)-2,1,3-benzoxadiazole [17]. In addition to HPLC-fluorometricanalysis, HPLC with electrochemical detection, LC-MS, GC/GC-MS and CE have beenused to separate and quantify the diastereomeric D-Ser derivatives [2]. The directenantioselective separation of D- and L-Ser has also been reported based upon fluorescentderivatization with an achiral reagent, fluorescein isothiocyanate (FITC), followed by CE-LIF separation of the derivatives using two chiral selectors, 2-hydroxypropyl-β-cyclodextrin(HP-β-CD) / β-cyclodextrin (β-CD) and sodium taurocholate, in the electrophoretic buffer[18].
While there are many reported approaches to the determination of D- and L-Ser levels inplasma and tissues, only a few have been used to measure intracellular D- and L-Ser [4,12].The objective of this study was to establish an assay that could measure small, butsignificant changes in intra-cellular D-Ser levels produced by changes in SR expression andactivity. In order to accomplish this, we have adapted the previously reported CE-LIFmethod [18]. We now report the development of an enantioselective CE-LIF method whichuses a single chiral selector, HP-β–CD, and the application of this method to thedetermination of concentration-dependent changes in intracellular D-Ser production inPC-12, C6, 1321N1 and HepG2 cell lines produced by incubation with LSer, a SR substrate,and Gly, a SR competitive inhibitor. The corresponding EC50 values of L-Ser and IC50
Singh et al. Page 2
Anal Biochem. Author manuscript; available in PMC 2013 February 15.
NIH
-PA Author Manuscript
NIH
-PA Author Manuscript
NIH
-PA Author Manuscript
values of Gly were also determined. The assay was sensitive and precise and SR activitywas detected in all of the tested cell lines even though the initial Western blot analysisindicated that the SR dimer was not present in the 1321N1 and HepG2 cells. A second SRantibody capable of detecting the monomeric and dimeric forms of the enzyme was used andthe results demonstrated that the SR monomer was present in all 4 cell lines, thus indicatingthat the SR monomer also mediates the conversion of L-Ser to D-Ser.
Materials and methodsMaterials
D-serine (D-Ser), L-serine (L-Ser), D-alanine (D-Ala), L-alanine (L-Ala), D-arginine (D-Arg), L-arginine (L-Arg), glycine (Gly), D-leucine (D-Leu), L-leucine (LLeu), D-isoleucine(D-Iso), L-isoleucine (L-Iso), D-glutamic acid (D-Glu), L-glutamic acid (L-Glu), D-asparticacid (D-Asp), L-aspartic acid (L-Asp), L-lysine (L-lys), β-cyclodextrin (β-CD), 2-hydroxypropyl-β-cyclodextrin (HP-β-CD), methanol, acetonitrile (ACN), lipopolysaccharide(LPS) and fluorescein isothiocyanate (FITC) were obtained from Sigma-Aldrich (St. Louis,MO, USA). De-ionized water was obtained from a Milli-Q system (Millipore, Billerica,MA, USA). All other chemicals used were of analytical grade.
Cell lines and Cell cultureThe cell lines selected for this study were PC-12 pheochromocytoma derived from ratadrenal medulla, human-derived 1321N1 astrocytoma, rat-derived C6 glioblastoma, andhuman-derived HepG2 hepatocellular carcinoma. All of the cell lines were obtained fromATCC (Manassas, VA, USA). The PC12 cells were maintained in RPMI-1640 with L-glutamine (L-Gln) supplemented with 10% horse serum (heat inactivated), 5% fetal bovineserum (FBS), 1% sodium pyruvate solution, 1% 4-(2-hydroxyethyl)-1-piperazineethanesulfonic acid (Hepes) buffer and 1% penicillin/streptomycin solution. The1321N1 and C6 cells were maintained in Dulbecco's Modified Eagle Medium (DMEM) withL-Gln supplemented with 10% FBS and 1% penicillin/streptomycin solution. The HepG2cells were maintained in Eagle's Minimum Essential Medium (EMEM) supplemented with 1% L-Gln, 10 % FBS, 1% sodium pyruvate solution and 1% penicillin/streptomycin solution.
DMEM with glutamine, E-MEM, RPMI-1640, trypsin solution, phosphate-buffered saline,FBS, sodium pyruvate solution (100 mM), L-Gln (200 mM) and penicillin/streptomycinsolution (containing 10,000 units/ml penicillin and 10,000 μg/ml streptomycin) wereobtained from Quality Biological (Gaithersburg, MD, USA), horse serum (heat inactivated)was obtained from Biosource (Rockville, MD, USA) and Hepes buffer (1 M) was obtainedfrom Mediatech Inc. (Manassas, VA, USA).
CE-LIF analysisInstrumentation—The CE separations were performed with a P/ACE MDQ systemequipped with a laser-induced fluorescence detector (Beckman Instruments, Fullerton, CA,USA). The laser-induced fluorescence detection was carried out with excitation at 488 nmand emission at 520 nm. An uncoated fused-silica capillary, 50 μm I.D, 60.2 cm total length,with an effective length of 50 cm, was used and the running buffer was composed of 0.5mM HP-β-CD in borate buffer [80 mM, pH 9.3]. The capillary was conditioned before eachanalysis by flushing successively with 0.1 M NaOH, 0.1 M H3PO4, H2O and running buffereach for 4 min. Samples were injected with pressure at 0.5 p.s.i. for 10 s and separated usinga voltage gradient in which separation voltage was 15 kV between 0 – 44 min, followed by22 kV between 45 – 60 min. The total run time was 76 min. Quantification wasaccomplished using area ratios calculated for FITC-D-Ser with FITC-D-Arg as the internalstandard, where the concentration of the internal standard was set at 5 μM.
Singh et al. Page 3
Anal Biochem. Author manuscript; available in PMC 2013 February 15.
NIH
-PA Author Manuscript
NIH
-PA Author Manuscript
NIH
-PA Author Manuscript
Standard solutions—A concentrated stock solution of 0.5 mM D-Ser in borate buffer [80mM, pH 9.3] was used to prepare 0.25, 0.5, 1, 2, 4, 10, 20, 40, 80 and 100 μM solutions forthe calibration curve. Standard solutions, 1 mM in borate buffer [80 mM, pH 9.3], of LSer,D-Ala, L-Ala, D-Arg, L-Arg, Gly, D-Leu, L-Leu, D-Iso, L-Iso, D-Glu, L-Glu, D-Asp, L-Asp, L-Lys were also prepared. A 100 μM solution of D-Arg in H2O was used as theinternal standard solution.
Sample preparation—Cells were collected and centrifuged for 5 min at 200 × g at 4 °C.The supernatant was discarded and the cells were suspended in 1.00 ml of H2O, 0.050 ml ofthe internal standard was added and the resulting mixture vortex mixed for 1 min. A 4.00 mlaliquot of ACN was added and the suspension was sonicated for 20 min. The mixture wasthen centrifuged for 15 min at 2500 × g at 4 °C, the supernatant collected and stream driedunder nitrogen. The residue was dissolved in 0.90 ml of borate buffer [80 mM, pH 9.3].
FITC labeling—FITC solution (3 mg/ml) was prepared in acetone and stored at –20 °Cuntil use. For the derivatization of standard amino acids, a 0.05 ml aliquot of the internalstandard solution was added to a 0.85 ml of the standard solution and 0.10 ml of FITCsolution was added and the resulting solutions were placed in darkness for 12 h at roomtemperature. When cellular extracts were assayed, 0.10 ml of FITC solution was added tothe 0.90 ml samples and the resulting solutions were placed in darkness for 12 h at roomtemperature.
Effect of L-serine and glycine on serine racemase activity and expressionCells were seeded on 100 × 20 mm tissue culture plates and were maintained at 37 °C underhumidified 5% CO2 in air until they reached >70% confluence. The original media wasreplaced with media containing sequential concentrations of the test compounds and theplates were incubated for an additional 36 h. The medium was removed, and the cellscollected for analysis. All of the studies were done in triplicate. When L-Ser was studied theconcentrations used were: 0, 2, 4, 6, 8, 10, 15 and 20 mM; whereas the study of the effectsof Gly was performed using the following concentrations: 0, 0.25, 0.5, 1, 2, 4, 6 and 8 mM.
Western BlottingCells were lysed with RIPA buffer containing ethylene glycol tetraacetic acid andethylenediamine tetraacetic acid (Boston BioProducts, Ashland, MA, USA). The lysis buffercontained a protease inhibitor cocktail composed of 4-(2-aminoethyl)benzenesulfonylfluoride, pepstatin A, E-64, bestatin, leupeptin, and aprotinin (Sigma-Aldrich). Proteinconcentrations were determined using the bicinchoninic acid (BCA) reagent obtained fromPierce Biotechnology, Inc. (Rockford, IL, USA). Proteins (20 μg/well) were separated on 4to 12% precast gels (Invitrogen, Carlsbad, CA, USA) using SDS-polyacrylamide gelelectrophoresis under reducing conditions and then they were electrophoretically transferredonto polyvinylidene fluoride (PVDF) membrane (Invitrogen). Western blots were performedaccording to standard methods which involved blocking in 5% non-fat milk and incubatedwith the antibody of interest, followed by incubation with a secondary antibody conjugatedwith the enzyme horseradish perodixase. The visualization of immunoreactive bands wasperformed using the ECL Plus Western Blotting Detection System (GE Healthcare, NJ,USA). The quantification of bands was done by volume densitometry using Image softwareand normalization to β-actin.
The primary antibodies for SR were obtained from Santa Cruz Biotechnology (Santa Cruz,CA, USA), sc-48741, and Abcam (Cambridge, MA, USA), ab45434, and the primaryantibody for β-actin was obtained from Abcam, ab6276. The antibodies were used at adilution recommended by the manufacturer.
Singh et al. Page 4
Anal Biochem. Author manuscript; available in PMC 2013 February 15.
NIH
-PA Author Manuscript
NIH
-PA Author Manuscript
NIH
-PA Author Manuscript
Statistical AnalysisGraphpad Prism 4 (GraphPad Software, Inc., La Jolla, CA, USA) running on a personalcomputer was used to perform all the statistical data analysis including EC50 and IC50 valuecalculations.
ResultsOptimization of the CE-LIF method for D-Serine and L-Serine analysis
Lu and Chen [20] have previously reported the development of a micellar CE-LIF methodfor the enantioselective separation of FITC-derivatized amino acids in which the optimumchiral separations were obtained using a 3 : 2 molar ratio of sodium taurocholate : β-CD or a3 : 2 molar ratio of sodium taurocholate : HP-β-CD. We have adapted this approach to thestudy of the intracellular concentrations of D-Ser. In the current study, the enantioselectiveresolution of FITC-derivatized D-Ser and L-Ser was achieved without the addition ofsodium taurocholate to the running buffer using either β-CD or HP-β-CD as the chiralselector. The enantioselectivity (α) and resolution (Rs) of D-Ser and L-Ser were optimizedby altering the concentrations of the selectors in borate buffer [80 mM, pH 9.3], Fig 1A,B.With HP-β-CD, the optimum α and Rs values, ~1.04 and 1.65, respectively, were observedat a selector concentration of 1 mM, and resolutions of Rs ≥ 1.20 were obtained at HP-β-CDconcentrations between 0.5 and 2 mM, Fig. 1A. When β-CD was used as the selector, higherenantioselectivities and resolutions were obtained with the optimum α and Rs values of 1.09and 3.15, respectively, observed at a β-CD concentration of 2 mM and baseline resolutionsof Rs ≥ 1.50 were obtained at all β-CD concentrations used in the study, Fig. 1B. The effectof buffer concentration was determined using 100 mM borate buffer and HP-β-CDconcentrations of 0.25 to 8.0 mM and no significant differences between the data obtainedwith 80 mM buffer were observed (data not shown).
The electrophoretic buffer composed of 1 mM HP-β-CD in borate buffer [80 mM, pH 9.3]was chosen for further development. A group of 8 additional amino acids, including 6racemic mixtures, were examined as potential interferences with the D-Ser determination.Under these conditions, enantioselective separations were achieved for each of the 7 D,L-amino acid standards investigated in this study with α values ranging from 1.03 (D,L-Ile) to1.60 (D,L-Leu), Table S1 (Supplemental Data). However, there was no resolution betweenD-Ser and D-Ala and only a partial resolution of L-Ser from L-Ala and Gly, as L-Ala andGly co-migrated, Fig. 2A. Resolution between D-Ser and D-Ala (Rs = 1.21) was achieved byreducing the HP-β-CD concentration to 0.5 mM without significant loss in theenantioselective separation of D-Ser and L-Ser, α = 1.03; Rs = 1.85. Under these conditions,the resolution between L-Ser and L-Ala was improved while Gly was completely separatedfrom L-Ser and L-Ala. A baseline separation between L-Ser and L-Ala was achieved using avoltage step-gradient of 15 kV from 0-44 min and 22 kV from 45-120 min, Fig. 2B. Underthese conditions, the total run time for the separation of all of the standards was 120 min.Since the objective of the assay was the determination of the intra-cellular concentrations ofD-Ser and L-Ser, the run time was reduced to 76 min by decreasing the voltage to 0 kV at 60min followed by consecutive 4 min washes of 0.1 M NaOH, 0.1 M phosphoric acid, H2Oand running buffer. Under these conditions, the limit of detection (LOD) and limit ofquantitation (LOQ) of this method for D-Ser were 0.1 μM and 0.25 μM, respectively, basedon ‘signal to noise’ ratio, LOD (3:1) and LOQ (13:1). The linearity of the method was r2 =0.998 established between 0.25 – 100 μM and the method was reproducible with %CVvalues ranging between 0.7% and 2.7% (Interday, n = 3). Relative migration factors of D-Ser and L-Ser were calculated relative to the migration time of D-Arg (internal standard),calculated using 10 experiments per day over 3 days (n = 30). The average relative
Singh et al. Page 5
Anal Biochem. Author manuscript; available in PMC 2013 February 15.
NIH
-PA Author Manuscript
NIH
-PA Author Manuscript
NIH
-PA Author Manuscript
migration factor of D-Ser was 1.02 ± 0.02, %CV = 2.36, and for L-Ser the average was 1.05± 0.03, %CV = 2.46.
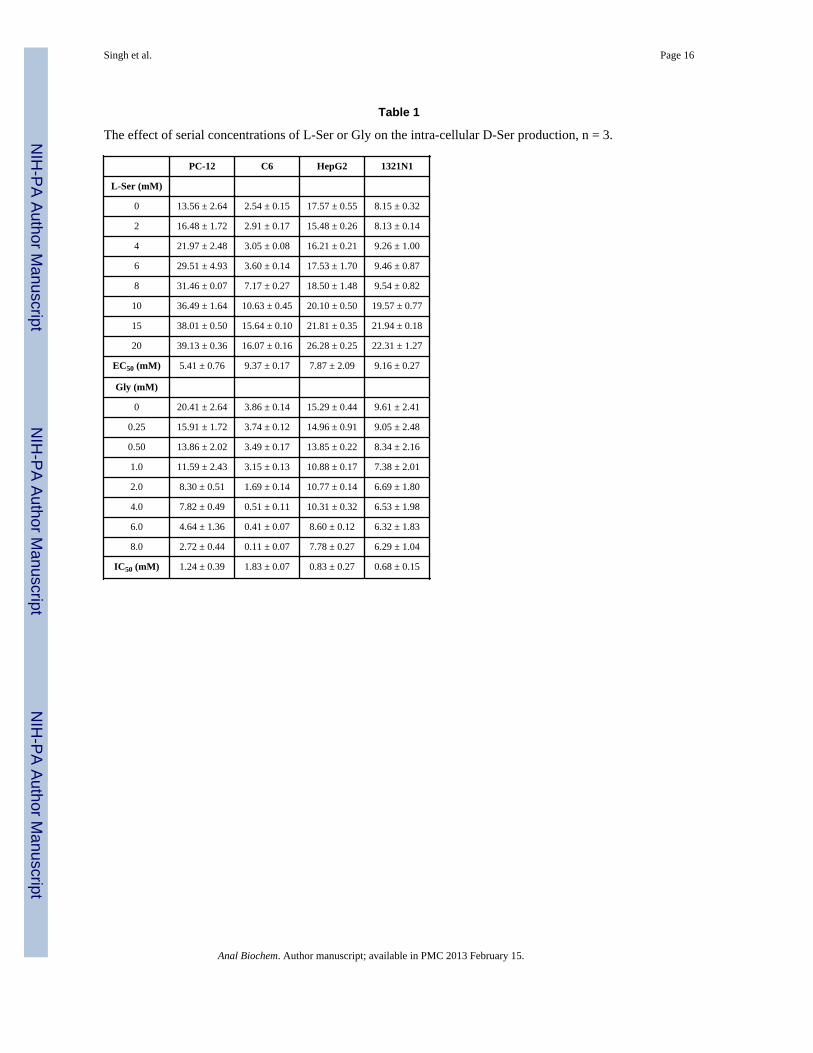
The effect of L-Ser media concentration on intracellular D-Ser concentrationSR mediates the conversion of L-Ser to D-Ser with Km values for L-Ser ranging from 4 mM,determined in purified recombinant human SR [19], to 18 mM, determined in SR purifiedfrom mouse brain [20]. In the present study we determined the effect of L-Ser, 2.0 to 20.0mM, added to the incubation buffer on intracellular D-Ser levels. The CE-LIF assay wasable to measure significant concentration-dependent increases in the intra-cellular D-Serlevels in all 4 cell lines, c.f. Fig. 3, which ranged from a 533% increase (C6) to a 50%increase (HepG2), Table 1. The data was used to calculate the EC50 value for the L-Ser-induced production of D-Ser in each cell line, Table 1, and the values ranged from 5.41 ±0.76 mM (PC-12) to 9.37 ± 0.17 mM (C6).
The effect of Gly media concentration on intracellular D-Ser concentrationPrevious studies have demonstrated that Gly is a competitive inhibitor of SR purified frommouse brain, and that the addition of 2 mM Gly to the incubation media produced an 80%reduction in the D-Ser production [6]. The effect was concentration-dependent with acalculated Ki value of 0.15 mM. Similar inhibitory activity has been reported for Gly withpurified recombinant human SR, Ki = 0.37 mM [19]. In the present study we determined theeffect on intracellular D-Ser levels produced by the addition of Gly, 0.25 to 8.0 mM, to theincubation buffer. The CE-LIF assay was able to measure significant concentration-dependent decreases in the intra-cellular D-Ser concentrations in all 4 cell lines, c.f. Fig. 3,which ranged from a 97% reduction (C6) to a 35% reduction (1321N1), Table 1. The datawas used to calculate the IC50 value for the Gly inhibition of SR in each cell line, Table 1,and the values ranged from 0.68 ± 0.15 mM (C6) to 1.83 ± 0.07 mM (HepG2). Thecalculated IC50 values are consistent with an estimated IC50 value of 1.8 mM for the Glyinhibition of purified mouse brain SR using the data supplied by Dunlop and Neidle [6].
Determination of SR expression using Western blottingThe cell lines used in this study were probed for SR expression using the technique ofWestern blotting with sc-48741 as the primary antibody. The blots obtained using thecellular extracts from the PC-12 and C6 contained a band at 74 kDa consistent with thepresence of the dimeric form of SR, while no bands were observed in the immunoblots fromthe HepG2 and 1231N1 cells, data not shown. On the basis of these results it was assumedthat the HepG2 and 1321N1 cell lines do not express functional SR. However, when thecellular extracts were assessed for intra-cellular DSer concentrations using the CE-LIFassay, the results indicated that all of the cell lines had intrinsic SR activity and that thisactivity could be modified with varying concentrations of L-Ser and Gly in the incubationmedia, Table 1. Based upon these results, the cellular extracts were reexamined using asecond primary SR antibody, ab45434. The resulting blots obtained with cellular extractsfrom the PC-12 and C6 cell lines contained two bands as 37 kDa and 74 kDa correspondingto the monomeric and dimeric forms of SR, respectively, Fig. 4. The relative ratios of theSR-dimer to the SR-monomer, normalized against β-actin, were ~5-fold and ~2-fold in thePC-12 and C-6 cells, respectively, Fig. 4. The extracts from the HepG2 and 1321N1 celllines contained a single 37 kDa band corresponding to the monomeric form of SR, Fig. 4.Although the enzymatic activity of SR was affected by L-Ser and Gly (see above), the datafrom the Western blot experiments indicated that neither of these treatments produced asignificant change in the SR dimer or SR monomer expression relative to control, Fig. 5A.
Since it has been previously demonstrated that the incubation of primary microglia with LPS(100 ng/ml) increased D-Ser levels in the incubation media and the expression of the
Singh et al. Page 6
Anal Biochem. Author manuscript; available in PMC 2013 February 15.
NIH
-PA Author Manuscript
NIH
-PA Author Manuscript
NIH
-PA Author Manuscript
dimeric form of SR [9], we treated PC-12 cells with LPS and determined the effect on intra-cellular D-Ser concentration and relative expression of SR. The addition of 10 ng/ml and100 ng/ml LPS to the incubation media produced 2.5-fold and 3.5-fold increases in intra-cellular D-Ser concentrations, respectively. Western blot analysis indicated that theexpression of the SR dimer had increased relative to control by 1.2-fold and 1.6-fold,respectively, while the relative expression of the SR monomer was 0.8-fold and 0.5-fold ofcontrol, Fig. 5B.
DiscussionThe objective of this project was the development of an analytical method capable ofmeasuring changes in the intra-cellular concentrations of D-Ser in order to assess the effectsof compounds on SR activity and expression. The experiments were carried out in 4 celllines of various origins and the results clearly indicate that the CE-LIF assay developed inthis study is capable of meeting these goals. This conclusion is supported by our datashowing the concentration-dependent changes in D-Ser production by L-Ser and Gly inintact cells. To our knowledge, this study is the first to report on the calculated EC50 andIC50 values from cellular experiments and by the fact that these values are consistent withthose from previous studies using recombinant SR.
A key element in the proposed analytical method was the comparison of the functionalchanges in SR, expressed as D-Ser concentrations, and the expression of the SR protein. Todetermine if L-Ser and/or Gly had affected SR expression and/or activity, we treated PC-12cells with 10 mM L-Ser, which produced a 160% increase in intra-cellular D-Ser, and 6 mMGly, which produced a 77% decrease in intra-cellular DSer, Table 2, without causing asignificant change in the SR dimer or SR monomer expression relative to control, Fig. 5A.
The treatment of PC-12 cells with LPS produced a significant increase in expression of theSR dimer and what appears to be a reduction in the corresponding monomer. It has beensuggested that the different forms of SR are in rapid equilibrium [5] and the results from thetreatment with LPS may reflect a shift in this equilibrium. This phenomenon is currentlybeing explored using the combined CE-LIF and Western blot approach and dose-responsestudies using the PC-12 and HepG2 cell lines, the latter expressing only the monomeric formof SR, Fig. 4. The results of these studies will be reported elsewhere.
It is generally assumed that human SR functions as a dimer, an assumption derived fromrecently determined crystallographic structures of the human and rat SR, c.f. [1,2]. Based onthese reports, an antibody selective for the dimeric form of SR was chosen to screenpotential cell lines for use as experimental and control cells; with PC-12 and C6 (SR dimerpositive) chosen as the experimental cell lines, and 1321N1 and HepG2 (SR dimer negative)chosen as the control cell lines. However, the functional studies indicated that all four celllines had intrinsic D-Ser production. The cell lines were re-probed using an antibody able todetect the SR monomer and dimer and the results indicated that the 1321N1 and HepG2 celllines expressed monomeric SR, Fig. 4. Thus, the data from this study indicate that in the1321N1 and HepG2 cell lines, the SR monomer mediates the racemization of L-Ser to D-Ser, is sensitive to L-Ser concentrations and is competitively inhibited by Gly, Table 1.Overall, the data from this study indicate that the CE-LIF assay developed in this project canbe used to assess changes in intra-cellular D-Ser concentrations. Further, the results alsodemonstrate that this technique should be combined with Western blot analysis to obtain anaccurate picture of the effect of substrate / inhibitors on SR activity.
Singh et al. Page 7
Anal Biochem. Author manuscript; available in PMC 2013 February 15.
NIH
-PA Author Manuscript
NIH
-PA Author Manuscript
NIH
-PA Author Manuscript
Supplementary MaterialRefer to Web version on PubMed Central for supplementary material.
AcknowledgmentsThis work was supported by funding from the Intramural Research Program of the National Institute on Aging/NIH.
Abbreviations used
Aβ1-42 amyloid β-peptide
β-CD β-cyclodextrin
HP-β-CD 2-hydroxypropyl-β-cyclodextrin
CNS central nervous system
CE-LIF capillary electrophoresis-laser induced fluorescence
DMEM Dulbecco's Modified Eagle Medium
E-MEM Eagle's Minimum Essential Medium
FBS fetal bovine serum
FITC fluorescein isothiocyanate
ACN acetonitrile
SR serine racemase
LPS lipopolysaccharide
References1. Wolosker H, Dumin E, Balan L, Foltyn V. D-Amino acids in the brain: D-Serine neurotransmission
and neurodegeneration. FEBS J. 2008; 275:3514–3526. [PubMed: 18564180]2. Jirásková-Vanícková J, Ettrich R, Vorlová B, Hoffman H, Lepšík M, Jansa P, Konvalinka J.
Inhibition of human serine racemase, an emerging target for medicinal chemistry. Curr. DrugTargets. 2011; 12:1037–1055. [PubMed: 21291385]
3. Sethuraman R, Lee T, Tachibana S. D-Serine regulation: A possible therapeutic approach for centralnervous diseases and chronic pain. Mini Rev. Med. Chem. 2009; 7:813–819. [PubMed: 19519506]
4. Miranda J, Panizzutti R, Foltyn V, Wolosker H. Cofactors of serine racemase that physiologicallystimulate the synthesis of the N-methyl-D-aspartate (NMDA) receptor co-agonist D-serine. Proc.Natl. Acad. Sci. U.S.A. 2002; 99:14542–14547. [PubMed: 12393813]
5. Cook S, Galve-Roperh I, Martinez del Pozo A, Rodriguez-Crespo I. Direct calcium binding resultsin activation of brain serine racemase. J. Biol. Chem. 2002; 277:27782–27792. [PubMed:12021263]
6. Dunlop D, Neidle A. Regulation of serine racemase activity by amino acids. Mol. Brain Res. 2005;133:208–214. [PubMed: 15710237]
7. Hoffman H, Jirskov J, Cigler P, Sanda M, Schraml J, Konvalinka J. Hydroxamic acids as a novelfamily of serine racemase inhibitors: Mechanistic analysis reveals different modes of interactionwith the pyridoxal-5’-phosphate cofactor. J. Med. Chem. 2009; 52:6032–6041. [PubMed:19791805]
8. Wu S, Barger S. Induction of serine racemase by inflammatory stimuli is dependent on AP-1. Ann.N. Y. Acad. Sci. 2004; 1035:133–146. [PubMed: 15681805]
Singh et al. Page 8
Anal Biochem. Author manuscript; available in PMC 2013 February 15.
NIH
-PA Author Manuscript
NIH
-PA Author Manuscript
NIH
-PA Author Manuscript
9. Wu S, Bodles A, Porter M, Griffin W, Basile A, Barger S. Induction of serine racemase expressionand D-serine release from microglia by amyloid β-peptide. J. Neuroinflammation. 2004; 1:2.[PubMed: 15285800]
10. Yoshikawa M, Shinomiya Y, Takayasu N, Tsukamoto H, Kobayashi H, Oka T, Hashimoto A.Long-term treatment with morphine increases the D-serine content in the rat brain by regulatingthe mRNA and protein expressions of serine racemase and D-amino acid oxidase. J. Pharmacol.Sci. 2008; 107:270–276. [PubMed: 18603832]
11. Yoshikawa M, Andoh H, Ito K, Suzuki T, Kawaguchi M, Kobayashi H, Oka T, Hashimoto A.Acute treatment with morphine augments the expression of serine racemase and D-amino acidoxidase mRNAs in rat brain. Eur. J. Pharmacol. 2005; 525:94–97. [PubMed: 16256980]
12. Hashimoto A, Nishikawa T, Oka T, Takahashi K, Hayashi T. Determination of free amino acidenantiomers in rat brain and serum by high-performance liquid chromatography afterderivatization with N-tert-butyloxycarbonyl-L-cysteine and o-phthaldialdehyde. J. Chromatogr.1992; 582:41–48. [PubMed: 1491056]
13. Grant S, Shulman Y, Tibbo P, Hampson D, Baker G. Determination of D-serine and relatedneuroactive amino acids in human plasma by high-performance liquid chromatography withfluorimetric detection. J. Chromatogr B. Analyt Technol Biomed Life Sci. 2006; 844:278–282.
14. Miyoshi Y, Hamase K, Okamura T, Konno R, Kasai N, Tojo Y, Zaitsu K. Simultaneous two-dimensional HPLC determination of free D-serine and D-alanine in the brain and periphery ofmutant rats lacking D-amino-acid oxidase. J. Chromatogr B. Analyt Technol Biomed Life Sci.2010 doi:10.1016/j.jchromb.2010.08.024.
15. Bruckner H, Wittner R, Godel H. Automated enantioseparation of amino acids by derivatizationwith o-phthaldialdehyde and n-acylated cysteines. J. Chromatogr. 1989; 476:73–82. [PubMed:2777997]
16. Buck R, Krummen K. High-performance liquid chromatographic determination of enantiomericamino acids and amino alcohols after derivatization with o-phthaldialdehyde and various chiralmercaptans : Application to peptide hydrolysates. J. Chromatogr. 1987; 387:255–265. [PubMed:3558624]
17. Wan H, Blomberg L. Chiral separation of amino acids and peptides by capillary electrophoresis. J.Chromatogr. 2000; 875:43–88.
18. Lu X, Chen Y. Chiral separation of amino acids derivatized with fluoresceine-5-isothiocyanate bycapillary electrophoresis and laser-induced fluorescence detection using mixed selectors of β-cyclodextrin and sodium taurocholate. J. Chromatogr A. 2002; 965:133–140. [PubMed: 12061559]
19. Hoffman H, Jirskov J, Ingr M, Zvelebil M, Konvalinka J. Recombinant human serine racemase:Enzymologic characterization and comparison with its mouse ortholog. Protein Expr. Purif. 2009;63:62–67. [PubMed: 18812225]
20. Neidle A, Dunlop D. Allosteric regulation of mouse brain serine racemase. Neurochem. Res. 2002;27:1719–1724. [PubMed: 12515328]
Singh et al. Page 9
Anal Biochem. Author manuscript; available in PMC 2013 February 15.
NIH
-PA Author Manuscript
NIH
-PA Author Manuscript
NIH
-PA Author Manuscript
Figure 1.Effect of the concentration of the chiral selector in the electrophoretic buffer onenantioselectivity (α) and chiral resolution (Rs). Where: A: Influence of HP-β-CDconcentration on (1) α and (2) Rs; B: Influence of β-CD concentration on (1) α and (2) Rs.
Singh et al. Page 10
Anal Biochem. Author manuscript; available in PMC 2013 February 15.
NIH
-PA Author Manuscript
NIH
-PA Author Manuscript
NIH
-PA Author Manuscript
Figure 2.(A) Electropherogram of FITC-labeled D,L-Arg, D,L-Ser, D,L-Ala and Gly obtained using1 mM HP-β-CD in borate buffer [80 mM, pH 9.3] as running buffer; (B) Electropherogramof FITC-labeled D,L-Arg, L-Lys, D,L-Iso, D,L-Leu, D,L-Ser, D,L-Ala and Gly obtained
Singh et al. Page 11
Anal Biochem. Author manuscript; available in PMC 2013 February 15.
NIH
-PA Author Manuscript
NIH
-PA Author Manuscript
NIH
-PA Author Manuscript
using 0.5 mM HP-β-CD in borate buffer [80 mM, pH 9.3] as running buffer. SeeExperimental section for assay conditions.
Singh et al. Page 12
Anal Biochem. Author manuscript; available in PMC 2013 February 15.
NIH
-PA Author Manuscript
NIH
-PA Author Manuscript
NIH
-PA Author Manuscript
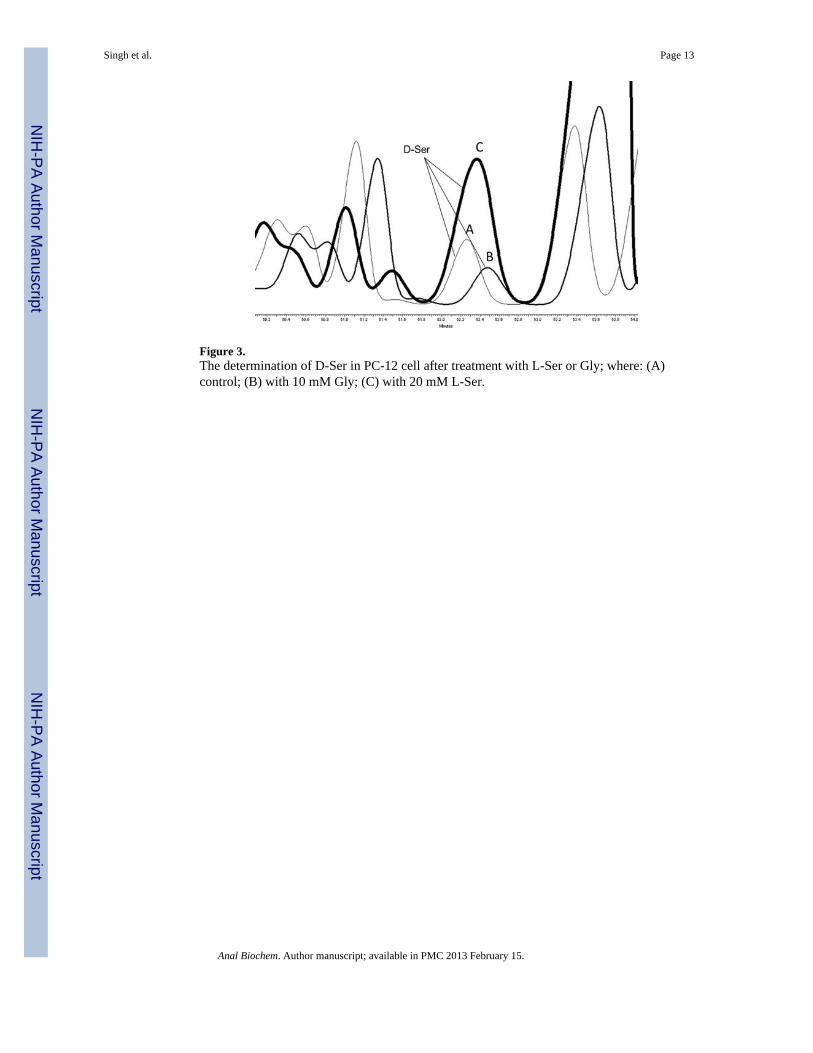
Figure 3.The determination of D-Ser in PC-12 cell after treatment with L-Ser or Gly; where: (A)control; (B) with 10 mM Gly; (C) with 20 mM L-Ser.
Singh et al. Page 13
Anal Biochem. Author manuscript; available in PMC 2013 February 15.
NIH
-PA Author Manuscript
NIH
-PA Author Manuscript
NIH
-PA Author Manuscript
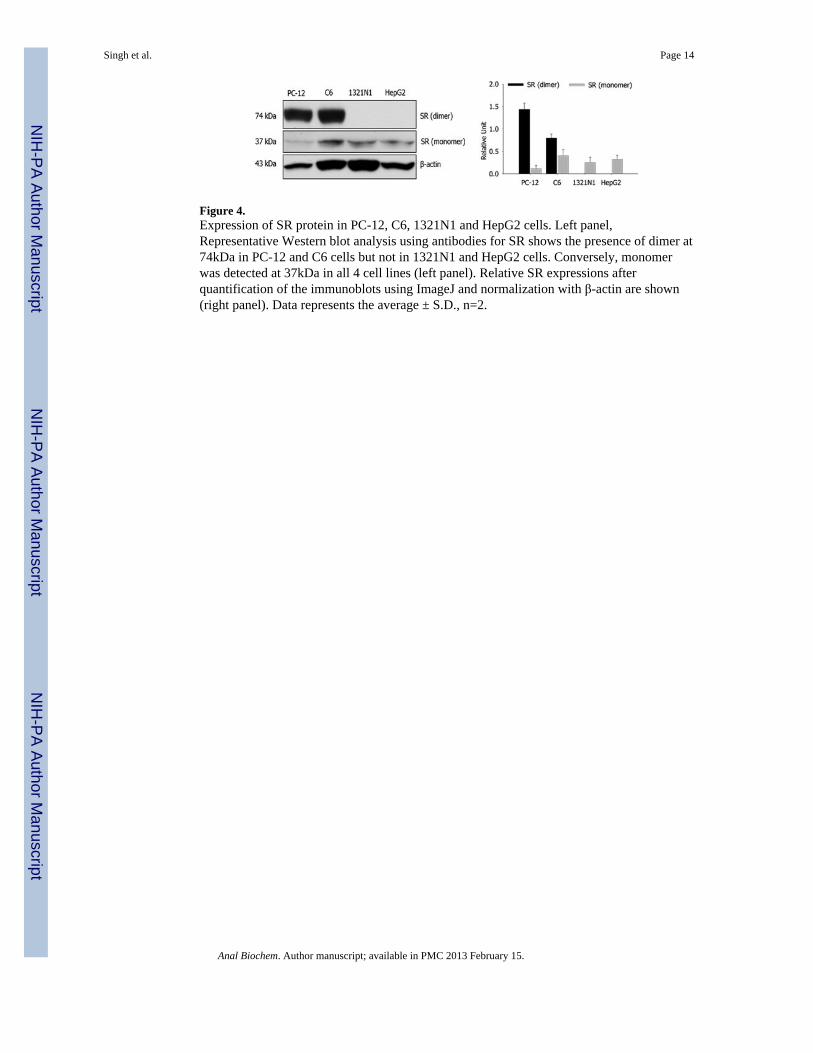
Figure 4.Expression of SR protein in PC-12, C6, 1321N1 and HepG2 cells. Left panel,Representative Western blot analysis using antibodies for SR shows the presence of dimer at74kDa in PC-12 and C6 cells but not in 1321N1 and HepG2 cells. Conversely, monomerwas detected at 37kDa in all 4 cell lines (left panel). Relative SR expressions afterquantification of the immunoblots using ImageJ and normalization with β-actin are shown(right panel). Data represents the average ± S.D., n=2.
Singh et al. Page 14
Anal Biochem. Author manuscript; available in PMC 2013 February 15.
NIH
-PA Author Manuscript
NIH
-PA Author Manuscript
NIH
-PA Author Manuscript
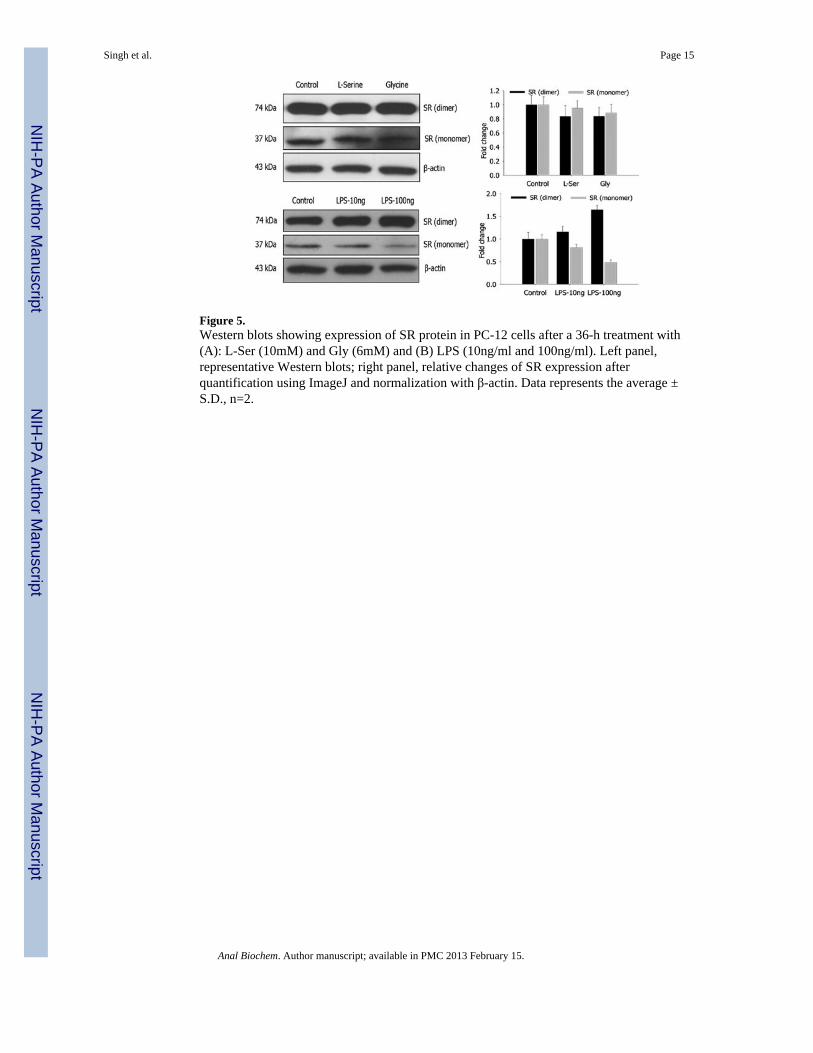
Figure 5.Western blots showing expression of SR protein in PC-12 cells after a 36-h treatment with(A): L-Ser (10mM) and Gly (6mM) and (B) LPS (10ng/ml and 100ng/ml). Left panel,representative Western blots; right panel, relative changes of SR expression afterquantification using ImageJ and normalization with β-actin. Data represents the average ±S.D., n=2.
Singh et al. Page 15
Anal Biochem. Author manuscript; available in PMC 2013 February 15.
NIH
-PA Author Manuscript
NIH
-PA Author Manuscript
NIH
-PA Author Manuscript
NIH
-PA Author Manuscript
NIH
-PA Author Manuscript
NIH
-PA Author Manuscript
Singh et al. Page 16
Table 1
The effect of serial concentrations of L-Ser or Gly on the intra-cellular D-Ser production, n = 3.
PC-12 C6 HepG2 1321N1
L-Ser (mM)
0 13.56 ± 2.64 2.54 ± 0.15 17.57 ± 0.55 8.15 ± 0.32
2 16.48 ± 1.72 2.91 ± 0.17 15.48 ± 0.26 8.13 ± 0.14
4 21.97 ± 2.48 3.05 ± 0.08 16.21 ± 0.21 9.26 ± 1.00
6 29.51 ± 4.93 3.60 ± 0.14 17.53 ± 1.70 9.46 ± 0.87
8 31.46 ± 0.07 7.17 ± 0.27 18.50 ± 1.48 9.54 ± 0.82
10 36.49 ± 1.64 10.63 ± 0.45 20.10 ± 0.50 19.57 ± 0.77
15 38.01 ± 0.50 15.64 ± 0.10 21.81 ± 0.35 21.94 ± 0.18
20 39.13 ± 0.36 16.07 ± 0.16 26.28 ± 0.25 22.31 ± 1.27
EC50 (mM) 5.41 ± 0.76 9.37 ± 0.17 7.87 ± 2.09 9.16 ± 0.27
Gly (mM)
0 20.41 ± 2.64 3.86 ± 0.14 15.29 ± 0.44 9.61 ± 2.41
0.25 15.91 ± 1.72 3.74 ± 0.12 14.96 ± 0.91 9.05 ± 2.48
0.50 13.86 ± 2.02 3.49 ± 0.17 13.85 ± 0.22 8.34 ± 2.16
1.0 11.59 ± 2.43 3.15 ± 0.13 10.88 ± 0.17 7.38 ± 2.01
2.0 8.30 ± 0.51 1.69 ± 0.14 10.77 ± 0.14 6.69 ± 1.80
4.0 7.82 ± 0.49 0.51 ± 0.11 10.31 ± 0.32 6.53 ± 1.98
6.0 4.64 ± 1.36 0.41 ± 0.07 8.60 ± 0.12 6.32 ± 1.83
8.0 2.72 ± 0.44 0.11 ± 0.07 7.78 ± 0.27 6.29 ± 1.04
IC50 (mM) 1.24 ± 0.39 1.83 ± 0.07 0.83 ± 0.27 0.68 ± 0.15
Anal Biochem. Author manuscript; available in PMC 2013 February 15.


