Embed Size (px)
Citation preview
Capital IQ: Getting Started
Basic Navigation and Functionality
Created by: Ben Stegeman ‘21
CAPITAL IQ BASIC TUTORIAL
In this tutorial, we will be exploring how to navigate and use the basic functions of S&P Global’s Capital IQ, as well as go over the key information needed for building a financial model.
What is Capital IQ?
Capital IQ (CIQ) is a financial research software used by many financial professionals, but more specifically Equity Researchers and Investment Bankers. This software compiles data of public and private companies, commodities, investment funds, economic indicators, and much more in an easy to use and straightforward layout. Additionally, CIQ includes features such as company and transaction screeners, stock price and yield curve charting, and compatibility with Microsoft Excel. This software is excellent for those looking to perform detailed industry and company research such as DCF and Comparable analysis.
How to Access Capital IQ
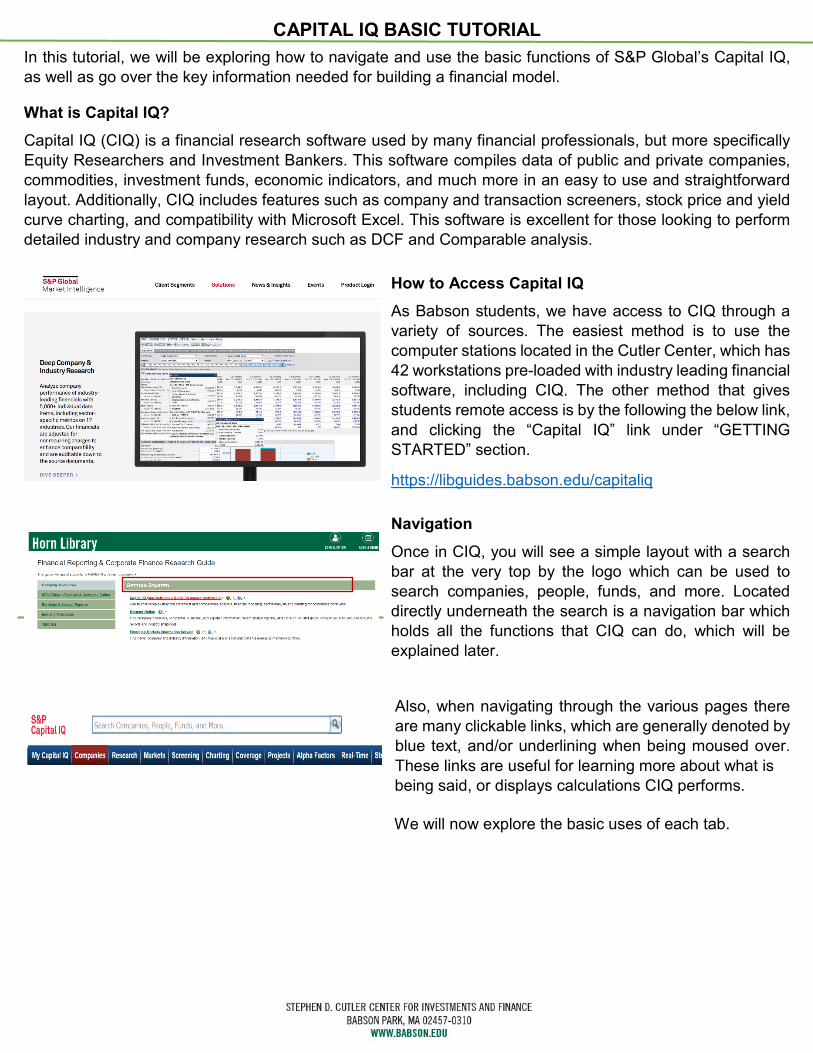
As Babson students, we have access to CIQ through a variety of sources. The easiest method is to use the computer stations located in the Cutler Center, which has 42 workstations pre-loaded with industry leading financial software, including CIQ. The other method that gives students remote access is by the following the below link, and clicking the “Capital IQ” link under “GETTING STARTED” section.
https://libguides.babson.edu/capitaliq
Navigation Once in CIQ, you will see a simple layout with a search bar at the very top by the logo which can be used to search companies, people, funds, and more. Located directly underneath the search is a navigation bar which holds all the functions that CIQ can do, which will be explained later.
Also, when navigating through the various pages there are many clickable links, which are generally denoted by blue text, and/or underlining when being moused over. These links are useful for learning more about what is
being said, or displays calculations CIQ performs.
We will now explore the basic uses of each tab.
CAPITAL IQ BASIC TUTORIAL
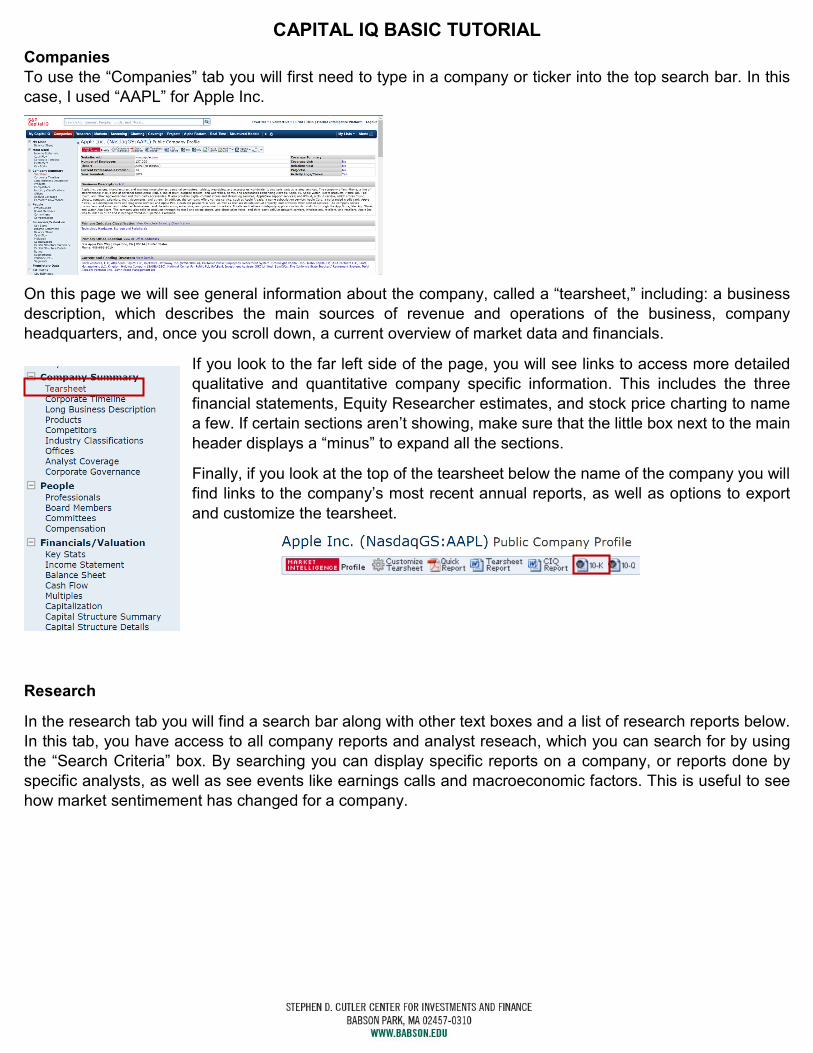
Companies To use the “Companies” tab you will first need to type in a company or ticker into the top search bar. In this case, I used “AAPL” for Apple Inc.
On this page we will see general information about the company, called a “tearsheet,” including: a business description, which describes the main sources of revenue and operations of the business, company headquarters, and, once you scroll down, a current overview of market data and financials.
If you look to the far left side of the page, you will see links to access more detailed qualitative and quantitative company specific information. This includes the three financial statements, Equity Researcher estimates, and stock price charting to name a few. If certain sections aren’t showing, make sure that the little box next to the main header displays a “minus” to expand all the sections.
Finally, if you look at the top of the tearsheet below the name of the company you will find links to the company’s most recent annual reports, as well as options to export and customize the tearsheet.
Research
In the research tab you will find a search bar along with other text boxes and a list of research reports below. In this tab, you have access to all company reports and analyst reseach, which you can search for by using the “Search Criteria” box. By searching you can display specific reports on a company, or reports done by specific analysts, as well as see events like earnings calls and macroeconomic factors. This is useful to see how market sentimement has changed for a company.
CAPITAL IQ BASIC TUTORIAL
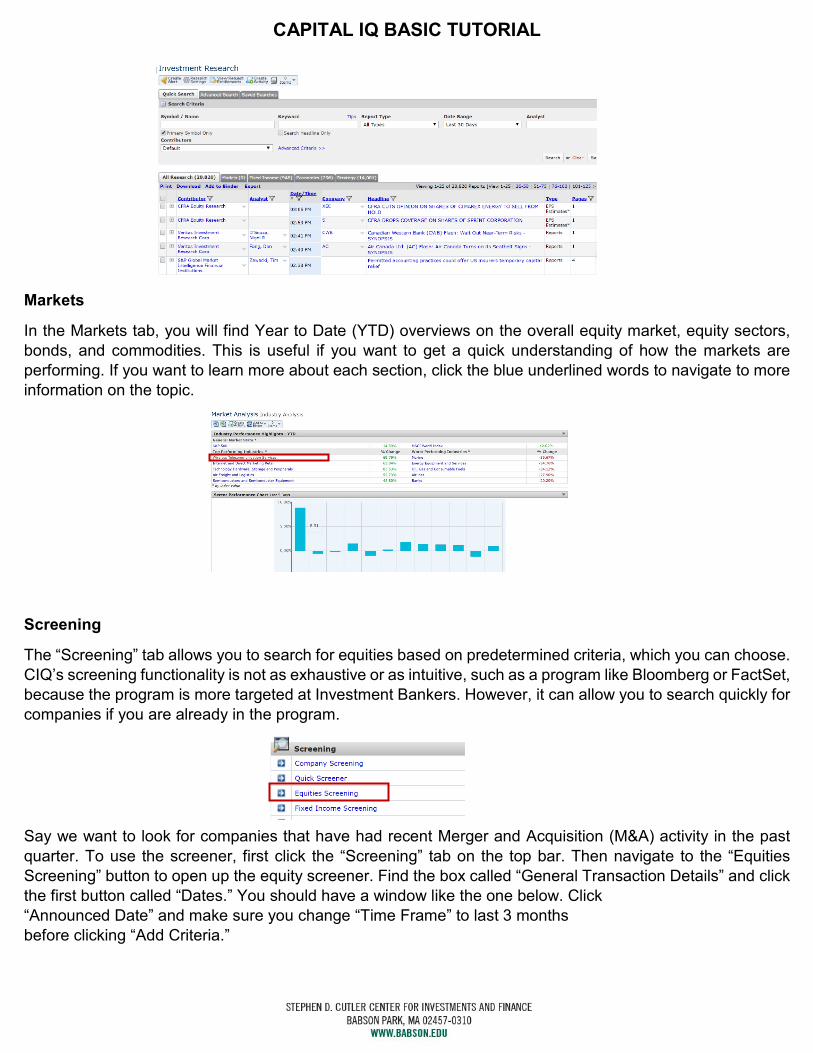
Markets
In the Markets tab, you will find Year to Date (YTD) overviews on the overall equity market, equity sectors, bonds, and commodities. This is useful if you want to get a quick understanding of how the markets are performing. If you want to learn more about each section, click the blue underlined words to navigate to more information on the topic.
Screening
The “Screening” tab allows you to search for equities based on predetermined criteria, which you can choose. CIQ’s screening functionality is not as exhaustive or as intuitive, such as a program like Bloomberg or FactSet, because the program is more targeted at Investment Bankers. However, it can allow you to search quickly for companies if you are already in the program.
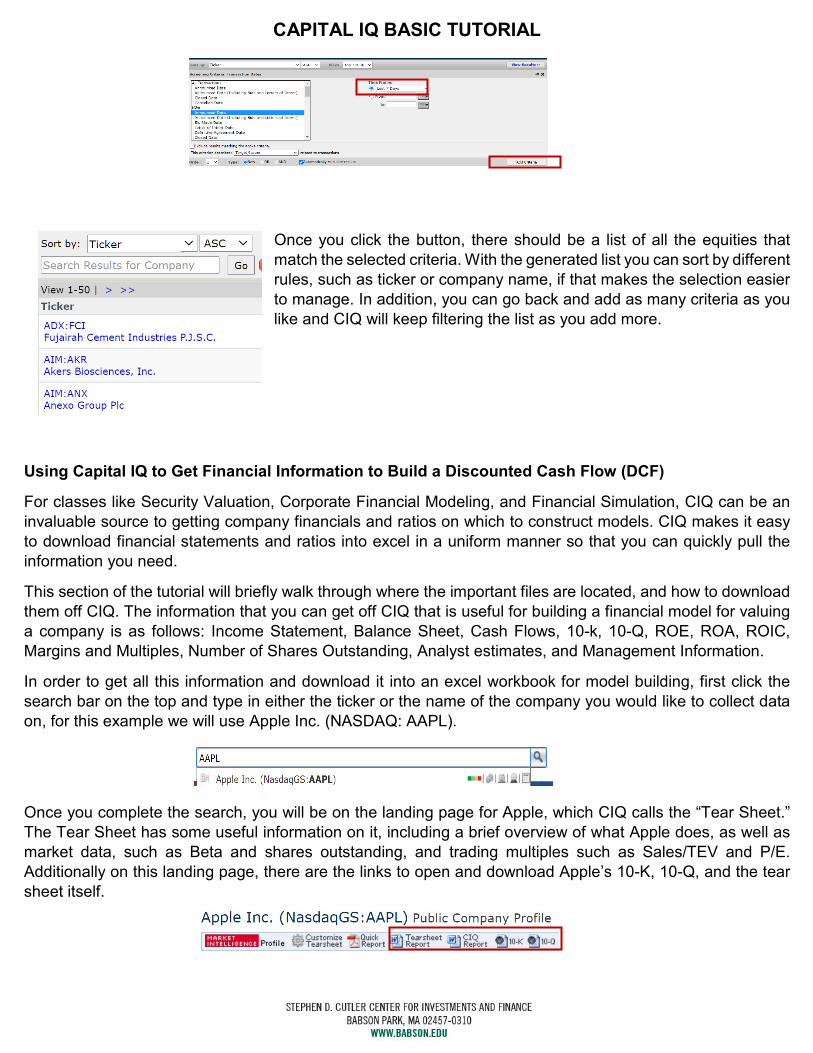
Say we want to look for companies that have had recent Merger and Acquisition (M&A) activity in the past quarter. To use the screener, first click the “Screening” tab on the top bar. Then navigate to the “Equities Screening” button to open up the equity screener. Find the box called “General Transaction Details” and click the first button called “Dates.” You should have a window like the one below. Click “Announced Date” and make sure you change “Time Frame” to last 3 months before clicking “Add Criteria.”
CAPITAL IQ BASIC TUTORIAL
Once you click the button, there should be a list of all the equities that match the selected criteria. With the generated list you can sort by different rules, such as ticker or company name, if that makes the selection easier to manage. In addition, you can go back and add as many criteria as you like and CIQ will keep filtering the list as you add more.
Using Capital IQ to Get Financial Information to Build a Discounted Cash Flow (DCF)
For classes like Security Valuation, Corporate Financial Modeling, and Financial Simulation, CIQ can be an invaluable source to getting company financials and ratios on which to construct models. CIQ makes it easy to download financial statements and ratios into excel in a uniform manner so that you can quickly pull the information you need.
This section of the tutorial will briefly walk through where the important files are located, and how to download them off CIQ. The information that you can get off CIQ that is useful for building a financial model for valuing a company is as follows: Income Statement, Balance Sheet, Cash Flows, 10-k, 10-Q, ROE, ROA, ROIC, Margins and Multiples, Number of Shares Outstanding, Analyst estimates, and Management Information.
In order to get all this information and download it into an excel workbook for model building, first click the search bar on the top and type in either the ticker or the name of the company you would like to collect data on, for this example we will use Apple Inc. (NASDAQ: AAPL).
Once you complete the search, you will be on the landing page for Apple, which CIQ calls the “Tear Sheet.” The Tear Sheet has some useful information on it, including a brief overview of what Apple does, as well as market data, such as Beta and shares outstanding, and trading multiples such as Sales/TEV and P/E. Additionally on this landing page, there are the links to open and download Apple’s 10-K, 10-Q, and the tear sheet itself.
CAPITAL IQ BASIC TUTORIAL
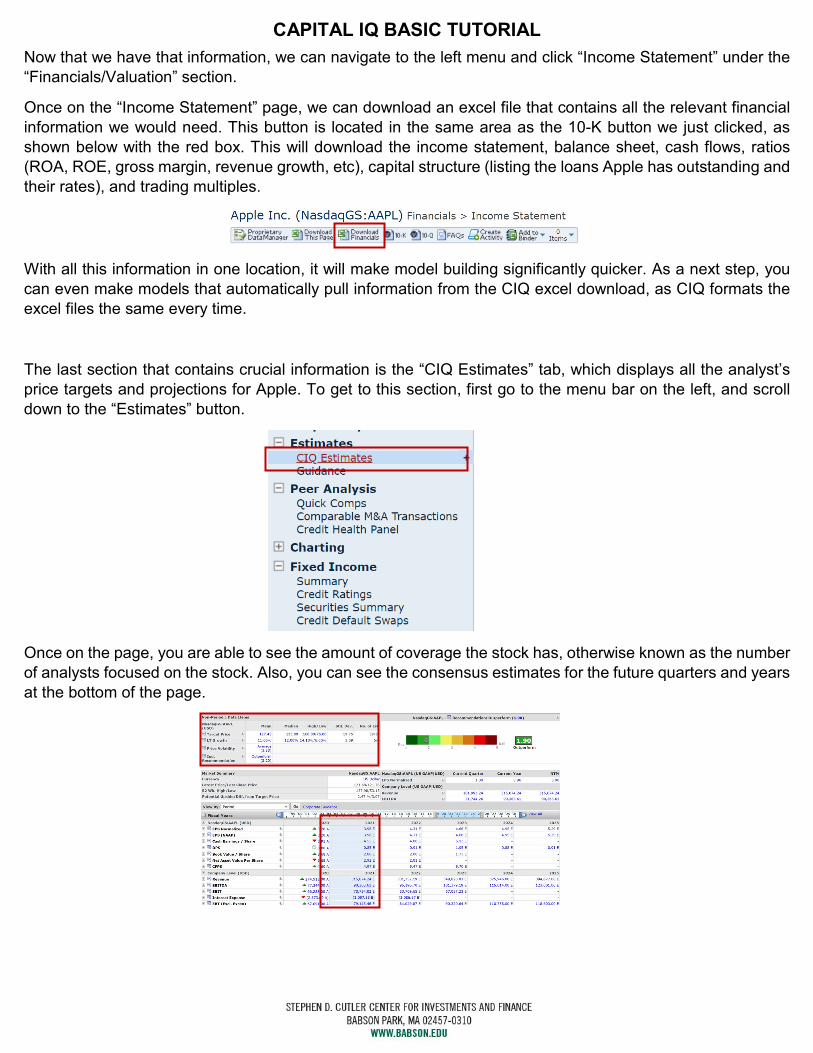
Now that we have that information, we can navigate to the left menu and click “Income Statement” under the “Financials/Valuation” section.
Once on the “Income Statement” page, we can download an excel file that contains all the relevant financial information we would need. This button is located in the same area as the 10-K button we just clicked, as shown below with the red box. This will download the income statement, balance sheet, cash flows, ratios (ROA, ROE, gross margin, revenue growth, etc), capital structure (listing the loans Apple has outstanding and their rates), and trading multiples.
With all this information in one location, it will make model building significantly quicker. As a next step, you can even make models that automatically pull information from the CIQ excel download, as CIQ formats the excel files the same every time.
The last section that contains crucial information is the “CIQ Estimates” tab, which displays all the analyst’s price targets and projections for Apple. To get to this section, first go to the menu bar on the left, and scroll down to the “Estimates” button.
Once on the page, you are able to see the amount of coverage the stock has, otherwise known as the number of analysts focused on the stock. Also, you can see the consensus estimates for the future quarters and years at the bottom of the page.

CAPITAL IQ BASIC TUTORIAL
This can be very useful to reference when building your model as if you are drastically off from consensus, which could alert you to possible issues in your model. While it is acceptable to differ from consensus in your assumptions, if those differences are not justifiable with research, then it is best to go with what analysts expect.
We hope this tutorial was helpful! Please watch the video for a visual walk-through, and check our other tutorials on the additional software offered at the Cutler Center.


