Embed Size (px)
Citation preview

Capsaicin alleviates the imbalance in xenobiotic metabolizingenzymes and tumor markers during experimental lungtumorigenesis
P. Anandakumar Æ S. Kamaraj Æ S. Jagan ÆG. Ramakrishnan Æ C. Naveenkumar Æ S. Asokkumar ÆT. Devaki
Received: 14 January 2009 / Accepted: 28 April 2009 / Published online: 18 May 2009
� Springer Science+Business Media, LLC. 2009
Abstract Lung cancer is currently a leading cause of
death all over the world. Environmental risk factors, par-
ticularly genotoxic chemicals such as polycyclic aromatic
hydrocarbons (PAH), are likely to account for a much
higher mortality. Xenobiotic metabolizing enzymes are
potentially chief determinants in both the susceptibility to
the mutagenic effects of chemical carcinogens and in the
response of tumors to chemotherapy. The well-known
carcinogen benzo(a)pyrene (B(a)P) of PAH family was
given orally (50 mg/kg body weight) to induce lung cancer
in Swiss albino mice. B(a)P induction altered the levels of
cytochromes (P450, b5), activities of phase I biotransfor-
mation enzymes (NADPH-cytochrome P450 reductase,
NADH-cytochrome b5 reductase and epoxide hydrolase),
phase II enzymes (glutathione-S-transferase, UDP-glucu-
ronyl transferase and DT-diaphorase), and the levels of
serum tumor markers. Treatment with capsaicin (CAP)
(10 mg/kg body weight) to the lung carcinoma mice
restored back the activities of phase I and II biotransfor-
mation enzymes and the levels of tumor markers to near
normalcy. The above findings were substantiated by
immunoblotting and immunohistochemical analysis of
cytochrome P450 1A1 (CYP1A1) in the lung tissues. Our
present study unravels that CAP can effectively detoxify
the carcinogens which discloses its anti-carcinogenic effect
during experimental lung cancer.
Keywords Benzo(a)pyrene � Lung cancer � Capsaicin �Phase I and II detoxification enzymes � Tumor markers
Introduction
The most important organs of xenobiotic metabolism are
the liver, which is strategically located to deal with
chemicals entering the body through the alimentary tract,
and the lungs, which have to take care of air-borne pollu-
tants. Most of the chemicals entering the body are not
reactive themselves and require metabolic activation by a
variety of enzymes responsible for drug metabolism to
exert their genotoxicity. Cytochrome P450 (CYP), a phase
I drug-metabolizing enzyme, is one of the major enzymes
mainly involved in the activation of carcinogens [1]. Many
of the CYP genes are known to exist in variant forms that
have different activities. Since many carcinogens require
metabolic activation before binding to DNA, individuals
with an elevated metabolic capacity to activate specific
carcinogens may be at an increased risk of cancer [2].
Phase II reactions are carried out by a class of widely
distributed enzymes that detoxify carcinogens either by
destroying their reactive centers or by conjugating them to
endogenous ligands facilitating their excretion [3]. Thus,
the activation of the carcinogens by phase I enzymes and
its detoxification, and elimination by phase II enzymes are
in absolute balance that exist in cells, and is an important
determinant of whether exposure to such carcinogens will
result in toxicity and neoplasia [2].
Benzo(a)pyrene (B(a)P) is one among the chief con-
stituents of smoke components, and in vivo metabolic
activation of B(a)P by xenobiotic enzymes leads to a highly
reactive metabolite 7,8-diol-9,10-epoxide-benzo(a)pyrene
(BPDE) [4]. BPDE is highly carcinogenic and mutagenic
and is capable of forming DNA adducts as well as chro-
mosomal aberrations. If DNA adducts are not efficiently
removed and repaired prior to DNA replication, mutations,
DNA strand breaks, or other genetic alterations may result,
P. Anandakumar � S. Kamaraj � S. Jagan � G. Ramakrishnan �C. Naveenkumar � S. Asokkumar � T. Devaki (&)
Department of Biochemistry, University of Madras,
Guindy Campus, Chennai 600-025, Tamil Nadu, India
e-mail: [email protected]
123
Mol Cell Biochem (2009) 331:135–143
DOI 10.1007/s11010-009-0151-0

which contribute to the process of carcinogenesis [5]. The
levels of BPDE-induced DNA damage vary widely and
reflect individual variation in susceptibility to a tobacco-
related carcinogen challenge [6]. Therefore, BPDE is a
relevant challenge mutagen to study the susceptibility to
lung carcinogenesis.
Recent epidemiological and experimental studies have
demonstrated the chemopreventive effects of capsaicin
(CAP) against chemical-induced carcinogenesis. These
studies have provided evidence of CAP’s protection against
variety of cancers [7, 8]. CAP is widely consumed
throughout the world and is also known to possess other
beneficial properties including anti-inflammatory, anti-
fungal and analgesic effects [9]. Mechanisms proposed
to explain CAP’s modification of cancer susceptibility
include effects on carcinogen metabolism, formation of
DNA adducts, and free radical scavenging [10–12]. Studies
from our laboratory have also proved the chemoprotective
role of CAP in different dimensions [13–17].
Hence, this study was motivated to prove that CAP may
extend its chemopreventive potential through modulating
phase I and II enzymes and decrease the levels of tumor
markers during B(a)P-induced lung cancer.
Materials and methods
Materials
Benzo(a)pyrene and CAP were purchased from M/s. Sigma
chemicals, St. Louis, USA. All other chemicals were of
analytical grade procured from M/s. SRL Chemicals Pvt.
Ltd., Mumbai.
Animals
Healthy male Swiss albino mice weighing 20–25 g
(8–10 weeks old) obtained from Veterinary College,
Chennai were used throughout the experiment. This study
was ethically approved by the Ministry of Social Justices
and Empowerment, Government of India, and by the Animal
Ethics Committee guidelines of our Institution (IAEC No.
01/024/08). The animals were housed under conditions of
controlled temperature (26 ± 2�C) with 12-h day/night
cycle. They were fed with standard rat/mice pellet diet (M/s.
Hindustan Lever Ltd., Mumbai) under the trade name Amrut
rat/mice feed and were given access to water ad libitum.
Experimental design
Experimental animals were divided into four groups of six
mice each as follows. Group I (control) received olive oil
throughout the course of the experiment. Group II (B(a)P)
was treated with benzo(a)pyrene [50 mg/kg body weight
(b.wt.) dissolved in olive oil] orally twice in a week (1st
day and 4th day) for four successive weeks. Group III
(CAP) received capsaicin (10 mg/kg b.wt. dissolved in
olive oil) intraperitoneally once in a week for 14 weeks to
assess the cytotoxicity (if any) induced by CAP. Group IV
(B(a)P ? CAP) received B(a)P (as in Group II) along with
CAP (10 mg/kg b.wt. dissolved in olive oil) intraperito-
neally. CAP treatment was started 1 week prior to the first
dose of B(a)P administration and continued for 14 weeks.
Dosing regime for the experimental animals was fixed
based on our previous studies [13–17].
All the procedures were performed at temperature
ranging between 0 and 4�C. At the end of the experimental
period, the animals were sacrificed. Liver and lung tissues
were isolated, washed in ice cold 1.15% KCl, and
homogenized. The homogenate was centrifuged at
9,0009g for 20 min, and the resulting supernatant was
further centrifuged at 105,0009g for 1 h at 4�C to obtain
the microsomal fraction. Blood was also collected, and the
serum was separated for other estimations. The following
biochemical estimations were carried out in the supernatant
and in the serum.
Biochemical analysis
Isolation of microsomes: Microsomes were isolated by the
method of Hanioka et al. [18]. The lung and liver were
homogenized with four volumes of medium containing
Tris–KCl buffer in a glass homogenizer. The homogenate
was centrifuged at 9,0009g for 20 min in a refrigerated
centrifuge, and the supernatant was decanted and recen-
trifuged at 105,0009g for 60 min. The microsomal pellet
was recentrifuged in Tris–KCl buffer and resedimented
twice as above. The washed microsomal pellet was finally
resuspended in phosphate buffer (4 mg of protein/ml) and
used for the analysis. The microsomal protein content was
estimated by the method of Lowry et al. [19].
Microsomal biotransformation enzymes
Phase I drug metabolizing enzymes
Estimation of cytochrome P450
Cytochrome P450 was estimated by the method of Omura
and Sato [20]. Microsomes suspended in phosphate buffer
(4 mg/ml) were reduced by a few milligrams of solid
sodium dithionate. Then, 1 ml of water saturated with
carbon monoxide was added. The absorbance of the sam-
ples was scanned at 400–500 nm. The level of cytochrome
P450 was expressed as nmoles/mg protein.
136 Mol Cell Biochem (2009) 331:135–143
123

Estimation of cytochrome b5
The amount of cytochrome b5 was measured by the
method of Omura and Sato [20]. To the microsomal sus-
pension, containing 4 mg of protein/ml in phosphate buf-
fer, 1 ml of NADH was added. The absorbance spectrum
between 400 and 500 nm was read against the blank con-
taining microsomal suspension alone. The level of cyto-
chrome b5 was calculated using the molar extinction
coefficient of 185 mM/cm between 424 and 409 nm and
was expressed as nmoles/mg protein.
Assay of NADPH-cytochrome P450 reductase
The activity of NADPH-cytochrome P450 reductase was
assayed by the method of Phillips and Langdon [21]. The
assay mixture containing 2.5 ml of buffer, 0.2 ml of
potassium cyanide, and 0.1 ml of cytochrome c was mixed
gently. After 3 min, 0.1 ml of NADPH was added and the
change in optical density was recorded at 30-s intervals for
3 min at 550 nm. The activity of NADPH-cytochrome
P450 reductase was expressed as nanomoles of cytochrome
c oxidized/min/mg protein.
Assay of NADH-cytochrome b5 reductase
NADH-cytochrome b5 reductase activity was determined
according to the method of Strittmater and Velick [22]. To
2 ml of buffer mixture, 0.1 ml of potassium cyanide and
0.1 ml of microsomal suspension, and 0.1 ml of NADH
were added, and the change in optical density at 430 nm
for 3 min at 15-s interval was taken. The specific activity
was expressed as nanomoles of ferricyanide reduced/min/
mg protein.
Phase II enzymes
Assay of glutathione-S-transferase
The activity of glutathione-S-transferase (GST) was
assayed by the method of Habig et al. [23]. To 1 ml of
tissue homogenate, 1 ml of phosphate buffer, 1.7 ml of
water and 0.1 ml of CDNB was added. After incubation at
37�C for 15 min, 0.1 ml of GSH was added, and the
change in optical density was read at 340 nm. The GST
activity was expressed as micromoles of CDNB conju-
gated/min/mg of protein.
Assay of UDP glucuronyl transferase
The UDP glucuronyl transferase (UDP-GT) was assayed
by the method of Bock et al. [24] with slight modification.
To 0.5 ml of Tris–HCl added 0.2 ml of TritonX-100,
0.05 ml of MgCl2, 0.05 ml of p-nitrophenol, and 0.18 ml
of water was added and then finally 0.1 ml of sample was
added and incubated at 37�C for 20 min. A quantity of
0.1 ml of UDP-glucuronic acid was added and the reaction
was arrested at different time intervals of 0, 10, and 20 min
by using TCA. The precipitate was centrifuged, and the
supernatant of 1 ml was taken. A quantity of 0.25 ml of
NaOH was added and read at 450 nm. The activity of
UDP-GT was expressed as nanomoles of p-nitrophenol
liberated/min/mg protein.
Assay of DT-diaphorase
Activity of DT-diaphorase (DTD) was assayed according to
the method of Ernest [25, 26]. To 2.5 ml of Tris–HCl buffer
(0.05 M), 0.1 ml of NADH (0.3 mM), 0.5 ml of dichloro-
phenol indophenol (0.04 mM), and 0.5 ml of BSA (0.07%)
were added and mixed well. A quantity of 0.1 ml of the
sample was added just before reading at 600 nm. Readings
were taken at 30-s interval for 2 min. Activity of DTD is
expressed as cytochrome C reduced/min/mg of protein.
Analysis of carcinoembryonic antigen and neuron
specific enolase
Carcinoembryonic antigen (CEA) and neuron specific
enolase (NSE) were measured in blood serum by chemi-
luminescent immunoassay (fully automated ADVIA cen-
taur, Bayer USA Chemiluminescense system).
Western blot analysis
Immunoblotting was performed according to the method of
Ramakrishnan et al. [27]. Approximately, 50 lg of the total
cell lysate was mixed with equal volume of 29 sample
buffer, boiled for 5 min at 95�C, cooled, loaded on each
lane of 10% polyacrylamide gel, and separated by sodium
dodecyl sulfate–polyacrylamide gel electrophoresis (SDS–
PAGE) at room temperature. The resolved proteins were
electrophoretically transferred to Nitrocellulose mem-
branes. The membranes were then blocked in 5% non-fat
milk in Tris-buffered saline with 0.1% Tween 20 for 1 h at
room temperature and probed with the following primary
antibodies: Cytochrome P450 1A1 (CYP1A1) mouse
monoclonal antibody (Dr. John J. Stegeman, WHOI,
Massachusetts and Dr. Harry. V. Gelboin, NCI, Maryland)
at a concentration of 3 lg/ml and b-actin (Sigma) mouse
monoclonal antibody at a dilution of 1:2,000 overnight at
4�C. The blots were then extensively washed with Tris-
buffered saline with 0.1% Tween 20, and then incubated
with anti-mouse and anti-mouse HRP-labeled secondary
antibody (Genei, Bangalore, India) at a dilution of 1:2,000
for 1 h at room temperature. After extensive washes in
Mol Cell Biochem (2009) 331:135–143 137
123

TBS-T, the bands were visualized by treating the mem-
branes with 3,30-diaminobenzidine tetrahydrochloride
(SRL, Mumbai, India). The membranes were photographed
and quantitated with image analysis software, imagej, NIH,
USA. Densitometry data presented in bar graphs are ‘‘fold
change’’ as compared with control.
Immunohistochemistry of cytochrome P450 1A1
The method of Ramakrishnan et al. [27] was followed for
immunohistochemistry. Tissue sections were deparaffi-
nized in two changes of xylene at 60�C for 20 min each
and hydrated through a graded series of alcohol; the slides
were incubated in a citrate buffer (pH 6.0) for three cycles
of 5 min each in a microwave overnight for antigen
retrieval. The sections were then allowed to cool to room
temperature and then rinsed with 19 Tris buffered saline
(TBS), and treated with 0.3% H2O2 in methanol for 10 min
to block endogeneous peroxidase activity. Non-specific
binding was blocked with 3% BSA in room temperature
for 1 h. The sections were then incubated with CYP1A1
(Dr. John J. Stegeman, WHOI, Massachusetts and
Dr. Harry V. Gelboin, NCI, Maryland) mouse monoclonal
antibody at a concentration of 0.3 lg/ml in 1% BSA in
TBS for two 1-h periods with a total of 0.3 ml per slide
added as 0.15 ml at time 0 and 60 min at 4�C overnight.
The slides were washed with TBS and then incubated
with anti-mouse HRP labeled secondary antibody (Genei,
Bangalore, India), at a dilution 1:500 for 1 h in room
temperature. The peroxidase activity was visualized by
treating the slides with 3,30-diaminobenzidine tetrahydro-
chloride (SRL, Mumbai, India); the slides were counter-
stained with Meyer’s hamatoxylin. Negative controls were
incubated with TBS instead of primary antibodies. Quan-
titative analysis was made in a blinded manner under a
light microscope. Each section was examined at high
magnification (409), and the ratio of positive area to lung
tissue area was calculated. The result was regarded as the
mean of five different fields on each section.
Data analysis
All data were expressed as mean ± SD for six mice. The
results were computed statistically (SPSS Software Pack-
age) using one-way ANOVA. Post-hoc testing was per-
formed for inter comparisons using the LSD. P \ 0.05 was
considered significant.
Results
Effect of CAP on cytochrome P450 and cytochrome b5
Table 1 represents the level of lung and liver microsomal
Cyt P450 and Cyt b5 in control and experimental group of
animals. There was a significant (P \ 0.05) increase in
lung and liver Cyt P450 and Cyt b5 levels in cancer-
bearing animals (Group II) when compared to control
animals of Group I. Treatment with CAP markedly
(P \ 0.05) decreased Cyt P450 and Cyt b5 levels in Group
IV animals when compared to lung cancer animals of
Group II.
Effect of capsaicin on phase I enzymes
Activities of lung and liver microsomal phase I drug-
metabolizing enzymes are represented in Table 2. Highly
significant (P \ 0.05) increase in the activities of NADPH
Cyt P450 reductase, NADH Cyt b5 reductase, and epoxide
hydrolase was noted in lung cancer-induced animals
(Group II) when compared to control animals (Group I).
The enzyme activities were significantly (P \ 0.05)
reversed to near normalcy on treatment with CAP in Group
IV animals when compared to lung cancer-bearing animals
(Group II).
Effect of capsaicin on phase II enzymes
Table 3 depicts the activities of phase II drug-metabolizing
enzymes in the lung and liver of control and experimental
Table 1 Levels of Cyt P450 and Cyt b5 in lung and liver microsomes of control and experimental animals
Parameters Group I (control) Group II (B(a)P) Group III (CAP) Group IV (B(a)P ? CAP)
Lung
Cyt P450 0.62 ± 0.06 0.99 ± 0.09a 0.63 ± 0.06 0.75 ± 0.07b
Cyt b5 0.47 ± 0.04 0.87 ± 0.07a 0.48 ± 0.04 0.55 ± 0.05b
Liver
Cyt P450 0.79 ± 0.07 1.21 ± 0.11a 0.78 ± 0.07 0. 88 ± 0.08b
Cyt b5 0.59 ± 0.05 0.94 ± 0.08a 0.58 ± 0.05 0.67 ± 0.06b
Values represent the mean ± SD for six mice. Statistical significance at P \ 0.05, as compared with a Group I, b Group II. Units: Cyt b5 and Cyt
P450—nmol/mg protein
138 Mol Cell Biochem (2009) 331:135–143
123
of group of animals. Significant (P \ 0.05) decrease in the
activities of GST, UDP-GT, and DTD was noticed in lung
cancer-bearing animals (Group II) when compared to
Group I control animals. Supplementation with CAP sig-
nificantly (P \ 0.05) restored the activities of these
enzymes to normalcy in Group IV animals when compared
to Group II lung cancer animals.
Effect of capsaicin on tumor markers
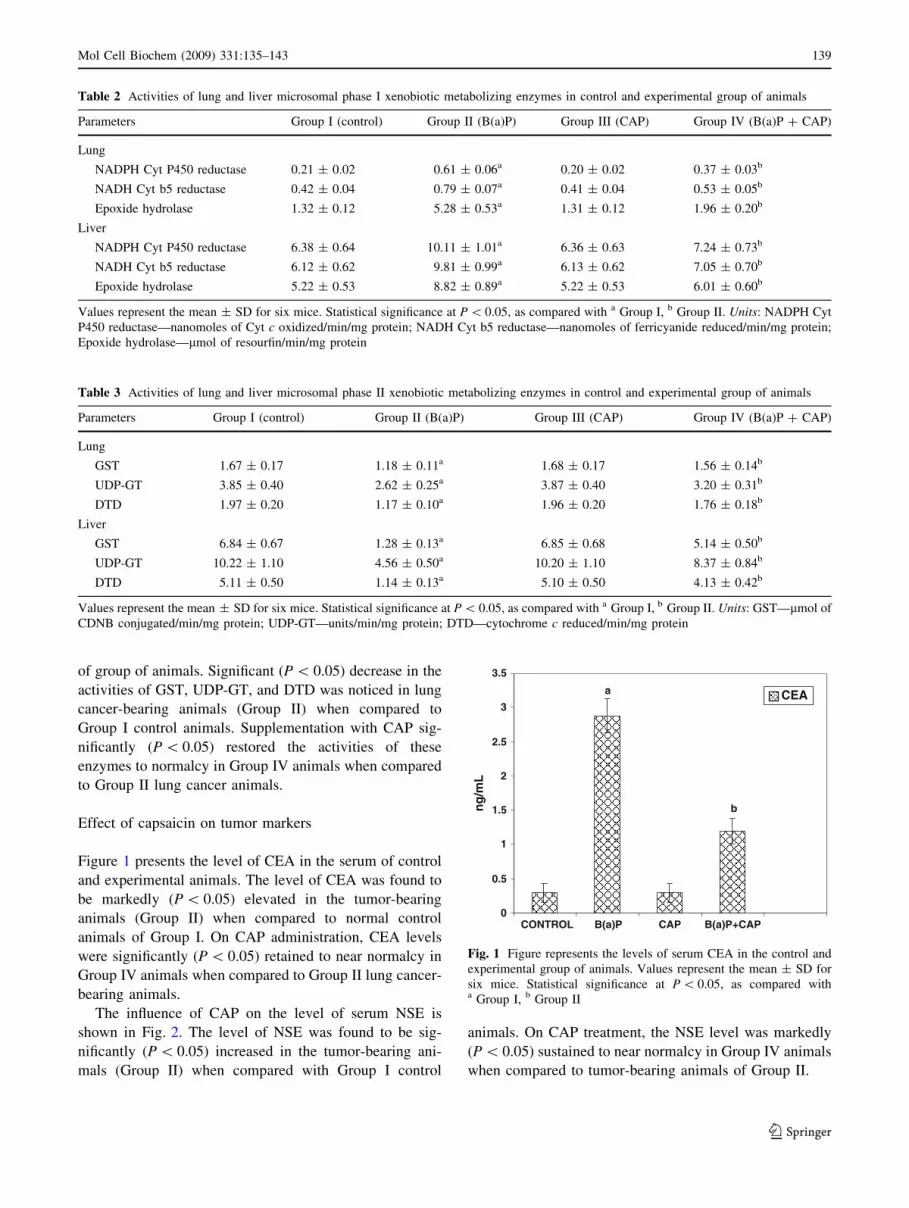
Figure 1 presents the level of CEA in the serum of control
and experimental animals. The level of CEA was found to
be markedly (P \ 0.05) elevated in the tumor-bearing
animals (Group II) when compared to normal control
animals of Group I. On CAP administration, CEA levels
were significantly (P \ 0.05) retained to near normalcy in
Group IV animals when compared to Group II lung cancer-
bearing animals.
The influence of CAP on the level of serum NSE is
shown in Fig. 2. The level of NSE was found to be sig-
nificantly (P \ 0.05) increased in the tumor-bearing ani-
mals (Group II) when compared with Group I control
animals. On CAP treatment, the NSE level was markedly
(P \ 0.05) sustained to near normalcy in Group IV animals
when compared to tumor-bearing animals of Group II.
Table 3 Activities of lung and liver microsomal phase II xenobiotic metabolizing enzymes in control and experimental group of animals
Parameters Group I (control) Group II (B(a)P) Group III (CAP) Group IV (B(a)P ? CAP)
Lung
GST 1.67 ± 0.17 1.18 ± 0.11a 1.68 ± 0.17 1.56 ± 0.14b
UDP-GT 3.85 ± 0.40 2.62 ± 0.25a 3.87 ± 0.40 3.20 ± 0.31b
DTD 1.97 ± 0.20 1.17 ± 0.10a 1.96 ± 0.20 1.76 ± 0.18b
Liver
GST 6.84 ± 0.67 1.28 ± 0.13a 6.85 ± 0.68 5.14 ± 0.50b
UDP-GT 10.22 ± 1.10 4.56 ± 0.50a 10.20 ± 1.10 8.37 ± 0.84b
DTD 5.11 ± 0.50 1.14 ± 0.13a 5.10 ± 0.50 4.13 ± 0.42b
Values represent the mean ± SD for six mice. Statistical significance at P \ 0.05, as compared with a Group I, b Group II. Units: GST—lmol of
CDNB conjugated/min/mg protein; UDP-GT—units/min/mg protein; DTD—cytochrome c reduced/min/mg protein
Table 2 Activities of lung and liver microsomal phase I xenobiotic metabolizing enzymes in control and experimental group of animals
Parameters Group I (control) Group II (B(a)P) Group III (CAP) Group IV (B(a)P ? CAP)
Lung
NADPH Cyt P450 reductase 0.21 ± 0.02 0.61 ± 0.06a 0.20 ± 0.02 0.37 ± 0.03b
NADH Cyt b5 reductase 0.42 ± 0.04 0.79 ± 0.07a 0.41 ± 0.04 0.53 ± 0.05b
Epoxide hydrolase 1.32 ± 0.12 5.28 ± 0.53a 1.31 ± 0.12 1.96 ± 0.20b
Liver
NADPH Cyt P450 reductase 6.38 ± 0.64 10.11 ± 1.01a 6.36 ± 0.63 7.24 ± 0.73b
NADH Cyt b5 reductase 6.12 ± 0.62 9.81 ± 0.99a 6.13 ± 0.62 7.05 ± 0.70b
Epoxide hydrolase 5.22 ± 0.53 8.82 ± 0.89a 5.22 ± 0.53 6.01 ± 0.60b
Values represent the mean ± SD for six mice. Statistical significance at P \ 0.05, as compared with a Group I, b Group II. Units: NADPH Cyt
P450 reductase—nanomoles of Cyt c oxidized/min/mg protein; NADH Cyt b5 reductase—nanomoles of ferricyanide reduced/min/mg protein;
Epoxide hydrolase—lmol of resourfin/min/mg protein
0
0.5
1
1.5
2
2.5
3
3.5
CONTROL B(a)P CAP B(a)P+CAP
ng
/mL
CEA a
b
Fig. 1 Figure represents the levels of serum CEA in the control and
experimental group of animals. Values represent the mean ± SD for
six mice. Statistical significance at P \ 0.05, as compared witha Group I, b Group II
Mol Cell Biochem (2009) 331:135–143 139
123

Effect of capsaicin on the protein expression
of cytochrome P450 1A1
Figure 3 represents the immunoblot analysis to confirm the
expression of CYP1A1 in all the defined experimental
animals. Their expression under tightly controlled physio-
logical situation is very optimal (lane 1) in control tissues.
CYP1A1 expression was very high in B(a)P-induced lung
cancer animals (lane 2). B(a)P along with CAP treatment
group caused a significant reduction in CYP1A1 expression
when compared to cancerous mice (lane 4), whereas CAP-
alone-treated mice showed expression similar to control
(lane 3).
Figure 4 shows the immunoreactive indices for
CYP1A1, which were found to be significantly upregulated
in lung cancer-bearing Group II animals (Fig. 4b) com-
pared to normal control animals (Fig. 4a) and CAP-alone-
treated animals (Fig. 4c). B(a)P along with CAP treatment
group markedly downregulated CYP1A1 expression in
Group IV animals (Fig. 4d).
Discussion
It is widely accepted that metabolic activation of xenobi-
otics by phase I enzymes is required for their cytotoxic,
mutagenic, and carcinogenic activities [28]. Studies dem-
onstrated that B(a)P after sequential metabolic activation
principally by phase I enzyme, CYP1A1 generates BPDE
[29]. BPDE is believed to be the ultimate carcinogenic
metabolite of B(a)P that leads to the formation of DNA
adducts that results in cancer. These findings were in
concordance with our present study, as we have noticed an
increase in the expression of CYP1A1 together with ele-
vations in the levels of Cyt P450, Cyt b5, and in the
activities of phase I xenobiotic metabolizing enzymes,
namely, NADPH Cyt P450 reductase, NADH Cyt b5
reductase, and epoxide hydrolase in B(a)P administered
lung cancer-bearing animals.
Substantial evidence implicates that CAP modulates the
microsomal cytochrome P450 enzymes 3A1, 2A2, 2B1,
2B2, 2C6, and 2C11 and thereby affects the metabolism of
carcinogens [10]. Moreover, CAP was found to suppress
the activity of rat epidermal aryl hydrocarbon hydroxylase
that is linked to the cytochrome P450 1A isoform respon-
sible for the metabolism of B(a)P and other PAH [30].
Earlier studies on CAP established that this alkaloid com-
pound was found to suppress the metabolism and covalent
DNA binding of B(a)P in human and mouse keratinocytes
[31]. In addition, in this study, CAP treatment effectively
reduced the activities of phase I xenobiotic metabolizing
enzymes suggesting its anti-mutagenic/anti-carcinogenic
activity against PAH, which was analogous with the pre-
vious findings.
Phase II enzymes such as GST, UDP-GT and DTD are
considered to be a major mechanism of protection against
chemical stress and initiation of carcinogenesis [3].
Mounting evidence has suggested a relevant mechanism
between the induction of phase II detoxification enzymes
and cancer chemoprevention [32]. GSTs are a family
of enzymes that catalyzes the conjugation of reactive
0
2
4
6
8
10
12
14
16
18
20
CONTROL B(a)P CAP B(a)P+CAP
ng
/mL
NSE a
b
Fig. 2 Figure depicts the serum NSE levels in the control and
experimental group of animals. Values represent the mean ± SD for
six mice. Statistical significance at P \ 0.05, as compared witha Group I, b Group II
Fig. 3 Figure presents the immunoblot analysis of CYP1A1 and
b-actin (internal control) in the lung of control and experimental
group of animals. a Lanes 1–4 represent groups 1–4 of control and
experimental animals, respectively. b Densitometric analysis of
CYP1A1 immuno blotting. Densitometry data was presented as ‘‘fold
change’’ as compared with control. Values represent the mean ± SD
for six mice. Statistical significance at P \ 0.05, as compared witha Group I, b Group II
140 Mol Cell Biochem (2009) 331:135–143
123

chemicals with GSH (reduced glutathione) and plays a
major role in protecting cells. After generating conjugated
GSH, these are subsequently eliminated via a GSH con-
jugate-recognizing transport [33]. Many naturally occur-
ring chemopreventive agents, including CAP, have been
reported to convert the DNA-damaging entities into
excretable metabolites through induction of GST [34].
Glucuronidation, catalyzed by UDP-GT family of
enzymes, is a major metabolic pathway of endogenous
steroids, bile acids, drugs, and carcinogens [35]. Several
phytochemicals are known to cause elevation in the
activities of GST through the induction of the microsomal
detoxification enzyme UDP-GT gene complex [36]. DTD
is a flavoprotein that catalyses two-electron reduction of
quinones, quinone imines, and nitrogen oxides. This reac-
tion prevents the formation of semiquinones by one elec-
tron reduction and, in turn, the generation of free radicals
from the autooxidation of semiquinones. Reduction of
quinines and nitrogen oxide might also make them avail-
able for conjugation with UDP-glucuronic acid, facilitating
their excretion. Hence, DTD acts as an early cellular
defense against tumorigenesis [37]. In this study, CAP
supplementation augmented the activities of all these three
important phase II enzymes in the lung and liver from its
basal constituent levels divulging its chemopreventive
action.
Tumor markers are substances usually identifiable in the
blood that indicates the presence or extent of tumor in the
body. Cancer chemoprevention and therapy depends on
the investigation of these tumor markers. CEA is an
oncofetal glycoprotein that is used clinically as a tumor
marker to detect the recurrence of many types of tumors
[38]. CEA is one of the most popular tumor markers
measured in lung cancer, and its various clinical applica-
tions have been reported [39]. CEA is detected in abnor-
mally high levels in metastatic carcinomas of non-digestive
organs, such as breast, lung, prostate, and ovary [40]. The
other protein that is most widely used as neuroendocrine
serum marker in clinical practice is the cc-isomer of the
ubiquitous enzyme enolase referred to as NSE [41]. This
serum marker has been extensively evaluated regarding its
clinical applicability. The use of NSE as an indicator of
disease status during chemotherapy and follow-up has been
evaluated in independent studies; decrease and increase of
NSE level are well correlated with tumor response during
chemotherapy [42]. Moreover, serum NSE measurements
may be of value in assessment of tumor burden in lung
cancer at presentation and a helpful parameter during
therapy [43]. The observed rise in serum CEA and NSE
levels in B(a)P administered animals could be associated
with production rates of tumor, its location and stage, size,
differentiation, and vascularity. CAP treatment lowered the
levels of CEA and NSE, which is a good prognosis for
tumor regression, and inhibition of metastasis.
In conclusion, CAP inhibits phase I enzymes that bio-
activates the carcinogen B(a)P and elevates the activity of
phase II enzymes which consecutively enhances the
detoxification process thereby aids in the elimination of
carcinogen. Furthermore, reduced levels of serum tumor
markers in the CAP-treated group reflected the anti-cancer
property of CAP. Hence, this study demonstrates that the
biotransformation enzyme-modifying capability of CAP
Fig. 4 Figure shows the
immunohistochemical staining
of CYP1A1 in the lung of
control and experimental group
of animals (409). Plates a–drepresent the lung sections of
groups 1–4 of experimental
animals, respectively. Arrowsindicate immunostained areas
Mol Cell Biochem (2009) 331:135–143 141
123

might play an important role in its anti-carcinogenic
potency which strongly suggests a possible cancer che-
mopreventive potential for CAP against B(a)P-induced
experimental lung cancer.
Acknowledgments First author P. Anandakumar wishes to thank
University Grants Commission, New Delhi, India for the financial
assistance in the form of Junior Research fellowship. The authors
S. Kamaraj and S. Jagan wishes to thank ICMR, CSIR, New Delhi,
India, respectively, for the financial assistance in the form of Senior
Research fellowship. The authors are thankful to Dr. John J. Steg-
eman, Woods Hole Oceanographic Institution, Massachusetts, and Dr.
Harry V. Gelboin, National Cancer Institute, Maryland for their kind
gift of CYP1A1 primary mouse monoclonal antibody.
References
1. Ding X, Kaminsky LS (2003) Human extrahepatic cytochromes
P450: function in xenobiotic metabolism and tissue-selective
chemical toxicity in the respiratory and gastrointestinal tracts.
Annu Rev Pharmacol Toxicol 43:149–173. doi:10.1146/annurev.
pharmtox.43.100901.140251
2. Srinivasan P, Suchalatha S, Babu PV, Devi RS, Narayan S, Sabitha
KE, Shyamala Devi CS (2008) Chemopreventive and therapeutic
modulation of green tea polyphenols on drug metabolizing
enzymes in 4-nitroquinoline 1-oxide induced oral cancer. Chem
Biol Interact 172:224–234. doi:10.1016/j.cbi.2008.01.010
3. Selvendiran K, Banu SM, Sakthisekaran D (2005) Oral supple-
mentation of piperine leads to altered phase II enzymes and
reduced DNA damage and DNA–protein cross links in ben-
zo(a)pyrene induced experimental lung carcinogenesis. Mol Cell
Biochem 268:141–147. doi:10.1007/s11010-005-3702-z
4. Graslund A, Jernstrom B (1989) DNA–carcinogen interaction:
covalent DNA-adducts of benzo(a)pyrene 7,8-dihydrodiol 9,10-
epoxides studied by biochemical and biophysical techniques. Q
Rev Biophys 22:1–37
5. Shinozaki R, Inoue S, Choi KS (1998) Flow cytometric mea-
surement of benzo[a]pyrene-diol-epoxide-DNA adducts in nor-
mal human peripheral lymphocytes and cultured human lung
cancer cells. Cytometry 31:300–306. doi:10.1002/(SICI)1097-
0320(19980401)31:4\300::AID-CYTO10[3.0.CO;2-U
6. Zhang H, Spitz MR, Tomlinson GE, Schabath MB, Mina JD, Wu
X (2002) Modification of lung cancer susceptibility by green tea
extract as measured by the comet assay. Cancer Detect Prev
26:411–418. doi:10.1016/S0361-090X(02)00127-7
7. Miller CH, Zhang Z, Hamilton SM, Teel RW (1993) Effects of
capsaicin on liver microsomal metabolism of the tobacco-specific
nitrosamine NNK. Cancer Lett 75:45–52. doi:10.1016/0304-3835
(93)90206-O
8. Surh YJ, Lee SS (1995) Capsaicin, a double-edged sword: tox-
icity, metabolism, and chemopreventive potential. Life Sci
56:1845–1855. doi:10.1016/0024-3205(95)00159-4
9. Chowdhury B, Mukhopadhyay S, Bhattacharayay D, De AK
(1996) Capsaicin, a unique anti-oxidant, anti-inflammatory,
analgesic compound with antifungal activity against dermato-
phytes. Med Sci Res 24:669–670
10. Teel RW (1997) Effects of capsaicin on rat liver S9-mediated
metabolism and DNA binding of aflatoxin. Nutr Cancer 15:27–32
11. Tanaka T, Kohno H, Sakata K, Yamada Y, Hirose Y, Sugie S, Mori
H (2002) Modifying effects of dietary capsaicin and rotenone on 4-
nitroquinoline 1-oxide-induced rat tongue carcinogenesis. Carci-
nogenesis 23:1361–1367. doi:10.1093/carcin/23.8.1361
12. Kogure K, Goto S, Nishimura M, Yasumoto M, Abe K, Ohiwa C,
Sassa H, Kusumi T, Terada H (2002) Mechanism of potent an-
tiperoxidative effect of capsaicin. Biochim Biophys Acta 1573:
84–92
13. Anandakumar P, Jagan S, Kamaraj S, Ramakrishnan G, Clara JB,
Pathitha D, Kavitha T, Devaki T (2009) Ameliorating effect of
capsaicin on alternations in lipid metabolism during mice lung
carcinoma. Arch Pharm Res 32:229–234. doi:10.1007/s12272-
009-1140-2
14. Anandakumar P, Kamaraj S, Jagan S, Ramakrishnan G, Devaki T
(2009) Lysosomal abnormalities during experimental lung car-
cinogenesis—defensive role of capsaicin. Fundam Clin Pharma-
col 23:97–103. doi:10.1111/j.1472-8206.2008.00637.x
15. Anandakumar P, Jagan S, Kamaraj S, Ramakrishnan G,
Vinodhkumar R, Devaki T (2008) Beneficial influence of cap-
saicin on lipid peroxidation, membrane-bound enzymes and
glycoprotein profile during experimental lung carcinogenesis.
J Pharm Pharmacol 60:803–808. doi:10.1211/jpp.60.6.0017
16. Anandakumar P, Kamaraj S, Jagan S, Ramakrishnan G, Vin-
odhkumar R, Devaki T (2008) Capsaicin modulates pulmonary
antioxidant defense system during benzo(a)pyrene-induced lung
cancer in Swiss albino mice. Phytother Res 22:529–533. doi:
10.1002/ptr.2393
17. Anandakumar P, Kamaraj S, Jagan S, Ramakrishnan G, Vin-
odhkumar R, Devaki T (2008) Stabilization of pulmonary mito-
chondrial enzyme system by capsaicin during benzo(a)pyrene
induced experimental lung cancer. Biomed Pharmacother
62:390–394. doi:10.1016/j.biopha.2007.09.005
18. Hanioka N, Jinno H, Nishimura T, Ando M (1997) Changes in
cytochrome P450 enzymes by 1,1-dichloroethylene in rat liver
and kidney. Arch Toxicol 72:9–16. doi:10.1007/s002040050462
19. Lowry OH, Rosebrough NH, Farr AL, Randall RI (1951) Protein
measurement with the folin-phenol reagent. J Biol Chem 193:
265–275
20. Omura T, Sato R (1964) The carbon monoxide-binding pigment
of liver microsomes. II. Solubilization, purification, and proper-
ties. J Biol Chem 239:2379–2385
21. Phillips AH, Langdon RG (1962) Hepatic triphosphopyridine
nucleotide-cytochrome c reductase: isolation, characterization,
and kinetic studies. J Biol Chem 237:2652–2660
22. Strittmatter P, Velick SF (1956) A microsomal cytochrome
reductase specific for diphosphopyridine nucleotide. J Biol Chem
221:277–286
23. Habig WH, Pabst MJ, Jakoby WB (1974) Glutathione-S-trans-
ferase. The first enzymatic step in mercapturic acid formation.
J Biol Chem 249:7130–7139
24. Bock KW, Burchell B, Ditton GJ et al (1983) UDP-glucuronosyl
transferase activities: guidelines for consistent interim terminol-
ogy and assay condition. Biochem Pharmacol 32:953–955. doi:
10.1016/0006-2952(83)90610-X
25. Ernest L, Danielson L, Ljunggren M (1982) DT-diaphorase-
purification from the soluble fraction of rat liver cytoplasm.
Biochem Biophys Acta 58:171–188
26. Talalay P, Benson AM (1982) Elevation of quinone reductase
activity by anticarcinogenic antioxidants. Adv Enzyme Regul
20:287–300. doi:10.1016/0065-2571(82)90021-8
27. Ramakrishnan G, Augustine TA, Jagan S, Vinodhkumar R,
Devaki T (2007) Effect of silymarin on N-nitrosodiethylamine
induced hepatocarcinogenesis in rats. Exp Oncol 29:39–44
28. Selvendiran K, Thirunavukkarasu C, Singh JPC, Padmavathi R,
Sakthisekaran D (2005) Chemopreventive effect of piperine on
mitochondrial TCA cycle and phase-I and glutathione-metabo-
lizing enzymes in benzo(a)pyrene induced lung carcinogenesis in
Swiss albino mice. Mol Cell Biochem 271:101–106. doi:10.1007/
s11010-005-5615-2
142 Mol Cell Biochem (2009) 331:135–143
123

29. Szeliga J, Dipple A (1998) DNA adduct formation by polycyclic
aromatic hydrocarbon dihydrodiol epoxides. Chem Res Toxicol
11:1–11. doi:10.1021/tx970142f
30. De AK, Agarwal K, Mukherjee A, Sengupta D (1995) Inhibition
by capsaicin against cyclophosphamide-induced clastogenicity
and DNA damage in mice. Mutat Res 335:253–258
31. Modly CE, Das M, Don PS, Marcelo CL, Mukhtar H, Bickers DR
(1986) Capsaicin as an in vitro inhibitor of benzo(a)pyrene
metabolism and its DNA binding in human and murine kerati-
nocytes. Drug Metab Dispos 14:413–416
32. Premalatha B, Sachdanandam P (2000) Modulating role of
Semecarpus anacardium L. nut milk extract on Aflatoxin B1
biotransformation. Pharmacol Res 41:19–24. doi:10.1006/phrs.
1999.0544
33. Song LL, Kosmeder JW, Lee SK, Gerhauser C, Lantvit D, Moon
RC, Moriarty RM, Pezzuto JM (1999) Cancer chemopreventive
activity mediated by 40-bromoflavone, a potent inducer of phase
II detoxification enzymes. Cancer Res 59(3):578–585
34. Manson MM, Ball HW, Barrett MC, Clark HL, Judah DJ, Wil-
liamson G, Neal GE (1997) Mechanism of action of dietary
chemoprotective agents in rat liver: induction of phase I and II
drug metabolizing enzymes and aflatoxin B1 metabolism. Car-
cinogenesis 18:1729–1738. doi:10.1093/carcin/18.9.1729
35. King C, Tang W, Ngui J, Tephly T, Braun M (2001) Charac-
terization of rat and human UDP-glucuronosyltransferases
responsible for the in vitro glucuronidation of diclofenac. Toxicol
Sci 61(1):49–53
36. Moon YJ, Wang X, Morris ME (2006) Dietary flavonoids: effects
on xenobiotic and carcinogen metabolism. Toxicol In Vitro
20:187–210. doi:10.1016/j.tiv.2005.06.048
37. Begleiter A, Leith MK, Curphey TJ, Doherty GP (1997) Induc-
tion of DT diaphorase in cancer chemoprevention and chemo-
therapy. Oncol Res 9:371–382
38. Sivaramakrishnan V, Shilpa PNM, Praveen Kumar VR, Niranjali
Devaraj S (2008) Attenuation of N-nitrosodiethylamine-induced
hepatocellular carcinogenesis by a novel flavonol-Morin. Chem
Biol Interact 171:79–88. doi:10.1016/j.cbi.2007.09.003
39. Sakao Y, Tomimitsu S, Takeda Y, Natsuaki M, Itoh T (2004)
Carcinoembryonic antigen as a predictive factor for postoperative
tumor relapse in early-stage lung adenocarcinoma. Eur J Car-
diothorac Surg 25:520–522. doi:10.1016/j.ejcts.2004.01.029
40. Devipriya S, Ganapathy V, Shyamaladevi CS (2006) Suppression
of tumor growth and invasion in 9,10 dimethyl benz(a)anthracene
induced mammary carcinoma by the plant bioflavonoid quercetin.
Chem Biol Interact 162:106–113. doi:10.1016/j.cbi.2006.04.002
41. Pujol JL, Boher JM, Grenier J, Quantin X (2001) Cyfra 21-1,
neuron specific enolase and prognosis of non-small cell lung
cancer: prospective study in 621 patients. Lung Cancer 31:221–
231. doi:10.1016/S0169-5002(00)00186-0
42. Quoix E, Purohit A, Faller-Beau M, Moreau L, Oster JP, Pauli G
(2000) Comparative prognostic value of lactate dehydrogenase
and neuron-specific enolase in small-cell lung cancer patients
treated with platinum-based chemotherapy. Lung Cancer 30:127–
134. doi:10.1016/S0169-5002(00)00131-8
43. Lamy P, Grenier J, Kramar A, Pujol JL (2000) Pro-gastrin-
releasing peptide, neuron specific enolase and chromogranin A as
serum markers of small cell lung cancer. Lung Cancer 29:197–
203. doi:10.1016/S0169-5002(00)00113-6
Mol Cell Biochem (2009) 331:135–143 143
123


