Embed Size (px)
Citation preview

www.elsevier.com/locate/agrformet
Agricultural and Forest Meteorology 131 (2005) 97–124
Carbon balance of coniferous forests growing in
contrasting climates: Model-based analysis
Belinda E. Medlyn a,*, Paul Berbigier b, Robert Clement c, Achim Grelle d,Denis Loustau e, Sune Linder f, Lisa Wingate c, Paul G. Jarvis c,
Bjarni D. Sigurdsson g, Ross E. McMurtrie a
a School of Biological, Earth and Environmental Sciences, University of NSW, Sydney 2052, Australiab INRA-EPHYSE, BP 81, 33883 Villenave d’Ornon Cedex, France
c School of GeoSciences, University of Edinburgh, King’s Buildings, Mayfield Road, Edinburgh EH9 3JG, UKd Swedish University of Agricultural Sciences, Department of Ecology and Environmental Research,
PO Box 7072, SE-750 07 Uppsala, Swedene INRA-EPHYSE, 69 route d’Arcachon, 33612 CESTAS Cedex, France
f Swedish University of Agricultural Sciences, Southern Swedish Forest Research Centre, PO Box 49, SE-230 53 Alnarp, Swedeng Icelandic Forest Research, Mogilsa, IS-116 Reykjavik, Iceland
Received 30 June 2004; received in revised form 13 May 2005; accepted 23 May 2005
Abstract
Forest carbon exchange contributes significantly to the global carbon balance and is therefore being monitored around theworld,
most notably using eddy covariance technology. In order to extrapolate from these measurements, we need to understand why
carbon balance (or net ecosystem production, NEP) differs among forests. Here, we use a detailed model of forest carbon exchange
applied to three coniferous European forests with differing NEP to pinpoint reasons for the differences among these sites. The model
was parameterised using extensive ecophysiological data obtained at each site. These data gave evidence of major differences
among sites in climate, leaf physiology, respiring biomass, leaf area index, and soil and biomass respiration rates. The model was
compared with eddy covariance data and found to satisfactorily simulate carbon exchange by each forest. Simulations were then run
which interchanged canopy structure, physiology and meteorology among sites, allowing us to quantify the contribution of each
factor to the inter-site differences in gross primary productivity (GPP), ecosystem respiration (RE) and NEP. The most important
factor was the difference in respiration rates, particularly soil respiration rates, among sites. Climate was also very important, with
differences in incident photosynthetically active radiation (PAR) affecting GPP and differences in temperature affecting both GPP
and RE. Effects of leaf area index, respiring biomass and leaf physiology on NEP were secondary, but still substantial. The work
provides detailed quantitative evidence of the major factors causing differences in NEP among coniferous forests.
# 2005 Elsevier B.V. All rights reserved.
Keywords: Eddy correlation; Modelling; Net ecosystem exchange; Climate; Soil respiration; Forest ecosystem
* Corresponding author. Tel.: +61 2 9385 2213; fax: +61 2 9385 1558.
E-mail address: [email protected] (B.E. Medlyn).
0168-1923/$ – see front matter # 2005 Elsevier B.V. All rights reserved.
doi:10.1016/j.agrformet.2005.05.004

B.E. Medlyn et al. / Agricultural and Forest Meteorology 131 (2005) 97–12498
Nomenclature
A photosynthetic rate (mmol m�2 s�1)
APAR absorbed photosynthetically active
radiation (MJ m�2 yr�1)
Ca atmospheric CO2 concentration
(mmol mol�1)
Ci intercellular CO2 concentration
(mmol mol�1)
D leaf to air vapour pressure deficit (kPa)
DBH diameter at breast height (cm)
gs stomatal conductance (mol m�2 s�1)
GPP gross primary productivity
(g C m�2 yr�1)
h relative humidity
Jmax potential rate of electron transport
(mmol m�2 s�1)
LAI leaf area index (m2 m�2)
LUE light use efficiency (g C MJ�1)
ME model efficiency
NEP net ecosystem production
(g C m�2 yr�1)
PAR photosynthetically active radiation
(MJ m�2 yr�1)
Q10 proportional increase in respiration rate
with a 10 8C increase in temperature
Rg above-ground growth respiration
(g C m�2 yr�1)
Rm above-ground maintenance respiration
(g C m�2 yr�1)
Rsoil soil respiration (g C m�2 yr�1)
RE ecosystem respiration (g C m�2 yr�1)
Vcmax maximum rate of Rubisco activity
(mmol m�2 s�1)
Greek letters
a quantum yield of electron transport
(mol mol�1)
u curvature of the light response of
electron transport
us soil water content in the rooting zone
(kg m�2)
1. Introduction
It is recognised that the world’s forests contribute
significantly to the global carbon (C) balance, and that
changes in forest C uptake may act as an important
feedback to the current increase in atmospheric carbon
dioxide (Malhi et al., 1999). A large research effort is
therefore currently being directed at monitoring forest
C balance around the world (e.g. Sellers et al., 1997;
Baldocchi et al., 2001; Andreae et al., 2002). An
important component of this research effort is the use
of eddy covariance methodology to measure C balance
of forest patches; this methodology has been applied at
over 100 forest sites (Baldocchi et al., 2001).
Extrapolation of these data to forests globally is
now a priority for researchers. A key problem is
identifying the major controls on C balance, in order to
allow results for individual forest patches to be
generalised (IPCC, 2003).
Forest C balance is known to be affected by a wide
range of different factors. A seminal paper comparing
eddy covariance measurements of forest C exchange in
European forests showed that net ecosystem production
of C (NEP) was linearly related to latitude (Valentini
et al., 2000). However, this relationship was shown not
to hold in North America (Law et al., 2002). It is argued
that in Europe, latitude integrates a number of factors
influencing C uptake such as radiation and precipita-
tion, whereas these factors do not vary with latitude in
the same way across North America (Barr et al., 2002).
Law et al. (2002) suggested that an index combining
temperature and water balance would be better able to
explain variation in forest C exchange across both
continents. The index explained 64% of variation in
gross ecosystem productivity (GPP) in all forests and
grasslands studied, but it was less successful in
explaining variability in NEP. The difference between
GPP and NEP is the ecosystem respiration (RE).
Several authors have calculated that RE varies more
than GPP and hence have suggested that RE is the main
determinant of NEP (Valentini et al., 2000; Pilegaard
et al., 2001; Arain et al., 2002). It is known that
respiration is strongly affected by temperature on a
short-term basis but when compared across sites,
respiration is more strongly related to productivity than
to temperature (Janssens et al., 2001). There is evidence
that both autotrophic and heterotrophic respiration
acclimate to temperature (Luo et al., 2001; Gifford,
2003) and it is thought that substrate limitation may
determine respiration in the long term (Dewar et al.,
1999; Gifford, 2003). There is also evidence that
disturbance, such as ploughing or drainage, may have

B.E. Medlyn et al. / Agricultural and Forest Meteorology 131 (2005) 97–124 99
effects on soil respiration that continue for many years
(Barford et al., 2001; Janssens et al., 2001) and there is
therefore an increasing emphasis on site history in
interpreting forest NEP (Schulze et al., 2000; Thornton
et al., 2002).
Hence, NEP is affected by a multiplicity of factors,
including climatic factors such as incident radiation,
temperature, and precipitation, site-specific factors
including soil type, nutrient availability and site history,
and interspecific differences in tree physiology. In order
to be able to generalise from flux studies, we need to be
able to quantify the influence of each of these factors
individually. However, separating out the effects of
each factor is difficult, because of confounding: most
eddy flux sites differ in a number of ways. In an attempt
to reduce the number of confounded factors, some
authors have tried to compare fluxes between sites with
at least one factor in common, such as comparing
ecosystems growing in similar climates (Clark et al.,
1999; Anthoni et al., 2002; Griffis et al., 2003) or
comparing similar ecosystems in contrasting climates
(Barr et al., 2002). An alternative approach, taken here,
is to use a model to directly estimate the contribution of
different factors to the difference in NEP among sites.
We focussed on three coniferous forests growing in
contrasting climatic conditions: a boreal Norway
spruce forest (Flakaliden, Sweden), a maritime Sitka
spruce forest (Griffin, Scotland), and a temperate pine
forest (Bray, France). Net ecosystem production
Table 1
Site characteristics
Bray, France Flakalide
Latitude 448420N 648070NLongitude 08430W 198270EElevation (m a.s.l.) 60 310
Dominant species Pinus pinaster Ait. Picea ab
Year planted 1970 1963
Period modelled March 1997–February 1998 Novemb
Annual mean air
temperature (8C)
12.9 2.0
Soil type Sandy podsol Sandy p
Understorey Grass (Molinia coerulea
L. Moench)
Dwarf sh
Vacciniu
Net ecosystem production
(g C m�2 yr�1)
575 �50
Wood increment
(t C ha�1 yr�1)
4.6 1.1
References Berbigier et al. (2001) Bergh et
varied considerably between these sites; it was
estimated from eddy covariance data to be
�50 g C m�2 yr�1 for Flakaliden, 575 g C m�2 yr�1
for Bray, and 590 g C m�2 yr�1 for Griffin (see
Section 2.1). Our aim was to identify the main
reasons for this difference in NEP among the sites.
We parameterised the forest canopy model MAES-
TRA (Wang and Jarvis, 1990a; Medlyn, 2004) for each
site, using extensive ecophysiological data obtained at
each site. The process of parameterisation enabled us to
identify the major differences among the sites:
differences in climate, canopy structure, leaf physiol-
ogy, and respiration rates were quantified. The model
was used to simulate NEP at each site and results
verified against eddy covariance data. We then ran a
series of simulations designed to quantify the effect of
each inter-site difference on NEP. Single parameters, or
groups of related parameters, were changed one at a
time, and the change in NEP calculated. This process
allowed us to rank individual factors in terms of their
importance in determining NEP.
2. Methods
2.1. Sites
The three eddy flux sites used included a Sitka
spruce forest in Scotland (Griffin), a Norway spruce
n, Sweden Griffin, U.K.
568370N38480W340
ies (L.) Karst Picea sitchensis (Bong.) Carr.
1981
er 1997–October 1998 January 1998–December 1998
6.3
odsolic glacial till Podsolised brown earth;
stagnohumic gley
rubs (chiefly
m spp.); mosses
Calluna vulgaris (L.) Hull; Erica spp.;
sparse under closed canopy
590
6.5
al. (1999) Clement (2004) and
Clement et al. (2003)

B.E. Medlyn et al. / Agricultural and Forest Meteorology 131 (2005) 97–124100
forest in Sweden (Flakaliden), and a maritime pine
forest in southern France (Bray). A summary of site
characteristics is given in Table 1. Griffin is the most
productive of the three sites. It is a young stand just
reaching canopy closure and suffers few climatic
extremes. Flakaliden is subject to harsh winters and
rates of growth are slow; the site is the oldest of the
three and yet the trees are smallest. Bray is subject to
summer droughts, but growth rates are relatively fast
and the trees are approaching maturity.
All three sites formed part of the EUROFLUX
network. In this network, a standard methodology was
used to measure eddy covariance, as described by
Aubinet et al. (2000). A continuous period of 1 year’s
worth of flux data was chosen for each site. For the
Bray and Flakaliden sites, this did not correspond to a
calendar year (Table 1). For ease of comparison
between sites, however, data are rearranged in the
figures to show a calendar year (e.g. January and
February data from Bray are for 1998 but data for
March onwards are for 1997).
Table 1 gives estimates of annual NEP for each site.
For the Flakaliden site, this estimate was taken from
the FLUXNET website (http://www.eosdis.ornl.gov/
FLUXNET) and was gap-filled using a lookup table
method with a correction for low friction velocity
(Falge et al., 2001). For the Bray site, the estimate is
taken from Berbigier et al. (2001), who used
polynomial regressions on meteorological data to fill
gaps in NEP. A similar method was used to obtain
annual NEP for the Griffin site (Clement, 2004).
Annual NEP was similar for Bray and Griffin, but
much smaller for Flakaliden.
2.2. Modelling approach
The heart of the paper is a modelling analysis that
aims to identify the major reasons for differences in
NEP among sites. The analysis consists of a series of
simulations in which drivers or parameters were
changed one at a time from one site to the next. At
each step, the impact of the change on modelled GPP,
RE and NEP was recorded. Each step is essentially a
‘‘what if’’ question: if the only difference between the
two sites was the factor being changed, what would be
the difference in NEP? For example, when incident
PAR is changed, we are asking what the difference in
NEP would be for two sites which were identical apart
from incident PAR. Clearly these simulations do not
represent reality: they are a type of sensitivity analysis
designed to work out which factors are most important
in determining differences in NEP among sites.
The model used was MAESTRA (Medlyn, 2004),
which is a development of the MAESTRO model
(Wang and Jarvis, 1990a). It is available on-line at
www.maestra.unsw.edu.au. This model was chosen
because it is quite detailed and incorporates all of the
major factors of interest. The forest overstorey is
represented as a three-dimensional array of tree
crowns, and for each crown, x and y co-ordinates,
height, trunk space, canopy radius, and one-sided leaf
area are specified. Radiation interception, photosynth-
esis and stomatal conductance are calculated for a
‘‘target’’ crown, which is divided into 72 subvolumes.
Radiation interception for each subvolume is calcu-
lated for both beam and diffuse radiation. Photosyn-
thetic uptake is driven by intercepted radiation, using
the leaf photosynthesis model of Farquhar et al.
(1980), while stomatal conductance may be repre-
sented by either of three models (Ball et al., 1987;
Jarvis, 1976; Leuning, 1995).
For the Bray and Flakaliden sites, carbon uptake by
the understorey is significant (Delzon, 2000; B.D.
Sigurdsson, personal communication) and hence the
model was modified to allow estimation of this
component. Radiation penetration to the forest floor
was calculated using MAESTRA routines and used to
drive a simple sun-shade photosynthesis model
(Medlyn et al., 2000). Routines were also added to
the model to calculate the respiratory component of
the CO2 flux. Above-ground maintenance respiration
is calculated from foliar biomass and above-ground
woody biomass using exponential functions of air
temperature. Total growth respiration is calculated as a
proportion of biomass increment and allocated within
the growth period according to air temperature. Soil
respiration is calculated from functions of soil
temperature developed for each site. Net ecosystem
production is calculated as the difference between
gross photosynthetic uptake and total respiration.
We first verified that the model was able to
adequately reproduce measured CO2 fluxes. First,
model estimates of ecosystem respiration were
compared with night-time CO2 fluxes. Average
measured and modelled fluxes were calculated for
each night for which flux data were available. The

B.E. Medlyn et al. / Agricultural and Forest Meteorology 131 (2005) 97–124 101
night-time fluxes at Griffin were corrected for CO2
storage and hence should be comparable with
modelled respiration. At Bray and Flakaliden, the
fluxes were not corrected for storage, so it is expected
that the modelled respiration will exceed measured
CO2 flux except on turbulent nights. A relationship
between night-time flux on turbulent nights and the
temperature of the soil–litter interface, developed by
Berbigier et al. (2001), was used to further evaluate
modelled respiration at the Bray site. Measured
daytime NEP was then compared with modelled
daytime NEP, calculated by subtracting modelled
daytime respiration from modelled daily GPP. Finally,
monthly ensembles (i.e., averages of all data for a
given time of day over the month) of NEP were
calculated for both measured and modelled data. The
goodness of fit of modelled daytime totals and
monthly ensembles to measured data is evaluated
using the model efficiency (ME), which estimates the
proportion of the variance of the data explained by the
1:1 line (Mayer and Butler, 1993).
The sensitivity analysis was then carried out as
follows. The contribution of the understorey to NEP at
each site was recorded separately. Model simulations
were run for the canopy only. Beginning with a
simulation for one of the sites, the model inputs were
changed to those of another site, one group at a time,
cumulatively, until all inputs corresponded to the
second site. At each step, the changes in GPP, RE and
NEP were recorded. The input meteorological data
were changed first, to evaluate the effect of climate
alone. The soil respiration relationship was changed
second; this relationship is shown (see below) to be
very important, and estimated NEP becomes unrea-
listic if the correct relationship is not used for any
given site. Canopy structural and physiological
parameters were then changed. The order in which
these parameters were changed was found not to affect
the conclusions drawn.
2.3. Parameterisation
In this section, we describe in turn each of the
inputs (climatic variables and parameter sets) used to
drive the model. This section is important because
differences in the model inputs should reflect the
actual differences among sites. We provide consider-
able detail about how the inputs were determined for
each site, with the aim of allowing the reader to judge
the validity of each difference in the inputs.
2.3.1. Climate
For each site, half-hourly meteorological data
including incident photosynthetically active radiation
(PAR), air and soil temperatures, relative humidity,
wind speed and precipitation were obtained from the
EUROFLUX database (http://daacl.esd.ornl.gov/
FLUXNET/euro_db.html). Soil water content does
not affect production at Flakaliden (Bergh et al., 1999)
and was assumed not to affect production at Griffin in
the modelled year. At the Bray site, values of soil
water content measured using time-domain reflecto-
metry were included in the meteorological data used to
drive the model (Ogee et al., 2001).
There were strong contrasts in climate among sites.
Annual courses of incident PAR and air temperature
for each site are illustrated in Fig. 1. Incident PAR is
clearly highest at Bray, the southernmost site. Total
annual incident PAR is similar at Griffin and
Flakaliden, but varies more strongly over the course
of the year at Flakaliden. Monthly air temperature is
highest throughout the year at Bray. Winters are
coldest at Flakaliden but mean June and July
temperatures are lowest at Griffin.
2.3.2. Tree dimensions
Average tree diameter at breast height (DBH),
tree height, height to crown base, and crown radius
are given in Table 2. These values were determined
as follows. At Bray, the positions of some 2500 trees
surrounding the flux tower have been recorded and
DBH is measured each year. At the end of 1996 and
1997, heights were measured on 200 trees and a
relationship with DBH developed. At the end of
1995, crown radius and height to crown base were
determined for 14 trees and a relationship with tree
height obtained (Porte, 1999). At Flakaliden, all
measurements were made on a nearby fertilisation/
irrigation experiment (Linder, 1995). Model inputs
were based on one of the Control plots of this
treatment (275 trees). DBH and height of each tree
were measured at the end of 1996 (Bergh et al.,
1999), and canopy radius was measured for each tree
in summer 1997 (Stenberg et al., 1999). At Griffin,
DBH in 1997 was measured on 1000 trees distributed
in fifty 10 m � 10 m sample plots located around the

B.E. Medlyn et al. / Agricultural and Forest Meteorology 131 (2005) 97–124102
Fig. 1. Monthly total photosynthetically active radiation (PAR) and average air temperature for each site, for the periods March 1997–February
1998 for Bray; November 1997–October 1998 for Flakaliden; January 1998–December 1998 for Griffin. Data for Bray and Flakaliden have been
rearranged to simplify comparison.
flux tower. Height versus DBH and canopy radius
versus DBH relationships were developed from
measurements of height and DBH on 200 trees in
1998 and 2001, and of canopy radius of 70 trees in
2001 (L. Wingate, R. Clement, personal commu-
nication).
The major differences in tree dimensions among
sites may be summarised as follows. Trees were tallest
and largest at the Bray site. However, because the
stocking was relatively low at Bray, the ground cover
fraction, or the ratio of total crown area: ground area,
was highest at Griffin and least at Bray.
2.3.3. Leaf area index
Leaf area index at the Bray site was measured
monthly using an optical method (Berbigier and
Bonnefond, 1995). Values in 1997 ranged from 2.6
to 3.1 m2 m�2 (Berbigier et al., 2001). Leaf area index
surrounding the tower at Flakaliden was marginally
less, at 2.2 m2 m�2, determined with a Li-Cor LAI2000
plant canopy analyser (Li-Cor Inc., Lincoln, NE, USA)
calibrated against biomass samples (Wallin et al.,
2001). A detailed study of leaf area index, comparing
optical and destructive methods, has been carried out at
Griffin (Wingate, 1998). Estimates of LAI varied
B.E. Medlyn et al. / Agricultural and Forest Meteorology 131 (2005) 97–124 103
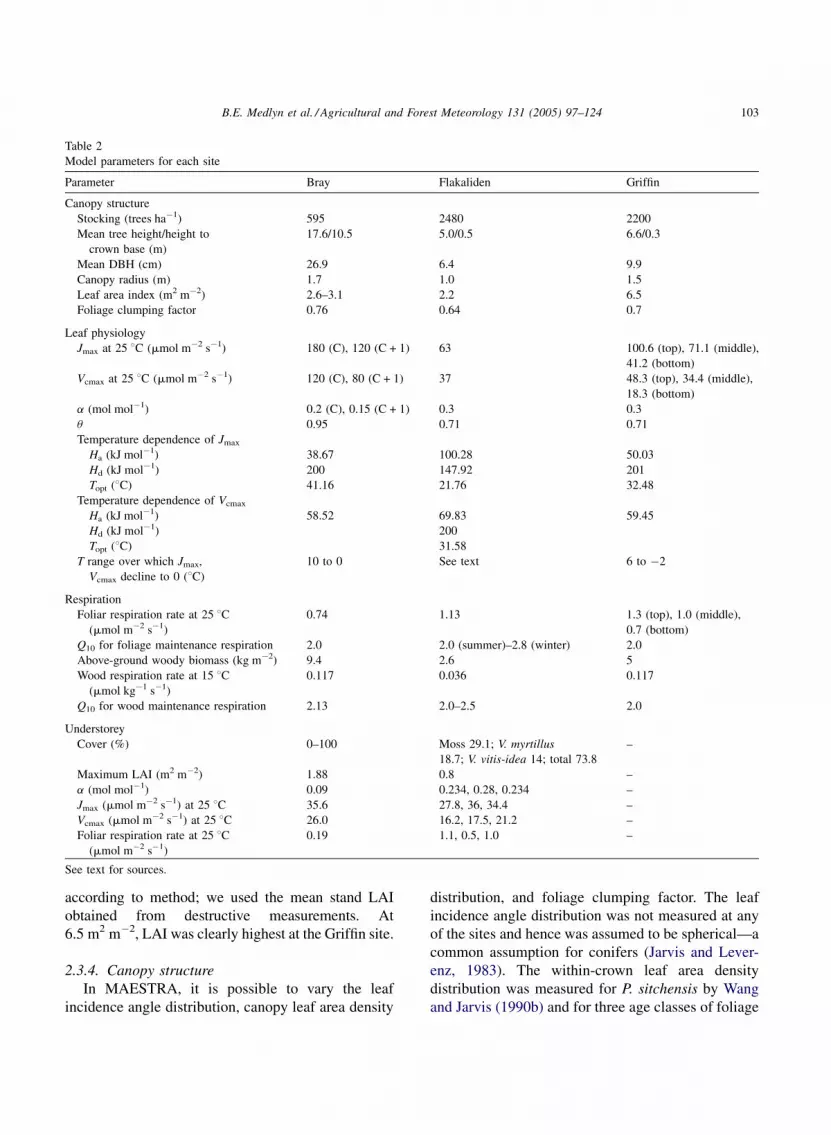
Table 2
Model parameters for each site
Parameter Bray Flakaliden Griffin
Canopy structure
Stocking (trees ha�1) 595 2480 2200
Mean tree height/height to
crown base (m)
17.6/10.5 5.0/0.5 6.6/0.3
Mean DBH (cm) 26.9 6.4 9.9
Canopy radius (m) 1.7 1.0 1.5
Leaf area index (m2 m�2) 2.6–3.1 2.2 6.5
Foliage clumping factor 0.76 0.64 0.7
Leaf physiology
Jmax at 25 8C (mmol m�2 s�1) 180 (C), 120 (C + 1) 63 100.6 (top), 71.1 (middle),
41.2 (bottom)
Vcmax at 25 8C (mmol m�2 s�1) 120 (C), 80 (C + 1) 37 48.3 (top), 34.4 (middle),
18.3 (bottom)
a (mol mol�1) 0.2 (C), 0.15 (C + 1) 0.3 0.3
u 0.95 0.71 0.71
Temperature dependence of Jmax
Ha (kJ mol�1) 38.67 100.28 50.03
Hd (kJ mol�1) 200 147.92 201
Topt (8C) 41.16 21.76 32.48
Temperature dependence of Vcmax
Ha (kJ mol�1) 58.52 69.83 59.45
Hd (kJ mol�1) 200
Topt (8C) 31.58
T range over which Jmax,
Vcmax decline to 0 (8C)
10 to 0 See text 6 to �2
Respiration
Foliar respiration rate at 25 8C(mmol m�2 s�1)
0.74 1.13 1.3 (top), 1.0 (middle),
0.7 (bottom)
Q10 for foliage maintenance respiration 2.0 2.0 (summer)–2.8 (winter) 2.0
Above-ground woody biomass (kg m�2) 9.4 2.6 5
Wood respiration rate at 15 8C(mmol kg�1 s�1)
0.117 0.036 0.117
Q10 for wood maintenance respiration 2.13 2.0–2.5 2.0
Understorey
Cover (%) 0–100 Moss 29.1; V. myrtillus
18.7; V. vitis-idea 14; total 73.8
–
Maximum LAI (m2 m�2) 1.88 0.8 –
a (mol mol�1) 0.09 0.234, 0.28, 0.234 –
Jmax (mmol m�2 s�1) at 25 8C 35.6 27.8, 36, 34.4 –
Vcmax (mmol m�2 s�1) at 25 8C 26.0 16.2, 17.5, 21.2 –
Foliar respiration rate at 25 8C(mmol m�2 s�1)
0.19 1.1, 0.5, 1.0 –
See text for sources.
according to method; we used the mean stand LAI
obtained from destructive measurements. At
6.5 m2 m�2, LAI was clearly highest at the Griffin site.
2.3.4. Canopy structure
In MAESTRA, it is possible to vary the leaf
incidence angle distribution, canopy leaf area density
distribution, and foliage clumping factor. The leaf
incidence angle distribution was not measured at any
of the sites and hence was assumed to be spherical—a
common assumption for conifers (Jarvis and Lever-
enz, 1983). The within-crown leaf area density
distribution was measured for P. sitchensis by Wang
and Jarvis (1990b) and for three age classes of foliage

B.E. Medlyn et al. / Agricultural and Forest Meteorology 131 (2005) 97–124104
of P. pinaster by Porte et al. (2000). No information on
leaf area density distribution was available for P.
abies, so for this species, a uniform leaf area density
distribution was assumed. Leaf area density for P.
sitchensis was highest in the mid-canopy and towards
the exterior of the crown, while leaf area density for
P. pinaster was highest at the top of the canopy and
towards the exterior of the crown.
The foliage clumping factor accounts for non-
randomness of foliage distribution due to the clumping
of needles into shoots (Oker-Blom and Kellomaki,
1983). For P. sitchensis, the clumping factor was given
as 0.7 by Wang and Jarvis (1990b). For P. pinaster and
P. abies, mean values of 0.76 and 0.64 were derived
from measurements of shoot projected area ratio made
by Bosc (1999) and Stenberg et al. (1995), respec-
tively. However, there is considerable variation about
the mean in both of these studies, suggesting that the
difference in these parameters among sites is unlikely
to be significant.
2.3.5. Needle reflectance and transmittance of
PAR
These parameters were assumed not to differ
among sites. Values have been determined accurately
only for P. pinaster. Using an integrating sphere,
Berbigier and Bonnefond (1995) found average needle
reflectance in the 400–700 nm waveband was 9% and
transmittance was 1.4%. Approximate values of
needle reflectance and transmittance obtained for P.
sitchensis by Norman and Jarvis (1974) using a
radiation sensor were very similar to those obtained
for P. pinaster, while measurements for P. abies were
unavailable.
2.3.6. Photosynthesis
Photosynthetic rates were estimated according to
the model of Farquhar et al. (1980), for which the key
parameters are the maximum rate of Rubisco activity,
Vcmax, the potential rate of electron transport, Jmax, and
the initial slope, a, and curvature, u, of the light
response of electron transport. The parameters Jmax
and Vcmax may be obtained from A–Ci curves (the
response of photosynthesis to intercellular CO2). In
order to assure comparability of these parameters, A–
Ci curves were obtained for each species and
parameters were fitted to these curves using a
consistent methodology (Medlyn et al., 2002a).
For P. pinaster, A–Ci curves were measured on
current foliage taken from the top of the canopy at
2-month intervals throughout the year, from a stand
neighbouring the Bray site (Medlyn et al., 2002b).
Information on gradients in these parameters through
the canopy and changes with age was also available
from a study on the same stand (Porte and Loustau,
1998). Measurements were made with a Walz
Compact Minicuvette System (Heinz Walz GmbH,
Effeltrich, Germany) on six individual needles laid
across the cuvette. The needles were illuminated from
both sides with saturating light (1400 mmol m�2 s�1).
Measurements were made at five different tempera-
tures from 15 to 35 8C. Values were converted to a
half-total leaf surface area basis, as required by
the model, using a total: projected area ratio of
2.57.
For P. sitchensis, A–Ci curves were measured on
foliage in situ at three different levels in the canopy.
These measurements were made at a site in southern
Scotland with LAI similar to that of the Griffin stand
(Meir et al., 2002). Measurements were made with a
CIRAS-1 gas exchange system (PP Systems,
Hitchin, Hertfordshire, UK) on an intact shoot.
Saturating illumination (800–2000 mmol m�2 s�1)
was supplied from one side of the cuvette and the
other side lined with reflective plastic. Air tempera-
ture averaged 22 8C. The total: projected area ratio
was assumed to be 2.31 (Barclay and Goodman,
2000).
For P. abies, photosynthesis measurements were
made for an elevated CO2 experiment using branch
bags at the Flakaliden irrigation/fertilisation experi-
ment (Roberntz and Stockfors, 1998). The measure-
ments used here were made on unbagged control
branches in an untreated control plot. Measurements
were made on current-year shoots on the third or
fourth whorl of branches, using a Li-6200 infrared gas
analyser (Li-Cor Inc., Lincoln, NE, USA). Illumina-
tion of 1000 mmol m�2 s�1 was provided from one
side only, and chamber temperature averaged 19.5 8C.
The total: projected area ratio was assumed to be 2.74
(Riederer et al., 1988).
Samples of the A–Ci responses obtained are
shown in Fig. 2. There is a considerable difference
between the relationships, with that for P. pinaster
being the uppermost and that for P. abies lowermost.
The initial slope and saturating values of these

B.E. Medlyn et al. / Agricultural and Forest Meteorology 131 (2005) 97–124 105
Fig. 2. Samples of measured photosynthesis–intercellular CO2 (A–Ci) responses used for each site. At Bray, the response was measured in
January, on current needles, on a cut branch taken from the third whorl. At Flakaliden, the response was measured in September, on current
needles, on a branch in the third whorl. Data for Griffin were measured at a plantation with similar leaf area index in southern Scotland. The
response was measured on 1-year-old shoots at the top of the canopy. All curves were taken at 20 8C and all are expressed on a half-total leaf
surface area basis. Data supplied by Peter Roberntz (Flakaliden), Patrick Meir (Griffin) and Belinda Medlyn (Bray).
relationships are used to derive Vcmax and Jmax,
respectively. The parameter values derived for each
species are given in Table 2. As indicated by the
relative positions of the relationships shown in
Fig. 2, these parameters are highest for P. pinaster
and lowest for P. abies.
Values for the parameters of the light response of
Jmax, a and u, were taken from Porte and Loustau
(1998) for P. pinaster. They assumed u to be constant
and equal to 0.95 and then fitted a to light-response
curves of photosynthesis made at ambient CO2
concentration. We corrected these values for absorp-
tance, which was assumed to be 89.5% in the visible
waveband (Berbigier and Bonnefond, 1995). For P.
sitchensis, we used values of a and u estimated by
Ibrom et al. (unpublished manuscript) from a study by
Leverenz and Jarvis (1979), who measured the light
response of shoots which had been trimmed such that
needles were arranged in a single layer, perpendicular
to the light source. As no comparable measurements
were available for P. abies, it was assumed that a and u
were identical to those for P. sitchensis. The difference
in these parameters implies that photosynthesis
increases more rapidly with increasing PAR in the
spruces as opposed to the pine.
2.3.7. Dependence of photosynthesis on
temperature
The temperature response of the parameters Jmax
and Vcmax was measured for P. pinaster at 2-month
intervals (Medlyn et al., 2002b). The temperature
response given here was obtained by fitting the
equations given by Medlyn et al. (2002a) to data from
all periods combined. For P. sitchensis, the tempera-
ture response of Jmax and Vcmax was estimated from
the temperature response of photosynthesis given by
Neilson et al. (1972). For P. abies, the temperature
responses were assumed to be the same as those of
Pinus sylvestris growing in similar boreal conditions
in Finland (Wang et al., 1996; Medlyn et al., 2002a).
The temperature responses are quite different across
the sites, with the optimal temperature for Jmax being
20 8C lower at the northernmost site (Flakaliden)
compared to the southernmost (Bray).
There is very little data available on the effects of
very low temperatures on photosynthesis. Inspection
of the flux data, however, showed that CO2 uptake
decreased rapidly below threshold temperatures at the
two milder sites. Based on this observation, the model
was modified such that Jmax and Vcmax were assumed
to decline to zero at low temperatures at these sites. At

B.E. Medlyn et al. / Agricultural and Forest Meteorology 131 (2005) 97–124106
Flakaliden, photosynthesis is inhibited over the winter
by frozen soil. The recovery of photosynthesis in
spring was modelled according to Bergh et al. (1998).
2.3.8. Stomatal conductance
Stomatal conductance data were obtained from
trees at each site. At the Bray site, stomatal
conductance was measured by Bosc (1999) using an
automatic ‘‘branch bag’’ style cuvette. The cuvette
was installed on a current-year branch near the top of
the canopy and measurements of branch stomatal
conductance were made every 20 min over a period of
40 days in September and October 1997. These data
span a drought period and hence allow the effect of
low soil water content on stomatal conductance to be
estimated. Similarly, at Griffin, branch bags were
operated as cuvettes for 3 days in July 2001 and
measurements of branch gas exchange made every
30 min (Wingate, 2003). For the Flakaliden site,
stomatal conductance was taken from the same set of
shoot gas exchange data used to derive photosynthetic
parameters. It was found that stomatal conductance
did not change during the measurement of A–Ci curves
and hence mean stomatal conductance from these
measurements was calculated and related to the
Fig. 3. Stomatal conductance data obtained from each site. The x-axis is the
multiplied by relative humidity (h) divided by atmospheric CO2 concentration
for the other sites, the full datasets are shown. Data are expressed per unit hal
Lisa Wingate (Griffin) and Alexandre Bosc (Bray). Lines are fitted to data
conditions prevailing before the beginning of the
measurement (Roberntz and Stockfors, 1998).
These data are compared in Fig. 3, with the
stomatal index proposed by Ball et al. (1987) on the x-
axis. As with photosynthetic rate, stomatal conduc-
tance appears to vary among the three species, being
highest for P. pinaster and lowest for P. abies. The
relationships shown in Fig. 3 are all significantly
different (P < 0.01).
The stomatal model of Leuning (1995) was fitted to
the data from P. pinaster and P. sitchensis. For P.
sitchensis, the following model was obtained:
gs ¼ 0:037 þ 6:33A
Cað1 þ D=0:5Þ (1)
where gs is stomatal conductance (mol m�2 s�1), A is
photosynthesis (mmol m�2 s�1), Ca is atmospheric
CO2 (mmol mol�1) and D is leaf to air vapour pressure
deficit (kPa). For P. pinaster, the fitted model includes
a dependence on soil water content, us:
gs ¼�
0:015 þ 8:63A
Cað1 þ D=1:39Þ
�f ðusÞ (2)
The dependence on soil water content was taken
from a study of sapflux of P. pinaster (Granier and
stomatal index proposed by Ball et al. (1987), viz. photosynthesis (A)
(Ca). For Bray, only data at high relative soil water content are shown;
f-total leaf surface area. Data supplied by Peter Roberntz (Flakaliden),
. Solid line, Bray; dashed line, Flakaliden; dotted line, Griffin.

B.E. Medlyn et al. / Agricultural and Forest Meteorology 131 (2005) 97–124 107
Loustau, 1994) and is given by
f ðusÞ ¼ 1 � 0:0156 exp
�4:269
us;max � us
us;max � us;min
�(3)
where us,max and us,min are the maximal and minimal
root zone soil water content, respectively. For the P.
abies data, it was not possible to fit the model of
Leuning (1995) because of the small range of vapour
pressure deficits in the data set and hence the model of
Ball et al. (1987) was fitted instead, obtaining:
gs ¼ 0:034 þ 3:5Ah
Ca
(4)
where h is relative humidity.
2.3.9. Foliage respiration
A detailed study of foliage maintenance respiration
was made on P. abies (Stockfors, 1997; Roberntz and
Stockfors, 1998; Stockfors and Linder, 1998b). The
measurements were made on detached needles from
current-year shoots taken from the third whorl of
branches at the Flakaliden irrigation-fertilisation
experiment. Needles were dark-adapted for at least
one hour before measurements were made using an
oxygen electrode. Measurements at 10 and 20 8C were
made on seven occasions through the year. Needle
respiration varied significantly through the year, with
wintertime rates double those during summer (Stock-
fors and Linder, 1998b). The temperature response of
needle respiration also varied over the course of the
year: Q10 ranged from 2 in summer to 2.8 in winter
(Stockfors and Linder, 1998b).
Needle maintenance respiration of P. sitchensis
trees was measured during the course of an elevated
CO2 experiment using branch bags at a site in southern
Scotland (Barton, 1997; Barton and Jarvis, 1999).
Here, measurements were made on shoots in situ using
an infrared gas analyser. Respiration rates were lower
for dark-adapted shoots during daytime than at night,
suggesting that foliage respiration rate is reduced in
daytime (Barton, 1997). Here, the night-time rate was
used as the base rate for foliage at the top of the
canopy. Respiration rate per unit foliage area was
assumed to decline with canopy depth, as found by
Meir et al. (2002).
For P. pinaster, needle maintenance respiration
rates were estimated from A–Ci curves measured in
situ at three levels in the canopy and on two age classes
of foliage (Porte and Loustau, 1998). In these
measurements, no attempt was made to dark-adapt
the needles. The respiration rate did not vary
significantly through the canopy. Information on
Q10 was not available for P. sitchensis or P. pinaster.
For these two species, Q10 was assumed to be 2.
For all three sites, it was assumed that foliage
respiration rate is reduced by 60% during the day
(Brooks and Farquhar, 1985). Foliage respiration
parameter values corrected to 25 8C are shown in
Table 2. Foliage respiration rate is highest for P.
sitchensis, followed by P. abies then P. pinaster.
However, it is difficult to be confident that this
difference between species is real, due to the
considerable differences in experimental protocol
outlined above.
There was no evidence for any difference in growth
respiration rates among sites, so growth respiration of
foliage and wood were calculated as constant fractions
(respectively 0.25 g C g�1 C and 0.15 g C g�1 C;
Chung and Barnes, 1977) of total production for all
sites.
2.3.10. Above-ground woody respiration
Detailed studies of stem respiration have been
made at two of the three sites. At the Bray site, Bosc
et al. (2003) measured respiration of excised branch
and stem sections which ranged in diameter from 0.9
to 4 cm for branches and 6 to 24 cm for stems.
Measurements were made in the laboratory under
controlled conditions in order to accurately determine
respiration at a constant temperature (15 8C). Respira-
tion rates were found to decrease with the age of the
section measured, irrespective of whether rates were
expressed per unit surface area, volume, or nitrogen.
Measurements were made in October, well after the
end of the growing season, and respiration rates were
assumed to represent maintenance respiration only.
Field measurements on branch segments were also
made using an automated cuvette over a period of 3–7
days (Bosc et al., 2003), allowing the temperature
response to be determined. A Q10 of 2.13 was
obtained.
At the Flakaliden irrigation-fertilisation experi-
ment, stem respiration was measured in situ on the
north-facing side of stems at a height of 1–1.5 m on
seven occasions between June 1993 and April 1994

B.E. Medlyn et al. / Agricultural and Forest Meteorology 131 (2005) 97–124108
(Stockfors and Linder, 1998a). On each occasion,
continuous measurements were made over a period of
24–48 h to allow determination of the temperature
response. The Q10 varied from 2.0 to 2.5 over the
growing season (Table 2). In a second study, stem
respiration was measured in situ using an automated
system throughout 1999 (Ceschia, 2001). Respiration
was measured at three different heights. During
summer 1999, automated measurements were also
made on first-order branches at three heights. In
October 1999, two trees were harvested and measure-
ments of respiration made on stem and branch
segments under controlled conditions in the labora-
tory. In this study, maintenance respiration rates were
also shown to depend on segment diameter, whether
expressed on a surface or volume area basis. The rates
obtained for P. abies are compared with those
measured by Bosc et al. (2003) on P. pinaster in
Fig. 4. It will be seen that, for a wood segment of
similar diameter, maintenance respiration rates at a
constant temperature are considerably higher for
P. pinaster.
The information from these studies was used to
parameterise a simple model of woody respiration.
Maintenance respiration at a reference temperature
was assumed constant throughout the year and was
calculated on a mass basis. The parameters derived for
the Bray and Flakaliden sites are given in Table 2. As
Fig. 4. Measured woody maintenance respiration as a function of stem or
(2001) (Flakaliden). All data corrected to 15 8C.
would be expected from Fig. 4, the effective wood
maintenance respiration rate was considerably higher
for Bray than for Flakaliden. No information was
available on stem respiration rates for the Griffin site
or for P. sitchensis. For this site, parameters were taken
from Bray because the trees there were growing at a
similar rate to those at Griffin.
2.3.11. Characterisation of understorey
The understorey was significant at the Bray and
Flakaliden sites, but sparse at the Griffin site, and
hence was modelled at the first two sites only.
The understorey at Bray was chiefly composed of a
grass, Molinia caerulea (L.) Moench, and formed the
subject of a detailed study by Delzon (2000). Grass
clumps were harvested on a fortnightly basis
throughout the growing season to determine above-
ground biomass and leaf area. Leaf extension was also
measured non-destructively on a weekly basis. Gas
exchange measurements, including responses to light,
CO2 and temperature, were made on grass clumps
removed from the site to a nearby greenhouse. These
measurements were used to parameterise a model of
photosynthesis and tested using further gas exchange
measurements made on grass clumps in situ. Key
parameters taken from this work and used to
parameterise the understorey model used here, are
given in Table 2.
branch diameter. Data from Bosc et al. (2003) (Bray) and Ceschia

B.E. Medlyn et al. / Agricultural and Forest Meteorology 131 (2005) 97–124 109
The understorey at Flakaliden was studied in
autumn 1998 by manually harvesting fifty 20 cm �20 cm plots that were randomly distributed over
control plots of the irrigation-fertilisation experiment.
The samples from each plot were divided into different
understorey species, measured for leaf area by LI-
3000 area meter (Li-Cor Inc., Lincoln, NE, USA),
dried in an oven at 80 8C for 48 h and weighed. The
three main understorey classes were Vaccinium
myrtillus L., V. vitis-idea L. and various moss species,
with 23, 32 and 33% of the understorey biomass,
respectively. In September 1998, light-response
curves and A–Ci curves were measured for the three
main understorey species using a LI-6200 Portable
Photosynthesis System (Li-Cor Inc., Lincoln, NE,
USA) and a light source. These data were used to
parameterise the biochemical model of Farquhar et al.
(1980). The parameters derived are given in Table 2.
2.3.12. Soil CO2 efflux
Soil CO2 efflux at the Bray site was measured over
the period January 2000–June 2002 using both (1) a
continuous automated open-chamber system with five
chambers of 25 cm diameter and (2) a portable manual
system (SRC-1, PP Systems, Hitchin, Hertfordshire,
England) (Pargade, 2000). The automated system was
used to estimate the Q10 of soil respiration on a monthly
basis, while the portable system was used to calculate a
spatial average (30 replicates) of the respiration rate at
15 8C (D. Loustau, personal communication).
At Flakaliden, soil CO2 efflux around the tower was
measured using a differential chamber system
Fig. 5. Regressions of soil respiration vs. soil temperature at 0–10 cm dept
mean annual soil temperature is marked by an asterisk for each site.
described by Moren and Lindroth (2000). Measure-
ments were made on three occasions at 36 sample sites
with varying soil moisture content. Also, at the nearby
fertilisation-irrigation experiment, a detailed study of
soil respiration was made as part of a soil warming
study (Stromgren, 2001). An automated chamber
system was used, similar to that used at the Bray site.
Continuous measurements were made from June to
October and relationships with temperature derived
for each month.
At Griffin, respiration was measured with a portable
CO2 analyser equipped with a soil chamber (SRC-1 and
EGM-3, PP Systems, Hitchin, Hertfordshire, England).
Measurements were made on 24 occasions between
August 2000 and June 2001. Sample sites were chosen
to reflect variations in site microtopography (L.
Wingate, personal communication). A relationship
with soil temperature was developed.
The relationships derived for August at each site
are compared in Fig. 5. For most values of soil
temperature, soil CO2 efflux is greatest at Flakaliden
and least at Bray.
3. Results
3.1. Model-data comparison
Although there are distinct limitations to the value
of a comparison between model output and eddy
covariance measurements (see Medlyn et al., 2005 for
a full discussion), we did verify that the model was
h for August for each site. The soil respiration rate corresponding to

B.E. Medlyn et al. / Agricultural and Forest Meteorology 131 (2005) 97–124110
able to adequately reproduce measured fluxes. We first
looked at night-time fluxes, as these consist of
respiration alone, whereas daytime fluxes include
photosynthetic uptake as well as respiratory losses.
We compared modelled night-time respiration with
measured night-time CO2 flux (Fig. 6). At Bray, as
expected, the modelled respiration values exceed the
night-time CO2 fluxes most of the time, with the
modelled values generally following the upper limit of
measurements. The night-time fluxes at Bray were not
corrected for CO2 storage within the canopy, which
tends to occur on calm nights. However, the modelled
values coincide well with respiration values estimated
Fig. 6. Annual courses of modelled and measured ecosystem respiration
values, which are estimated as average night-time CO2 efflux. Solid line
indicates respiration estimated from a relationship between night-time CO
interface. Data for Bray and Flakaliden have been rearranged to show a
from the relationship between CO2 flux on turbulent
nights (u* > 0.4 m s�1) and the soil–litter interface
temperature. At both Flakaliden and Griffin, modelled
respiration follows fairly closely the upper limit of
measured night-time CO2 flux, with a large number of
values overestimated (although not so severely as at
Bray). Many authors have noted previously that, even
where night-time fluxes are corrected for CO2 storage,
fluxes tend to be low when turbulence is low,
suggesting a systematic underestimation by the flux
measurement system (Lavigne et al., 1997; Aubinet
et al., 2000; Falge et al., 2001; Barr et al., 2002). We
therefore regard the congruence between the modelled
for (a) Bray, (b) Flakaliden and (c) Griffin. Circles show measured
is modelled average night-time respiration. In (a), the dotted line
2 efflux on turbulent nights, and the temperature of the litter–soil
calendar year to simplify comparison (see Fig. 1).
B.E. Medlyn et al. / Agricultural and Forest Meteorology 131 (2005) 97–124 111
values and the upper limit of the night-time CO2 fluxes
as evidence that ecosystem respiration is being
satisfactorily modelled.
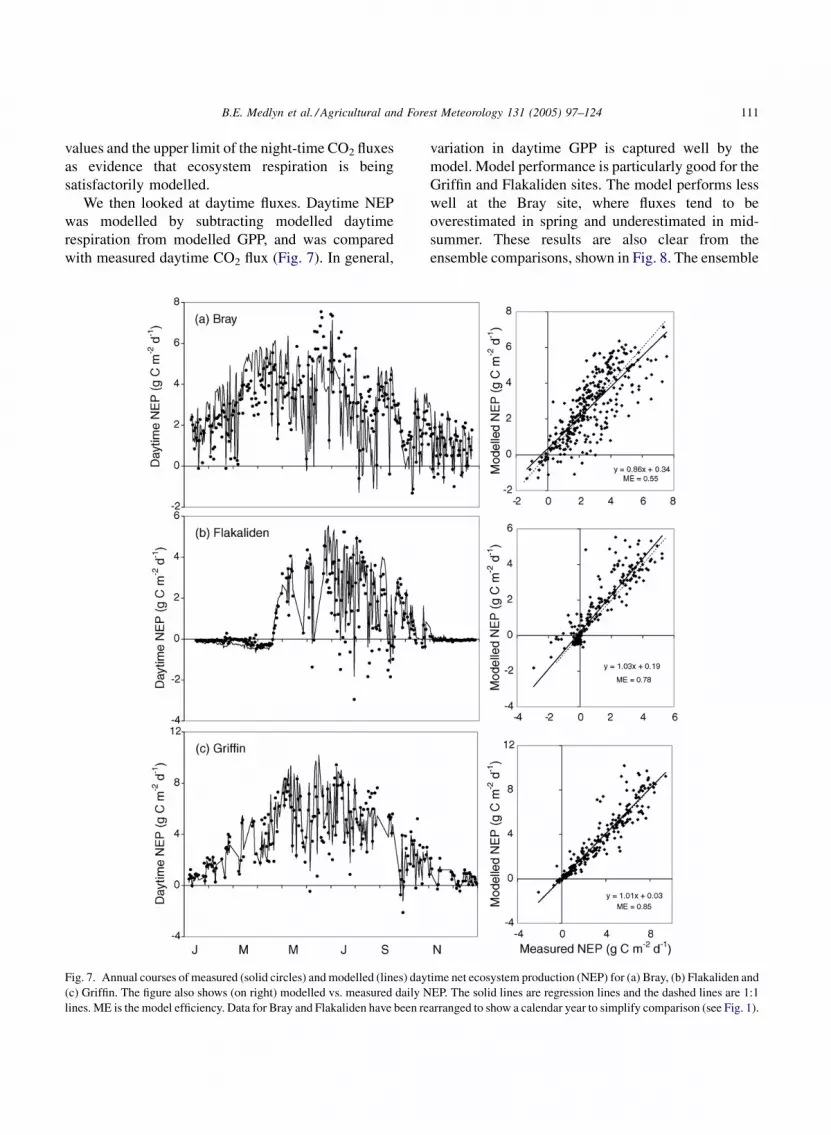
We then looked at daytime fluxes. Daytime NEP
was modelled by subtracting modelled daytime
respiration from modelled GPP, and was compared
with measured daytime CO2 flux (Fig. 7). In general,
Fig. 7. Annual courses of measured (solid circles) and modelled (lines) day
(c) Griffin. The figure also shows (on right) modelled vs. measured daily N
lines. ME is the model efficiency. Data for Bray and Flakaliden have been re
variation in daytime GPP is captured well by the
model. Model performance is particularly good for the
Griffin and Flakaliden sites. The model performs less
well at the Bray site, where fluxes tend to be
overestimated in spring and underestimated in mid-
summer. These results are also clear from the
ensemble comparisons, shown in Fig. 8. The ensemble
time net ecosystem production (NEP) for (a) Bray, (b) Flakaliden and
EP. The solid lines are regression lines and the dashed lines are 1:1
arranged to show a calendar year to simplify comparison (see Fig. 1).

B.E. Medlyn et al. / Agricultural and Forest Meteorology 131 (2005) 97–124112
values are averages of NEP for each half-hour over each
month. The comparison of modelled with measured
ensemble NEP is excellent for the Griffin and
Flakaliden sites. At Bray, daytime CO2 uptake increases
steadily between February and June, but this pattern is
Fig. 8. Measured (solid circles) and modelled (lines) monthly half-hour ne
and (c) Griffin. Ensembles are calculated by averaging NEP for each half
modelled vs. measured ensemble NEP. The solid lines are regression lines a
Bray and Flakaliden have been rearranged to show a calendar year to sim
not captured by the model. We believe this problem is
caused by the modelling of respiration (see Section 4).
Fig. 8 shows again that modelled night-time CO2
release from respiration is considerably larger than
measured night-time CO2 flux, particularly at Bray.
t ecosystem production (NEP) ensembles for (a) Bray, (b) Flakaliden
-hour with reliable CO2 flux data. The figure also shows (on right)
nd the dashed lines are 1:1 lines. ME is the model efficiency. Data for
plify comparison (see Fig. 1).
B.E. Medlyn et al. / Agricultural and Forest Meteorology 131 (2005) 97–124 113
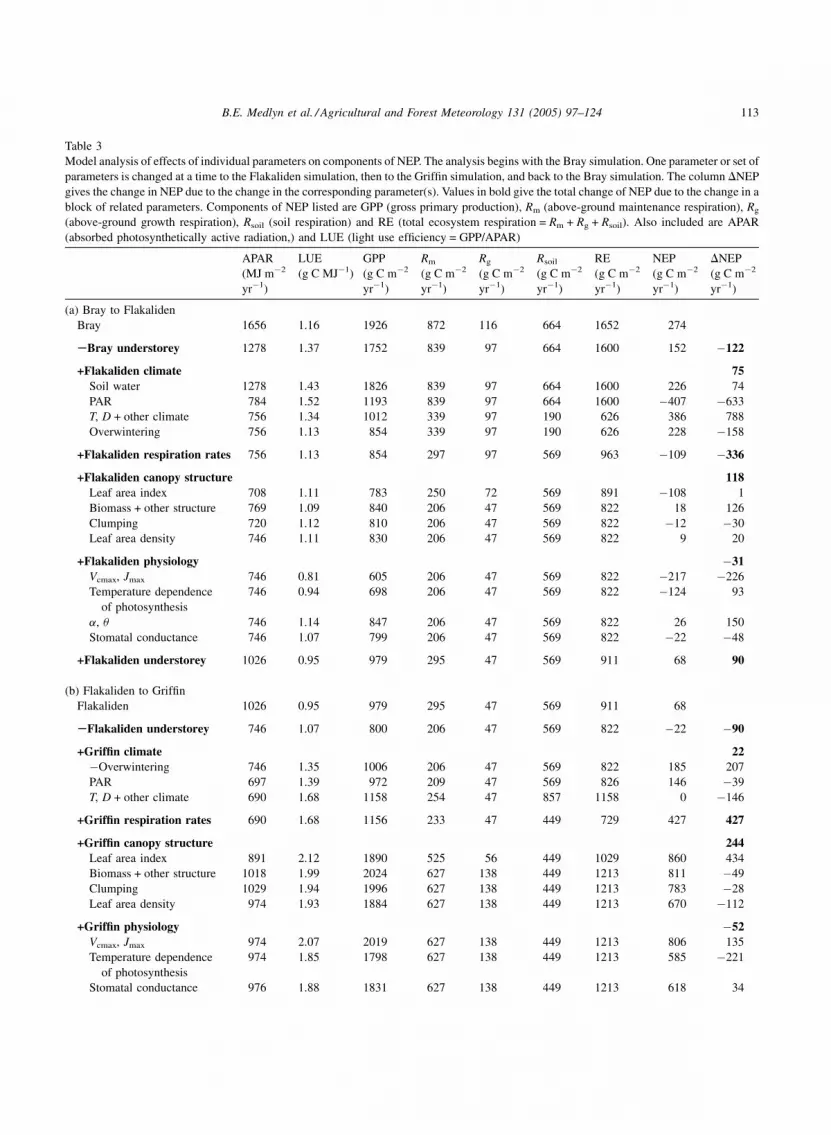
Table 3
Model analysis of effects of individual parameters on components of NEP. The analysis begins with the Bray simulation. One parameter or set of
parameters is changed at a time to the Flakaliden simulation, then to the Griffin simulation, and back to the Bray simulation. The column DNEP
gives the change in NEP due to the change in the corresponding parameter(s). Values in bold give the total change of NEP due to the change in a
block of related parameters. Components of NEP listed are GPP (gross primary production), Rm (above-ground maintenance respiration), Rg
(above-ground growth respiration), Rsoil (soil respiration) and RE (total ecosystem respiration = Rm + Rg + Rsoil). Also included are APAR
(absorbed photosynthetically active radiation,) and LUE (light use efficiency = GPP/APAR)
APAR
(MJ m�2
yr�1)
LUE
(g C MJ�1)
GPP
(g C m�2
yr�1)
Rm
(g C m�2
yr�1)
Rg
(g C m�2
yr�1)
Rsoil
(g C m�2
yr�1)
RE
(g C m�2
yr�1)
NEP
(g C m�2
yr�1)
DNEP
(g C m�2
yr�1)
(a) Bray to Flakaliden
Bray 1656 1.16 1926 872 116 664 1652 274
SBray understorey 1278 1.37 1752 839 97 664 1600 152 �122
+Flakaliden climate 75Soil water 1278 1.43 1826 839 97 664 1600 226 74
PAR 784 1.52 1193 839 97 664 1600 �407 �633
T, D + other climate 756 1.34 1012 339 97 190 626 386 788
Overwintering 756 1.13 854 339 97 190 626 228 �158
+Flakaliden respiration rates 756 1.13 854 297 97 569 963 �109 �336
+Flakaliden canopy structure 118Leaf area index 708 1.11 783 250 72 569 891 �108 1
Biomass + other structure 769 1.09 840 206 47 569 822 18 126
Clumping 720 1.12 810 206 47 569 822 �12 �30
Leaf area density 746 1.11 830 206 47 569 822 9 20
+Flakaliden physiology �31Vcmax, Jmax 746 0.81 605 206 47 569 822 �217 �226
Temperature dependence
of photosynthesis
746 0.94 698 206 47 569 822 �124 93
a, u 746 1.14 847 206 47 569 822 26 150
Stomatal conductance 746 1.07 799 206 47 569 822 �22 �48
+Flakaliden understorey 1026 0.95 979 295 47 569 911 68 90
(b) Flakaliden to Griffin
Flakaliden 1026 0.95 979 295 47 569 911 68
SFlakaliden understorey 746 1.07 800 206 47 569 822 �22 �90
+Griffin climate 22�Overwintering 746 1.35 1006 206 47 569 822 185 207
PAR 697 1.39 972 209 47 569 826 146 �39
T, D + other climate 690 1.68 1158 254 47 857 1158 0 �146
+Griffin respiration rates 690 1.68 1156 233 47 449 729 427 427
+Griffin canopy structure 244Leaf area index 891 2.12 1890 525 56 449 1029 860 434
Biomass + other structure 1018 1.99 2024 627 138 449 1213 811 �49
Clumping 1029 1.94 1996 627 138 449 1213 783 �28
Leaf area density 974 1.93 1884 627 138 449 1213 670 �112
+Griffin physiology �52Vcmax, Jmax 974 2.07 2019 627 138 449 1213 806 135
Temperature dependence
of photosynthesis
974 1.85 1798 627 138 449 1213 585 �221
Stomatal conductance 976 1.88 1831 627 138 449 1213 618 34

B.E. Medlyn et al. / Agricultural and Forest Meteorology 131 (2005) 97–124114
Table 3 (Continued )
APAR
(MJ m�2
yr�1)
LUE
(g C MJ�1)
GPP
(g C m�2
yr�1)
Rm
(g C m�2
yr�1)
Rg
(g C m�2
yr�1)
Rsoil
(g C m�2
yr�1)
RE
(g C m�2
yr�1)
NEP
(g C m�2
yr�1)
DNEP
(g C m�2
yr�1)
(c) Griffin to Bray
Griffin 976 1.88 1831 627 138 449 1213 618
+Bray climate �1705PAR 1865 1.23 2301 636 138 449 1223 1078 460
T, D + other climate 1846 1.35 2495 1217 138 2195 3549 �1054 �2131
Soil water 1846 1.33 2462 1217 138 2195 3549 �1087 �33
+Bray respiration rates 1846 1.33 2447 964 138 664 1766 681 1767
+Bray canopy structure �629Leaf area index 1502 1.13 1698 508 154 664 1326 371 �309
Biomass + other structure 1149 1.21 1392 839 97 664 1600 �208 �580
Clumping 1174 1.17 1375 839 97 664 1600 �225 �17
Leaf area density 1286 1.28 1652 839 97 664 1600 52 277
+Bray physiology 100Vcmax, Jmax 1286 1.59 2049 839 97 664 1600 448 396
Temperature dependence
of photosynthesis
1286 1.59 2048 839 97 664 1600 447 �1
a, u 1286 1.26 1624 839 97 664 1600 23 �424
Stomatal conductance 1278 1.37 1752 839 97 664 1600 152 129
+Bray understorey 1656 1.16 1926 872 116 664 1652 274 122
Annual totals of NEP can also be compared.
Modelled annual NEP for each site is given in Table 3
(first row of each section). These values can be
compared with the NEP estimated from flux data given
in Table 1. Modelled NEP overestimates the value
given for Flakaliden and underestimates that for Bray,
but the relative NEP of the three sites remains the
same.
In summary, model agreement with measurements
is satisfactory. This comparison cannot be used to say
that the model is correct, but does show that it can
reproduce the major features of the dataset, giving
some confidence in the realism of the model and its
suitability for our purpose.
3.2. Analysis of NEP
The results of the analysis of the difference in NEP
among sites are given in Table 3. In this analysis,
parameter sets were changed one at a time and the
effects on GPP, RE and NEP are recorded. The aim is to
show the relative importance of each parameter. There
is substantial uncertainty attached each value in Table 3,
owing to the uncertainty in parameter values and
model structure. These uncertainties are extremely
difficult to quantify. However, as a rough rule of thumb
based on considerable experience with the model,
we suggest that a change greater than 100 g C m�2 yr�1
(i.e., approx. 20% of NEP at the Bray site) can be
regarded as significant.
Beginning with the Bray site (Table 3a), the
contribution of the understorey was first removed,
reducing modelled NEP by 122 g C m�2 yr�1. The
climate was changed to that of the Flakaliden site in
four steps: first the soil water content, then the PAR,
thirdly all other climatic factors, primarily air and soil
temperature and relative humidity, and finally the
winter conditions preventing photosynthesis at Fla-
kaliden were taken into account. Low soil water
content at Bray was estimated to reduce NEP by
74 g C m�2 yr�1. Reducing the PAR to that of
Flakaliden had a dramatic effect on GPP, reducing
it by 633 g C m�2 yr�1, but reducing the temperature
had an even more dramatic effect on respiration,
reducing it by 968 g C m�2 yr�1. Winter conditions at
Flakaliden also served to reduce GPP significantly.
However, the effect on NEP of changing climate alone
from Bray to Flakaliden was quite small, an increase
of just 75 g C m�2 yr�1. Changing respiration rates
from Bray to Flakaliden caused a large decrease in

B.E. Medlyn et al. / Agricultural and Forest Meteorology 131 (2005) 97–124 115
NEP, of 336 g C m�2 yr�1, largely due to the increase
in soil respiration rate. Changing canopy structure
from Bray to Flakaliden served to increase NEP,
largely due to the decrease in maintenance and growth
respiration occasioned when respiring biomass was
changed from the large, tall trees at Bray to the small
ones at Flakaliden. Overall, there was little effect of
changing leaf physiology from Bray to Flakaliden,
despite the large differences in Jmax and Vcmax
parameters (see Fig. 3). The decrease in these
parameters caused a large decrease in NEP of
226 g C m�2 yr�1, but this was largely compensated
for by the change in temperature dependence of these
parameters, and the increase in the quantum yield. The
understorey at Flakaliden was estimated to add
90 g C m�2 yr�1 to the NEP.
Comparing the Flakaliden and Griffin sites
(Table 3b), changing the boreal climate of Flakaliden
to the maritime climate at Griffin had almost no effect
on NEP overall. The effect of PAR on GPP was small,
and although GPP was increased considerably by the
removal of the winter dormancy of photosynthesis,
increasing the temperature from Flakaliden to that of
Griffin caused a compensatory increase in respiration.
As with the Bray–Flakaliden comparison, a large
change in NEP was seen when respiration rates were
changed, because of the large difference in soil
respiration rate. Changing the canopy structure from
Flakaliden to Griffin also affected NEP considerably,
with an increase of 244 g C m�2 yr�1. The increase in
LAI had a large impact on GPP, as did the increased
canopy area. Changing the leaf physiology parameters
had a relatively small overall effect on NEP.
Comparing Griffin and Bray (Table 3c), the change
in climate decreased NEP dramatically. The increase
in PAR and temperature increased GPP by
664 g C m�2 yr�1, but maintenance and soil respira-
tion also increased, by 2326 g C m�2 yr�1, far out-
weighing the increase in GPP. Changing respiration
rates also had a major effect: maintenance respiration
was decreased by 252 g C m�2 yr�1 and soil respira-
tion by 1531 g C m�2 yr�1. The change in canopy
structure also decreased NEP significantly. Auto-
trophic respiration decreased considerably, because of
the smaller LAI at Bray, but the low LAI and canopy
area decreased GPP further. As with the earlier
comparisons, leaf physiology had a relatively small
overall effect on NEP. There was a large increase in
NEP due to the higher Jmax and Vcmax, but this increase
was counterbalanced by the effect of a lower quantum
yield.
Both GPP and RE thus varied considerably among
the sites, and the sensitivity analysis shown in Table 3
helps us to understand the reasons for this variation.
GPP was highest at Bray, slightly lower at Griffin, and
considerably lower at Flakaliden. Bray has the highest
GPP because it has the highest incident PAR and
temperature and the most productive leaf physiology.
Griffin has the next largest GPP because of its large
LAI; neither climate nor leaf physiology cause much
difference in GPP between Flakaliden and Griffin.
Above-ground autotrophic respiration is similar at the
Bray and Griffin sites, despite the much larger stem
biomass at Bray, because of the large leaf biomass at
Griffin. At Flakaliden, total biomass is low, so above-
ground respiration is low. Soil respiration was highest
at Bray, slightly lower at Flakaliden, and lower again
at Griffin, and these differences are due to a
combination of soil temperature, which is highest at
Bray, and the relationship between soil respiration and
temperature, which is highest at Flakaliden. We thus
see that climate alone does not determine NEP; LAI,
soil respiration, and respiring biomass are also key
determinants.
4. Discussion
The number of eddy flux sites measuring NEP of
forests and other ecosystems around the world is
growing rapidly, and many estimates of annual NEP
are now available from these data (Baldocchi et al.,
2001). However, we are limited in our ability to
generalise from these experimental sites because the
analysis of the differences among sites is still in its
early stages (IPCC, 2003). This analysis is complex
because of the multiplicity of factors that affect NEP.
Straightforward comparison of flux datasets shows
only the gross differences among ecosystems, whereas
we need to understand the importance of individual
factors in determining NEP. As most inter-site
comparisons involve many confounded factors, the
logical way to separate out their influence is to use a
model. A modelling approach has been taken
previously by Law et al. (2001), who used the model

B.E. Medlyn et al. / Agricultural and Forest Meteorology 131 (2005) 97–124116
3PG to separate out the effects of LAI and climate on
the NEP of young and old stands of ponderosa pine.
Here, we used the model MAESTRA to separate
out the effects of climate, stand structure and
physiology on NEP of three coniferous forest stands
growing in contrasting climates. The results of the
analysis show clearly why annual NEP does not vary
straightforwardly among sites. Climate alone has
several different effects: an increase in PAR increases
GPP, but the concomitant increase in temperature also
has a large effect on respiration and may or may not
increase GPP, depending on whether low winter
temperatures restrict photosynthesis, or whether high
summer temperatures result in drought. Soil respira-
tion rates also differed considerably among sites, and
these had a huge effect on modelled NEP. Leaf area
index and respiring biomass were also found to have
substantial effects on NEP. Individual aspects of leaf
physiology could influence NEP significantly, but,
interestingly, changing the suite of leaf physiology
parameters from one site to another suggested that the
overall effect of leaf physiology was small.
For this analysis to be credible, we must have
confidence in the model used, and in the assumed
differences in parameters. We now consider each of
these in turn.
4.1. Model validity
We believe that the model is appropriate for this
analysis because it embodies current best understanding
of forest gas exchange and because it can reproduce the
main features of the datasets. The MAESTRA model
has a long pedigree: it was developed from the
MAESTRO model (Wang and Jarvis, 1990a), which
was first published in 1990 and has been successfully
applied in a wide range of contexts since then (Medlyn,
2004). The model is very similar in structure to many
other models applied to eddy covariance data (e.g.
Baldocchi and Wilson, 2001) and it seems likely that
most current models would yield similar conclusions to
this study. However, it is important to be aware that
there is considerable uncertainty in model structure,
parameter values, and the data (for more detail, see
Medlyn et al., 2005). To account for this uncertainty, we
suggest that only relatively large shifts in model outputs
(changes greater than 100 g C m�2) should be treated as
significant.
Although comparison with the flux data cannot
prove the model to be correct, it shows that the model
can, in general, adequately reproduce the datasets.
Fluxes at the Griffin site were simulated well
throughout the year. At Flakaliden, there was a slight
overestimation (by 9%) of daily CO2 uptake through
the year. This error is within the range of uncertainty
of eddy flux data (Anthoni et al., 1999). There is
however one major discrepancy between model output
and data at the Bray site, where CO2 uptake was
overestimated in spring and underestimated in
summer. This problem may be related to the way
that we model respiration. Note that in Fig. 8, where
monthly ensembles of NEP are compared, midday
NEP from flux measurements for the Bray site
increases steadily during the first half of the year,
whereas modelled midday NEP begins to decrease
after March. In the model, this decrease occurs
because, as temperature increases from spring to
summer, the respiration rate increases faster than GPP.
This effect is not seen in the flux data. Fig. 9 illustrates
the importance in the model of the temperature
dependence of respiration. Monthly ensemble NEP is
plotted against incident PAR for the months of
February and May and it can be seen that the response
of NEP to PAR is similar in both months. Adding
modelled respiration, which depends on temperature,
gives GPP. The response of GPP to PAR is seen to be
quite different between the months. The temperature
dependence of GPP is inadequate to explain this large
increase between February and May. The implication
is that the temperature dependence of respiration in the
model is too large.
There has recently been considerable debate about
the adequacy of our current ability to model
respiration (Dewar et al., 1999; Cannell and Thornley,
2000; Gifford, 2003). Several authors have suggested
that, instead of a temperature-driven growth-main-
tenance paradigm, plant respiration should instead be
linked to photosynthetic production (Dewar et al.,
1999; Gifford, 2003; Whitehead et al., 2004). Our
results provide further evidence that the standard
respiration model is inadequate. We attempted to test
the respiration component of the model against flux
data using night-time CO2 efflux (Fig. 6). The
modelled respiration tended to overestimate the flux
data, as has been found by a number of other studies
(Lavigne et al., 1997; Law et al., 1999). Current

B.E. Medlyn et al. / Agricultural and Forest Meteorology 131 (2005) 97–124 117
Fig. 9. (a) Half-hourly averages of net ecosystem production (NEP) from flux measurements vs. half-hourly averages of incident photo-
synthetically active radiation (PAR) for the Bray site in February (solid circles) and May (open squares). (b) Half-hourly averages of gross
primary productivity (GPP), calculated by summing NEP and modelled respiration, vs. half-hourly averages of incident PAR for the Bray site in
February (solid circles) and May (open squares).
thinking is that eddy covariance underestimates night-
time fluxes, particularly in stable conditions (Aubinet
et al., 2003) and hence the discrepancy shown in Fig. 6
does not necessarily indicate a problem with the
model. Reliable estimates of night-time CO2 flux
would be invaluable in aiding us to develop better
respiration models.
4.2. Major differences among sites
4.2.1. Soil respiration
Differences in the rate of soil respiration at a given
soil temperature were one of the most important
influences on NEP. The responses used in the model
were very different (Fig. 5), with respiration rate at a
given soil temperature being generally highest for
Flakaliden and lowest for Bray. Janssens et al. (2001)
attributed the high soil CO2 efflux at Griffin and
Flakaliden to the effects of disturbance at plantation
establishment (ploughing and fertilisation at Griffin;
clear-felling, prescribed burning, and soil scarification
at Flakaliden), while the low soil CO2 efflux at Bray
was attributed to low soil moisture content. These
explanations are clearly speculative.
A possible alternative hypothesis is acclimation of
respiration to soil temperature. Fig. 5 illustrates that
soil respiration at the average soil temperature for each
site is similar, a result which is consistent with the

B.E. Medlyn et al. / Agricultural and Forest Meteorology 131 (2005) 97–124118
outcome of a soil warming experiment at Flakaliden
(Stromgren, 2001). After 4 years of warming, the soil
respiration rate at the increased temperature in the
warmed plot was similar to the rate at ambient
temperature in the unwarmed plot. However, acclima-
tion to soil warming may have different causes than
acclimation to soil temperature in different climates.
In the soil warming experiment, a major hypothesis for
the acclimation was a reduction in substrate avail-
ability for heterotrophic respiration (Eliasson et al.,
2005), whereas a comparison of soil carbon pools
across the three sites considered here suggests that
substrate availability may have been lowest in the
coldest site, Flakaliden. Soil carbon in the top 50 cm
(including litter layer) at Flakaliden was estimated at
4.5 kg C m�2 (Andersson et al., 2002), whereas it was
11 kg C m�2 in the top 30 cm at Griffin (Wingate,
2003) and 10.5 kg C m�2 in the top 30 cm at Bray (D.
Loustau, personal communication).
The methodology used to measure soil respiration
at the three sites differed slightly, which may also have
contributed to the difference in measured soil
respiration rates. It is known that soil respiration
rates are quite sensitive to the measurement system.
Comparisons of measurement systems by Norman
et al. (1997) and Janssens et al. (2000) suggest that the
system used at the Griffin site (CIRAS-1 closed
dynamic system) may give higher respiration rates
than the open dynamic systems used at the other sites.
However, the differences in respiration found by those
comparisons are considerably smaller (10–46%,
Janssens et al., 2000) than the differences among
sites found here (3–10 times larger at Flakaliden and
Griffin than at Bray). There have been some additional
measurements at the Bray site yielding higher rates of
soil respiration (D. Loustau, personal communica-
tion), but using these rates makes it impossible to close
the carbon balance at this site. In summary, the
evidence is good for quite different soil respiration
rates at the three sites, but we do not completely
understand why these rates differ.
4.2.2. Above-ground respiration
Both respiring biomass and maintenance respira-
tion rates have moderate impacts on NEP (Table 3).
There are clear differences in woody biomass among
the three sites, which are substantiated by inventories:
woody biomass is more than three times greater at
Bray than at Flakaliden (Table 2). Biomass is
evidently a function of both plantation age and growth
rate. It is interesting that woody maintenance
respiration rates are also considerably larger for Bray
than for Flakaliden (Fig. 4), even when segment
diameter is taken into account. We hypothesise that the
maintenance respiration rate is larger at Bray because
of increased cellular activity, i.e. increased growth
rate. This difference also lends support to the
argument that respiration rate should be linked to
photosynthesis, discussed above. This hypothesis
should be explored further, carefully accounting for
within-tree variation in rates.
4.2.3. Total respiration
Previous analyses comparing these sites have
stressed the importance of respiration in determining
NEP (Valentini et al., 2000; Janssens et al., 2001). This
study confirms the importance of respiration but there
are some points of disagreement with previous studies.
Valentini et al. (2000) suggested that GPP was
constant with latitude and that differences in NEP
were entirely driven by differences in ecosystem
respiration. In contrast, the current analysis suggests
large differences in GPP among sites, largely driven
by the considerable differences in climate, with
secondary effects of needle photosynthetic rates and
leaf area index. The study by Janssens et al. (2001)
also shows considerable variation in GPP among sites,
and they suggest that RE is related to GPP. They focus
on the role of soil respiration in explaining the high
rates of ecosystem respiration in the northern sites,
citing the effect of ploughing at establishment to
explain high RE at the Griffin site. Here, however, the
estimated ratio of RE:GPP was similar for Bray and
Flakaliden (0.86 and 0.93, respectively), it was
considerably lower for Griffin (0.66). Soil respiration
was actually quite low at Griffin; plant respiration was
relatively high owing to the large LAI, but the LAI
also resulted in a large GPP and hence a lower RE:GPP
ratio.
4.2.4. Leaf area index
Mean LAI was similar at the Bray and Flakaliden
sites but much higher at Griffin, with significant
consequences for NEP (Table 3). Light interception,
photosynthesis, and respiration were all increased, but
the overall effect was a large increase in NEP. LAI has

B.E. Medlyn et al. / Agricultural and Forest Meteorology 131 (2005) 97–124 119
also been shown to be a key determinant of NEP in a
study comparing young and old ponderosa pine forests
(Anthoni et al., 2002).
The high LAI at Griffin is due to a combination of
factors including fertility, climate, and age. Bray and
Flakaliden are both relatively infertile sites and their
LAI can be increased dramatically with the regular
addition of fertiliser (Bergh et al., 1999; D. Loustau,
personal communication). The climate at Griffin is
mild, with neither the harsh winters of Flakaliden nor
the summer droughts of Bray, both of which restrict
leaf area development. Finally, Griffin forest is the
youngest of the three plantations and had only recently
reached canopy closure.
4.2.5. Canopy structure
Inspection of Table 3 shows that the leaf area
density distribution, both within crowns (leaf area
density) and the crown size (included in biomass +
other structure) has a significant effect on light
interception, GPP and thus NEP. The importance of
leaf area density for GPP and NEP is explored further
by Wang and Jarvis (1990b). The clumping of foliage
into shoots, in contrast, has almost no effect on NEP.
The parameter describing this clumping was identified
by Baldocchi and Wilson (2001) as a key parameter
for deciduous trees. However, here it varied only
slightly among sites and indeed the difference was
unlikely to be significant, explaining the low
sensitivity of the analysis to this parameter.
4.2.6. Leaf physiology
There appeared to be significant differences among
species in foliar physiology. There were large
differences in A–Ci responses (Fig. 2), in the
relationship between stomatal conductance and
photosynthetic rate (Fig. 3), and in the quantum yield
of electron transport.
The difference in A–Ci responses and hence the
photosynthetic parameters Jmax and Vcmax may have
been in part mediated by needle nitrogen content. The
nitrogen content of the needles measured for Fig. 2
was 1.8, 2.0 and 3.7 g m�2 on a half-total leaf surface
area basis for P. sitchensis, P. abies, and P. pinaster,
respectively. We note that it is also possible that
differences in experimental procedure such as lighting
and needle arrangement contributed to the difference
in responses. However, the differences in the stomatal
conductance relationships followed the same pattern
among species as the A–Ci responses, with the slope of
stomatal conductance versus photosynthesis being
largest for P. pinaster and smallest for P. abies (Fig. 3).
As photosynthesis is included on the x-axis, metho-
dological differences in lighting and needle arrange-
ment are less likely to be of importance here. There are
few other comparative studies of how the relationship
shown in Fig. 3 varies among species; it would be
interesting to know if the relative rankings shown in
Figs. 2 and 3 generalise to other species.
The evidence for the differences in the quantum
yield parameter is, unfortunately, quite flimsy,
particularly as quantum yield is a highly sensitive
parameter in the model (Medlyn et al., 2005). Earlier
versions of the model assumed that this parameter was
fixed and equal to its theoretical value of 0.425 (Evans
and Farquhar, 1991), but comparisons of model output
with eddy flux data showed that this value was clearly
too high (Ibrom et al., unpublished manuscript). It is
not altogether clear why this parameter is less than its
theoretical value, nor how it should be measured at
leaf scale. The two parameter values used here were
obtained by (i) fitting the parameter to light-response
curves (Porte and Loustau, 1998) and (ii) estimating
the parameter from previous measurements of needle
gas exchange response to incident radiation (Leverenz
and Jarvis, 1979; Ibrom et al., unpublished manu-
script). Neither set of measurements was made at a
saturating CO2 concentration. In the first case the
curvature parameter u was also fitted to data (and was
highly correlated with a), while in the second case a
fixed value of u was assumed. Because of these
differences in methodology, it is uncertain whether the
difference in quantum yield, although considerable
(0.2 versus 0.3), is genuine. There are also few other
estimates in the literature that could be used to
compare these values against. Better quantification of
this parameter is needed.
Interestingly, despite the large differences in
parameterisations for needle physiology, the overall
effect of physiology on NEP was quite small.
Changing individual parameters gave large changes
in NEP, but the changes due to different parameters
appeared to compensate, so the overall effect of
changing the total suite of physiological parameters
from one species to another was small. This result
poses the question of whether the small effect of

B.E. Medlyn et al. / Agricultural and Forest Meteorology 131 (2005) 97–124120
physiology is coincidental in these cases, or whether
the physiological parameters are always correlated in
such a way as to have little overall effect on NEP. The
modelling study by McMurtrie et al. (1994), in which
conifer GPP was found to be roughly proportional to
utilisable absorbed PAR in different climates, suggests
that physiology does not play a large role in
determining GPP. A similar conclusion is suggested
by the work of Buchmann and Schulze (1999), who
found that the mean maximum rate of light-saturated
assimilation in eddy flux studies on conifers increased
consistently with increasing leaf area index. However,
further research is required to confirm this conclusion,
and also, if found to be correct, to answer the question
of why significant leaf-level differences in physiology
are compensatory at the canopy level.
4.2.7. Climate
The finding that climate has several opposing
effects on NEP echoes the results of many other
studies. For example, Law et al. (2002), in a
comparative study of 34 eddy flux sites, showed that
GEP was related to site water balance and tempera-
ture, but that RE was poorly correlated with
temperature across sites, with the result that the only
discernible influence of climate on NEP was a weak
correlation with site water balance. Barr et al. (2002)
also illustrate how temperature does not have a
consistent effect on NEP. They showed that years with
a warm spring in a temperate deciduous forest had
reduced NEP because of increased respiration and
drought stress, while NEP was increased by warm
springs in a boreal deciduous forest owing to earlier
leaf-out. The likelihood that differences in LAI are
related to climate adds yet another dimension to the
complex response of NEP to climate.
4.3. Further research needs
This study indicates that considerable further
research is needed before we will be able to
extrapolate from current eddy flux studies to reliably
predict NEP for other forest ecosystems.
We would argue that one important step would be
to analyse data from other flux sites using the detailed,
model-based methodology used here. This methodol-
ogy allows us to separate out the individual effects of
climate, structure and physiology on NEP for any
given site. Detailed characterisations of structure and
physiology are available for many sites but are often
not linked quantitatively to NEP.
Soil respiration represents another important
knowledge gap. The analysis presented here shows
that soil respiration rates are one of the most important
controls on NEP. However, they can at present only be
modelled using site-specific empirical relationships
and we have little idea of how to generalise from these
relationships to other sites. Process-based models of
soil respiration rates are urgently required.
We also show that modelling of plant respiration is
problematic. There is disagreement about whether the
growth-maintenance paradigm of plant respiration
(Amthor, 2000) is adequate to model annual respira-
tion rates, or whether respiration rates should be linked
to photosynthetic uptake on this timescale (Gifford,
2003). Night-time eddy flux data should be of use in
enabling us to quantify ecosystem respiration more
accurately, but unfortunately these data are affected by
high uncertainty, particularly when turbulence is low
(Massman and Lee, 2002; Baldocchi, 2003). Reducing
the uncertainty in night-time fluxes would aid
significantly in developing better models of ecosystem
respiration.
Finally, the exercise of comparing physiological
parameters across sites has highlighted our poor
understanding of how some of these parameters (such
as stomatal conductance, quantum yield, and respira-
tion rates) vary among different forest systems. In
these comparisons, confounding due to methodologi-
cal differences was a serious problem. Further
comparative studies of these parameters, that aim to
link variation in parameters with factors such as
climate, species, and nutrition, would be very helpful
in our attempts to generalise. However, the use of
comparable methodologies in such studies is essential.
5. Conclusions
This study focussed on three forest sites whose
carbon balance, or NEP, was shown to differ using
eddy flux measurements. A modelling analysis was
used to identify the main factors causing the difference
in NEP. Differences in climate affected both carbon
uptake and release but could not alone account for the
differences in NEP. Differences in soil respiration

B.E. Medlyn et al. / Agricultural and Forest Meteorology 131 (2005) 97–124 121
rates were found to be extremely important, but their
variation among sites was difficult to explain.
Differences in plant respiration rates, respiring
biomass, and leaf area index also contributed
significantly to the difference in NEP among sites.
If we are to generalise from flux studies to other forest
patches, each of these factors needs to be quantified.
Acknowledgements
BM was supported by an Australia Research
Council Post Doctoral Fellowship. RM was supported
by an Australia Research Council Discovery Grant.
We are very grateful to Johan Bergh, Eric Ceschia,
Michael Freeman, Peter Roberntz, Monika Stromgren,
Jan Stockfors, Britta Widen, and Jerry Skoglund and
his undergraduate students (Sweden), Alexandre
Bosc, Sylvain Delzon, and Annabel Porte (France),
and Craig Barton and Patrick Meir (U.K.) for
supplying data used in parameterisation. Thanks to
Ying-Ping Wang, as ever, for supplying the original
MAESTRO model.
References
Amthor, J.S., 2000. The McCree–de Wit–Penning de Vries–Thorn-
ley respiration paradigms: 30 years later. Ann. Bot. 86, 1–20.
Andersson, P., Berggren, D., Nilsson, I., 2002. Indices for nitrogen
status and nitrate leaching from soils under Norway spruce
(Picea abies (L.) Karst) stands in Sweden. For. Ecol. Manage.
157, 39–53.
Andreae, M.O., Artaxo, P., Brandao, C., Carswell, F.E., Ciccioli, P.,
da Costa, A.L., Culf, A.D., Esteves, J.L., Gash, J.H.C., Grace, J.,
Kabat, P., Lelieveld, J., Malhi, Y., Manzi, A.O., Meixner, F.X.,
Nobre, A.D., Nobre, C., Ruivo, M.d.L.P., Silva-Dias, M.A.,
Stefani, P., Valentini, R., Jouanne, J., von Waterloo, M.J.,
2002. Biogeochemical cycling of carbon, water, energy, trace
gases, and aerosols in Amazonia: the LBA-EUSTACH experi-
ments. J. Geophys. Res. 107 (D20). doi:10.1029/2001JD000524.
Anthoni, P.M., Law, B.E., Unsworth, M.H., 1999. Carbon and water
vapor exchange of an open-canopied Ponderosa pine ecosystem.
Agric. For. Meteorol. 95, 151–168.
Anthoni, P.M., Unsworth, M.H., Law, B.E., Irvine, J., Baldocchi,
D.D., Van Tuyl, S., Moore, D., 2002. Seasonal differences in
carbon and water vapor exchange in young and old-growth
ponderosa pine ecosystems. Agric. For. Meteorol. 111, 203–222.
Arain, M.A., Black, T.A., Barr, A.G., Jarvis, P.G., Massheder, J.M.,
Verseghy, D.L., Nesic, Z., 2002. Effects of seasonal and inter-
annual climate variability on net ecosystem productivity of
boreal deciduous and conifer forests. Can. J. For. Res. 32,
878–891.
Aubinet, M., Grelle, A., Ibrom, A., Rannik, U., Moncrieff, J., Foken,
T., Kowalski, A.S., Martin, P.H., Berbigier, P., Bernhofer, C.,
Clement, R., Elbers, J., Granier, A., Grunwald, T., Morgenstern,
K., Pilegaard, K., Rebmann, C., Snijders, W., Valentini, R.,
Vesala, T., 2000. Estimates of the annual net carbon and water
exchange of forests: the EUROFLUX methodology. Adv. Ecol.
Res. 30, 113–175.
Aubinet, M., Clement, R., Elbers, J.A., Folken, T., Grelle, A., Ibrom,
A., Moncrieff, J., Pilegaard, K., Rannik, U., Rebmann, C., 2003.
Methodology for data acquisition, storage and treatment. In:
Valentini, R. (Ed.), Fluxes of Carbon, Water and Energy of
European Forests. Springer-Verlag, Berlin, Heidelberg, pp. 9–
35.
Baldocchi, D.D., 2003. Assessing the eddy covariance technique for
evaluating carbon dioxide exchange rates of ecosystems: past,
present and future. Glob. Change Biol. 9, 479–492.
Baldocchi, D.D., Wilson, K.B., 2001. Modeling CO2 and water
vapor exchange of a temperate broadleaved forest across hourly
to decadal time scales. Ecol. Modell. 142, 155–184.
Baldocchi, D., Falge, E., Gu, L.H., Olson, R., Hollinger, D., Run-
ning, S., Anthoni, P., Bernhofer, C., Davis, K., Evans, R.,
Fuentes, J., Goldstein, A., Katul, G., Law, B., Lee, X.H., Malhi,
Y., Meyers, T., Munger, W., Oechel, W., Paw, U.K.T., Pilegaard,
K., Schmid, H.P., Valentini, R., Verma, S., Vesala, T., Wilson, K.,
Wofsy, S., 2001. FLUXNET: a new tool to study the temporal
and spatial variability of ecosystem-scale carbon dioxide, water
vapor, and energy flux densities. Bull. Am. Meteorol. Soc. 82,
2415–2434.
Ball, J.T., Woodrow, I.E., Berry, J.A., 1987. A model predicting
stomatal conductance and its contribution to the control of
photosynthesis under different environmental conditions. In:
Biggins, J. (Ed.), Progress in Photosynthesis Research. Marti-
nus-Nijhoff Publishers. Dordrecht, The Netherlands, pp. 221–
224.
Barclay, H.J., Goodman, D., 2000. Conversion of total to projected
leaf area index in conifers. Can. J. Bot. 78, 447–454.
Barford, C., Wofsy, S.C., Goulden, M.L., Munger, J.W., Pyle, E.H.,
Urbanski, S., Hutyra, L., Saleska, S.R., Fitzjarrald, D., Moore,
K., 2001. Factors controlling long- and short-term sequestration
of atmospheric CO2 in a mid-latitude forest. Science 294, 1688–
1691.
Barr, A.G., Griffis, T.J., Black, T.A., Lee, X.H., Staebler, R.M.,
Fuentes, J.D., Chen, Z., Morgenstern, K., 2002. Comparing the
carbon budgets of boreal and temperate deciduous forest stands.
Can. J. For. Res. 32, 813–822.
Barton, C.V.M., 1997. Effects of elevated atmospheric carbon
dioxide concentration on growth and physiology of Sitka spruce
(Picea sitchensis (Bong.) Carr.). Ph.D. Edinburgh University, p.
203.
Barton, C.V.M., Jarvis, P.G., 1999. Growth response of branches of
Picea sitchensis to four years exposure to elevated atmospheric
carbon dioxide concentration. New Phytol. 144, 233–243.
Berbigier, P., Bonnefond, J.M., 1995. Measurement and modelling
of radiation transmission within a stand of maritime pine (Pinus
pinaster Ait.). Ann. Sci. For. 52, 23–42.

B.E. Medlyn et al. / Agricultural and Forest Meteorology 131 (2005) 97–124122
Berbigier, P., Bonnefond, J.M., Mellmann, P., 2001. CO2 and water
vapour fluxes for 2 years above Euroflux forest site. Agric. For.
Meteorol. 108, 183–197.
Bergh, J., McMurtrie, R.E., Linder, S., 1998. Climatic factors
controlling the productivity of Norway spruce: a model-based
analysis. For. Ecol. Manage. 110, 127–139.
Bergh, J., Linder, S., Lundmark, T., Elfving, B., 1999. The effect of
water and nutrient availability on the productivity of Norway
spruce in northern and southern Sweden. For. Ecol. Manage.
119, 51–62.
Bosc, A., 1999. Etude experimentale du fonctionnement hydrique et
carbone des organes aeriens du Pin maritime (Pinus pinaster
Ait.). Ph.D. Universite Victor Segalen Bordeaux 2.
Bosc, A., De Grandcourt, A., Loustau, D., 2003. Variability of stem
and branch maintenance respiration in a Pinus pinaster tree. Tree
Physiol. 23, 227–236.
Brooks, A., Farquhar, G.D., 1985. Effect of temperature on the CO2/
O2 specificity of ribulose-1,5-bisphosphate carboxylase/oxyge-
nase and the rate of respiration in the light. Planta 165, 397–406.
Buchmann, N., Schulze, E.D., 1999. Net CO2 and H2O fluxes of
terrestrial ecosystems. Glob. Biogeochem. Cycles 13, 751–760.
Cannell, M.G.R., Thornley, J.M.H., 2000. Modelling the compo-
nents of plant respiration: some guiding principles. Ann. Bot. 85,
45–54.
Ceschia, E., 2001. Environmental effects on spatial and seasonal
variations of stem respiration in European beech and Norway
spruce. Doctoral Thesis. Acta Univ. Agric. Suec., Silvestria 219,
56 pp.
Chung, H.H., Barnes, R.L., 1977. Photosynthate allocation in Pinus
taeda. I. Substrate requirements for synthesis of shoot biomass.
Can. J. For. Res. 7, 106–111.
Clark, K.L., Gholz, H.L., Moncrieff, J.B., Cropley, F., Loescher,
H.W., 1999. Environmental controls over net exchanges of
carbon dioxide from contrasting Florida ecosystems. Ecol. Appl.
9, 936–948.
Clement, R., Moncrieff, J.B., Jarvis, P.G., 2003. Net carbon pro-
ductivity of Sitka spruce forest in Scotland. Scottish Forestry 57,
5–10.
Clement, R., 2004. Mass and energy exchange of a plantation forest
in Scotland using micrometeorological methods. Ph.D. Univer-
sity of Edinburgh.
Delzon, S., 2000. Photosynthese de la Molinie (Molinia coerulea
(L.) Moench) en sous-bois de Pin maritime, aux niveaux de la
feuille et du couvert. D.E.A. Universite d’Orsay-Paris XI, 35 pp.
Dewar, R.C., Medlyn, B.E., McMurtrie, R.E., 1999. Acclimation of
the respiration photosynthesis ratio to temperature: insights from
a model. Glob. Change Biol. 5, 615–622.
Eliasson, P.E., McMurtrie, R.E., Pepper, D.A., Stromgren, M.,
Linder, S., Agren, G.I., 2005. The response of heterotrophic
CO2 flux to soil warming. Glob. Change Biol. 11, 167–181.
Evans, J.R., Farquhar, G.D., 1991. Modeling canopy photosynthesis
from biochemistry of the C3 chloroplast. In: Boote, K.J.,Loomis,
R.S. (Eds.), Modeling Crop Photosynthesis—From Biochemis-
try to Canopy. Crop Science Society of America, Madison, WI,
pp. 1–17.
Falge, E., Baldocchi, D., Olson, R., Anthoni, P., Aubinet, M.,
Bernhofer, C., Burba, G., Ceulemans, R., Clement, R., Dolman,
H., Granier, A., Gross, P., Grunwald, T., Hollinger, D., Jensen,
N.O., Katul, G., Keronen, P., Kowalski, A.S., Lai, C.T., Law,
B.E., Meyers, T., Moncrieff, J., Moors, E., Munger, J.W.,
Pilegaard, K., Rannik, U., Rebmann, C., Suyker, A., Tenhunen,
J., Tu, K., Verma, S., Vesala, T., Wilson, K., Wofsy, S., 2001. Gap
filling strategies for defensible annual sums of net ecosystem
exchange. Agric. For. Meteorol. 107, 43–69.
Farquhar, G.D., Von Caemmerer, S., Berry, J.A., 1980. A biochem-
ical model of photosynthetic carbon dioxide assimilation in
leaves of 3-carbon pathway species. Planta 149, 78–90.
Gifford, R.M., 2003. Plant respiration in productivity models:
conceptualisation, representation and issues for global terrestrial
carbon-cycle research. Funct. Plant Biol. 30, 171–186.
Granier, A., Loustau, D., 1994. Measuring and modelling the
transpiration of a maritime pine canopy from sap-flow data.
Agric. For. Meteorol. 71, 61–81.
Griffis, T.J., Black, T.A., Morgenstern, K., Barr, A.G., Nesic, Z.,
Drewitt, G.B., Gaumont-Guay, D., McCaughey, J.H., 2003.
Ecophysiological controls on the carbon balances of three
southern boreal forests. Agric. For. Meteorol. 117, 53–71.
IPCC, 2003. IPCC meeting on current scientific understanding of the
processes affecting terrestrial carbon stocks and human influ-
ences upon them. In: Schimel, D., Manning, M. (Eds.), IPCC
Expert Meeting Report. IPCC Secretariat, Geneva, Switzerland,
p. 34.
Janssens, I.A., Kowalski, A., Longdoz, B., Ceulemans, R., 2000.
Assessing forest soil CO2 efflux: an in situ comparison of four
techniques. Tree Physiol. 20, 23–32.
Janssens, I.A., Lankreijer, H., Matteucci, G., Kowalski, A.S., Buch-
mann, N., Epron, D., Pilegaard, K., Kutsch, W., Longdoz, B.,
Grunwald, T., Montagnani, L., Dore, S., Rebmann, C., Moors,
E.J., Grelle, A., Rannik, U., Morgenstern, K., Berbigier, P.,
Ibrom, A., Moncrieff, J., Aubinet, M., Bernhofer, C., Jensen,
N.O., Vesala, T., Granier, A., Schulze, E.-D., Lindroth, A.,
Dolman, A.J., Jarvis, P.G., Ceulemans, R., Valentini, R.,
2001. Productivity overshadows temperature in determining soil
and ecosystem respiration across European forests. Glob.
Change Biol. 7, 269–278.
Jarvis, P.G., 1976. The interpretation of the variations in leaf water
potential and stomatal conductance found in canopies in the
field. Phil. Trans. Roy. Soc. London, Ser. B 273, 593–610.
Jarvis, P.G., Leverenz, J.W., 1983. Productivity of temperate, decid-
uous and evergreen forests. In: Lange, O.L., Nobel, P.S., Os-
mond, C.B., Ziegler, H. (Eds.), Encyclopedia of Plant
Physiology, 12D Physiological Plant Ecology IV. Ecosystem
Processes: Mineral Cycling, Productivity and Man’s Influence.
Springer-Verlag, Berlin, pp. 234–280.
Lavigne, M.B., Ryan, M.G., Anderson, D.E., Baldocchi, D.D., Crill,
P.M., Fitzjarrald, D.R., Goulden, M.L., Gower, S.T., Massheder,
J.M., McCaughey, J.H., Rayment, M., Striegl, R.G., 1997.
Comparing nocturnal eddy covariance measurements to esti-
mates of ecosystem respiration made by scaling chamber mea-
surements at six coniferous boreal sites. J. Geophys. Res. 102,
28977–28985.
Law, B.E., Goldstein, A.H., Anthoni, P.M., Unsworth, M.H., Panek,
J.A., Bauer, M.R.J., Fracheboud, M., Huiltman, N., 2001. Car-
bon dioxide and water vapor exchange by young and old

B.E. Medlyn et al. / Agricultural and Forest Meteorology 131 (2005) 97–124 123
ponderosa pine ecosystems during a dry summer. Tree Physiol.
21, 299–308.
Law, B.E., Ryan, M.G., Anthoni, P.M., 1999. Seasonal and annual
respiration of a ponderosa pine ecosystem. Glob. Change Biol. 5,
169–182.
Law, B.E., Falge, E., Gu, L., Baldocchi, D.D., Bakwin, P., Berbigier,
P., Davis, K., Dolman, A.J., Falk, M., Fuentes, J.D., Goldstein,
A., Granier, A., Grelle, A., Hollinger, D., Janssens, I.A., Jarvis,
P.G., Jensen, N.O., Katul, G., Mahli, Y., Matteucci, G., Meyers,
T., Monson, R., Munger, W., Oechel, W., Olson, R., Pilegaard,
K., Paw, U.K.T., Thorgeirsson, H., Valentini, R., Verma, S.,
Vesala, T., Wilson, K., Wofsy, S., 2002. Environmental controls
over carbon dioxide and water vapor exchange of terrestrial
vegetation. Agric. For. Meteorol. 113, 97–120.
Leuning, R., 1995. A critical appraisal of a coupled stomatal-
photosynthesis model for C3 plants. Plant Cell Environ. 18,
339–357.
Leverenz, J.W., Jarvis, P.G., 1979. Photosynthesis in Sitka spruce
(Picea sitchensis (Bong.) Carr.). VIII. The effects of light flux
density and direction on the rate of net photosynthesis and the
stomatal conductance of needles. J. Appl. Ecol. 16, 919–932.
Linder, S., 1995. Foliar analysis for detecting and correcting nutrient
imbalances in Norway spruce. Ecol. Bull. (Copenhagen) 44,
178–190.
Luo, Y.Q., Wan, S.Q., Hui, D.F., Wallace, L.L., 2001. Acclimatiza-
tion of soil respiration to warming in a tall grass prairie. Nature
413, 622–625.
Malhi, Y., Baldocchi, D., Jarvis, P.G., 1999. The carbon balance of
tropical, temperate and boreal forests. Plant Cell Environ. 22,
715–740.
Massman, W.J., Lee, X., 2002. Eddy covariance flux corrections and
uncertainties in long term studies of carbon and energy
exchanges. Agric. For. Meteorol. 104, 185–198.
Mayer, D.G., Butler, D.G., 1993. Statistical validation. Ecol. Model.
68, 21–32.
McMurtrie, R.E., Gholz, H.L., Linder, S., Gower, S.T., 1994.
Climatic factors controlling the productivity of pine stands: a
model-based analysis. Ecol. Bull. (Copenhagen) 43, 173–188.
Medlyn, B.E., 2004. A MAESTRO retrospective. In: McNaughton,
K. (Ed.), Forests at the Land–Atmosphere Interface. CAB
International, pp. 105–121.
Medlyn, B.E., McMurtrie, R.E., Dewar, R.C., Jeffreys, M.P., 2000.
Soil processes dominate the long-term response of forest net
primary productivity to increased temperature and atmospheric
CO2 concentration. Can. J. For. Res. 30, 873–888.
Medlyn, B.E., Dreyer, E., Ellsworth, D., Forstreuter, M., Harley,
P.C., Kirschbaum, M.U.F., LeRoux, X., Loustau, D., Montpied,
P., Strassemeyer, J., Walcroft, A., Wang, K., 2002a. Temperature
response of parameters of a biochemically-based model of
photosynthesis. II. A review of experimental data. Plant Cell
Environ. 25, 1167–1179.
Medlyn, B.E., Loustau, D., Delzon, S., 2002b. Temperature response
of parameters of a biochemically-based model of photosynth-
esis. I. Seasonal changes in mature maritime pine (Pinus pina-
ster Ait.). Plant Cell Environ. 25, 1155–1165.
Medlyn, B.E., Robinson, A.P., Clement, R., McMurtrie, R.E., 2005.
On the validation of models of forest CO2 exchange using eddy
covariance data: some perils and pitfalls. Tree Physiol. 25, 839–
857.
Meir, P., Kruijt, B., Broadmeadow, M., Barbosa, E., Kull, O.,
Carswell, F., Nobre, A., Jarvis, P.G., 2002. Acclimation of
photosynthetic capacity to irradiance in tree canopies in relation
to leaf nitrogen concentration and leaf mass per unit area. Plant
Cell Environ. 25, 343–357.
Moren, A.-S., Lindroth, A., 2000. CO2 exchange at the floor of a
boreal forest. Agric. For. Meteorol. 101, 1–14.
Neilson, R.E., Ludlow, M.M., Jarvis, P.G., 1972. Photosynthesis of
Sitka spruce (Picea sitchensis (Bong.) Carr.). II. Response to
temperature. J. Appl. Ecol. 9, 721–745.
Norman, J.M., Jarvis, P.G., 1974. Photosynthesis in Sitka spruce
(Picea sitchensis (Bong.) Carr.). III. Measurements of canopy
structure and interception of radiation. J. Appl. Ecol. 11, 375–
398.
Norman, J.M., Kucharik, C.J., Gower, S.T., Baldocchi, D.D., Crill,
P.M., Rayment, M., Savage, K., Striegl, R.G., 1997. A compar-
ison of six methods for measuring soil-surface carbon dioxide
fluxes. J. Geophys. Res. 102, 8771–28777.
Ogee, J., Lamaud, E., Brunet, Y., Berbigier, P., Bonnefond, J.M.,
2001. A long-term study of soil heat flux under a forest canopy.
Agric. For. Meteorol. 106, 173–186.
Oker-Blom, P., Kellomaki, S., 1983. Effect of grouping foliage on
the within-stand and within-crown light regime: comparison of
random and grouping canopy models. Agric. For. Meteorol. 28,
143–155.
Pargade, J., 2000. Analyses des variations spatio-temporelles du flux
de CO2 d’un sol forestier mesure par la methode dynamique.
DEA. Universite Henri Poincare Nancy I. p30.
Pilegaard, K., Hummelshøj, P., Jensen, N.O., Chen, Z., 2001. Two
years of continuous CO2 eddy-flux measurements over a Danish
beech forest. Agric. For. Meteorol. 107, 29–41.
Porte, A., 1999. Modelisation des effets du bilan hydrique sur la
production primaire et la croissance d’un couvert de pins
maritimes (Pinus pinaster Ait.) en lande humide. Ph.D. Uni-
versite d’Orsay, Paris XI.
Porte, A., Loustau, D., 1998. Variability of the photosynthetic
characteristics of mature needles within the crown of a 25-
year-old Pinus pinaster. Tree Physiol. 18, 223–232.
Porte, A., Bosc, A., Champion, I., Loustau, D., 2000. Estimating the
foliage area of maritime pine (Pinus pinaster Ait.) branches and
crowns with application to modelling the foliage area distribu-
tion in the crown. Ann. For. Sci. 57, 73–86.
Riederer, M., Kurbasik, K., Steinbrecher, R., Voss, A., 1988. Surface
areas, lengths and volumes of Picea abies (L.) Karst needles:
determination, biological variability and effect of environmental
factors. Trees 2, 165–172.
Roberntz, P., Stockfors, J., 1998. Effects of elevated CO2 concen-
tration and nutrition on net photosynthesis, stomatal conduc-
tance and needle respiration of field-grown Norway spruce trees.
Tree Physiol. 18, 233–241.
Schulze, E.D., Wirth, C., Heimann, M., 2000. Managing forests after
Kyoto. Science 289, 2058–2059.
Sellers, P.J., Hall, F.G., Kelly, R.D., Black, A., Baldocchi, D., Berry,
J., Ryan, M., Ranson, K.J., Crill, P.M., Lettenmaier, D.P.,
Margolis, H., Cihlar, J., Newcomer, J., Fitzjarrald, D., Jarvis,

B.E. Medlyn et al. / Agricultural and Forest Meteorology 131 (2005) 97–124124
P.G., Gower, S.T., Halliwell, D., Williams, D., Goodison, B.,
Wickland, D.E., Guertin, F.E., 1997. BOREAS in 1997: experi-
ment overview, scientific results, and future directions. J. Geo-
phys. Res. 102, 28731–28769.
Stenberg, P., Linder, S., Smolander, H., 1995. Variation in the ratio
of shoot silhouette area to needle area in fertilized and unferti-
lized Norway spruce trees. Tree Physiol. 15, 705–712.
Stenberg, P., Kangas, T., Smolander, H., Linder, S., 1999. Shoot
structure, canopy openness, and light interception in Norway
spruce. Plant Cell Environ. 22, 1133–1142.
Stockfors, J., 1997. Respiratory losses in Norway spruce: the effect
of growth and nutrition. Doctoral Thesis. Acta Univ. Agric.
Suec., Silvestria 20, 41 pp.
Stockfors, J., Linder, S., 1998a. Effect of nitrogen on the seasonal
course of growth and maintenance respiration in stems of Nor-
way spruce trees. Tree Physiol. 18, 155–166.
Stockfors, J., Linder, S., 1998b. The effect of nutrition on the
seasonal course of needle respiration in Norway spruce stands.
Trees 12, 130–138.
Stromgren, M., 2001. Soil-surface CO2 flux and growth in a boreal
Norway spruce stand. Effects of soil warming and nutrition.
Doctoral Thesis. Acta Univ. Agric. Suec., Silvestria 220, 44 pp.
Thornton, P.E., Law, B.E., Gholz, H.L., Clark, K.L., Falge, E.,
Ellsworth, D.S., Golstein, A.H., Monson, R.K., Hollinger, D.,
Falk, M., Chen, J., Sparks, J.P., 2002. Modeling and measuring
the effects of disturbance history and climate on carbon and
water budgets in evergreen needleleaf forests. Agric. For.
Meteorol. 113, 185–222.
Valentini, R., Matteucci, G., Dolman, A.J., Schulze, E.-D.,
Rebmann, C., Moors, E.J., Granier, A., Gross, P., Jensen,
N.O., Pilegaard, K., Lindroth, A., Grelle, A., Bernhofer, C.,
Grunwald, T., Aubinet, M., Ceulemanns, R., Kowalski, A.S.,
Vesala, T., Rannik, U., Berbigier, P., Loustau, D., Gudmundsson,
J., Thorgeirsson, H., Ibrom, A., Morgenstern, K., Clement, R.,
Moncrieff, J., Montagnani, L., Minerbi, S., Jarvis, P.G., 2000.
Respiration as the main determinant of carbon balance in
European forests. Nature 404, 861–865.
Wallin, G., Linder, S., Lindroth, A., Rantfors, M., Flemberg, S.,
Grelle, A., 2001. Carbon dioxide exchange in Norway spruce at
the shoot, tree and ecosystem scale. Tree Physiol. 21, 969–976.
Wang, K., Kellomaki, S., Laitinen, K., 1996. Acclimation of photo-
synthetic parameters in Scots pine after three years exposure to
elevated temperature and CO2. Agric. For. Meteorol. 82, 195–
217.
Wang, Y.-P., Jarvis, P.G., 1990a. Description and validation of an
array model—MAESTRO. Agric. For. Meteorol. 51, 257–280.
Wang, Y.-P., Jarvis, P.G., 1990b. Influence of crown structural
properties on PAR absorption, photosynthesis, and transpiration
in Sitka spruce: application of a model (MAESTRO). Tree
Physiol. 7, 297–316.
Whitehead, D., Griffin, K.L., Turnbull, M.H., Tissue, D.T., Engel,
V.C., Brown, K.J., Schuster, W.S.F., Walcroft, A.S., 2004.
Response of total night-time respiration to differences in total
daily photosynthesis for leaves in a Quercus rubra L. canopy:
implications for modelling canopy CO2 exchange. Glob. Change
Biol. 10, 925–938.
Wingate, L., 1998. Calibration of the hemispherical photographic
and beam transmittance techniques to measure leaf area index
distribution in a Picea sitchensis (Bong.) Carr. plantation. B.Sc.
University of Edinburgh, p. 47.
Wingate, L., 2003. The contribution of photosynthesis and respira-
tion to the net ecosystem exchange and ecosystem 13C discri-
mination of a Sitka spruce plantation. Ph.D. University of
Edinburgh, p. 268.


