Embed Size (px)
Citation preview
E L S E V I E R Field Crops Research 41 (1995) 45-54
F i e l d C r o p s R e s e a r c h
Carbon isotope discrimination and grain yield for three bread wheat germplasm groups grown at different levels of water stress
K.D. Sayre a,., E. Acevedo b, R.B. Austin c a International Maize and Wheat Improvement Center, Apdo. Postal 6-641, 06600 Mexico; D.F. Mexico
b Facultad de Ciencias Agrarias y Forestales, Universidad de Chile, Casilla 1004, Santiago, Chile c 15. Wingate Way, Trumpington, Cambridge, CB2 2HD, UK
Received 3 February 1994; accepted 7 November 1994
Abstract
Carbon isotope discrimination (A) , yield and other characters were determined for 75 spring bread wheat cultivars and advanced breeding lines in which water availability was varied using a line-source irrigation system. The experiment was carried out in 1989/90 at CIMMYT-CIANO, Cd. Obregon, in northwest Mexico. Forty of the cultivars and advanced breeding lines came from CIMMYT-Mexico, twenty from ICARDA-Syria, and fifteen from CIMMYT's International Drought Trial (IDT). Considering all materials together, grain yield and A were markedly reduced by drought (yield declined from 4560 to 1090 kg ha-~, A from 16.9 to 14.0%o, from least to most stressed, respectively). For each group of lines, grain yield was positively correlated with A in both the most stressed and least stressed parts of the trial (except for the CIMMYT lines under low stress where the correlation was nonsignificant). In addition, high yield under stress was associated with an early maturity score and with less reduction in mature plant height. A may be potentially used to augment selection for high yield based on yield itself, in both low- and high-stressed environments. In the latter environment, early maturity and minimal reduction in plant height should also be considered in a selection program especially under conditions of mid-season to terminal drought and/or heat stress.
Keywords: Breeding strategy; Stress tolerance; Triticum aesticum
I. Introduct ion
Studies with wheat and barley have indicated exis- tence of a positive correlation between grain yield 'and carbon isotope discrimination ( A ) of either grain car- bon or that in peduncles sampled at maturity. Condon et al. (1987) and Araus et al. (1993) both reported correlation coefficients of ca. 0.5 for wheat in a series of trials that had not experienced water stress. In a study of barley (Craufurd et al., 1991), correlations with
* Corresponding author.
0378-4290/95/$09.50 © 1995 Elsevier Science B.V. All rights reserved S S D 1 0 3 7 8 - 4 2 9 0 ( 9 4 ) 0 0 1 0 5 - 7
yield were stronger for trials with moderate stress while
weak with low or negligible stress levels. Two diffi-
culties arise in interpreting the results of these and sim- ilar trials. First, because the severity of water stress is often confounded with trial site and year, differences
in the magnitude of the correlations cannot be attributed unequivocally, given other potentially confounding factors, to genotypic differences in water stress response. Second, at least in the barley study, both yield and A were closely associated with phenology (date of ear emergence) ; earlier lines escaped drought and pro- duced high yield and high A.
46 K.D. Sayre et al. /Fie ld Crops Research 41 (1995) 45-54
The present study evaluated the carbon isotope com- position of peduncles sampled from three sets of bread wheat lines grown in a single experiment in which variation in water stress was controlled using a line- source irrigation system. This allowed direct assess- ments of effects of water stress on the strength of the association between grain yield and A. Because the experiment compared 75 lines of different origins and phenology, we were able to estimate the influence of phenology on the association between grain yield and A.
2. Material and methods
The line-source system was based on the design employed by Hanks et al. (1976). On each side of the line there was a block of 75 plots 15 m long and 1.2 m wide, arranged perpendicular to the sprinkler line such that the gradient in water supply was achieved along the length of the plots. Each plot comprised six rows 20 cm apart. To minimize potential edge effects, no additional gap was left between adjacent plots beyond the normal 20-cm row spacing. The 75 lines were sown in random order in each of the two replicate blocks.
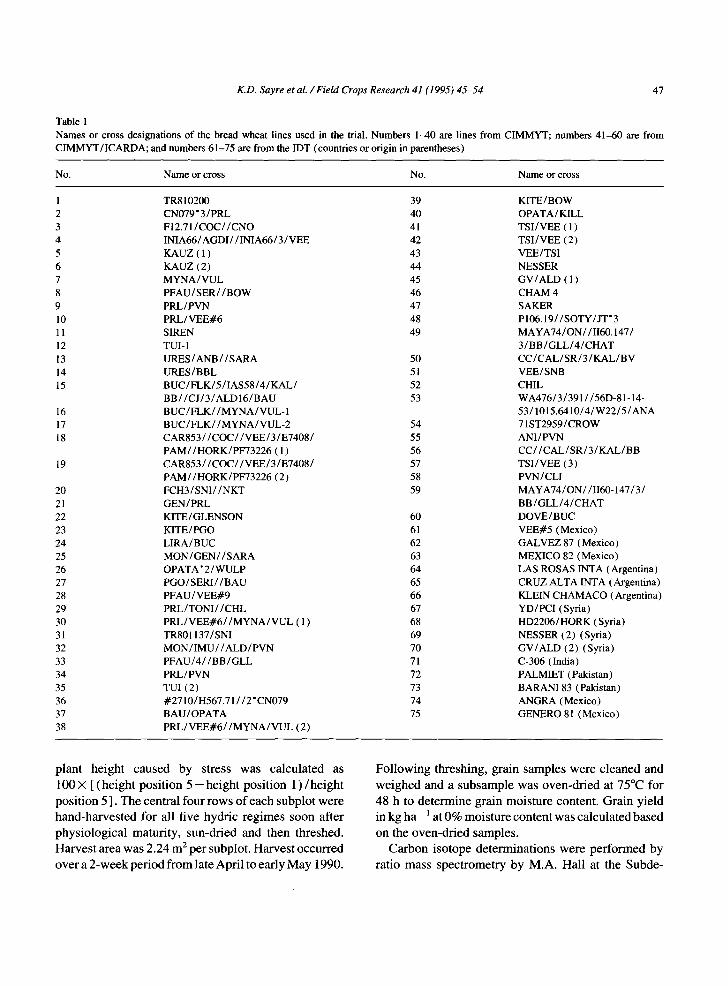
Three groups of materials were compared and are identified in Table 1. Group I comprised 40 advanced lines (F6 or above) developed by CIMMYT (Inter- national Maize and Wheat Improvement Centre) in Mexico; group II comprised 20 advanced lines (F6 or above) developed by a joint CIMMYT/ICARDA (International Centre for Agricultural Research in the Dry Areas) project in Syria; and group III consisted of 15 cultivars or advanced lines included in CIMMYT's International Drought Trial (IDT) in 1988 and 1989 that came from collaborating countries.
These three groups were chosen to compare CIM- MYT materials which had been selected in Mexico, mainly under conditions of adequate moisture, with those from CIMMYT/ICARDA (referred to below as ICARDA), which had been selected in Syria under moderate to severe moisture stress. The IDT cultivars were included for eventual comparison with data avail- able from the international trial locations and had been recognized for good performance under drought stress in the countries of origin.
The trial area was sown on 12 December 1989 near Ciudad Obregon, Sonora, in northwest Mexico at the
CIANO (Centro de Investigaciones Agrfcolas de Noroeste) Experiment Station (elevation 40 m asl, 26°N, 109°W). The soil was a coarse sandy clay, mixed montmorillonitic Typic Caliciorthid (USDA Soil Tax- onomy), low in organic matter ( < 10 mg g - 1 ) slightly alkaline in pH (7.7) andwith adequate K fertility. Before seeding, 150 kg N and 20 kg P ha - ~ as urea and triple super phosphate, respectively, were broadcast to the plots and incorporated by disc harrow. Table 2 presents a summary of weather data from sowing to harvest. Conditions during the growing season were normal for the area.
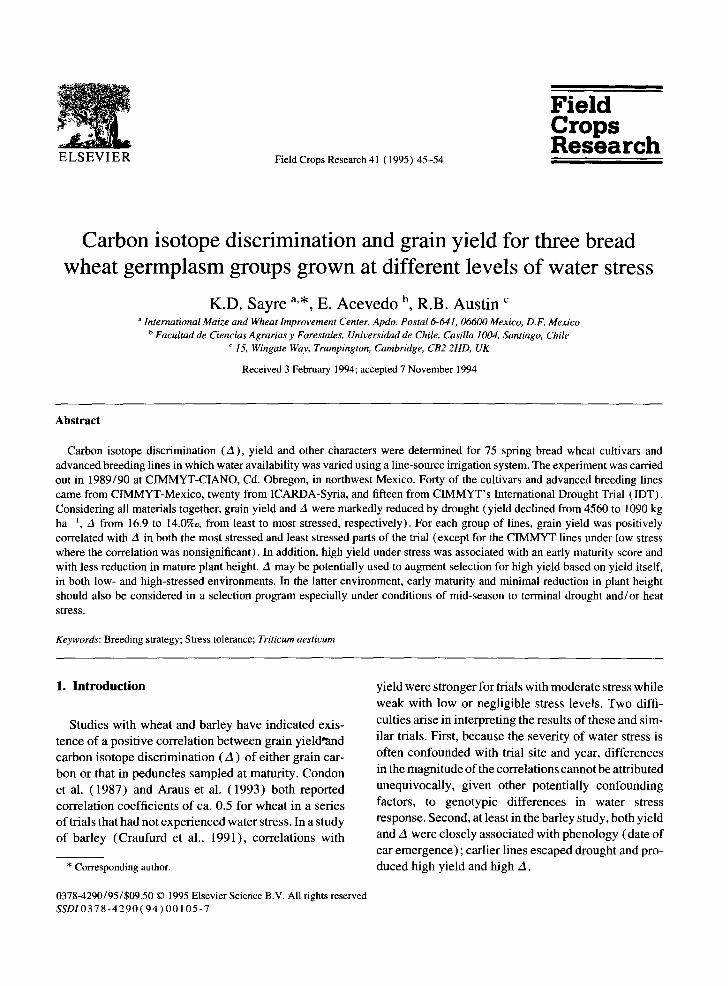
The trial was irrigated uniformly by sprinkle irriga- tion with 40 mm water on 14 December 1989; 120 mm of available water (above - 1.5 MPa) was present in the top 120 cm of the soil profile prior to this irrigation. Subsequent irrigations were applied by the line-source system when the 0--60 cm soil profile near the line- source was depleted to about 50% of its maximal available water content. The area closest to the line- source received no more than 40 mm per day (to pre- vent run-off), and water was applied on successive days as necessary to restore the profile in this position to near field capacity. All irrigations were applied under calm conditions usually in the early morning between 05:30 to 08:00, to avoid wind drift. A total of 15 irri- gations were applied during the season including the successive irrigations to avoid run-off. The amounts of water applied for each irrigation were measured with rain guages distributed uniformly throughout the trial area. These amounts together with 55 mm rainfall and the 120 nun available water in the profile at sowing are illustrated in Fig. 1 for each line-source position. Irri- gation was discontinued when all but the very latest lines had lost all green colour.
Discounting 0.5 m at either end of each plot, the remaining 14 m was divided into five equal subplots (positions 1 to 5, most to least stressed, respectively), each 2.8 m long. Days to 50% ear emergence and phys- iological maturity were assessed for positions 1 and 5 only for the IDT lines. For the other two groups, within which there was less variation in phenology, only maturity was scored for each line on a 1 to 5 scale, 1 corresponding to very early and 5 to very late.
Near maturity, plant height to the terminal spikelet was measured and samples of peduncles, excluding flag leaf sheaths, were taken from subplots 1 (most stressed) and 5 (least stressed). Percent reduction in
K.D. Sayre et al. / FieM Crops Research 41 (1995) 45-54 47
Table 1 Names or cross designations of the bread wheat lines used in the trial. Numbers 1-40 are lines from CIMMYT; numbers 41-60 are from CIMMYT/ICARDA; and numbers 61-75 are from the IDT (countries or origin in parentheses)
No. Name or cross No. Name or cross
1 TR8 i 0200 39 2 CN079" 3/PRL 40 3 F12.71/COC//CNO 41 4 INIA66/AGDI/ / INIA66/3 / VEE 42 5 KAUZ ( 1 ) 43 6 KAUZ (2) 44 7 MYNA/VUL 45 8 P F A U / S E R / / B O W 46 9 PRL/PVN 47 10 PRL/VEE#6 48 11 SIREN 49 12 TUI-1 13 URES/ANB / /SARA 50 14 URES/BBL 51 15 BUC/FLK/5/IAS58/4/KAL/ 52
BB/ /CJ/3/ALD16/BAU 53 16 B U C / F L K / / M Y N A / V U L - 1 17 B U C / F L K / / M Y N A / V U L - 2 54 18 CAR853 / /COC/ /VEE/3 /E7408 / 55
PAM//HORK/PF73226 ( 1 ) 56 19 CAR853//COC//VEE/3/E7408/ 57
PAM//HORK/PF73226 (2) 58 20 FCH3 / SNI / / N K T 59 21 GEN / PRL 22 KITE/GLENSON 60 23 KITE/PGO 61 24 LIRA/BUC 62 25 M O N / G E N / / S A R A 63 26 OPATA * 2 /WULP 64 27 PGO/SERI / /BAU 65 28 PFAU / VEE#9 66 29 PRL/TON1/ /CHL 67 30 P R L / V E E # 6 / / M Y N A / V U L ( 1 ) 68 31 TR801137 / SNI 69 32 M O N / I M U / / A L D / P V N 70 33 P F A U / 4 / / B B / G L L 71 34 PRL/PVN 72 35 TUI (2) 73 36 #2710/H567.71 / /2 "CN079 74 37 BAU/OPATA 75 38 P R L / V E E # 6 / / M Y N A / V U L (2)
KITE/BOW OPATA/KILL TSI/VEE ( 1 ) TSI/VEE (2) VEE/TSI NESSER GV/ALD ( 1 ) CHAM 4 SAKER P106.19/ /SOTY/JT '3 MAYA74/ON//II60.147 / 3 / B B / G L L / 4 / C H A T C C / C A L / S R / 3 / K A L / B V VEE/SNB CHIL WA476/3/391 //56D-81-14- 53/1015.6410/4 /W22/5/ANA 71 ST2959/CROW ANI/PVN CC/ /CAL/SR/3/KAL/BB TSI/VEE (3) PVN/CLI MAYA74/ON//1160-147 / 3 / BB/GLL/4 /CHAT DOVE/BUC VEE#5 (Mexico) GALVEZ 87 (Mexico) MEXICO 82 (Mexico) LAS ROSAS 1NTA (Argentina) CRUZ ALTA INTA (Argentina) KLEIN CHAMACO (Argentina) YD/PCI (Syria) HD2206/HORK (Syria) NESSER (2) (Syria) GV/ALD (2) (Syria) C-306 (India) PALMIET (Pakistan) BARAN183 (Pakistan) ANGRA (Mexico) GENERO 81 (Mexico)
plant height caused by stress was calculated as 100 × [ (height position 5 - height position 1 ) /height position 5 ]. The central four rows of each subplot were hand-harvested for all five hydric regimes soon after physiological maturity, sun-dried and then threshed.
2 Harvest area was 2.24 m per subplot. Harvest occurred over a 2-week period from late April to early May 1990.
Following threshing, grain samples were cleaned and weighed and a subsample was oven-dried at 75°C for 48 h to determine grain moisture content. Grain yield in kg ha- 1 at 0% moisture content was calculated based on the oven-dried samples.
Carbon isotope determinations were performed by ratio mass spectrometry by M.A. Hall at the Subde-
48 K.D. Sayre et al. / Field Crops Research 41 (1995) 45-54
Table 2 Selected weather data for period between crop sowing and harvest during the 1989/1990 season
Month Temperature Rainfall Pan evaporation (°C) (mm) (ram/day)
rain max
December 9.2 24.9 35 2.5 January 7.5 24.2 2 2.7 February 6.8 24.0 15 3.1 March 9.0 27.5 3 4.5 April 12.4 32.1 0 7.0 May 13.8 35.2 0 8.5
6OO ( ~ Rep 1 ,.B. Rep 2
5OO
2OO
1011
line source position
Fig. 1. Water (mm) available to the crops in each replication from the line source (position 1 most stressed, position 5 least stressed). North side (rep 1) and South side (rep 2). The amounts shown include 55 mm rainfall and 120 mm available water in the profile (0-120 cm) at sowing.
partment of Quaternary Research, University of Cam- bridge, Cambridge, UK. Carbon isotope compositions of the peduncle samples were reported as deviations in parts per thousand expressed relative to air taken as -7 .85% relative to belemnite from the Pee Dee for- mation in South Carolina (the international standard) following Farquhar and Richards (1984).
Statistical analyses were carried out assuming that the experiment was a split block design with irrigation levels arranged systematically in each replicate along the gradient of applied water and lines randomized in each replicate. Thus, the statistical significance of line differences, and the interaction effects between irriga- tion position and line could be tested.
3. Results
There were significant differences among genetic lines for yield and A. The interaction between irrigation position and line was significant only for yield.
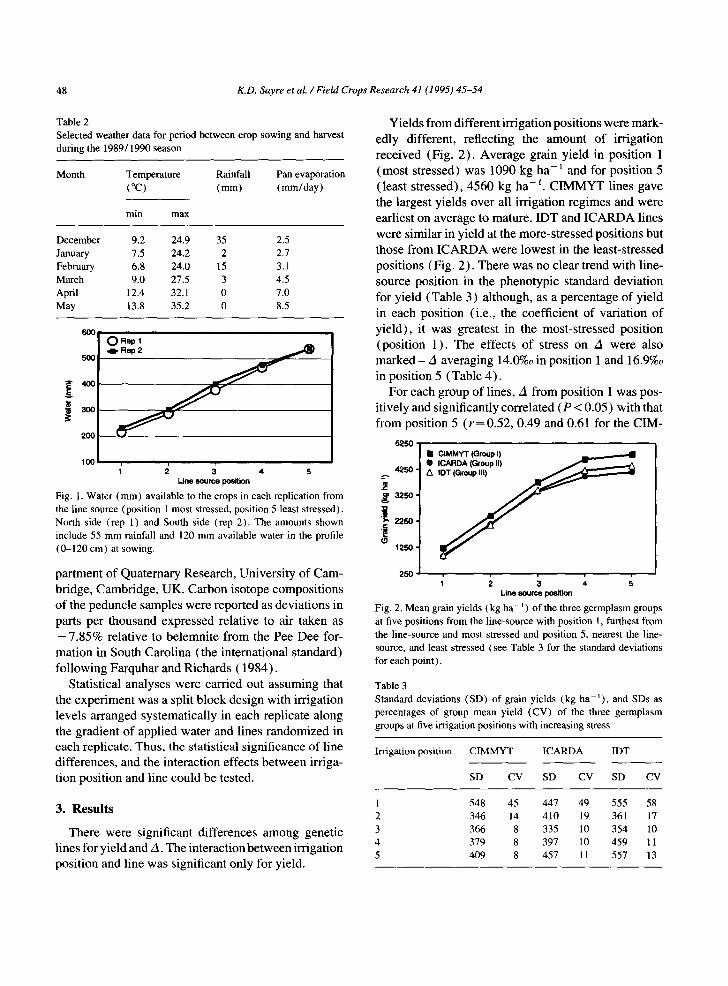
Yields from different irrigation positions were mark- edly different, reflecting the amount of irrigation received (Fig. 2). Average grain yield in position 1 (most stressed) was 1090 kg ha- ] and for position 5 (least stressed), 4560 kg ha-1. CIMMYT lines gave the largest yields over all irrigation regimes and were earliest on average to mature. IDT and ICARDA lines were similar in yield at the more-stressed positions but those from ICARDA were lowest in the least-stressed positions (Fig. 2). There was no clear trend with line- source position in the phenotypic standard deviation for yield (Table 3) although, as a percentage of yield in each position (i.e., the coefficient of variation of yield), it was greatest in the most-stressed position (position 1). The effects of stress on A were also marked - A averaging 14.0%o in position 1 and 16.9%o in position 5 (Table 4).
For each group of lines, A from position 1 was pos- itively and significantly correlated (P < 0.05) with that from position 5 (r=0.52, 0.49 and 0.61 for the CIM-
525O • CIMMYT (Group I) • ICARDA (Group II)
.i
250 ; i ; ; ; Line source position
Fig. 2. Mean grain yields (kg ha - l ) of the three germplasm groups at five positions from the line-source with position 1, furthest from the line-source and most stressed and position 5, nearest the line- source, and least stressed (see Table 3 for the standard deviations for each point).
Table 3 Standard deviations (SD) of grain yields (kg h a - l ) , and SDs as percentages of group mean yield (CV) of the three germplasm groups at five irrigation positions with increasing stress
Irrigation position CIMMYT ICARDA IDT
SD CV SD CV SD CV
1 548 45 447 49 555 58 2 346 14 410 19 361 17 3 366 8 335 10 354 10 4 379 8 397 10 459 11 5 409 8 457 11 557 13
K.D. Sayre et al. / Field Crops Research 41 (1995) 45-54 ,49
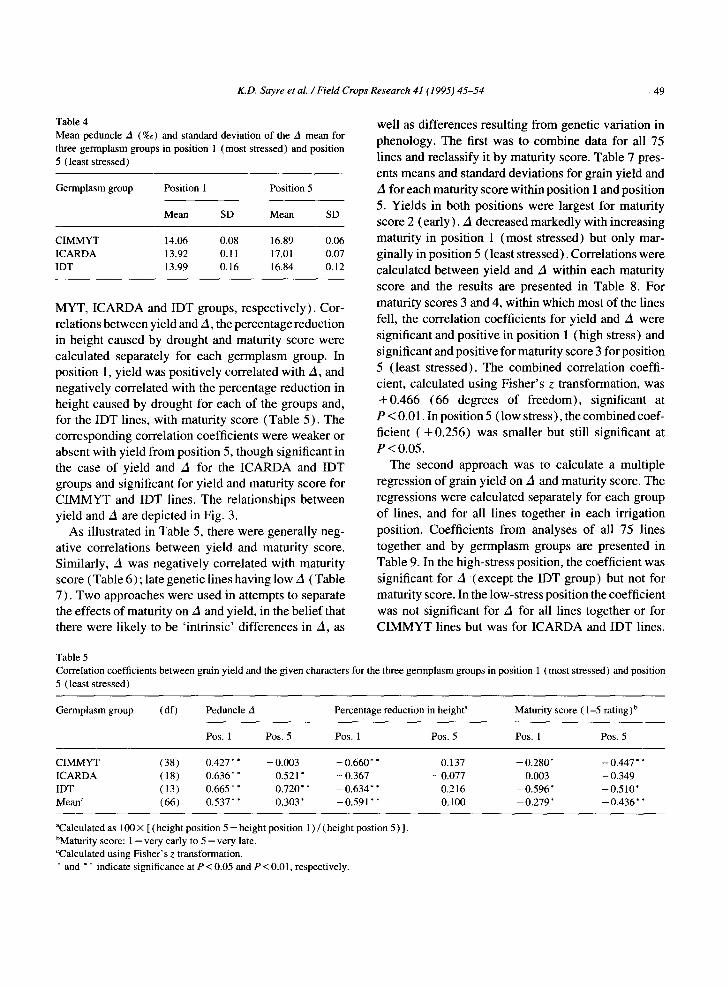
Table 4 Mean peduncle A (%0) and standard deviation of the A mean for three germplasm groups in position 1 (most stressed) and position 5 (least stressed)
Germplasm group Position 1 Position 5
Mean SD Me~ SD
CIMMYT 14.06 0.08 16.89 0.06 1CARDA 13.92 0.11 17.01 0.07 1DT 13.99 0.16 16.84 0.12
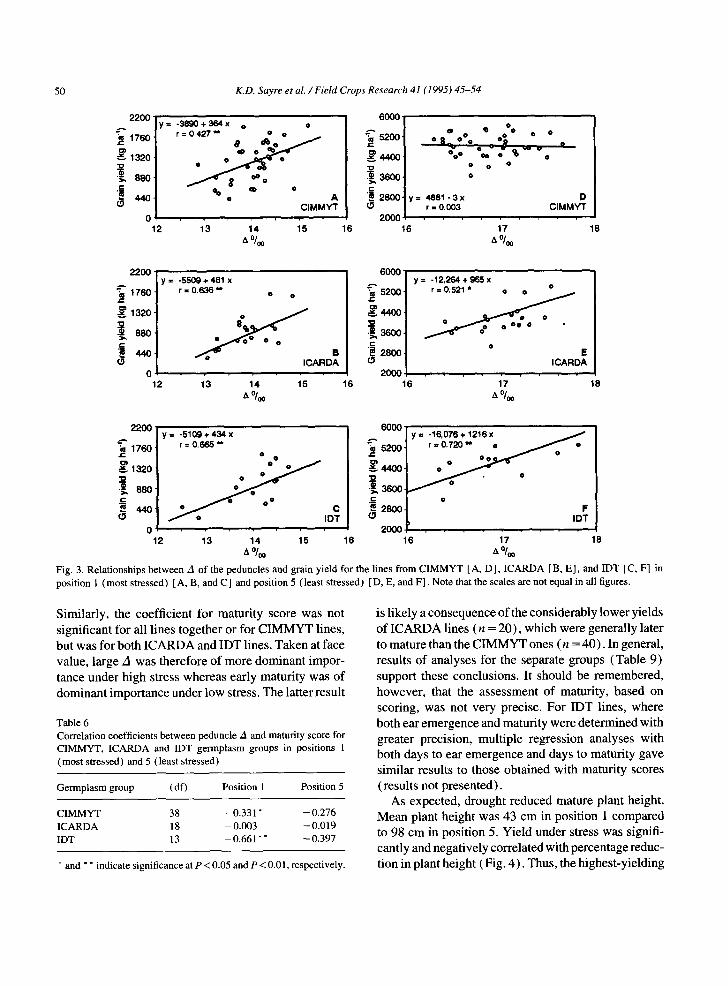
MYT, ICARDA and IDT groups, respect ively) . Cor- relations between yield and za, the percentage reduction in height caused by drought and maturity score were calculated separately for each germplasm group. In posit ion 1, yield was posit ively correlated with A, and negatively correlated with the percentage reduction in height caused by drought for each of the groups and, for the IDT lines, with maturity score (Table 5). The corresponding correlation coefficients were weaker or absent with yield from posit ion 5, though significant in the case of yield and A for the I C A R D A and IDT groups and significant for yield and maturity score for C IMMYT and IDT lines. The relationships between yield and A are depicted in Fig. 3.
As illustrated in Table 5, there were generally neg- ative correlations between yield and maturity score. Similarly, A was negatively correlated with maturity score ( Table 6) ; late genetic lines having low A (Table 7) . Two approaches were used in attempts to separate the effects of maturity on A and yield, in the bel ief that there were l ikely to be ' intrinsic ' differences in A, as
well as differences resulting from genetic variation in phenology. The first was to combine data for all 75 lines and reclassify it by maturity score. Table 7 pres- ents means and standard deviations for grain yield and A for each maturity score within position 1 and position 5. Yields in both positions were largest for maturity score 2 (ear ly) . A decreased markedly with increasing maturity in posit ion 1 (most stressed) but only mar- ginally in position 5 ( least stressed). Correlations were calculated between yield and A within each maturity score and the results are presented in Table 8. For maturity scores 3 and 4, within which most of the lines fell, the correlation coefficients for yield and A were significant and positive in position 1 (high stress) and significant and posit ive for maturity score 3 for position 5 ( least stressed). The combined correlation coeffi- cient, calculated using Fisher ' s z transformation, was +0 .466 (66 degrees of f reedom), significant at P < 0.01. In position 5 ( low stress), the combined coef- ficient ( + 0 . 2 5 6 ) was smaller but still significant at P < 0.05.
The second approach was to calculate a multiple regression of grain yield on A and maturity score. The regressions were calculated separately for each group of lines, and for all lines together in each irrigation position. Coefficients from analyses of all 75 lines together and by germplasm groups are presented in Table 9. In the high-stress position, the coefficient was significant for A (except the IDT group) but not for maturity score. In the low-stress position the coefficient was not significant for A for all lines together or for CIMMYT lines but was for ICARDA and IDT lines.
Table 5 Correlation coefficients between grain yield and the given characters for the three germplasm groups in position 1 (most stressed) and position 5 (least stressed)
Germplasm group (df) Peduncle A Percentage reduction in height" Maturity score ( 1-5 rating) b
Pos. 1 Pos. 5 Pos. 1 Pos. 5 Pos. 1 Pos. 5
CIMMYT (38) 0.427* * -0.003 -0.660* * 0.137 -0.280* -0.447*" ICARDA (18) 0.636" * 0.521 * - 0.367 - 0.077 0.003 - 0.349 IDT (13) 0.665** 0.720** -0.634** 0.216 -0.596* -0.510" Mean c (66) 0.537* * 0.303* -0.591 * * 0.100 -0.279* - 0.436" *
aCalculated as 100 X [ (height position 5 -height position 1 ) /(height postion 5 ) ]. bMaturity score: 1 = very early to 5 = very late. °Calculated using Fisher's z transformation. * and * * indicate significance at P < 0.05 and P < 0.01, respectively.
50 K.D. Sayre et al. / Field Crops Research 41 (1995) 45-54
22O0
~ 1760
1320 ¥ t -
0 12
y = -3890+364x o o r = 0 .427~ o o
• O ~ •
~ ~o ~ ,~ •
o A C I M M Y T
1"3 14 15 16
6000-
~ 200-
4400.
~ 3600.
"~ 2800-
2000 16
¢D ~ ~ ° ° • o o 9 O°o . • • o* ***'0" ~,"'.
• o o
o
a
y = 4 8 8 1 - 3 x D r = 0.003 CIMMYT
17 °Ioo
18
2200"
1760" r-
1320 1
880" e-
"~ 44o-
0 12
y = -5509 ÷ 461 x r = 0 ' 6 3 6 ~ o o
Y O O O • O
B ICARDA
1'3 1'4 15
6000 ¸
5200
i 4400
3600 p.
",W 2800
20OO 16 16
y = -12,264 + 965 x o r=0,521"- - a o
O O 0 •
0
ICARDA
17 18 A °/oo
22°°1y=! -slog.4~x .= *~"~ 1 80o0 r-~" 1760 | r = 0.665"* -,~ ~ t *** ~s2oo ~. 1320 ° ~ " ~ 4400
"~ 4 4 0 | o / - ~' 2800! o I / * , e
20O01
I y = -16,076 ÷ 1216x / I
r = 0.720 ** o ~ •
I
o 0@
o I D ;
12 13 14 15 16 16 17 18 %0 A %0 Fig. 3, Relat ionships between A of the peduncles and grain yield for the lines from CIMMYT [A, D] , ICARDA [B, E l , and IDT [C, F] in position 1 (most stressed) [A, B, and C] and position 5 (least stressed) [D, E, and F]. Note that the scales are not equal in all figures.
Similarly, the coefficient for maturity score was not significant for all lines together or for CIMMYT lines, but was for both ICARDA and IDT lines. Taken at face value, large A was therefore of more dominant impor- tance under high stress whereas early maturity was of dominant importance under low stress. The latter result
Table 6 Correlation coefficients between peduncle A and maturity score for CIMMYT, ICARDA and IDT germplasm groups in posit ions 1 (mos t stressed) and 5 ( least stressed)
Germplasm group (df) Position 1 Position 5
CIMMYT 38 - 0.331 * - 0.276 ICARDA 18 - 0.003 - 0.019 IDT 13 - 0.661 * * - 0.397
• and * * indicate significance at P < 0.05 and P < 0.01, respectively.
is likely a consequence of the considerably lower yields of ICARDA lines (n = 20), which were generally later to mature than the CIMMYT ones (n = 40). In general, results of analyses for the separate groups (Table 9) support these conclusions. It should be remembered, however, that the assessment of maturity, based on scoring, was not very precise. For IDT lines, where both ear emergence and maturity were determined with greater precision, multiple regression analyses with both days to ear emergence and days to maturity gave similar results to those obtained with maturity scores (results not presented).
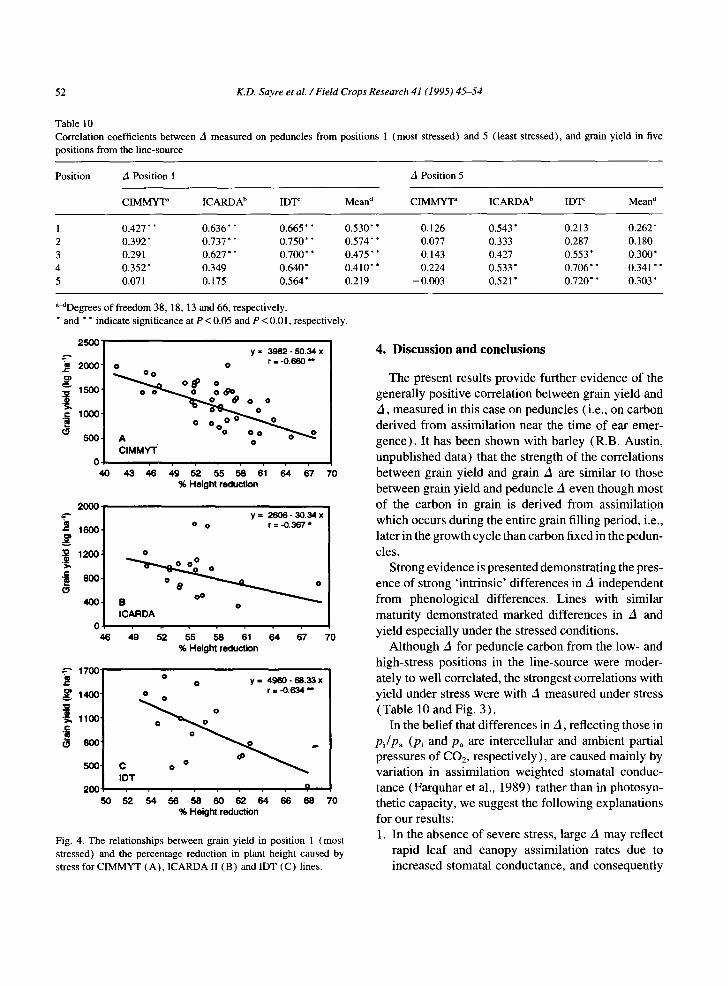
As expected, drought reduced mature plant height. Mean plant height was 43 cm in position 1 compared to 98 cm in position 5. Yield under stress was signifi- cantly and negatively correlated with percentage reduc- tion in plant height (Fig. 4). Thus, the highest-yielding
K.D. Sayre et aL / Field Crops Research 41 (1995) 45-54 51
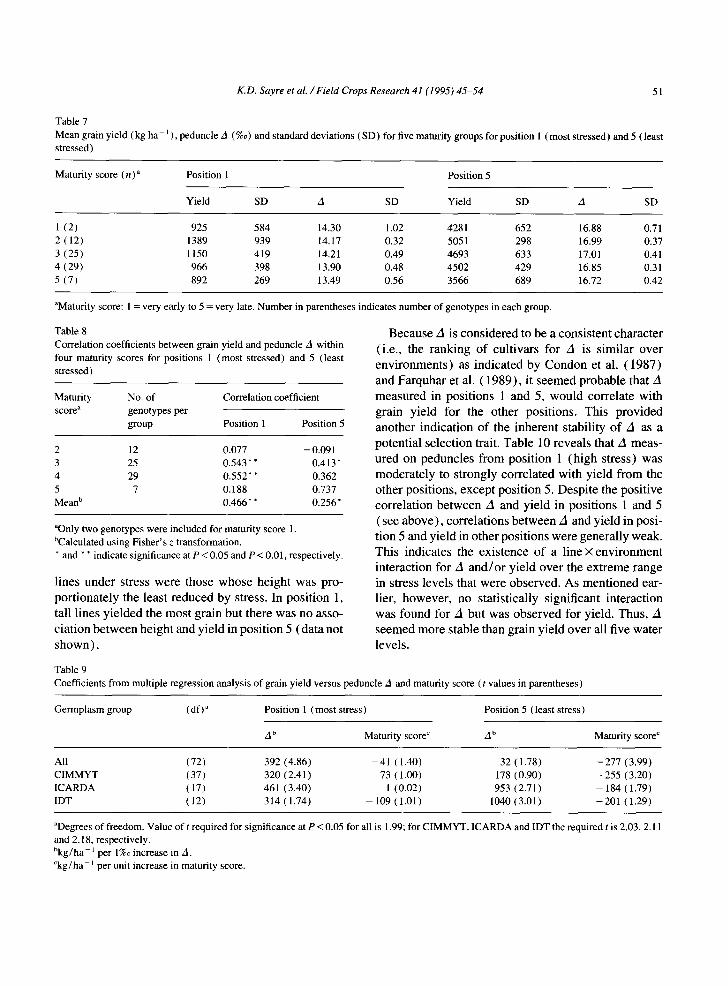
Table 7 Mean grain yield ( kg ha- 1 ), peduncle A (%0) and standard deviations (SD) for five maturity groups for position 1 (most stressed) and 5 ( least stressed)
Maturity score (n) a Position 1 Position 5
Yield SD A SD Yield SD A SD
1 (2) 925 584 14.30 1.02 4281 652 16.88 0.71 2 (12) 1389 939 14.17 0.32 5051 298 16.99 0.37 3 (25) 1150 419 14.21 0.49 4693 633 17.01 0.41 4 (29) 966 398 13.90 0.48 4502 429 16.85 0.31 5 (7) 892 269 13.49 0.56 3566 689 16.72 0.42
aMaturity score: 1 = very early to 5 = very late. Number in parentheses indicates number of genotypes in each group.
Table 8 Correlation coefficients between grain yield and peduncle A within four maturity scores for positions 1 (most stressed) and 5 (least stressed)
Maturity No. of Correlation coefficient score a genotypes per
group Position 1 Position 5
2 12 0.077 -0.091 3 25 0.543** 0.413" 4 29 0.552** 0.362 5 7 0.188 0.737 Mean b 0.466** 0.256*
aOnly two genotypes were included for maturity score 1. bCalculated using Fisher's z transformation. * and * * indicate significance at P < 0.05 and P < 0.01, respectively.
l ines u n d e r s t ress were those w h o s e he igh t was pro-
po r t i ona t e ly the leas t r e d u c e d by stress. In pos i t ion 1,
tall l ines y ie lded the m o s t g ra in bu t there was no asso-
c ia t ion b e t w e e n h e i g h t and y ie ld in pos i t ion 5 ( d a t a no t
s h o w n ) .
Table 9
B e c a u s e A is c o n s i d e r e d to be a cons i s t en t cha rac t e r
(i .e. , the r a n k i n g o f cu l t ivars for A is s imi la r ove r
e n v i r o n m e n t s ) as i nd ica t ed by C o n d o n et al. ( 1 9 8 7 )
and F a r q u h a r et al. ( 1 9 8 9 ) , it s e e m e d p r o b a b l e tha t A
m e a s u r e d in pos i t ions 1 and 5, w o u l d cor re la te wi th
g ra in y ie ld for the o the r pos i t ions , Th i s p r o v i d e d
ano the r i nd ica t ion o f the i n h e r e n t s tabi l i ty o f A as a
po ten t i a l se lec t ion trait. Tab le 10 revea l s tha t A meas -
u red on pedunc l e s f rom pos i t ion 1 ( h i g h s t ress) was
m o d e r a t e l y to s t rong ly co r re la t ed wi th y ie ld f rom the
o the r pos i t ions , excep t pos i t ion 5. Desp i t e the pos i t ive
co r re l a t ion b e t w e e n A and y ie ld in pos i t ions 1 and 5
( see a b o v e ) , co r re la t ions b e t w e e n A and y ie ld in pos i -
t ion 5 and yie ld in o the r pos i t ions were genera l ly weak.
Th i s ind ica tes the ex i s t ence o f a l ine × e n v i r o n m e n t
in t e rac t ion for A a n d / o r y ie ld ove r the ex t r eme r ange
in s tress leve ls tha t were obse rved . A s m e n t i o n e d ear-
lier, howeve r , no s ta t is t ica l ly s igni f icant in te rac t ion
was f o u n d for A but was o b s e r v e d for yield. Thus , A
s e e m e d m o r e s tab le t han gra in yie ld ove r all f ive wa te r
levels .
Coefficients from multiple regression analysis of grain yield versus peduncle A and maturity score (t values in parentheses)
Germplasm group (df) ~ Position 1 (most stress) Position 5 (least stress)
A b Maturity score c A b Maturity score c
All (72) 392 (4.86) - 41 (1.40) 32 (1.78) -277 (3.99) CIMMYT (37) 320 (2.41) - 7 3 (1.00) - 178 (0.90) -255 (3.20) ICARDA (17) 461 (3.40) 1 (0.02) 953 (2.71) - 184 (1.79) IDT (12) 314 (1.74) - 109 (1.01) 1040 (3.01) -201 (1.29)
~Degrees of freedom. Value of t required for significance at P < 0.05 for all is 1.99; for CIMMYT, ICARDA and IDT the required t is 2.03, 2.11 and 2.18, respectively. bkg/h a 1 per 1%o increase in A. Ckg/ha J per unit increase in maturity score.
52 K.D. Sayre et al. / Field Crops Research 41 (1995) 45-54
Table 10 Correlation coefficients between A measured on peduncles from positions 1 (most stressed) and 5 (least stressed), and grain yield in five positions from the line-source
Position A Position 1 A Position 5
CIMMY'I "~ ICARDA b IDT ~ Mean ~ CIMMYT ~ ICARDA b IDT ~ Mean d
1 0.427* * 0.636* * 0.665* * 0.530* * 0.126 0.543* 0.213 0.262* 2 0.392 * 0.737 * * 0.750 * * 0.574" * 0.077 0.333 0.287 0.180 3 0.291 0.627* * 0.700* * 0.475* * 0.143 0.427 0.553* 0.300* 4 0.352* 0.349 0.640* 0.410" * 0.224 0.533 * 0.706* * 0.341 * * 5 0.071 0.175 0.564* 0.219 -0.003 0.521" 0.720* * 0.303*
amDegrees of freedom 38, 18, 13 and 66, respectively. * and * * indicate significance at P < 0.05 and P < 0.01, respectively.
2500"
2 0 0 0
1500"
"~ 1000"
o 40
y = 3982 - 50.34 x 0 0 r = -0.660 **
o O
o o ~ o 0 o
o o_ 0 ° ~ " ~
C I M M Y ' r
~3 46 49 52 55 58 6'1 64 67 7 0 % Height reduction
2000-
,~ 16oo.
12oo-
c • a 8oo-
y = 2606 - 30.34 x o o r = -0.367 *
- " 1700"
== 14oo!
1100"
.~0-
0 46 70
B 0 8 o o ~ o
ICARDA
4o g5 ;1 64 % Height reduction
2 0 0 5 0 7 0
o 0 y = 4960 - 68.33 x 0 r = -0.634 **
C o o lOT
q
52 54 56 58 6O 62 64 66 68 % Height reduction
Fig. 4. The relationships between grain yield in position 1 (most stressed) and the percentage reduction in plant height caused by stress for CIMMYT (A), ICARDA II (B) and IDT (C) lines.
4 . D i s c u s s i o n a n d c o n c l u s i o n s
The present results p rovide further ev idence o f the
general ly posi t ive correlat ion be tween grain yield and
A, measured in this case on peduncles (i.e., on carbon
der ived f rom assimila t ion near the t ime of ear emer-
gence ) . It has been shown with barley (R.B. Austin,
unpubl ished data) that the strength o f the correlat ions
be tween grain yield and grain A are similar to those
be tween grain y ie ld and peduncle A even though most
o f the carbon in grain is der ived f rom assimilat ion
which occurs during the entire grain filling period, i.e.,
later in the growth cycle than carbon fixed in the pedun-
cles.
St rong ev idence is presented demonst ra t ing the pres-
ence o f strong ' in t r ins ic ' d i f ferences in A independent
f rom phenologica l differences. Lines with s imilar
maturi ty demonst ra ted marked differences in A and
yie ld especia l ly under the stressed condit ions.
A l though A for peduncle carbon f rom the low- and
high-stress posi t ions in the l ine-source were moder-
ately to wel l correlated, the strongest correlat ions with
yield under stress were with A measured under stress
(Tab le 10 and Fig. 3) .
In the be l i e f that d i f ferences in A, reflect ing those in
Pi/Pa (Pi and Pa are intercel lular and ambient partial pressures o f CO2, respec t ive ly) , are caused mainly by variat ion in assimilat ion weighted stomatal conduc-
tance (Farquhar et al., 1989) rather than in photosyn-
thetic capacity, we suggest the fo l lowing explanat ions
for our results:
1. In the absence o f severe stress, large A may reflect
rapid leaf and canopy assimilat ion rates due to
increased stomatal conductance, and consequent ly
K.D. Sayre et al. / Field Crops Research 41 (1995) 45-54 53
higher yields, even though results for the CIMMYT group of lines under no stress do not directly support this premise. However, because the CIMMYT lines underwent intensive empirical selection over sev- eral generations for grain yield in the absence of stress in the location where this trial was conducted, it is suggested that genetic variation that could con- dition a significant positive association between yield and A under no stress had been reduced by selection.
2. Under conditions of high solar radiation, as was the case here, large A, which is indicative of high leaf and canopy transpiration rates, will reduce leaf tem- perature and may also contribute to heat avoidance (Delgado et al., 1994).
3. Under conditions of terminal drought associated with increasing solar radiation and air temperature over the growing season (as for this trial), lines that head and mature early will assimilate most of their grain carbon when vapour pressure deficits are small, in contrast with late-heading cultivars. Accordingly, early lines will have a larger A than late-heading ones. The observed decrease in A under severe stress as maturity increased, combined with the corresponding reduction in yields as pre- sented in Table 7, support this premise especially in view of the very marginal decrease in A with increase in maturity in the absence of stress. If these explanations are correct, carbon isotope dis-
crimination could be used as a selection index for increased yield over a wide range of water stress con- ditions, as follows: 1. Select for high 'intrinsic' A in a low-stress environ-
ment at an early stage in the breeding program. This should increase the rate of genetic gain in yield for environments with high yield potential. Obviously, the weak association between yield and A for the CIMMYT lines under no stress, as illustrated in Fig. 3D, appears to undermine this strategy. As argued above, however, the CIMMYT lines represent elite materials intensively selected for yield for several generations in the trial environment under low stress. In contrast, ICARDA and IDT lines demon- strated positive correlations between yield and A, for both high- and low-stress conditions (Figs. 3B and 3E and Figs. 3C and 3F, respectively). If the ICARDA and IDT materials more closely approxi- mate early segregating progeny derived from
.
diverse crosses, then their performance does indi- cate the feasibility of measuring A in a low-stress environment as an efficient selection tool to elimi- nate segregants with low A and concurrently low yield potential at an early stage. This strategy should be less costly than expensive empirical field-testing of a large number of segregating families over sev- eral generations. Breeding and selection in water-limited environ- ments from high A material derived from ( 1 ) above for (a) early heading, (b) maintenance of height, and (c) high A. This should increase the rate of genetic gain in yield in water-limited environments when the crop is subject to terminal drought and/or high temperature. It also could identify lines that perform well under stress as well as benefit from more opportune conditions as they occur from year- to-year variations in moisture availability. The sig- nificant correlation between grain yield and zl for all three groups for the most stressed conditions indicate such feasibility, especially considering the performance under stress of elite CIMMYT lines, which demonstrated no such relationship under the no-stress situation.
These conclusions, though based on only one exper- iment, are consistent with results of Condon et al. (1987) and Araus et al. (1993) on wheat which did not experience stress, and with those of Craufurd et al. (1991 ) on barley grown in a range of environments differing in water availability, particularly in the sever- ity of terminal drought.
Based on these results it seems desirable to undertake selection experiments, both in low- and high-stress environments, to test the value of the carbon isotope discrimination for augmenting yield-based selection.
Acknowledgements
We are grateful to N.J. Shackleton, Subdepartment of Quaternary Research, University of Cambridge, for making available the facilities of his laboratories for the analyses of carbon isotope composition, to M.A. Hall and his assistants for undertaking the analysis of the peduncle samples, and to I. Ortiz-Monasterio, J. Cruz Miranda and A. Lim6n Ortega for their valuable assistance for field operations.
54 K.D. Sayre et al. / Field Crops Research 41 (1995) 45-54
References
Araus, J.L., Reynolds, M.P. and Acevedo, E., 1993. Leaf posture, grain yield, growth, leaf structure, and carbon isotope discrimi- nation in wheat. Crop Sci., 33: 1273-1279.
Condon, A.G,, Richards, R.A. and Farquhar, G.D., 1987. Carbon isotope discrimination is positively correlated with grain yield and dry matter production in field grown wheat. Crop Sci., 27: 996-1001.
Craufurd, P.Q., Austin, R.B., Acevedo, E. and Hall, M.A., 1991. Carbon isotope discrimination and grain-yield in barley. Field Crops Res., 27: 301-313.
Delgado, M.I., Reynolds, M.P., Larqu6-Saavedra, A. and Nava, S.T., 1994. Genetic diversity for photosynthesis in wheat yield under heat-stressed field environments and its relationship to produc- tivity. Wheat Special Report No. 30. CIMMYT, Mexico, D.F.
Farquhar, G.D. and Richards, R.A., 1984. Isotopic composition of plant carbon correlates with water use efficiency of wheat gen- otypes. Aust. J. Plant Physiol., 11: 539-552.
Farquhar, G.D., Ehleringer, J.R. and Hubrik, K.T., 1989. Carbon isotope discrimination and photosynthesis. Annu. Rev. Plant Physiol. Plant Mol. Biol., 40: 503-537.
Hanks, R.J., Keller, J., Rasmussen, V.P. and Wilson, G.D., 1976. Line-source sprinkler for continuous variable irrigation-crop pro- duction studies. Soil Sci. Soc. Am. J., 40: 426--429.


