Embed Size (px)
Citation preview
This report contains the collective views of an international group ofexperts and does not necessarily represent the decisions or the stated policyof the United Nations Environment Programme, the International LabourOrganisation or the World Health Organization.
Environmental Health Criteria 213
CARBON MONOXIDE(SECOND EDITION)
First draft prepared by Mr J. Raub, US Environmental ProtectionAgency, Research Triangle Park, North Carolina, USA
Published under the joint sponsorship of the United NationsEnvironment Programme, the International LabourOrganisation and the World Health Organization, andproduced within the framework of the Inter-OrganizationProgramme for the Sound Management of Chemicals.
The pagination and layout of this pdf file and of the printed EHCare not identicalCorrigenda published by 30th November 2004 have beenincorporated in this file-
World Health OrganizationGeneva, 1999
The International Programme on Chemical Safety (IPCS), established in 1980,is a joint venture of the United Nations Environment Programme (UNEP), theInternational Labour Organisation (ILO) and the World Health Organization (WHO).The overall objectives of the IPCS are to establish the scientific basis for assessment ofthe risk to human health and the environment from exposure to chemicals, throughinternational peer review processes, as a prerequisite for the promotion of chemicalsafety, and to provide technical assistance in strengthening national capacities for thesound management of chemicals.
The Inter-Organization Programme for the Sound Management of Chemicals(IOMC) was established in 1995 by UNEP, ILO, the Food and Agriculture Organizationof the United Nations, WHO, the United Nations Industrial Development Organizationand the Organisation for Economic Co-operation and Development (ParticipatingOrganizations), following recommendations made by the 1992 UN Conference onEnvironment and Development to strengthen cooperation and increase coordination inthe field of chemical safety. The purpose of the IOMC is to promote coordination of thepolicies and activities pursued by the Participating Organizations, jointly or separately,to achieve the sound management of chemicals in relation to human health and theenvironment.
WHO Library Cataloguing-in-Publication Data
Carbon monoxide.
(Environmental health criteria ; 213)
1.Carbon monoxide - adverse effects 2.Carbon monoxide - pharmacology3.Environmental monitoring - methods 4.Environmental exposure 5.Risk factorsI.International Programme on Chemical Safety II.Series
ISBN 92 4 157213 2 (NLM classification: QV 662) ISSN 0250-863X
The World Health Organization welcomes requests for permission to reproduce ortranslate its publications, in part or in full. Applications and enquiries should beaddressed to the Office of Publications, World Health Organization, Geneva,Switzerland, which will be glad to provide the latest information on any changes madeto the text, plans for new editions, and reprints and translations already available.
©World Health Organization 1999
Publications of the World Health Organization enjoy copyright protection inaccordance with the provisions of Protocol 2 of the Universal Copyright Convention.All rights reserved.
The designations employed and the presentation of the material in this publicationdo not imply the expression of any opinion whatsoever on the part of the Secretariat ofthe World Health Organization concerning the legal status of any country, territory, cityor area or of its authorities, or concerning the delimitation of its frontiers or boundaries.
The mention of specific companies or of certain manufacturers’ products does notimply that they are endorsed or recommended by the World Health Organization inpreference to others of a similar nature that are not mentioned. Errors and omissionsexcepted, the names of proprietary products are distinguished by initial capital letters.
iii
CONTENTS
ENVIRONMENTAL HEALTH CRITERIA FORCARBON MONOXIDE
PREAMBLE
ABBREVIATIONS
1. SUMMARY AND CONCLUSIONS 1
1.1 Chemistry and analytical methods 11.2 Sources and environmental levels of carbon monoxide in
the environment 11.3 Environmental distribution and transformation 21.4 Population exposure to carbon monoxide 31.5 Toxicokinetics and mechanisms of action of
carbon monoxide 51.6 Health effects of exposure to carbon monoxide 7
1.6.1 Cardiovascular effects 81.6.2 Acute pulmonary effects 111.6.3 Cerebrovascular and behavioural effects 111.6.4 Developmental toxicity 121.6.5 Other systemic effects 131.6.6 Adaptation 14
1.7 Combined exposure of carbon monoxide withaltitude, drugs and other air pollutants andenvironmental factors 151.7.1 High-altitude effects 151.7.2 Carbon monoxide interaction with drugs 151.7.3 Combined exposure of carbon monoxide
with other air pollutants and environmentalfactors 16
1.7.4 Tobacco smoke 171.8 Evaluation of subpopulations potentially at risk
from carbon monoxide exposure 171.9 Carbon monoxide poisoning 181.10 Recommended WHO guidelines 19
EHC 213: Carbon Monoxide
iv
2. CHEMISTRY AND ANALYTICAL METHODS 20
2.1 Physical and chemical properties 202.2 Methods for measuring carbon monoxide in
ambient air 202.2.1 Introduction 202.2.2 Methods 22
2.2.2.1 Non-dispersive infraredphotometry method 22
2.2.2.2 Gas chromatography method 232.2.2.3 Other analysers 23
2.2.3 Measurement using personal monitors 252.2.4 Carbon monoxide detectors/alarms 25
2.3 Biological monitoring 272.3.1 Blood carboxyhaemoglobin measurement 27
2.3.1.1 Sample handling 302.3.1.2 Potential reference methods 302.3.1.3 Other methods of measurement 33
2.3.2 Carbon monoxide in expired breath 342.3.2.1 Measurement methods 362.3.2.2 Potential limitations 37
3. SOURCES OF CARBON MONOXIDE IN THEENVIRONMENT 38
3.1 Introduction 383.2 Principles of formation by source category 39
3.2.1 General combustion processes 493.2.2 Combustion engines 50
3.2.2.1 Mobile combustion engines 503.2.2.2 Stationary combustion sources
(steam boilers) 513.2.3 Other sources 52
3.3 Indoor carbon monoxide 533.3.1 Introduction 533.3.2 Emissions from indoor sources 54
3.3.2.1 Gas cooking ranges, gas ovensand gas appliances 55
3.3.2.2 Unvented space heaters 563.3.2.3 Coal or wood stoves 573.3.2.4 Tobacco combustion 57
v
4. ENVIRONMENTAL DISTRIBUTION ANDTRANSFORMATION 59
4.1 Introduction 594.2 Global sources, sinks and lifetime 60
4.2.1 Sinks 604.2.2 Atmospheric lifetime 614.2.3 Latitudinal distribution of sources 624.2.4 Uncertainties and consistencies 63
4.3 Global distributions 654.3.1 Seasonal variations 664.3.2 Latitudinal variation 664.3.3 Variations with altitude 674.3.4 Other variations 67
4.4 Global trends 68
5. ENVIRONMENTAL LEVELS AND PERSONALEXPOSURES 70
5.1 Introduction 705.2 Population exposure to carbon monoxide 71
5.2.1 Ambient air monitoring 715.2.2 Approaches for estimating population
exposure 735.2.3 Personal monitoring field studies 745.2.4 Carbon monoxide exposures indoors 775.2.5 Carbon monoxide exposures inside
vehicles 805.2.6 Carbon monoxide exposures outdoors 83
5.3 Estimating population exposure to carbonmonoxide 855.3.1 Components of exposure 875.3.2 Approaches to exposure modelling 89
5.4 Exposure measurements in populations andsubpopulations 905.4.1 Carboxyhaemoglobin measurements in
populations 905.4.2 Breath measurements in populations 935.4.3 Subject age 995.4.4 Pulmonary disease 995.4.5 Effects of smoking 100
EHC 213: Carbon Monoxide
vi
5.5 Megacities and other major urban areas 1015.6 Indoor concentrations and exposures 103
5.6.1 Indoor concentrations recorded inpersonal exposure studies 108
5.6.2 Targeted microenvironmental studies 1115.6.2.1 Indoor microenvironmental
concentrations 1135.6.2.2 Concentrations associated with
indoor sources 1145.7 Occupational exposure 119
5.7.1 Occupational exposure limits 1205.7.2 Exposure sources 1245.7.3 Combined exposure to xenobiotics
metabolized to carbon monoxide 1255.7.4 Typical studies at the workplace 125
6. TOXICOKINETICS AND METABOLISM 134
6.1 Introduction 1346.2 Endogenous carbon monoxide production 1346.3 Uptake of carbon monoxide and formation of
carboxyhaemoglobin 1366.4 Distribution of carbon monoxide 150
6.4.1 Intracellular effects of carbon monoxide 1506.4.2 Carbon monoxide binding to myoglobin 1536.4.3 Carbon monoxide uptake by cytochrome
P-450 1556.4.4 Carbon monoxide and cytochrome c
oxidase 1566.5 Elimination 160
7. EFFECTS ON LABORATORY ANIMALS 162
7.1 Introduction 1627.2 Cardiovascular system and blood 162
7.2.1 Disturbances in cardiac rhythm 1637.2.2 Haemodynamic studies 1667.2.3 Cardiomegaly 1717.2.4 Haematology studies 1777.2.5 Atherosclerosis and thrombosis 179
7.3 Respiratory system 186
vii
7.3.1 Pulmonary morphology 1867.3.2 Lung function 188
7.4 Central nervous system and behavioural effects 1907.4.1 Effects on cerebral blood flow and brain
metabolism 1907.4.1.1 Effects on cerebral blood flow 1907.4.1.2 Effects on brain metabolism 1967.4.1.3 Evidence for a reoxygenation
injury in carbon monoxidepoisoning 198
7.4.2 Effects on schedule-controlled behaviour 1987.5 Adaptation 2007.6 Developmental toxicity 211
7.6.1 Introduction 2117.6.2 Evidence for elevated fetal carboxy-
haemoglobin relative to maternalhaemoglobin 213
7.6.3 Effect of maternal carboxyhemoglobinon placental oxygen transport 2207.6.3.1 Measurement of carboxy-
haemoglobin content in fetalblood 222
7.6.4 Consequences of carbon monoxide indevelopment 2237.6.4.1 Fetotoxic and teratogenic
consequences of prenatalcarbon monoxide exposure 223
7.6.4.2 Alteration in cardiovasculardevelopment followingearly carbon monoxide exposure 227
7.6.4.3 Neurobehavioural consequencesof perinatal carbon monoxideexposure 230
7.6.4.4 Neurochemical effects of prenataland perinatal carbon monoxideexposure 232
7.6.4.5 Morphological consequences ofacute prenatal carbon monoxideexposure 234
7.6.4.6 Neuromuscular effects of prenatalcarbon monoxide exposure 234
EHC 213: Carbon Monoxide
viii
7.6.4.7 Summary 2357.7 Other systemic effects 2357.8 Interactions 237
7.8.1 Combinations with psychoactive drugs 2377.8.1.1 Alcohol 2377.8.1.2 Barbiturates 2397.8.1.3 Other psychoactive drugs 240
7.8.2 Combinations with other air pollutantsand environmental factors 2407.8.2.1 Other air pollutants 2407.8.2.2 Combustion products 2417.8.2.3 Environmental factors 2457.8.2.4 Summary 248
8. EFFECTS ON HUMANS 250
8.1 Healthy subjects 2508.1.1 Introduction 2508.1.2 Acute pulmonary effects of carbon
monoxide 2508.1.2.1 Effects on lung morphology 2508.1.2.2 Effects on lung function 251
8.1.3 Cardiovascular and respiratory responseto exercise 256
8.1.4 Behavioural changes and workperformance 2598.1.4.1 Introduction 2598.1.4.2 Sensory effects 2598.1.4.3 Motor and sensorimotor
performance 2638.1.4.4 Vigilance 2668.1.4.5 Miscellaneous measures of
performance 2678.1.4.6 Automobile driving 2708.1.4.7 Brain electrical activity 270
8.1.5 Adaptation 2728.1.5.1 Short-term habituation 2738.1.5.2 Long-term adaptation 273
8.1.6 Carbon monoxide interactions with drugs 274
ix
8.1.7 Combined exposure to carbon monoxideand other air pollutants and environmentalfactors 2758.1.7.1 Exposure to other pollutants in
ambient air 2768.1.7.2 Exposure to other environmental
factors 2778.1.8 Exposure to tobacco smoke 278
8.1.8.1 Environmental tobacco smoke 2788.1.8.2 Mainstream tobacco smoke 279
8.2 High-risk groups 2808.2.1 Effects in individuals with heart disease 2808.2.2 Effects in individuals with chronic
obstructive lung disease 2938.2.3 Effects in individuals with chronic
anaemia 2948.2.4 Arrhythmogenic effects 2958.2.5 Effects on coronary blood flow 2988.2.6 Relationship between carbon monoxide
exposure and risk of cardiovascular diseasein humans 2998.2.6.1 Introduction 2998.2.6.2 Daily mortality 2998.2.6.3 Hospital admissions 3028.2.6.4 Occupational exposures 3058.2.6.5 Carbon monoxide poisoning 3078.2.6.6 Tobacco smoke 308
8.2.7 Effects of exposure during pregnancy andearly childhood 3108.2.7.1 Pregnancy 3108.2.7.2 Reduced birth weight 3158.2.7.3 Sudden infant death syndrome 3168.2.7.4 Neurobehavioural effects 317
8.2.8 High-altitude effects 3198.2.8.1 Introduction 3198.2.8.2 Carboxyhaemoglobin formation 3218.2.8.3 Cardiovascular effects 3218.2.8.4 Neurobehavioural effects 3258.2.8.5 Compartmental shifts 327
8.3 Carbon monoxide poisoning 327
EHC 213: Carbon Monoxide
x
9. EVALUATION OF HEALTH RISKS 335
9.1 Introduction 3359.2 Age, gender and pregnancy as risk factors 3369.3 Risk of carbon monoxide exposure in individuals
with pre-existing disease 3379.3.1 Subjects with coronary artery disease 3379.3.2 Subjects with congestive heart failure 3399.3.3 Subjects with other vascular diseases 3409.3.4 Subjects with anaemia and other
haematological disorders 3409.3.5 Subjects with obstructive lung disease 341
9.4 Subpopulations at risk from combined exposureto carbon monoxide and other chemicalsubstances 3419.4.1 Interactions with drugs 3419.4.2 Interactions with other chemical substances in the environment 342
9.5 Subpopulations exposed to carbon monoxide athigh altitudes 342
9.6 Carbon monoxide poisoning 3439.7 Recommended guideline values 344
9.7.1 Environmental sources 3449.7.2 Environmental concentrations 3449.7.3 Carboxyhaemoglobin concentrations in
the population 3459.7.4 General population exposure 3469.7.5 Working population exposure 3479.7.6 Derived guideline values for carbon
monoxide concentrations in ambient air 3479.8 Recommendations 348
9.8.1 Further research 3489.8.2 Protection of human health 349
REFERENCES 350
RÉSUMÉ ET CONCLUSIONS 411
RESUMEN Y CONCLUSIONES 434
INDEX 457

xi
NOTE TO READERS OF THE CRITERIA MONOGRAPHS
Every effort has been made to present information in the criteriamonographs as accurately as possible without unduly delaying theirpublication. In the interest of all users of the Environmental HealthCriteria monographs, readers are requested to communicate any errorsthat may have occurred to the Director of the International Programmeon Chemical Safety, World Health Organization, Geneva, Switzerland,in order that they may be included in corrigenda.
* * *
A detailed data profile and a legal file can be obtained from theInternational Register of Potentially Toxic Chemicals, Case postale356, 1219 Châtelaine, Geneva, Switzerland (telephone no. + 41 22 -9799111, fax no. + 41 22 - 7973460, E-mail [email protected]).
xii
Environmental Health Criteria
P R E A M B L E
Objectives
In 1973, the WHO Environmental Health Criteria Programmewas initiated with the following objectives:
(i) to assess information on the relationship between exposure toenvironmental pollutants and human health, and to provideguidelines for setting exposure limits;
(ii) to identify new or potential pollutants;
(iii) to identify gaps in knowledge concerning the health effects ofpollutants;
(iv) to promote the harmonization of toxicological and epidemio-logical methods in order to have internationally comparableresults.
The first Environmental Health Criteria (EHC) monograph, onmercury, was published in 1976, and since that time an ever-increasingnumber of assessments of chemicals and of physical effects have beenproduced. In addition, many EHC monographs have been devoted toevaluating toxicological methodology, e.g., for genetic, neurotoxic,teratogenic and nephrotoxic effects. Other publications have beenconcerned with epidemiological guidelines, evaluation of short-termtests for carcinogens, biomarkers, effects on the elderly and so forth.
Since its inauguration, the EHC Programme has widened itsscope, and the importance of environmental effects, in addition tohealth effects, has been increasingly emphasized in the total evaluationof chemicals.
The original impetus for the Programme came from WorldHealth Assembly resolutions and the recommendations of the 1972 UNConference on the Human Environment. Subsequently, the workbecame an integral part of the International Programme on Chemical
xiii
Safety (IPCS), a cooperative programme of UNEP, ILO and WHO. Inthis manner, with the strong support of the new partners, theimportance of occupational health and environmental effects was fullyrecognized. The EHC monographs have become widely established,used and recognized throughout the world.
The recommendations of the 1992 UN Conference on Environ-ment and Development and the subsequent establishment of theIntergovernmental Forum on Chemical Safety with the priorities foraction in the six programme areas of Chapter 19, Agenda 21, all lendfurther weight to the need for EHC assessments of the risks ofchemicals.
Scope
The criteria monographs are intended to provide critical reviewson the effects on human health and the environment of chemicals andof combinations of chemicals and physical and biological agents. Assuch, they include and review studies that are of direct relevance forthe evaluation. However, they do not describe every study carried out.Worldwide data are used and are quoted from original studies, not fromabstracts or reviews. Both published and unpublished reports areconsidered, and it is incumbent on the authors to assess all the articlescited in the references. Preference is always given to published data.Unpublished data are used only when relevant published data areabsent or when they are pivotal to the risk assessment. A detailedpolicy statement is available that describes the procedures used forunpublished proprietary data so that this information can be used in theevaluation without compromising its confidential nature (WHO (1990)Revised Guidelines for the Preparation of Environmental HealthCriteria Monographs. PCS/90.69, Geneva, World HealthOrganization).
In the evaluation of human health risks, sound human data,whenever available, are preferred to animal data. Animal and in vitrostudies provide support and are used mainly to supply evidence missingfrom human studies. It is mandatory that research on human subjectsis conducted in full accord with ethical principles, including theprovisions of the Helsinki Declaration.
EHC 213: Carbon Monoxide
xiv
The EHC monographs are intended to assist national andinternational authorities in making risk assessments and subsequent riskmanagement decisions. They represent a thorough evaluation of risksand are not, in any sense, recommendations for regulation or standardsetting. These latter are the exclusive purview of national and regionalgovernments.
Content
The layout of EHC monographs for chemicals is outlined below.
• Summary — a review of the salient facts and the risk evaluationof the chemical
• Identity — physical and chemical properties, analytical methods• Sources of exposure• Environmental transport, distribution, and transformation• Environmental levels and human exposure• Kinetics and metabolism in laboratory animals and humans• Effects on laboratory mammals and in vitro test systems• Effects on humans• Effects on other organisms in the laboratory and field• Evaluation of human health risks and effects on the environment• Conclusions and recommendations for protection of human
health and the environment• Further research• Previous evaluations by international bodies, e.g., IARC,
JECFA, JMPR
Selection of chemicals
Since the inception of the EHC Programme, the IPCS hasorganized meetings of scientists to establish lists of priority chemicalsfor subsequent evaluation. Such meetings have been held in: Ispra,Italy, 1980; Oxford, United Kingdom, 1984; Berlin, Germany, 1987;and North Carolina, USA, 1995. The selection of chemicals has beenbased on the following criteria: the existence of scientific evidence thatthe substance presents a hazard to human health and/or theenvironment; the possible use, persistence, accumulation or degrada-
xv
tion of the substance shows that there may be significant human orenvironmental exposure; the size and nature of populations at risk(both human and other species) and risks for the environment; inter-national concern, i.e., the substance is of major interest to severalcountries; adequate data on the hazards are available.
If an EHC monograph is proposed for a chemical not on thepriority list, the IPCS Secretariat consults with the cooperatingorganizations and all the Participating Institutions before embarking onthe preparation of the monograph.
Procedures
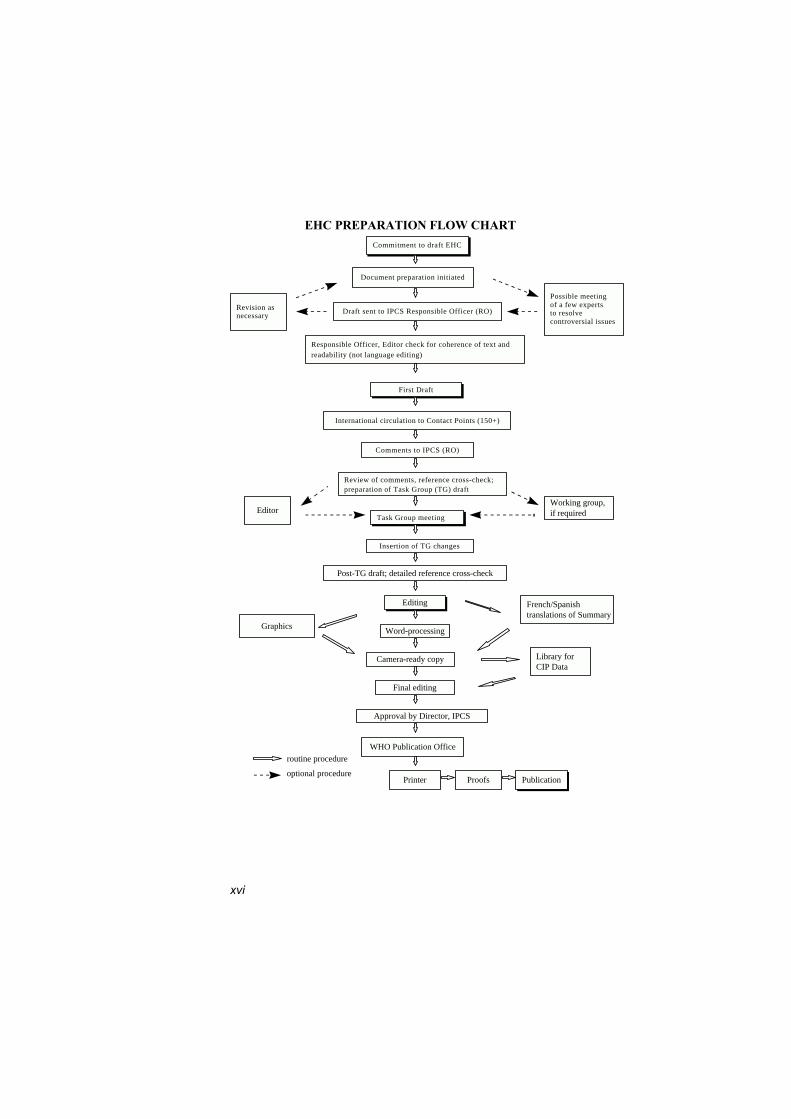
The order of procedures that result in the publication of an EHCmonograph is shown in the flow chart. A designated staff member ofIPCS, responsible for the scientific quality of the document, serves asResponsible Officer (RO). The IPCS Editor is responsible for layoutand language. The first draft, prepared by consultants or, more usually,staff from an IPCS Participating Institution, is based initially on dataprovided from the International Register of Potentially ToxicChemicals and from reference databases such as Medline and Toxline.
The draft document, when received by the RO, may require aninitial review by a small panel of experts to determine its scientificquality and objectivity. Once the RO finds the document acceptable asa first draft, it is distributed, in its unedited form, to well over 150 EHCcontact points throughout the world who are asked to comment on itscompleteness and accuracy and, where necessary, provide additionalmaterial. The contact points, usually designated by governments, maybe Participating Institutions, IPCS Focal Points or individual scientistsknown for their particular expertise. Generally, some four months areallowed before the comments are considered by the RO and author(s).A second draft incorporating comments received and approved by theDirector, IPCS, is then distributed to Task Group members, who carryout the peer review, at least six weeks before their meeting.
The Task Group members serve as individual scientists, not asrepresentatives of any organization, government or industry. Theirfunction is to evaluate the accuracy, significance and relevance of the
xvi
Commitment to draft EHCCommitment to draft EHC
Document preparation initiated
Draft sent to IPCS Responsible Officer (RO)
EHC PREPARATION FLOW CHART
Revision asnecessary
Possible meeting of a few experts to resolve controversial issues
First DraftFirst Draft
Responsible Officer, Editor check for coherence of text and readability (not language editing)
Responsible Officer, Editor check for coherence of text and readability (not language editing)
International circulation to Contact Points (150+)
Comments to IPCS (RO)
Review of comments, reference cross-check;preparation of Task Group (TG) draft
Task Group meeting
Insertion of TG changes
Post-TG draft; detailed reference cross-check
EditingEditing
Word-processing
Camera-ready copy
Final editing
Approval by Director, IPCS
WHO Publication Office
Printer Proofs PublicationPublication
Graphics
Library forCIP Data
French/Spanish translations of Summary
Working group,if requiredEditor
routine procedure
optional procedure
xvii
information in the document and to assess the health and environmentalrisks from exposure to the chemical. A summary and recommendationsfor further research and improved safety aspects are also required. Thecomposition of the Task Group is dictated by the range of expertiserequired for the subject of the meeting and by the need for a balancedgeographical distribution.
The three cooperating organizations of the IPCS recognize theimportant role played by nongovernmental organizations. Repre-sentatives from relevant national and international associations may beinvited to join the Task Group as observers. While observers mayprovide a valuable contribution to the process, they can speak only atthe invitation of the Chairperson. Observers do not participate in thefinal evaluation of the chemical; this is the sole responsibility of theTask Group members. When the Task Group considers it to beappropriate, it may meet in camera.
All individuals who as authors, consultants or advisers participatein the preparation of the EHC monograph must, in addition to servingin their personal capacity as scientists, inform the RO if at any time aconflict of interest, whether actual or potential, could be perceived intheir work. They are required to sign a conflict of interest statement.Such a procedure ensures the transparency and probity of the process.
When the Task Group has completed its review and the RO issatisfied as to the scientific correctness and completeness of thedocument, the document then goes for language editing, referencechecking and preparation of camera-ready copy. After approval by theDirector, IPCS, the monograph is submitted to the WHO Office ofPublications for printing. At this time, a copy of the final draft is sentto the Chairperson and Rapporteur of the Task Group to check for anyerrors.
It is accepted that the following criteria should initiate theupdating of an EHC monograph: new data are available that wouldsubstantially change the evaluation; there is public concern for healthor environmental effects of the agent because of greater exposure; anappreciable time period has elapsed since the last evaluation.
All Participating Institutions are informed, through the EHCprogress report, of the authors and institutions proposed for the draftingof the documents. A comprehensive file of all comments received on

EHC 213: Carbon Monoxide
xviii
drafts of each EHC monograph is maintained and is available onrequest. The Chairpersons of Task Groups are briefed before eachmeeting on their role and responsibility in ensuring that these rules arefollowed.
xix
WHO TASK GROUP ON ENVIRONMENTAL HEALTHCRITERIA FOR CARBON MONOXIDE
Members
Dr M.R. Carratu, Institute of Pharmacology, Medical School,University of Bari, Policlinico, Piazza G. Cesare, I-70124 Bari,Italy
Dr Qing Chen, Beijing Medical University, School of Public Health,Beijing, People’s Republic of China
Dr G. Cotti, Agenzia Regionale per la Prevenzione e l’Ambientedell’Emilia-Romagna (ARPA), Sezione Provinciale di Bologna,via Triachini 17, I-40138 Bologna, Italy
Dr M.J. Hazucha, UNC Center for Environmental Medicine andLung Biology, School of Medicine, The University of NorthCarolina, Chapel Hill, North Carolina 27599-7310, USA
Dr M. Jantunen, KTL Environmental Health, EXPOLIS,Mannerheiminitie 166, FIN-00300 Helsinki, Finland
Professor E. Lahmann, Schützallee 136, D-14169 Berlin 37(Dahlem), Germany
Dr P. Lauriola, Direzione Tecnica, ARPA Emilia Romagna, Via Po5, I-40139 Bologna, Italy
Dr M. Mathieu-Nolf, Centre Anti-Poisons, 5 avenue Oscar Lambret,F-59037 Lille Cédex, France
Dr D. Pankow, Institute of Environmental Toxicology, MartinLuther University, Franzosenweg 1a, D-06097 Halle (Saale),Germany
Professor D.G. Penney, Department of Physiology, Wayne StateUniversity, School of Medicine, Detroit, Michigan 48201, USA
EHC 213: Carbon Monoxide
xx
Dr J.A. Raub, National Center for Environmental Assessment, USEnvironmental Protection Agency (MD-52), Research TrianglePark, North Carolina 27711, USA (Rapporteur)
Professor J.A. Sokal, Institute of Occupational Medicine, Koscielna13 str., PL-41-200 Sosnowiec, Poland
Dr F.M. Sullivan, Harrington House, 8 Harrington Road, Brighton,E. Sussex, BN1 6RE, United Kingdom (Chairman)
Observers
Dr J.H. Duffus, International Union of Pure and Applied Chemistry(IUPAC), The Edinburgh Centre for Toxicology, Heriot-WattUniversity, Riccarton, Edinburgh, EH14 4AS, United Kingdom
Professor A. Mutti, International Commission on OccupationalHealth (ICOH), Laboratory of Industrial Toxicology, Universityof Parma Medical School, Via A. Gramsci 14, I-43100 Parma,Italy
Secretariat
Dr B.H. Chen, Medical Officer, Assessment of Risk andMethodologies, International Programme on Chemical Safety,World Health Organization, Geneva, Switzerland (Secretary)
Dr M. Mercier, Director, International Programme on ChemicalSafety, World Health Organization, Geneva, Switzerland
xxi
IPCS TASK GROUP ON ENVIRONMENTAL HEALTHCRITERIA FOR CARBON MONOXIDE (SECOND EDITION)
The Environmental Health Criteria for Carbon Monoxide (Firstedition) was published in 1979. Since then, a lot of new health data oncarbon monoxide have emerged, and the global exposure scenario hasalso changed. The information presented in this edition focusesprimarily on the data that have become available since the publicationof the first edition.
A WHO Task Group on Environmental Health Criteria forCarbon Monoxide met in Bologna, Italy, from 26 to 30 May 1997. Themeeting was organized and supported financially by the AgenziaRegionale per la Prevenzione e l’Ambiente dell’Emilia-Romagna(ARPA), Sezione Provinciale di Bologna, Italy. Dr M. Mercier,Director of the International Programme on Chemical Safety (IPCS),opened the meeting and welcomed the participants on behalf of thethree IPCS cooperating organizations (UNEP/ILO/WHO). From theSecretariat, Dr B.H. Chen, IPCS, served as Secretary of the meeting.The Task Group reviewed and revised the draft criteria monograph andmade an evaluation of the risks for human health from exposure tocarbon monoxide, and made a recommendation on the air qualityguidelines for carbon monoxide.
The first draft of this monograph was prepared by Mr J. Raub ofthe US Environmental Protection Agency (US EPA) in ResearchTriangle Park. The second draft was also prepared by Mr J. Raub,incorporating comments received following the circulation of the firstdraft to the IPCS Contact Points for Environmental Health Criteriamonographs. Dr P. Pankow contributed to the final text of themetabolism chapter, Drs Carratù, Hazucha, and Penney contributed tothe final text of the animal study chapter, and Mr Raub contributedsignificantly to the final text of the document.
Dr B.H. Chen, member of the IPCS Central Unit, and Ms M.Sheffer, Scientific Editor, Ottawa, Canada, were responsible for theoverall scientific content and linguistic editing, respectively.
The efforts of all who helped in the preparation and finalizationof the document are gratefully acknowledged.

EHC 213: Carbon Monoxide
xxii
Financial support for this Task Group meeting was provided bythe Agenzia Regionale per la Prevenzione e l’Ambiente dell’EmiliaRomagna (Regional Agency for Prevention and Environment ofEmilia-Romagna Region, Italy).

xxiii
ABBREVIATIONS
ACGIH American Conference of GovernmentalIndustrial Hygienists
A/F air to fuelBAT biological tolerance limitBEI biological exposure indexCFK Coburn-Forster-KaneCI confidence intervalCO carbon monoxideCOHb carboxyhaemoglobinDNA deoxyribonucleic acidEPA Environmental Protection Agency (USA)FEV1 forced expiratory volume in 1 sFVC forced vital capacityIQ intelligence quotientLC50 median lethal concentratoinLD50 median lethal doseLOEL lowest-observed-effect levelNAAQS National Ambient Air Quality StandardNADPH reduced nicotinamide adenine dinucleotide
phosphateNDIR non-dispersive infraredNIOSH National Institute for Occupational Safety and
Health (USA)NOEL no-observed-effect levelO2Hb oxyhaemoglobinPCO partial pressure of carbon monoxidePO
2 partial pressure of oxygen
PEM personal exposure monitorPGI2 prostacyclinPM2.5 particulate matter with mass median
aerodynamic diameter less than 2.5 :mPM10 particulate matter with mass median
aerodynamic diameter less than 10 :mppb part per billionppbv part per billion by volumeppm part per millionREL recommended exposure limitRNA ribonucleic acid

EHC 213: Carbon Monoxide
xxiv
RR relative riskSD standard deviationSMR standardized mortality ratioSTEL short-term exposure limitTLV threshold limit valueTWA time-weighted averageUV ultraviolet
E minute ventilationO2 max maximal oxygen uptake
WHO World Health Organization
1
1. SUMMARY AND CONCLUSIONS
Carbon monoxide (CO) is a colourless, odourless gas that can bepoisonous to humans. It is a product of the incomplete combustion ofcarbon-containing fuels and is also produced by natural processes orby biotransformation of halomethanes within the human body. Withexternal exposure to additional carbon monoxide, subtle effects canbegin to occur, and exposure to higher levels can result in death. Thehealth effects of carbon monoxide are largely the result of the for-mation of carboxyhaemoglobin (COHb), which impairs the oxygencarrying capacity of the blood.
1.1 Chemistry and analytical methods
Methods available for the measurement of carbon monoxide inambient air range from fully automated methods using the non-dispersive infrared (NDIR) technique and gas chromatography tosimple semiquantitative manual methods using detector tubes.Because the formation of carboxyhaemoglobin in humans isdependent on many factors, including the variability of ambient airconcentrations of carbon monoxide, carboxyhaemoglobinconcentration should be measured rather than calculated. Severalrelatively simple methods are available for determining carbonmonoxide by analysis either of the blood or of alveolar air that is inequilibrium with the blood. Some of these methods have beenvalidated by careful comparative studies.
1.2 Sources and environmental levels of carbonmonoxide in the environment
Carbon monoxide is a trace constituent of the troposphere,produced by both natural processes and human activities. Becauseplants can both metabolize and produce carbon monoxide, trace levelsare considered a normal constituent of the natural environment.Although ambient concentrations of carbon monoxide in the vicinityof urban and industrial areas can substantially exceed global back-ground levels, there are no reports of these currently measured levelsof carbon monoxide producing any adverse effects on plants ormicroorganisms. Ambient concentrations of carbon monoxide, how-ever, can be detrimental to human health and welfare, depending on
EHC 213: Carbon Monoxide
2
the levels that occur in areas where humans live and work and on thesusceptibility of exposed individuals to potentially adverse effects.
Trends in air quality data from fixed-site monitoring stationsshow a general decline in carbon monoxide concentrations, whichreflects the efficacy of emission control systems on newer vehicles.Highway vehicle emissions in the USA account for about 50% of totalemissions; non-highway transportation sources contribute 13%. Theother categories of carbon monoxide emissions are other fuel combus-tion sources, such as steam boilers (12%); industrial processes (8%);solid waste disposal (3%); and miscellaneous other sources (14%).
Indoor concentrations of carbon monoxide are a function ofoutdoor concentrations, indoor sources, infiltration, ventilation and airmixing between and within rooms. In residences without sources,average carbon monoxide concentrations are approximately equal toaverage outdoor levels. The highest indoor carbon monoxide concen-trations are associated with combustion sources and are found inenclosed parking garages, service stations and restaurants, for exam-ple. The lowest indoor carbon monoxide concentrations are found inhomes, churches and health care facilities. Exposure studies show thatpassive cigarette smoke is associated with increasing a non-smoker’sexposure by an average of about 1.7 mg/m3 (1.5 ppm) and that use ofa gas cooking range at home is associated with an increase of about2.9 mg/m3 (2.5 ppm). Other sources that may contribute to carbonmonoxide in the home include combustion space and water heatersand coal- or wood-burning stoves.
1.3 Environmental distribution and transformation
Recent data on global trends in tropospheric carbon monoxideconcentrations indicate a decrease over the last decade. Globalbackground concentrations fall in the range of 60–140 :g/m3 (50–120 ppb). Levels are higher in the northern hemisphere than in thesouthern hemisphere. Average background concentrations also fluc-tuate seasonally. Higher levels occur in the winter months, and lowerlevels occur in the summer months. About 60% of the carbon monox-ide found in the non-urban troposphere is attributed to human activi-ties, both directly from combustion processes and indirectly throughthe oxidation of hydrocarbons and methane that, in turn, arise fromagricultural activities, landfills and other similar sources.Atmospheric reactions involving carbon monoxide can produce ozone
Summary and Conclusions
3
in the troposphere. Other reactions may deplete concentrations of thehydroxyl radical, a key participant in the global removal cycles ofmany other natural and anthropogenic trace gases, thus possiblycontributing to changes in atmospheric chemistry and, ultimately, toglobal climate change.
1.4 Population exposure to carbon monoxide
During typical daily activities, people encounter carbon monox-ide in a variety of microenvironments — while travelling in motorvehicles, working at their jobs, visiting urban locations associatedwith combustion sources, or cooking and heating with domestic gas,charcoal or wood fires — as well as in tobacco smoke. Overall, themost important carbon monoxide exposures for a majority of indi-viduals occur in the vehicle and indoor microenvironments.
The development of small, portable electrochemical personalexposure monitors (PEMs) has made possible the measurement ofcarbon monoxide concentrations encountered by individuals as theymove through numerous diverse indoor and outdoor microenviron-ments that cannot be monitored by fixed-site ambient stations. Resultsof both exposure monitoring in the field and modelling studiesindicate that individual personal exposure determined by PEMs doesnot directly correlate with carbon monoxide concentrationsdetermined by using fixed-site monitors alone. This observation is dueto the mobility of people and to the spatial and temporal variability ofcarbon monoxide concentrations. Although they fail to show acorrelation between individual personal monitor exposures andsimultaneous nearest fixed-site monitor concentrations, large-scalecarbon monoxide human exposure field studies do suggest thataggregate personal exposures are lower on days of lower ambientcarbon monoxide levels as determined by the fixed-site monitors andhigher on days of higher ambient levels. These studies point out thenecessity of having personal carbon monoxide measurements toaugment fixed-site ambient monitoring data when total humanexposure is to be evaluated. Data from these field studies can be usedto construct and test models of human exposure that account for timeand activity patterns known to affect exposure to carbon monoxide.
EHC 213: Carbon Monoxide
4
Evaluation of human carbon monoxide exposure situationsindicates that occupational exposures in some workplaces orexposures in homes with faulty or unvented combustion appliancescan exceed 110 mg carbon monoxide/m3 (100 ppm), often leading tocarboxyhaemoglobin levels of 10% or more with continued exposure.In contrast, such high exposure levels are encountered much lesscommonly by the general public exposed under ambient conditions.More frequently, exposures to less than 29–57 mg carbon monoxide/m3 (25–50 ppm) for any extended period of time occur among thegeneral population; at the low exercise levels usually engaged inunder such circumstances, the resulting carboxyhaemoglobin levelsmost typically remain 1–2% among non-smokers. These levels can becompared with the physiological norm for non-smokers, which isestimated to be in the range of 0.3–0.7% carboxyhaemoglobin. Insmokers, however, baseline carboxyhaemoglobin concentrations aver-age 4%, with a usual range of 3–8%, reflecting absorption of carbonmonoxide from inhaled smoke.
Studies of human exposure have shown that motor vehicleexhaust is the most important source for regularly encounteredelevated carbon monoxide levels. Studies indicate that the motorvehicle interior has the highest average carbon monoxide concentra-tion (averaging 10–29 mg/m3 [9–25 ppm]) of all microenvironments.Furthermore, commuting exposures have been shown to be highlyvariable, with some commuters breathing carbon monoxide in excessof 40 mg/m3 (35 ppm).
The workplace is another important setting for carbon monoxideexposures. In general, apart from commuting to and from work,exposures at work exceed carbon monoxide exposures during non-work periods. Occupational and non-occupational exposures mayoverlay one another and result in a higher concentration of carbonmonoxide in the blood. Most importantly, the nature of certainoccupations carries an increased risk of high carbon monoxideexposure (e.g., those occupations involved directly with vehicledriving, maintenance and parking). Occupational groups exposed tocarbon monoxide from vehicle exhaust include auto mechanics;parking garage and gas station attendants; bus, truck or taxi drivers;police; and warehouse workers. Certain industrial processes canexpose workers to carbon monoxide produced directly or as a by-product; they include steel production, coke ovens, carbon black
Summary and Conclusions
5
production and petroleum refining. Firefighters, cooks and construc-tion workers may also be exposed at work to high carbon monoxidelevels. Occupational exposures in industries or settings with carbonmonoxide production represent some of the highest individual expo-sures observed in field monitoring studies.
1.5 Toxicokinetics and mechanisms of action of carbonmonoxide
Carbon monoxide is absorbed through the lungs, and theconcentration of carboxyhaemoglobin in the blood at any time willdepend on several factors. When in equilibrium with ambient air, thecarboxyhaemoglobin content of the blood will depend mainly on theconcentrations of inspired carbon monoxide and oxygen. However, ifequilibrium has not been achieved, the carboxyhaemoglobin concen-tration will also depend on the duration of exposure, pulmonaryventilation and the carboxyhaemoglobin originally present beforeinhalation of the contaminated air. In addition to its reaction withhaemoglobin, carbon monoxide combines with myoglobin, cyto-chromes and metalloenzymes such as cytochrome c oxidase andcytochrome P-450. The health significance of these reactions is notclearly understood but is likely to be of less importance at ambientexposure levels than that of the reaction of the gas with haemoglobin.
The exchange of carbon monoxide between the air we breatheand the human body is controlled by both physical (e.g., masstransport and diffusion) and physiological (e.g., alveolar ventilationand cardiac output) processes. Carbon monoxide is readily absorbedfrom the lungs into the bloodstream. The final step in this processinvolves competitive binding between carbon monoxide and oxygento haemoglobin in the red blood cell, forming carboxyhaemoglobinand oxyhaemoglobin (O2Hb), respectively. The binding of carbonmonoxide to haemoglobin, producing carboxyhaemoglobin anddecreasing the oxygen carrying capacity of blood, appears to be theprincipal mechanism of action underlying the induction of toxiceffects of low-level carbon monoxide exposures. The precise mecha-nisms by which toxic effects are induced via carboxyhaemoglobinformation are not understood fully but likely include the induction ofa hypoxic state in many tissues of diverse organ systems. Alternativeor secondary mechanisms of carbon monoxide-induced toxicity(besides carboxyhaemoglobin) have been hypothesized, but none has
EHC 213: Carbon Monoxide
6
been demonstrated to operate at relatively low (near-ambient) carbonmonoxide exposure levels. Blood carboxyhaemoglobin levels, then,are currently accepted as representing a useful physiological markerby which to estimate internal carbon monoxide burdens due to thecombined contribution of (1) endogenously derived carbon monoxideand (2) exogenously derived carbon monoxide resulting from expo-sure to external sources of carbon monoxide. Carboxyhaemoglobinlevels likely to result from particular patterns (concentrations, dura-tions, etc.) of external carbon monoxide exposure can be estimatedreasonably well from the Coburn-Forster-Kane (CFK) equation.
A unique feature of carbon monoxide exposure, therefore, is thatthe blood carboxyhaemoglobin level represents a useful biologicalmarker of the dose that the individual has received. The amount ofcarboxyhaemoglobin formed is dependent on the concentration andduration of carbon monoxide exposure, exercise (which increases theamount of air inhaled per unit time), ambient temperature, healthstatus and the characteristic metabolism of the individual exposed.The formation of carboxyhaemoglobin is a reversible process;however, because of the tight binding of carbon monoxide to haemo-globin, the elimination half-time is quite long, ranging from 2 to 6.5h, depending on the initial levels of carboxyhaemoglobin and theventilation rate of the individuals. This might lead to accumulation ofcarboxyhaemoglobin, and even relatively low concentrations of carbonmonoxide might produce substantial blood levels of carboxyhaemo-globin.
The level of carboxyhaemoglobin in the blood may be determineddirectly by blood analysis or indirectly by measuring carbon monoxidein exhaled breath. The measurement of exhaled breath has theadvantages of ease, speed, precision and greater subject acceptancethan measurement of blood carboxyhaemoglobin. However, the accu-racy of the breath measurement procedure and the validity of theHaldane relationship between breath and blood remain in question forexposures at low environmental carbon monoxide concentrations.
Because carboxyhaemoglobin measurements are not readilyavailable in the exposed population, mathematical models have beendeveloped to predict carboxyhaemoglobin levels from known carbonmonoxide exposures under a variety of circumstances. The best all-around model for carboxyhaemoglobin prediction is still the equationdeveloped by Coburn, Forster and Kane. The linear solution is useful
Summary and Conclusions
7
for examining air pollution data leading to relatively low carboxy-haemoglobin levels, whereas the non-linear solution shows goodpredictive power even for high carbon monoxide exposures. The tworegression models might be useful only when the conditions ofapplication closely approximate those under which the parameterswere estimated.
Although the principal cause of carbon monoxide toxicity at lowexposure levels is thought to be tissue hypoxia due to carbonmonoxide binding to haemoglobin, certain physiological aspects ofcarbon monoxide exposure are not explained well by decreases in theintracellular oxygen partial pressure related to the presence of car-boxyhaemoglobin. Consequently, secondary mechanisms of carbonmonoxide toxicity related to intracellular uptake of carbon monoxidehave been the focus of a great deal of research interest. Carbonmonoxide binding to many intracellular compounds has been welldocumented both in vitro and in vivo; however, it is still uncertainwhether or not intracellular uptake of carbon monoxide in thepresence of haemoglobin is sufficient to cause either acute organsystem dysfunction or long-term health effects. The virtual absence ofsensitive techniques capable of assessing intracellular carbonmonoxide binding under physiological conditions has resulted in avariety of indirect approaches to the problem, as well as manynegative studies.
Current knowledge pertaining to intracellular carbon monoxidebinding suggests that the proteins most likely to be inhibited function-ally at relevant levels of carboxyhaemoglobin are myoglobin, foundpredominantly in heart and skeletal muscle, and cytochrome oxidase.The physiological significance of carbon monoxide uptake by myo-globin is uncertain at this time, but sufficient concentrations of car-boxymyoglobin could potentially limit the maximal oxygen uptake ofexercising muscle. Although there is suggestive evidence for signifi-cant binding of carbon monoxide to cytochrome oxidase in heart andbrain tissue, it is unlikely that significant carbon monoxide bindingwould occur at low carboxyhaemoglobin levels.
1.6 Health effects of exposure to carbon monoxide
The health significance of carbon monoxide in ambient air islargely due to the fact that it forms a strong bond with thehaemoglobin molecule, forming carboxyhaemoglobin, which impairs
EHC 213: Carbon Monoxide
8
the oxygen carrying capacity of the blood. The dissociation of oxy-haemoglobin in the tissues is also altered by the presence of carboxy-haemoglobin, so that delivery of oxygen to tissues is reduced further.The affinity of human haemoglobin for carbon monoxide is roughly240 times that for oxygen, and the proportions of carboxyhaemoglobinand oxyhaemoglobin formed in blood are dependent largely on thepartial pressures of carbon monoxide and oxygen.
Concerns about the potential health effects of exposure to carbonmonoxide have been addressed in extensive studies with both humansand various animal species. Under varied experimental protocols,considerable information has been obtained on the toxicity of carbonmonoxide, its direct effects on the blood and other tissues, and themanifestations of these effects in the form of changes in organfunction. Many of the animal studies, however, have been conductedat extremely high levels of carbon monoxide (i.e., levels not found inambient air). Although severe effects from exposure to these highlevels of carbon monoxide are not directly germane to the problemsresulting from exposure to current ambient levels of carbon monoxide,they can provide valuable information about potential effects ofaccidental exposure to carbon monoxide, particularly those exposuresoccurring indoors.
1.6.1 Cardiovascular effects
Decreased oxygen uptake and the resultant decreased workcapacity under maximal exercise conditions have clearly been shownto occur in healthy young adults starting at 5.0% carboxyhaemo-globin, and several studies have observed small decreases in workcapacity at carboxyhaemoglobin levels as low as 2.3–4.3%. Theseeffects may have health implications for the general population interms of potential curtailment of certain physically demandingoccupational or recreational activities under circumstances ofsufficiently high carbon monoxide exposure.
However, of greater concern at more typical ambient carbonmonoxide exposure levels are certain cardiovascular effects (i.e.,aggravation of angina symptoms during exercise) likely to occur in asmaller, but sizeable, segment of the general population. This group,chronic angina patients, is currently viewed as the most sensitive riskgroup for carbon monoxide exposure effects, based on evidence foraggravation of angina occurring in patients at carboxyhaemoglobin
Summary and Conclusions
9
levels of 2.9–4.5%. Dose–response relationships for cardiovasculareffects in coronary artery disease patients remain to be defined moreconclusively, and the possibility cannot be ruled out at this time thatsuch effects may occur at levels below 2.9% carboxyhaemoglobin.Therefore, new published studies are evaluated in this document todetermine the effects of carbon monoxide on aggravation of angina atlevels in the range of 2–6% carboxyhaemoglobin.
Five key studies have investigated the potential for carbon mon-oxide exposure to enhance the development of myocardial ischaemiaduring exercise in patients with coronary artery disease. An earlystudy found that exercise duration was significantly decreased by theonset of chest pain (angina) in patients with angina pectoris at post-exposure carboxyhaemoglobin levels as low as 2.9%, representing anincrease of 1.6% carboxyhaemoglobin over the baseline. Results of alarge multicentre study demonstrated effects in patients with repro-ducible exercise-induced angina at post-exposure carboxyhaemoglobinlevels of 3.2%, corresponding to an increase of 2.0% carboxyhaemo-globin from the baseline. Others also found similar effects in patientswith obstructive coronary artery disease and evidence of exercise-induced ischaemia at post-exposure carboxyhaemoglobin levels of4.1% and 5.9%, respectively, representing increases of 2.2% and4.2% carboxyhaemoglobin over the baseline. One study of subjectswith angina found an effect at 3% carboxyhaemoglobin, representingan increase of 1.5% carboxyhaemoglobin from the baseline. Thus, thelowest-observed-adverse-effect level in patients with exercise-inducedischaemia is somewhere between 3% and 4% carboxyhaemoglobin,representing an increase of 1.5–2.2% carboxyhaemoglobin from thebaseline. Effects on silent ischaemia episodes, which represent themajority of episodes in these patients, have not been studied.
The adverse health consequences of low-level carbon monoxideexposure in patients with ischaemic heart disease are very difficult topredict in the at-risk population of individuals with heart disease.Exposure to carbon monoxide that is sufficient to achieve 6% car-boxyhaemoglobin, but not lower levels of carboxyhaemoglobin, hasbeen shown to significantly increase the number and complexity ofexercise-induced arrhythmias in patients with coronary artery diseaseand baseline ectopy. This finding, combined with the time-seriesstudies of carbon monoxide-related morbidity and mortality and theepidemiological work of tunnel workers who are routinely exposed to
EHC 213: Carbon Monoxide
10
automobile exhaust, is suggestive but not conclusive evidence thatcarbon monoxide exposure may provide an increased risk of suddendeath from arrhythmia in patients with coronary artery disease.
Previous assessments of the cardiovascular effects of carbonmonoxide have identified what appears to be a linear relationshipbetween the level of carboxyhaemoglobin in the blood and decrementsin human maximal exercise performance, measured as maximaloxygen uptake. Exercise performance consistently decreases at a bloodlevel of about 5% carboxyhaemoglobin in young, healthy, non-smoking individuals. Some studies have even observed a decrease inshort-term maximal exercise duration at levels as low as 2.3–4.3%carboxyhaemoglobin; however, this decrease is so small as to be ofconcern mainly for competing athletes rather than for ordinary peopleconducting the activities of daily life.
There is also evidence from both theoretical considerations andexperimental studies in laboratory animals that carbon monoxide canadversely affect the cardiovascular system, depending on the exposureconditions utilized in these studies. Although disturbances in cardiacrhythm and conduction have been noted in healthy and cardiac-impaired animals, results from these studies are not conclusive. Thelowest level at which effects have been observed varies, dependingupon the exposure regime used and species tested. Results fromanimal studies also indicate that inhaled carbon monoxide canincrease haemoglobin concentration and haematocrit ratio, whichprobably represents a compensation for the reduction in oxygentransport caused by carbon monoxide. At high carbon monoxideconcentrations, excessive increases in haemoglobin and haematocritmay impose an additional workload on the heart and compromiseblood flow to the tissues.
There is conflicting evidence that carbon monoxide exposure willenhance development of atherosclerosis in laboratory animals, andmost studies show no measurable effect. Similarly, the possibility thatcarbon monoxide will promote significant changes in lipidmetabolism that might accelerate atherosclerosis is suggested in onlya few studies. Any such effect must be subtle, at most. Finally, carbonmonoxide probably inhibits rather than promotes platelet aggregation.In general, there are few data to indicate that an atherogenic effect of
Summary and Conclusions
11
exposure would be likely to occur in human populations at commonlyencountered levels of ambient carbon monoxide.
1.6.2 Acute pulmonary effects
It is unlikely that carbon monoxide has any direct effects on lungtissue except for extremely high concentrations associated with carbonmonoxide poisoning. Human studies on the effects of carbon monox-ide on pulmonary function are complicated by the lack of adequateexposure information, the small number of subjects studied and theshort exposures explored. Occupational or accidental exposure to theproducts of combustion and pyrolysis, particularly indoors, may leadto acute decrements in lung function if the carboxyhaemoglobin levelsare high. It is difficult, however, to separate the potential effects ofcarbon monoxide from those due to other respiratory irritants in thesmoke and exhaust. Community population studies on carbon monox-ide in ambient air have not found any significant relationship withpulmonary function, symptomatology and disease.
1.6.3 Cerebrovascular and behavioural effects
No reliable evidence demonstrating decrements in neurobehav-ioural function in healthy, young adults has been reported at carboxy-haemoglobin levels below 5%. Results of studies conducted at orabove 5% carboxyhaemoglobin are equivocal. Much of the researchat 5% carboxyhaemoglobin did not show any effect even whenbehaviours similar to those affected in other studies at higher carboxy-haemoglobin levels were involved. However, investigators failing tofind carbon monoxide-related neurobehavioural decrements at 5% orhigher carboxyhaemoglobin levels may have utilized tests not suffi-ciently sensitive to reliably detect small effects of carbon monoxide.From the empirical evidence, then, it can be said that carboxyhaemo-globin levels greater than or equal to 5% may produce decrements inneurobehavioural function. It cannot be said confidently, however,that carboxyhaemoglobin levels lower than 5% would be withouteffect. However, only young, healthy adults have been studied usingdemonstrably sensitive tests and carboxyhaemoglobin levels of 5% orgreater. The question of groups at special risk for neurobehaviouraleffects of carbon monoxide, therefore, has not been explored.
Of special note are those individuals who are taking drugs withprimary or secondary depressant effects that would be expected to
EHC 213: Carbon Monoxide
12
exacerbate carbon monoxide-related neurobehavioural decrements.Other groups at possibly increased risk for carbon monoxide-inducedneurobehavioural effects are the aged and ill, but these groups havenot been evaluated for such risk.
Under normal circumstances, the brain can increase blood flowor tissue oxygen extraction to compensate for the hypoxia caused byexposure to carbon monoxide. The overall responses of the cerebro-vasculature are similar in the fetus, newborn and adult animal; how-ever, the mechanism of the increase in cerebral blood flow is stillunclear. In fact, several mechanisms working simultaneously toincrease blood flow appear likely, and these may involve metabolicand neural aspects as well as the oxyhaemoglobin dissociation curve,tissue oxygen levels and even a histotoxic effect of carbon monoxide.Whether these compensatory mechanisms will continue to operatesuccessfully in a variety of conditions where the brain or its vascula-ture are compromised (i.e., stroke, head injury, atherosclerosis, hyper-tension) is also unknown. Aging increases the probability of suchinjury and disease. It is also possible that there exist individual differ-ences with regard to carboxyhaemoglobin sensitivity and compensa-tory mechanisms.
Behaviours that require sustained attention or sustained perfor-mance are most sensitive to disruption by carboxyhaemoglobin. Thegroup of human studies on hand–eye coordination (compensatorytracking), detection of infrequent events (vigilance) and continuousperformance offers the most consistent and defensible evidence ofcarboxyhaemoglobin effects on behaviour at levels as low as 5%.These effects at low carbon monoxide exposure concentrations,however, have been very small and somewhat controversial. Never-theless, the potential consequences of a lapse of coordination andvigilance on the continuous performance of critical tasks by operatorsof machinery such as public transportation vehicles could be serious.
1.6.4 Developmental toxicity
Studies in several laboratory animal species provide strongevidence that maternal carbon monoxide exposures of 170–230 mg/m3
(150–200 ppm), leading to approximately 15–25% carboxyhaemo-globin, produce reductions in birth weight, cardiomegaly, delays inbehavioural development and disruption in cognitive function.Isolated experiments suggest that some of these effects may be present
Summary and Conclusions
13
at concentrations as low as 69–74 mg/m3 (60–65 ppm; approximately6–11% carboxyhaemoglobin) maintained throughout gestation.Studies relating human carbon monoxide exposure from ambientsources or cigarette smoking to reduced birth weight are of concernbecause of the risk for developmental disorders; however, many ofthese studies have not considered all sources of carbon monoxide. Thecurrent data from children suggesting a link between environmentalcarbon monoxide exposures and sudden infant death syndrome areweak.
1.6.5 Other systemic effects
Laboratory animal studies suggest that enzyme metabolism ofxenobiotic compounds may be affected by carbon monoxide exposure.Most of the authors of these studies have concluded, however, thateffects on metabolism at low carboxyhaemoglobin levels (#15%) areattributable entirely to tissue hypoxia produced by increased levels ofcarboxyhaemoglobin, because they are no greater than the effectsproduced by comparable levels of hypoxic hypoxia. At higher levelsof exposure, where carboxyhaemoglobin concentrations exceed 15–20%, carbon monoxide may directly inhibit the activity of mixed-function oxidases. The decreases in xenobiotic metabolism shownwith carbon monoxide exposure might be important to individualsreceiving treatment with drugs.
Inhalation of high levels of carbon monoxide, leading to carboxy-haemoglobin concentrations greater than 10–15%, has been reportedto cause a number of other systemic effects in laboratory animals, aswell as effects in humans suffering from acute carbon monoxidepoisoning. Tissues of highly active oxygen metabolism, such as heart,brain, liver, kidney and muscle, may be particularly sensitive tocarbon monoxide poisoning. The effects of high levels of carbonmonoxide on other tissues are not as well known and are, therefore,less certain. There are reports in the literature of effects on liver,kidney, bone and the immune capacity of the lung and spleen. It isgenerally agreed that the severe tissue damage occurring during acutecarbon monoxide poisoning is due to one or more of the following:(1) ischaemia resulting from the formation of carboxyhaemoglobin,(2) inhibition of oxygen release from oxyhaemoglobin, (3) inhibitionof cellular cytochrome function (e.g., cytochrome oxidases) and(4) metabolic acidosis.
Only relatively weak evidence points towards possible carbonmonoxide effects on fibrinolytic activity, and then only at rather high
EHC 213: Carbon Monoxide
14
carbon monoxide exposure levels. Similarly, whereas certain data alsosuggest that perinatal effects (e.g., reduced birth weight, slowed post-natal development, sudden infant death syndrome) are associated withcarbon monoxide exposure, insufficient evidence exists by which toeither qualitatively confirm such an association in humans or establishany pertinent exposure–effect relationships.
1.6.6 Adaptation
The only evidence for short- or long-term compensation for oradaptation to increased carboxyhaemoglobin levels in the blood isindirect. Experimental animal data indicate that increased carboxy-haemoglobin levels produce physiological responses that tend to offsetother deleterious effects of carbon monoxide exposure. Such responsesare (1) increased coronary blood flow, (2) increased cerebral bloodflow, (3) increased haemoglobin through increased haematopoiesisand (4) increased oxygen consumption in muscle.
Short-term compensatory responses in blood flow or oxygenconsumption may not be complete or might even be lacking in certainpersons. For example, it is known from laboratory animal studies thatcoronary blood flow increases with increasing carboxyhaemoglobin,and it is known from human clinical studies that subjects with ischae-mic heart disease respond to the lowest levels of carboxyhaemoglobin(6% or less). The implication is that in some cases of cardiac impair-ment, the short-term compensatory mechanism is impaired.
From neurobehavioural studies, it is apparent that decrementsdue to carbon monoxide have not occurred consistently in all subjects,or even in the same studies, and have not demonstrated adose–response relationship with increasing carboxyhaemoglobinlevels. The implication from these data is that there might be somethreshold or time lag in a compensatory mechanism such as increasedblood flow. Without direct physiological evidence in either laboratoryanimals or, preferably, humans, this concept can only behypothesized.
The mechanism by which long-term adaptation would occur, ifit could be demonstrated in humans, is assumed to be an increasedhaemoglobin concentration via an increase in haematopoiesis. Thisalteration in haemoglobin production has been demonstrated repeat-edly in laboratory animal studies, but no recent studies have beenconducted indicating or suggesting that some adaptational benefit has
Summary and Conclusions
15
occurred or would occur. Furthermore, even if the haemoglobinincrease is a signature of adaptation, it has not been demonstrated tooccur at low ambient concentrations of carbon monoxide.
1.7 Combined exposure of carbon monoxide withaltitude, drugs and other air pollutants andenvironmental factors
1.7.1 High-altitude effects
Although there are many studies comparing and contrasting theeffects of inhaling carbon monoxide with those produced by exposureto altitude, there are relatively few reports on the combined effects ofinhaling carbon monoxide at altitude. There are data to support thepossibility that the effects of these two hypoxia episodes are at leastadditive. These data were obtained at carbon monoxide concentrationsthat are too high to have much significance for regulatory concerns.
There are even fewer studies of the long-term effects of carbonmonoxide at high altitude. These studies indicate few changes at car-bon monoxide concentrations below 110 mg/m3 (100 ppm) and alti-tudes below 4570 m. The fetus, however, may be particularly sensitiveto the effects of carbon monoxide at altitude; this is especially truewith the high levels of carbon monoxide associated with maternalsmoking.
1.7.2 Carbon monoxide interaction with drugs
There remains little direct information on the possible enhance-ment of carbon monoxide toxicity by concomitant drug use or abuse;however, there are some data suggesting cause for concern. There issome evidence that interactions between drug effects and carbonmonoxide exposure can occur in both directions; that is, carbonmonoxide toxicity may be enhanced by drug use, and the toxic orother effects of drugs may be altered by carbon monoxide exposure.Nearly all the published data that are available on carbon monoxidecombinations with drugs concern the use of alcohol.
The use and abuse of psychoactive drugs and alcohol are ubiqui-tous in society. Because of the effect of carbon monoxide on brainfunction, interactions between carbon monoxide and psychoactive
EHC 213: Carbon Monoxide
16
drugs could be anticipated. Unfortunately, little systematic researchhas addressed this question. In addition, little of the research that hasbeen done has utilized models for expected effects from treatmentcombinations. Thus, it is often not possible to assess whether thecombined effects of drugs and carbon monoxide exposure are additiveor differ from additivity. It is important to recognize that evenadditive effects of combinations can be of clinical significance,especially when the individual is unaware of the combined hazard.The greatest evidence for a potentially important interaction of carbonmonoxide comes from studies with alcohol in both laboratory animalsand humans, where at least additive effects have been obtained. Thesignificance of this is augmented by the high probable incidence ofcombined alcohol use and carbon monoxide exposure.
1.7.3 Combined exposure of carbon monoxide with other airpollutants and environmental factors
Many of the data concerning the combined effects of carbonmonoxide and other pollutants found in the ambient air are based onlaboratory animal experiments. Only a few human studies are avail-able. Early studies in healthy human subjects on common airpollutants such as carbon monoxide, nitrogen dioxide, ozone or per-oxyacetyl nitrate failed to show any interaction from combinedexposure. In laboratory studies, no interaction was observed followingcombined exposure to carbon monoxide and common ambient airpollutants such as nitrogen dioxide or sulfur dioxide. However, anadditive effect was observed following combined exposure to highlevels of carbon monoxide and nitric oxide, and a synergistic effectwas observed after combined exposure to carbon monoxide and ozone.
Toxicological interactions of combustion products, primarily car-bon monoxide, carbon dioxide and hydrogen cyanide, at levels typi-cally produced by indoor and outdoor fires have shown a synergisticeffect following carbon monoxide plus carbon dioxide exposure andan additive effect with hydrogen cyanide. Additive effects were alsoobserved when carbon monoxide, hydrogen cyanide and low oxygenwere combined; adding carbon dioxide to this combination wassynergistic.
Finally, studies suggest that environmental factors such as heatstress and noise may be important determinants of health effects whencombined with exposure to carbon monoxide. Of the effects described,
Summary and Conclusions
17
the one potentially most relevant to typical human exposures is agreater decrement in the exercise performance seen when heat stressis combined with 57 mg carbon monoxide/m3 (50 ppm).
1.7.4 Tobacco smoke
Besides being a source of carbon monoxide for smokers as wellas non-smokers, tobacco smoke is also a source of other chemicalswith which environmental carbon monoxide could interact. Availabledata strongly suggest that acute and chronic carbon monoxide expo-sure attributed to tobacco smoke can affect the cardiopulmonarysystem, but the potential interaction of carbon monoxide with otherproducts of tobacco smoke confounds the results. In addition, it is notclear if incremental increases in carboxyhaemoglobin caused byenvironmental exposure would actually be additive to chronicallyelevated carboxyhaemoglobin levels due to tobacco smoke, becausesome physiological adaptation may take place.
1.8 Evaluation of subpopulations potentially at risk fromcarbon monoxide exposure
Most information on the health effects of carbon monoxideinvolves two carefully defined population groups — young, healthyadults and patients with diagnosed coronary artery disease. On thebasis of the known effects described, patients with reproducible exer-cise-induced ischaemia appear to be best established as a sensitivegroup within the general population that is at increased risk forexperiencing health effects of concern (i.e., decreased exercise dura-tion due to exacerbation of cardiovascular symptoms) at ambient ornear-ambient carbon monoxide exposure concentrations that result incarboxyhaemoglobin levels down to 3%. A smaller sensitive group ofhealthy individuals experiences decreased exercise duration at similarlevels of carbon monoxide exposure, but only during short-termmaximal exercise. Decrements in exercise duration in the healthypopulation would therefore be of concern mainly to competing ath-letes, rather than to ordinary people carrying out the commonactivities of daily life.
It can be hypothesized, however, from both clinical and theoreti-cal work and from experimental research on laboratory animals, thatcertain other groups in the population may be at probable risk from
EHC 213: Carbon Monoxide
18
exposure to carbon monoxide. Identifiable probable risk groups canbe categorized by gender differences; by age (e.g., fetuses, younginfants and the elderly); by genetic variations (i.e., haemoglobinabnormalities); by pre-existing diseases, either known or unknown,that already decrease the availability of oxygen to critical tissues; orby the use of medications, recreational drugs or alterations inenvironment (e.g., exposure to other air pollutants or to high altitude).Unfortunately, little empirical evidence is currently available by whichto specify health effects associated with ambient or near-ambientcarbon monoxide exposures for most of these probable risk groups.
1.9 Carbon monoxide poisoning
Most of this document is concerned with the relatively lowconcentrations of carbon monoxide that induce effects in humans at,or near, the lower margin of carboxyhaemoglobin detection by currentmedical technology. Yet health effects associated with exposure to thispollutant range from the more subtle cardiovascular and neuro-behavioural effects at low ambient concentrations to unconsciousnessand death after acute exposure to high concentrations of carbon mon-oxide. The morbidity and mortality resulting from the latter exposurescan be a significant public health concern.
Carbon monoxide is responsible for a large percentage of theaccidental poisonings and deaths reported throughout the world eachyear. Certain conditions exist in both the indoor and outdoor environ-ments that cause a small percentage of the population to becomeexposed to dangerous levels of carbon monoxide. Outdoors, concen-trations of carbon monoxide are highest near street intersections, incongested traffic, near exhaust gases from internal combustionengines and from industrial sources, and in poorly ventilated areassuch as parking garages and tunnels. Indoors, carbon monoxideconcentrations are highest in workplaces or in homes that have faultyor poorly vented combustion appliances or downdrafts or backdrafts.
The symptoms and signs of acute carbon monoxide poisoningcorrelate poorly with the level of carboxyhaemoglobin measured at thetime of arrival at the hospital. Carboxyhaemoglobin levels below 10%are usually not associated with symptoms. At higher carboxyhaemo-globin saturations of 10–30%, neurological symptoms of carbonmonoxide poisoning can occur, such as headache, dizziness,
Summary and Conclusions
19
weakness, nausea, confusion, disorientation and visual disturbances.Exertional dyspnoea, increases in pulse and respiratory rates andsyncope are observed with continuous exposure, producing carboxy-haemoglobin levels from 30% to 50%. When carboxyhaemoglobinlevels are higher than 50%, coma, convulsions and cardiopulmonaryarrest may occur.
Complications occur frequently in carbon monoxide poisoning(immediate death, myocardial impairment, hypotension, arrhythmias,pulmonary oedema). Perhaps the most insidious effect of carbonmonoxide poisoning is the delayed development of neuropsychiatricimpairment within 1–3 weeks and the neurobehaviouralconsequences, especially in children. Carbon monoxide poisoningduring pregnancy results in high risk for the mother, by increasing theshort-term complications rate, and for the fetus, by causing fetaldeath, developmental disorders and cerebral anoxic lesions.Furthermore, the severity of fatal intoxication cannot be assessed bythe maternal rate.
Carbon monoxide poisoning occurs frequently, has severe conse-quences, including immediate death, involves complications and latesequelae and is often overlooked. Efforts in prevention and in publicand medical education should be encouraged.
1.10 Recommended WHO guidelines
The following guideline values (ppm values rounded) andperiods of time-weighted average exposures have been determined insuch a way that the carboxyhaemoglobin level of 2.5% is notexceeded, even when a normal subject engages in light or moderateexercise:
100 mg/m3 (87 ppm) for 15 min60 mg/m3 (52 ppm) for 30 min30 mg/m3 (26 ppm) for 1 h10 mg/m3 (9 ppm) for 8 h
20
2. CHEMISTRY AND ANALYTICAL METHODS
2.1 Physical and chemical properties
Carbon monoxide (CO) is a tasteless, odourless, colourless, non-corrosive and quite stable diatomic molecule that exists as a gas in theEarth’s atmosphere. Radiation in the visible and near-ultraviolet (UV)regions of the electromagnetic spectrum is not absorbed by carbonmonoxide, although the molecule does have weak absorption bandsbetween 125 and 155 nm. Carbon monoxide absorbs radiation in theinfrared region corresponding to the vibrational excitation of its elec-tronic ground state. It has a low electric dipole moment (0.10 debye),short interatomic distance (0.123 nm) and high heat of formationfrom atoms or bond strength (2072 kJ/mol). These observationssuggest that the molecule is a resonance hybrid of three structures(Perry et al., 1977), all of which contribute nearly equally to the nor-mal ground state. General physical properties of carbon monoxide aregiven in Table 1.
2.2 Methods for measuring carbon monoxide in ambientair
2.2.1 Introduction
Because of the low levels of carbon monoxide in ambient air,methods for its measurement require skilled personnel and sophisti-cated analytical equipment. The principles of the methodology havebeen described by Smith & Nelson (1973). A sample introductionsystem is used, consisting of a sampling probe, an intake manifold,tubing and air movers. This system is needed to collect the air samplefrom the atmosphere and to transport it to the analyser withoutaltering the original concentration. It may also be used to introduceknown gas concentrations to periodically check the reliability of theanalyser output. Construction materials for the sampling probe, intakemanifold and tubing should be tested to demonstrate that the testatmosphere composition or concentration is not altered significantly.The sample introduction system should be constructed so that itpresents no pressure drop to the analyser. At low flow and lowconcentrations, such operation may require validation.
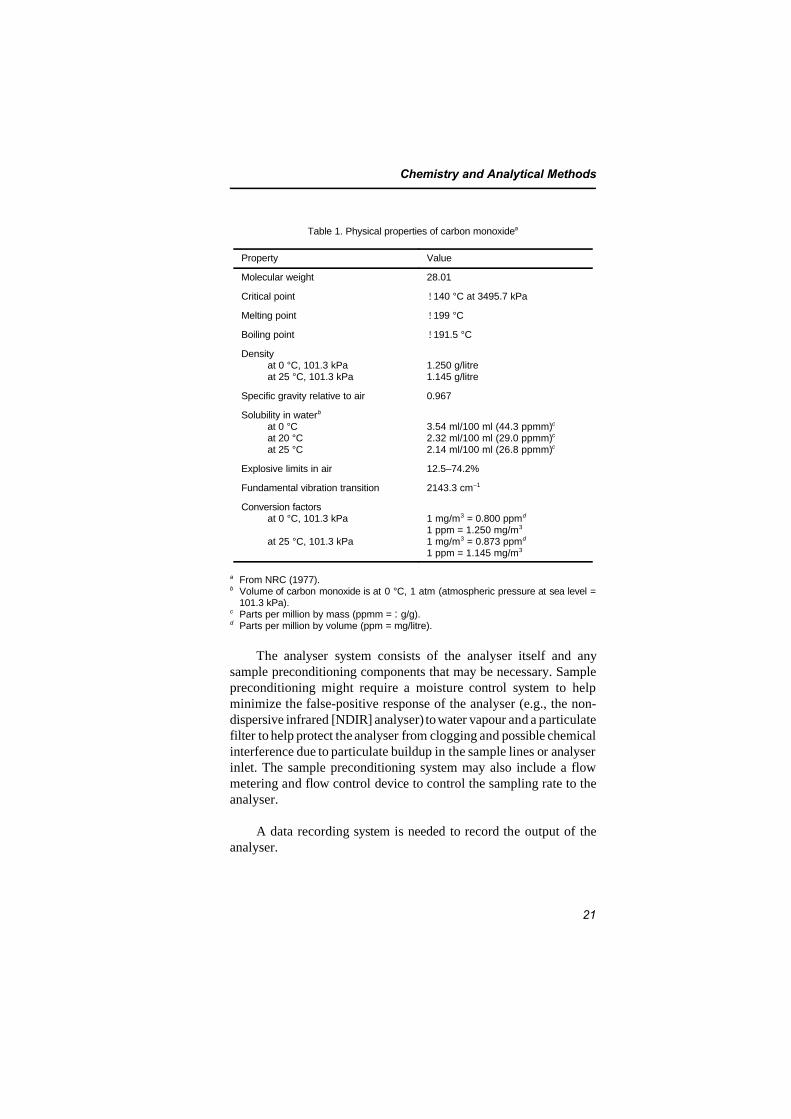
Chemistry and Analytical Methods
21
Table 1. Physical properties of carbon monoxidea
Property Value
Molecular weight 28.01
Critical point !140 °C at 3495.7 kPa
Melting point !199 °C
Boiling point !191.5 °C
Densityat 0 °C, 101.3 kPaat 25 °C, 101.3 kPa
1.250 g/litre1.145 g/litre
Specific gravity relative to air 0.967
Solubility in waterb
at 0 °Cat 20 °Cat 25 °C
3.54 ml/100 ml (44.3 ppmm)c
2.32 ml/100 ml (29.0 ppmm)c
2.14 ml/100 ml (26.8 ppmm)c
Explosive limits in air 12.5–74.2%
Fundamental vibration transition 2143.3 cm–1
Conversion factorsat 0 °C, 101.3 kPa
at 25 °C, 101.3 kPa
1 mg/m3 = 0.800 ppmd
1 ppm = 1.250 mg/m3
1 mg/m3 = 0.873 ppmd
1 ppm = 1.145 mg/m3
a From NRC (1977).b Volume of carbon monoxide is at 0 °C, 1 atm (atmospheric pressure at sea level =
101.3 kPa).c Parts per million by mass (ppmm = :g/g).d Parts per million by volume (ppm = mg/litre).
The analyser system consists of the analyser itself and anysample preconditioning components that may be necessary. Samplepreconditioning might require a moisture control system to helpminimize the false-positive response of the analyser (e.g., the non-dispersive infrared [NDIR] analyser) to water vapour and a particulatefilter to help protect the analyser from clogging and possible chemicalinterference due to particulate buildup in the sample lines or analyserinlet. The sample preconditioning system may also include a flowmetering and flow control device to control the sampling rate to theanalyser.
A data recording system is needed to record the output of theanalyser.
EHC 213: Carbon Monoxide
22
2.2.2 Methods
A reference method or equivalent method for air qualitymeasurements is required for acceptance of measurement data. Anequivalent method for monitoring carbon monoxide can be sodesignated when the method is shown to produce results equivalentto those from the approved reference monitoring method based onabsorption of infrared radiation from a non-dispersed beam.
The designated reference methods are automated, continuousmethods utilizing the NDIR technique, which is generally accepted asbeing the most reliable method for the measurement of carbon monox-ide in ambient air. As of January 1988, no equivalent methods thatuse a principle other than NDIR have been designated for measuringcarbon monoxide in ambient air.
There have been several excellent reviews on the measurementof carbon monoxide in the atmosphere (National Air PollutionControl Administration, 1970; Driscoll & Berger, 1971; Leithe, 1971;American Industrial Hygiene Association, 1972; NIOSH, 1972;Verdin, 1973; Stevens & Herget, 1974; Harrison, 1975;Schnakenberg, 1976; NRC, 1977; Repp, 1977; Lodge, 1989; OSHA,1991a; ASTM, 1995; ISO, 1996).
2.2.2.1 Non-dispersive infrared photometry method
Currently, the most commonly used measurement technique isthe type of NDIR method referred to as gas filter correlation (Actonet al., 1973; Burch & Gryvnak, 1974; Ward & Zwick, 1975; Burch etal., 1976; Goldstein et al., 1976; Gryvnak & Burch, 1976a,b; Hergetet al., 1976; Bartle & Hall, 1977; Chaney & McClenny, 1977).
Carbon monoxide has a characteristic infrared absorption near4.6 :m. The absorption of infrared radiation by the carbon monoxidemolecule can therefore be used to measure the concentration of carbonmonoxide in the presence of other gases. The NDIR method is basedon this principle (Feldstein, 1967).
Most commercially available NDIR analysers incorporate a gasfilter to minimize interferences from other gases. They operate atatmospheric pressure, and the most sensitive analysers are able todetect minimum carbon monoxide concentrations of about 0.05 mg/m3
Chemistry and Analytical Methods
23
(0.044 ppm). Interferences from carbon dioxide and water vapour canbe dealt with so as not to affect the data quality. NDIR analysers withdetectors as designed by Luft (1962) are relatively insensitive to flowrate, require no wet chemicals, are sensitive over wide concentrationranges and have short response times. NDIR analysers of the newergas filter correlation type have overcome zero and span problems andminor problems due to vibrations.
2.2.2.2 Gas chromatography method
A more sensitive method for measuring low background levelsof carbon monoxide is gas chromatography (Porter & Volman, 1962;Feldstein, 1967; Swinnerton et al., 1968; Bruner et al., 1973; Dagnallet al., 1973; Tesarik & Krejci, 1974; Bergman et al., 1975; Smith etal., 1975; ISO, 1989). This technique is an automated, semi-continuous method in which carbon monoxide is separated fromwater, carbon dioxide and hydrocarbons other than methane by astripper column. Carbon monoxide and methane are then separatedon an analytical column, and the carbon monoxide is passed througha catalytic reduction tube, where it is converted to methane. Thecarbon monoxide (converted to methane) passes through a flameionization detector, and the resulting signal is proportional to theconcentration of carbon monoxide in the air. This method has beenused throughout the world. It has no known interferences and can beused to measure levels from 0.03 to 50 mg/m3 (0.026 to 43.7 ppm).These analysers are expensive and require continuous attendance bya highly trained operator to produce valid results. For high levels, auseful technique is catalytic oxidation of the carbon monoxide byHopcalite or other catalysts (Stetter & Blurton, 1976), either withtemperature-rise sensors (Naumann, 1975; Schnakenberg, 1976;Benzie et al., 1977) or with electrochemical sensors (Bay et al., 1972,1974; Bergman et al., 1975; Dempsey et al., 1975; Schnakenberg,1975; Repp, 1977). Numerous other analytical schemes have beenused to measure carbon monoxide in air.
2.2.2.3 Other analysers
Other systems to measure carbon monoxide in ambient airinclude gas chromatography/flame ionization, in which carbon mon-oxide is separated from other trace gases by gas chromatography andcatalytically converted to methane prior to detection; controlled-potential electrochemical analysis, in which carbon monoxide is
EHC 213: Carbon Monoxide
24
measured by means of the current produced in aqueous solution by itselectro-oxidation by an electro-catalytically active noble metal (theconcentration of carbon monoxide reaching the electrode is controlledby its rate of diffusion through a membrane, which depends on itsconcentration in the sampled atmosphere; Bay et al., 1972, 1974);galvanic cells that can be used to measure atmospheric carbonmonoxide continuously, in the manner described by Hersch (1964,1966); coulometric analysis, which employs a modified Hersch-typecell; mercury replacement, in which mercury vapour formed by thereduction of mercuric oxide by carbon monoxide is detectedphotometrically by its absorption of UV light at 253.7 nm; dual-isotope fluorescence, which utilizes the slight difference in theinfrared spectra of isotopes of carbon monoxide; catalyticcombustion/thermal detection, which is based on measuring thetemperature rise resulting from catalytic oxidation of the carbonmonoxide in the sample air; second-derivative spectrometry, whichutilizes a second-derivative spectrometer to process the transmissionversus wavelength function of an ordinary spectrometer to produce anoutput signal proportional to the second derivative of this function;and Fourier-transform spectroscopy, which is an extremely powerfulinfrared spectroscopic technique.
Intermittent samples may be collected in the field and lateranalysed in the laboratory by the continuous analysing techniquesdescribed above. Sample containers may be rigid (glass cylinders orstainless steel tanks) or non-rigid (plastic bags). Because of locationand cost, intermittent sampling may at times be the only practicalmethod for air monitoring. Samples can be taken over a few minutesor accumulated intermittently to obtain, after analysis, either “spot”or “integrated” results.
Additional techniques for analysing intermittent samples includecolorimetric analysis, in which carbon monoxide reacts in an alkalinesolution with the silver salt of p-sulfamoyl-benzoate to form acoloured silver sol; a National Institute of Standards and Technologycolorimetric indicating gel (incorporating palladium and molybdenumsalts), which involves colorimetric comparison with freshly preparedindicating gels exposed to known concentrations of carbon monoxide;a length-of-stain indicator method, which uses an indicator tubecontaining potassium palladosulfite; and frontal analysis, in which airis passed over an adsorbent until equilibrium is established between
Chemistry and Analytical Methods
25
the concentration of carbon monoxide in the air and the concentrationof carbon monoxide on the adsorbent.
A simple and inexpensive measurement technique uses detectortubes (indicator tubes) (Leichnitz, 1993). This method is widelyapplied in industrial hygiene and is suitable for analysis of highlypolluted atmospheric air. The measurement with Dräger tubes(Drägerwerk, 1994) is based on the reaction: 5CO + I2O5 ÷ I2 +5CO2. The iodine-coloured layer in the tube corresponds in length tothe carbon monoxide concentration in the sample.
2.2.3 Measurement using personal monitors
Until the 1960s, most of the data available on ambient carbonmonoxide concentrations came from fixed monitoring stations oper-ated routinely in urban areas. The accepted measurement techniquewas NDIR spectrometry, but the instruments were large and cumber-some, often requiring vibration-free, air-conditioned enclosures.Without a portable, convenient monitor for carbon monoxide, it wasextremely difficult to measure carbon monoxide concentrations accu-rately in the microenvironments that people usually visited.
Ultimately, small personal exposure monitors (PEMs) weredeveloped that could measure carbon monoxide concentrations con-tinuously over time and store the readings automatically on internaldigital memories (Ott et al., 1986). These small PEMs made possiblethe large-scale field studies on human exposure to carbon monoxidein Denver, Colorado, and Washington, DC, USA, in the winter of1982–83 (Akland et al., 1985).
2.2.4 Carbon monoxide detectors/alarms
Carbon monoxide detectors have been designed like residentialsmoke detectors — to be low cost, yet provide protection from acatastrophic event by sounding an audible alarm. The carbon mon-oxide detector industry is young, however, and is in a stage of rapidgrowth. In the USA, an estimated 7–8 million detectors have beenpurchased since the early 1990s, but the numbers used in homes willcontinue to rise as local municipalities change building codes torequire the installation of carbon monoxide detectors in new residen-tial structures containing combustion-source appliances, stoves orfireplaces.
EHC 213: Carbon Monoxide
26
Currently available carbon monoxide detectors are based on aninteractive-type sensor (e.g., tin oxide, Figaro-type gel cell, fuel cell,artificial haemoglobin) that relies on direct interaction betweencarbon monoxide and the sensitive element in order to generate aresponse. They are battery-powered, alternating current-powered orboth. The most popular alternating current-powered detectors have aheated metallic sensor that reacts with carbon monoxide; the battery-powered detectors have a chemically treated gel disk that darkens withexposure to carbon monoxide or a fuel cell. Small, inexpensive carbonmonoxide detection cards or tablets that require frequent visualinspection of colour changes do not sound an alarm and are notrecommended as a primary detector.
Carbon monoxide detectors are sensitive to location and environ-mental conditions, including temperature, relative humidity and thepresence of other interfering gases. They may also become less stablewith time. For example, they should not be installed in dead-space air(i.e., near ceilings), near windows or near doors where there is a lotof air movement, and they should not be exposed to temperature orhumidity extremes. Excessive heat or cold will affect performance,and humidity extremes will affect the activation time. Utilization ofnon-interactive infrared technology (e.g., NDIR) in indoor carbonmonoxide detection would overcome all of the shortcomings of thecurrently available carbon monoxide detectors.
In the USA, a new voluntary standard for carbon monoxidedetectors was published in 1992 by the Underwriters Laboratories (ULStandard 2034) and revised in 1995. This standard provides alarmrequirements for detectors that are based on both the carbon monoxideconcentration and the exposure time. It is designed so that an alarmis activated within 90 min of exposure to 110 mg/m3 (100 ppm),within 35 min of exposure to 230 mg/m3 (200 ppm) or within 15 minof exposure to 460 mg/m3 (400 ppm) (i.e., when exposures areequivalent to 10% carboxyhaemoglobin [COHb]; see section 2.3).Approximately 15 manufacturers produce detectors listed under ULStandard 2034.
Because UL Standard 2034 covers a wide range of exposureconditions, there has been some ambiguity about its interpretation.For example, it is not clear if a detector meets the standard if thealarm is activated anytime between 5 and 90 min in the presence of110 mg carbon monoxide/mg3 (100 ppm). In fact, alarm sensitivities
Chemistry and Analytical Methods
27
are still a problem for the industry, and further discussion anddirection are needed. Moreover, the 10% carboxyhaemoglobin levelis protective of healthy individuals only (see chapter 8). It would benecessary to avoid exposures to 10 mg carbon monoxide/m3 (9 ppm)for 8 h or 29 mg/m3 (25 ppm) for 1 h in order to protect sensitiveindividuals with coronary heart disease at the 3%carboxyhaemoglobin level. Thus, current detectors provide warningagainst carbon monoxide levels that are protective of the healthypopulation only. Despite these limitations, carbon monoxide detectorsare reliable and effective, continue to improve and should berecommended for use in homes in addition to smoke detectors and firealarms.
2.3 Biological monitoring
A unique feature of carbon monoxide exposure is that there is abiological marker of the dose that the individual has received: thelevel of carbon monoxide in the blood. This level may be calculatedby measuring carboxyhaemoglobin in blood or carbon monoxide inexhaled breath.
2.3.1 Blood carboxyhaemoglobin measurement
The level of dissolved carbon monoxide in blood is normallybelow the level of detection but may be of importance in thetransportation of carbon monoxide between cells and tissues (seechapter 6). Thus, the blood level of carbon monoxide isconventionally represented as a percentage of the total haemoglobinavailable (i.e., the percentage of haemoglobin that is in the form ofcarboxyhaemoglobin, or simply percent carboxyhaemoglobin).
Any technique for the measurement of carboxyhaemoglobin inblood must be specific and must have sufficient sensitivity andaccuracy for the purpose of the values obtained. The majority oftechnical methods that have been published on measurement ofcarbon monoxide in blood have been for forensic purposes. Thesemethods are less accurate than generally required for themeasurement of low levels of carboxyhaemoglobin (<5%). Bloodlevels of carbon monoxide resulting from exposure to existing ambientlevels of carbon monoxide would not be expected to exceed 5%carboxyhaemoglobin in non-smoking subjects. The focus of theforensic methods has been the reliability of measurements over the
EHC 213: Carbon Monoxide
28
entire range of possible values: from less than 1% to 100%carboxyhaemoglobin. These forensically oriented methods areadequate for the intended use of the values and the non-ideal storageconditions of the samples being analysed.
In the areas of exposure assessment and low-level health effectsof carbon monoxide, it is more important to know the accuracy of anymethod in the low-level range of <5% carboxyhaemoglobin. There islittle agreement upon acceptable reference methods in this range, norare there accurate reference standards available in this range. The useof techniques that have unsubstantiated accuracy in the low range ofcarboxyhaemoglobin levels can lead to considerable differences inestimations of exposure conditions. Measurement of low levels ofcarboxyhaemoglobin demands careful evaluation because of the impli-cations, based upon these data, for the setting of air quality standards.Therefore, this section will focus on the methods that have beenevaluated at levels below 10% carboxyhaemoglobin and the methodsthat have been extensively used in assessing exposure to carbonmonoxide.
The measurement of carbon monoxide in blood can be accom-plished by a variety of techniques, both destructive and non-destructive. Carboxyhaemoglobin can be determined non-destructivelyby observing the change in the absorption spectrum in either the Soretor visible region brought about by the combination of carbon monox-ide with haemoglobin. With present optical sensing techniques,however, all optical methods are limited in sensitivity to approxi-mately 1% of the range of expected values. If attempts are made toexpand the lower range of absorbances, sensitivity is lost on the upperend where, in the case of carboxyhaemoglobin, total haemoglobin ismeasured. For example, in the spectrophotometric method describedby Small et al. (1971), a change in absorbance equal to the limit ofresolution of 0.01 units can result in a difference in 0.6% carboxy-haemoglobin. Therefore, optical techniques cannot be expected toobtain the resolution that is possible with other means of detection ofcarbon monoxide (Table 2).
The more sensitive (higher-resolution) techniques require therelease of the carbon monoxide from the haemoglobin into a gasphase; the carbon monoxide can then be detected directly by (1) infra-red absorption (Maas et al., 1970) following separation using
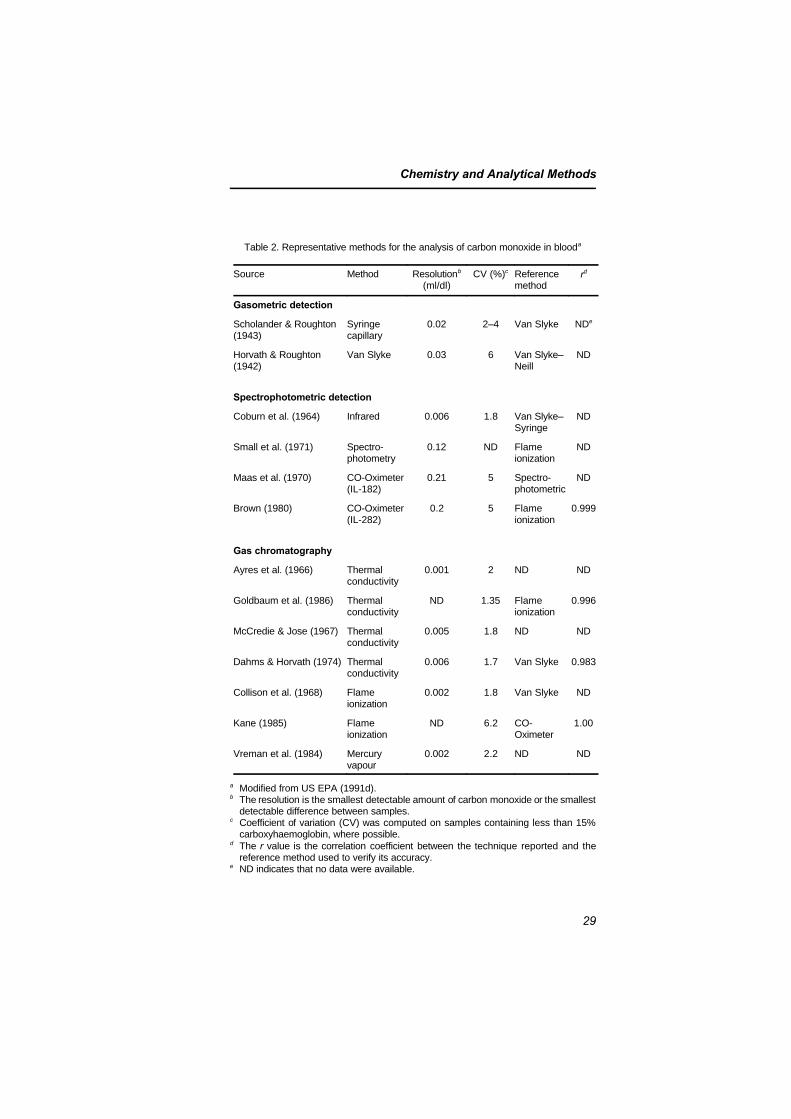
Chemistry and Analytical Methods
29
Table 2. Representative methods for the analysis of carbon monoxide in blooda
Source Method Resolutionb
(ml/dl)CV (%)c Reference
methodrd
Gasometric detection
Scholander & Roughton(1943)
Syringecapillary
0.02 2–4 Van Slyke NDe
Horvath & Roughton(1942)
Van Slyke 0.03 6 Van Slyke–Neill
ND
Spectrophotometric detection
Coburn et al. (1964) Infrared 0.006 1.8 Van Slyke–Syringe
ND
Small et al. (1971) Spectro-photometry
0.12 ND Flameionization
ND
Maas et al. (1970) CO-Oximeter(IL-182)
0.21 5 Spectro-photometric
ND
Brown (1980) CO-Oximeter(IL-282)
0.2 5 Flameionization
0.999
Gas chromatography
Ayres et al. (1966) Thermalconductivity
0.001 2 ND ND
Goldbaum et al. (1986) Thermalconductivity
ND 1.35 Flameionization
0.996
McCredie & Jose (1967) Thermalconductivity
0.005 1.8 ND ND
Dahms & Horvath (1974) Thermalconductivity
0.006 1.7 Van Slyke 0.983
Collison et al. (1968) Flameionization
0.002 1.8 Van Slyke ND
Kane (1985) Flameionization
ND 6.2 CO-Oximeter
1.00
Vreman et al. (1984) Mercuryvapour
0.002 2.2 ND ND
a Modified from US EPA (1991d).b The resolution is the smallest detectable amount of carbon monoxide or the smallest
detectable difference between samples. c Coefficient of variation (CV) was computed on samples containing less than 15%
carboxyhaemoglobin, where possible.d The r value is the correlation coefficient between the technique reported and the
reference method used to verify its accuracy. e ND indicates that no data were available.
EHC 213: Carbon Monoxide
30
gas chromatography, (2) the difference in thermal conductivitybetween carbon monoxide and the carrier gas (Ayres et al., 1966;McCredie & Jose, 1967; Dahms & Horvath, 1974; Goldbaum et al.,1986; Horvath et al., 1988b; Allred et al., 1989b), (3) the amount ofionization following quantitative conversion of carbon monoxide tomethane and ionization of the methane (Collison et al., 1968; Dennis& Valeri, 1980; Guillot et al., 1981; Clerbaux et al., 1984; Kane,1985; Katsumata et al., 1985; Costantino et al., 1986) or (4) therelease of mercury vapour resulting from the combination of carbonmonoxide with mercuric oxide (Vreman et al., 1984).
2.3.1.1 Sample handling
Carbon monoxide bound to haemoglobin is a relatively stablecompound that can be dissociated by exposure to oxygen or UVradiation (Horvath & Roughton, 1942; Chace et al., 1986). If theblood sample is maintained in the dark under cool, sterile conditions,the carbon monoxide content will remain stable for a long period oftime. Various investigators have reported no decrease in percentcarboxyhaemoglobin over 10 days (Collison et al., 1968), 3 weeks(Dahms & Horvath, 1974), 4 months (Ocak et al., 1985) and6 months (Vreman et al., 1984). The blood collection system used caninfluence the carbon monoxide level, because some ethylenediamine-tetraacetic acid vacutainer tube stoppers contain carbon monoxide(Vreman et al., 1984). The stability of the carbon monoxide contentin properly stored samples does not indicate that constant values willbe obtained by all techniques of analysis. The spectrophotometricmethods are particularly susceptible to changes in optical qualities ofthe sample, resulting in small changes in carboxyhaemoglobin withstorage (Allred et al., 1989b).
Therefore, the care needed to make a carboxyhaemoglobin deter-mination depends upon the technique that is being utilized. It appearsas though measurement of low levels of carboxyhaemoglobin withoptical techniques should be conducted as soon as possible followingcollection of the samples.
2.3.1.2 Potential reference methods
Exposure to carbon monoxide at equilibrium conditions resultsin carboxyhaemoglobin levels of between 0.1 and 0.2% for eachmilligram of carbon monoxide per cubic metre air (part per million).
Chemistry and Analytical Methods
31
A reference technique for the measurement of carboxyhaemoglobinshould be able to discriminate between two blood samples with adifference of 0.1% carboxyhaemoglobin (approximately 0.02 ml/dl).To accomplish this task, the coefficient of variation (standard devia-tion of repeated measures on any given sample divided by the meanof the values times 100) of the method should be less than 5%, so thatthe two values that are different by 0.1 percentage points can be statis-tically proven to be distinct. In practical terms, a reference methodshould have the sensitivity to detect approximately 0.025% carboxy-haemoglobin to provide this level of confidence in the valuesobtained.
The accurate measurement of carboxyhaemoglobin requires thequantitation of the content of carbon monoxide released from haemo-globin in the blood. Optically based techniques have limitations ofresolution and specificity due to the potential interference from manysources. The techniques that can be used as reference methods involvethe quantitative release of carbon monoxide from the haemoglobinfollowed by the measurement of the amount of carbon monoxidereleased. Classically, this quantitation was measured manometricallywith a Van Slyke apparatus (Horvath & Roughton, 1942) or aRoughton-Scholander syringe (Roughton & Root, 1945). These tech-niques have served as the “Gold Standard” in this field for almost50 years. However, there are limitations of resolution with thesetechniques at the lower ranges of carboxyhaemoglobin. The gasomet-ric standard methodology has been replaced with headspace extractionfollowed by the use of solid-phase gas chromatographic separationwith several different types of detection: thermal conductivity, flameionization and mercury vapour reduction. The carbon monoxide in theheadspace can also be quantitated by infrared detection, which can becalibrated with gas standards. However, there is no general agreementthat any of the more sensitive methods of carbon monoxide analysisare acceptable reference methods.
The following techniques all conform to all the requirements ofa reference method:
(1) Flame ionization detection: This technique requires theseparation of carbon monoxide from the other headspacegases and the reduction of the carbon monoxide to methaneby catalytic reduction.
EHC 213: Carbon Monoxide
32
(2) Thermal conductivity detection: This technique usesvacuum extraction of carbon monoxide from blood in a VanSlyke apparatus and gas chromatographic separation withthermal conductivity analysis of the carbon monoxide.
(3) Infrared detection: This technique uses a method forextracting carbon monoxide from blood under normalatmospheric conditions and then injecting the headspacegas into an infrared analyser.
The conventional means of representing the quantity of carbonmonoxide in a blood sample is the percent carboxyhaemoglobin: thepercentage of the total carbon monoxide combining capacity that is inthe form of carboxyhaemoglobin. This is conventionally determinedby the use of the following formula:
% COHb = [CO content/(Hb × 1.389)] × 100 (2-1)
where CO content is the carbon monoxide concentration, measuredin millilitres per decilitre blood at standard temperature and pressure,dry; Hb is the haemoglobin concentration, measured in grams perdecilitre blood; and 1.389 is the stoichiometric combining capacity ofcarbon monoxide for haemoglobin in units of millilitres of carbonmonoxide per gram of haemoglobin at standard temperature and pres-sure, dry; however, in practice, a value of 1.36 ml carbon monoxide/ghaemoglobin is used for the oxygen capacity of normal human bloodbecause it is impossible to achieve 100% haemoglobin saturation.
The analytical methods that quantify the carbon monoxidecontent in blood require the conversion of these quantities to percentcarboxyhaemoglobin. The product of the haemoglobin and thetheoretical combining capacity (1.389, according to InternationalCommittee for Standardization in Haematology, 1978) yields thecarbon monoxide capacity. With the use of capacity and the measuredcontent, the percentage of carbon monoxide capacity (percentcarboxyhaemoglobin) is calculated. To be absolutely certain of theaccuracy of the haemoglobin measurement, the theoretical valueshould be routinely substantiated by direct measurement (internalvalidation) of the haemoglobin–carbon monoxide combining capacity.The total carbon monoxide–haemoglobin combining capacity shouldbe determined as accurately as the content of carbon monoxide. Theerror of the techniques that measure carbon monoxide content is
Chemistry and Analytical Methods
33
dependent on the error in haemoglobin analysis for the final form ofthe data, percent carboxyhaemoglobin. Therefore, the actual carbonmonoxide–haemoglobin combining capacity should be measured andcompared with the calculated value based upon the reference methodfor haemoglobin measurement. The measurement of carbon monox-ide–haemoglobin combining capacity can be routinely performed byequilibration of a blood sample with carbon monoxide (Allred et al.,1989b).
The standard methods for haemoglobin determination involve theconversion of all species of haemoglobin to cyanomethaemoglobinwith the use of a mixture of potassium ferricyanide, potassium cyanideand sodium bicarbonate.
2.3.1.3 Other methods of measurement
There is a wide variety of other techniques that have beendescribed for the analysis of carbon monoxide in blood. These meth-ods include UV-visible spectrophotometry (Small et al., 1971; Brown,1980; Zwart et al., 1984, 1986), magnetic circular dichroism spectros-copy (Wigfield et al., 1981), photochemistry (Sawicki & Gibson,1979), gasometric methods (Horvath & Roughton, 1942; Roughton &Root, 1945) and a calorimetric method (Sjostrand, 1948a). Not all ofthese methods have been as well characterized for the measurementof low levels of carboxyhaemoglobin as those listed above as potentialreference methods.
1) Spectrophotometric methods
The majority of the techniques are based upon optical detectionof carboxyhaemoglobin, which is more rapid than the referencetechniques because it does not involve extraction of the carbon mon-oxide from the blood sample. These direct measurements also enablethe simultaneous measurement of several species of haemoglobin,including reduced haemoglobin, oxyhaemoglobin (O2Hb) and car-boxyhaemoglobin. The limitations of the spectrophotometric tech-niques have been reviewed by Kane (1985). The optical methodsutilizing UV wavelengths require dilution of the blood sample, whichcan lead to the loss of carbon monoxide as a result of competition withthe dissolved oxygen in solution. Removing the dissolved oxygen withdithionite can lead to the formation of sulfhaemoglobin, which inter-feres with the measurement of carboxyhaemoglobin (Rai & Minty,
EHC 213: Carbon Monoxide
34
1987). Another limitation is that the absorption maxima (and spectralcurves) are not precisely consistent between individuals. This may bedue to slight variations in types of haemoglobin in subjects. For thesereasons, the techniques using fixed-wavelength measurement pointswould not be expected to be as precise, accurate or specific as theproposed reference methods mentioned above.
2) CO-Oximeter measurements of carboxyhaemoglobin
The speed of measurement and relative accuracy of spectrophoto-metric measurements over the entire range of expected values led tothe development of CO-Oximeters. These instruments utilize fromtwo to seven wavelengths in the visible region for the determinationof proportions of oxyhaemoglobin, carboxyhaemoglobin, reduced hae-moglobin and methaemoglobin. The proportion of each species ofhaemoglobin is determined from the absorbance and molar extinctioncoefficients at present wavelengths. All of the commercially availableinstruments provide rapid results for all the species of haemoglobinbeing measured. In general, the manufacturers’ listed limit ofaccuracy for all of the instruments is 1% carboxyhaemoglobin.However, this level of accuracy is not suitable for measurementsassociated with background carbon monoxide levels (<2%carboxyhaemoglobin) because it corresponds to errors exceeding 50%.The precision of measurement for these instruments is excellent andhas misled users regarding the accuracy of the instruments. Therelatively modest level of accuracy is adequate for the design purposesof the instruments; however, at low levels of carboxyhaemoglobin, theability of the instruments to measure the percent carboxyhaemoglobinaccurately is limited.
2.3.2 Carbon monoxide in expired breath
Carbon monoxide levels in expired breath can be used to estimatethe levels of carbon monoxide in the subject’s blood. The basicdeterminants of carbon monoxide levels in alveolar air have beendescribed by Douglas et al. (1912), indicating that there arepredictable equilibrium conditions that exist between carbonmonoxide bound to haemoglobin and the partial pressure of thecarbon monoxide in the blood. The equilibrium relationship forcarbon monoxide between blood and the gas phase to which the bloodis exposed can be described as follows:
Chemistry and Analytical Methods
35
PCO/PO2 = M (% COHb/% O2Hb) (2-2)
where PCO is the partial pressure of carbon monoxide in the blood, PO2
is the partial pressure of oxygen in the blood, M is the Haldanecoefficient (reflecting the relative affinity of haemoglobin for oxygenand carbon monoxide), % COHb is the percentage of total haemo-globin combining capacity bound with carbon monoxide, and % O2Hbis the percentage of total haemoglobin combining capacity bound withoxygen.
The partial pressure of carbon monoxide in the arterial blood willreach a steady-state value relative to the partial pressure of carbonmonoxide in the alveolar gas. Therefore, by measuring theend-expired breath from a subject’s lungs, one can measure theend-expired carbon monoxide partial pressure and, with the use of theHaldane relationship, estimate the blood level of carboxyhaemoglobin.This measurement will always be an estimate, because the Haldanerelationship is based upon attainment of an equilibrium, which doesnot occur under physiological conditions.
The measurement of carbon monoxide levels in expired breathto estimate blood levels is based upon application of the Haldanerelationship to gas transfer in the lung (Eq. 2-2). For example, whenthe oxygen partial pressure is increased in the alveolar gas, it ispossible to predict the extent to which the partial pressure of carbonmonoxide will increase in the alveolar gas. This approach is limited,however, because of the uncertainty associated with variables that areknown to influence gas transfer in the lung and that mediate the directrelationship between liquid-phase gas partial pressures and air-phasepartial pressures.
The basic mechanisms that are known to influence carbonmonoxide transfer in the lung have been identified through theestablishment of techniques to measure pulmonary diffusion capacityfor carbon monoxide. Some of the factors that can result in decreaseddiffusion capacity for carbon monoxide (altering the relationshipbetween expired carbon monoxide pressures and carboxyhaemoglobinlevels) are increased membrane resistance, intravascular resistance,age, alveolar volume, pulmonary vascular blood volume, pulmonaryblood flow and ventilation/perfusion inequality (Forster, 1964). Theextent to which each of these variables actually contributes to the
EHC 213: Carbon Monoxide
36
variability in the relationship has not been experimentallydemonstrated. There are few experiments that focus on the factorsleading to variability in the relationship between alveolar carbonmonoxide and percent carboxyhaemoglobin at the levels ofcarboxyhaemoglobin currently deemed to be of regulatory importance.This may be due in part to the difficulties in working with analyticaltechniques, particularly blood techniques, that are very close to theirlimits of reproducibility.
The expired breath method for obtaining estimates of blood levelsof carbon monoxide has a distinct advantage for monitoring largenumbers of subjects, because of the non-invasive nature of themethod. Other advantages include the ability to obtain an instan-taneous reading and the ability to take an immediate replicate samplefor internal standardization. The breath-holding technique forenhancing the normal carbon monoxide concentration in exhaledbreath has been widely used; however, it should be noted that theabsolute relationship between breath-hold carbon monoxide pressuresand blood carbon monoxide pressures has not been thoroughlyestablished for carboxyhaemoglobin levels below 5%. The breath-holding method allows time (20 s) for diffusion of carbon monoxideinto the alveolar air so that carbon monoxide levels are higher thanlevels following normal tidal breathing.
Partial pressures of carbon monoxide in expired breath are highlycorrelated with percent carboxyhaemoglobin levels over a wide rangeof carboxyhaemoglobin levels. The accuracy of the breath-holdmethod is unknown owing to the lack of paired sample analyses ofcarbon monoxide partial pressures in exhaled breath and concurrentcarboxyhaemoglobin levels in blood utilizing a sensitive referencemethod. No one has attempted to determine the error of estimateinvolved in applying group average regression relationships to theaccurate determination of carboxyhaemoglobin. Therefore, the extrap-olation of breath-hold carbon monoxide partial pressures to actualcarboxyhaemoglobin levels must be made with reservation until theaccuracy of this method is better understood.
2.3.2.1 Measurement methods
Ventilation in healthy individuals involves air movement throughareas in the pulmonary system that are primarily involved in eitherconduction of gas or gas exchange in the alveoli. In a normal breath(tidal volume), the proportion of the volume in the non-gas exchang-
Chemistry and Analytical Methods
37
ing area is termed the dead space. In the measurement of carbonmonoxide in the exhaled air, the dead-space gas volume serves todilute the alveolar carbon monoxide concentration. Several methodshave been developed to account for the dead-space dilution. Theseinclude the mixed expired gas technique, which uses the Bohrequation to determine the physiological dead space; the breath-holdtechnique, a method of inspiration to total lung capacity followed bya breath-hold period of various durations (a breath-hold time of 20 swas found to provide near-maximal values for carbon monoxidepressures); and the rebreathing technique, in which 5 litres of oxygenare rebreathed for 2–3 min while the carbon dioxide is removed.
Kirkham et al. (1988) compared all three techniques for measur-ing expired carbon monoxide to predict percent carboxyhaemoglobin.The rebreathing and breath-hold methods both yield approximately20% higher levels of “alveolar” carbon monoxide than does the Bohrcomputation from mixed expired gas. Both the mixed expired andbreath-holding techniques show a significant decline in the alveolarcarbon monoxide tension when the subject is standing. Therefore,measurements of expired carbon monoxide must be made in the samebody position relative to control measurements or reference measure-ments.
2.3.2.2 Potential limitations
The measurement of exhaled breath has the advantages of ease,speed, precision and greater subject acceptance over measurement ofblood carboxyhaemoglobin. However, the accuracy of the breathmeasurement procedure and the validity of the Haldane relationshipbetween breath and blood at low environmental carbon monoxideconcentrations remain in question.
38
3. SOURCES OF CARBON MONOXIDE IN THEENVIRONMENT
3.1 Introduction
Carbon monoxide is produced by both natural and anthropogenicprocesses. About half of the carbon monoxide is released at theEarth’s surface, and the rest is produced in the atmosphere. Manypapers on the global sources of carbon monoxide have been publishedover the last 20 years; whether most of the carbon monoxide in theatmosphere is from human activities or from natural processes hasbeen debated for nearly as long.
The recent budgets that take into account previously publisheddata suggest that human activities are responsible for about 60% ofthe carbon monoxide in the non-urban troposphere, and naturalprocesses account for the remaining 40%. It also appears thatcombustion processes directly produce about 40% of the annualemissions of carbon monoxide (Jaffe, 1968, 1973; Robinson &Robbins, 1969, 1970; Swinnerton et al., 1971), and oxidation ofhydrocarbons makes up most of the remainder (about 50%) (Went,1960, 1966; Rasmussen & Went, 1965; Zimmerman et al., 1978;Hanst et al., 1980; Greenberg et al., 1985), along with other sourcessuch as the oceans (Swinnerton et al., 1969; Seiler & Junge, 1970;Lamontagne et al., 1971; Linnenbom et al., 1973; Liss & Slater, 1974;Seiler, 1974; Seiler & Schmidt, 1974; Swinnerton & Lamontagne,1974; NRC, 1977; Bauer et al., 1980; Logan et al., 1981; DeMoreet al., 1985) and vegetation (Krall & Tolbert, 1957; Wilks, 1959;Siegel et al., 1962; Seiler & Junge, 1970; Bidwell & Fraser, 1972;Seiler, 1974; NRC, 1977; Seiler & Giehl, 1977; Seiler et al., 1978;Bauer et al., 1980; Logan et al., 1981; DeMore et al., 1985). Some ofthe hydrocarbons that eventually end up as carbon monoxide are alsoproduced by combustion processes, constituting an indirect source ofcarbon monoxide from combustion. These conclusions are summar-ized in Table 3, which is adapted from the 1981 budget of Loganet al., in which most of the previous work was incorporated (Loganet al., 1981; WMO, 1986). The total emissions of carbon monoxideare about 2600 million tonnes per year. Other budgets by Volz et al.(1981) and by Seiler & Conrad (1987) have been reviewed byWarneck (1988). Global emissions between 2000 and 3000 milliontonnes per year are consistent with these budgets.
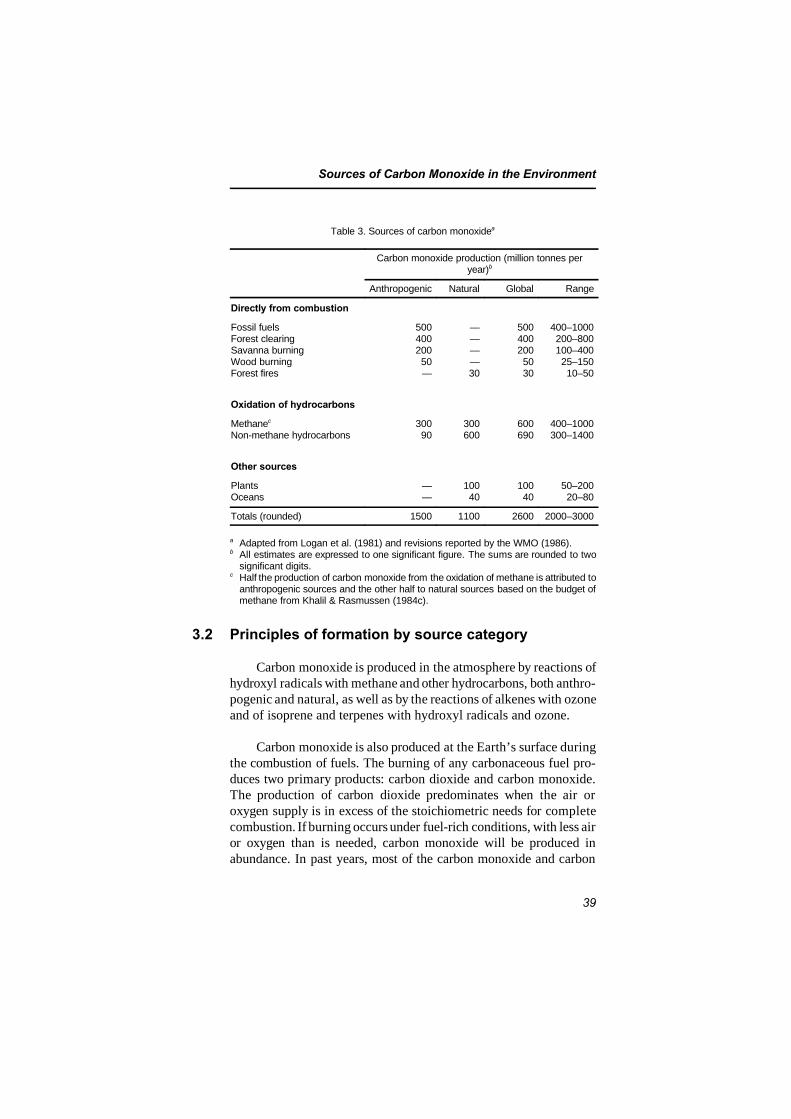
Sources of Carbon Monoxide in the Environment
39
Table 3. Sources of carbon monoxidea
Carbon monoxide production (million tonnes peryear)b
Anthropogenic Natural Global Range
Directly from combustion
Fossil fuelsForest clearingSavanna burningWood burningForest fires
50040020050—
————30
5004002005030
400–1000200–800100–40025–15010–50
Oxidation of hydrocarbons
Methanec
Non-methane hydrocarbons30090
300600
600690
400–1000300–1400
Other sources
PlantsOceans
——
10040
10040
50–20020–80
Totals (rounded) 1500 1100 2600 2000–3000
a Adapted from Logan et al. (1981) and revisions reported by the WMO (1986). b All estimates are expressed to one significant figure. The sums are rounded to two
significant digits.c Half the production of carbon monoxide from the oxidation of methane is attributed to
anthropogenic sources and the other half to natural sources based on the budget ofmethane from Khalil & Rasmussen (1984c).
3.2 Principles of formation by source category
Carbon monoxide is produced in the atmosphere by reactions ofhydroxyl radicals with methane and other hydrocarbons, both anthro-pogenic and natural, as well as by the reactions of alkenes with ozoneand of isoprene and terpenes with hydroxyl radicals and ozone.
Carbon monoxide is also produced at the Earth’s surface duringthe combustion of fuels. The burning of any carbonaceous fuel pro-duces two primary products: carbon dioxide and carbon monoxide.The production of carbon dioxide predominates when the air oroxygen supply is in excess of the stoichiometric needs for completecombustion. If burning occurs under fuel-rich conditions, with less airor oxygen than is needed, carbon monoxide will be produced inabundance. In past years, most of the carbon monoxide and carbon
EHC 213: Carbon Monoxide
40
dioxide formed were simply emitted into the atmosphere. In recentyears, concerted efforts have been made to reduce ambient air con-centrations of materials that are potentially harmful to humans. Muchcarbon monoxide, most notably from mobile sources, is converted tocarbon dioxide, which is then emitted into the atmosphere.
Emission source categories in the USA (US EPA, 1991b) aredivided into five individual categories: (1) transportation, (2) station-ary source fuel combustion, (3) industrial processes, (4) solid wastedisposal and (5) miscellaneous.
Transportation sources include emissions from all mobilesources, including highway and off-highway motor vehicles. Highwaymotor vehicles include passenger cars, trucks, buses and motorcycles.Off-highway vehicles include aircraft, locomotives, vessels andmiscellaneous engines such as farm equipment, industrial andconstruction machinery, lawnmowers and snowmobiles.
Emission estimates from gasoline- and diesel-powered motorvehicles are based upon vehicle-mile (vehicle-kilometre) tabulationsand emission factors. Eight vehicle categories are considered:(1) light-duty gasoline vehicles (mostly passenger cars), (2) light-dutydiesel passenger cars, (3) light-duty gasoline trucks (weighing lessthan 6000 lb [2.7 tonnes]), (4) light-duty gasoline trucks (weighing6000–8500 lb [2.7–3.9 tonnes]), (5) light-duty diesel trucks,(6) heavy-duty gasoline trucks and buses, (7) heavy-duty diesel trucksand buses and (8) motorcycles. The emission factors used are basedon the US Environmental Protection Agency’s (EPA) mobile sourceemission factor model, developed by the EPA Office of MobileSources, which uses the latest available data to estimate averagein-use emissions from highway vehicles.
Aircraft emissions are based on emission factors and aircraftactivity statistics reported by the Federal Aviation Administration(1988). Emissions are based on the number of landing–take-off cycles.Any emissions in cruise mode, which is defined to be above 3000 ft(1000 m), are ignored. Average emission factors for each year, whichtake into account the national mix of aircraft types for generalaviation, military and commercial aircraft, are used to compute theemissions.
Sources of Carbon Monoxide in the Environment
41
In the USA, the Department of Energy reports consumption ofdiesel fuel and residual fuel oil by locomotives (US Department ofEnergy, 1988a). Average emission factors applicable to diesel fuelconsumption were used to calculate emissions. Vessel use of dieselfuel, residual oil and coal is also reported by the Department ofEnergy (US Department of Energy, 1988a,b). Gasoline use is basedon national boat and motor registrations, coupled with a use factor(gallons [litres] per motor per year) (Hare & Springer, 1973) andmarine gasoline sales (US Department of Transportation, 1988).Emission factors from EPA Report No. AP-42 are used to computeemissions (US EPA, 1985).
Gasoline and diesel fuel are consumed by off-highway vehiclesin substantial quantities. The fuel consumption is divided into severalcategories (e.g., farm tractors, other farm machinery, constructionequipment, industrial machinery, snowmobiles and small generalutility engines such as lawnmowers and snowblowers). Fuel use isestimated for each category from estimated equipment population andan annual use factor of gallons (litres) per unit per year (Hare &Springer, 1973), together with reported off-highway diesel fueldeliveries (US Department of Energy, 1988a) and off-highwaygasoline sales (US Department of Transportation, 1988).
Stationary combustion equipment, such as coal-, gas- or oil-firedheating or power generating plants, generates carbon monoxide as aresult of improper or inefficient operating practices or inefficientcombustion techniques. The specific emission factors for stationaryfuel combustors vary according to the type and size of the installationand the fuel used, as well as the mode of operation. The US EPA’scompilation of air pollutant emission factors provides emission dataobtained from source tests, material balance studies, engineeringestimates and so forth for the various common emission categories.For example, coal-fired electricity generating plants report coal use tothe US Department of Energy (1988b,c). Distillate oil, residual oil,kerosene and natural gas consumed by stationary combustors are alsoreported by user category to the US Department of Energy (1988a).Average emission factors from EPA Report No. AP-42 (US EPA,1985) were used to calculate the emission estimates. The consumptionof wood in residential wood stoves has likewise been estimated by theUS Department of Energy (1982, 1984).
EHC 213: Carbon Monoxide
42
In addition to fuel combustion, certain other industrial processesgenerate and emit varying quantities of carbon monoxide into the air.The lack of published national data on production, type of equipmentand controls, as well as an absence of emission factors, makes itimpossible to include estimates of emissions from all industrial proc-ess sources.
Solid waste carbon monoxide emissions result from the com-bustion of wastes in municipal and other incinerators, as well as fromthe open burning of domestic and municipal refuse.
Miscellaneous carbon monoxide emissions result from theburning of forest and agricultural materials, smouldering coal refusematerials and structural fires.
The Forest Service of the US Department of Agriculture pub-lishes information on the number of forest fires and the acreageburned (US Forest Service, 1988). Estimates of the amount of materialburned per acre are made to determine the total amount of materialburned. Similar estimates are made to account for managed burningof forest areas. Average emission factors were applied to the quantitiesof materials burned to calculate emissions.
A study was conducted by the US EPA (Yamate, 1974) to obtain,from local agricultural and pollution control agencies, estimates of thenumber of acres and estimated quantity of material burned per acre inagricultural burning operations. These data have been updated andused to estimate agricultural burning emissions, based on averageemission factors.
Estimates of the number of burning coal refuse piles existing inthe USA are made in reports by the Bureau of Mines. McNay (1971)presents a detailed discussion of the nature, origin and extent of thissource of pollution. Rough estimates of the quantity of emissions wereobtained using this information by applying average emission factorsfor coal combustion. It was assumed that the number of burning refusepiles decreased to a negligible level by 1975.
The US Department of Commerce publishes, in its statisticalabstracts, information on the number and types of structures damagedby fire (US Department of Commerce, 1987). Emissions were
Sources of Carbon Monoxide in the Environment
43
estimated by applying average emission factors for wood combustionto these totals.
The estimated total annual carbon monoxide emissions from thevarious source categories in the USA for 1970, 1975 and 1980–1990(US EPA, 1991b) indicate that carbon monoxide emissions from allanthropogenic sources declined from 101.4 million tonnes (111.8 mil-lion short tons) in 1970 to 60.1 million tonnes (66.2 million shorttons) in 1990. The majority, about 63%, of the carbon monoxideemissions total comes from transportation sources, 12% comes fromstationary source fuel combustion, 8% comes from industrialprocesses, 3% comes from solid waste and 14% comes frommiscellaneous sources.
The single largest contributing source of carbon monoxideemissions is highway vehicles, which emitted an estimated 50% of thenational total in 1990. Because of the implementation of the FederalMotor Vehicle Control Program, carbon monoxide emissions fromhighway vehicles declined 54%, from 65.3 to 30.3 million tonnes, inthe period 1970–1990. Fig. 1 displays the trend in estimated carbonmonoxide emissions from the major highway vehicle categories from1970 to 1990. Although the total annual vehicle-miles (vehicle-kilometres) travelled continue to increase in the USA (by 37% just inthe period 1981–1990), total carbon monoxide emissions fromhighway vehicles have continued to decrease as a result of the FederalMotor Vehicle Control Program-mandated air pollution controldevices on new vehicles.
Carbon monoxide emissions from other sources have alsogenerally decreased. In 1970, emissions from burning of agriculturalcrop residues were greater than in more recent years. Solid wastedisposal emissions have also decreased as the result of implementationof regulations limiting or prohibiting burning of solid waste in manyareas. Emissions of carbon monoxide from stationary source fuelcombustion occur mainly from the residential sector. These emissionswere reduced somewhat through the mid-1970s as residential consum-ers converted to natural gas, oil or electric heating equipment. Recentgrowth in the use of residential wood stoves has reversed this trend,but increased carbon monoxide emissions from residential sourcescontinue to be small compared with highway vehicle emissions.Nevertheless, in 1990, residential wood combustion accounted for
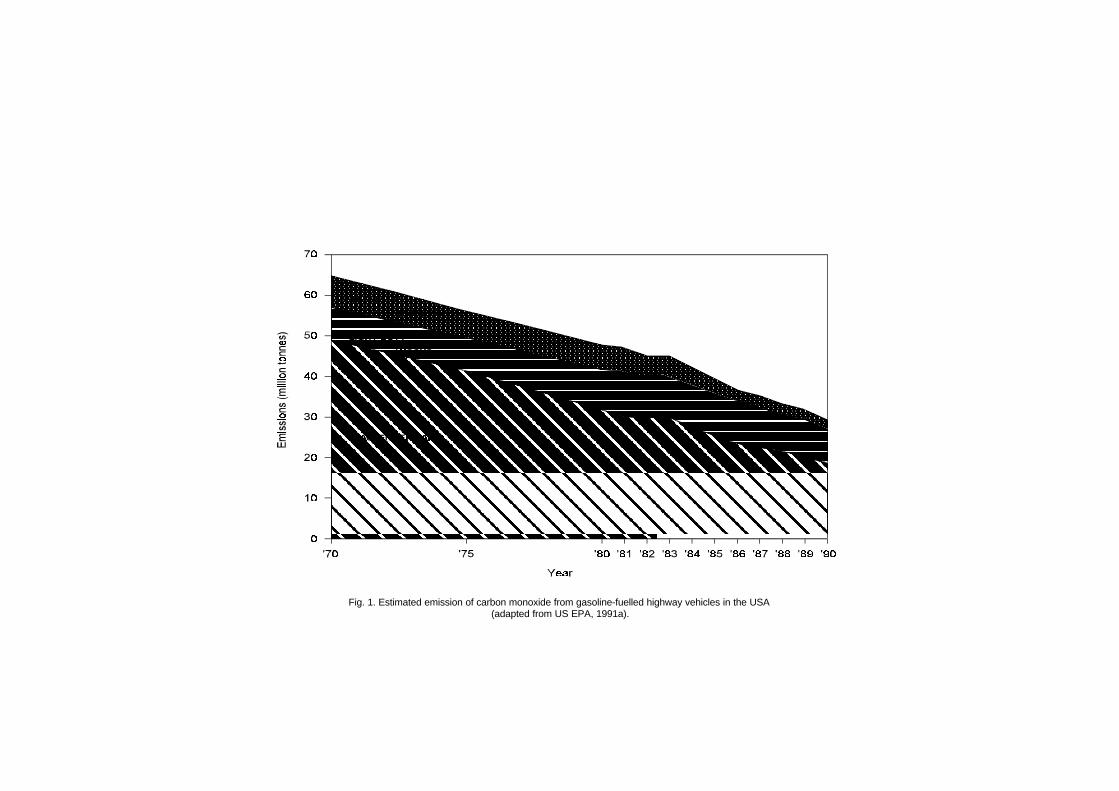
Fig. 1. Estimated emission of carbon monoxide from gasoline-fuelled highway vehicles in the USA (adapted from US EPA, 1991a).
Sources of Carbon Monoxide in the Environment
45
about 10% of national carbon monoxide emissions, more than anysource category except highway vehicles. Carbon monoxide emissionsfrom industrial processes have generally been declining since 1970 asthe result of the obsolescence of a few high-polluting processes suchas manufacture of carbon black by the channel process andinstallation of controls on other processes.
Considerable effort has been made to reduce emissions of carbonmonoxide and other pollutants to the atmosphere. Because the auto-mobile engine is recognized to be the major source of carbon monox-ide in most urban areas, special attention is given to the control ofautomotive emissions. Generally, the approach has beentechnological: reduction of carbon monoxide emissions to theatmosphere either by improving the efficiency of the combustionprocesses, thereby increasing the yield of carbon dioxide anddecreasing the yield of carbon monoxide, or by applying secondarycatalytic combustion reactors to the waste gas stream to convertcarbon monoxide to carbon dioxide.
The development and application of control technology to reduceemissions of carbon monoxide from combustion processes generallyhave been successful and are continuing to receive deserved attention.The reduction of carbon monoxide emissions from 7.0 to 3.4 g/mi(from 4.4 to 2.1 g/km), scheduled for the 1981 model year, wasdelayed 2 years, reflecting in part the apparent difficulty encounteredby the automobile industry in developing and supplying the requiredcontrol technology. The carbon monoxide emission limit for light-duty vehicles at low altitude has been 3.4 g/mi (2.1 g/km) since 1983;since 1984, this limit has applied to light-duty vehicles at all altitudes.
Carbon monoxide emissions from 1990 to 1994 in Germany, asestimated by the Federal Environmental Agency (1997), aresummarized in Table 4 and show a clear reduction with time. Theestimated carbon monoxide emissions in Europe during 1990 aresummarized in Table 5, including the sum of 28 European countriesand individual data from 10 countries (European EnvironmentalAgency, 1995). The Task Group noted that the original reference doesnot specify any details concerning the zero values listed in Table 5.
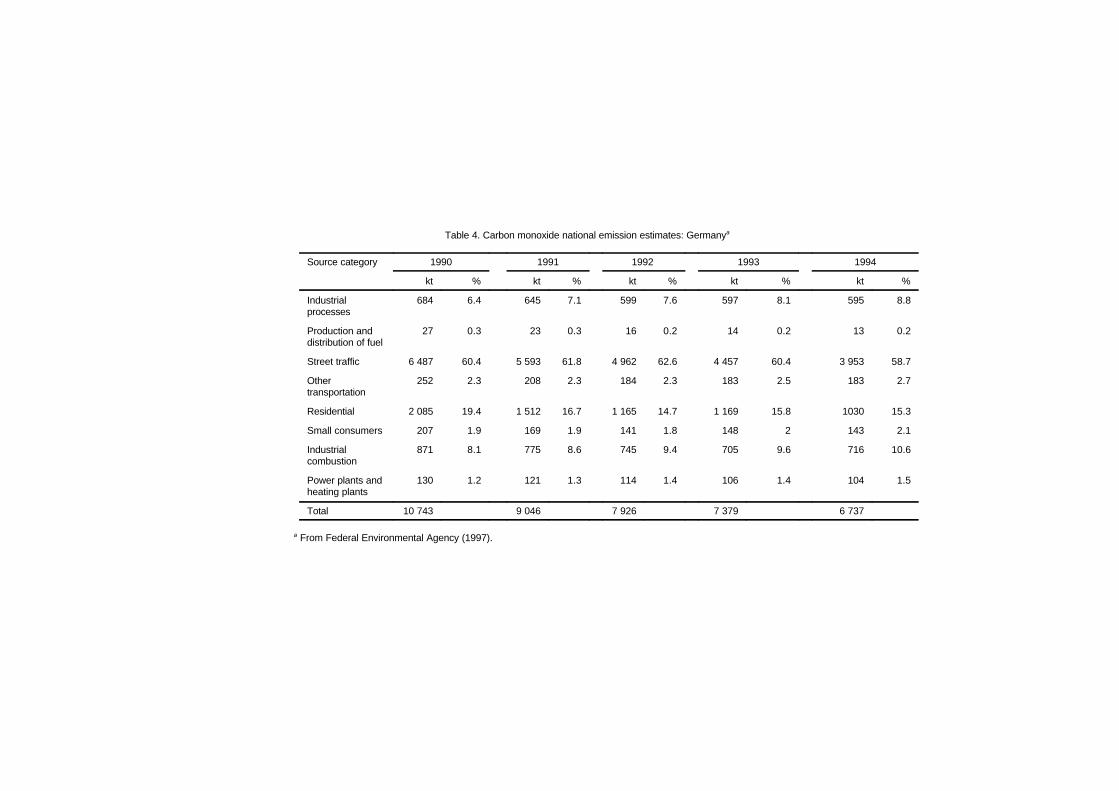
Table 4. Carbon monoxide national emission estimates: Germanya
Source category 1990 1991 1992 1993 1994
kt % kt % kt % kt % kt %
Industrialprocesses
684 6.4 645 7.1 599 7.6 597 8.1 595 8.8
Production anddistribution of fuel
27 0.3 23 0.3 16 0.2 14 0.2 13 0.2
Street traffic 6 487 60.4 5 593 61.8 4 962 62.6 4 457 60.4 3 953 58.7
Othertransportation
252 2.3 208 2.3 184 2.3 183 2.5 183 2.7
Residential 2 085 19.4 1 512 16.7 1 165 14.7 1 169 15.8 1030 15.3
Small consumers 207 1.9 169 1.9 141 1.8 148 2 143 2.1
Industrialcombustion
871 8.1 775 8.6 745 9.4 705 9.6 716 10.6
Power plants andheating plants
130 1.2 121 1.3 114 1.4 106 1.4 104 1.5
Total 10 743 9 046 7 926 7 379 6 737
a From Federal Environmental Agency (1997).
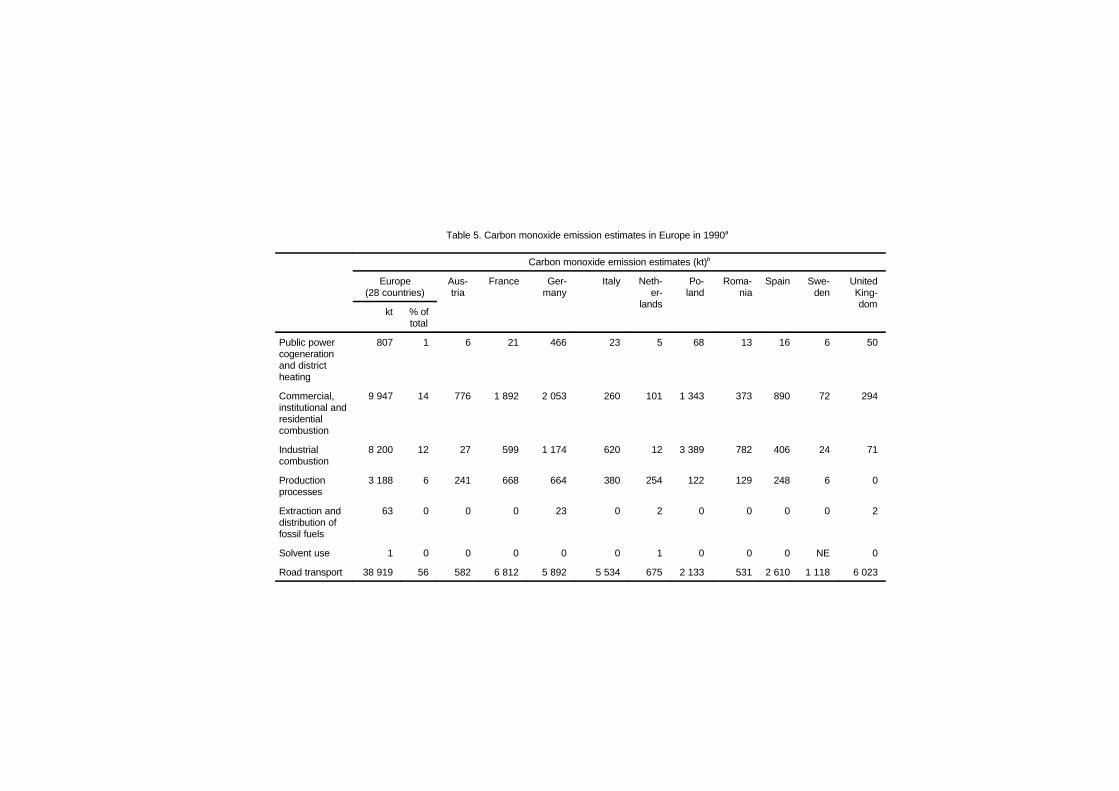
Table 5. Carbon monoxide emission estimates in Europe in 1990a
Carbon monoxide emission estimates (kt)b
Europe(28 countries)
Aus-tria
France Ger-many
Italy Neth-er-
lands
Po-land
Roma-nia
Spain Swe-den
UnitedKing-dom
kt % oftotal
Public powercogenerationand districtheating
807 1 6 21 466 23 5 68 13 16 6 50
Commercial,institutional andresidentialcombustion
9 947 14 776 1 892 2 053 260 101 1 343 373 890 72 294
Industrialcombustion
8 200 12 27 599 1 174 620 12 3 389 782 406 24 71
Productionprocesses
3 188 6 241 668 664 380 254 122 129 248 6 0
Extraction anddistribution offossil fuels
63 0 0 0 23 0 2 0 0 0 0 2
Solvent use 1 0 0 0 0 0 1 0 0 0 NE 0
Road transport 38 919 56 582 6 812 5 892 5 534 675 2 133 531 2 610 1 118 6 023
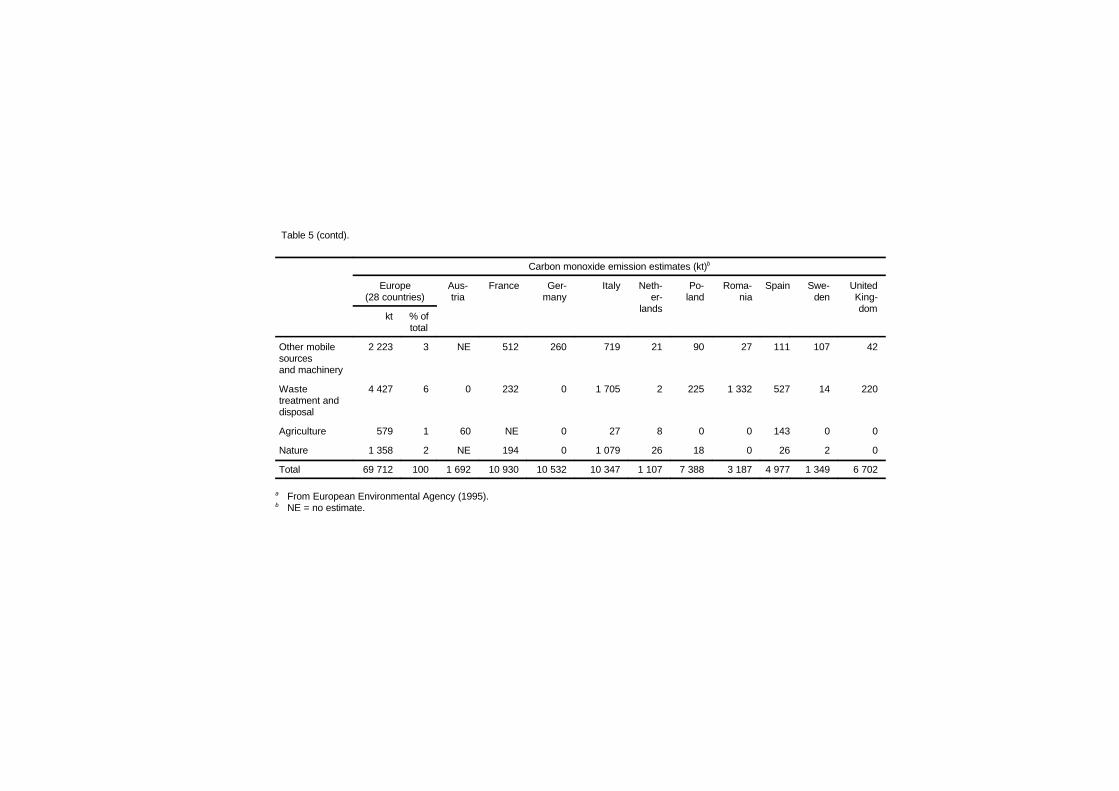
Table 5 (contd).
Carbon monoxide emission estimates (kt)b
Europe(28 countries)
Aus-tria
France Ger-many
Italy Neth-er-
lands
Po-land
Roma-nia
Spain Swe-den
UnitedKing-dom
kt % oftotal
Other mobilesourcesand machinery
2 223 3 NE 512 260 719 21 90 27 111 107 42
Wastetreatment anddisposal
4 427 6 0 232 0 1 705 2 225 1 332 527 14 220
Agriculture 579 1 60 NE 0 27 8 0 0 143 0 0
Nature 1 358 2 NE 194 0 1 079 26 18 0 26 2 0
Total 69 712 100 1 692 10 930 10 532 10 347 1 107 7 388 3 187 4 977 1 349 6 702
a From European Environmental Agency (1995).b NE = no estimate.
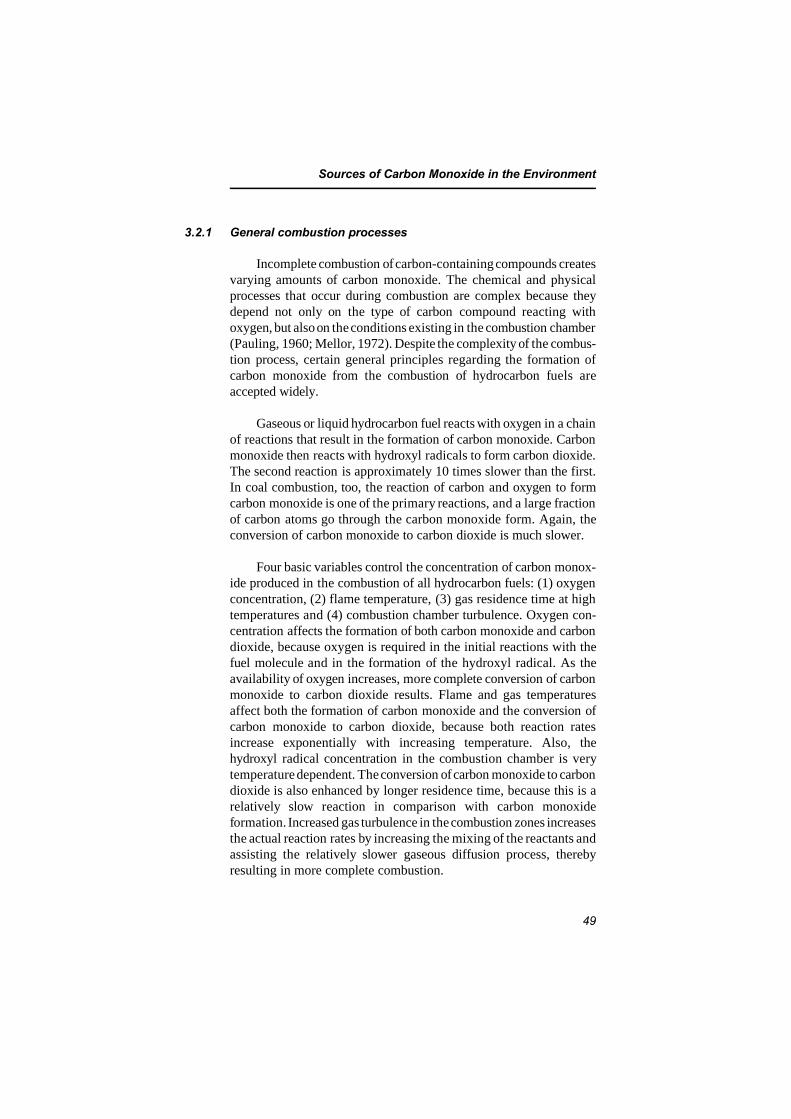
Sources of Carbon Monoxide in the Environment
49
3.2.1 General combustion processes
Incomplete combustion of carbon-containing compounds createsvarying amounts of carbon monoxide. The chemical and physicalprocesses that occur during combustion are complex because theydepend not only on the type of carbon compound reacting withoxygen, but also on the conditions existing in the combustion chamber(Pauling, 1960; Mellor, 1972). Despite the complexity of the combus-tion process, certain general principles regarding the formation ofcarbon monoxide from the combustion of hydrocarbon fuels areaccepted widely.
Gaseous or liquid hydrocarbon fuel reacts with oxygen in a chainof reactions that result in the formation of carbon monoxide. Carbonmonoxide then reacts with hydroxyl radicals to form carbon dioxide.The second reaction is approximately 10 times slower than the first.In coal combustion, too, the reaction of carbon and oxygen to formcarbon monoxide is one of the primary reactions, and a large fractionof carbon atoms go through the carbon monoxide form. Again, theconversion of carbon monoxide to carbon dioxide is much slower.
Four basic variables control the concentration of carbon monox-ide produced in the combustion of all hydrocarbon fuels: (1) oxygenconcentration, (2) flame temperature, (3) gas residence time at hightemperatures and (4) combustion chamber turbulence. Oxygen con-centration affects the formation of both carbon monoxide and carbondioxide, because oxygen is required in the initial reactions with thefuel molecule and in the formation of the hydroxyl radical. As theavailability of oxygen increases, more complete conversion of carbonmonoxide to carbon dioxide results. Flame and gas temperaturesaffect both the formation of carbon monoxide and the conversion ofcarbon monoxide to carbon dioxide, because both reaction ratesincrease exponentially with increasing temperature. Also, thehydroxyl radical concentration in the combustion chamber is verytemperature dependent. The conversion of carbon monoxide to carbondioxide is also enhanced by longer residence time, because this is arelatively slow reaction in comparison with carbon monoxideformation. Increased gas turbulence in the combustion zones increasesthe actual reaction rates by increasing the mixing of the reactants andassisting the relatively slower gaseous diffusion process, therebyresulting in more complete combustion.
EHC 213: Carbon Monoxide
50
3.2.2 Combustion engines
3.2.2.1 Mobile combustion engines
Most mobile sources of carbon monoxide are internal combustionengines of two types: (1) gasoline-fuelled, spark ignition,reciprocating engines (carburetted or fuel-injected) and (2) diesel-fuelled reciprocating engines. The carbon monoxide emitted from anygiven engine is the product of the following factors: (1) theconcentration of carbon monoxide in the exhaust gases, (2) the flowrate of exhaust gases and (3) the duration of operation.
1) Internal combustion engines (gasoline-fuelled, spark ignition engines)
Exhaust concentrations of carbon dioxide increase with lower(richer) air-to-fuel (A/F) ratios and decrease with higher (leaner)A/F ratios, but they remain relatively constant with ratios above thestoichiometric ratio of about 15:1 (Hagen & Holiday, 1964). Thebehaviour of gasoline automobile engines before and after theinstallation of pollutant control devices differs considerably. Depend-ing on the mode of driving, the average uncontrolled engine operatesat A/F ratios ranging from about 11:1 to a point slightly above thestoichiometric ratio. During the idling mode, at low speeds with lightload (such as low-speed cruise), during the full open throttle modeuntil speed picks up and during deceleration, the A/F ratio is low inuncontrolled cars, and carbon monoxide emissions are high. Athigher-speed cruise and during moderate acceleration, the reverse istrue. Cars with exhaust controls generally remain much closer tostoichiometric A/F ratios in all modes, and thus the carbon monoxideemissions are kept lower. The exhaust flow rate increases withincreasing engine power output.
The decrease in available oxygen with increasing altitude has theeffect of enriching the A/F mixture and increasing carbon monoxideemissions from carburetted engines. Fuel-injected gasoline engines,which predominate in the vehicle fleet today, have more closelycontrolled A/F ratios and are designed and certified to comply withapplicable emission standards regardless of elevation (US EPA,1983).
Correlations between total emissions of carbon monoxide ingrams per vehicle-mile (vehicle-kilometre) and average route speedshow a decrease in emissions with increasing average speed
Sources of Carbon Monoxide in the Environment
51
(Simonaitis & Heicklen, 1972; Stuhl & Niki, 1972; US EPA, 1985).During low-speed conditions (below 32 km/h or 20 mi/h average routespeed), the greater emissions per unit of distance travelled areattributable to (1) an increased frequency of acceleration, decelerationand idling encountered in heavy traffic and (2) the consequentincrease in the operating time per mile (kilometre) driven.
The carbon monoxide and the unburned hydrocarbon exhaustemissions from an uncontrolled engine result from incompletecombustion of the fuel–air mixture. Emission control on new vehiclesis being achieved by engine modifications, improvements in enginedesign and changes in engine operating conditions. Substantialreductions in carbon monoxide and other pollutant emissions resultfrom consideration of design and operating factors such as leaner,uniform mixing of fuel and air during carburetion, controlled heatingof intake air, increased idle speed, retarded spark timing, improvedcylinder head design, exhaust thermal reactors, oxidizing andreducing catalysts, secondary air systems, exhaust recycle systems,electronic fuel injection, A/F ratio feedback controls and modifiedignition systems (NAS, 1973).
2) Internal combustion engines (diesel engines)
Diesel engines are in use throughout the world in heavy-dutyvehicles, such as trucks and buses, and they are also extensively usedin Western Europe in light-duty vans, taxis and some cars. Dieselengines allow more complete combustion and use less volatile fuelsthan do spark ignition engines. The operating principles are signi-ficantly different from those of the gasoline engine. In diesel combus-tion, carbon monoxide concentrations in the exhaust are relatively lowbecause high temperature and large excesses of oxygen are involvedin normal operation.
3.2.2.2 Stationary combustion sources (steam boilers)
This section refers to fuel-burning installations such as coal-,gas- or oil-fired heating or power generating plants (externalcombustion boilers).
In these combustion systems, the formation of carbon monoxideis lowest at a ratio near or slightly above the stoichiometric A/F ratio.At lower than stoichiometric A/F ratios, high carbon monoxide
EHC 213: Carbon Monoxide
52
concentrations reflect the relatively low oxygen concentration and thepossibility of poor reactant mixing from low turbulence. These twofactors can increase emissions even though flame temperatures andresidence time are high. At higher than stoichiometric A/F ratios,increased carbon monoxide emissions result from decreased flametemperatures and shorter residence time. These two factors remainpredominant even when oxygen concentrations and turbulenceincrease. Minimal carbon monoxide emissions and maximum thermalefficiency therefore require combustor designs that provide highturbulence, sufficient residence time, high temperatures and near-stoichiometric A/F ratios. Combustor design dictates the actualapproach to that minimum.
3.2.3 Other sources
There are numerous industrial activities that result in theemission of carbon monoxide at one or more stages of the process(Walsh & Nussbaum, 1978; US EPA, 1979a, 1985). Manufacturingpig iron can produce as much as 700–1050 kg carbon monoxide/tonneof pig iron. Other methods of producing iron and steel can producecarbon monoxide at a rate of 9–118.5 kg/tonne. However, most of thecarbon monoxide generated is normally recovered and used as fuel.Conditions such as “slips,” abrupt collapses of cavities in the coke–oremixture, can cause instantaneous emissions of carbon monoxide thattemporarily exceed the capacity of the control equipment. Grey ironfoundries can produce 72.5 kg carbon monoxide/tonne of product, butan efficient afterburner can reduce the carbon monoxide emissions to4.5 kg/tonne. Nevertheless, industrial carbon monoxide emissionsmay constitute an important part of total emissions in industrial cities— for example, in the Ruhr area in Germany.
Charcoal production results in average carbon monoxideemissions of 172 kg/tonne. Emissions from batch kilns are difficult tocontrol, although some may have afterburners. Afterburners can moreeasily reduce, by an estimated 80% or more, the relatively constantcarbon monoxide emissions from continuous charcoal production.Emissions from carbon black manufacture can range from 5 to3200 kg carbon monoxide/tonne depending on the efficiency andquality of the emission control systems.
Some chemical processes, such as phthalic anhydride production,give off as little as 6 kg carbon monoxide/tonne with proper controls
Sources of Carbon Monoxide in the Environment
53
or as much as 200 kg carbon monoxide/tonne if no controls areinstalled. There are numerous other chemical processes that producerelatively low carbon monoxide emissions per tonne of product:sulfate pulping for paper produces 1–30 kg carbon monoxide/tonne,lime manufacturing normally produces 1–4 kg carbon monoxide/tonne, and carbon monoxide emissions from adipic acid productionare zero or slight with proper controls. Other industrial chemicalprocesses that cause carbon monoxide emissions are the manufactureof terephthalic acid and the synthesis of methanol and higheralcohols. As a rule, most industries find it economically desirable toinstall suitable controls to reduce carbon monoxide emissions.
Even though some of these carbon monoxide emission rates seemexcessively high, they are, in fact, only a small part of the totalpollutant load. Mention of these industries is made to emphasize theconcern for localized pollution problems when accidents occur orproper controls are not used.
In some neighbourhoods, wintertime carbon monoxide emissionsinclude a significant component from residential fireplaces and woodstoves. Emissions of carbon monoxide can range from 18 to 140 g/kg,depending on design, fuel type and skill of operation.
Although the estimated carbon monoxide emissions resultingfrom forest wildfires in the USA have fluctuated between about 4 and9 million tonnes per year since 1970 and were 6.2 million tonnes in1989, the estimated total carbon monoxide emissions from industrialprocesses in the USA declined from 8.9 million tonnes in 1970 to 4.6million tonnes in 1989 (US EPA, 1991c).
3.3 Indoor carbon monoxide
3.3.1 Introduction
Carbon monoxide is introduced to indoor environments throughemissions from a variety of combustion sources and in the infiltrationor ventilation air from outdoors. The resulting indoor concentration,both average and peak, is dependent on a complex interaction ofseveral interrelated factors affecting the introduction, dispersion andremoval of carbon monoxide. These factors include, for example, suchvariables as (1) the type, nature (factors affecting the generation rate
EHC 213: Carbon Monoxide
54
of carbon monoxide) and number of sources, (2) source usecharacteristics, (3) building characteristics, (4) infiltration orventilation rates, (5) air mixing between and within compartments inan indoor space, (6) removal rates and potential remission orgeneration by indoor surfaces and chemical transformations,(7) existence and effectiveness of air contaminant removal systemsand (8) outdoor concentrations.
Source emissions from indoor combustion are usually charac-terized in terms of emission rates, defined as the mass of pollutantemitted per unit of fuel input (micrograms per kilojoule). Theyprovide source strength data as input for indoor modelling, promotean understanding of the fundamental processes influencing emissions,guide field study designs assessing indoor concentrations, identify andrank important sources and aid in developing effective mitigationmeasures. Unfortunately, source emissions can vary widely. Althoughit would be most useful to assess the impact of each of the sources onindoor air concentrations of carbon monoxide by using models, thehigh variability in the source emissions and in other factors affectingthe indoor levels does not make such an effort very useful. Such anestimate will result in predicted indoor concentrations ranging overseveral orders of magnitude, making them of no practical use, andmay be misleading.
3.3.2 Emissions from indoor sources
Carbon monoxide emitted directly into the indoor environmentis one of several air contaminants resulting from combustion sources.Such emissions into occupied spaces can be unintentional or the resultof accepted use of unvented or partially vented combustion sources.Faulty or leaky flue pipes, backdrafting and spillage from combustionappliances that draw their air from indoors (e.g., Moffatt, 1986),improper use of combustion sources (e.g., use of a poorly maintainedkerosene heater) and air intake into a building from attached parkinggarages are all examples of unintentional or accidental indoor sourcesof carbon monoxide. In the USA, the National Center for HealthStatistics (1986) estimates that between 700 and 1000 deaths per yearare due to accidental carbon monoxide poisoning. Mortality statisticsare similar for other developed countries as well. The number ofindividuals experiencing severe adverse health effects at sublethalcarbon monoxide concentrations from accidental indoor sources is nodoubt many times the number of estimated deaths. Although the
Sources of Carbon Monoxide in the Environment
55
unintentional or accidental indoor sources of carbon monoxiderepresent a serious health hazard, little is known about the extent ofthe problem throughout the world. Such sources cannot becharacterized for carbon monoxide emissions in any standard way thatwould make the results extendable to the general population.
The major indoor sources of carbon monoxide emissions thatresult from the accepted use of unvented or partially vented com-bustion sources include gas cooking ranges and ovens, gas appliances,unvented gas space heaters, unvented kerosene space heaters, coal- orwood-burning stoves and cigarette combustion.
3.3.2.1 Gas cooking ranges, gas ovens and gas appliances
Estimates indicate that gas (natural gas and liquid propane) isused for cooking, heating water and drying clothes in approximately45.1% of all homes in the USA (US Bureau of the Census, 1982) andin nearly 100% of the homes in some other countries (e.g., theNetherlands). Unvented, partially vented and improperly vented gasappliances, particularly the gas cooking range and oven, represent animportant source category of carbon monoxide emissions into theindoor residential environment. Emissions of carbon monoxide fromthese gas appliances are a function of a number of variables relatingto the source type (range top or oven, water heater, dryer, number ofpilot lights, burner design, etc.), source condition (age, maintenance,combustion efficiency, etc.), source use (number of burners used,frequency of use, fuel consumption rate, length of use, improper use,etc.) and venting of emissions (existence and use of outside vents overranges, efficiency of vents, venting of gas dryers, etc.).
The source emission studies typically have been conducted in thelaboratory setting and have involved relatively few gas ranges and gasappliances. The reported studies indicate that carbon monoxideemissions are highly variable among burners on a single gas cookingrange and between gas cooking ranges and ovens, varying by as muchas an order of magnitude. Operating a gas cooking range or ovenunder improperly adjusted flame conditions (yellow-tipped flame) canresult in greater than a fivefold increase in emissions compared withproperly operating flame conditions (blue flame). Use of a rich or leanfuel appeared to have little effect on carbon monoxide emissions. Ingeneral, carbon monoxide emissions were roughly, on average,comparable for top burners, ovens, pilot lights and unvented gas
EHC 213: Carbon Monoxide
56
dryers when corrected for fuel consumption rate. The emission ratesgathered by either the direct or mass balance method werecomparable. Only one study attempted to evaluate gas stove emissionsin the field for a small number (10) of residences. This study foundcarbon monoxide emissions to be as much as a factor of 4 higher thanin chamber studies. Given the prevalence of the source, limited fieldmeasurements and poor agreement between existing laboratory- andfield-derived carbon monoxide emission data, there is a need toestablish a better carbon monoxide emission database for gas cookingranges in residential settings.
3.3.2.2 Unvented space heaters
Unvented kerosene and gas space heaters are used in the colderclimates to supplement central heating systems or in more moderateclimates as the primary source of heat. During the heating season,space heaters generally will be used for a number of hours during theday, resulting in emissions over relatively long periods of time.
Over the last several years, there has been a dramatic increase inthe use of unvented or poorly vented kerosene space heaters inresidential and commercial establishments, primarily as a supplemen-tal heat source. For example, in the USA, an estimated 16.1 millionsuch heaters had been sold through 1986 (S.E. Womble, personalcommunication, US Consumer Product Safety Commission, 1988).An additional 3 million residences use unvented gas space heaters(fuelled by natural gas or propane). The potentially large number ofunvented space heaters used throughout the world, particularly duringperiods when energy costs rise quickly, makes them an importantsource of carbon monoxide indoors.
Carbon monoxide emissions from unvented kerosene and gasspace heaters can vary considerably and are a function of heaterdesign (convective, radiant, combination, etc.), condition of heaterand manner of operation (e.g., flame setting).
Carbon monoxide emissions from unvented gas space heaterswere found to be variable from heater to heater, but were roughlycomparable to those for gas cooking ranges. Infrared gas space heatersproduced higher emissions than the convective or catalytic heaters.Emissions of carbon monoxide for these heaters were higher formaltuned heaters and for the mass balance versus direct method of
Sources of Carbon Monoxide in the Environment
57
testing. No differences for rich or lean fuel were found, but use ofnatural gas resulted in higher emissions than did use of propane.Lower fuel consumption settings resulted in lower carbon monoxideemissions. Emissions were observed to vary in time during a heaterrun and increase when room or chamber oxygen levels decreased.
Among the three principal unvented kerosene space heaterdesigns (radiant, convective and two-stage burners), radiant heatersproduced the highest carbon monoxide emissions and convectiveheaters produced the lowest emissions. Wick setting (low, normal orhigh) had a major impact on emissions, with the low-wick settingresulting in the highest carbon monoxide emissions. Data fromdifferent laboratories are in good agreement for this source.
3.3.2.3 Coal or wood stoves
Use of coal- or wood-burning stoves has been a popular costsavings alternative to conventional cooking and heating systems usinggas or oil. Carbon monoxide and other combustion by-products enterthe indoor environment during fire start-up, during fire-tendingfunctions or through leaks in the stove or venting system. Hence, it isdifficult to evaluate indoor carbon monoxide emission rates for thesesources. Traynor et al. (1987) evaluated indoor carbon monoxidelevels from four wood-burning stoves (three airtight stoves and onenon-airtight stove) in a residence. The non-airtight stove emittedsubstantial amounts of carbon monoxide to the residence, particularlywhen operated with a large fire. The airtight stoves contributedconsiderably less. The average carbon monoxide source strengthsduring stove operation ranged from 10 to 140 cm3/h for the airtightstoves and from 220 to 1800 cm3/h for the non-airtight stoves.
3.3.2.4 Tobacco combustion
The combustion of tobacco represents an important source ofindoor air contaminants. Carbon monoxide is emitted indoors fromtobacco combustion through the exhaled mainstream smoke and fromthe smouldering end of the cigarette (sidestream smoke). Carbonmonoxide emission rates in mainstream and sidestream smoke havebeen evaluated extensively in small chambers (less than a litre involume) using a standardized smoking machine protocol. The resultsof these studies have been summarized and evaluated in severalreports (e.g., NRC, 1986a; Surgeon General of the United States,
EHC 213: Carbon Monoxide
58
1986). These results indicate considerable variability in total(mainstream plus sidestream smoke) carbon monoxide emissions,with a typical range of 40–67 mg per cigarette. A small chamberstudy of 15 brands of Canadian cigarettes (Rickert et al., 1984) foundthe average carbon monoxide emission rate (mainstream plussidestream smoke) to be 65 mg per cigarette. A more limited numberof studies have been done using large chambers with the occupantssmoking or using smoking machines. Girman et al. (1982) reporteda carbon monoxide emission rate of 94.6 mg per cigarette for a largechamber study in which one cigarette brand was evaluated. A carbonmonoxide emission factor of 88.3 mg per cigarette was reported byMoschandreas et al. (1985) for a large chamber study of one referencecigarette.
On average, a smoker smokes approximately two cigarettes perhour, with an average smoking time of approximately 10 min percigarette. Using the above range of reported carbon monoxideemission rates for environmental tobacco smoke, this would roughlyresult in the emission of 80–190 mg of carbon monoxide per smokerper hour into indoor spaces where smoking occurs. This valuecompares with an approximate average carbon monoxide emissionrate of 260–545 mg/h for one range-top burner (without pilot light)operating with a blue flame. Two smokers in a house would producehourly carbon monoxide emissions comparable to the hourlyproduction rate of a single gas burner. Tobacco combustion thereforerepresents an important indoor source of carbon monoxide,particularly in locations where many people are smoking.
59
4. ENVIRONMENTAL DISTRIBUTION ANDTRANSFORMATION
4.1 Introduction
Carbon monoxide was first discovered to be a minor constituentof the Earth’s atmosphere in 1948 by Migeotte (1949). While takingmeasurements of the solar spectrum, he observed a strong absorptionband in the infrared region at 4.6 :m, which he attributed to carbonmonoxide (Lagemann et al., 1947). On the twin bases of the beliefthat the solar contribution to that band was negligible and hisobservation of a strong day-to-day variability in absorption, Migeotte(1949) concluded that an appreciable amount of carbon monoxide waspresent in the terrestrial atmosphere of Columbus, Ohio, USA. In the1950s, many more observations of carbon monoxide were made, withmeasured concentrations ranging from 0.09 to 110 mg/m3 (0.08 to100 ppm) (Migeotte & Neven, 1952; Benesch et al., 1953; Locke &Herzberg, 1953; Faith et al., 1959; Robbins et al., 1968; Sie et al.,1976). On the basis of these and other measurements available in1963, Junge (1963) stated that carbon monoxide appeared to be themost abundant trace gas, other than carbon dioxide, in theatmosphere. The studies of Sie et al. (1976) indicated higher mixingratios near the ground than in the upper atmosphere, implying asource in the biosphere, but Junge (1963) emphasized that knowledgeof the sources and sinks of atmospheric carbon monoxide wasextremely poor. It was not until the late 1960s that concerted effortswere made to determine the various production and destructionmechanisms for carbon monoxide in the atmosphere.
Far from human habitation in remote areas of the southern hemi-sphere, natural background carbon monoxide concentrations averagearound 0.05 mg/m3 (0.04 ppm), primarily as a result of natural pro-cesses such as forest fires and the oxidation of methane. In the nor-thern hemisphere, background concentrations are 2–3 times higherbecause of more extensive human activities. Much higher concentra-tions occur in cities, arising from technological sources such as auto-mobiles and the production of heat and power. Carbon monoxideemissions are increased when fuel is burned in an incomplete orinefficient way.
EHC 213: Carbon Monoxide
60
The physical and chemical properties of carbon monoxidesuggest that its atmospheric removal occurs primarily by reaction withhydroxyl radicals. Almost all the carbon monoxide emitted into theatmosphere each year is removed by reactions with hydroxyl radicals(85%), by soils (10%) and by diffusion into the stratosphere. There isa small imbalance between annual emissions and removal, causing anincrease of about 1% per year. It is very likely that the imbalance isdue to increasing emissions from anthropogenic activities. The aver-age concentration of carbon monoxide is about 100 :g/m3 (90 ppbv),which amounts to about 400 million tonnes in the atmosphere, andthe average lifetime is about 2 months. This view of the global cycleof carbon monoxide is consistent with the present estimates of averagehydroxyl radical concentrations and the budgets of other trace gases,including methane and methyl chloroform.
4.2 Global sources, sinks and lifetime
The largest sources of carbon monoxide in the global atmosphereare combustion processes and the oxidation of hydrocarbons (seechapter 3). The mass balance of a trace gas in the atmosphere can bedescribed as a balance between the rate of change of the global burdenadded to the annual rate of loss on the one side and global emissionson the other side (dC/dt + loss rate = source emissions, where C =concentration). In steady state, the atmospheric lifetime (J) is the ratioof the global burden to the loss rate. The global burden is the totalnumber of molecules of a trace gas in the atmosphere or its total mass.The concentration of a trace gas can vary (dC/dt is not 0) when eitherthe loss rate or the emissions vary cyclically in time, representingseasonal variations, or vary over a long time, often representing trendsin human industrial activities or population. For carbon monoxide,both types of trends exist. There are large seasonal cycles drivenmostly by seasonal variations in the loss rate but also affected byseasonal variations in emissions, and there are also indications oflong-term trends probably caused by increasing anthropogenicemissions.
4.2.1 Sinks
It is believed that reaction with hydroxyl radicals is the majorsink for removing carbon monoxide from the atmosphere. The cycleof the hydroxyl radical itself cannot be uncoupled from the cycles ofcarbon monoxide, methane, water and ozone. In the troposphere,
Environmental Distribution and Transformation
61
hydroxyl radicals (OHA) are produced by the photolysis of ozone (hL +O3 6 O(1D) + O2) followed by the reaction of the excited oxygenatoms with water vapour to produce two hydroxyl radicals (O(1D) +H2O 6 OHA + OHA). The production of hydroxyl radicals is balancedby their removal principally by reactions with carbon monoxide andmethane. On a global scale, carbon monoxide may remove morehydroxyl radicals than methane; however, methane is more importantin the southern hemisphere, where there is much less carbon monox-ide, than in the northern hemisphere, but the amount of methane isonly slightly less in the northern hemisphere.
The amount of carbon monoxide that is removed by reactionswith hydroxyl radicals can be estimated by calculating the loss asloss = Keff [OHA]ave [CO]ave, where Keff is the effective reaction rateconstant, [OHA]ave is the average hydroxyl radical concentration and[CO]ave is the average concentration of carbon monoxide. Thereaction rate constant of CO + OHA is K = (1.5 × 10⁻¹³) (1 + 0.6 Patm)cm3/molecule per second (DeMore et al., 1987), where Patm is theatmospheric pressure. The constant Keff describes the effective reactionrate, taking into account the decreasing atmospheric pressure anddecreasing carbon monoxide concentrations with height. EstimatingKeff to be 2 × 10–13 cm3/molecule per second and taking [OHA]ave to be8 × 105 molecules/cm3 and [CO]ave to be 90 ppbv (equivalent to about100 :g/m3), the annual loss of carbon monoxide from reactions withhydroxyl radicals is about 2200 million tonnes per year. The valuesadopted for [OHA]ave and [CO]ave are discussed in more detail later inthis chapter.
Uptake of carbon monoxide by soils has been documented andmay amount to about 250 million tonnes per year, or about 10% of thetotal emitted into the atmosphere (Inman et al., 1971; Ingersoll et al.,1974; Seiler & Schmidt, 1974; Bartholomew & Alexander, 1981),although arid soils may release carbon monoxide into the atmosphere(Conrad & Seiler, 1982). Another 100 million tonnes (5%) or so areprobably removed annually in the stratosphere (Seiler, 1974).
4.2.2 Atmospheric lifetime
Based on the global sources and sinks described above, theaverage atmospheric lifetime of carbon monoxide can be calculated tobe about 2 months, with a range between 1 and 4 months, whichreflects the uncertainty in the annual emissions of carbon monoxide
EHC 213: Carbon Monoxide
62
(J = C/S, where C is the tropospheric mixing ratio and S is the totalannual emissions). The lifetime, however, can vary enormously withlatitude and season compared with its global average value. Duringwinters at high and middle latitudes, carbon monoxide has a lifetimeof more than a year, but during summers at middle latitudes, thelifetime may be closer to the average global lifetime of about2 months. Moreover, in the tropics, the average lifetime of carbonmonoxide is probably about 1 month. These calculated variationsreflect the seasonal cycles of hydroxyl radicals at various latitudes.
4.2.3 Latitudinal distribution of sources
When the sources, sinks, transport and observed concentrationsof carbon monoxide are combined into a mass balance model, it ispossible to calculate any one of these four components if the others areknown. In the case of carbon monoxide, the sources can be estimatedassuming that the sinks (hydroxyl radical reaction and soils),transport and concentrations are known. The latitudinal distributionof sources can be described in a one-dimensional model (Khalil &Rasmussen, 1990b). This model is similar to that described byCzeplak & Junge (1974) and Fink & Klais (1978). A time-averagedversion was applied to the carbon monoxide budget by Hameed &Stewart (1979), and a somewhat modified and time-dependentversion, mentioned above, was applied by Khalil & Rasmussen(1990b) to derive the latitudinal distribution of carbon monoxideshown in Fig. 2. Calculations by Khalil & Rasmussen (1990b) alsosuggest that emissions are higher in spring and summer than in theother seasons, particularly in the middle northern latitudes. This isexpected for three reasons: (1) oxidation of methane and otherhydrocarbons is faster during the summer because of the seasonalvariation of hydroxyl radicals; (2) other direct emissions are alsogreater during spring and summer; and (3) at middle and higherlatitudes, methane and non-methane hydrocarbons build up during thewinter, and this reservoir is oxidized when hydroxyl radicalconcentrations rise during the spring.
From Fig. 2, the emissions from the northern and southern tropi-cal latitudes sum up to 480 million tonnes per year and 330 milliontonnes per year, respectively; the emissions from the northern andsouthern middle latitudes are 960 million tonnes per year and210 million tonnes per year, respectively; some 50 million tonnes areemitted each year from the Arctic; and some 10 million tonnes peryear come from the Antarctic. The largest fluxes of carbon monoxide
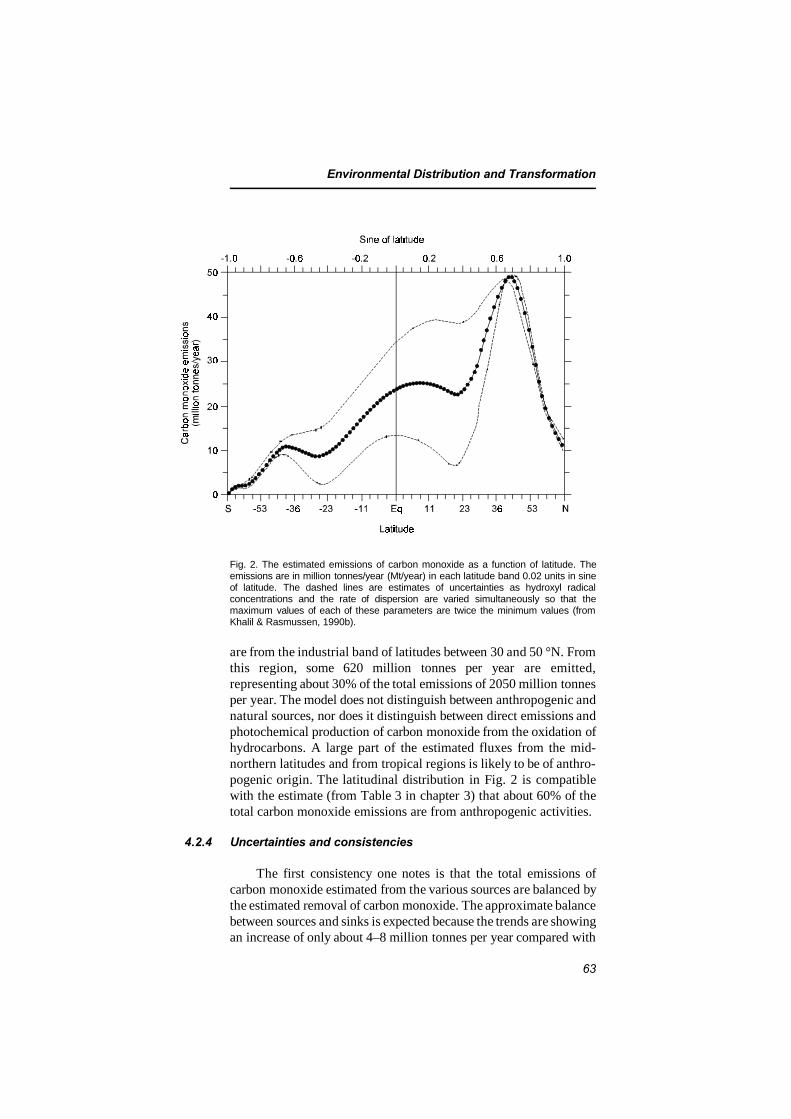
Environmental Distribution and Transformation
63
Fig. 2. The estimated emissions of carbon monoxide as a function of latitude. Theemissions are in million tonnes/year (Mt/year) in each latitude band 0.02 units in sineof latitude. The dashed lines are estimates of uncertainties as hydroxyl radicalconcentrations and the rate of dispersion are varied simultaneously so that themaximum values of each of these parameters are twice the minimum values (fromKhalil & Rasmussen, 1990b).
are from the industrial band of latitudes between 30 and 50 °N. Fromthis region, some 620 million tonnes per year are emitted,representing about 30% of the total emissions of 2050 million tonnesper year. The model does not distinguish between anthropogenic andnatural sources, nor does it distinguish between direct emissions andphotochemical production of carbon monoxide from the oxidation ofhydrocarbons. A large part of the estimated fluxes from the mid-northern latitudes and from tropical regions is likely to be of anthro-pogenic origin. The latitudinal distribution in Fig. 2 is compatiblewith the estimate (from Table 3 in chapter 3) that about 60% of thetotal carbon monoxide emissions are from anthropogenic activities.
4.2.4 Uncertainties and consistencies
The first consistency one notes is that the total emissions ofcarbon monoxide estimated from the various sources are balanced bythe estimated removal of carbon monoxide. The approximate balancebetween sources and sinks is expected because the trends are showingan increase of only about 4–8 million tonnes per year compared with
EHC 213: Carbon Monoxide
64
the total global emission rate of more than 2000 million tonnes peryear.
On the other hand, there are large uncertainties in the sourcesand sinks that in the future may upset the apparently cohesive presentbudget of carbon monoxide. Although the patterns of the globaldistribution are becoming established, there are still uncertaintiesabout the absolute concentrations. Estimates of emissions fromindividual sources are very uncertain (see Table 3 in chapter 3). Inmost cases, the stated uncertainty is a qualitative expression of thelikely range of emissions, and it cannot be interpreted statistically.Therefore, the resulting uncertainty in the total emissions, obtainedby adding up the uncertainties in individual sources, appears to belarge.
There are two difficulties encountered in improving the estimatesof carbon monoxide emissions from individual sources. First,although many critical experiments to determine the production andemissions of carbon monoxide from individual sources are yet to bedone, there is a limit to the accuracy with which laboratory data canbe extrapolated to the global scale. Second, the cycle of carbonmonoxide may be so intimately tied up with the cycles ofhydrocarbons that accurate global estimates of carbon monoxideemissions may not be possible until the hydrocarbon cycles are betterunderstood.
Whereas the global distribution and seasonal variations in theglobal distribution of hydroxyl radicals can be calculated, there are nodirect measurements of hydroxyl radicals that can be used to estimatethe removal of carbon monoxide. The effective average concentrationof hydroxyl radicals that acts on trace gases can be estimatedindirectly from the cycles of other trace gases with known globalemissions. Therefore, the total emissions of carbon monoxide areconstrained by the budgets of other trace gases, even though theestimates of emissions from individual sources may remain uncertain.The most notable constraint may be the budget of methyl chloroform.Methyl chloroform is a degreasing solvent that has been emitted intothe atmosphere in substantial quantities for more than 20 years. It isthought to be removed principally by reacting with hydroxyl radicalsand to a lesser extent by photodissociation in the stratosphere.Because industry records on methyl chloroform production and saleshave been kept for a long time, methyl chloroform can be used toestimate the average amount of hydroxyl radicals needed to explainthe observed concentrations compared with the emissions. The
Environmental Distribution and Transformation
65
accuracy of the source estimates of methyl chloroform is improved bythe patterns of its uses; most methyl chloroform tends to be releasedshortly after purchase, so large unknown or unquantified reservoirsprobably do not exist. The recent budgets of methyl chloroformsuggest that, on average, there are about 8 × 10⁵ molecules ofhydroxyl radical per cubic centimetre, although significantuncertainties remain (see, for example, Khalil & Rasmussen, 1984c).This is the value used above in estimating the loss of carbonmonoxide from reaction with hydroxyl radicals. The same averagevalue of hydroxyl radicals also explains the methane concentrationscompared with estimated sources, lending more support to theaccuracy of the estimated hydroxyl radical concentrations. Neither ofthese constraints is very stringent; however, if the total globalemissions of carbon monoxide from all sources are much differentfrom the estimated 2600 million tonnes per year, then revisions of thebudgets of both methane and methyl chloroform may be required.
Although there are other sources and sinks of carbon monoxide,these are believed to be of lesser importance on a global scale (Swin-nerton et al., 1971; Chan et al., 1977).
4.3 Global distributions
Atmospheric concentrations, and thus the global distribution, aregenerally the most accurately known components of a global massbalance of a trace gas, because direct atmospheric measurements canbe taken (Wilkniss et al., 1973; Seiler, 1974; Ehhalt & Schmidt,1978; Pratt & Falconer, 1979; Heidt et al., 1980; Dianov-Klokov &Yurganov, 1981; Seiler & Fishman, 1981; Rasmussen & Khalil,1982; Reichle et al., 1982; Hoell et al., 1984; Fraser et al., 1986;Khalil & Rasmussen, 1988, 1990a). Much has been learned about theglobal distribution of carbon monoxide over the last decade. Theexperiments leading to the present understanding range fromsystematic global observations at ground level for the last 8–10 years,reported by Khalil & Rasmussen (1988, 1990a) and Seiler (Seiler &Junge, 1970; Seiler, 1974), to finding the instantaneous globaldistribution of carbon monoxide from remote-sensing instruments onboard the US National Aeronautics and Space Administration’s spaceshuttle, as reported by Reichle et al. (1982, 1990).
EHC 213: Carbon Monoxide
66
4.3.1 Seasonal variations
The seasonal variations in carbon monoxide are well established(Dianov-Klokov & Yurganov, 1981; Seiler et al., 1984; Fraser et al.,1986; Khalil & Rasmussen, 1990a). High concentrations are observedduring the winters in each hemisphere, and the lowest concentrationsare seen in late summer. The amplitude of the cycle is largest at highnorthern latitudes and diminishes as one moves towards the equatoruntil it is reversed in the southern hemisphere, reflecting the reversalof the seasons. The seasonal variations are small in the equatorialregion. These patterns are expected from the seasonal variations inhydroxyl radical concentrations and carbon monoxide emissions. Atmid and high latitudes, diminished solar radiation, water vapour andozone during winters cause the concentrations of hydroxyl radicals tobe much lower than during summer. The removal of carbon monoxideis slowed down, and its concentrations build up. In summer, theopposite pattern exists, causing the large seasonal variations in carbonmonoxide.
On the hemispheric scale, the seasonal variation in carbon mon-oxide is approximately proportional to the concentration. Therefore,because there is much more carbon monoxide in the northern hemi-sphere than in the southern hemisphere, the decline of concentrationsin the northern hemisphere during the summer is not balanced by therise of concentrations in the southern hemisphere. This causes aglobal seasonal variation. The total amount of carbon monoxide in theEarth’s atmosphere undergoes a remarkably large seasonal variation;the global burden is highest during northern winters and lowestduring northern summers.
4.3.2 Latitudinal variation
The global seasonal variation in carbon monoxide content in theEarth’s atmosphere also creates a seasonal variation in the latitudinaldistribution (Newell et al., 1974; Seiler, 1974; Reichle et al., 1982,1986; Khalil & Rasmussen, 1988, 1990a). During northern winters,carbon monoxide levels are at their highest in the northern hemi-sphere, whereas concentrations in the southern hemisphere are at aminimum. The interhemispheric gradient, defined as the ratio of theamounts of carbon monoxide in the northern and southern hemi-spheres, is at its maximum of about 3.2 during northern hemispherewinters and falls to about 1.8 during northern hemisphere summers,
Environmental Distribution and Transformation
67
which is about half the winter value. The average latitudinal gradientis about 2.5, which means that, on average, there is about 2.5 times asmuch carbon monoxide in the northern hemisphere as in the southernhemisphere. Early data on latitudinal variations did not account forthe seasonal variations.
4.3.3 Variations with altitude
In the northern hemisphere troposphere, the concentrations ofcarbon monoxide generally decline with altitude, but in the southernhemisphere, the vertical gradient may be reversed as a result of thetransport of carbon monoxide from the northern hemisphere into thesouthern hemisphere. Above the tropopause, concentrations declinerapidly, so that there is very little carbon monoxide between 20 and40 km; at still higher altitudes, the mixing ratio may again increase(Seiler & Junge, 1969; Seiler & Warneck, 1972; Fabian et al., 1981).
4.3.4 Other variations
The concentration of carbon monoxide is generally higher in theair over populated continental areas than in the air over oceans, eventhough oceans release carbon monoxide into the atmosphere. Otherregions, such as tropical forests, may also be a source of isoprene andother hydrocarbons that may form carbon monoxide in the atmos-phere. Such sources produce shifting patterns of high carbonmonoxide concentrations over regional and perhaps even largerspatial scales. Variations in carbon monoxide concentrations weremeasured during the 1984 flights of the space shuttle, as reported byReichle et al. (1990).
Occasionally, significant diurnal variations in carbon monoxideconcentrations may also occur in some locations. For instance, diurnalvariations have been observed over some parts of the oceans, withhigh concentrations during the day and low concentrations at night.Because similar patterns also exist in the surface seawater, the diurnalvariations in carbon monoxide concentrations in the air can beexplained by emissions from the oceans.
Finally, after the repeating cycles and other trends are subtracted,considerable random fluctuations still remain in time series ofmeasurements. These fluctuations reflect the short lifetime of carbon
EHC 213: Carbon Monoxide
68
monoxide and the vicinity of the sources, and they complicate thedetection of long-term trends.
4.4 Global trends
Global concentrations of carbon monoxide were reported to beincreasing during the late 1970s and early 1980s, because some 60%of the global emissions of carbon monoxide come from anthropogenicsources, which had increasing emissions over this period. Directatmospheric observations reported by Khalil & Rasmussen (1984a)showed a detectable increasing trend at Cape Meares in Oregon, USA,between 1979 and 1982, when the rate of increase was about 5% peryear. Subsequent data from the same site showed that the rate was notsustained for long, and a much smaller increasing trend of somewhatless than 2% per year emerged over the longer period of 1970–1987(Khalil & Rasmussen, 1988). Similar data from other sites distributedworldwide also showed a global increase of about 1% per year (Khalil& Rasmussen, 1988). The trends were strongest in the mid-northernlatitudes where most of the sources were located and became smallerand weaker in the southern hemisphere. At the mid-southern latitudesite, the trends persisted but were not statistically significant (Khalil& Rasmussen, 1988). Rinsland & Levine (1985) reported estimates ofcarbon monoxide concentrations from spectroscopic plates fromEurope showing that between 1950 and 1984, carbon monoxideconcentrations increased at about 2% per year. Spectroscopicmeasurements of carbon monoxide taken by Dvoryashina et al. (1982,1984) and Dianov-Klokov and colleagues (Dianov-Klokov et al.,1978; Dianov-Klokov & Yurganov, 1981) in the Soviet Union alsosuggested an increase of about 2% per year between 1974 and 1982(Khalil & Rasmussen, 1984b, 1988).
More recent reports of carbon monoxide measurements in airsamples show that from 1988 to 1993, global carbon monoxideconcentrations started to decline rapidly. Novelli et al. (1994) col-lected air samples from 27 locations between 71 °N and 41 °S aboutonce every 3 weeks from a ship during the period June 1990 to June1993. In the northern latitudes, carbon monoxide concentrationsdecreased at a spatially and temporally average rate of 8.4 ± 1.0:g/m3 (7.3 ± 0.9 ppb) per year (6.1% per year). In the southernlatitudes, carbon monoxide concentrations decreased at a rate of 4.8± 0.6 :g/m3 (4.2 ± 0.5 ppb) per year (7.0% per year). Khalil &Rasmussen (1994) reported a slightly smaller decline in global carbon
Environmental Distribution and Transformation
69
monoxide concentrations of 2.6 ± 0.8% per year during the periodfrom 1988 to 1992. The rate of decrease reported by Khalil &Rasmussen (1994) was particularly rapid in the southern hemisphere.The authors hypothesize that this decline may reflect a reduction intropical biomass burning.
Since 1993, the downward trend in global carbon monoxideconcentrations has levelled off, and it is not clear if carbon monoxidewill continue to decline or increase. These reported trends in globalcarbon monoxide concentrations are relatively small, and the randomvariability is large. Nevertheless, they are extremely importanttowards an understanding of global atmospheric chemistry andpossible effects on global climate. Such changes in troposphericcarbon monoxide concentrations can cause shifts in hydroxyl radicalconcentrations and affect the oxidizing capacity of the atmosphere,thereby influencing the concentration of other trace gases, includingmethane. This change could also be a significant factor contributingto levels of ozone in the non-urban troposphere.
The likely future global-scale concentrations of carbon monoxideare completely unknown at present. It is possible that in the nextdecade, carbon monoxide concentrations will remain stable or evendecline further. Emissions from automobiles are probably on thedecline worldwide, emissions from biomass burning may bestabilizing or even declining, as speculated above, and thecontribution from methane oxidation may no longer be increasing asrapidly as before. Because the atmospheric lifetime of carbonmonoxide is short compared with those of other contributors to globalchange, the ambient concentrations adjust rapidly to existingemissions of carbon monoxide or its precursors.
70
5. ENVIRONMENTAL LEVELS AND PERSONALEXPOSURES
5.1 Introduction
Air quality guidelines for carbon monoxide are designed toprotect against actual and potential human exposures in ambient airthat would cause adverse health effects. The World Health Organi-zation’s guidelines for carbon monoxide exposure (WHO, 1987) areexpressed at four averaging times, as follows:
100 mg/m3 for 15 min60 mg/m3 for 30 min30 mg/m3 for 1 h10 mg/m3 for 8 h
The guideline values and periods of time-weighted average exposureshave been determined so that the carboxyhaemoglobin level of 2.5%is not exceeded, even when a normal subject engages in relativelyheavy work.
Cigarette consumption represents a special case of carbonmonoxide exposure; for the smoker, it almost always dominates overpersonal exposure from other sources. Studies by Radford & Drizd(1982) show that carboxyhaemoglobin levels of cigarette smokersaverage 4%, whereas those of non-smokers average 1%. Therefore,this summary focuses on environmental exposure of non-smokers tocarbon monoxide.
People encounter carbon monoxide in a variety of environments— while travelling in motor vehicles, working at their jobs, visitingurban locations associated with combustion sources, or cooking andheating with domestic gas, charcoal or wood fires — as well as intobacco smoke. Studies of human exposure have shown that amongthese settings, the motor vehicle is the most important for regularlyencountered elevations of carbon monoxide. Studies conducted by theUS EPA in Denver, Colorado, and Washington, DC, for example,have demonstrated that the motor vehicle interior has the highestaverage carbon monoxide concentrations (averaging 8–11 mg/m3
[7–10 ppm]) of all microenvironments (Johnson, 1984).
Environmental Levels and Personal Exposures
71
Another important setting for carbon monoxide exposure is theworkplace. In general, carbon monoxide exposures at work exceedexposures during non-work periods, apart from commuting to andfrom work. Average concentrations may be elevated during this periodbecause workplaces are often located in congested areas that havehigher background carbon monoxide concentrations than do manyresidential neighbourhoods. Occupational and non-occupational expo-sures may overlay one another and result in a higher concentration ofcarbon monoxide in the blood. Certain occupations also increase therisk of high carbon monoxide exposure. These include those occupa-tions involved directly with vehicle driving, maintenance and parking,such as auto mechanics; parking garage and gas station attendants;bus, truck or taxi drivers; traffic police; and warehouse workers. Someindustrial processes produce carbon monoxide directly or as a by-product, including steel production, nickel refining, coke ovens,carbon black production and petroleum refining. Firefighters, cooksand construction workers may also be exposed to higher carbon mon-oxide levels at work. Occupational exposures in industries or settingswith carbon monoxide production also represent some of the highestindividual exposures observed in field monitoring studies.
The highest indoor non-occupational carbon monoxide exposuresare associated with combustion sources and include enclosed parkinggarages, service stations and restaurants. The lowest indoor carbonmonoxide concentrations are found in homes, churches and healthcare facilities. The US EPA’s Denver Personal Monitoring Studyshowed that passive cigarette smoke is associated with increasing anon-smoker’s exposure by an average of about 1.7 mg/m3 (1.5 ppm)and that use of a gas range is associated with an increase of about2.9 mg/m3 (2.5 ppm) at home. Other sources that may contribute tohigher carbon monoxide levels in the home include combustion spaceheaters and wood- and coal-burning stoves.
5.2 Population exposure to carbon monoxide
5.2.1 Ambient air monitoring
Many early attempts to estimate exposure of human populationsused data on ambient air quality from fixed monitoring stations. Anexample of such an analysis can be found in the 1980 annual reportof the President’s Council on Environmental Quality (1980). In this
EHC 213: Carbon Monoxide
72
analysis, a county’s exposure to an air pollutant was estimated as theproduct of the number of days on which violations of the primarystandard were observed at county monitoring sites multiplied by thecounty’s population. Exposure was expressed in units of person-days.National exposure to an air pollutant was estimated by the sum of allcounty exposures.
The methodology employed by the Council on EnvironmentalQuality provides a relatively crude estimate of exposure and is limitedby four assumptions:
(1) The exposed populations do not travel outside areas repre-sented by fixed-site monitors.
(2) The air pollutant concentrations measured with the networkof fixed-site monitors are representative of the concentra-tions breathed by the population throughout the area.
(3) The air quality in any one area is only as good as that at thelocation that has the worst air quality.
(4) There are no violations in areas of the county that are notmonitored.
Many studies cast doubt on the validity of these assumptions forcarbon monoxide. These studies are reviewed in Ott (1982) and inSpengler & Soczek (1984). Doubts over the ability of fixed-sitemonitors alone to accurately depict air pollutant exposures are basedon two major findings on fixed-site monitor representativeness:
(1) Indoor and in-transit concentrations of carbon monoxidemay be significantly different from ambient carbon monox-ide concentrations.
(2) Ambient outdoor concentrations of carbon monoxide withwhich people come in contact may vary significantly fromcarbon monoxide concentrations measured at fixed-sitemonitors.
In estimating exposure, the Council on Environmental Qualityalso assumed that each person in the population spends 24 h at home.
Environmental Levels and Personal Exposures
73
This assumption permitted the use of readily available demographicdata from the US Bureau of the Census. Data collected 20 years agoindicate that people spend a substantial portion of their time awayfrom home. In a study of metropolitan Washington, DC, residentsduring 1968, Chapin (1974) found that people spent an average 6.3h away from home on Sunday and 10.6 h away from home on Friday.This translates to between 26.3% and 44.2% of the day spent awayfrom home. More recent personal exposure and time budget studies(e.g., Johnson, 1987; Schwab et al., 1990) also indicate that a substan-tial portion of time is spent away from home.
Fixed-site monitors measure concentrations of pollutants inambient air. Ambient air has been defined by the US EPA in the Codeof Federal Regulations (OSHA, 1991b) as air that is “external tobuildings, to which the general public has access.” But the nature ofmodern urban lifestyles in many countries, including the USA,indicates that people spend an average of over 20 h per day indoors(Meyer, 1983). Reviews of studies on this subject by Yocom (1982),Meyer (1983) and Spengler & Soczek (1984) show that measurementsof indoor carbon monoxide concentrations vary significantly fromsimultaneous measurements in ambient air. The difference betweenindoor and outdoor air quality and the amount of time people spendindoors reinforce the conclusion that using ambient air quality mea-surements alone will not provide accurate estimates of populationexposure.
5.2.2 Approaches for estimating population exposure
In recent years, researchers have focused on the problem ofdetermining actual population exposures to carbon monoxide. Thereare three alternative approaches for estimating the exposures of apopulation to air pollution: the “direct approach,” using fieldmeasurement of a representative population carrying PEMs; the“indirect approach,” involving computation from field data of activitypatterns and measured concentration levels within microenvironments(Ott, 1982); and a hybrid approach that combines the direct andindirect approaches (Mage, 1991).
In the direct approach, as study participants engage in regulardaily activities, they are responsible for recording their exposures tothe pollutant of interest using a personal monitor. Subjects can recordtheir exposures in a diary, the method used in a US pilot study in
EHC 213: Carbon Monoxide
74
Los Angeles, California (Ziskind et al., 1982), or they can auto-matically store exposure data in a data logger, the method used instudies in Denver, Colorado (Johnson, 1984), and Washington, DC(Hartwell et al., 1984), which are summarized by Akland et al.(1985). In all of these studies, subjects also recorded the time andnature of their activities while they monitored personal exposures tocarbon monoxide.
The direct approach can be used to obtain an exposure inventoryof a representative sample from either the general population or aspecific subpopulation, which can be defined by many demographic,occupational and health factors. The inventory can cover a range ofmicroenvironments encountered over a period of interest (e.g., a day),or it can focus on one particular microenvironment. With this flexi-bility, policy analysts can assess the problem that emission sourcespose to a particular subgroup (e.g., commuters) active in a specificmicroenvironment (e.g., automobiles).
The indirect approach to estimating personal exposure is to usePEMs or microenvironmental monitors to monitor microenvironmentsrather than individuals. Combined with the ambient data andadditional data on human activities that occur in these microenviron-ments, data from the indirect approach can be used to estimate thepercentage of a subpopulation that is at risk for exposure to pollutantconcentrations that exceed national or regional air quality standards.Flachsbart & Brown (1989) conducted this type of study to estimatemerchant exposure to carbon monoxide from motor vehicle exhaustat the Ala Moana Shopping Center in Honolulu, Hawaii, USA.
5.2.3 Personal monitoring field studies
The development of small PEMs made possible the large-scalecarbon monoxide human exposure field studies in Denver, Colorado,and Washington, DC, in the winter of 1982–83 (Akland et al., 1985).These monitors proved effective in generating 24-h carbon monoxideexposure profiles on 450 persons in Denver and 800 persons inWashington, DC. The Denver–Washington, DC, study is the onlylarge-scale field study on population exposure to carbon monoxidethat has been undertaken to date.
Results from the Denver–Washington, DC, study (Akland et al.,1985) show that over 10% of the Denver residents and 4% of the
Environmental Levels and Personal Exposures
75
Washington, DC, residents were exposed to 8-h average carbonmonoxide levels above 10 mg/m3 (9 ppm) during the winter studyperiod. This degree of population exposure could not be accuratelydeduced from simultaneous data collected by the fixed-site monitorswithout taking into account other factors, such as contributions fromindoor sources, elevated levels within vehicles and individuals’activity patterns. In Denver, for example, the fixed-site monitorsexceeded the 10 mg/m3 (9 ppm) level only 3.1% of the time. Theseresults indicate that the effects of personal activity, indoor sourcesand, especially, time spent commuting all greatly contribute to aperson’s carbon monoxide exposure.
This study emphasizes that additional strategies are required toaugment data from fixed-site monitoring networks in order to evaluateactual human carbon monoxide exposures and health risks within acommunity. The cumulative carbon monoxide data for both Denverand Washington, DC, show that personal monitors often measurehigher concentrations than do fixed stations. As part of this study, 1-hexposures to carbon monoxide concentrations as determined bypersonal monitors were compared with measured ambient concentra-tions at fixed monitor sites. Correlations between personal monitordata and fixed-site data were consistently poor; the fixed-site datausually explained less than 10% of the observed variation in personalexposure. For example, 1-h carbon monoxide measurements taken atthe nearest fixed stations were only weakly correlated (0.14 # r #0.27) with office or residential measurements taken with personalmonitors (Akland et al., 1985).
The conclusion that exposure of persons to ambient carbon mon-oxide and other pollutants does not directly correlate with concentra-tions determined at fixed-site monitors is supported by the work ofothers (Ott & Eliassen, 1973; Cortese & Spengler, 1976; Dockery &Spengler, 1981; Wallace & Ott, 1982; Wallace & Ziegenfus, 1985).Results from the Finnish Liila study in Helsinki, in which personalcarbon monoxide and nitrogen dioxide exposures of preschool chil-dren were monitored, showed that their short-term personal carbonmonoxide exposures did not correlate with carbon monoxide levels inambient air and that gas stove use at home was the dominant deter-minant of carbon monoxide exposure (Alm et al., 1994).
EHC 213: Carbon Monoxide
76
In view of the high degree of variability of ambient carbonmonoxide concentrations over both space and time and the presenceof indoor sources of carbon monoxide, the reported results are notsurprising. A given fixed monitor is unable to track the exposure ofindividuals to ambient carbon monoxide as they go about their dailyactivities, moving from one location to another, all of which areseldom in the immediate vicinity of the monitor. This does notnecessarily mean, however, that fixed monitors do not give someuseful general information on the overall level of exposure of apopulation to carbon monoxide. The Denver and Washington, DC,data, although failing to show a correlation between exposuresmeasured by individual personal monitors and simultaneousconcentrations measured by the nearest fixed-site monitors, didsuggest that, in Denver, aggregate personal exposures were lower ondays of lower ambient carbon monoxide levels as determined by fixed-site monitors and higher on days of higher ambient levels. Also, bothfixed-site and personal exposures were higher in Denver than inWashington, DC. For example, the median ambient daily 1-h maxi-mum carbon monoxide concentration was measured by fixed monitorsto be 3.7 mg/m3 (3.2 ppm) higher in Denver than in Washington, DC,and the personal median daily 1-h maximum carbon monoxide expo-sure was measured by PEMs to be 4.5 mg/m3 (3.9 ppm) higher inDenver. Likewise, the median ambient daily 8-h maximum carbonmonoxide concentration measured by fixed monitors was found to be3.3 mg/m3 (2.9 ppm) higher in Denver, whereas the personal mediandaily 8-h maximum carbon monoxide exposure was 3.9 mg/m3
(3.4 ppm) higher in Denver.
The in-transit microenvironment with the highest estimatedcarbon monoxide concentration was the motorcycle, whereas walkingand bicycling had the lowest carbon monoxide concentrations. Out-door microenvironments can also be ranked for these data. Outdoorpublic garages and outdoor residential garages and carports had thehighest carbon monoxide concentrations; outdoor service stations,vehicle repair facilities and parking lots had intermediate concentra-tions. In contrast, school grounds and residential grounds hadrelatively low concentrations, whereas extremely low carbonmonoxide concentrations were found in outdoor sports arenas,amphitheatres, parks and golf courses. Finally, a wide range ofconcentrations was found in Denver within indoormicroenvironments. The highest indoor carbon monoxide
Environmental Levels and Personal Exposures
77
concentrations occurred in service stations, vehicle repair facilitiesand public parking garages; intermediate concentrations were foundin shopping malls, residential garages, restaurants, offices,auditoriums, sports arenas, concert halls and stores; and the lowestconcentrations were found in health care facilities, public buildings,manufacturing facilities, homes, schools and churches.
One activity that influences personal exposure is commuting. Anestimated 1% of the non-commuters in Washington, DC, wereexposed to concentrations above 10 mg/m3 (9 ppm) for 8 h. Bycomparison, an estimated 8% of persons reporting that theycommuted more than 16 h per week had 8-h carbon monoxideexposures above the 10 mg/m3 (9 ppm) level. Finally, certainoccupational groups whose work brings them in close proximity to theinternal combustion engine had a potential for elevated carbonmonoxide exposures. These include automobile mechanics; parkinggarage or gas station attendants; crane deck operators; cooks; taxi, busand truck drivers; firemen; policemen; and warehouse andconstruction workers. Of the 712 carbon monoxide exposure profilesobtained in Washington, DC, 29 persons fell into this “high-exposure” category. Of these, 25% had 8-h carbon monoxideexposures above the 10 mg/m3 (9 ppm) level.
Several field studies have also been conducted by the US EPA todetermine the feasibility and effectiveness of monitoring selectedmicroenvironments for use in estimating exposure profiles indirectly.One study (Flachsbart et al., 1987), conducted in Washington, DC, in1982 and 1983, concentrated on the commuting microenvironment,because earlier studies identified this microenvironment type as thesingle most important non-occupational microenvironment relative tototal carbon monoxide population exposure. It was observed that forthe typical automobile commuter, the time-weighted average carbonmonoxide exposure while commuting ranged from 10 to 16 mg/m3
(9 to 14 ppm). The corresponding rush-hour (7:00 to 9:00 a.m., 4:00to 6:00 p.m.) averages at fixed-site monitors were 3.1–3.5 mg/m3
(2.7–3.1 ppm).
5.2.4 Carbon monoxide exposures indoors
People in developed countries spend a majority (~85%) of theirtime indoors (US EPA, 1989a,b); therefore, a comprehensivedepiction of exposure to carbon monoxide must include this setting.The indoor sources, emissions and concentrations are sufficientlydiverse, however, that only a few studies can be cited here as
EHC 213: Carbon Monoxide
78
examples. Targeted field studies that have monitored indoor carbonmonoxide levels as a function of the presence or absence ofcombustion sources are described in more detail in section 5.6.
Early studies date back to before 1970, when it was found thatindoor and outdoor carbon monoxide levels do not necessarily agree.For example, one study determined indoor–outdoor relationships forcarbon monoxide over 2-week periods during summer, winter and fallin 1969 and 1970 in buildings in Hartford, Connecticut, USA (Yocomet al., 1971). With the exception of the private homes, which wereessentially equal, there was a day-to-night effect in the fall and winterseasons; days were higher by about a factor of 2. These differences areconsistent with higher traffic-related carbon monoxide levels outdoorsin the daytime.
Indoor and outdoor carbon monoxide concentrations weremeasured in four homes, also in the Hartford, Connecticut, area, in1973 and 1974 (Wade et al., 1975). All used gas-fired cooking stoves.Concentrations were measured in the kitchen, living room and bed-room. Stove use, as determined by activity diaries, correlated directlywith carbon monoxide concentrations. Peak carbon monoxide concen-trations in several of the kitchens exceeded 10 mg/m3 (9 ppm), butaverage concentrations ranged from 2.3–3.4 mg/m3 (2–3 ppm) toabout 9 mg/m3 (8 ppm). These results are in general agreement withresults obtained in Boston, Massachusetts, USA (Moschandreas &Zabransky, 1982). In this study, the investigators found significantdifferences between carbon monoxide concentrations in rooms inhomes where there were gas appliances.
Effects of portable kerosene-fired space heaters on indoor airquality were measured in an environmental chamber and a house(Traynor et al., 1982). Carbon monoxide emissions from white flameand blue flame heaters were compared. The white flame convectiveheater emitted less carbon monoxide than the blue flame radiantheater. Concentrations in the residence were <2.3 mg/m3 (<2 ppm)and 2.3–8 mg/m3 (2–7 ppm), respectively. The authors concluded thathigh levels might occur when kerosene heaters are used in smallspaces or when air exchange rates are low.
A rapid method using an electrochemical PEM to survey carbonmonoxide was applied in nine high-rise buildings in the San
Environmental Levels and Personal Exposures
79
Francisco and Los Angeles, California, areas during 1980 and 1984(Flachsbart & Ott, 1986). One building had exceptionally high carbonmonoxide levels compared with the other buildings; averageconcentrations on various floors ranged from 6 to 41 mg/m3 (5 to36 ppm). The highest levels were in the underground parking garage,which was found to be the source of elevated carbon monoxide withinthe building through transport via the elevator shaft.
The effect of residential wood combustion and specific heatertype on indoor carbon monoxide levels has been investigated(Humphreys et al., 1986). Airtight and non-airtight heaters werecompared in a research home in Tennessee, USA. Carbon monoxideemissions from the non-airtight heaters were generally higher thanthose from the airtight heaters. Peak indoor carbon monoxide concen-tration (ranging from 1.5 to 33.9 mg/m3 [1.3 to 29.6 ppm], dependingon heater type) was related to fuel reloadings.
Two studies in the Netherlands have measured carbon monoxidelevels in homes. Carbon monoxide levels in 254 Netherland homeswith unvented gas-fired geysers (water heaters) were investigatedduring the winter of 1980 (Brunekreef et al., 1982). Concentrationsat breathing height were grouped into the following categories:#11 mg/m3 (#10 ppm; n = 154), 13–57 mg/m3 (11–50 ppm; n = 50),58–110 mg/m3 (51–100 ppm; n = 25) and >110 mg/m3 (>100 ppm;n = 17). They found that a heater vent reduced indoor carbonmonoxide concentrations and that the type of burner affected carbonmonoxide levels. In another study, air pollution in Dutch homes wasinvestigated by Lebret (1985). Carbon monoxide concentrations weremeasured in the kitchen (0–20.0 mg/m3 [0–17.5 ppm]), the livingroom (0–10.0 mg/m3 [0–8.7 ppm]) and the bedroom (0–4.0 mg/m3
[0–3.5 ppm]). Carbon monoxide levels were elevated in homes withgas cookers and unvented geysers. Kitchen carbon monoxide levelswere higher than those in other locations as a result of peaks from theuse of gas appliances. Carbon monoxide levels in living rooms wereslightly higher in houses with smokers. The overall mean carbonmonoxide level indoors was 0–3.1 mg/m3 (0–2.7 ppm) above outdoorlevels.
In Zagreb, Yugoslavia, carbon monoxide was measured in eighturban institutions housing sensitive populations, including kinder-gartens, a children’s hospital and homes for the elderly (Sisovic &
EHC 213: Carbon Monoxide
80
Fugas, 1985). Winter carbon monoxide concentrations ranged from1.3 to 15.7 mg/m3 (1.1 to 13.7 ppm), and summer concentrationsranged from 0.7 to 7.9 mg/m3 (0.6 to 6.9 ppm). The authors attributedindoor carbon monoxide concentrations to nearby traffic density,general urban pollution, seasonal differences and day-to-day weatherconditions. Indoor sources were not reported.
Toxic levels of carbon monoxide were also found in measure-ments at six ice skating rinks (Johnson et al., 1975b). This study wasprompted by the reporting of symptoms of headache and nauseaamong 15 children who patronized one of the rinks. Carbon monoxideconcentrations were found to be as high as 350 mg/m3 (304 ppm)during operation of a propane-powered ice-resurfacing machine.Depending on skating activity levels, the ice-resurfacing operationwas performed for 10 min every 1–2 h. Because this machine wasfound to be the main source of carbon monoxide, using catalyticconverters and properly tuning the engine greatly reduced emissionsof carbon monoxide and, hence, reduced carbon monoxideconcentrations. Similar findings have been reported by Spengler et al.(1978), Lévesque et al. (1990), Paulozzi et al. (1993) and Lee et al.(1994).
5.2.5 Carbon monoxide exposures inside vehicles
Studies of carbon monoxide concentrations inside automobileshave also been reported over the past decade.
Petersen & Sabersky (1975) measured pollutants inside an auto-mobile under typical driving conditions. Carbon monoxide concentra-tions were generally less than 29 mg/m3 (25 ppm), with one 3-minpeak of 52 mg/m3 (45 ppm). Average concentrations inside the vehiclewere similar to those outside. No in-vehicle carbon monoxide sourceswere noted; however, a commuter’s exposure is usually determined byother high-emitting vehicles, not by the driven vehicle itself (Chan etal., 1989; Shikiya et al., 1989).
Drowsiness, headache and nausea were reported by eightchildren who had ridden in school buses for about 2 h while travellingon a ski trip (Johnson et al., 1975a). The students reporting symptomswere seated in the rear of the bus, which had a rear-mounted engineand a leaky exhaust. The exhaust system was subsequently repaired.During a later ski outing for students, carbon monoxideconcentrations were also monitored for a group of 66 school buses in
Environmental Levels and Personal Exposures
81
the parking lot. The investigators found 5 buses with carbonmonoxide concentrations of 6–29 mg/m3 (5–25 ppm) (mean 17 mg/m3
[15 ppm]), 24 buses showing concentrations in excess of 10 mg/m3
(9 ppm) for short periods and 2 buses showing up to 3 times the 10mg/m3 (9 ppm) level for short periods. Drivers were advised to parkso that exhausts from one bus would not be adjacent to the fresh airintake for another bus.
During a US cross-country trip in the spring of 1977, Chaney(1978) measured in-vehicle carbon monoxide concentrations. Thecarbon monoxide levels varied depending on traffic speed. Onexpressways in Chicago, Illinois, San Diego, California, and LosAngeles, California, when traffic speed was less than 16 km/h, carbonmonoxide concentrations exceeded 17 mg/m3 (15 ppm). Levelsincreased to 52 mg/m3 (45 ppm) when traffic stopped. In addition, itwas observed that heavily loaded vehicles (e.g., trucks) produced highcarbon monoxide concentrations inside nearby vehicles, especiallywhen the trucks were ascending a grade.
Colwill & Hickman (1980) measured carbon monoxide concen-trations in 11 new cars as they were driven on a heavily traffickedroute in and around London, United Kingdom. The inside meancarbon monoxide level for the 11 cars was 28.9 mg/m3 (25.2 ppm),whereas the outside mean level was 53.8 mg/m3 (47.0 ppm).
In a study mandated by the US Congress in the 1977 Clean AirAct Amendments, the EPA studied carbon monoxide intrusion intovehicles (Ziskind et al., 1981). The objective was to determinewhether carbon monoxide was leaking into the passenger compart-ments of school buses, police cars and taxis and, if so, how prevalentthe situation was. The study involved 1164 vehicles in Boston,Massachusetts, and Denver, Colorado. All vehicles were in use in aworking fleet at the time of testing. The results indicated that all threetypes of vehicles often have multiple (an average of four to five) pointsof carbon monoxide intrusion — worn gaskets, accelerator pedals,rust spots in the trunk, etc. In 58% of the rides lasting longer than 8h, carbon monoxide levels exceeded 10 mg/m3 (9 ppm). Thus, thestudy provided evidence that maintenance and possibly design ofvehicles may be important factors in human exposure to carbonmonoxide.
EHC 213: Carbon Monoxide
82
Petersen & Allen (1982) reported the results of carbon monoxidemeasurements taken inside vehicles under typical driving conditionsin Los Angeles, California, over 5 days in October 1979. They foundthat the average ratio of interior to exterior carbon monoxideconcentrations was 0.92. However, the hourly average interior carbonmonoxide concentrations were 3.9 times higher than the nearestfixed-site measurements. In their analysis of the factors that influenceinterior carbon monoxide levels, they observed that traffic flow andtraffic congestion (stop-and-go) are important, but “comfort state”(i.e., car windows open/closed, fan on/off, etc.) and meteorologicalparameters (i.e., wind speed, wind direction) have little influence onincremental exposures. Another study, carried out in Paris, France(Dor et al., 1995), also showed that the carbon monoxide concentra-tion in cars can be 3 times that of the ambient air. A study in HongKong showed that the same may be true for concentrations in buses(Chan & Wu, 1993).
Flachsbart (1989) investigated the effectiveness of priority laneson a Honolulu, Hawaii, arterial highway in reducing commuter traveltime and exposure to carbon monoxide. The carbon monoxideconcentrations and exposures of commuters in these lanes weresubstantially lower than in the non-priority lanes. Carbon monoxideexposure was reduced approximately 61% for express buses, 28% forhigh-occupancy vehicles and 18% for carpools when compared withthat for regular automobiles. The higher speed associated with prioritylanes helped reduce carbon monoxide exposure. These observationsdemonstrate that carbon monoxide concentrations have a high degreeof spatial variability on roadways, associated with vehicle speed andtraffic volume.
Ott et al. (1994) measured carbon monoxide exposures inside acar travelling on a major urban arterial highway in El Camino Realin the USA (traffic volume 30 500–45 000 vehicles per day) over a13.5-month period. For 88 trips, the mean carbon monoxideconcentration was 11.2 mg/m3 (9.8 ppm), with a standard deviationof 6.6 mg/m3 (5.8 ppm).
Fernadenz-Bremauntz & Ashmore (1995a,b) related exposure ofcommuters in vehicles to carbon monoxide to fixed-siteconcentrations at monitoring stations in Mexico City. The ambientlevels were all more than 15 mg/m3 (13 ppm). The highest median
Environmental Levels and Personal Exposures
83
and 90th percentile in-vehicle concentrations were found in autos andminibuses (49–68 and 77–96 mg/m3 [43–59 and 67–84 ppm]), withlower levels in buses (34 and 49 mg/m3 [30 and 43 ppm]), trolleys (30and 44 mg/m3 [26 and 38 ppm]) and metro and light rail (24 and 33mg/m3 [21 and 29 ppm]). Average in-vehicle/ambient ratios for eachmode of transport were as follows: automobile, 5.2; minivan, 5.2;minibus, 4.3; bus, 3.1; trolleybus, 3.0; and metro, 2.2.
Chan et al. (1991) investigated driver exposure to volatileorganic chemicals, carbon monoxide, ozone and nitrogen dioxideunder different urban, rural and interstate highway driving conditionsusing four different cars in Raleigh, North Carolina, USA. They foundthat the in-vehicle carbon monoxide concentrations did not vary signi-ficantly between the cars, and they were on average 4.5 times higherthan the ambient carbon monoxide measurements. Car ventilation hadlittle effect on the driver exposures.
Two Finnish studies of personal air pollution exposures ofchildren showed that preschool children who commuted to a day carecentre by bus or car were exposed to considerably higher peak carbonmonoxide levels than children who went to the day care centre bywalking or on a bike (Jantunen et al., 1995) and that the averagecarbon monoxide exposure of schoolchildren in Kuopio, Finland, ina car or bus was 4 times higher than in other microenvironments(Alm et al., 1995).
5.2.6 Carbon monoxide exposures outdoors
Carbon monoxide concentrations in outdoor settings (besidesthose measured at fixed monitoring stations) show considerablevariability. Ott (1971) made 1128 carbon monoxide measurements atoutdoor locations in San Jose, California, USA, at breathing heightover a 6-month period and compared these results with the officialfixed monitoring station data. This study simulated the measurementsof the outdoor carbon monoxide exposures of pedestrians in down-town San Jose by having them carry personal monitoring pumps andsampling bags while walking standardized routes on congested side-walks. If an outdoor measurement was made more than 100 m awayfrom any major street, its carbon monoxide concentration was similar,suggesting the existence of a generalized urban backgroundconcentration in San Jose that was spatially uniform over the city(within a 33-km2 grid) when one is sufficiently far away from mobile
EHC 213: Carbon Monoxide
84
sources. Because the San Jose monitoring station was located near astreet with heavy traffic, it recorded concentrations approximately100% higher than this background value. In contrast, outdoor carbonmonoxide levels from personal monitoring studies of downtownpedestrians were 60% above the corresponding monitoring stationvalues, and the correlation coefficient was low (r = 0.20). Bycollecting the pedestrian personal exposures over 8-h periods, it waspossible to compare the levels with the air quality standards. On 2 of7 days for which data were available, the pedestrian concentrationswere particularly high (15 and 16.3 mg/m3 [13 and 14.2 ppm]) andwere 2–3 times the corresponding levels recorded at the same time(5.0 and 7.1 mg/m3 [4.4 and 6.2 ppm]) at the air monitoring station(Ott & Eliassen, 1973; Ott & Mage, 1975). These results show thatconcentrations to which pedestrians were exposed on downtownstreets could exceed recommended air quality standards, although theofficial air monitoring station record values were significantly lessthan that. It can be argued, however, that not many pedestrians spenda lot of time outdoors walking along downtown sidewalks, and that isone of the important reasons for including realistic human activitypatterns in exposure assessments. It should also be noted that street-level carbon monoxide concentrations have significantly decreasedover the last decade in countries where vehicular emission controlsare in place.
Godin et al. (1972) conducted similar studies in downtownToronto, Ontario, Canada, using 100-ml glass syringes in conjunctionwith NDIR spectrometry. They measured carbon monoxide concentra-tions along streets, inside passenger vehicles and at a variety of otherlocations. Like other investigators, they found that carbon monoxideconcentrations were determined by very localized phenomena. Ingeneral, carbon monoxide concentrations in traffic and along streetswere much higher than those observed at conventional fixed air moni-toring stations. In a subsequent study in Toronto, Wright et al. (1975)used Ecolyzers to measure 4- to 6-min average carbon monoxideconcentrations encountered by pedestrians and street workers andobtained similar results. Levels ranged from 11 to 57 mg/m3 (10 to50 ppm), varying with wind speed and direction, atmosphericstability, traffic density and height of buildings. They also measuredcarbon monoxide concentrations on the sidewalks of a street thatsubsequently was closed to traffic to become a pedestrian mall. Beforethe street was closed, the average concentrations at two intersectionswere 10.8 ± 4.6 mg/m3 (9.4 ± 4.0 ppm) and 9.0 ± 2.2 mg/m3 (7.9 ±
Environmental Levels and Personal Exposures
85
1.9 ppm) (mean, plus or minus standard deviation); after the streetwas closed, the averages dropped to 4.2 ± 0.6 mg/m3 (3.7 ± 0.5 ppm)and 4.6 ± 1.1 mg/m3 (4.0 ± 1.0 ppm), respectively, which wereequivalent to the background level.
A large-scale field investigation was undertaken of carbon mon-oxide concentrations in indoor and outdoor locations in five Califor-nia, USA, cities using personal monitors (Ott & Flachsbart, 1982).For outdoor commercial settings, the average carbon monoxideconcentration was 5 mg/m3 (4 ppm). This carbon monoxide level wasstatistically, but not substantially, greater than the average carbonmonoxide concentration of 2.3 mg/m3 (2 ppm) recordedsimultaneously at nearby fixed monitoring stations.
The Organisation for Economic Co-operation and Development(OECD, 1997) recently published a study of trends and relative con-centrations in Western Europe, the USA and Japan between 1988 and1993, based on the annual maximum 8-h average concentration aturban traffic and urban residential sites. This showed that the averagelevels remained unchanged, but, at the most polluted locations in bothresidential and commercial (heavily trafficked) areas, levels of carbonmonoxide have declined significantly. A short summary of results ofdifferent countries is given in Table 6, as published by the OECD(1997). Carbon monoxide measurements in atmospheric air wereperformed in many countries — for example, at approximately 300sites in Germany using automatic devices.
Investigations in traffic routes of Amsterdam, Netherlands (vanWijnen et al., 1995), using personal air sampling resulted in muchhigher carbon monoxide concentrations in the samples of car driversthan in the personal air samples of cyclists. Similar results from Ger-many were cited.
5.3 Estimating population exposure to carbon monoxide
Accurate estimates of human exposure to carbon monoxide area prerequisite for both a realistic appraisal of the risks posed by thepollutant and the design and implementation of effective controlstrategies. This section discusses the general concepts on which expo-sure assessment is based and approaches for estimating populationexposure to carbon monoxide using exposure models. Because
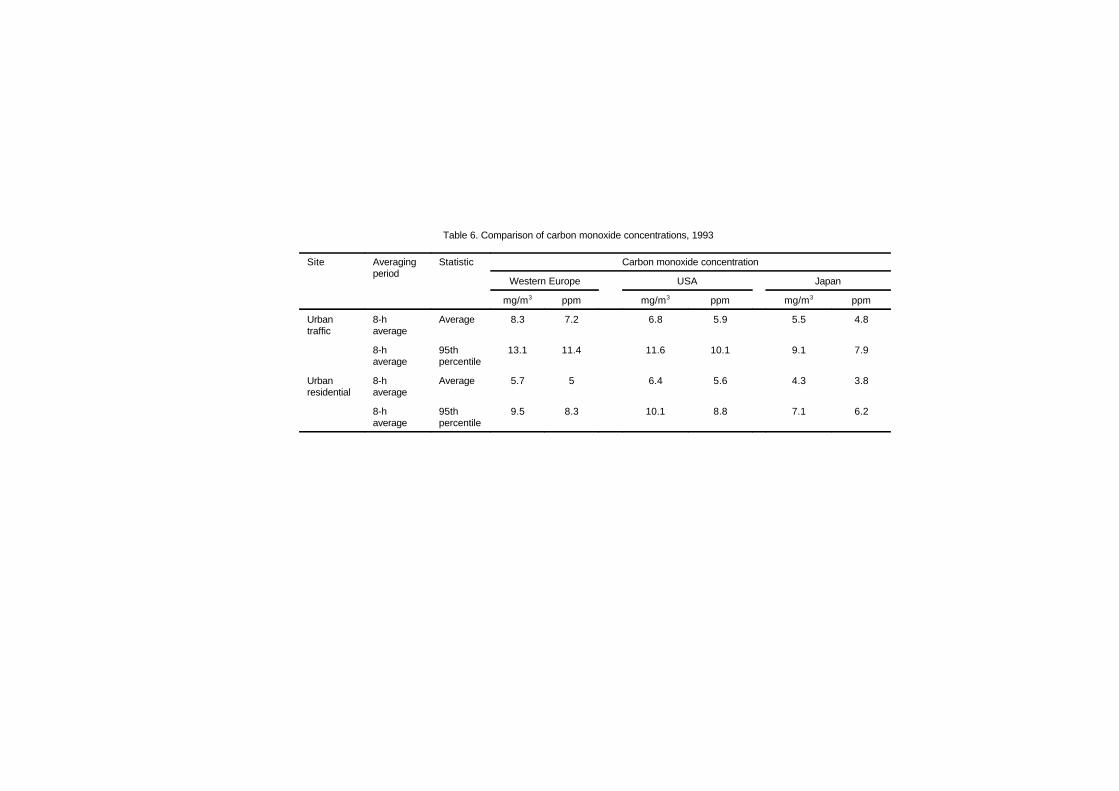
Table 6. Comparison of carbon monoxide concentrations, 1993
Site Averagingperiod
Statistic Carbon monoxide concentration
Western Europe USA Japan
mg/m3 ppm mg/m3 ppm mg/m3 ppm
Urbantraffic
8-haverage
Average 8.3 7.2 6.8 5.9 5.5 4.8
8-haverage
95thpercentile
13.1 11.4 11.6 10.1 9.1 7.9
Urbanresidential
8-haverage
Average 5.7 5 6.4 5.6 4.3 3.8
8-haverage
95thpercentile
9.5 8.3 10.1 8.8 7.1 6.2
Environmental Levels and Personal Exposures
87
of problems in estimating population exposure solely from fixed-station data, several formal human exposure models have beendeveloped. Some of these models include information on humanactivity patterns: the microenvironments people visit and the timesthey spend there. These models also contain submodels depicting thesources and concentrations likely to be found in eachmicroenvironment, including indoor, outdoor and in-transit settings.
5.3.1 Components of exposure
Two aspects of exposure bear directly on the related healthconsequences. The first is the magnitude of the pollutant exposure.The second is the duration of the exposure. The magnitude is animportant exposure parameter, because concentration typically isassumed to be directly proportional to dose and, ultimately, to thehealth outcome. But exposure implies a time component, and it isessential to specify the duration of an exposure. The health risks ofexposure to a specific concentration for 5 min are likely to bedifferent, all other factors being equal, from those of exposure to thesame concentration for an hour.
The magnitude and duration of exposure can be determined byplotting an individual’s air pollution exposure over time. The functionCi(t) describes the air pollutant concentration to which an individualis exposed at any point in time t. Ott (1982) defined the quantity Ci(t)as the instantaneous exposure of an individual. The shaded area underthe graph represents the accumulation of instantaneous exposures oversome period of time (t1 ! t0). This area is also equal to the integral ofthe air pollutant concentration function, Ci(t), between t0 and t1. Ott(1982) defined the quantity represented by this area as the integratedexposure.
The average exposure, calculated by dividing the integratedexposure by the period of integration (t1 ! t0), represents the averageair pollutant concentration to which an individual was exposed overthe defined period of exposure. To facilitate comparison with estab-lished air quality standards, an averaging period is usually chosen toequal the averaging period of the standard. In this case, the averageexposure is referred to as a standardized exposure.
As discussed above, exposure represents the joint occurrence ofan individual being located at point (x,y,z) during time t with the
EHC 213: Carbon Monoxide
88
simultaneous presence of an air pollutant at concentration Cxyz(t).Consequently, an individual’s exposure to an air pollutant is afunction of location as well as time. If a volume at a location can bedefined such that air pollutant concentrations within it are relativelyhomogeneous, yet potentially different from other locations, thevolume may be considered a “microenvironment” (Duan, 1982).Microenvironments may be aggregated by location (e.g., indoor oroutdoor) or activity performed at a location (e.g., residential orcommercial) to form microenvironment types.
It is important to distinguish between individual exposures andpopulation exposures. Sexton & Ryan (1988) defined the pollutantconcentrations experienced by a specific individual during normaldaily activities as “personal” or “individual” exposures. A personalexposure depends on the air pollutant concentrations that are presentin the locations through which the person moves, as well as on thetime spent at each location. Because time–activity patterns can varysubstantially from person to person, individual exposures exhibit widevariability (Dockery & Spengler, 1981; Quackenboss et al., 1982;Sexton et al., 1984; Spengler et al., 1985; Stock et al., 1985; Wallaceet al., 1985). Thus, although it is a relatively straightforwardprocedure to measure any one person’s exposure, many suchmeasurements may be needed to quantify the mean and variance ofexposures for a defined group. The daily activities of a person in timeand space define his or her activity pattern. Accurate estimates of airpollution exposure generally require that an exposure model accountfor the activity patterns of the population of interest. The activitypatterns may be determined through “time budget” studies of thepopulation. Studies of this type have been performed by Szalai (1972),Chapin (1974), Michelson & Reed (1975), Robinson (1977), Johnson(1987) and Schwab et al. (1990). The earlier studies may now be outof date because they were not designed to investigate human exposurequestions and because lifestyles have changed over the past 25 years.Ongoing exposure studies have adopted the diary methods that weredeveloped for sociological investigations and applied them to currentexposure and time budget investigations. A few of these studies havebeen reported (e.g., Johnson, 1987; Schwab et al., 1990).
From a public health perspective, it is important to determine the“population exposure,” which is the aggregate exposure for a specifiedgroup of people (e.g., a community or an identified occupational
Environmental Levels and Personal Exposures
89
cohort). Because exposures are likely to vary substantially betweenindividuals, specification of the distribution of personal exposureswithin a population, including the average value and the associatedvariance, is often the focus of exposure assessment studies. The uppertail of the distribution, which represents those individuals exposed tothe highest concentrations, is frequently of special interest, becausethe determination of the number of individuals who experienceelevated pollutant levels can be critical for health risk assessments.This is especially true for pollutants for which the relationshipbetween dose and response is highly non-linear.
5.3.2 Approaches to exposure modelling
In recent years, the limitations of using fixed-site monitors aloneto estimate public exposure to air pollutants have stimulated interestin using portable monitors to measure personal exposure. These PEMswere developed for carbon monoxide in the late 1970s by EnergeticsScience Incorporated and by General Electric. Wallace & Ott (1982)surveyed PEMs available then for carbon monoxide and other airpollutants.
The availability of these monitors has facilitated use of the directand indirect approaches to assessing personal exposure (see section5.2.2). Whether the direct or indirect approach is followed, theestimation of population exposure requires a “model” — that is, amathematical or computerized approach of some kind. Sexton & Ryan(1988) suggested that most exposure models can be classified as oneof three types: statistical, physical or physical-stochastic.
The statistical approach requires the collection of data on humanexposures and the factors thought to be determinants of exposure.These data are combined in a statistical model, normally a regressionequation or an analysis of variance, to investigate the relationshipbetween air pollution exposure (dependent variable) and the factorscontributing to the measured exposure (independent variables). Anexample of a statistical model is the regression model developed byJohnson et al. (1986) for estimating carbon monoxide exposures inDenver, Colorado, based on data obtained from the Denver PersonalMonitoring Study. If the study group constitutes a representativesample, the derived statistical model may be extrapolated to thepopulation defined by the sampling frame. It should also be noted thatselection of factors thought to influence exposure has a substantial
EHC 213: Carbon Monoxide
90
effect on the outcome of the analysis. Spurious conclusions can bedrawn, for example, from statistical models that include parametersthat are correlated with, but not causally related to, air pollutionexposure.
In the physical modelling approach, the investigator makes ana priori assumption about the underlying physical processes thatdetermine air pollution exposure and then attempts to approximatethese processes through a mathematical formulation. Because themodel is chosen by the investigator, it may produce biased resultsbecause of the inadvertent inclusion of inappropriate parameters orthe improper exclusion of critical components. The National AmbientAir Quality Standards (NAAQS) Exposure Model as originallyapplied to carbon monoxide by Johnson & Paul (1983) is an exampleof a physical model.
The physical-stochastic approach combines elements of both thephysical and statistical modelling approaches. The investigator beginsby constructing a mathematical model that describes the physicalbasis for air pollution exposure. Then, a random or stochasticcomponent that takes into account the imperfect knowledge of thephysical parameters that determine exposure is introduced into themodel. The physical-stochastic approach limits the effect ofinvestigator-induced bias by the inclusion of the random componentand allows for estimates of population distributions for air pollutionexposure. Misleading results may still be produced, however, becauseof poor selection of model parameters. In addition, the requiredknowledge about distributional characteristics may be difficult toobtain. Examples of models based on this approach that have beenapplied to carbon monoxide include the Simulation of Human Activityand Pollutant Exposure model (Ott, 1984; Ott et al., 1988) and twomodels derived from the NAAQS Exposure Model, developed byJohnson et al. (1990).
5.4 Exposure measurements in populations andsubpopulations
5.4.1 Carboxyhaemoglobin measurements in populations
Numerous studies have used the above-described methodologiesto characterize the levels of carboxyhaemoglobin in the general
Environmental Levels and Personal Exposures
91
population. These studies have been designed to determine frequencydistributions of carboxyhaemoglobin levels in the populations beingstudied. In general, the higher the frequency of carboxyhaemoglobinlevels above baseline in non-smoking subjects, the greater theincidence of significant carbon monoxide exposure.
Carboxyhaemoglobin levels in blood donors have been studiedfor various urban populations in the USA. Included have been studiesof blood donors and sources of carbon monoxide in the metropolitanSt. Louis, Missouri, population (Kahn et al., 1974); evaluation ofsmoking and carboxyhaemoglobin in the St. Louis metropolitanpopulation (Wallace et al., 1974); carboxyhaemoglobin analyses of16 649 blood samples provided by the Red Cross Missouri–Illinoisblood donor programme (Davis & Gantner, 1974); a survey of blooddonors for percent carboxyhaemoglobin in Chicago, Illinois,Milwaukee, Wisconsin, New York, New York, and Los Angeles,California (Stewart et al., 1976); a national survey for carboxy-haemoglobin in American blood donors from urban, suburban andrural communities across the USA (Stewart et al., 1974); and thetrend in percent carboxyhaemoglobin associated with vehicular trafficin Chicago blood donors (Stewart et al., 1976). These extensivestudies of volunteer blood donor populations show three main sourcesof exposure to carbon monoxide in urban environments: smoking,general activities (usually associated with internal combustionengines) and occupational exposures. For comparisons of sources, thepopulations are divided into two main groups — smokers and non-smokers. The main groups are often divided further into subgroupsconsisting of industrial workers, drivers, pedestrians and others, forexample. Among the two main groups, smokers show an average of4% carboxyhaemoglobin, with a usual range of 3–8%; non-smokersaverage about 1% carboxyhaemoglobin (Radford & Drizd, 1982).Smoking behaviour generally occurs as an intermittent diurnalpattern, but carboxyhaemoglobin levels can rise to a maximum ofabout 15% in some individuals who chain-smoke. Similar results wereobtained in a more recent study in Bahrain (Madany, 1992) and in astudy in Beijing, People’s Republic of China (Song et al., 1984).
Aside from tobacco smoke, the most significant sources ofpotential exposure to carbon monoxide in the population are commu-nity air pollution, occupational exposures and household exposures(Goldsmith, 1970). Community air pollution comes mainly from
EHC 213: Carbon Monoxide
92
automobile exhaust and has a typical intermittent diurnal pattern.Occupational exposures occur for up to 8 h per day, 5 days per week,producing carboxyhaemoglobin levels generally less than 10%.
More recent studies characterizing carboxyhaemoglobin levels inthe population have appeared in the literature. Turner et al. (1986)used an IL 182 CO-Oximeter to determine percent carboxyhaemo-globin in venous blood of a study group consisting of both smokingand non-smoking hospital staff, inpatients and outpatients. Bloodsamples were collected for 3487 subjects (1255 non-smokers) duringmorning hours over a 5-year period. A detailed smoking history wasobtained at the time of blood collection. Using 1.7% carboxyhaemo-globin as a normal cut-off value, the distribution for the populationstudied showed above-normal results for 94.7% of cigarette smokers,10.3% of primary cigar smokers, 97.4% of those exposed to environ-mental smoke from cigars and 94.7% of those exposed to environmen-tal smoke from pipes.
Zwart & van Kampen (1985) tested a blood supply using aroutine spectrophotometric method for total haemoglobin and for car-boxyhaemoglobin in 3022 samples of blood for transfusion in hospitalpatients in the Netherlands. For surgery patients over a 1-year period,the distribution of percent carboxyhaemoglobin in samples collectedas part of the surgical protocol showed 65% below 1.5% carboxy-haemoglobin, 26.5% between 1.5% and 5% carboxyhaemoglobin,6.7% between 5% and 10% carboxyhaemoglobin and 0.3% in excessof 10% carboxyhaemoglobin. This distribution of percent carboxy-haemoglobin was homogeneous across the entire blood supply,resulting in 1 in 12 patients having blood transfusions at 75%available haemoglobin capacity.
Radford & Drizd (1982) analysed blood carboxyhaemoglobin inapproximately 8400 samples obtained from respondents in the 65geographic areas of the second US National Health and NutritionExamination Survey during the period 1976–1980. When the fre-quency distributions of blood carboxyhaemoglobin levels are plottedon a logarithmic probability scale to facilitate comparison of theresults for different age groups and smoking habits, it is evident thatadult smokers in the USA have carboxyhaemoglobin levels consid-erably higher than those of non-smokers, with 79% of the smokers’blood samples above 2% carboxyhaemoglobin and 27% of the
Environmental Levels and Personal Exposures
93
observations above 5% carboxyhaemoglobin. The nationwide distribu-tions of persons aged 12–74 who have never smoked and who are ex-smokers were similar, with 5.8% of the ex-smokers and 6.4% of thenever-smokers above 2% carboxyhaemoglobin. It is evident that asignificant proportion of the non-smoking US population had bloodlevels above 2% carboxyhaemoglobin. For these two non-smokinggroups, blood levels above 5% were found in 0.7% of the never-smokers and 1.5% of the ex-smokers. It is possible that these highblood levels could be due, in part, to misclassification of somesmokers as either ex- or non-smokers. Children aged 2–11 had lowercarboxyhaemoglobin levels than the other groups, with only 2.3% ofthe children’s samples above 2% carboxyhaemoglobin and 0.2%above 5% carboxyhaemoglobin.
Wallace & Ziegenfus (1985) utilized available data from thesecond National Health and Nutrition Examination Survey to analysethe relationship between measured carboxyhaemoglobin levels and theassociated 8-h carbon monoxide concentrations at nearby fixed moni-tors. Carboxyhaemoglobin data were available for a total of 1658 non-smokers in 20 cities. The authors concluded that fixed outdoor carbonmonoxide monitors alone are, in general, not providing useful esti-mates of carbon monoxide exposure of urban residents.
5.4.2 Breath measurements in populations
In a study by Wallace (1983) in which breath measurements ofcarbon monoxide were used to detect an indoor air problem,65 workers in an office had been complaining for some months oflate-afternoon sleepiness and other symptoms, which they attributedto the new carpet. About 40 of the workers had their breath tested forcarbon monoxide on a Friday afternoon and again on a Mondaymorning. The average breath carbon monoxide levels decreased from26 mg/m3 (23 ppm) on Friday to 8 mg/m3 (7 ppm) on Mondaymorning, indicating a work-related condition. Non-working fans inthe parking garage and broken fire doors were identified as the causeof the problem.
Wald et al. (1981) obtained measurements of percent carboxy-haemoglobin for 11 749 men, aged 35–64, who attended a medicalcentre in London, United Kingdom, for comprehensive health screen-ing examinations between 11:00 a.m. and 5:00 p.m. The time ofsmoking for each cigarette, cigar or pipe smoked since waking was

EHC 213: Carbon Monoxide
94
recorded at the time of collection of a venous blood sample. Percentcarboxyhaemoglobin was determined using an IL 181 CO-Oximeter.Using 2% carboxyhaemoglobin as a normal cut-off value, 81% ofcigarette smokers, 35% of cigar and pipe smokers and 1% of non-smokers were found to be above normal. An investigation ofcarboxyhaemoglobin and alveolar carbon monoxide was conducted ona subgroup of 187 men (162 smokers and 25 non-smokers). Threesamples of alveolar air were collected at 2-min intervals within 5 minof collecting venous blood for carboxyhaemoglobin estimation.Alveolar air was collected by having the subject hold his breath for20 s and then exhale through a 1-m glass tube with an internaldiameter of 17 mm and fitted with a 3-litre anaesthetic bag at thedistal end. Air at the proximal end of the tube was considered to bealveolar air, and a sample was removed by a small side tube located5 mm from the mouthpiece. The carbon monoxide content wasmeasured using an Ecolyzer. The instrumental measurement is basedon detection of the oxidation of carbon monoxide to carbon dioxide bya catalytically active electrode in an aqueous electrolyte. The mean ofthe last two readings to the nearest 0.29 mg/m3 (0.25 ppm) wasrecorded as the alveolar carbon monoxide concentration. Subjectsreporting recent alcohol consumption were excluded, because ethanolin the breath affects the response of the Ecolyzer. A linear regressionequation of percent carboxyhaemoglobin on alveolar carbon monoxidelevel had a correlation coefficient of 0.97, indicating that acarboxyhaemoglobin level could be estimated reliably from analveolar carbon monoxide level.
Honigman et al. (1982) determined alveolar carbon monoxideconcentrations by end-expired breath analysis for athletes (joggers).The group included 36 non-smoking males and 7 non-smokingfemales, all conditioned joggers, covering at least 34 km per week forthe previous 6 months in the Denver, Colorado, area. The participantsexercised for a 40-min period each day over one of three definedcourses in the Denver urban environment (elevation 1610 m).Samples of expired air were collected and analysed before start ofexercise, after 20 min and again at the end of the 40-min exerciseperiod. Heart rate measurements at 20 min and 40 min were 84 and82% of mean age-predicted maxima, respectively, indicating exercisein the aerobic range. Relative changes in carbon monoxideconcentrations in expired air were plotted and compared with carbonmonoxide concentrations in ambient air measured at the time of
Environmental Levels and Personal Exposures
95
collecting breath samples. Air and breath samples were analysedusing an MSA Model 70. Relative changes in expired end-air carbonmonoxide based on the concentration of carbon monoxide in breathbefore the start of exercise were plotted in terms of the ambient airconcentrations measured during the exercise period, at both 20 and40 min of exercise. For ambient concentrations of carbon monoxidebelow 7 mg/m3 (6 ppm), the aerobic exercise served to decrease therelative amount of expired end-air carbon monoxide compared withthe concentration measured before the start of exercise. For ambientconcentrations in the range of 7–8 mg/m3 (6–7 ppm), there was no netchange in the carbon monoxide concentrations in the expired air. Forambient air concentrations in excess of 8 mg/m3 (7 ppm), the aerobicexercise resulted in relative increases in expired carbon monoxide,with the increases after 40 min being greater than similar increasesobserved at the 20-min measurements. Sedentary controls at themeasurement stations showed no relative changes. Thus, aerobicexercise, as predicted by the physiological models of uptake andelimination, is shown to enhance transport of carbon monoxide,thereby decreasing the time to reach equilibrium conditions.
Verhoeff et al. (1983) surveyed 15 identical residences that usednatural gas for cooking and geyser units for water heating. Carbonmonoxide concentrations in the flue gases were measured using anEcolyzer (2000 series). The flue gases were diluted to the dynamicrange of the instrument for carbon monoxide (determined by Draegertube analyses for carbon dioxide dilution to 2.0–2.5%). Breathsamples were collected from 29 inhabitants by having each participanthold a deep breath for 20 s and exhale completely through a glasssampling tube (225-ml volume). The sampling tube was stopperedand taken to a laboratory for analysis of carbon monoxide contentusing a gas–liquid chromatograph (Hewlett-Packard 5880A). Theoverall coefficient of variation for sampling and analysis was 7%,based on results of previous measurements. No significant differenceswere observed for non-smokers as a result of their cooking ordishwashing activities using the natural gas fixtures. There was aslight increase in carbon monoxide in expired air for smokers, but thismay be due to the possibility of increased smoking during the dinnerhour.
Wallace et al. (1984) reported data on measurements of expiredend-air carbon monoxide and comparisons with predicted valuesbased on personal carbon monoxide measurements for populations in
EHC 213: Carbon Monoxide
96
Denver, Colorado, and Washington, DC. Correlations between breathcarbon monoxide and preceding 8-h average carbon monoxide expo-sures were high (0.6–0.7) in both cities. Correlation coefficients werecalculated for 1-h to 10-h average personal carbon monoxideexposures in 1-h increments; the highest correlations occurred at7–9 h. However, breath carbon monoxide levels showed no relation-ship with ambient carbon monoxide measurements at the nearestfixed-station monitor.
A major large-scale study employing breath measurements ofcarbon monoxide was carried out by the US EPA in Washington, DC,and Denver, Colorado, in the winter of 1982–83 (Hartwell et al.,1984; Johnson, 1984; Wallace et al., 1984, 1988; Akland et al., 1985).In Washington, DC, 870 breath samples were collected from 812participants; 895 breath samples were collected from 454 Denverparticipants (two breath samples on 2 consecutive days in Denver).All participants also carried personal monitors to measure theirexposures over a 24-h period in Washington, DC, or a 48-h period inDenver. The subjects in each city formed a probability samplerepresenting 1.2 million adult non-smokers in Washington, DC, and500 000 adult non-smokers in Denver.
The distributions of breath levels in the two cities appeared to beroughly lognormal, with geometric means of 6.0 mg carbon monox-ide/m3 (5.2 ppm) for Denver and 5.0 mg carbon monoxide/m3
(4.4 ppm) for Washington, DC. Geometric standard deviations wereabout 1.8 mg/m3 (1.6 ppm) for each city. Arithmetic means were8.1 mg/m3 (7.1 ppm) for Denver and 6.0 mg/m3 (5.2 ppm) forWashington, DC.
Of greater regulatory significance is the number of people whosecarboxyhaemoglobin levels exceeded the value of 2.1%, because theUS EPA has determined that the current 10 mg/m3 (9 ppm), 8-haverage standard would keep more than 99.9% of the most sensitivenon-smoking adult population below this level of protection (FederalRegister, 1985). An alveolar carbon monoxide concentration of about11 mg/m3 (10 ppm) would correspond to a carboxyhaemoglobin levelof 2%. The percentage of people with measured breath valuesexceeding this level was about 6% in Washington, DC. This percen-tage was increased to 10% when the correction for the effect of roomair was applied. Of course, because the breath samples were taken on
Environmental Levels and Personal Exposures
97
days and at times when carbon monoxide levels were not necessarilyat their highest level during the year, these percentages are lowerlimits of the estimated number of people who may have incurredcarboxyhaemoglobin levels above 2%. Yet the two central stations inWashington, DC, recorded a total of one exceedance of the 10 mg/m3
(9 ppm) standard during the winter of 1982–83. Models based onfixed-station readings would have predicted that an exceedingly tinyproportion of the Washington, DC, population received exposuresexceeding the standard. Therefore, the results from the breath mea-surements indicated that a much larger portion of both Denver andWashington, DC, residents were exceeding 2% carboxyhaemoglobinthan was predicted by models based on fixed-station measurements.
It should also be noted that the number of people with measuredmaximum 8-h exposures exceeding the EPA outdoor standard of10 mg/m3 (9 ppm) was only about 3.5% of the Washington, DC,subjects. This value appears to disagree with the value of 10%obtained from the corrected breath samples. However, the personalmonitors used in the study were shown to experience several differentproblems, including a loss of response associated with battery dis-charge towards the end of the 24-h monitoring period, which causedthem to read low just at the time the breath samples were beingcollected. Therefore, Wallace et al. (1988) concluded that the breathmeasurements were correct and the personal air measurements werebiased low. The importance of including breath measurements infuture exposure and epidemiology studies is indicated by this study.
Hwang et al. (1984) described the use of expired air analysis forcarbon monoxide in an emergency clinical setting to diagnose thepresence and extent of carbon monoxide intoxication. The subjectswere 47 Korean patients brought in for emergency treatment whoshowed various levels of consciousness: alertness (11), drowsiness(21), stupor (7), semicoma (5), coma (1) and unknown (2). The studygroup included 16 males, aged 16–57, and 31 females, aged 11–62.Exposure durations ranged from 2 to 10 h, with all exposuresoccurring in the evening and nighttime hours. The source of carbonmonoxide was mainly charcoal fires used for cooking and heating. Inorder to estimate carbon monoxide concentrations in expired air, adetector tube (Gastec 1La containing potassium palladosulfite as botha reactant and colour-change indicator for the presence of carbonmonoxide on silica gel) was fitted to a Gastec manual sampling pump.
EHC 213: Carbon Monoxide
98
One stroke of the sampling plunger represents 100 ml of air. A 100-ml sample of expired air was collected by inserting a detector tube ata nostril and slowly pulling back the plunger for one full stroke forexpired air. A 10-ml sample of venous blood was also collected at thistime for determining percent carboxyhaemoglobin using a CO-Oximeter. The subjects showed signs of acute intoxication, and signi-ficant relationships were found between carbon monoxide levels inexpired air and percent carboxyhaemoglobin.
Cox & Whichelow (1985) analysed end-exhaled air (collectedover approximately the last half of the exhalation cycle) for carbonmonoxide concentrations for a random population of 168 adults —69 smokers and 99 non-smokers. The results were used to evaluate theinfluence of home heating systems on exposures to and absorption ofcarbon monoxide. Ambient indoor concentrations of carbon monoxidewere measured in the homes of study subjects. The subjects included86 men and 82 women, ranging in age from 18 to 74. Interviews wereusually conducted in the living room of the subject’s home. The typeof heating system in use was noted, and the indoor air concentrationof carbon monoxide was measured using an Ecolyzer. After theambient indoor carbon monoxide level was determined, a breathsample was collected from the subject. The subject was asked to holda deep breath for 20 s and then to exhale completely into a trilaminateplastic bag. The bag was fitted to the port of the Ecolyzer, and thecarbon monoxide content of the exhaled air was measured. Forsmokers, the time since smoking their last cigarette and the numberof cigarettes per day were noted. For non-smokers, there was a strongcorrelation between carbon monoxide levels in ambient air and carbonmonoxide levels in expired air. With smokers, the correlation wasstrongest with the number of cigarettes smoked per day. The data alsosupported the supposition that smokers are a further source of ambientcarbon monoxide in the indoor environment.
Lambert et al. (1988) compared carbon monoxide levels in breathwith carboxyhaemoglobin levels in blood in 28 subjects (including2 smokers). Breath carbon monoxide was collected using the standardtechnique developed by Jones et al. (1958): maximal inspiration wasfollowed by a 20-s breath-hold, and the first portion of the expiredbreath was discarded. Excellent precision (± 0.23 mg/m3 [± 0.2 ppm])was obtained in 35 duplicate samples. Blood samples were collectedwithin 15 min of the breath samples using a gas-tight plastic syringe
Environmental Levels and Personal Exposures
99
rinsed with sodium heparin. Carboxyhaemoglobin was measuredusing an IL 282 CO-Oximeter. Some samples were also measuredusing a gas chromatograph.
By using least squares regression, the null hypothesis of nodifference in the slope and intercept estimates for non-smokers andsmokers was not rejected (i.e., there was no association between bloodcarboxyhaemoglobin and breath carbon monoxide in either non-smokers or smokers).
5.4.3 Subject age
The relationship between age and carboxyhaemoglobin level isnot well established. Kahn et al. (1974) reported that non-smokingsubjects under the age of 19 years had a significantly lower percentcarboxyhaemoglobin than older subjects, but there was no differencein carboxyhaemoglobin between the ages of 20 and 59 years. Kahnet al. (1974) also reported that there was a slight decrease in thecarboxyhaemoglobin levels in non-smoking subjects over the age of60 years. Radford & Drizd (1982) reported that younger subjects,3–11 years old, had lower levels of carboxyhaemoglobin than did theolder age group of 12–74 years. Goldsmith (1970) reported thatexpired carbon monoxide levels were unchanged with age in non-smokers; however, there was a steady decline in the expired carbonmonoxide levels with age in smokers. The decrease in expired carbonmonoxide is disproportionately large for the decrease in carboxy-haemoglobin levels measured by Kahn et al. (1974) in older subjects.Therefore, by comparison of the data from these two studies, it wouldappear that older subjects have higher levels of carboxyhaemoglobinthan predicted from the expired carbon monoxide levels. It is notknown how much of this effect is due to aging of the pulmonarysystem, resulting in a condition similar to that of subjects withobstructive pulmonary disease (see below).
5.4.4 Pulmonary disease
A major potential influence on the relationship between bloodand alveolar partial pressures of carbon monoxide is the presence ofsignificant lung disease. Hackney et al. (1962) demonstrated that theslow increase in exhaled carbon monoxide concentration in arebreathing system peaked after 1.5 min in healthy subjects butrequired 4 min in a subject with lung disease. These findings have
EHC 213: Carbon Monoxide
100
been substantiated by Guyatt et al. (1988), who reported that patientswith pulmonary disease did not have the same relationship betweenpercent carboxyhaemoglobin and breath-hold carbon monoxide con-centrations. The group with pulmonary disease had a forcedexpiratory volume in 1 s (FEV1)/forced vital capacity (FVC) percent-age of <71.5%, whereas the healthy subjects had an FEV1/FVCpercentage of >86%. The linear regression for the healthy group wasCOHb = 0.629 + 0.158(ppm CO); for the pulmonary disease group,the linear regression was COHb = 0.369 + 0.185(ppm CO). Thismeans that at low carbon monoxide levels, individuals with obstruc-tive pulmonary disease would have a lower “alveolar” carbon mon-oxide level for any given percent carboxyhaemoglobin level thanwould the healthy subjects.
5.4.5 Effects of smoking
Studies evaluating the effect of cigarette smoking on end-expiredcarbon monoxide have found a phasic response that depends onsmoking behaviour (Henningfield et al., 1980; Woodman et al.,1987). There is an initial rapid increase in the carbon monoxideconcentration of expired air as a result of smoking. This is followedby a rapid (5-min) decrease after cessation of smoking and a slowdecrease over the 5- to 60-min period after smoking. A comparison ofthe results from one study (Tsukamoto & Matsuda, 1985) showed thatthe carbon monoxide concentration in expired air increases byapproximately 6 mg/m3 (5 ppm) after smoking one cigarette. Thiscorresponds to an increase of 0.67% carboxyhaemoglobin based onblood–breath relationships developed by the authors. Use of cigaretteswith different tar and nicotine yields or the use of filter-tip cigarettesshowed no apparent effect on end-expired carbon monoxideconcentrations (Castelli et al., 1982).
The relationship between breath-hold carbon monoxide andblood carbon monoxide is apparently altered as a result of smoking,making the detection of small changes difficult. Guyatt et al. (1988)showed that smoking one cigarette results in a variable response inthe relationship between breath-hold alveolar carbon monoxidefraction [FACO(Bh)] and carboxyhaemoglobin levels. The range ofFACO(Bh) values for an increase of 1% carboxyhaemoglobin was from!6 to +6 mg/m3 (!5 to +5 ppm). The correlation between the changein FACO(Bh) and the change in carboxyhaemoglobin in 500 subjectswas only 0.705. This r value indicates that only 50% of the change inFACO(Bh) was due to changes in carboxyhaemoglobin. It is not
Environmental Levels and Personal Exposures
101
known how much of this residual error is due to subject complianceor to error in the method. Therefore, the results obtained with breath-holding in smoking subjects should be viewed with caution unlesslarge differences in FACO(Bh) are reported (i.e., considerable cigaretteconsumption is being evaluated).
5.5 Megacities and other major urban areas
Throughout the world, there are large urban areas that haveserious air pollution problems and encompass large land areas andover 10 million people (total population of the 20 megacities in 1990was estimated to be 275 million). The cities that have been designatedas megacities include 2 in North America (Los Angeles, California,USA; New York, New York, USA), 4 in Central and South America(Buenos Aires, Argentina; Mexico City, Mexico; Rio de Janeiro,Brazil; São Paulo, Brazil), 1 in Africa (Cairo, Egypt), 11 in Asia(Bangkok, Thailand; Beijing, People’s Republic of China; Bombay,India; Calcutta, India; Delhi, India; Jakarta, Indonesia; Karachi,Pakistan; Manila, Philippines; Seoul, South Korea; Shanghai,People’s Republic of China; Tokyo, Japan) and 2 in Europe (London,United Kingdom; Moscow, Russia). However, many other cities areheading for megacity status.
Of the 20 megacities studied (WHO/UNEP, 1992; Mage et al.,1996), monitoring capabilities for carbon monoxide have been desig-nated as none or unknown in 9, rudimentary in 1, adequate in 4 andgood in 6 (see Table 7). The air quality for carbon monoxide has beendesignated as no data available or insufficient data for assessment insix; serious problems, WHO guidelines exceeded by more than afactor of 2 in one; moderate to heavy pollution, WHO guidelinesexceeded by up to a factor of 2 (short-term guidelines exceeded on aregular basis at certain locations) in seven; and low pollution, WHOguidelines are normally met (short-term guidelines may be exceededoccasionally) in six (see Table 7).
The problem of air pollution in Mexico City is confounded bygeography. The metropolitan area of Mexico City is located at a meanaltitude of 2240 m and is situated in the Mexican Basin. The reducedoxygen in the air at high altitude causes carbon monoxide emissionsto increase because of incomplete combustion, and it exacerbates thehealth effects attributed to carbon monoxide, especially among highly

EHC 213: Carbon Monoxide
102
Table 7. Overview of carbon monoxide air quality and monitoring capabilities in 20megacitiesa
Megacity Air quality for carbonmonoxideb
Status of monitoringcapabilitiesc
Bangkok, Thailand a B
Beijing, People’s Republicof China
d B
Bombay, India a D
Buenos Aires, Argentina d D
Cairo, Egypt b D
Calcutta, India d D
Delhi, India a D
Jakarta, Indonesia b D
Karachi, Pakistan d D
London, United Kingdom b B
Los Angeles, USA b A
Manila, Philippines d D
Mexico City, Mexico c A
Moscow, Russia b C
New York, USA b A
Rio de Janeiro, Brazil a B
São Paulo, Brazil b A
Seoul, South Korea a A
Shanghai, People’sRepublic of China
d D
Tokyo, Japan a A
a Adapted from WHO/UNEP (1992); Mage et al. (1996).b a = Low pollution, WHO guidelines normally met (short-term guidelines may be
exceeded occasionally). b = Moderate to heavy pollution, WHO guidelines exceeded by up to a factor of 2
(short-term guidelines exceeded on a regular basis at certain locations). c = Serious problem, WHO guidelines exceeded by more than a factor of 2. d = No data available or insufficient data for assessment.c A = Good. B = Adequate. C = Rudimentary. D = None or not known.
Environmental Levels and Personal Exposures
103
susceptible population groups, including children and pregnantwomen.
Data for air quality trends in about 40 countries were collectedin the WHO/United Nations Environment Programme (UNEP) GlobalEnvironmental Monitoring System (GEMS/Air) (UNEP/WHO, 1993).The GEMS/Air programme was terminated in 1995. WHO has set upa successive programme, the Air Management Information System(WHO, 1997a). Summary air quality data for carbon monoxide arecurrently available for many countries, such as Austria, Germany,Greece, Japan, New Zealand and Switzerland. For example, between1986 and 1995, the annual mean carbon monoxide concentrationsranged from 5.1 to 8.4 mg/m3 (4.5 to 7.3 ppm) in Greece, from 0.8 to2.7 mg/m3 (0.7 to 2.4 ppm) in Japan and from 0.9 to 1.9 mg/m3 (0.8to 1.7 ppm) in New Zealand. In Australia, the annual mean carbonmonoxide concentrations from 1988 to 1995 ranged from 0.66 to1.36 mg/m3 (0.58 to 1.19 ppm). Air quality trends for carbonmonoxide over the same period are shown in Fig. 3 for Athens,Greece, Chongqing, People’s Republic of China, Frankfurt, Germany,Johannesburg, South Africa, London, United Kingdom, and LosAngeles, USA.
In a recent report (Eerens et al., 1995), carbon monoxide datafrom 105 cities in 35 European states are given. They include annualaverage 8-h maximum concentrations and number of days exceedingWHO Air Quality Guidelines and twice the WHO Air Quality Guide-lines.
5.6 Indoor concentrations and exposures
Indoor concentrations of carbon monoxide are a function ofoutdoor concentrations, indoor sources (source type, source condition,source use, etc.), infiltration/ventilation and air mixing between andwithin rooms. In residences without sources, average carbonmonoxide concentrations are approximately equal to average outdoorconcentrations at the corresponding elevation, generally decreasingwith height above the ground. Proximity to outdoor sources (i.e.,structures near heavily travelled roadways or with attached garages orparking garages) can have a major impact on indoor carbon monoxideconcentrations.
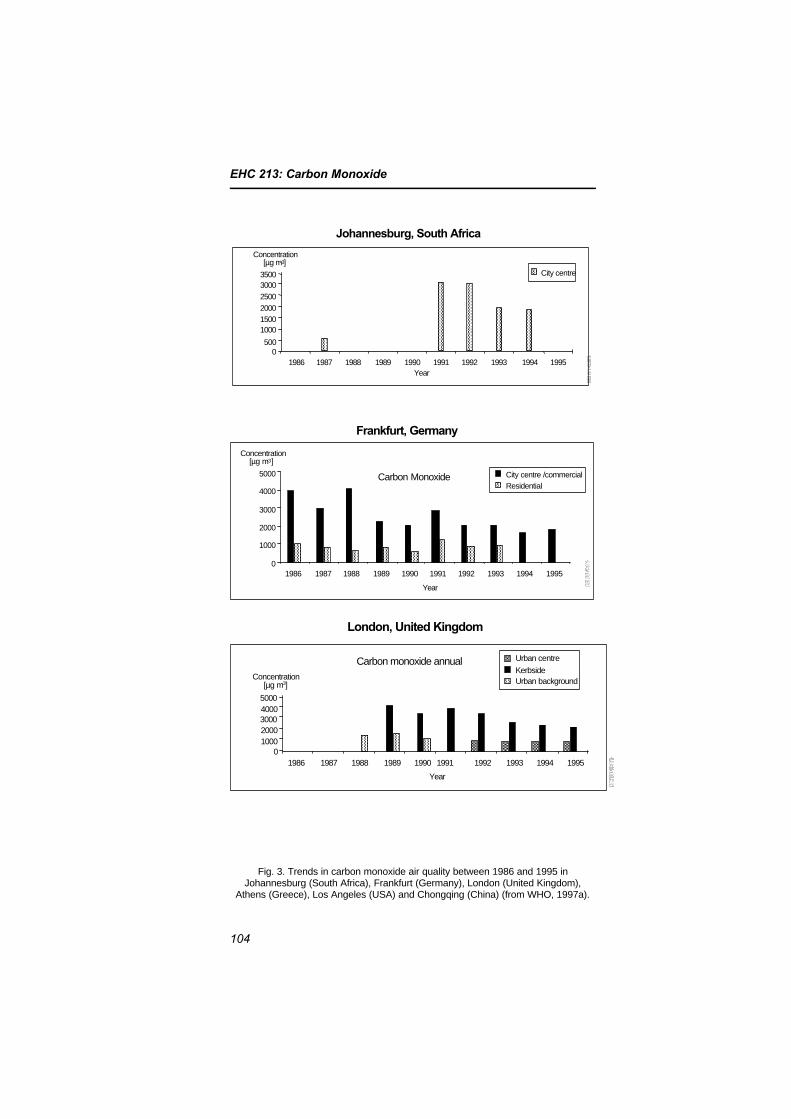
EHC 213: Carbon Monoxide
104
Johannesburg, South Africa
Concentration[µg m-3]
Year
City centre
30003500
2500
200015001000
5000
19871986 1988 1989 1990 19951991 1992 1993 1994
London, United Kingdom
Concentration[µg m-3]
Year
Carbon monoxide annualmeans
5000
01986
Urban centre
Kerbside
4000300020001000
1987 1988 1989 1990 1991 1992 1993 1994 1995
Urban background
5000
Frankfurt, Germany
Concentration[µg m-3]
Year
Carbon Monoxide4000
3000
2000
1000
01986
City centre /commercialResidential
1987 1988 1989 1990 1991 1992 1993 1994 1995
Fig. 3. Trends in carbon monoxide air quality between 1986 and 1995 inJohannesburg (South Africa), Frankfurt (Germany), London (United Kingdom),
Athens (Greece), Los Angeles (USA) and Chongqing (China) (from WHO, 1997a).
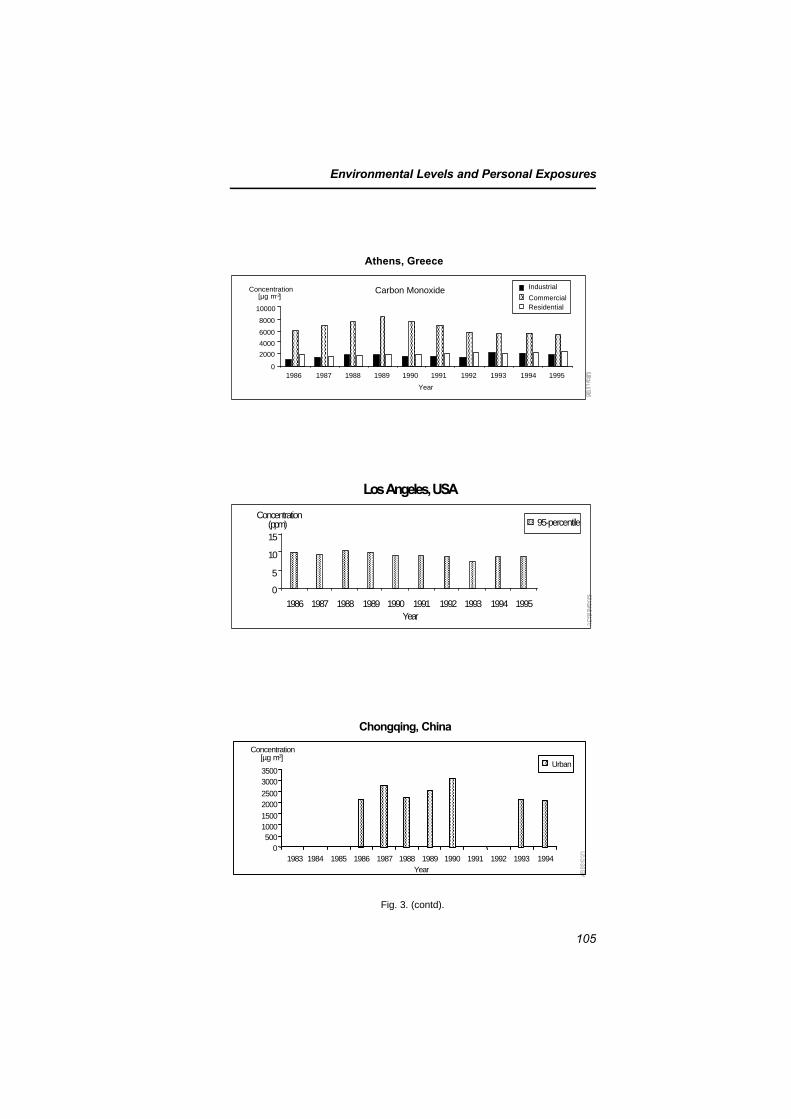
Environmental Levels and Personal Exposures
105
10000
Athens, Greece
Concentration[µg m-3]
Year
Carbon Monoxide
8000
6000
4000
2000
01986 1987 1988 1989 1990 1991 1992 1993 1994 1995
Industrial
CommercialResidential
Los Angeles, USA
Concentration(ppm)
Year
95-percentile
15
10
5
0
19871986 1988 1989 1990 1991 1992 1993 1994 1995
Chongqing, China
Concentration[µg m-3]
Year
Urban
3000
1983
3500
25002000
15001000500
01984 1985 1986 1987 1988 1989 1990 1991 1992 1993 1994
Fig. 3. (contd).
EHC 213: Carbon Monoxide
106
The development of small lightweight and portable electrochemi-cal carbon monoxide monitors over the past decade has permitted themeasurement of personal carbon monoxide exposures and carbonmonoxide concentrations in a number of indoor environments. Theavailable data on indoor carbon monoxide concentrations have beenobtained from total personal exposure studies or studies in whichvarious indoor environments have been targeted for measurements.
The extensive total personal carbon monoxide exposure studiesconducted by the US EPA in Washington, DC, and Denver, Colorado,have shown that the highest carbon monoxide concentrations occur inindoor microenvironments associated with transportation sources(parking garages, cars, buses, etc.). Concentrations in these environ-ments were found to frequently exceed 10 mg/m3 (9 ppm). Studiestargeted towards specific indoor microenvironments have alsoidentified the in-vehicle commuting microenvironment as an environ-ment in which carbon monoxide concentrations frequently exceed10 mg/m3 (9 ppm) and occasionally exceed 40 mg/m3 (35 ppm).Special environments or occurrences (indoor ice skating rinks, officeswhere emissions from parking garages migrate indoors, etc.) havebeen reported where indoor carbon monoxide levels can exceed therecommended air quality guidelines.
A majority of the targeted field studies (see section 5.6.2)monitored indoor carbon monoxide levels as a function of thepresence or absence of combustion sources (gas ranges, unvented gasand kerosene space heaters, wood-burning stoves and fireplaces andtobacco combustion). The results of these studies indicate that thepresence and use of an unvented combustion source result in indoorcarbon monoxide levels above those found outdoors. The associatedincrease in carbon monoxide concentrations can vary considerably asa function of the source, source use, condition of the source andaveraging time of the measurement. Intermittent sources such as gascooking ranges can result in high peak carbon monoxide concen-trations (in excess of 10 mg/m3 [9 ppm]), whereas long-term averageincreases in concentrations (i.e., 24-h) associated with gas ranges areconsiderably lower (on the order of 1.1 mg/m3 [1 ppm]). Thecontribution of tobacco combustion to indoor carbon monoxide levelsis variable. Under conditions of high smoking and low ventilation, thecontribution can be on the order of a few milligrams per cubic metre(parts per million). One study suggested that the contribution to
Environmental Levels and Personal Exposures
107
residential carbon monoxide concentrations of tobacco combustion ison the order of 1.1 mg/m3 (1 ppm), whereas another study showed nosignificant increase in residential carbon monoxide levels.
Unvented or poorly vented combustion sources that are used forsubstantial periods of time (e.g., unvented gas and kerosene spaceheaters) appear to be the major contributors to residential carbonmonoxide concentrations. One extensive study of unvented gas spaceheaters indicated that 12% of the homes had 15-h average carbonmonoxide concentrations greater than 9 mg/m3 (8 ppm), with thehighest concentration at 41.9 mg/m3 (36.6 ppm). Only very limiteddata are available on the contribution of kerosene heaters to theaverage carbon monoxide concentrations in residences, and these dataindicate a much lower contribution than that of gas heaters. Peakcarbon monoxide concentrations associated with both unvented gasand kerosene space heaters can exceed the current ambient 1- and 8-hstandards (40 and 10 mg/m3 [35 and 9 ppm], respectively) inresidences, and, because of the nature of the source (continuous),those peaks tend to be sustained for several hours.
Very limited data on carbon monoxide levels in residences withwood-burning stoves or fireplaces are available. Non-airtight stovescan contribute substantially to residential carbon monoxide concen-trations, whereas airtight stoves can result in small increases. Theavailable data indicate that fireplaces do not contribute measurably toaverage indoor concentrations. No information is available forsamples of residences with leaky flues. In addition, there is noinformation available on short-term indoor carbon monoxide levelsassociated with these sources, nor are there studies that examine theimpact of attached garages on residential carbon monoxideconcentrations.
The available data on short-term (1-h) and long-term (8-h)indoor carbon monoxide concentrations as a function ofmicroenvironments and sources in those microenvironments are notadequate to assess exposures in those environments. In addition, littleis known about the spatial variability of carbon monoxide indoors.These indoor microenvironments represent the most important carbonmonoxide exposures for individuals and as such need to be bettercharacterized.
Concentrations of carbon monoxide in an enclosed environmentare affected by a number of factors in addition to the source factors.
EHC 213: Carbon Monoxide
108
These factors include outdoor concentrations, proximity to outdoorsources (i.e., parking garages or traffic), volume of the space andmixing within and between indoor spaces.
Carbon monoxide measurements in enclosed spaces have beenmade either in support of total personal exposure studies or in targetedindoor studies. In the personal exposure studies, individuals wear themonitors in the course of their daily activities, taking them througha number of different microenvironments. In targeted studies, carbonmonoxide measurements are taken in indoor spaces independent ofthe activities of occupants of those spaces.
5.6.1 Indoor concentrations recorded in personal exposure studies
Three studies have reported carbon monoxide concentrations invarious microenvironments as part of an effort to measure totalhuman exposure to carbon monoxide and to assess the accuracy ofexposure estimates calculated from fixed-site monitoring data. In eachstudy, subjects wore personal carbon monoxide exposure monitors forone or more 24-h periods. Carbon monoxide concentrations wererecorded on data loggers at varying time intervals as a function oftime spent in various microenvironments. Participants kept an activitydiary in which they were asked to record time, activity (e.g., cooking),location (microenvironment type), presence and use of sources (e.g.,smokers or gas stoves) and other pertinent information. Carbonmonoxide concentrations by microenvironment were extracted fromthe measured concentrations by use of the activity diaries.
Two of the studies, conducted in Denver, Colorado, and Wash-ington, DC, by the US EPA (Hartwell et al., 1984; Johnson, 1984;Whitmore et al., 1984; Akland et al., 1985), measured the frequencydistribution of carbon monoxide exposure in a representative sampleof the urban population. The study populations were selected using amultistage sampling strategy. The third study, also conducted inWashington, DC (Nagda & Koontz, 1985), utilized a conveniencesample.
The first-mentioned Washington, DC, study obtained a total of814 person-day samples for 1161 participants, whereas the Denverstudy obtained 899 person-day samples for 485 participants. TheDenver study obtained consecutive 24-h samples for each participant,whereas the Washington, DC, study obtained one 24-h sample for
Environmental Levels and Personal Exposures
109
each participant. Both studies were conducted during the winter of1982–83.
A comparison of carbon monoxide concentrations measured inthe Washington, DC, and Denver studies is shown in Table 8 (fromAkland et al., 1985). Concentrations measured in all microenviron-ments for the Denver study were higher than those for theWashington, DC, study. This is consistent with the finding that dailymaximum 1-h and 8-h carbon monoxide concentrations at outdoorfixed monitoring sites were about a factor of 2 higher in the Denverarea than in the Washington, DC, area during the course of thestudies (Akland et al., 1985). The highest concentrations in bothstudies were associated with indoor parking garages and commuting,whereas the lowest levels were measured in indoor environmentswithout sources of carbon monoxide. Concentrations associated withcommuting are no doubt higher owing to the proximity to and densityof outside carbon monoxide sources (cars, buses and trucks),particularly during commuting hours when traffic is heaviest. Indoorlevels, especially residential levels in the absence of indoor sources,are lower primarily because of the time of day of sampling (non-commuting hours with lower outdoor levels). A more detailedbreakdown of carbon monoxide concentrations by microenvironmentsfor the Denver study is shown in Table 9 (Johnson, 1984).Microenvironments associated with motor vehicles result in thehighest concentrations, with concentrations reaching or exceeding theNAAQS 10 mg/m3 (9 ppm) reference level.
No statistical difference (P > 0.05) in carbon monoxide concen-trations was found between residences with and without gas ranges inthe Washington, DC, study. The results of a similar analysis on theDenver data, according to the presence or absence of selected indoorsources, are shown in Table 10 (Johnson, 1984); in contrast to theWashington, DC, study, the presence of an operating gas stove in theDenver study resulted in a statistically significant increase of2.97 mg/m3 (2.59 ppm). Attached garages, use of gas ranges andpresence of smokers were all shown to result in higher indoor carbonmonoxide concentrations. Concentrations were well below theNAAQS 10 mg/m3 (9 ppm) reference level but were substantiallyabove concentrations in residences without the sources.
In the second Washington, DC, study (Nagda & Koontz, 1985),197 person-days of samples were collected from 58 subjects,
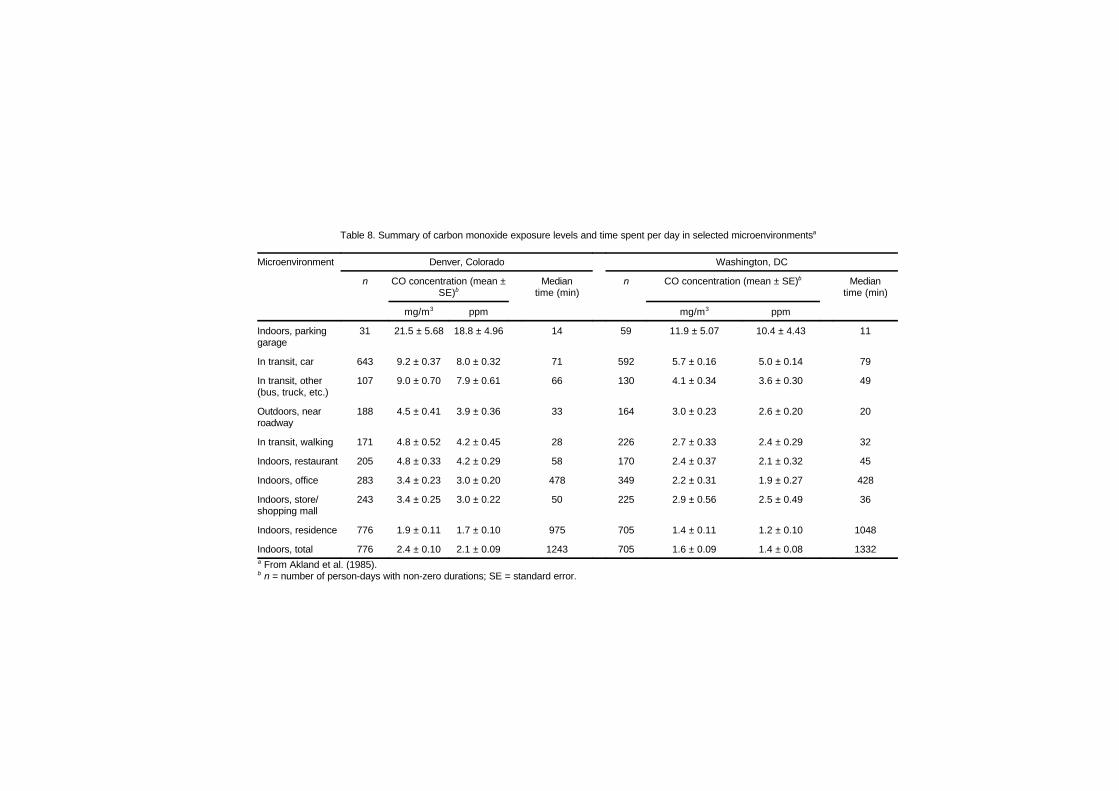
Table 8. Summary of carbon monoxide exposure levels and time spent per day in selected microenvironmentsa
Microenvironment Denver, Colorado Washington, DC
n CO concentration (mean ±SE)b
Mediantime (min)
n CO concentration (mean ± SE)b Mediantime (min)
mg/m3 ppm mg/m3 ppm
Indoors, parkinggarage
31 21.5 ± 5.68 18.8 ± 4.96 14 59 11.9 ± 5.07 10.4 ± 4.43 11
In transit, car 643 9.2 ± 0.37 8.0 ± 0.32 71 592 5.7 ± 0.16 5.0 ± 0.14 79
In transit, other(bus, truck, etc.)
107 9.0 ± 0.70 7.9 ± 0.61 66 130 4.1 ± 0.34 3.6 ± 0.30 49
Outdoors, nearroadway
188 4.5 ± 0.41 3.9 ± 0.36 33 164 3.0 ± 0.23 2.6 ± 0.20 20
In transit, walking 171 4.8 ± 0.52 4.2 ± 0.45 28 226 2.7 ± 0.33 2.4 ± 0.29 32
Indoors, restaurant 205 4.8 ± 0.33 4.2 ± 0.29 58 170 2.4 ± 0.37 2.1 ± 0.32 45
Indoors, office 283 3.4 ± 0.23 3.0 ± 0.20 478 349 2.2 ± 0.31 1.9 ± 0.27 428
Indoors, store/shopping mall
243 3.4 ± 0.25 3.0 ± 0.22 50 225 2.9 ± 0.56 2.5 ± 0.49 36
Indoors, residence 776 1.9 ± 0.11 1.7 ± 0.10 975 705 1.4 ± 0.11 1.2 ± 0.10 1048
Indoors, total 776 2.4 ± 0.10 2.1 ± 0.09 1243 705 1.6 ± 0.09 1.4 ± 0.08 1332a From Akland et al. (1985).b n = number of person-days with non-zero durations; SE = standard error.
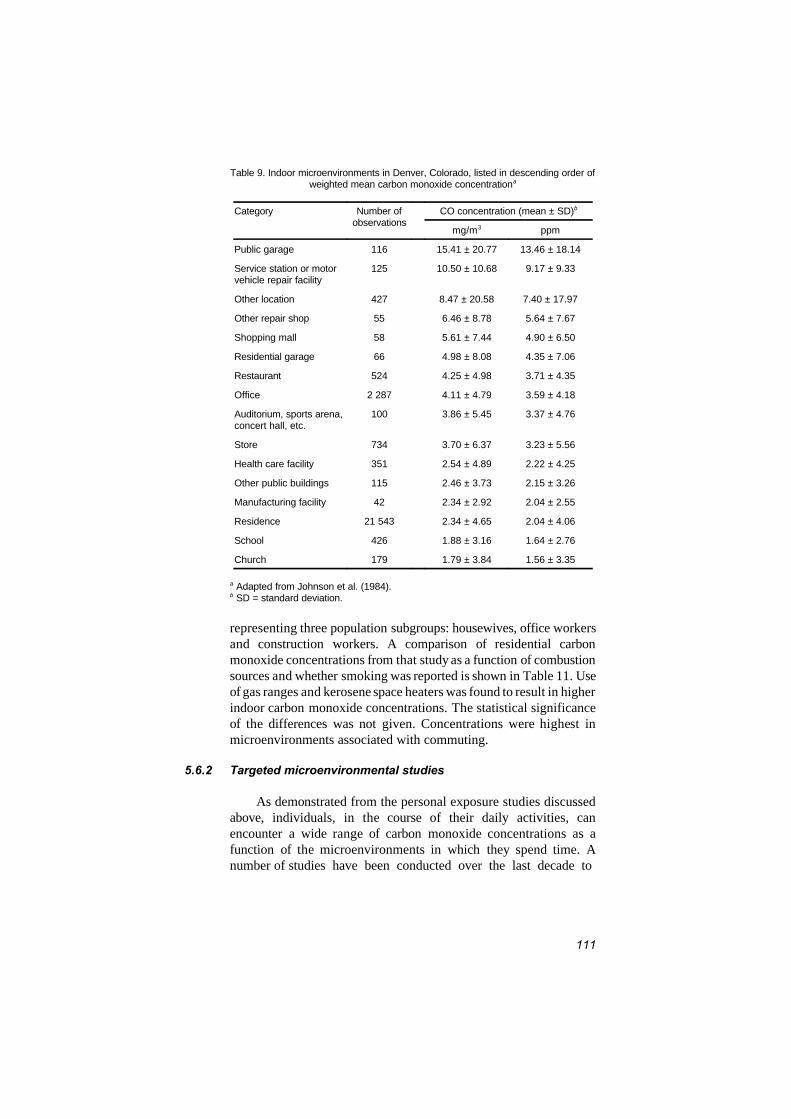
111
Table 9. Indoor microenvironments in Denver, Colorado, listed in descending order ofweighted mean carbon monoxide concentrationa
Category Number ofobservations
CO concentration (mean ± SD)b
mg/m3 ppm
Public garage 116 15.41 ± 20.77 13.46 ± 18.14
Service station or motorvehicle repair facility
125 10.50 ± 10.68 9.17 ± 9.33
Other location 427 8.47 ± 20.58 7.40 ± 17.97
Other repair shop 55 6.46 ± 8.78 5.64 ± 7.67
Shopping mall 58 5.61 ± 7.44 4.90 ± 6.50
Residential garage 66 4.98 ± 8.08 4.35 ± 7.06
Restaurant 524 4.25 ± 4.98 3.71 ± 4.35
Office 2 287 4.11 ± 4.79 3.59 ± 4.18
Auditorium, sports arena,concert hall, etc.
100 3.86 ± 5.45 3.37 ± 4.76
Store 734 3.70 ± 6.37 3.23 ± 5.56
Health care facility 351 2.54 ± 4.89 2.22 ± 4.25
Other public buildings 115 2.46 ± 3.73 2.15 ± 3.26
Manufacturing facility 42 2.34 ± 2.92 2.04 ± 2.55
Residence 21 543 2.34 ± 4.65 2.04 ± 4.06
School 426 1.88 ± 3.16 1.64 ± 2.76
Church 179 1.79 ± 3.84 1.56 ± 3.35
a Adapted from Johnson et al. (1984).b SD = standard deviation.
representing three population subgroups: housewives, office workersand construction workers. A comparison of residential carbonmonoxide concentrations from that study as a function of combustionsources and whether smoking was reported is shown in Table 11. Useof gas ranges and kerosene space heaters was found to result in higherindoor carbon monoxide concentrations. The statistical significanceof the differences was not given. Concentrations were highest inmicroenvironments associated with commuting.
5.6.2 Targeted microenvironmental studies
As demonstrated from the personal exposure studies discussedabove, individuals, in the course of their daily activities, canencounter a wide range of carbon monoxide concentrations as afunction of the microenvironments in which they spend time. Anumber of studies have been conducted over the last decade to
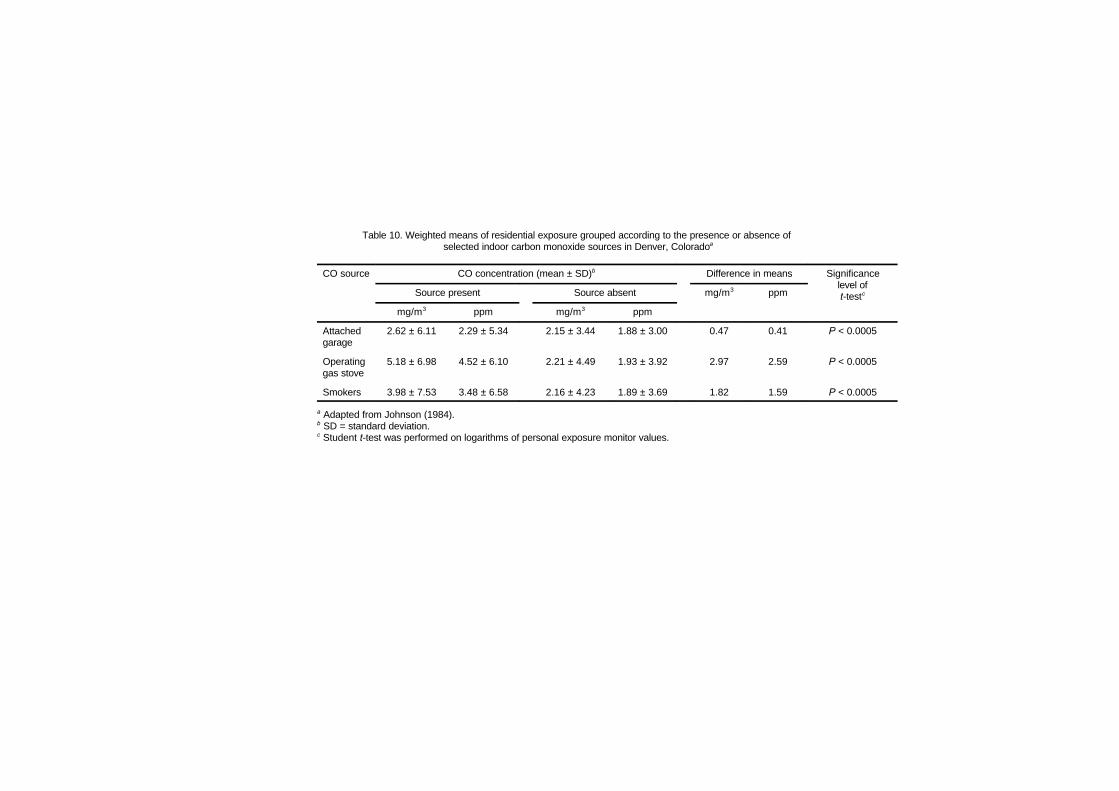
Table 10. Weighted means of residential exposure grouped according to the presence or absence of selected indoor carbon monoxide sources in Denver, Coloradoa
CO source CO concentration (mean ± SD)b Difference in means Significancelevel oft-testcSource present Source absent mg/m3 ppm
mg/m3 ppm mg/m3 ppm
Attachedgarage
2.62 ± 6.11 2.29 ± 5.34 2.15 ± 3.44 1.88 ± 3.00 0.47 0.41 P < 0.0005
Operatinggas stove
5.18 ± 6.98 4.52 ± 6.10 2.21 ± 4.49 1.93 ± 3.92 2.97 2.59 P < 0.0005
Smokers 3.98 ± 7.53 3.48 ± 6.58 2.16 ± 4.23 1.89 ± 3.69 1.82 1.59 P < 0.0005
a Adapted from Johnson (1984).b SD = standard deviation.c Student t-test was performed on logarithms of personal exposure monitor values.
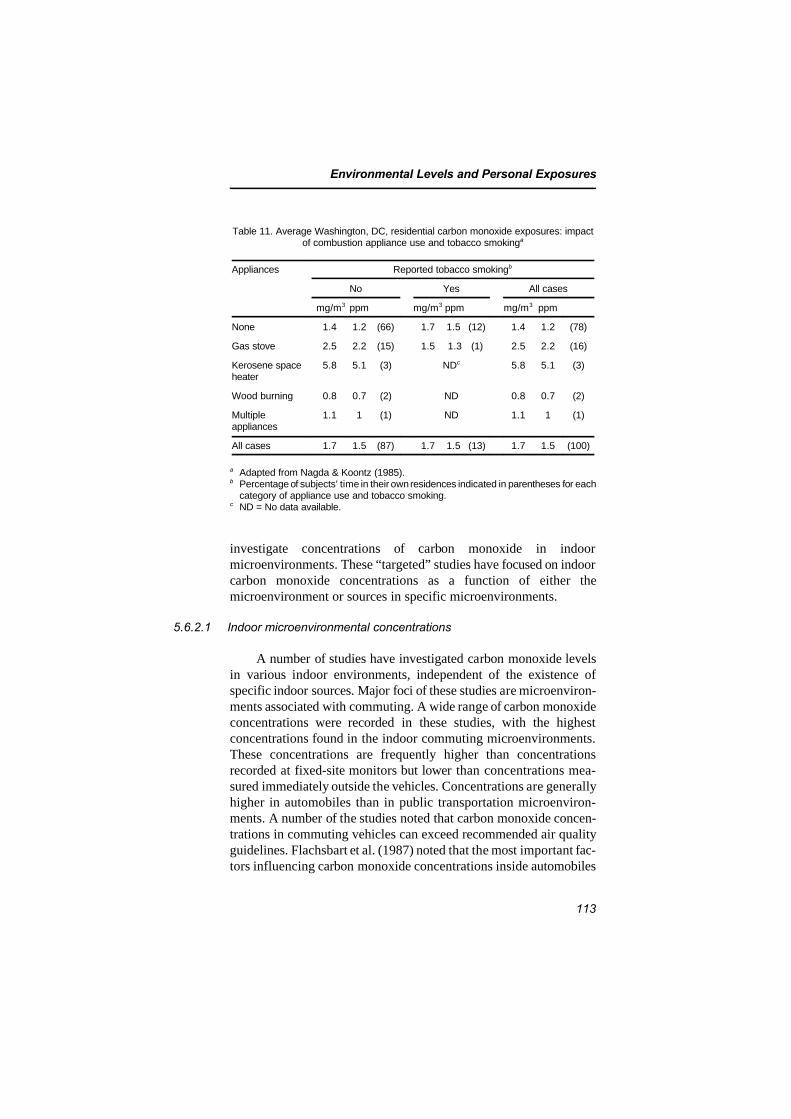
Environmental Levels and Personal Exposures
113
Table 11. Average Washington, DC, residential carbon monoxide exposures: impactof combustion appliance use and tobacco smokinga
Appliances Reported tobacco smokingb
No Yes All cases
mg/m3 ppm mg/m3 ppm mg/m3 ppm
None 1.4 1.2 (66) 1.7 1.5 (12) 1.4 1.2 (78)
Gas stove 2.5 2.2 (15) 1.5 1.3 (1) 2.5 2.2 (16)
Kerosene spaceheater
5.8 5.1 (3) NDc 5.8 5.1 (3)
Wood burning 0.8 0.7 (2) ND 0.8 0.7 (2)
Multipleappliances
1.1 1 (1) ND 1.1 1 (1)
All cases 1.7 1.5 (87) 1.7 1.5 (13) 1.7 1.5 (100)
a Adapted from Nagda & Koontz (1985).b Percentage of subjects’ time in their own residences indicated in parentheses for each
category of appliance use and tobacco smoking.c ND = No data available.
investigate concentrations of carbon monoxide in indoormicroenvironments. These “targeted” studies have focused on indoorcarbon monoxide concentrations as a function of either themicroenvironment or sources in specific microenvironments.
5.6.2.1 Indoor microenvironmental concentrations
A number of studies have investigated carbon monoxide levelsin various indoor environments, independent of the existence ofspecific indoor sources. Major foci of these studies are microenviron-ments associated with commuting. A wide range of carbon monoxideconcentrations were recorded in these studies, with the highestconcentrations found in the indoor commuting microenvironments.These concentrations are frequently higher than concentrationsrecorded at fixed-site monitors but lower than concentrations mea-sured immediately outside the vehicles. Concentrations are generallyhigher in automobiles than in public transportation microenviron-ments. A number of the studies noted that carbon monoxide concen-trations in commuting vehicles can exceed recommended air qualityguidelines. Flachsbart et al. (1987) noted that the most important fac-tors influencing carbon monoxide concentrations inside automobiles
EHC 213: Carbon Monoxide
114
included link-to-link variability (a proxy for traffic density, vehiclemix and roadway setting), day-to-day variability (a proxy forvariations in meteorological factors and ambient carbon monoxideconcentrations) and time of day. This study noted that with increasedautomobile speed, interior carbon monoxide concentrations decreased,because grams of carbon monoxide emitted per kilometre travelleddecrease with increasing vehicle speed, and the turbulence of vehiclewake increases with increasing vehicle speed.
Service stations, car dealerships, parking garages and officespaces that have attached garages can exhibit high concentrations ofcarbon monoxide as a result of automobile exhaust. In one case(Wallace, 1983), corrective measures reduced office space carbonmonoxide concentrations originating from an attached parking garagefrom 22 mg/m3 (19 ppm) to approximately 5 mg/m3 (4 ppm). In aninvestigation of seven ice skating rinks in the Boston, Massachusetts,area, one study (Spengler et al., 1978) reported exceptionally highaverage carbon monoxide concentrations (61.4 mg/m3 [53.6 ppm]),with a high reading of 220 mg/m3 (192 ppm). Ice-cleaning machinesand poor ventilation were found to be responsible.
Residential and commercial buildings were generally found tohave low concentrations of carbon monoxide, but information isseldom provided on the presence of indoor sources or outdoor levels.
5.6.2.2 Concentrations associated with indoor sources
The major indoor sources of carbon monoxide in residences aregas ranges and unvented kerosene and gas space heaters, withproperly operating wood-burning stoves and fireplaces (non-leakyventing system) and tobacco combustion of secondary importance.Properly used gas ranges (ranges used for cooking and not spaceheating) are used intermittently and thus would contribute to short-term peak carbon monoxide levels indoors but likely would not resultin substantial increases in longer-term average concentrations.Unvented kerosene and gas space heaters typically are used for severalhours at a time and thus are likely to result in sustained higher levelsof carbon monoxide. The improper operation of gas ranges orunvented gas or kerosene space heaters (e.g., low-wick setting forkerosene heaters or yellow-tipping operation of gas ranges) couldresult in substantial increases in indoor carbon monoxide levels.Carbon monoxide levels indoors associated with tobacco combustion
Environmental Levels and Personal Exposures
115
are, based upon source emission data, expected to be low unless thereis a very high smoking density and low ventilation. In the absence ofa leaky flue or leaky fire box, indoor carbon monoxide levels fromfireplaces or stoves should be low, with short peaks associated withcharging the fire when some backdraft might occur.
The majority of studies investigating carbon monoxide concen-trations in residences, as a function of the presence or absence of aknown carbon monoxide source, typically have measured carbonmonoxide concentrations associated with the source’s use over shortperiods (on the order of a few minutes to a few hours). Only twostudies (Koontz & Nagda, 1987; Research Triangle Institute, 1990)have reported long-term average carbon monoxide concentrations(over several hours) as a function of the presence of a carbonmonoxide source for large residential sample sizes, whereas one study(McCarthy et al., 1987) reported longer-term average indoor carbonmonoxide concentrations for a small sample.
1) Average indoor-source-related concentrations
As part of a study to determine the impact of combustion sourceson indoor air quality, a sample of 382 homes in New York State, USA(172 in Onondaga County and 174 in Suffolk County), was monitoredfor carbon monoxide concentrations during the winter of 1986(Research Triangle Institute, 1990). In this study, four combustionsources were examined: gas cooking appliances, unvented kerosenespace heaters, wood-burning stoves and fireplaces and tobaccoproducts.
Gas ranges and kerosene heaters were found to result in smallincreases in average carbon monoxide levels. Use of a wood-burningstove or fireplace resulted in lower average carbon monoxide levels,presumably owing to increased air exchange rates associated with use.The study found no effect on average carbon monoxide levels withtobacco combustion and no difference by location in the residence.
Koontz & Nagda (1987), utilizing census data for sampleselection, monitored 157 homes in 16 neighbourhoods in north-central Texas, USA, over a 9-week period between January and March1985. Unvented gas space heaters were used as the primary means ofheating in 82 residences (13 had one unvented gas space heater, 36had two, and 33 had three or more) and as a secondary heat source in
EHC 213: Carbon Monoxide
116
29 residences (17 had one unvented gas space heater, and 12 had twoor more).
Residences in which unvented gas space heaters are the primaryheat source exhibited the highest carbon monoxide concentrations.Carbon monoxide concentrations were greater than or equal to10 mg/m3 (9 ppm) in 12% of the homes, with the highest concen-tration measured at 41.9 mg/m3 (36.6 ppm). No values were measuredabove 10 mg/m3 (9 ppm) for residences in which an unvented gasspace heater was not used at all or was used as a secondary heatsource. Five of the residences exceeded the 1-h, 40 mg/m3 (35 ppm)level, whereas seven of the residences exceeded the 8-h, 10 mg/m3
(9 ppm) level. Higher carbon monoxide levels were associated withmaltuned unvented gas appliances and the use of multiple unventedgas appliances.
In a study of 14 homes with one or more unvented gas spaceheaters (primary source of heat) in the area of Atlanta, Georgia, USA,McCarthy et al. (1987) measured carbon monoxide levels by con-tinuous NDIR monitors in two locations in the homes (room with theheater and a remote room in the house) and outdoors. One out of the14 unvented gas space heater homes exceeded 10 mg/m3 (9 ppm)during the sampling period. Mean indoor values ranged from 0.30 to10.87 mg/m3 (0.26 to 9.49 ppm) and varied as a function of the usepattern of the heater. Only one of the homes used more than oneheater during the air sampling. Outdoor concentrations ranged from0.34 to 1.8 mg/m3 (0.3 to 1.6 ppm).
Investigations of indoor air pollution by different heating systemsin 16 private houses in Germany (Moriske et al., 1996) showed carbonmonoxide concentrations up to 16 mg/m3 (14 ppm) (98th percentile)during the heating period and up to 4.6 mg/m3 (4.0 ppm) during thenon-heating period in 8 homes with coal burning and open fireplace.In 8 homes with central heating, carbon monoxide concentrationswere up to 2.3 mg/m3 (2.0 ppm) during both heating and non-heatingperiods. In a home on the ground floor of a block of flats with acentral stove in the basement below, carbon monoxide concentrationswere up to 64 mg/m3 (56 ppm) during the heating season.
Environmental Levels and Personal Exposures
117
2) Peak indoor-source-related concentrations
Short-term or peak indoor carbon monoxide concentrationsassociated with specific sources were obtained for a few field studies.In these studies, a wide range of peak carbon monoxideconcentrations was observed in various residences with differentindoor carbon monoxide sources. The highest concentrationsmeasured (>700 mg/m3 [>600 ppm]) were associated with emissionsfrom geysers (water heaters), found in a large study conducted in theNetherlands (Brunekreef et al., 1982). Peak levels of carbon monoxideassociated with gas ranges were from 1.1 mg/m3 (1.0 ppm) to morethan 110 mg/m3 (100 ppm). This broad range is somewhat consistentwith the results of other studies evaluating carbon monoxideemissions from gas ranges. The variability is in part due to thenumber of burners used, flame condition, condition of the burners,etc. As might be expected, radiant kerosene heaters produced highercarbon monoxide concentrations than did convective heaters.Unvented gas space heaters were generally associated with highercarbon monoxide peaks than were gas ranges or kerosene heaters. Asnoted above, the peaks associated with gas or kerosene heaters arelikely to be sustained over longer periods of time because of the longsource-use times.
Test houses have been used by investigators to evaluate theimpact of specific sources, modifications to sources and variations intheir use on residential peak carbon monoxide concentrations.
In one of the earliest investigations of indoor air quality, Wadeet al. (1975) measured indoor and outdoor carbon monoxide levels infour houses that had gas stoves. Indoor concentrations were found tobe 1.7–3.8 times higher than the outdoor levels. Carbon monoxidelevels in one house exceeded 10 mg/m3 (9 ppm), the NAAQSreference level. As part of a modelling study of emissions from a gasrange, Davidson et al. (1987) measured carbon monoxide concentra-tions in three residences. Peak carbon monoxide levels in excess of6 mg/m3 (5 ppm) were measured in one townhouse.
Indoor carbon monoxide levels associated with wood-burningstoves were measured in two test house studies. In one study(Humphreys et al., 1986), indoor carbon monoxide levels associatedwith the use of both airtight (conventional and catalytic) and non-airtight wood heaters were evaluated in a 337-m3 weatherized home.Indoor carbon monoxide concentrations were higher than outdoor
EHC 213: Carbon Monoxide
118
levels for all tests. Conventional airtight stoves produced indoorcarbon monoxide levels typically about 1.1–2.3 mg/m3 (1–2 ppm)above background level, with a peak concentration of 10.4 mg/m3
(9.1 ppm). Use of non-airtight stoves resulted in average indoorcarbon monoxide concentrations 2.3–3.4 mg/m3 (2–3 ppm) aboveoutdoor concentrations, with peak concentrations as high as33.9 mg/m3 (29.6 ppm). In a 236-m3 house (Traynor et al., 1984), fourwood-burning stoves (three airtight and one non-airtight) were tested.The airtight stoves generally resulted in small contributions to bothaverage and peak indoor carbon monoxide levels (0.11–1.1 mg/m3
[0.1–1 ppm] for the average and 0.23–3.1 mg/m3 [0.2–2.7 ppm] forthe peak). The non-airtight stove contributed as much as 10.4 mg/m3
(9.1 ppm) to the average indoor level and 49 mg/m3 (43 ppm) to thepeak.
3) Indoor concentrations related to environmental tobacco smoke
Carbon monoxide has been measured extensively in chamberstudies as a surrogate for environmental tobacco smoke (e.g., Bridge& Corn, 1972; Hoegg, 1972; Weber et al., 1976, 1979a,b; Leadereret al., 1984; Weber, 1984; Clausen et al., 1985). Under steady-stateconditions in chamber studies, where outdoor carbon monoxide levelsare monitored and the tobacco brands and smoking rates are con-trolled, carbon monoxide can be a reasonably good indicator ofenvironmental tobacco smoke and is used as such. Under such cham-ber conditions, carbon monoxide concentrations typically range fromless than 1.1 mg/m3 (1 ppm) to greater than 11 mg/m3 (10 ppm).
A number of field studies have monitored carbon monoxide indifferent indoor environments with and without smoking occupants.Although carbon monoxide concentrations were generally higher inindoor spaces when smoking occurred, the concentrations were highlyvariable. The variability of carbon monoxide production from tobaccocombustion, the variability in the number of cigarettes smoked anddifferences in ventilation and variability of outdoor concentrationsmake it difficult to assess the contribution of tobacco combustion toindoor carbon monoxide concentrations. The chamber studies andfield studies conducted do indicate that under typical smoking condi-tions encountered in residences or offices, carbon monoxide concen-trations can be expected to be above background outdoor levels, butlower than the levels resulting from other unvented combustionsources. In indoor spaces where heavy smoking occurs and in small
Environmental Levels and Personal Exposures
119
indoor spaces, carbon monoxide emissions from tobacco combustionwill be an important contributor to carbon monoxide concentrations.
5.7 Occupational exposure
Carbon monoxide is a ubiquitous contaminant occurring in avariety of occupational settings. The number of persons occupationallyexposed to carbon monoxide in the working environment is greaterthan for any other physical or chemical agent (Hosey, 1970), withestimates as high as 975 000 occupationally exposed at high levels inthe USA (NIOSH, 1972).
Two main sources for background exposures in both occupationaland non-occupational settings appear to be smoking and the internalcombustion engine (NAS, 1969). Also, endogenous carbon monoxidemay be derived from certain halomethanes that are biotransformed bymixed-function oxidases in vivo. Smoking is a personal habit thatmust be considered in evaluating exposure in general, as well as thoseoccurring in workplaces. In addition, work environments are oftenlocated in densely populated areas, and such areas frequently have ahigher background concentration of carbon monoxide compared withless densely populated residential areas. Thus, background exposuresmay be greater during work hours than during non-work hours.
There are several sources other than smoking and the internalcombustion engine that contribute to exposure during work hours.These include contributions to background levels by combustion oforganic materials in the geographic area of the workplace; work inspecific industrial processes that produce carbon monoxide; and expo-sure to halomethanes that give rise to endogenous carbon monoxideduring biotransformation. Therefore, a number of potential sources ofcarbon monoxide should be considered when evaluating the riskassociated with carbon monoxide exposure, including personal habits,living conditions and co-exposure to other potential sources of carbonmonoxide or to xenobiotics that are metabolized to carbon monoxideor that interfere with biotransformation processes. Finally, theparticular vulnerability of specific groups at increased risk because ofsome physiological (pregnancy) or pathological (angina, anaemia,respiratory insufficiency) conditions should be taken into account inthe health surveillance of occupationally exposed workers.
EHC 213: Carbon Monoxide
120
5.7.1 Occupational exposure limits
Elevated concentrations of carbon monoxide occur in numeroussettings, including those at work, at home or in the street. Acuteeffects related to production of anoxia from exposures to carbonmonoxide have historically been a basis for concern. In recent years,however, this concern has grown to include concerns for potentialeffects from chronic exposure as well (Sammons & Coleman, 1974;Rosenstock & Cullen, 1986a,b).
Three kinds of occupational exposure limits are currently utilizedin a number of countries (Table 12). The most common are averagepermissible concentrations for a typical 8-h working day (time-weighted average, TWA), concentrations for short-term exposures,generally of 15-min duration (short-term exposure limit, STEL), andmaximum permissible concentrations not to be exceeded (ceilinglimit).
Whereas some countries do not apply legally binding occupa-tional exposure limits and others refer to maximum allowable concen-trations, threshold limit values (TLVs) are the most widely used andaccepted standards representing “conditions under which it is believedthat nearly all workers may be repeatedly exposed day after daywithout adverse health effects.” In the introduction to the list of TLVspublished by the American Conference of Governmental IndustrialHygienists (ACGIH, 1995), it is also stressed that these limits are notfine lines separating safe from dangerous situations, but ratherguidelines to be used by professionals with a specific training inindustrial hygiene. Moreover, it is recognized that a small percentageof workers may be “unusually responsive to some industrial chemicalsbecause of genetic factors, age, personal habits (smoking, alcohol, orother drugs), medication, or previous exposure. Such workers may notbe adequately protected from adverse health effects at concentrationsat or below the threshold limit. An occupational physician shouldevaluate the extent to which such workers require additionalprotection” (ACGIH, 1995).
A TWA concentration of 29 mg/m3 (25 ppm) has been recom-mended by ACGIH as the TLV for carbon monoxide since 1991. Such
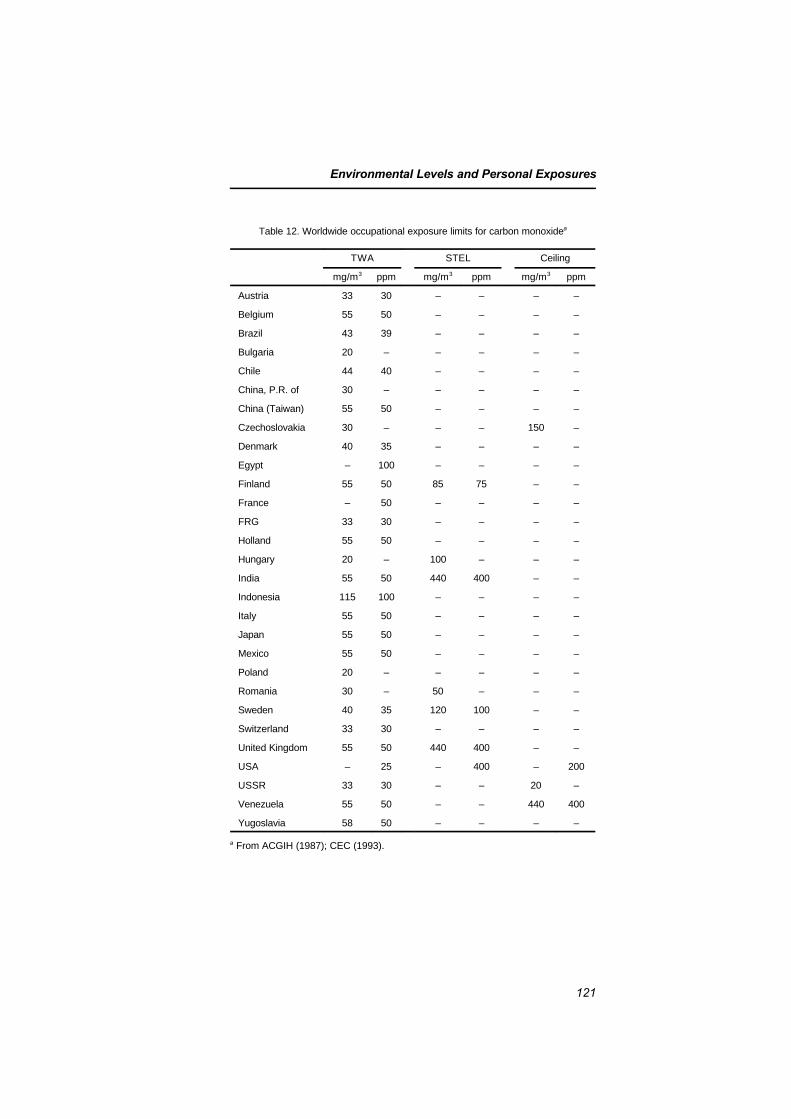
Environmental Levels and Personal Exposures
121
Table 12. Worldwide occupational exposure limits for carbon monoxidea
TWA STEL Ceiling
mg/m3 ppm mg/m3 ppm mg/m3 ppm
Austria 33 30 – – – –
Belgium 55 50 – – – –
Brazil 43 39 – – – –
Bulgaria 20 – – – – –
Chile 44 40 – – – –
China, P.R. of 30 – – – – –
China (Taiwan) 55 50 – – – –
Czechoslovakia 30 – – – 150 –
Denmark 40 35 – – – –
Egypt – 100 – – – –
Finland 55 50 85 75 – –
France – 50 – – – –
FRG 33 30 – – – –
Holland 55 50 – – – –
Hungary 20 – 100 – – –
India 55 50 440 400 – –
Indonesia 115 100 – – – –
Italy 55 50 – – – –
Japan 55 50 – – – –
Mexico 55 50 – – – –
Poland 20 – – – – –
Romania 30 – 50 – – –
Sweden 40 35 120 100 – –
Switzerland 33 30 – – – –
United Kingdom 55 50 440 400 – –
USA – 25 – 400 – 200
USSR 33 30 – – 20 –
Venezuela 55 50 – – 440 400
Yugoslavia 58 50 – – – –
a From ACGIH (1987); CEC (1993).
EHC 213: Carbon Monoxide
122
a limit is likely to be adopted by other countries traditionally relyingon ACGIH-recommended TLVs and by countries relying on therecommended exposure limits (RELs) adopted by the US NationalInstitute for Occupational Safety and Health (NIOSH), currently setat 40 mg/m3 (35 ppm). Although ceiling limits and STELs are notexpressly indicated, general rules advise that exposure levels “mayexceed the TLV-TWA three times for no more than 30 min during awork-day, and under no circumstances should they exceed five timesthe TLV-TWA.” Therefore, a ceiling of 143 mg/m3 (125 ppm) and aSTEL of 86 mg/m3 (75 ppm) may be derived from such a guidance.Biotransformation into carbon monoxide rather than other toxicproperties is the scientific basis for setting the TLV for methylenechloride at 177 mg/m3 (50 ppm).
In addition to ambient monitoring, biomarkers can be used toassess exposure, susceptibility and early effects. Carboxyhaemoglobinis a widely accepted biomarker — or biological exposure index (BEI),according to ACGIH nomenclature — of exposure to carbonmonoxide. The ACGIH has recently proposed a carboxyhaemoglobinlevel of 3.5% as a BEI being most likely reached by a non-smoker atthe end of an 8-h exposure to 29 mg carbon monoxide/m3 (25 ppm)(ACGIH, 1991). The biological tolerance limit (BAT) recommendedby the DFG (1996) is 5% carboxyhaemoglobin, corresponding to acarbon monoxide TWA level of 34 mg/m3 (30 ppm).
Neither the BEI nor the BAT is applicable to tobacco smokers.According to Gilli et al. (1979), a serum thiocyanate level above 3.8mg/litre and a carboxyhaemoglobin level in the range of 2.5–6% area certain indication of cigarette smoking, whereas a thiocyanateconcentration below 3.8 mg/litre and a carboxyhaemoglobin levelabove 5% indicate occupational exposure to carbon monoxide.Tobacco smoking can also be assessed measuring cotinine excretion,but studies relating cotinine in urine to carboxyhaemoglobin are notavailable. An alternative BEI is carbon monoxide concentration inend-expired air collected at the end of the working shift. A concen-tration of 23 mg/m3 (20 ppm) would be reached after exposure to an8-h TWA level of 29 mg/m3 (25 ppm).
It ought to be noted that both BEIs and BATs are usuallyestablished taking into account the relationship between biomarkersand exposure levels rather than the relationship between biomarkersand adverse effects. Therefore, higher carboxyhaemoglobin levels aregenerally accepted for smokers, taking into account the fact that theirhigher levels result from a voluntary habit giving rise to an additional
Environmental Levels and Personal Exposures
123
carbon monoxide burden. However, if adverse effects are expected tooccur as a consequence of carboxyhaemoglobin and carbon monoxidebody burden, then smokers should be advised about their additionalrisk.
NIOSH (1972) observed that “the potential for exposure tocarbon monoxide for employees in the work place is greater than forany other chemical or physical agent” and recommended thatexposure to carbon monoxide be limited to a concentration no greaterthan 40 mg/m3 (35 ppm), expressed as a TWA for a normal 8-hworkday, 5 days per week. A ceiling concentration was alsorecommended at a limit of 230 mg/m3 (200 ppm), not to exceed anexposure time greater than 30 min. Occupational exposures at theproposed concentrations and conditions underlying the basis of thestandard were considered to maintain carboxyhaemoglobin in bloodbelow 5%.
Although it was not stated, the basis of the recommended NIOSHstandard (i.e., maintaining carboxyhaemoglobin below 5% in blood)assumes that (1) the sensitive population group protected by airquality standards would not be occupationally exposed and (2)contributions from other non-occupational sources would also be lessthan a TWA concentration of 40 mg/m3 (35 ppm). It was recognizedthat such a standard may not provide the same degree of protection tosmokers, for example. Other particularly vulnerable groups of workersdeserve special consideration. Among these, pregnant women shouldrequire special protection because of the potentially deleterious effectsof carbon monoxide exposure on the fetuses (NIOSH, 1972). Thesame requirement for safety of pregnant women has been establishedby the DFG (1996).
Although recognizing that biological changes might occur at thelow level of exposure recommended in the proposed standard, NIOSHconcluded that subtle aberrations in the nervous system withexposures producing carboxyhaemoglobin concentrations in blood ator below 5% did not demonstrate significant impairments that wouldcause concern for the health and safety of workers. In addition,NIOSH observed that individuals with impairments that interfere withnormal oxygen delivery to tissues (e.g., emphysema, anaemia,coronary heart disease) may not have the same degree of protection ashave less impaired individuals. It was also recognized that work athigher altitudes (e.g., 1500–2400 m above sea level) would necessitate
EHC 213: Carbon Monoxide
124
decreasing the exposure limit below 40 mg/m3 (35 ppm), tocompensate for a decrease in the oxygen partial pressure as a result ofhigh-altitude environments and a corresponding decrease inoxygenation of the blood (NIOSH, 1972). High-altitude environmentsof concern include airline cabins at a pressure altitude of 1500 m orgreater (NRC, 1986b) and high mountain tunnels (Miranda et al.,1967).
5.7.2 Exposure sources
The contribution of occupational exposures to carbon monoxidecan be separated from other sources of carbon monoxide exposure, butthere are at least two conditions to consider:
(1) When carbon monoxide concentrations at work are higherthan the carbon monoxide equilibrium concentration associ-ated with the percent carboxyhaemoglobin at the start of thework shift, there will be a net absorption of carbon monox-ide and an increase in percent carboxyhaemoglobin. Non-smokers will show an increase that is greater than that forsmokers because they start from a lower baseline carboxy-haemoglobin level. In some cases, non-smokers may showan increase and smokers a decrease in percent carboxy-haemoglobin.
(2) When carbon monoxide concentrations at work are lowerthan the equilibrium concentration necessary to produce theworker’s current level of carboxyhaemoglobin, then thepercent carboxyhaemoglobin will show a decrease. Therewill be a net loss of carbon monoxide at work.
As mentioned above, occupational exposures can stem from threesources: (1) through background concentrations of carbon monoxide,(2) through work in industrial processes that produce carbonmonoxide as a product or by-product and (3) through exposure tosome halomethanes that are metabolized to carbon monoxide in vivo.In addition, work environments that tend to accumulate carbonmonoxide concentrations may result in occupational exposures.Rosenman (1984) lists a number of occupations in which the workersmay be exposed to high carbon monoxide concentrations. This listincludes acetylene workers, blast furnace workers, coke oven workers,diesel engine operators, garage mechanics, steel workers, metal oxide
Environmental Levels and Personal Exposures
125
reducers, miners, nickel refining workers, organic chemical synthesiz-ers, petroleum refinery workers and pulp and paper workers. Inaddition, because methylene chloride is metabolized to carbonmonoxide in the body, aerosol packagers, anaesthetic makers, bitumenmakers, degreasers, fat extractors, flavouring makers, leather finishworkers, oil processors, paint remover makers, resin makers andworkers exposed to dichloromethane-containing solvent mixtures andstain removers can also have high carboxyhaemoglobin levels.
5.7.3 Combined exposure to xenobiotics metabolized to carbonmonoxide
Certain halomethanes, particularly dichloromethane, a frequentlyused organic solvent also known as methylene chloride (reviewed inEHC 164), are metabolized to carbon monoxide, carbon dioxide andchlorine (or iodine or bromine) in a reaction catalysed by cytochromeP-450 2E1.
Combined exposures frequently occur at the workplace, and theirtemporal sequence may result in opposite effects. Concurrent exposureto other substrates of cytochrome P-450 2E1 — including ethanol anda number of common organic solvents, such as benzene and its alkylderivatives, trichloroethylene and acetone — may cause a competitiveinhibition of the oxidation of methylene chloride to carbon monoxide.As the same substances may act as inducers, provided they are nolonger present to compete with methylene chloride, increased rates ofcarbon monoxide formation are expected to occur in peoplechronically exposed to such solvents or to ethanol and then exposedto methylene chloride at the workplace. As a corollary of theseobservations, and taking into account the fact that the carbonmonoxide produced from inhaled dichloromethane rather than theparent compound underlies non-cancer end-points and the fact thatthe carbon monoxide formation rate is modified in a different way byprior and concurrent exposure to other substances, it would seemlogical to rely on the same BEIs proposed for carbon monoxide tomonitor exposure to methylene chloride and other halomethanesrather than on ambient monitoring alone.
5.7.4 Typical studies at the workplace
Aircraft accidents involving 113 aircraft, 184 crew members and207 passengers were investigated to characterize accident toxicology
EHC 213: Carbon Monoxide
126
and to aid in the search for causation of a crash (Blackmore, 1974).Determinations of percent carboxyhaemoglobin in blood samplesobtained from victims enabled differentiation of a variety of accidentsequences involving fires. For example, percent carboxyhaemoglobindeterminations combined with passenger seating information andcrew assignments can help differentiate between fire in flight and fireafter the crash, between survivability of the crash and death due tosmoke inhalation, and between specific malfunctions in equipmentoperated by a particular crew member and defects in space heating inthe crew cabin or passenger compartment. One accident in the serieswas associated with a defective space heater in the crew compartment.Another accident was also suspicious with regard to a space heater.
Carbon monoxide concentrations were used to classify workersfrom 20 foundries into three groups: those with definite occupationalexposure, those with slight exposure and controls (Hernberg et al.,1976). Angina pectoris, electrocardiogram findings and blood pres-sures of foundry workers were evaluated in terms of carbon monoxideexposure for the 1000 workers who had the longest occupationalexposures for the 20 foundries. Angina showed a clear dose–responsewith exposure to carbon monoxide either from occupational sourcesor from smoking, but there was no such trend in electrocardiogramfindings. The systolic and diastolic pressures of carbon monoxide-exposed workers were higher than those for other workers, when ageand smoking habits were considered.
Carboxyhaemoglobin and smoking habits were studied for apopulation of steelworkers and compared with those for blast furnaceworkers as well as employees not exposed at work (Jones & Walters,1962). Carbon monoxide is produced in coke ovens, blast furnacesand sintering operations. Exhaust gases from these operations areoften used for heating and as fuels for other processes. Fifty-sevenvolunteers working in the blast furnace area were studied for smokinghabits, symptoms of carbon monoxide exposure and estimations ofcarboxyhaemoglobin levels by an expired air technique. The mainincrease in carboxyhaemoglobin for blast furnace personnel was 2.0%for both smokers and non-smokers in the group. For smokers in theunexposed control group, there was a decrease in percent carboxy-haemoglobin. A follow-up study found similar results (Butt et al.,1974). Virtamo & Tossavainen (1976) reported a study of carbonmonoxide measurements in air of 67 iron, steel or copper alloy
Environmental Levels and Personal Exposures
127
foundries. Blood carboxyhaemoglobin of iron workers exceeded 6%in 26% of the non-smokers and 71% of the smokers studied.
Poulton (1987) found that a medical helicopter with its enginerunning in a narrowed or enclosed helipad was a source of potentialexposure to carbon monoxide, JP-4 fuel and possibly other combustionproducts for flight crews, medical personnel, bystanders and patientsbeing evacuated. Measurements were made by means of a portableinfrared analyser. Carbon monoxide concentrations were found to begreatest near the heated exhaust. Concentrations ranged from 9 to 49mg/m3 (8 to 43 ppm).
Exhaust from seven of the most commonly used chain-saws(Nilsson et al., 1987) was analysed under laboratory conditions tocharacterize emissions. The investigators conducted field studies onexposures of loggers using chain-saws in felling operations and alsoin limbing and bucking into lengths. In response to an inquiry, 34%of the loggers responded that they often experienced discomfort fromthe exhaust fumes of chain-saws, and another 50% complained ofoccasional problems. Sampling for carbon monoxide exposures wascarried out for 5 days during a 2-week work period in a sparse pinestand at an average wind speed of 0–3 m/s, a temperature range of1–16 °C and a snow depth of 50–90 cm. Carbon monoxide concen-trations ranged from 10 to 23 mg/m3 (9 to 20 ppm), with a mean valueof 20.0 mg/m3 (17.5 ppm). Carbon monoxide concentrationsmeasured under similar, but snow-free, conditions ranged from 24 to44 mg/m3 (21 to 38 ppm), with a mean value of 32 mg/m3 (28 ppm).In another study, carbon monoxide exposures were monitored for non-smoking chain-saw operators; average exposures recorded were from23 to 63 mg/m3 (20 to 55 ppm), with carboxyhaemoglobin levelsranging from 1.5 to 3.0% (Van Netten et al., 1987).
Forklift operators, stevedores and winch operators were moni-tored for carbon monoxide in expired air, using a Mine SafetyAppliances analyser, to calculate percent carboxyhaemoglobin(Breysse & Bovee, 1969). Periodic blood samples were collected tovalidate the calculations. Forklift operators and stevedores, but notwinch operators, work in the holds of ships. The ships to be evaluatedwere selected on the basis of their use of gasoline-powered forklifts foroperations. To evaluate seasonal variations in percent carboxy-haemoglobin, analyses were performed for one 5-day period per
EHC 213: Carbon Monoxide
128
month for a full year. Efforts were made to select a variety of ships forevaluation. In total, 689 determinations of percent carboxyhaemo-globin were made from samples of blood to compare with values fromsamples of expired air. The samples were collected on 51 separatedays involving 26 different ships. Smoking was found to be a majorcontributing factor to the percent carboxyhaemoglobin levels found.Carboxyhaemoglobin values for non-smokers indicated that the useof gasoline-powered lifts in the holds of the ships did not produce acarbon monoxide concentration in excess of 57 mg/m3 (50 ppm) forup to 8 h as a TWA under the work rules and operating conditions inpractice during the study. Smoking behaviour confounded exposureevaluations.
Carbon monoxide concentrations have been measured in avariety of workplaces where potential exists for accumulation fromoutside sources. Exposure conditions in workplaces, however, aresubstantially different. The methods to be applied, groupcharacteristics, jobs being performed, smoking habits and physicalcharacteristics of the facilities themselves introduce considerablevariety in the approaches used. Typical studies are discussed below.
Wallace (1983) investigated carbon monoxide in air and breathof employees working at various times over a 1-month period in anoffice constructed in an underground parking garage. Carbon monox-ide levels were determined by use of a device containing a proprietarysolid polymer electrolyte to detect electrons emitted in the oxidationof carbon monoxide to carbon dioxide. Variation in carbon monoxidemeasurements in ambient air showed a strong correlation with trafficactivity in the parking garage. Initially, the office carbon monoxidelevels were found to be at a daily average of 21 mg/m3 (18 ppm), withthe average from 12:00 to 4:00 p.m. at 25 mg/m3 (22 ppm) and theaverage from 4:00 to 5:00 p.m. at 41 mg/m3 (36 ppm). Analyses ofexpired air collected from a group of 20 non-smokers working in theoffice showed a strong correlation with concentrations of carbonmonoxide in ambient air and traffic activity. For example, the averagecarbon monoxide in expired air for one series of measurements was26.8 mg/m3 (23.4 ppm), compared with simultaneous measurementsof carbon monoxide concentrations in air of 25–30 mg/m3
(22–26 ppm). After a weekend, carbon monoxide concentrations inbreath on Monday morning were substantially decreased (around8 mg/m3 [7 ppm]), but they rose again on Monday afternoon to equal
Environmental Levels and Personal Exposures
129
the air levels of 14 mg/m3 (12 ppm). Closing fire doors and usingexisting garage fans decreased carbon monoxide concentrations in thegarage offices to 2.3 mg/m3 (2 ppm) or less, concentrations similar tothose for other offices in the complex that were located away from thegarage area.
Carboxyhaemoglobin levels (Ramsey, 1967) were determinedover a 3-month period during the winter for 38 parking garage atten-dants, and the values for carboxyhaemoglobin were compared withvalues from a group of 27 control subjects. Blood samples werecollected by finger stick on Monday mornings at the start of the workweek, at the end of the work shift on Mondays and at the end of thework week on Friday afternoons. Hourly analyses were carried out onthree different weekdays using potassium paladosulfite indicator tubesfor the concentrations of carbon monoxide at three of the six garagesin the study. Hourly levels ranged from 8 to 270 mg/m3 (7 to240 ppm), and the composite mean of the 18 daily averages was67.4 ± 28.5 mg/m3 (58.9 ± 24.9 ppm). Although the Monday versusFriday afternoon values for carboxyhaemoglobin were not signifi-cantly different, there were significant differences between Mondaymorning and Monday afternoon values. Smokers showed higherstarting baseline levels, but there was no apparent difference in netincrease in carboxyhaemoglobin body burden between smokers andnon-smokers. Carboxyhaemoglobin levels for non-smokers rangedfrom a mean of 1.5 ± 0.83% for the morning samples to 7.3 ± 3.46%for the afternoon samples. For smokers, these values were2.9 ± 1.88% for the morning and 9.3 ± 3.16% for the afternoon. Theauthors observed a crude correlation between daily average carbonmonoxide levels in air and carboxyhaemoglobin levels observed fora 2-day sampling period.
In a study of motor vehicle examiners conducted by NIOSH(Stern et al., 1981), carbon monoxide levels of 5–24 mg/m3
(4–21 ppm) TWA were recorded in six outdoor motor vehicleinspection stations. In contrast, the semi-open and enclosed stationshad levels of 11–46 mg/m3 (10–40 ppm) TWA. The levels exceededthe recommended NIOSH standard of 40 mg/m3 (35 ppm) TWA on10% of the days sampled. In addition, all stations experienced peakshort-term levels above 230 mg/m3 (200 ppm).
EHC 213: Carbon Monoxide
130
Carboxyhaemoglobin levels were measured for 22 employees ofan automobile dealership during the winter months when garagedoors were closed and ceiling exhaust fans were turned off (Andrecset al., 1979). Employees subjected to testing included garagemechanics, secretaries and sales personnel. These included 17 malesaged 21–37 and five females aged 19–36. Blood samples werecollected on a Monday morning before the start of work and on Fridayat the end of the work week. Smokers working in the garage areashowed a Monday morning mean carboxyhaemoglobin value of4.87 ± 3.64% and a Friday afternoon mean value of 12.9 ± 0.83%.Non-smokers in the garage showed a corresponding increase incarboxyhaemoglobin, with a Monday morning mean value of1.50 ± 1.37% and a Friday afternoon mean value of 8.71 ± 2.95%.Non-smokers working in areas other than the garage had a Fridayafternoon mean value of 2.38 ± 2.32%, which was significantly lowerthan the mean values for smokers and non-smokers in the garagearea. Environmental concentrations or breathing zone samples forcarbon monoxide were not collected. The authors concluded thatsmokers have a higher baseline level of carboxyhaemoglobin than donon-smokers, but both groups show similar increases in carboxy-haemoglobin during the work week while working in the garage area.The authors observed that the concentrations of carboxyhaemoglobinfound in garage workers were the same as those reported to produceneurological impairment. These results are consistent with thosereported by Amendola & Hanes (1984), who reported some of thehighest indoor levels collected at automobile service stations anddealerships. Concentrations ranged from 18.5–126.9 mg/m3
(16.2–110.8 ppm) in cold weather to 2.5–24.7 mg/m3 (2.2–21.6 ppm)in warm weather.
A group of 34 employees, 30 men and 4 women, working inmultistorey garages was evaluated for exposures to exhaust fumes(Fristedt & Akesson, 1971). Thirteen were service employees workingat street level, and 21 were shop employees working either one storeyabove or one storey below street level. Six facilities were included inthe study. Blood samples were collected on a Friday at four facilities,on Thursday and Friday at another and on a Thursday only at a sixthfacility. The blood samples were evaluated for red blood cell andwhite blood cell counts, carboxyhaemoglobin, lead and *-amino-levulinic acid. Work histories, medical case histories and smokinghabits were recorded. Among the employees evaluated, 11 of24 smokers and 3 of 10 non-smokers complained of discomfort from
Environmental Levels and Personal Exposures
131
exhaust fumes. Smokers complaining of discomfort averaged 6.6%carboxyhaemoglobin, and non-smokers complaining averaged 2.2%carboxyhaemoglobin. The corresponding values for non-complainingworkers averaged 4.2 and 1.1%, respectively.
Air pollution by carbon monoxide in underground garages wasinvestigated as part of a larger study of traffic pollutants in Paris,France (Chovin, 1967). Work conducted between the hours of8:00 a.m. and 10:00 p.m. resulted in exposures in excess of 57 mg/m3
(50 ppm) and up to 86 mg/m3 (75 ppm), on a TWA basis.
As part of a larger study of carbon monoxide concentrations andtraffic patterns in Paris (Chovin, 1967), samples were taken in roadtunnels. There was good correlation between the traffic volumescombined with the lengths of the tunnels and the carbon monoxideconcentrations found. None of the tunnels studied had mechanicalventilation. The average carbon monoxide concentrations in thetunnels were 31 mg/m3 (27 ppm) and 34 mg/m3 (30 ppm) for 1965and 1966, respectively, compared with an average of 27 mg/m3
(24 ppm) in the streets for both years. The average risk for a personworking or walking in a street or tunnel was considered by the authorsto be 3–4 times less than the maximal risk indicated by values forcarbon monoxide from instantaneous air sample measurements. In theUSA, Evans et al. (1988) studied bridge and tunnel workers inmetropolitan New York City, New York. The average carboxyhaemo-globin concentration over the 11 years of study averaged 1.73% fornon-smoking bridge workers and 1.96% for tunnel workers.
In a discussion of factors to consider in carbon monoxide controlof high-altitude highway tunnels, Miranda et al. (1967) reviewed thehistories of several tunnels. Motor vehicles were estimated to emitabout 0.03 kg carbon monoxide/km at sea level. At 3350 m and agrade of 1.64%, emissions were estimated at 0.1 kg/km (for vehiclesmoving upgrade). Tunnels with ventilation are generally designed tocontrol carbon monoxide concentrations at or below 110 mg/m3
(100 ppm). The Holland Tunnel in New York was reported to average74 mg/m3 (65 ppm), with a recorded maximum of 418 mg/m3
(365 ppm) due to a fire. For the Sumner Tunnel in Boston, Massa-chusetts, ventilation is started at carbon monoxide concentrations of110 mg/m3 (100 ppm), and additional fans are turned on and an alarmis sounded at 290 mg/m3 (250 ppm). The average carbon monoxide
EHC 213: Carbon Monoxide
132
concentration is 57 mg/m3 (50 ppm). The Mont Blanc Tunnel is11.6 km long at an average elevation of 1274 m. This tunnel isdesigned to maintain carbon monoxide concentrations at or below110 mg/m3 (100 ppm). The Grand Saint Bernard Tunnel is 5.6 kmlong at an average elevation of 1830 m. The tunnel is designed tomaintain carbon monoxide concentrations at or below 230 mg/m3
(200 ppm). For the tunnel at 3350 m, the authors recommendedmaintaining carbon monoxide concentrations at or below 29 mg/m3
(25 ppm) for long-term exposures and at or below 57 mg/m3 (50 ppm)for peaks of 1-h exposure. The recommendations are based onconsiderations of a combination of hypoxia from lack of oxygen dueto the altitude and stress of carbon monoxide exposures of workersand motorists.
Carbon monoxide exposures of tollbooth operators were studiedalong the New Jersey, USA, Turnpike. The results reported byHeinold et al. (1987) indicated that peak exposures for 1 h rangedfrom 14 to 27 mg/m3 (12 to 24 ppm), with peak 8-h exposures of 7–17mg/m3 (6–15 ppm).
Carboxyhaemoglobin levels were determined for 15 non-smokersat the start, middle and end of a 40-day submarine patrol (Bondiet al., 1978). Values found were 2.1%, 1.7% and 1.7%, respectively.The average carbon monoxide concentration in ambient air was 8mg/m3 (7 ppm). The authors observed that the levels of percentcarboxyhaemoglobin found would not cause significant impairmentof the submariners.
In contrast, Iglewicz et al. (1984) found in a 1981 study thatcarbon monoxide concentrations inside ambulances in New Jerseywere often above the US EPA 8-h standard of 10 mg/m3 (9 ppm). Forexample, measurements made at the head of the stretcher exceeded10 mg/m3 (9 ppm) on nearly 27% of the 690 vehicles tested, with4.2% (29 vehicles) exceeding 40 mg/m3 (35 ppm).
Environmental tobacco smoke has been reviewed (NRC, 1986b)for contributions to air contaminants in airliner cabins and topotential exposures for passengers and flight crew members.Environmental tobacco smoke is described as a complex mixturecontaining many components. Analyses of carbon monoxide contentand particulate matter in cabin air were used as surrogates for the
Environmental Levels and Personal Exposures
133
vapour phases and solid components of environmental tobacco smoke,respectively. A mathematical model was developed and used tocalculate the dilution of contaminants by outside make-up air. Theamount of carbon monoxide in the cabin environment depends on therate and number of cigarettes smoked and on the rate of dilution byoutside make-up air. An additional factor to consider is the influenceof pressure altitude on the absorption of carbon monoxide and othergases. The legal limit for pressure altitude is 2440 m. The partialpressure of oxygen is 16 kPa assuming 20% oxygen in the cabin air,compared with 20 kPa at sea level. It is possible that the absorptionrate for carbon monoxide would be increased under hypobaricconditions.
A study of municipal bus drivers in the San Francisco Bay,California, USA, area by Quinlan et al. (1985) showed a TWA of1.1–26 mg/m3 (1–23 ppm), with a mean TWA of 6.3 mg/m3 (5.5 ppm)and standard deviation of 5.6 mg/m3 (4.9 ppm). The peak exposuresranged from 8 to 54 mg/m3 (7 to 47 ppm), with a mean of 29.0 mg/m3
(25.3 ppm) and standard deviation of 14.3 mg/m3 (12.5 ppm).
Cooke (1986) reported finding no significant increases outsidenormal ranges, compared with the general population, for levels ofblood lead and carboxyhaemoglobin in a group of 13 roadsideworkers. Samples were collected in the afternoon of a workday.Among the subjects, 7 of 13 were smokers and showed percentcarboxyhaemoglobin in blood ranging from 3.0 to 8.8% (mean of5.5%). For non-smokers, percent carboxyhaemoglobin ranged from0.5 to 1.4% (mean of 1.2%). Each smoker had smoked at least onecigarette in the 4 h preceding collection of blood samples. No sampleswere collected before the start of work, and no measurements ofcarbon monoxide in air at the work sites were presented.
134
6. TOXICOKINETICS AND METABOLISM
6.1 Introduction
The binding of carbon monoxide to haemoglobin, producing car-boxyhaemoglobin, decreases the oxygen carrying capacity of bloodand interferes with oxygen release at the tissue level; these two mainmechanisms of action underlie the potentially toxic effects of low-level carbon monoxide exposure. Impaired delivery of oxygen caninterfere with cellular respiration and result in tissue hypoxia.Hypoxia of sensitive tissues, in turn, can affect the function of manyorgans, including the lungs. The effects would be expected to be morepronounced under conditions of stress, as with exercise, for example.Although the principal cause of carbon monoxide-induced toxicity atlow exposure levels is thought to be increased carboxyhaemoglobinformation, the physiological response to carbon monoxide at the cellu-lar level and its related biochemical effects are still not fully under-stood. Other mechanisms of carbon monoxide-induced toxicity havebeen hypothesized and assessed, such as hydroxyl radical production(Piantadosi et al., 1997) and lipid peroxidation (Thom, 1990, 1992,1993) in the brain of carbon monoxide-poisoned rats, but none hasbeen demonstrated to operate at relatively low (near-ambient) carbonmonoxide exposure levels.
6.2 Endogenous carbon monoxide production
In addition to exogenous sources, humans are also exposed tosmall amounts of carbon monoxide produced endogenously. In theprocess of natural degradation of haemoglobin to bile pigments, inconcert with the microsomal reduced nicotinamide adenine dinucleo-tide phosphate (NADPH) cytochrome P-450 reductase, two haemoxygenase isoenzymes, HO-1 and HO-2, catalyse the oxidative break-down of the "-methene bridge of the tetrapyrrol ring of haem, leadingto the formation of biliverdin and carbon monoxide. The major site ofhaem breakdown, and therefore the major organ for production ofendogenous carbon monoxide, is the liver (Berk et al., 1976). Thespleen and the erythropoietic system are other important catabolicgenerators of carbon monoxide. Because the amount of porphyrinbreakdown is stoichiometrically related to the amount ofendogenously formed carbon monoxide, the blood level of carboxy-haemoglobin and the concentration of carbon monoxide in the
Toxicokinetics and Metabolism
135
alveolar air have been used with mixed success as quantitative indicesof the rate of haem catabolism (Landaw et al., 1970; Solanki et al.,1988). Not all endogenous carbon monoxide comes from haemoglobindegradation. Other haemoproteins, such as myoglobin, cytochromes,peroxidases and catalase, contribute approximately 20–25% to thetotal amount of carbon monoxide generated (Berk et al., 1976).Approximately 0.4 ml carbon monoxide/h is formed by haemoglobincatabolism, and about 0.1 ml/h originates from non-haemoglobinsources (Coburn et al., 1964). Metabolic processes other than haemcatabolism contribute only a very small amount of carbon monoxide(Miyahara & Takahashi, 1971). In both males and females, week-to-week variations in carbon monoxide production are greater than day-to-day or within-day variations. Moreover, in females, carboxyhaemo-globin levels fluctuate with the menstrual cycle; the mean rate ofcarbon monoxide production in the premenstrual, progesterone phasealmost doubles (Delivoria-Papadopoulos et al., 1970; Lynch & Moede,1972). Neonates and pregnant women also showed a significantincrease in endogenous carbon monoxide production related toincreased breakdown of red blood cells.
Any disturbance leading to increased destruction of red bloodcells and accelerated breakdown of other haemoproteins would leadto increased production of carbon monoxide. Haematomas, intra-vascular haemolysis of red blood cells, blood transfusion and ineffec-tive erythropoiesis will all elevate the carbon monoxide concentrationin the blood. Degradation of red blood cells under pathologicalconditions such as anaemias (haemolytic, sideroblastic, sickle cell),thalassaemia, Gilbert’s syndrome with haemolysis and other haema-tological diseases will also accelerate carbon monoxide production(Berk et al., 1974; Solanki et al., 1988). In patients with haemolyticanaemia, the carbon monoxide production rate was 2–8 times higherand blood carboxyhaemoglobin concentration was 2–3 times higherthan in normals (Coburn et al., 1966). Increased carbon monoxideproduction rates have been reported after administration of pheno-barbital, progesterone (Delivoria-Papadopoulos et al., 1970) anddiphenylhydantoin (Coburn, 1970).
The biological significance of the haem oxygenases appears to benot limited to the above-mentioned role. Evidence is accumulating tosuggest that the formed carbon monoxide functions as a gaseous sig-nalling molecule (Verma et al., 1993; Sue-Matsu et al., 1994; Vincent
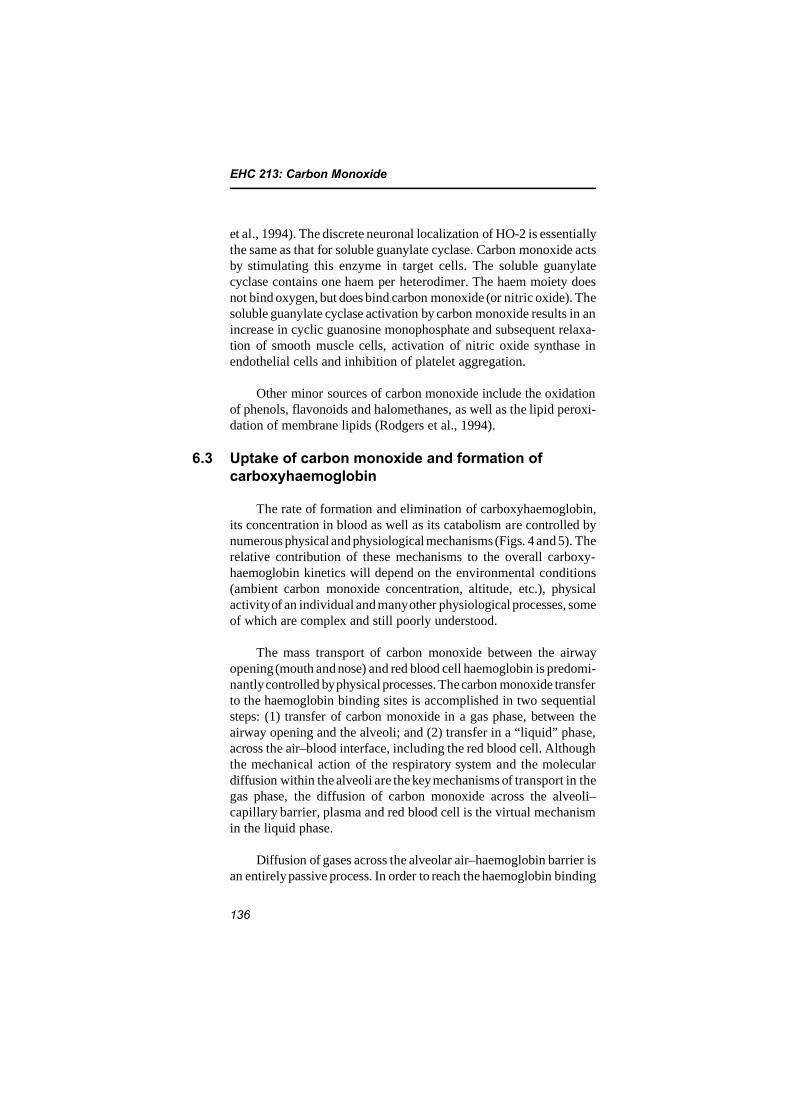
EHC 213: Carbon Monoxide
136
et al., 1994). The discrete neuronal localization of HO-2 is essentiallythe same as that for soluble guanylate cyclase. Carbon monoxide actsby stimulating this enzyme in target cells. The soluble guanylatecyclase contains one haem per heterodimer. The haem moiety doesnot bind oxygen, but does bind carbon monoxide (or nitric oxide). Thesoluble guanylate cyclase activation by carbon monoxide results in anincrease in cyclic guanosine monophosphate and subsequent relaxa-tion of smooth muscle cells, activation of nitric oxide synthase inendothelial cells and inhibition of platelet aggregation.
Other minor sources of carbon monoxide include the oxidationof phenols, flavonoids and halomethanes, as well as the lipid peroxi-dation of membrane lipids (Rodgers et al., 1994).
6.3 Uptake of carbon monoxide and formation ofcarboxyhaemoglobin
The rate of formation and elimination of carboxyhaemoglobin,its concentration in blood as well as its catabolism are controlled bynumerous physical and physiological mechanisms (Figs. 4 and 5). Therelative contribution of these mechanisms to the overall carboxy-haemoglobin kinetics will depend on the environmental conditions(ambient carbon monoxide concentration, altitude, etc.), physicalactivity of an individual and many other physiological processes, someof which are complex and still poorly understood.
The mass transport of carbon monoxide between the airwayopening (mouth and nose) and red blood cell haemoglobin is predomi-nantly controlled by physical processes. The carbon monoxide transferto the haemoglobin binding sites is accomplished in two sequentialsteps: (1) transfer of carbon monoxide in a gas phase, between theairway opening and the alveoli; and (2) transfer in a “liquid” phase,across the air–blood interface, including the red blood cell. Althoughthe mechanical action of the respiratory system and the moleculardiffusion within the alveoli are the key mechanisms of transport in thegas phase, the diffusion of carbon monoxide across the alveoli–capillary barrier, plasma and red blood cell is the virtual mechanismin the liquid phase.
Diffusion of gases across the alveolar air–haemoglobin barrier isan entirely passive process. In order to reach the haemoglobin binding
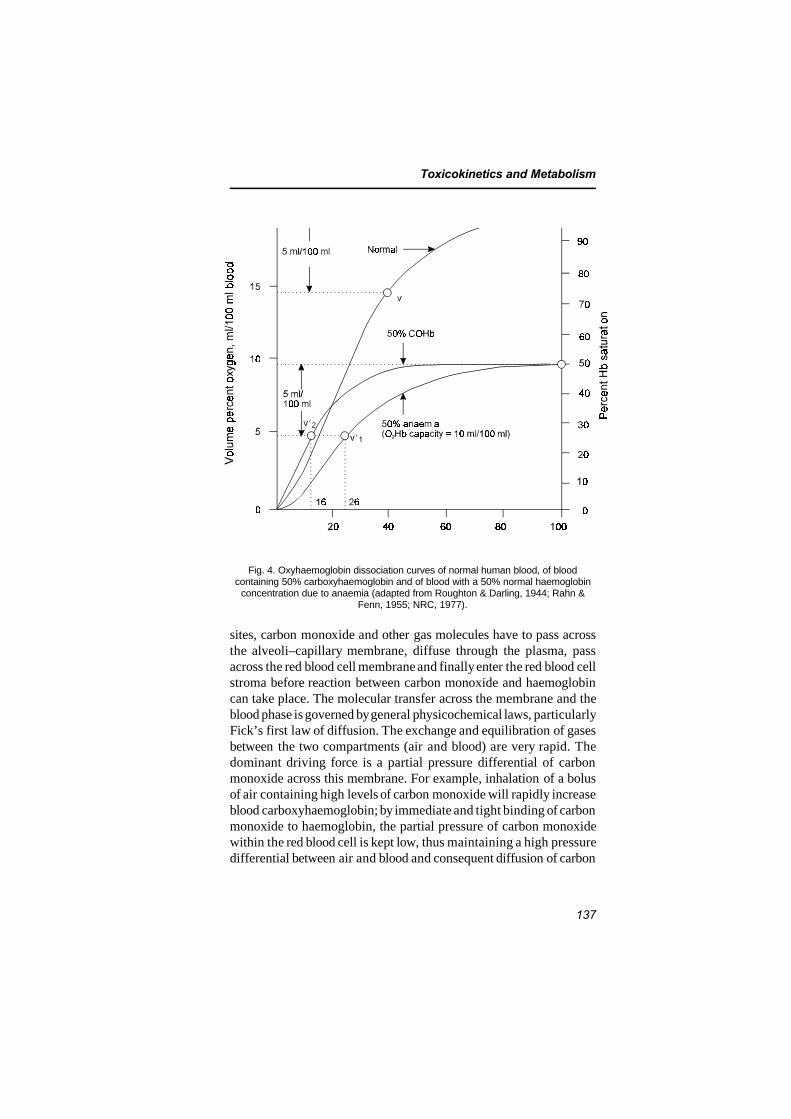
Toxicokinetics and Metabolism
137
Fig. 4. Oxyhaemoglobin dissociation curves of normal human blood, of bloodcontaining 50% carboxyhaemoglobin and of blood with a 50% normal haemoglobin
concentration due to anaemia (adapted from Roughton & Darling, 1944; Rahn &Fenn, 1955; NRC, 1977).
sites, carbon monoxide and other gas molecules have to pass acrossthe alveoli–capillary membrane, diffuse through the plasma, passacross the red blood cell membrane and finally enter the red blood cellstroma before reaction between carbon monoxide and haemoglobincan take place. The molecular transfer across the membrane and theblood phase is governed by general physicochemical laws, particularlyFick’s first law of diffusion. The exchange and equilibration of gasesbetween the two compartments (air and blood) are very rapid. Thedominant driving force is a partial pressure differential of carbonmonoxide across this membrane. For example, inhalation of a bolusof air containing high levels of carbon monoxide will rapidly increaseblood carboxyhaemoglobin; by immediate and tight binding of carbonmonoxide to haemoglobin, the partial pressure of carbon monoxidewithin the red blood cell is kept low, thus maintaining a high pressuredifferential between air and blood and consequent diffusion of carbon
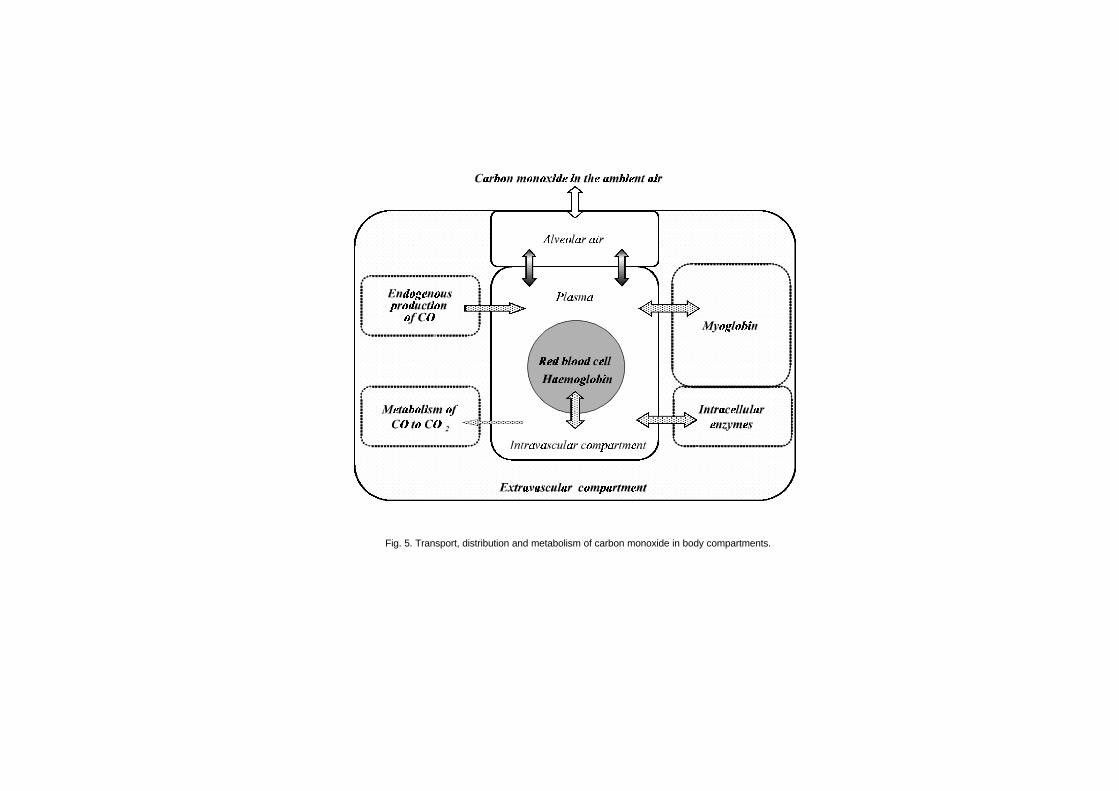
Fig. 5. Transport, distribution and metabolism of carbon monoxide in body compartments.
Toxicokinetics and Metabolism
139
monoxide into blood. Subsequent inhalation of carbon monoxide-freeair progressively decreases the gradient to the point of its reversal(higher carbon monoxide pressure on the blood side than in alveolarair), and carbon monoxide will be released into alveolar air. The air–blood pressure gradient for carbon monoxide is usually much higherthan the blood–air gradient; therefore, the carbon monoxide uptakewill be a proportionally faster process than carbon monoxide elimina-tion. The rate of carbon monoxide release will be further affected bythe products of tissue metabolism. Under pathological conditions,where one or several components of the air–blood interface might beseverely affected, as in emphysema, fibrosis or oedema, both theuptake and elimination of carbon monoxide will be affected.
The rate of diffusion of gases might be altered considerably bymany physiological factors acting concomitantly. Diurnal variationsin carbon monoxide diffusion related to variations in haemoglobinhave been reported in normal healthy subjects (Frey et al., 1987).Others found the changes to be related to physiological factors as well,such as oxyhaemoglobin, carboxyhaemoglobin, partial pressure ofalveolar carbon dioxide, ventilatory pattern, oxygen consumption,blood flow and functional residual capacity (Forster, 1987). It hasbeen confirmed repeatedly that diffusion is body position and ventila-tion dependent. Carbon monoxide diffusion is significantly higher ina supine position at rest than in a sitting position at rest. In bothpositions, carbon monoxide diffusion is greater during exercise thanat rest (McClean et al., 1981). Carbon monoxide diffusion willincrease with exercise, and, at maximum work rates, the diffusion willbe maximal regardless of position. This increase is attained byincreases in both the membrane-diffusing component and the pul-monary capillary blood flow (Stokes et al., 1981). The above physio-logical processes will minimally affect carboxyhaemoglobin formationin healthy individuals exposed to low and relatively uniform levels ofcarbon monoxide. Under such ambient conditions, these factors willbe the most influential during the initial period of carbon monoxidedistribution and exchange. If sufficient time is allowed for equili-bration, the sole determinant of carboxyhaemoglobin concentration inblood will be the ratio of the partial pressures of carbon monoxide(PCO) and oxygen (PO2
). However, the shorter the half-time forequilibration (e.g., due to hyperventilation, high concentration ofcarbon monoxide, increased cardiac output, etc.), the more involvedthese mechanisms will become in modulating the rate of carbon
EHC 213: Carbon Monoxide
140
monoxide uptake (Pace et al., 1950; Coburn et al., 1965). At hightransient carbon monoxide exposures of resting individuals, both thecardiac and the lung function mechanisms will control the rate ofcarbon monoxide uptake. Incomplete mixing of blood might result ina substantial difference between the arterial and venous carboxy-haemoglobin concentrations (Godin & Shephard, 1972). In chronicbronchitics, asthmatics and other subpopulations at risk (pregnantwomen, the elderly, etc.), the kinetics of carboxyhaemoglobinformation will be even more complex, because any abnormalities ofventilation and perfusion and gas diffusion will aggravate carbonmonoxide exchange between blood and air.
Although the rate of carbon monoxide binding with haemoglobinis about one-fifth slower and the rate of dissociation from haemo-globin is an order of magnitude slower than the respective rates foroxygen, the carbon monoxide chemical affinity (represented by theHaldane coefficient, M) for haemoglobin is about 245 (240–250) timesgreater than that for oxygen (Roughton, 1970). One part of carbonmonoxide and 245 parts of oxygen would form equal parts of oxy-haemoglobin and carboxyhaemoglobin (50% of each), which wouldbe achieved by breathing air containing 21% oxygen and 650 mgcarbon monoxide/m3 (570 ppm). Moreover, under steady-state condi-tions (gas exchange between blood and atmosphere remains constant),the ratio of carboxyhaemoglobin to oxyhaemoglobin is proportionalto the ratio of their respective partial pressures. The relationshipbetween the affinity constant M and PO2
and PCO, first expressed byHaldane (1898), has the following form:
COHb/O2Hb = M (PCO/PO2) (6-1)
At equilibrium, when haemoglobin is maximally saturated by oxygenand carbon monoxide at their respective gas tensions, the M value forall practical purposes is independent of pH and 2,3-diphospho-glycerate over a wide range of PCO/PO2
ratios. The M, however, istemperature dependent (Wyman et al., 1982).
Under dynamic conditions, competitive binding of oxygen andcarbon monoxide to haemoglobin is complex; simply said, the greaterthe number of haems bound to carbon monoxide, the greater the affin-ity of free haems for oxygen. Any decrease in the amount of availablehaemoglobin for oxygen transport (carbon monoxide poisoning,bleeding, anaemia, blood diseases, etc.) will reduce the quantity of
Toxicokinetics and Metabolism
141
oxygen carried by blood to the tissue. However, carbon monoxide notonly occupies oxygen binding sites, molecule for molecule, thusreducing the amount of available oxygen, but also alters thecharacteristic relationship between oxyhaemoglobin and PO2
, whichin normal blood is S-shaped. With increasing concentration ofcarboxyhaemoglobin in blood, the dissociation curve is shiftedgradually to the left, and its shape is transformed into that of arectangular hyperbola (Fig. 4). Because the shift occurs over a criticalsaturation range for release of oxygen to tissues, a reduction inoxyhaemoglobin by carbon monoxide poisoning will have more severeeffects on the release of oxygen than the equivalent reduction inhaemoglobin due to anaemia. Thus, in an anaemic patient (50%) ata tissue PO2
of 3.5 kPa (26 torr) (vN1), 5 vol % of oxygen (50%desaturation) might be extracted from blood, the amount sufficient tosustain tissue metabolism. In contrast, in a person poisoned withcarbon monoxide (50% carboxyhaemoglobin), the tissue PO2
will haveto drop to 2.1 kPa (16 torr) (vN2; severe hypoxia) to release the same5 vol % oxygen (Fig. 4). Any higher demand on oxygen under theseconditions (e.g., by exercise) might result in coma of the carbonmonoxide-poisoned individual.
There are over 350 variants to normal human haemoglobin(Zinkham et al., 1980). In the haemoglobin S variant, sickling takesplace when deoxyhaemoglobin S in the red blood cell reaches acritical level and causes intracellular polymerization. Oxygenation ofthe haemoglobin S molecules in the polymer, therefore, should leadto a change in molecular shape, breakup of the polymer andunsickling of the cell. Carbon monoxide was considered at one timeto be potentially beneficial, because it ultimately would reduce theconcentration of deoxyhaemoglobin S by converting part of thehaemoglobin to carboxyhaemoglobin. Exposure to carbon monoxide,however, was not considered to be an effective clinical treatment,because high carboxyhaemoglobin levels (>20%) were required.
Other haematological disorders can cause elevated concentrationsof carboxyhaemoglobin in the blood. Ko & Eisenberg (1987) studieda patient with Waldenström’s macroglobulinaemia. Not only was thecarboxyhaemoglobin saturation elevated, but the half-life of carboxy-haemoglobin was about 3 times longer than in a normal individual.Presumably, exogenous exposure to carbon monoxide, in conjunctionwith higher endogenous carbon monoxide levels, could result incritical levels of carboxyhaemoglobin. However, because carbon
EHC 213: Carbon Monoxide
142
monoxide can also modify the characteristics of unstable haemo-globin, as demonstrated in patients with haemoglobin S, it is notknown how ambient or near-ambient levels of carbon monoxidewould affect individuals with these disorders.
Although the lung in its function as a transport system for gasesis exposed continuously to carbon monoxide, very little carbonmonoxide actually diffuses and is stored in the lung tissue itself,except for the alveolar region. The epithelium of the conductive zone(nasopharynx and large airways) presents a significant barrier todiffusion of carbon monoxide (Guyatt et al., 1981). Therefore,diffusion and gas uptake by the tissue, even at high carbon monoxideconcentrations, will be exceedingly slow; most of this small amountof carbon monoxide will be dissolved in the mucosa of the airways.Diffusion into the submucosal layers and interstitium will depend onthe concentration of carbon monoxide and duration of exposure.Experimental exposures of the orinasal cavity of monkeys to excep-tionally high concentrations of carbon monoxide for a short period oftime increased their blood carboxyhaemoglobin level to only 1.5%.Comparative exposures of the whole lung, however, elevated carboxy-haemoglobin to almost 60% (Schoenfisch et al., 1980). Thus,diffusion of carbon monoxide across the airway mucosa willcontribute extremely little, if at all, to overall carboxyhaemoglobinconcentration. In the transitional zone (#20th generation), where bothconductive and diffusive transport take place, diffusion of carbonmonoxide into lung interstitium will be much easier, and at timesmore complete. In the respiratory zone (alveoli), which is the mosteffective interface for carbon monoxide transfer, diffusion into thelung interstitium will be complete. Because the total lung tissue massis rather small compared with that of other carbon monoxidecompartments, a relatively small amount of carbon monoxide(primarily dissolved carbon monoxide) will be distributed within thelung structures.
The role of myoglobin in oxygen transport is not yet fullyunderstood. Myoglobin as a respiratory haemoprotein of musculartissue will undergo a reversible reaction with carbon monoxide in amanner similar to that of oxygen. The greater affinity of oxygen formyoglobin than for haemoglobin (hyperbolic versus S-shaped dissoci-ation curve) is in this instance physiologically beneficial, because asmall drop in tissue PO2
will release a large amount of oxygen fromoxymyoglobin. It is believed that the main function of myoglobin is
Toxicokinetics and Metabolism
143
to serve as a temporary store of oxygen and act as a diffusion facilita-tor between haemoglobin and the tissues.
Myoglobin has an affinity constant approximately 8 times lowerthan that of haemoglobin (M = 20–40 versus 245, respectively). Aswith haemoglobin, the combination velocity constant between carbonmonoxide and myoglobin is only slightly lower than for oxygen, butthe dissociation velocity constant is much lower than for oxygen. Thecombination of greater affinity (myoglobin is 90% saturated at PO2
of2.7 kPa [20 mmHg]) and lower dissociation velocity constant forcarbon monoxide favours retention of carbon monoxide in the muscu-lar tissue. Thus, a considerable amount of carbon monoxide canpotentially be stored in the skeletal muscle. The ratio of carboxymyo-globin to carboxyhaemoglobin saturation for skeletal muscle of aresting dog and cat has been determined to be 0.4–0.9; for cardiacmuscle, the ratio is slightly higher (0.8–1.2) (Coburn et al., 1973;Sokal et al., 1986). Prolonged exposures did not change this ratio ineither muscle (Sokal et al., 1984). During exercise, the relative rateof carbon monoxide binding increases more for myoglobin than forhaemoglobin, and carbon monoxide will diffuse from blood to skeletalmuscle (Werner & Lindahl, 1980); consequently, the carboxymyo-globin/carboxyhaemoglobin will increase for both skeletal and cardiacmuscles (Sokal et al., 1986). A similar shift in carbon monoxide hasbeen observed under hypoxic conditions, because a fall in intracellularPO2
below a critical level will increase the relative affinity of myo-globin for carbon monoxide (Coburn et al., 1971). Consequent reduc-tion in the oxygen carrying capacity of myoglobin might have aprofound effect on the supply of oxygen to the tissue.
In 1965, Coburn, Forster and Kane developed a differentialequation to describe the major physiological variables that determinethe concentration of carboxyhaemoglobin in blood ([COHb]) for theexamination of the endogenous production of carbon monoxide. Theequation, referred to as the Coburn-Forster-Kane, or CFK, model, isstill much in use today for the prediction of blood carboxyhaemo-globin concentration consequent to inhalation of carbon monoxide(Fig. 6), for two reasons. First, the model is quite robust to challengesto the original assumptions. Second, the model can be relatively easilyadapted to more specialized applications.
Eq. 6-2 represents the CFK model:
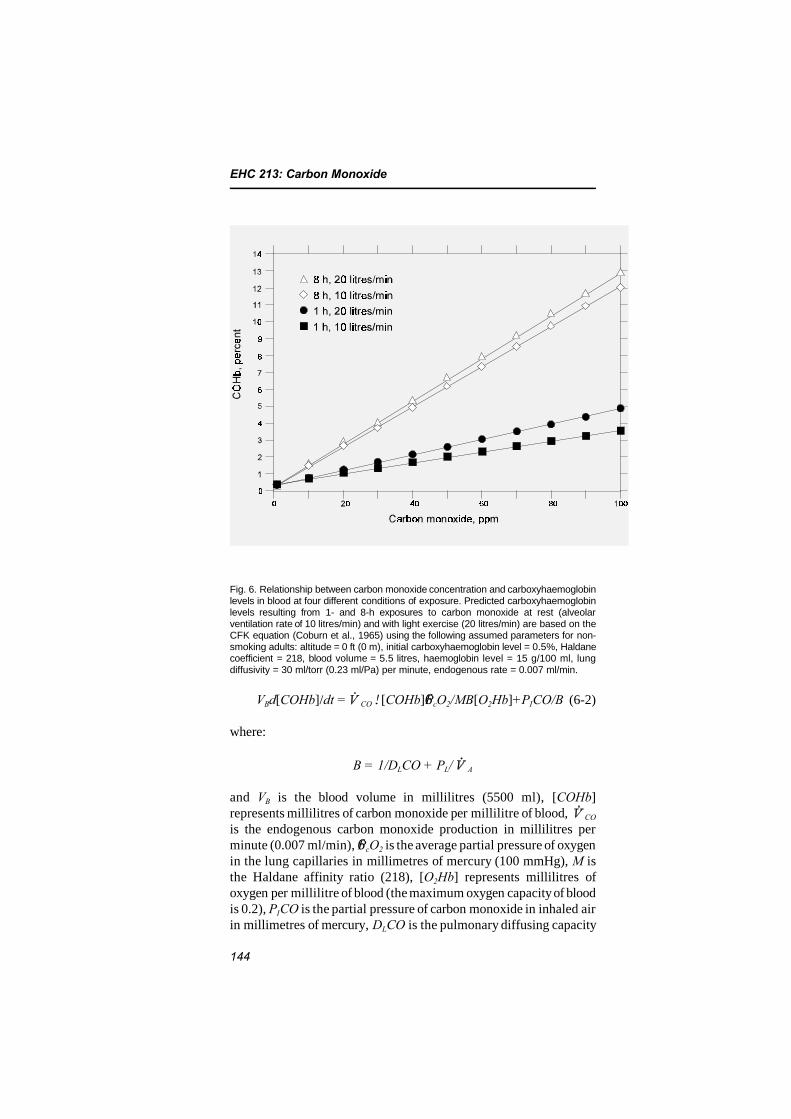
EHC 213: Carbon Monoxide
144
Fig. 6. Relationship between carbon monoxide concentration and carboxyhaemoglobinlevels in blood at four different conditions of exposure. Predicted carboxyhaemoglobinlevels resulting from 1- and 8-h exposures to carbon monoxide at rest (alveolarventilation rate of 10 litres/min) and with light exercise (20 litres/min) are based on theCFK equation (Coburn et al., 1965) using the following assumed parameters for non-smoking adults: altitude = 0 ft (0 m), initial carboxyhaemoglobin level = 0.5%, Haldanecoefficient = 218, blood volume = 5.5 litres, haemoglobin level = 15 g/100 ml, lungdiffusivity = 30 ml/torr (0.23 ml/Pa) per minute, endogenous rate = 0.007 ml/min.
VBd[COHb]/dt = CO![COHb]6PcO2/MB[O2Hb]+PICO/B (6-2)
where:
B = 1/DLCO + PL/ A
and VB is the blood volume in millilitres (5500 ml), [COHb]represents millilitres of carbon monoxide per millilitre of blood, CO
is the endogenous carbon monoxide production in millilitres perminute (0.007 ml/min), 6PcO2 is the average partial pressure of oxygenin the lung capillaries in millimetres of mercury (100 mmHg), M isthe Haldane affinity ratio (218), [O2Hb] represents millilitres ofoxygen per millilitre of blood (the maximum oxygen capacity of bloodis 0.2), PICO is the partial pressure of carbon monoxide in inhaled airin millimetres of mercury, DLCO is the pulmonary diffusing capacity
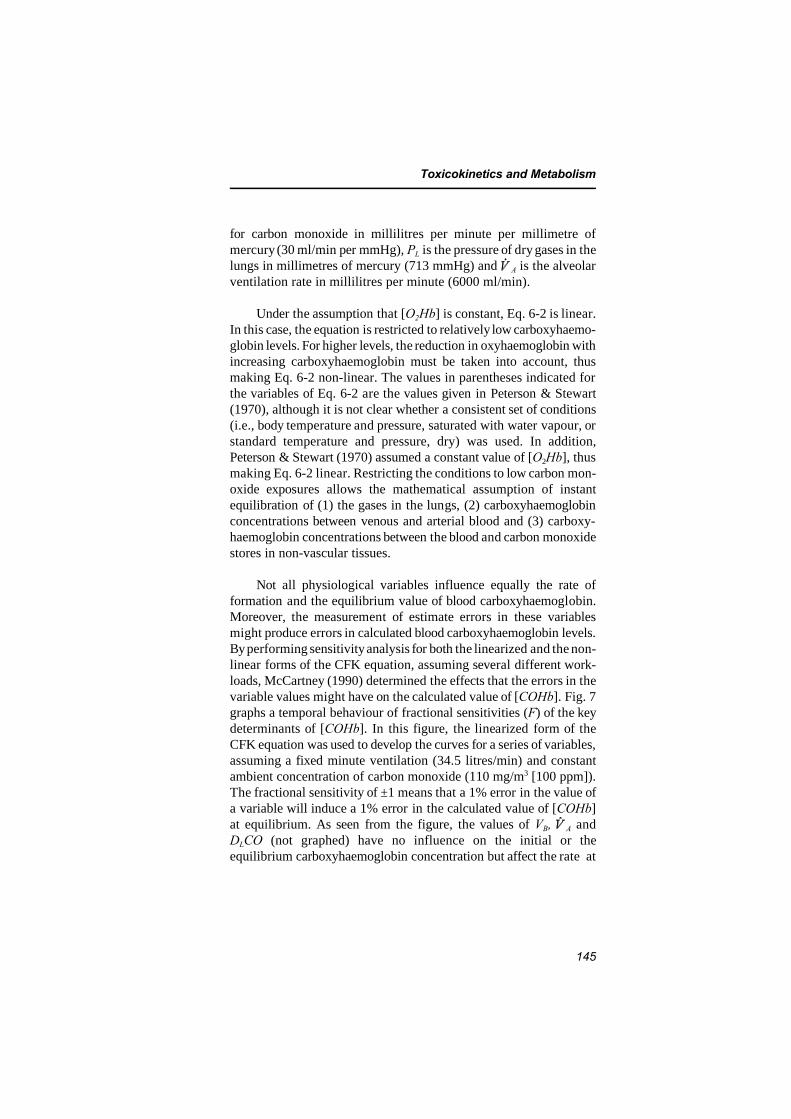
Toxicokinetics and Metabolism
145
for carbon monoxide in millilitres per minute per millimetre ofmercury (30 ml/min per mmHg), PL is the pressure of dry gases in thelungs in millimetres of mercury (713 mmHg) and A is the alveolarventilation rate in millilitres per minute (6000 ml/min).
Under the assumption that [O2Hb] is constant, Eq. 6-2 is linear.In this case, the equation is restricted to relatively low carboxyhaemo-globin levels. For higher levels, the reduction in oxyhaemoglobin withincreasing carboxyhaemoglobin must be taken into account, thusmaking Eq. 6-2 non-linear. The values in parentheses indicated forthe variables of Eq. 6-2 are the values given in Peterson & Stewart(1970), although it is not clear whether a consistent set of conditions(i.e., body temperature and pressure, saturated with water vapour, orstandard temperature and pressure, dry) was used. In addition,Peterson & Stewart (1970) assumed a constant value of [O2Hb], thusmaking Eq. 6-2 linear. Restricting the conditions to low carbon mon-oxide exposures allows the mathematical assumption of instantequilibration of (1) the gases in the lungs, (2) carboxyhaemoglobinconcentrations between venous and arterial blood and (3) carboxy-haemoglobin concentrations between the blood and carbon monoxidestores in non-vascular tissues.
Not all physiological variables influence equally the rate offormation and the equilibrium value of blood carboxyhaemoglobin.Moreover, the measurement of estimate errors in these variablesmight produce errors in calculated blood carboxyhaemoglobin levels.By performing sensitivity analysis for both the linearized and the non-linear forms of the CFK equation, assuming several different work-loads, McCartney (1990) determined the effects that the errors in thevariable values might have on the calculated value of [COHb]. Fig. 7graphs a temporal behaviour of fractional sensitivities (F) of the keydeterminants of [COHb]. In this figure, the linearized form of theCFK equation was used to develop the curves for a series of variables,assuming a fixed minute ventilation (34.5 litres/min) and constantambient concentration of carbon monoxide (110 mg/m3 [100 ppm]).The fractional sensitivity of ±1 means that a 1% error in the value ofa variable will induce a 1% error in the calculated value of [COHb]at equilibrium. As seen from the figure, the values of VB, A andDLCO (not graphed) have no influence on the initial or theequilibrium carboxyhaemoglobin concentration but affect the rate at
Fig. 7. Fractional sensitivity of carboxyhaemoglobin to the key carboxyhaemoglobin determinants as a function of time (see text for details) (from McCartney, 1990).
Toxicokinetics and Metabolism
147
which the equilibrium is achieved. The error in these variables doesnot affect the calculated equilibrium blood carboxyhaemoglobinconcentration. All the other variables, however, affect both thecarboxyhaemoglobin equilibrium and the rate at which it isapproached. Incorrect determination of the initial value of [COHb]and [THb] (total blood concentration of haemoglobin) will inducecarboxyhaemoglobin concentration errors during buildup. While anerror in the initial value of [COHb] progressively loses its influenceon the calculated [COHb], for [THb] the impact of this error on[COHb] will be diminished only transiently, regaining its full effectat equilibrium. In contrast to the initial value of [COHb], an error inM, 6PcO2 or F1CO will attain its maximum influence at equilibrium.
Tikuisis et al. (1992) studied the rate of formation of carboxy-haemoglobin in healthy young males at a low (approximately 45 W)and moderate (approximately 90 W) exercise load. Individuals wereexposed to 3400 mg carbon monoxide/m3 (3000 ppm) for 3 min at restfollowed by three intermittent exposures, ranging from 3400 mgcarbon monoxide/m3 (3000 ppm) for 1 min at low exercise to 764 mgcarbon monoxide/m3 (667 ppm) at moderate exercise. The CFKequation underpredicted the increase in carboxyhaemoglobin for theexposures at rest and the first exposure at exercise, whereas it over-predicted the carboxyhaemoglobin increase for the latter two expo-sures at exercise. The carboxyhaemoglobin concentration after allexposures reached approximately 10%. The measured and predictedcarboxyhaemoglobin values differed by <1 percentage point. Theslight shift of the measured carboxyhaemoglobin dissociation curvefrom the predicted curve was attributed to a delay in the delivery ofcarboxyhaemoglobin to the blood sampling point, a dorsal hand vein.
Benignus et al. (1994) extended the observations of Tikuisis etal. (1992). They exposed 15 men to 7652 mg C18O/m3 (6683 ppm) for3.1–6.7 min at rest. Both arterial and venous blood carboxyhaemo-globin levels were determined frequently during and for 10 minfollowing the exposures. Except for the Haldane constant (M), whichwas assumed to be 245, all other physiological parameters of the CFKequation were measured for each individual from the very beginning.Arterial carboxyhaemoglobin was considerably higher than the venouscarboxyhaemoglobin. The rate of increase in blood carboxyhaemo-globin and the arterial–venous carboxyhaemoglobin differences variedwidely among individuals. The peak arterial carboxyhaemoglobinconcentration at the end of exposure ranged from 13.9 to 20.9%. Thepeak venous carboxyhaemoglobin concentration reached during the
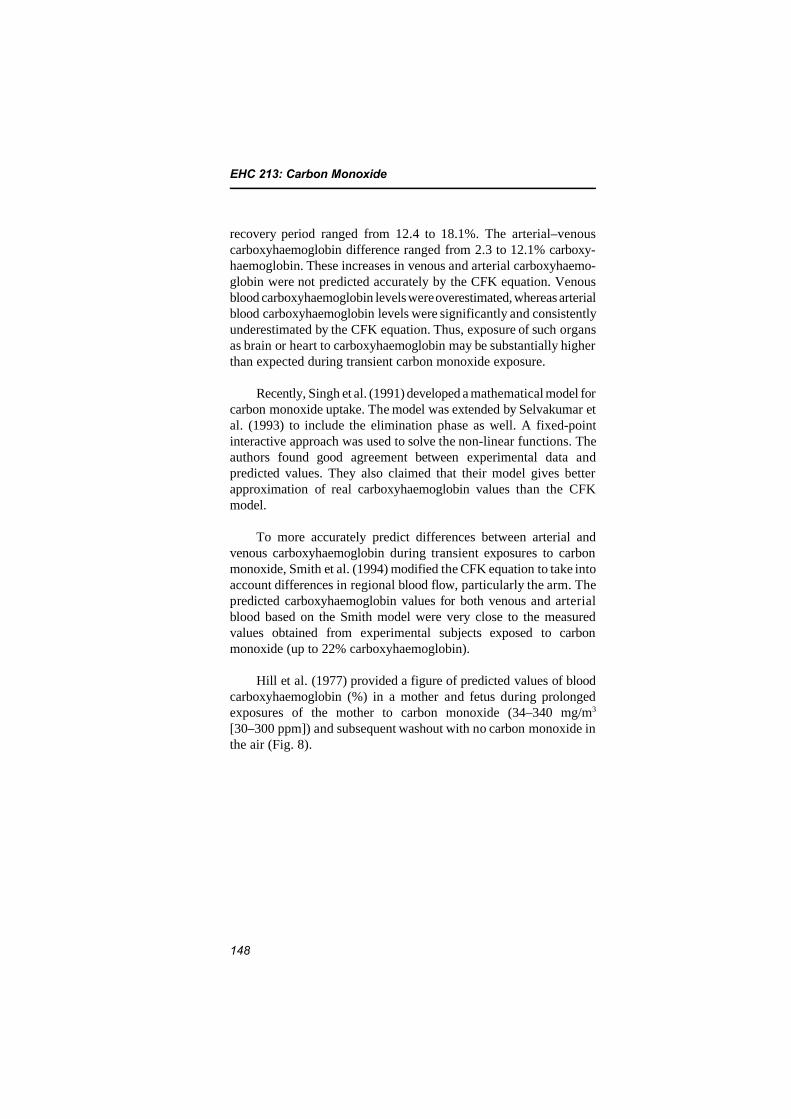
EHC 213: Carbon Monoxide
148
recovery period ranged from 12.4 to 18.1%. The arterial–venouscarboxyhaemoglobin difference ranged from 2.3 to 12.1% carboxy-haemoglobin. These increases in venous and arterial carboxyhaemo-globin were not predicted accurately by the CFK equation. Venousblood carboxyhaemoglobin levels were overestimated, whereas arterialblood carboxyhaemoglobin levels were significantly and consistentlyunderestimated by the CFK equation. Thus, exposure of such organsas brain or heart to carboxyhaemoglobin may be substantially higherthan expected during transient carbon monoxide exposure.
Recently, Singh et al. (1991) developed a mathematical model forcarbon monoxide uptake. The model was extended by Selvakumar etal. (1993) to include the elimination phase as well. A fixed-pointinteractive approach was used to solve the non-linear functions. Theauthors found good agreement between experimental data andpredicted values. They also claimed that their model gives betterapproximation of real carboxyhaemoglobin values than the CFKmodel.
To more accurately predict differences between arterial andvenous carboxyhaemoglobin during transient exposures to carbonmonoxide, Smith et al. (1994) modified the CFK equation to take intoaccount differences in regional blood flow, particularly the arm. Thepredicted carboxyhaemoglobin values for both venous and arterialblood based on the Smith model were very close to the measuredvalues obtained from experimental subjects exposed to carbonmonoxide (up to 22% carboxyhaemoglobin).
Hill et al. (1977) provided a figure of predicted values of bloodcarboxyhaemoglobin (%) in a mother and fetus during prolongedexposures of the mother to carbon monoxide (34–340 mg/m3
[30–300 ppm]) and subsequent washout with no carbon monoxide inthe air (Fig. 8).
Fig. 8. Predicted (CFK model) buildup of blood carboxyhaemoglobin (%) in a mother and fetus during prolonged exposures of mother to carbonmonoxide (34–340 mg/m3 [30–300 ppm]) and subsequent washout with no carbon monoxide in the air (from
Hill et al., 1977).
EHC 213: Carbon Monoxide
150
6.4 Distribution of carbon monoxide
6.4.1 Intracellular effects of carbon monoxide
The principal cause of carbon monoxide toxicity at low exposurelevels is thought to be tissue hypoxia due to carbon monoxide bindingto haemoglobin; however, certain physiological aspects of carbonmonoxide exposure are not well explained by decreases inintracellular PO2
related to the presence of carboxyhaemoglobin. Formany years, it has been known that carbon monoxide is distributed toextravascular sites such as skeletal muscle (Coburn et al., 1971, 1973)and that 10–50% of the total body store of carbon monoxide may beextravascular (Luomanmaki & Coburn, 1969). Furthermore,extravascular carbon monoxide is metabolized slowly to carbondioxide in vivo (Fenn, 1970). Consequently, secondary mechanismsof carbon monoxide toxicity related to intracellular uptake of carbonmonoxide have been the focus of a great deal of research interest.Carbon monoxide binding to many intracellular compounds has beenwell documented both in vitro and in vivo; however, it is stilluncertain whether or not intracellular uptake of carbon monoxide inthe presence of haemoglobin is sufficient to cause either acute organsystem dysfunction or long-term health effects. The virtual absence ofsensitive techniques capable of assessing intracellular carbonmonoxide binding under physiological conditions has resulted in avariety of indirect approaches to the problem, as well as manynegative studies.
Carbon monoxide is known to react with a variety of metal-containing proteins found in nature. Carbon monoxide-bindingmetalloproteins present in mammalian tissues include oxygen carrierproteins such as haemoglobin (Douglas et al., 1912) and myoglobin(Antonini & Brunori, 1971) as well as metalloenzymes (oxidoreduc-tases) such as cytochrome c oxidase (Keilin & Hartree, 1939),cytochromes of the P-450 type (Omura & Sato, 1964), tryptophanoxygenase (Tanaka & Knox, 1959) and dopamine hydroxylase(Kaufman, 1966). These metalloproteins contain iron and/or coppercentres at their active sites that form metal–ligand complexes withcarbon monoxide in competition with molecular oxygen. Carbonmonoxide and oxygen form complexes with metalloenzymes onlywhen the iron and copper are in their reduced forms (Fe(II), Cu(I)).Caughey (1970) reviewed the similarities and differences in thephysicochemical characteristics of carbon monoxide and oxygen
Toxicokinetics and Metabolism
151
binding to these transition metal ions. The competitive relationshipbetween carbon monoxide and oxygen for the active site ofintracellular haemoproteins is usually described by the Warburgpartition coefficient (R), which is the carbon monoxide/oxygen ratiothat produces 50% inhibition of the oxygen uptake of the enzyme, or,in the case of myoglobin, a 50% decrease in the number of availableoxygen binding sites.
The measured Warburg coefficients of various mammaliancarbon monoxide-binding proteins have been tabulated recently byCoburn & Forman (1987) (see Table 13). These R values range fromapproximately 0.025 for myoglobin to 0.1–12 for cytochrome P-450.Warburg coefficient values of 2–28 have been reported for cytochromec oxidase (Keilin & Hartree, 1939; Wohlrab & Ogunmola, 1971;Wharton & Gibson, 1976). By comparison, the R value for humanhaemoglobin of 0.0045 is some 3 orders of magnitude less than thatof cytochrome c oxidase. This means, for example, that carbonmonoxide would bind to cytochrome oxidase in vivo only if oxygengradients from red blood cells in the capillary to the mitochondriawere quite steep. Application of R values for intracellular haemo-proteins in this way, however, merits caution, because most measure-ments of carbon monoxide binding have not been made atphysiological temperatures or at relevant rates of electron transport.
Apart from questions about the relevance of extrapolating in vitropartition coefficients to physiological conditions, experimental prob-lems arise that are related to determining actual carbon monoxide/oxygen ratios in intact tissues. Reasonably good estimates of tissuePCO may be obtained by calculating the value in mean capillary bloodfrom the Haldane relationship (NRC, 1977), neglecting the low rateof carbon monoxide metabolism by the tissue. Experimental estimatesof the PCO in animal tissues have been found to be in close agreementwith these calculations and average slightly less than alveolar PCO
(Goethert et al., 1970; Goethert, 1972). In general, steady-stateestimates for tissue PCO range from 3 to 70 Pa (0.02 to 0.5 torr) atcarboxyhaemoglobin concentrations of 5–50%. Therefore, at 50%carboxyhaemoglobin, a carbon monoxide/oxygen ratio of 5 may beachieved at sites of intracellular oxygen uptake only if tissue PO2
inthe vicinity of the carbon monoxide-binding proteins is approximately10 Pa (0.1 torr).
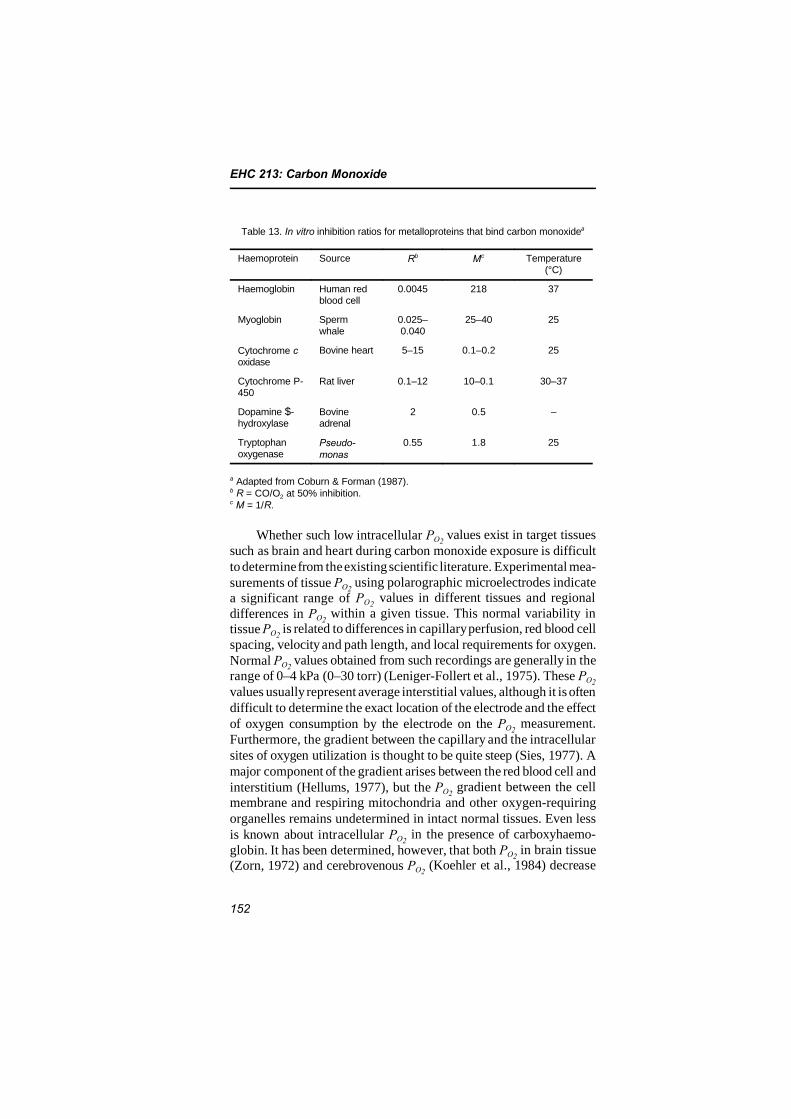
EHC 213: Carbon Monoxide
152
Table 13. In vitro inhibition ratios for metalloproteins that bind carbon monoxidea
Haemoprotein Source Rb Mc Temperature(°C)
Haemoglobin Human redblood cell
0.0045 218 37
Myoglobin Spermwhale
0.025–0.040
25–40 25
Cytochrome coxidase
Bovine heart 5–15 0.1–0.2 25
Cytochrome P-450
Rat liver 0.1–12 10–0.1 30–37
Dopamine $-hydroxylase
Bovineadrenal
2 0.5 –
Tryptophanoxygenase
Pseudo-monas
0.55 1.8 25
a Adapted from Coburn & Forman (1987).b R = CO/O2 at 50% inhibition.c M = 1/R.
Whether such low intracellular PO2 values exist in target tissues
such as brain and heart during carbon monoxide exposure is difficultto determine from the existing scientific literature. Experimental mea-surements of tissue PO2
using polarographic microelectrodes indicatea significant range of PO2
values in different tissues and regionaldifferences in PO2
within a given tissue. This normal variability intissue PO2
is related to differences in capillary perfusion, red blood cellspacing, velocity and path length, and local requirements for oxygen.Normal PO2
values obtained from such recordings are generally in therange of 0–4 kPa (0–30 torr) (Leniger-Follert et al., 1975). These PO2
values usually represent average interstitial values, although it is oftendifficult to determine the exact location of the electrode and the effectof oxygen consumption by the electrode on the PO2
measurement.Furthermore, the gradient between the capillary and the intracellularsites of oxygen utilization is thought to be quite steep (Sies, 1977). Amajor component of the gradient arises between the red blood cell andinterstitium (Hellums, 1977), but the PO2
gradient between the cellmembrane and respiring mitochondria and other oxygen-requiringorganelles remains undetermined in intact normal tissues. Even lessis known about intracellular PO2
in the presence of carboxyhaemo-globin. It has been determined, however, that both PO2
in brain tissue(Zorn, 1972) and cerebrovenous PO2
(Koehler et al., 1984) decrease
Toxicokinetics and Metabolism
153
linearly as a function of carboxyhaemoglobin concentration.Presumably, then, intracellular PO2
declines with increasing carboxy-haemoglobin concentration, and, at certain locations, carbonmonoxide forms ligands with the oxygen-dependent, intracellularhaemoproteins. As the intracellular PO2
decreases, the carbonmonoxide/oxygen ratio in the tissue increases at constant PCO, and anincreasing fraction of the available intracellular oxygen binding sitesbecome occupied by carbon monoxide.
The intracellular uptake of carbon monoxide behaves generallyaccording to the preceding principles; most of the experimentalevidence for this line of reasoning was derived from in vivo studies ofcarboxyhaemoglobin formation by Coburn and colleagues (1965). Forall intracellular haemoproteins, however, two crucial quantitativeunknowns remain: (1) the fraction of intracellular binding sites indiscrete tissues inhibited by carbon monoxide at any level of carboxy-haemoglobin saturation, and (2) the critical fraction of inhibited sitesnecessary to amplify or initiate a deleterious physiological effect ortrigger biochemical responses with long-term health effects. Ingeneral, then, the activities of certain intracellular haemoproteins maybe altered at physiologically tolerable levels of carboxyhaemoglobin.The problem is in determining what level of intracellular reserve isavailable during carbon monoxide hypoxia.
6.4.2 Carbon monoxide binding to myoglobin
The red protein myoglobin is involved in the transport of oxygenfrom capillaries to mitochondria in red muscles. The binding ofcarbon monoxide to myoglobin in heart and skeletal muscle in vivohas been demonstrated at levels of carboxyhaemoglobin below 2% inheart and 1% in skeletal muscle (Coburn & Mayers, 1971; Coburnet al., 1973). The carboxymyoglobin/carboxyhaemoglobin saturationratio has been found to be approximately 1 in cardiac muscle and lessthan 1 in skeletal muscle. These ratios did not increase with increasesin carboxyhaemoglobin up to 50% saturation. In the presence ofhypoxaemia and hypoperfusion, the amount of carbon monoxideuptake by myoglobin has been measured and was shown to increase(Coburn et al., 1971, 1973). A similar conclusion has been reachedduring maximal exercise in humans, where carbon monoxide shiftsfrom haemoglobin to the intracellular compartment (i.e., myoglobin,at carboxyhaemoglobin levels of 2–2.5%) (Clark & Coburn, 1975).The significance of carbon monoxide uptake by myoglobin is
EHC 213: Carbon Monoxide
154
uncertain, because our understanding of the functional role ofmyoglobin in working muscle is incomplete. Myoglobin undoubtedlyenhances the uptake of oxygen by muscle cells so that the continuousoxygen demand of working muscle is satisfied (Wittenberg et al.,1975). Myoglobin may contribute to muscle function by serving as anoxygen store, by enhancing intracellular diffusion of oxygen or byacting as an oxygen buffer to maintain a constant mitochondrial PO2during changes in oxygen supply. Functional myoglobin has beenfound to be necessary for maintenance of maximum oxygen uptakeand mechanical tension in exercising skeletal muscle (Cole, 1982).The binding of carbon monoxide to myoglobin would therefore beexpected to limit oxygen availability to mitochondria in workingmuscle. This possibility has been verified theoretically by computersimulations of Hoofd & Kreuzer (1978) and Agostoni et al. (1980).The three-compartment (arterial and venous capillary blood andmyoglobin) computer model of Agostoni et al. (1980) predicted thatcarboxymyoglobin formation in low PO2
regions of the heart (e.g.,subendocardium) could be sufficient to impair intracellular oxygentransport to mitochondria at carboxyhaemoglobin saturations of5–10%. The concentration of carboxymyoglobin was also predicted toincrease during conditions of hypoxia, ischaemia and increasedoxygen demand.
Wittenberg & Wittenberg (1993) investigated the effect ofincreased carboxymyoglobin in cardiac muscle cells and subsequentdecreases in myoglobin-mediated oxidative phosphorylation. Isolatedrat cardiac myocytes were maintained near the intracellular PO2
of theworking heart (0.3–0.7 kPa [2–5 torr]) and near the end-venous PO2(2.7 kPa [20 torr]) and exposed to low-pressure carbon monoxide(0.009–9 kPa [0.07–70 torr]; 100–100 000 mg/m3 [90–90 000 ppm]).The fraction of intracellular myoglobin, determined spectrophoto-metrically, was in agreement with the fraction predicted from the ratioof carbon monoxide to oxygen partial pressures. When carboxymyo-globin was at least 40% of the total intracellular myoglobin, the rateof oxidative phosphorylation was significantly lower than that incontrol cells from the same preparation. The authors estimated thatthis result would be achieved when arterial carboxyhaemoglobinlevels reached approximately 20–40%. In previous studies by theauthors (Wittenberg & Wittenberg, 1985, 1987), spectrophotometryshowed no evidence of carbon monoxide binding to cytochromeoxidase, the only mitochondrial component known to bind withcarbon monoxide, until very high levels of carboxymyoglobin were
Toxicokinetics and Metabolism
155
reached (almost 100%). Therefore, the effect of carbon monoxide oncellular respiration in these experiments was apparently not due toinhibition of cytochrome oxidase.
Increases in cardiac carboxymyoglobin levels have been mea-sured after heavy workloads in carbon monoxide-exposed rats,independent of changes in carboxyhaemoglobin concentration (Sokalet al., 1986). These investigators reported that exercise significantlyincreased cardiac carboxymyoglobin at carboxyhaemoglobin satura-tions of approximately 10, 20 and 50%, although metabolic acidosisworsened only at 50% carboxyhaemoglobin. It remains unknown,however, whether or not low carboxymyoglobin could be responsiblefor decreases in maximal oxygen uptake during exercise reported atcarboxyhaemoglobin levels of 4–5%.
6.4.3 Carbon monoxide uptake by cytochrome P-450
Mixed-function oxidases (cytochrome P-450) are involved in thedetoxification of a number of drugs and steroids by “oxidation.” Theseenzymes are distributed widely throughout mammalian tissues; thehighest concentrations are found in the microsomes of the liver,adrenal gland and lungs of some species (Estabrook et al., 1970).These oxidases are also present in low concentrations in kidney andbrain tissues. Mixed-function oxidases catalyse a variety of reactions(e.g., hydroxylation) involving the uptake of a pair of electrons fromNADPH with reduction of one atom of oxygen to water and incor-poration of the other into substrates (White & Coon, 1980). Theseenzymes bind carbon monoxide, and their binding constant valuesrange from 0.1 to 12 in vitro (see Coburn & Forman, 1987). Thesensitivity of cytochrome P-450 to carbon monoxide is increasedunder conditions of rapid electron transport (Estabrook et al., 1970);however, previous calculations have indicated that tissue PCO is toolow to inhibit the function of these haemoproteins in vivo at less than15–20% carboxyhaemoglobin (Coburn & Forman, 1987). There havebeen few attempts to measure carbon monoxide binding coefficientsfor these enzymes in intact tissues. In isolated rabbit lung, the effectsof carbon monoxide on mixed-function oxidases are consistent witha K of approximately 0.5 (Fisher et al., 1979). Carbon monoxideexposure decreases the rate of hepatic metabolism of hexobarbital andother drugs in experimental animals (Montgomery & Rubin, 1973;Roth & Rubin, 1976a,b). These effects of carbon monoxide onxenobiotic metabolism appear to be attributable entirely to
EHC 213: Carbon Monoxide
156
carboxyhaemoglobin-related tissue hypoxia, because they are nogreater than the effects of “equivalent” levels of hypoxic hypoxia.Three optical studies of rat liver perfused in situ with haemoglobin-free buffers have demonstrated uptake of carbon monoxide by cyto-chrome P-450 at carbon monoxide/oxygen ratios of 0.03–0.10 (Sies& Brauser, 1970; Iyanagi et al., 1981; Takano et al., 1985). In thestudy by Takano et al. (1985), significant inhibition of hexobarbitalmetabolism was found at a carbon monoxide/oxygen ratio of about0.1. This carbon monoxide/oxygen ratio, if translated directly tocarboxyhaemoglobin concentration, would produce a carboxyhaemo-globin level that is incompatible with survival (~95%). At present,there is no scientific evidence that carbon monoxide significantlyinhibits the activity of mixed-function oxidases at carboxyhaemo-globin saturations below 15–20%. Although most studies do notindicate effects of carbon monoxide on cytochrome P-450 activity atphysiologically relevant carbon monoxide concentrations, specific P-450 isoenzymes may have higher affinities for carbon monoxide.Also, the rate of substrate metabolism and substrate type may increasecarbon monoxide binding by P-450 enzymes.
6.4.4 Carbon monoxide and cytochrome c oxidase
Cytochrome c oxidase, also known as cytochrome aa3, is theterminal enzyme in the mitochondrial electron transport chain thatcatalyses the reduction of molecular oxygen to water.
Although the enzyme complex binds carbon monoxide, threereasons are often cited for why there are still considerable uncertain-ties as to this occurrence only under conditions of severe hypoxia. Thereasons for this difficulty centre around differences in the redoxbehaviour of cytochrome oxidase in vivo relative to its in vitrobehaviour. The enzyme has a high resting reduction level at normalPO2
in brain (Jobsis et al., 1977) and other tissues, and its oxidationstate varies directly with PO2
in vitro (Kreisman et al., 1981). Thesefindings may indicate that the oxidase operates near its effective KM
in vivo or that the availability of oxygen to each mitochondrion orrespiratory chain is not continuous under most physiologicalcircumstances. There may also be differences in or regulation of theKM for oxygen of the enzyme according to regional metabolicconditions. For example, the apparent KM for oxygen of cytochromeoxidase increases several times during rapid respiration (Oshino et al.,1974); in isolated cells, it varies as a function of the cytosolic
Toxicokinetics and Metabolism
157
phosphorylation potential (Erecinska & Wilson, 1982). Conditions ofhigh respiration and/or high cytosolic phosphorylation potential invitro increase the concentration of carbon monoxide–cytochromeoxidase at any carbon monoxide/oxygen value. This concept is parti-cularly relevant for tissues like the heart and brain.
Enhanced sensitivity of cytochrome oxidase to carbon monoxidehas been demonstrated in uncoupled mitochondria, where carbonmonoxide/oxygen ratios as low as 0.2 delay the oxidation of reducedcytochrome oxidase in transit from anoxia to normoxia (Chance et al.,1970). Several studies of respiring tissues, however, have foundcarbon monoxide/oxygen ratios of 12–20 to be necessary for 50%inhibition of oxygen uptake (Coburn et al., 1979; Kidder, 1980; Fisher& Dodia, 1981). In this context, it is important to note that in a giventissue, the carbon monoxide/oxygen ratio necessary to inhibit one-halfof the oxygen uptake does not necessarily correspond to carbonmonoxide binding to one-half of the oxidase molecules. This isbecause unblocked cytochrome oxidase molecules may oxidize respi-ratory complexes of blocked chains, thus causing the oxygenconsumption to fall more slowly than predicted for strictly linearsystems. The capacity of tissues to compensate for electron transportinhibition by branching has not been investigated systematically as afunction of PO2
, carbon monoxide/oxygen ratio, cytosolic phosphoryla-tion potential or rate of electron transport in vivo.
The contention that intracellular carbon monoxide uptake bycytochrome oxidase occurs is supported by a few experiments. It hasbeen known for many years, primarily through the work of Fenn(Fenn & Cobb, 1932; Fenn, 1970), that carbon monoxide is slowlyoxidized in the body to carbon dioxide. This oxidation occursnormally at a much lower rate than the endogenous rate of carbonmonoxide production; however, the rate of oxidation of carbonmonoxide increases in proportion to the carbon monoxide body store(Luomanmaki & Coburn, 1969). The oxidation of carbon monoxideto carbon dioxide was shown in 1965 by Tzagoloff & Wharton to becatalysed by reduced cytochrome oxidase. In addition, Young et al.(1979) demonstrated that oxidized cytochrome oxidase promotescarbon monoxide oxidation and, subsequently, that cytochromeoxidase in intact heart and brain mitochondria was capable ofcatalysing the reaction at a carbon monoxide/oxygen ratio of
EHC 213: Carbon Monoxide
158
approximately 4 (Young & Caughey, 1986). The physiologicalsignificance of this reaction is unknown.
Optical evidence suggesting that cytochrome oxidase is sensitiveto carbon monoxide in vivo comes from studies of the effects of carbonmonoxide on cerebrocortical cytochromes in fluorocarbon-perfusedrats (Piantadosi et al., 1985, 1987). In these studies, carbon monoxide/oxygen ratios of 0.006–0.06 were associated with spectral evidence ofcarbon monoxide binding to reduced cytochrome oxidase. Thespectral data also indicated that the intracellular uptake of carbonmonoxide produced increases in the reduction level of b-typecytochromes in the brain cortex. At a carbon monoxide/oxygen ratioof 0.06, most (>80%) of the cytochrome b became reduced in thecerebral cortex. The cytochrome b response is not well understood; itis thought to represent an indirect (e.g., energy-dependent) responseof mitochondrial b-cytochromes to carbon monoxide, because thesecytochromes are not known to bind carbon monoxide in situ. Thecarbon monoxide/oxygen ratio used in the studies of Piantadosi et al.(1985, 1987) would produce carboxyhaemoglobin levels in the rangeof 50–90%. The venous PO2
in those experiments, however, was about13 kPa (100 torr); thus, at tissue PO2
s that are significantly lower, thiseffect should occur at lower carboxyhaemoglobin saturations. It isunlikely, however, that cerebral uptake of carbon monoxide is signifi-cant at carboxyhaemoglobin below 5%, because tissue PCO is so lowin the presence of haemoglobin. The physiological significance ofthese effects of carbon monoxide has not yet been determined.
Direct effects of carbon monoxide on mitochondrial functionhave been suggested by several studies that indicate decreases incytochrome oxidase activity by histochemistry in brain and heart aftersevere carbon monoxide intoxication in experimental animals (Savo-lainen et al., 1980; Somogyi et al., 1981; Pankow & Ponsold, 1984).The magnitude of the decrease in cytochrome oxidase activity mayexceed that associated with severe hypoxia, although problems ofdetermining “equivalent” levels of carbon monoxide hypoxia andhypoxic hypoxia have not been addressed adequately by these studies.
Dichloromethane belongs to the group of xenobiotics that aremetabolized to carbon monoxide. Dichloromethane-derived carbonmonoxide is produced by means of cytochrome P-450 2E1, bound tomembranes of the endoplasmic reticulum of liver cells. The carbon
Toxicokinetics and Metabolism
159
monoxide may be distributed among various cell fractions, where itreacts with haemoproteins within the cells. Subsequently, it formscarboxyhaemoglobin. The cytochrome oxidase activities in differenttissues of rats were studied by oral administration of 12.4 mmoldichloromethane/kg body weight (about 10% carboxyhaemoglobin 6 hafter gavage) and by inhalation exposure to 883 000 mg dichloro-methane/m3 (250 000 ppm) for 20 s (3–4% carboxyhaemoglobin after2 h). Six hours after dichloromethane ingestion, the cytochrome oxi-dase activity was reduced in the brain, lung and muscle by 28–42%.Twenty minutes after inhalation of dichloromethane, it was reducedby 42–51% in brain, liver, kidney and muscle. These effects werereversible. Pretreatment with the specific inhibitor of cytochrome P-450 2E1, diethyldithiocarbamate, prevented these effects. These find-ings indicate that the effect of dichloromethane is caused by thedichloromethane metabolite, carbon monoxide (Lehnebach et al.,1995).
The effects of passive cigarette smoking on oxidative phos-phorylation in myocardial mitochondria have been studied in rabbits(Gvozdjakova et al., 1984). Mitochondrial respiratory rate (State 3and State 4) and rates of oxidative phosphorylation were found to bedecreased significantly by carboxyhaemoglobin concentrations of6–7%. These data, however, are not definitive with respect to carbonmonoxide, because they include effects of nicotine, which reachedconcentrations of 5.7 :g/litre in blood. A recent study by Snow et al.(1988) in dogs with prior experimental myocardial infarctionindicated that a carboxyhaemoglobin concentration of 9.4% increasedthe resting reduction level of cytochrome oxidase in the heart. Thecarbon monoxide exposures were also accompanied by more rapidcytochrome oxidase reductions after coronary artery occlusion and lessrapid reoxidation of the enzyme after release of the occlusion. Theauthors concluded that carbon monoxide trapped the oxidase in thereduced state during transient cardiac ischaemia. There is alsoevidence that formation of the carbon monoxide–cytochrome oxidaseligand occurs in the brain of the rat at carboxyhaemoglobinsaturations of 40–50% (Brown & Piantadosi, 1990). This bindingappears to be related to hypotension and probable cerebralhypoperfusion during carbon monoxide exposure. This effect is inconcert with experimental evidence that carbon monoxide producesdirect vasorelaxation of smooth muscle. This vasodilation occurs inrabbit aorta (Coburn et al., 1979), in the coronary circulation of
EHC 213: Carbon Monoxide
160
isolated perfused rat heart (McFaul & McGrath, 1987) and in thecerebral circulation of the fluorocarbon-perfused rat (Piantadosi et al.,1987). The mechanism of this vasodilator effect is unclear.
6.5 Elimination
The large number of data available on the rate of carbon monox-ide uptake and the formation of carboxyhaemoglobin contrasts sharplywith the limited information available on the dynamics of carbonmonoxide washout from body stores and blood. Although the samefactors that govern carbon monoxide uptake will affect carbonmonoxide elimination, the relative importance of these factors mightnot be the same (Peterson & Stewart, 1970; Landaw, 1973). Both theformation and the decline of carboxyhaemoglobin fit a second-orderfunction best, increasing during the uptake period and decreasingduring the elimination period. Hence, an initial rapid decay willgradually slow down (Stewart et al., 1970; Landaw, 1973; Wagneret al., 1975). The elimination rate of carbon monoxide from anequilibrium state will follow a monotonically decreasing second-order(logarithmic or exponential) function (Pace et al., 1950). The rate,however, might not be constant following transient exposures tocarbon monoxide where, at the end of exposure, the steady-stateconditions were not reached yet. In this situation, particularly aftervery short and high carbon monoxide exposures, it is possible thatcarboxyhaemoglobin decline could be biphasic, and it can beapproximated best by a double-exponential function: the initial rateof decline or “distribution” might be considerably faster than the later“elimination” phase (Wagner et al., 1975). The reported divergenceof the carboxyhaemoglobin decline rate in blood and in exhaled airsuggests that the carbon monoxide elimination rates fromextravascular pools are slower than that reported for blood (Landaw,1973). Although the absolute elimination rates are associatedpositively with the initial concentration of carboxyhaemoglobin, therelative elimination rates appear to be independent of the initialconcentration of carboxyhaemoglobin (Wagner et al., 1975).
The half-time of carbon monoxide disappearance from bloodunder normal recovery conditions while breathing air showed consi-derable between-individual variance. For carboxyhaemoglobin con-centrations of 2–10%, the half-time ranged from 3 to 5 h (Landaw,1973); others reported the range to be 2–6.5 h for slightly higherinitial concentrations of carboxyhaemoglobin (Peterson & Stewart,
Toxicokinetics and Metabolism
161
1970). The half-time of carboxyhaemoglobin elimination wasprolonged in dogs with acute lung injury (Wu, 1992). The eliminationof carbon monoxide following exposure of rabbits to 2–2.9% carbonmonoxide for 40, 60 or 300 s (69–82% carboxyhaemoglobin at theend of the 300-s exposure) was not linear and showed a typical three-phase elimination pattern. The authors explained the third phase,about 90 min after exposure, by endogenous carbon monoxideproduction (Wazawa et al., 1996).
Increased inhaled concentrations of oxygen acceleratedelimination of carbon monoxide; by breathing 100% oxygen, the half-time was shortened by almost 75% (Peterson & Stewart, 1970). Theelevation of PO2
to 300 kPa (3 atm) reduced the half-time to about20 min, which is approximately a 14-fold decrease over that seenwhen breathing room air (Landaw, 1973; Britten & Myers, 1985).Although the washout of carbon monoxide can be somewhat accel-erated by an admixture of 5% carbon dioxide in oxygen, hyperbaricoxygen treatment is more effective in facilitating displacement ofcarbon monoxide.
162
7. EFFECTS ON LABORATORY ANIMALS
7.1 Introduction
Concerns about the potential health effects of exposure to carbonmonoxide have been addressed in extensive studies with variousanimal species. Under varied experimental protocols, considerableinformation has been obtained on the toxicity of carbon monoxide, itsdirect effects on the blood and other tissues, and the manifestations ofthese effects in the form of changes in organ function. Many of thesestudies, however, have been conducted at extremely high levels ofcarbon monoxide (i.e., levels not found in ambient air). Althoughsevere effects from exposure to these high levels of carbon monoxideare not directly germane to the effects from exposure to currentambient levels of carbon monoxide, they can provide valuableinformation about potential effects of accidental exposure to carbonmonoxide, particularly those exposures occurring indoors. Thesehigher-level studies, therefore, are being considered in this chapteronly if they extend dose–response information or if they provide cluesto other potential health effects of carbon monoxide that have not beenidentified already. In this document, emphasis has been placed onstudies conducted at ambient or near-ambient concentrations ofcarbon monoxide that have been published in the peer-reviewedliterature.
The effects observed from non-human experimental studies haveprovided some insight into the role that carbon monoxide plays incellular metabolism. Caution must be exercised, however, in extrapo-lating the results obtained from these data to humans. Not only arethere questions related to species differences, but exposure conditionsdiffer markedly in the studies conducted by different investigators.Information on the carboxyhaemoglobin levels achieved and theduration of exposure utilized in the studies will be provided in the textor tables if it was available in the original manuscript. Where thisinformation is lacking, only the carbon monoxide levels (milligramsper cubic metre and parts per million) will be reported.
7.2 Cardiovascular system and blood
The cardiovascular system is sensitive to alterations in oxygensupply. Because inhaled carbon monoxide limits oxygen supply, itmight be expected to adversely affect the cardiovascular system; the
Effects on Laboratory Animals
163
degree of hypoxia and the extent of tissue injury will be determinedby the dose of carbon monoxide. The effect of carbon monoxide on thecardiovascular system has been the subject of several reviews (Turino,1981; McGrath, 1982; Penney, 1988). This section will discussstudies in animals that have evaluated the effects of carbon monoxideon ventricular fibrillation, haemodynamics, cardiomegaly,haematology and atherosclerosis.
7.2.1 Disturbances in cardiac rhythm
Data obtained from animal studies suggest that carbon monoxidecan disturb cardiac conduction and cause cardiac arrhythmias. In dogsexposed intermittently or continuously to carbon monoxide (57 and110 mg/m3 [50 and 100 ppm]; 2.6–12.0% carboxyhaemoglobin) for6 weeks in environmental chambers, Preziosi et al. (1970) reportedabnormal electrocardiograms; the changes appeared during the secondweek and continued throughout the exposure. The blood cytology,haemoglobin and haematocrit values were unchanged from controlvalues. DeBias et al. (1973) studied the effects of breathing carbonmonoxide (110–120 mg/m3 [96–102 ppm]; 12.4% carboxyhaemo-globin) continuously (23 h per day for 24 weeks) on the electrocardio-grams of healthy monkeys and monkeys with myocardial infarctsinduced by injecting microspheres into the coronary circulation. Theauthors observed higher P-wave amplitudes in both the infarcted andnon-infarcted monkeys and a higher incidence of T-wave inversion inthe infarcted monkeys. The authors concluded that there was a greaterdegree of ischaemia in the infarcted animals breathing carbon monox-ide. Although there was a greater incidence of T-wave inversion inthe infarcted monkeys, the effects were transient and of such lowmagnitude that accurate measurements of amplitude were notpossible.
In other long-term studies, however, several groups have reportedno effects of carbon monoxide either on the electrocardiogram or oncardiac arrhythmias. Musselman et al. (1959) observed no changes inthe electrocardiogram of dogs exposed continuously to carbon monox-ide (57 mg/m3 [50 ppm]; 7.3% carboxyhaemoglobin) for 3 months.These observations were confirmed by Malinow et al. (1976), whoreported no effects on the electrocardiogram in cynomolgus monkeys(Macaca fascicularis) exposed to carbon monoxide (570 mg/m3
[500 ppm], pulsed; 21.6% carboxyhaemoglobin) for 14 months.
EHC 213: Carbon Monoxide
164
Several research groups have investigated the effects of carbonmonoxide on the vulnerability of the heart to induced ventricularfibrillation. DeBias et al. (1976) reported that carbon monoxide(110 mg/m3 [100 ppm] inhaled for 16 h; 9.3% carboxyhaemoglobin)reduced the threshold for ventricular fibrillation induced by an elec-trical stimulus applied to the myocardium of monkeys during the finalstage of ventricular repolarization. The voltage required to inducefibrillation was highest in normal animals breathing air and lowest ininfarcted animals breathing carbon monoxide. Infarction alone andcarbon monoxide alone each required significantly less voltage forfibrillation; when the two were combined, the effects on the myocar-dium were additive. These observations were confirmed in both anaes-thetized, open-chested dogs with acute myocardial injury (Aronowet al., 1978) and normal dogs (Aronow et al., 1979) breathing carbonmonoxide (110 mg/m3 [100 ppm]; 6.3–6.5% carboxyhaemoglobin) for2 h. However, Kaul et al. (1974) reported that anaesthetized dogsinhaling 570 mg carbon monoxide/m3 (500 ppm; 20–35% carboxy-haemoglobin) for 90 min were resistant to direct electrocardiographicchanges. At 20% carboxyhaemoglobin, there was evidence ofenhanced sensitivity to digitalis-induced ventricular tachycardia, butthere was no increase in vulnerability of the ventricles to hydrocarbon/epinephrine or to digitalis-induced fibrillation following exposure tocarbon monoxide resulting in 35% carboxyhaemoglobin.
Several workers have investigated the effect of breathing carbonmonoxide shortly after cardiac injury on the electrical activity of theheart. Becker & Haak (1979) evaluated the effects of carbon monoxide(five sequential exposures to 5700 mg/m3 [5000 ppm], producing 4.9–17.0% carboxyhaemoglobin) on the electrocardiograms of anaes-thetized dogs 1 h after coronary artery ligation. Myocardial ischaemia,as judged by the amount of ST-segment elevation in epicardialelectrocardiograms, increased significantly at the lowest carboxy-haemoglobin levels (4.9%) and increased further with increasingcarbon monoxide exposure; there were no changes in heart rate, bloodpressure, left atrial pressure, cardiac output or blood flow to theischaemic myocardium. Similar results were noted by Sekiya et al.(1983), who investigated the influence of carbon monoxide(3400 mg/m3 [3000 ppm] for 15 min followed by 150 mg/m3
[130 ppm] for 1 h; 13–15% carboxyhaemoglobin) on the extent andseverity of myocardial ischaemia in dogs. This dose of carbon monox-ide inhaled prior to coronary artery ligation increased the severity and
Effects on Laboratory Animals
165
extent of ischaemic injury and the magnitude of ST-segment elevationmore than did ligation alone. There were no changes in heart rate orarterial pressure. On the other hand, several groups have reported noeffects of carbon monoxide on the electrocardiogram or on cardiacarrhythmias (Musselman et al., 1959; Malinow et al., 1976). Foster(1981) concluded that carbon monoxide (110 mg/m3 [100 ppm] for6–9 min; 10.4% carboxyhaemoglobin) is not arrhythmogenic in dogsduring the early minutes of acute myocardial infarction followingocclusion of the left anterior descending coronary artery. This level ofcarbon monoxide did not either effect slowing of conduction throughthe ischaemic myocardium or affect the incidence of spontaneousventricular tachycardia. These results were confirmed by Hutcheonet al. (1983) in their investigation of the effects of carbon monoxideon the electrical threshold for ventricular arrhythmias and theeffective refractory period of the heart. They concluded that carbonmonoxide (230 mg/m3 [200 ppm] for 60 and 90 min; 5.1–6.3%carboxyhaemoglobin) does not alter the effective refractory period orthe electrical threshold for ventricular arrhythmias in dogs. Theseresults are consistent with those of Mills et al. (1987), who studied theeffects of 0–20% carboxyhaemoglobin on the electrical stability of theheart in chloralose-anaesthetized dogs during coronary occlusion.There were no major effects on heart rate, mean arterial bloodpressure, effective refractory period, vulnerable period or ventricularfibrillation threshold.
The effects of acute carbon monoxide exposure on cardiacelectrical stability were studied in several canine heart models (Vanoliet al., 1989; Verrier et al., 1990). These workers examined the directeffects of carbon monoxide on the normal and ischaemic heart in theanaesthetized dog as well as possible indirect effects mediated bychanges in platelet aggregability or central nervous system activity inthe conscious dog. In anaesthetized dogs, exposure to carbon monox-ide resulting in carboxyhaemoglobin levels of up to 20% (570 mgcarbon monoxide/m3 [500 ppm] for 90–120 min) had no effect onventricular electrical stability in the normal or acutely ischaemicheart. In a second study using anaesthetized dogs, these workersevaluated the effects of carbon monoxide on platelet aggregability andits effect on coronary flow during partial coronary artery stenosis.Concentrations of carboxyhaemoglobin up to 20% (570 mg carbonmonoxide/m3 [500 ppm] for 60–120 min) did not alter plateletaggregability or its effect on coronary blood flow during stenosis. In
EHC 213: Carbon Monoxide
166
a third model using conscious dogs, these workers studied the effectson the heart of carbon monoxide-elicited changes in central nervoussystem activity. They observed no adverse effects on cardiacexcitability in response to carboxyhaemoglobin levels of up to 20%(230–570 mg carbon monoxide/m3 [200–500 ppm] for 90–120 min)or to 9.7 ± 1.6% carboxyhaemoglobin (29–57 mg carbonmonoxide/m3 [25–50 ppm]) for 24 h.
Farber et al. (1990) studied the effects of acute exposure to car-bon monoxide on ventricular arrhythmias in a dog model of suddencardiac death. In this model, 60% of dogs with a healed anterior myo-cardial infarction will experience ventricular fibrillation during acutemyocardial ischaemia with mild exercise. Dogs that develop ven-tricular fibrillation during acute myocardial ischaemia with exerciseare considered at high risk for sudden death and are defined as“susceptible.” Dogs that survive the test without a fatal arrhythmia areconsidered at low risk for sudden death and are defined as “resistant.”Using this model, Farber et al. (1990) tested the effects of carboxy-haemoglobin levels ranging from 5% to 15% (1700 mg carbon mon-oxide/m3 [1500 ppm] for varying times) in resistant and susceptibledogs. Heart rates increased with increasing carboxyhaemoglobinlevels, but the increase did not become significant until carboxy-haemoglobin levels reached 15%. This trend was observable at rest aswell as during exercise in both resistant and susceptible dogs. Inresistant animals, in which acute myocardial ischaemia is typicallyassociated with bradycardia, this reflex response occurred earlier andwas augmented by exposure to carbon monoxide. In both resistant andsusceptible dogs, carbon monoxide induced a worsening of ventriculararrhythmias in a minority of cases. The ventricular arrhythmias werenot reproducible in subsequent trials. The authors concluded thatacute exposure to carbon monoxide is seldom arrhythmogenic in dogsthat have survived myocardial infarction.
7.2.2 Haemodynamic studies
The effects of carbon monoxide on coronary flow, heart rate,blood pressure, cardiac output, myocardial oxygen consumption andblood flow to various organs have been investigated in laboratoryanimals. The results are somewhat contradictory (partly becauseexposure regimes differed); however, most workers agree that carbonmonoxide in sufficiently high doses can affect many haemodynamicvariables.
Effects on Laboratory Animals
167
Adams et al. (1973) described increased coronary flow and heartrate and decreased myocardial oxygen consumption in anaesthetizeddogs breathing 1700 mg carbon monoxide/m3 (1500 ppm) for 30 min(23.1% carboxyhaemoglobin). The decreased oxygen consumptionindicates that the coronary flow response was not great enough tocompensate for the decreased oxygen availability. The authors notedthat although there was a positive chronotropic response, there was nopositive inotropic response. The authors speculated that (1) the carbonmonoxide may have caused an increase in the endogenous rhythm orblocked the positive inotropic response or (2) the response to carbonmonoxide was mediated through the cardiac afferent receptors to givea chronotropic response without the concomitant inotropic response.When they used $-adrenergic blocking agents, the heart rate responseto carbon monoxide disappeared, suggesting possible reflex mediationby the sympathetic nervous system.
In a later study in chronically instrumented, awake dogs exposedto 1100 mg carbon monoxide/m3 (1000 ppm), producing carboxy-haemoglobin levels of 30%, Young & Stone (1976) reported anincrease in coronary flow with no change in myocardial oxygenconsumption. The increased coronary flow occurred in animals withhearts paced at 150 beats/min, as well as in non-paced animals, andin animals with propranolol and atropine blockade. Because thechanges in coronary flow with arterial oxygen saturation were similarwhether the animals were paced or not, these workers concluded thatthe increase in coronary flow is independent of changes in heart rate.Furthermore, the authors reasoned that if the coronary vasodilationwas caused entirely by the release of a metabolic vasodilator,associated with decreased arterial oxygen saturation, the change incoronary flow in animals with both $-adrenergic and parasympatheticblockade should be the same as in control dogs. Young & Stone(1976) concluded that coronary vasodilation observed with an arterialoxygen saturation reduced by carbon monoxide is mediated partiallythrough an active neurogenic process.
Increased myocardial blood flow after carbon monoxide inhala-tion in dogs was confirmed by Einzig et al. (1980), who also demon-strated the regional nature of the blood flow response. Using labelledmicrospheres, these workers demonstrated that whereas both right andleft ventricular beds were dilated maximally at carboxyhaemoglobinlevels of 41% (17 000–23 000 mg carbon monoxide/m3 [15 000–
EHC 213: Carbon Monoxide
168
20 000 ppm] for 10 min), subendocardial/subepicardial blood flowratios were reduced. The authors concluded that in addition to theglobal hypoxia associated with carbon monoxide poisoning, there isalso an underperfusion of the subendocardial layer, which is mostpronounced in the left ventricle.
The results on the endocardium were confirmed by Kleinert et al.(1980), who reported the effects of lowering oxygen content by about30% with low oxygen or carbon monoxide gas mixtures (11 000 mgcarbon monoxide/m3 [10 000 ppm] for 3 min; 21–28% carboxy-haemoglobin). Regional myocardial relative tissue partial pressure ofoxygen (PO2
), perfusion and small vessel blood content were evaluatedin anaesthetized, thoracotomized rabbits. Both carbon monoxide andhypoxic hypoxia increased regional blood flow to the myocardium andalso, but to a lesser extent, in the endocardium. Relative endocardialPO2
fell more markedly than epicardial PO2 in both conditions. Small
vessel blood content increased more with carbon monoxide than withlow PO2
, whereas regional oxygen consumption increased under bothconditions. The authors concluded that the response to lowered oxy-gen content (whether by inhaling low oxygen or carbon monoxide gasmixtures) is an increase in flow, metabolic rate and the number ofopen capillaries, and the effects of both types of hypoxia appear moresevere in the endocardium.
A decrease in tissue PO2 with carbon monoxide exposure has also
been reported by Weiss & Cohen (1974). These workers exposedanaesthetized rats to 90 and 180 mg carbon monoxide/m3 (80 and160 ppm) for 20-min periods and measured tissue oxygen tension aswell as heart rate. A statistically significant decrease in brain PO2occurred with inhalation of 180 mg carbon monoxide/m3 (160 ppm),but there was no change in heart rate.
Horvath (1975) investigated the coronary flow response in dogswith carboxyhaemoglobin levels of 6.2–35.6% produced by con-tinuous administration of precisely measured volumes of carbonmonoxide. Coronary flow increased progressively as blood carboxy-haemoglobin increased and was maintained for the duration of theexperiment. However, when animals with complete atrioventricularblock were maintained by cardiac pacemakers and were exposed tocarboxyhaemoglobin levels of 6–7%, there was no longer an increasein coronary blood flow. These results are provocative, because they
Effects on Laboratory Animals
169
suggest an increased danger from low carboxyhaemoglobin levels incardiac-disabled individuals.
The effects of carbon monoxide hypoxia and hypoxic hypoxia onarterial blood pressure and other vascular parameters were alsostudied in carotid baroreceptor- and chemoreceptor-denervated dogs(Traystman & Fitzgerald, 1977). Arterial blood pressure wasunchanged by carbon monoxide hypoxia but increased with hypoxichypoxia. Similar results were seen in carotid baroreceptor-denervatedanimals with intact chemoreceptors. Following carotid chemo-denervation, arterial blood pressure decreased equally with both typesof hypoxia.
In a subsequent report from the same laboratory (Sylvester et al.,1979), the effects of carbon monoxide hypoxia (11 000 mg carbonmonoxide/m3 [10 000 ppm] followed by 1100 mg carbon monoxide/m3
[1000 ppm] for 15–20 min; 61–67% carboxyhaemoglobin) andhypoxic hypoxia were compared in anaesthetized, paralysed dogs.Cardiac output and stroke volume increased during both carbonmonoxide and hypoxic hypoxia, whereas heart rate was variable.Mean arterial pressure decreased during carbon monoxide hypoxia butincreased during hypoxic hypoxia. Total peripheral resistance fellduring both hypoxias, but the decrease was greater during the carbonmonoxide hypoxia. After resection of the carotid body, the circulatoryeffects of hypoxic and carbon monoxide hypoxia were the same andwere characterized by decreases in mean arterial pressure and totalperipheral resistance. In a second series of experiments with closed-chest dogs, hypoxic and carbon monoxide hypoxia caused equalcatecholamine secretion before carotid body resection. After carotidbody resection, the magnitude of the catecholamine response wasdoubled with both hypoxias. These workers concluded that theresponses to hypoxic and carbon monoxide hypoxia differ and that thedifference is dependent on intact chemo- and baroreflexes and ondifferences in arterial oxygen tension, but not on differences incatecholamine secretion or ventilatory response.
In cynomolgus monkeys exposed to 570 mg carbon monoxide/m3
(500 ppm) intermittently for 12 h per day for 14 months (21.6%carboxyhaemoglobin), Malinow et al. (1976) reported no changes inarterial pressure, left ventricular pressure, time derivative of pressure(dP/dt) and ventricular contractility. On the other hand, Kanten et al.(1983) studied the effects of carbon monoxide (170 mg/m3 [150 ppm];
EHC 213: Carbon Monoxide
170
carboxyhaemoglobin up to 16%) for 0.5–2 h on haemodynamicparameters in open-chest, anaesthetized rats and reported that heartrate, cardiac output, cardiac index, time derivative of maximal force(aortic) and stroke volume increased significantly, whereas meanarterial pressure, total peripheral resistance and left ventricularsystolic pressure decreased. These effects were evident at carboxy-haemoglobin levels as low as 7.5% (0.5 h). There were no changes instroke work, left ventricular dP/dt maximum and stroke power.
The effects of carbon monoxide on blood flow to various vascularbeds has been investigated in several animal models, but most of thestudies have been conducted at rather high carbon monoxide or car-boxyhaemoglobin levels. In general, carbon monoxide increases cere-bral blood flow.
In recent studies, Oremus et al. (1988) reported that in the anaes-thetized rat breathing carbon monoxide (570 mg/m3 [500 ppm]; 23%carboxyhaemoglobin) for 1 h, carbon monoxide reduces mean arterialpressure through peripheral vasodilation predominantly in the skeletalmuscle vasculature. There were no differences in heart rate or mesen-teric or renal resistance between the carbon monoxide-exposed andcontrol groups. This was confirmed by Gannon et al. (1988), whoreported that in the anaesthetized rat breathing carbon monoxide(570 mg/m3 [500 ppm]; 24% carboxyhaemoglobin) for 1 h, carbonmonoxide increased inside vessel diameter (36–40%) and flow rate(38–54%) and decreased mean arterial pressure to 79% of control inthe cremaster muscle. There was no change in the response of 3Avessels to topical applications of phenylephrine as a result of carbonmonoxide exposure.
King et al. (1984, 1985) compared whole-body and hindlimbblood flow responses in anaesthetized dogs exposed to carbonmonoxide or anaemic hypoxia. Arterial oxygen content was reducedby moderate (50%) or severe (65%) carbon monoxide hypoxia(produced by dialysis with 100% carbon monoxide) or anaemichypoxia (produced by haemodilution). These workers noted thatcardiac output was elevated in all groups at 30 min and in the severecarbon monoxide group at 60 min. Hindlimb blood flow remainedunchanged during carbon monoxide hypoxia in the animals withintact hindlimb innervation but was greater in animals withdenervated hindlimbs. There was a decrease in mean arterial pressurein all groups associated with a fall in total peripheral resistance.
Effects on Laboratory Animals
171
Hindlimb resistance remained unchanged during moderate carbonmonoxide hypoxia in the intact groups but was increased in thedenervated group. The authors concluded that the increase in cardiacoutput during carbon monoxide hypoxia was directed to non-muscleareas of the body and that intact sympathetic innervation was requiredto achieve this redistribution. However, aortic chemoreceptor inputwas not necessary for the increase in cardiac output during severecarbon monoxide hypoxia or for the diversion of the increased flow tonon-muscle tissues.
King et al. (1987) investigated the effects of high carbon monox-ide (1100–11 000 mg/m3 [1000–10 000 ppm] to lower arterial oxygencontent to 5–6 vol %) and hypoxic hypoxia on the contracting gastroc-nemius muscle of anaesthetized dogs. Oxygen uptake decreased fromthe normoxic level in the carbon monoxide group but not in thehypoxic hypoxia group. Blood flow increased in both groups duringhypoxia, but more so in the carbon monoxide group. Oxygen extrac-tion increased further during contractions in the hypoxic group butfell in the carbon monoxide group. The authors observed that the oxy-gen uptake limitation occurring during carbon monoxide hypoxia andisometric contractions was associated with a reduced oxygen extrac-tion and concluded that the leftward shift in the oxyhaemoglobin dis-sociation curve during carbon monoxide hypoxia may have impededoxygen extraction.
Melinyshyn et al. (1988) investigated the role of $-adreno-receptors in the circulatory responses of anaesthetized dogs to severecarbon monoxide (about a 63% decrease in arterial oxygen contentobtained by dialysing with 100% carbon monoxide). One group was$-blocked with propranolol ($1 and $2 blockade), a second was $-blocked with ICI 118,551 ($2 blockade) and a third was a timecontrol. Cardiac output increased in all groups during carbonmonoxide hypoxia, with the increase being greatest in theunblockaded group. Hindlimb blood flow rose during carbonmonoxide hypoxia only in the unblockaded group. The authorsconcluded that 35% of the rise in cardiac output occurring duringcarbon monoxide hypoxia depended on peripheral vasodilationmediated through $2-adrenoreceptors.
7.2.3 Cardiomegaly
The early investigations of cardiac enlargement followingprolonged exposure to carbon monoxide have been confirmed in
EHC 213: Carbon Monoxide
172
different animal models and extended to characterize the developmentand regression of the cardiomegaly. Theodore et al. (1971) reportedcardiac hypertrophy in rats breathing 460 mg carbon monoxide/m3
(400 ppm) for the first 71 days, followed by 570 mg/m3 (500 ppm) forthe remaining 97 days, but not in dogs, baboons or monkeys receivingthe same carbon monoxide exposure. Penney et al. (1974a) also notedcardiomegaly in rats breathing 570 mg carbon monoxide/m3
(500 ppm); heart weights were one-third greater than predicted forcontrols within 14 days of exposure and were 140–153% of controlsafter 42 days of exposure. The cardiomegaly was accompanied bychanges in cardiac lactate dehydrogenase isoenzyme composition thatwere similar to those reported in other conditions that cause cardiachypertrophy (e.g., aortic and pulmonary artery constriction, coronaryartery disease, altitude acclimation, severe anaemia).
To further characterize the hypertrophy and determine itsthreshold, Penney et al. (1974b) measured heart weights in ratsexposed continuously to 110, 230 or 570 mg carbon monoxide/m3
(100, 200 or 500 ppm; 9.26, 15.82 and 41.14% carboxyhaemoglobin)for various times (1–42 days); they noted significant increases in heartweights at 230 and 570 mg carbon monoxide/m3 (200 and 500 ppm),with changes occurring in the left ventricle and septum, rightventricle and especially the atria. The authors concluded that whereasthe threshold for an increased haemoglobin response is 110 mgcarbon monoxide/m3 (100 ppm; 9.26% carboxyhaemoglobin), thethreshold for cardiac enlargement is near 230 mg carbonmonoxide/m3 (200 ppm; 12.03% carboxyhaemoglobin); unlike cardiachypertrophy caused by altitude, which primarily involves the rightventricle, cardiac hypertrophy caused by carbon monoxide involvesthe whole heart.
The regression of cardiac hypertrophy in rats exposed continu-ously to moderate (460 mg/m3 [400 ppm]; 35% carboxyhaemoglobin)or severe (570–1300 mg/m3 [500–1100 ppm]; 58% carboxyhaemo-globin) carbon monoxide for 6 weeks was followed by Styka & Penney(1978). Heart weight to body weight ratio increased from 2.65 incontrols to 3.52 and 4.01 with moderate and severe carbon monoxideexposure, respectively. Myocardial lactate dehydrogenase M subunitswere elevated 5–6% by moderate and 12–14% by severe carbonmonoxide exposure. Forty-one to 48 days after terminating the carbonmonoxide exposure, haemoglobin concentrations among groups did
Effects on Laboratory Animals
173
not differ significantly; heart weight to body weight values weresimilar in the control and moderately exposed animals, but remainedsignificantly elevated in the severely exposed animals.
In addition to cardiomegaly, Kjeldsen et al. (1972) reportedultrastructural changes in the myocardium of rabbits breathing 210mg carbon monoxide/m3 (180 ppm; 16.7% carboxyhaemoglobin) for2 weeks. The changes included focal areas of necrosis of myofibrilsand degenerative changes of the mitochondria. In addition, varyingdegrees of injury were noted in the blood vessels. These includedoedema in the capillaries, stasis and perivascular haemorrhages on thevenous side and endothelial swelling, subendothelial oedema anddegenerative changes in myocytes on the arterial side.
The haemodynamic consequences of prolonged carbon monoxideexposure have been examined in rats breathing 570 mg carbonmonoxide/m3 (500 ppm; 38–42% carboxyhaemoglobin) for 1–42 days(Penney et al., 1979) and in goats breathing 180–250 mg carbonmonoxide/m3 (160–220 ppm; 20% carboxyhaemoglobin) for 2 weeks(James et al., 1979). In rats, cardiomegaly developed; stroke index,stroke power and cardiac index increased; and total systemic andpulmonary resistances decreased. Left and right ventricular systolicpressures, mean aortic pressure, maximum left ventricular dP/dt andheart rate did not change significantly. Penney et al. (1979) concludedthat enhanced cardiac output, via an increased stroke volume, is acompensatory mechanism to provide tissue oxygenation during carbonmonoxide intoxication and that increased cardiac work is the majorfactor responsible for the development of cardiomegaly. In chronicallyinstrumented goats, James et al. (1979) noted that cardiac index,stroke volume, left ventricular contractility and heart rate were allunchanged during exposure to carbon monoxide but were depressedsignificantly during the first week following termination of theexposure. Discrepancies between the Penney et al. (1979) and Jameset al. (1979) studies may be the result of differences in the carbonmonoxide concentrations or in the species used.
Penney et al. (1984) studied the compliance and measured thedimensions of hypertrophied hearts from rats breathing 570 mgcarbon monoxide/m3 (500 ppm; 38–40% carboxyhaemoglobin) for38–47 days. Heart weight to body weight ratios increased from 2.69to 3.34. Although compliance of the right and left ventricles was
EHC 213: Carbon Monoxide
174
higher in the carbon monoxide group, the differences disappearedwhen the heart weight was normalized by body weight. Leftventricular apex-to-base length and left ventricular outside diameterincreased 6.4 and 7.3%, respectively; there were no changes in leftventricle, right ventricle or septum thickness. The authors concludedthat chronic carbon monoxide exposure produces eccentriccardiomegaly with no intrinsic change in wall stiffness.
The consequences of breathing carbon monoxide have also beeninvestigated in perinatal animals. Postnatal exposures are describedhere; the effects of prenatal exposure to carbon monoxide arediscussed in section 7.6.4.2.
Penney & Weeks (1979) examined the effects of inhaling 570 mgcarbon monoxide/m3 (500 ppm; 38–42% carboxyhaemoglobin) until50 days of age on cardiac growth in young (5 days) and old (25 days)rats. They observed that the younger rats experienced the greaterchange in heart weight and DNA synthesis and concluded that thepotential for cardiac DNA synthesis and muscle cell hyperplasia endsin rats during the 5th through 25th days of postnatal development.
Penney et al. (1980) compared the effects of prenatal carbonmonoxide exposure in Sprague-Dawley rats at a dose of 230 mg/m3
(200 ppm) with exposure both prenatally and neonatally until age29 days. Neonatal carbon monoxide concentrations were elevated to570 mg/m3 (500 ppm). Cardiomegaly and depressed haemoglobin,haematocrit and red blood cell counts were found following carbonmonoxide exposure. In subjects allowed to survive until youngadulthood, the heart weight to body weight ratios of subjects receivingcarbon monoxide both prenatally and neonatally were still elevated,whereas those in the prenatal carbon monoxide condition did notdiffer from control subjects in this measure.
Ventricular weights (wet and dry) and myocyte size and volumewere measured in perinatal rats exposed to 230 mg carbon monoxide/m3 (200 ppm) by Clubb et al. (1986). Pregnant rats were exposed toair or carbon monoxide, and, at birth, pups from these two groupswere subdivided into four groups: (1) control group (air/air), whichwas maintained in air in utero and postpartum; (2) air/carbonmonoxide group, which received carbon monoxide postpartum only;(3) carbon monoxide/carbon monoxide group, which received carbon
Effects on Laboratory Animals
175
monoxide in utero and postpartum; and (4) carbon monoxide/airgroup, which received carbon monoxide in utero but was maintainedin air postpartum. Right ventricle weights were increased in animalsexposed to carbon monoxide during the fetal period, but left ventricleweights were increased by carbon monoxide during the neonatalperiod. Although heart weight to body weight ratios increased to thoseof the carbon monoxide/carbon monoxide group by 12 days of age inanimals exposed to carbon monoxide postnatally only (air/carbonmonoxide), heart weight to body weight ratios decreased to those ofcontrols (air/air) by 28 days of age in animals exposed to air post-natally following fetal carbon monoxide exposure (carbon monoxide/air). There was no difference in myocyte volume between groups atbirth. Left ventricle plus septum and right ventricle cell volumes ofthe carbon monoxide/carbon monoxide group were smaller than thoseof the controls at 28 days of age despite the heavier wet and dryweights of the carbon monoxide/carbon monoxide neonates. At birth,the carbon monoxide-exposed animals had more myocytes in the rightventricle than the air-exposed controls; carbon monoxide exposureafter birth resulted in left ventricular hyperplasia.
Clubb et al. (1986) concluded that the increased haemodynamicload caused by carbon monoxide during the fetal period results incardiomegaly, characterized by myocyte hyperplasia, and this cellularresponse is sustained throughout the early neonatal period in animalsexposed to carbon monoxide postpartum.
Penney et al. (1993) investigated whether carbon monoxide expo-sure in the developing heart produces long-lasting alterations incoronary vasculature. One-day-old male rat pups exposed to 530 mgcarbon monoxide/m3 (500 ppm) continuously for 30 days weresacrificed at 61 and 110 days of age. Morphometric analysis wasperformed on the fixed hearts. There were no significant differencesin the number of small (27–114 :m) or larger (>114 :m) vessels inany heart region. The septum in the carbon monoxide-exposed ratswas an exception; there were more small veins at 61 days of age andmore larger veins at 110 days of age. There was a significant increasein the number of small arteries at both ages in the carbon monoxide-exposed rats across all heart regions and in the smaller veins at 61days of age. The large vessels in the septum at 61 days of age had asignificantly greater diameter in the carbon monoxide-exposedcompared with the air-exposed rats. This was also true for the large
EHC 213: Carbon Monoxide
176
arteries in the septum and right ventricle of the 110-day-old rats.Taking all heart regions together, the large arteries in carbonmonoxide-exposed rats were larger than those in air-exposed rats.Previous carbon monoxide exposure significantly increased largeartery and total cross-sectional area in the septum and right ventricleat 61 days of age and in the right ventricle at 110 days of age. Totalcross-sectional area of veins in the septum was also increased. Takingall heart regions together, carbon monoxide significantly increasedsmall artery cross-sectional area at 61 days of age and small, largeand total artery cross-sectional area at 110 days of age. With oneexception (small veins, 110 days of age), there was no effect of carbonmonoxide on vein cross-sectional area. These changes resulted in anincrease in the percentage of total cross-sectional area contributed bythe larger vessels. Pathological examination showed nothingabnormal. The results suggest profound and persistent changes incoronary vessel architecture following chronic neonatal carbonmonoxide exposure.
Penney et al. (1992) determined whether the cardiomegalyproduced by carbon monoxide is related to the development ofpulmonary hypertension, as is known to occur at high altitude. New-born rats were exposed to 570 mg carbon monoxide/m3 (500 ppm) for32 days at Detroit, Michigan, USA, or to 3500 m simulated altitudeat Fort Collins, Colorado, USA. Right ventricle and left ventricle plusseptum masses in the carbon monoxide-exposed rats were increased38.0% and 37.4%, respectively, relative to air-maintained controls.Right ventricle and left ventricle plus septum masses in the altitudegroup were increased 55.7% and 9.3%, respectively, relative to con-trols. Cardiac hypertrophy declined in the carbon monoxide andaltitude groups post-exposure but remained significantly above thecontrols for the right ventricle at 145 days of age. By use of an in vitropreparation, pulmonary vascular resistance and pulmonary arterialpressure were significantly increased immediately after altitude butnot after carbon monoxide exposure and remained elevated inadulthood after altitude exposure. Pulmonary vascular resistance wascorrelated with haematocrit in altitude-exposed but not in carbonmonoxide-exposed rats.
Bambach et al. (1991) performed in situ assessment of cardio-megaly in rats exposed to 570 mg carbon monoxide/m3 (500 ppm) for0–62 days using nuclear magnetic resonance imaging. Following finalimaging, the rats were sacrificed and heart mass was determined. The
Effects on Laboratory Animals
177
mean outside diameter of the left ventricle plus septum showed astrong correlation with the duration of carbon monoxide exposure,whereas the correlation coefficients for the left ventricle plus septumlumen diameter and wall thickness were marginally significant. Themean pleural space diameter also increased significantly (r = 0.64,P < 0.05) with duration of carbon monoxide exposure. The resultsachieved with nuclear magnetic resonance imaging are consistentwith past morphological studies of carbon monoxide-induced cardio-megaly, where heart dimensions were determined in relaxed frozentissue, and corroborate the eccentric nature of the cardiomegaly.
The stimulus for carbon monoxide-induced cardiomegaly wasinvestigated by Penney & Formolo (1993). Rats were exposed to570 mg carbon monoxide/m3 (500 ppm) for 30 days, some receivingthe $1-adrenergic blocker atenolol, others the "1-adrenergic blockingagent prazosin. Systolic blood pressure was significanly lowered bycarbon monoxide and by atenolol at a high dose. Carbon monoxidealone resulted in 30–43% and 18–25% weight increases in rightventricle and left ventricle plus septum, respectively. Neither low- norhigh-dose prazosin significantly decreased right ventricle and leftventricle plus septum weights in the carbon monoxide-exposed rats.Low-dose atenolol failed to alter right ventricle and left ventricle plusseptum weights in the carbon monoxide-exposed rats, whereas high-dose atenolol significantly increased right ventricle weight in thecarbon monoxide-exposed rats. Thus, carbon monoxide-inducedcardiomegaly develops in spite of lowered systolic blood pressure andthe blockade of either "1 or $1 receptors. The results suggest thepotentially powerful role of enhanced preload in drivingcardiomegaly.
7.2.4 Haematology studies
Increase in haemoglobin concentration, as well as haematocritratio, is a well-documented response to hypoxia that serves to increasethe oxygen carrying capacity of the blood. Guyton & Richardson(1961) and Smith & Crowell (1967), however, suggested that changesin haematocrit ratio not only affect the oxygen carrying capacity of theblood, but affect blood flow as well. Therefore, when haematocritratios increase much above normal, oxygen delivery to the tissues maybe reduced, because the resultant decrease in blood flow can morethan offset the increased oxygen carrying capacity of the blood. Smith& Crowell (1967) concluded that there is an optimum haematocrit
EHC 213: Carbon Monoxide
178
ratio at sea level that shifts to a higher value with altitude acclimation.Presumably a similar compensation would occur when oxygen trans-port is reduced by carbon monoxide; however, experimental evidenceis needed to confirm these relationships.
Changes in haemoglobin concentration and haematocrit ratiohave been reported in numerous animal studies. In dogs exposed to57 mg carbon monoxide/m3 (50 ppm; 7.3% carboxyhaemoglobin) for3 months, Musselman et al. (1959) reported a slight increase inhaemoglobin concentration (12%), haematocrit ratio (10%) and redblood cells (10%). These observations were extended by Jones et al.(1971) to include several species of animals exposed to 58 mg carbonmonoxide/m3 (51 ppm) or more (3.2–20.2% carboxyhaemoglobin),intermittently or continuously, for up to 90 days. There were no signi-ficant increases in the haemoglobin or haematocrit values observed inany of the species at 58 mg carbon monoxide/m3 (51 ppm; 3.2–6.2%carboxyhaemoglobin). At 110 mg carbon monoxide/m3 (96 ppm;4.9–12.7% carboxyhaemoglobin), significant increases were noted inthe haematocrit value for monkeys (from 43% to 47%) and in thehaemoglobin (from 14.0g% to 16.49g%) and haematocrit values(from 46% to 52%) for rats. Haemoglobin and haematocrit valueswere elevated in rats (by 14% and 10%, respectively), guinea-pigs(8% and 10%, respectively) and monkeys (34% and 26%,respectively) exposed to 230 mg carbon monoxide/m3 (200 ppm;9.4–12.0% carboxyhaemoglobin); they were also elevated in dogs, butthere were too few animals to determine statistical significance.However, in dogs exposed to carbon monoxide (220 mg/m3
[195 ppm]; 30% carboxyhaemoglobin) for 72 h, Syvertsen & Harris(1973) reported that haematocrit and haemoglobin increased from50.3% to 57.8% and from 15.0g% to 16.2g%, respectively. Thedifferences in haematocrit and haemoglobin occurred after a 72-hexposure and were attributed to increased erythropoiesis. Because nomeasurements were made, however, the possibility of spleniccontraction cannot be excluded. Penney et al. (1974b) observedsignificant increases in haemoglobin (from 15.6g% to 16.7g%) in ratsexposed to 110 mg carbon monoxide/m3 (100 ppm) over several weeksand concluded that the threshold for an increased haemoglobinresponse is close to 110 mg/m3 (100 ppm; 9.26% carboxyhaemo-globin).
Several groups have reported no change in haemoglobin orhaematocrit following carbon monoxide exposure. Thus, Preziosiet al. (1970) observed no significant change in haemoglobin
Effects on Laboratory Animals
179
concentration in dogs exposed to 57 or 110 mg carbon monoxide/m3
(50 or 100 ppm; 2.6–12.0% carboxyhaemoglobin) for 6 weeks. Inmonkeys exposed to 23 or 74 mg carbon monoxide/m3 (20 and65 ppm; 1.9–10.2% carboxyhaemoglobin) for 2 years, Eckardt et al.(1972) noted no compensatory increases in haemoglobinconcentration or haematocrit ratio. In mice exposed 5 days per weekto 57 mg carbon monoxide/m3 (50 ppm) for 1–3 months, Stupfel &Bouley (1970) observed no significant increase in haemoglobin.
Interestingly, in fetuses removed from pregnant rats after 21 daysof exposure to carbon monoxide, Prigge & Hochrainer (1977) reporteda significant increase in fetal haematocrit (from 33.3% to 34.5%) at69 mg/m3 (60 ppm) and a significant decrease in haemoglobin andhaematocrit at 290 mg/m3 (250 ppm) (from 9.1g% to 8.0g% and from33.3% to 28.4%, respectively) and 570 mg/m3 (500 ppm) (from 9.1g%to 6.5g% and from 33.3% to 21.9%, respectively). These results wereconfirmed by Penney et al. (1980), who reported significantly lowerhaemoglobin (12.6g% versus 15.8g%), haematocrit (46.2% versus54.4%) and red blood cell counts (27.2% versus 29.1%) in newbornsfrom pregnant rats exposed to 230 mg carbon monoxide/m3 (200 ppm;27.8% carboxyhaemoglobin) for the final 18 days of development thanin controls. However, in a later study, Penney et al. (1983) reportedthat although red blood cell counts were depressed in neonates frompregnant rats exposed to 180, 190 or 230 mg carbon monoxide/m3
(157, 166 or 200 ppm; 21.8–33.5% carboxyhaemoglobin) for the last17 of 22 gestation days, mean corpuscular haemoglobin and volumewere elevated.
The results from animal studies indicate that inhaled carbonmonoxide can increase haemoglobin concentration and haematocritratio. Small increases in haemoglobin and haematocrit probablyrepresent a compensation for the reduction in oxygen transport causedby carbon monoxide; excessive increases in haemoglobin and haemat-ocrit may impose an additional workload on the heart andcompromise blood flow to the tissue. The oxygen transport system ofthe fetus is especially sensitive to carbon monoxide inhaled by themother.
7.2.5 Atherosclerosis and thrombosis
There is little evidence to conclusively support a relationshipbetween carbon monoxide exposure and atherosclerosis in animalmodels.
EHC 213: Carbon Monoxide
180
Astrup et al. (1967) described atheromatosis as well as increasedcholesterol accumulation in aortas from rabbits fed cholesterol andexposed to carbon monoxide (190–400 mg/m3 [170–350 ppm];17–33% carboxyhaemoglobin) for 10 weeks. These observations werenot supported, however, by Webster et al. (1970), who observed nochanges in the aorta or carotid arteries or in serum cholesterol levelsin squirrel monkeys fed cholesterol and exposed intermittently tocarbon monoxide (110–340 mg/m3 [100–300 ppm]; 9–26% carboxy-haemoglobin) for 7 months; they did note enhanced atherosclerosis inthe coronary arteries. Davies et al. (1976) confirmed that coronaryartery atherosclerosis was significantly higher in rabbits fed choles-terol and exposed intermittently to carbon monoxide for 10 weeks(290 mg/m3 [250 ppm]; 20% carboxyhaemoglobin), but they alsoreported no significant differences between groups in aortic concen-trations of triglycerides, cholesterol, phospholipids or plasma choles-terol.
In cynomolgus monkeys fed cholesterol and exposed inter-mittently to carbon monoxide for 14 months (57–570 mg/m3
[50–500 ppm]; 21.6% carboxyhaemoglobin), Malinow et al. (1976)observed no differences in plasma cholesterol levels or in coronary oraortic atherosclerosis. Armitage et al. (1976) confirmed that inter-mittent carbon monoxide (170 mg/m3 [150 ppm] for 52 and 84 weeks;10% carboxyhaemoglobin) did not enhance the extent or severity ofatherosclerosis in the normal white Carneau pigeon. Although carbonmonoxide exposure did increase the severity of coronary arteryatherosclerosis in birds fed cholesterol, the difference between groups,noted at 52 weeks, was not present after 84 weeks.
Stender et al. (1977) exposed rabbits that were fed high levels ofcholesterol to carbon monoxide for 6 weeks continuously andintermittently (230 mg/m3 [200 ppm]; 17% carboxyhaemoglobin). Inthe cholesterol-fed group, carbon monoxide had no effect on free andesterified cholesterol concentrations in the inner layer of the aorticwall. In the normal group, carbon monoxide increased the concentra-tion of cholesterol in the aortic arch, but there was no difference in thecholesterol content of the total aorta.
Hugod et al. (1978), using a blind technique and the samecriteria to assess intimal damage as were used in earlier studies(Kjeldsen et al., 1972; Thomsen, 1974; Thomsen & Kjeldsen, 1975),
Effects on Laboratory Animals
181
noted no histological changes in the coronary arteries or aorta inrabbits exposed to carbon monoxide (230, 2300 or 4600 mg/m3 [200,2000 or 4000 ppm]) for 0.5–12 weeks. These workers suggested thatthe positive results obtained earlier were due to the non-blindevaluation techniques and the small number of animals used. Later,Hugod (1981) confirmed these negative results using electronmicroscopy.
Only a few studies published since 1979 have demonstrated asignificant atherogenic effect of low-level carbon monoxide exposure.Turner et al. (1979) showed that carbon monoxide enhanced thedevelopment of coronary artery lesions in white Carneau pigeons thatwere fed a diet of 0.5% and 1%, but not 2%, cholesterol. The exposurewas to 170 mg carbon monoxide/m3 (150 ppm) for 6 h per day, 5 daysper week, for 52 weeks (10–20% carboxyhaemoglobin). Plasmacholesterol levels may have been increased slightly by the carbonmonoxide, but this was significant (P < 0.5) only at week 11.Marshall & Hess (1981) exposed mini-pigs to 180, 210 or 480 mgcarbon monoxide/m3 (160, 185 or 420 ppm) for 4 h per day for 1–16days (5–30% carboxyhaemoglobin). The higher concentrations wereassociated with adhesion of platelets to arterial endothelium and tofossae of degenerated endothelial cells. Additional changes at thehigher concentration included an increased haematocrit, an increasein blood viscosity and an increase in platelet aggregation.
Alcindor et al. (1984) studied rabbits with induced hypercholes-terolaemia. Three sets of rabbits were studied. The first was a controlgroup receiving a normal diet and breathing air. The second groupwas fed a 2% cholesterol diet. The third group was fed the same dietand was exposed to 170 mg carbon monoxide/m3 (150 ppm). Carboxy-haemoglobin levels were not reported. Low-density lipoprotein parti-cles in the carbon monoxide-exposed rabbits were richer in cholesteroland had a higher cholesterol-to-phospholipid molar ratio than did theparticles from the non-exposed rabbits after 45 days (P < 0.01).
Other animal studies have given generally negative results. Binget al. (1980) studied cynomolgus monkeys. Four animals were used ascontrols, and seven were exposed to carbon monoxide at a level of460 mg/m3 (400 ppm) for 10 alternate half-hours of each day duringa 12-month period. Carboxyhaemoglobin levels showed a gradualincrease to a peak at 5 h of 20%. The monkeys had no histologicalevidence of atherosclerosis, vessel wall damage or fat deposition in
EHC 213: Carbon Monoxide
182
the arterial wall. There was no significant change in cholesterol or inlipoprotein levels. High-density to total cholesterol ratios did notdiffer between the carbon monoxide-exposed and air-exposed animals.These animals were on a normal diet with no augmentation ofcholesterol or fat content. The study demonstrated that even highlevels of carbon monoxide exposure are not invariably followed byarterial injury or abnormal lipid accumulation.
Similar negative results were reported by Sultzer et al. (1982),who studied swine. Pigs with and without von Willebrand’s diseasewere divided into groups that were exposed to intermittent, low-levelcarbon monoxide or to air. Carbon monoxide was delivered at115 mg/m3 (100 ppm) for 8 h each weekday for 4 months. Carboxy-haemoglobin levels averaged 7% after 5 h of exposure. The degree ofcoronary and aortic atherosclerotic lesion development in response toa 2% cholesterol diet was similar in the two exposure groups. Therewas no effect of ambient carbon monoxide on the degree of hyper-cholesterolaemia induced by the diet. The findings showed no obviouseffect of carbon monoxide on atherogenesis in hypercholesterolaemicpigs.
Penn et al. (1992) and Penn (1993) reported negative results inthe cockerel model, which is sensitive to modulation by environmentalagents. The plaque volume percentage in the aortic walls of experi-mental and control animals was determined after exposures to 57,110, 170 or 230 mg carbon monoxide/m3 (50, 100, 150 or 200 ppm),2 h per day, 5 days per week, for 16 weeks. Chronic carbon monoxideexposures, either alone or in combination with a low-cholesterol diet,did not stimulate arteriosclerotic plaque development in cockerels.Exposure to carbon monoxide after large plaques had developed, asa result of either a high-cholesterol diet or injections with dimethyl-benz[a]anthracene, also did not stimulate any further plaque develop-ment. Although levels of carboxyhaemoglobin measured 10 min afterthe highest exposures were approximately 11–12%, it was apparentthat birds eliminate carbon monoxide more rapidly than mammals. Asa result, it was not clear if carboxyhaemoglobin levels were sufficient-ly elevated for a long enough period of time to draw any definitiveconclusions from these experiments.
A number of studies have examined the contribution of carbonmonoxide in cigarette smoke to the purported effects of smoking on
Effects on Laboratory Animals
183
atherogenesis and thrombosis. Rogers et al. (1980) fed a high-cholesterol diet to 36 baboons for up to 81 weeks. The animals weretaught to puff either cigarette smoke or air from smoking machines ina human-like manner using operant conditioning with a water reward.Half of the baboons smoked 43 cigarettes each day. The baboons weregiven a cigarette or sham every 15 min during a 12-h day, exceptduring times of blood drawing. Average carboxyhaemoglobin levelsin smokers were about 1.9%. Only slight differences in the very-low-density and high-density lipoprotein levels were noted between thesmokers and non-smokers. Additionally, platelet aggregation withadenosine 5U-phosphate and collagen was similar in the two groups.
Rogers et al. (1988) extended their previous study of malebaboons for an additional 1.2 years of diet and smoking (total diet,3.2 years; total smoking, 2.8 years). They also studied a separategroup of 25 female baboons that received the diet for 2.6 years andwere exposed to cigarette smoke for 1.6 years. Blood levels of carbonmonoxide were determined by gas chromatography and were reportedboth as total concentration in millilitres per decilitre and as percentsaturation of haemoglobin, as calculated by a validated linearregression equation. Levels of carboxyhaemoglobin in the malebaboons averaged 0.64% at baseline, whereas carboxyhaemoglobinwas on average 0.35% in female baboons at baseline. The weeklyaverages of carboxyhaemoglobin levels determined after 57 weekswere 2.01% and 1.13% in male and female baboons, respectively. Thebaseline cholesterol levels were 105 mg/dl and 88 mg/dl in the twogroups of baboons. Levels at 16 weeks were 226 mg/dl in males and291 mg/dl in females. There were no significant differences in totalcholesterol, high-density lipoprotein cholesterol or low-density lipo-protein cholesterol between smokers and controls. There were slightlymore fatty streaks and fibrous lesions in the carotid arteries ofsmokers than in controls. No differences in lesion prevalence,vascular content of lipids or prostaglandins were seen in aorta orcoronary arteries.
The results reported by Rogers et al. (1980, 1988) suggest little,if any, effect of cigarette smoking on atherosclerotic lesion develop-ment in baboons. Whether these findings can be extrapolated toeffects of smoking in humans is difficult to determine. The carboxy-haemoglobin levels attained in the experimental animals were barely2%. Levels in human smokers are probably 4% or more during thewaking hours of the day. On the other hand, the findings are
EHC 213: Carbon Monoxide
184
consistent with most studies of the effects of low levels of carbonmonoxide on atherogenesis.
A study of cockerels by Penn et al. (1983) has shown negativeresults as well. Three groups of cockerels, each including sevenanimals, were used to determine if the atherogenic effect of cigarettesmoke could be separated from an effect due solely to carbonmonoxide. Cockerels develop aortic fibromuscular atheroscleroticlesions spontaneously. Various agents, including some carcinogens,have been shown to accelerate the growth in thickness and extent ofthese lesions. The authors used this model by exposing one group ofanimals to the smoke from 40 cigarettes each day for 5 days per week.The cockerels were exposed from about 6 weeks of age until about22 weeks of age. A similar group of animals was exposed to carbonmonoxide calibrated to give a similar carboxyhaemoglobin level tothat achieved in the animals exposed to cigarette smoke. The thirdgroup of animals was exposed to filtered air. Carboxyhaemoglobinlevels following an exposure session were measured at 6, 9, 12 and15 weeks. The average level in the air-exposed animals was 1.6%.Levels in the cigarette smoke and carbon monoxide groups were6.7% and 7.2%, respectively. Atherosclerosis was quantified both bythe extent of the aorta involved and by the cross-sectional area of theintimal thickening. The cigarette smoke-exposed group had moreaortic lesions and lesions with greater cross-sectional area than dideither the carbon monoxide-exposed group or the air-exposed group.This difference was significant at P < 0.05 in a one-tailed chi-squaretest. The data suggest that atherogenic effects of cigarette smoke arenot solely attributable to carbon monoxide.
It has been postulated that a possible atherogenic effect of carbonmonoxide may be mediated through an ability of carbon monoxide toenhance platelet aggregation or some other component of thrombosis.This possibility was raised in the study by Marshall & Hess (1981)noted above. Other studies, however, have demonstrated that theeffect of carbon monoxide is to depress platelet aggregation. In onestudy (Mansouri & Perry, 1982), platelet aggregation in response toepinephrine and arachidonic acid was reduced in in vitro experimentsin which carbon monoxide was bubbled through platelet-rich plasma.Similarly, platelets from smokers aggregated less well than plateletsfrom non-smokers, although this inhibition of aggregation was notcorrelated with the level of carboxyhaemoglobin.
Effects on Laboratory Animals
185
Madsen & Dyerberg (1984) extended these observations bystudying the effects of carbon monoxide and nicotine on bleeding timein humans. Smoke from high-nicotine cigarettes caused a significantshortening of the bleeding time, whereas smoke from low-nicotinecigarettes caused no significant change in bleeding time. Carbonmonoxide inhalation sufficient to raise carboxyhaemoglobin to 15%was followed by a shortening of the bleeding time (6.0–4.8 min), butfor a short period of time (<1.5 h). After administration of acetyl-salicylic acid (Aspirin), neither nicotine nor carbon monoxide affectedbleeding times or platelet aggregation. The findings suggest that thepro-aggregating effects of cigarette smoke are mediated through aninhibitory effect of nicotine on prostacyclin (PGI2) production. Effectsof carbon monoxide in the smoke seem to be minor and short-lived.
These findings were corroborated by Renaud et al. (1984), whostudied the effects of smoking cigarettes of varying nicotine contenton plasma clotting times and on aggregation of platelets withthrombin, adenosine diphosphate, collagen and epinephrine in10 human subjects. Both the clotting functions and platelet aggre-gation were increased with increasing nicotine content in cigarettes.There was no correlation of these parameters, however, with carboxy-haemoglobin levels. The carboxyhaemoglobin levels were increasedapproximately 60% above baseline levels.
Effeney (1987) provided convincing evidence that these effectsof nicotine and carbon monoxide on platelet function are mediatedthrough opposing effects on PGI2 production. Four rabbits wereexposed to 460 mg carbon monoxide/m3 (400 ppm) in an exposurechamber for 7–10 days. Carboxyhaemoglobin levels averaged about20%. Ten rabbits received an infusion of nicotine for 7–10 days. Full-thickness samples of atrial and ventricular myocardium wereincubated with arachidonic acid for determination of PGI2 productionby radioimmunoassay of 6-keto-PGF1" (a stable metabolite of PGI2)and by inhibition of platelet aggregation. Carbon monoxide exposureincreased PGI2 production, which was significant in the ventricularmyocardium. Nicotine exposure reduced PGI2 production in all tissuesexamined. The combination of nicotine and carbon monoxide causeda net increase in PGI2 production. The effect of carbon monoxide maybe to induce hypoxaemia, a known stimulant of PGI2 production. Thiseffect of carbon monoxide would serve to reduce aggregation.
EHC 213: Carbon Monoxide
186
Another explanation for the inhibition of platelet aggregation bycarbon monoxide exposure has been provided by Bruene & Ullrich(1987). These investigators bubbled carbon monoxide throughplatelet-rich plasma and then challenged the platelets with variousagonists. The carbon monoxide exposure was much greater than thatencountered in physiological or even toxic states. The results,however, indicated that inhibition of aggregation was related toenhancement of guanylate cyclase action and associated increasedcyclic guanosine monophosphate levels.
7.3 Respiratory system
7.3.1 Pulmonary morphology
Laboratory animal studies by Niden & Schulz (1965) and Feinet al. (1980) found that very high levels of carbon monoxide (5700–11 000 mg/m3 [5000–10 000 ppm]) for 15–45 min were capable ofproducing capillary endothelial and alveolar epithelial oedema in ratsand rabbits, respectively. These effects of carbon monoxide have notbeen reported, however, at lower levels of carbon monoxide exposure.
In a small number (n = 5) of New Zealand white rabbits, Feinet al. (1980) reported a significant increase in the permeability of51Cr-labelled ethylenediaminetetraacetic acid from alveoli to arterialblood within 15 min after the start of exposure to 0.8% (9200 mg/m3
[8000 ppm]) carbon monoxide. Passage of this labelled markerpersisted and increased throughout the remaining 30 min of the study.The mean carboxyhaemoglobin level after exposure was 63 ± 4%(mean ± standard error). Although morphometric examination wasnot performed, transmission electron microscopy showed evidence ofcapillary endothelial and alveolar epithelial swelling and oedemaalong with detachment of the endothelium from the basementmembrane. Mitochondria were disintegrated, and alveolar Type 2cells were depleted of lamellar bodies. None of these effects was foundin four control animals exposed to air.
Despite an increase in gross lung weight, Penney et al. (1988)were unable to demonstrate any evidence of oedema in the lungs ofmale albino rats after 7.5 weeks of exposure to incrementallyincreasing concentrations of carbon monoxide ranging from 290 to1500 mg/m3 (250 to 1300 ppm). The authors also reported that this

Effects on Laboratory Animals
187
effect was not due to increased blood volume in the lung or fibrosis,as measured by lung hydroxyproline content. There was, therefore, noobvious explanation other than general growth for the lung hyper-trophy reported in this study after chronic exposure to high concen-trations of carbon monoxide.
Fisher et al. (1969) failed to find any histological changes in thelungs of mongrel dogs exposed to carbon monoxide concentrations of9200–16 000 mg/m3 (8000–14 000 ppm) for 14–20 min (up to 18%carboxyhaemoglobin). Similarly, no morphological changes werefound by Hugod (1980) in the lungs of adult rabbits continuouslyexposed to 230 mg carbon monoxide/m3 (200 ppm) for up to 6 weeks(11.9–19% carboxyhaemoglobin) or to 2200 mg carbon monoxide/m3
(1900 ppm) for 5 h (31–39% carboxyhaemoglobin).
Niden (1971) speculated about possible effects of low levels ofcarbon monoxide on cellular oxidative pathways when he reportedthat exposure of mice to concentrations of carbon monoxide rangingfrom 57 to 100 mg/m3 (50 to 90 ppm) for 1–5 days, resulting incarboxyhaemoglobin levels of <10%, produced increased cristae in themitochondria and dilation of the smooth endoplasmic reticulum in thenon-ciliated bronchiolar (Clara) cell. Minimal changes, consisting offragmentation of lamellar bodies, were found in the Type 2 epithelialcell. The morphological appearance of the remaining cells of theterminal airways was normal. The results of this study were notpresented in detail, however, and have not been confirmed at lowconcentrations of carbon monoxide. Thus, the significance, if any, ofchanges in the structure of cells lining the terminal airways isunknown.
Weissbecker et al. (1969) found no significant changes in theviability of alveolar macrophages exposed in vitro to high concentra-tions of carbon monoxide (up to 220 000 mg/m3 [190 000 ppm]).These results were later confirmed in more extensive in vivo exposurestudies by Chen et al. (1982), who obtained alveolar macrophages bybronchoalveolar lavage from rats exposed to 570 mg carbon monox-ide/m3 (500 ppm; 41–42% carboxyhaemoglobin) from birth through33 days of age. Morphological and functional changes in the exposedcells were minimal. There were no statistically significant differencesin cell number, viability, maximal diameter, surface area or acidphosphatase activity. The phagocytic ability of alveolar macrophages
EHC 213: Carbon Monoxide
188
was enhanced by carbon monoxide exposure, as determined by astatistically significant (P < 0.05) increase in the percentage of spreadforms and cells containing increased numbers of retained latexparticles. The biological significance of this finding is questionable,however, because very few (n = 5) animals were evaluated and nofollow-up studies have been performed.
7.3.2 Lung function
Laboratory animal studies of lung function changes associatedwith carbon monoxide exposure parallel the morphology studiesdescribed above, because high concentrations (1700–11 000 mg/m3
[1500–10 000 ppm]) of carbon monoxide were utilized.
Fisher et al. (1969) ventilated the left lung of seven dogs with8–14% (92 000–160 000 mg/m3 [80 000–140 000 ppm]) carbonmonoxide for 14–20 min. Femoral artery blood carboxyhaemoglobinlevels ranged from 8% to 18% at the end of carbon monoxideventilation. No changes in the diffusing capacity or pressure–volumecharacteristics of the lung were found.
Fein et al. (1980) measured lung function in nine New Zealandwhite rabbits exposed for 45 min to either 0.8% (9200 mg/m3
[8000 ppm]) carbon monoxide or air. After carbon monoxide expo-sure, carboxyhaemoglobin levels reached 63%. The dynamic lungcompliance significantly decreased and the airway resistancesignificantly increased at 15 min and 30 min after the start of carbonmonoxide exposure, respectively. The mean blood pressure fell to62% of the baseline value by the end of exposure; the heart rate wasnot changed. The arterial pH decreased progressively throughoutexposure, although there were no changes in the alveolar–arterial PO2difference.
Robinson et al. (1985) examined ventilation ( A) and perfusion( ) distribution in mongrel dogs during and following carbonmonoxide exposure. A small number (n = 5) of mongrel dogs wereexposed to 1% carbon monoxide (11 000 mg/m3 [10 000 ppm]) for10 min, resulting in peak carboxyhaemoglobin levels of 59 ± 5.4%.Inert gas distributions were measured at peak exposure and 2, 4 and24 h after exposure. No changes in A/ were found. Previousstudies were unable to show accumulation of lung water in the same
Effects on Laboratory Animals
189
model (Halebian et al., 1984a,b). The authors concluded that otherconstituents of smoke, besides carbon monoxide, were responsible forthe pulmonary oedema and A/ mismatching found in victimsexposed to smoke in closed-space fires.
Little is known about the effects of carbon monoxide onventilation in laboratory animals, and the few studies available arecontradictory. No effects of carbon monoxide on ventilation werefound in unanaesthetized rabbits (Korner, 1965) or cats (Neubaueret al., 1981), whereas large increases were reported in conscious goats(Santiago & Edelman, 1976; Doblar et al., 1977; Chapman et al.,1980). In anaesthetized cats, high concentrations of carbon monoxide(11 000 mg/m3 [10 000 ppm]) increased ventilation (Lahiri &Delaney, 1976). Gautier & Bonora (1983) used cats to compare thecentral effects of hypoxia on control of ventilation under consciousand anaesthetized conditions. The cats were exposed for 60 min toeither low inspired oxygen fraction (where the fraction of inspiredoxygen [FIO2] = 0.115) or carbon monoxide diluted in air. In con-scious cats, 1700 mg carbon monoxide/m3 (1500 ppm) causeddecreased ventilation, whereas higher concentrations (2300 mg/m3
[2000 ppm]) induced first a small decrease, followed by tachypnoea,which is typical of hypoxic hypoxia in carotid-denervated consciousanimals. In anaesthetized cats, however, carbon monoxide causedonly mild changes in ventilation.
Other respiratory effects of carbon monoxide hypoxia, such as theincreased total pulmonary resistance estimated by tracheal pressure,have been reported in anaesthetized laboratory rats and guinea-pigs(Mordelet-Dambrine et al., 1978; Mordelet-Dambrine & Stupfel,1979). The significance of this effect is unknown, however, particu-larly under the extremely high carbon monoxide exposure conditionsutilized in these studies (4-min inhalation of 2.84% carbon monoxide[33 000 mg/m3; 28 400 ppm]), which produced carboxyhaemoglobinconcentrations above 60% (Stupfel et al., 1981). Similar increases intracheal pressure were also seen with hypoxic hypoxia (FIO2 = 0.89),suggesting a possible general mechanism associated with severe tissuehypoxia.
EHC 213: Carbon Monoxide
190
7.4 Central nervous system and behavioural effects
7.4.1 Effects on cerebral blood flow and brain metabolism
7.4.1.1 Effects on cerebral blood flow
Kety & Schmidt (1948) demonstrated that cerebral oxygen con-sumption is about 3.5 ml of oxygen per 100 g of brain (cerebralhemispheres) per minute in normal adult humans. This consumptionof oxygen is virtually unchanged under a variety of conditions. Thecerebral vasculature responds to decreases in oxygen availability byincreasing cerebral blood flow in order to maintain cerebral oxygendelivery and/or by increasing oxygen extraction in order to maintaincerebral oxygen utilization when cerebral oxygen delivery is limited.
An important point to emphasize when comparing carbonmonoxide hypoxia with hypoxic hypoxia is that although arterialoxygen content is reduced with both hypoxic and carbon monoxidehypoxia, there is no reduction in arterial oxygen tension with carbonmonoxide hypoxia. Comparisons of the equivalent effects of bothcarbon monoxide and hypoxic hypoxia on cerebral blood flow andcerebral oxygen consumption in the same animal preparations havebeen made by Traystman and co-workers in several studies(Traystman & Fitzgerald, 1977, 1981; Traystman et al., 1978;Fitzgerald & Traystman, 1980; Koehler et al., 1982, 1983, 1984,1985). The concept of equivalent effects of both types of hypoxia(hypoxic and carbon monoxide) has been described by Permutt &Farhi (1969) and involves the comparison of physiological effects ofelevated carboxyhaemoglobin and low oxygen at equal reductions inhaemoglobin, arterial oxygen content, arterial or venous oxygen ten-sion or blood flow.
Traystman et al. (1978) previously reported that the increase incerebral blood flow in dogs during a reduction in arterial oxygencontent, produced by exposing the animal to a low oxygen gas mixture(hypoxic hypoxia), was not different from the increase in cerebralblood flow when oxygen content was decreased by adding carbonmonoxide to the breathing gas mixture (carbon monoxide hypoxia)(Fig. 9). This was true both before and after carotid sinus chemo-denervation. This study also demonstrated that mean arterial bloodpressure increased with hypoxic hypoxia, whereas it decreased withcarbon monoxide hypoxia. Because the cerebral blood flow increase
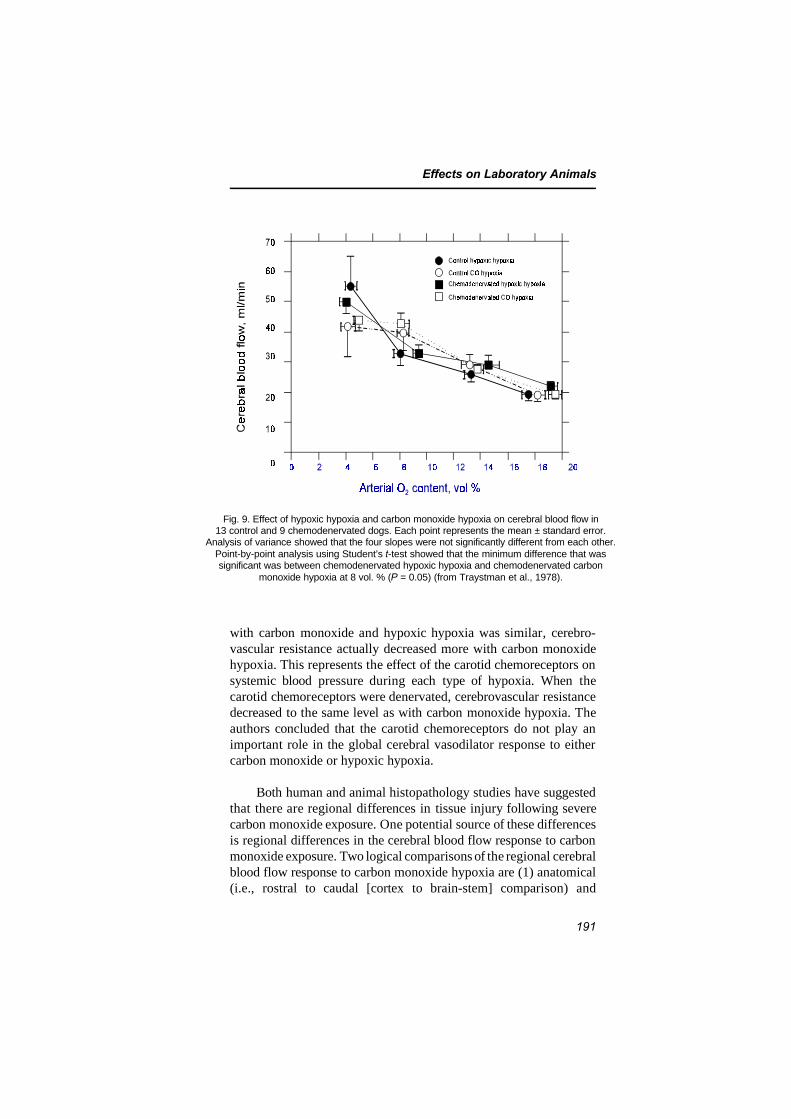
Effects on Laboratory Animals
191
Fig. 9. Effect of hypoxic hypoxia and carbon monoxide hypoxia on cerebral blood flow in13 control and 9 chemodenervated dogs. Each point represents the mean ± standard error.
Analysis of variance showed that the four slopes were not significantly different from each other.Point-by-point analysis using Student’s t-test showed that the minimum difference that wassignificant was between chemodenervated hypoxic hypoxia and chemodenervated carbon
monoxide hypoxia at 8 vol. % (P = 0.05) (from Traystman et al., 1978).
with carbon monoxide and hypoxic hypoxia was similar, cerebro-vascular resistance actually decreased more with carbon monoxidehypoxia. This represents the effect of the carotid chemoreceptors onsystemic blood pressure during each type of hypoxia. When thecarotid chemoreceptors were denervated, cerebrovascular resistancedecreased to the same level as with carbon monoxide hypoxia. Theauthors concluded that the carotid chemoreceptors do not play animportant role in the global cerebral vasodilator response to eithercarbon monoxide or hypoxic hypoxia.
Both human and animal histopathology studies have suggestedthat there are regional differences in tissue injury following severecarbon monoxide exposure. One potential source of these differencesis regional differences in the cerebral blood flow response to carbonmonoxide exposure. Two logical comparisons of the regional cerebralblood flow response to carbon monoxide hypoxia are (1) anatomical(i.e., rostral to caudal [cortex to brain-stem] comparison) and
EHC 213: Carbon Monoxide
192
(2) physiological (i.e., brain areas with a functional blood–brainbarrier versus brain areas without an intact blood–brain barrier).Koehler et al. (1984) observed interesting regional cerebral blood flowresponses to hypoxic and carbon monoxide hypoxia in newborn lambsand adult sheep. In adults, regions with high normoxic blood flowssuch as the caudate nucleus and midbrain showed a large response tohypoxia, whereas lower blood flow regions with large white mattertracts, such as the cervical spinal cord, pons, diencephalon andpiriform lobe, showed a relatively lower response. Other brain regionswere essentially homogeneous in their responses. Carbon monoxidehypoxia increased cerebral blood flow to a greater extent than hypoxichypoxia in all brain regions, but the overall pattern of regionalcerebral blood flow was similar for the two types of hypoxia in theadults.
In the newborn, regional responses differed for each type ofhypoxia. With hypoxic hypoxia in the newborn, the brain-stemregions had a significantly greater response than all other regionsexcept the caudate nucleus, whereas all cerebral lobes respondedsignificantly less than all other regions. With carbon monoxidehypoxia, the difference between brain-stem responses and those ofother regions was less marked. In the adults, in contrast, there was nosignificant interactive effect between the type of hypoxia and thepattern of regional response. With both types of hypoxia, the caudatenucleus had a significantly greater response than all other regions,and the cervical spinal cord responded significantly less than all otherregions.
Ludbrook et al. (1992) exposed rabbits to 1% carbon monoxide(11 000 mg/m3 [10 000 ppm]) or to hypoxic hypoxia. Both conditionscaused a significant increase in cerebral blood flow of up to 300%,such that oxygen delivery to the brain was unchanged. Despite themaintenance of oxygen delivery to the brain during and after thecarbon monoxide exposure, the cortical somatosensory evokedresponse voltages were halved during the exposure and recovered toonly about 80% of baseline subsequently. The authors concluded thatthe primary toxicity of carbon monoxide to the brain in rabbits is notdue to a reduction in oxygen delivery.
Okeda et al. (1987) also demonstrated carbon monoxide-inducedregional cerebral blood flow differences in cats. This group attemptedto demonstrate that there is a selective vulnerability of the pallidumand cerebral white matter and showed low cerebral blood flow values
Effects on Laboratory Animals
193
for these brain areas. In newborn lambs (Koehler et al., 1984), unlikeadult sheep, the patterns of regional cerebral blood flow responseswere not similar with the two types of hypoxia. Brain-stem regions,especially the medulla, had marked responses relative to the cerebrumduring hypoxic hypoxia. Peeters et al. (1979) also made this observa-tion in unanaesthetized fetal lambs.
There is at least one area of the brain that does not respond toalterations in arterial oxygen content and partial pressure as do otherbrain areas — the neurohypophysis. The neurohypophysis is an ana-tomically unique region of the brain, and the regulation of blood flowto this area appears to be different from that to other areas of thebrain. Hanley et al. (1986) demonstrated that when arterial oxygencontent was reduced equivalently with hypoxic hypoxia and carbonmonoxide hypoxia, global cerebral blood flow increased by 239% and300%, respectively. Regional cerebral blood flow also showed similarresponses for all brain areas except the neurohypophysis. With hypox-ic hypoxia, neurohypophyseal blood flow increased markedly (320%),but it was unchanged with carbon monoxide. These blood flowresponses of the neurohypophysis occur independently of alterationsin blood pressure.
Wilson et al. (1987) determined the role of the chemoreceptorsin the neurohypophyseal response to hypoxia and found that chemo-receptor denervation completely inhibited the increase in neuro-hypophyseal blood flow associated with hypoxia. The response tocarbon monoxide was unaltered. These data (Hanley et al., 1986;Wilson et al., 1987) demonstrated that the mechanism responsible forthe increase in neurohypophyseal blood flow with hypoxia is uniquecompared with other brain regions. The only animals in which neuro-hypophyseal blood flow did not respond were the denervated animalsand those given carbon monoxide. Both of these conditions are onesin which the chemoreceptors have been shown to be inactive (Comroe,1974; Traystman & Fitzgerald, 1981). Although the blood flowresponse to hypoxia does not involve the peripheral chemoreceptorsfor most brain regions, this is not true for the neurohypophysis. Thus,here is an example of one regional brain area that does not respond tocarbon monoxide hypoxia (i.e., a change in arterial oxygen content)but does respond to a change in arterial oxygen tension. This suggeststhat the chemoreceptor represents the mechanism involved in theneurohypophyseal response to hypoxic hypoxia and that local changes

EHC 213: Carbon Monoxide
194
in arterial oxygen content are not involved in this response, becausethe neurohypophysis does not respond to carbon monoxide. It isunclear whether other regional brain areas have similar responses tohypoxic and carbon monoxide hypoxia.
Carbon monoxide hypoxia results in an increase in cerebral bloodflow, and this has been demonstrated by a number of investigators(Sjostrand, 1948b; Haggendal & Norback, 1966; Paulson et al., 1973;Traystman et al., 1978; Traystman & Fitzgerald, 1981).
Traystman (1978) examined the cerebral blood flow responses tocarbon monoxide hypoxia in anaesthetized dogs, particularly in therange of carboxyhaemoglobin less than 20% (Fig. 10). A carboxy-haemoglobin level as low as 2.5% resulted in a small, but significant,increase in cerebral blood flow to 102% of control. With reductionsin oxygen carrying capacity of 5, 10, 20 and 30% (5, 10, 20 and 30%carboxyhaemoglobin), cerebral blood flow increased to approximately105, 110, 120 and 130% of control, respectively. At each of theselevels, cerebral oxygen consumption remained unchanged. At car-boxyhaemoglobin levels above 30%, cerebral blood flow increased outof proportion to the decrease in oxygen carrying capacity, but thebrain could no longer maintain cerebral oxygen consumptionconstant. At a carboxyhaemoglobin level of 50%, cerebral blood flowincreased to about 200% of control. These findings are in generalagreement with those of MacMillan (1975), who demonstrated that ascarboxyhaemoglobin increased to 20, 50 and 65%, cerebral blood flowincreased to 200, 300 and then 400%, respectively, in cats. Thesecerebral blood flow increases at 20% carboxyhaemoglobin are higherthan those reported in Traystman’s (1978) study, but the reason forthis is not known. Haggendal & Norback (1966) demonstrated a50–150% of control increase in cerebral blood flow with carboxy-haemoglobin levels of 30–70%, and Paulson et al. (1973) showed a26% increase in cerebral blood flow with a carboxyhaemoglobin levelof 20%. These findings also indicate that cerebral blood flowincreases progressively with increasing carboxyhaemoglobinconcentrations and that cerebral oxygen consumption is maintainedconstant even at a carboxyhaemoglobin level of 30%. This hasimportant implications regarding the behavioural and electro-physiological consequences of carbon monoxide exposure. Thesefindings are also consistent with those of Dyer & Annau (1978), whofound that superior colliculus evoked potential latencies are not
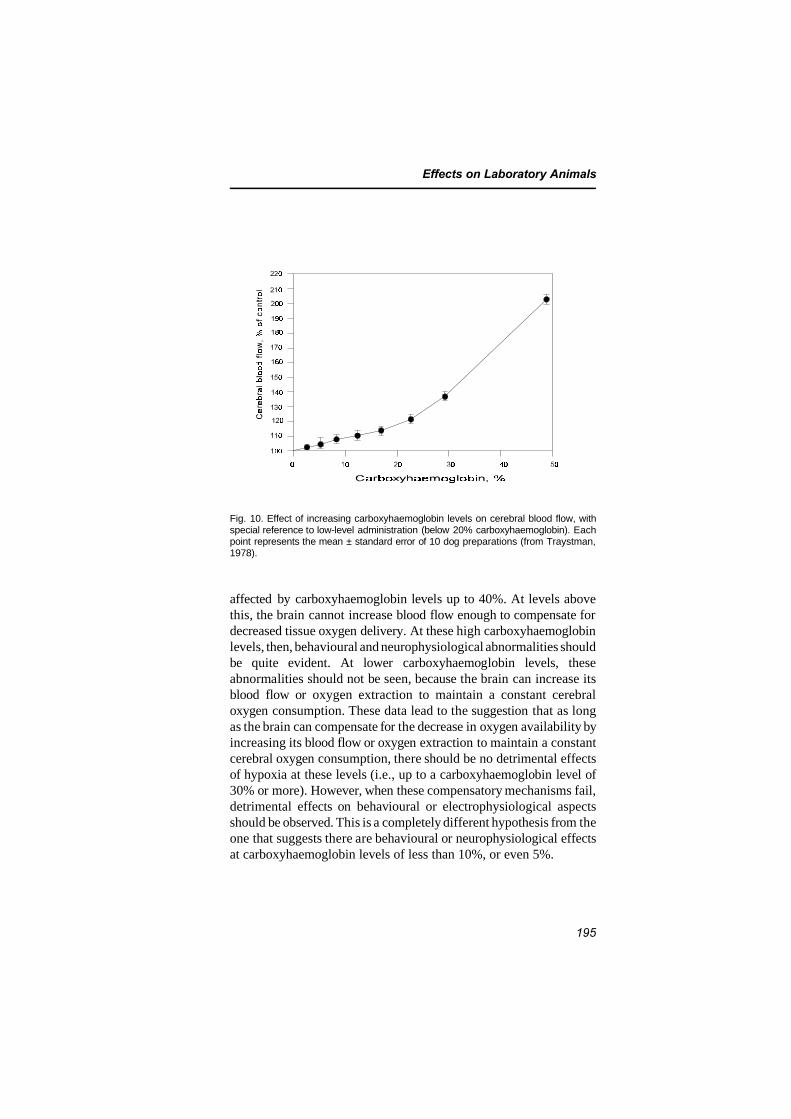
Effects on Laboratory Animals
195
Fig. 10. Effect of increasing carboxyhaemoglobin levels on cerebral blood flow, withspecial reference to low-level administration (below 20% carboxyhaemoglobin). Eachpoint represents the mean ± standard error of 10 dog preparations (from Traystman,1978).
affected by carboxyhaemoglobin levels up to 40%. At levels abovethis, the brain cannot increase blood flow enough to compensate fordecreased tissue oxygen delivery. At these high carboxyhaemoglobinlevels, then, behavioural and neurophysiological abnormalities shouldbe quite evident. At lower carboxyhaemoglobin levels, theseabnormalities should not be seen, because the brain can increase itsblood flow or oxygen extraction to maintain a constant cerebraloxygen consumption. These data lead to the suggestion that as longas the brain can compensate for the decrease in oxygen availability byincreasing its blood flow or oxygen extraction to maintain a constantcerebral oxygen consumption, there should be no detrimental effectsof hypoxia at these levels (i.e., up to a carboxyhaemoglobin level of30% or more). However, when these compensatory mechanisms fail,detrimental effects on behavioural or electrophysiological aspectsshould be observed. This is a completely different hypothesis from theone that suggests there are behavioural or neurophysiological effectsat carboxyhaemoglobin levels of less than 10%, or even 5%.
EHC 213: Carbon Monoxide
196
Lanston et al. (1996) examined cerebral blood flow in sheepduring carbon monoxide exposure (65% carboxyhaemoglobin). Meanarterial blood pressure was generally unchanged. Oxygen delivery tothe brain was sustained throughout the administration of carbonmonoxide because of a significant increase in cerebral blood flow.Despite lack of evidence of metabolic acidosis or brain hypoxia,oxygen consumption by the brain fell progressively, and the sheepshowed behavioural changes that varied from agitation to sedationand narcosis. The authors hypothesized that the mechanism of thesechanges was probably unrelated to hypoxia but may have been due toraised intracranial pressure or a direct effect of carbon monoxide onbrain function.
Brian et al. (1994) examined the hypothesis that carbonmonoxide directly relaxes cerebral blood vessels. The aorta andbasilar and middle cerebral arteries were used for tension recordingsin vitro. After pre-contraction, cumulative relaxationconcentration–response curves for carbon monoxide, nitric oxide andother substances were obtained. Carbon monoxide (1 × 10⁻⁶ to 3 ×10⁻⁴ mol/litre) did not affect tension in rabbit or dog cerebral arteries.In rabbit aorta, carbon monoxide induced 29 ± 4% (mean ± standarderror of the mean) relaxation at the highest concentration used (3 ×10⁻⁴ mol/litre). In contrast, nitric oxide produced 80–100% relaxationof all arteries. The authors suggested that carbon monoxide does nothave a significant effect on tone in cerebral arteries, but at highconcentrations it produces concentration-dependent relaxation inrabbit aorta. Factors that account for this regional heterogeneity arenot clear.
7.4.1.2 Effects on brain metabolism
Ischiropoulos et al. (1996) studied nitric oxide production in thebrain, documenting by electron paramagnetic resonance spectroscopythat nitric oxide is increased ninefold immediately after carbonmonoxide poisoning. Evidence that peroxynitrite was generated wassought by looking for nitrotyrosine in the brains of carbon monoxide-poisoned rats. Nitrotyrosine was found deposited in vascular walls andalso diffusely throughout the parenchyma in immunocytochemicalstudies. A 10-fold increase in nitrotyrosine was found in the brains ofcarbon monoxide-poisoned rats. When rats were pretreated with thenitric oxide synthase inhibitor L-nitroarginine methyl ester, formationof both nitric oxide and nitrotyrosine in response to carbon monoxidepoisoning was abolished, as well as leukocyte sequestration in the
Effects on Laboratory Animals
197
microvasculature, endothelial xanthine dehydrogenase conversion toxanthine oxidase and brain lipid peroxidation. The authors concludedthat perivascular reactions mediated by peroxynitrite are important inthe cascade of events that lead to brain oxidative stress in carbonmonoxide poisoning.
Song and collaborators (1990) exposed rat pups to carbonmonoxide acutely and subacutely and made measurements of brainmonoamines (norepinephrine [NE], dopamine [DA] and 5-hydroxy-tryptamine [5-HT]) and 5-hydroxytryptamine metabolite, 5-hydroxy-indoleacetic acid (5-HIAA), using fluorospectroscopy. They found that57 mg carbon monoxide/m3 (50 ppm) was the minimal concentrationthat produced significant changes in monoamine levels and alsoshowed a definite dose–effect–time relationship. The authors sug-gested that monoamines could be useful biochemical indices fortoxicity of carbon monoxide in the central nervous system.
In a review article, Penney and his group (1993) described theresults of a series of studies on acute severe carbon monoxidepoisoning using a defined animal model. Rats were exposed to highlevels of carbon monoxide (1700–2900 mg/m3 [1500–2500 ppm]) for90 min. The common carotid artery and jugular vein serving one sideof the brain of the rats were occluded by indwelling catheter. Theusual changes noted were hypotension, bradycardia, hypothermia,altered blood glucose, unconsciousness, cerebral oedema and behav-ioural evidence of central nervous system damage. The authors foundthat both greatly depressed and greatly elevated glucose during and/orafter carbon monoxide exposure increased morbidity and mortality.Added hypothermia induced during carbon monoxide exposure wasfound to reduce morbidity/enhance survival, whereas rapid rewarmingwas found to be the best strategy to reduce morbidity/enhance survivalpost-carbon monoxide exposure. Infusion of ethanol during carbonmonoxide exposure was found to significantly decrease morbidity andmortality. The use of the N-methyl-D-aspartic acid receptor blockerketamine had a significant beneficial effect in reducing morbidity andmortality (Penney & Chen, 1996). Cerebral cortical oedema andchanges in brain phosphagens were assessed following carbon monox-ide poisoning. Through the use of magnetic resonance imaging andspectroscopic techniques, cyanide poisoning, in contrast to carbonmonoxide exposure, was found to produce a different pattern of
EHC 213: Carbon Monoxide
198
changes in blood glucose and lactate and failed to slow cardiac AVconduction and ventricular repolarization.
7.4.1.3 Evidence for a reoxygenation injury in carbon monoxide poisoning
The fact that cytochrome a3 may remain inhibited when a patientis reoxygenated leads to consideration of the possibility of free oxygenradical formation and then occurrence of reoxygenation injury. It haslong been recognized that, with regard to pathological aspects of brainlesions, similarities are striking between carbon monoxide poisoningand post-ischaemic reperfusion injury, and a common mechanism hasbeen hypothesized for these different forms of brain injury (Okeda etal., 1981, 1982).
More recently, Thom (1990) showed evidence for the occurrenceof lipid peroxidation in brain of carbon monoxide-poisoned rats. Anincrease of conjugated diene and malonyldialdehyde concentrationsappears only after a 90-min period of normal air breathing followingcarbon monoxide exposure. Thom (1992) was able to demonstrate thatblocking xanthine oxidase by allopurinol or depleting animals of thisenzyme by feeding them a tungsten-supplemented diet decreases themagnitude of brain lipid peroxidation. This offers further evidencethat, at least in part, a common mechanism exists between carbonmonoxide poisoning and reperfusion injury.
Brown & Piantadosi (1992) reported further evidence for oxygenfree radical generation during the reoxygenation phase after carbonmonoxide exposure by showing a decrease in brain catalase activitythat demonstrates hydrogen peroxide production. There was also adecrease in the ratio of reduced/oxidized glutathione with an increasein salicylate hydroxylation products and a decrease in intracellular pHand energetic compounds. This was rapidly corrected by hyperbaricoxygen as opposed to normobaric oxygen, under which it continuedto decrease during the first 45 min.
7.4.2 Effects on schedule-controlled behaviour
Because of the high levels of carboxyhaemoglobin that areemployed in studies of laboratory animals using schedule-controlledbehaviour, effects of carboxyhaemoglobin are reported in all articleson the subject. There are a number of problems with the publishedliterature. Only a few investigators measured carboxyhaemoglobin;
Effects on Laboratory Animals
199
instead, most simply specified the exposure parameters. Anotherproblem is that of hypothermia, which occurs in rats when carboxy-haemoglobin levels rise (Annau & Dyer, 1977; Mullin & Krivanek,1982). If hypothermia develops as a consequence of carboxyhaemo-globin elevation, behavioural effects may be secondary to the hypo-thermia, rather than directly attributable to the carboxyhaemoglobin.None of the experimenters attempted to control for hypothermiaeffects. Thus, behavioural effects of carboxyhaemoglobin may beoverestimated in the rat with respect to humans who do not exhibithypothermia from elevated carboxyhaemoglobin.
The level of carboxyhaemoglobin may be estimated for studies inwhich it was not given by use of normative curves published inMontgomery & Rubin (1971). Schrot & Thomas (1986) and Schrotet al. (1984) published corroborating curves. For all rat studies inwhich carboxyhaemoglobin was not measured, carboxyhaemoglobinlevels were estimated from exposure parameters.
With one exception (Mullin & Krivanek, 1982), effects ofcarboxyhaemoglobin on schedule-controlled behaviour did not occuruntil carboxyhaemoglobin exceeded approximately 20%. In somestudies, no effect was observed until even higher levels. It is possible,however, that a number of the studies were insensitive because of thesmall numbers of subjects employed. In the study by Mullin &Krivanek (1982), it was reported that conditioned avoidancebehaviour was affected at carboxyhaemoglobin levels as low as 12.2%.The carboxyhaemoglobin level reported in this study is, however,about half of the value that would be estimated from the Montgomery& Rubin (1971) data. It seems likely that either exposure or carboxy-haemoglobin values were erroneous in the report. If the exposure datawere correct, the effects threshold would fit the other data in theliterature. It thus appears that carboxyhaemoglobin does not affectschedule-controlled behaviour in laboratory animals until levelsexceed 20%.
Miyagawa et al. (1995) examined the acute effects of carbonmonoxide exposure on a steady-state operant behaviour involving barpressing. This was done in (1) rats exposed to various concentrationsof carbon monoxide (570, 1100, 1700 and 2300 mg/m3 [500, 1000,1500 and 2000 ppm]) for 1 h and (2) rats exposed to 1700 mg/m3
(1500 ppm) for different periods (1, 2 and 4 h). Abrupt cessation of
EHC 213: Carbon Monoxide
200
the response was produced by exposure to 1100 mg/m3 (1000 ppm) orhigher concentrations of carbon monoxide. Recovery from the effectsof carbon monoxide exposure was observed as a sudden resumptionof responding during the post-exposure period. The duration ofexposure required to produce response inhibition was closely corre-lated with the exposure concentration. The post-exposure intervalrequired for response recovery was also correlated with the exposureconcentration. This post-exposure response recovery interval, how-ever, was constant and independent of the duration of exposure whenthe concentration was fixed at 1700 mg/m3 (1500 ppm). It was foundthat carboxyhaemoglobin levels were within the range 33–43% whenresponse recovery occurred. This suggested the existence of athreshold carboxyhaemoglobin level associated with the drastic behav-ioural change.
When there were frank effects on schedule-controlled behaviour,they all seemed to be in the direction of a slowing of rate or speed ofresponse. Schedule-produced patterns of behaviour were notdisrupted, in general. Thus, it appears that the effect of elevatedcarboxyhaemoglobin is on some general aspect of behavioural controlhaving to do with the rate of processing.
Table 14 summarizes health effects, other than developmentaleffects, of carbon monoxide on laboratory animals.
7.5 Adaptation
The earliest study on adaptation to carbon monoxide exposure inlaboratory animals was performed by Killick (1937). Mice wereexposed to successively higher concentrations of carbon monoxide,which, over a period of 6–15 weeks, reached 2300–3300 mg/m3
(2000–2850 ppm) and produced 60–70% carboxyhaemoglobin. Thenon-adapted mice exhibited much more extreme symptoms whenexposed to such levels. A control group was used to partially rule outeffects of selection of carbon monoxide-resistant animals.
Clark & Otis (1952) exposed mice to gradually increasing carbonmonoxide levels over a period of 14 days until a level of 1400 mg/m3
(1200 ppm) was reached. When exposed to a simulated altitude of10 400 m, survival of the carbon monoxide-adapted groups was muchgreater than that of controls. Similarly, when mice were acclimatized
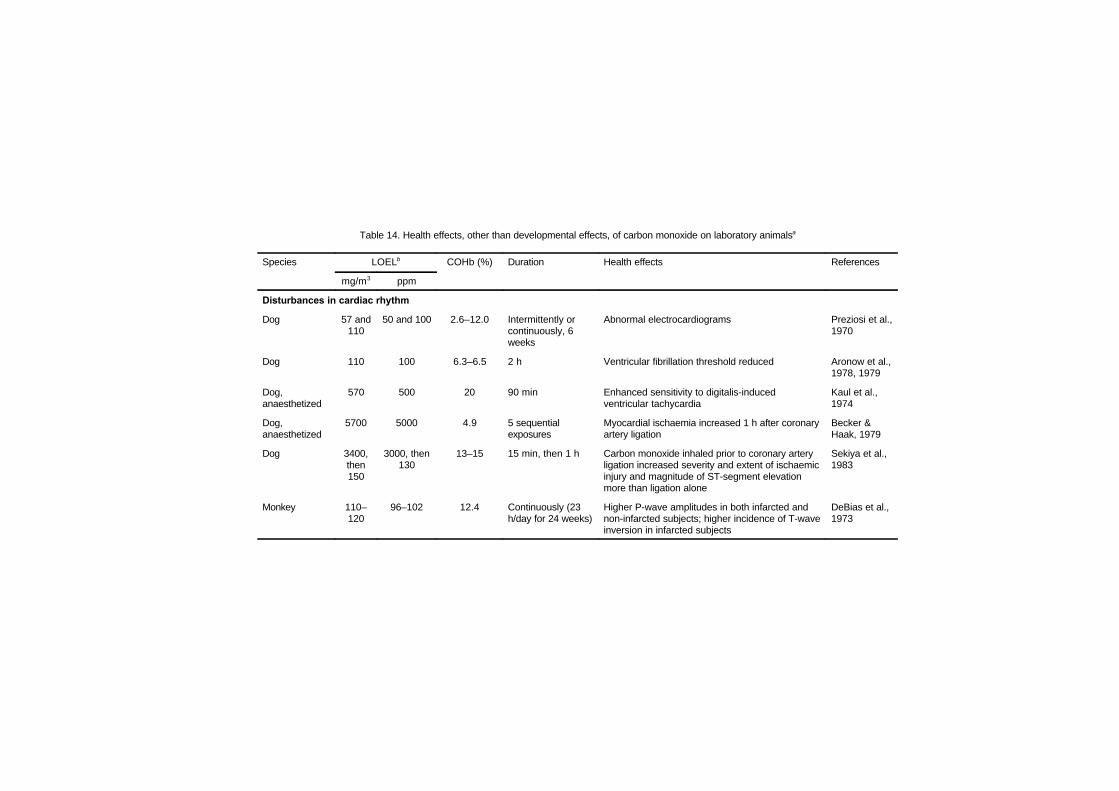
Table 14. Health effects, other than developmental effects, of carbon monoxide on laboratory animalsa
Species LOELb COHb (%) Duration Health effects References
mg/m3 ppm
Disturbances in cardiac rhythm
Dog 57 and110
50 and 100 2.6–12.0 Intermittently orcontinuously, 6weeks
Abnormal electrocardiograms Preziosi et al.,1970
Dog 110 100 6.3–6.5 2 h Ventricular fibrillation threshold reduced Aronow et al.,1978, 1979
Dog,anaesthetized
570 500 20 90 min Enhanced sensitivity to digitalis-inducedventricular tachycardia
Kaul et al.,1974
Dog,anaesthetized
5700 5000 4.9 5 sequentialexposures
Myocardial ischaemia increased 1 h after coronaryartery ligation
Becker &Haak, 1979
Dog 3400,then150
3000, then130
13–15 15 min, then 1 h Carbon monoxide inhaled prior to coronary arteryligation increased severity and extent of ischaemicinjury and magnitude of ST-segment elevationmore than ligation alone
Sekiya et al.,1983
Monkey 110–120
96–102 12.4 Continuously (23h/day for 24 weeks)
Higher P-wave amplitudes in both infarcted andnon-infarcted subjects; higher incidence of T-waveinversion in infarcted subjects
DeBias et al.,1973
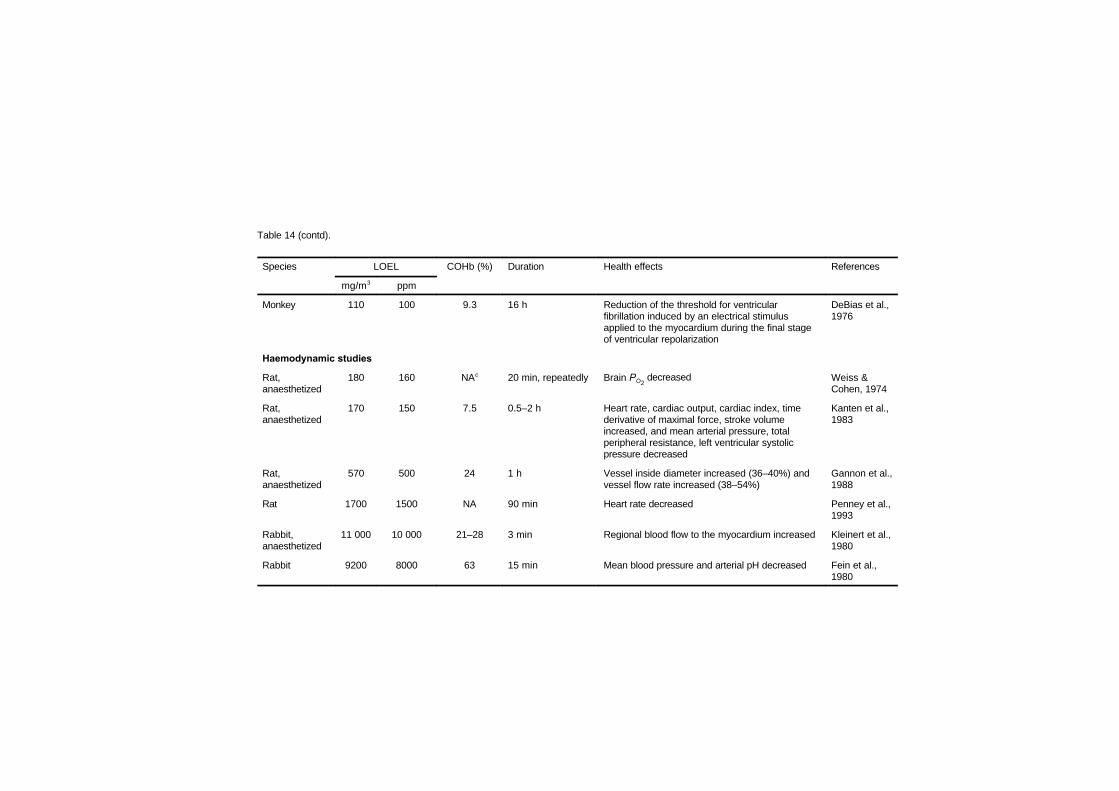
Table 14 (contd).
Species LOEL COHb (%) Duration Health effects References
mg/m3 ppm
Monkey 110 100 9.3 16 h Reduction of the threshold for ventricularfibrillation induced by an electrical stimulusapplied to the myocardium during the final stageof ventricular repolarization
DeBias et al.,1976
Haemodynamic studies
Rat,anaesthetized
180 160 NAc 20 min, repeatedly Brain PO2 decreased Weiss &
Cohen, 1974
Rat,anaesthetized
170 150 7.5 0.5–2 h Heart rate, cardiac output, cardiac index, timederivative of maximal force, stroke volumeincreased, and mean arterial pressure, totalperipheral resistance, left ventricular systolicpressure decreased
Kanten et al.,1983
Rat,anaesthetized
570 500 24 1 h Vessel inside diameter increased (36–40%) andvessel flow rate increased (38–54%)
Gannon et al.,1988
Rat 1700 1500 NA 90 min Heart rate decreased Penney et al.,1993
Rabbit,anaesthetized
11 000 10 000 21–28 3 min Regional blood flow to the myocardium increased Kleinert et al.,1980
Rabbit 9200 8000 63 15 min Mean blood pressure and arterial pH decreased Fein et al.,1980
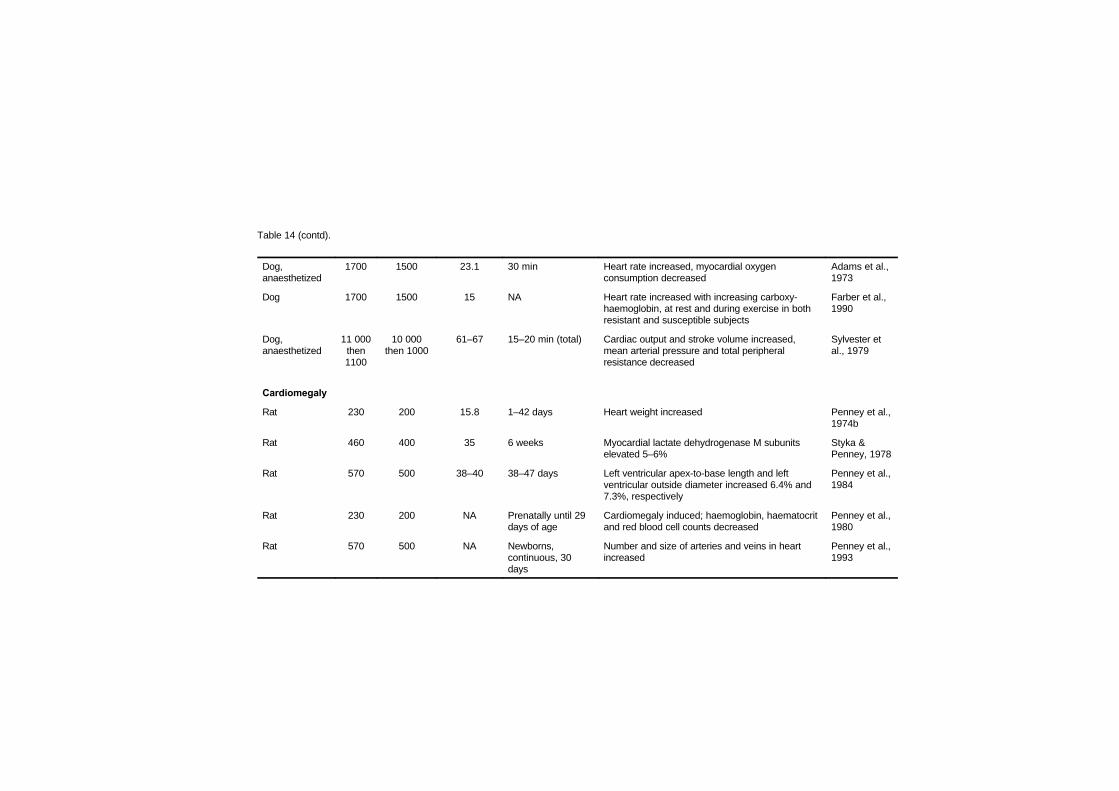
Table 14 (contd).
Dog,anaesthetized
1700 1500 23.1 30 min Heart rate increased, myocardial oxygenconsumption decreased
Adams et al.,1973
Dog 1700 1500 15 NA Heart rate increased with increasing carboxy-haemoglobin, at rest and during exercise in bothresistant and susceptible subjects
Farber et al.,1990
Dog,anaesthetized
11 000then1100
10 000then 1000
61–67 15–20 min (total) Cardiac output and stroke volume increased,mean arterial pressure and total peripheralresistance decreased
Sylvester etal., 1979
Cardiomegaly
Rat 230 200 15.8 1–42 days Heart weight increased Penney et al.,1974b
Rat 460 400 35 6 weeks Myocardial lactate dehydrogenase M subunitselevated 5–6%
Styka &Penney, 1978
Rat 570 500 38–40 38–47 days Left ventricular apex-to-base length and leftventricular outside diameter increased 6.4% and7.3%, respectively
Penney et al.,1984
Rat 230 200 NA Prenatally until 29days of age
Cardiomegaly induced; haemoglobin, haematocritand red blood cell counts decreased
Penney et al.,1980
Rat 570 500 NA Newborns,continuous, 30days
Number and size of arteries and veins in heartincreased
Penney et al.,1993
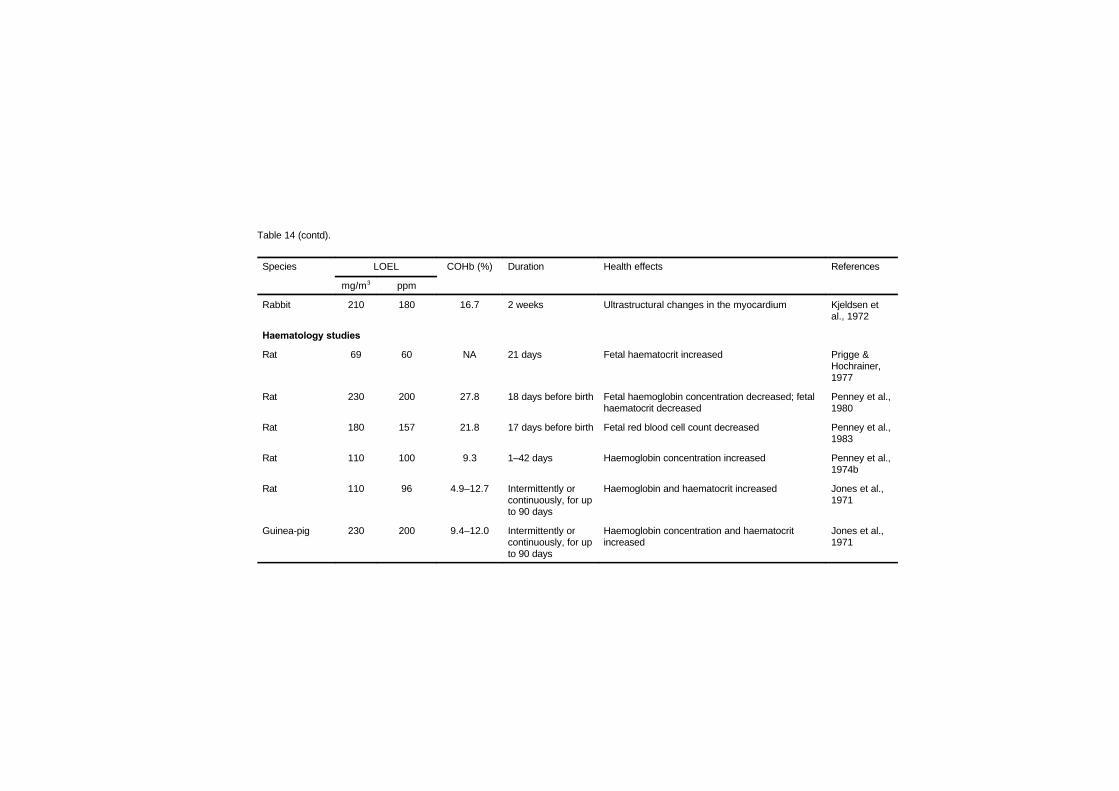
Table 14 (contd).
Species LOEL COHb (%) Duration Health effects References
mg/m3 ppm
Rabbit 210 180 16.7 2 weeks Ultrastructural changes in the myocardium Kjeldsen etal., 1972
Haematology studies
Rat 69 60 NA 21 days Fetal haematocrit increased Prigge &Hochrainer,1977
Rat 230 200 27.8 18 days before birth Fetal haemoglobin concentration decreased; fetalhaematocrit decreased
Penney et al.,1980
Rat 180 157 21.8 17 days before birth Fetal red blood cell count decreased Penney et al.,1983
Rat 110 100 9.3 1–42 days Haemoglobin concentration increased Penney et al.,1974b
Rat 110 96 4.9–12.7 Intermittently orcontinuously, for upto 90 days
Haemoglobin and haematocrit increased Jones et al.,1971
Guinea-pig 230 200 9.4–12.0 Intermittently orcontinuously, for upto 90 days
Haemoglobin concentration and haematocritincreased
Jones et al.,1971
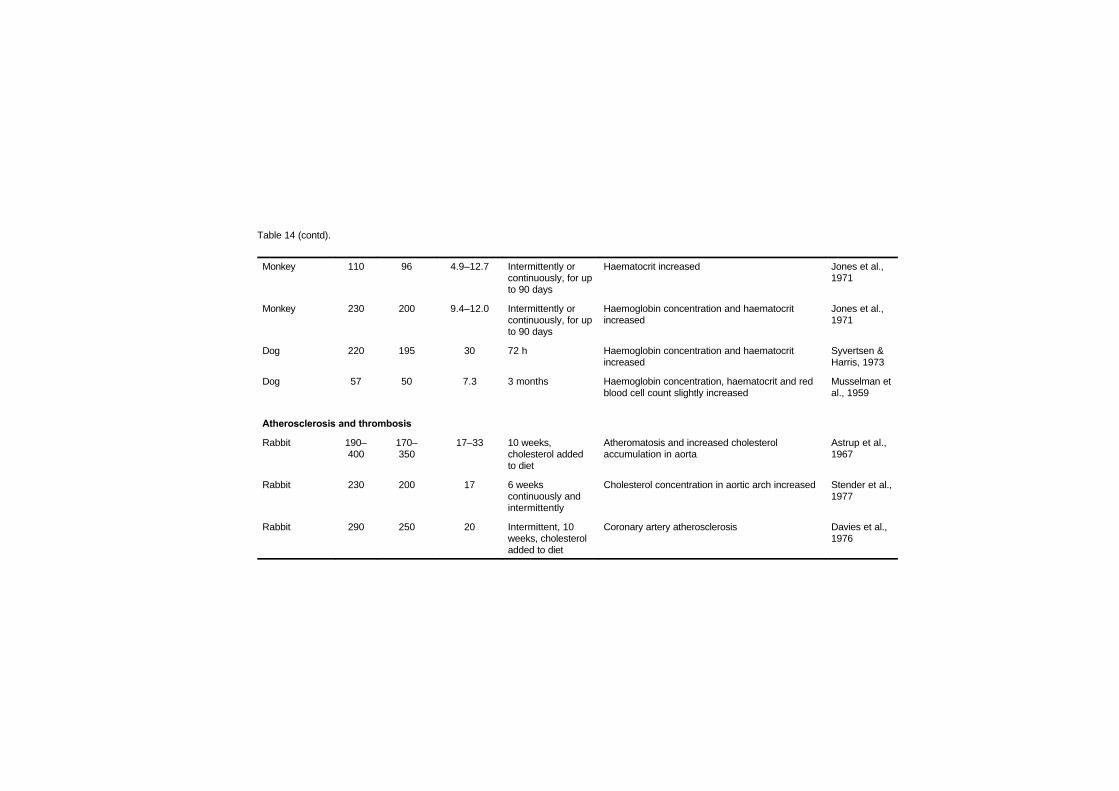
Table 14 (contd).
Monkey 110 96 4.9–12.7 Intermittently orcontinuously, for upto 90 days
Haematocrit increased Jones et al.,1971
Monkey 230 200 9.4–12.0 Intermittently orcontinuously, for upto 90 days
Haemoglobin concentration and haematocritincreased
Jones et al.,1971
Dog 220 195 30 72 h Haemoglobin concentration and haematocritincreased
Syvertsen &Harris, 1973
Dog 57 50 7.3 3 months Haemoglobin concentration, haematocrit and redblood cell count slightly increased
Musselman etal., 1959
Atherosclerosis and thrombosis
Rabbit 190–400
170–350
17–33 10 weeks,cholesterol addedto diet
Atheromatosis and increased cholesterolaccumulation in aorta
Astrup et al.,1967
Rabbit 230 200 17 6 weekscontinuously andintermittently
Cholesterol concentration in aortic arch increased Stender et al.,1977
Rabbit 290 250 20 Intermittent, 10weeks, cholesteroladded to diet
Coronary artery atherosclerosis Davies et al.,1976
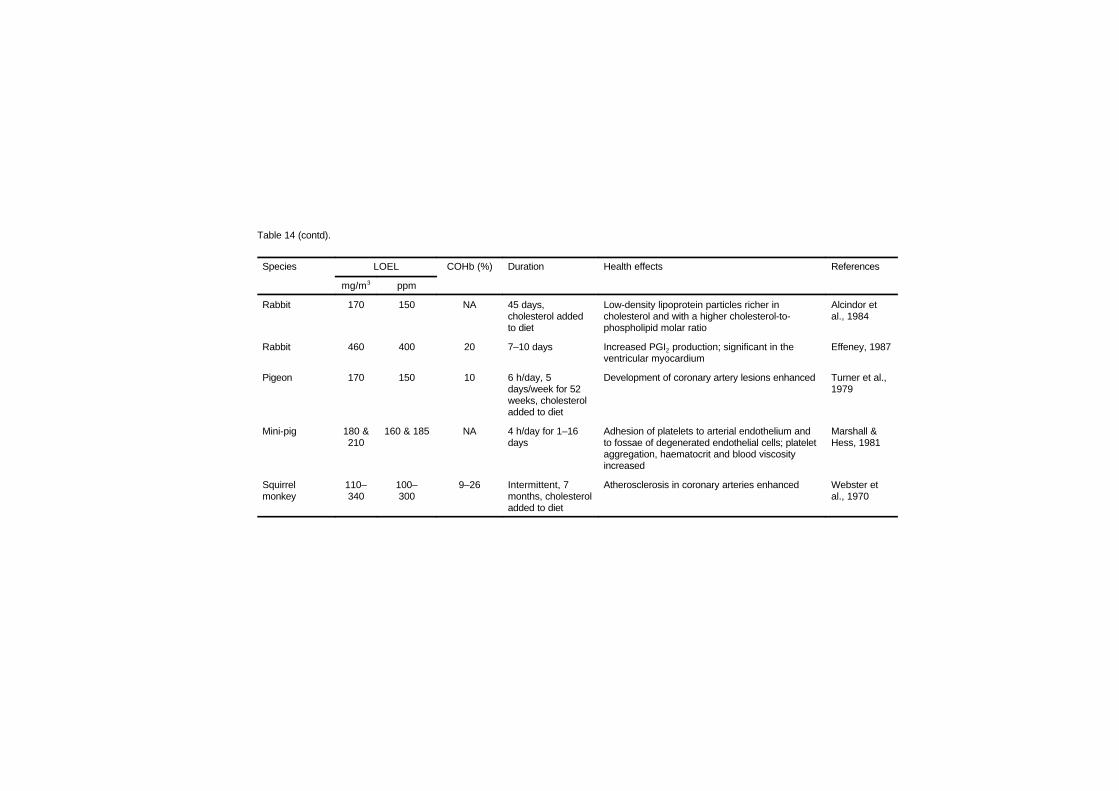
Table 14 (contd).
Species LOEL COHb (%) Duration Health effects References
mg/m3 ppm
Rabbit 170 150 NA 45 days,cholesterol addedto diet
Low-density lipoprotein particles richer incholesterol and with a higher cholesterol-to-phospholipid molar ratio
Alcindor etal., 1984
Rabbit 460 400 20 7–10 days Increased PGI2 production; significant in theventricular myocardium
Effeney, 1987
Pigeon 170 150 10 6 h/day, 5days/week for 52weeks, cholesteroladded to diet
Development of coronary artery lesions enhanced Turner et al.,1979
Mini-pig 180 &210
160 & 185 NA 4 h/day for 1–16days
Adhesion of platelets to arterial endothelium andto fossae of degenerated endothelial cells; plateletaggregation, haematocrit and blood viscosityincreased
Marshall &Hess, 1981
Squirrelmonkey
110–340
100–300
9–26 Intermittent, 7months, cholesteroladded to diet
Atherosclerosis in coronary arteries enhanced Webster etal., 1970
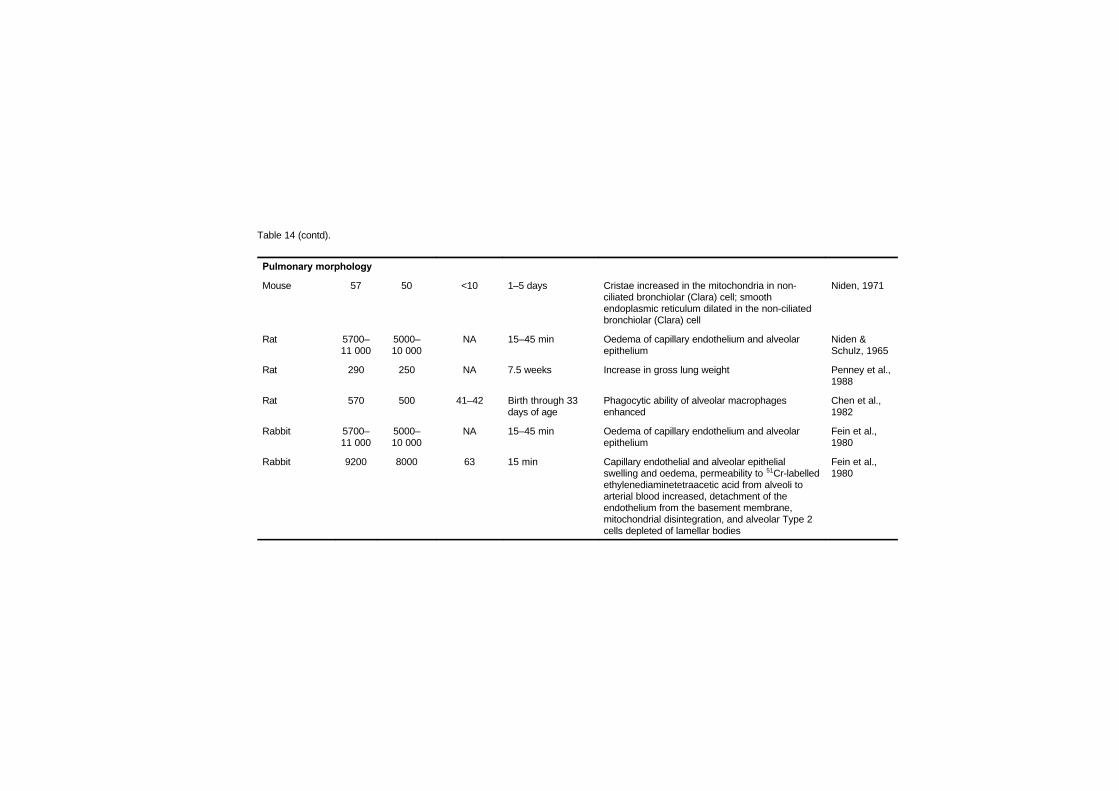
Table 14 (contd).
Pulmonary morphology
Mouse 57 50 <10 1–5 days Cristae increased in the mitochondria in non-ciliated bronchiolar (Clara) cell; smoothendoplasmic reticulum dilated in the non-ciliatedbronchiolar (Clara) cell
Niden, 1971
Rat 5700–11 000
5000–10 000
NA 15–45 min Oedema of capillary endothelium and alveolarepithelium
Niden &Schulz, 1965
Rat 290 250 NA 7.5 weeks Increase in gross lung weight Penney et al.,1988
Rat 570 500 41–42 Birth through 33days of age
Phagocytic ability of alveolar macrophagesenhanced
Chen et al.,1982
Rabbit 5700–11 000
5000–10 000
NA 15–45 min Oedema of capillary endothelium and alveolarepithelium
Fein et al.,1980
Rabbit 9200 8000 63 15 min Capillary endothelial and alveolar epithelialswelling and oedema, permeability to 51Cr-labelledethylenediaminetetraacetic acid from alveoli toarterial blood increased, detachment of theendothelium from the basement membrane,mitochondrial disintegration, and alveolar Type 2cells depleted of lamellar bodies
Fein et al.,1980
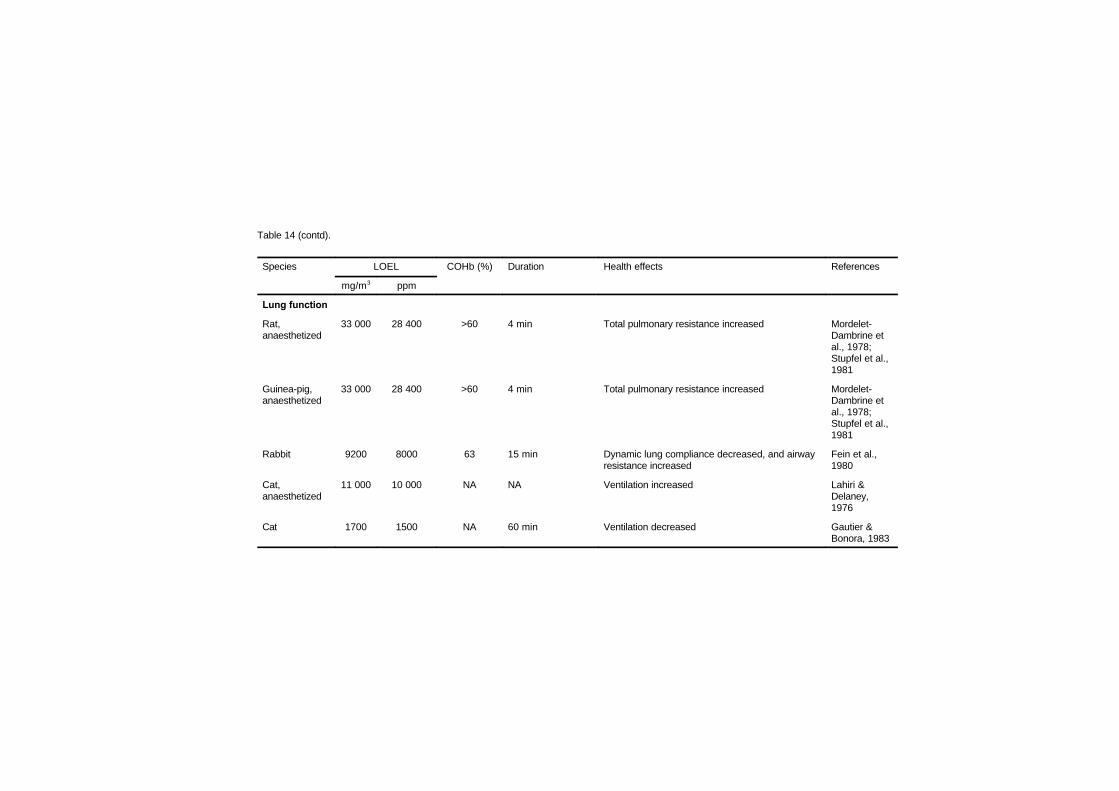
Table 14 (contd).
Species LOEL COHb (%) Duration Health effects References
mg/m3 ppm
Lung function
Rat,anaesthetized
33 000 28 400 >60 4 min Total pulmonary resistance increased Mordelet-Dambrine etal., 1978;Stupfel et al.,1981
Guinea-pig,anaesthetized
33 000 28 400 >60 4 min Total pulmonary resistance increased Mordelet-Dambrine etal., 1978;Stupfel et al.,1981
Rabbit 9200 8000 63 15 min Dynamic lung compliance decreased, and airwayresistance increased
Fein et al.,1980
Cat,anaesthetized
11 000 10 000 NA NA Ventilation increased Lahiri &Delaney,1976
Cat 1700 1500 NA 60 min Ventilation decreased Gautier &Bonora, 1983
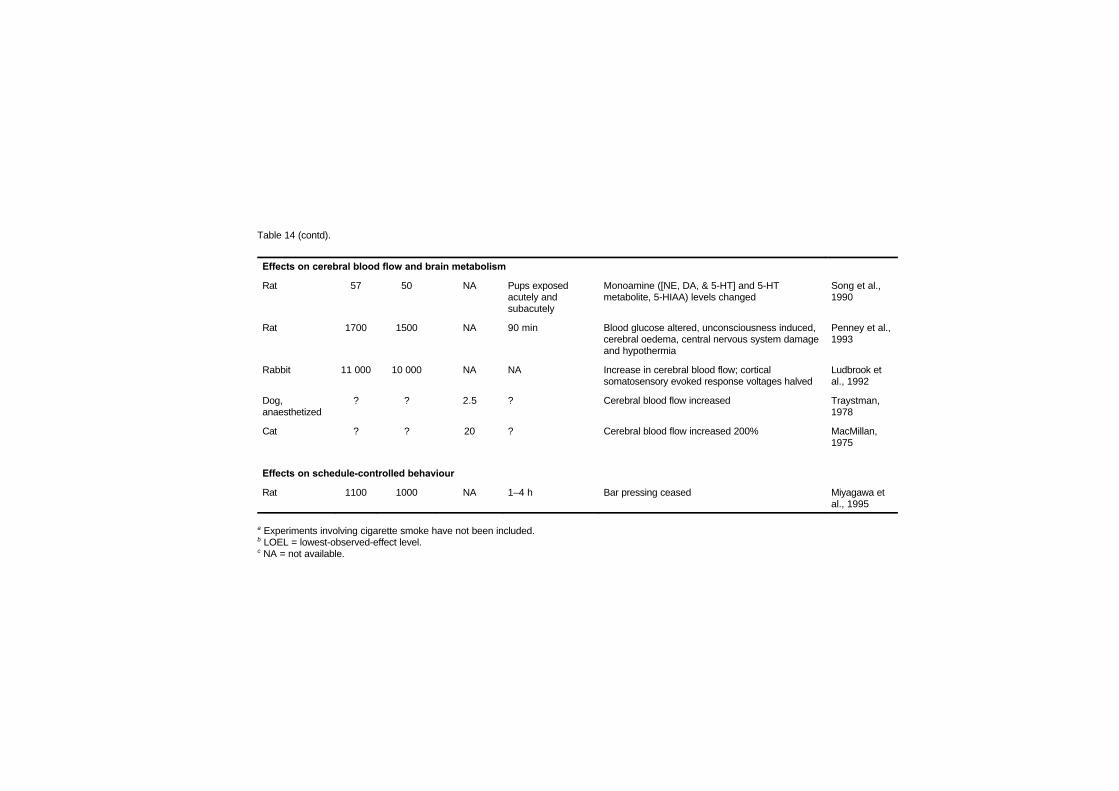
Table 14 (contd).
Effects on cerebral blood flow and brain metabolism
Rat 57 50 NA Pups exposedacutely andsubacutely
Monoamine ([NE, DA, & 5-HT] and 5-HTmetabolite, 5-HIAA) levels changed
Song et al.,1990
Rat 1700 1500 NA 90 min Blood glucose altered, unconsciousness induced,cerebral oedema, central nervous system damageand hypothermia
Penney et al.,1993
Rabbit 11 000 10 000 NA NA Increase in cerebral blood flow; corticalsomatosensory evoked response voltages halved
Ludbrook etal., 1992
Dog,anaesthetized
? ? 2.5 ? Cerebral blood flow increased Traystman,1978
Cat ? ? 20 ? Cerebral blood flow increased 200% MacMillan,1975
Effects on schedule-controlled behaviour
Rat 1100 1000 NA 1–4 h Bar pressing ceased Miyagawa etal., 1995
a Experiments involving cigarette smoke have not been included.b LOEL = lowest-observed-effect level.c NA = not available.
EHC 213: Carbon Monoxide
210
to a simulated altitude of 5500 m, Clark & Otis (1952) showed thatthese altitude-adapted mice survived 2900 mg carbon monoxide/m3
(2500 ppm) better than controls. Wilks et al. (1959) reported similareffects in dogs.
Chronic exposure of rats to carbon monoxide increases haemo-globin concentration, haematocrit and erythrocyte counts via erythro-poietin production. Penney et al. (1974a) concluded that the thresholdfor the erythropoietin response was 110 mg/m3 (100 ppm; 9.26%carboxyhaemoglobin). Cardiac enlargement, involving the entire heartduring carbon monoxide exposure (compared with right ventricularhypertrophy with high-altitude exposure), is induced when ambientcarbon monoxide is near 230 mg/m3 (200 ppm), producing a carboxy-haemoglobin level of 15.8% (Penney et al., 1974b). Blood volume ofthe rats exposed for 7.5 weeks to carbon monoxide exposures peakingat 1500 mg/m3 (1300 ppm) nearly doubled, and erythrocyte massmore than tripled (Penney et al., 1988). After 42 days of continuousexposure to 570 mg/m3 (500 ppm), rat blood volume almost doubled,primarily as a consequence of increases in numbers of erythrocytes(Davidson & Penney, 1988). It should be noted that all thedemonstrated effects on tissues and fluids are induced by long-termexposures to high carbon monoxide concentrations. McGrath (1989)exposed rats for 6 weeks to altitudes ranging from 1000 m (ambient)to 5500 m and to concentrations of carbon monoxide ranging from 0to 570 mg/m3 (0 to 500 ppm). At 10 and 40 mg carbon monoxide/m3
(9 and 35 ppm), where carboxyhaemoglobin levels ranged from 0.9%to 3.3%, there were no significant changes in body weight, rightventricular weight, haematocrit or haemoglobin. Small but non-significant changes in these variables were measured when the carbonmonoxide concentration was 110 mg/m3 (100 ppm) and carboxy-haemoglobin levels ranged from 9.4% to 10.2%. This is consistentwith the observations noted above (Penney et al., 1974a) — that thethreshold for erythropoietic effects was 110 mg/m3 (100 ppm).
Besides the level of exposure, the time course of exposure tocarbon monoxide is also important. As discussed above, haemoglobinincreases in laboratory animals exposed to carbon monoxide afterabout 48 h and continues to increase in the course of continuedexposure until about 30 days, depending perhaps upon exposure level.This haematopoietic response to long-term carbon monoxide exposure
Effects on Laboratory Animals
211
is similar to that shown for long-term hypoxic hypoxia, except that itis slower to start and tends to offset carbon monoxide hypoxic effects.
Most investigators have at least implied that increased haemo-globin level is the mechanism by which adaptation occurs. Certainlythis explanation is reasonable for the studies showing increasedsurvival in groups adapted for several days. Little has been done,however, to elucidate the extent to which such increases offset thedeleterious effects of carbon monoxide. The probability that someadaptation occurs is supported theoretically by haemoglobin increasesand empirically in the findings of laboratory animal studies measuringsurvival time. However, adaptation has not been demonstrated forspecific health effects other than survival time.
7.6 Developmental toxicity
7.6.1 Introduction
Developmental toxicity has been described as including death ofthe developing organism, structural abnormalities, altered growth andfunctional deficits resulting from toxic exposures that occur pre- andpostnatally up to the subject’s attaining sexual maturity. The appear-ance of toxic effects may occur at any time throughout life. Concernfor special vulnerability of immature organisms to toxic compoundsfocuses on the possibilities that (1) a toxic exposure that is notsufficient to produce maternal toxicity or toxicity in the adultorganism will adversely affect the fetus or neonate or (2) at a level ofexposure that does produce a toxic consequence in the adult ormother, the fetus or neonate suffers a qualitatively different toxicresponse. Toxic responses that occur early in life but are notpermanent may or may not be a cause of concern. In some cases, theytruly may be transient events with no persisting consequences.However, in other cases, such results may have their ownconsequences for development of the organism or may reappear underconditions of ill health produced by other toxic exposures, environ-mental stresses or exposure to pathogenic agents.
There are theoretical reasons and supporting experimental datathat suggest that the fetus and developing organism are especiallyvulnerable to carbon monoxide. One reason for approaching the fetusas a separate entity for purposes of regulation is that the fetus is likely
EHC 213: Carbon Monoxide
212
to experience a different carbon monoxide exposure from the adultgiven identical concentrations of the gas in air. This is due todifferences in uptake and elimination of carbon monoxide from fetalhaemoglobin, which are documented below. Further, differencesappear to exist among species in the relative affinity of fetal and adulthaemoglobin for carbon monoxide. These data are reviewed by Longo(1970).
Less studied is the possibility that tissue hypoxia may differbetween the fetus and adult even at equivalent carboxyhaemoglobinconcentrations as a result of differences in perfusion of critical organs,differences in maturation of adaptive cardiovascular responses tohypoxia and differences in tissue requirements for oxygen. Inferencesconcerning these factors are obtained principally fromexperimentation performed in laboratory animals in which theimmature organism does show enhanced toxicity relative to the adult.Concern must also be expressed for the development of sensitive andappropriate animal models. It is necessary to bear in mind the relativestate of development of the human and laboratory animal in questionat the time of birth in developing useful animal models. For example,the neonatal rat is very immature relative to the neonatal human atbirth with respect to development of the central nervous system(Fechter et al., 1986); thus, a combined prenatal and neonatalexposure model may be more accurate in predicting consequences ofprenatal exposure in the human.
Hill et al. (1977) aptly described mathematical models for pre-dicting fetal exposure to carbon monoxide based upon placentaltransport and the differences between maternal and fetal haemoglobinaffinity for carbon monoxide and oxygen. They predicted that for anymaternal carbon monoxide exposure of moderate duration, fetal car-boxyhaemoglobin levels would lag behind maternal carboxyhaemo-globin levels for several hours, but would, given sufficient time,surpass maternal carboxyhaemoglobin levels by as much as 10 per-centage points (in humans) owing to the higher carbon monoxideaffinity of fetal haemoglobin compared with adult haemoglobin.Moreover, they predicted a far longer wash-out period for the fetalcirculation to eliminate carbon monoxide following termination ofexposure than that found in the adult. Data accumulated in bothlaboratory animal and human studies support these conclusions.
Effects on Laboratory Animals
213
Table 15 summarizes developmental effects of carbon monoxideon laboratory animals.
7.6.2 Evidence for elevated fetal carboxyhaemoglobin relative tomaternal haemoglobin
A fairly wide range of neonatal and maternal carboxyhaemo-globin levels has been published for humans, probably due to widedifferences in cigarette smoking patterns prior to and during labour.In one recent study, measurement of fetal cord blood in the offspringof cigarette smokers who smoked during labour showed fetal carboxy-haemoglobin levels 2.55 times higher than in maternal blood. Cordblood averaged 10.1% carboxyhaemoglobin at delivery, whereasmaternal blood averaged 5.6% carboxyhaemoglobin on the mother’sarrival at the hospital and 4.1% carboxyhaemoglobin at delivery(Bureau et al., 1982). These values for fetal carboxyhaemoglobin arefairly high relative to other published sources (Longo, 1977). How-ever, higher fetal carboxyhaemoglobin levels have been found inlaboratory studies across a broad range of animal species whensufficient time was allowed for carboxyhaemoglobin to equilibrate inthe fetal compartment. Christensen et al. (1986) ultimately observedhigher carbon monoxide levels in fetal guinea-pigs than in their damsfollowing carbon monoxide exposure given near term. Immediatelyfollowing maternal exposure, at gestational age 62–65 days, to a bolusof carbon monoxide gas (5 ml given over 65 s through a trachealcatheter), these investigators reported a faster elevation in maternalcarboxyhaemoglobin levels than in fetal levels, a finding consistentwith the models of Hill et al. (1977).
Anders & Sunram (1982) exposed gravid rats to 25 mg carbonmonoxide/m3 (22 ppm) for 1 h on day 21 of gestation and reportedthat fetal carboxyhaemoglobin levels averaged 12% higher than levelstaken at the same time period in the dam. These results are consistentwith those of Garvey & Longo (1978), whose study involved chroniccarbon monoxide exposures in rats. Dominick & Carson (1983)exposed pregnant sows to carbon monoxide concentrations of 170–460 mg/m3 (150–400 ppm) for 48–96 h between gestation days 108and 110. They reported fetal carboxyhaemoglobin levels that exceededmaternal levels by 3–22% using a CO-Oximeter.
Studies with control and protein-deficient CD-1 mice exposed to0 (endogenous), 74 or 140 mg carbon monoxide/m3 (0, 65 or 125
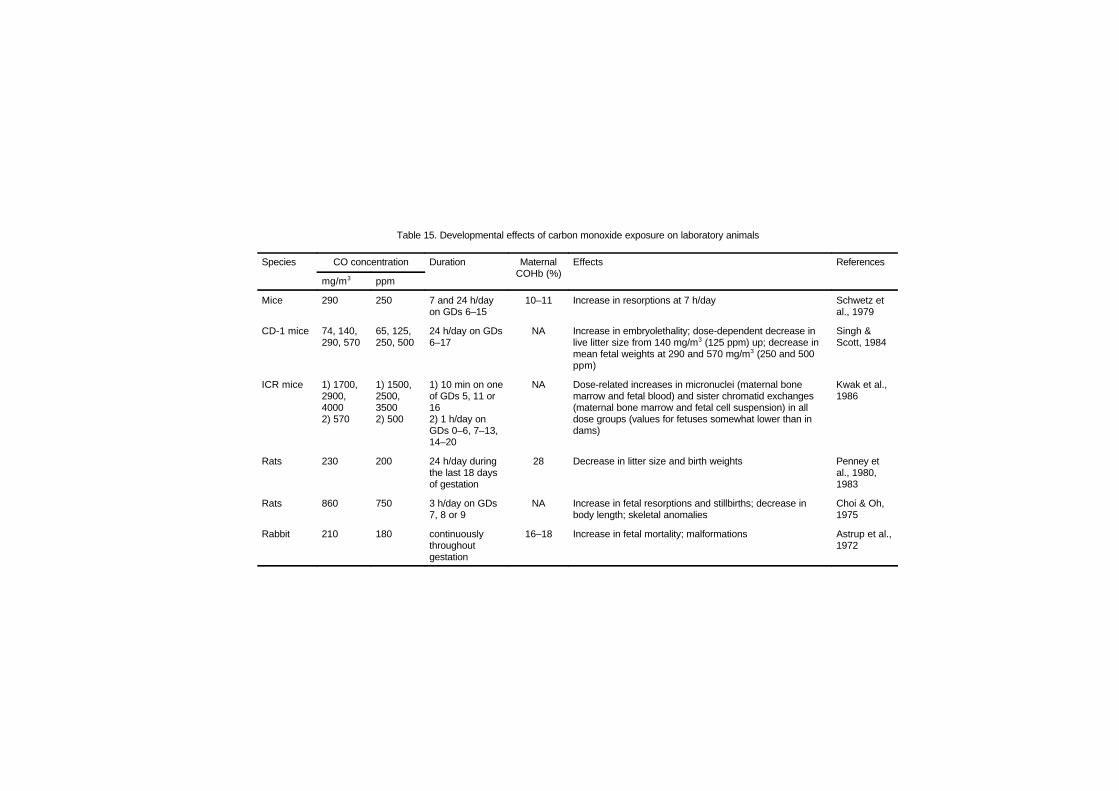
Table 15. Developmental effects of carbon monoxide exposure on laboratory animals
Species CO concentration Duration MaternalCOHb (%)
Effects References
mg/m3 ppm
Mice 290 250 7 and 24 h/dayon GDs 6–15
10–11 Increase in resorptions at 7 h/day Schwetz etal., 1979
CD-1 mice 74, 140,290, 570
65, 125,250, 500
24 h/day on GDs6–17
NA Increase in embryolethality; dose-dependent decrease inlive litter size from 140 mg/m3 (125 ppm) up; decrease inmean fetal weights at 290 and 570 mg/m3 (250 and 500ppm)
Singh &Scott, 1984
ICR mice 1) 1700,2900,40002) 570
1) 1500,2500,35002) 500
1) 10 min on oneof GDs 5, 11 or162) 1 h/day onGDs 0–6, 7–13,14–20
NA Dose-related increases in micronuclei (maternal bonemarrow and fetal blood) and sister chromatid exchanges(maternal bone marrow and fetal cell suspension) in alldose groups (values for fetuses somewhat lower than indams)
Kwak et al.,1986
Rats 230 200 24 h/day duringthe last 18 daysof gestation
28 Decrease in litter size and birth weights Penney etal., 1980,1983
Rats 860 750 3 h/day on GDs7, 8 or 9
NA Increase in fetal resorptions and stillbirths; decrease inbody length; skeletal anomalies
Choi & Oh,1975
Rabbit 210 180 continuouslythroughoutgestation
16–18 Increase in fetal mortality; malformations Astrup et al.,1972
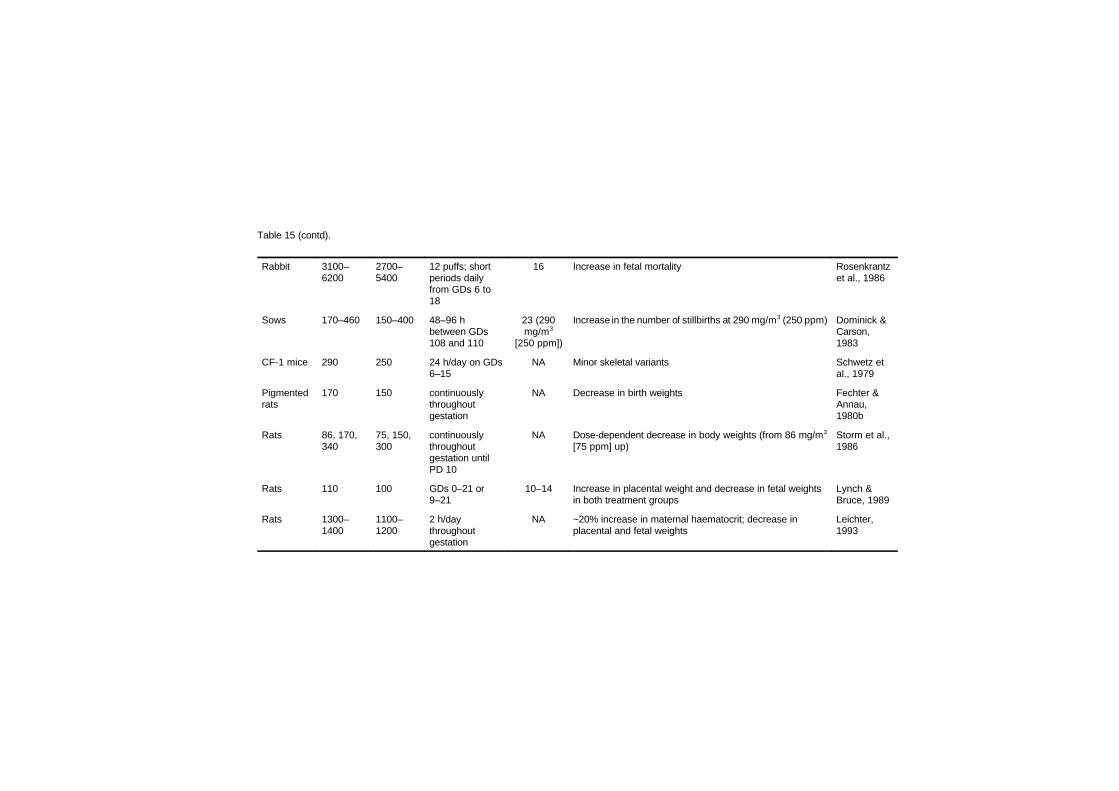
Table 15 (contd).
Rabbit 3100–6200
2700–5400
12 puffs; shortperiods dailyfrom GDs 6 to18
16 Increase in fetal mortality Rosenkrantzet al., 1986
Sows 170–460 150–400 48–96 hbetween GDs108 and 110
23 (290mg/m3
[250 ppm])
Increase in the number of stillbirths at 290 mg/m3 (250 ppm) Dominick &Carson,1983
CF-1 mice 290 250 24 h/day on GDs6–15
NA Minor skeletal variants Schwetz etal., 1979
Pigmentedrats
170 150 continuouslythroughoutgestation
NA Decrease in birth weights Fechter &Annau,1980b
Rats 86, 170,340
75, 150,300
continuouslythroughoutgestation untilPD 10
NA Dose-dependent decrease in body weights (from 86 mg/m3
[75 ppm] up)Storm et al.,1986
Rats 110 100 GDs 0–21 or9–21
10–14 Increase in placental weight and decrease in fetal weightsin both treatment groups
Lynch &Bruce, 1989
Rats 1300–1400
1100–1200
2 h/daythroughoutgestation
NA ~20% increase in maternal haematocrit; decrease inplacental and fetal weights
Leichter,1993
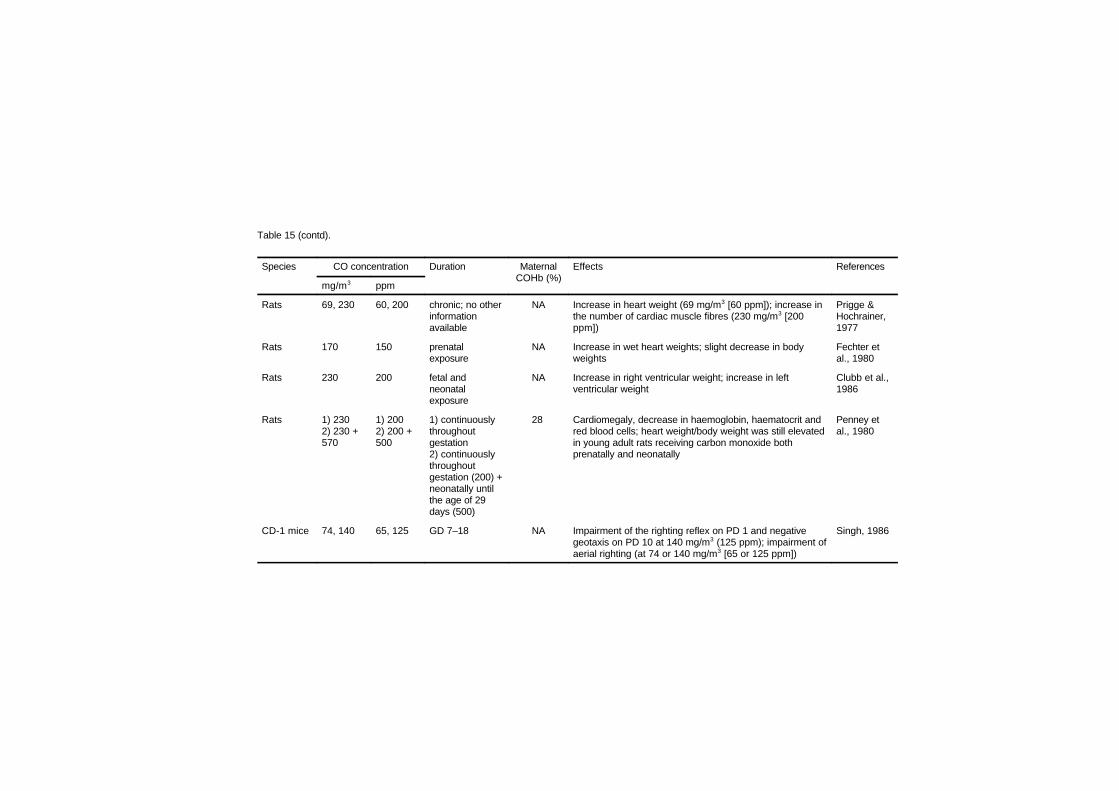
Table 15 (contd).
Species CO concentration Duration MaternalCOHb (%)
Effects References
mg/m3 ppm
Rats 69, 230 60, 200 chronic; no otherinformationavailable
NA Increase in heart weight (69 mg/m3 [60 ppm]); increase inthe number of cardiac muscle fibres (230 mg/m3 [200ppm])
Prigge &Hochrainer,1977
Rats 170 150 prenatalexposure
NA Increase in wet heart weights; slight decrease in bodyweights
Fechter etal., 1980
Rats 230 200 fetal andneonatalexposure
NA Increase in right ventricular weight; increase in leftventricular weight
Clubb et al.,1986
Rats 1) 2302) 230 +570
1) 2002) 200 +500
1) continuouslythroughoutgestation2) continuouslythroughoutgestation (200) +neonatally untilthe age of 29days (500)
28 Cardiomegaly, decrease in haemoglobin, haematocrit andred blood cells; heart weight/body weight was still elevatedin young adult rats receiving carbon monoxide bothprenatally and neonatally
Penney etal., 1980
CD-1 mice 74, 140 65, 125 GD 7–18 NA Impairment of the righting reflex on PD 1 and negativegeotaxis on PD 10 at 140 mg/m3 (125 ppm); impairment ofaerial righting (at 74 or 140 mg/m3 [65 or 125 ppm])
Singh, 1986
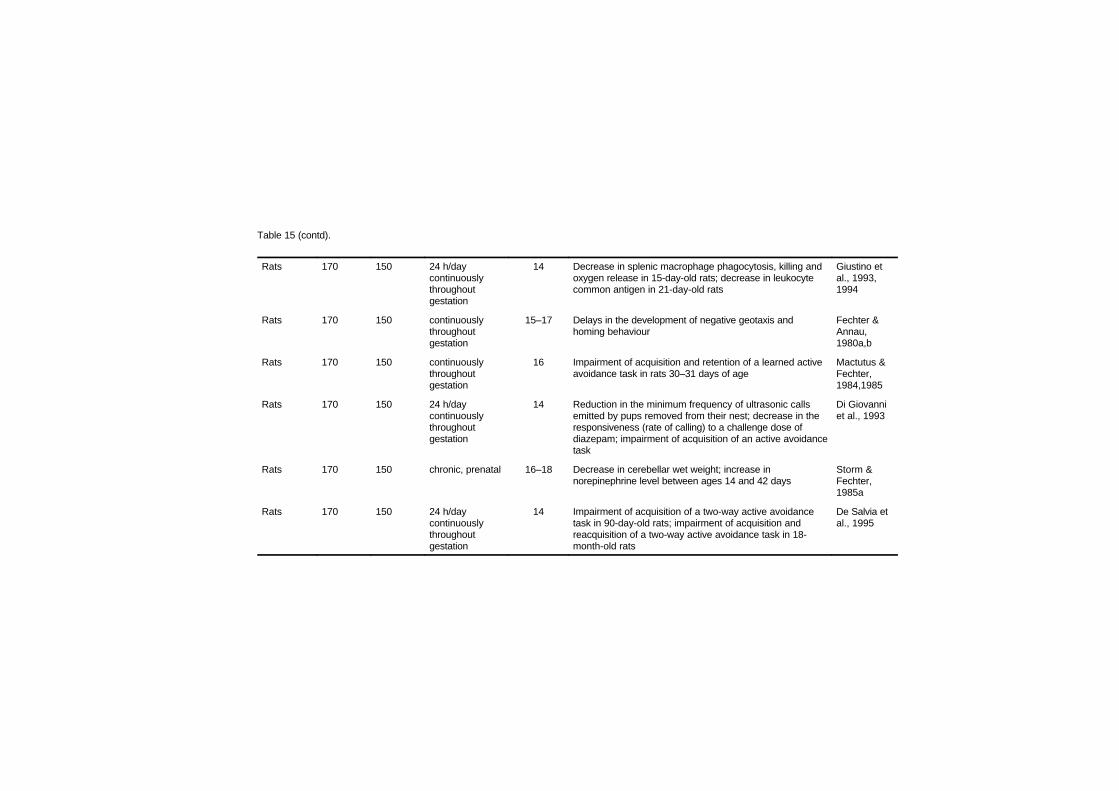
Table 15 (contd).
Rats 170 150 24 h/daycontinuouslythroughoutgestation
14 Decrease in splenic macrophage phagocytosis, killing andoxygen release in 15-day-old rats; decrease in leukocytecommon antigen in 21-day-old rats
Giustino etal., 1993,1994
Rats 170 150 continuouslythroughoutgestation
15–17 Delays in the development of negative geotaxis andhoming behaviour
Fechter &Annau,1980a,b
Rats 170 150 continuouslythroughoutgestation
16 Impairment of acquisition and retention of a learned activeavoidance task in rats 30–31 days of age
Mactutus &Fechter,1984,1985
Rats 170 150 24 h/daycontinuouslythroughoutgestation
14 Reduction in the minimum frequency of ultrasonic callsemitted by pups removed from their nest; decrease in theresponsiveness (rate of calling) to a challenge dose ofdiazepam; impairment of acquisition of an active avoidancetask
Di Giovanniet al., 1993
Rats 170 150 chronic, prenatal 16–18 Decrease in cerebellar wet weight; increase innorepinephrine level between ages 14 and 42 days
Storm &Fechter,1985a
Rats 170 150 24 h/daycontinuouslythroughoutgestation
14 Impairment of acquisition of a two-way active avoidancetask in 90-day-old rats; impairment of acquisition andreacquisition of a two-way active avoidance task in 18-month-old rats
De Salvia etal., 1995
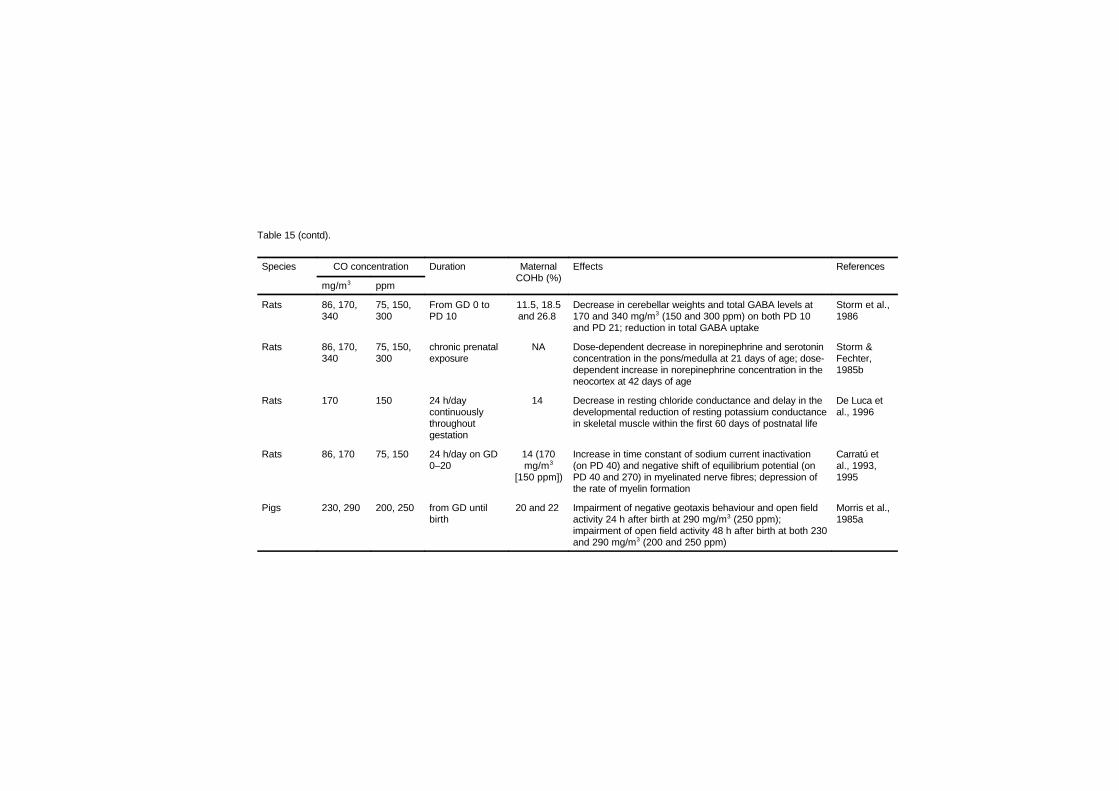
Table 15 (contd).
Species CO concentration Duration MaternalCOHb (%)
Effects References
mg/m3 ppm
Rats 86, 170,340
75, 150,300
From GD 0 toPD 10
11.5, 18.5and 26.8
Decrease in cerebellar weights and total GABA levels at170 and 340 mg/m3 (150 and 300 ppm) on both PD 10and PD 21; reduction in total GABA uptake
Storm et al.,1986
Rats 86, 170,340
75, 150,300
chronic prenatalexposure
NA Dose-dependent decrease in norepinephrine and serotoninconcentration in the pons/medulla at 21 days of age; dose-dependent increase in norepinephrine concentration in theneocortex at 42 days of age
Storm &Fechter,1985b
Rats 170 150 24 h/daycontinuouslythroughoutgestation
14 Decrease in resting chloride conductance and delay in thedevelopmental reduction of resting potassium conductancein skeletal muscle within the first 60 days of postnatal life
De Luca etal., 1996
Rats 86, 170 75, 150 24 h/day on GD0–20
14 (170mg/m3
[150 ppm])
Increase in time constant of sodium current inactivation(on PD 40) and negative shift of equilibrium potential (onPD 40 and 270) in myelinated nerve fibres; depression ofthe rate of myelin formation
Carratú etal., 1993,1995
Pigs 230, 290 200, 250 from GD untilbirth
20 and 22 Impairment of negative geotaxis behaviour and open fieldactivity 24 h after birth at 290 mg/m3 (250 ppm);impairment of open field activity 48 h after birth at both 230and 290 mg/m3 (200 and 250 ppm)
Morris et al.,1985a
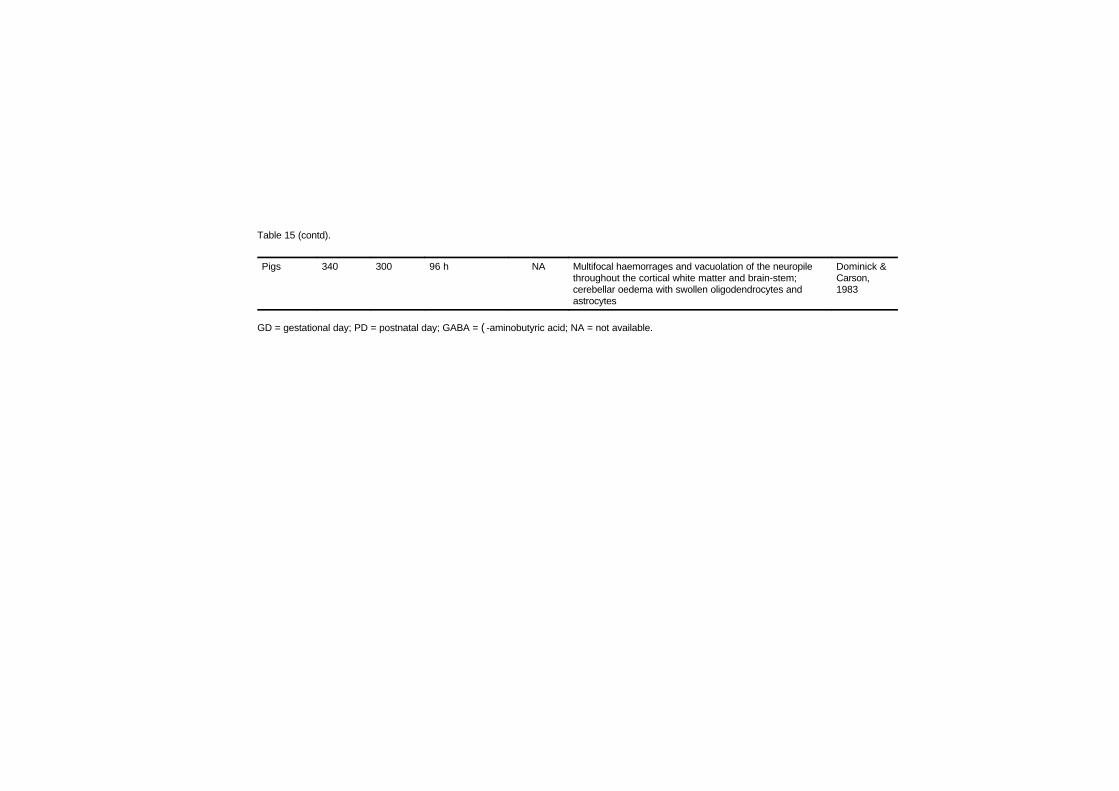
Table 15 (contd).
Pigs 340 300 96 h NA Multifocal haemorrages and vacuolation of the neuropilethroughout the cortical white matter and brain-stem;cerebellar oedema with swollen oligodendrocytes andastrocytes
Dominick &Carson,1983
GD = gestational day; PD = postnatal day; GABA = (-aminobutyric acid; NA = not available.
EHC 213: Carbon Monoxide
220
ppm) from days 8 to 18 of gestation revealed that maternal carboxy-haemoglobin levels were related to carbon monoxide concentration andwere inversely related to dietary protein intake. The authors suggestedthat protein deficiency may enhance placental carboxyhaemoglobinlevels, which may exacerbate fetal hypoxia (Singh et al., 1992).
Carbon monoxide uptake and elimination were studied in maternaland fetal sheep. When pregnant sheep in the last quarter of gestationwere exposed to 34 mg carbon monoxide/m3 (30 ppm), the maternalcarboxyhaemoglobin increased from a baseline level of 1.1% to around4.6% over 8–10 h. The fetal carboxyhaemoglobin increased moreslowly from a baseline value of around 1.8% to a steady-state value of7.4% by 36–48 h. At 57 mg/m3 (50 ppm), the steady-statecarboxyhaemoglobin in the dams was 12.2% and in the fetus 19.8%.The increase in the maternal carboxyhaemoglobin resembled a simpleexponential process with a half-time of 1.5 h; the half-time for fetalcarboxyhaemoglobin was 5 h. The decay curve for carbon monoxideelimination showed a similar relationship, with elimination occurringmore slowly in the fetus than in the mother (Longo & Hill, 1977).
Fetal carboxyhaemoglobin kinetics may not be static throughoutpregnancy. Bissonnette & Wickham (1977) studied transplacentalcarbon monoxide uptake in guinea-pigs at approximate gestational ages45–68 days. They reported that placental diffusing capacity increasessignificantly with increased gestational age and appears to becorrelated with fetal weight rather than placental weight. Longo &Ching (1977) also showed increases in carbon monoxide diffusion ratesacross the placenta of the ewe during the last trimester of pregnancy.However, they did not find a consistent increase when diffusion ratewas corrected for fetal weight (i.e., when diffusing capacity wasexpressed on a per kilogram fetal weight basis).
7.6.3 Effect of maternal carboxyhaemoglobin on placental oxygentransport
Gurtner et al. (1982) studied the transport of oxygen across theplacenta in the presence of carbon monoxide by cannulating both thematernal and fetal vessels of anaesthetized sheep. They measured thetransport of oxygen across the placenta compared with transport ofargon, urea and tritiated water when carbon monoxide was introduced.They showed a reduction in oxygen diffusing capacity relative to
Effects on Laboratory Animals
221
argon, which appeared to be related to the level of maternal carboxy-haemoglobin. Reduction of oxygen transport was observed below 10%carboxyhaemoglobin, and oxygen transport approached zero at car-boxyhaemoglobin values of 40–50%. Gurtner et al. (1982) interpretedthese data as supporting the role of carrier-mediated transport foroxygen and suggested that carbon monoxide competitively binds to thiscarrier. An alternative explanation is that the introduction of carbonmonoxide simply reduces the amount of fetal haemoglobin available tobind oxygen. Moreover, Longo & Ching (1977), for example, wereunable to alter carbon monoxide diffusing capacity across the placentaby administration of a series of drugs that bind to cytochrome P-450.
Christensen et al. (1986) suggested that maternal carbon monox-ide exposure may independently impair oxygen diffusion across theplacenta as a result of the enhanced affinity of maternal haemoglobinfor oxygen in the presence of carboxyhaemoglobin (the Haldaneeffect). Using the guinea-pig, these authors demonstrated an initial,almost instantaneous, fall in fetal PO2
in arterial blood and an increasein fetal partial pressure of carbon dioxide, which subsequently wasfollowed by an increase in fetal carboxyhaemoglobin between approxi-mately 5 and 10 min (the last time point studied, but a time when fetalcarboxyhaemoglobin values were still far below maternal values). Theycalculated that the decrease in fetal oxygen transfer was due mostly toa decrease in maternal oxygen carrying capacity, but also, perhaps upto one-third, to the increased affinity of haemoglobin for oxygen in thepresence of carbon monoxide. This model assumes that uterineperfusion remains constant under the experimental conditions used.Longo (1976) also showed a significant dose-related drop in fetaloxygen levels in blood taken from the fetal descending artery and fetalinferior vena cava after pregnant ewes were exposed to variable levelsof carbon monoxide for durations sufficient to yield carboxyhaemo-globin equilibration in both the fetal and maternal compartments.
To summarize, it has been demonstrated that the presence ofmaternal carboxyhaemoglobin over a range of values results indepressed oxygen levels in fetal blood. The simplest explanations forthe inverse relationship between maternal carboxyhaemoglobin andfetal oxygen levels are reduced maternal oxygen carrying capacity,impaired dissociation of oxygen from maternal haemoglobin (the
EHC 213: Carbon Monoxide
222
Haldane effect) and reduced availability of free fetal haemoglobin thatis able to bind oxygen.
7.6.3.1 Measurement of carboxyhaemoglobin content in fetal blood
Zwart et al. (1981a) and Huch et al. (1983) called into questionthe accuracy of spectrophotometric measurements of carboxyhaemo-globin in fetal blood using the IL 182 and IL 282 CO-Oximeter. TheCO-Oximeter is effectively a spectrophotometer preset to read samplesat specific wavelengths that correspond to absorbance maxima foroxyhaemoglobin, carboxyhaemoglobin and methaemoglobin deter-mined using adult blood samples. Different plug-in modules (IL 182)or programmed absorbance values (IL 282) can be used to correct forspecies differences in the absorbance spectrum of rat, human, dog andcow. Some investigators have used these instruments for estimatingcarboxyhaemoglobin levels in species for which the instrument has notbeen calibrated, such as the pig and guinea-pig. Typically, individualinvestigators have calibrated the CO-Oximeter using blood standardsfully saturated with carbon monoxide and with oxygen. The adequacyof such a procedure is not certain. Further, the correspondence ofabsorbance maxima between adult and fetal haemoglobin for speciesupon which the CO-Oximeter is calibrated at the factory is an empiricalquestion for which few data are published. Noting the finding of higherapparent carboxyhaemoglobin levels in the venous cord blood ofhumans than in the uterine artery, Huch et al. (1983) examined thepossibility that oxyhaemoglobin in fetal blood might interfere withaccurate measurement of carboxyhaemoglobin levels in the fetus,presumably because of different absorbance maxima for fetal than foradult blood. Working in vitro, Huch et al. (1983) deoxygenated fetaland maternal blood by flushing a tonometer with nitrogen and 5%carbon dioxide. They introduced a “small volume” of carbon monoxidegas, measured the blood gases using the IL 282 CO-Oximeter and thenstudied the effect of stepwise addition of oxygen to the apparentcarboxyhaemoglobin levels. They showed little influence of oxygensaturation upon maternal carboxyhaemoglobin but indicated thatoxygen saturation did affect readings of fetal carboxyhaemoglobin soas to overestimate carboxyhaemoglobin. This error is particularly likelyat high oxyhaemoglobin concentrations. Zwart et al. (1981b) suggestedan apparent elevation of carboxyhaemoglobin levels of approximately2% with 40% oxyhaemoglobin saturation and of approximately 6%with oxyhaemoglobin levels of 90–95%. Such errors do not invalidatethe finding that fetal carboxyhaemoglobin exceeds maternal values, butthey do bring into question the magnitude of this difference. Whethersimilar errors also occur in measuring fetal carboxyhaemoglobin levels
Effects on Laboratory Animals
223
in animal blood is uncertain and should be subjected to experimentaltest. The calibration of spectrophotometers based upon fetalhaemoglobin absorbance spectra rather than automated analysis basedupon adult absorbance spectra is recommended to achieve greateraccuracy in determining absolute levels of carbon monoxide in fetalblood. Vreman et al. (1984) described a gas chromatographic methodfor measuring carboxyhaemoglobin that has been applied to humanneonates. Because of the very small volume of blood needed to makethese measurements and because they eliminate the problem ofabsorbance spectra of fetal haemoglobin, this may be considered auseful means of accurately assessing carboxyhaemoglobin indeveloping organisms. There is also a new model of the CO-Oximeter(No. 482) that apparently allows for use of absorbance spectra basedon calibration of fetal blood.
7.6.4 Consequences of carbon monoxide in development
This section presents the evidence that carbon monoxide exposureduring early development has the potential of producing untowardeffects. The four types of toxic outcomes — fetotoxicity, grossteratogenicity, altered growth and functional deficiencies in sensitiveorgan systems — are considered in order. As is the case in adultorganisms, the nervous and cardiovascular systems appear to be mostsensitive to carbon monoxide exposure.
7.6.4.1 Fetotoxic and teratogenic consequences of prenatal carbonmonoxide exposure
There is clear evidence from laboratory animal studies that veryhigh levels of carbon monoxide exposure may be fetotoxic. However,there exists some question concerning the level of exposure that causesfetal death, because both the duration and concentration of maternalexposure are critical values in determining fetal exposure. The data thatsuggest that prenatal carbon monoxide exposure produces terata areextremely limited and, again, come largely from studies using quitehigh exposure levels.
EHC 213: Carbon Monoxide
224
1) Fetotoxicity
CD-1 mice (17 per group) were exposed to 0, 74, 140, 290 or570 mg carbon monoxide/m3 (0, 65, 125, 250 or 500 ppm), 24 h perday, from days 6 to 17 of gestation and were sacrificed on day 18. Nosigns of maternal toxicity were observed at any dose. Embryo-fetaltoxicity became apparent at 140 mg/m3 (125 ppm), resulting in a dose-dependent decrease in live litter size, an increase in embryolethalityand decreased mean fetal weights. No malformations were detected.Although a significant decrease in fetal weights was found at the twohighest doses, skeletal abnormalities (reduced ossification) werereported as not being dose dependent (Singh & Scott, 1984).
Schwetz et al. (1979) also exposed mice to 290 mg carbonmonoxide/m3 (250 ppm) for 7 and 24 h per day on gestation days 6–15.They found no effect on number of implantation sites or number of livefetuses per litter, but they did find a significant elevation in resorptionswith the 7-h exposure (10–11% carboxyhaemoglobin), but not with 24h per day exposures.
Rates of micronuclei and sister chromatid exchanges wereanalysed in ICR mice from mothers and fetuses on day 20 of pregnancyafter exposure to high acute doses (0, 1700, 2900 or 4000 mg/m3 [0,1500, 2500 or 3500 ppm] for 10 min) of carbon monoxide on one ofday 5, day 11 or day 16 of pregnancy. In a more chronic exposureregime, pregnant mice were treated with 570 mg carbon monoxide/m3
(500 ppm) for 1 h per day on days 0–6, 7–13 or 14–20. Dose-relatedincreases in both micronuclei and sister chromatid exchanges wereobserved in all dose groups, values for fetuses being somewhat lowerthan for dams. This may relate to the different sensitivity of the tissuesexamined (maternal bone marrow and fetal blood for the micronucleustest, maternal bone marrow and fetal cell suspension for sisterchromatid exchanges). No relevant differences were found betweenmaternal and fetal values or between exposure on different days or timeperiods of gestation (Kwak et al., 1986).
Dominick & Carson (1983) exposed pregnant sows to carbonmonoxide concentrations of 170–460 mg/m3 (150–400 ppm) for48–96 h between gestation days 108 and 110 (average gestation was114 days). They showed a significant linear increase in the number ofstillbirths as a function of increasing carbon monoxide exposure.Stillbirths were significantly elevated above control levels when the
Effects on Laboratory Animals
225
maternal carboxyhaemoglobin levels exceeded 23% saturation. Thesesaturation levels were obtained at approximately 290 mg carbonmonoxide/m3 (250 ppm). Carboxyhaemoglobin levels were measuredusing an IL 182 CO-Oximeter equipped with a human blood board; pigblood samples fully saturated with carbon monoxide and with oxygenwere run each day to calibrate the instrument. There was very largevariability among litters at a given concentration level in the percentageof stillbirths that occurred. Penney et al. (1980) found evidence ofreduced litter size in rats exposed for the last 18 days of gestation to230 mg carbon monoxide/m3 (200 ppm; maternal carboxyhaemoglobinlevels averaged 28%). However, Fechter et al. (1987) did not observesimilar effects on litter size in rats exposed to levels of carbonmonoxide as high as 340 mg/m3 (300 ppm; maternal carboxyhaemo-globin levels of 24%).
2) Teratogenicity
There are limited data (Astrup et al., 1972) suggesting increasedfetal mortality and malformations among rabbits exposed to 210 mgcarbon monoxide/m3 (180 ppm; 16–18% carboxyhaemoglobin)throughout gestation. The frequency of malformations reported wassmall and the historical rate of such anomalies in the laboratory wasundocumented, so these results require replication by other workersbefore they can be considered as the basis for regulation. Rosenkrantzet al. (1986) exposed rabbits to high doses (12 puffs of 3100–6200 mg/m3 [2700–5400 ppm]) of carbon monoxide for short periodsdaily from gestation days 6 to 18. Carboxyhaemoglobin levels wereestimated at 16%, although animals had not equilibrated with theinhaled mixture. Despite a large number of fetal deaths, there was noevidence of terata in the carbon monoxide-exposed animals.
Choi & Oh (1975) reported skeletal anomalies in rats exposed to860 mg carbon monoxide/m3 (750 ppm) for 3 h per day on gestationday 7, 8 or 9. They also reported an excess in fetal absorptions andstillbirths and a decrease in body length. Schwetz et al. (1979) reportedno teratogenic effects but did report an increase in minor skeletalvariants in CF-1 mice exposed to 290 mg carbon monoxide/m3
(250 ppm) for 24 h per day from gestation days 6 to 15.
One of the best-studied and possibly one of the most sensitivemeasures of early carbon monoxide exposure is a depression in birthweight. The effect seen in animals following fetal carbon monoxide
EHC 213: Carbon Monoxide
226
exposure is generally transitory and occurs despite the fact thatmaternal body weight growth through pregnancy does not appear to beadversely affected. Inasmuch as the depressed birth weight observedis a transient event, its significance is not clear. However, in humans,low-birth-weight babies may be at particular risk for many otherdevelopmental disorders, so the effect cannot be disregarded casually.Moreover, in humans, there is a strong correlation between maternalcigarette smoking and reduced birth weight (see chapter 8). Whetherthe causative agent here is carbon monoxide, nicotine or a combinationof these or other agents is uncertain.
Fechter & Annau (1980b) replicated earlier data from theirlaboratory showing significantly depressed birth weights in pigmentedrats exposed throughout gestation to 170 mg carbon monoxide/m3
(150 ppm). Penney et al. (1980) also found a significant depression inbirth weight among rats exposed for the last 18 days of gestation to 230mg carbon monoxide/m3 (200 ppm). Penney et al. (1983) showed atrend towards divergence in body weight among fetuses exposed to 230mg carbon monoxide/m3 (200 ppm), which developed progressivelyduring the last 17 days of parturition, suggesting that late gestationalexposure to carbon monoxide may be essential to observe the effect.Storm et al. (1986) reported that following carbon monoxide exposurefrom the beginning of gestation through postnatal day 10, body weightwas depressed in a dose-dependent fashion at 86, 170 and 340 mgcarbon monoxide/m3 (75, 150 and 300 ppm). Moreover, these valueswere all significantly lower than air-control subjects. By age 21 days,no significant body weight differences were seen among the testgroups. At no time did Fechter and colleagues observe evidence ofmaternal toxicity as identified by death, reduced maternal weight gainor gross physical appearance.
Exposure of Wistar rats (11–17 per group) to 110 mg carbonmonoxide/m3 (100 ppm) during pregnancy, with maternal carboxy-haemoglobin levels estimated to be in the order of 10–14%, resulted infetal weight reductions of 8% and 6% in groups treated over days 0–21or 9–21 of gestation, respectively. No effects on fetal weight wereobserved with exposure on days 0–15, 3–11 or 17–21 of gestation.Placental weight increased significantly in all groups for which carbonmonoxide exposure continued to term but was unaffected whentreatment ceased before term (Lynch & Bruce, 1989).
Effects on Laboratory Animals
227
Leichter (1993) exposed groups of 7–8 pregnant Sprague-Dawleyrats to 1300–1400 mg carbon monoxide/m3 (1100–1200 ppm) for 2 hper day throughout gestation. As food intake was reduced in carbonmonoxide-exposed animals, a pair-fed control group was introduced inaddition to a control group allowed food ad libitum. When the animalswere killed on day 20 of pregnancy, maternal haematocrit values in thecarbon monoxide-exposed group were increased by about 20%compared with both control group values. Fetal and placental weightswere significantly decreased in the carbon monoxide-exposed groupcompared with the other two groups.
Morris et al. (1985b) exposed neonatal piglets chronically tocarbon monoxide for 21 days starting at approximately 28 days of age(230 and 340 mg/m3 [200 and 300 ppm]; carboxyhaemoglobin levelsaveraged 16% and 21%, respectively). They reported a significantimpairment in weight gain in pigs exposed to 340 mg carbonmonoxide/m3 (300 ppm), but no effect in pigs exposed to 230 mg/m3
(200 ppm).
7.6.4.2 Alteration in cardiovascular development following early carbonmonoxide exposure
It is known that a variety of cardiovascular and haematopoieticchanges can accompany hypoxia in neonates and adult subjects,including elevation in haemoglobin, haematocrit and heart weight. Datagathered in adult laboratory animals suggest that these changes may berelated. Cardiomegaly resulting from hypoxia reflects the amount ofwork performed to extract an adequate supply of oxygen. Whether ornot the same processes occur in prenatal and neonatal carbonmonoxide-induced hypoxia has been the subject of several reports. Forprenatal exposure, the accumulated laboratory animal data suggest thatcarbon monoxide-induced cardiomegaly may be proportionatelygreater than in adult animals at a given maternal carbon monoxideexposure level. Whether or not this is due to higher fetal carboxy-haemoglobin levels, as a consequence of fetal haemoglobin’s higheraffinity for carbon monoxide, is not clear. Although the cardiomegalymay resolve when the neonatal subject is placed in a normal airenvironment, there is evidence for a persisting increase in the numberof muscle fibres. The functional significance of these changes, if any,is uncertain. The lowest-observed-effect level (LOEL) for fetalcardiomegaly has not been well determined. One experiment has shownsignificant elevation of heart weight following carbon monoxide
EHC 213: Carbon Monoxide
228
exposures as low as 69 mg/m3 (60 ppm) (Prigge & Hochrainer, 1977),and there are no published dose–response experiments that provide ano-observed-effect level (NOEL). Chronic prenatal carbon monoxideexposure at approximately 230 mg/m3 (200 ppm) results in a significantincrease in the number of muscle fibres in the heart. The NOEL for thischange has not been determined.
Fechter et al. (1980) measured wet and dry heart weight andprotein and nucleic acid levels at several time points between birth andweaning in rats prenatally exposed to 170 mg carbon monoxide/m3
(150 ppm) or to air. They reported that neonates had significantlyelevated wet heart weights despite a slightly reduced body weight atbirth. Groups did not differ at birth in dry heart weight, total protein orRNA or DNA levels in whole heart. No significant differences betweengroups on any measure were present at postnatal day 4 or subsequentages studied. The data were interpreted as evidence for cardiac oedemarather than a change in heart muscle mass itself. The finding of aheavier heart at birth replicated the finding of Prigge & Hochrainer(1977), who exposed rats prenatally to carbon monoxide at levels aslow as 69 mg/m3 (60 ppm) and observed a similar increase in heartweight. Clubb et al. (1986) observed increases in right ventricularweight due to fetal carbon monoxide exposure and increases in leftventricular weight following neonatal exposure to 230 mg carbonmonoxide/m3 (200 ppm). As in the case of Fechter et al. (1980), theyshowed a gradual return to normal heart weight when prenatallyexposed neonates were placed in an air environment neonatally.
These results were not verified by Penney et al. (1983) inoffspring of pregnant rats exposed to 180, 190 or 230 mg carbonmonoxide/m3 (157, 166 or 200 ppm; 21.8–33.5% carboxyhaemo-globin) for the last 17 of 22 gestation days. These workers observedthat wet and dry heart weights increase proportionately and concludedthat cardiomegaly, present at birth, is not due to elevated myocardialwater content. They also determined that cardiac lactate dehydrogenaseM subunit composition and myoglobin concentration were elevated at230 mg carbon monoxide/m3 (200 ppm). They concluded that maternalcarbon monoxide inhalation exerts significant effects on fetal body andplacental weights, heart weight, enzyme constituents and enzymecomposition. Moreover, in newborn rats inhaling 570 mg carbonmonoxide/m3 (500 ppm; 38–42% carboxyhaemoglobin) for 32 days
Effects on Laboratory Animals
229
and then developing in air, Penney et al. (1982) observed that heartweight to body weight ratios increased sharply after birth, peaked at14 days of age and then fell progressively; they remained higher in ratsexposed prenatally to carbon monoxide than in control rats for up to107 days of age. The persistent cardiomegaly could not be explainedby changes in DNA or hydroxyproline.
Male offspring of Wistar rats (number not stated) exposed to 0, 86or 170 mg carbon monoxide/m3 (0, 75 or 150 ppm) from day 0 to day20 of gestation were evaluated for the effects of carbon monoxideexposure on splenic macrophage function (macrophage phagocytosisand killing ability, macrophage respiratory bursts) on day 15, 21 or 60postpartum. Literature values and a pilot study showed 15% carboxy-haemoglobin saturation in pregnant rats exposed to 170 mg carbonmonoxide/m3 (150 ppm). No differences in maternal mortality orweight gain were observed in exposed rats. Litters were reduced to sixmale pups where possible within 24 h of birth and fostered to untreatedmothers. Splenic macrophage phagocytosis and oxygen release weresignificantly decreased in 15- and 21-day-old males exposed to 170 mgcarbon monoxide/m3 (150 ppm) during pregnancy, and splenicmacrophage killing was significantly reduced in 15-day-old malesprenatally exposed to 86 or 170 mg carbon monoxide/m3 (75 or 150ppm). No carbon monoxide-induced alterations in splenic macrophagefunction were observed in 60-day-old rats (Giustino et al., 1993).
Female Wistar rats were exposed to 0, 86 or 170 mg carbonmonoxide/m3 (0, 75 or 150 ppm) from day 0 to day 20 of gestation, andthe frequency of splenic immunocompetent cells was evaluated inyoung (15- to 21-day-old) or aged (18 months) male offspring. Asignificant decrease in leukocyte common antigen (LCA +) cells in 21-day-old animals prenatally exposed to 170 mg carbon monoxide/m3
(150 ppm) was found, but other cell populations (macrophages, majorhistocompatibility [MHC] II cells, T and B lymphocytes) were notsignificantly lower than control values, although there was a trendtowards a reduction. No changes were observed at the lower dose of 86mg/m3 (75 ppm) at 15 days or 18 months of age (Giustino et al., 1994).
To summarize, there is good evidence for the development ofsevere cardiomegaly following early-life carbon monoxide exposure at
EHC 213: Carbon Monoxide
230
doses between 69 and 230 mg/m3 (60 and 200 ppm). These effects aretransitory if exposure is prenatal, and it is not clear whether they altercardiac function or produce latent cardiovascular effects that maybecome overt later in life. There are many published reports suggestingincreases in heart weight associated with neonatal carbon monoxideexposures up to 570 mg/m3 (500 ppm), maintained over the first30–60 days of life (see section 7.2.3). Persisting elevation in heartweight results from combined prenatal carbon monoxide exposure at230 mg/m3 (200 ppm) and neonatal exposure at 570 mg/m3 (500 ppm).The LOEL for this effect has not been determined.
7.6.4.3 Neurobehavioural consequences of perinatal carbon monoxideexposure
Fechter & Annau (1980a,b) reported delays in the development ofnegative geotaxis and homing in rats exposed prenatally to 170 mgcarbon monoxide/m3 (150 ppm) (maternal carboxyhaemoglobin levelswere not reported in this paper, but levels previously reported in thislaboratory under that exposure regimen are 15–17%; Fechter & Annau,1977). These data were replicated by Singh (1986) using CD-1 miceexposed to 0, 74 or 140 mg carbon monoxide/m3 (0, 65 or 125 ppm)from gestation days 7 to 18. He found that exposure at 140 mg/m3
(125 ppm) significantly impaired the righting reflex on postnatal day 1and negative geotaxis on postnatal day 10. He also reported impairedaerial righting among subjects exposed prenatally to 74 or 140 mgcarbon monoxide/m3 (65 or 125 ppm). Morris et al. (1985a) studied theconsequences of moderate carbon monoxide exposure given very latein gestation. They exposed pigs to 230 or 290 mg carbon monoxide/m3
(200 or 250 ppm; carboxyhaemoglobin levels of 20% and 22%) fromgestation day 109 until birth. They found impairment of negativegeotaxis behaviour and open field activity 24 h after birth in pigsexposed to 290 mg/m3 (250 ppm). Activity in the open field wassignificantly reduced in subjects exposed to both 230 and 290 mg/m3
(200 and 250 ppm) 48 h after birth. The significance of thesebehavioural dysfunctions is that they point to delays in behaviouraldevelopment that may themselves contribute to impairments in the wayin which the individual interacts with its environment.
There are also reports of impaired cognitive function produced byprenatal carbon monoxide exposure that may be related to permanentneurological damage. Mactutus & Fechter (1984) showed poorer
Effects on Laboratory Animals
231
acquisition and retention of a learned active avoidance task in rats30–31 days of age that had received continuous prenatal exposures of170 mg/m3 (150 ppm). This study is noteworthy because very carefulefforts were made to distinguish cognitive deficits such as motivationaland emotional factors and performance deficits such as motor factors.These findings were replicated and extended by Mactutus & Fechter(1985), who studied the effects of prenatal exposures to 170 mg carbonmonoxide/m3 (150 ppm; 16% maternal carboxyhaemoglobin) onlearning and retention in weanling, young adult and aging (1-year-old)rats. They found that both the weanling and young adult rats showedsignificant retention deficits, whereas impairments were found in bothlearning and retention in aging rats relative to control subjects. Theyinterpreted these results to mean that there are permanent neurologicalsequelae of prenatal carbon monoxide exposure. They raised theimportant issue that sensitivity of tests for consequences of early toxicexposure may reflect the developmental status of the test subject andcomplexity of the task. In this case, a learning impairment not observedin the early adult period was detected by working with aged subjects.No systematic attempts have been made to replicate these effects usinglower levels of carbon monoxide.
Di Giovanni et al. (1993) exposed Wistar rats to 0, 86 or 170 mgcarbon monoxide/m3 (0, 75 or 150 ppm) 24 h per day continuouslythroughout gestation. The high dose (170 mg/m3 [150 ppm]) produced14% carboxyhaemoglobin saturation. The exposure regimen did notaffect maternal body weight gain, duration of pregnancy, live litter size,pup mortality or pup weight and pup body weight gain. Litters wereculled to six males within 24 h of birth and fostered to untreated dams.One pup from each litter was tested in a single behavioural test.Ultrasonic vocalization recorded on postnatal day 5 showed a decreasein the minimal frequency (kHz) of calling in pups exposed prenatallyto 170 mg carbon monoxide/m3 (150 ppm). On day 10, a challengedose of diazepam (0.25 mg/kg body weight) reduced the calling rate byabout 90% in the control and low-dose group; in the high-dose group,the reduction was less than 50%. Locomotor activity with and withoutan amphetamine challenge was unaffected by maternal carbonmonoxide exposure when rats were tested in an open field at 14 and 21days of age. At 90 days of age, rats exposed prenatally to 170 mg/m3
(150 ppm) showed impaired acquisition of the correct response in atwo-way active avoidance task. However, prenatal exposure to carbonmonoxide (170 mg/m3 [150 ppm]) significantly impaired theacquisition of a two-way active avoidance task in 3-month-old male
EHC 213: Carbon Monoxide
232
rats as well as the acquisition and reacquisition of this schedule in 18-month-old rats subjected to six daily 20-trial sessions (De Salvia et al.,1995). These findings show that gestational exposure to carbonmonoxide induces permanent learning and memory impairment in ratoffspring.
7.6.4.4 Neurochemical effects of prenatal and perinatal carbon monoxideexposure
A significant number of studies have appeared concerning theeffects of acute and chronic prenatal and perinatal carbon monoxideexposure upon a variety of neurochemical parameters. These experi-ments are important because the transmission of information betweennerve cells is based upon neurochemical processes. Labelled neuro-transmitters can sometimes act as markers for the development ofspecific neurons in the brain, thereby serving as a sensitive alternativeto histopathological investigation, particularly when the toxic agentselectively affects neurons based upon a biochemical target. Theabsence of a specific cell group may have important consequences forsubsequent brain development, because the absence of growth targetsfor synapse formation can have additional consequences on braindevelopment. Altered neurochemical development has been observedat carbon monoxide exposure levels lower than those necessary toproduce signs of maternal toxicity or gross teratogenicity in neonates.Chronic prenatal and perinatal exposures to 170–340 mg carbonmonoxide/m3 (150–300 ppm) have been shown to yield persistingalterations in norepinephrine, serotonin and (-aminobutyric acid levelsand in (-aminobutyric acid uptake in rats. There are also a substantialnumber of acute exposure studies that have demonstrated neuro-chemical effects of carbon monoxide. However, these generally havebeen conducted at life-threatening levels and are not particularlyrelevant to setting ambient air standards for carbon monoxide.
Storm & Fechter (1985a) reported that chronic prenatal carbonmonoxide exposures of 170 mg/m3 (150 ppm; approximately 16–18%carboxyhaemoglobin based upon other research in this laboratory)decreased cerebellar wet weight but increased norepinephrine levels inthis structure when expressed in terms of either concentration(nanograms per milligram wet weight) or total cerebellar content abovecontrol values between the ages of 14 and 42 days. This period
Effects on Laboratory Animals
233
represented the duration of the experiment. Although this persistingelevation in norepinephrine cannot be considered permanent, it is thecase that rats do obtain normal adult values of monoamineneurotransmitters at about the age of 40–45 days. There was no effectof carbon monoxide treatment on norepinephrine levels in the cerebralcortex. Because noradrenergic neurons have their cell bodies outsideof the cerebellum and project axons that terminate on cell bodies in thisstructure, Storm & Fechter’s (1985a) data may reflect an effect ofincreased noradrenergic innervation secondary to toxic injury to targetneurons in the cerebellum. Consistent with this hypothesis, Storm et al.(1986) reported deficits in cerebellar weight and, more importantly,deficits in markers of (-aminobutyric acid-ergic activity in the cere-bellum following prenatal and perinatal carbon monoxide exposures.(-Aminobutyric acid is thought to be an inhibitory neurotransmitterpresent in several neuronal cell types that are intrinsic to the cere-bellum. Subjects in this experiment received 0, 86, 170 or 340 mgcarbon monoxide/m3 (0, 75, 150 or 300 ppm; corresponding maternalcarboxyhaemoglobin levels were 2.5, 11.5, 18.5 and 26.8%) from thebeginning of gestation until postnatal day 10. Neurochemical measure-ments were made either on postnatal day 10 or on postnatal day 21.They showed reduced total (-aminobutyric acid levels in thecerebellum following either 170 or 340 mg carbon monoxide/m3 (150or 300 ppm) exposure at both measurement times. They also reporteda significant reduction in total (-aminobutyric acid uptake, but notglutamate uptake, in synaptosomes prepared from cerebella of 21-day-old neonates. Glutamate is an excitatory neurotransmitter found withinthe cerebellum. Histological markers of cerebellar toxicity were alsoobtained that were compatible with the neurochemical data, and theseare described below in section 7.6.4.5.
In a related paper, Storm & Fechter (1985b) evaluated nor-epinephrine and serotonin levels at postnatal days 21 and 42 in fourdifferent brain regions (pons/medulla, neocortex, hippocampus andcerebellum) of rats following chronic prenatal exposures of rats to 86,170 or 340 mg carbon monoxide/m3 (75, 150 or 300 ppm). Theyreported that norepinephrine and serotonin concentrations decreasedlinearly with dose in the pons/medulla at 21, but not at 42, days of age(i.e., evidence of a transient effect); the LOEL was 170 mg/m3
(150 ppm). Norepinephrine increased linearly with carbon monoxidedose in the neocortex at 42, but not at 21, days of age. The authors alsoshowed that cerebellar weight was significantly reduced for the rats
EHC 213: Carbon Monoxide
234
exposed at 170 and 340 mg/m3 (150 and 300 ppm) when measured onpostnatal 21 and for the rats exposed at 340 mg/m3 (300 ppm) at 42days of age.
7.6.4.5 Morphological consequences of acute prenatal carbon monoxideexposure
Profound acute carbon monoxide exposures do result in obviousneurological pathology that can be predicted to be inconsistent with lifeor with normal neurological development. These data are not asrelevant to setting standards for ambient air quality as they are indemonstrating the danger of accidental high-level carbon monoxideexposures and in providing possible insight into the susceptibility ofthe developing brain to toxic exposure (Daughtrey & Norton, 1982;Okeda et al., 1986; Storm et al., 1986). The one possible exception isa study conducted in fetal pigs exposed via the mother to 340 mgcarbon monoxide/m3 (300 ppm) for 96 h (Dominick & Carson, 1983).The authors reported quite marked sensitivity to the carbon monoxideas reflected in fetotoxicity, but they also identified multifocalhaemorrhages and vacuolation of the neuropile throughout the corticalwhite matter and brain-stem. They also observed cerebellar oedemawith swollen oligodendrocytes and astrocytes, two non-neuronal celltypes that have important roles in supporting neural function.
Full characterization of the histopathological effects of very low,subchronic carbon monoxide exposure on development is impeded bythe absence of additional research in the published literature.
7.6.4.6 Neuromuscular effects of prenatal carbon monoxide exposure
Prenatal exposure of pregnant rats to 170 mg carbon monoxide/m3
(150 ppm) but not 86 mg/m3 (75 ppm) (carboxyhaemoglobin levels notmeasured) throughout gestation produced a depression of potassiumand chloride conductances in gastrocnemius muscle fibres during thefirst 60 days of postnatal life, reaching control values at 80 days. Theseeffects were responsible for a decrease in excitability of skeletal musclefibres (De Luca et al., 1996).
A voltage clamp analysis of ionic currents recorded fromperipheral (sciatic) nerve fibres isolated from prenatally exposed maleWistar rats (five litters per group exposed to 0, 86 or 170 mg carbonmonoxide/m3 [0, 75 or 150 ppm] on days 0–20 of gestation) was
Effects on Laboratory Animals
235
performed in animals aged 40 and 270 days. In 40-day-old carbonmonoxide-exposed rats from both dose groups, changes in voltage andtime-dependent properties of sodium channels were observed, resultingin slower inactivation of activity. These changes in membraneexcitability were still present to a lesser degree at 270 days (Carratú etal., 1993). Morphometric examination of the sciatic nerve in theexperiments reported by Carratú et al. (1995) showed that the rate ofmyelin formation in rats exposed to 170 mg carbon monoxide/m3 (150ppm) (14% carboxyhaemoglobin) was depressed between 28 and 40days of age, but it was not studied at later stages.
7.6.4.7 Summary
The data reviewed in this section provide strong evidence thatprenatal carbon monoxide exposures of 170–230 mg/m3 (150–200 ppm; ~15–25% maternal carboxyhaemoglobin levels) producereductions in birth weight, cardiomegaly, delays in behavioural devel-opment and disruption in cognitive function in laboratory animals ofseveral species. Isolated experiments suggest that some of these effectsmay be present at carbon monoxide concentrations as low as 69–74 mg/m3 (60–65 ppm; ~6–11% carboxyhaemoglobin) maintainedthroughout gestation.
7.7 Other systemic effects
Several studies suggest that enzyme metabolism of xenobioticcompounds may be affected by carbon monoxide exposure (Mont-gomery & Rubin, 1971; Kustov et al., 1972; Pankow & Ponsold, 1972,1974; Martynjuk & Dacenko, 1973; Swiecicki, 1973; Pankow et al.,1974; Roth & Rubin, 1976a,b). Most of the authors have concluded,however, that effects on metabolism at low carboxyhaemoglobin levels(#15%) are attributable entirely to tissue hypoxia produced byincreased levels of carboxyhaemoglobin, because they are no greaterthan the effects produced by comparable levels of hypoxic hypoxia. Athigher levels of exposure, at which carboxyhaemoglobin concen-trations exceed 15–20%, there may be direct inhibitory effects ofcarbon monoxide on the activity of mixed-function oxidases, but morebasic research is needed. The decreases in xenobiotic metabolismshown with carbon monoxide exposure might be important toindividuals receiving treatment with drugs (see section 8.1.6).
EHC 213: Carbon Monoxide
236
The effects of carbon monoxide on tissue metabolism noted abovemay partially explain the body weight changes associated with carbonmonoxide. Short-term exposure to 290–1100 mg/m3 (250–1000 ppm)for 24 h was reported previously to cause weight loss in laboratory rats(Koob et al., 1974), but no significant body weight effects werereported in long-term exposure studies in laboratory animals at carbonmonoxide concentrations ranging from 57 mg/m3 (50 ppm) for3 months to 3400 mg/m3 (3000 ppm) for 300 days (Campbell, 1934;Musselman et al., 1959; Stupfel & Bouley, 1970; Theodore et al.,1971). It is quite probable that the initial hypoxic stress resulted indecreased weight gain followed by compensation for the hypoxia withcontinued exposure by adaptive changes in the blood and circulatorysystem. It is known, however, that carbon monoxide-induced hypoxiaduring gestation will cause a reduction in the birth weight of laboratoryanimals. Although a similar effect has been difficult to demonstrate inhumans exposed to carbon monoxide alone, there is a strongcorrelation between maternal cigarette smoking and reduced birthweight (see section 8.2.7.2).
In experiments with adult rats exposed to 570 mg carbon mon-oxide/m3 (500 ppm) whose food and water consumption and bodyweight were measured on a daily basis, it was noted that after an initialperiod of a few days in which appetite was reduced, food and waterconsumption renormalized and body weight gain progressed (Penney,1984). During weeks 2–5 of the study, body weight gain of the carbonmonoxide-exposed rats was significantly greater than that of thematched air controls. It was suggested by the authors that carbonmonoxide may have suppressed basal metabolic rate without curtailingfood intake, thus allowing added body mass.
Inhalation of high levels of carbon monoxide, leading to carboxy-haemoglobin concentrations greater than 10–15%, has been reportedto cause a number of systemic effects in laboratory animals as well aseffects in humans suffering from acute carbon monoxide poisoning (seesection 8.3). Tissues of highly active oxygen metabolism, such as heart,brain, liver, kidney and muscle, may be particularly sensitive to carbonmonoxide poisoning. Other systemic effects of carbon monoxidepoisoning are not as well known and are, therefore, less certain. Thereare reports in the literature of effects on liver (Katsumata et al., 1980),kidney (Kuska et al., 1980) and bone (Zebro et al., 1983). Results from
Effects on Laboratory Animals
237
one additional study in adult guinea-pigs suggest that immune capacityin the lung and spleen was affected by intermittent exposure to highlevels of carbon monoxide for 3–4 weeks (Snella & Rylander, 1979).It is generally agreed that these systemic effects are caused by thesevere tissue damage occurring during acute carbon monoxidepoisoning due to (1) ischaemia resulting from the formation ofcarboxyhaemoglobin, (2) inhibition of oxygen release from oxyhaemo-globin, (3) inhibition of cellular cytochrome function (e.g., cytochromeoxidases) and (4) metabolic acidosis.
Gong & Wang (1995) investigated the effects of carbon monoxideat low concentration on lipid peroxidation and glutathione peroxidasein the rat. It was shown that lipid peroxide increased significantly inplasma when the rats were exposed to 500 mg carbon monoxide/m3
(440 ppm) for 20 days, and also in heart when exposed for 30 days. Nochanges in lipid peroxide were caused by 25 and 50 mg carbonmonoxide/m3 (22 and 44 ppm), but 25 mg carbon monoxide/m3 (22ppm) resulted in changes in glutathione peroxidase. These findingsindicate that carbon monoxide can induce free radicals and thus formlipid peroxide. Glutathione peroxidase may serve as an early sensitiveindicator for the effects of carbon monoxide.
Shinomiya and collaborators (1994) investigated the relationshipbetween degree of carboxyhaemoglobin saturation and the amount ofcarbon monoxide in various organs. Rats inhaled air containing 0.195%carbon monoxide (2200 mg/m3 [1950 ppm]) for varying periods oftime to give five experimental groups. After sacrifice, blood wascollected for measurement of carboxyhaemoglobin, giving carboxy-haemoglobin values (%) of 12.2 ± 1.16, 31.6 ± 2.38, 42.4 ± 2.11, 52.3± 1.81 and 73.6 ± 3.01. The carbon monoxide content in the rat organsdecreased in the following order: blood > spleen > liver > lung >kidney/myocardium > encephalon/pectoral muscles. There was a goodpositive correlation between the degree of carboxyhaemoglobinsaturation and carbon monoxide content of the organ examined.
7.8 Interactions
7.8.1 Combinations with psychoactive drugs
7.8.1.1 Alcohol
There have been a number of animal studies of combinations ofalcohol and carbon monoxide. Although there is some evidence that
EHC 213: Carbon Monoxide
238
alcohol metabolism can be reduced in rat liver in situ by a carboxy-haemoglobin level of 20% (Topping et al., 1981), an in vivo study inmice found no effects of carbon monoxide exposure on alcoholmetabolism (Kim & Carlson, 1983). On the other hand, Pankow et al.(1974) provided some evidence that high doses of carbon monoxidedecreased blood alcohol levels in rats 30 min after a large dose ofalcohol. They also reported that this dose of alcohol significantlylowered carboxyhaemoglobin levels associated with a large sub-cutaneous dose of carbon monoxide. These high-dose combinationswere also associated with additive effects on enzyme markers ofhepatotoxicity, but no interactions were observed when lower doses ofcarbon monoxide were given.
In contrast to the inconsistent metabolic effects seen withcombinations of carbon monoxide and alcohol, results of twobehavioural studies in animals have shown substantial interactioneffects. Mitchell et al. (1978) studied the interaction of inhaled carbonmonoxide with two doses of alcohol in rats using two behaviouralmeasures. Sensorimotor incapacitation was assessed by failure toremain on a rotating rod. An additional measure of motor effects wasthe inability to withdraw the leg from a source of electric shock. Thelength of exposure to approximately 2300 mg carbon monoxide/m3
(2000 ppm) before the animals failed in these performances wasdecreased in a dose-dependent manner by alcohol. Carboxyhaemo-globin determinations made at the time of behavioural incapacitationwere inversely related to alcohol dose.
Knisely et al. (1989) reported a large interaction of carbonmonoxide exposure and alcohol administration on operant behaviourin animals. Mice, trained to lever press for water reinforcement, weretested with 1.1 g alcohol/kg body weight and various doses of carbonmonoxide, alone and in combination. An unusual feature of this studywas that both alcohol and carbon monoxide were administered byintraperitoneal injection. A dose of alcohol that had little effect on ratesof lever pressing when given alone resulted in large rate-decreasingeffects when given in combination with doses of carbon monoxide thatalso had no effects when given alone. Typically, behavioural effects ofcarbon monoxide alone were not seen under these test conditions untilcarboxyhaemoglobin saturations greater than 40–50% were obtained(Knisely et al., 1987). Thus, alcohol about doubled the acute toxicityof carbon monoxide in this study.
Effects on Laboratory Animals
239
7.8.1.2 Barbiturates
There has been some interest in the interaction of carbonmonoxide with barbiturates, because prolongation of barbiturate effectscan reflect effects of toxicants on drug metabolism. In an earlyevaluation of the functional significance of the binding of carbonmonoxide to cytochrome P-450, Montgomery & Rubin (1971)examined the effects of carbon monoxide exposure on the duration ofaction of hexobarbital and the skeletal muscle relaxant zoxazolaminein rats. Both drugs are largely deactivated by the hepatic mixed-function oxidase system. Although carbon monoxide was found todose-dependently enhance both hexobarbital sleeping time andzoxazolamine paralysis, subsequent research indicated that this wasprobably not due to a specific inhibition of the mixed-function oxidasesystem by carbon monoxide, but rather was a non-specific effect ofhypoxia, because even greater effects could be produced at a similarlevel of arterial oxygen produced by hypoxic hypoxia (Montgomery &Rubin, 1973; Roth & Rubin, 1976c). In support of the lack of effectsof carbon monoxide on drug metabolism, Kim & Carlson (1983) foundno effect of carbon monoxide exposure on the plasma half-life foreither hexobarbital or zoxazolamine in mice.
There have been two studies of the interaction of carbonmonoxide and pentobarbital using operant behaviour in laboratoryanimals. McMillan & Miller (1974) found that exposure of pigeons to440 mg carbon monoxide/m3 (380 ppm), a concentration that had littleeffect on behaviour when given alone, reduced the response rate,thereby increasing the effects of an intermediate dose of pentobarbital.On the other hand, the disruptive effects of all doses of pentobarbitalon the temporal patterning of fixed-interval responding were enhancedmarkedly by 1200 mg carbon monoxide/m3 (1030 ppm). Thisconcentration of carbon monoxide by itself did not alter responsepatterning, but did lower overall rates of responding. In the study,Knisely et al. (1989) found generally additive effects of intraperitonealcarbon monoxide administration with the effects of pentobarbital inmice responding under a fixed-ratio schedule. In that study, theinteraction of carbon monoxide with pentobarbital was not as evidentas the interaction with alcohol, suggesting that general conclusionsabout carbon monoxide interactions with central nervous systemdepressant drugs may not be possible.
EHC 213: Carbon Monoxide
240
7.8.1.3 Other psychoactive drugs
Even more limited data are available on interactions of carbonmonoxide exposure with other psychoactive drugs. In the study byKnisely et al. (1989) of interactions of intraperitoneal carbon monoxideadministration with psychoactive drugs on operant behaviour of mice,d-amphetamine, chlorpromazine, nicotine, diazepam and morphinewere studied in addition to alcohol and pentobarbital. As with alcohol,a suggestion of greater than additive effects was obtained fromcombinations of carbon monoxide with both d-amphetamine andchlorpromazine; however, in these cases, the differences from addi-tivity did not reach statistical significance. Effects of carbon monoxidein combination with nicotine, caffeine and morphine were additive.McMillan & Miller (1974) also found evidence for an interaction ofcarbon monoxide and d-amphetamine on operant behaviour in pigeons.In this study, carbon monoxide concentrations as low as 560 and 1100mg/m3 (490 and 930 ppm) were able to modify the behavioural effectsof d-amphetamine.
7.8.2 Combinations with other air pollutants and environmental factors
Many of the data concerning the combined effects of carbonmonoxide and other pollutants found in ambient air are based onanimal experiments; they are briefly reviewed here. The few humanstudies available are reviewed in chapter 8.
7.8.2.1 Other air pollutants
Groll-Knapp et al. (1988) reported that combined exposure of ratsto carbon monoxide plus nitric oxide for 3 h caused a significant (P <0.01) increase in mean methaemoglobin levels when compared withmethaemoglobin levels in rats exposed to nitric oxide alone. Nosignificant changes were observed in blood carboxyhaemoglobin levelscompared with exposure to carbon monoxide alone or to carbonmonoxide plus nitric oxide. Combined exposure also caused significantbehavioural changes. Hugod (1981) reported that combined exposureto carbon monoxide plus nitric oxide plus hydrogen cyanide for2 weeks produced no morphological changes in the lungs, pulmonaryarteries, coronary arteries or aortas of rabbits.
In a 1-year inhalation toxicity study, no adverse toxic effects wereseen in groups of rats exposed to relatively low levels of carbon
Effects on Laboratory Animals
241
monoxide plus nitrogen dioxide or carbon monoxide plus sulfurdioxide compared with rats exposed to one of these pollutants alone(Busey, 1972). Murray et al. (1978) observed no teratogenic effects inoffspring of mice or rabbits exposed to carbon monoxide plus sulfurdioxide for 7 h per day during gestation days 6–15 or 6–18, respec-tively.
Male Sprague-Dawley rats were given 3 or 6 mmol dibromo-methane/kg body weight or breathed 260 mg carbon monoxide/m3 (225ppm) for 120 min (Fozo & Penney, 1993). Peak carboxyhaemoglobinlevels were 16% after 8 h with 3 mmol dibromomethane/kg bodyweight, 18% after 12 h with 6 mmol dibromomethane/kg body weightand 17% in carbon monoxide-exposed rats. Systolic blood pressuredropped 1.6 kPa (12 mmHg) in rats receiving carbon monoxide, butthere was no significant change in rats receiving dibromomethane.Body temperature dropped approximately 1 °C in the rats receivingcarbon monoxide or dibromomethane. There was no significant changein heart rate or in blood glucose or lactate in any of the rats.
7.8.2.2 Combustion products
A common condition in an atmosphere produced by a fire is thepresence of a rapidly changing combination of potentially toxic gases(primarily carbon monoxide, carbon dioxide and hydrogen cyanide),reduced oxygen levels (hypoxic hypoxia) and high temperatures.Combined exposure to these gases occurs during smoke inhalationunder conditions of hypoxic hypoxia. In addition, both carbonmonoxide and carbon dioxide are common products of carbon-containing materials; consequently, accidental exposure to high levelsof carbon monoxide will rarely occur without simultaneous exposureto carbon dioxide. Exposure to carbon monoxide and hydrogen cyanideis of concern because both carbon monoxide and hydrogen cyanideproduce effects by influencing tissue oxygen delivery. Increasedcarboxyhaemoglobin reduces oxygen carrying capacity and mayinterfere with tissue oxygen release, whereas hydrogen cyanide inhibitstissue respiration. Studies were conducted to determine thetoxicological interactions of the combustion products with and withoutreduced oxygen.
Several studies have investigated the effects resulting fromcombined exposure to carbon monoxide and combustion products from
EHC 213: Carbon Monoxide
242
fires. Rodkey & Collison (1979) reported a significant (P < 0.02)decrease in mean survival time in mice jointly exposed until death tocarbon monoxide plus carbon dioxide compared with mice exposed tocarbon monoxide alone. In contrast, Crane (1985) observed nodifferences in the times to incapacitation or times to death in ratsexposed until death to various concentrations of carbon monoxide pluscarbon dioxide. In a recent study, Levin et al. (1987a) demonstrated asynergistic effect between carbon monoxide and carbon dioxide in ratsexposed to various concentrations of carbon monoxide plus carbondioxide. Simultaneous exposure to non-lethal levels of carbon dioxide(1.7–17.3%) and to sublethal levels of carbon monoxide (2900–4600mg/m3 [2500–4000 ppm]) caused deaths in rats both during andfollowing (up to 24 h) a 30-min exposure. Although the equilibriumlevels of carboxyhaemoglobin were not changed by the presence ofcarbon dioxide, the rate of carboxyhaemoglobin formation was1.5 times greater in rats exposed to carbon monoxide plus carbondioxide than in rats exposed to carbon monoxide alone. The synergisticeffects of carbon dioxide on carbon monoxide toxicity were alsoobserved at other exposure times (Levin et al., 1988a).
Combined exposure to carbon monoxide plus hydrogen cyanidehad an additive effect in rats, as evidenced by increases in mortalityrate (Levin et al., 1987b, 1988a). Results from this series ofexperiments showed that the exposed animals died at lower carbonmonoxide concentrations as the levels of hydrogen cyanide increased.In the presence of hydrogen cyanide, carboxyhaemoglobin atequilibrium was less than that measured in the absence of hydrogencyanide; however, the initial rate of carboxyhaemoglobin formationwas the same. This apparent depressive effect of hydrogen cyanide oncarboxyhaemoglobin formation may explain the reason for the lowcarboxyhaemoglobin levels (<50%) seen in some people who died ina fire (Levin et al., 1987b). However, Hugod (1981) found nomorphological changes in the lung, pulmonary and coronary arteries oraorta of rabbits exposed to carbon monoxide plus nitric oxide plushydrogen cyanide (see section 7.8.2.1).
Combined exposures to carbon monoxide plus potassium cyanidehave produced conflicting results. Norris et al. (1986) reported that thedose that was lethal to 50% of test subjects (LD50) was significantlylower in mice pretreated with carbon monoxide prior to intraperitonealinjection of potassium cyanide. Sublethal doses of potassium cyanide
Effects on Laboratory Animals
243
produced a synergistic effect on mortality. On the other hand, Winston& Roberts (1975) observed no alterations in lethality in mice pretreatedwith carbon monoxide and then treated with intraperitoneal injectionsof potassium cyanide.
The effects of carbon monoxide and potassium cyanide on theelectrocardiogram were examined in female rats (1) treated with 1700or 2700 mg carbon monoxide/m3 (1500 or 2400 ppm) for 90 min, (2)given 4 mg potassium cyanide/kg body weight alone or (3) given1700 mg carbon monoxide/m3 (1500 ppm) plus 4 mg potassiumcyanide/kg body weight (Katzman & Penney, 1993). Carbon monoxidesignificantly increased PR interval by 4.5–17.0 ms, with or withoutcombination with potassium cyanide. Administration of potassiumcyanide alone produced minimal change in the PR interval. QT intervalwas increased up to 20 ms by exposure to carbon monoxide, with orwithout combination with potassium cyanide. Potassium cyanide aloneproduced no change in the QT interval. T-wave duration was increasedup to 22.5 ms by exposure to 1700 mg carbon monoxide/m3 (1500ppm), with or without combination with potassium cyanide. Potassiumcyanide alone produced minimal changes in T-wave duration. Therewere no changes in duration of the QRS complex or of the R wave. Nocorrelation was observed between body temperature and QT interval.The results indicate that carbon monoxide at the concentrations usedhas major effects on the electrocardiogram in slowing AV conductionand ventricular repolarization (Katzman & Penney, 1993).
Levine-prepared female rats were exposed to 2700 mg carbonmonoxide/m3 (2400 ppm), 1700 mg carbon monoxide/m3 (1500 ppm),4 mg sodium cyanide/kg body weight or both 1700 mg carbonmonoxide/m3 (1500 ppm) and 4 mg sodium cyanide/kg body weight(Dodds et al., 1992). The carbon monoxide exposures lasted 90 min,followed by recovery in room air. Rats exposed to the highest carbonmonoxide concentration experienced significant bradycardia. Allgroups exhibited an initial hypotension, which was either maintainedor exaggerated during exposure in all but the rats receiving cyanide andwhich returned to pre-exposure values by 90 min. All groupsexperienced a significant hypothermia during the exposure period, withthose in the 1700 mg carbon monoxide/m3 (1500 ppm) group or thecyanide group returning to initial values over the recovery period.During exposure, all groups experienced an initial surge in glucose
EHC 213: Carbon Monoxide
244
concentration, which was maintained in all but rats exposed to 2700 mgcarbon monoxide/m3 (2400 ppm). The greatest hyperglycaemicresponse resulted from the combination of carbon monoxide andcyanide, whereas 2700 mg carbon monoxide/m3 (2400 ppm) producedthe smallest. Cyanide alone produced no significant rise in lactateconcentration. However, lactate concentration in all other groups wassignificantly elevated during the exposure period, returning to initialvalues by 4 h of recovery. Lactate concentrations and neurologicaldeficit in rats exposed to 1700 mg carbon monoxide/m3 (1500 ppm),when added to those rats treated with cyanide, closely approximatedthe lactate and neurological deficit of the combination treatment.Neurological deficit was greatest in rats exposed to 2700 mg carbonmonoxide/m3 (2400 ppm). While in most cases the responses of the ratsto carbon monoxide and cyanide differed whether the substances wereadministered alone or in combination, a synergistic relationship is notsuggested. An additive or less than additive relationship is more likely.
A number of studies examined the effects of carbon monoxideadministered under conditions of hypoxic hypoxia. Rodkey & Collison(1979) observed a lower mean survival time and a higher level ofcarboxyhaemoglobin in mice exposed to carbon monoxide in thepresence of low oxygen (14%) than in those exposed to an ambientoxygen (21%) level. Winston & Roberts (1975) showed that pre-exposure of mice to carbon monoxide, followed by exposure to 7%oxygen 24 h later, had no effect on lethality compared with controlsexposed to 7% oxygen only. Thus, pre-exposure to carbon monoxidehad no protective effect against hypoxic hypoxia. However, pre-exposure to 10% oxygen caused a significant decrease in lethality inmice exposed 24 h later to carbon monoxide. Alterations in colethalitywere not associated with alterations in carboxyhaemoglobin levels. Ina behavioural study in mice, Cagliostro & Islas (1982) showed thatreaction times gradually increased with a decrease in oxygen levels to10%. At <10% oxygen, reaction time increased dramatically. Atreduced oxygen levels and in the presence of carbon monoxide, thedecreases in performance were even greater than those observed inmice exposed to reduced oxygen levels alone.
Three and four gas combinations of combustion products werealso examined (Levin et al., 1988b). The combinations tested includedcarbon monoxide, carbon dioxide, hydrogen cyanide and reduced
Effects on Laboratory Animals
245
oxygen. Carbon dioxide showed synergistic effects when tested withany of the other gases. The other gases were additive with carbonmonoxide.
7.8.2.3 Environmental factors
Yang et al. (1988) studied the combined effects of high tempera-ture and carbon monoxide exposure in laboratory mice and rats. Theywere exposed 1 h per day for 23 consecutive days to environmentalchamber temperatures of 25 and 35 °C at carbon monoxide concen-trations ranging from 660 to 700 mg/m3 (580 to 607 ppm). Carboxy-haemoglobin levels after 1 h of exposure ranged from 31.5% to 46.5%.The toxicity of carbon monoxide to mice, based on the concentrationthat is lethal to 50% of test subjects (LC50) and survival time, wasfound to be 3 times higher at 35 °C. High temperature was also foundto enhance the effects of carbon monoxide on the function of oxidativephosphorylation of liver mitochondria in rats. Body temperatureregulation and heat tolerance were also affected by carbon monoxideexposure. The authors speculated that these effects of combinedexposure to carbon monoxide and high temperature are due to theproduction of higher carboxyhaemoglobin, possibly as a result ofhyperventilation. [Contrary to this notion, the Task Group noted thatit is likely that the same equilibrium carboxyhaemoglobin saturationwould only be reached sooner owing to increased ventilation caused byheat.]
Fechter et al. (1987, 1988) and Fechter (1988), using laboratoryrats exposed to high levels of carbon monoxide (290–1400 mg/m3
[250–1200 ppm] for 3.5 h) with and without broad-band noise (105 dBfor 120 min), showed that carbon monoxide acts in a dose-dependentmanner to potentiate noise-induced auditory dysfunction. Althoughcarbon monoxide or noise alone did not have an effect, carbonmonoxide combined with noise produced a more severe loss of haircells at the basal end of the cochlea, especially at the high-frequencytones. A previous pilot study by Young et al. (1987) conducted at 1400mg carbon monoxide/m3 (1200 ppm) also showed that combinedexposure to noise and carbon monoxide produced high-frequency shiftsof greater magnitude than those produced by exposure to noise alone.The carbon monoxide levels used in these studies, however, are muchgreater than those encountered in the typical ambient environment, oreven in the typical occupational environment.
EHC 213: Carbon Monoxide
246
There have been few studies of the long-term effects of carbonmonoxide at altitude conducted in various laboratory animal species.James et al. (1979) studied cardiac function in six unsedated goats thatwere chronically instrumented and exposed to 180–230 mg carbonmonoxide/m3 (160–200 ppm; 20% carboxyhaemoglobin) for 6 weeksat 1500 m (5000 ft). Cardiac index and stroke volume were unchangedduring and after the exposure. Heart rate and contractility of the leftventricular myocardium were unchanged during exposure to carbonmonoxide, but both were depressed during the first week after removalof the carbon monoxide. The authors concluded that if there was adecrease in intrinsic myocardial function during the carbon monoxideexposure, it may have been masked by increased sympathetic activity.
McGrath (1988, 1989) studied cardiovascular, body and organweight changes in rats exposed continuously for 6 weeks to (1) ambientaltitude, (2) ambient altitude plus carbon monoxide, (3) simulated highaltitude and (4) carbon monoxide at high altitude. Altitudes rangedfrom 1000 m (3300 ft) to 5500 m (18 000 ft), and carbon monoxideconcentrations ranged from 0 to 570 mg/m3 (0 to 500 ppm).
Carbon monoxide had no effect on body weight at any altitude.There was a tendency for haematocrit to increase even at the lowestconcentration of carbon monoxide (10 mg/m3 [9 ppm]), but theincrease did not become significant until 110 mg/m3 (100 ppm). At3000 m (10 000 ft), there was a tendency for the total heart weight toincrease in rats inhaling 110 mg carbon monoxide/m3 (100 ppm).Although its effects on the heart at high altitude are complex, carbonmonoxide had little effect on the right ventricle in concentrations of570 mg/m3 (500 ppm) or less; it did not exacerbate any effects due toaltitude. There was a tendency for the left ventricle weight to increasewith exposure to 40 mg carbon monoxide/m3 (35 ppm) at high altitude,but the increase was not significant until 110 mg carbon monoxide/m3
(100 ppm). Heart rate, blood pressure, cardiac output and peripheralresistance were unaffected by exposure to 40 mg carbon monoxide/m3
(35 ppm) or 3000-m (10 000-ft) altitude, singly or in combination. Theauthor concluded that 6 weeks of exposure to 40 mg carbonmonoxide/m3 (35 ppm) does not produce measurable effects in thehealthy laboratory rat, nor does it exacerbate the effects produced byexposure to 3000-m (10 000-ft) altitude.
Effects on Laboratory Animals
247
The data reported by McGrath (1988, 1989) are generally inagreement with findings reported by other investigators. The carboxy-haemoglobin concentrations at the end of the 6 weeks of exposure tocarbon monoxide at 1000 m (3300 ft) were 0.6, 0.9, 2.4, 3.7 and 8.5%for ambient carbon monoxide levels of 0, 10, 40 and 110 mg/m3 (0, 9,35, 50 and 100 ppm), respectively. This relationship can be expressedas:
% COHb = 0.115 + 0.08x (7-1)
where x is the carbon monoxide exposure in parts per million. Thecorrelation coefficient (r) for this relationship was 0.99. The data fromother altitudes were not sufficient to calculate the rate of increase.Exposure of rats to 570 mg/m3 (500 ppm) and altitudes up to 5500 m(18 000 ft) resulted in carboxyhaemoglobin levels of 40–42%.
An interesting, but not unexpected, finding in this study was thathigh-altitude residence in the absence of exogenous carbon monoxideresulted in increased basal carboxyhaemoglobin concentrations. Thesevalues were 0.6, 1.3, 1.7 and 1.9% for altitudes from 1000 to 5500 m(3300 to 18 000 ft). These increases can be expressed as:
% COHb = 0.0000914 + 0.26687x (7-2)
where x is altitude, in feet. The correlation coefficient (r) for thisrelationship was 0.99. Whether or not similar increases in basalcarboxyhaemoglobin concentrations would be observed in humansadapted to altitude needs to be determined. The author concluded thatalthough there was a tendency for haematocrit ratios, spleen weightsand total heart weights to be elevated by combined carbon monoxide–altitude exposure, the results were not significant, and, in general, theeffects produced by 4600-m (15 000-ft) altitude were not intensified byexposure to 110 mg carbon monoxide/m3 (100 ppm).
McDonagh et al. (1986) studied cardiac hypertrophy and ventricu-lar capillarity in rats exposed to 5500 m (18 000 ft) and 57, 110 and570 mg carbon monoxide/m3 (50, 100 and 500 ppm). Coronarycapillarity increased after exposure to 5500 m (18 000 ft) for 6 weeks,but this response was blocked by carbon monoxide. Right ventricularthickness was increased by altitude but was not increased further bycarbon monoxide. At 570 mg carbon monoxide/m3 (500 ppm), the right
EHC 213: Carbon Monoxide
248
ventricular hypertrophy was attenuated, but the results are uncertainowing to the high mortality in this group. Left ventricular thickness wasalso increased at 5500 m (18 000 ft) and was increased further bycarbon monoxide. The authors concluded that because the ventricularthickness is increased while capillarity is reduced, it is possible that themyocardium can be underperfused in the altitude plus carbonmonoxide group.
Cooper et al. (1985) evaluated the effects of carbon monoxide ataltitude on electrocardiograms and cardiac weights in rats exposed for6 weeks to (1) ambient, (2) ambient + 570 mg carbon monoxide/m3
(500 ppm), (3) 4600 m (15 000 ft) and (4) 4600 m (15 000 ft) +570 mg carbon monoxide/m3 (500 ppm) conditions. Carboxyhaemo-globin values were 36.2% and 34.1% in the ambient + carbon monox-ide and altitude + carbon monoxide groups, respectively. Haematocritswere 54 ± 1%, 77 ± 1%, 68 ± 1% and 82 ± 1% in the ambient, ambient+ carbon monoxide, altitude and altitude + carbon monoxide groups,respectively. In the ambient + carbon monoxide, altitude and altitude+ carbon monoxide groups, respectively, the mean electrical axisshifted 33.2° left, 30° right and 116.4° right. Heart weight to bodyweight ratios were 2.6 × 10⁻³, 3.2 × 10⁻³, 3.2 × 10⁻³ and 4.0 × 10⁻³ inthe ambient, ambient + carbon monoxide, altitude and altitude + carbonmonoxide groups, respectively. Whereas carbon monoxide increasedleft ventricular weight and altitude increased right ventricular weight,altitude + carbon monoxide increased both. Changes in electro-cardiogram were consistent with changes in cardiac weight.
These results indicate that whereas carbon monoxide inhaled atambient altitude causes a left electrical axis deviation, carbonmonoxide inhaled at 4600 m (15 000 ft) exacerbates the well-knownphenomenon of right electrical axis deviation. Thus, the results fromchronic animal studies indicate that there is little effect of carbonmonoxide on the cardiovascular system of rats exposed to carbonmonoxide concentrations of 110 mg/m3 (100 ppm) or less and altitudesup to 3000 m (10 000 ft).
7.8.2.4 Summary
In animal studies, no interaction was observed followingcombined exposure of carbon monoxide and ambient air pollutantssuch as nitrogen dioxide or sulfur dioxide (Busey, 1972; Murray et al.,1978; Hugod, 1981). However, an additive effect was observed
Effects on Laboratory Animals
249
following combined exposure of high levels of carbon monoxide plusnitric oxide (Groll-Knapp et al., 1988), and a synergistic effect wasobserved after combined exposure to carbon monoxide and ozone(Murphy, 1964).
Toxicological interactions of combustion products, carbon mon-oxide, carbon dioxide and hydrogen cyanide, at levels typicallyproduced by indoor and outdoor fires, have shown a synergistic effectfollowing carbon monoxide plus carbon dioxide exposure (Rodkey &Collison, 1979; Levin et al., 1987a) and an additive effect with carbonmonoxide plus hydrogen cyanide (Levin et al., 1987b). Additive effectswere also observed when carbon monoxide, hydrogen cyanide and lowoxygen were combined; adding carbon dioxide to this combination wassynergistic (Levin et al., 1988b). Additional studies are needed,however, to evaluate the effects of carbon monoxide under conditionsof hypoxic hypoxia.
Finally, laboratory animal studies (Young et al., 1987; Fechteret al., 1988; Yang et al., 1988) suggest that the combination ofenvironmental factors such as heat stress and noise with exposure tocarbon monoxide may be important determinants of health effects. Ofthe effects described, the one potentially most relevant to typicalhuman exposures is a greater decrement in exercise performance seenwhen heat stress is combined with 57 mg carbon monoxide/m3
(50 ppm) (see chapter 8).
250
8. EFFECTS ON HUMANS
8.1 Healthy subjects
8.1.1 Introduction
Many direct experiments investigating the effects of carbonmonoxide on humans have been conducted during the last century.Although many reports describe inadvertent exposures to variouslevels of carbon monoxide, there are a considerable number of preciseand delineated studies utilizing human subjects. Most of these havebeen conducted by exposing young adult males to concentrations ofcarbon monoxide equivalent to those frequently or occasionallydetected during ambient monitoring. Research on human subjects,however, can be limited by methodological problems that make thedata difficult to interpret. These problems include (1) failure to mea-sure blood carboxyhaemoglobin levels; (2) failure to distinguishbetween the physiological effects from a carbon monoxide dose ofhigh concentration (i.e., bolus effect) and the slow, insidious incre-ment in carboxyhaemoglobin levels over time from lower inhaledcarbon monoxide concentrations; (3) failure to distinguish betweennormal blood flow and blood flow increased in response to hypoxia(compensatory responses); and (4) the use of small numbers of experi-mental subjects. Other factors involve failure to provide (1) controlmeasures (e.g., double-blind conditions) for experimenter bias andexperimenter effects; (2) control periods so that task-learning effectsdo not mask negative results; (3) homogeneity in the subject pool,particularly in groups labelled “smokers”; (4) control of possible bore-dom and fatigue effects; and (5) adequate statistical treatment of thedata.
8.1.2 Acute pulmonary effects of carbon monoxide
8.1.2.1 Effects on lung morphology
Results from human autopsies have indicated that severe pul-monary congestion and oedema were produced in the lungs of indi-viduals who died from acute smoke inhalation resulting from fires(Fein et al., 1980; Burns et al., 1986). These individuals, however,were exposed to relatively high concentrations of carbon monoxide aswell as other combustion components of smoke, such as carbon
Effects on Humans
251
dioxide, hydrogen cyanide, various aldehydes (e.g., acrolein), hydro-chloric acid, phosgene and ammonia. If carbon monoxide, containedin relatively high concentrations in the inhaled smoke, wasresponsible for the pathological sequelae described in fire victims,then to what extent can oedema be attributed to the primary injury ofcapillary endothelial or alveolar epithelial cells?
In a study by Parving (1972) on 16 human subjects,transcapillary permeability to 131I-labelled human serum albuminincreased from an average 5.6% per hour in controls to 7.5% per hourfollowing exposure to carbon monoxide. The subjects were exposedfor 3–5 h to 0.43% (4900 mg/m3 [4300 ppm]) carbon monoxide,resulting in approximately 23% carboxyhaemoglobin. There were noassociated changes in plasma volume, haematocrit or total proteinconcentration.
The only other relevant permeability studies were conducted withcigarette smoke. Mason et al. (1983) showed rapidly reversible altera-tions in pulmonary epithelial permeability induced by smoking usingradiolabelled diethylenetriaminepentaacetic acid (99mTc-DTPA) as amarker. This increased permeability reverted to normal fairly rapidlywhen subjects stopped smoking (Minty et al., 1981). Using a ratmodel, the permeability changes associated with cigarette smoke weredemonstrated later by Minty & Royston (1985) to be due to theparticulate matter contained in the smoke. The increase in 99mTc-DTPA clearance observed after exposure to dilute whole smoke didnot occur when the particles were removed, suggesting that the carbonmonoxide contained in the gaseous phase does not alter permeabilityof the alveolar–capillary membrane.
8.1.2.2 Effects on lung function
Human studies of pulmonary function are mostly devoted to theidentification of effects occurring in the lungs of individuals exposedto relatively high concentrations of carbon monoxide. Older studiesin the literature describe the effects of brief, controlled experimentswith high carbon monoxide–air mixtures. Chevalier et al. (1966)exposed 10 subjects to 5700 mg carbon monoxide/m3 (5000 ppm) for2–3 min until carboxyhaemoglobin levels reached 4%. Measurementsof pulmonary function and exercise studies were performed before andafter exposure. Inspiratory capacity and total lung capacity decreased7.5% (P < 0.05) and 2.1% (P < 0.02), respectively, whereas maximumbreathing capacity increased 5.7% (P < 0.05) following exposure.
EHC 213: Carbon Monoxide
252
Mean resting diffusing capacity of the lungs decreased 7.6% (P <0.05) compared with air-exposed controls. Fisher et al. (1969)exposed a small number (n = 4) of male subjects, aged 23–36 years,to 6% (69 000 mg/m3 [60 000 ppm]) carbon monoxide for 18 s,resulting in estimated carboxyhaemoglobin concentrations of 17–19%.There were no significant changes in lung volume, mechanics ordiffusing capacity. Neither of these studies was definitive, however,and no follow-up studies were reported.
More recent studies in the literature describing the effects ofcarbon monoxide on pulmonary function have been concerned withexposure to the products of combustion and pyrolysis from suchsources as tobacco, fires or gas- and kerosene-fuelled appliances andengines. One group of individuals, representing the largest proportionof the population exposed to carbon monoxide, is tobacco smokers.
A second group evaluated for potential changes in acute ventila-tory function includes occupations in which individuals are exposedto variable, and often unknown, concentrations of carbon monoxidein both indoor and outdoor environments. Firefighters, tunnel workersand loggers are typical examples of individuals at possible risk.Unfortunately, these individuals are also exposed to high concentra-tions of other combustion components of smoke and exhaust. It is verydifficult to separate the potential effects of carbon monoxide fromthose due to other respiratory irritants.
Firefighters have previously been shown to have a greater loss oflung function associated with acute and chronic smoke inhalation (asreviewed by Sparrow et al., 1982). None of these earlier studies,however, characterized the exposure variables, particularly the con-centrations of carbon monoxide found in smoke, nor did they reportthe carboxyhaemoglobin levels found in firefighters after exposure.Most reports of lung function loss associated with other occupationalexposures also fail to characterize exposure to carbon monoxide. Thefollowing studies have attempted to monitor, or at least estimate, thecarbon monoxide and carboxyhaemoglobin levels found in occupa-tional settings where lung function was also measured.
Sheppard et al. (1986) reported that acute decrements in lungfunction were associated with routine firefighting. Baseline airwayresponsiveness to methacholine was measured in 29 firefighters from
Effects on Humans
253
one fire station in San Francisco, California, USA, who were moni-tored over an 8-week period. Spirometry measurements were takenbefore and after each 24-h work shift and after each fire. Exhaled gaswas sampled 55 times from 21 firefighters immediately after each fireand was analysed for carbon monoxide. Despite the use of personalrespiratory protection, exhaled carbon monoxide levels exceeded110 mg/m3 (100 ppm) on four occasions, with a maximum of150 mg/m3 (132 ppm), corresponding to predicted carboxyhaemo-globin levels of 17–22%. Of the 76 spirometry measurements obtainedwithin 2 h after a fire, 18 showed a greater fall in FEV1 and/or FVCcompared with routine work shifts without fires. Decrements in lungfunction persisted for as long as 18 h in some of the individuals, butthey did not appear to occur selectively in those individuals with pre-existing airway hyperresponsiveness.
Evans et al. (1988) reported on changes in lung function andrespiratory symptoms associated with exposure to automobile exhaustamong bridge and tunnel officers. Spirometry measurements wereobtained in and symptom questionnaires were administered on a vol-untary basis to 944 officers of the Triborough Bridge and TunnelAuthority in New York City, New York, USA, over an 11-year periodbetween 1970 and 1981. Regression analyses were performed on466 individuals (49%) who had been tested at least three times duringthat period. Carboxyhaemoglobin levels were calculated from expired-air breath samples. Small but significant differences were foundbetween the bridge and tunnel officers. Estimated levels of carboxy-haemoglobin were consistently higher in tunnel workers than inbridge workers for both non-smoking individuals (1.96% and 1.73%,respectively) and smoking individuals (4.47% and 4.25%,respectively). Lung function measures of FEV1 and FVC were lower,on average, in tunnel workers than in bridge workers. There were noreported differences in respiratory symptoms except for a slightlyhigher symptom prevalence in tunnel workers who smoked. Becausedifferences in lung function between the two groups were small, it isquestionable if the results are clinically significant or if they wereeven related to carbon monoxide exposure.
Hagberg et al. (1985) evaluated the complaints of 211 loggersreporting dyspnoea and irritative symptoms in their eyes, noses andthroats after chain-saw use. Measurements of lung spirometry, car-boxyhaemoglobin and exposure to carbon monoxide, hydrocarbons
EHC 213: Carbon Monoxide
254
and aldehydes were conducted on 23 loggers over 36 work periodslasting 2 h each. Ventilation levels during tree felling averaged41 litres/min. Carboxyhaemoglobin levels increased after chain-sawuse (P < 0.05) but were weakly although significantly (P < 0.001)correlated (r = 0.63) with mean carbon monoxide concentrations of19 mg/m3 (17 ppm) (5–84 mg/m3 [4–73 ppm] range) in non-smokers.Corresponding carboxyhaemoglobin levels were apparently <2%;unfortunately, the absolute values before and after exposure were notreported. Bronchoconstriction, measured by a decreased FEV1/FVC(P < 0.03) and forced expiratory flow measured at 25–75% of FVC(P < 0.005), was found after the work periods, but no correlationswere obtained between lung function, carboxyhaemoglobin levels andexposure variables. There were no reported significant changes inFEV1 or FVC.
The potential effects of indoor combustion products of kerosenespace heaters on lung function were evaluated by Cooper & Alberti(1984). Carbon monoxide and sulfur dioxide concentrations weremonitored in 14 suburban homes in Richmond, Virginia, USA, duringJanuary and February of 1983 while modern kerosene heaters were inoperation. Spirometry measurements were obtained in 29 subjectsover a 2-day period, randomizing exposures between days with andwithout the heater on. During heater operation, the carbon monoxideconcentration was 7.8 ± 6.8 mg/m3 (6.8 ± 5.9 ppm) (0–16 mg/m3
[0–14 ppm] range), and the sulfur dioxide concentration was 1.1 ± 1.1mg/m3 (0.4 ± 0.4 ppm) (0–2.9 mg/m3 [0–1 ppm] range). On controldays, the indoor carbon monoxide concentration was 0.16 ± 0.61mg/m3 (0.14 ± 0.53 ppm), whereas sulfur dioxide was undetectable.Six of the homes had carbon monoxide concentrations exceeding 10mg/m3 (9 ppm). Corresponding outdoor carbon monoxideconcentrations were 0–3.4 mg/m3 (0–3 ppm). Carboxyhaemoglobinlevels significantly increased from 0.82 ± 0.43% on control days to1.11 ± 0.52% on days when kerosene heaters were used. Exposure toheater emissions, however, had no effect on FVC, FEV1 or maximummid-expiratory flow rate.
Most of the published community population studies on carbonmonoxide have investigated the relationship between ambient carbonmonoxide levels and hospital admissions, deaths or symptoms attrib-uted to cardiovascular diseases. Little epidemiological information is
Effects on Humans
255
available on the relationship between carbon monoxide andpulmonary function, symptomatology and disease.
One study by Lutz (1983) attempted to relate levels of ambientpollution to pulmonary diseases seen in a family practice clinic in SaltLake City, Utah, USA, during the winters of 1980 and 1981, whenheavy smog conditions prevailed. Data on patient diagnoses, localclimatological conditions and levels of carbon monoxide, ozone andparticulate matter were obtained over a 13-week period. Pollutantlevels were measured daily and then averaged for each week of thestudy; absolute values were not reported. For each week, weightedsimple linear regression (values not reported) and correlation analyseswere performed. Significant correlations (P = 0.01) betweenpollution-related diseases and the environmental variables were foundfor particulate matter (r = 0.79), ozone (r = !0.67) and percentage ofsmoke and fog (r = 0.79), but not for carbon monoxide (r = 0.43) orpercentage of cloud cover (r = 0.33). The lack of a significantcorrelation with carbon monoxide was explained by a small fraction(2%) of diagnoses for ischaemic heart disease compared with apredominance of respiratory tract diseases such as asthma, bronchitis,bronchiolitis and emphysema.
Daily lung function in a large community population exposed toindoor and outdoor air pollution was measured in Tucson, Arizona,USA, by Lebowitz and co-workers (Lebowitz et al., 1983a,b, 1984,1985, 1987; Lebowitz, 1984; Robertson & Lebowitz, 1984). Subsetsof both healthy subjects and subjects with asthma, allergies andairway obstructive disease were drawn from a symptom-stratified,geographic sample of 117 middle-class households. Symptoms,medication use and peak flow measurements were recorded daily overa 2-year period. Indoor/outdoor monitoring was conducted in arandom sample of 41 representative houses. Maximum 1-hconcentrations of ozone, carbon monoxide and nitrogen dioxide anddaily levels of total suspended particulates, allergens andmeteorological variables were monitored at central stations within0.8 km of each population subset. Because gas stoves and tobaccosmoking were the predominant indoor sources, indoor pollutantmeasurements were made for particles and carbon monoxide. Levelsof carbon monoxide were low, averaging less than 2.7 mg/m3
(2.4 ppm) indoors and 4.4–5.6 mg/m3 (3.8–4.9 ppm) outdoors.Spectral time-series analysis was used to evaluate relationships
EHC 213: Carbon Monoxide
256
between environmental exposure and pulmonary effects over time(Robertson & Lebowitz, 1984; Lebowitz et al., 1987). Asthmaticswere the most responsive, whereas healthy subjects showed no signi-ficant responses. Outdoor ozone, nitrogen dioxide, allergens, meteo-rology and indoor gas stoves were significantly related to symptomsand peak flow.
8.1.3 Cardiovascular and respiratory response to exercise
The most extensive human studies on the cardiorespiratoryeffects of carbon monoxide are those involving the measurement ofoxygen uptake during exercise. Healthy young individuals were usedin most of the studies evaluating the effects of carbon monoxide onexercise performance; healthy older individuals were used in only twostudies (Raven et al., 1974a; Aronow & Cassidy, 1975). In all of thesestudies, oxygen uptake during submaximal exercise for shortdurations (5–60 min) was not affected by carboxyhaemoglobin levelsas high as 15–20%. Under conditions of short-term maximal exercise,however, statistically significant decreases (3–23%) in maximaloxygen uptake ( O2
max) were found at carboxyhaemoglobin levelsranging from 5% to 20% (Pirnay et al., 1971; Ekblom & Huot, 1972;Vogel & Gleser, 1972; Stewart et al., 1978; Weiser et al., 1978; Kleinet al., 1980). In another study by Horvath et al. (1975), the criticallevel at which carboxyhaemoglobin marginally influenced O2
max(P < 0.10) was approximately 4.3%. The data obtained by Horvath’sgroup and others are summarized in Fig. 11. There is a linearrelationship between decline in O2
max and increase in carboxy-haemoglobin that can be expressed as % decrease in O2
max = 0.91(% COHb) + 2.2 (US EPA, 1979b; Horvath, 1981). Short-termmaximal exercise duration has also been shown to be reduced(3–38%) at carboxyhaemoglobin levels ranging from 2.3% to 7%(Ekblom & Huot, 1972; Drinkwater et al., 1974; Raven et al.,1974a,b; Horvath et al., 1975; Weiser et al., 1978).
Numerous studies have demonstrated that an increase in carboxy-haemoglobin is associated with a compensatory increase in brainblood flow. Benignus et al. (1992) conducted two sets of studies on 14and 12 young healthy men, respectively, measuring brain blood flowby the method of impedance plethysmography. In the first study,subjects were transiently exposed to various concentrations of carbonmonoxide. In the second study, the exposure lasted 4 h. The exposuresproduced carboxyhaemoglobin levels up to 18.4%. The variation of
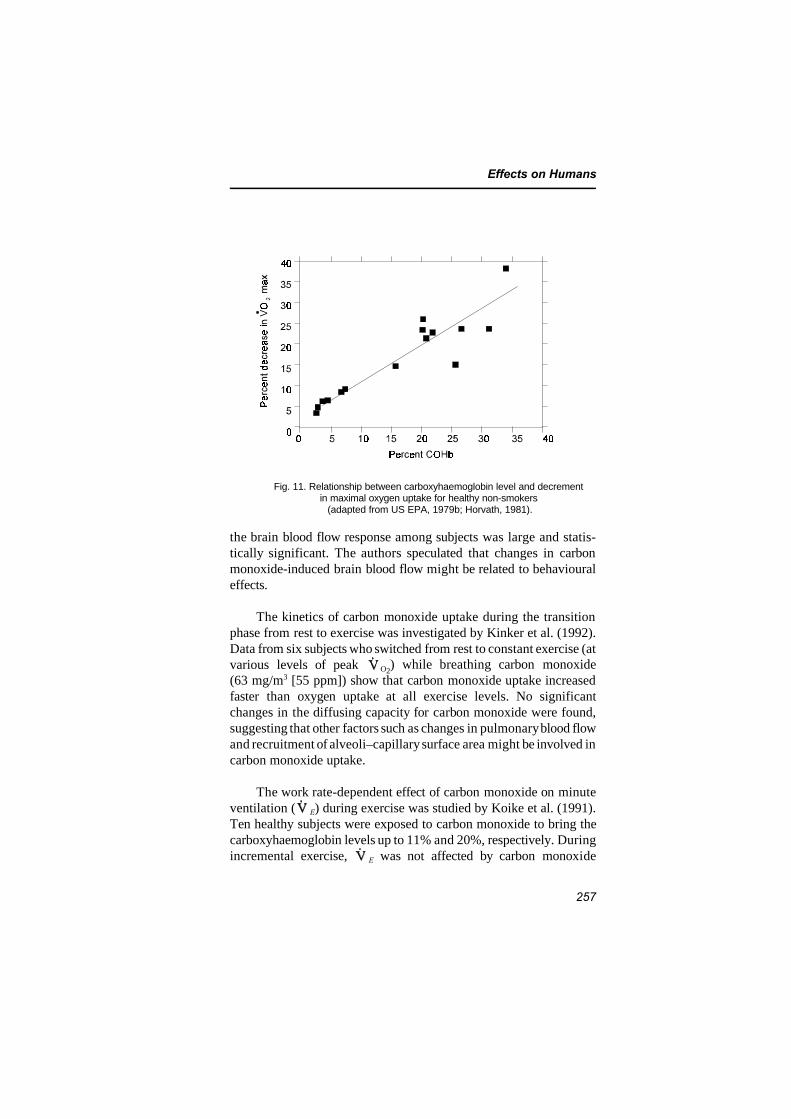
Effects on Humans
257
Fig. 11. Relationship between carboxyhaemoglobin level and decrementin maximal oxygen uptake for healthy non-smokers (adapted from US EPA, 1979b; Horvath, 1981).
the brain blood flow response among subjects was large and statis-tically significant. The authors speculated that changes in carbonmonoxide-induced brain blood flow might be related to behaviouraleffects.
The kinetics of carbon monoxide uptake during the transitionphase from rest to exercise was investigated by Kinker et al. (1992).Data from six subjects who switched from rest to constant exercise (atvarious levels of peak O2
) while breathing carbon monoxide(63 mg/m3 [55 ppm]) show that carbon monoxide uptake increasedfaster than oxygen uptake at all exercise levels. No significantchanges in the diffusing capacity for carbon monoxide were found,suggesting that other factors such as changes in pulmonary blood flowand recruitment of alveoli–capillary surface area might be involved incarbon monoxide uptake.
The work rate-dependent effect of carbon monoxide on minuteventilation ( E) during exercise was studied by Koike et al. (1991).Ten healthy subjects were exposed to carbon monoxide to bring thecarboxyhaemoglobin levels up to 11% and 20%, respectively. Duringincremental exercise, E was not affected by carbon monoxide
EHC 213: Carbon Monoxide
258
breathing at work rates below the lactic acidosis threshold. Above thelactic acidosis threshold, however, as the work load and carboxy-haemoglobin concentration increased, the E increased as well. Theincrease in E correlated positively with carboxyhaemoglobin levels(r . 0.83). Such an increase in exercise E due to carboxyhaemo-globin might restrict work rates above the lactic acidosis thresholdand lead to greater lactic acidosis.
Potential effects of hypoxia on muscle deoxygenation duringexercise were studied by Maehara et al. (1997). Seven healthy subjectsexercised at two constant work loads under various conditions ofhypoxic and carbon monoxide-induced hypoxia (15% carboxyhaemo-globin). They found that progressive muscle deoxygenation wasaccelerated at exercise levels above the lactic acidosis threshold.
It is well recognized that the same decrease in oxygen carryingcapacity of blood due to carbon monoxide-induced hypoxia andanaemia will have different physiological effects. Celsing et al. (1987)found in a series of very carefully performed studies in normal sub-jects that O2
max decreased by 19 ml/min per kilogram per gramper litre change in haemoglobin over a range of haemoglobin concen-trations from 13.7 to 17.0 g/dl. This change represents a 2% decreasein O2
max for every 3% decrease in haemoglobin concentration ina well-trained subject. The decrease also corresponds to the decreasein O2
max reported by Ekblom & Huot (1972) and Horvath et al.(1975). However, Ekblom & Huot (1972) found a much more markedeffect on maximal work time (i.e., work on a constant load untilexhaustion with a duration of about 6 min). An explanation for themarked decrease in maximal work time could be that carbon monox-ide has a negative effect on the oxidative enzymatic system, whereasthe decrease in work time is due to a combination of a decrease inoxygen capacity and a less efficient oxidative enzymatic system. If thedata are extrapolated to lower carboxyhaemoglobin values, a 3% levelof carboxyhaemoglobin should decrease the maximal work time byabout 20%. However, this decrease is more than the 10% averagedecrease reported by Klausen et al. (1983), who also found moremarked effects in less well-trained subjects compared with well-trained subjects. Additional studies need to be performed to resolvethe difference in the maximal work time values reported in thesestudies.
Effects on Humans
259
8.1.4 Behavioural changes and work performance
8.1.4.1 Introduction
Effects of carboxyhaemoglobin elevation above 20% on behav-iour have been unambiguously demonstrated in humans. Below thislevel, results are less consistent. Based on meta-analysis of Benignus(1994), 18–25% carboxyhaemoglobin levels in healthy sedentarypersons would be required to produce a 10% decrement in behaviour.Some of the differences among studies of the effect of carboxyhaemo-globin on the behaviour of humans are apparently due to technicalproblems in the execution of experiments, because single-blind ornon-blind experiments tend to yield a much higher rate of significanteffects than do double-blind studies. Even when non-double-blindexperiments are eliminated from consideration, however, a substantialamount of disparity remains among results of studies. It is possiblethat such residual disagreement is due to the action of an unsuspectedvariable that is not being controlled across experiments. Because atpresent no data are available on the behavioural changes and workperformance of individuals with chronically elevated carboxyhaemo-globin, the subsequent sections discuss only findings of acute studies.
8.1.4.2 Sensory effects
1) Vision
Absolute threshold. In an experiment using four well-trained youngsubjects, it was demonstrated that visual sensitivity was decreased ina dose-related manner by carboxyhaemoglobin levels of 4.5, 9.4, 15.8and 19.7% (McFarland et al., 1944). Various aspects of these datawere subsequently reported by Halperin et al. (1959) and McFarland(1970). Carboxyhaemoglobin elevations were accomplished by inhal-ation of boluses of high-concentration carbon monoxide. Visualthresholds were measured repeatedly over a 5-min period at eachcarboxyhaemoglobin level. Experimenters were not blind to the expo-sure conditions, and the subjects could have easily deduced theconditions from the experimental design, because no air-only condi-tion was included to control for the effects of the testing scheme itself.Data from only one typical subject were presented. Thresholds weremeasured at only one level of dark adaptation (0.02 lx).
EHC 213: Carbon Monoxide
260
McFarland (1973), in a scantily documented article, reported thatsimilar threshold shifts occurred at the end of a carbon monoxideexposure period (17% carboxyhaemoglobin) and an air-only session.Thus, it is possible that the effects reported by McFarland et al. (1944)were due to fatigue or some other time-on-task related variable. VonRestorff & Hebisch (1988) found no dark adaptation effects onsubjects with carboxyhaemoglobin levels ranging from 9% to 17%.Luria & McKay (1979) found no effect of 9% carboxyhaemoglobin onscotopic visual threshold.
The effect of 17% carboxyhaemoglobin (bolus administration,followed by maintenance carbon monoxide level for 135 min) on theentire dark adaptation curve was studied by Hudnell & Benignus(1989) using 21 young men in a double-blind study. No differencebetween carbon monoxide and air groups was observed. A power of0.7 was calculated for the test employed so that the conclusions arereasonably defensible. From the above evidence, it appears that effectson visual sensitivity have not been demonstrated at carboxyhaemo-globin levels up to 17%.
Temporal resolution. The temporal resolution of the visual systemhas been studied in the form of critical flicker frequency. In thecritical flicker frequency paradigm, subjects report the frequency atwhich light flashes begin to appear as a continuous light.
Seppanen et al. (1977) reported dose-ordinal decreases of criticalflicker frequency for carboxyhaemoglobin levels of approximately 4.0,6.1, 8.4, 10.7 and 12.7%. The experiment was conducted with22 healthy subjects whose ages ranged from 20 to 62 years. Carboxy-haemoglobin was induced by breathing high concentrations of carbonmonoxide from a Douglas bag. Subjects were blind as to thecondition, but apparently experimenters were informed. Appropriatecontrols for fatigue were included, and the exposure levels wererandomized.
A study was reported by von Post-Lingen (1964) in whichcarboxyhaemoglobin levels ranging up to 23% were induced in100 subjects by breathing carbon monoxide-contaminated air from aspirometer for about 7 min in a single-blind procedure. One group ofsubjects was given an injection of Evipan (sodium hexobarbitone; seeReynolds & Prasad, 1982), a drug previously shown to have produceddecreases in critical flicker frequency only if patients had
Effects on Humans
261
demonstrable brain damage. In the non-drug group, critical flickerfrequency was unaffected until approximately 14% carboxyhaemo-globin. In the drug group, however, effects began at carboxyhaemo-globin levels as low as 6% and were dose proportional up to thehighest carboxyhaemoglobin value. When the drug-plus-carbon mon-oxide study was repeated in a double-blind replication (n = 15), noeffects were seen. The latter replication study was given only oneparagraph in the report, and thus it is not clear exactly what was done.
Beard & Grandstaff (1970) reported significant effects on criticalflicker frequency in an earlier study in which four subjects had beenexposed to carbon monoxide levels of 57, 170 or 290 mg/m3 (50, 150or 250 ppm) for 1 h. Carboxyhaemoglobin was estimated by theauthors to have reached 3.0, 5.0 and 7.5%, respectively, by the end ofthe exposure. Documentation was extremely sparse, and, with onlyfour subjects, power was probably low. Even though the elevatedcarboxyhaemoglobin groups had decreased critical flicker frequency,the results were not dose ordinal. There is a comparatively largeamount of literature published before the Seppanen et al. (1977)article, in which the effect of elevated carboxyhaemoglobin on criticalflicker frequency was tested. In none of the earlier studies was criticalflicker frequency found to be affected, even though much higher levelsof carboxyhaemoglobin were reached. The studies and their maximumcarboxyhaemoglobin levels were Lilienthal & Fugitt (1946), 15.4%;Vollmer et al. (1946), 17.5%; Guest et al. (1970), 8.9%; O’Donnellet al. (1971a), 12.7%; Fodor & Winneke (1972), 7.5%; Ramsey(1973), 11.2%; and Winneke (1974), 10.0%. To be sure, there wasmuch variation in size of the subject group, method and experimentaldesign among the above studies, but no pattern emerges as to why theSeppanen et al. (1977), Beard & Grandstaff (1970) and von Post-Lingen (1964) studies found significant effects when the others didnot. It is noteworthy that the studies reporting significant effects wereall conducted in a single- or non-blind manner.
Miscellaneous visual functions. A number of researchers reportedthe results of experiments in which visual parameters other thanabsolute threshold or critical flicker frequency were measured as partof a battery of tests. Many of these experiments studied a large groupof subjects.
EHC 213: Carbon Monoxide
262
Beard & Grandstaff (1970) reported a study in which foursubjects were exposed to carbon monoxide sufficient to produceestimated (by the authors) carboxyhaemoglobin levels of 3.0, 5.0 and7.5%. The measurements made were critical flicker frequency (seeabove), brightness difference thresholds, visual acuity and absolutethreshold. Data for the latter variable were unreliable and were notreported. Dose-related impairments in acuity and brightnessdifference sensitivity were reported. The scant documentation ofmethods plus the low number of subjects make the results difficult toevaluate.
Five other reports of significant visual function effects bycarboxyhaemoglobin elevation are extant. Two of the studies (Benderet al., 1972; Fodor & Winneke, 1972) reported that tachistoscopicpattern detection was impaired by carboxyhaemoglobin levels of 7.3%and 5.3%, respectively. Weir et al. (1973), Ramsey (1972) and Salva-tore (1974) reported that brightness discrimination was adverselyaffected by carboxyhaemoglobin levels of 6–20%.
Tests of visual function after carboxyhaemoglobin elevationconducted by other authors have been uniformly non-significant.Especially noteworthy are studies by Hudnell & Benignus (1989) andStewart et al. (1975), both of which found no acuity effects as reportedby Beard & Grandstaff (1970). Brightness discrimination was simi-larly not found to be affected (Ramsey, 1973), in contradiction withthe reports of others. The latter study is especially interesting in thatit represents a failure to replicate an earlier study by the same author(Ramsey, 1972). The earlier study by Ramsey was conducted in asingle-blind manner, whereas the later one was double-blind.
The most thorough tests of visual function were performed byHudnell & Benignus (1989), who tested absolute threshold (seeabove), acuity and motion detection with carboxyhaemoglobin levelsof 17% and found no effects due to carboxyhaemoglobin. The acuityand motion detection were tested at both scotopic and photopic levels.
It would appear that the results of studies on the effects ofcarboxyhaemoglobin elevation on miscellaneous visual function arenot supportive of significant effects. Results that were significant intwo studies (Beard & Grandstaff, 1970; Weir et al., 1973) werecontradicted by other reports using relatively large groups of subjectsunder better controlled conditions.
Effects on Humans
263
2) Audition
Surprisingly little work has been done concerning the effects ofcarboxyhaemoglobin on auditory processes. Stewart et al. (1970)reported that the audiogram of subjects exposed to carbon monoxideresulting in up to 12.0% carboxyhaemoglobin was not affected. Haideret al. (1976) exposed subjects to a 105-dB, one-octave bandwidthrandom noise (centre frequency of 2 kHz) for 15 min while carboxy-haemoglobin level was elevated to 13%. Under continued carboxy-haemoglobin elevation, the temporary threshold shifts were measuredafter noise cessation. No effects of carboxyhaemoglobin on temporarythreshold shift were observed. Guest et al. (1970) tested the effects ofelevated carboxyhaemoglobin (8.9%) on auditory flutter fusion andfound no significant effect. The flutter fusion test is analogous tocritical flicker frequency in vision and was tested by having thesubject judge the rate at which an interrupted white noise becameapparently continuous. From these data, it would appear that the func-tioning of the auditory system is not particularly sensitive to carboxy-haemoglobin elevation, but little research has been done.
8.1.4.3 Motor and sensorimotor performance
1) Fine motor skills
In a single-blind study, Bender et al. (1972) found that manualdexterity and precision (Purdue pegboard) were impaired by 7% car-boxyhaemoglobin. Winneke (1974) reported that hand steadiness wasaffected by 10% carboxyhaemoglobin, but no supportive statistical testwas presented.
Similar motor functions were evaluated by a number of otherinvestigators and were found not to be affected, even at higher car-boxyhaemoglobin levels. Vollmer et al. (1946) reported that 20% car-boxyhaemoglobin did not affect postural stability. O’Donnell et al.(1971b) used the Pensacola Ataxia Battery to measure various aspectsof locomotion and postural stability. Subjects with 6.6% carboxy-haemoglobin were not affected. Stewart et al. (1970, 1975) tested theability of subjects to manipulate small parts using the Crawford collarand pin test and screw test, the American Automobile Associationhand steadiness test and the Flanagan coordination test. Carboxy-haemoglobin levels up to 15% had no effect on any of the measures.Two subjects were taken to 33% and 40% carboxyhaemoglobin,
EHC 213: Carbon Monoxide
264
however; in these subjects, the collar and pin performance wasimpaired and the subjects reported hand fatigue. Manual dexterity(Purdue pegboard), rapid precision movement (Purdue handprecision) and static hand steadiness (pen in hole) and tapping testswere not affected by carboxyhaemoglobin levels of approximately5.3% (Fodor & Winneke, 1972). Wright et al. (1973) reported thathand steadiness was not affected by carboxyhaemoglobin levels of5.6%. Weir et al. (1973) found no effects of 14% carboxyhaemoglobinon tapping, star tracing and rail walking. Mihevic et al. (1983)discovered no effect on tapping when the task was performed alone orsimultaneously with an arithmetic task. Finally, Seppanen et al.(1977) demonstrated that tapping speed was unaffected by 12.7%carboxyhaemoglobin. Most of the above non-significant studies useda moderate to large number of subjects. The overwhelming evidencein the area of fine motor control indicates that carboxyhaemoglobinlevels below approximately 20% (the highest level tested) do notproduce effects.
2) Reaction time
Of the 12 different experiments that studied reaction time, only1 reported a significant result (Weir et al., 1973), and that effectoccurred only at 20% carboxyhaemoglobin. A number of the non-significant effects were from studies using a large number of subjects.The consistent finding that carboxyhaemoglobin elevation does notaffect reaction time is especially impressive because of the wide rangeof carboxyhaemoglobin levels employed (5.0–41.0%).
3) Tracking
Tracking is a special form of fine motor behaviour and hand–eyecoordination that requires a subject to either follow a moving targetor compensate for a moving target’s motion by manipulation of alever, for example. Of the 11 studies on the topic, 4 reportedsignificant effects, and 1 of those found effects only at 20% carboxy-haemoglobin. The matter is more complicated, however, and theliterature in the area offers some clues to the reasons for the diversityamong the reports.
O’Donnell et al. (1971a,b) used critical instability compensatorytracking in which the task was to keep a meter needle centred.Simultaneous performance of detection tasks was also required in oneof the studies. No effects were demonstrated for carboxyhaemoglobinlevels as high as 12–13%. The critical instability tracking task was
Effects on Humans
265
also used by Gliner et al. (1983) in conjunction with peripheral lightdetection. Carboxyhaemoglobin levels up to 5.8% had no effect onperformance. Pursuit rotor tracking was also reported to be unaffectedat 5.3% carboxyhaemoglobin (Fodor & Winneke, 1972). Weir et al.(1973) reported that pursuit rotor performance was slightly affectedbeginning at 20% carboxyhaemoglobin. In a 1988 study, Bunnell &Horvath used a two-dimensional tracking task in which the stimuluswas presented on a cathode ray tube and was controlled with ajoystick. No effect of carboxyhaemoglobin or exercise or a combina-tion of the two was seen for carboxyhaemoglobin levels up to 10.2%.Schaad et al. (1983) reported that pursuit and compensatory trackingwere not affected by a carboxyhaemoglobin level of 20% even duringsimultaneous performance of monitoring tasks.
In a pair of careful studies of different design, Putz et al. (1976,1979) studied compensatory tracking by having the subject try to keepa vertically moving spot in the centre of an oscilloscope screen. Thetracking was performed while the subject also did a light brightnessdetection task. In both studies, tracking was significantly affected bycarboxyhaemoglobin levels of 5%. The fact that both studies demon-strated significant results despite differences in experimental designlends credibility to the finding. Additional credibility was gainedwhen the Putz et al. (1976) study was replicated with similar resultsby Benignus et al. (1987).
The consistency of the compensatory tracking results in the Putzet al. (1976) protocol was not continued when Benignus et al. (1990a)attempted to demonstrate a dose–effect relationship using the sameexperimental design. In the latter study, independent groups wereexposed to carbon monoxide sufficient to produce carboxyhaemo-globin levels of control, 5, 12 and 17%. Carbon monoxide wasadministered via Douglas bag breathing, and then carboxyhaemo-globin was maintained by low-level carbon monoxide in room air. Afifth group was exposed to carbon monoxide in the chamber only, andthis group served as a positive control because it was treated in exactlythe same ways as the subjects in Putz et al. (1976) and in Benignuset al. (1987). No significant effects on tracking were demonstrated inany group. The means for the tracking error were elevated in a nearlydose-ordinal manner, but not to a statistically significant extent.
EHC 213: Carbon Monoxide
266
At present, there is no apparent reason for the lack of consistencyamong the reports of tracking performance. The largest study with thewidest dose range (Benignus et al., 1990a) appears to be the strongestindicator of no significant effects of carboxyhaemoglobin elevation.However, it is difficult to ignore the several other studies that werewell controlled and did demonstrate significant effects. At this point,the best summary seems to be that carboxyhaemoglobin elevationproduces small decrements in tracking that are sometimes significant.The possible reasons for such high variability are unclear.
8.1.4.4 Vigilance
A dependent variable that is possibly affected by elevatedcarboxyhaemoglobin is the performance of extended, low-demandtasks characterized as vigilance tasks. Because of the low-demandcharacteristic of vigilance tasks, they are usually of a single-task type.Of the eight reports, four reported significant effects. Despite theseemingly greater unanimity in this area, it is noteworthy that for eachreport of significant effects, there exists a failed attempt at directreplication.
Horvath et al. (1971) reported a significant vigilance effect at6.6% carboxyhaemoglobin. A second study, conducted in the samelaboratory (Christensen et al., 1977), failed to find significant effectsof 4.8% carboxyhaemoglobin on the same task. To be sure, the secondstudy used slightly lower carboxyhaemoglobin levels, but the meansleft no suggestion of an effect. Roche et al. (1981) from the samelaboratory reported that performance of the same task after a bolusexposure was used to produce 5% carboxyhaemoglobin was notaffected.
Fodor & Winneke (1972) reported a study in which 5.3%carboxyhaemoglobin significantly impaired performance of a vigi-lance task. When the same task and protocol were tried again in thesame laboratory (Winneke, 1974), no significant effects were found,even for carboxyhaemoglobin levels up to 10%.
Groll-Knapp et al. (1972) reported dose-related significant effectsof carboxyhaemoglobin levels ranging from estimated values of 3%to 7.6%. Effects were large, but apparently the study was not blind.Haider et al. (1976) reported similar effects at lowcarboxyhaemoglobin levels, but not at higher levels. The authors have
Effects on Humans
267
twice mentioned failures to replicate the results (Haider et al., 1976;Groll-Knapp et al., 1978). A similar experiment using a differentstimulus failed to produce significant effects at 12% carboxyhaemo-globin (Groll-Knapp et al., 1978).
The fact that all replication attempts for each of the reportedsignificant effects of carboxyhaemoglobin on vigilance have failed toverify the original reports is evidence for some unreliability or theoperation of unknown and uncontrolled variables. That the non-verifications were conducted by the original researchers, as well as byothers, makes the case for unreliability even more convincing. Ifvigilance is affected by carboxyhaemoglobin elevation, a convincingdemonstration remains to be made. Perhaps a case can be made thatbehavioural effects of carboxyhaemoglobin levels below 20% arepresent in the exposed population, but they are probably small and,therefore, difficult to demonstrate reliably (Benignus et al., 1990b).
8.1.4.5 Miscellaneous measures of performance
1) Continuous performance
Continuous performance is a category of behaviour that is relatedto vigilance. The difference is that many tasks that are performed overa long period of time are more demanding and involve more thansimple vigilance. Sometimes the continuous performance tasks are notperformed for a sufficiently long period of time to involve decrementsin vigilance or are interrupted too frequently.
Putz et al. (1976, 1979) reported that monitoring performedsimultaneously with tracking was impaired at carboxyhaemoglobinlevels as low as 5%. In a replication attempt of the Putz et al. (1976,1979) studies, Benignus et al. (1987) failed to find any effects ofapproximately 8% carboxyhaemoglobin. O’Donnell et al. (1971a) alsofailed to find effects of carboxyhaemoglobin on a monitoring taskperformed simultaneously with tracking. Schaad et al. (1983) foundno effects on monitoring performed simultaneously with tracking evenwhen carboxyhaemoglobin was 20%. Gliner et al. (1983) reported thatsignal detection was affected by 5.8% carboxyhaemoglobin whenperformed singly, but not when performed simultaneously withtracking. The latter results are in conflict with those of Putz et al.(1976, 1979).
EHC 213: Carbon Monoxide
268
Insogna & Warren (1984) reported that the total game score onthe performance of a multitask video game was reduced by carboxy-haemoglobin levels of 4.2%. Separate task scores were not collected.Schulte (1963) reported that letter, word and colour detection taskswere dose-ordinally impaired by carboxyhaemoglobin levels as low as5% and ranging up to 20%. Reported carboxyhaemoglobin levels wereat considerable variance with values expected from the exposureparameters (Laties & Merigan, 1979). Benignus et al. (1977) reportedthat 8.2% carboxyhaemoglobin did not affect a numeric monitoringtask.
Again, there is disturbing lack of replicability in the literature.The two most credible studies showing effects of carboxyhaemoglobinon continuous performance (Putz et al., 1976, 1979) were not verifiedby Benignus et al. (1987). In the latter study, the tracking effects ofthe Putz et al. (1976, 1979) work were verified. Similar studies ofmonitoring during tracking (O’Donnell et al., 1971a; Gliner et al.,1983; Schaad et al., 1983) also reported no effects of carboxyhaemo-globin, even with levels as high as 20%. It seems necessary to suspendjudgement regarding the continuous performance results until furtherdata and understanding are available. Perhaps the best judgement isto hypothesize small effects.
2) Time estimation
In 1967, Beard & Wertheim reported that carboxyhaemoglobinproduced a dose-related decrement in single-task time estimationaccuracy beginning at 2.7%. Various versions of the same task weretested by others with carboxyhaemoglobin levels ranging up to 20%without effects being demonstrated (Stewart et al., 1970, 1973b, 1975;O’Donnell et al., 1971b; Weir et al., 1973; Wright & Shephard,1978b). An exact replication, which also did not find significantresults, was conducted by Otto et al. (1979). It seems safe to assumethat time estimation is remarkably impervious to elevated carboxy-haemoglobin.
3) Cognitive effects
Five of the 11 experiments discussed below that have beenreported in the literature found cognitive effects of carboxyhaemo-globin. Bender et al. (1972) reported effects of 7.3% carboxyhaemo-globin on a variety of tasks. Groll-Knapp et al. (1978) reported
Effects on Humans
269
memory to be affected after exposure to carbon monoxide during sleep(11% carboxyhaemoglobin), but a very similar study performed by thesame group later found no effects of 10% carboxyhaemoglobin (Groll-Knapp et al., 1982). Arithmetic performance was affected slightly ina non-dose-ordinal manner when a simultaneous tapping task wasperformed (Mihevic et al., 1983). Schulte (1963) reported a dose-ordinal effect on arithmetic performance beginning at 5% and rangingto 20% carboxyhaemoglobin. Carboxyhaemoglobin levels in the latterstudy were considerably different from values expected from theexposure parameters (Laties & Merigan, 1979). Similar variableswere tested by others, sometimes at higher levels of carboxyhaemo-globin and with relatively large groups of subjects, without findingeffects (O’Donnell et al., 1971a; Stewart et al., 1975; Haider et al.,1976; Groll-Knapp et al., 1978; Schaad et al., 1983). The conclusionsare, at best, equivocal.
A study by Bunnell & Horvath (1988) utilized a wide range ofcognitive tasks involving short-term memory, Manikin rotation,Stroop word-colour tests, visual search and arithmetic problems (thelatter as part of a divided attention task performed simultaneouslywith tracking). Carboxyhaemoglobin was formed by bag breathingfollowed by a carbon monoxide level in room air designed to maintaina constant carboxyhaemoglobin level. Subjects were exercised at 0, 35or 60% of O2
max before cognitive tests were performed. The Strooptest performance was slightly but significantly decreased by both 7%and 10% carboxyhaemoglobin by the same amount, but exercise hadno effect. The authors suggested that negative transfer effects(difficulty in reversing instructional sets) were responsible for thedecrement. Visual searching improved for carboxyhaemoglobin levelsboth at rest and at medium exercise. At the high exercise level,however, carboxyhaemoglobin produced dose-ordinal impairments inperformance. The authors conjectured that hypoxic depression ofcortical function interacted with hypoxic stress and exercise stress toproduce the effects.
Most of the data on cognitive effects of carboxyhaemoglobinelevation are not sufficiently consistent to consider. The study byBunnell & Horvath (1988), however, is suggestive of potentiallyimportant effects of interactions of carboxyhaemoglobin and exercise.Before any conclusions may be drawn about the results, the studyshould be replicated and expanded.
EHC 213: Carbon Monoxide
270
8.1.4.6 Automobile driving
Complex behaviour, in the form of automobile driving, has beentested a number of times for effects of carboxyhaemoglobin elevation.Not only is automobile driving potentially more sensitive to disruptionbecause of its complexity, but it is also an inherently interestingvariable because of its direct applicability to non-laboratory situations.The well-practised nature of the behaviour, on the other hand, maymake performances more resistant to disruption. The complexity ofthe behaviour also leads to methodological difficulties. Attempting toexhaustively measure the complex behaviours usually leads investi-gators to measure many dependent variables. Statistically analysinga large number of variables in a defensible way requires many subjectsand leads to greater expense.
In an early study by Forbes et al. (1937), using only five subjects,steering accuracy in a simulator was investigated with carboxyhaemo-globin levels of up to 27.8%. No effects were demonstrated. Asparsely documented experiment by Wright et al. (1973), using50 subjects with 5.6% carboxyhaemoglobin, tested a number of func-tions of simulator performance but found no effects. Weir et al. (1973)performed an experiment with actual automobile driving on ahighway in which many variables were measured and tested. None ofthe variables was reliably affected until carboxyhaemoglobin exceededapproximately 20%. Wright & Shephard (1978a) failed to find effectsof 7% carboxyhaemoglobin on driving (although they reported effects,they had misapplied the chi-square test). The only effect on driving ata lower carboxyhaemoglobin level (7.6%) was reported by Rummo &Sarlanis (1974), who found that the ability to follow another car at afixed distance was impaired.
The difference between the experiments of Rummo & Sarlanis(1974) and Weir et al. (1973) is troubling. Both measured followingdistance, but only the experiment employing the lower-level carboxy-haemoglobin found effects. If automobile driving is affected bycarboxyhaemoglobin elevation, it remains to be demonstrated in aconclusive manner.
8.1.4.7 Brain electrical activity
Electrical activity of the brain (see review by Benignus, 1984)offers the possibility of testing the effects of carboxyhaemoglobin
Effects on Humans
271
without the problem of selecting the most sensitive behaviouraldependent variable. It is less dependent upon subject cooperation andeffort and may be a more general screening method. The majordisadvantage of the measures is the lack of functional interpretability.The area has been plagued with poor quantification and, frequently,a lack of statistical significance testing.
The electroencephalogram is a recording of the continuous vol-tage fluctuations emitted by the intact brain. The slow-evokedpotential originally called the contingent negative variation is com-puted by averaging over trials and was linked to (among other things)cognitive processes or expectancy (Donchin et al., 1977). The evokedpotential is the electrical activity in the brain resulting from sensorystimulation, either auditory or visual. The electroencephalogram,contingent negative variation and evoked potentials have been studiedwith carboxyhaemoglobin elevation.
Groll-Knapp et al. (1972) reported that the contingent negativevariation was decreased in amplitude in a dose-related manner forcarboxyhaemoglobin levels ranging from 3% to 7.6%. In a secondstudy, Groll-Knapp et al. (1978) again reported that contingentnegative variation amplitude was reduced by 12% carboxyhaemo-globin when subjects missed a signal in a vigilance task. Moreevidence is required before the functional significance of such aneffect can be deduced, but it is a potentially important finding.
Clinical electroencephalograms were analysed by visual inspec-tion by Stewart et al. (1970, 1973a) and Hosko (1970) after exposureto sufficient carbon monoxide to produce carboxyhaemoglobin levelsranging up to 33%. No effects were noticed. Groll-Knapp et al. (1978)reported similar results using spectrum analysis on electroencephalo-grams from subjects with 12% carboxyhaemoglobin. Haider et al.(1976) reported slight changes in the electroencephalogram spectrumfor carboxyhaemoglobin levels of 13%, but no tests of significancewere conducted. In view of the above studies, it seems reasonable toassume that no electroencephalogram effects of carboxyhaemoglobinlevels below at least 10% should be expected.
O’Donnell et al. (1971b) reported that sleep stages (asdetermined from the electroencephalogram) were not distributed bycarboxyhaemoglobin levels up to 12.4%. Groll-Knapp et al. (1978)
EHC 213: Carbon Monoxide
272
and Haider et al. (1976), however, both reported distributed sleepstages at similar carboxyhaemoglobin levels usingelectroencephalogram spectra. Groll-Knapp et al. (1982) repeatedtheir earlier study and found essentially the same effects.
The visual evoked potential was not affected consistently bycarboxyhaemoglobin elevation below approximately 22%, and usuallythe lowest level for effects was higher. At higher levels, the effectswere dose related (Hosko, 1970; Stewart et al., 1970).
Groll-Knapp et al. (1978) found no effect of carboxyhaemoglobin(8.6%) on click auditory evoked potentials during waking but reportedincreased positive peak amplitudes when subjects were tested duringsleep at approximately 11% carboxyhaemoglobin. The finding wasverified by Groll-Knapp et al. (1982). The fact that the data werecollected during sleep is potentially important.
Putz et al. (1976) conducted a double-blind study in which30 persons were exposed to 80 mg carbon monoxide/m3 (70 ppm) for240 min (5% carboxyhaemoglobin at the end of the session). Amongother variables, the auditory evoked potential was measured. Thepeak-to-peak amplitude of the N1–P1 components was increased in adose-ordinal manner beginning at approximately 3% carboxyhaemo-globin.
Many of the brain electrical activity measures seem to be alteredby carboxyhaemoglobin elevation. The functional significance of thesechanges is not clear. Sometimes an alteration is not an indication ofa deleterious effect but merely implies some change in processing.When induced by low levels of carboxyhaemoglobin, however, anychange should be viewed as potentially serious.
8.1.5 Adaptation
This section considers whether or not exposure to carbonmonoxide will eventually lead to the development of physiologicalresponses that tend to offset some of the deleterious effects. Althoughthere is possibly a temporal continuum in such processes, the term“adaptation” will be used in this review to refer to long-term phenom-ena, and the term “habituation” will refer to short-term processes. Theterm “compensatory mechanism” will be used to refer to those
Effects on Humans
273
physiological responses that tend to ameliorate deleterious effects,whether in the long-term or short-term case.
8.1.5.1 Short-term habituation
Arguments have been made for the possibility that there existshort-term compensatory mechanisms for carbon monoxide exposure.These hypothetical mechanisms have been based upon physiologicalevidence and have been used to account for certain behaviouralfindings reported in the literature.
There is physiological evidence for responses that wouldcompensate for the deleterious effects of carbon monoxide in a veryshort time span. As discussed, carbon monoxide has been demon-strated to produce an increased cerebral blood flow, which isapparently produced by cerebrovascular vasodilation. It has also beenshown (Zorn, 1972; Miller and Wood, 1974; Doblar et al., 1977;Traystman, 1978), however, that the tissue PO2
values for variouscentral nervous system sites fall in proportion to carboxyhaemoglobin,despite the increased blood flow. Apparently, the PO2
values would fallconsiderably more without the increased blood flow. It appears thattissue PO2 falls immediately and continuously as carboxyhaemoglobinrises.
8.1.5.2 Long-term adaptation
Adaptation is an all-inclusive term that incorporates all of theacute or chronic adjustments of an organism to a stressor. It does notindicate (or predict) whether the adjustments are initially oreventually beneficial or detrimental. Acclimatization is an adaptiveprocess that results in reduction of the physiological strain producedby exposure to a stressor. Generally, the main effect of repeated,constant exposure to the stressor is considered to result in animprovement of performance or a reduced physiological cost. Both ofthese phenomena tend to exploit the reserve potential of the organism.
Whether or not adaptation can occur in individuals chronicallyexposed to various ambient concentrations of carbon monoxideremains unresolved. Concern for carbon monoxide intoxication inEngland and Scandinavia led to the speculation that adaptationaladjustments could occur in humans (Killick, 1940; Grut, 1949). Theseconcerns were directed to situations where high ambient carbon
EHC 213: Carbon Monoxide
274
monoxide concentrations were present. There are only a few availablestudies conducted in humans.
Killick (1940), using herself as a subject, reported that shedeveloped acclimatization as evidenced by diminished symptoms,slower heart rate and the attainment of a lower carboxyhaemoglobinequilibrium level following exposure to a given inspired carbon mon-oxide concentration. Interestingly, Haldane & Priestley (1935) hadalready reported a similar finding as to the attainment of a differentcarboxyhaemoglobin equilibrium following exposure to a fixed levelof carbon monoxide in the ambient air.
Killick (1948) repeated her carbon monoxide exposure studies inan attempt to obtain more precise estimations of the acclimatizationeffects she had noted previously. The degree of acclimatization wasindicated by (1) a diminution in severity of symptoms during suc-cessive exposure to the same concentrations of carbon monoxide and(2) a lower carboxyhaemoglobin level after acclimatization than thatobtained prior to acclimatization during exposure to the same concen-trations of inhaled carbon monoxide.
8.1.6 Carbon monoxide interactions with drugs
There is little direct information on the possible enhancement ofcarbon monoxide toxicity by concomitant drug use or abuse; however,there are some data suggesting cause for concern. There is evidencethat interactions of drug effects with carbon monoxide exposure canoccur in both directions; that is, carbon monoxide toxicity may beenhanced by drug use, and the toxic or other effects of drugs may bealtered by carbon monoxide exposure.
The effects of combined carbon monoxide exposure and alcohol(ethanol) administration have been the most extensively studiedinteraction. A study from the Medical College of Wisconsin (1974)found no effects of alcohol doses resulting in blood alcohol levels ofabout 0.05% and carboxyhaemoglobin levels in the general range of8–9%, either alone or in combination, on a number of psychomotorbehavioural tasks. The lack of sensitivity of these measures to alcoholdoses known to affect performance under many other conditions, aswell as other problems in the study design, raises the question of theadequacy of this study to detect interactive effects. Rockwell & Weir(1975) studied the interaction of carbon monoxide exposures resulting
Effects on Humans
275
in nominal 0, 2, 8 and 12% carboxyhaemoglobin levels with alcoholdoses resulting in nominal 0.05% blood alcohol levels for effects onactual driving and driving-related performances in young, non-smoking college students. Dose-related effects of carbon monoxide forperceptual narrowing and decreased eye movement were observed. Inaddition, effects were observed on some measures by this dose ofalcohol alone. An effect-addition model was used to evaluate thealcohol–carbon monoxide interaction. In combination, the effects ofcarbon monoxide and alcohol were often additive, and there was asupra-additive alcohol–carbon monoxide interaction at 12% carboxy-haemoglobin levels. In a retrospective human study, King (1983)noted that the lethal carbon monoxide level was higher in thepresence of ethanol, suggesting that alcohol ingestion prior to carbonmonoxide exposure may provide some protection.
Because of a concern that persons exposed to carbon monoxidemay not be able to detect odours that would indicate a fire or otherhazardous condition, especially when consuming alcohol, Engen(1986) conducted a carefully controlled study of combined carbonmonoxide–alcohol exposure in human subject volunteers. The detec-tion of a threshold concentration of the smoky odour of quaiacol wasevaluated using signal detection analysis. Although not statisticallysignificant, there was a tendency for both alcohol and carbon monox-ide to improve odour detection compared with air only. When alcoholand carbon monoxide were combined, the odour detection was signi-ficantly poorer than after either treatment alone, but it was notsignificantly poorer than the air control.
8.1.7 Combined exposure to carbon monoxide and other airpollutants and environmental factors
In this section, human effects associated with combined exposureto carbon monoxide and other air pollutants and environmentalfactors are reviewed. Although a number of studies in the literaturehave tested exposure to combined pollutants, fewer studies haveactually been designed to test specifically for interactions betweencarbon monoxide and the other exposure components. Therefore, thissection emphasizes only those studies providing a combined treatmentgroup where pollutant exposure levels are reported.
EHC 213: Carbon Monoxide
276
8.1.7.1 Exposure to other pollutants in ambient air
Photochemical air pollution is usually associated with two ormore pollutants, consisting mainly of carbon monoxide, sulfur oxides,ozone, nitrogen oxides, peroxyacyl nitrates and organic peroxides.The gaseous compounds that constitute tobacco smoke are carbonmonoxide, hydrogen cyanide and nitric oxide. As urban living,industrial employment and cigarette smoking bring humans intodirect contact with carbon monoxide and other pollutants, it seemsappropriate to determine if combined exposure to these pollutants hasdetrimental health effects.
Several studies have been conducted to determine the effectsresulting from combined exposure to carbon monoxide and otherpollutants. A study by DeLucia et al. (1983) in adults exposed tocarbon monoxide plus ozone during exercise showed no synergisticeffects on blood carboxyhaemoglobin levels or pulmonary or cardio-respiratory thresholds. Similarly, simultaneous exposure to carbonmonoxide plus ozone plus nitrogen dioxide for 2 h produced noconsistent changes (synergistic or additive) in pulmonary functionindices and physiological parameters in young male subjects (Hackneyet al., 1975a,b).
Combined exposure to carbon monoxide and peroxyacyl nitratesexerted no greater effect on the work capacity of healthy men (youngand middle-aged smokers and non-smokers) than did exposure tocarbon monoxide alone. Increases in blood carboxyhaemoglobin levelsof smokers during the carbon monoxide or carbon monoxide plusperoxyacyl nitrate exposures were observed (Drinkwater et al., 1974;Raven et al., 1974a,b; Gliner et al., 1975).
Halogenated hydrocarbons, such as the dihalomethanes (e.g.,methylene bromide, methylene iodide and methylene chloride), arewidely used as organic solvents. These chemicals are metabolized inthe body to produce carbon monoxide, which is readily bound tohaemoglobin. Therefore, any additional exposure to carbon monoxide,producing higher carboxyhaemoglobin levels, could possibly causegreater health effects. For example, up to 80% of inhaled methylenechloride will be metabolized to carbon monoxide. Inhalation of1800–3500 mg/m3 (500–1000 ppm), therefore, would result incarboxyhaemoglobin levels of over 14%. Not only can this elevationin carboxyhaemoglobin have a significant effect when combined with
Effects on Humans
277
carbon monoxide exposure, but the carbon monoxide resulting frommetabolism generally requires a longer time to dissipate (Kurppa,1984).
8.1.7.2 Exposure to other environmental factors
1) Environmental heat
Several of the studies (Drinkwater et al., 1974; Raven et al.,1974a,b; Gliner et al., 1975) describing the effects of carbonmonoxide exposure alone and carbon monoxide combined withperoxyacyl nitrates on exercise performance in healthy adult men alsoevaluated the effects of heat stress. Subjects were exposed to 57 mgcarbon monoxide/m3 (50 ppm) and/or 0.27 ppm peroxyacyl nitratesin environmental exposure chamber conditions of 30% relativehumidity at 25 and 30 °C. In these studies, oxygen uptake andexercise duration were assessed during both maximal and submaximalexercise. Heat stress was more effective in reducing maximal exerciseperformance than exposure to the polluted environments. Thecombination of heat stress with carbon monoxide exposure was foundto be important, however, in producing symptom complaints duringsubmaximal exercise at 35 °C that were not found at 25 °C. Furtherwork in the same laboratory (Bunnell & Horvath, 1989) alsodemonstrated that subjects experienced significant levels ofsymptoms, particularly exertion symptoms, associated with elevatedcarboxyhaemoglobin when exercising in the heat. These studiessuggest, therefore, that heat stress may be an important determinantof changes in exercise performance when combined with exposure tocarbon monoxide.
2) Environmental noise
An early epidemiological study by Lumio (1948) of operators ofcarbon monoxide-fuelled vehicles found significantly greater per-manent hearing loss than expected after controlling for possible con-founding factors. More recently, Sulkowski & Bojarski (1988) studiedage-matched workers with similar length of duty employed infoundry, cast iron and cast steel positions where carbon monoxide andnoise exposure varied. The group exposed to the combined effects of95-dB noise and a mean concentration of 47 mg carbon monoxide/m3
(41 ppm) did not experience any greater hearing loss than the groupsexposed only to noise (96 dB) or carbon monoxide (52 mg/m3
[45 ppm]). In fact, a permanent threshold shift was significantly
EHC 213: Carbon Monoxide
278
larger in workers exposed to noise alone than in those exposed to thecombined influence of carbon monoxide and noise.
8.1.8 Exposure to tobacco smoke
8.1.8.1 Environmental tobacco smoke
A common source of carbon monoxide for the general populationis tobacco smoke. Exposure to tobacco smoke not only affects thecarboxyhaemoglobin level of the smoker, but, under some circum-stances, can also affect non-smokers. For example, acute exposure(1–2 h) to smoke-polluted environments has been reported to cause anincremental increase in non-smokers’ carboxyhaemoglobin of about1% (Jarvis, 1987).
The carbon monoxide concentration in tobacco smoke is approxi-mately 4.5% (52 000 mg/m3 [45 000 ppm]). A smoker may beexposed to 460–570 mg carbon monoxide/m3 (400–500 ppm) for theapproximately 6 min that it takes to smoke a typical cigarette,producing an average baseline carboxyhaemoglobin of 4%, with atypical range of 3–8%. Heavy smokers can have carboxyhaemoglobinlevels as high as 15%. In comparison, non-smokers average about 1%carboxyhaemoglobin in their blood. As a result of their higherbaseline carboxyhaemoglobin levels, smokers may actually beexcreting more carbon monoxide into the air than they are inhalingfrom the ambient environment. Smokers may even show an adaptiveresponse to the elevated carboxyhaemoglobin levels, as evidenced byincreased red blood cell volumes or reduced plasma volumes (Smith& Landaw, 1978a,b).
In addition to being a source of carbon monoxide for smokers aswell as for non-smokers, tobacco smoke is also a source of otherchemicals with which environmental carbon monoxide could interact.Available data strongly suggest that acute and chronic carbon monox-ide exposure attributed to tobacco smoke can affect the cardiopul-monary system, but the potential interaction of carbon monoxide withother products of tobacco smoke confounds the results. In addition, itis not clear if incremental increases in carboxyhaemoglobin caused byenvironmental exposure would actually be additive to chronicallyelevated carboxyhaemoglobin levels due to tobacco smoke, becausesome physiological adaptation may take place.
Effects on Humans
279
8.1.8.2 Mainstream tobacco smoke
Acute effects of cigarette smoke on maximal exercise perfor-mance appear to be similar to those described in subjects exposed tocarbon monoxide. Hirsch et al. (1985) studied the acute effect ofsmoking on cardiorespiratory function during exercise in nine healthymale subjects who were current smokers. They were tested twice —once after smoking three cigarettes per hour for 5 h and once after nothaving smoked. The exercise tests were done on a bicycle ergometerwith analysis of gas exchange and intra-arterial blood gases andpressures. On the smoking day, O2
max was significantly decreasedby 4%, and the anaerobic threshold was decreased by 14%. The rate–blood pressure product was a significant 12% higher at comparablework loads of 100 W on the smoking day than on the non-smokingday. There were no changes due to smoking, however, on the durationof exercise or on the mean work rate during maximal exercise testing.The blood carboxyhaemoglobin level before exercise was 1.8% on thenon-smoking day and 6.6% on the smoking day. At peak exercise, thecarboxyhaemoglobin was 0.9% and 4.8% on the non-smoking andsmoking day, respectively. The authors concluded that the mainadverse effect of smoking was due to carbon monoxide, although theincrease in rate–blood pressure product also might be the result of thesimultaneous inhalation of nicotine. They felt that the magnitude ofchange in performance indicators corresponded well with earlierreports.
It would be interesting, therefore, to determine if smokers andnon-smokers had different responses to carbon monoxide exposure.Unfortunately, smokers and non-smokers were not always identifiedin many of the studies on exercise performance, making it difficult tointerpret the available data. Information derived from studies oncigarette smoke is also sparse. As a result, attempts to sort out theacute effects of carbon monoxide from those due to other componentsof cigarette smoke have been equivocal. Seppanen (1977) reportedthat the physical work capacities of cigarette smokers decreased at9.1% carboxyhaemoglobin levels after either breathing boluses of1300 mg carbon monoxide/m3 (1100 ppm) or smoking cigarettes. Thegreatest decrease in maximal work, however, was observed aftercarbon monoxide inhalation.
EHC 213: Carbon Monoxide
280
Klausen et al. (1983) compared the acute effects of cigarettesmoking and inhalation of carbon monoxide on maximal exerciseperformance. They studied 16 male smokers under three differentconditions: after 8 h without smoking (control), after inhalation of thesmoke of three cigarettes and after carbon monoxide inhalation. Justbefore maximal exercise testing, the arterial carboxyhaemoglobinlevel reached 4.51% and 5.26% after cigarette smoke and carbonmonoxide inhalation, respectively, compared with 1.51% for controls.Average O2
max decreased by about 7% with both smoke andcarbon monoxide. Exercise time, however, decreased 20% with smokebut only 10% with carbon monoxide, suggesting that nicotine, smokeparticles or other components of tobacco smoke may contribute to theobserved effects. The authors therefore concluded that a specifiedcarboxyhaemoglobin level induced by either smoke or carbonmonoxide decreased maximal work performance to the same degree.Of note is the more marked decrease in work time compared with
O2 max induced by carbon monoxide, a finding that agrees with the
Ekblom & Huot (1972) results.
8.2 High-risk groups
8.2.1 Effects in individuals with heart disease
Aronow et al. (1972) and Aronow & Isbell (1973) demonstratedthat patients with angina pectoris, when exposed to low levels of car-bon monoxide (2.5–3% carboxyhaemoglobin), experienced reducedtime to onset of exercise-induced chest pain as a result of insufficientoxygen supply to the heart muscle. A study by Anderson et al. (1973)reported similar results at mean carboxyhaemoglobin levels of 2.9%and 4.5%.
In 1981, Aronow reported an effect of 2% carboxyhaemoglobinon time to onset of angina in 15 patients. The protocol was similar tothat used in previously reported studies, with patients exercising untilonset of angina. Only 8 of the 15 subjects developed 1 mm or greaterischaemic ST-segment depression at the onset of angina during thecontrol periods. This was not significantly affected by carbon mon-oxide. One millimetre or greater ST-segment depression is thecommonly accepted criterion for exercise-induced ischaemia. It isquestionable, therefore, as to whether the remaining patients truly metadequate criteria for ischaemia despite angiographically documented
Effects on Humans
281
cardiac disease. After breathing 57 mg carbon monoxide/m3 (50 ppm)for 1 h, the patients’ times to onset of angina significantly decreasedfrom a mean of 321.7 ± 96 s to a mean of 289.2 ± 88 s.
The cardiovascular studies by Aronow et al. were severelycriticized because the subjective measure of symptoms (angina) wasaffected by lack of adequate double-blind experimental conditions.There was also a lack of significant objective findings.
In an attempt to improve upon these earlier preliminary studies,the more recent studies placed greater emphasis on electrocardiogramchanges as objective measures of ischaemia. Another consideration inthe conduct of the newer studies on angina was to better establish thedose–response relationships for low levels of carbon monoxide expo-sure. Although carboxyhaemoglobin level is accepted as the bestmeasure of the effective dose of carbon monoxide, the reporting oflow-level effects is problematic because of inconsistencies in therigour with which the devices for measuring carboxyhaemoglobinhave been validated. The most frequently used technique for mea-suring carboxyhaemoglobin has been the optical method found in theIL series of CO-Oximeters. Not only is there a lot of individualvariability in these machines, but recent comparisons with the gaschromatographic technique of measuring carboxyhaemoglobin havesuggested that the optical method may not be a suitable referencetechnique for measuring low levels of carboxyhaemoglobin. Severaladditional studies have appeared in the literature to help define theprecise carboxyhaemoglobin levels at which cardiovascular effectsoccur in angina patients. Because the range of carboxyhaemoglobinvalues obtained with the optical method of analysis may be differentfrom that obtained by gas chromatography, the method used tomeasure carboxyhaemoglobin will be indicated in parentheses foreach of these studies.
Sheps et al. (1987) studied 30 patients aged 38–75 years withischaemic heart disease and assessed not only symptoms duringexercise, but also radionuclide evidence of ischaemia (left ventricularejection fraction changes). Patients were non-smokers with ischaemia,defined by exercise-induced ST-segment depression, angina or abnor-mal ejection fraction response (i.e., all patients had documentedevidence of ischaemia).
EHC 213: Carbon Monoxide
282
Patients were exposed to carbon monoxide (110 mg/m3
[100 ppm]) or air during a 3-day, randomized double-blind protocolto achieve a post-exposure level of 4% carboxyhaemoglobin (CO-Oximeter measurement). Resting pre-exposure levels were 1.7%, post-exposure levels were 4.1% and post-exercise levels were 3.6% on thecarbon monoxide exposure day; thus, the study examined acute eleva-tion of carboxyhaemoglobin levels from 1.7% to an average of 3.8%,or an average increase of 2.2% carboxyhaemoglobin from restingvalues. Comparing exposure to carbon monoxide with exposure to air,there was no significant difference in time to onset of angina,maximal exercise time, maximal ST-segment depression (1.5 mm forboth) or time to significant ST-segment depression. The conclusionof this study was that 3.8% carboxyhaemoglobin produces noclinically significant effects on this patient population.
Interestingly, further analysis of the time to onset of angina datain this paper demonstrated that 3 of the 30 patients experiencedangina on the carbon monoxide exposure day but not on the air-control day. These patients had to be deleted from the classicalanalysis of differences between time to onset of angina that wasreported in the publication. However, actuarial analysis of time toonset of angina including these patients revealed a statisticallysignificant (P < 0.05) difference in time to onset of angina favouringan earlier time under the carbon monoxide exposure conditions(Bissette et al., 1986). None of the patients had angina only on the airexposure day.
Subsequent work from these same investigators (Adams et al.,1988) focused on repeating the study at 6% carboxyhaemoglobin (CO-Oximeter measurement). Thirty subjects with obstructive coronaryartery disease and evidence of exercise-induced ischaemia wereexposed to air or carbon monoxide on successive days in arandomized double-blind crossover fashion. Post-exposure carboxy-haemoglobin levels averaged 5.9 ± 0.1% compared with 1.6 ± 0.1%after air exposure, representing an increase of 4.3%carboxyhaemoglobin. The mean duration of exercise was significantlylonger after air exposure than after carbon monoxide exposure(626 ± 50 s for air versus 585 ± 49 s for carbon monoxide, P < 0.05).Actuarial methods suggested that subjects experienced angina earlierduring exercise on the day of carbon monoxide exposure (P < 0.05).In addition, this study showed that, at a slightly higher level of carbonmonoxide exposure, both the level and change in ejection fraction at
Effects on Humans
283
submaximal exercise were greater on the air day than on the carbonmonoxide day. The peak exercise left ventricular ejection fraction,however, was not different for the two exposures.
These results demonstrated earlier onset of ventricular dysfunc-tion and angina and poorer exercise performance in patients withischaemic heart disease after acute carbon monoxide exposure suffi-cient to increase carboxyhaemoglobin to 6%. It is of interest that inboth the 4% study and the 6% study reported by this group, seven ofthe patients experienced angina on the carbon monoxide exposureday, but not on the air exposure day. There were no patients whoexperienced angina in the reverse sequence, providing further supportfor a significant effect of carbon monoxide exposure on anginaoccurrence.
Kleinman & Whittenberger (1985) and Kleinman et al. (1989)studied non-smoking male subjects with a history of stable anginapectoris and positive exercise tests. All but 2 of the 26 subjects hadadditional confirmation of ischaemic heart disease, such as previousmyocardial infarction, positive angiogram, positive thallium scan,prior angioplasty or prior bypass surgery. Subjects were exposed for1 h in a randomized double-blind crossover fashion to either 110 mgcarbon monoxide/m3 (100 ppm) or clean air on 2 separate days.Subjects performed an incremental exercise test on a cycle ergometerto the point at which they noticed the onset of angina. For the studygroup, the 1-h exposure to 110 mg carbon monoxide/m3 (100 ppm)resulted in an increase in carboxyhaemoglobin from 1.4% after cleanair to 3% (CO-Oximeter measurement) after carbon monoxide. Forthe entire study group (n = 26), the 1-h exposure to 110 mg/m3
(100 ppm) resulted in a decrease of the time to onset of angina by6.9% from 6.5 to 6.05 min (Kleinman & Whittenberger, 1985). Thisdifference was significant in a one-tailed paired t-test (P = 0.03).When using a two-tailed test, the difference loses statisticalsignificance at the P = 0.05 level.
In the published version of results from this study (Kleinmanet al., 1989), the two subjects with inconsistencies in their medicalrecords and histories were dropped from the analysis. For this studygroup (n = 24), the 1-h exposure to 110 mg carbon monoxide/m3
(100 ppm) (3% carboxyhaemoglobin by CO-Oximeter measurement)resulted in a significant decrease of time to onset of angina by 5.9%using a one-tailed, two-factor analysis of variance (P = 0.046). There
EHC 213: Carbon Monoxide
284
was no significant effect on the duration of angina, but oxygen uptakeat angina point was reduced 2.7% (P = 0.04). Only eight of thesubjects exhibited depression in the ST-segment of their electro-cardiogram traces during exercise. For this subgroup, there was a 10%reduction (P < 0.036) in time to onset of angina and a 19% reduction(P < 0.044) in the time to onset of 1-mm ST-segment depression.
A multicentre study of effects of low levels of carboxyhaemo-globin has been conducted in three cities on a relatively large sample(n = 63) of individuals with coronary artery disease (Allred et al.,1989a,b, 1991). The purpose of this study was to determine the effectsof carbon monoxide exposures producing 2.0% and 3.9% carboxy-haemoglobin (gas chromatographic measurement) on time to onset ofsignificant ischaemia during a standard treadmill exercise test.Significant ischaemia was measured subjectively by the duration ofexercise required for the development of angina (time to onset ofangina) and objectively by the time required to demonstrate a 1-mmchange in the ST-segment of the electrocardiogram (time to ST). Thetime to onset of ST-segment changes was measured to the nearestsecond, rather than to the nearest minute as in the other studies onangina, a strength of this study. Male subjects aged 41–75(mean = 62.1 years) with stable exertional angina pectoris and apositive stress test, as measured by a greater than 1-mm ST-segmentchange, were studied. Further evidence that these subjects hadcoronary artery disease was provided by the presence of at least oneof the following criteria: angiographic evidence of narrowing ($70%)of at least one coronary artery, documented prior myocardial infarc-tion or a positive stress thallium test demonstrating an unequivocalperfusion defect. Thus, as opposed to some previous studies reported,this study critically identified patients with documented coronaryartery disease.
The protocol for this study was similar to that used in theAronow studies, because two exercise tests were performed on thesame day. The two tests were separated by a recovery period and adouble-blind exposure period. On each of the 3 exposure days, thesubject performed a symptom-limited exercise test on a treadmill, thenwas exposed for 50–70 min to carbon monoxide concentrations thatwere experimentally determined to produce end-exposure carboxy-haemoglobin levels of 2% and 4%. The mean exposure levels andranges for the test environment were clean air (0 mg carbon
Effects on Humans
285
monoxide/m3 [0 ppm]), 134 mg carbon monoxide/m3 (117 ppm; range48–230 mg/m3 [42–202 ppm]) and 290 mg carbon monoxide/m3
(253 ppm; range 160–410 mg/m3 [143–357 ppm]). The subject thenperformed a second symptom-limited exercise test. The time to onsetof angina and the time to 1-mm ST-segment change were determinedfor each test. The percent changes following exposure at both 2.0%and 3.9% carboxyhaemoglobin (gas chromatographic measurement)were then compared with the same subject’s response to the random-ized exposure to room air (less than 2.3 mg carbon monoxide/m3
[2 ppm]).
When potential exacerbation of the exercise-induced ischaemiaby exposure to carbon monoxide was tested using the objectivemeasure of time to 1-mm ST-segment change, exposure to carbonmonoxide levels producing 2.0% carboxyhaemoglobin resulted in a5.1% decrease (P = 0.01) in the time to attain this level of ischaemia.At 3.9% carboxyhaemoglobin, the decrease in time to the ST criterionwas 12.1% (P # 0.0001) relative to the air-day results; this reductionin time to ST-segment depression was accompanied by a significant(P = 0.03) reduction in the heart rate–blood pressure product (doubleproduct), an index of myocardial work. The maximal amplitude of theST-segment change was also significantly affected by the carbon mon-oxide exposures: at 2% carboxyhaemoglobin, the increase was 11%(P = 0.002), and at 3.9% carboxyhaemoglobin, the increase was 17%relative to the air day (P # 0.0001).
When the individual centre data in the Allred et al. (1989a,b,1991) study were analysed for covariates that may have influenced theresults of this study, only the absolute level of carboxyhaemoglobinwas found to have had a significant effect. This finding is notsurprising, given the dose–response relationship between carbon mon-oxide and time to 1-mm ST-segment change. This analysis comparedthe slopes for each individual subject. The three times to 1-mm ST-segment change were plotted against the three actual carboxyhaemo-globin levels. The 62 individual slopes were then combined to yielda significant (P < 0.005) regression model: Change in time to 1-mmST-segment change = (!3.85 ± 0.63) (% COHb) + (8.01% ± 2.48%).This dose–response relationship indicates that there is a 3.9%decrease in the time to ST criterion for every 1% increase in carboxy-haemoglobin.
EHC 213: Carbon Monoxide
286
The time to onset of angina was also significantly reduced inthese subjects. At 2.0% carboxyhaemoglobin, the time to angina wasreduced by 4.2% (P = 0.027), and at 3.9% carboxyhaemoglobin, thetime was reduced by 7.1% (P = 0.002). There were no significantchanges in the double products at the time of onset of angina in eitherexposure condition. The regression analysis for the time to anginadata also resulted in a significant relationship (P < 0.025). Theaverage regression was Time to angina = (!1.89% ± 0.81%) (%COHb) + (1.00% ± 2.11%). The lower level of significance and thelarger error terms for the angina regression relative to the ST analysisindicate that the angina end-point is more variable. This may be dueto the subjective nature of this end-point or the variability in theability of subjects to clearly recognize the onset of the pain.
The two end-points (time to angina and time to ST change) inthe Allred study were also correlated, with a Spearman rankcorrelation coefficient of 0.49 (P # 0.0001). The conclusion of all ofthe analyses from this multicentre study is that the response of themyocardium in these patients with coronary artery disease isconsistent, although the effects are relatively small.
The analysis of the covariates in this multicentre study alsoprovides answers to ancillary questions that have been raisedelsewhere in this document. The medication being used by thesesubjects did not significantly influence the results (i.e., there does notappear to be any drug interaction with the effects of carbonmonoxide). The major medications being used in this group were $-blockers (used by 38 of the 63 subjects), nitrates (used by 36 of the63 subjects) and calcium channel blockers (used by 40 of the 63 sub-jects). The other major concern was the influence of the severity of thedisease. The simplest approach to this was to evaluate the influenceof the duration of the exercise, because the subjects with more severedisease were limited in their exercise performance. No significantcorrelation was found between duration of exercise and the percentchange in time to angina or ST criterion. There was also norelationship between the average time of exercise until the onset ofangina and either of the end-points. Not was there a relationshipbetween the presence of a previous myocardial infarction and thestudy end-points.
Effects on Humans
287
The duration of exercise was significantly shortened at 3.9%carboxyhaemoglobin but not at 2.0%. This finding must be usedcautiously, because these subjects were not exercised to their maxi-mum capacity in the usual sense. The major reason for termination ofthe exercise was the progression of the angina (306 of 376 exercisetests). The subjects were to grade their angina on a four-point scale;when the exercise progressed beyond level two, they were stopped.Therefore, this significant decrease in exercise time of 40 s at the3.9% carboxyhaemoglobin level is undoubtedly due to the earlieronset of angina followed by the normal rate of progression of theseverity of the angina.
The individual centre data provide insight into the interpretationof other studies that have been conducted in this area. Each of thecentres enrolled the numbers of subjects that have been reported byother investigators. The findings reported above were notsubstantiated in all instances at each centre. When one considers theresponses of the group to even 3.9% carboxyhaemoglobin, it is clearwhy one might not find significance in one parameter or another. Forthe decrease in ST segment at 3.9%, only 49 of 62 subjectsdemonstrated this effect on the day tested. The potential for findingsignificance at this effect rate with a smaller sample size is reduced.Random sampling of this population with a smaller sample couldeasily provide subjects that would not show significant effects of theselow levels of carbon monoxide on the test day.
The recent reports (Allred et al., 1989b, 1991) of the multicentrestudy, organized and supported by the Health Effects Institute, discusssome reasons for differences between the results of the studies citedabove (see Table 16). The studies have different designs, types ofexercise tests, inclusion criteria (and, therefore, patient populations),exposure conditions and means of measuring carboxyhaemoglobin.All of the studies have shown an effect of carboxyhaemoglobinelevation on time to onset of angina (see Fig. 12). Results from theKleinman et al. (1989) study showed a 6% decrease in exercise timeto angina at 3.0% carboxyhaemoglobin (CO-Oximeter measurement)measured at the end of exposure. Allred et al. (1989a,b) reported a 5%and 7% decrease in time to onset of angina after increasing carboxy-haemoglobin levels to 3.2% and 5.6% (CO-Oximeter measurement),respectively, at the end of exposure. Although the Sheps et al. (1987)and Adams et al. (1988) studies did not observe statistically
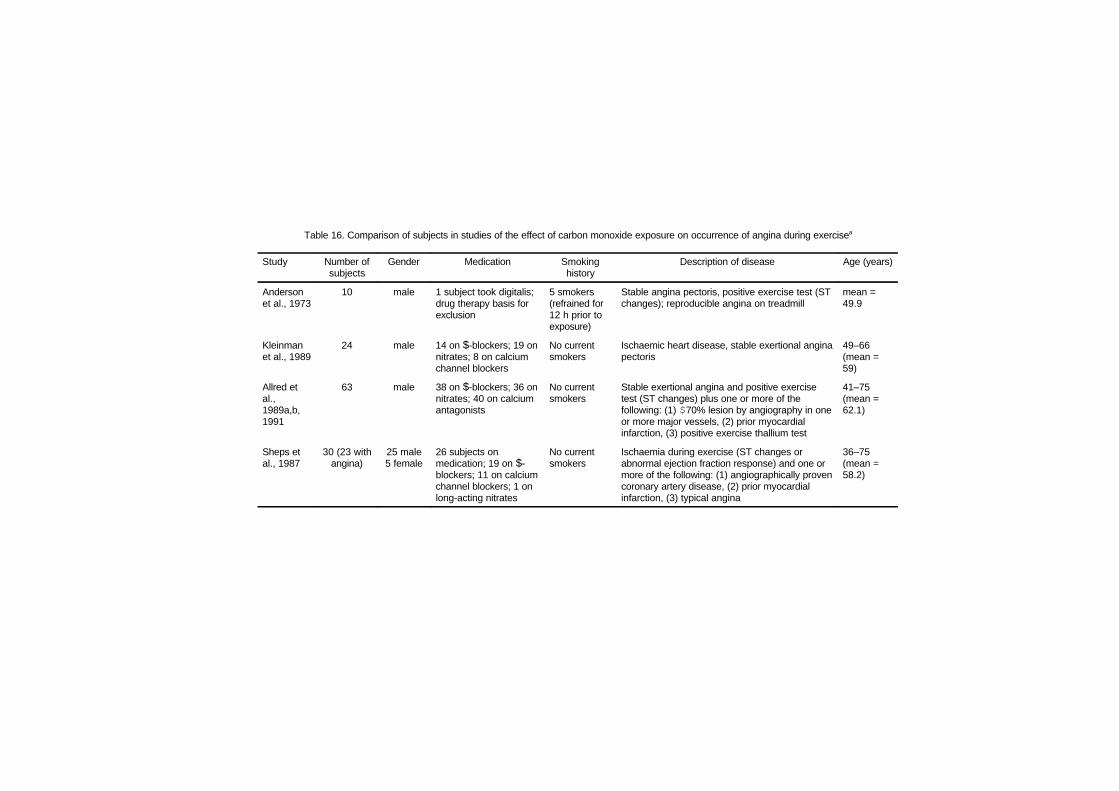
Table 16. Comparison of subjects in studies of the effect of carbon monoxide exposure on occurrence of angina during exercisea
Study Number ofsubjects
Gender Medication Smokinghistory
Description of disease Age (years)
Andersonet al., 1973
10 male 1 subject took digitalis;drug therapy basis forexclusion
5 smokers(refrained for12 h prior toexposure)
Stable angina pectoris, positive exercise test (STchanges); reproducible angina on treadmill
mean =49.9
Kleinmanet al., 1989
24 male 14 on $-blockers; 19 onnitrates; 8 on calciumchannel blockers
No currentsmokers
Ischaemic heart disease, stable exertional anginapectoris
49–66(mean =59)
Allred etal.,1989a,b,1991
63 male 38 on $-blockers; 36 onnitrates; 40 on calciumantagonists
No currentsmokers
Stable exertional angina and positive exercisetest (ST changes) plus one or more of thefollowing: (1) $70% lesion by angiography in oneor more major vessels, (2) prior myocardialinfarction, (3) positive exercise thallium test
41–75(mean =62.1)
Sheps etal., 1987
30 (23 withangina)
25 male5 female
26 subjects onmedication; 19 on $-blockers; 11 on calciumchannel blockers; 1 onlong-acting nitrates
No currentsmokers
Ischaemia during exercise (ST changes orabnormal ejection fraction response) and one ormore of the following: (1) angiographically provencoronary artery disease, (2) prior myocardialinfarction, (3) typical angina
36–75(mean =58.2)
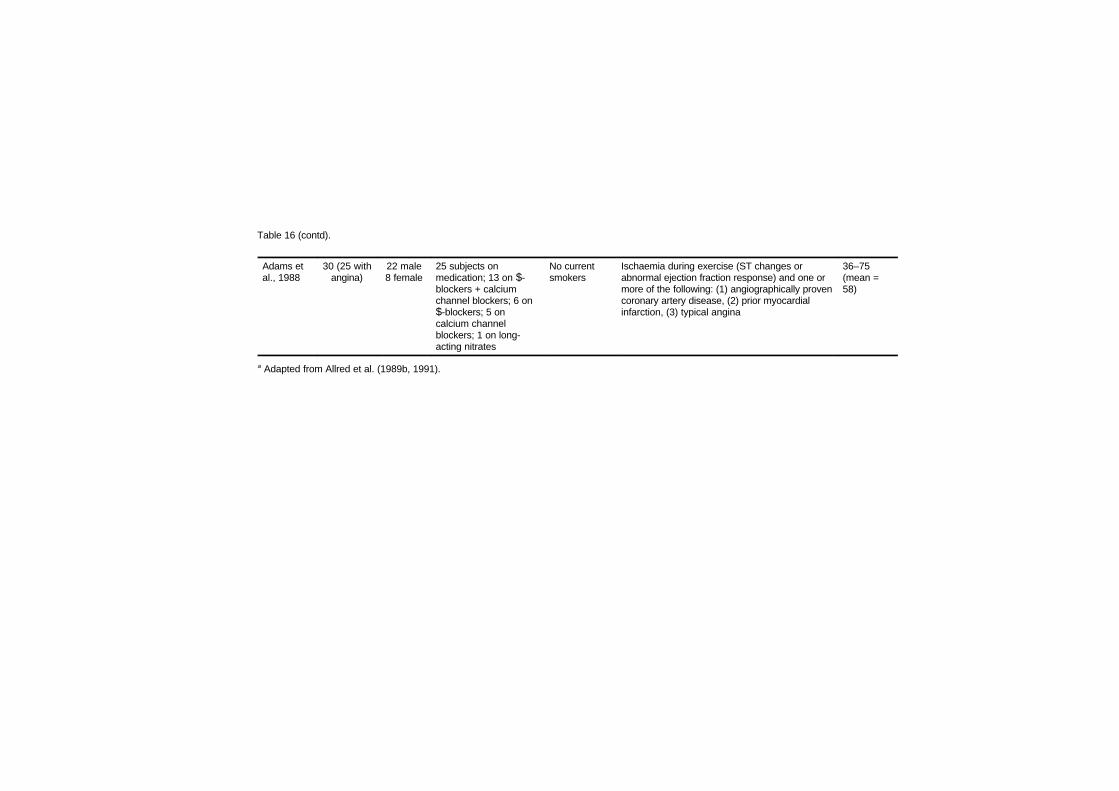
Table 16 (contd).
Adams etal., 1988
30 (25 withangina)
22 male8 female
25 subjects onmedication; 13 on $-blockers + calciumchannel blockers; 6 on$-blockers; 5 oncalcium channelblockers; 1 on long-acting nitrates
No currentsmokers
Ischaemia during exercise (ST changes orabnormal ejection fraction response) and one ormore of the following: (1) angiographically provencoronary artery disease, (2) prior myocardialinfarction, (3) typical angina
36–75(mean =58)
a Adapted from Allred et al. (1989b, 1991).
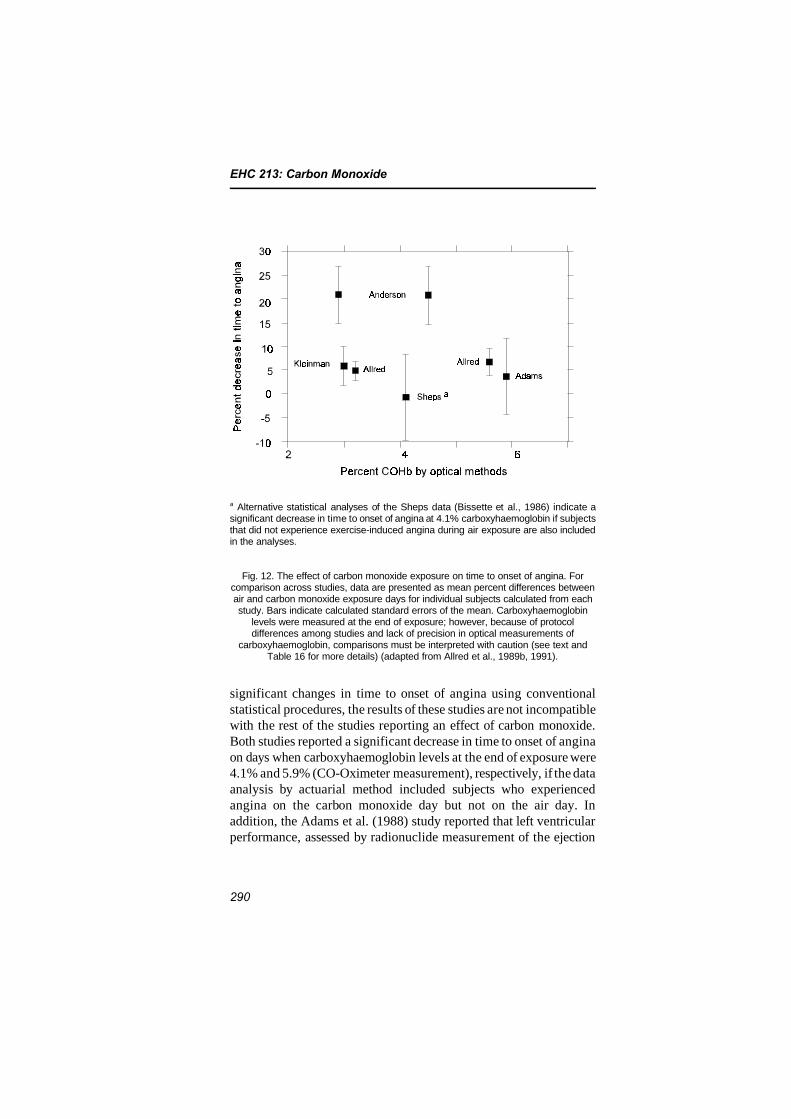
EHC 213: Carbon Monoxide
290
a Alternative statistical analyses of the Sheps data (Bissette et al., 1986) indicate asignificant decrease in time to onset of angina at 4.1% carboxyhaemoglobin if subjectsthat did not experience exercise-induced angina during air exposure are also includedin the analyses.
Fig. 12. The effect of carbon monoxide exposure on time to onset of angina. Forcomparison across studies, data are presented as mean percent differences betweenair and carbon monoxide exposure days for individual subjects calculated from eachstudy. Bars indicate calculated standard errors of the mean. Carboxyhaemoglobin
levels were measured at the end of exposure; however, because of protocoldifferences among studies and lack of precision in optical measurements of
carboxyhaemoglobin, comparisons must be interpreted with caution (see text andTable 16 for more details) (adapted from Allred et al., 1989b, 1991).
significant changes in time to onset of angina using conventionalstatistical procedures, the results of these studies are not incompatiblewith the rest of the studies reporting an effect of carbon monoxide.Both studies reported a significant decrease in time to onset of anginaon days when carboxyhaemoglobin levels at the end of exposure were4.1% and 5.9% (CO-Oximeter measurement), respectively, if the dataanalysis by actuarial method included subjects who experiencedangina on the carbon monoxide day but not on the air day. Inaddition, the Adams et al. (1988) study reported that left ventricularperformance, assessed by radionuclide measurement of the ejection
Effects on Humans
291
fraction, was reduced during submaximal exercise after carbonmonoxide exposure compared with air exposure.
Of particular importance in this group of studies was the fact thatthe multicentre study (Allred et al., 1989a,b, 1991) demonstrated adose–response effect of carboxyhaemoglobin on time to onset ofangina. The only other single study that investigated more than asingle target level of carboxyhaemoglobin was that by Anderson et al.(1973), and their results, based on a smaller number of subjects, didnot show a dose–response relationship for angina.
The time to onset of significant electrocardiogram ST-segmentchanges, which are indicative of myocardial ischaemia in patientswith documented coronary artery disease, is a more objective indicatorof ischaemia than is angina. Allred et al. (1989a,b, 1991) reported a5.1% and 12.1% decrease in time to ST-segment depression at car-boxyhaemoglobin levels of 2.0% and 3.9% (gas chromatographicmeasurement), respectively, measured at the end of exercise. Anadditional measurement of the ST change was made by Allred et al.(1989b) to confirm this response — all the leads showing ST-segmentchanges were summed. This summed ST score was also significantlyaffected by both levels of carboxyhaemoglobin. The significantfinding for the summed ST score indicates that the effect reported fortime to 1-mm ST-segment change was not dependent upon changesobserved in a single electrocardiogram lead.
The differences between the results of these five studies onexercise-induced angina can largely be explained by differences inexperimental methodology and analysis of data and, to some extent,by differences in subject populations and sample size. For example,the Kleinman et al. (1989) study and the Allred et al. (1989a,b, 1991)study used one-tailed P values, whereas the Sheps et al. (1987) andAdams et al. (1988) studies used two-tailed P values. The Allred et al.(1989a,b, 1991) study also used trimmed means (with the two highestand two lowest values deleted) to guard against outliers. If a two-sidedP value was utilized on the time to onset of angina variable observedat the lowest carboxyhaemoglobin level in the Allred et al. (1989a,b,1991) study, it would become 0.054 rather than 0.027, a result thatwould be considered borderline significant. If a two-sided P valuewere used in the Kleinman et al. (1989) study, the difference in timeto onset of angina would lose significance at the P = 0.05 level.
EHC 213: Carbon Monoxide
292
The entry criteria in the Allred et al. (1989a,b, 1991) study weremore rigorous than in the other studies. All subjects were required tohave stable exertional angina and reproducible exercise-induced STdepression and angina. Besides these criteria, all subjects wererequired to have a previous myocardial infarction, angiographicdisease or a positive thallium stress test. In addition, only men werestudied. These strict entry criteria were helpful in allowing theinvestigators to more precisely measure an adverse effect of carbonmonoxide exposure. The protocol for the multicentre study, however,was slightly different from some of the protocols previously reported.On each test day, the subject performed a symptom-limited exercisetest on a treadmill, then was exposed for approximately 1 h to air orone of two levels of carbon monoxide in air before undergoing asecond exercise test. Time to onset of ischaemic electrocardiogramchanges and time to onset of angina were determined for eachexercise test. The percent difference for these end-points from the pre-and post-exposure test was then determined. The results on the 2%target day and then the 4% target day were compared with those onthe control day.
The statistical significance reported at the low-level carbonmonoxide exposure is present only when the differences between pre-and post-exposure exercise tests are analysed. Analysis of only thepost-exposure test results in a loss of statistical significance for the2% carboxyhaemoglobin level. Some of the differences between theresults of this multicentre study and previous studies may be relatedto the fact that the exposure was conducted shortly after patientsexercised to angina. The length of time required for resolution ofexercise-induced ischaemia is not known. However, exercise treadmilltesting of patients with coronary artery disease has been shown toinduce regional wall motion abnormalities of the left ventricle thatpersist for over 30–45 min after exercise when chest pain and electro-cardiogram abnormalities are usually resolved (Kloner et al., 1991).In addition, radionuclide studies in these patients have shown meta-bolic effects of ischaemia to last for more than 1 h after exercise(Camici et al., 1986). Because the effects of ischaemia may have avariable duration, differences between pre- and post-exposure testsmay have been due to effects of carbon monoxide exposure onrecovery from a previous episode of exercise-induced ischaemiarather than detrimental effects only during exercise.
Effects on Humans
293
In conclusion, five key studies have investigated the potential forcarbon monoxide exposure to enhance the development of myocardialischaemia during progressive exercise tests. Despite differencesbetween them, it is impressive that all of the studies identified inFig. 12 show a decrease in time to onset of angina at post-exposurecarboxyhaemoglobin levels ranging from 2.9% to 5.9%. This repre-sents incremental increases of 1.5–4.4% carboxyhaemoglobin frompre-exposure baseline levels. Therefore, there are clearlydemonstrable effects of low-level carbon monoxide exposure inpatients with ischaemic heart disease. The adverse health conse-quences of these types of effects, however, are very difficult to predictin the at-risk population of individuals with heart disease. Thereexists a distribution of professional judgements on the clinicalsignificance of small performance decrements occurring with thelevels of exertion and carbon monoxide exposure defined in these fivestudies. The decrements in performance that have been described atthe lowest levels (#3% carboxyhaemoglobin) are in the range ofreproducibility of the test and may not be alarming to somephysicians. On the other hand, the consistency of the responses intime to onset of angina across the studies and the dose–responserelationship described by Allred et al. (1989a,b, 1991) betweencarboxyhaemoglobin and time to ST-segment changes wouldstrengthen the argument in the minds of other physicians that,although small, the effects could limit the activity of these individualsand affect the quality of their life. In addition, it has been argued byBassan (1990) that 58% of cardiologists believe that recurrent epi-sodes of exertional angina are associated with a substantial risk ofprecipitating a myocardial infarction, a fatal arrhythmia or slight butcumulative myocardial damage.
8.2.2 Effects in individuals with chronic obstructive lung disease
Aronow et al. (1977) studied the effects of a 1-h exposure to110 mg carbon monoxide/m3 (100 ppm) on exercise performance in10 men, aged 53–67 years, with chronic obstructive lung disease. Theresting mean carboxyhaemoglobin levels increased from 1.4% base-line levels to 4.1% after breathing carbon monoxide. The mean exer-cise time until marked dyspnoea significantly decreased (33%) from218 s in the air-control period to 147 s after breathing carbon monox-ide. The authors speculated that the reduction in exercise performancewas due to a cardiovascular limitation rather than respiratory impair-ment.
EHC 213: Carbon Monoxide
294
Only one other study in the literature, by Calverley et al. (1981),looked at the effects of carbon monoxide on exercise performance inolder subjects with chronic lung disease. They evaluated 15 patientswith severe reversible airway obstruction due to chronic bronchitisand emphysema. Six of the patients were current smokers, but theywere asked to stop smoking for 12 h before each study. The distancewalked within 12 min was measured before and after each subjectbreathed 0.02% (230 mg/m3 [200 ppm]) carbon monoxide in air froma mouthpiece for 20–30 min until carboxyhaemoglobin levels were8–12% above their initial levels. A significant decrease in walkingdistance was reported when the mean carboxyhaemoglobin concen-tration reached 12.3%, a level much higher than most of thosereported in studies on healthy subjects.
Thus, although it is possible that individuals with hypoxia dueto chronic lung diseases such as bronchitis and emphysema may besusceptible to carbon monoxide during submaximal exercise typicallyfound during normal daily exercise, these effects have not beenstudied adequately at relevant carboxyhaemoglobin concentrations ofless than 5%.
8.2.3 Effects in individuals with chronic anaemia
An additional study by Aronow et al. (1984) on the effect ofcarbon monoxide on exercise performance in anaemic subjects founda highly significant decrease in work time (16%) induced by anincrease of 1.24% carboxyhaemoglobin. The magnitude of changeseems to be very unlikely, however, even considering the report byEkblom & Huot (1972). The study was double-blind and randomized,but with only 10 subjects. The exercise tests were done on a bicycle inthe upright position with an increase in workload of 25 W every3 min. However, no measure of maximal performance such as bloodlactate was used. The mean maximal heart rate was only 139–146 beats per minute compared with a predicted maximal heart rateof 170 beats per minute for the mean age of the subjects. A subjectrepeating a test within the same day, which was the case in theAronow et al. (1984) study, will often remember the time and workload and try to do the same in the second test. Normally, however,some subjects will increase while others will decrease the time. Thissituation was apparent on the air-control day, with an increasedemonstrated in 6 out of 10 subjects, despite the high reproducibilityfor such a soft, subjective end-point. Also, comparing the control tests
Effects on Humans
295
on the air day with the carbon monoxide day, 7 out of 10 subjectsincreased their work time. After carbon monoxide exposure, however,all subjects decreased their time between 29 and 65 s. These dataappear to be implausible given the soft end-point used, when 2–3 ofthe subjects would be expected to increase their time even if therewere a true effect of carbon monoxide.
8.2.4 Arrhythmogenic effects
Until recent years, the literature has been confusing with regardto potential arrhythmogenic effects of carbon monoxide.
Davies & Smith (1980) studied the effects of moderate carbonmonoxide exposure on healthy individuals. Six matched groups ofhuman subjects lived in a closed, environmental exposure chamber for18 days and were exposed to varying levels of carbon monoxide.Standard 12-lead electrocardiograms were recorded during fivecontrol, eight exposure and five recovery days. P-wave changes of atleast 0.1 mV were seen in the electrocardiograms during the carbonmonoxide exposure period in 3 of 15 subjects at 2.4% carboxyhaemo-globin and in 6 of 15 subjects at 7.1% carboxyhaemoglobin comparedwith 0 of 14 at 0.5% carboxyhaemoglobin. The authors felt that car-bon monoxide had a specific toxic effect on the myocardium in addi-tion to producing a generalized decrease in oxygen transport to tissue.
Several methodological problems create difficulties of inter-pretation for this study. The study design did not use each subject ashis own control. Thus, only one exposure was conducted for eachsubject. Half of the subjects were tobacco smokers who were requiredto stop smoking, and certainly some of the electrocardiogram changescould have been due to the effects of nicotine withdrawal. Althoughthe subjects were deemed to be normal, no screening stress tests wereperformed to uncover latent ischaemic heart disease or propensity toarrhythmia. Most importantly, no sustained arrhythmias ormeasurable effects on the conduction system were noted by theauthors. If P-wave changes of clinical significance are representativeof a toxic effect of carbon monoxide on the atrium, then an effect onconduction of arrhythmias should be demonstrated.
Knelson (1972) reported that 7 of 26 individuals aged 41–60 years had abnormal electrocardiograms after exposure to 110 mgcarbon monoxide/m3 (100 ppm) for 4 h (carboxyhaemoglobin levels
EHC 213: Carbon Monoxide
296
of 5–9%). Two of them developed arrhythmias. No further detailswere given regarding specifics of these abnormalities. Among12 younger subjects aged 25–36 years, all electrocardiograms werenormal.
Hinderliter et al. (1989) reported on effects of low-level carbonmonoxide exposure on resting and exercise-induced ventriculararrhythmias in patients with coronary artery disease and no baselineectopy. They studied 10 patients with ischaemic heart disease and noectopy according to baseline monitoring. After an initial trainingsession, patients were exposed to air, 110 mg carbon monoxide/m3
(100 ppm) or 230 mg carbon monoxide/m3 (200 ppm) on successivedays in a randomized, double-blinded crossover fashion. Venouscarboxyhaemoglobin levels after exposure to 110 and 230 mg carbonmonoxide/m3 (100 and 200 ppm) averaged 4% and 6%, respectively.Symptom-limited supine exercise was performed after exposure. Eightof the 10 patients had evidence of exercise-induced ischaemia —angina, ST-segment depression or abnormal left ventricular ejectionfraction response — during one or more exposure days. Ambulatoryelectrocardiograms were obtained for each day and were analysed forarrhythmia frequency and severity. On air and carbon monoxideexposure days, each patient had only 0–1 ventricular premature beatsper hour in the 2 h prior to exposure, during the exposure period,during the subsequent exercise test and in the 5 h following exercise.The authors concluded that low-level carbon monoxide exposure isnot arrhythmogenic in patients with coronary artery disease and noventricular ectopy at baseline.
The results of low-level carbon monoxide exposure on patientswith higher levels of ectopy were reported by the same investigators(Sheps et al., 1990, 1991). The frequency of a single ventricularpremature depolarization per hour was significantly greater after car-bon monoxide exposure producing 6% carboxyhaemoglobin (167.72 ±37.99) compared with exposure to room air (127.32 ± 28.22,P = 0.03) and remained significant when adjusted for baselineventricular premature depolarization levels for all subjects regardlessof ventricular premature depolarization frequency category. Duringexercise, the mean number of multiple ventricular premature depolari-zations per hour was greater after carbon monoxide exposure produc-ing 6% carboxyhaemoglobin (9.59 ± 3.70) compared with exposureto room air (3.18 ± 1.67, P = 0.02) and remained significant after
Effects on Humans
297
adjustment for baseline multiple ventricular premature depolarizationlevels and when all subjects were included regardless of ventricularpremature depolarization frequency category. The authors concludedthat the number and complexity of ventricular arrhythmias increasesignificantly during exercise after carbon monoxide exposures produc-ing 6% carboxyhaemoglobin compared with room air exposures, butnot after carbon monoxide exposures producing 4% carboxyhaemo-globin. Because statistically significant effects were shown onlyduring the exercise period, however, these reported changes are likelyoccurring at a lower carboxyhaemoglobin level. In fact, the carboxy-haemoglobin levels during exercise were 1.4% on the air exposureday, 3.7% on the 4% carboxyhaemoglobin target exposure day and5.3% on the 6% carboxyhaemoglobin target exposure day, reflectingthe mean values of the pre- and post-exercise levels. Analysis of dose–response relationships could not be carried out in this study, makingit more difficult to determine the strength of the evidence for theeffects of carbon monoxide on arrhythmia. In this study, the amountof arrhythmia produced by carbon monoxide exposure was notcorrelated with measured variables of angina (e.g., time to ST-segment depression and time to angina) or with the clinicaldescriptors of disease status or medication usage.
Dahms et al. (1993) also studied the effects of low-level carbonmonoxide exposure in patients with myocardial ischaemia and aminimum of 30 ventricular ectopic beats over a 20-h period. In total,28 subjects were exposed in a randomized double-blind fashion toeither room air or sufficient carbon monoxide for 1 h to elevatecarboxyhaemoglobin levels to 3% and 5%. The frequency of singleventricular ectopic beats at rest was 115 ± 28 in room air, 121 ± 31 at3% carboxyhaemoglobin and 94 ± 23 at 5% carboxyhaemoglobin.Exposure to carbon monoxide had no additional effect over exercise-induced increases in the frequency of single or multiple ectopic beats.The amount of arrhythmia was not related to the severity of myo-cardial ischaemia during normal daily activity.
There are important clinical differences in the patients studiedby Sheps et al. (1990) and Dahms et al. (1993) that may account forthe different results obtained with exercise. In the Dahms et al. (1993)study, the percentage of patients with $50 ventricular ectopic beatsper hour was significantly greater and ventricular function of thepatients was significantly worse than in the Sheps et al. (1990) study;
EHC 213: Carbon Monoxide
298
however, the myocardial ischaemia, as indicated by exercise-inducedangina or ischaemic ST-segment depression, was greater in thepatients studied by Sheps et al. (1990), and a greater percentage ofthem were taking $-adrenergic blocking drugs.
The effects of low-level carbon monoxide exposure on exercise-induced ventricular arrhythmia in patients with coronary arterydisease and baseline ectopy are dependent on their clinical status. Inmore severely compromised individuals, exposures to carbonmonoxide that produce 6% carboxyhaemoglobin (but not lowercarboxyhaemoglobin levels) have been shown to significantly increasethe number and complexity of arrhythmias.
8.2.5 Effects on coronary blood flow
The effects of breathing carbon monoxide on myocardial functionin patients with and without coronary heart disease have beenexamined by Ayres et al. (1969, 1970, 1979). Acute elevation of car-boxyhaemoglobin from 0.98% to 8.96% by a bolus exposure usingeither 1100 mg carbon monoxide/m3 (1000 ppm) for 8–15 min or57 000 mg/m3 (50 000 ppm) for 30–45 s caused a 20% averagedecrease in coronary sinus oxygen tension without a concomitantincrease in coronary blood flow in the patients with coronary arterydisease. Observations in patients with coronary disease revealed thatacute elevation of carboxyhaemoglobin to approximately 9%decreased the extraction of oxygen by the myocardium. However,overall myocardial oxygen consumption did not change significantly,because an increase in coronary blood flow served as a mechanism tocompensate for a lower overall myocardial oxygen extraction. Incontrast, patients with non-coronary disease increased their coronaryblood flow with an insignificant decrease in coronary sinus oxygentension as a response to increased carboxyhaemoglobin. The coronarypatients also switched from lactate extraction to lactate production.Thus, because of their inability to increase coronary blood flow tocompensate for the effects of increased carboxyhaemoglobin, a poten-tial threat exists for patients with coronary heart disease who inhalecarbon monoxide.
Although the coronary sinus PO2 dropped only slightly in this
study (reflecting average coronary venous oxygen tension), it iscertainly possible that, in areas beyond a significant coronary arterialstenosis, tissue hypoxia might be precipitated by very low tissue PO2
Effects on Humans
299
values. Tissue hypoxia might be further exacerbated by a coronary-steal phenomenon whereby increased overall coronary flow divertsflow from areas beyond a stenosis to other normal areas. Therefore,the substrate for the worsening of ischaemia and consequent precip-itation of arrhythmias is present with carbon monoxide exposure.
8.2.6 Relationship between carbon monoxide exposure and risk ofcardiovascular disease in humans
8.2.6.1 Introduction
General population epidemiological studies on the relationbetween carbon monoxide exposure and ischaemic heart disease arenot conclusive. In the USA, early population studies (Goldsmith &Landaw, 1968; Cohen et al., 1969; Hexter & Goldsmith, 1971)suggested an association between atmospheric levels of carbon mon-oxide and increased mortality from cardiovascular disease in LosAngeles, California, but potential confounders were not effectivelycontrolled. In contrast, a study in Baltimore, Maryland (Kuller et al.,1975), showed no association between ambient carbon monoxidelevels and cardiovascular disease or sudden death. A study of emer-gency room visits for cardiovascular complaints in Denver, Colorado(Kurt et al., 1978), showed a relationship with carbon monoxide expo-sure levels, but the correlations were relatively weak, and otherenvironmental factors were not evaluated. These earlyepidemiological data were summarized by Kuller & Radford (1983).They concluded that mortality and morbidity studies have beennegative or equivocal in relating carbon monoxide levels to healtheffects, but studies in human subjects with compromised coronarycirculation support an effect of acute exposure to carbon monoxide atblood levels corresponding to a carbon monoxide exposure level ofabout 20 ppm over several hours. They calculate that, based on healthsurveys, probably over 10 million subjects in the USA are exposed topotentially deleterious levels of carbon monoxide and that perhaps1250 excess deaths related to low-dose environmental carbonmonoxide exposure occur each year.
8.2.6.2 Daily mortality
More recent time-series studies in North and South America andin Europe have also been equivocal in relating day-to-day variationsin carbon monoxide levels with daily mortality. No relationship was
EHC 213: Carbon Monoxide
300
found between carbon monoxide and daily mortality in Los Angeles,California, or Chicago, Illinois (Ito et al., 1995; Kinney et al., 1995;Ito & Thurston, 1996), after adjusting for particulate matter with massmedian aerodynamic diameter less than 10 :m (PM10). Verhoeff et al.(1996) found no relationship between 24-h average carbon monoxideconcentrations and daily mortality in Amsterdam, Netherlands, withor without adjustment for PM10 and other pollutants. Saldiva et al.(1994, 1995) found no association between carbon monoxide anddaily mortality among children or the elderly in San Paulo, Brazil,after adjusting for nitrogen oxides and PM10, respectively. Three otherstudies (Touloumi et al., 1994; Salinas & Vega, 1995; Wietlisbach etal., 1996) showed small, statistically significant relationships betweencarbon monoxide and daily mortality; however, other pollutants (e.g.,total suspended particulates, sulfur dioxide, nitrogen dioxide, blacksmoke) and other environmental variables (e.g., temperature andrelative humidity) were also significant. Further studies and analyseswill be needed to determine if low-level carbon monoxide exposure isactually increasing mortality, particularly in the elderly population,or if carbon monoxide is a surrogate marker for some other mobile-source pollutant.
Touloumi et al. (1994) investigated the association of air pollu-tion with daily all-cause mortality in Athens, Greece, for the years1984 through 1988. Daily mean pollution indicators for sulfurdioxide, black smoke and carbon monoxide were averaged over all theavailable monitoring stations. Auto-regressive models with log-transformed daily mortality as the dependent variable were used toadjust for temperature, relative humidity, year, season, day of weekand serial correlations in mortality. Separate models for log(sulfurdioxide), log(smoke) and log(carbon monoxide) produced statisticallysignificant (P < 0.001) coefficients. Air pollution data lagged by 1 dayhad the strongest association with daily mortality. Multiple regressionmodelling showed that sulfur dioxide and smoke were independentpredictors of mortality, although to a lesser extent than temperatureand relative humidity. The inclusion of carbon monoxide in thismodel did not further improve the association with daily mortality,suggesting that carbon monoxide may be a surrogate marker for othermobile-source pollutants.
Daily mortality results of the European Community multicentreAPHEA (Short-term effects of Air Pollution on Health: a European
Effects on Humans
301
Approach using epidemiologic time-series data) study (Touloumi etal., 1996) in Athens for the years 1987 through 1991 show that for 8-h carbon monoxide concentrations in ambient air (median 6.1 mg/m3
[5.3 ppm], mean 6.6 mg/m3 [5.8 ppm] and maximum 24.9 mg/m3
[21.7 ppm]) compiled from three fixed monitoring sites, the relativerisk (RR) of dying from a 10 mg/m3 (8.7 ppm) increase in the dailycarbon monoxide concentration in ambient air is 1.10 (95% confi-dence interval [CI] = 1.05–1.15). The strongest effect was observedduring the winter, when higher levels of sulfur dioxide were observed.This new result has not yet been confirmed in other epidemiologicalstudies. It may be explained by yet unknown health effects of lowlevels of carbon monoxide, by the presence of highly compromisedsusceptible groups in the population or by carbon monoxide beingmerely a surrogate of other combustion-generated air pollutants.
Salinas & Vega (1995) determined the effect of urban airpollution on daily mortality in metropolitan Santiago, Chile, from1988 to 1991. Data on maximum 8-h average carbon monoxide,maximum hourly ozone, daily mean sulfur dioxide, PM10 and PM2.5
(particles with diameter <2.5 :m), and meteorological variables wereobtained from five monitoring stations. Total and respiratory disease-specific deaths were compared, calculating the risk of death bymunicipality and month of the year using age-adjusted standardizedmortality ratios and controlling for socioeconomic status. Daily countsof deaths were regressed using a Poisson model on the pollutants,controlling for temperature and relative humidity. A clear pattern inthe geographic distribution of risk of death was found, both for totalmortality and for disease-specific mortality (e.g., pneumonia, chronicobstructive pulmonary disease, asthma), regardless of socioeconomicand living conditions. The number of deaths was significantlyassociated directly with humidity, carbon monoxide and suspendedparticles and indirectly with temperature when the model included alldays with available data during the 4-year period. The associationsremained significant for those days with fine suspended particle levelsbelow 150 :g/m3.
Wietlisbach et al. (1996) assessed the association between dailymortality and air pollution in three Swiss metropolitan areas ofZurich, Basle and Geneva for the period 1984 through 1989. Dailycounts were obtained for total mortality, mortality for persons 65 yearsof age or older and respiratory and cardiovascular disease mortality.
EHC 213: Carbon Monoxide
302
Daily weather variables and pollution data for total suspendedparticulates, sulfur dioxide, nitrogen dioxide, carbon monoxide andozone were obtained from the respective reference stations. Dailycounts of death were regressed using a Poisson model on thepollutants, controlling for time trends, seasonal factors and weathervariables. A positive, statistically significant association was foundbetween daily mortality and total suspended particulates, sulfurdioxide and nitrogen dioxide. The strongest association was observedwith a 3-day moving average. Somewhat smaller associations wereobserved in each city between mortality in persons 65 years of age orolder and measured carbon monoxide concentrations (mean = 1.1–2.3mg/m3 [1–2 ppm]; maximum = 5–8 mg/m3 [4–7 ppm]). Associationswith ozone were very weak and inconsistent. When all pollutants wereincluded in the model together, the regression coefficients wereunstable and statistically insignificant.
8.2.6.3 Hospital admissions
Two recent studies in the USA (Morris et al., 1995; Schwartz &Morris, 1995), a similar study in Canada (Burnett et al., 1997) andone in Greece (Pantazopoulou et al., 1995) have suggested that day-to-day variations in ambient carbon monoxide concentrations arerelated to cardiovascular hospital admissions, especially for persons65 years of age or over.
A time-series analysis of ambient levels of gaseous air pollutants(carbon monoxide, nitrogen dioxide, sulfur dioxide, ozone) and Medi-care hospital admissions for congestive heart failure was performedfor seven US cities (Chicago, Illinois; Detroit, Michigan; Houston,Texas; Los Angeles, California; Milwaukee, Wisconsin; New York,New York; Philadelphia, Pennsylvania) during the 4-year period from1986 through 1989 by Morris et al. (1995). Maximum daily carbonmonoxide levels (mean ± standard deviation [SD]) ranged from 2.1± 1.1 mg/m3 (1.8 ± 1.0 ppm) in Milwaukee to 6.4 ± 1.9 mg/m3 (5.6 ±1.7 ppm) in New York. The relative risk of admissions associatedwith an 11 mg/m3 (10 ppm) increase in carbon monoxide ranged from1.10 in New York to 1.37 in Los Angeles. All seven cities showedsimilar patterns of increasing admissions with increasing ambientcarbon monoxide concentrations. Approximately 3250 hospitaladmissions for congestive heart failure (5.7% of all such admissions)each year can therefore be attributed to the observed association withcarbon monoxide levels. It is possible, however, that the observed
Effects on Humans
303
association represents the impact of some other, unmeasured pollutantor group of pollutants covarying in time with carbon monoxide.
The association between air pollution and cardiovascular hospitaladmissions for persons aged 65 years or older was examined in theDetroit, Michigan, metropolitan area during the years 1986 through1989 by Schwartz & Morris (1995). Air quality data were availablefor PM10 on 82% and for ozone on 85% of possible days. Data wereavailable for sulfur dioxide and carbon monoxide on all days duringthe study period. The mean PM10 was 48.0 :g/m3, the mean ozonewas 82.0 :g/m3 (41.0 ppb), the mean sulfur dioxide was 66.0 :g/m3
(25.4 ppb) and the mean carbon monoxide was 2.7 mg/m3 (2.4 ppm).A Poisson auto-regressive model was used to analyse the data withdummy variables for temperature and dew point, month, and linearand quadratic time trends. Daily admissions for ischaemic heartdisease were associated with a 32 :g/m3 increase in PM10 (RR =1.018; 95% CI = 1.005–1.032), a 47 :g/m3 (18 ppb) increase in sulfurdioxide (RR = 1.014; 95% CI = 1.003–1.026) and a 1.47 mg/m3
(1.28 ppm) increase in carbon monoxide (RR = 1.010; 95% CI =1.001–1.018); however, both sulfur dioxide and carbon monoxidebecame insignificant after controlling for PM10, whereas PM10
remained significant after controlling for the other pollutants. Dailyadmissions for heart failure were independently associated with a1.28 mg/m3 increase in PM10 (RR = 1.024; 95% CI = 1.004–1.044)and carbon monoxide (RR = 1.022; 95% CI = 1.110–1.034). Ozonewas not a significant risk factor for cardiovascular hospitaladmissions, and no pollutant was a significant risk factor fordysrhythmia admissions.
A number of issues need to be resolved before the results ofMorris et al. (1995) and Schwartz & Morris (1995) can be fullyunderstood. Congestive heart failure is the most common indicationfor hospitalization among adults 65 years of age or over in the USA;however, elderly patients with heart failure have demonstrated highrates of readmission, ranging from 29% to 47%. Behavioural factors(e.g., non-compliance with medication and diet) and social factors(e.g., isolation) frequently contribute to early readmission, suggestingthat many hospital admissions for congestive heart failure could beprevented. Hospital admission for congestive heart failure could alsobe indicated for severe pulmonary oedema, pneumonia or generalizedoedema. Additional information on the admission criteria (e.g.,clinical evidence of acute myocardial ischaemia, oxygen saturation or
EHC 213: Carbon Monoxide
304
symptomatic syncope), on cigarette and tobacco use and on indoorcarbon monoxide exposures is needed.
The relative risks reported by Morris et al. (1995) are small,ranging from 1.10 to 1.37; the city with the highest carbon monoxidelevels (New York) had the lowest relative risk for congestive heartfailure admission. Also, the model without any lag provided thestrongest association, suggesting that cumulative exposure was notimportant. The carbon monoxide concentrations measured by station-ary monitors are also very low; any carboxyhaemoglobin levelsproduced by a 1-h exposure to <11 mg carbon monoxide/m3
(<10 ppm), for example, would be difficult to measure. If cumulativeexposures were important, even 8 h of exposure to 11 mg carbonmonoxide/m3 (10 ppm) with moderate exercise (20 litres/min) wouldbe expected to produce only 1.5% carboxyhaemoglobin. In addition,carbon monoxide data from stationary monitors are not highlycorrelated with personal exposures, and individuals with coronaryheart disease would not be expected to be in locations where carbonmonoxide monitors exist. It is possible that carbon monoxide could bea surrogate for automobile pollution, in general. Carbon monoxide ishighly correlated with particles during the winter months. Particles(PM10) were found to be correlated in the Schwartz & Morris (1995)study, but were not included in the Morris et al. (1995) analysis. Also,particles have previously been shown to be associated with hospitaladmissions for both heart failure and ischaemic heart disease inOntario (Burnett et al., 1995).
Burnett et al. (1997) examined temporal relationships betweenambient air pollutants and hospitalizations among the elderly (persons65 years of age or older) in 10 Canadian cities for the 11-year periodfrom 1981 through 1991. A time-series analysis adjusted for long-term time trends, seasonal and subseasonal variations, and day-of-week effects was used to explore the association betweencardiopulmonary illness and the ambient air pollutants carbonmonoxide, nitrogen dioxide, sulfur dioxide, ozone and coefficient ofhaze. After stratifying for months of the year and adjusting fortemperature, dew point and other pollutants, the log of the daily 1-hmaximum carbon monoxide concentration recorded on the day ofadmission had the strongest and most consistent statistical associationwith hospitalization for congestive heart failure. The relative risk was1.065 (95% CI = 1.028–1.104) for an increase from 1.1 to 3.4 mgcarbon monoxide/m3 (1 to 3 ppm, the 25th and 75th percentiles of the
Effects on Humans
305
exposure distribution). Except for ozone, the other pollutants wereclearly confounded in this analysis; however, carbon monoxide aloneaccounted for 90% of the daily excess hospitalizations attributable tothe entire mix. The authors noted that this relationship may not becausal because of possible misclassification of exposure to carbonmonoxide and the likelihood that carbon monoxide may be acting asa surrogate for pollution from transportation sources in general.
Pantazopoulou et al. (1995) studied the daily number of emer-gency outpatient visits and admissions for cardiac and respiratorycauses to all major hospitals in the greater Athens area during 1988.Concentrations of air pollutants (smoke, carbon monoxide andnitrogen dioxide) were obtained from the Ministry of the Environ-ment. Mean levels of carbon monoxide for all available monitoringstations were 4.5 ± 1.6 (SD) mg/m3 (3.9 ± 1.4 ppm) in winter and3.4 ± 1.0 (SD) mg/m3 (3.0 ± 0.9 ppm) in summer. Multiple linearregression modelling was used to look for statistical relationships,controlling for the potential effects of meteorological and chrono-logical variables, separately for winter and summer. A positive asso-ciation was found between the daily number of emergency admissionsfor cardiac and respiratory causes and all measured pollutants duringthe winter, but not during the summer.
8.2.6.4 Occupational exposures
Early studies of occupational exposure to carbon monoxide(Jones & Sinclair, 1975; Redmond, 1975; Redmond et al., 1979)failed to identify any increased risk of cardiovascular diseaseassociated with carbon monoxide exposure. In a Finnish study(Hernberg et al., 1976; Koskela et al., 1976), the prevalence of anginaamong foundry workers showed an exposure–response relationshipwith regard to carbon monoxide exposure, but no such result wasfound for ischaemic electrocardiogram findings during exercise.
Stern et al. (1981) reported a study performed by NIOSH. Theyinvestigated the health effects of chronic exposure to low concen-trations of carbon monoxide by conducting a historical prospectivecohort study of mortality patterns among 1558 white male motorvehicle examiners in New Jersey, USA. The examiners were exposedto 11–27 mg carbon monoxide/m3 (10–24 ppm). The carboxy-haemoglobin levels were determined in 27 volunteers. The average
EHC 213: Carbon Monoxide
306
carboxyhaemoglobin level before a work shift was 3.3% in the wholegroup, and the post-shift level was 4.7%; these levels were 2.1% and3.7%, respectively, in non-smokers only. The death rates were com-pared with the rates in the US population based on vital statistics. Thecohort demonstrated a slight overall increase in cardiovascular deaths,but a more pronounced excess was observed within the first 10 yearsfollowing employment. The study has several important limitations,however, including the use of historical controls, lack of knowledgeabout smoking habits and the fact that the individuals’ carboxyhaemo-globin levels were not known.
Stern et al. (1988) investigated the effect of occupational expo-sure to carbon monoxide on mortality from arteriosclerotic heartdisease in a retrospective cohort study of 5529 New York City, NewYork, USA, bridge and tunnel officers. Among former tunnel officers,the standardized mortality ratio (SMR) was 1.35 (90% CI =1.09–1.68) compared with the New York City population. Using theproportional hazards model, the authors compared the risk ofmortality from arteriosclerotic heart disease among tunnel workerswith that of the less exposed bridge officers. They found an elevatedrisk in the tunnel workers that declined within as few as 5 years aftercessation of exposure. The 24-h average carbon monoxide level in thetunnel was around 57 mg/m3 (50 ppm) in 1961 and around 46 mg/m3
(40 ppm) in 1968. However, higher values were recorded during rushhours. In 1971, the ventilation was further improved and the officerswere allowed clean air breaks. Although the authors concluded thatcarbon monoxide exposure may play an important role in thepathophysiology of cardiovascular mortality, other factors must betaken into consideration. Mortality from arteriosclerotic heart diseasehas a complex multifactor etiology. The presence of other risk factors,such as cigarette smoke, hypertension, hyperlipidaemia, family historyof heart disease, obesity, socioeconomic status and sedentary living,can all increase the risk of developing coronary heart disease. Inaddition, detailed exposure monitoring was not done in this study.The bridge and tunnel workers were exposed not only to carbonmonoxide but also to other compounds emitted from motor vehicleexhaust and to the noise and stress of their environment. These otherfactors could have contributed to the findings.
Hansen (1989) reported the results of a 10-year follow-up studyon mortality among 583 Danish male automobile mechanics between
Effects on Humans
307
15 and 74 years of age. The number of deaths expected for theautomobile mechanics was compared with those for a similar groupof Danish men employed as carpenters, electricians and other skilledworkers free from occupational exposure to automobile exhaust,petrochemical products, asbestos and paint pigments. The number ofdeaths observed among the automobile mechanics exceeded theexpected number by 21%. Although the increased mortality was notconfined to any single cause of death, the author reported aremarkable excess of deaths attributed to ischaemic heart diseasewhere the standardized mortality ratio was 121 and the95% confidence interval was 102–145. The only other significantcategory of death was that due to external causes (SMR = 131; 95%CI = 113–153). No significant differences were found among theautomobile mechanics for other diseases except for an increase inpancreatic cancer (SMR = 219; 95% CI = 128–351). Exposure tocarbon monoxide and polycyclic aromatic hydrocarbons through theinhalation of automobile exhaust and the handling of solvents and oilsmay have accounted for the difference in ischaemic heart diseasedeaths between the automobile mechanics and the comparison group;however, other occupational exposures or other lifestyle factors, asindicated above, may also have contributed to the findings.
8.2.6.5 Carbon monoxide poisoning
Intoxication with carbon monoxide that induces carboxyhaemo-globin levels around 50–60% is often lethal; however, even levelsaround 20% carboxyhaemoglobin have been associated with death,mainly coronary events, in patients with severe coronary arterydisease. Balraj (1984) reported on 38 cases of individuals dyingimmediately or within a few days following carbon monoxideexposures producing 10–50% carboxyhaemoglobin, usually non-lethallevels of carbon monoxide. All of the subjects had coronary arterydisease, and 29 of them had severe cases. The author concluded thatthe carbon monoxide exposure, resulting in carboxyhaemoglobinlevels between 10% and 30% in 24 cases, triggered the lethal event insubjects with a restricted coronary flow reserve. Similar associationsbetween carbon monoxide exposure and death or myocardialinfarction have been reported by several other authors. Atkins &Baker (1985) reported two cases with 23% and 30% carboxyhaemo-globin, McMeekin & Finegan (1987) reported one case with45% carboxyhaemoglobin, Minor & Seidler (1986) reported one casewith 19% carboxyhaemoglobin and Ebisuno et al. (1986) reported
EHC 213: Carbon Monoxide
308
one case with 21% carboxyhaemoglobin. For a more completediscussion of carbon monoxide poisoning, see section 8.3.
Forycki et al. (1980) described electrocardiogram changes in880 patients treated for acute poisoning. Effects were observed in279 cases, with the most marked changes in cases with carbonmonoxide poisoning. In those, the most common change was a T-wave abnormality; in six cases, a pattern of acute myocardialinfarction was present. Conduction disturbances were also commonin carbon monoxide poisoning, but arrhythmias were less common.
Elsasser et al. (1995) reported that 78 myocardial infarctionpatients with Q-wave infarction had more arrhythmias and highercreatine kinase levels after acute carbon monoxide exposures thatraised carboxyhaemoglobin levels to $5%. The carboxyhaemoglobinconcentration was measured at admission to the coronary care unit ofa university hospital and 4 h later. The authors concluded that carbonmonoxide was associated with a more severe course of acute myo-cardial infarction; however, causation could not be determined.
8.2.6.6 Tobacco smoke
The association between smoking and cardiovascular disease isfully established. Although little is known about the relativeimportance of carbon monoxide compared with other components oftobacco smoke, such as nicotine and polycyclic aromatic hydro-carbons, most researchers consider all of them to be important. Thenicotine component clearly aggravates the decrease in oxygencapacity induced by carbon monoxide through an increase in theoxygen demand of the heart, and polycyclic aromatic hydrocarbonshave been implicated in the atherosclerotic process (Glantz &Parmley, 1991).
Passive smoking exposes an individual to all components in thecigarette smoke, but the carbon monoxide component dominatesheavily, because only 1% or less of the nicotine is absorbed fromsidestream smoke, compared with 100% in an active smoker (Jarvis,1987; Wall et al., 1988). Therefore, exposure to sidestream smokewill be the closest to pure carbon monoxide exposure, even if theresultant levels of carboxyhaemoglobin are low (about 1–2%) (Jarvis,1987). The relationship between passive smoking and increased riskof coronary heart disease is controversial. Early studies on thisrelationship were reviewed in the 1986 report of the Surgeon General
Effects on Humans
309
(Surgeon General of the United States, 1986) and by the US NationalResearch Council (NRC, 1986a). Since that time, the epidemiologicalevidence linking passive smoking exposure to heart disease hasrapidly expanded. The available literature, to date, on the relationshipbetween passive exposure to environmental tobacco smoke in thehome and the risk of heart disease death in the non-smoking spouseof a smoker consists of 19 published reports (Gillis et al., 1984;Hirayama, 1984; Garland et al., 1985; Lee et al., 1986; Svendsen etal., 1987; Helsing et al., 1988; He, 1989; Hole et al., 1989; Kawachiet al., 1989; Sandler et al., 1989; Humble et al., 1990; Butler, 1991;Dobson et al., 1991; La Vecchia et al., 1993; He et al., 1994; Muscat& Wynder, 1995; Steenland et al., 1996; Kawachi et al., 1997) and4 review articles (Glantz & Parmley, 1991; Steenland, 1992; Wells,1994; LeVois & Layard, 1995). All but two of the studies yieldedrelative risks greater than 1.0; however, six studies in men and eightstudies in women had 95% confidence intervals that included 1.0,indicating that the risk of passive smoking for heart disease was notstatistically significant. By combining the studies to improve thepower to detect an effect, Glantz & Parmley (1991) reported acombined relative risk of 1.3 (95% CI = 1.2–1.4) for 10 studies, Wells(1994) reported a combined relative risk of 1.23 (95% CI =1.12–1.35) for 12 studies and LeVois & Layard (1995) reported acombined relative risk of 1.29 (95% CI = 1.18–1.41) for 14 studies.Even though it is impossible to rule out an effect of the othercomponents in sidestream smoke, the data suggest an increase in riskof coronary heart disease associated with prolonged exposure to lowlevels of carbon monoxide.
In a cross-sectional study of 625 smokers aged 30–69, Wald et al.(1973) reported that the incidence of cardiovascular disease washigher in subjects with carboxyhaemoglobin greater than 5% than insubjects with carboxyhaemoglobin below 3%, a relative risk of 21.2(95% CI = 3.3–734.3). Even if all of the subjects were smokers, theassociation between carboxyhaemoglobin and cardiovascular diseasemight be due to the fact that percent carboxyhaemoglobin is ameasure of smoke exposure.
Low to intermediate levels of carboxyhaemoglobin mightinterfere with the early course of an acute myocardial infarction. Theincrease in carboxyhaemoglobin can be due to recent smoking orenvironmental exposure. Mall et al. (1985) reported on a prospective
EHC 213: Carbon Monoxide
310
study in smoking and non-smoking patients with an acute myocardialinfarction who were separated by their baseline carboxyhaemoglobinlevels. Sixty-six patients were studied in total. Thirty-one patientswere found to have a carboxyhaemoglobin level of 1.5%, and 35 werefound to have a level of 4.5%. In the group with elevated carboxy-haemoglobin, more patients developed transmural infarction, but thedifference was not significant. Patients with transmural infarction hadhigher maximum creatine phosphokinase values when carboxyhaemo-globin was over 2%. During the first 6 h after admission to the hospi-tal, these patients needed an antiarrhythmic treatment significantlymore frequently. Differences in rhythm disorders were still present ata time when nicotine, owing to its short half-life, was already elimi-nated. The authors concluded that moderately elevated levels ofcarboxyhaemoglobin may aggravate the course of an acute myocardialinfarction.
8.2.7 Effects of exposure during pregnancy and early childhood
8.2.7.1 Pregnancy
It is thought that carbon monoxide crosses the placenta by simplediffusion and that the concentration of carboxyhaemoglobin in thefetus is dependent on maternal carboxyhaemoglobin concentrations,the rate of fetal carbon monoxide production, the diffusion capacityof the placenta for carbon monoxide and the relative affinity of thehaemoglobin for carbon monoxide (Longo, 1977). Maternal carboxy-haemoglobin levels in non-smokers range between 0.5% and 1.0%and those of fetal blood between 0.7% and 2.5% (Longo, 1970, 1977).Fetal uptake of carbon monoxide takes place more slowly than mater-nal uptake. Following acute exposure, maternal carboxyhaemoglobinlevels reach half the steady-state value in 2 h; in the fetus, on theother hand, steady-state values are not reached until 7 h after theonset of exposure. Final equilibrium is reached 36–48 h after theonset of exposure, and the carboxyhaemoglobin level in fetal blood atthis time is 10% higher than maternal levels due to the increasedaffinity of fetal haemoglobin (Hill et al., 1977; Longo, 1977).
A fairly wide range of neonate and maternal carboxyhaemo-globin levels has been published for humans, probably as a result ofwide differences in cigarette smoking patterns prior to and duringlabour. Maternal smoking during pregnancy exposes the fetus togreater than normal concentrations of carbon monoxide. Mean
Effects on Humans
311
concentrations of 2.0–8.3% carboxyhaemoglobin and 2.4–7.6%carboxyhaemoglobin for maternal and fetal blood, respectively, havebeen reported (Longo, 1970).
In a study by Bureau et al. (1982), the measurement of fetal cordblood in the offspring of cigarette smokers who smoked during labourshowed that fetal carboxyhaemoglobin levels were 2.55 times higherthan in maternal blood. Cord blood averaged 10.1% carboxyhaemo-globin at delivery, whereas maternal blood averaged 5.6% car-boxyhaemoglobin on the mother’s arrival at the hospital and 4.1%carboxyhaemoglobin at delivery. Most of the observations on carbonmonoxide exposure in pregnancy are based upon reports of cases ofaccidental or deliberate maternal carbon monoxide intoxication.These studies provide valuable information on the consequences ofhigh peak carbon monoxide concentrations on pregnancy outcome butsay nothing about the effects of short- or long-term low-level exposureto carbon monoxide.
Desclaux et al. (1951) reported a case of carbon monoxideintoxication in the fifth month of pregnancy where the subject wasunconscious for 3 days. The child was born at term with a birthweight of 3500 g. Encephalography revealed gross ventriculardilatation, and the child was mentally retarded and had generalhypertonia.
Muller & Graham (1995) reviewed eight cases from the literaturein which the mother had been intoxicated with carbon monoxide inpregnancy and delivered living offspring. The common features in theoffspring were psychomotor disturbances and mental retardation. Theauthors presented a case of carbon monoxide intoxication shortlybefore the expected date of delivery. The child was stillborn withcherry red-coloured skin and organs. Fetal blood was 49% saturatedwith carboxyhaemoglobin.
Copel et al. (1982) reported a case of carbon monoxideintoxication with a maternal blood carboxyhaemoglobin level of24.5% in the first trimester of pregnancy. Pregnancy was uncom-plicated until the 38th week, when amniocentesis revealed a greaterthan 3:1 lecithin:sphingomyelin ratio and the presence ofphosphatidyl glycerol; the amniotic fluid was also meconium-stained.The child was delivered prematurely by caesarean section with a birth
EHC 213: Carbon Monoxide
312
weight of 1950 g. The child developed normally and showed no signsof central nervous system damage at 6 months of age.
The association between carbon monoxide exposure and reducedfetal growth was studied by Astrup et al. (1972). Blood carboxy-haemoglobin was measured in 176 smoking and 177 non-smokingpregnant women. Blood carboxyhaemoglobin levels in 97% of non-smokers and 77% of smokers were below 3%; the mean carboxy-haemoglobin concentration in each group was 0.87% and 1.92%,respectively. The average birth weight of the newborns of smokingwomen (2990 g) was lower than that of the newborns of non-smokingwomen (3225 g). No evidence of a dose–effect relationship betweenmaternal blood carboxyhaemoglobin and infant birth weight waspresented, but the correlation coefficient between birth weight and themean carboxyhaemoglobin measurements of each individual wasstatistically significant (P < 0.05). No attempts were made to adjustfor other potential growth-retarding factors in cigarette smoke (e.g.,nicotine), which may also have effects on birth weight and cannot bedisregarded.
There is one case reported in which a 17-year-old healthy femaleof 37 weeks’ gestation was exposed to carbon monoxide while apassenger in a car. The exposure was for two periods of 3 h each andresulted in headache, nausea, vomiting and chest pain; she becameunresponsive while being transferred to hospital. On examination,physical signs were normal except that she was orientated to personand time but not to place. Oxygen partial pressure was 30.5 kPa(229 mmHg), and carboxyhaemoglobin was 47.2%. Results of fetalmonitoring were consistent with acute fetal hypoxia. The patient wastreated with supplemental oxygen immediately and approximately 2 hafter admission to the hospital; hyperbaric oxygen treatment wasinitiated (100% oxygen at 243 kPa [2.4 atm] absolute for 90 min).After treatment, the subject’s carboxyhaemoglobin was 2.4% (withinthe normal range for a pregnant female) and fetal heart rate was140 beats per minute, with normalized beat-to-beat variability. Thepatient was delivered at term of a health female child (3600 g) withApgar scores of 9 at 1 min and 10 at 5 min post-delivery. Thenewborn’s physical condition, including neurological findings, wasnormal, and mother and child were discharged from hospital 2 dayspostpartum. Assessment of the child at 2 and 6 months revealednormal growth and development (Van Hoesen et al., 1989).
Effects on Humans
313
Koren et al. (1991), in a multicentre prospective study of fetaloutcome following accidental carbon monoxide poisoning in preg-nancy, reported on a total of 40 pregnancies, which included 3 twinbirths, 1 termination of pregnancy and 4 ongoing pregnancies.Exposure to carbon monoxide occurred in the first trimester in12 pregnancies, the second trimester in 14 pregnancies and the thirdtrimester in 14 pregnancies. The analyses were based on 38 babies.The trimester at the time of carbon monoxide exposure did not affectmean birth weight (3.4 ± 0.5 kg, excluding the twin births andoffspring of mothers who smoked $20 cigarettes a day). The exposurewas stratified into grades based on clinical symptoms and signs andcarboxyhaemoglobin levels where available. Adverse fetal outcomeoccurred only after grade 4 or 5 poisoning (carboxyhaemoglobin$21%). There were two grade 5 cases; one resulted in stillbirth at29 weeks of gestation (26% carboxyhaemoglobin, treated with high-flow oxygen), and the second resulted in fetal death at term followedby maternal death. Of the three cases of grade 4 severity (whichincluded the case described by van Hoesen et al., 1989), two weretreated with hyperbaric oxygen, and their infants were developingwell at 1 year of age. The third case was exposed to carbon monoxideat 23 weeks of gestation and had a carboxyhaemoglobin of 25% 2 hafter the exposure. She was treated with high-flow oxygen for 2 h;although she was delivered of a normal infant at term (birth weight4 kg), the child at 8 months of age had poor head control anddevelopmental delay, which were judged to be compatible with post-anoxic encephalopathy. One patient with grade 2 poisoning at 30weeks’ gestation (carboxyhaemoglobin 13.8%) was treated with high-flow oxygen for 7 h followed by hyperbaric oxygen for 2 h. Shedelivered a 3.2-kg infant, who was developing normally at 3 weeks ofage. The other grade 2 case was exposed at 20 weeks’ gestation, andthe baby, born at 25 weeks, had respiratory distress syndrome andjaundice; at 3 months of age, the infant was developing appropriately.All of the infants of mothers with grade 1 symptoms (10 treated withhigh-flow oxygen, 19 untreated) developed normally.
In a prospective study designed to assess hyperbaric oxygentolerance in pregnancy, 44 pregnant women who had been exposed tocarbon monoxide were treated with hyperbaric oxygen (203 kPa[2 atm] absolute) for 2 h followed by 4 h of normobaric oxygen within5.3 ± 3.7 h of the exposure, irrespective of the clinical severity of theintoxication and the stage of the pregnancy. Six patients were lost to
EHC 213: Carbon Monoxide
314
follow-up, two sustained spontaneous abortion and one elected toterminate the pregnancy for reasons unrelated to the intoxication.Thirty-four women gave birth to normal newborns, and one gave birthto a child with Down’s syndrome. There was no evidence that the useof hyperbaric oxygen was implicated in either of the spontaneousabortions. It was concluded that hyperbaric oxygen treatment may beused in pregnant women acutely poisoned with carbon monoxide(Elkharrat et al., 1991).
A prospective study was carried out in Lille, France, in whichevery pregnant woman admitted to the hyperbaric oxygen unitbetween January 1983 and December 1989 with carbon monoxidepoisoning was evaluated. According to the protocol of the unit, everypatient was treated with hyperbaric oxygen. Follow-up data wereobtained on 86 of 90 women; when compared with a matchedpopulation of carbon monoxide-poisoned non-pregnant women, nodifference was observed in source of carbon monoxide, clinicalseverity, carboxyhaemoglobin or plasma bicarbonate concentrations.Short-term complications were more common in the pregnant womencompared with the matched group, but long-term outcome did notdiffer. In five cases, carbon monoxide intoxication led to fetal death(a fourfold increase in relative risk), 77 women (89.5%) had asuccessful pregnancy, and the prematurity, fetal hypotrophy andmalformation rate were the same as those of the general population.It was concluded that although carbon monoxide intoxication inducedan increase in the short-term maternal complication rate and the fetaldeath rate, the long-term outcome for both the mother and infantwhere hyperbaric oxygen had been used was not different from thatof the general population (Mathieu et al., 1996a).
In summary, carbon monoxide is transferred slowly to the fetus,and fetal haemoglobin has a higher affinity for carbon monoxide thandoes that of the adult. The oxygen dissociation curve is shifted to theleft, making the fetal hypoxia more pronounced than the maternaltissue hypoxia. The severity of fetal intoxication cannot be assessed bythe maternal state. There is a difference between the rate of formationof carboxyhaemoglobin in the mother’s and the fetus’s blood.Moreover, in comparison with the mother’s dissociation curve, thecurve in the fetus is shifted to the right. These two mechanisms resultin a significant delay in elimination of carbon monoxide from thefetus, thus prolonging exposure. High doses of carbon monoxide are
Effects on Humans
315
without doubt able to cause fetal death (Norman & Halton, 1990),developmental disorders and reduced fetal growth. The dose–responsefunctions for these effects are, however, not known, and no safe levelof exposure has been defined based upon scientific data. Case reportshave generally been based upon high and toxic doses of carbonmonoxide. There is a lack of follow-up studies on women with lowand chronic carbon monoxide exposure, especially on central nervoussystem development in their children.
8.2.7.2 Reduced birth weight
Studies relating human carbon monoxide exposure from ambientsources or cigarette smoking to reduced birth weight have frequentlyfailed to take into account all sources of carbon monoxide exposure.Alderman et al. (1987), for example, studied the relationship betweenbirth weight and maternal carbon monoxide exposure based uponneighbourhood ambient carbon monoxide data obtained from station-ary air monitoring sites in Denver, Colorado, USA. They failed toshow a relationship between these factors, but they also failed tocontrol for maternal cigarette smoking or possible occupationalexposures to carbon monoxide. Carboxyhaemoglobin measurementswere not made among either the mothers or their offspring to estimatenet exposure levels. A similar design problem is found in the study ofWouters et al. (1987), in which cord blood carboxyhaemoglobin andbirth weight were correlated. The authors reported a significantcorrelation between cigarette smoking and reduced birth weight, butno correlation between cord blood carboxyhaemoglobin and birthweight. Such data might be interpreted to mean that carbon monoxideis not the component in cigarette smoke responsible for reduced birthweight. Such a conclusion appears to be unjustified based uponWouters et al. (1987), because carboxyhaemoglobin is a good estimateof recent carbon monoxide exposure only. Thus, it may indicate onlyhow recently women in this study smoked their last cigarette beforedelivery of the child rather than estimating smoking rates or historythroughout pregnancy.
Other studies have related indirect exposure to smoke inpregnancy with reduced birth weights. Martin & Bracken (1986)showed an association between passive smoking (exposure to cigarettesmoke for at least 2 h per day) and reduced birth weight. Unfor-tunately, sidestream smoke contains significant nicotine as well as
EHC 213: Carbon Monoxide
316
carbon monoxide, so it is not possible to relate this effect to carbonmonoxide exposure.
Mochizuki et al. (1984) attempted to evaluate the role ofmaternal nicotine intake in reduced birth weight and presentedevidence of possibly impaired utero-placental circulation amongsmokers. These changes were not related specifically to the nicotinecontent of the cigarettes and failed, moreover, to take into account thepossible synergistic effects between reduced perfusion that might haveresulted from the vasoconstrictive effects of nicotine and the reducedoxygen availability that might have resulted from carbon monoxideexposure. As noted in the section of this report that deals with theeffects of high altitude (section 8.2.8), many of the outcomes ofmaternal carbon monoxide exposure are also observed in offspring ofwomen living at high altitude. These include reduced birth weight,increased risk of perinatal mortality and increased risk of placentalabnormalities. Limited data exist on the possibility of increased riskof carbon monoxide exposure to the fetus being carried at highaltitude. Such findings are considered in the section on high altitude.
8.2.7.3 Sudden infant death syndrome
There have been a number of studies linking maternal cigarettesmoking with sudden infant death syndrome (Schoendorf & Kiely,1992; Mitchell et al., 1993; Scragg et al., 1993; Klonoff-Cohen et al.,1995; Blair et al., 1996; Hutter & Blair, 1996), but it is uncertainwhat the role of carbon monoxide might be in such a relationship.
It has been suggested that carbon monoxide may be a causativefactor in sudden infant death syndrome. Hoppenbrouwers et al. (1981)reported a statistical association between the frequency of suddeninfant death syndrome and levels of several airborne pollutants,including carbon monoxide, sulfur dioxide, nitrogen dioxide andhydrocarbons. Sudden infant death syndrome was reported morecommonly in the winter, at a time when the burning of fossil fuels forheating would be greatest. It is interesting to note that there is a phaselag of approximately 7 weeks between the increase in pollutant levelsand the increase of sudden infant death syndrome. Furthercorrelations were obtained between sudden infant death syndrome andthe predicted level of carbon monoxide and lead for the child’s birthmonth and between sudden infant death syndrome and the level ofpollution at the reporting station closest to the infant’s home. These
Effects on Humans
317
correlations are not compelling without more information on themethods by which other possible risk factors were controlled inmaking the geographical correlations. Although it is technicallydifficult, it would be very useful to obtain carboxyhaemoglobin levelsclose to the time of death in sudden infant death syndrome victims, asthis would greatly assist in determining the incidence of elevatedcarbon monoxide exposure in such cases.
The current data from human children suggesting a link betweenenvironmental carbon monoxide exposures and sudden infant deathsyndrome are weak, but further study should be encouraged.
8.2.7.4 Neurobehavioural effects
Behaviour is an essential function of the nervous system, andabnormalities in this outcome can be diagnostic for particular neuro-logical disorders or for nervous system dysfunction. Because at pres-ent no data are available on behavioural changes of children withchronically elevated carboxyhaemoglobin, this section discusses onlythe findings of acute studies. However, these studies are not adequatefor evaluating the dose–effect relationship to be used in ambient airstandard setting. Because carboxyhaemoglobin levels are almostalways determined at hospital admission time, they will be lower thanthe carboxyhaemoglobin levels at exposure time. Therefore, except forthe confirmation of carbon monoxide inhalation, it is difficult to usethese carboxyhaemoglobin levels to estimate severity of poisoning attime of exposure.
Crocker & Walker (1985) reported on the consequences of acutecarbon monoxide exposure in 28 children, 16 of which had carboxy-haemoglobin levels over 15% and were considered to have had“potentially toxic” carboxyhaemoglobin levels. These children werebetween the ages of 8 months and 14 years. The authors reportednausea, vomiting, headache, lethargy and syncope to be the mostcommon signs and symptoms. A very limited follow-up investigationwas performed with these children, so no conclusions can be drawnfrom this work concerning persisting effects. In addition to very largedifferences in the nature (dose and duration) of exposure, the extremevariability in patient age limits the potential value of the datapresented in this work. The absence of any reports from childrenhaving carboxyhaemoglobin levels of #15% (a very high carboxy-haemoglobin level) is regrettable, because these are the children one
EHC 213: Carbon Monoxide
318
must study to develop an understanding of the relationship betweendose and effect for the purpose of setting standards for ambient air.
Klees et al. (1985) conducted a more comprehensive study of theconsequences of childhood carbon monoxide exposure on subsequentbehavioural development. They reported that the age at whichexposure occurred, its severity and also the child’s intellectual levelat the time of exposure also play a role in the outcome.
The authors suggested that the severity of neurobehaviouraleffects depends on the exposure period when it occurs at a criticaltime of the development of certain neurobehavioural functions.Subjects who had higher intellectual function prior to accidentalexposure also appeared to fare better after carbon monoxide exposure.However, the authors stressed that long-term perceptual andintellectual consequences of carbon monoxide exposure may occurthat are not well identified in short-term cursory examinations,because certain invisible visuo-spatial disorders persisting for yearsmay seriously impair adaptive functioning of the child. Because of thedifficulty of interpreting carboxyhaemoglobin levels on hospitaladmission, the authors adopted the following criteria to evaluateintensity of intoxication: (1) light: hypotonia, vertigo, vomiting, etc.;(2) medium: loss of consciousness (short period); (3) severe: any ofthe previous symptoms followed by coma. Of 14 children followed upfor 2–11 years after intoxication, only 1 (medium) showed no sequelae(despite carboxyhaemoglobin levels of 42% on admission to hospitalat the age of 9 years 10 months). Seven children (four light, threemedium) had impairment of visual memory and concentration, butnormal IQ scores. Six children (two light, one medium, three severe)who had serious learning disorders did not have more severe carbonmonoxide exposures as judged from their carboxyhaemoglobin levels.They include several cases where exposures did occur at a young ageand children who had psychological difficulties prior to carbonmonoxide exposure. This study leaves some question concerning therelative vulnerability of children to carbon monoxide as a function oftheir age, because several of the youngest children did make fullrecovery, whereas others did not. It seems likely that the child’s agemay have an influence, as well as the promptness of hospitalizationand efficacy of treatment. Further study of the outcomes of childhoodcarbon monoxide exposures will be useful in determining whetherthere are differences with respect to vulnerability to carbon monoxidelevel.
Effects on Humans
319
Venning et al. (1982) reported on a case of acute carbon monox-ide poisoning in a 13-week-old baby who had profoundly elevatedcarboxyhaemoglobin levels (60% 2 h after removal from the auto-mobile in which she had been accidentally exposed to carbonmonoxide). Her parents had much lower carboxyhaemoglobin values,although this may reflect differences in concentration of carbonmonoxide inhaled. The child was reported to be unconscious for 48 h,to go through convulsions over the next 18 days, but to show recoveryfrom “minor neurological abnormalities” by 6 weeks later.
8.2.8 High-altitude effects
8.2.8.1 Introduction
Although there are many studies comparing and contrastinginhaling carbon monoxide with exposure to altitude, there arerelatively few reports on the effects of inhaling carbon monoxide ataltitude. There are data to support the possibility that the effects ofthese two hypoxia episodes are at least additive. These data wereobtained at carbon monoxide concentrations that are too high to havemuch significance for regulatory concerns. There are also data thatindicate decrements in visual sensitivity and flicker fusion frequencyin subjects exposed to carbon monoxide (5–10% carboxyhaemoglobin)at higher altitudes. These data, however, are somewhat controversial.
There are even fewer studies of the long-term effects of carbonmonoxide at high altitude. These studies generally indicate fewchanges at carbon monoxide concentrations below 110 mg/m3
(100 ppm) and altitudes below 4570 m. A provocative study byMcDonagh et al. (1986) suggests that the increase in ventricularcapillarity seen with altitude exposure may be blocked by carbonmonoxide. The fetus may be particularly sensitive to the effects ofcarbon monoxide at altitude; this is especially true with the highlevels of carbon monoxide associated with maternal smoking.
Precise estimates of the number of people exposed to carbonmonoxide at high altitude are not readily available. As of 1980,however, more than 4.2 million people (T.K. Lindsey, letter to Dr. J.McGrath dated 4 July 1989, Forestville, Maryland, USA) were livingat altitudes in excess of 1525 m. Moreover, estimates obtained fromseveral US states with mountainous regions (i.e., California, Nevada,
EHC 213: Carbon Monoxide
320
Hawaii and Utah) indicate that more than 35 million tourists maysojourn in high-altitude areas during the summer and winter months.
The potential effects on human health of inhaling carbonmonoxide at high altitudes are complex. Whenever carbon monoxidebinds to haemoglobin, it reduces the amount of haemoglobin availableto carry oxygen. People at high altitudes already live in a state ofhypoxaemia, however, because of the reduced PO2
in the air. Carbonmonoxide, by binding to haemoglobin, intensifies the hypoxaemiaexisting at high altitudes by further reducing transport of oxygen tothe tissues. Hence, the effects of carbon monoxide and high altitudeare usually considered to be additive.
This consideration does not take into account the fact that withinhours of arrival at high altitude, certain physiological adjustmentsbegin to take place. Haemoconcentration occurs, and the increasedhaemoglobin concentration offsets the decreased oxygen saturationand restores oxygen concentration to pre-ascent levels. Consequently,the simple additive model of carboxyhaemoglobin and altitude hypox-aemia may be valid only during early altitude exposure.
The visitor newly arrived to higher altitudes may be at greaterrisk from carbon monoxide than the adapted resident, however,because of a non-compensated respiratory alkalosis from hyper-ventilation, lower arterial haemoglobin saturation without a compen-satory absolute polycythaemia (therefore greater hypoxaemia) andhypoxia-induced tachycardia.
Several factors tend to exacerbate ambient carbon monoxidelevels at high altitude (Kirkpatrick & Reeser, 1976). For example,carbon monoxide emissions from automobiles are likely to be higherin mountain communities. Early studies on automobile emissionsshowed that automobiles tuned for driving at 1610 m emit almost1.8 times more carbon monoxide when driven at 2440 m.Automobiles tuned for driving at sea level emit almost 4 times morecarbon monoxide when driven at 2440 m. Moreover, automobileemissions are increased by driving at reduced speeds, along steepgrades and under poor driving conditions. Therefore, large influxesof tourists driving automobiles tuned for sea level conditions intohigh-altitude resort areas may drastically increase pollutant levels ingeneral, and carbon monoxide levels in particular (NRC, 1977).
Effects on Humans
321
Although emission data comparing sea level and high-altitudeconditions for the current automobile fleet are not yet available, newerautomobile engine technologies should significantly reduce carbonmonoxide emissions in general, as well as carbon monoxide emissionsat high altitude. Heating devices (space heaters and fireplaces) usedfor social effect, as well as warmth, are a second factor contributingto carbon monoxide emissions in mountain resort areas. Finally,population growth in mountain areas is concentrated along valleyfloors; this factor, combined with the reduced volume of air availablefor pollutant dispersal in valleys, causes pollutants, including carbonmonoxide, to accumulate in mountain valleys.
8.2.8.2 Carboxyhaemoglobin formation
The effects of high altitude on carboxyhaemoglobin formationhave been considered in a theoretical paper by Collier & Goldsmith(1983). Transforming and rearranging the CFK equation (Coburn etal., 1965), these workers derived an equation expressing carboxy-haemoglobin in terms of endogenous and exogenous sources of carbonmonoxide. According to this relationship, a given partial pressure ofcarbon monoxide will result in a higher percent carboxyhaemoglobinat high altitudes (where PO2
is reduced). Thus, Collier & Goldsmith(1983) calculated an incremental increase in carboxyhaemoglobin ataltitude even in the absence of inhaled carbon monoxide that is mostlikely due to endogenous production of carbon monoxide (seeTable 17).
8.2.8.3 Cardiovascular effects
There are studies comparing the cardiovascular responses tocarbon monoxide with those to high altitude, but there are relativelyfew studies of the cardiovascular responses to carbon monoxide athigh altitude. Forbes et al. (1945) reported that carbon monoxideuptake increased during 6 min of exercise of varying intensity on abicycle ergometer at an equivalent altitude of 4875 m. The increasedcarbon monoxide uptake was caused by altitude hyperventilationstimulated by decreased arterial oxygen tension and not by diminishedbarometric pressure.
Pitts & Pace (1947) reported that pulse rate increased in responseto the combined stress of high altitude and carbon monoxide. Thesubjects were 10 healthy men who were exposed to simulated altitudes
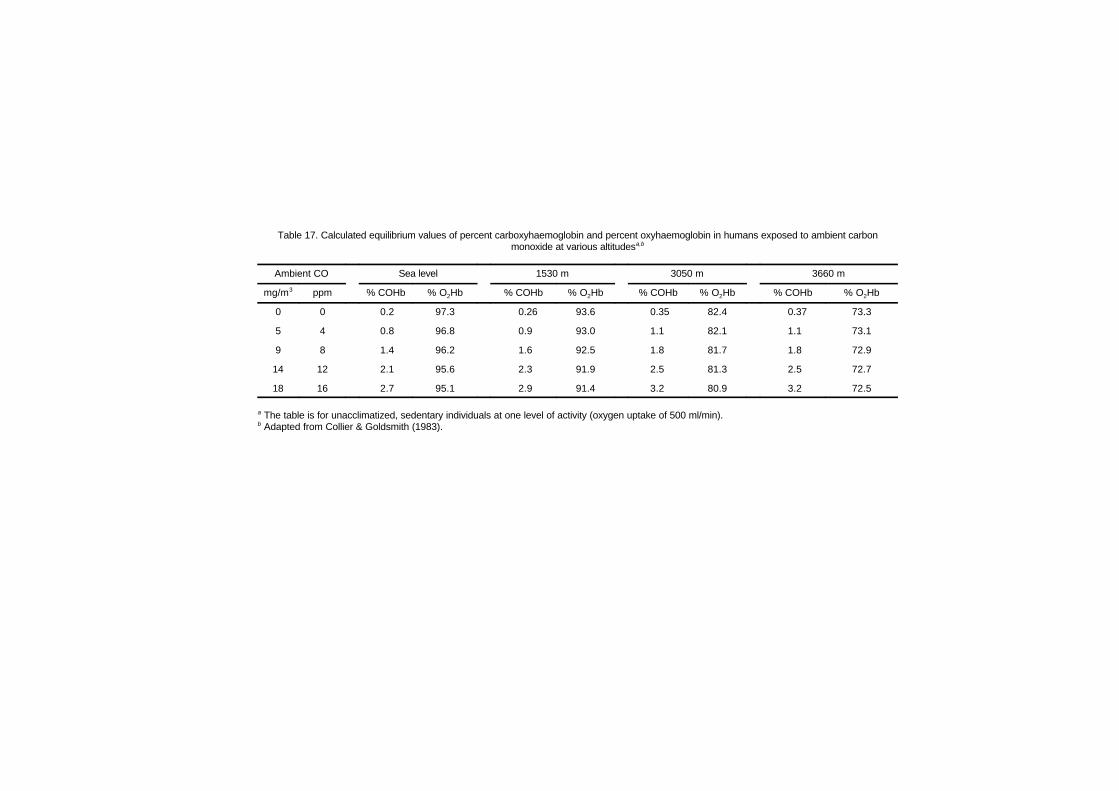
Table 17. Calculated equilibrium values of percent carboxyhaemoglobin and percent oxyhaemoglobin in humans exposed to ambient carbonmonoxide at various altitudesa,b
Ambient CO Sea level 1530 m 3050 m 3660 m
mg/m3 ppm % COHb % O2Hb % COHb % O2Hb % COHb % O2Hb % COHb % O2Hb
0 0 0.2 97.3 0.26 93.6 0.35 82.4 0.37 73.3
5 4 0.8 96.8 0.9 93.0 1.1 82.1 1.1 73.1
9 8 1.4 96.2 1.6 92.5 1.8 81.7 1.8 72.9
14 12 2.1 95.6 2.3 91.9 2.5 81.3 2.5 72.7
18 16 2.7 95.1 2.9 91.4 3.2 80.9 3.2 72.5
a The table is for unacclimatized, sedentary individuals at one level of activity (oxygen uptake of 500 ml/min). b Adapted from Collier & Goldsmith (1983).
Effects on Humans
323
of 2135, 3050 and 4570 m and inhaled 3400 or 6900 mg carbon mon-oxide/m3 (3000 or 6000 ppm) to obtain carboxyhaemoglobin levels of6% or 13%, respectively. The mean pulse rate during exercise and themean pulse rate during the first 5 min after exercise were correlatedwith and increased with the carboxyhaemoglobin concentration andsimulated altitude. The authors concluded that the response to a 1%increase in carboxyhaemoglobin level was equivalent to that obtainedby raising a normal group of men 100 m in altitude. This relationshipwas stated for a range of altitudes from 2135 to 3050 m and forincreases in carboxyhaemoglobin up to 13%.
Weiser et al. (1978) studied the effects of carbon monoxide onaerobic work at 1610 m in young subjects rebreathing from a closed-circuit system containing a bolus of 100% carbon monoxide untilcarboxyhaemoglobin levels reached 5%. They reported that this levelof carboxyhaemoglobin impaired exercise performance at highaltitude to the same extent as that reported at sea level (Horvath et al.,1975). Because these subjects were Denver, Colorado, USA, residentsand were fully adapted to this altitude, however, they would have hadan arterial oxygen concentration the same as at sea level (about 20 mloxygen/dl). Hence, 5% carboxyhaemoglobin would lower arterialoxygen concentration about the same amount at both altitudes andimpair work performance at altitude to the same extent as at sea level.In the Weiser et al. (1978) study, breathing carbon monoxide duringsubmaximal exercise caused small but significant changes in cardio-respiratory function; the working heart rate increased, and post-exercise left ventricular ejection time did not shorten to the sameextent as when filtered air was breathed. Carbon monoxide exposurelowered the anaerobic threshold and increased minute ventilation atwork rates heavier than the anaerobic threshold due to increasedblood lactate levels.
Wagner et al. (1978) studied young smokers and non-smokerswho exercised at 53% of O2
max at 101.3 and 69.7 kPa (760 and523 torr). Carboxyhaemoglobin levels were raised to 4.2%. While ataltitude with these elevated carboxyhaemoglobin levels, non-smokersincreased their cardiac output and decreased their arterial–mixedvenous oxygen differences. Smokers did not respond in a similarmanner. Smokers, with their initial higher haemoglobin concentra-tions, may have developed some degree of adaptation to carbonmonoxide and/or high altitude.
EHC 213: Carbon Monoxide
324
In a complex study involving four altitudes ranging from sealevel up to 3050 m and four ambient carbon monoxide concentrations(up to 170 mg/m3 [150 ppm]), Horvath et al. (1988a,b) evaluatedcarboxyhaemoglobin levels during a maximal aerobic capacity test.They concluded that O2
max values determined in men and womenwere only slightly diminished as a result of increased ambient carbonmonoxide. Carboxyhaemoglobin concentrations attained at maximumwere highest at 55 m (4.42%) and lowest at 3050 m (2.56%) whilebreathing 170 mg carbon monoxide/m3 (150 ppm). This wasattributed to the reduced partial pressure of carbon monoxide at highaltitude. No additional effects that could be attributed to the combinedexposure to high altitude and carbon monoxide were found.Independence of the altitude and carbon monoxide hypoxia wasdemonstrated under the condition of performing a maximum aerobiccapacity test. The reductions in O2
max due to high altitude and tothe combined exposure of ambient carbon monoxide and high altitudewere similar.
Horvath & Bedi (1989) studied 17 non-smoking young men todetermine the alterations in carboxyhaemoglobin during exposure toambient carbon monoxide at 0 or 10 mg/m3 (0 or 9 ppm) for 8 h at sealevel or an altitude of 2135 m. Nine subjects rested during the expo-sures, and eight exercised for the last 10 min of each hour at a meanventilation of 25 litres (at body temperature, barometric pressure,saturated conditions). All subjects performed a maximal aerobiccapacity test at the completion of their respective exposures. At thelow carbon monoxide concentrations studied, the CFK equationestimated carboxyhaemoglobin levels to be 1.4% (Peterson & Stewart,1975). Carboxyhaemoglobin concentrations fell in all subjects duringtheir exposures to 0 mg carbon monoxide/m3 (0 ppm) at sea level or2135 m. During the 8-h exposures to 10 mg carbon monoxide/m3
(9 ppm), carboxyhaemoglobin levels rose linearly from approximately0.2% to 0.7%. No significant differences in uptake were foundwhether the subjects were resting or intermittently exercising. Levelsof carboxyhaemoglobin were similar at both altitudes. A portion of thelarger estimate of carboxyhaemoglobin determined by the CFK equa-tion could be accounted for by the use of an assumed blood volume.Maximal aerobic capacity was reduced approximately 7–10% conse-quent to altitude exposure during 0 mg carbon monoxide/m3 (0 ppm).These values were not altered following 8-h exposure to 10 mg carbonmonoxide/m3 (9 ppm) in either resting or exercising individuals.
Effects on Humans
325
In a study of patients with coronary artery disease, Leaf & Klein-man (1996) performed exercise stress tests after random exposures toeither carbon monoxide or clean air at sea level or a simulated 2.1-km-high altitude. The carbon monoxide and high-altitude conditionswere each selected to reduce the percentage of oxygen saturation ofarterial blood by 4%. Levels of carboxyhaemoglobin were increasedfrom an average of 0.62% after clean air exposure to 3.91% aftercarbon monoxide exposure. The average incidence of exercise-induced ventricular ectopy was approximately doubled after exposureto carbon monoxide or high altitude compared with clean airexposures (from 10 to approximately 20 premature ventricularcontractions). There was also a significant trend of increased ectopywith decreased oxygen saturation. No effects were observed in subjectswho were free from ectopy. These results indicate that individualshaving coronary artery disease and baseline ectopy are susceptible toincreased levels of hypoxaemia resulting from either hypoxic orcarbon monoxide exposures.
Exposure to carbon monoxide from smoking may pose a specialrisk to the fetus at altitude. Moore et al. (1982) reported that maternalsmoking at 3100 m was associated with a two- to threefold greaterreduction in infant birth weight than has been reported at sea level.Moreover, carboxyhaemoglobin levels of 1.8–6.2% measured in allpregnant subjects were inversely related to infant birth weight.Earlier, Brewer et al. (1970, 1974) reported that the mean carboxy-haemoglobin level in smokers at altitude is higher than in smokers atsea level, and that subjects who smoked had greater oxygen affinitiesthan non-smokers. Moreover, cessation of smoking by polycythaemicindividuals at altitude results in a marked reduction in carboxyhaemo-globin and a decrease in oxygen–haemoglobin affinity to values lessthan those reported for normal individuals at sea level.
8.2.8.4 Neurobehavioural effects
The neurobehavioural effects following carbon monoxide expo-sure are controversial and should, therefore, be interpreted withextreme caution. Those neurobehavioural studies specifically con-cerned with carbon monoxide exposure at altitude are reviewed brieflyin this section.
McFarland et al. (1944) reported changes in visual sensitivityoccurring at a carboxyhaemoglobin concentration of 5% or at a
EHC 213: Carbon Monoxide
326
simulated altitude of approximately 2430 m. Later, McFarland (1970)expanded on the original study and noted that a pilot flying at 1830 mbreathing 0.005% (57 mg/m3 [50 ppm]) carbon monoxide in air is atan altitude physiologically equivalent to approximately 3660 m.McFarland (1970) stated that sensitivity of the visual acuity test wassuch that even the effects of small quantities of carbon monoxideabsorbed from cigarette smoke were clearly demonstrable. In subjectsinhaling smoke from three cigarettes at 2285 m, there was a combinedloss of visual sensitivity equal to that occurring at 3050–3355 m.Results from the original study were confirmed by Halperin et al.(1959), who also observed that recovery from the detrimental effectsof carbon monoxide on visual sensitivity lagged behind eliminationof carbon monoxide from the blood.
Lilienthal & Fugitt (1946) reported that combined exposure toaltitude and carbon monoxide decreased flicker fusion frequency (i.e.,the critical frequency in cycles per second at which a flickering lightappears to be steady). Whereas mild hypoxia (that occurring at2745–3660 m) alone impaired flicker fusion frequency, carboxy-haemoglobin levels of 5–10% decreased the altitude threshold foronset of impairment to 1525–1830 m.
The psychophysiological effects of carbon monoxide at altitudeare a particular hazard in high-performance aircraft (Denniston et al.,1978). Acute ascent to altitude increases ventilation via thestimulating effects of a reduced PO2
on the chemoreceptors. Theincreased ventilation causes a slight increase in blood pH and a slightleftward shift in the oxyhaemoglobin dissociation curve. Althoughsuch a small shift would probably have no physiological significanceunder normal conditions, it may take on physiological importance foraviators required to fly under a variety of operational conditions andto perform tedious tasks involving a multitude of cognitive processes.The leftward shift of the oxyhaemoglobin dissociation curve may befurther aggravated by the persisting alkalosis caused by hyper-ventilation resulting from anxiety. The potential for this effect hasbeen reported by Pettyjohn et al. (1977), who found that respiratoryminute volume may be increased by 110% during final landingapproaches requiring night vision devices. Thus, the hypoxia-inducing effects of carbon monoxide inhalation would accentuate thecellular hypoxia caused by stress- and altitude-induced hyper-ventilation.
Effects on Humans
327
8.2.8.5 Compartmental shifts
The shift of carbon monoxide out of the blood has beendemonstrated in studies (Horvath et al., 1988a,b) conducted on bothmen and women undergoing maximal aerobic capacity tests ataltitudes of 55, 1525, 2135 and 3060 m and carbon monoxideconcentrations of 0, 57, 110 and 170 mg/m3 (0, 50, 100 and150 ppm). Carbon monoxide at maximum work shifted intoextravascular spaces and returned to the vascular space within 5 minafter exercise stopped.
8.3 Carbon monoxide poisoning
Carbon monoxide is responsible for more than half of the fatalpoisonings that are reported all over the world each year (NationalSafety Council, 1982; Faure et al., 1983; Cobb & Etzel, 1991;Mathieu et al., 1996a). At sublethal levels, carbon monoxidepoisoning occurs in a small but important fraction of the population.Certain conditions exist in both the indoor and outdoor ambientenvironments that cause a small percentage of the population tobecome exposed to dangerous levels of carbon monoxide. Outdoors,concentrations of carbon monoxide are highest near intersections, incongested traffic, near exhaust gases from internal combustionengines and from industrial combustion sources, and in poorlyventilated areas such as parking garages and tunnels. Indoors, carbonmonoxide concentrations in the workplace or in homes that havefaulty appliances or downdrafts and backdrafts have been measuredin excess of 110 mg/m3 (100 ppm), resulting in carboxyhaemoglobinlevels of greater than 10% for 8 h of exposure. In addition, carbonmonoxide is found in the smoke produced by all types of fires. Of the6000 deaths from burns in the USA each year, more than half arerelated to inhalation injuries where victims die from carbon monoxidepoisoning, hypoxia and smoke inhalation (Heimbach & Waeckerle,1988). Despite efforts in prevention and in public and medicaleducation, this intoxication remains frequent, severe and too oftenoverlooked (Barret et al., 1985).
Carbon monoxide poisoning is not new, although more attentionhas been focused on this problem recently in the scientific literatureas well as in the popular media. The first scientific studies of thehypoxic effects of carbon monoxide were described by Bernard in1865. The attachment of carbon monoxide to haemoglobin, producingcarboxyhaemoglobin, was evaluated by Douglas et al. (1912),
EHC 213: Carbon Monoxide
328
providing the necessary tools for studying human response to carbonmonoxide. During the next half century, numerous studies wereconducted, with the principal emphasis being on high concentrationsof carboxyhaemoglobin. Carbon monoxide poisoning as an occupa-tional hazard (Grut, 1949) received the greatest attention owing to theincreased use of natural gas and the potential for leakage of exhaustfumes in homes and industry. Other sources of carbon monoxide havebecome more important and more insidious. The clinical picture ofcarbon monoxide poisoning, as described by Grut (1949), relatesprimarily to the alterations in cardiac and central nervous systemfunction as a result of the extreme hypoxia induced.
Mortality from carbon monoxide exposure is high. In 1985,1365 deaths due to carbon monoxide exposure were reported inEngland and Wales (Meredith & Vale, 1988). In the USA, more than3800 people die annually from carbon monoxide (accidental andintentional), and more than 10 000 individuals seek medical attentionor miss at least 1 day of work because of a sublethal exposure (USCenters for Disease Control, 1982). The per capita mortality andmorbidity statistics for carbon monoxide are surprisingly similar forthe Scandinavian countries and for Canada as well. However, not allinstances of carbon monoxide poisoning are reported, and completeup-to-date data are difficult to obtain. In some places, continuoussurveillance by recording all cases hospitalized for every hospital inthe region covered has been set up by a poison centre that givesannual epidemiological reports at the local level (Mathieu et al.,1996a). Often the individuals suffering from carbon monoxidepoisoning are unaware of their exposure, because symptoms aresimilar to those associated with the flu or with clinical depression.This may result in a significant number of misdiagnoses by medicalprofessionals (Grace & Platt, 1981; Fisher & Rubin, 1982; Barretet al., 1985; Dolan et al., 1987; Heckerling et al., 1987, 1988;Kirkpatrick, 1987). Therefore, the precise number of individuals whohave suffered from carbon monoxide intoxication is not known, butit is certainly larger than the mortality figures indicate. Nonetheless,the reported literature available for review indicates the seriousnessof this problem.
The symptoms, signs and prognosis of acute poisoning correlatepoorly with the level of carboxyhaemoglobin measured at the time ofarrival at the hospital (Klees et al., 1985; Meredith & Vale, 1988).Carboxyhaemoglobin levels below 10% are usually not associated
Effects on Humans
329
with symptoms. At the higher carboxyhaemoglobin saturations of10–30%, neurological symptoms of carbon monoxide poisoning canoccur, such as headache, dizziness, weakness, nausea, confusion,disorientation and visual disturbances. Exertional dyspnoea, increasesin pulse and respiratory rates, and syncope are observed withcontinuous exposure producing carboxyhaemoglobin levels in excessof 30–50%. When carboxyhaemoglobin levels are higher than 50%,coma, convulsions and cardiorespiratory arrest may occur. There arenumerous tables giving symptom-associated carboxyhaemoglobinlevels and the corresponding carbon monoxide concentrations in theatmosphere (Ellenhorn & Barceloux, 1988). Examples are given inTable 18.
Different individuals experience very different clinical manifesta-tions of carbon monoxide poisoning and, therefore, have differentoutcomes even under similar exposure conditions. Norkool & Kirk-patrick (1985) found that carboxyhaemoglobin levels in individualswho had never lost consciousness ranged from 5% to 47%. In indi-viduals who were found unconscious but regained consciousness athospital arrival, the range was 10–64%; for those remaining uncon-scious, carboxyhaemoglobin levels ranged from 1% to 53%. The largedifferences in carboxyhaemoglobin levels found in these individualsmost likely resulted from differences in time elapsing from exposureto carbon monoxide and admission to the hospital. Considerable dif-ferences in exposure duration may also be responsible for the lack ofcorrelation between blood carboxyhaemoglobin and the clinical sever-ity of carbon monoxide poisoning (Sokal, 1985; Sokal & Kralkowska,1985). These data clearly indicate that carboxyhaemoglobin satura-tions correlate so poorly with clinical status that they have little prog-nostic significance.
The level of carbon monoxide in the tissues may have an equalor greater impact on the clinical status of the patient compared withthe level of carbon monoxide in the blood (Broome et al., 1988). Theextent of tissue toxicity, which becomes significant under hypoxicconditions or with very high levels of carbon monoxide, is likelydetermined by the length of exposure. For example, a short exposureto carbon monoxide at high ambient concentrations may allowinsufficient time for significant increases in tissue levels of carbonmonoxide to occur. The syncope observed in individuals with carbonmonoxide poisoning who were exposed in this manner may be the
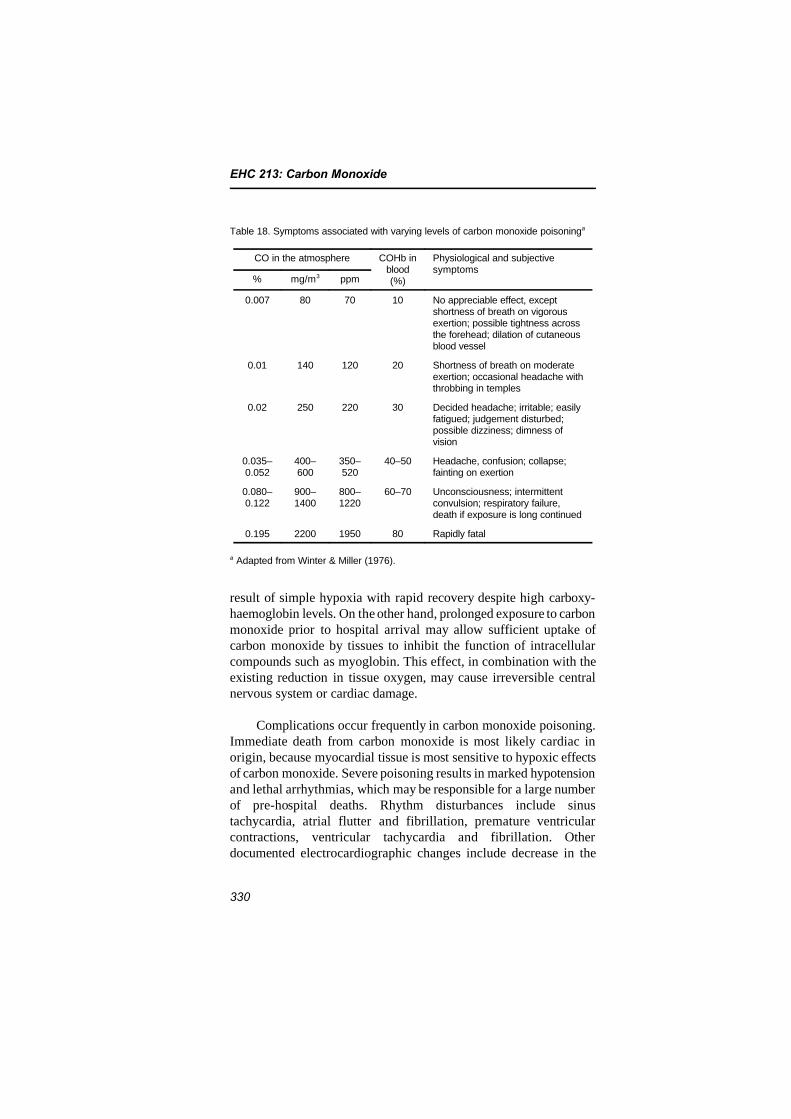
EHC 213: Carbon Monoxide
330
Table 18. Symptoms associated with varying levels of carbon monoxide poisoninga
CO in the atmosphere COHb inblood(%)
Physiological and subjectivesymptoms
% mg/m3 ppm
0.007 80 70 10 No appreciable effect, exceptshortness of breath on vigorousexertion; possible tightness acrossthe forehead; dilation of cutaneousblood vessel
0.01 140 120 20 Shortness of breath on moderateexertion; occasional headache withthrobbing in temples
0.02 250 220 30 Decided headache; irritable; easilyfatigued; judgement disturbed;possible dizziness; dimness ofvision
0.035–0.052
400–600
350–520
40–50 Headache, confusion; collapse;fainting on exertion
0.080–0.122
900–1400
800–1220
60–70 Unconsciousness; intermittentconvulsion; respiratory failure,death if exposure is long continued
0.195 2200 1950 80 Rapidly fatal
a Adapted from Winter & Miller (1976).
result of simple hypoxia with rapid recovery despite high carboxy-haemoglobin levels. On the other hand, prolonged exposure to carbonmonoxide prior to hospital arrival may allow sufficient uptake ofcarbon monoxide by tissues to inhibit the function of intracellularcompounds such as myoglobin. This effect, in combination with theexisting reduction in tissue oxygen, may cause irreversible centralnervous system or cardiac damage.
Complications occur frequently in carbon monoxide poisoning.Immediate death from carbon monoxide is most likely cardiac inorigin, because myocardial tissue is most sensitive to hypoxic effectsof carbon monoxide. Severe poisoning results in marked hypotensionand lethal arrhythmias, which may be responsible for a large numberof pre-hospital deaths. Rhythm disturbances include sinustachycardia, atrial flutter and fibrillation, premature ventricularcontractions, ventricular tachycardia and fibrillation. Otherdocumented electrocardiographic changes include decrease in the
Effects on Humans
331
magnitude of the R-wave, ST elevation, T-wave inversion and heartblock. Coronary underperfusion can lead to myocardial infarction,especially if coronary arteries are previously narrowed. Pulmonaryoedema is a fairly common feature that makes routine chest X-raymandatory in each carbon monoxide-poisoned patient (Mathieu &Wattel, 1990). Rhabdomyolosis and its consequence, renal failure, aswell as pancreatitis, are also complications that may be seen in carbonmonoxide poisoning.
Neurological manifestations of acute carbon monoxide poisoninginclude disorientation, confusion, coma, cogwheel rigidity, opistho-tonic posturing, extremity flaccidity or spasticity, and extensor plantarresponse. Perhaps the most insidious effect of carbon monoxidepoisoning is the delayed development of neuropsychiatric impairment.Within 1–3 weeks of poisoning, 15–40% of patients will manifestinappropriate euphoria, impaired judgement, poor concentration andrelative indifference to obvious neurological deficits. Computed axialtomography can show low density in the area of globus pallidus insome patients with poor neurological outcome (Sawday et al., 1980),but this feature is not specific for carbon monoxide poisoning.
Observed ocular effects from case reports on acute carbonmonoxide poisoning range from retinal haemorrhages (Dempseyet al., 1976; Kelley & Sophocleus, 1978) to blindness (Duncan &Gumpert, 1983; Katafuchi et al., 1985). In addition, Trese et al.(1980) described a case report of a 57-year-old woman havingperipheral neuropathy and tortuous retinal vessels after chronic,intermittent exposure to low levels of carbon monoxide over a 16-month period. These authors speculated that increased blood flowfrom low-level, chronic exposure to carbon monoxide may lead to thedevelopment of a compensatory retinal vascular tortuosity. With high-level, acute exposures to carbon monoxide, the compensation will nottake place, and localized vascular haemorrhages result.
Management of carbon monoxide-poisoned patients first consistsof removing the patient from exposure to the toxic atmosphere andsupplying pure oxygen to accelerate the elimination of carbonmonoxide and improve tissue oxygenation. Respiratory and circula-tory conditions are assessed rapidly, and resuscitative measures areperformed if needed. Evaluation includes neurological status ofconscious level, motor response and reflectivity, and a complete
EHC 213: Carbon Monoxide
332
physical examination looking for complications, associated trauma orintoxication, and previous disease. Laboratory exams should includea blood gas analysis to look for acidosis and a carboxyhaemoglobinmeasurement. Carboxyhaemoglobin levels over 5% in a non-smokerand over 10% in a smoker confirm the diagnosis but not the severityof intoxication (Ilano & Raffin, 1990).
Patients with carbon monoxide poisoning respond to treatmentwith 100% oxygen (Pace et al., 1950). If available, treatment withhyperbaric oxygen at 2.5–3 times atmospheric pressure for 90 min ispreferable (Myers, 1986), but the precise conditions requiring treat-ment have been a topic of debate in the literature (Mathieu et al.,1985; Norkool & Kirkpatrick, 1985; Broome et al., 1988; Brown etal., 1989; James, 1989; Raphael et al., 1989; Roy et al., 1989; Thom& Keim, 1989; Van Hoesen et al., 1989). It has been suggested thatif carboxyhaemoglobin is above 25%, hyperbaric oxygen treatmentshould be initiated (Norkool & Kirkpatrick, 1985), although treatmentplans based on specific carboxyhaemoglobin saturations are not wellfounded (Thom & Keim, 1989). Most hyperbaric centres treat patientswith carbon monoxide intoxication when they manifest loss of con-sciousness or other neurological signs and symptoms (excluding head-ache), regardless of the carboxyhaemoglobin saturation atpresentation (Piantadosi, 1990). The first European ConsensusConference on hyperbaric medicine has concluded that hyperbaricoxygen is highly recommended in every comatose patient, everypatient who had lost consciousness during exposure, every patientwith abnormal neuropsychological manifestation and every pregnantwoman (Mathieu et al., 1996b).
The half-time elimination of carbon monoxide while breathingair is approximately 320 min; when breathing 100% oxygen, it is80 min; and when breathing oxygen at 304 kPa (3 atm), it is 23 min(Myers et al., 1985). In the case of normobaric oxygen treatment,length of oxygen administration is also controversial, but it appearsthat it must be long enough to ensure total carbon monoxidedetoxication. Proposed durations are often between 12 and 48 h.
Successful removal of carbon monoxide from the blood does notensure an uneventful recovery with no further clinical signs orsymptoms. Neurological problems may develop insidiously weeksafter recovery from the acute episode of carbon monoxide poisoning
Effects on Humans
333
(Meredith & Vale, 1988). These late neurological sequelae includeintellectual deterioration, memory impairment and cerebral, cerebellarand midbrain damage. Smith & Brandon (1973) published a study inwhich they found 10% of cases with immediate gross neurologicalsequelae, but also 33% with delayed personality deterioration and43% with memory disturbances. In a literature review, Ginsberg &Romano (1976) found between 15% and 40% of late cases withneurological sequelae. The explanation for neurological problems maylie in misdiagnosis (30% in a French Poison Control Center study;Mathieu et al., 1985), inadequate therapy (40% of the patients ofSmith & Brandon, 1973, did not receive any oxygen in the emergencytreatment) or delayed therapy. Complete recovery is obtained in morecases if oxygen is applied in less than 6 h (Barois et al., 1979).
Mathieu et al. (1996a) conducted a study on the long-termconsequences of carbon monoxide poisoning and treatment byhyperbaric oxygen therapy on 774 patients, who were divided into fivegroups: group zero, in which patients suffered only from headache ornausea; group I, with abnormality in neurological examination; groupII, where patients had lost consciousness regardless of their clinicalstate of admission; group III, in which patients were comatose(Glasgow coma scale 6); and group IV, where patients were deeplycomatose. Group zero received only normobaric pure oxygen, whilegroups I, II, III and IV received hyperbaric oxygen. At 1 year only,4.4% of patients suffered from persistent manifestation, and only1.6% had major functional impairment. However, persistentneurological manifestations occurred only in patients from groups Iand IV.
As in the previous study (Mathieu et al., 1996a) and inaccordance with the Klees et al. (1985) conclusions, neither theclinical status nor the carboxyhaemoglobin level on hospitaladmission can predict the development of delayed neuropsychologicalchanges. Thus, the authors advocate the use of hyperbaric oxygen inevery carbon monoxide-poisoned patient who has suffered loss ofconsciousness during carbon monoxide exposure, who has aneurological abnormality upon clinical examination or who remainscomatose upon admission. These results are in accordance with thoseobtained by Myers et al. (1981).
In conclusion, carbon monoxide poisoning remains frequent andsevere with a relatively high risk of immediate death, complications
EHC 213: Carbon Monoxide
334
and late sequelae; furthermore, it is too often overlooked. The humandata from cases of accidental high-dose carbon monoxide exposuresare not adequate for evaluating the relationship between dose andeffect and identifying a LOEL and a NOEL, or for setting carbonmonoxide standards in ambient air, because of the small number ofcases reviewed and problems in documenting levels of exposure.Nevertheless, they suggest that in some circumstances and meteoro-logical conditions, acute poisoning can always occur in a chronicsituation. This possibility has to be taken into account in definingstandards. As well, such data, if systematically gathered and reported,could be useful in identifying possible ages of special sensitivity tocarbon monoxide and cofactors or other risk factors that mightidentify sensitive subpopulations.
335
9. EVALUATION OF HEALTH RISKS
9.1 Introduction
Most of the critical information on the human health effects ofcarbon monoxide discussed in this document has been derived byconsideration of data from two carefully defined population groups —young, healthy adults and patients with diagnosed coronary arterydisease. In addition to laboratory studies, supporting evidence hasbeen obtained from epidemiological and clinical studies as well asreports of accidental exposures. On the basis of the known effectsdescribed, patients with reproducible exercise-induced ischaemiaappear to be a well-defined sensitive group within the general popu-lation that is at increased risk for experiencing health effects (i.e.,decreased exercise duration due to exacerbation of cardiovascularsymptoms) of concern at ambient or near-ambient carbon monoxideexposure concentrations that result in carboxyhaemoglobin levelsdown to 3%. A smaller sensitive group of healthy individuals experi-ences decreased exercise duration at similar levels of carbonmonoxide exposure, but only during short-term maximal exercise.Decrements in exercise duration in the healthy population, therefore,would be mainly of concern to competing athletes rather than toordinary people carrying out the common activities of daily life.
From both clinical and theoretical work and from experimentalresearch on laboratory animals, certain other groups in the populationare identified as being at probable risk from exposure to carbonmonoxide. These probable risk groups include (1) fetuses and younginfants, (2) pregnant women, (3) the elderly, especially those withcompromised cardiopulmonary or cerebrovascular functions, (4) indi-viduals with obstructed coronary arteries, but not yet manifestingovert symptomatology of coronary artery disease, (5) individuals withcongestive heart failure, (6) individuals with peripheral vascular orcerebrovascular disease, (7) individuals with haematological diseases(e.g., anaemia) that affect oxygen carrying capacity or transport in theblood, (8) individuals with genetically unusual forms of haemoglobinassociated with reduced oxygen carrying capacity, (9) individuals withchronic obstructive lung diseases, (10) individuals using medicinal orrecreational drugs having effects on the brain or cerebrovasculature,(11) individuals exposed to other pollutants (e.g., methylene chloride)that increase endogenous formation of carbon monoxide and
EHC 213: Carbon Monoxide
336
(12) individuals who have not been adapted to high altitude and areexposed to a combination of high altitude and carbon monoxide.
Little empirical evidence is currently available by which tospecify health effects associated with ambient or near-ambient carbonmonoxide exposures for most of these probable risk groups. Whereasthe previous chapters dealt with documented evidence of carbonmonoxide exposure through controlled or natural laboratory investi-gations, in this chapter an effort will be made to determine the antici-pated effects of carbon monoxide in special subpopulations that forma significant proportion of the population at large.
As well, guideline values for ambient air carbon monoxideexposure and recommendations for further research and protection ofhuman health are provided in this chapter.
9.2 Age, gender and pregnancy as risk factors
The fetus and newborn infant are theoretically susceptible tocarbon monoxide exposure for several reasons. Fetal circulation islikely to have a higher carboxyhaemoglobin level than the maternalcirculation as a result of differences in uptake and elimination ofcarbon monoxide from fetal haemoglobin. Because the fetus also hasa lower oxygen tension in the blood than adults, any further drop infetal oxygen tension owing to the presence of carboxyhaemoglobincould have a potentially serious effect. The newborn infant with acomparatively high rate of oxygen consumption and lower oxygentransport capacity for haemoglobin than most adults would also bepotentially susceptible to the hypoxic effects of increased carboxy-haemoglobin. Newer data from laboratory animal studies on thedevelopmental toxicity of carbon monoxide suggest that prolongedexposure to high levels (>110 mg/m3 [>100 ppm]) of carbonmonoxide during gestation may produce a reduction in birth weight,cardiomegaly and delayed behavioural development. Human data arescant and more difficult to evaluate, but further research is warranted.Additional studies are therefore needed to determine if chronicexposure to carbon monoxide, particularly at low, near-ambient levels,can compromise the already marginal conditions existing in the fetusand newborn infant.
Evaluation of Health Risks
337
The effects of carbon monoxide on maternal–fetal relationshipsare not well understood. In addition to fetuses and newborn infants,pregnant women also represent a susceptible group, because preg-nancy is associated with increased alveolar ventilation and anincreased rate of oxygen consumption that serves to increase the rateof carbon monoxide uptake from inspired air. Perhaps a moreimportant factor is that pregnant women experience haemodilution asa result of the disproportionate increase in plasma volume comparedwith erythrocyte volume. This group, therefore, should be studied toevaluate the effects of carbon monoxide exposure and elevated car-boxyhaemoglobin levels.
Changes in metabolism with age may make the aging populationparticularly susceptible to the effects of carbon monoxide. Maximaloxygen uptake declines steadily with age. The rate of decline in thepopulation is difficult to determine, however, partly because of thewide range of values reported in the cross-sectional and longitudinalstudies published in the literature, and partly because of confoundingfactors such as heredity, changes in body weight and composition, andlevel of physical activity.
By the time an average healthy, non-smoking male reaches theage of 65 years, the maximal oxygen uptake will be about 23 ±5 ml/kg body weight per minute. At 75 years of age, the maximaloxygen uptake will be about 17 ± 5 ml/kg body weight per minute.The decline in maximal oxygen uptake with age seems to be the samein females, as well. However, because females have about 20–25%lower maximal oxygen uptake, the corresponding values will occurabout 5–8 years earlier in females. In physically active individuals, thecorresponding values will occur about 10–15 years later than in theaverage sedentary person.
9.3 Risk of carbon monoxide exposure in individualswith pre-existing disease
9.3.1 Subjects with coronary artery disease
Coronary heart disease is one of the major causes of death anddisability in the world, especially in industrialized societies. In a 1996WHO estimate, 7.2 million deaths globally were caused by coronaryheart disease, which ranked first in leading causes of death (WHO,
EHC 213: Carbon Monoxide
338
1997b). Although deaths from coronary heart disease constitute onlyabout 14% of the global total number of deaths, they are responsiblefor about one-third of all deaths in industrialized societies. The coro-nary heart disease epidemic began in industrialized societies in theearly decades of the 20th century. Its death rates peaked in the 1960sand early 1970s and have since declined dramatically. On the otherhand, coronary heart disease is now increasing in developingcountries as their populations age and adopt unhealthy habits andbehaviours. The world’s highest coronary heart disease mortality ratesare now found in eastern and central Europe.
According to data compiled by the American Heart Association(1989), persons with diagnosed coronary artery disease numbered5 million in 1987 and 7 million in 1990, the latter being about 3% ofthe total US population (Collings, 1988; US Department of Healthand Human Services, 1990). These persons have myocardialischaemia, which occurs when the heart muscle receives insufficientoxygen delivered by the blood. For some, exercise-induced anginapectoris can occur. In all patients with diagnosed coronary arterydisease, however, the predominant type of ischaemia, as identified byST-segment depression, is asymptomatic (i.e., silent). In other words,patients who experience angina usually have more ischaemic episodesthat are asymptomatic. Unfortunately, some individuals in the popula-tion have coronary artery disease but are totally asymptomatic. It hasbeen estimated that 5% of middle-aged men develop a positiveexercise test, one of the signs of ischaemia. A significant number ofthese men will have angiographic evidence of coronary artery disease(Cohn, 1988; Epstein et al., 1988, 1989). For example, in the USA,more than 1 million heart attacks occur each year, half of them beingfatal (American Heart Association, 1989). About 10–15% of allmyocardial infarctions are silent (Kannel & Abbott, 1984; Epstein etal., 1988). Of the 500 000 survivors of hospitalized myocardialinfarction, about 10% are asymptomatic but have signs of ischaemia.Thus, many more persons, as many as 3–4 million Americans(American Heart Association, 1989), are not aware that they havecoronary heart disease and may constitute a high-risk group.
Persons with both asymptomatic and symptomatic coronaryartery disease have a limited coronary flow reserve and therefore willbe sensitive to a decrease in oxygen carrying capacity induced bycarbon monoxide exposure. In addition, carbon monoxide might exert
Evaluation of Health Risks
339
a direct effect on vascular smooth muscle, particularly in thoseindividuals with an already damaged vascular endothelium. Naturallyoccurring vasodilators like acetylcholine cause a release of endothe-lium-derived relaxing factor that precedes the onset of vascularsmooth muscle relaxation. Oxyhaemoglobin and oxymyoglobin willantagonize these smooth muscle relaxant effects. Although no clinicalstudies have been done, in vitro studies suggest that carbon monoxidemay inhibit the effects of oxyhaemoglobin on the action of acetyl-choline. Carbon monoxide exposure in patients with a diseasedendothelium, therefore, could accentuate acetylcholine-induced vaso-spasm and aggravate silent ischaemia.
9.3.2 Subjects with congestive heart failure
Congestive heart failure is a major and growing public healthproblem. Because the prevalence of heart failure is known to increasewith age, improvements in the average life expectancy of the generalpopulation would be expected to increase the magnitude of the prob-lem over the next few decades. It was reported that about 75% ofpatients with heart failure are above the age of 60 years in the USA(Brody et al., 1987).
Worldwide morbidity and mortality data for heart failure are notavailable. In the USA, about 400 000 new cases of heart failure arediagnosed every year, resulting in about 1.6 million hospitalizations.The mortality rate is high, between 15% and 60% per year. The onsetof death is often sudden, and, because about 65% of heart failurepatients have serious arrhythmias, this sudden death is thought to bedue to arrhythmia (Brody et al., 1987).
Patients with congestive heart failure have a markedly reducedcirculatory capacity and therefore may be very sensitive to anylimitations in oxygen carrying capacity. Thus, exposure to carbonmonoxide will certainly reduce their exercise capacity and will evenbe dangerous, especially because of its arrhythmogenic activity. Theetiology of heart failure is diverse, but the dominating disease iscoronary artery disease. The large portion of heart failure patientswith coronary artery disease, therefore, might be even more sensitiveto carbon monoxide exposure.
EHC 213: Carbon Monoxide
340
9.3.3 Subjects with other vascular diseases
Vascular disease including cerebrovascular disease is present inboth the male and female population and is more prevalent above65 years of age. Both of these conditions are often found in subjectswith coronary artery disease. Both conditions are also associated witha limited blood flow capacity and therefore should be sensitive tocarbon monoxide exposure. It is not clear, however, how low levels ofexposure to carbon monoxide will affect these individuals. Only onestudy has been reported on patients with peripheral vascular disease.
9.3.4 Subjects with anaemia and other haematological disorders
Clinically diagnosed low levels of haemoglobin, characterized asanaemia, are a relatively prevalent condition throughout the world. Ifthe anaemia is mild to moderate, an inactive person is often asympto-matic. However, owing to the limitation in the oxygen carryingcapacity resulting from the low haemoglobin levels, an anaemicperson should be more sensitive to low-level carbon monoxide expo-sure than a person with normal haemoglobin levels. If anaemia iscombined with other prevalent diseases, such as coronary arterydisease, the individual will also be at an increased risk from carbonmonoxide exposure. Anaemia is more prevalent in women and in theelderly, already two potentially high-risk groups. An anaemic personwill also be more sensitive to the combination of carbon monoxideexposure and high altitude.
Individuals with haemolytic anaemia often have higher baselinelevels of carboxyhaemoglobin, because the rate of endogenous carbonmonoxide production from haem catabolism is increased. One of themany causes of anaemia is the presence of abnormal haemoglobin inthe blood. For example, in sickle-cell disease, the average life span ofred blood cells with abnormal haemoglobin S is 12 days comparedwith an average of 88 days in healthy individuals with normal haemo-globin (haemoglobin A). As a result, baseline carboxyhaemoglobinlevels can be as high as 4%. In subjects with haemoglobin Zurich,where affinity for carbon monoxide is 65 times that of normal haemo-globin, carboxyhaemoglobin levels range from 4% to 7%.
Evaluation of Health Risks
341
9.3.5 Subjects with obstructive lung disease
Chronic obstructive pulmonary disease is a prevalent disease,especially among smokers, and a large number (>50%) of theseindividuals have limitations in their exercise performance, demon-strated by a decrease in oxygen saturation during mild to moderateexercise. In spite of their symptoms, many of them (~30%) continueto smoke and already may have carboxyhaemoglobin levels of 4–8%.Subjects with hypoxia are also more likely to have a progression of thedisease, resulting in severe pulmonary insufficiency, pulmonaryhypertension and right heart failure. Studies suggest that individualswith hypoxia due to chronic lung disease such as bronchitis andemphysema may be susceptible to carbon monoxide during sub-maximal exercise typically found during normal daily activity.
Hospital admissions for asthma have increased considerably inthe past few years, particularly among individuals less than 18 yearsof age. Because asthmatics can also experience exercise-inducedairflow limitation, it is likely that they would also be susceptible tohypoxia. It is not known, however, how exposure to carbon monoxidewould affect these individuals.
9.4 Subpopulations at risk from combined exposure tocarbon monoxide and other chemical substances
9.4.1 Interactions with drugs
There is almost a complete lack of data on the possible toxicconsequences of combined carbon monoxide exposure and drug use.Because of the diverse classes of both cardiovascular and psychoactivedrugs, and because many other classes have not been examined at all,it must be concluded that this is an area of concern for which it isdifficult at the present time to make recommendations that will havean effect on air quality guidelines.
Because data are generally lacking on carbon monoxide–druginteractions, it should be useful to speculate on some of themechanisms by which carbon monoxide might be expected to alterdrug effects, or vice versa, and discuss possible populations at riskbecause of these potential interaction effects.
EHC 213: Carbon Monoxide
342
9.4.2 Interactions with other chemical substances in the environment
Besides direct ambient exposure to carbon monoxide, there areother chemical substances in the environment that can lead toincreased carboxyhaemoglobin saturation when inhaled. Halogenatedhydrocarbons used as organic solvents undergo metabolic breakdownby cytochrome P-450 to form carbon monoxide and inorganic halide.Possibly the greatest concern regarding potential risk in thepopulation comes from exposure to one of these halogenatedhydrocarbons, methylene chloride, and some of its derivatives.
9.5 Subpopulations exposed to carbon monoxide athigh altitudes
For patients with coronary artery disease, restricted coronaryblood flow limits oxygen delivery to the myocardium. Carbon monox-ide also has the potential for compromising oxygen transport to theheart. For this reason, such patients have been identified as thesubpopulation most sensitive to the effects of carbon monoxide. Areduction in the partial pressure of oxygen in the atmosphere, as athigh altitude, also has the potential for compromising oxygentransport. Therefore, patients with coronary artery disease who visithigher elevations might be unusually sensitive to the added effects ofatmospheric carbon monoxide.
It is important to distinguish between the long-term resident ofhigh altitude and the newly arrived visitor from low altitude. Speci-fically, the visitor will be more hypoxaemic than the fully adaptedresident.
One would postulate that the combination of high altitude withcarbon monoxide would pose the greatest risk to persons newlyarrived at high altitude who have underlying cardiopulmonarydisease, particularly because they are usually older individuals.Surprisingly, this hypothesis has never been tested adequately.
It is known that low birth weights occur in both infants born ataltitudes above 1830 m as well as infants born near sea level whosemothers had elevated carboxyhaemoglobin levels as a result ofcigarette smoking. It has also been shown that carboxyhaemoglobinlevels in smokers at high altitude are higher than in smokers at sea
Evaluation of Health Risks
343
level. Although it is probable that the combination of hypoxic hypoxiaand hypoxia resulting from ambient exposure to carbon monoxidecould further reduce birth weight at high altitude and possibly modifyfuture development, no data are currently available to support thishypothesis.
9.6 Carbon monoxide poisoning
The majority of this document deals with the relatively lowconcentrations of carbon monoxide that induce effects in humans ator near the lower margin of detection by current medical technology.Yet the health effects associated with exposure to this pollutant rangefrom the more subtle cardiovascular and neurobehavioural effects atlow ambient concentrations, as identified in the preceding sections, tounconsciousness and death after acute exposure to high concentrationsof carbon monoxide. The morbidity and mortality resulting from thelatter exposures are described briefly here to complete the picture ofcarbon monoxide exposure in present-day society.
Carbon monoxide is reported to be the cause of more than halfof the fatal poisonings that are reported in many countries. Fatal casesare also grossly under-reported or misdiagnosed by medicalprofessionals. Therefore, the precise number of individuals who havesuffered from carbon monoxide intoxication is not known. In theUSA, the National Center for Health Statistics (1986) estimates thatbetween 700 and 1000 deaths per year are due to accidental carbonmonoxide poisoning.
The symptoms, signs and prognosis of acute poisoning correlatepoorly with the level of carboxyhaemoglobin measured at the time ofhospital admission; however, because carbon monoxide poisoning isa diagnosis frequently overlooked, the importance of the early symp-toms (headache, dizziness, weakness, nausea, confusion, disorienta-tion and visual disturbances) has to be emphasized, especially if theyrecur with a certain periodicity or in certain circumstances.Complications occur frequently in carbon monoxide poisoning.Immediate death is most likely cardiac in origin, because myocardialtissues are most sensitive to the hypoxic effects of carbon monoxide.Severe poisoning results in marked hypotension and lethalarrhythmias and other electrocardiographic changes. Pulmonaryoedema is a fairly common feature. Neurological manifestation of
EHC 213: Carbon Monoxide
344
acute carbon monoxide poisoning includes disorientation, confusionand coma. Perhaps the most insidious effect of carbon monoxidepoisoning is the delayed development of neuropsychiatric impairmentwithin 1–3 weeks and the neurobehavioural consequences, especiallyin children. Carbon monoxide poisoning during pregnancy results inhigh risk for the mother, by increasing the short-term complicationrate, and for the fetus, by causing fetal death, developmental disordersand chronic cerebral lesions.
In conclusion, carbon monoxide poisoning occurs frequently, hassevere consequences, including immediate death, involves complica-tions and late sequelae and is often overlooked. Efforts in preventionin public and medical education should be encouraged.
9.7 Recommended guideline values
9.7.1 Environmental sources
Carbon monoxide comes from both natural and anthropogenicprocesses. About half of the carbon monoxide is released at theEarth’s surface, and the rest is produced in the atmosphere. About60% of the carbon monoxide is from human activities, whereasnatural processes account for the remaining 40%. Recent reportsshowed that global carbon monoxide concentrations started to declinerapidly from 1988 to 1993. Since 1993, the downward trend in globalcarbon monoxide has levelled off, and it is not clear if carbonmonoxide concentrations will continue to decline.
9.7.2 Environmental concentrations
The natural background carbon monoxide concentrations inremote areas of the southern hemisphere are around 0.05 mg/m3
(0.04 ppm), primarily as a result of natural processes. In the northernhemisphere, background concentrations are 2–3 times higher becauseof a greater human population density.
Carbon monoxide concentrations in ambient air monitored fromfixed-site stations are generally below 10 mg/m3 (9 ppm, 8-h average).The annual mean carbon monoxide concentrations are less than10 mg/m3 (9 ppm). However, short-term peak carbon monoxideconcentrations occur in traffic environments; carbon monoxideconcentrations up to 57 mg/m3 (50 ppm) are reported on heavily
Evaluation of Health Risks
345
travelled roads. Air quality data from fixed-site monitoring stationsseem to underestimate the short-term peak carbon monoxide level intraffic environments. Personal monitoring data from pedestrians andstreet workers showed that the carbon monoxide level could reach10–16 mg/m3 (9–14 ppm) and 11–57 mg/m3 (10–50 ppm), respec-tively.
Indoor and in-transit concentrations of carbon monoxide may besignificantly different from ambient carbon monoxide concentrations.The carbon monoxide levels in homes are usually lower than10 mg/m3 (9 ppm); however, the peak value in homes with gas stovescould be higher than 10 mg/m3 (9 ppm) and up to 21 mg/m3 (18 ppm)in the kitchen, from 1.1 to 34 mg/m3 (1 to 30 ppm) with woodcombustion and from 2.3 to 8 mg/m3 (2 to 7 ppm) with a keroseneheater. A report from homes with unvented gas-fired water heatersshowed that the indoor carbon monoxide levels range from less than11 mg/m3 (10 ppm) to more than 110 mg/m3 (100 ppm).
The carbon monoxide concentrations inside motor vehicles aregenerally around 10–29 mg/m3 (9–25 ppm) and occasionally over40 mg/m3 (35 ppm). Carbon monoxide levels in parking garages,tunnels and ice skating rinks are higher than in common indoorenvironments.
The differences between indoor and outdoor air quality and thedifferent amounts of time people spend indoors and outdoors explainwhy using ambient air quality measurements alone will not provideaccurate estimates of population exposure. The measurement ofcarbon monoxide from personal monitors more accurately reflects thereal exposure.
Occupational exposure levels are generally below 34 mg/m3
(30 ppm). Workers exposed to vehicle exhaust may have peak expo-sures over 230 mg/m3 (200 ppm).
9.7.3 Carboxyhaemoglobin concentrations in the population
Carbon monoxide diffuses rapidly across the alveolar andcapillary membrane and more slowly across the placental membrane.Approximately 85% of the absorbed carbon monoxide binds withhaemoglobin to form carboxyhaemoglobin, which is a specific bio-marker of exposure in blood. The remaining 15% is distributed
EHC 213: Carbon Monoxide
346
extravascularly. During an exposure to a fixed ambient concentrationof carbon monoxide, the carboxyhaemoglobin concentration increasesrapidly at the onset of exposure, starts to level off after 3 h andapproaches a steady state after 6–8 h of exposure. An 8-h value wouldbe representative of any longer continuous exposure value. In real-lifesituations, the prediction of individual carboxyhaemoglobin levels isdifficult because of large spatial and temporal variations in bothindoor and outdoor levels of carbon monoxide. Typical carboxy-haemoglobin concentrations in the non-smoking population rangefrom 0.5% to 2.0%; levels are slightly higher in pregnant women.
A common source of carbon monoxide for the general populationis tobacco smoke. Exposure to tobacco smoke not only increasescarboxyhaemoglobin concentrations in smokers, but under somecircumstances can also affect non-smokers. In many of the studiescurrently cited to justify the formulation of exposure limits, neitherthe smoking habits of the subjects nor their exposure to passivesmoking has been taken into account. In addition, as the result ofhigher baseline carboxyhaemoglobin levels, smokers may actually beexcreting more carbon monoxide into the air than they are inhalingfrom the ambient environment. Smokers may even show an adaptiveresponse to the elevated carboxyhaemoglobin levels, as evidenced byincreased red blood cell volumes and reduced plasma volumes. As aconsequence, it is not clear if incremental increases in carboxyhaemo-globin caused by environmental exposure would actually be additiveto the chronically elevated carboxyhaemoglobin levels due to tobaccosmoke. Thus, the exposure limits are recommended primarily for theprotection of non-smokers.
9.7.4 General population exposure
The environmental health criteria used in arriving at a recom-mendation for an exposure limit for the general population weremainly those data obtained from the exposure of non-smoking subjectswith coronary artery disease to carbon monoxide while exercising andpotential effects in fetuses of non-smoking pregnant mothers exposedto ambient sources of carbon monoxide. The principal cause of carbonmonoxide-induced effects at low levels of ambient exposure is thoughtto be increased carboxyhaemoglobin formation. Therefore, the pri-mary exposure limits are derived on the basis of carboxyhaemoglobin.
Evaluation of Health Risks
347
In order to protect non-smoking population groups with docu-mented or latent coronary artery disease from acute ischaemic heartattacks and to protect fetuses of non-smoking pregnant mothers fromuntoward hypoxic effects, a carboxyhaemoglobin level of 2.5% shouldnot be exceeded.
9.7.5 Working population exposure
Non-smoking people in certain occupations (e.g., car, bus andtaxi drivers, policemen, firemen, traffic wardens, street workers,garage and tunnel workers, mechanics) can have long-term carboxy-haemoglobin levels up to 5%. On the basis of present knowledge, theTask Group unanimously agreed on maintaining carboxyhaemoglobinlevels not exceeding 5%, because working populations compriseindividuals who are assumed to be healthy, physiologically resilientand under regular supervision.
9.7.6 Derived guideline values for carbon monoxide concentrations inambient air
It is important, wherever possible, to have both biological andenvironmental assessments of human exposure to pollutants.Although the biological measurements may be more relevant inrelation to effects in population groups, they may be more difficult touse in practice. For carbon monoxide, the relationship betweenconcentrations in air and carboxyhaemoglobin levels is affected byseveral physiological and environmental variables, including exposuretime. The appropriate carbon monoxide guidelines are based on theCFK exponential equation, which takes into account all knownphysiological variables affecting carbon monoxide uptake (see chapter6).
The following guideline values (ppm values rounded) andperiods of time-weighted average exposures have been determined insuch a way that the carboxyhaemoglobin level of 2.5% is notexceeded, even when a normal subject engages in light or moderateexercise:
100 mg/m3 (87 ppm) for 15 min60 mg/m3 (52 ppm) for 30 min30 mg/m3 (26 ppm) for 1 h10 mg/m3 (9 ppm) for 8 h
EHC 213: Carbon Monoxide
348
It should be emphasized that analyses of carbon monoxide in airand of carboxyhaemoglobin in blood are complementary and shouldbe in no way regarded as alternative methods of monitoring.Obviously, air monitoring has its uses in the planning and imple-mentation of control measures and for warning purposes, but suchmeasurements have limited value in estimating the actual humanexposure defined by carboxyhaemoglobin levels. It must also berecognized that complete protection of all persons, at all times, cannotreasonably be sought by ambient environmental control.
9.8 Recommendations
9.8.1 Further research
Further research is needed to:
• evaluate the effects of long-term carbon monoxide exposureon pregnant women and newborns;
• study the health effects of chronic exposure to low-levelcarbon monoxide, with emphasis on the fetus and newborninfant;
• determine the effects of carbon monoxide exposure onpatients with asthma, chronic obstructive pulmonary disease,anaemia and haematological disorders;
• study the interactions of carbon monoxide and other outdoorand indoor environmental pollutants;
• study the interactions of carbon monoxide and medication;
• study the influence of environmental factors, including highaltitude and heat stress, on health effects from exposure tocarbon monoxide, both in the general population and in high-risk groups, including the elderly, children and those suf-fering from cardiorespiratory diseases;
• identify the biomarkers for delayed neurological sequelae ofcarbon monoxide exposure and for epidemiological studies;
Evaluation of Health Risks
349
• study the mechanism of carbon monoxide toxicity at cellularand subcellular levels;
• study factors influencing endogenous carbon monoxideproduction; and
• improve estimates of population exposure to carbon monox-ide, especially by the use of personal exposure monitors.
9.8.2 Protection of human health
For protection of human health, it is desirable to:
• educate the general population, especially those with cardio-vascular and respiratory diseases, about the risk of carbonmonoxide exposure;
• improve monitoring of carbon monoxide in the workplaceand in public places (streets, shops, restaurants, car parks);
• increase awareness of health risks from carbon monoxideexposure for those potentially exposed to high peak carbonmonoxide levels from internal combustion engines used inenclosed environments;
• increase efforts to reduce carbon monoxide emissions fromcombustion engines;
• encourage the development of better methods for carbonmonoxide detection and promotion of the use of carbon mon-oxide detectors; and
• improve the awareness of medical professionals, as well asthe general population, of the dangers of carbon monoxideexposure during pregnancy.

350
REFERENCES
ACGIH (1987) In: Cook WA ed. Occupational exposure limits worldwide. Cincinnati, Ohio, AmericanConference of Governmental Industrial Hygienists.
ACGIH (1999) TLVs (Threshold Limit Values) and BEI (Biological Exposure Indices). Cincinnati,Ohio, American Conference of Governmental Industrial Hygienists.
Acton LL, Griggs M, Hall GD, Ludwig CB, Malkmus W, Hesketh WD, & Reichle H (1973) Remotemeasurement of carbon monoxide by a gas filter correlation instrument. J Am Inst AeronautAstronaut, 11: 899-900.
Adams JD, Erickson HH, & Stone HL (1973) Myocardial metabolism during exposure to carbonmonoxide in the conscious dog. J Appl Physiol, 34: 238-242.
Adams KF, Koch G, Chatterjee B, Goldstein GM, O'Neil JJ, Bromberg PA, Sheps DS, McAllister S,Price CJ, & Bissette J (1988) Acute elevation of blood carboxyhemoglobin to 6% impairs exerciseperformance and aggravates symptoms in patients with ischemic heart disease. J Am Coll Cardiol,12: 900-909.
Agostoni A, Stabilini R, Viggiano G, Luzzana M, & Samaja M (1980) Influence of capillary and tissuePO
2 on carbon monoxide binding to myoglobin: a theoretical evaluation. Microvasc Res, 20: 81-87.
Akland GG, Hartwell TD, Johnson TR, & Whitmore RW (1985) Measuring human exposure to carbonmonoxide in Washington, D.C., and Denver, Colorado, during the winter of 1982-1983. Environ SciTechnol, 19: 911-918.
Alcindor LG, Belegaud J, Aalam H, Piot MC, Heraud C, & Boudene C (1984) Teneur en cholesteroldes lipoprotéines légères chez le lapin hypercholestérolémique intoxiqué ou non par l'oxyde decarbone. Ann Nutr Metab, 28: 117-122.
Alderman BW, Baron AE, & Savitz DA (1987) Maternal exposure to neighborhood carbon monoxideand risk of low infant birth weight. Public Health Rep, 102: 410-414.
Allred EN, Bleecker ER, Chaitman BR, Dahms TE, Gottlieb SO, Hackney JD, Pagano M, SelvesterRH, Walden SM, & Warren J (1989a) Short-term effects of carbon monoxide exposure on the exerciseperformance of subjects with coronary artery disease. N Engl J Med, 321: 1426-1432.
Allred EN, Bleecker ER, Chaitman BR, Dahms TE, Gottlieb SO, Hackney JD, Hayes D, Pagano M,Selvester RH, Walden SM, & Warren J (1989b) Acute effects of carbon monoxide exposure onindividuals with coronary artery disease. Cambridge, Massachusetts, Health Effects Institute(Research Report No. 25).
Allred EN, Bleecker ER, Chaitman BR, Dahms TE, Gottlieb SO, Hackney JD, Pagano M, SelvesterRH, Walden SM, & Warren J (1991) Effects of carbon monoxide on myocardial ischemia. EnvironHealth Perspect, 91: 89-132.
Alm S, Reponen A, Mukala K, Pasanen P, Tuomist J, & Jantunen MJ (1994) Personal exposures ofpreschool children to carbon monoxide: Roles of ambient air quality and gas stoves. Atmos Environ,28(22): 3577-3580.

References
351
Alm S, Reponen A, Jurvelin J, Salonen RO, Pekkanen J, & Jantunen MJ (1995) Time activitypatterns and levels of carbon monoxide in different microenvironments among Finnish primary schoolchildren. Epidemiology, 6(suppl 4): S51.
Amendola AA & Hanes NB (1984) Characterization of indoor carbon monoxide levels produced by theautomobile. In: Berglund B, Lindvall T, & Sundell J ed. Indoor air. Proceedings of the 3rd InternationalConference on Indoor Air Quality and Climate — Volume 4: Chemical characterization and personalexposure. Stockholm, Sweden, Swedish Council for Building Research, pp 97-102 (Publication No.PB85-104214, available from NTIS, Springfield, Virginia, USA).
American Heart Association (1989) 1990 Heart and stroke facts. Dallas, Texas, American HeartAssociation.
American Industrial Hygiene Association (1972) Intersociety committee methods for ambient airsampling and analysis: Report II. Am Ind Hyg Assoc J, 33: 353-359.
Anders MW & Sunram JM (1982) Transplacental passage of dichloromethane and carbon monoxide.Toxicol Lett, 12: 231-234.
Anderson EW, Andelman RJ, Strauch JM, Fortuin NJ, & Knelson JH (1973) Effect of low-level carbonmonoxide exposure on onset and duration of angina pectoris: a study in ten patients with ischemicheart disease. Ann Intern Med, 79: 46-50.
Andrecs L, Stenzler A, Steinberg H, & Johnson T (1979) Carboxyhemoglobin levels in garageworkers. Am Rev Respir Dis, 119: 199.
Annau Z & Dyer RS (1977) Effects of environmental temperature upon body temperature in thehypoxic rat. Fed Proc, 36: 579.
Antonini E & Brunori M (1971) The partition constant between two ligands. In: Hemoglobin andmyoglobin in their reactions with ligands. Amsterdam, North-Holland Publishing Company,pp 174-175.
Armitage AK, Davies RF, & Turner DM (1976) The effects of carbon monoxide on the developmentof atherosclerosis in the White Carneau pigeon. Atherosclerosis, 23: 333-344.
Aronow WS & Cassidy J (1975) Effect of carbon monoxide on maximal treadmill exercise: a studyin normal persons. Ann Intern Med, 83: 496-499.
Aronow WS & Isbell MW (1973) Carbon monoxide effect on exercise-induced angina pectoris. AnnIntern Med, 79: 392-395.
Aronow WS, Harris CN, Isbell MW, Rokaw SN, & Imparato B (1972) Effect of freeway travel onangina pectoris. Ann Intern Med, 77: 669-676.
Aronow WS, Ferlinz J, & Glauser F (1977) Effect of carbon monoxide on exercise performance inchronic obstructive pulmonary disease. Am J Med, 63: 904-908.
Aronow WS, Stemmer EA, Wood B, Zweig S, Tsao K-P, & Raggio L (1978) Carbon monoxide andventricular fibrillation threshold in dogs with acute myocardial injury. Am Heart J, 95: 754-756.
Aronow WS, Stemmer EA, & Zweig S (1979) Carbon monoxide and ventricular fibrillation thresholdin normal dogs. Arch Environ Health, 34: 184-186.

EHC 213: Carbon Monoxide
352
Aronow WS, Schlueter WJ, Williams MA, Petratis M, & Sketch MH (1984) Aggravation of exerciseperformance in patients with anemia by 3% carboxyhemoglobin. Environ Res, 35: 394-398.
ASTM (1995) Annual book of ASTM standards, Section 11: Water and environmental technology,Volume 11.03: Atmospheric analysis — D3162-94: Standard test method for carbon monoxide in theatmosphere (continuous measurement by nondispersive infra-red spectrometry). Philadelphia,Pennsylvania, American Society for Testing and Materials. Astrup P, Kjeldsen K, & Wanstrup J (1967) Enhancing influence of carbon monoxide on thedevelopment of atheromatosis in cholesterol-fed rabbits. J Atheroscler Res, 7: 343-354.
Astrup P, Olsen HM, Trolle D, & Kjeldsen K (1972) Effect of moderate carbon-monoxide exposure onfetal development. Lancet, 1972(7789): 1220-1222.
Atkins EH & Baker EL (1985) Exacerbation of coronary artery disease by occupational carbonmonoxide exposure: a report of two fatalities and a review of the literature. Am J Ind Med, 7: 73-79.
Ayres SM, Criscitiello A, & Giannelli S Jr (1966) Determination of blood carbon monoxide content bygas chromatography. J Appl Physiol, 21: 1368-1370.
Ayres SM, Mueller HS, Gregory JJ, Giannelli S Jr, & Penny JL (1969) Systemic and myocardialhemodynamic responses to relatively small concentrations of carboxyhemoglobin (COHb).Arch Environ Health, 18: 699-709.
Ayres SM, Giannelli S Jr, & Mueller H (1970) Myocardial and systemic responses tocarboxyhemoglobin. In: Coburn RF ed. Biological effects of carbon monoxide. Ann NY Acad Sci, 174:68-293.
Ayres SM, Evans RG, & Buehler ME (1979) The prevalence of carboxyhemoglobinemia in NewYorkers and its effects on the coronary and systemic circulation. Prev Med, 8: 323-332.
Balraj EK (1984) Atherosclerotic coronary artery disease and “low” levels of carboxyhemoglobin:Report of fatalities and discussion of pathophysiologic mechanisms of death. J Forensic Sci, 29:1150-1159.
Bambach GA, Penney DG, & Negendank NG (1991) In situ assessment of the rat heart duringchronic carbon monoxide exposure using magnetic resonance imaging. J Appl Toxicol, 11: 43-49.
Barois A, Brosbuis S, & Goulon M (1979) Les intoxications aiguës par l’oxyde de carbon et les gazde chauffage. Rev Prat, 29: 1211-1231.
Barret L, Danel V, & Faure J (1985) Carbon monoxide poisoning, a diagnosis frequently overlooked.J Toxicol Clin Toxicol, 23: 309-313.
Bartholomew GW & Alexander M (1981) Soil as a sink for atmospheric carbon monoxide. Science,212: 1389-1391.
Bartle ER & Hall G (1977) Airborne HCl–CO sensing system: Final report. La Jolla, California,Science Applications, Inc. (Report No. SAI-76-717-LJ, available from NTIS, Springfield, Virginia,USA).
Bassan MM (1990) Sudden cardiac death [letter to the editor]. N Engl J Med, 322: 272.

References
353
Bauer K, Conrad R, & Seiler W (1980) Photooxidative production of carbon monoxide by phototrophicmicroorganisms. Biochim Biophys Acta, 589: 46-55.
Bay HW, Blurton KF, Lieb HC, & Oswin HG (1972) Electrochemical measurement of carbonmonoxide. Am Lab, 4: 57-58, 60-61.
Bay HW, Blurton KF, Sedlak JM, & Valentine AM (1974) Electrochemical technique for themeasurement of carbon monoxide. Anal Chem, 46: 1837-1839.
Beard RR & Grandstaff N (1970) Carbon monoxide exposure and cerebral function. Ann NY Acad Sci,174: 385-395.
Becker LC & Haak ED Jr (1979) Augmentation of myocardial ischemia by low level carbon monoxideexposure in dogs. Arch Environ Health, 34: 274-279.
Bender W, Goethert M, & Malorny G (1972) Effect of low carbon monoxide concentrations onpsychological functions. Staub-Reinhalt Luft, 32: 54-60.
Benesch W, Migeotte M, & Neven L (1953) Investigations of atmospheric CO at the Jungfraujoch.J Opt Soc Am, 43: 1119-1123.
Benignus VA (1984) EEG as a cross species indicator of neurotoxicity. Neurobehav Toxicol Teratol,6: 473-483.
Benignus VA (1994) Behavioural effects of carbon monoxide: meta analyses and extrapolations. ApplPhysiol, 76: 1310-1316.
Benignus VA, Otto DA, Prah JD, & Benignus G (1977) Lack of effects of carbon monoxide on humanvigilance. Percept Mot Skills, 45: 1007-1014.
Benignus VA, Muller KE, Barton CN, & Prah JD (1987) Effect of low level carbon monoxide oncompensatory tracking and event monitoring. Neurotoxicol Teratol, 9: 227-234.
Benignus VA, Muller KE, Smith MV, Pieper KS, & Prah JD (1990a) Compensatory tracking inhumans with elevated carboxyhemoglobin. Neurotoxicol Teratol, 12: 105-110.
Benignus VA, Muller KE, & Malott CM (1990b) Dose-effects functions for carboxyhemoglobin andbehavior. Neurotoxicol Teratol, 12: 111-118.
Benignus VA, Petrovick MK, Newlin Clapp L, & Prah JD (1992) Carboxyhemoglobin and brain bloodflow in humans. Neurotoxicol Teratol, 14: 285-290.
Benignus VA, Hazucha MJ, Smith MV, & Bromberg PA (1994) Prediction of carboxyhemoglobinformation due to transient exposure to carbon monoxide. J Appl Physiol, 76(4): 1739-1745.
Benzie TP, Bossart CJ, & Poli AA (1977) US Patent 4,030,887: Carbon monoxide detectionapparatus and method — catalysts. Washington, DC, US Patent Office (Mine Safety Appliances Co.,assignee).
Bergman I, Coleman JE, & Evans D (1975) A simple gas chromatograph with an electrochemicaldetector for the measurement of hydrogen and carbon monoxide in the parts per million range, appliedto exhaled air. Chromatographia, 8: 581-583.
Berk PD, Rodkey FL, Blaschke TF, Collison HA, & Waggoner JG (1974) Comparison of plasmabilirubin turnover and carbon monoxide production in man. J Lab Clin Med, 83: 29-37.

EHC 213: Carbon Monoxide
354
Berk PD, Blaschke TF, Scharschmidt BF, Waggoner JG, & Berlin NI (1976) A new approach toquantitation of the various sources of bilirubin in man. J Lab Clin Med, 87: 767-780.
Bidwell RGS & Fraser DE (1972) Carbon monoxide uptake and metabolism by leaves. Can J Bot,50: 1435-1439.
Bing RJ, Sarma JSM, Weishaar R, Rackl A, & Pawlik G (1980) Biochemical and histological effectsof intermittent carbon monoxide exposure in cynomolgus monkeys (Macaca fascicularis) in relationto atherosclerosis. J Clin Pharmacol, 20: 487-499.
Bissette J, Carr G, Koch GG, Adams KF, & Sheps DS (1986) Analysis of (events/time at risk) ratiosfrom two-period crossover studies. In: American Statistical Association 1986 Proceedings of theBiopharmaceutical Section. Washington, DC, American Statistical Association, pp 104-108.
Bissonnette JM & Wickham WK (1977) Placental diffusing capacity for carbon monoxide inunanesthetized guinea pigs. Respir Physiol, 31: 161-168.
Blackmore DJ (1974) Aircraft accident toxicology: U.K. experience 1967-1972. Aerosp Med,45: 987-994.
Blair PS, Fleming PJ, Bensley D, Smith I, Bacon C, Taylor E, Berry J, Golding J, & Tripp J (1996)Smoking and the sudden infant death syndrome: Results from 1993-5 case control study forconfidential inquiry into stillbirths and deaths in infancy. Br Med J, 313(7051): 195-198.
Bondi KR, Very KR, & Schaefer KE (1978) Carboxyhemoglobin levels during a submarine patrol.Undersea Biomed Res, 5: 17-18.
Brewer GJ, Eaton JW, Weil JV, & Grover RF (1970) Studies of red cell glycolysis and interactionswith carbon monoxide, smoking, and altitude. In: Brewer GJ ed. Red cell metabolism and function:Proceedings of the First International Conference on Red Cell Metabolism and Function, Ann Arbor,Michigan, October 1969. New York, Plenum Press, pp 95-114 (Advances in Experimental Medicineand Biology series, Volume 6).
Brewer GJ, Sing CF, Eaton JW, Weil JV, Brewer LF, & Grover RF (1974) Effects on hemoglobinoxygen affinity of smoking in residents of intermediate altitude. J Lab Clin Med, 84: 191-205.
Breysse PA & Bovee HH (1969) Use of expired air-carbon monoxide for carboxyhemoglobindeterminations in evaluating carbon monoxide exposures resulting from the operation of gasoline forklift trucks in holds of ships. Am Ind Hyg Assoc J, 30: 477-483.
Brian JE Jr, Heistad DD, & Faraci FM (1994) Effect of carbon monoxide on rabbit cerebral arteries.Stroke, 25: 639-643.
Bridge DP & Corn M (1972) Contribution to the assessment of exposure of nonsmokers to air pollutionfrom cigarette and cigar smoke in occupied spaces. Environ Res, 5: 192-209.
Britten JS & Myers RAM (1985) Effects of hyperbaric treatment on carbon monoxide elimination inhumans. Undersea Biomed Res, 12: 431-438.
Brody JA, Brock DB, & Williams TF (1987) Trends in the health of the elderly population. Annu RevPublic Health, 8: 211-234.
Broome JR, Pearson RR, & Skrine H (1988) Carbon monoxide poisoning: forgotten not gone! Br JHosp Med, 39: 298, 300, 302, 304-305.

References
355
Brown LJ (1980) A new instrument for the simultaneous measurement of total hemoglobin,% oxyhemoglobin, % carboxyhemoglobin, % methemoglobin, and oxygen content in whole blood.IEEE Trans Biomed Engl, 27: 132-138.
Brown SD & Piantadosi CA (1990) In vivo binding of carbon monoxide to cytochrome c oxidase in ratbrain. J Appl Physiol, 68: 604-610.
Brown S & Piantadosi C (1992) Recovery of energy metabolism in rat brain after carbon monoxidehypoxia. J Clin Invest, 89: 666-672.
Brown SD, Piantadosi CA, Gorman DF, Gilligan JEF, Clayton DG, Neubauer RA, Gottlieb SF,Raphael J-C, Elkharrat D, Jars-Guincestre M-C, Chastang C, Chasles V, Vercken J-B, & Gajdos P(1989) Hyperbaric oxygen for carbon monoxide poisoning [letter to the editor]. Lancet, Oct 28(8670):1032-1033.
Bruene B & Ullrich V (1987) Inhibition of platelet aggregation by carbon monoxide is mediated byactivation of guanylate cyclase. Mol Pharmacol, 32: 497-504.
Brunekreef B, Smit HA, Biersteker K, Boleij JSM, & Lebret E (1982) Indoor carbon monoxide pollutionin The Netherlands. Environ Int, 8: 193-196.
Bruner F, Ciccioli P, & Rastelli R (1973) The determination of carbon monoxide in air in the parts perbillion range by means of a helium detector. J Chromatogr, 77: 125-129.
Bunnell DE & Horvath SM (1988) Interactive effects of physical work and carbon monoxide oncognitive task performance. Aviat Space Environ Med, 59: 1133-1138.
Bunnell DE & Horvath SM (1989) Interactive effects of heat, physical work, and CO exposure onmetabolism and cognitive task performance. Aviat Space Environ Med, 60: 428-432.
Burch DE & Gryvnak DA (1974) Cross-stack measurement of pollutant concentrations using gas-cellcorrelation spectroscopy. In: Stevens RK & Herget WF ed. Analytical methods applied to air pollutionmeasurements. Ann Arbor, Michigan, Ann Arbor Science Publishers, Inc., pp 193-231.
Burch DE, Gates FJ, & Pembrook JD (1976) Ambient carbon monoxide monitor. Research TrianglePark, North Carolina, US Environmental Protection Agency, Environmental Sciences ResearchLaboratory (EPA-600/2-76-210).
Bureau MA, Monette J, Shapcott D, Pare C, Mathieu J-L, Lippe J, Blovin D, Berthiaume Y, & BeginR (1982) Carboxyhemoglobin concentration in fetal cord blood and in blood of mothers who smokedduring labor. Pediatrics, 69: 371-373.
Burnett RT, Dales RE, Brook JR, Raizenne ME, & Krewski D (1997) Association between ambientcarbon monoxide levels and hospitalizations for congestive heart failure in the elderly in 10 Canadiancities. Epidemiology, 8(2): 162-167.
Burns TR, Greenberg SD, Cartwright J, & Jachimczyk JA (1986) Smoke inhalation: an ultrastructuralstudy of reaction to injury in the human alveolar wall. Environ Res, 41: 447-457.
Busey WM (1972) Chronic exposure of albino rats to certain airborne pollutants. Vienna, Virginia,Hazleton Laboratories, Inc. (Unpublished document).

EHC 213: Carbon Monoxide
356
Butler WJ (1991) Commentary on “Links between passive smoking and disease: A best evidencesynthesis — A report of the Working Group on Passive Smoking.” Clin Invest Med, 14(5): 484-489.
Butt J, Davies GM, Jones JG, & Sinclair A (1974) Carboxyhaemoglobin levels in blast furnaceworkers. Ann Occup Hyg, 17: 57-63.
Cagliostro DE & Islas A (1982) The effects of reduced oxygen and of carbon monoxide onperformance in a mouse pole-jump apparatus. J Combust Toxicol, 9: 187-193.
Calverley PMA, Leggett RJE, & Flenley DC (1981) Carbon monoxide and exercise tolerance inchronic bronchitis and emphysema. Br Med J, 283: 878-880.
Camici P, Araujo LI, Spinks T, Lammertsma AA, Kaski JC, Shea MJ, Selwyn AP, Jones T, & MaseriA (1986) Increased uptake of 18F-fluorodeoxyglucose in postischemic myocardium of patients withexercise-induced angina. Circulation, 74: 81-88.
Campbell JA (1934) Growth, fertility, etc. in animals during attempted acclimatization to carbonmonoxide. Exp Physiol, 24: 271-281.
Carratú MR, Renna G, Giustino A, De Salvia MA, & Cuomo V (1993) Changes in peripheral nervoussystem activity produced in rats by prenatal exposure to carbon monoxide. Arch Toxicol, 67: 297-301.
Carratú MR, Cagiano R, De Salvia MA, Trabace L, & Cuomo V (1995) Developmental neurotoxicityof carbon monoxide. Arch Toxicol, 17(suppl): 295-301.
Castelli WP, Garrison RJ, McNamara PM, Feinleib M, & Faden E (1982) The relationship of carbonmonoxide in expired air of cigarette smokers to the tar nicotine content of the cigarette they smoke:The Framingham study. In: 55th Scientific Sessions of the American Heart Association, Dallas,Texas, November. Circulation, 66: 11-315 (American Heart Association Monograph No. 91).
Caughey WS (1970) Carbon monoxide bonding in hemeproteins. In: Coburn RF ed. Biological effectsof carbon monoxide. Ann NY Acad Sci, 174: 148-153.
CEC (1993) Carbon monoxide. Luxembourg, Commission of the European Communities, ScientificExpert Group on Occupational Exposure Limits (SEG/CDO/44A).
Celsing F, Svedenhag J, Pihlstedt P, & Ekblom B (1987) Effects of anemia and stepwise-inducedpolycythaemia on maximal aerobic power in individuals with high and low haemoglobinconcentrations. Acta Physiol Scand, 129: 47-54.
Chace DH, Goldbaum LR, & Lappas NT (1986) Factors affecting the loss of carbon monoxide fromstored blood samples. J Anal Toxicol, 10: 181-189.
Chan LY & Wu HWY (1993) A study of bus commuter and pedestrian exposure to traffic air pollutionin Hong Kong. Environ Int, 19: 121-132.
Chan WH, Uselman WM, Calvert JG, & Shaw JH (1977) The pressure dependence of the rateconstant for the reaction: OH + CO 6 H + CO2. Chem Phys Lett, 45: 240-244.
Chan C-C, Ozkaynak H, Spengler JD, Sheldon L, Nelson W, & Wallace L (1989) Commuter'sexposure to volatile organic compounds, ozone, carbon monoxide, and nitrogen dioxide. Presentedat the 82nd Annual Meeting of the Air and Waste Management Association, Anaheim, California, June1989. Pittsburgh, Pennsylvania, Air and Waste Management Association (Paper No. 9-34A.4).

References
357
Chan C-C, Ozkaynak H, Spengler JD, & Sheldon L (1991) Driver exposure to volatile organiccompounds, CO, ozone, and NO2 under different driving conditions. Environ Sci Technol, 25(5): 964-972.
Chance B, Erecinska M, & Wagner M (1970) Mitochondrial responses to carbon monoxide toxicity.In: Coburn RF ed. Biological effects of carbon monoxide. Ann NY Acad Sci, 174: 193-204.
Chaney LW (1978) Carbon monoxide automobile emissions measured from the interior of a travelingautomobile. Science, 199: 1203-1204.
Chaney LW & McClenny WA (1977) Unique ambient carbon monoxide monitor based on gas filtercorrelation: Performance and application. Environ Sci Technol, 11: 1186-1190.
Chapin FS Jr (1974) Human activity patterns in the city. New York, Wiley-Interscience Publishers.
Chapman RW, Santiago TV, & Edelman NH (1980) Brain hypoxia and control of breathing:neuromechanical control. J Appl Physiol Respir Environ Exercise Physiol, 49: 497-505.
Chen S, Weller MA, & Penney DG (1982) A study of free lung cells from young rats chronicallyexposed to carbon monoxide from birth. Scanning Electron Microsc, 2: 859-867.
Chevalier RB, Krumholz RA, & Ross JC (1966) Reaction of nonsmokers to carbon monoxideinhalation: Cardiopulmonary responses at rest and during exercise. J Am Med Assoc, 198:1061-1064.
Choi KD & Oh YK (1975) [A teratological study on the effects of carbon monoxide exposure upon thefetal development of albino rats.] Chungang Uihak, 29: 209-213 (in Korean with summary in English).
Chovin P (1967) Carbon monoxide: analysis of exhaust gas investigations in Paris. Environ Res,1: 198-216.
Christensen CL, Gliner JA, Horvath SM, & Wagner JA (1977) Effects of three kinds of hypoxias onvigilance performance. Aviat Space Environ Med, 48: 491-496.
Christensen P, Gronlund J, & Carter AM (1986) Placental gas exchange in the guinea-pig: Fetal bloodgas tensions following the reduction of maternal oxygen capacity with carbon monoxide. J DevPhysiol, 8: 1-9.
Clark BJ & Coburn RF (1975) Mean myoglobin oxygen tension during exercise at maximal oxygenuptake. J Appl Physiol, 39: 135-144.
Clark RT Jr & Otis AB (1952) Comparative studies on acclimatization of mice to carbon monoxide andto low oxygen. Am J Physiol, 169: 285-294.
Clausen GH, Fanger PO, Cain WS, & Leaderer BP (1985) The influence of aging, particle filtrationand humidity on tobacco smoke odor. In: Fanger PO ed. CLIMA 2000: Proceedings of the WorldCongress on Heating, Ventilating and Air-Conditioning, Copenhagen, August 1985 — Volume 4:Indoor climate. Copenhagen, Denmark, VVS Kongres, pp 345-350.

EHC 213: Carbon Monoxide
358
Clerbaux T, Willems E, & Brasseur L (1984) Evaluation d’une méthode chromatographique deréférence pour la détermination du taux sanguin de carboxyhémoglobine. Pathol Biol, 32: 813-816.
Clubb FJ Jr, Penney DG, Baylerian MS, & Bishop SP (1986) Cardiomegaly due to myocytehyperplasia in perinatal rats exposed to 200 ppm carbon monoxide. J Mol Cell Cardiol, 18: 477-486.
Cobb N & Etzel RA (1991) Unintentional carbon monoxide-related deaths in the United States, 1979through 1988. J Am Med Assoc, 266: 659-663.
Coburn RF (1970) Enhancement by phenobarbital and diphenylhydantoin of carbon monoxideproduction in normal man. N Engl J Med, 283: 512-515.
Coburn RF & Forman HJ (1987) Carbon monoxide toxicity. In: Fishman AP, Farhi LE, Tenney SM,& Geiger SR ed. Handbook of physiology: a critical, comprehensive presentation of physiologicalknowledge and concepts, Volume IV: Gas Exchange, Section 3: The respiratory system. Bethesda,Maryland, American Physiological Society, pp 439-456.
Coburn RF & Mayers LB (1971) Myoglobin O2 tension determined from measurements ofcarboxymyoglobin in skeletal muscle. Am J Physiol, 220: 66-74.
Coburn RF, Williams WJ, & Forster RE (1964) Effect of erythrocyte destruction on carbon monoxideproduction in man. J Clin Invest, 43: 1098-1103.
Coburn RF, Forster RE, & Kane PB (1965) Considerations of the physiological variables thatdetermine the blood carboxyhemoglobin concentration in man. J Clin Invest, 44: 1899-1910.
Coburn RF, Williams WJ, & Kahn SB (1966) Endogenous carbon monoxide production in patientswith hemolytic anemia. J Clin Invest, 45: 460-468.
Coburn RF, Wallace HW, & Abboud R (1971) Redistribution of body carbon monoxide afterhemorrhage. Am J Physiol, 220: 868-873.
Coburn RF, Ploegmakers F, Gondrie P, & Abboud R (1973) Myocardial myoglobin oxygen tension.Am J Physiol, 224: 870-876.
Coburn RF, Grubb B, & Aronson RD (1979) Effect of cyanide on oxygen tension-dependentmechanical tension in rabbit aorta. Circ Res, 44: 368-378.
Cohen SI, Deane M, & Goldsmith JR (1969) Carbon monoxide and survival from myocardialinfarction. Arch Environ Health, 19: 510-517.
Cohn PF (1988) Detection and prognosis of the asymptomatic patient with silent myocardial ischemia.Am J Cardiol, 61: 4B-6B.
Cole RP (1982) Myoglobin function in exercising skeletal muscle. Science, 216: 523-525.
Collier CR & Goldsmith JR (1983) Interactions of carbon monoxide and hemoglobin at high altitude.Atmos Environ, 17: 723-728.
Collins JG (1988) Prevalence of selected chronic conditions, United States, 1983-85. Hyattsville,Maryland, US Department of Health and Human Services, National Center for Health Statistics(Advance data from vital and health statistics No.1/55) (DHHS Publication No. (PHS) 88-1250).
References
359
Collison HA, Rodkey FL, & O’Neal JD (1968) Determination of carbon monoxide in blood by gaschromatography. Clin Chem, 14: 162-171.
Colwill DM & Hickman AJ (1980) Exposure of drivers to carbon monoxide. J Air Pollut Control Assoc,30: 1316-1319.
Comroe JH Jr (1974) Physiology of respiration: an introductory text, 2nd ed. Chicago, Illinois, YearBook Medical Publishers, Inc.
Conrad R & Seiler W (1982) Arid soils as a source of atmospheric carbon monoxide. Geophys ResLett, 9: 1353-1356.
Cooke RA (1986) Blood lead and carboxyhaemoglobin levels in roadside workers. J Soc Occup Med,36: 102-103.
Cooper KR & Alberti RR (1984) Effect of kerosene heater emissions on indoor air quality andpulmonary function. Am Rev Respir Dis, 129: 629-631.
Cooper RL, Dooley BS, McGrath JJ, McFaul SJ, & Kopetzky MT (1985) Heart weights andelectrocardiograms in rats breathing carbon monoxide at altitude. Fed Proc, 44: 1048.
Copel JA, Bowen F, & Bolognese RJ (1982) Carbon monoxide intoxication in early pregnancy. ObstetGynecol, 59(suppl): 26S-28S.
Cortese AD & Spengler JD (1976) Ability of fixed monitoring stations to represent personal carbonmonoxide exposure. J Air Pollut Control Assoc, 26: 1144-1150.
Costantino AG, Park J, & Caplan YH (1986) Carbon monoxide analysis: a comparison of twoCO-oximeters and headspace gas chromatography. J Anal Toxicol, 10: 190-193.
Council on Environmental Quality (1980) Environmental quality: the eleventh annual report of theCouncil on Environmental Quality. Washington, DC, Council on Environmental Quality.
Cox BD & Whichelow MJ (1985) Carbon monoxide levels in the breath of smokers and nonsmokers:effect of domestic heating systems. J Epidemiol Commun Health, 39: 75-78.
Crane CR (1985) Are the combined toxicities of CO and CO2 synergistic? J Fire Sci, 3: 143-144.
Crocker PJ & Walker JS (1985) Pediatric carbon monoxide toxicity. J Emerg Med, 3: 443-448.
Czeplak G & Junge C (1974) Studies of interhemispheric exchange in the troposphere by a diffusionmodel. In: Frenkiel FN & Munn RE ed. Turbulent diffusion in environmental pollution: Proceedingsof a symposium, Charlottesville, Virginia, April 1973. New York, London, Academic Press, pp 57-72.
Dagnall RM, Johnson DJ, & West TS (1973) A method for the determination of carbon monoxide,carbon dioxide, nitrous oxide and sulphur dioxide in air by gas chromatography using an emissivehelium plasma detector. Spectrosc Lett, 6: 87-95.
Dahms TE & Horvath SM (1974) Rapid, accurate technique for determination of carbon monoxide inblood. Clin Chem, 20: 533-537.
Dahms TE, Younis LT, Wiens RD, Zarnegar S, Byers SL, & Chaitman BR (1993) Effects of carbonmonoxide exposure in patients with documented cardiac arrhythmias. J Am Coll Cardiol, 21(2): 442-450.

EHC 213: Carbon Monoxide
360
Daughtrey WC & Norton S (1982) Morphological damage to the premature fetal rat brain after acutecarbon monoxide exposure. Exp Neurol, 78: 26-37.
Davidson SB & Penney DG (1988) Time course of blood volume change with carbon monoxideinhalation and its contribution to the overall cardiovascular response. Arch Toxicol, 61: 306-313.
Davidson CI, Borrazzo JE, & Hendrickson CT (1987) Pollutant emission factors for gas stoves:a literature survey. Research Triangle Park, North Carolina, US Environmental Protection Agency, Airand Energy Engineering Research Laboratory (EPA-600/9-87-005).
Davies DM & Smith DJ (1980) Electrocardiographic changes in healthy men during continuouslow-level carbon monoxide exposure. Environ Res, 21: 197-206.
Davies RF, Topping DL, & Turner DM (1976) The effect of intermittent carbon monoxide exposure onexperimental atherosclerosis in the rabbit. Atherosclerosis, 24: 527-536.
Davis GL & Gantner GE Jr (1974) Carboxyhemoglobin in volunteer blood donors. J Am Med Assoc,230: 996-997.
DeBias DA, Banerjee CM, Birkhead NC, Harrer WV, & Kazal LA (1973) Carbon monoxide inhalationeffects following myocardial infarction in monkeys. Arch Environ Health, 27: 161-167.
DeBias DA, Banerjee CM, Birkhead NC, Greene CH, Scott SD, & Harrer WV (1976) Effects of carbonmonoxide inhalation on ventricular fibrillation. Arch Environ Health, 31: 42-46.
Delivoria-Papadopoulos M, Coburn RF, & Forster RE (1970) Cyclical variation of rate of hemedestruction and carbon monoxide production ( CO) in normal women. Physiologist, 13: 178.
De Luca A, Pierno S, Tricarico D, Carratú MR, Cagiano R, Cuomo V, & Conte Camerino D (1996)Developmental changes of membrane electrical properties of rat skeletal muscle fibers produced byprenatal exposure to carbon monoxide. Environ Toxicol Pharmacol, 2: 213-221.
DeLucia AJ, Whitaker JH, & Bryant LR (1983) Effects of combined exposure to ozone and carbonmonoxide (CO) in humans. In: Lee SD, Mustafa MG, & Mehlman MA ed. International Symposium on the Biomedical Effects of Ozone and Related Photochemical Oxidants, Pinehurst, NC,March 1983. Princeton, New Jersey, Princeton Scientific Publishers, Inc., pp 145-159 (Advances inModern Environmental Toxicology series, Volume 5).
DeMore WB, Margitan JJ, Molina MJ, Watson RT, Golden DM, Hampson RF, Kurylo MJ, Howard CJ,& Ravishankara AR (1985) Chemical kinetics and photochemical data for use in stratosphericmodeling: evaluation number 7. Washington, DC, National Aeronautics and Space Administration(JPL Publication No. 85-37, available from NTIS, Springfield, Virginia, USA).
Dempsey RM, LaConti AB, Nolan ME, Torkildsen RA, Schnakenberg G, & Chilton E (1975)Development of fuel cell CO detection instruments for use in a mine atmosphere. Washington, DC,US Department of the Interior, Bureau of Mines (Report No. 77-76, available from NTIS, Springfield,Virginia, USA).
Dempsey LC, O’Donnell JJ, & Hoff JT (1976) Carbon monoxide retinopathy. Am J Ophthalmol,82: 692-693.
Dennis RC & Valeri CR (1980) Measuring percent oxygen saturation of hemoglobin, percentcarboxyhemoglobin and methemoglobin, and concentrations of total hemoglobin and oxygen in bloodof man, dog, and baboon. Clin Chem, 26: 1304-1308.

References
361
Denniston JC, Pettyjohn FS, Boyter JK, Kelliher JC, Hiott BF, & Piper CF (1978) The interaction ofcarbon monoxide and altitude on aviator performance: pathophysiology of exposure to carbonmonoxide. Fort Rucker, Alabama, US Army Aeromedical Research Laboratory (Report No. 78-7,available from NTIS, Springfield, Virginia, USA).
De Salvia MA, Cagiano R, Carratù MR, Di Giovanni V, Trabace L, & Cuomo V (1995) Irreversibleimpairment of active avoidance behaviour in rats prenatally exposed to mild concentrations of carbonmonoxide. Psychopharmacology, 122: 66-71.
Desclaux P, Soulairac A, & Morlon C (1951) Carbon monoxide intoxication during the course of apregnancy (fifth month). Arch Fr Pediatr, 8: 316-318.
DFG (German Research Association) (1996) [Maximum allowable workplace concentrations andbiological tolerance values for working materials.] Weinheim, Germany, VCH-Verlag, 188 pp (inGerman).
Dianov-Klokov VI & Yurganov LN (1981) A spectroscopic study of the global space-time distributionof atmospheric CO. Tellus, 33: 262-273.
Dianov-Klokov VI, Fokeyeva YeV, & Yurganov LN (1978) A study of the carbon monoxide content ofthe atmosphere. Izv Acad Sci USSR Atmos Oceanic Phys, 14: 263-270.
Di Giovanni V, Cagiano R, De Salvia MA, Giustino A, Lacomba C, Renna G, & Cuomo V (1993)Neurobehavioural changes produced in rats by prenatal exposure to carbon monoxide. Brain Res, 616:126-131.
Doblar DD, Santiago TV, & Edelman NH (1977) Correlation between ventilatory and cerebrovascularresponses to inhalation of CO. J Appl Physiol Respir Environ Exercise Physiol, 43: 455-462.
Dobson AJ, Alexander HM, Heller RF, & Lloys DM (1991) Passive smoking and the risk of heart attackor coronary death. Med J Aust, 154(12): 793-797.
Dockery DW & Spengler JD (1981) Personal exposure to respirable particulates and sulfates. J AirPollut Control Assoc, 31: 153-159.
Dodds RG, Penney DG, & Sutariya BB (1992) Cardiovascular, metabolic and neurologic effects ofcarbon monoxide and cyanide in the rat. Toxicol Lett, 61: 243-254.
Dolan MC, Haltom TL, Barrows GH, Short CS, & Ferriell KM (1987) Carboxyhemoglobin levels inpatients with flu-like symptoms. Ann Emerg Med, 16: 782-786.
Dominick MA & Carson TL (1983) Effects of carbon monoxide exposure on pregnant sows and theirfetuses. Am J Vet Res, 44: 35-40.
Donchin E, McCarthy G, & Kutas M (1977) Electro-encephalographic investigations of hemisphericspecialization. In: Desmedt JE ed. Progress in clinical neurophysiology, Volume 3: Language andhemispheric specialization in man — cerebral event related potentials. Basel, S. Karger, pp 212-242.
Dor F, LeMoullec Y, & Festy B (1995) Exposure of city residents to carbon monoxide and monocyclicaromatic hydrocarbons during commuting trips in the Paris Metropolitan Area. J Air Waste ManageAssoc, 45: 103-110.

EHC 213: Carbon Monoxide
362
Douglas CG, Haldane JS, & Haldane JBS (1912) The laws of combination of haemoglobin withcarbon monoxide and oxygen. J Physiol, 44: 275-304.
Drägerwerk AG (1994) Dräger tube handbook, 9th ed. Lübeck, Drägerwerk.
Drinkwater BL, Raven PB, Horvath SM, Gliner JA, Ruhling RO, Bolduan NW, & Taguchi S (1974)Air pollution, exercise, and heat stress. Arch Environ Health, 28: 177-181.
Driscoll JN & Berger AW (1971) Improved chemical methods for sampling and analysis of gaseouspollutants from the combustion of fossil fuels — Volume III: Carbon monoxide. Cincinnati, Ohio, USEnvironmental Protection Agency, Office of Air Programs (Report No. APTD-1109, available fromNTIS, Springfield, Virginia, USA).
Duan N (1982) Models for human exposure to air pollution. Environ Int, 8: 305-309.
Duncan JS & Gumpert J (1983) A case of blindness following carbon monoxide poisoning, treatedwith dopamine. J Neurol Neurosurg Psychiatry, 46: 459.
Dvoryashina EV, Dianov-Klokov VI, & Yurganov YL (1982) Results of carbon monoxide abundancemeasurements at Zvenigorod, 1970-1982. Moscow, USSR Academy of Sciences.
Dvoryashina EV, Dianov-Klokov VI, & Yurganov YL (1984) Variations of the carbon monoxide contentin the atmosphere for 1970-1982. Atmos Ocean Phys, 20(1): 27-33.
Dyer RS & Annau Z (1978) Carbon monoxide and superior colliculus evoked potentials. In: Otto DAed. Multidisciplinary perspectives in event-related brain potential research: Proceedings of the FourthInternational Congress on Event-Related Slow Potentials of the Brain (EPIC IV), Hendersonville, NC, April 1976. Washington, DC, US Environmental Protection Agency, Office ofResearch and Development, pp 417-419 (EPA-600/9-77-043).
Ebisuno S, Yasuno M, Yamada Y, Nishino Y, Hori M, Inoue M, & Kamada T (1986) Myocardialinfarction after acute carbon monoxide poisoning: case report. Angiology, 37: 621-624.
Eckardt RE, MacFarland HN, Alarie YCE, & Busey WM (1972) The biologic effect from long-termexposure of primates to carbon monoxide. Arch Environ Health, 25: 381-387.
Eerens HC, van Velze K, Bezuglaya E, Burn J, & Grønskei K (1995) Air quality in major Europeancities. Bilthoven, The Netherlands, National Institute of Public Health and Environmental Protection(RIVM Report No. 722401009).
Effeney DJ (1987) Prostacyclin production by the heart: effect of nicotine and carbon monoxide. JVasc Surg, 5: 237-247.
Ehhalt DH & Schmidt U (1978) Sources and sinks of atmospheric methane. Pure Appl Geophys,116: 452-464.
Einzig S, Nicoloff DM, & Lucus RV Jr (1980) Myocardial perfusion abnormalities in carbon monoxidepoisoned dogs. Can J Physiol Pharmacol, 58: 396-405.
Ekblom B & Huot R (1972) Response to submaximal and maximal exercise at different levels ofcarboxyhemoglobin. Acta Physiol Scand, 86: 474-482.
Elkharrat D, Raphael JC, Korach JM, Jars-Guincestre MC, Chastang C, Harboun C, & Gajdos P(1991) Acute carbon monoxide intoxication and hyperbaric oxygen in pregnancy. Intensive Care Med,17(5): 289-292.
References
363
Ellenhorn MJ & Barceloux DG ed (1988) Medical toxicology diagnosis and treatment of humanpoisoning. New York, Elsenin, pp 820-829.
Elsasser S, Mall T, Grossenbacher M, Zuber M, Perruchoud AP, & Ritz R (1995) Influence of carbonmonoxide (CO) on the early course of acute myocardial infarction. Intensive Care Med, 21(9): 716-722.
Engen T (1986) The combined effect of carbon monoxide and alcohol on odor sensitivity.Environ Int, 12: 207-210.
Epstein SE, Quyyumi AA, & Bonow RO (1988) Myocardial ischemia — silent or symptomatic. N EnglJ Med, 318: 1038-1043.
Epstein SE, Quyyumi AA, & Bonow RO (1989) Sudden cardiac death without warning: possiblemechanisms and implications for screening asymptomatic populations. N Engl J Med, 321: 320-324.
Erecinska M & Wilson DF (1982) Regulation of cellular energy metabolism. J Membr Biol, 70: 1-14.
Estabrook RW, Franklin MR, & Hildebrandt AG (1970) Factors influencing the inhibitory effect ofcarbon monoxide on cytochrome P-450-catalyzed mixed function oxidation reactions. In: Coburn RFed. Biological effects of carbon monoxide. Ann NY Acad Sci, 174: 218-232.
European Environmental Agency (1995) Core inventories air — CORINAIR 90: Summary.Copenhagen, Denmark, European Environmental Agency.
Evans RG, Webb K, Homan S, & Ayres SM (1988) Cross-sectional and longitudinal changes inpulmonary function associated with automobile pollution among bridge and tunnel officers. Am J IndMed, 14: 25-36.
Fabian P, Borchers R, Flentje G, Matthews WA, Seiler W, Giehl H, Bunse K, Mueller F, Schmidt U,Volz A, Khedim A, & Johnen FJ (1981) The vertical distribution of stable trace gases at mid-latitudes.J Geophys Res Oceans Atmos, C86: 5179-5184.
Faith WL, Renzetti NA, & Rogers LH (1959) Fifth technical progress report. San Marino, California,Air Pollution Foundation.
Farber JP, Schwartz PJ, Vanoli E, Stramba-Badiale M, & De Ferrari GM (1990) Carbon monoxideand lethal arrhythmias. Cambridge, Massachusetts, Health Effects Institute (Research Report No. 36).
Faure J, Arsac P, & Chalandre P (1983) Prospective study in carbon monoxide intoxication by gaswater heaters. Hum Toxicol, 2: 422-425.
Fechter LD (1988) Interactions between noise exposure and chemical asphyxiants: evidence forpotentiation of noise induced hearing loss. In: Berglund B, Berglund U, Karlsson J, & Lindvall T ed.Noise as a public health problem, Volume 3: Performance, behaviour, animal, combined agents, andcommunity responses — Proceedings of the 5th International Congress on Noise as a Public HealthProblem, Stockholm, August 1988. Stockholm, Sweden, Swedish Council for Building Research, pp117-122.
Fechter LD & Annau Z (1977) Toxicity of mild prenatal carbon monoxide exposure. Science, 197:680-682.

EHC 213: Carbon Monoxide
364
Fechter LD & Annau Z (1980a) Persistent neurotoxic consequences of mild prenatal carbon monoxideexposure. In: Multidisciplinary approach to brain development. Amsterdam, Elsevier/North-HollandBiomedical Press, pp 111-112.
Fechter LD & Annau Z (1980b) Prenatal carbon monoxide exposure alters behavioral development.Neurobehav Toxicol, 2: 7-11.
Fechter LD, Thakur M, Miller B, Annau Z, & Srivastava U (1980) Effects of prenatal carbon monoxideexposure on cardiac development. Toxicol Appl Pharmacol, 56: 370-375.
Fechter LD, Mactutus CF, & Storm JE (1986) Carbon monoxide and brain development.Neurotoxicology, 7: 463-473.
Fechter LD, Karpa MD, Proctor B, Lee AG, & Storm JE (1987) Disruption of neostriatal developmentin rats following perinatal exposure to mild, but chronic carbon monoxide. Neurotoxicol Teratol,9: 277-281.
Fechter LD, Young JS, & Carlisle L (1988) Potentiation of noise induced threshold shifts and hair cellloss by carbon monoxide. Hear Res, 34: 39-47.
Federal Aviation Administration (1988) FAA air traffic activity. Washington, DC, US Department ofTransportation, Office of Management Systems.
Federal Environmental Agency (1997) [Data about the environment, 1994/1995.] Berlin, ErichSchmidt Verlag (in German).
Federal Register (1985) Review of the national ambient air quality standards for carbon monoxide:Final rule. Fed Reg, 50: 37484-37501.
Fein A, Grossman RF, Jones JG, Hoeffel J, & McKay D (1980) Carbon monoxide effect on alveolarepithelial permeability. Chest, 78: 726-731.
Feldstein M (1967) Methods for the determination of carbon monoxide. Prog Chem Toxicol, 3: 99-119.
Fenn WO (1970) The burning of CO in tissues. In: Coburn RF ed. Biological effects of carbonmonoxide. Ann NY Acad Sci, 174: 64-71.
Fenn WO & Cobb DM (1932) The burning of carbon monoxide by heart and skeletal muscle.Am J Physiol, 102: 393-401.
Fernadenz-Bremauntz AA & Ashmore MR (1995a) Exposure of commuters to carbon monoxide inMexico City: I. Measurement of in-vehicle concentrations. Atmos Environ, 29: 525-532. Fernadenz-Bremauntz AA & Ashmore MR (1995b) Exposure of commuters to carbon monoxide inMexico City: II. Comparison of in-vehicle and fixed site concentrations. J Expo Anal EnvironEpidemiol, 5: 497-510.
Fink HJ & Klais O (1978) Global distribution of fluorocarbons. Ber Bunsenges Phys Chem,82: 1147-1150.
Fisher AB & Dodia C (1981) Lung as a model for evaluation of critical intracellular PO2 and PCO.
Am J Physiol, 241: E47-E50.
Fisher J & Rubin KP (1982) Occult carbon monoxide poisoning. Arch Intern Med, 142: 1270-1271.

References
365
Fisher AB, Hyde RW, Baue AE, Reif JS, & Kelly DF (1969) Effect of carbon monoxide on functionand structure of the lung. J Appl Physiol, 26: 4-12.
Fisher GL, Chrisp CE, & Raabe OG (1979) Physical factors affecting the mutagenicity of fly ash froma coal-fired power plant. Science, 204: 879-881. Fitzgerald RS & Traystman RJ (1980) Peripheral chemoreceptors and the cerebral vascular responseto hypoxemia. Fed Proc, 39: 2674-2677.
Flachsbart PG (1989) Effectiveness of priority lanes in reducing travel time and carbon monoxideexposure. Inst Transport Eng J, 59: 41-45.
Flachsbart PG & Brown DE (1989) Employee exposure to motor vehicle exhaust at a Honolulushopping center. J Archit Plan Res, 6: 19-33.
Flachsbart PG & Ott WR (1986) A rapid method for surveying CO concentrations in high-risebuildings. In: Berglund B, Berglund U, Lindvall T, Spengler J, & Sundell J ed. Indoor air quality:Papers from the 3rd International Conference on Indoor Air Quality and Climate, Stockholm, August1984. Environ Int, 12: 255-264.
Flachsbart PG, Mack GA, Howes JE, & Rodes CE (1987) Carbon monoxide exposures of Washingtoncommuters. J Air Pollut Control Assoc, 37: 135-142.
Fodor GG & Winneke G (1972) Effect of low CO concentrations on resistance to monotony and onpsychomotor capacity. Staub-Reinhalt Luft, 32: 46-54.
Forbes WH, Dill DB, De Silva H, & Van deVenter FM (1937) The influence of moderate carbonmonoxide poisoning upon the ability to drive automobiles. J Ind Hyg Toxicol, 19: 598-603.
Forbes WH, Sargent F, & Roughton FJW (1945) The rate of carbon monoxide uptake by normal men.Am J Physiol, 143: 594-608.
Forster RE (1964) Diffusion of gases. In: Fenn WO & Rahn H ed. Handbook of physiology: a critical,comprehensive presentation of physiological knowledge and concepts, Section 3: Respiration.Washington, DC, American Physiological Society, vol 1, pp 839-872.
Forster RE (1987) Diffusion of gases across the alveolar membrane. In: Fishman AP, Farhi LE,Tenney SM, & Geiger SR ed. Handbook of physiology: a critical, comprehensive presentation ofphysiological knowledge and concepts, Volume IV: Gas exchange, Section 3: The respiratory system.Bethesda, Maryland, American Physiological Society, pp 71-88.
Forycki Z, Swica P, Krasnowiecki A, Dubicki J, & Panow A (1980) [Electrocardiographic changesduring acute poisonings.] Pol Tyg Lek, 35: 1941-1944 (in Polish).
Foster JR (1981) Arrhythmogenic effects of carbon monoxide in experimental acute myocardialischemia: lack of slowed conduction and ventricular tachycardia. Am Heart J, 102: 876-882.
Fozo MS & Penney DG (1993) Dibromomethane and carbon monoxide in the rat: Comparison of thecardiovascular and metabolic effects. J Appl Toxicol, 13: 147-151.
Fraser PJ, Hyson P, Rasmussen RA, Crawford AJ, & Khalil MAK (1986) Methane, carbon monoxideand methylchloroform in the southern hemisphere. J Atmos Chem, 4: 3-42.
Frey TM, Crapo RO, Jensen RL, & Elliott CG (1987) Diurnal variation of the diffusing capacity of thelung: is it real? Am Rev Respir Dis, 136: 1381-1384.

EHC 213: Carbon Monoxide
366
Fristedt B & Akesson B (1971) [Health hazards from automobile exhausts at service facilities ofmultistory garages.] Hyg Revy, 60: 112-118 (in Swedish).
Gannon BJ, Fleming BP, Heesch CM, Barron KW, & Diana JN (1988) Effects of acute carbonmonoxide exposure on precapillary vessels in the rat cremaster muscle. FASEB J, 2: A743.
Garland C, Barrett-Connor E, Suarez L, Criqui MH, & Wingard DL (1985) Effects of passive smokingon ischemic heart disease mortality of nonsmokers. Am J Epidemiol, 121: 645-650.
Garvey DJ & Longo LD (1978) Chronic low level maternal carbon monoxide exposure and fetal growthand development. Biol Reprod, 19: 8-14.
Gautier H & Bonora M (1983) Ventilatory response of intact cats to carbon monoxide hypoxia. J ApplPhysiol Respir Environ Exercise Physiol, 55: 1064-1071.
Gilli G, Scursatore E, Vanini G, & Vercellotti E (1979) Serum thiocyanate values as a discriminatingelement in assessment of exposure to carbon monoxide. Minerva Med, 70: 2803-2810.
Gillis CR, Hole DJ, Hawthorne VM, & Boyle P (1984) The effect of environmental tobacco smoke intwo urban communities in the west of Scotland. In: Rylander R, Peterson Y, & Snella M-C ed. ETS— Environmental tobacco smoke: Report from a Workshop on Effects and Exposure Levels, Geneva,Switzerland, March 1983. Eur J Respir Dis, 65(suppl 133): 121-126.
Ginsberg R & Romano J (1976) Carbon monoxide encephalopathy: Need for appropriate treatment.Am J Psychol, 133: 317-320.
Girman JR, Apte MG, Traynor GW, Allen JR, & Hollowell CD (1982) Pollutant emission rates fromindoor combustion appliances and sidestream cigarette smoke. Environ Int, 8: 213-221.
Giustino A, Cagiano R, Carratú MR, De Salvia MA, Panaro MA, Jirillo E, & Cuomo V (1993)Immunological changes produced in rats by prenatal exposure to carbon monoxide. PharmacolToxicol, 73: 274-278.
Giustino A, Carratú MR, Siro-Brigiani G, De Salvia MA, Pellegrino NM, Steardo L, Jirillo E, & CuomoV (1994) Changes in the frequency of splenic immunocompetent cells in rats exposed to carbonmonoxide during gestation. Immunopharmacol Immunotoxicol, 16: 281-292.
Glantz SA & Parmley WW (1991) Passive smoking and heart disease: epidemiology, physiology, andbiochemistry. Circulation, 83: 1-12.
Gliner JA, Raven PB, Horvath SM, Drinkwater BL, & Sutton JC (1975) Man’s physiologic responseto long-term work during thermal and pollutant stress. J Appl Physiol, 39: 628-632.
Gliner JA, Horvath SM, & Mihevic PM (1983) Carbon monoxide and human performance in a singleand dual task methodology. Aviat Space Environ Med, 54: 714-717.
Godin G & Shephard RJ (1972) On the course of carbon monoxide uptake and release. Respiration,29: 317-329.
Godin G, Wright G, & Shephard RJ (1972) Urban exposure to carbon monoxide. Arch Environ Health,25: 305-313.
Goethert M (1972) Factors influencing the CO content of tissues. Staub-Reinhalt Luft, 32: 15-20.
References
367
Goethert M, Lutz F, & Malorny G (1970) Carbon monoxide partial pressure in tissue of differentanimals. Environ Res, 3: 303-309.
Goldbaum LR, Chace DH, & Lappas NT (1986) Determination of carbon monoxide in blood by gaschromatography using a thermal conductivity detector. J Forensic Sci, 31: 133-142.
Goldsmith JR (1970) Contribution of motor vehicle exhaust, industry, and cigarette smoking tocommunity carbon monoxide exposures. In: Coburn RF ed. Biological effects of carbon monoxide.Ann NY Acad Sci, 174: 122-134.
Goldsmith JR & Landaw SA (1968) Carbon monoxide and human health. Science, 162: 1352-1358.
Goldstein HW, Bortner MH, Grenda RN, Dick R, & Barringer AR (1976) Correlation interferometricmeasurement of carbon monoxide and methane from the Canada Centre for Remote Sensing FalconFan-Jet Aircraft. Can J Remote Sens, 2: 30-41.
Gong CH & Wang LJZ (1995) The effects of CO at low concentration on lipid peroxidation andglutathione peroxidation in rats. Environ Health, 12: 111-114.
Grace TW & Platt FW (1981) Subacute carbon monoxide poisoning: another great imitator. J AmMed Assoc, 246: 1698-1700.
Greenberg JP, Zimmerman PR, & Chatfield RB (1985) Hydrocarbons and carbon monoxide in Africansavannah air. Geophys Res Lett, 12: 113-116.
Groll-Knapp E, Wagner H, Hauck H, & Haider M (1972) Effects of low carbon monoxideconcentrations on vigilance and computer-analyzed brain potentials. Staub-Reinhalt Luft, 32: 64-68.
Groll-Knapp E, Haider M, Hoeller H, Jenkner H, & Stidl HG (1978) Neuro- and psychophysiologicaleffects of moderate carbon monoxide exposure. In: Otto DA ed. Multidisciplinary perspectives inevent-related brain potential research: Proceedings of the 4th International Congress on Event-RelatedSlow Potentials of the Brain (EPIC IV), Hendersonville, NC, April 1976. Washington, DC,US Environmental Protection Agency, Office of Research and Development, pp 424-430(EPA-600/9-77-043).
Groll-Knapp E, Haider M, Jenkner H, Liebich H, Neuberger M, & Trimmel M (1982) Moderate carbonmonoxide exposure during sleep: neuro- and psychophysiological effects in young and elderly people.Neurobehav Toxicol Teratol, 4: 709-716.
Groll-Knapp E, Haider M, Kienzl K, Handler A, & Trimmel M (1988) Changes in discriminationlearning and brain activity (ERP’s) due to combined exposure to NO and CO in rats. Toxicology, 49:441-447.
Grôsslinger E & Radunsky K ed. (1995) Corinair 90 summary: Summary report No. 1. EuropeanTopic Centre on Air Emissions (Report to the European Environmental Agency).
Grut A (1949) Chronic carbon monoxide poisoning: a study in occupational medicine. Copenhagen,Ejnar Munksgaard.
Gryvnak DA & Burch DE (1976a) Monitoring of pollutant gases in aircraft exhausts by gas-filtercorrelation methods. Presented at the AIAA 14th Aerospace Sciences Meeting, Washington, DC,January 1976. New York, American Institute of Aeronautics and Astronautics (AIAA Paper No.76-110).

EHC 213: Carbon Monoxide
368
Gryvnak DA & Burch DE (1976b) Monitoring NO and CO in aircraft jet exhaust by a gas-filtercorrelation technique. Dayton, Ohio, Wright-Patterson Air Force Base, US Air Force, AeropropulsionLaboratory (Report No. AFAPL-TR-75-101, available from NTIS, Springfield, Virginia, USA).
Guest ADL, Duncan C, & Lawther PJ (1970) Carbon monoxide and phenobarbitone: a comparisonof effects on auditory flutter fusion threshold and critical flicker fusion threshold. Ergonomics, 13:587-594.
Guillot JG, Weber JP, & Savoie JY (1981) Quantitative determination of carbon monoxide in bloodby head-space gas chromatography. J Anal Toxicol, 5: 264-266.
Gurtner GH, Traystman RJ, & Burns B (1982) Interactions between placental O2 and CO transfer.J Appl Physiol Respir Environ Exercise Physiol, 52: 479-487.
Guyatt AR, Holmes MA, & Cumming G (1981) Can carbon monoxide be absorbed from the upperrespiratory tract in man? Eur J Respir Dis, 62: 383-390.
Guyatt AR, Kirkham AJT, Mariner DC, & Cumming G (1988) Is alveolar carbon monoxide anunreliable index of carboxyhaemoglobin changes during smoking in man? Clin Sci, 74: 29-36.
Guyton AC & Richardson TQ (1961) Effect of hematocrit on venous return. Circ Res, 9: 157-164.
Gvozdjakova A, Bada V, Sany L, Kucharska J, Kruty F, Bozek P, Trstansky L, & Gvozdjak J (1984)Smoke cardiomyopathy: disturbance of oxidative processes in myocardial mitochondria. CardiovascRes, 18: 229-232.
Hackney JD, Kaufman GA, Lashier H, & Lynn K (1962) Rebreathing estimate of carbon monoxidehemoglobin. Arch Environ Health, 5: 300-307.
Hackney JD, Linn WS, Mohler JG, Pedersen EE, Breisacher P, & Russo A (1975a) Experimentalstudies on human health effects of air pollutants: II. Four-hour exposure to ozone alone and incombination with other pollutant gases. Arch Environ Health, 30: 379-384.
Hackney JD, Linn WS, Law DC, Karuza SK, Greenberg H, Buckley RD, & Pedersen EE (1975b)Experimental studies on human health effects of air pollutants: III. Two-hour exposure to ozone aloneand in combination with other pollutant gases. Arch Environ Health, 30: 385-390.
Hagberg M, Kolmodin-Hedman B, Lindahl R, Nilsson C-A, & Norstrom A (1985) Irritative complaints,carboxyhemoglobin increase and minor ventilatory function changes due to exposure to chain-sawexhaust. Eur J Respir Dis, 66: 240-247.
Hagen DF & Holiday GW (1964) The effects of engine operating and design variables on exhaustemissions. In: Vehicle emissions (selected SAE papers). New York, Society of Automotive Engineers,Inc., pp 206-223 (Technical Progress Series, Volume 6).
Haggendal E & Norback B (1966) Effect of viscosity on cerebral blood flow. Acta Chir Scand,364(suppl): 13-22.
Haider M, Groll-Knapp E, Hoeller H, Neuberger M, & Stidl H (1976) Effects of moderate CO dose onthe central nervous system — electrophysiological and behaviour data and clinical relevance. In:Finkel AJ & Duel WC ed. Clinical implications of air pollution research: Air Pollution Medical ResearchConference, San Francisco, California, December 1974. Acton, Massachusetts, Publishing SciencesGroup, Inc., pp 217-232.

References
369
Haldane J (1898) Some improved methods of gas analysis. J Physiol (Lond), 22: 465-480.
Haldane JS & Priestley JG (1935) Respiration. New Haven, Connecticut, Yale University Press.
Halebian P, Barie P, Robinson N, & Shires GT (1984a) Effects of carbon monoxide on pulmonary fluidaccumulation. Curr Surg, 41: 369-371.
Halebian P, Sicilia C, Hariri R, Inamdar R, & Shires GT (1984b) A safe and reproducible model ofcarbon monoxide poisoning. Ann NY Acad Sci, 435: 425-428.
Halperin MH, McFarland RA, Niven JI, & Roughton FJW (1959) The time course of the effects ofcarbon monoxide on visual thresholds. J Physiol (Lond), 146: 583-593.
Hameed S & Stewart RW (1979) Latitudinal distribution of the sources of carbon monoxide in thetroposphere. Geophys Res Lett, 6: 841-844.
Hanley DF, Wilson DA, & Traystman RJ (1986) Effect of hypoxia and hypercapnia on neurohypo-physeal blood flow. Am J Physiol, 250: H7-H15.
Hansen ES (1989) Mortality of auto mechanics: a ten-year follow-up. Scand J Work Environ Health,15: 3-46.
Hanst PL, Spence JW, & Edney EO (1980) Carbon monoxide production in photooxidation of organicmolecules in the air. Atmos Environ, 14: 1077-1088.
Hare CT & Springer KJ (1973) Exhaust emissions from uncontrolled vehicles and related equipmentusing internal combustion engines, Part 4: Small air-cooled spark ignition utility engines. Ann Arbor,Michigan, US Environmental Protection Agency, Office of Air and Water Programs (Publication No.APTD-1493, available from NTIS, Springfield, Virginia, USA).
Harrison N (1975) A review of techniques for the measurement of carbon monoxide in theatmosphere. Ann Occup Hyg, 18: 37-44.
Hartwell TD, Clayton CA, Ritchie RM, Whitmore RW, Zelon HS, Jones SM, & Whitehurst DA (1984)Study of carbon monoxide exposure of residents of Washington, DC and Denver, Colorado. ResearchTriangle Park, North Carolina, US Environmental Protection Agency, Environmental MonitoringSystems Laboratory (EPA-600/4-84-031).
He Y (1989) [Women’s passive smoking and coronary heart disease.] Zhonghua Yufang Yixue Zazhi,23: 19-22 (in Chinese).
Heckerling PS, Leikin JB, Maturen A, & Perkins JT (1987) Predictors of occult carbon monoxidepoisoning in patients with headache and dizziness. Ann Intern Med, 107: 174-176.
Heckerling PS, Leikin JB, & Maturen A (1988) Occult carbon monoxide poisoning: validation of aprediction model. Am J Med, 84: 251-256.
Heidt LE, Krasnec JP, Lueb RA, Pollock WH, Henry BE, & Crutzen PJ (1980) Latitudinal distributionsof CO and CH4 over the Pacific. J Geophys Res Oceans Atmos, C85: 7329-7336.
Heimbach DM & Waeckerle JF (1988) Inhalation injuries. Ann Emerg Med, 17: 1316-1320.
Heinold DW, Sacco AM, & Insley EM (1987) Tollbooth operator exposure on the New JerseyTurnpike. Presented at the 80th Annual Meeting of the Air Pollution Control Association, New York,June 1987. Pittsburgh, Pennsylvania, Air Pollution Control Association (Paper No. 87-84A.12).

EHC 213: Carbon Monoxide
370
Hellums JD (1977) The resistance to oxygen transport in the capillaries relative to that in thesurrounding tissue. Microvasc Res, 13: 131-136.
Helsing KJ, Sandler DP, Comstock GW, & Chee E (1988) Heart disease mortality in nonsmokersliving with smokers. Am J Epidemiol, 127: 915-922.
Henningfield JE, Stitzer ML, & Griffiths RR (1980) Expired air carbon monoxide accumulation andelimination as a function of number of cigarettes smoked. Addict Behav, 5: 265-272.
Herget WF, Jahnke JA, Burch DE, & Gryvnak DA (1976) Infrared gas-filter correlation instrument forin situ measurement of gaseous pollutant concentrations. Appl Opt, 15: 1222-1228.
Hernberg S, Karava R, Koskela R-S, & Luoma K (1976) Angina pectoris, ECG findings and bloodpressure of foundry workers in relation to carbon monoxide exposure. Scand J Work Environ Health,2(suppl 1): 54-63.
Hersch P (1964) Galvanic analysis. In: Reilley CN ed. Advances in analytical chemistry andinstrumentation. New York, Interscience Publishers, vol 3, pp 183-249.
Hersch PA (1966) US Patent 3,258,411: Method and apparatus for measuring the carbon monoxidecontent of a gas stream. Washington, DC, US Patent Office (Beckman Instruments, Inc., assignee).
Hexter AC & Goldsmith JR (1971) Carbon monoxide: association of community air pollution withmortality. Science, 172: 265-266.
Hill EP, Hill JR, Power GG, & Longo LD (1977) Carbon monoxide exchanges between the humanfetus and mother: a mathematical model. Am J Physiol, 232: H311-H323.
Hinderliter AL, Adams KF Jr, Price CJ, Herbst MC, Koch G, & Sheps DS (1989) Effects of low-levelcarbon monoxide exposure on resting and exercise-induced ventricular arrhythmias in patients withcoronary artery disease and no baseline ectopy. Arch Environ Health, 44: 89-93.
Hirayama T (1984) Lung cancer in Japan: effects of nutrition and passive smoking. In: Mizell M &Correa P ed. Lung cancer — causes and prevention: Proceedings of the International Lung CancerUpdate Conference, New Orleans, LA, March 1983. New York, Verlag Chemie International, pp175-195 (Biomedical Advances in Carcinogenesis, Volume 1).
Hirsch GL, Sue DY, Wasserman K, Robinson TE, & Hansen JE (1985) Immediate effects of cigarettesmoking on cardiorespiratory responses to exercise. J Appl Physiol, 58: 1975-1981.
Hoegg UR (1972) Cigarette smoke in closed spaces. Environ Health Perspect, 2: 117-128.
Hoell JM, Gregory GL, Carroll MA, McFarland M, Ridley BA, Davis DD, Bradshaw J, Rodgers MO,Torres AL, Sachse GW, Hill GF, Condon EP, Rasmussen RA, Campbell MC, Farmer JC, SheppardJC, Wang CC, & Davis LI (1984) An intercomparison of carbon monoxide, nitric oxide, and hydroxylmeasurement techniques: Overview of results. J Geophys Res, 89: 11819-11825.
Hole DJ, Gillis CR, Chopra C, & Hawthorne VM (1989) Passive smoking and cardiorespiratory healthin a general population in the west of Scotland. Br Med J, 299: 423-427.
Honigman B, Cromer R, & Kurt TL (1982) Carbon monoxide levels in athletes during exercise in anurban environment. J Air Pollut Control Assoc, 32: 77-79.
References
371
Hoofd L & Kreuzer F (1978) Calculation of the facilitation of O2 or CO transport by Hb or Mb by meansof a new method for solving the carrier-diffusion problem. In: Silver IA, Erecinska M, & Bicher HIed. Oxygen transport to tissue — III. New York, London, Plenum Press, pp 163-168 (Advances inExperimental Medicine and Biology, Volume 94).
Hoppenbrouwers T, Calub M, Arakawa K, & Hodgman JE (1981) Seasonal relationship of suddeninfant death syndrome and environmental pollutants. Am J Epidemiol, 113: 623-635.
Horvath SM (1975) Influence of carbon monoxide on cardiac dynamics in normal and cardiovascularstressed animals (Final report on grant ARB-2096). Santa Barbara, California, University of California,Institute on Environmental Stress (Available from NTIS, Springfield, Virginia, USA).
Horvath SM (1981) Impact of air quality in exercise performance. Exercise Sport Sci Rev, 9: 265-296.
Horvath SM & Bedi JF (1989) Alteration in carboxyhemoglobin concentrations during exposure to 9ppm carbon monoxide for 8 hours at sea level and 2134 m altitude in a hypobaric chamber. J AirPollut Control Assoc, 39: 1323-1327.
Horvath SM & Roughton FJW (1942) Improvements in the gasometric estimation of carbon monoxidein blood. J Biol Chem, 144: 747-755.
Horvath SM, Dahms TE, & O’Hanlon JF (1971) Carbon monoxide and human vigilance: a deleteriouseffect of present urban concentrations. Arch Environ Health, 23: 343-347.
Horvath SM, Raven PB, Dahms TE, & Gray DJ (1975) Maximal aerobic capacity at different levelsof carboxyhemoglobin. J Appl Physiol, 38: 300-303.
Horvath SM, Bedi JF, Wagner JA, & Agnew J (1988a) Maximal aerobic capacity at several ambientconcentrations of CO at several altitudes. J Appl Physiol, 65: 2696-2708.
Horvath SM, Agnew JW, Wagner JA, & Bedi JF (1988b) Maximal aerobic capacity at several ambientconcentrations of carbon monoxide at several altitudes. Cambridge, Massachusetts, Health EffectsInstitute (Research Report No. 21).
Hosey AD (1970) Priorities in developing criteria for “breathing air” standards. J Occup Med,12: 43-46.
Hosko MJ (1970) The effect of carbon monoxide on the visual evoked response in man and thespontaneous electroencephalogram. Arch Environ Health, 21: 174-180.
Huch R, Huch A, Tuchschmid P, Zijlstra WG, & Zwart A (1983) Carboxyhemoglobin concentrationin fetal cord blood. Pediatrics, 71: 461-462.
Hudnell HK & Benignus VA (1989) Carbon monoxide exposure and human visual detectionthresholds. Neurotoxicol Teratol, 11: 363-371.
Hugod C (1980) The effect of carbon monoxide exposure on morphology of lungs and pulmonaryarteries in rabbits: A light- and electron-microscopic study. Arch Toxicol, 43: 273-281.
Hugod C (1981) Myocardial morphology in rabbits exposed to various gas-phase constituents oftobacco smoke: An ultrastructural study. Atherosclerosis, 40: 181-190.

EHC 213: Carbon Monoxide
372
Hugod C, Hawkins LH, Kjeldsen K, Thomsen HK, & Astrup P (1978) Effect of carbon monoxideexposure on aortic and coronary intimal morphology in the rabbit. Atherosclerosis, 30: 333-342.
Humble C, Croft J, Gerber A, Casper M, Hames CG, & Tyroler HA (1990) Passive smoking and20-year cardiovascular disease mortality among nonsmoking wives, Evans County, Georgia.Am J Public Health, 80: 599-601.
Humphreys MP, Knight CV, & Pinnix JC (1986) Residential wood combustion impacts on indoorcarbon monoxide and suspended particulates. In: Proceedings of the 1986 EPA/APCA Symposiumon Measurement of Toxic Air Pollutants, Raleigh, NC, April 1986. Research Triangle Park, NorthCarolina, US Environmental Protection Agency, Environmental Monitoring Systems Laboratory, pp736-747 (EPA-600/9-86-013).
Hutcheon DE, Doorley BM, & Oldewurtel HA (1983) Carbon monoxide inhalation and the vulnerabilityof the ventricles to electrically induced arrhythmias. Fed Proc, 42: 1114.
Hutter CD & Blair ME (1996) Carbon monoxide — does fetal exposure cause sudden infant deathsyndrome? Med Hypotheses, 46(1): 1-4.
Hwang SJ, Cho SH, & Yun DR (1984) [Postexposure relationship between carboxyhemoglobin inblood and carbon monoxide in expired air.] Seoul J Med, 25: 511-516 (in Korean).
Iglewicz R, Rosenman KD, Iglewicz B, O’Leary K, & Hockemeier R (1984) Elevated levels of carbonmonoxide in the patient compartment of ambulances. Am J Public Health, 74: 511-512.
Ilano A & Raffin T (1990) Management of carbon monoxide poisoning. Chest, 97: 165-169.
Inman RE, Ingersoll RB, & Levy EA (1971) Soil: a natural sink for carbon monoxide. Science, 172:1229-1231.
Insogna S & Warren CA (1984) The effect of carbon monoxide on psychomotor function. In: Mital Aed. Trends in ergonomics/human factors: I. Amsterdam, Oxford, New York, Elsevier SciencePublishers, pp 331-337.
International Committee for Standardization in Haematology (1978) Recommendations for referencemethod for haemoglobinometry in human blood (ICSH standard EP 6/2: 1977) and specifications forinternational haemoglobincyanide reference preparation (ICSH standard EP 6/3: 1977). J Clin Pathol,31: 139-143.
IPCS (1979) Environmental health criteria 13: Carbon monoxide. Geneva, World Health Organization,International Programme on Chemical Safety.
Ischiropoulos H, Beers MF, Ohnishi ST, Fisher D, Garner SE, & Thom SR (1996) Nitric oxideproduction and perivascular nitration in brain after carbon monoxide poisoning in the rat. J Clin Invest,97: 2260-2267.
ISO (1989) International standard ISO 8186: Ambient air — Determination of the mass concentrationof carbon monoxide: Gas chromatographic method. Geneva, International Organization forStandardization.
ISO (1996) International standard ISO/DIS 4224: Ambient air — Determination of the mass concen-tration of carbon monoxide: Nondispersive infrared spectrometric method. Geneva, InternationalOrganization for Standardization.

References
373
Ito K & Thurston GD (1996) Daily PM10/mortality associations: an investigation of at-risk populations.J Expo Anal Environ Epidemiol, 6: 79-96.
Ito K, Kinney P, & Thurston GD (1995) Variations in PM10 concentrations within two metropolitanareas and their implication for health effects analysis. J Inhal Toxicol, 7(5): 735-745.
Iyanagi T, Suzaki T, & Kobayashi S (1981) Oxidation-reduction states of pyridine nucleotide andcytochrome P-450 during mixed-function oxidation in perfused rat liver. J Biol Chem, 256:12933-12939.
Jaffe LS (1968) Ambient carbon monoxide and its fate in the atmosphere. J Air Pollut Control Assoc,18: 534-540.
Jaffe LS (1973) Carbon monoxide in the biosphere: sources, distribution, and concentrations. JGeophys Res, 78: 5293-5305.
James PB (1989) Hyperbaric and normobaric oxygen in acute carbon monoxide poisoning. Lancet,1989(8666): 799-780.
James WE, Tucker CE, & Grover RF (1979) Cardiac function in goats exposed to carbon monoxide.J Appl Physiol Respir Environ Exercise Physiol, 47: 29-434.
Jantunen MJ, Alm S, Mukala K, Reponen A, & Tuomisto J (1995) Personal CO exposures ofpreschool children in Helsinki, Finland: The influence of transportation, epidemiology. Abstractspresented at the 1995 ISSE/ISEA Annual Conference, Noordvijkerhout, August-September 1995, pS/70.
Jarvis MJ (1987) Uptake of environmental tobacco smoke. In: O’Neill IK, Brunnemann KD, Dodet B,& Hoffmann D ed. Environmental carcinogens: Methods of analysis and exposure measurement,Volume 9 — Passive smoking. Lyon, International Agency for Research on Cancer, pp 43-58(IARC Scientific Publications No. 81).
Jobsis FF, Keizer JH, LaManna JC, & Rosenthal M (1977) Reflectance spectrophotometry ofcytochrome aa3 in vivo. J Appl Physiol Respir Environ Exercise Physiol, 43: 858-872.
Johnson T (1984) A study of personal exposure to carbon monoxide in Denver, Colorado. ResearchTriangle Park, North Carolina, US Environmental Protection Agency, Environmental MonitoringSystems Laboratory (EPA-600/4-84-014).
Johnson T (1987) A study of human activity patterns in Cincinnati, Ohio (Contract No. RP940-06).Palo Alto, California, Electric Power Research Institute.
Johnson T & Paul RA (1983) The NAAQS exposure model (NEM) applied to carbon monoxide.Research Triangle Park, North Carolina, US Environmental Protection Agency, Office of Air QualityPlanning and Standards (EPA-450/5-83-003).
Johnson CJ, Moran J, & Pekich R (1975a) Carbon monoxide in school buses. Am J Public Health,65: 1327-1329.
Johnson CJ, Moran JC, Paine SC, Anderson HW, & Breysse PA (1975b) Abatement of toxic levelsof carbon monoxide in Seattle ice-skating rinks. Am J Public Health, 65: 1087-1090.
Johnson T, Capel J, & Wijnberg L (1986) Selected data analyses relating to studies of personalcarbon monoxide exposure in Denver and Washington, DC (Contract No. 68-02-3496). Research

EHC 213: Carbon Monoxide
374
Triangle Park, North Carolina, US Environmental Protection Agency, Environmental MonitoringSystems Laboratory.
Johnson T, Capel J, & Wijnberg L (1990) The incorporation of serial correlation into a version of NEMapplicable to carbon monoxide (Contract No. 68-02-44069). Research Triangle Park, North Carolina,US Environmental Protection Agency, Atmospheric Research and Exposure Assessment Laboratory.
Jones JG & Sinclair A (1975) Arterial disease amongst blast furnace workers. Ann Occup Hyg, 18:15-20.
Jones JG & Walters DH (1962) A study of carboxyhaemoglobin levels in employees at an integratedsteelworks. Ann Occup Hyg, 5: 221-230.
Jones RH, Ellicott MF, Cadigan JB, & Gaensler EA (1958) The relationship between alveolar andblood carbon monoxide concentrations during breathholding. J Lab Clin Med, 51: 553-564.
Jones RA, Strickland JA, Stunkard JA, & Siegel J (1971) Effects on experimental animals oflong-term inhalation exposure to carbon monoxide. Toxicol Appl Pharmacol, 19: 46-53.
Junge CE (1963) In: von Mieghem J & Hales AL ed. Air chemistry and radioactivity — Volume 4.New York, London, Academic Press (International Geophysics series).
Kahn A, Rutledge RB, Davis GL, Altes JA, Gantner GE, Thornton CA, & Wallace ND (1974)Carboxyhemoglobin sources in the metropolitan St. Louis population. Arch Environ Health, 29:127-135. Kane DM (1985) Investigation of the method to determine carboxyhaemoglobin in blood. Downsview,Ontario, Canada, Department of National Defence, Defence and Civil Institute of EnvironmentalMedicine (Report No. DCIEM-85-R-32, available from NTIS, Springfield, Virginia, USA).
Kannel WB & Abbott RD (1984) Incidence and prognosis of unrecognized myocardial infarction: anupdate on the Framingham study. N Engl J Med, 311: 1144-1147.
Kanten WE, Penney DG, Francisco K, & Thill JE (1983) Hemodynamic responses to acutecarboxyhemoglobinemia in the rat. Am J Physiol, 244: H320-H327.
Katafuchi Y, Nishimi T, Yamaguchi Y, Matsuishi T, Kimura Y, Otaki E, & Yamashita Y (1985) Corticalblindness in acute carbon monoxide poisoning. Brain Dev, 7: 516-519.
Katsumata Y, Aoki M, Oya M, Yada S, & Suzuki O (1980) Liver damage in rats during acute carbonmonoxide poisoning. Forensic Sci Int, 16: 119-123.
Katsumata Y, Sato K, & Yada S (1985) A simple and high-sensitive method for determination ofcarbon monoxide in blood by gas chromatography. Hanzaigaku Zasshi, 51: 139-144.
Katzman GM & Penney DG (1993) Electrocardiographic responses to carbon monoxide and cyanidein the conscious rat. Toxicol Lett, 69: 139-153.
Kaufman S (1966) D. Coenzymes and hydroxylases: ascorbate and dopamine-ß-hydroxylase;tetrahydropteridines and phenylalanine and tyrosine hydroxylases. Pharmacol Rev, 18: 61-69.
Kaul B, Calabro J, & Hutcheon DE (1974) Effects of carbon monoxide on the vulnerability of theventricles to drug-induced arrhythmias. J Clin Pharmacol, 14: 25-31.

References
375
Kawachi I, Pearce NE, & Jackson RT (1989) Deaths from lung cancer and ischaemic heart diseasedue to passive smoking in New Zealand. NZ Med J, 102(871): 337-340.
Kawachi I, Colditz GA, Speizer FE, Manson JE, Stampfer MJ, Willett WE, & Hennekens CH (1997)A prospective study of passive smoking and coronary heart disease. Circulation, 95(10): 2374-2379.
Keilin D & Hartree EF (1939) Cytochrome and cytochrome oxidase. Proc R Soc Lond, B127: 167-191.
Kelley JS & Sophocleus GJ (1978) Retinal hemorrhages in subacute carbon monoxide poisoning:exposures in homes with blocked furnace flues. J Am Med Assoc, 239: 1515-1517.
Kety SS & Schmidt CF (1948) The effects of altered arterial tensions of carbon dioxide and oxygenon cerebral blood flow and cerebral oxygen consumption of normal young men. J Clin Invest,27: 484-492.
Khalil MAK & Rasmussen RA (1984a) Carbon monoxide in the earth’s atmosphere: increasing trend.Science, 224: 54-56.
Khalil MAK & Rasmussen RA (1984b) The global increase of carbon monoxide. In: Aneja VPed. Environmental impact of natural emissions: Proceedings of an Air Pollution Control AssociationSpecialty Conference, March 1984. Pittsburgh, Pennsylvania, Air Pollution Control Association, pp403-414.
Khalil MAK & Rasmussen RA (1984c) The atmospheric lifetime of methylchloroform (CH3CCl3).Tellus, B36: 317-332.
Khalil MAK & Rasmussen RA (1988) Carbon monoxide in the earth’s atmosphere: indications of aglobal increase. Nature (Lond), 332: 242-245.
Khalil MAK & Rasmussen RA (1990a) The global cycle of carbon monoxide: trends and massbalance. Chemosphere, 20: 227-242.
Khalil MAK & Rasmussen RA (1990b) Atmospheric carbon monoxide: latitudinal distribution ofsources. Geophys Res Lett, 17: 1913-1916.
Khalil MAK & Rasmussen RA (1994) Global decrease in atmospheric carbon monoxide concentration.Nature (Lond), 370: 639-641.
Kidder GW III (1980) Carbon monoxide insensitivity of gastric acid secretion. Am J Physiol,238: G197-G202.
Killick EM (1937) The acclimatization of mice to atmospheres containing low concentrations of carbonmonoxide. J Physiol (Lond), 91: 279-292.
Killick EM (1940) Carbon monoxide anoxemia. Physiol Rev, 20: 313-344.
Killick EM (1948) The nature of the acclimatization occurring during repeated exposure of the humansubject to atmospheres containing low concentrations of carbon monoxide. J Physiol (Lond), 107:27-44.
Kim YC & Carlson GP (1983) Effect of carbon monoxide inhalation exposure in mice on drugmetabolism in vivo. Toxicol Lett, 19: 7-13.

EHC 213: Carbon Monoxide
376
King LA (1983) Effect of ethanol in fatal carbon monoxide poisonings. Hum Toxicol, 2: 155-157.
King CE, Cain SM, & Chapler CK (1984) Whole body and hindlimb cardiovascular responses of theanesthetized dog during CO hypoxia. Can J Physiol Pharmacol, 62: 769-774.
King CE, Cain SM, & Chapler CK (1985) The role of aortic chemoreceptors during severe CO hypoxia.Can J Physiol Pharmacol, 63: 509-514.
King CE, Dodd SL, & Cain SM (1987) O2 delivery to contracting muscle during hypoxic or COhypoxia. J Appl Physiol, 63: 726-732.
Kinker JR, Haffor AS, Stephan M, & Clanton TL (1992) Kinetics of CO uptake and diffusing capacityin transition from rest to steady-state exercise. J Appl Physiol, 72: 1764-1772.
Kinney PL, Ito K, & Thurston GD (1995) A sensitive analysis of mortality/PM-10 associations in LosAngeles: Proceedings of the 1995 Colloquium on Particulate Air Pollution and Human Mortality andMorbidity. Inhal Toxicol, 7(1): 59-69.
Kirkham AJT, Guyatt AR, & Cumming G (1988) Alveolar carbon monoxide: a comparison of methodsof measurement and a study of the effect of change in body posture. Clin Sci, 74: 23-28.
Kirkpatrick JN (1987) Occult carbon monoxide poisoning. West J Med, 146: 52-56.
Kirkpatrick LW & Reeser WK Jr (1976) The air pollution carrying capacities of selected Coloradomountain valley ski communities. J Air Pollut Control Assoc, 26: 992-994.
Kjeldsen K, Astrup P, & Wanstrup J (1972) Ultrastructural intimal changes in the rabbit aorta aftera moderate carbon monoxide exposure. Atherosclerosis, 16: 67-82.
Klausen K, Andersen C, & Nandrup S (1983) Acute effects of cigarette smoking and inhalation ofcarbon monoxide during maximal exercise. Eur J Appl Physiol Occup Physiol, 51: 371-379.
Klees M, Heremans M, & Dougan S (1985) Psychological sequelae to carbon monoxide intoxicationin the child. Sci Total Environ, 44: 165-176.
Klein JP, Forster HV, Stewart RD, & Wu A (1980) Hemoglobin affinity for oxygen during short-termexhaustive exercise. J Appl Physiol Respir Environ Exercise Physiol, 48: 236-242.
Kleinert HD, Scales JL, & Weiss HR (1980) Effects of carbon monoxide or low oxygen gas mixtureinhalation on regional oxygenation, blood flow, and small vessel blood content of the rabbit heart.Pfluegers Arch, 383: 105-111.
Kleinman MT & Whittenberger JL (1985) Effects of short-term exposure to carbon monoxide insubjects with coronary artery disease. Sacramento, California, California State Air Resources Board(Report No. ARB-R-86/276, available from NTIS, Springfield, Virginia, USA).
Kleinman MT, Davidson DM, Vandagriff RB, Caiozzo VJ, & Whittenberger JL (1989) Effects ofshort-term exposure to carbon monoxide in subjects with coronary artery disease. Arch EnvironHealth, 44: 361-369.
Kloner RA, Allen J, Cox TA, Zheng Y, & Ruiz CE (1991) Stunned left ventricular myocardium afterexercise treadmill testing in coronary artery disease. Am J Cardiol, 68: 329-334.
References
377
Klonoff-Cohen HS, Edelstein SL, Lefkowitz ES, Srinivasan IP, Jae-Clun-Chang, & Wiley KJ (1995)The effect of passive smoking and tobacco exposure through breast milk on sudden infant deathsyndrome. J Am Med Assoc, 273(10): 795-798.
Knelson JH (1972) United States air quality criteria and ambient standards for carbon monoxide.Staub-Reinhalt Luft, 32: 183-185.
Knisely JS, Rees DC, Salay JM, Balster RL, & Breen TJ (1987) Effects of intraperitoneal carbonmonoxide on fixed-ratio and screen-test performance in the mouse. Neurotoxicol Teratol, 9: 221-225.
Knisely JS, Rees DC, & Balster RL (1989) Effects of carbon monoxide in combination withbehaviorally active drugs on fixed-ratio performance in the mouse. Neurotoxicol Teratol, 11: 447-452.
Ko BH & Eisenberg RS (1987) Prolonged carboxyhemoglobin clearance in a patient withWaldenstrom’s macroglobulinemia. Am J Emerg Med, 5: 503-508.
Koehler RC, Jones MD Jr, & Traystman RJ (1982) Cerebral circulatory response to carbon monoxideand hypoxic hypoxia in the lamb. Am J Physiol, 243: H27-H32.
Koehler RC, Traystman RJ, Rosenberg AA, Hudak ML, & Jones MD Jr (1983) Role of O2-hemoglobinaffinity on cerebrovascular response to carbon monoxide hypoxia. Am J Physiol, 245: H1019-H1023.
Koehler RC, Traystman RJ, Zeger S, Rogers MC, & Jones MD Jr (1984) Comparison ofcerebrovascular response to hypoxic and carbon monoxide hypoxia in newborn and adult sheep.J Cereb Blood Flow Metab, 4: 115-122.
Koehler RC, Traystman RJ, & Jones MD Jr (1985) Regional blood flow and O2 transport duringhypoxic and CO hypoxia in neonatal and adult sheep. Am J Physiol, 248: H118-H124.
Koike A, Wasserman K, Armon Y, & Weiler Ravell D (1991) The work rate-dependent effect of carbonmonoxide on ventilatory control during exercise. Respir Physiol, 85: 169-183.
Koob GF, Annau Z, Rubin RJ, & Montgomery MR (1974) Effect of hypoxic hypoxia and carbonmonoxide on food intake, water intake, and body weight in two strains of rats. Life Sci, 14: 1511-1520.
Koontz MD & Nagda NL (1987) Survey of factors affecting NO2 concentrations. In: Seifert B, EsdornH, Fischer M, Rueden H, & Wegner J ed. Indoor air ’87: Proceedings of the 4th InternationalConference on Indoor Air Quality and Climate, Berlin, August 1987 — Volume 1: Volatile organiccompounds, combustion gases, particles and fibres, microbiological agents. Berlin, Federal Republicof Germany, Institute for Water, Soil, and Air Hygiene, pp 430-434.
Koren G, Sharav R, Pastuszak A, Garrettson LK, Hill K, Samson I, Rorem M, King A, & Dolgin JE(1991) A multicenter, prospective study of fetal outcome following accidental carbon monoxidepoisoning in pregnancy. Reprod Toxicol, 5: 397-403.
Korner PI (1965) The role of the arterial chemoreceptors and baroreceptors in the circulatory responseto hypoxia of the rabbit. J Physiol (Lond), 180: 279-303.
Koskela R-S, Hernberg S, Karava R, Jarvinen E, & Nurminen M (1976) A mortality study of foundryworkers. Scand J Work Environ Health, 2(suppl 1): 73-89.

EHC 213: Carbon Monoxide
378
Krall AR & Tolbert NE (1957) A comparison of the light dependent metabolism of carbon monoxideby barley leaves with that of formaldehyde, formate and carbon dioxide. Plant Physiol, 32: 321-326.
Kreisman NR, Sick TJ, LaManna JC, & Rosenthal M (1981) Local tissue oxygen tension —cytochrome a,a3 redox relationships in rat cerebral cortex in vivo. Brain Res, 218: 161-174.
Kuller LH & Radford EP (1983) Epidemiological bases for the current ambient carbon monoxidestandards. Environ Health Perspect, 52: 131-139.
Kuller LH, Radford EP, Swift D, Perper JA, & Fisher R (1975) Carbon monoxide and heart attacks.Arch Environ Health, 30: 477-482.
Kurppa K (1984) Carbon monoxide. In: Aitio A, Riihimaki V, & Vainio H ed. Biological monitoring andsurveillance of workers exposed to chemicals. New York, Hemisphere Publishing Corporation,pp 159-164.
Kurt TL, Mogielnicki RP, & Chandler JE (1978) Association of the frequency of acute cardiorespiratorycomplaints with ambient levels of carbon monoxide. Chest, 74: 10-14.
Kuska J, Kokot F, & Wnuk R (1980) Acute renal failure after exposure to carbon monoxide. Mater MedPol (Engl. ed.), 12: 236-238.
Kustov VV, Belkin VI, Abidin BI, Ostapenko OF, Malkuta AN, & Poddubnaja LT (1972) Aspects ofchronic carbon monoxide poisoning in young animals. Gig Tr Prof Zabol, 5: 50-52.
Kwak HM, Yang YH, & Lee MS (1986) Cytogenetic effects on mouse fetus of acute and chronictransplacental in vivo exposure to carbon monoxide: induction of micronuclei and sister chromatidexchanges. Yonsei Med J, 27: 205-212.
Lagemann RT, Nielsen AH, & Dickey FP (1947) The infra-red spectrum and molecular constants ofC12O16 and C13O16. Phys Rev, 72: 284-289.
Lahiri S & Delaney RG (1976) Effect of carbon monoxide on carotid chemoreceptor activity andventilation. In: Paintal AS ed. Morphology and mechanisms of chemoreceptors: Proceedings of anInternational Satellite Symposium, Srinagar, India, October 1974. Delhi, India, University of Delhi,Vallabhbhai Patel Chest Institute, pp 340-344.
Lambert WE, Colome SD, & Wojciechowski SL (1988) Application of end-expired breath samplingto estimate carboxyhemoglobin levels in community air pollution exposure assessments. AtmosEnviron, 22: 2171-2181.
Lamontagne RA, Swinnerton JW, & Linnenbom VJ (1971) Nonequilibrium of carbon monoxide andmethane at the air-sea interface. J Geophys Res, 76: 5117-5121.
Landaw SA (1973) The effects of cigarette smoking on total body burden and excretion rates of carbonmonoxide. J Occup Med, 15: 231-235.
Landaw SA, Callahan EW Jr, & Schmid R (1970) Catabolism of heme in vivo: comparison of thesimultaneous production of bilirubin and carbon monoxide. J Clin Invest, 49: 914-925.
Lanston P, Gorman D, Runciman W, & Upton R (1996) The effect of carbon monoxide on oxygenmetabolism in the brains of awake sheep. Toxicology, 114: 223-232.
References
379
Laties VG & Merigan WH (1979) Behavioral effects of carbon monoxide on animals and man. AnnuRev Pharmacol Toxicol, 19: 357-392.
La Vecchia C, D’Avanzo B, Grazia-Franzosi M, & Tognoni G (1993) Passive smoking and the risk ofacute myocardial infarction. Lancet, 341(8843): 505-506.
Leaderer BP, Cain WS, Isseroff R, & Berglund LG (1984) Ventilation requirements in buildings —II. Particulate matter and carbon monoxide from cigarette smoking. Atmos Environ, 18: 99-106.
Leaf DA & Kleinman MT (1996) Urban ectopy in the mountains: carbon monoxide exposure at highaltitude. Arch Environ Health, 51: 283-290.
Lebowitz MD (1984) The effects of environmental tobacco smoke exposure and gas stoves on dailypeak flow rates in asthmatic and non-asthmatic families. In: Rylander R, Peterson Y, & Snella M-Ced. ETS — Environmental tobacco smoke: Report from a Workshop on Effects and Exposure Levels,Geneva, Switzerland, March 1983. Eur J Respir Dis, 65(suppl 133): 90-97.
Lebowitz MD, Holberg CJ, O’Rourke MK, Corman G, & Dodge R (1983a) Gas stove usage, CO andTSP, and respiratory effects. Research Triangle Park, North Carolina, US Environmental ProtectionAgency, Health Effects Research Laboratory (EPA-600/D-83-107).
Lebowitz MD, Holberg CJ, & Dodge RR (1983b) Respiratory effects on populations from low-levelexposures to ozone. Presented at the 76th Annual Meeting of the Air Pollution Control Association,Atlanta, GA, June 1983. Pittsburgh, Pennsylvania, Air Pollution Control Association (Paper No.83-12.5).
Lebowitz MD, Corman G, O’Rourke MK, & Holberg CJ (1984) Indoor-outdoor air pollution, allergenand meteorological monitoring in an arid southwest area. J Air Pollut Control Assoc, 34: 1035-1038.
Lebowitz MD, Holberg CJ, Boyer B, & Hayes C (1985) Respiratory symptoms and peak flowassociated with indoor and outdoor air pollutants in the southwest. J Air Pollut Control Assoc, 35:1154-1158.
Lebowitz MD, Collins L, & Holberg CJ (1987) Time series analyses of respiratory responses to indoorand outdoor environmental phenomena. Environ Res, 43: 332-341.
Lebret E (1985) Air pollution in Dutch homes: an exploratory study in environmental epidemiology.Wageningen, The Netherlands, Department of Air Pollution & Department of Environmental andTropical Health (Reports Nos R-138 and 1985-221).
Lee PN, Chamberlain J, & Alderson MR (1986) Relationship of passive smoking to risk of lung cancerand other smoking-associated diseases. Br J Cancer, 54: 97-105.
Lee K, Yanagisawa Y, & Spengler JD (1994) Carbon monoxide and nitrogen dioxide exposure inindoor ice skating rinks. J Sports Sci, 12: 279-283.
Lehnebach A, Kuhn C, & Pankow D (1995) Dichloromethane as an inhibitor of cytochrome c oxidasein different tissues of rats. Arch Toxicol, 69(3): 180-184.
Leichnitz K (1993) Determination of the time-weighted average concentration of carbon monoxide inair using a long term detector tube. In: Seifert B, van de Wiel HJ, Dodet B, & O’Neil IK ed.Environmental carcinogens: Methods of analysis and exposure measurement — Volume 12: Indoorair. Lyon, International Agency for Research on Cancer, pp 346-352 (IARC Scientific Publications No.109).

EHC 213: Carbon Monoxide
380
Leichter J (1993) Fetal growth retardation due to exposure of pregnant rats to carbon monoxide.Biochem Arch, 8: 267-272.
Leithe W (1971) The analysis of air pollutants. Ann Arbor, Michigan, Ann Arbor SciencePublishers, Inc.
Leniger-Follert E, Luebbers DW, & Wrabetz W (1975) Regulation of local tissue PO2 of the brain
cortex at different arterial O2 pressures. Pfluegers Arch, 359: 81-95.
Lévesque B, Dewailly E, Lavoie R, Prud’Homme D, & Allaire S (1990) Carbon monoxide in indoor iceskating rinks: evaluation of absorption by adult hockey players. Am J Public Health, 80: 594-598.
Levin BC, Paabo M, Gurman JL, Harris SE, & Braun E (1987a) Toxicological interactions betweencarbon monoxide and carbon dioxide. Toxicology, 47: 135-164.
Levin BC, Paabo M, Gurman JL, & Harris SE (1987b) Effects of exposure to single or multiplecombinations of the predominant toxic gases and low oxygen atmospheres produced in fires. FundamAppl Toxicol, 9: 236-250.
Levin BC, Gurman JL, Paabo M, Baier L, & Holt T (1988a) Toxicological effects of different timeexposures to the fire gases: Carbon monoxide or hydrogen cyanide or to carbon monoxide combinedwith hydrogen cyanide or carbon dioxide. In: Jason NH & Houston BA ed. Ninth Joint Panel Meetingof the UJNR Panel on Fire Research and Safety, Norwood, MA, May 1987. Gaithersburg, Maryland,US Department of Commerce, National Bureau of Standards, pp 368-383 (Report No. NBSIR88-3753).
Levin BC, Paabo M, Gurman JL, Clark HM, & Yoklavich MF (1988b) Further studies of thetoxicological effects of different time exposures to the individual and combined fire gases — carbonmonoxide, hydrogen cyanide, carbon dioxide and reduced oxygen. In: Polyurethanes 88: Proceedingsof the 31st Annual Technical/Marketing Conference of the Society of Plastics Industry, Philadelphia,October 1988. Lancaster, Pennsylvania, Technomic Publishing Co., pp 249-252.
Le Vois ME & Layard MW (1995) Publication bias in the environmental tobacco smoke/coronary heartdisease epidemiologic literature. Regul Toxicol Pharmacol, 21(1): 184-191.
Lilienthal JL Jr & Fugitt CH (1946) The effect of low concentrations of carboxyhemoglobin on the“altitude tolerance” of man. Am J Physiol, 145: 359-364.
Linnenbom VJ, Swinnerton JW, & Lamontagne RA (1973) The ocean as a source for atmosphericcarbon monoxide. J Geophys Res, 78: 5333-5340.
Liss PS & Slater PG (1974) Flux of gases across the air-sea interface. Nature (Lond), 247: 181-184.
Locke JL & Herzberg L (1953) The absorption due to carbon monoxide in the infrared solar spectrum.Can J Phys, 31: 504-516.
Lodge JP ed. (1989) Methods of air sampling and analysis, 3rd ed. Chelsea, Michigan, LewisPublishers.
Logan JA, Prather MJ, Wofsy SC, & McElroy MB (1981) Tropospheric chemistry: a globalperspective. J Geophys Res Oceans Atmos, C86: 7210-7254.
References
381
Longo LD (1970) Carbon monoxide in the pregnant mother and fetus and its exchange across theplacenta. In: Coburn RF ed. Biological effects of carbon monoxide. Ann NY Acad Sci, 174: 313-341.
Longo LD (1976) Carbon monoxide: Effects on oxygenation of the fetus in utero. Science, 194:523-525.
Longo LD (1977) The biological effects of carbon monoxide on the pregnant woman, fetus, andnewborn infant. Am J Obstet Gynecol, 129: 69-103.
Longo LD & Ching KS (1977) Placental diffusing capacity for carbon monoxide and oxygen inunanesthetized sheep. J Appl Physiol Respir Environ Exercise Physiol, 43: 885-893.
Longo LD & Hill EP (1977) Carbon monoxide uptake and elimination in fetal and maternal sheep.Am J Physiol, 232: H324-H330.
Ludbrook GL, Helps SC, Gorman DF, Reilly PL, & North JB (1992) Electrocardiographic responsesto carbon monoxide and cyanide in the conscious rat. Toxicology, 75: 71-80.
Luft KF (1962) [The “UNOR,” a new gas analytical device for mining.] Glúckauf, 98: 493-495 (inGerman).
Lumio JS (1948) Hearing deficiencies caused by carbon monoxide (generator gas). Helsinki, Finland,Oto-Laryngological Clinic of the University.
Luomanmaki K & Coburn RF (1969) Effects of metabolism and distribution of carbon monoxide onblood and body stores. Am J Physiol, 217: 354-363.
Luria SM & McKay CL (1979) Effects of low levels of carbon monoxide on visions of smokers andnonsmokers. Arch Environ Health, 34: 38-44.
Lutz LJ (1983) Health effects of air pollution measured by outpatient visits. J Fam Pract, 16: 307-313.
Lynch AM & Bruce NW (1989) Placental growth in rats exposed to carbon monoxide at selectedstages of pregnancy. Biol Neonate, 56: 151-157.
Lynch SR & Moede AL (1972) Variation in the rate of endogenous carbon monoxide production innormal human beings. J Lab Clin Med, 79: 85-95.
Maas AHJ, Hamelink ML, & de Leeuw RJM (1970) An evaluation of the spectrophotometricdetermination of HbO2, HbCO and Hb in blood with the CO-Oximeter IL 182. Clin Chim Acta,29: 303-309.
McCarthy SM, Yarmac RF, & Yocom JE (1987) Indoor nitrogen dioxide exposure: the contributionfrom unvented gas space heaters. In: Seifert B, Esdorn H, Fischer M, Rueden H, & Wegner J ed.Indoor air ‘87: Proceedings of the 4th International Conference on Indoor Air Quality and Climate,Berlin, August 1987 — Volume 1: Volatile organic compounds, combustion gases, particles andfibres, microbiological agents. Berlin, Federal Republic of Germany, Institute for Water, Soil, and AirHygiene, pp 478-482.
McCartney ML (1990) Sensitivity analysis applied to Coburn-Forster-Kane models of carboxy-hemoglobin formation. Am Ind Hyg Assoc J, 51: 169-177.

EHC 213: Carbon Monoxide
382
McClean PA, Duguid NJ, Griffin PM, Newth CJL, & Zamel N (1981) Changes in exhaled pulmonarydiffusing capacity at rest and exercise in individuals with impaired positional diffusion. Clin RespirPhysiol, 17: 179-186.
McCredie RM & Jose AD (1967) Analysis of blood carbon monoxide and oxygen by gaschromatography. J Appl Physiol, 22: 863-866.
McDonagh PF, Reynolds JM, & McGrath JJ (1986) Chronic altitude plus carbon monoxide exposurecauses left ventricular hypertrophy but an attenuation of coronary capillarity. Fed Proc, 45: 883.
McFarland RA (1970) The effects of exposure to small quantities of carbon monoxide on vision. In:Coburn RF ed. Biological effects of carbon monoxide. Ann NY Acad Sci, 174: 301-312.
McFarland RA (1973) Low level exposure to carbon monoxide and driving performance. Arch EnvironHealth, 27: 355-359.
McFarland RA, Roughton FJW, Halperin MH, & Niven JI (1944) The effects of carbon monoxide andaltitude on visual thresholds. J Aviat Med, 15: 381-394.
McFaul SJ & McGrath JJ (1987) Studies on the mechanism of carbon monoxide-induced vasodilationin the isolated perfused rat heart. Toxicol Appl Pharmacol, 87: 464-473.
McGrath JJ (1982) Physiological effects of carbon monoxide. In: McGrath JJ & Barnes CD ed. Airpollution: Physiological effects. New York, London, Academic Press, pp 147-181.
McGrath JJ (1988) Body and organ weights of rats exposed to carbon monoxide at high altitude. JToxicol Environ Health, 23: 303-310.
McGrath JJ (1989) Cardiovascular effects of chronic carbon monoxide and high-altitude exposure.Cambridge, Massachusetts, Health Effects Institute (Research Report No. 27).
McMeekin JD & Finegan BA (1987) Reversible myocardial dysfunction following carbon monoxidepoisoning. Can J Cardiol, 3: 118-121.
MacMillan V (1975) Regional cerebral blood flow of the rat in acute carbon monoxide intoxication. CanJ Physiol Pharmacol, 53: 644-650.
McMillan DE & Miller AT Jr (1974) Interactions between carbon monoxide and d-amphetamine orpentobarbital on schedule-controlled behavior. Environ Res, 8: 53-63.
McNay LM (1971) Coal refuse fires, an environmental hazard. Washington, DC, US Department ofthe Interior, Bureau of Mines (Information Circular No. 8515).
Mactutus CF & Fechter LD (1984) Prenatal exposure to carbon monoxide: learning and memorydeficits. Science, 223: 409-411.
Mactutus CF & Fechter LD (1985) Moderate prenatal carbon monoxide exposure produces persistent,and apparently permanent, memory deficits in rats. Teratology, 31: 1-12.
Madany IM (1992) Carboxyhemoglobin levels in blood donors in Bahrain. Sci Total Environ, 116: 53-58.
Madsen H & Dyerberg J (1984) Cigarette smoking and its effects on the platelet-vessel wallinteraction. Scand J Clin Lab Invest, 44: 203-206.

References
383
Maehara K, Riley M, Galassetti P, Barstow TJ, & Wasserman K (1997) Effect of hypoxia and carbonmonoxide on muscle oxygenation during exercise. Am J Respir Crit Care Med, 155: 229-235.
Mage D (1991) A comparison of the direct and indirect methods of human exposure. New Horizonsin Biological Dosimetry, 443-454.
Mage D, Ozolins G, Peterson P, Webster A, Orthofer R, Vandeweerd V, & Gwynne M (1996) Urbanair pollution in megacities of the world. Atmos Environ, 30(5): 681-686.
Malinow MR, McLaughlin P, Dhindsa DS, Metcalfe J, Ochsner AJ III, Hill J, & McNulty WP (1976)Failure of carbon monoxide to induce myocardial infarction in cholesterol-fed cynomolgus monkeys(Macaca fascicularis). Cardiovasc Res, 10: 101-108.
Mall Th, Grossenbacher M, Perruchoud AP, & Ritz R (1985) Influence of moderately elevated levelsof carboxyhemoglobin on the course of acute ischemic heart disease. Respiration, 48: 237-244.
Mansouri A & Perry CA (1982) Alteration of platelet aggregation by cigarette smoke and carbonmonoxide. Thromb Haemost, 48: 286-288.
Marshall M & Hess H (1981) [Acute effects of low carbon monoxide concentrations on blood rheology,platelet function, and the arterial wall in the minipig.] Res Exp Med, 178: 201-210 (in German).
Martin TR & Bracken MB (1986) Association of low birth weight with passive smoke exposure inpregnancy. Am J Epidemiol, 124: 633-642.
Martynjuk VC & Dacenko II (1973) [Aminotransferase activity in chronic carbon monoxide poisoning.]Gig Naselennykh Mest, 12: 53-56 (in Russian).
Mason GR, Uszler JM, Effros RM, & Reid E (1983) Rapid reversible alterations of pulmonary epithelialpermeability induced by smoking. Chest, 83: 6-11.
Mathieu D & Wattel F ed. (1990) Oxygenotherapie hyperbare et réanimation. Paris, Editions Masson,pp 129-143.
Mathieu D, Nolf M, Durocher A, Saulnier F, Frimat P, Furon D, & Wattel F (1985) Acute carbonmonoxide poisoning risk of late sequelae and treatment by hyperbaric oxygen. J Toxicol Clin Toxicol,23: 315-324.
Mathieu D, Mathieu-Nolf M, & Wattel F (1996a) Intoxication par le monoxyde de carbone: Aspectsactuels. Bull Acad Natl Med, 180: 965-973.
Mathieu D, Wattel F, Neviere R, & Mathieu-Nolf M (1996b) In: Oriani G, Marroni A, & Wattel F ed.Handbook on hyperbaric medicine. Berlin, Heidelberg, New York, Springer Verlag, pp 281-296.
Medical College of Wisconsin (1974) Exposure of humans to carbon monoxide combined withingestion of ethyl alcohol and the comparison of human performance when exposed for varyingperiods of time to carbon monoxide. Milwaukee, Wisconsin, Medical College of Wisconsin (ReportNo. MCOW-ENVM-CO-74-2, available from NTIS, Springfield, Virginia, USA).
Melinyshyn MJ, Cain SM, Villeneuve SM, & Chapler CK (1988) Circulatory and metabolic responsesto carbon monoxide hypoxia during ß-adrenergic blockade. Am J Physiol, 255: H77-H84.

EHC 213: Carbon Monoxide
384
Mellor AM (1972) Current kinetic modeling techniques for continuous flow combustors. In: CorneliusW & Agnew WG ed. Emissions from continuous combustion systems: Proceedings of a symposium,Warren, Michigan, September 1971. New York, Plenum Press, pp 23-53.
Meredith T & Vale A (1988) Carbon monoxide poisoning. Br Med J, 296: 77-79.
Meyer B (1983) Indoor air quality. Reading, Massachusetts, Addison-Wesley Publishing Company,Inc.
Michelson W & Reed P (1975) The time budget. In: Michelson W ed. Behavioral research methodsin environmental design. Stroudsburg, Pennsylvania, Dowden, Hutchinson, & Ross, Inc., pp 180-234(Community Development series).
Migeotte MV (1949) The fundamental band of carbon monoxide at 4.7 :m/m3 in the solar spectrum.Phys Rev, 75: 1108-1109.
Migeotte M & Neven L (1952) Récents progrès dans l’observation du spectre infra-rouge du soleil àla station scientifique du Jungfraujoch (Suisse). Mem Soc R Sci Liege, 12: 165-178.
Mihevic PM, Gliner JA, & Horvath SM (1983) Carbon monoxide exposure and information processingduring perceptual-motor performance. Int Arch Occup Environ Health, 51: 355-363.
Miller AT & Wood JJ (1974) Effects of acute carbon monoxide exposure on the energy metabolismof rat brain and liver. Environ Res, 8: 107-111.
Mills AK, Skornik WA, Valles LM, O’Rourke JJ, Hennessey RM, & Verrier RL (1987) Effects of carbonmonoxide on cardiac electrical properties during acute coronary occlusion. Fed Proc, 46: 336.
Minor M & Seidler D (1986) Myocardial infarction following carbon monoxide poisoning. West VaMed J, 82: 25-28.
Minty BD & Royston D (1985) Cigarette smoke induced changes in rat pulmonary clearance of99mTcDTPA: a comparison of particulate and gas phases. Am Rev Respir Dis, 132: 1170-1173.
Minty BD, Jordan C, & Jones JG (1981) Rapid improvement in abnormal pulmonary epithelialpermeability after stopping cigarettes. Br Med J, 282: 1183-1186.
Miranda JM, Konopinski VJ, & Larsen RI (1967) Carbon monoxide control in a high highway tunnel.Arch Environ Health, 15(1): 16-25.
Mitchell DS, Packham SC, & Fitzgerald WE (1978) Effects of ethanol and carbon monoxide on twomeasures of behavioral incapacitation of rats. Proc West Pharmacol Soc, 21: 427-431.
Mitchell EA, Ford RP, Stewart AW, Taylor BJ, Becroft DM, Thompson JM, Scragg R, Hassall IB,Barry DM, & Allen EM (1993) Smoking and the sudden infant death syndrome. Pediatrics, 91(5): 893-896.
Miyagawa M, Honma T, Sato M, & Hasegawa H (1995) Acute effects of inhalation exposure to carbonmonoxide on schedule-controlled operant behavior and blood carboxyhemoglobin levels in rats. IndHealth, 33: 119-129.
Miyahara S & Takahashi H (1971) Biological CO evolution: carbon monoxide evolution during auto-and enzymatic oxidation of phenols. J Biochem (Tokyo), 69: 231-233.

References
385
Mochizuki M, Maruo T, Masuko K, & Ohtsu T (1984) Effects of smoking on fetoplacental-maternalsystem during pregnancy. Am J Obstet Gynecol, 149: 413-420.
Moffatt S (1986) Backdrafting woes. Prog Builder, December: 25-36.
Montgomery MR & Rubin RJ (1971) The effect of carbon monoxide inhalation on in vivo drugmetabolism in the rat. J Pharmacol Exp Ther, 179: 465-473.
Montgomery MR & Rubin RJ (1973) Oxygenation during inhibition of drug metabolism by carbonmonoxide or hypoxic hypoxia. J Appl Physiol, 35: 505-509.
Moore LG, Rounds SS, Jahnigen D, Grover RF, & Reeves JT (1982) Infant birth weight is related tomaternal arterial oxygenation at high altitude. J Appl Physiol Respir Environ Exercise Physiol,52: 695-699.
Mordelet-Dambrine M & Stupfel M (1979) Comparison in guinea-pigs and in rats of the effects ofvagotomy and of atropine on respiratory resistance modifications induced by an acute carbonmonoxide or nitrogen hypoxia. Comp Biochem Physiol Comp Physiol, A63: 555-559.
Mordelet-Dambrine M, Stupfel M, & Duriez M (1978) Comparison of tracheal pressure and circulatorymodifications induced in guinea pigs and in rats by carbon monoxide inhalation. Comp BiochemPhysiol Comp Physiol, A59: 65-68.
Moriske HJ, Drews M, Ebert G, Schneller G, Schöndube M, & Konieczny L (1996) Indoor air pollutionby different heating system: coal burning, open fireplace and central heating. Toxicol Lett, 88: 349-354.
Morris GL, Curtis SE, & Simon J (1985a) Perinatal piglets under sublethal concentrations ofatmospheric carbon monoxide. J Anim Sci, 61: 1070-1079.
Morris GL, Curtis SE, & Widowski TM (1985b) Weanling pigs under sublethal concentrations ofatmospheric carbon monoxide. J Anim Sci, 61: 1080-1087.
Morris RD, Naumova EN, & Munasinghe RL (1995) Ambient air pollution and hospitalization forcongestive heart failure among elderly people in seven large US cities. Am J Public Health, 85(10):1361-1365.
Moschandreas DJ & Zabransky J Jr (1982) Spatial variation of carbon monoxide and oxides ofnitrogen concentrations inside residences. Environ Int, 8: 177-183.
Moschandreas DJ, Relwani SM, O’Neill HJ, Cole JT, Elkins RH, & Macriss RA (1985)Characterization of emission rates from indoor combustion sources. Chicago, Illinois, Gas ResearchInstitute (Report No. GRI 85/0075, available from NTIS, Springfield, Virginia, USA).
Muller GL & Graham S (1995) Intrauterine death of the fetus due to accidental carbon monoxidepoisoning. N Engl J Med, 252: 1075-1078.
Mullin LS & Krivanek ND (1982) Comparison of unconditioned reflex and conditioned avoidance testsin rats exposed by inhalation to carbon monoxide, 1,1,1-trichloroethane, toluene or ethanol.Neurotoxicology, 3: 126-137.
Murphy SD (1964) A review of effects on animals of exposure to auto exhaust and some of itscomponents. J Air Pollut Control Assoc, 14: 303-308.

EHC 213: Carbon Monoxide
386
Murray FJ, Schwetz BA, Crawford AA, Henck JW, & Staples RE (1978) Teratogenic potential ofsulfur dioxide and carbon monoxide in mice and rabbits. In: Mahlum DD, Sikov MR, Hackett PL, &Andrew FD ed. Developmental toxicology of energy-related pollutants: Proceedings of the SeventeenthAnnual Hanford Biology Symposium, Richland, WA, October 1977. Oak Ridge, Tennessee,US Department of Energy, Technical Information Center, pp 469-478 (Available from NTIS,Springfield, Virginia, USA).
Muscat JE & Wynder EL (1995) Exposure to environmental tobacco smoke and the risk of heartattack. Int J Epidemiol, 24(4): 715-719.
Musselman NP, Groff WA, Yevich PP, Wilinski FT, Weeks MH, & Oberst FW (1959) Continuousexposure of laboratory animals to low concentration of carbon monoxide. Aerosp Med, 30: 524-529.
Myers RAM (1986) Hyperbaric oxygen therapy: a committee report. Bethesda, Maryland, Underseaand Hyperbaric Medical Society, pp 33-36.
Myers R, Snyder S, Linderberg S, & Cowley A (1981) Value of hyperbaric oxygen in suspected carbonmonoxide poisoning. J Am Med Assoc, 246: 2478-2480.
Myers RAM, Snyder SK, & Emhoff TA (1985) Subacute sequelae of carbon monoxide poisoning. AnnEmerg Med, 14: 1163-1167.
Nagda NL & Koontz MD (1985) Microenvironmental and total exposures to carbon monoxide for threepopulation subgroups. J Air Pollut Control Assoc, 35: 134-137.
NAS (1969) Effects of chronic exposure to low levels of carbon monoxide on human health, behavior,and performance. Washington, DC, National Academy of Sciences and National Academy ofEngineering.
NAS (1973) Automotive spark ignition engine emission control systems to meet the requirements ofthe 1970 Clean Air Amendments. Washington, DC, National Academy of Sciences (Available fromNTIS, Springfield, Virginia, USA).
National Air Pollution Control Administration (1970) Air quality criteria for carbon monoxide.Washington, DC, US Department of Health, Education, and Welfare, Public Health Service (ReportNo. NAPCA-PUB-AP-62, available from NTIS, Springfield, Virginia, USA).
National Center for Health Statistics (1986) Vital statistics of the United States 1982 — Volume II:Mortality, Part A. Hyattsville, Maryland, US Department of Health and Human Services, Public HealthService.
National Safety Council (1982) How people died in home accidents, 1981. In: Accident facts.Chicago, Illinois, National Safety Council, pp. 80-84.
Naumann RJ (1975) Patent No. 3,895,912: Carbon monoxide monitor. Washington, DC, US PatentOffice.
Neubauer JA, Santiago TV, & Edelman NH (1981) Hypoxic arousal in intact and carotidchemodenervated sleeping cats. J Appl Physiol Respir Environ Exercise Physiol, 51: 1294-1299.
Newell RE, Boer GJ Jr, & Kidson JW (1974) An estimate of the interhemispheric transfer of carbonmonoxide from tropical general circulation data. Tellus, 26: 103-107.

References
387
Niden AH (1971) The effects of low levels of carbon monoxide on the fine structure of the terminalairways. Am Rev Respir Dis, 103: 898.
Niden AH & Schulz H (1965) The ultrastructural effects of carbon monoxide inhalation on the rat lung.Virchows Arch Pathol Anat Physiol, 339: 283-292.
Nilsson C-A, Lindahl R, & Norstrom A (1987) Occupational exposure to chain saw exhausts in loggingoperations. Am Ind Hyg Assoc J, 48: 99-105.
NIOSH (1972) Criteria for a recommended standard occupational exposure to carbon monoxide.Cincinnati, Ohio, National Institute for Occupational Safety and Health (Report No. NIOSH-TR-007-72).
Norkool DM & Kirkpatrick JN (1985) Treatment of acute carbon monoxide poisoning with hyperbaricoxygen: a review of 115 cases. Ann Emerg Med, 14: 1168-1171.
Norman CA & Halton DM (1990) Is carbon monoxide a workplace teratogen? A review and evaluationof the literature. Ann Occup Hyg, 34(4): 335-347.
Norris JC, Moore SJ, & Hume AS (1986) Synergistic lethality induced by the combination of carbonmonoxide and cyanide. Toxicology, 40: 121-129.
Novelli PC, Massarie KA, Tans PT, & Lang PA (1994) Recent changes in atmospheric carbonmonoxide. Science, 263: 1587-1590.
NRC (1977) Carbon monoxide. Washington, DC, National Academy of Sciences, National ResearchCouncil.
NRC (1986a) Environmental tobacco smoke: measuring exposures and assessing health effects.Washington, DC, National Research Council, National Academy Press.
NRC (1986b) The airliner cabin environment: air quality and safety. Washington, DC, NationalResearch Council, National Academy Press.
Ocak A, Valentour JC, & Blanke RV (1985) The effects of storage conditions on the stability of carbonmonoxide in postmortem blood. J Anal Toxicol, 9: 202-206.
O'Donnell RD, Mikulka P, Heinig P, & Theodore J (1971a) Low level carbon monoxide exposure andhuman psychomotor performance. Toxicol Appl Pharmacol, 18: 593-602.
O'Donnell RD, Chikos P, & Theodore J (1971b) Effect of carbon monoxide exposure on human sleepand psychomotor performance. J Appl Physiol, 31: 513-518.
OECD (1997) Advanced air quality indicators project — final report. Paris, Organisation for EconomicCo-operation and Development.
Okeda R, Funata N, Takano T, Miyazaki Y, Yokoyama K, & Manabe M (1981) The pathogenesis ofcarbon monoxide encephalopathy in the acute phase physiological morphological correlation. ActaNeuropathol, 54: 1-10.
Okeda R, Funata N, Song SJ, Higashino F, Takano T, & Yokoyama K (1982) Comparative study onpathogenesis of selective cerebral lesions in carbon monoxide poisoning and nitrogen hypoxia in cats.Acta Neuropathol, 56: 265-272.

EHC 213: Carbon Monoxide
388
Okeda R, Matsuo T, Kuroiwa T, Tajima T, & Takahashi H (1986) Experimental study on pathogenesisof the fetal brain damage by acute carbon monoxide intoxication of the pregnant mother. ActaNeuropathol, 69: 244-252.
Okeda R, Matsuo T, Kuroiwa T, Nakai M, Tajima T, & Takahashi H (1987) Regional cerebral bloodflow of acute carbon monoxide poisoning in cats. Acta Neuropathol, 72: 389-393.
Omura T & Sato R (1964) The carbon monoxide-binding pigment of liver microsomes: I. Evidencefor its hemoprotein nature. J Biol Chem, 239: 2370-2378.
Oremus RA, Barron KW, Gannon BJ, Fleming BP, Heesch CM, & Diana JN (1988) Effects of acutecarbon monoxide (CO) exposure on cardiovascular (CV) hemodynamics in the anesthetized rat.FASEB J, 2: A1312.
OSHA (Occupational Safety and Health Administration) (1991a) Ambient air monitoring reference andequivalent methods. Code Fed Regul, 40: 53.
OSHA (Occupational Safety and Health Administration) (1991b) National primary and secondaryambient air quality standards. Code Fed Regul, 40: 50.
Oshino N, Sugano T, Oshino R, & Chance B (1974) Mitochondrial function under hypoxic conditions:the steady states of cytochrome a+a3 and their relation to mitochondrial energy states. BiochimBiophys Acta, 368: 298-310.
Ott WR (1971) An urban survey technique for measuring the spatial variation of carbon monoxideconcentrations in cities. Stanford, California, Stanford University, Department of Civil Engineering(Ph.D. dissertation). Ann Arbor, Michigan, University Microfilms (Publication No. 72-16,764).
Ott WR (1982) Concepts of human exposure to air pollution. Environ Int, 7: 179-196.
Ott WR (1984) Exposure estimates based on computer generated activity patterns. J Toxicol ClinToxicol, 21: 97-128.
Ott W & Eliassen R (1973) A survey technique for determining the representativeness of urban airmonitoring stations with respect to carbon monoxide. J Air Pollut Control Assoc, 23: 685-690.
Ott W & Flachsbart P (1982) Measurement of carbon monoxide concentrations in indoor and outdoorlocations using personal exposure monitors. Environ Int, 8: 295-304.
Ott W & Mage DT (1975) A method for simulating the true human exposure of critical populationgroups to air pollutants. In: Proceedings of the International Symposium on Recent Advances in theAssessment of the Health Effects of Environmental Pollution, Paris, France, June 1974. Luxembourg,Commission of the European Communities, pp 2097-2107.
Ott WR, Rodes CE, Drago RJ, Williams C, & Burmann FJ (1986) Automated data-logging personalexposure monitors for carbon monoxide. J Air Pollut Control Assoc, 36: 883-887.
Ott W, Thomas J, Mage D, & Wallace L (1988) Validation of the simulation of human activity andpollutant exposure (SHAPE) model using paired days from the Denver, CO, carbon monoxide fieldstudy. Atmos Environ, 22: 2101-2113.
Ott W, Switzer P, & Willits N (1994) Carbon monoxide exposures inside an automobile travelling onan urban arterial highway. Air Waste, 44: 1010-1018.

References
389
Otto DA, Benigus VA, & Prah JD (1979) Carbon monoxide and human time discrimination: failure toreplicate Beard-Wertheim experiments. Aviat Space Environ Med, 50: 40-43.
Pace N, Strajman E, & Walker EL (1950) Acceleration of carbon monoxide elimination in man by highpressure oxygen. Science, 111: 652-654.
Pankow D & Ponsold W (1972) Leucine aminopeptidase activity in plasma of normal and carbonmonoxide poisoned rats. Arch Toxicol, 29: 279-285.
Pankow D & Ponsold W (1974) [The combined effects of carbon monoxide and other biologicallyactive detrimental factors on the organism.] Z Gesamte Hyg Grenzgeb, 20: 561-571 (in German).
Pankow D & Ponsold W (1984) Effect of carbon monoxide exposure on heart cytochrome c oxidaseactivity of rats. Biomed Biochim Acta, 43: 1185-1189.
Pankow D, Ponsold W, & Fritz H (1974) Combined effects of carbon monoxide and ethanol on theactivities of leucine aminopeptidase and glutamic-pyruvic transaminase in the plasma of rats. ArchToxicol, 32: 331-340.
Pantazopoulou A, Katsouyanni K, Kourea-Kremastinou J, & Trichopoulos D (1995) Short-term effectsof air pollution on hospital emergency outpatient visits and admissions in the greater Athens, Greecearea. Environ Res, 69(1): 31-36.
Parving H-H (1972) The effect of hypoxia and carbon monoxide exposure on plasma volume andcapillary permeability to albumin. Scand J Clin Lab Invest, 30: 49-56.
Pauling L (1960) The nature of the chemical bond and the structure of molecules and crystals: anintroduction to modern structural chemistry, 3rd ed. Ithaca, Cornell University Press, pp 194-195.
Paulozzi LJ, Spengler RF, Vogt RL, & Carney JK (1993) A survey of carbon monoxide and nitrogendioxide in indoor ice arenas in Vermont. J Environ Health, 56(5): 23-25.
Paulson OB, Parving H-H, Olesen J, & Skinhoj E (1973) Influence of carbon monoxide and ofhemodilution on cerebral blood flow and blood gases in man. J Appl Physiol, 35: 111-116.
Peeters LLH, Sheldon RE, Jones MD Jr, Makowski EL, & Meschia G (1979) Blood flow to fetal organsas a function of arterial oxygen content. Am J Obstet Gynecol, 135: 637-646.
Penn A (1993) Determination of the atherogenic potential of inhaled carbon monoxide. Cambridge,Massachusetts, Health Effects Institute (Research Report No. 57).
Penn A, Butler J, Snyder C, & Albert RE (1983) Cigarette smoke and carbon monoxide do not haveequivalent effects upon development of arteriosclerotic lesions. Artery, 12: 17-131.
Penn A, Currie J, & Snyder C (1992) Inhalation of carbon monoxide does not acceleratearteriosclerosis in cockerels. Eur J Pharmacol, 228: 155-164.
Penney DG (1984) Carbon monoxide-induced cardiac hypertrophy. In: Zak R ed. Growth of the heartin health and disease. New York, Raven Press, pp 337-362.
Penney DG (1988) A review: hemodynamic response to carbon monoxide. Environ Health Perspect,77: 121-130.
Penney DG (1993) Acute carbon monoxide poisoning in an animal model: The effects of alteredglucose on morbidity and mortality. Toxicology, 80(2-3): 85-101.

EHC 213: Carbon Monoxide
390
Penney DG & Chen K (1996) NMDA receptor-blocker ketamine protects during acute carbonmonoxide poisoning, while calcium channel-blocker verapamil does not. J Appl Toxicol, 16(4): 297-304.
Penney DG & Formolo J (1993) Carbon monoxide-induced cardiac hypertrophy is not reduced byalpha or beta-blockade in the rat. Toxicology, 80(2-3): 173-187.
Penney DG & Weeks TA (1979) Age dependence of cardiac growth in the normal and carbonmonoxide-exposed rat. Dev Biol, 71: 153-162.
Penney D, Dunham E, & Benjamin M (1974a) Chronic carbon monoxide exposure: time course ofhemoglobin, heart weight and lactate dehydrogenase isozyme changes. Toxicol Appl Pharmacol, 28:493-497.
Penney D, Benjamin M, & Dunham E (1974b) Effect of carbon monoxide on cardiac weight ascompared with altitude effects. J Appl Physiol, 37: 80-84.
Penney DG, Sodt PC, & Cutilletta A (1979) Cardiodynamic changes during prolonged carbonmonoxide exposure in the rat. Toxicol Appl Pharmacol, 50: 213-218.
Penney DG, Baylerian MS, & Fanning KE (1980) Temporary and lasting cardiac effects of pre- andpostnatal exposure to carbon monoxide. Toxicol Appl Pharmacol, 53: 271-278.
Penney DG, Baylerian MS, Thill JE, Fanning CM, & Yedavally S (1982) Postnatal carbon monoxideexposure: immediate and lasting effects in the rat. Am J Physiol, 243: H328-H339.
Penney DG, Baylerian MS, Thill JE, Yedavally S, & Fanning CM (1983) Cardiac response of the fetalrat to carbon monoxide exposure. Am J Physiol, 244: H289-H297.
Penney DG, Barthel BG, & Skoney JA (1984) Cardiac compliance and dimensions in carbonmonoxide-induced cardiomegaly. Cardiovasc Res, 18: 270-276.
Penney DG, Davidson SB, Gargulinski RB, & Caldwell-Ayre TM (1988) Heart and lung hypertrophy,changes in blood volume, hematocrit and plasma renin activity in rats chronically exposed toincreasing carbon monoxide concentrations. J Appl Toxicol, 8: 171-178.
Penney DG, Tucker A, & Bambach GA (1992) Heart and lung alterations in neonatal rats exposed toCO or high altitude. J Appl Physiol, 73: 1713-1719.
Penney DG, Giraldo A, & VanEgmond EM (1993) Chronic carbon monoxide exposure in young ratsalter coronary vessel growth. J Toxicol Environ Health, 39: 207-222.
Permutt S & Farhi L (1969) Tissue hypoxia and carbon monoxide. In: Effects of chronic exposure tolow levels of carbon monoxide on human health, behavior, and performance. Washington, DC,National Academy of Sciences, pp 18-24.
Perry RA, Atkinson R, & Pitts JN Jr (1977) Kinetics of the reactions of OH radicals with C2H2 and CO.J Chem Phys, 67: 5577-5584.
Petersen WB & Allen R (1982) Carbon monoxide exposures to Los Angeles area commuters. J AirPollut Control Assoc, 32: 826-833.
Petersen GA & Sabersky RH (1975) Measurements of pollutants inside an automobile. J Air PollutControl Assoc, 25: 1028-1032.

References
391
Peterson JE & Stewart RD (1970) Absorption and elimination of carbon monoxide by inactive youngmen. Arch Environ Health, 21: 165-171.
Peterson JE & Stewart RD (1975) Predicting the carboxyhemoglobin levels resulting from carbonmonoxide exposures. J Appl Physiol, 39: 633-638.
Pettyjohn FS, McNeil RJ, Akers LA, & Faber JM (1977) Use of inspiratory minute volumes inevaluation of rotary and fixed wing pilot workload. Fort Rucker, Alabama, US Army AeromedicalResearch Laboratory (Report No. 77-9).
Piantadosi CA (1990) Carbon monoxide intoxication. In: Update in intensive care and emergencymedicine — Volume 10. Brussels, Erasme University Hospital.
Piantadosi CA, Sylvia AL, Saltzman HA, & Jobsis-Vandervliet FF (1985) Carbon monoxide-cytochrome interactions in the brain of the fluorocarbon-perfused rat. J Appl Physiol, 58: 665-672.
Piantadosi CA, Sylvia AL, & Jobsis-Vandervliet FF (1987) Differences in brain cytochrome responsesto carbon monoxide and cyanide in vivo. J Appl Physiol, 62: 1277-1284.
Piantadosi CA, Zhang J, & Demchenko IT (1997) Production of hydroxyl radical in the hippocampusafter CO hypoxia or hypoxic hypoxia in the rat. Free Radic Biol Med, 22(4): 725-732.
Pirnay F, Dujardin J, Deroanne R, & Petit JM (1971) Muscular exercise during intoxication by carbonmonoxide. J Appl Physiol, 31: 573-575.
Pitts GC & Pace N (1947) The effect of blood carboxyhemoglobin concentration on hypoxia tolerance.Am J Physiol, 148: 139-151.
Porter K & Volman DH (1962) Flame ionization detection of carbon monoxide for gas chromatographicanalysis. Anal Chem, 34: 748-749.
Poulton TJ (1987) Medical helicopters: carbon monoxide risk? Aviat Space Environ Med, 58: 166-168.
Pratt R & Falconer P (1979) Circumpolar measurements of ozone, particles, and carbon monoxidefrom a commercial airliner. J Geophys Res Oceans Atmos, C84: 7876-7882.
Preziosi TJ, Lindenberg R, Levy D, & Christenson M (1970) An experimental investigation in animalsof the functional and morphologic effects of single and repeated exposures to high and lowconcentrations of carbon monoxide. Ann NY Acad Sci, 174: 369-384.
Prigge E & Hochrainer D (1977) Effects of carbon monoxide inhalation on erythropoiesis and cardiachypertrophy in fetal rats. Toxicol Appl Pharmacol, 42: 225-228.
Putz VR, Johnson BL, & Setzer JV (1976) Effects of CO on vigilance performance: effects of low levelcarbon monoxide on divided attention, pitch discrimination, and the auditory evoked potential.Cincinnati, Ohio, National Institute for Occupational Safety and Health (Report No. NIOSH-77-124).
Putz VR, Johnson BL, & Setzer JV (1979) A comparative study of the effects of carbon monoxide andmethylene chloride on human performance. J Environ Pathol Toxicol, 2: 97-112.
Quackenboss JJ, Kanarek MS, Spengler JD, & Letz R (1982) Personal monitoring for nitrogen dioxideexposure: methodological considerations for a community study. Environ Int, 8: 249-258.

EHC 213: Carbon Monoxide
392
Quinlan P, Connor M, & Waters M (1985) Environmental evaluation of stress and hypertension inmunicipal bus drivers. Cincinnati, Ohio, National Institute for Occupational Safety and Health(Publication No. PB86-144763).
Radford EP & Drizd TA (1982) Blood carbon monoxide levels in persons 3-74 years of age: UnitedStates, 1976-80. Hyattsville, Maryland, US Department of Health and Human Services, NationalCenter for Health Statistics (DHHS Publication No. (PHS) 82-1250).
Rahn H & Fenn WO (1955) A graphical analysis of the respiratory gas exchange: the O2-CO2
diagram. Washington, DC, American Physiological Society, p 37.
Rai VS & Minty PSB (1987) The determination of carboxyhaemoglobin in the presence ofsulphaemoglobin. Forensic Sci Int, 33: 1-6.
Ramsey JM (1967) Carboxyhemoglobinemia in parking garage employees. Arch Environ Health,15: 580-583.
Ramsey JM (1972) Carbon monoxide, tissue hypoxia, and sensory psychomotor response inhypoxaemic subjects. Clin Sci, 42: 619-625.
Ramsey JM (1973) Effects of single exposures of carbon monoxide on sensory and psychomotorresponse. Am Ind Hyg Assoc J, 34: 212-216.
Raphael J-C, Elkharrat D, Jars-Guincestre M-C, Chastang C, Chasles V, Vercken J-B, & Gajdos P(1989) Trial of normobaric and hyperbaric oxygen for acute carbon monoxide intoxication. Lancet,2(8660): 414-419.
Rasmussen RA & Khalil MAK (1982) Latitudinal distributions of trace gases in and above theboundary layer. Chemosphere, 11: 227-235.
Rasmussen RA & Went FW (1965) Volatile organic material of plant origin in the atmosphere. ProcNatl Acad Sci (USA), 53: 215-220.
Raven PB, Drinkwater BL, Horvath SM, Ruhling RO, Gliner JA, Sutton JC, & Bolduan NW (1974a)Age, smoking habits, heat stress, and their interactive effects with carbon monoxide andperoxyacetylnitrate on man’s aerobic power. Int J Biometeorol, 18: 222-232.
Raven PB, Drinkwater BL, Ruhling RO, Bolduan N, Taguchi S, Gliner J, & Horvath SM (1974b) Effectof carbon monoxide and peroxyacetyl nitrate on man’s maximal aerobic capacity. J Appl Physiol, 36:288-293.
Redmond CK (1975) Comparative cause-specific mortality patterns by work area within the steelindustry. Cincinnati, Ohio, National Institute for Occupational Safety and Health (HEW PublicationNo. (NIOSH) 75-157).
Redmond CK, Emes JJ, Mazumdar S, Magee PC, & Kamon E (1979) Mortality of steelworkersemployed in hot jobs. J Environ Pathol Toxicol, 2: 75-96.
Reichle HG Jr, Beck SM, Haynes RE, Hesketh WD, Holland JA, Hypes WD, Orr HD III, Sherrill RT,Wallio HA, Casas JC, Saylor MS, & Gormsen BB (1982) Carbon monoxide measurements in thetroposphere. Science, 218: 1024-1026.
Reichle HG Jr, Connors VS, Holland JA, Hypes WD, Wallio HA, Casas JC, Gormsen BB, Saylor MS,& Hesketh WD (1986) Middle and upper tropospheric carbon monoxide mixing ratios as measuredby a satellite-borne remote sensor during November 1981. J Geophys Res Atmos, 91: 10865-10887.

References
393
Reichle HG Jr, Connors VS, Holland JA, Sherrill RT, Wallio HA, Casas JC, Condon EP, GormsenBB, & Seiler W (1990) The distribution of middle tropospheric carbon monoxide during early October1984. J Geophys Res Atmos, 95: 9845-9856.
Renaud S, Blache D, Dumont E, Thevenon C, & Wissendanger T (1984) Platelet function aftercigarette smoking in relation to nicotine and carbon monoxide. Clin Pharmacol Ther, 36: 389-395.
Repp M (1977) Evaluation of continuous monitors for carbon monoxide in stationary sources.Research Triangle Park, North Carolina, US Environmental Protection Agency, EnvironmentalScience Research Laboratory (EPA-600/2-77-063).
Research Triangle Institute (1990) An investigation of infiltration and indoor air quality: final report.Albany, New York, New York State Energy Research and Development Authority (Report No.NYERDA-90-11, available from NTIS, Springfield, Virginia, USA).
Reynolds JEF & Prasad AB ed. (1982) Martindale: The extra pharmacopoeia, 28th ed. London, ThePharmaceutical Press, p 804.
Rickert WS, Robinson JC, & Collishaw N (1984) Yields of tar, nicotine, and carbon monoxide in thesidestream smoke from 15 brands of Canadian cigarettes. Am J Public Health, 74: 228-231.
Rinsland CP & Levine JS (1985) Free tropospheric carbon monoxide concentrations in 1950 and 1951deduced from infrared total column amount measurements. Nature (Lond), 318: 250-254.
Robbins RC, Borg KM, & Robinson E (1968) Carbon monoxide in the atmosphere. J Air Pollut ControlAssoc, 18: 106-110.
Robertson G & Lebowitz MD (1984) Analysis of relationships between symptoms and environmentalfactors over time. Environ Res, 33: 130-143.
Robinson JP (1977) How Americans use time: a social-psychological analysis of everyday behavior.New York, Praeger Publishers.
Robinson E & Robbins RC (1969) Sources, abundance, and fate of gaseous atmospheric pollutants:supplement (SRI Project PR-6755). Menlo Park, California, Stanford Research Institute
Robinson E & Robbins RC (1970) Atmospheric background concentrations of carbon monoxide.In: Coburn RF ed. Biological effects of carbon monoxide. Ann NY Acad Sci, 174: 89-95.
Robinson NB, Barie PS, Halebian PH, & Shires GT (1985) Distribution of ventilation and perfusionfollowing acute carbon monoxide poisoning. In: 41st Annual Forum on Fundamental SurgicalProblems held at the 71st Annual Clinical Congress of the American College of Surgeons, Chicago,October 1985. Surg Forum, 36: 115-118.
Roche S, Horvath S, Gliner J, Wagner J, & Borgia J (1981) Sustained visual attention and carbonmonoxide: elimination of adaptation effects. Hum Factors, 23: 175-184.
Rockwell TJ & Weir FW (1975) The interactive effects of carbon monoxide and alcohol on drivingskills (CRC-APRAC project CAPM-9-69). Columbus, Ohio, The Ohio State University ResearchFoundation (Available from NTIS, Springfield, Virginia, USA).
Rodgers PA, Vreman HJ, Dennery PA, & Stevenson DK (1994) Sources of carbon monoxide (CO)in biological systems and applications of CO detection technologies. Semin Perinatol, 18: 2-10.

EHC 213: Carbon Monoxide
394
Rodkey FL & Collison HA (1979) Effects of oxygen and carbon dioxide on carbon monoxide toxicity.J Combust Toxicol, 6: 208-212.
Rogers WR, Bass RL III, Johnson DE, Kruski AW, McMahan CA, Montiel MM, Mott GE, Wilbur RL,& McGill HC Jr (1980) Atherosclerosis-related responses to cigarette smoking in the baboon.Circulation, 61: 1188-1193.
Rogers WR, Carey KD, McMahan CA, Montiel MM, Mott GE, Wigodsky HS, & McGill HC Jr (1988)Cigarette smoking, dietary hyperlipidemia, and experimental atherosclerosis in the baboon. Exp MolPathol, 48: 135-151.
Rosenkrantz H, Grant RJ, Fleischman RW, & Baker JR (1986) Marihuana-induced embryotoxicityin the rabbit. Fundam Appl Toxicol, 7: 236-243.
Rosenman KD (1984) Cardiovascular disease and work place exposures. Arch Environ Health, 39:218-224.
Rosenstock L & Cullen MR (1986a) Cardiovascular disease. In: Clinical occupational medicine.Philadelphia, W.B. Saunders, pp 71-80.
Rosenstock L & Cullen MR (1986b) Neurologic disease. In: Clinical occupational medicine.Philadelphia, W.B. Saunders, pp 118-134.
Roth RA Jr & Rubin RJ (1976a) Role of blood flow in carbon monoxide- and hypoxic hypoxia-inducedalterations in hexobarbital metabolism in rats. Drug Metab Dispos, 4: 460-467.
Roth RA Jr & Rubin RJ (1976b) Comparison of the effect of carbon monoxide and of hypoxic hypoxia.I. In vivo metabolism, distribution and action of hexobarbital. J Pharmacol Exp Ther, 199: 53-60.
Roth RA Jr & Rubin RJ (1976c) Comparison of the effect of carbon monoxide and of hypoxic hypoxia:II. Hexobarbital metabolism in the isolated, perfused rat liver. J Pharmacol Exp Ther, 199: 61-66.
Roughton FJW (1970) The equilibrium of carbon monoxide with human hemoglobin in whole blood.In: Coburn RF ed. Biological effects of carbon monoxide. Ann NY Acad Sci, 174: 177-188.
Roughton FJW & Darling RC (1944) The effect of carbon monoxide on the oxyhemoglobindissociation curve. Am J Physiol, 141: 17-31.
Roughton FJW & Root WS (1945) The estimation of small amounts of carbon monoxide in air. J BiolChem, 160: 135-148.
Roy TM, Mendieta JM, Ossorio MA, & Walker JF (1989) Perceptions and utilization of hyperbaricoxygen therapy for carbon monoxide poisoning in an academic setting. J Ky Med Assoc, 87: 223-226.
Rummo N & Sarlanis K (1974) The effect of carbon monoxide on several measures of vigilance in asimulated driving task. J Saf Res, 6: 126-130.
Saldiva PH, Lichtenfels AJ, Paiva PS, Barone IA, Martins MA, Massad E, Pereira JC, Xavier VP,Singer JM, & Bohm GM (1994) Association between air pollution and mortality due to respiratorydiseases in children in Sao Paulo, Brazil: A preliminary report. Environ Res, 65(2): 218-225.
Saldiva PH, Pope CA III, Schwartz J, Dockery DW, Lichtenfels AJ, Salge JM, Barone I, & Bohm GM(1995) Air pollution and mortality in elderly people: a time-series study in Sao Paulo, Brazil. ArchEnviron Health, 50(2): 159-163.
References
395
Salinas M & Vega J (1995) The effect of outdoor air pollution on mortality risk: an ecological studyfrom Santiago, Chile. World Health Stat Q, 48(2): 118-125.
Salvatore S (1974) Performance decrement caused by mild carbon monoxide levels on two visualfunctions. J Saf Res, 6: 131-134.
Sammons JH & Coleman RL (1974) Firefighters’ occupational exposure to carbon monoxide. J OccupMed, 16(8): 543-546.
Sandler DP, Comstock GW, Helsing KJ, & Shore DL (1989) Deaths from all causes in non-smokerswho lived with smokers. Am J Public Health, 79(2): 163-167.
Santiago TV & Edelman NH (1976) Mechanism of the ventilatory response to carbon monoxide. J ClinInvest, 57: 977-986.
Savolainen H, Kurppa K, Tenhunen R, & Kivisto H (1980) Biochemical effects of carbon monoxidepoisoning in rat brain with special reference to blood carboxyhemoglobin and cerebral cytochromeoxidase activity. Neurosci Lett, 19: 319-323.
Sawday Y, Takahashi M, Ohashi N, Fusamoto H, Maemura K, Kobayashi H, Yoshiora T, & SugimotoT (1980) Computerized tomography as an indication of long-term outcome after acute carbonmonoxide poisoning. Lancet, 1: 783-784.
Sawicki CA & Gibson QH (1979) A photochemical method for rapid and precise determination ofcarbon monoxide levels in blood. Anal Biochem, 94: 440-449.
Schaad G, Kleinhanz G, & Piekarski C (1983) [Influence of carbon monoxide in breath onpsychophysical competence.] Wehrmed Monatsschr, 10: 423-430 (in German).
Schnakenberg GH (1975) Gas detection instrumentation...what’s new and what’s to come. Coal Age,80: 84-92.
Schnakenberg GH Jr (1976) Improvements in coal mine gas detection instrumentation. Pap SympUnderground Min, 2: 206-216.
Schoendorf KC & Kiely JL (1992) Relationship of sudden infant death syndrome to maternal smokingduring and after pregnancy. Pediatrics, 90(6): 905-908.
Schoenfisch WH, Hoop KA, & Struelens BS (1980) Carbon monoxide absorption through the oral andnasal mucosae of cynomolgus monkeys. Arch Environ Health, 35: 152-154.
Scholander PF & Roughton FJW (1943) Micro gasometric estimation of the blood gases: II. Carbonmonoxide. J Biol Chem, 148: 551-563.
Schrot J & Thomas JR (1986) Multiple schedule performance changes during carbon monoxideexposure. Neurobehav Toxicol Teratol, 8: 225-230.
Schrot J, Thomas JR, & Robertson RF (1984) Temporal changes in repeated acquisition behaviorafter carbon monoxide exposure. Neurobehav Toxicol Teratol, 6: 23-28.
Schulte JH (1963) Effects of mild carbon monoxide intoxication. Arch Environ Health, 7: 524-530.

EHC 213: Carbon Monoxide
396
Schwab M, Colome SD, Spengler JD, Ryan PB, & Billick IH (1990) Activity patterns applied topollutant exposure assessment: data from a personal monitoring study in Los Angeles. Toxicol IndHealth, 6: 517-532.
Schwartz J & Morris R (1995) Air pollution and hospital admissions for cardiovascular disease inDetroit, Michigan. Am J Epidemiol, 141(1): 23-35.
Schwetz BA, Smith FA, Leong BKJ, & Staples RE (1979) Teratogenic potential of inhaled carbonmonoxide in mice and rabbits. Teratology, 19: 385-391.
Scragg R, Stewart AW, Mitchell EA, Ford RP, & Thompson JM (1995) Public health policy on bedsharing and smoking in the sudden infant death syndrome. NZ J Med, 108(1001): 218-222.
Seiler W (1974) The cycle of atmospheric CO. Tellus, 26: 116-135.
Seiler W & Conrad R (1987) Contribution of tropical ecosystems to the global budget of trace gasesespecially CH4, H2, CO and N2O. In: Dickinson RE ed. The geophysiology of Amazonia: vegetationand climate. New York, John Wiley & Sons, Inc.
Seiler W & Fishman J (1981) The distribution of carbon monoxide and ozone in the free troposphere.J Geophys Res Oceans Atmos, C86: 7255-7265.
Seiler W & Giehl H (1977) Influence of plants on the atmospheric carbon monoxide. Geophys ResLett, 4: 329-332.
Seiler W & Junge C (1969) Decrease of carbon monoxide mixing ratio above the polar tropopause.Tellus, 21: 447-449.
Seiler W & Junge C (1970) Carbon monoxide in the atmosphere. J Geophys Res, 75: 2217-2226.
Seiler W & Schmidt U (1974) Dissolved nonconservative gases in seawater. In: Goldberg ED ed. Thesea — Volume 5: Marine chemistry. New York, John Wiley and Sons, Inc., pp 219-243.
Seiler W & Warneck P (1972) Decrease of the carbon monoxide mixing ratio at the tropopause. JGeophys Res, 77: 3204-3214.
Seiler W, Giehl H, & Bunse G (1978) The influence of plants on atmospheric carbon monoxide anddinitrogen oxide. Pure Appl Geophys, 116: 439-451.
Seiler W, Giehl H, Brunke E-G, & Halliday E (1984) The seasonality of CO abundance in the southernhemisphere. Tellus, B36: 219-231.
Sekiya S, Sato S, Yamaguchi H, & Harumi K (1983) Effects of carbon monoxide inhalation onmyocardial infarct size following experimental coronary artery ligation. Jpn Heart J, 24: 407-416.
Selvakumar S, Sharan M, & Singh MP (1993) A mathematical model for the elimination of carbonmonoxide in humans. J Theor Biol, 162: 321-336.
Seppanen A (1977) Physical work capacity in relation to carbon monoxide inhalation and tobaccosmoking. Ann Clin Res, 9: 269-274.
Seppanen A, Hakkinen V, & Tenkku M (1977) Effect of gradually increasing carboxyhaemoglobinsaturation on visual perception and psychomotor performance of smoking and nonsmoking subjects.Ann Clin Res, 9: 314-319.

References
397
Sexton K & Ryan PB (1988) Assessment of human exposure to air pollution: methods,measurements, and models. In: Watson AY, Bates RR, & Kennedy D ed. Air pollution, theautomobile, and public health. Washington, DC, National Academy Press, pp 207-238.
Sexton K, Spengler JD, & Treitman RD (1984) Personal exposure to respirable particles: a case studyin Waterbury, Vermont. Atmos Environ, 18: 1385-1398.
Sheppard D, Distefano S, Morse L, & Becker C (1986) Acute effects of routine firefighting on lungfunction. Am J Ind Med, 9: 333-340.
Sheps DS, Adams KF Jr, Bromberg PA, Goldstein GM, O’Neil JJ, Horstman D, & Koch G (1987)Lack of effect of low levels of carboxyhemoglobin on cardiovascular function in patients with ischemicheart disease. Arch Environ Health, 42: 108-116.
Sheps DS, Herbst MC, Hinderliter AL, Adams KF, Ekelund LG, O’Neil JJ, Goldstein GM, BrombergPA, Dalton JL, Ballenger MN, Davis SM, & Koch GG (1990) Production of arrhythmias by elevatedcarboxyhemoglobin in patients with coronary artery disease. Ann Intern Med, 113: 343-351.
Sheps DS, Herbst MC, Hinderliter AL, Adams KF, Ekelund LG, O’Neil JJ, Goldstein GM, BrombergPA, Ballenger M, Davis SM, & Koch G (1991) Effects of 4 percent and 6 percent carboxyhemoglobinon arrhythmia production in patients with coronary artery disease. Cambridge, Massachusetts, HealthEffects Institute (Research Report No. 41).
Shikiya D, Liu C, Kahn M, Juarros J, & Barcikowski W (1989) In-vehicle air toxics characterizationstudy in the South Coast Air Basin. El Monte, California, South Coast Air Quality ManagementDistrict, Office of Planning and Rules.
Shinomiya K, Orimoto C, & Shinomiya T (1994) [Experimental exposure to carbon monoxide in rats(I) — Relation between the degree of carboxyhemoglobin saturation and the amount of carbonmonoxide in the organ tissues of rats.] Jpn J Legal Med, 48: 19-25 (in Japanese).
Sie BKT, Simonaitis R, & Heicklen J (1976) The reaction of OH with CO. Int J Chem Kinet, 8: 85-98.
Sies H (1977) Oxygen gradients during hypoxic steady states in liver: urate oxidase and cytochromeoxidase as intracellular O2 indicators. Hoppe Seylers Z Physiol Chem, 358: 1021-1032.
Sies H & Brauser B (1970) Interaction of mixed function oxidase with its substrates and associatedredox transitions of cytochrome P-450 and pyridine nucleotides in perfused rat liver. Eur J Biochem,15: 531-540.
Simonaitis R & Heicklen J (1972) Kinetics and mechanism of the reaction of O(3P) with carbonmonoxide. J Chem Phys, 56: 2004-2011.
Singh J (1986) Early behavioral alterations in mice following prenatal carbon monoxide exposure.Neurotoxicology, 7: 475-481.
Singh J & Scott LH (1984) Threshold for carbon monoxide induced fetotoxicity. Teratology, 30:253-257.
Singh MP, Sharan M, & Selvakumar S (1991) A mathematical model for the computation ofcarboxyhemoglobin in human blood as a function of exposure time. Philos Trans R Soc Lond Biol Sci,B334: 135-147.

EHC 213: Carbon Monoxide
398
Singh J, Smith CB, & Moore Cheatu L (1992) Additivity of protein deficiency and carbon monoxideon placental carboxyhemoglobin in mice. Am J Obstet Gynecol, 167: 843-846.
Sisovic A & Fugas M (1985) Indoor concentrations of carbon monoxide in selected urbanmicroenvironments. Environ Monit Assess, 5: 199-204.
Sjostrand T (1948a) A method for the determination of carboxyhaemoglobin concentrations byanalysis of the alveolar air. Acta Physiol Scand, 16: 201-210.
Sjostrand T (1948b) Brain volume, diameter of the blood-vessels in the pia mater, and intracranialpressure in acute carbon monoxide poisoning. Acta Physiol Scand, 15: 351-361.
Small KA, Radford EP, Frazier JM, Rodkey FL, & Collison HA (1971) A rapid method forsimultaneous measurement of carboxy- and methemoglobin in blood. J Appl Physiol, 31: 154-160.
Smith J & Brandon S (1973) Morbidity from acute carbon monoxide poisoning at three years follow-up. Br Med J, 1: 318-321.
Smith EE & Crowell JW (1967) Role of an increased hematocrit in altitude acclimatization. AerospMed, 38: 39-43.
Smith JR & Landaw SA (1978a) Smokers’ polycythemia. N Engl J Med, 298: 6-10.
Smith JR & Landaw SA (1978b) Smokers’ polycythemia [letter to the editor]. N Engl J Med, 298: 973.
Smith F & Nelson AC Jr (1973) Guidelines for development of a quality assurance program: referencemethod for the continuous measurement of carbon monoxide in the atmosphere. Research TrianglePark, North Carolina, US Environmental Protection Agency, Quality Assurance and EnvironmentalMonitoring Laboratory (EPA-R4-73-028a).
Smith RG, Bryan RJ, Feldstein M, Locke DC, & Warner PO (1975) Tentative method for constantpressure volumetric gas analysis for O2, CO2, CO, N2, hydrocarbons (ORSAT). Health Lab Sci,12: 177-181.
Smith MV, Hazucha MJ, & Benignus VA (1994) Effect of regional circulation patterns on observedCOHb level. J Appl Physiol, 77: 1659-1665.
Snella M-C & Rylander R (1979) Alteration in local and systemic immune capacity after exposure tobursts of CO. Environ Res, 20: 74-79.
Snow TR, Vanoli E, De Ferrari G, Stramba-Badiale M, & Dickey DT (1988) Response of cytochromea,a3 to carbon monoxide in canine hearts with prior infarcts. Life Sci, 42: 927-931.
Sokal JA (1985) The effect of exposure duration on the blood level of glucose pyruvate and lactate inacute carbon monoxide intoxication in man. J Appl Toxicol, 5: 395-397.
Sokal JA & Kralkowska E (1985) The relationship between exposure duration, carboxyhemoglobin,blood glucose, pyruvate and lactate and the severity of intoxication in 39 cases of acute carbonmonoxide poisoning in man. Arch Toxicol, 57: 196-199.
Sokal JA, Majka J, & Palus J (1984) The content of carbon monoxide in the tissues of rats intoxicatedwith carbon monoxide in various conditions of acute exposure. Arch Toxicol, 56: 106-108.

References
399
Sokal J, Majka J, & Palus J (1986) Effect of work load on the content of carboxymyoglobin in the heartand skeletal muscles of rats exposed to carbon monoxide. J Hyg Epidemiol Microbiol Immunol,30: 57-62.
Solanki DL, McCurdy PR, Cuttitta FF, & Schechter GP (1988) Hemolysis in sickle cell disease asmeasured by endogenous carbon monoxide production: a preliminary report. Am J Clin Pathol,89: 221-225.
Somogyi E, Balogh I, Rubanyi G, Sotonyi P, & Szegedi L (1981) New findings concerning thepathogenesis of acute carbon monoxide (CO) poisoning. Am J Forensic Med Pathol, 2: 31-39.
Song H, Kuo H, Wei SD, Geun L du S, & Yen F (1984) The COHb levels of 1332 blood donors inBeijing. J Chin Prev Med, 18: 86-88.
Song H, Wang L, & Wang Z (1990) The effects of carbon monoxide on monoamines in brain of ratpups. China Environ Sci, 10: 127-130.
Sparrow D, Bosse R, Rosner B, & Weiss ST (1982) The effect of occupational exposure on pulmonaryfunction: a longitudinal evaluation of fire fighters and nonfire fighters. Am Rev RespirDis, 125: 319-322.
Spengler JD & Soczek ML (1984) Evidence for improved ambient air quality and the need for personalexposure research. Environ Sci Technol, 18: 268A-280A.
Spengler JD, Stone KR, & Lilley FW (1978) High carbon monoxide levels measured in enclosedskating rinks. J Air Pollut Control Assoc, 28: 776-779.
Spengler JD, Treitman RD, Tosteson TD, Mage DT, & Soczek ML (1985) Personal exposures torespirable particulates and implications for air pollution epidemiology. Environ Sci Technol,19: 700-707.
Steenland K (1992) Passive smoking and the risk of heart disease. J Am Med Assoc, 267(1): 94-99.
Steenland K, Thun M, Lally C, & Health C Jr (1996) Environmental tobacco smoke and coronary heartdisease in the American Cancer Society CPS-II cohort. Circulation, 94(4): 622-628.
Stender S, Astrup P, & Kjeldsen K (1977) The effect of carbon monoxide on cholesterol in the aorticwall of rabbits. Atherosclerosis, 28: 357-367.
Stern FB, Lemen RA, & Curtis RA (1981) Exposure of motor vehicle examiners to carbon monoxide:a historical prospective mortality study. Arch Environ Health, 36: 59-66.
Stern FB, Halperin WE, Hornung RW, Ringenburg VL, & McCammon CS (1988) Heart diseasemortality among bridge and tunnel officers exposed to carbon monoxide. Am J Epidemiol,128: 1276-1288.
Stetter JR & Blurton KF (1976) Portable high-temperature catalytic reactor: application to air pollutionmonitoring instrumentation. Rev Sci Instrum, 47: 691-694.
Stevens RK & Herget WF (1974) Analytical methods applied to air pollution measurements. AnnArbor, Michigan, Ann Arbor Science Publishers, Inc.
Stewart RD, Peterson JE, Baretta ED, Bachand RT, Hosko MJ, & Herrmann AA (1970) Experimentalhuman exposure to carbon monoxide. Arch Environ Health, 21: 154-164.

EHC 213: Carbon Monoxide
400
Stewart RD, Peterson JE, Fisher TN, Hosko MJ, Baretta ED, Dodd HC, & Herrmann AA (1973a)Experimental human exposure to high concentrations of carbon monoxide. Arch Environ Health, 26:1-7.
Stewart RD, Newton PE, Hosko MJ, & Peterson JE (1973b) Effect of carbon monoxide on timeperception. Arch Environ Health, 27: 155-160.
Stewart RD, Baretta ED, Platte LR, Stewart EB, Kalbfleisch JH, Van Yserloo B, & Rimm AA (1974)Carboxyhemoglobin levels in American blood donors. J Am Med Assoc, 229: 1187-1195.
Stewart RD, Newton PE, Hosko MJ, Peterson JE, & Mellender JW (1975) The effect of carbonmonoxide on time perception, manual coordination, inspection, and arithmetic. In: Weiss B & LatiesVG ed. Behavioral toxicology: Proceedings of the International Conference on Environmental Toxicity,Rochester, NY, June 1972. New York, London, Plenum Press, pp 29-60.
Stewart RD, Hake CL, Wu A, Stewart TA, & Kalbfleisch JH (1976) Carboxyhemoglobin trend inChicago blood donors, 1970-1974. Arch Environ Health, 31: 280-286.
Stewart RD, Newton PE, Kaufman J, Forster HV, Klein JP, Keelen MH Jr, Stewart DJ, Wu A, & HakeCL (1978) The effect of a rapid 4% carboxyhemoglobin saturation increase on maximal treadmillexercise. New York, Coordinating Research Council, Inc. (Report No. CRC-APRAC- CAPM-22-75,available from NTIS, Springfield, Virginia, USA).
Stock TH, Kotchmar DJ, Contant CF, Buffler PA, Holguin AH, Gehan BM, & Noel LM (1985) Theestimation of personal exposures to air pollutants for a community-based study of health effects inasthmatics — design and results of air monitoring. J Air Pollut Control Assoc, 35: 266-1273.
Stokes DL, MacIntyre NR, & Nadel JA (1981) Nonlinear increases in diffusing capacity during exerciseby seated and supine subjects. J Appl Physiol Respir Environ Exercise Physiol, 51: 858-863.
Storm JE & Fechter LD (1985a) Alteration in the postnatal ontogeny of cerebellar norepinephrinecontent following chronic prenatal carbon monoxide. J Neurochem, 45: 965-969.
Storm JE & Fechter LD (1985b) Prenatal carbon monoxide exposure differentially affects postnatalweight and monoamine concentration of rat brain regions. Toxicol Appl Pharmacol, 81: 139-146.
Storm JE, Valdes JJ, & Fechter LD (1986) Postnatal alterations in cerebellar GABA content, GABAuptake and morphology following exposure to carbon monoxide early in development. Dev Neurosci,8: 251-261.
Stuhl F & Niki H (1972) Pulsed vacuum-UV photochemical study of reactions of OH with H2, D2, andCO using a resonance-fluorescent detection method. J Chem Phys, 57: 3671-3677.
Stupfel M & Bouley G (1970) Physiological and biochemical effects on rats and mice exposed to smallconcentrations of carbon monoxide for long periods. Ann NY Acad Sci, 174: 342-368.
Stupfel M, Mordelet-Dambrine M, & Vauzelle A (1981) COHb formation and acute carbon monoxideintoxication in adult male rats and guinea-pigs. Bull Eur Physiopathol Respir, 17: 43-51.
Styka PE & Penney DG (1978) Regression of carbon monoxide-induced cardiomegaly. Am J Physiol,235: H516-H522.

References
401
Sue-matsu M, Kashiwagi S, Sano T, Goda N, Shinoda Y, & Ishimura Y (1994) Carbon monoxide asan endogenous modulator of hepatic vascular perfusion. Biochem Biophys Res Commun, 205: 1333-1337.
Sulkowski WJ & Bojarski K (1988) Hearing loss due to combined exposure to noise and carbonmonoxide — a field study. In: Berglund B, Berglund U, Karlsson J, & Lindvall T ed. Noise as a publichealth problem: Proceedings of the 5th International Congress on Noise as a Public Health Problem,Stockholm, August 1988 — Volume 1: Abstract guide. Stockholm, Sweden, Swedish Council forBuilding Research, p 179.
Sultzer DL, Brinkhous KM, Reddick RL, & Griggs TR (1982) Effect of carbon monoxide onatherogenesis in normal pigs and pigs with von Willebrand’s disease. Atherosclerosis, 43: 303-319.
Surgeon General of the United States (1986) The health consequences of involuntary smoking: Areport of the Surgeon General. Rockville, Maryland, US Department of Health and Human Services,Public Health Service, Office on Smoking and Health (Publication No. DHHS (CDC)87-8398).
Svendsen KH, Kuller LH, Martin MJ, & Ockene JK (1987) Effects of passive smoking in the multiplerisk factor intervention trial. Am J Epidemiol, 126: 783-795.
Swiecicki W (1973) [The effect of vibration and physical training on carbohydrate metabolism in ratsintoxicated with carbon monoxide.] Med Pr, 34: 399-405 (in Polish).
Swinnerton JW & Lamontagne RA (1974) Carbon monoxide in the south Pacific Ocean. Tellus,26: 136-142.
Swinnerton JW, Linnenbom VJ, & Cheek CH (1968) A sensitive gas chromatographic method fordetermining carbon monoxide in seawater. Limnol Oceanogr, 13: 193-195.
Swinnerton JW, Linnenbom VJ, & Cheek CH (1969) Distribution of methane and carbon monoxidebetween the atmosphere and natural waters. Environ Sci Technol, 3: 836-838.
Swinnerton JW, Lamontagne RA, & Linnenbom VJ (1971) Carbon monoxide in rainwater. Science,172: 943-945.
Sylvester JT, Scharf SM, Gilbert RD, Fitzgerald RS, & Traystman RJ (1979) Hypoxic and CO hypoxiain dogs: hemodynamics, carotid reflexes, and catecholamines. Am J Physiol, 236: H22-H28.
Syvertsen GR & Harris JA (1973) Erythropoietin production in dogs exposed to high altitude andcarbon monoxide. Am J Physiol, 225: 293-299.
Szalai A ed. (1972) The use of time: daily activities of urban and suburban populations in 12 countries.The Hague, The Netherlands, Mouton & Co.
Takano T, Motohashi Y, Miyazaki Y, & Okeda R (1985) Direct effect of carbon monoxide onhexobarbital metabolism in the isolated perfused liver in the absence of hemoglobin. J Toxicol EnvironHealth, 15: 847-854.
Tanaka T & Knox WE (1959) The nature and mechanism of the tryptophan pyrrolase(peroxidase-oxidase) reaction of Pseudomonas and of rat liver. J Biol Chem, 234: 1162-1170.

EHC 213: Carbon Monoxide
402
Tesarik K & Krejci M (1974) Chromatographic determination of carbon monoxide below the 1 ppmlevel. J Chromatogr, 91: 539-544.
Theodore J, O’Donnell RD, & Back KC (1971) Toxicological evaluation of carbon monoxide in humansand other mammalian species. J Occup Med, 13: 242-255.
Thom S (1990) Carbon monoxide-mediated brain lipid peroxidation in the rat. J Appl Physiol, 68: 997-1003.
Thom S (1992) Dehydrogenase conversion to oxidase and lipid peroxidation in brain after carbonmonoxide poisoning. J Appl Physiol, 73(4): 1584-1589.
Thom SR (1993) Functional inhibition of leukocyte B2 integrins by hyperbaric oxygen in carbonmonoxide-mediated brain injury in rats. Toxicol Appl Pharmacol, 123(2): 248-256.
Thom SR & Keim LW (1989) Carbon monoxide poisoning: a review — Epidemiology, patho-physiology, clinical findings, and treatment options including hyperbaric oxygen therapy. J Toxicol ClinToxicol, 27: 141-156.
Thomsen HK (1974) Carbon monoxide-induced atherosclerosis in primates: an electron-microscopicstudy on the coronary arteries of Macaca irus monkeys. Atherosclerosis, 20: 233-240.
Thomsen HK & Kjeldsen K (1975) Aortic intimal injury in rabbits: an evaluation of a threshold limit.Arch Environ Health, 30: 604-607.
Tikuisis P, Kane DM, McLellan TM, Buick F, & Fairburn SM (1992) Rate of formation ofcarboxyhemoglobin in exercising humans exposed to carbon monoxide. J Appl Physiol, 72: 1311-1319.
Topping DL, Fishlock RC, Trimble RP, Storer GB, & Snoswell AM (1981) Carboxyhaemoglobininhibits the metabolism of ethanol by perfused rat liver. Biochem Int, 3: 157-163.
Touloumi G, Pocock SJ, Katsouyanni K, & Trichopoulos D (1994) Short-term effects of air pollutionon daily mortality in Athens: A time-series analysis. Int J Epidemiol, 23(5): 957-967.
Touloumi G, Samli E, & Katsouyanni K (1996) Daily mortality and “winter type” air pollution in Athens,Greece: A time series analysis within the APHEA project. J Epidemiol Community Health, 50(suppl1): 47-51.
Traynor GW, Allen JR, Apte MG, Dillworth JF, Girman JR, Hollowell CD, & Koonce JF Jr (1982)Indoor air pollution from portable kerosene-fired space heaters, wood-burning stoves, andwood-burning furnaces. In: Proceedings of the Air Pollution Control Association Specialty Conferenceon Residential Wood and Coal Combustion, Louisville, KY, March 1982. Pittsburgh, Pennsylvania,Air Pollution Control Association, pp 253-263.
Traynor GW, Apte MG, Carruthers AR, Dillworth JF, Grimsrud DT, & Gundel LA (1984) Indoor airpollution to emissions from wood burning stoves. Presented at the 77th Annual Meeting of the AirPollution Control Association, San Francisco, CA, June 1984. Pittsburgh, Pennsylvania, Air PollutionControl Association (Paper No. 84-33.4).
Traynor GW, Apte MG, Carruthers AR, Dillworth JF, Grimsrud DT, & Gundel LA (1987) Indoor airpollution due to emissions from wood-burning stoves. Environ Sci Technol, 21: 691-697.
References
403
Traystman RJ (1978) Effect of carbon monoxide hypoxia and hypoxic hypoxia on cerebral circulation.In: Otto DA ed. Multidisciplinary perspectives in event-related brain potential research: Proceedingsof the 4th International Congress on Event-Related Slow Potentials of the Brain (EPIC IV),Hendersonville, NC, April 1976. Washington, DC, US Environmental Protection Agency, Office ofResearch and Development, pp 453-457 (EPA-600/9-77-043).
Traystman RJ & Fitzgerald RS (1977) Cerebral circulatory responses to hypoxic hypoxia and carbonmonoxide hypoxia in carotid baroreceptor and chemoreceptor denervated dogs. Acta Neurol Scand,56(suppl 64): 294-295.
Traystman RJ & Fitzgerald RS (1981) Cerebrovascular response to hypoxia in baroreceptor- andchemoreceptor-denervated dogs. Am J Physiol, 241: H724-H731.
Traystman RJ, Fitzgerald RS, & Loscutoff SC (1978) Cerebral circulatory responses to arterial hypoxiain normal and chemodenervated dogs. Circ Res, 42: 649-657.
Trese MT, Krohel GB, & Hepler RS (1980) Ocular effects of chronic carbon monoxide exposure. AnnOphthalmol, 12: 536-538.
Tsukamoto H & Matsuda Y (1985) [Relationship between smoking and both the carbon monoxideconcentration in expired air and the carboxyhemoglobin content.] Kotsu Igaku, 39: 367-376 (inJapanese).
Turino GM (1981) Effect of carbon monoxide on the cardiorespiratory system. Carbon monoxidetoxicity: physiology and biochemistry. Circulation, 63: 253A-259A.
Turner DM, Lee PN, Roe FJC, & Gough KJ (1979) Atherogenesis in the White Carneau pigeon:further studies of the role of carbon monoxide and dietary cholesterol. Atherosclerosis, 34: 407-417.
Turner JAM, McNicol MW, & Sillett RW (1986) Distribution of carboxyhaemoglobin concentrationsin smokers and non-smokers. Thorax, 41: 25-27.
UNEP/WHO (1993) UNEP/WHO GEMS/Air — A global programme for urban air quality monitoringand assessment. Nairobi, United Nations Environment Programme/Geneva, World HealthOrganization (WHO/PEP 93.7; UNEP/GEMS/93.A.1).
US Bureau of the Census (1982) 1980 Census of population and housing supplementary report:provisional estimates of social, economic, and housing characteristics: states and selected standardmetropolitan statistical areas. Washington, DC, US Department of Commerce, Bureau of the Census(Report No. PHC 80-S1-1).
US Centers for Disease Control (1982) Carbon monoxide intoxication — a preventable environmentalhealth hazard. Morb Mortal Wkly Rep, 31: 529-531.
US Department of Commerce (1987) Statistical abstract of the United States 1988, 108th ed.Washington, DC, US Department of Commerce, Bureau of the Census.
US Department of Energy (1982) Estimates of U.S. wood energy consumption from 1949 to 1981.Washington, DC, Energy Information Administration, Office of Coal, Nuclear, Electricity, and AlternateFuels (Publication No. DOE/EIA-0341, available from NTIS, Springfield, Virginia, USA).
US Department of Energy (1984) Estimates of U.S. wood energy consumption 1980-1983.Washington, DC, Energy Information Administration, Office of Coal, Nuclear, Electric and AlternateFuels (Publication No. DOE/EIA-0341[83], available from NTIS, Springfield, Virginia, USA).

EHC 213: Carbon Monoxide
404
US Department of Energy (1988a) Petroleum marketing monthly. Washington, DC, EnergyInformation Administration (Publication No. DOE/EIA-0380[88/06]).
US Department of Energy (1988b) Coal distribution January-December. Washington, DC, EnergyInformation Administration (Publication No. DOE/EIA-25[88/4Q]).
US Department of Energy (1988c) Electric power annual. Washington, DC, Energy InformationAdministration (Publication No. DOE/EIA-0348[87]).
US Department of Health and Human Services (1990) Vital and health statistics — Current estimatesfrom the National Health Interview Survey, 1989. Hyattsville, Maryland, Public Health Service,National Center for Health Statistics (Series 10: Data from the National Health Survey, No. 176)(DHHS Publication No. (PHS) 90-1504).
US Department of Transportation (1988) Highway statistics. Washington, DC, Federal HighwayAdministration.
US EPA (1979a) Control techniques for carbon monoxide emissions. Research Triangle Park, NorthCarolina, US Environmental Protection Agency, Office of Air Quality Planning and Standards,Emission Standards and Engineering Division (EPA-450/3-79-006).
US EPA (1979b) Air quality criteria for carbon monoxide. Research Triangle Park, North Carolina,US Environmental Protection Agency, Office of Health and Environmental Assessment,Environmental Criteria and Assessment Office (EPA-600/8-79-022).
US EPA (1983) Controlling emissions from light-duty motor vehicles at higher elevations: a report toCongress. Ann Arbor, Michigan, US Environmental Protection Agency, Office of Mobile Source AirPollution Control (EPA-460/3-83-001).
US EPA (1985) Compilation of air pollutant emission factors, Volume I: Stationary point and areasources; Volume II: Mobile sources, 4th ed. Research Triangle Park, North Carolina, USEnvironmental Protection Agency, Office of Air Quality Planning and Standards (EPA Reports NosAP-42-ED-4-VOL-1 and AP-42-ED-4-VOL-2).
US EPA (1989a) User’s guide to MOBILE4 (Mobile Source Emission Factor Model). Ann Arbor,Michigan, US Environmental Protection Agency, Office of Mobile Sources (EPA Report No.EPA-AA-TEB-89-01).
US EPA (1989b) Adjustment of MOBILE4 idle CO emission factors to non-standard operatingconditions. Ann Arbor, Michigan, US Environmental Protection Agency, Office of Air and Radiation,Office of Mobile Sources (Unpublished document).
US EPA (1991a) National air quality and emissions trends report, 1990. Research Triangle Park,North Carolina, US Environmental Protection Agency, Office of Air Quality Planning and Standards(EPA/450/4-91/023).
US EPA (1991b) National air pollutant emission estimates 1940-1990. Research Triangle Park, NorthCarolina, US Environmental Protection Agency, Office of Air Quality Planning and Standards(EPA/450/4-91/028).

References
405
US EPA (1991c) National air pollutant emission estimates 1940-1989. Research Triangle Park, NorthCarolina, US Environmental Protection Agency, Office of Air Quality Planning and Standards (EPA-450/4-91-004).
US EPA (1991d) Air quality criteria for carbon monoxide. Research Triangle Park, North Carolina, USEnvironmental Protection Agency, National Centre for Environmental Assessment (EPA/600/8-90/045F).
US Forest Service (1988) Wildfire statistics. Washington, DC, US Department of Agriculture, Stateand Private Forestry.
Van Hoesen KB, Camporesi EM, Moon RE, Hage ML, & Piantadosi CA (1989) Should hyperbaricoxygen be used to treat the pregnant patient for acute carbon monoxide poisoning? A case report andliterature review. J Am Med Assoc, 261: 1039-1043.
Van Netten C, Brubaker RL, Mackenzie CJG, & Godolphin WJ (1987) Blood lead and carboxy-hemoglobin levels in chainsaw operators. Environ Res, 43: 244-250.
Vanoli E, De Ferrari GM, Stramba-Badiale M, Farber JP, & Schwartz PJ (1989) Carbon monoxideand lethal arrhythmias in conscious dogs with a healed myocardial infarction. Am Heart J,117: 348-357.
Van Wijnen JH, Verhoeff AP, Jans HWA, & van Bruggen M (1995) The exposure of cyclists, cardrivers and pedestrians to traffic-related air pollutants. Int Arch Occup Environ Health, 67: 187-193.
Venning H, Roberton D, & Milner AD (1982) Carbon monoxide poisoning in an infant. Br Med J,284: 651.
Verdin A (1973) Gas analysis instrumentation. New York, John Wiley & Sons, Inc.
Verhoeff AP, van der Velde HCM, Boleij JSM, Lebret E, & Brunekreef B (1983) Detecting indoor COexposure by measuring CO in exhaled breath. Int Arch Occup Environ Health, 53: 167-173.
Verhoeff AP, Hoek G, Schwartz J, & van Wijnen JH (1996) Air pollution and daily mortality inAmsterdam. Epidemiology, 7(3): 225-230.
Verma A, Hirsch DJ, Glatt CE, Ronnett GV, & Snyder SH (1993) Carbon monoxide — A putativeneural messenger. Science, 259: 381-384.
Verrier RL, Mills AK, & Skornik WA (1990) Acute effects of carbon monoxide on cardiac electricalstability. Cambridge, Massachusetts, Health Effects Institute (Research Report No. 35).
Vincent SR, Das S, & Maines MD (1994) Brain heme oxygenase isoenzymes and nitric oxidesynthase are co-localized in select neurons. Neuroscience, 63: 223-231.
Virtamo M & Tossavainen A (1976) Carbon monoxide in foundry air. Scand J Work Environ Health,2(suppl 1): 37-41.
Vogel JA & Gleser MA (1972) Effect of carbon monoxide on oxygen transport during exercise. J ApplPhysiol, 32: 234-239.
Vollmer EP, King BG, Birren JE, & Fisher MB (1946) The effects of carbon monoxide on three typesof performance, at simulated altitudes of 10,000 and 15,000 feet. J Exp Psychol, 36: 244-251.
EHC 213: Carbon Monoxide
406
Volz A, Ehhalt DH, & Derwent RG (1981) Seasonal and latitudinal variation of 14CO and thetropospheric concentration of OH radicals. J Geophys Res Oceans Atmos, C86: 5163-5171.
Von Post-Lingen M-L (1964) The significance of exposure to small concentrations of carbon monoxide:results of an experimental study on healthy persons. Proc R Soc Med, 57: 1021-1029.
Von Restorff W & Hebisch S (1988) Dark adaptation of the eye during carbon monoxide exposure insmokers and nonsmokers. Aviat Space Environ Med, 59: 928-931.
Vreman HJ, Kwong LK, & Stevenson DK (1984) Carbon monoxide in blood: an improved microliterblood-sample collection system, with rapid analysis by gas chromatography. Clin Chem, 30:1382-1386.
Wade WA III, Cote WA, & Yocom JE (1975) A study of indoor air quality. J Air Pollut Control Assoc,25: 933-939.
Wagner JA, Horvath SM, & Dahms TE (1975) Carbon monoxide elimination. Respir Physiol,23: 41-47.
Wagner JA, Horvath SM, Andrew GM, Cottle WH, & Bedi JF (1978) Hypoxia, smoking history, andexercise. Aviat Space Environ Med, 49: 785-791.
Wald N, Howard S, Smith PG, & Kjeldsen K (1973) Association between atherosclerotic diseases andcarboxyhaemoglobin levels in tobacco smokers. Br Med J, 1(865): 761-765.
Wald NJ, Idle M, Boreham J, & Bailey A (1981) Carbon monoxide in breath in relation to smoking andcarboxyhaemoglobin levels. Thorax, 36: 366-369.
Wallace LA (1983) Carbon monoxide in air and breath of employees in an underground office. J AirPollut Control Assoc, 33: 678-682.
Wallace LA & Ziegenfus RC (1985) Comparison of carboxyhemoglobin concentrations in adultnonsmokers with ambient carbon monoxide levels. J. Air Pollut Control Assoc, 35: 944-949.
Wallace ND, Davis GL, Rutledge RB, & Kahn A (1974) Smoking and carboxyhemoglobin in theSt. Louis metropolitan population: theoretical and empirical considerations. Arch Environ Health,29: 136-142.
Wallace LA, Thomas J, & Mage DT (1984) Comparison of end-tidal breath CO estimates of COHbwith estimates based on exposure profiles of individuals in the Denver and Washington, DC area.Research Triangle Park, North Carolina, US Environmental Protection Agency, EnvironmentalMonitoring Systems Laboratory (EPA-600/D-84-194).
Wallace LA, Pellizzari ED, Hartwell TD, Sparacino CM, Sheldon LS, & Zelon HS (1985) Results fromthe first three seasons of the TEAM Study: personal exposures, indoor-outdoor relationships, andbreath levels of toxic air pollutants measured for 355 persons in New Jersey. Presented at the 78thAnnual Meeting of the Air Pollution Control Association, Detroit, MI, June 1985. Pittsburgh,Pennsylvania, Air Pollution Control Association (Paper No. 85-31.6).
Wallace L, Thomas J, Mage D, & Ott W (1988) Comparison of breath CO, CO exposure, and Coburnmodel predictions in the U.S. EPA Washington-Denver (CO) study. Atmos Environ, 22: 2183-2193.
Walsh MP & Nussbaum BD (1978) Who’s responsible for emissions after 50,000 miles? AutomotEng, 86: 32-35.

References
407
Ward TV & Zwick HH (1975) Gas cell correlation spectrometer: GASPEC. Appl Opt, 14: 2896-2904.
Warneck P (1988) Chemistry of the natural atmosphere. New York, London, Academic Press.
Wazawa H, Yamamoto K, Yamamoto Y, Matsumoto H, & Fukui Y (1996) Elimination of carbonmonoxide from the body: an experimental study on the rabbit. Nippon Hoigaku Zasshi, 50: 258-262.
Weber A (1984) Annoyance and irritation by passive smoking. Prev Med, 13: 618-625.
Weber A, Jermini C, & Grandjean E (1976) Irritating effects on man of air pollution due to cigarettesmoke. Am J Public Health, 66: 672-676.
Weber A, Fischer T, & Grandjean E (1979a) Passive smoking in experimental and field conditions.Environ Res, 20: 205-216.
Weber A, Fischer T, & Grandjean E (1979b) Passive smoking: irritating effects of the total smoke andthe gas phase. Int Arch Occup Environ Health, 43: 183-193.
Webster WS, Clarkson TB, & Lofland HB (1970) Carbon monoxide-aggravated atherosclerosis in thesquirrel monkey. Exp Mol Pathol, 13: 36-50.
Weir FW, Rockwell TH, Mehta MM, Attwood DA, Johnson DF, Herrin GD, Anglen DM, & Safford RR(1973) An investigation of the effects of carbon monoxide on humans in the driving task: final report(Contracts Nos 68-02-0329 and CRC-APRAC; Project CAPM-9-69). Columbus, Ohio, The Ohio StateUniversity Research Foundation (Publication PB-224646, available from NTIS, Springfield, Virginia,USA).
Weiser PC, Morrill CG, Dickey DW, Kurt TL, & Cropp GJA (1978) Effects of low-level carbonmonoxide exposure on the adaptation of healthy young men to aerobic work at an altitude of1,610 meters. In: Folinsbee LJ, Wagner JA, Borgia JF, Drinkwater BL, Gliner JA, & Bedi JF ed.Environmental stress: individual human adaptations. New York, London, Academic Press, pp101-110.
Weiss HR & Cohen JA (1974) Effects of low levels of carbon monoxide on rat brain and muscle tissuePO
2. Environ Physiol Biochem, 4: 31-39.
Weissbecker L, Carpenter RD, Luchsinger PC, & Osdene TS (1969) In vitro alveolar macrophageviability: effect of gases. Arch Environ Health, 18: 756-759.
Wells AJ (1996) Passive smoking as a cause of heart disease. J Am Coll Cardiol, 24(2): 546-554.
Went FW (1960) Organic matter in the atmosphere, and its possible relation to petroleum formation.Proc Natl Acad Sci (USA), 46: 212-221.
Went FW (1966) On the nature of Aitken condensation nuclei. Tellus, 18: 549-556.
Werner B & Lindahl J (1980) Endogenous carbon monoxide production after bicycle exercise in healthsubjects and in patients with hereditary spherocytosis. Scand J Clin Lab Invest, 40: 319-324.
Wharton DC & Gibson QH (1976) Cytochrome oxidase from Pseudomonas aeruginosa: IV. Reactionwith oxygen and carbon monoxide. Biochim Biophys Acta, 430: 445-453.

EHC 213: Carbon Monoxide
408
White RE & Coon MJ (1980) Oxygen activation by cytochrome P-450. Annu Rev Biochem, 49:315-356.
Whitmore RW, Jones SM, & Rosenzweig MS (1984) Final sampling report for the study of personalCO exposure. Research Triangle Park, North Carolina, US Environmental Protection Agency,Environmental Monitoring Systems Laboratory (EPA-600/4-84-034).
WHO (1987) Air quality guidelines for Europe. Copenhagen, World Health Organization, RegionalOffice for Europe (WHO Regional Publications, European Series, No. 23).
WHO (1997a) Healthy cities — Air management information system. Geneva, World HealthOrganization (CD- ROM).
WHO (1997b) The world health report 1997. Geneva, World Health Organization.
WHO/UNEP (World Health Organization/United Nations Environment Programme) (1992) Urban airpollution in megacities of the world. Oxford, Blackwell.
Wietlisbach V, Pope CA III, & Ackermann-Liebrich U (1996) Air pollution and daily mortality in threeSwiss urban areas. Soz Präventivmed, 41(2): 107-115.
Wigfield DC, Hollebone BR, MacKeen JE, & Selwin JC (1981) Assessment of the methods availablefor the determination of carbon monoxide in blood. J Anal Toxicol, 5: 122-125.
Wilkniss PE, Lamontagne RA, Larson RE, Swinnerton JW, Dickson CR, & Thompson T (1973)Atmospheric trace gases in the southern hemisphere. Nature (Lond), 245: 45-47.
Wilks SS (1959) Carbon monoxide in green plants. Science, 129: 964-966.
Wilks SS, Tomashefski JF, & Clark RT Jr (1959) Physiological effects of chronic exposure to carbonmonoxide. J Appl Physiol, 14: 305-310.
Wilson DA, Hanley DF, Feldman MA, & Traystman RJ (1987) Influence of chemoreceptors onneurohypophyseal blood flow during hypoxic hypoxia. Circ Res, 61(suppl II): II/94-II/101.
Winneke G (1974) Behavioral effects of methylene chloride and carbon monoxide as assessed bysensory and psychomotor performance. In: Xintaras C, Johnson BL, & de Groot I ed. Behavioraltoxicology: early detection of occupational hazards — Proceedings of a workshop, Cincinnati, OH,June 1973. Cincinnati, Ohio, National Institute for Occupational Safety and Health, pp 130-144(DHEW Publication No. (NIOSH) 74-126).
Winston JM & Roberts RJ (1975) Influence of carbon monoxide, hypoxic hypoxia or potassiumcyanide pretreatment on acute carbon monoxide and hypoxic hypoxia lethality. J Pharmacol Exp Ther,193: 713-719.
Winter PM & Miller JN (1976) Carbon monoxide poisoning. J Am Med Assoc, 236: 1503.
Wittenberg BA & Wittenberg JB (1985) Oxygen pressure gradients in isolated cardiac myocytes. JBiol Chem, 260: 6548-6554.
Wittenberg BA & Wittenberg JB (1987) Myoglobin-mediated oxygen delivery to mitochondria ofisolated cardiac myocytes. Proc Natl Acad Sci (USA), 84: 7503-7507.
References
409
Wittenberg BA & Wittenberg JB (1993) Effects of carbon monoxide on isolated heart muscles cells.Cambridge, Massachusetts, Health Effects Institute, pp 1-12 (Research Report No. 62).
Wittenberg BA, Wittenberg JB, & Caldwell PRB (1975) Role of myoglobin in the oxygen supply tored skeletal muscle. J Biol Chem, 250: 9038-9043.
Wohlrab H & Ogunmola GB (1971) Carbon monoxide binding studies of cytochrome a3 hemes inintact rat liver mitochondria. Biochemistry, 10: 1103-1106.
Woodman G, Wintoniuk DM, Taylor RG, & Clarke SW (1987) Time course of end-expired carbonmonoxide concentration is important in studies of cigarette smoking. Clin Sci, 73: 553-555.
WMO (1986) Carbon monoxide (CO). In: Atmospheric ozone 1985: Assessment of our understandingof the processes controlling its present distribution and change. Geneva, World MeteorologicalOrganization, vol 1, pp 100-106 (Global Ozone Research and Monitoring Project, Report No. 16).
Wouters EJM, de Jong PA, Cornelissen PJH, Kurver PHJ, van Oel WC, & van Woensel CLM (1987)Smoking and low birth weight: absence of influence by carbon monoxide? Eur J Obstet GynecolReprod Biol, 25: 35-41.
Wright GR & Shephard RJ (1978a) Brake reaction time — effects of age, sex, and carbon monoxide.Arch Environ Health, 33: 141-150.
Wright GR & Shephard RJ (1978b) Carbon monoxide exposure and auditory duration discrimination.Arch Environ Health, 33: 226-235.
Wright G, Randell P, & Shephard RJ (1973) Carbon monoxide and driving skills. Arch Environ Health,27: 349-354.
Wright GR, Jewczyk S, Onrot J, Tomlinson P, & Shephard RJ (1975) Carbon monoxide in the urbanatmosphere: hazards to the pedestrian and the street-worker. Arch Environ Health, 30: 123-129.
Wu WX (1992) Factors influencing carboxyhemoglobin kinetics in inhalation lung injury. Chung HuaNei Ko Tsa Chih, 31: 689-691, 730.
Wyman J, Bishop G, Richey B, Spokane R, & Gill S (1982) Examination of Haldane’s first law for thepartition of CO and O2 to hemoglobin A0. Biopolymers, 21: 1735-1747.
Yamate G (1974) Emissions inventory from forest wildfires, forest managed burns, and agriculturalburns. Research Triangle Park, North Carolina, US Environmental Protection Agency, Office of AirQuality Planning and Standards (EPA-450/3-74-062).
Yang L, Zhang W, He H, & Zhang G (1988) Experimental studies on combined effects of hightemperature and carbon monoxide. J Tongji Med Univ, 8: 60-65.
Yocom JE (1982) Indoor-outdoor air quality relationships: a critical review. J Air Pollut Control Assoc,32: 500-520.
Yocom JE, Clink WL, & Cote WA (1971) Indoor/outdoor air quality relationships. J Air Pollut ControlAssoc, 21: 251-259.
Young LJ & Caughey WS (1986) Mitochondrial oxygenation of carbon monoxide. Biochem J,239: 225-227.
Young SH & Stone HL (1976) Effect of a reduction in arterial oxygen content (carbon monoxide) oncoronary flow. Aviat Space Environ Med, 47: 142-146.
EHC 213: Carbon Monoxide
410
Young LJ, Choc MG, & Caughey WS (1979) Role of oxygen and cytochrome c oxidase in thedetoxification of CO by oxidation to CO2. In: Caughey WS & Caughey H ed. Biochemical and clinicalaspects of oxygen: Proceedings of a symposium, Fort Collins, CO, September 1975. New York,London, Academic, pp 355-361.
Young JS, Upchurch MB, Kaufman MJ, & Fechter LD (1987) Carbon monoxide exposure potentiateshigh-frequency auditory threshold shifts induced by noise. Hear Res, 26: 37-43.
Zebro T, Wright EA, Littleton RJ, & Prentice AID (1983) Bone changes in mice after prolongedcontinuous exposure to a high concentration of carbon monoxide. Exp Pathol, 24: 51-67.
Zimmerman PR, Chatfield RB, Fishman J, Crutzen PJ, & Hanst PL (1978) Estimates on theproduction of CO and H2 from the oxidation of hydrocarbon emissions from vegetation. Geophys ResLett, 5: 679-682.
Zinkham WH, Houtchens RA, & Caughey WS (1980) Carboxyhemoglobin levels in an unstablehemoglobin disorder (Hb Zuerich): effect on phenotypic expression. Science, 209: 406-408.
Ziskind RA, Rogozen MB, Carlin T, & Drago R (1981) Carbon monoxide intrusion into sustained-usevehicles. Environ Int, 5: 109-123.
Ziskind RA, Fite K, & Mage DT (1982) Pilot field study: carbon monoxide exposure monitoring in thegeneral population. Environ Int, 8: 283-293.
Zorn H (1972) The partial oxygen pressure in the brain and liver at subtoxic concentrations of carbonmonoxide. Staub-Reinhalt Luft, 32: 24-29.
Zwart A & van Kampen EJ (1985) Dyshaemoglobin, especially carboxyhaemoglobin, levels inhospitalized patients. Clin Chem, 31: 945.
Zwart A, Buursma A, Oeseburg B, & Zijlstra WG (1981a) Determination of hemoglobin derivativeswith the IL 282 CO-oximeter as compared with a manual spectrophotometric five-wavelength method.Clin Chem, 27: 1903-1907.
Zwart A, Buursma A, van Kampen EJ, Oeseburg B, van der Ploeg PHW, & Zijlstra WG (1981b)A multi-wavelength spectrophotometric method for the simultaneous determination of fivehaemoglobin derivatives. J Clin Chem Clin Biochem, 19: 457-463.
Zwart A, Buursma A, van Kampen EJ, & Zijlstra WG (1984) Multicomponent analysis of hemoglobinderivatives with a reversed optics spectrophotometer. Clin Chem, 30: 373-379.
Zwart A, van Kampen EJ, & Zijlstra WG (1986) Results of routine determination of clinicallysignificant hemoglobin derivatives by multicomponent analysis. Clin Chem, 32: 972-978.
411
RESUME ET CONCLUSIONS
Le monoxyde de carbone appelé aussi oxyde de carbone (CO) estun gaz incolore et inodore qui peut être toxique pour l’Homme. Ilrésulte de la combustion incomplète de substances contenant ducarbone et se forme également dans l’organisme humain à la faveur deprocessus naturels ou encore par suite de la biotransformation deshalométhanes. Lors d’une exposition externe à des teneurs enmonoxyde de carbone supérieures à la normale, des effets subtilspeuvent commencer à se manifester et en cas d’exposition à desconcentrations encore plus élevées, la mort peut survenir. Les effetstoxiques du monoxyde de carbone sont dus pour une grande part à laformation de carboxyhémoglobine (COHb), qui empêche le transportde l’oxygène par le sang.
1. Chimie et méthodes d’analyse
Il existe, pour doser le monoxyde de carbone dans l’air ambiant,toute une série de possibilités qui vont des méthodes totalementautomatisées basées sur l’arbsorptiométrie infrarouge non dispersiveou la chromatographie en phase gazeuse à des techniques manuellessemiquantitatives utilisant des tubes détecteurs. Comme la formationde carboxyhémoglobine dans l’organisme humain dépend d’un grandnombre de facteurs, et notamment du caractère variable de la teneur del’air en monoxyde de carbone, il est préférable de mesurer laconcentration de carboxyhémoglobine que de chercher à la calculer. Ilexiste un certain nombre de méthodes relativement simples pour doserle monoxyde de carbone en analysant le sang ou l’air alvéolaire enéquilibre avec le sang. Certaines de ces méthodes ont pu être validéesgrâce à une études comparatives minutieuses.
2. Sources et concentrations de monoxyde de carbonedans l’environnement
Le monoxyde de carbone est présent dans la troposphère à l’étatde traces qui trouvent leur origine dans des processus naturels et danscertaines activités humaines. Etant donné que les végétaux sontcapables de métaboliser le monoxyde de carbone et d’en produire, onconsidère qu’à l’état de traces, ce gaz est un constituant normal del’environnement naturel. La concentration de monoxyde de carbone
EHC 213: Carbon Monoxide
412
dans l’air aux abords des agglomérations et des zones industrielles peutêtre sensiblement supérieure à la teneur naturelle normale, mais on n’aencore jamais fait état d’effets nocifs sur les plantes ou lesmicrooganismes qui seraient imputables aux teneurs que l’on mesureactuellement dans ces conditions. Il n’en reste pas moins que laprésence de monoxyde de carbone à ces concentrations peut êtredommageable à la santé humaine, selon les valeurs qu’elles atteignentsur les lieux de travail ou les zones de résidence et en fonctionégalement de la réceptivité des sujets exposés aux effets nocifspotentiels.
En examinant les données de qualité de l’air fournies par lesstations de contrôle fixes, on constate une tendance au déclin de lateneur en monoxyde de carbone qui traduit l’efficacité des systèmesantipollution dont sont munis les véhicules récents. Aux Etats-Unis, lesémissions dues aux véhicules à moteur qui circulent sur les autoroutesreprésentent environ 50 % du total, les moyens de transports circulanthors des autoroutes en représentant 13 %. Parmi les autres sourcesémettant du monoxyde de carbone on peut citer l’utilisation d’autrescombustibles que les carburants automobiles, par exemple dans leschaudières (12 %), divers processus industriels (8 %), l’élimination desdéchets solides (3 %) et diverses autres sources (14 %).
A l’intérieur des bâtiments, la concentration en monoxyde decarbone dépend de la concentration dans l’air extérieur, de la présencede sources internes, de la ventilation et du brassage de l’air danschaque pièce et d’une pièce à l’autre. Dans les habitation où il n’enexiste pas d’autres sources, la concentration de monoxyde de carbonedans l’air est à peu près la même que la concentration extérieuremoyenne. Les concentrations les plus élevées se rencontrent enprésence de sources intérieures de combustion, notamment dans lesgarages fermés, les stations service et les restaurants, par exemple.C’est dans l’air des maisons d’habitation, des églises et desétablissements de soins que la concentration en monoxyde de carboneest la plus faible. On a montré que le tabagisme passif résultant del’exposition à la fumée de cigarette accroît l’exposition des nonfumeurs d’environ 1,7 mg/m3 en moyenne (1,5 ppm) et que l’utilisationd’une cuisinière à gaz augmente la teneur de l’air en CO d’environ 2,9mg/m3 (2,5 ppm). Parmi les autres sources de monoxyde de carbone
Résumé et Conclusions
413
dans l’air intérieur des habitations on peut citer les cheminées, leschauffe-eau ainsi que les poêles à bois ou à charbon.
3. Distribution et transformation dans l’environnement
Il ressort des données récentes sur l’évolution des concentrationsen monoxyde de carbone à l’échelle de la planète que celles-ci sont endiminution depuis une dizaine d’années. Le niveau de fond est del’ordre de 60 à 140 :g/m3 (50 à 120 parties par milliard). Les valeurssont plus fortes dans l’hémisphère nord que dans l’hémisphère sud. Leniveau de fond moyen fluctue également selon la saison. Les valeurssont plus fortes durant les mois d’hiver et plus faibles en été. Environ60 % du monoxyde de carbone présent dans la troposphère hors desagglomérations urbaines trouvent leur origine dans des activitéshumaines, soit de façon directe par suite de processus de combustion,soit de façon indirecte par suite de l’oxydation d’hydrocarbures etnotamment du méthane lors d’activités agricoles, de l’enfouissementde déchets etc. Dans l’atmosphère, le monoxyde de carbone peutintervenir dans des réactions susceptibles d’aboutir à la formationd’ozone au niveau de la troposphère. D’autres réactions peuventconduire à réduire fortement la concentration en radicaux hydroxyles,qui jouent un rôle clé dans les cycles planétaires d’élimination denombreux autres gaz résultant de l’activité humaine et qui sontégalement présents dans l’atmosphère à l’état de traces. Il pourraits’ensuivre une modification de la chimie atmosphérique et en fin decompte, un changement du climat général de la planète.
4. Exposition de la population au monoxyde de carbone
Au cours de ses activités quotidiennes habituelles, tout un chacunse trouve en présence de monoxyde de carbone dans diversmicroenvironnements - en se déplaçant à bord d’un véhicule à moteur,en exerçant son activité professionnelle, en se rendant sur des sitesurbains où diverses substances sont brûlées, en faisant la cuisine ou ense chauffant au gaz, au charbon ou au bois ou encore en fumant ou enétant exposé à la fumée des autres. En règle générale, c’est à proximitéd’un véhicule en marche ou dans certains microrenvironnementsdomestiques que l’exposition au monoxyde de carbone est la plusimportante pour la majorité des gens.
EHC 213: Carbon Monoxide
414
Grâce à des moniteurs élecrochimiques personnels (MEP) queleur miniaturisation permet de porter sur soi, il est possible de mesurerles concentrations de monoxyde de carbone qu’un individu estsusceptible de rencontrer lorsqu’il se déplace à travers un grandnombre de microenvironnements extérieurs et intérieurs que l’on nepeut surveiller à l’aide de station de mesure fixes. Les résultats desmesures sur le terrain ainsi que les études de modélisation indiquentqu’il n’y a pas de corrélation directe entre l’exposition individuelledéterminée par les MEP et la concentration de monoxyde de carbonemesurée en utilisant uniquement des stations fixes. Cette observations’explique par la mobilité des personnes et également par les variationsspatio-temporelles de la teneur en CO. Les études de grande envergureportant sur l’exposition humaine au monoxyde de carbone ne mettentpas en évidence de corrélation entre les chiffres des moniteurspersonnels et ceux des stations de mesure fixes les plus proches, maiselles révèlent que l’exposition individuelle cumulée est plus faible lesjours où la concentration ambiante de CO mesurée par les stations fixesest basse et qu’elle est plus élevée lorsque cette concentration est enaugmentation. Ces études soulignent la nécessité de compléter lesmesures des stations fixes par celles des moniteurs personnels si l’onveut évaluer l’exposition humaine totale. Les données fournies par cesétudes sur le terrain peuvent être utilisées pour établir et expérimenterdes modèles d’exposition humaine rendant compte de l’évolution del’exposition au CO en fonction du temps et de l’activité.
L’étude des diverses situations conduisant à une expositionhumaine au monoxyde de carbone indique que sur certains lieux detravail ou dans certaines habitations où les appareils à combustion sontdéfectueux ou dont la ventilation n’est pas suffisante, montre quel’exposition peut dépasser 110 mg de monoxyde de carbone par m3
(100 ppm), ce qui conduit souvent à des taux de carboxyhémoglobinede 10 % ou davantage en cas d’exposition continue. En revanche, lapopulation générale est beaucoup moins souvent exposée à de tellesconcentrations dans les conditions ambiantes habituelles. Lesconcentrations auxquelles la population générale est exposée pendantdes périodes plus ou moins longues se situent plus fréquemment dansla fourchette de 29 à 57 mg de monoxyde de carbone par m3 (25-50 ppm); dans ces circonstances, l’activité physique est généralementréduite et le taux résultant de carboxyhémoglobine ne dépasse pas 1-2 % chez les non fumeurs. Ces valeurs sont comparables à la norme
Résumé et Conclusions
415
physiologique pour des non fumeurs, qui est de 0,3 à 0,7 %. Chez lesfumeurs en revanche, le taux de base de carboxyhémoglobine est de 4% en moyenne, avec un intervalle de variation qui est habituellementde 3-8 %, et il traduit l’absorption du CO présent dans la fuméeinhalée.
Les études consacrées à l’exposition humaine ont montré que lesgaz d’échappement des véhicules à moteur sont la source la plusfréquente des concentrations élevées de CO. Elles montrent enparticulier qu’à l’intérieur d’un véhicule à moteur, la concentrationmoyenne maximale en monoxyde de carbone (en moyenne 10-29 mg/m3, soit 9-25 ppm) est la plus forte de tous lesmicroenvironnements. En outre, pour les habitants des banlieues, laconcentration varie dans des proportions extrêmes, et l’exposition peutatteindre dans certains cas plus de 40 mg/m3 (35 ppm).
Les lieux de travail constituent également un environnementimportant en ce qui concerne l’exposition au monoxyde de carbone. Engénéral, si l’on excepte les trajets pour se rendre au travail et enrevenir, l’exposition pendant l’activité professionnelle est supérieureà ce qu’elle peut être pendant les période de loisirs. Il arrivequ’exposition professionnelle et non professionnelle se juxtaposent, cequi peut conduire à une concentration encore plus élevée de monoxydede carbone dans le sang. Mais plus encore, certaines activitésprofessionnelles, de par leur nature même, peuvent comporter un risqueaccru de forte exposition au CO (par exemple, la conduite et l’entretiende véhicules ou le gardiennage de parkings). Parmi les professionsexposées au monoxyde de carbone présent dans les gaz d’échappementde véhicules à moteur, on peut citer les mécaniciens automobiles, lesgardiens de parkings et les employés de stations service, les chauffeursde bus, de camions ou de taxis et enfin les employés des entrepôts.Certains processus industriels peuvent également exposer les ouvriersà du monoxyde de carbone produit directement ou en tant que sous-produit d’autres activités : production d’acier, fours à coke, productionde noir de carbone et raffinage du pétrole, par exemple. Les pompiers,les cuisiniers et les ouvriers du bâtiment peuvent également êtreexposés à de fortes concentrations de monoxyde de carbone.L’exposition au monoxyde de carbone dans l’industrie est la plus fortequi ait été observée au niveau individuel lors des enquêtes sur leterrain.
EHC 213: Carbon Monoxide
416
5. Toxicocinétique et modes d’action du monoxyde decarbone
Le monoxyde de carbone est absorbé au niveau des poumons etla concentration de carboxyhémoglobine à un instant quelconquedépend de plusieurs facteurs. Lorsqu’il y a équilibre avec l’air ambiant,la teneur du sang en carboxyhémoglobine dépend essentiellement dela concentration respective du monoxyde de carbone et de l’oxygèneinspirés. En revanche, s’il n’y a pas équilibre, la concentration de lacarboxyhémoglobine va également dépendre de la durée del’exposition, de la ventilation pulmonaire et de la quantité decarboxyhémoglobine initialement présente avant l’inhalation d’aircontaminé. En plus de sa réaction sur l’hémoglobine, le monoxyde decarbone se combine à la myoglobine, aux cytochromes et auxmétalloenzymes telles que la cytochrome-c-oxydase et le cytochromeP-450. On ignore quelle peut être l’incidence de ces réactions sur lasanté humaine mais il est probable qu’aux concentrations ambiantes,elles sont moins importantes que la fixation du gaz sur l’hémoglobine.
Les échanges de monoxyde de carbone entre l’air que nousrespirons et notre organisme sont sous la dépendance de processusphysiques (transferts de masse et diffusion) et physiologiques (par ex.la ventilation alvéolaire et le débit cardiaque). Le monoxyde decarbone passe facilement des poumons au courant sanguin. L’étapefinale de ce processus comporte une compétition entre le monoxyde decarbone et l’oxygène pour la fixation sur l’hémoglobine à l’intérieurdes hématies, qui conduit respectivement à la formation decarboxyhémoglobine et d’oxyhémoglobine (O2Hb). La fixation dumonoxyde de carbone sur l’hémoglobine pour donner de lacarboxyhémoglobine et réduire ainsi la capacité du sang à transporterl’oxygène, se révèle être le principal mécanisme à la base des effetstoxiques d’une exposition à de faibles concentration de ce gaz. On neconnaît pas totalement le détail des mécanismes par lesquels laformation de carboxyhémoglobine exerce ses effets toxiques, mais ilest probable qu’ils comportent l’apparition d’un état d’hypoxie dansnombre des tissus qui composent les divers organes. On a invoquéd’autres modes d’action ainsi que des mécanismes secondaires pourexpliquer la toxicité du monoxyde de carbone (à côté de la formationde carboxyhémoglobine), mais il n’a pu être prouvé que cesmécanismes étaient capables d’intervenir à des niveaux d’expositionrelativement faibles (concentrations proches des valeurs ambiantes).
Résumé et Conclusions
417
On admet donc, à l’heure actuelle, que le taux sanguin decarboxyhémoglobine constitue un marqueur utile pour l’estimation dela charge interne en monoxyde de carbone due 1) à la formationendogène de cette molécule et 2) à l’exposition au monoxyde decarbone d’origine exogène produit par des sources externes. Le taux decarboxyhémoglobine susceptible de résulter de diverses modalitésd’exposition (concernant par exemple la concentration, la durée etc...)à des sources externes peut être calculé assez bien au moyen del’équation de Coburn-Forster-Kane, appelée aussi équation CFK.
L’exposition au monoxyde de carbone a donc cette caractéristiqueunique d’être évaluable au moyen du taux de carboxyhémoglobine, quise révèle donc être un marqueur biologique intéressant de la dose reçupar le sujet exposé. La quantité de carboxyhémoglobine formée dépendde la concentration du gaz et de la durée d’exposition, de l’activitéphysique exercée lors de l’exposition (qui accroît le volume d’airinhalé par unité de temps), de la température ambiante, de l’état desanté du sujet et de son métabolisme propre. La formation decarboxyhémoglobine est un processus réversible; cependant, en raisonde la force de la liaison du monoxyde de carbone à la moléculed’hémoglobine, la demi-vie d’élimination est assez longue et va de 2à 6,5 h selon la concentration initiale de carboxyhémoglobine et de lafréquence respiratoire du sujet. Il s’ensuit que la carboxyhémoglobinepeut s’accumuler et que des concentrations même relativement faiblesde monoxyde de carbone sont susceptibles d’en produire de fortesconcentrations dans le sang.
On peut déterminer le taux sanguin de carboxyhémoglobine soitdirectement par analyse du sang, soit indirectement en dosant lemonoxyde de carbone dans l’air expiré. Cette dernière méthode al’avantage de la facilité, de la rapidité, de la précision et d’unemeilleure coopération du sujet que dans le cas d’une analyse sanguine.Toutefois, dans le cas d’une exposition à une faible concentration demonoxyde de carbone présente dans l’environnement, l’exactitude dela méthode et la validité de la relation de Haldane entre laconcentration dans l’air expiré et la concentration sanguine restentincertaines.
Etant donné la difficulté à obtenir des mesures de carboxy-hémoglobine dans la population exposée, on a mis au point desmodèles mathématiques qui permettent de déterminer le taux de
EHC 213: Carbon Monoxide
418
carboxyhémoglobine résultant d’une exposition à du monoxyde decarbone dans diverses circonstances. Le modèle le mieux adapté auxdiverses conditions est l’équation de Coburn-Forster-Kane. La solutionlinéaire est utile pour l’étude des données de pollution de l’airconduisant à des taux relativement faibles de carboxyhémoglobine, lessolutions non linéaires ayant une bonne valeur prédictive même pourles situations où l’exposition au monoxyde de carbone est intense. Lesdeux modèles de régression peuvent également avoir leur utilité, maisseulement si les conditions d’applications sont très proches de cellesdans lesquelles les paramètres ont été établis.
Même si la toxicité du monoxyde de carbone s’expliqueprincipalement, en cas d’exposition peu intense, par une hypoxietissulaire due à la fixation de ce gaz sur l’hémoglobine, il est difficilede bien expliquer certains aspects physiologiques de l’exposition aumonoxyde de carbone par une diminution de la pression partielled’oxygène intracellulaire due à la présence de carboxyhémoglobine.C’est pourquoi de nombreux travaux de recherche sont consacrés à desmécanismes secondaires susceptibles de rendre compte de la toxicitédu monoxyde de carbone qui résulte de sa fixation intracellulaire. Il estabondamment attesté que le monoxyde de carbone se combine à diverscomposés intracellulaires tant in vivo qu’in vitro. On ignore encore sila fixation intracellulaire du monoxyde de carbone en présenced’hémoglobine est suffisante pour provoquer des troubles organiquesaigus ou des effets à long terme. Comme on ne dispose pratiquementpas de techniques sensibles qui puissent nous permettre d’étudier lafixation du monoxyde de carbone dans les conditions physiologiques,diverses méthodes ont été proposées qui abordent le problème demanière indirecte et nombre d’études ont abouti à des résultats négatifs.
A l’heure actuelle, on pense que les protéines intracellulaires quiont le plus de chances d’être fonctionnellement inhibées par la fixationde monoxyde de carbone lorsque la carboxyhémoglobine atteint untaux significatif sont la myoglobine, qui est principalement présentedans le myocarde et les muscles squelettiques, ainsi que la cytochrome-oxydase. On ignore encore quelle peut être la portée physiologique dela fixation de monoxyde de carbone par la myoglobine, mais il est vraique si la concentration de carboxymyoglobine atteint une valeursuffisante, elle peut limiter la fixation de l’oxygène par le musclependant l’exercice physique. On dispose de données qui suggèrent que
Résumé et Conclusions
419
le monoxyde de carbone se combine effectivement à la cytochrome-oxydase dans le tissu cardiaque et cérébral, mais cette combinaisonn’est sans doute pas très importante lorsque le taux decarboxyhémoglobine est faible.
6. Effets toxiques de l’exposition au monoxyde decarbone
Du point de vue sanitaire, l’importance de la pollution de l’air parle monoxyde de carbone tient en grande partie au fait que ce gaz secombine énergiquement avec la molécule d’hémoglobine pour formerde la carboxyhémoglobine qui réduit la capacité du sang à transporterl’oxygène. La carboxyhémoglobine perturbe également la dissociationintratissulaire de l’oxyhémoglobine, de sorte que cela réduit encorel’apport d’oxygène aux tissus. L’hémoglobine humaine a environ 240fois plus d’affinité pour le monoxyde de carbone que pour l’oxygèneet la proportion relative de carboxyhémoglobine et d’oxyhémoglobinequi se forment dans le sang dépend en grande partie de la pressionpartielle respective du monoxyde de carbone et de l’oxygène.
Les effets potentiels d’une exposition au monoxyde de carboneont suscité de nombreuses études tant chez l’Homme que chezl’animal. Divers protocoles expérimentaux ont permis d’obtenir unesomme de données sur la toxicité du monoxyde de carbone, sur seseffets directs au niveau du sang et des autres tissus, ainsi que sur lamanifestation de ces effets sous forme de perturbations fonctionnellesau niveau des divers organes. Cependant, nombreuses sont les étudessur l’animal qui ont été effectuées avec des concentrationsextrêmement élevées de monoxyde de carbone (c’est-à-dire necorrespondant nullement à celles qui sont présentes dans l’air ambiant).Il est vrai malgré tout que, même si les graves effets résultant d’uneexposition à des concentrations aussi fortes ne sont guère en rapportavec ceux que peut produire l’exposition aux concentrationsrencontrées dans l’air ambiant, ces études fournissent néanmoins desrenseignements intéressants sur les effets potentiels d’une expositionaccidentelle au monoxyde de carbone, en particulier d’une expositionà l’intérieur d’un local.
EHC 213: Carbon Monoxide
420
6.1 Effets cardiovasculaires
On a montré sans ambiguïté qu’à partir d’un taux decarboxyhémoglobine de 5,0 %, il y avait réduction de la fixationd’oxygène et diminution consécutive de la capacité physique dans desconditions d’effort maximal chez de jeunes adultes en bonne santé. Enoutre, il ressort de plusieurs études que la capacité physique commencedéjà à diminuer un peu pour des taux de carboxyhémoglobinen’excédant pas 2,3 à 4,3 %. Ces effets peuvent avoir des conséquencespour la santé de la population, en ce sens qu’ils impliquent un risquede diminution de l’aptitude à exercer certaines activitésprofessionnelles ou récréatives tant soit peu exigeantes sur le planphysique, lorsque l’exposition au monoxyde de carbone est d’uneintensité suffisante.
Ce sont cependant certains effets cardiovasculaires qui peuventêtre plus à craindre en cas d’exposition à des concentrations ambiantesde monoxyde de carbone plus caractéristiques (notammentl’aggravation d’un angor au cours d’une activité physique) chez uneproportion plus faible mais néanmoins non négligeable de lapopulation. Les sujets souffrant d’angine de poitrine chronique sontconsidérés actuellement comme le groupe le plus réceptif aux effetsd’une exposition au monoxyde de carbone, d’après les signesd’aggravation de l’angor constatés chez des patients présentant un tauxde carboxyhémoglobine de 2,9 à 4,5 %. Il faudra encore établir demanière plus concluante les relations dose-réponse chez les maladessouffrant de cardiopathies coronariennes, mais on ne peut cependantexclure la possibilité que ces effets cardiovasculaires se produisent àdes taux de carboxyhémoglobine inférieurs à 2,9 %. C’est pourquoi leprésent document comporte une évaluation des études nouvellementpubliées sur la question afin de déterminer si le monoxyde de carboneest susceptible d’aggraver un angor à des taux de carboxyhémoglobinesitués entre 2 et 6 %.
Cinq études essentielles ont été consacrées à la possibilitéd’aggravation d’une ischémie myocardique par une exposition aumonoxyde de carbone pendant l’exercice physique chez des maladescoronariens. Une première étude avait montré que la durée del’exercice physique était sensiblement réduite par l’apparition d’unedouleur thoracique (angor) chez les sujets souffrant d’angine depoitrine pour des taux post-exposition de carboxyhémoglobinen’excédant pas 2,9 %, c’est-à-dire supérieurs de 1,6 % au taux de base.
Résumé et Conclusions
421
Une étude multicentrique de grande envergure a mis en évidence deseffets cardiovasculaires chez des malades présentant un angor d’effortreproductible pour des taux post-exposition de carboxyhémoglobine de3,2 %, c’est-à-dire supérieurs de 2,0 % à la valeur de base. D’autresauteurs ont également observé des effets analogues chez des patientssouffrant d’une cardiopathie coronarienne obstructive et mis enévidence une ischémie d’effort à des taux post-exposition decarboxyhémoglobine respectivement égaux à 4,1 et 5,9 %, c’est-à-direrespectivement supérieurs de 2,2 et de 4,2 % au taux de base. Uneautre étude, portant sur des sujets souffrant d’angine de poitrine, a misen évidence des effets cardiovasculaires à un taux decarboxyhémoglobine de 3 %, c’est-à-dire supérieur de 1,5 % à lavaleur de base. La valeur la plus faible sans effet nocif observable(LOAEL) chez des malades présentant une ischémie d’effort se situedonc quelque part entre 3 et 4 % de carboxyhémoglobine, c’est-à-direun taux supérieur de 1,5 à 2,2 % à la valeur de base. On n’a pas étudiéles effets du monoxyde de carbone sur les épisodes d’ischémieasymptomatiques, qui représentent en fait la majorité des cas chez cesmalades.
Les effets nocifs d’une exposition à de faibles concentrations demonoxyde de carbone chez des malades souffrant de cardiopathieischémique sont difficiles à prévoir au sein d’une population decardiaques. On a montré qu’une exposition suffisante pour produire untaux de carboxyhémoglobine de 6 % au moins, augmentait sensible-ment le nombre et la complexité des arythmies d’effort en cas decoronaropathie et d’ectopie. Cette observation, si on la rapproche desrésultats d’études de morbidité et de mortalité ou d’études épidémiol-ogiques relatives aux ouvriers travaillant dans des tunnels qui sontsystématiquement exposés au monoxyde de carbone émis par lesvéhicules automobiles, incite à penser, sans certitude absolue toutefois,que l’exposition au monoxyde de carbone peut comporter un risqueaccru de mort subite chez les malades souffrant de coronaropathie.
Des travaux antérieurs consacrés aux effets cardiovasculaires dumonoxyde de carbone ont mis en évidence ce qui semble être unerelation linéaire entre le taux sanguin de carboxyhémoglobine et unediminution des performances physiques chez les sujets humainsmesurées par la consommation maximale d’oxygène. Cette diminutionest systématiquement observée pour des taux sanguins de carboxy-hémoglobine d’environ 5 %, chez de jeunes sujets non fumeurs en
EHC 213: Carbon Monoxide
422
bonne santé. Certaines études ont même mis en évidence une réductionde la durée maximale des exercices physiques courts pour des taux decarboxyhémoglobine n’excédant pas 2,3 à 4,3 %; toutefois cetteréduction est si faible qu’elle intéresse davantage les athlètes que lesgens ordinaires vaquant à leurs activités quotidiennes.
D’après des considérations théoriques et des études expérimen-tales sur l’animal, le monoxyde de carbone est susceptible d’exercerdes effets nocifs sur le système cardiovasculaire en fonction desconditions d’exposition. Toutefois, les résultats de ces travaux ne sontpas concluants, même s’il révèlent des troubles du rythme et de laconduction chez les animaux en bonne santé comme chez ceux quiprésentent des problèmes cardiaques. La concentration la plus faible àlaquelle ces troubles ont été observés varie selon les modalitésd’exposition et l’espèce étudiée. L’expérimentation animale indiqueégalement que l’inhalation de monoxyde de carbone peut accroître laconcentration d’hémoglobine et l’hématocrite, ce qui traduit probable-ment une compensation de la réduction du transport d’oxygèneprovoquée par ce gaz. A forte concentration de monoxyde de carbone,une augmentation excessive du taux d’hémoglobine et de l’hématocritepeut imposer au coeur une charge supplémentaire et gêner l’apport desang aux tissus.
Un certain nombre de données contradictoires indiquent qu’uneexposition au monoxyde de carbone peut favoriser l’apparitiond’athérosclérose chez les animaux de laboratoire, mais la plupart desétudes ne mettent en évidence aucun effet mesurable. De même, seulesquelques études évoquent la possibilité d’une modification dumétabolisme des lipides susceptible d’accélérer l’athérosclérose. Ceteffet doit être subtil, à tout le moins. Enfin, le monoxyde de carboneagit probablement sur les plaquettes, mais davantage en en inhibantl’agrégation qu’en la favorisant. D’une façon générale, il n’existe guèrede données indiquant qu’il puisse se produire dans la population deseffets athérogènes consécutifs à une exposition au monoxyde decarbone aux concentrations couramment rencontrées dans l’airambiant.
6.2 Effets pulmonaires aigus
Il n’est guère probable que le monoxyde de carbone exerce deseffets directs sur le tissu pulmonaire sauf en cas d’exposition à desconcentrations extrêmement élevées entraînant une intoxication.
Résumé et Conclusions
423
L’étude des effets du monoxyde de carbone sur la fonction pulmonairehumaine se heurte à un certain nombre de difficultés, à savoir l’absenced’informations suffisantes sur l’exposition, le petit nombre de sujetsétudiés et la durée limitée de l’exposition. Une expositionprofessionnelle ou accidentelle à des produits de combustion ou depyrolyse, notamment à l’intérieur d’un local, peut conduire à une chutebrutale de la capacité fonctionnelle pulmonaire si le taux decarboxyhémoglobine est élevé. Toutefois, il est difficile de distinguerles effets potentiels du monoxyde de carbone de ceux qui peuvent êtredus à des irritants des voies respiratoires présents dans la fumée et lesgaz d’échappement. Les études communautaires sur les effets dumonoxyde de carbone présent dans l’air ambiant n’ont pas permis demettre en évidence de relation significative entre ce gaz et certainssymptômes ou maladies affectant la fonction pulmonaire.
6.3 Effets sur le système vasculaire cérébral et le comportement
Il n’existe pas de données fiables qui mettent en évidence unealtération des fonctions neurocomportementales chez des jeunesadultes en bonne santé, à des taux de carboxyhémoglobine inférieursà 5 %. Les résultats des études effectuées en présence de taux égaux ousupérieurs à 5 % sont ambigus. Une grande partie des rechercheseffectuées sur des sujets dont le taux sanguin de carboxyhémoglobineétait de 5 %, n’ont révélé aucun effet, même en considérant desproblèmes comportementaux analogues à ceux qui avaient été mis enévidence dans les études portant sur des taux plus élevés decarboxyhémoglobine. Toutefois, il est possible que les chercheurs quin’avaient pu mettre en évidence d’altérations neurocomportementalesà des taux de carboxyhémoglobine égaux ou supérieurs à 5 %, aientutilisé des tests dont la sensibilité était insuffisante pour permettre dedéceler les effets subtils du monoxyde de carbone. On peut donc dire,en se fondant sur les données expérimentales, qu’un taux decarboxyhémoglobine supérieur ou égal à 5 % est susceptible d’altérerles fonctions neurocomportementales. Cependant, on me peut affirmerqu’un taux inférieur à 5 % serait sans effet. Il est vrai, toutefois, quel’on n’a étudié que de jeunes adultes en bonne santé en les soumettantà des tests de sensibilité démontrable et dans des conditions où le tauxde carboxyhémoglobine était supérieur ou égal à 5 %. Le problème desgroupes de population exposés à un risque particulier d’effetsneurocomportementaux par suite d’une exposition au monoxyde decarbone reste donc entier.
EHC 213: Carbon Monoxide
424
A noter tout spécialement le cas des personnes qui prennent desmédicaments ayant un effet dépresseur primaire ou secondaire et quirisquerait de potentialiser l’altération des fonctions neurocomporte-mentales due à une exposition au monoxyde de carbone. Les autresgroupes de population qui peuvent courir un risque accru d’altérationneurocomportementale sont les personnes âgées et les malades, maisce risque n’a pas été évalué.
Dans les conditions normales, le cerveau est capable d’accroîtreson irrigation ou de capter davantage d’oxygène pour compenser unehypoxie oxycarbonée. La réaction globale du système vasculairecérébral est analogue chez le foetus, le nouveau-né et l’animal adulte.Toutefois, il semble que plusieurs mécanismes concourent à augmenterle débit sanguin et il est possible qu’interviennent certains facteursneurologiques et métaboliques, ainsi que la courbe de dissociation del’oxyhémoglobine, le taux d’oxygène tissulaire et même un effethistotoxique du monoxyde de carbone. La question se pose de savoirsi ces mécanismes compensatoires vont continuer à fonctionner dansdiverses situations où l’intégrité du système vasculaire cérébral estcompromise (par ex. en cas d’accident vasculaire cérébral, de lésionintracrânienne, d’athérosclérose, d’hypertension etc.). La probabilitéde lésions ou d’affections de ce genre augmente en tout cas avec l’âge.Il se peut aussi que la sensibilité à la carboxyhémoglobine et lesmécanismes compensatoires varient selon les individus.
Ce sont les comportements exigeant une attention ou un effortsoutenus qui sont les plus sensibles à une perturbation par lacarboxyhémoglobine.Il existe un ensemble d’études sur des sujetshumains qui ont été consacrées à la coordination oeil-main (suivicompensatoire), au repérage d’événements rares (vigilance) et à laréalisation de tâches en continu ; ce sont ces études qui rendent comptedes effets de la carboxyhémoglobine aux taux n’excédant pas 5 % dela manière la plus cohérente et la plus justifiable. Il est vrai cependantque ces effets du monoxyde de carbone sous faible concentration sontvraiment minimes et quelque peu discutables. Il n’empêche qu’undéfaut de coordination et de vigilance pendant l’accomplissement encontinu de tâches difficiles, comme lorsqu’on travaille sur desmachines ou que l’on conduit des véhicules de transport public,pourrait avoir de sérieuses conséquences.
Résumé et Conclusions
425
6.4 Effets nocifs sur le développement
Des études sur plusieurs espèces d’animaux de laboratoire tendentfortement à montrer que l’exposition de femelles gravides à dumonoxyde de carbone à la concentration de 170-230 mg/m3 (150-200 ppm), ce qui donne lieu à un taux de carboxyhémoglobine de 15-25 %, entraîne une diminution du poids de naissance, une cardio-mégalie, un retard sur le plan comportemental et l’abolition desfonctions cognitives. Des travaux isolés donnent à penser que certainsde ces effets pourraient se manifester à des concentrations ne dépassantpas 69-74 mg/m3 (60-65 ppm; taux de carboxyhémoglobineapproximativement égal à 6-11 %) maintenues pendant toute la duréede la gestation. On peut s’inquiéter du fait que des études aient mis enévidence une relation entre l’exposition humaine à du monoxyde decarbone provenant de sources environnementales ou de la fumée decigarettes et le faible poids de naissance de certains nouveau-nés etcela, du fait de la possibilité de troubles du développement ; il faut diretoutefois que nombre de ces travaux ne prennent pas en compte toutesles sources de monoxyde de carbone. Les données selon lesquelles ilexisterait un lien entre l’exposition au monoxyde de carbone présentdans l’environnement et la mort subite du nouveau-né ne sont pasconvaincantes.
6.5 Autres effets généraux
Les études effectuées sur des animaux de laboratoire incitent àpenser que la métabolisation enzymatique de composés xénobiotiquespourrait être affectée par une exposition au monoxyde de carbone. Laplupart des auteurs de ces études ont toutefois conclu qu’à de faiblestaux de carboxyhémoglobine (inférieurs ou égaux à 15 %) les effetsétaient attribuables en totalité à l’hypoxie tissulaire due à l’accroisse-ment du taux de carboxyhémoglobine, car ils n’étaient pas plusmarqués que ceux qui résultent d’une hypoxie proprement dite.Lorsque l’exposition est plus intense, c’est-à-dire pour un taux decarboxyhémoglobine compris entre 15 et 20 %, le monoxyde decarbone peut inhiber directement l’activité des oxydases à fonctionmixte. L’altération du métabolisme des composés xénobiotiquesconstatée dans les cas d’exposition au monoxyde de carbone pourraitavoir des conséquences importantes pour les sujets qui suivent untraitement médicamenteux.
EHC 213: Carbon Monoxide
426
L’inhalation de monoxyde de carbone sous forte concentration,conduisant à l’apparition dans le sang d’un taux de carboxy-hémoglobine supérieur à 10-15 %, produit un certain nombre d’autreseffets généraux chez l’animal de laboratoire, ainsi que chez les sujetshumains souffrant d’une intoxication oxycarbonée aiguë. Les tissus quisont le siège d’un intense métabolisme de l’oxygène, comme ceux ducoeur, du cerveau, du foie, du rein et des muscles pourraient êtreparticulièrement sensibles à l’intoxication oxycarbonée. On ne connaîtpas très bien les effets de fortes concentrations de monoxyde decarbone sur les autres tissus, aussi sont-ils plus incertains. Il est renducompte, dans la littérature, d’effets sur le foie, le rein, les os etl’immunocompétence du poumon et de la rate. On s’accordegénéralement à penser que les lésions tissulaires graves qui seproduisent lors d’une intoxication oxycarbonée aiguë ont une ouplusieurs des causes suivantes : 1) ischémie résultant de la formationde carboxyhémoglobine, 2) inhibition de la libération d’oxygène parl’oxyhémoglobine, 3) inhibition de la fonction du cytochrome cellulaire(par ex. des cytochrome-oxydases) et 4) acidose métabolique.
On possède quelques éléments de preuve relativement ténus d’uneffet éventuel du monoxyde de carbone sur l’activité fibrinolytique etencore, uniquement en cas d’exposition à de fortes concentrations. Demême, certaines données incitent à penser que des effets périnatals sontégalement possibles (par ex. réduction du poids de naissance,ralentissement du développement postnatal, mort subite du nouveau-né) en cas d’exposition au monoxyde de carbone, mais on manqued’éléments d’appréciation pour pouvoir confirmer qualitativementl’existence d’une telle corrélation chez l’Homme ou établir une relationdose-effet appropriée.
6.6 Adaptation
Les seules preuves que l’on possède de la compensation à courtou à long terme d’un taux élevé de carboxyhémoglobine, ou d’uneadaptation à cet état de choses, sont des preuves indirectes. Lesdonnées obtenues sur des animaux de laboratoire indiquent qu’unaccroissement du taux de carboxyhémoglobine produit des réactionsphysiologiques qui tendent à contrebalancer les autres effets nocifs del’exposition au monoxyde de carbone. Ces réactions sont les suivantes :1) augmentation du débit sanguin au niveau des coronaires, 2)augmentation du débit sanguin cérébral, 3) augmentation du taux
Résumé et Conclusions
427
d’hémoglobine par activation de l’hématopoïèse et 4) augmentation dela consommation d’oxygène par les muscles.
S’agissant du débit sanguin et de la consommation d’oxygène, lesréactions compensatoires à court terme peuvent n’être que partielles oumême totalement absentes chez certains sujets. par exemple, on sait,d’après les études sur les animaux de laboratoire, que le débit sanguinau niveau des coronaires s’accroît à mesure qu’augmente le taux decarboxyhémoglobine et les études cliniques sur des sujets humainsmontrent que chez un patient souffrant de cardiopathie ischémique, uneréaction se produit aux taux les plus faibles (6 % ou moins). On peuten déduire que chez certains cardiaques, les mécanismes decompensation à court terme ne jouent plus pleinement leur rôle.
Il apparaît, à la lumière des études neurocomportementales, quel’effet du monoxyde de carbone ne se produit pas systématiquementchez tous les sujets, ni même au cours d’une même étude et on n’a pasmis en évidence de relation dose-effet, c’est-à-dire une intensificationavec l’augmentation du taux de carboxyhémoglobine. On peut conclurede ces données que des mécanismes de compensation tels quel’augmentation du débit sanguin, pourraient ne se déclencher qu’àpartir d’un certain seuil ou comporter une sorte d’hystérésis. Faute depreuve physiologique directe chez l’animal, ou de préférence, chezl’Homme, cette notion reste ne peut que rester à l’état d’hypothèse.
Le mécanisme d’adaptation à long terme, à supposer qu’on puissele mettre en évidence chez l’Homme, consisterait semble-t-il en en uneaugmentation du taux d’hémoglobine consécutive à une activation del’hématopoïèse. Cette modification de la production d’hémoglobine aété observée à plusieurs reprises chez les animaux de laboratoire, maisaucun travail récent n’indique ou ne suggère qu’il en résulte ourésulterait un avantage adaptatif quelconque. De plus, même sil’accroissement du taux d’hémoglobine signe un mécanisme adaptatif,on ne l’a pas mis en évidence pour de faibles taux de carboxy-hémoglobine.
EHC 213: Carbon Monoxide
428
7. Exposition au monoxyde de carbone associée àl’altitude, à la prise de médicaments ou de diversessubstances chimiques ou encore à une exposition àd’autres polluants atmosphériques ou facteursenvironnementaux
7.1 Effets d’une altitude élevée
Il existe de nombreuses études dans lesquelles sont comparés leseffets de l’inhalation de monoxyde de carbone et ceux que produit lefait de se trouver à une altitude élevée, mais relativement peus’intéressent aux effets combinés de ce gaz et de l’altitude. Un certainnombre de données incitent à penser que les deux types d’hypoxieseraient, pour le moins, additifs. Toutefois ces données ont étéobtenues dans des conditions où la concentration de monoxyde decarbone était trop élevée pour pouvoir être prise en considération d’unpoint de vue réglementaire.
S’agissant des effets à long terme du monoxyde de carbone inhaléà haute altitude, les études sont encore moins nombreuses. Les étudesdisponibles indiquent qu’il ne se produit pas grand chose au dessous de110 mg/m3 (100 ppm) et pour des altitudes inférieures à 4570 m. Il estcependant possible que le foetus soit particulièrement sensible auxeffets du monoxyde de carbone en altitude; c’est particulièrement vrailorsque la mère est fumeuse et expose l’enfant qu’elle porte à de fortesconcentrations de CO.
7.2 Interaction entre le monoxyde de carbone et les substances oumédicaments divers
On ne possède guère d’informations directes sur unepotentialisation éventuelle de la toxicité du CO en cas de prise demédicaments ou de toxicomanie ; certaines données montrent toutefoisque ce peut être un sujet de préoccupation. On possède certains indicesd’une action pouvant aller dans le même sens ou en sens inverse ;autrement dit que la toxicité du monoxyde du carbone peut êtrepotentialisée par la prise de certains produits ou que les effets, toxiquesou autres, d’un produit peuvent être atténués par une exposition au CO.Presque toutes les données publiées sur cette question concernent laconsommation d’alcool.
Résumé et Conclusions
429
La consommation et l’abus de substances psychoactives etd’alcool sont un aspect universel de la vie sociale. En raison de l’effetdu monoxyde de carbone sur les fonctions cérébrales, on peuts’attendre à ce qu’il y ait des interactions entre ce gaz et les substancespsychoactives. Malheureusement, peu de travaux de recherchesystématiques ont été consacrés à cette question. En outre, parmi lesquelques travaux effectués, seule une faible proportion se base sur unemodélisation des effets probables de ces associations de substances.Dans ces conditions, il est bien souvent impossible de déterminer si leseffets combinés de la prise de diverses substances et d’une expositionau CO sont additifs ou non. Il importe de se rendre compte quel’additivité des effets de plusieurs substances peut avoir de l’impor-tance sur le plan clinique, même si le sujet n’a pas conscience de cegenre de risque. Les principales données relatives à des interactionspotentiellement importantes avec le monoxyde de carbone proviennentd’études pratiquées sur l’Homme et l’animal, en présence d’uneimbibition alcoolique, études qui montrent que les effets sont au moinsadditifs. Comme les cas d’exposition au CO en présence d’uneimbibition alcoolique sont probablement fréquents, ces résultatsprennent un relief accru.
7.3 Exposition combinée au monoxyde de carbone et à d’autrespolluants atmosphériques et facteurs environnementaux
Une grande partie des données relatives aux effets combinés dumonoxyde de carbone et d’autres polluants présents dans l’air ambiantprovient de l’expérimentation animale. Seules quelques études ontporté sur des sujets humains. Les premiers travaux sur des sujetshumains en bonne santé, qui concernaient des polluants atmosphériquescourants comme le monoxyde de carbone, le dioxyde d’azote, l’ozoneou le nitrate de peroxyacétyle, n’ont pas mis en évidence d’interactionsentre ces composés en cas d’exposition combinée. Lors d’études enlaboratoire, aucune interaction n’a été observée après exposition à dumonoxyde de carbone et à des polluants atmosphériques courantscomme le dioxyde d’azote et le dioxyde de soufre. Cependant, on atout de même constaté un effet additif après exposition combinée à defortes concentrations de monoxyde de carbone et à du dioxyde d’azote,un effet synergistique étant observé après exposition combinée aumonoxyde de carbone et à l’ozone.
EHC 213: Carbon Monoxide
430
Des interactions toxicologiques entre des produits de combustion,principalement du monoxyde et du dioxyde de carbone ainsi que ducyanure d’hydrogène, présents à des concentrations caractéristiques decelles qui sont produites par des incendies en plein air ou dans un local,ont provoqué des effets synergistiques après exposition au monoxydeet au dioxyde de carbone, et des effets additifs en présence de cyanured’hydrogène. On a également observé des effets additifs lorsque dumonoxyde de carbone, du cyanure d’hydrogène et de l’oxygène à faibleconcentration étaient simultanément présents ; l’adjonction de dioxydede carbone à cette association a produit un effet synergistique.
Enfin, d’autres études incitent à penser que certains facteursenvironnementaux comme un stress thermique ou le bruit peuvent jouerun rôle important dans les effets toxiques lorsqu’ils s’ajoutent à uneexposition à du monoxyde de carbone. Parmi les effets qui ont été ainsidécrits, celui qui pourrait être le plus important dans les cas courantsd’exposition humaine consiste dans une diminution des performancesphysique lorsqu’un stress thermique s’ajoute à une exposition aumonoxyde de carbone à la concentration de 57 mg/m3 (50 ppm).
7.4 Fumée de tabac
Tout en étant une source de monoxyde de carbone pour lesfumeurs et les non fumeurs, la fumée de tabac contient égalementdiverses substances chimiques avec lesquelles ce gaz pourrait interagir.Les données dont on disposent incitent fortement à penser qu’uneexposition momentanée ou chronique au CO contenu dans la fumée detabac est de nature à affecter le système cardiopulmonaire, mais il estvrai que les interactions potentielles entre le monoxyde de carbone etd’autres composés présents dans la fumée sont autant de facteurs deconfusion. En outre, on ne peut affirmer que les effets d’uneaugmentation du taux de carboxyhémoglobine par suite d’uneexposition au CO présent dans l’environnement s’ajoutent à ceux d’uneélévation chronique de ce taux, car il peut se produire une certaineadaptation physiologique.
Résumé et Conclusions
431
8. Sous-groupes de population courant un risqued’exposition au monoxyde de carbone
La plupart des données dont on dispose au sujet des effetstoxiques du monoxyde de carbone portent sur deux groupes depopulation bien définis : les adultes jeunes en bonne santé et lesmalades souffrant d’une cardiopathie coronarienne. D’après les effetsqui ont été observés, les malades présentant une ischémie d’effortreproductible sont le groupe de population pour lequel on a le mieuxétabli qu’ils couraient un risque accru de ressentir des effets inquiétants(réduction de la durée de l’exercice physique par suite del’exacerbation des symptômes cardiovasculaires) en cas d’expositionà des concentration de CO correspondant aux valeurs ambiantes ouquasi-ambiantes et produisant des taux minimaux de carboxy-hémoglobine de l’ordre de 3 %. Il existe un autre groupe - plus restreintet constitué de sujets en bonne santé - qui est également réceptif auxeffets du CO sous la forme d’une diminution de la durée de l’exercicephysique, mais cet effet ne s’observe que pendant un exercice physiquede courte durée dans des condition d’effort maximal. Cette réductionde l’aptitude à soutenir un effort prolongé pour des personnes en bonnesanté devrait donc concerner davantage les athlètes engagés dans descompétitions que des gens ordinaires vaquant à leurs occupationsquotidiennes.
On peut toutefois supposer, en se basant sur les résultatscliniques, des considérations théoriques et les données fournies parl’expérimentation animale, que d’autres segments de la populationpourraient courir un risque en cas d’exposition au monoxyde decarbone. On peut les regrouper par sexe, par âge (par ex. foetus,nourrissons, personnes âgées), par types génétiques (par ex. porteursd’hémoglobine anormale), par maladies préexistantes - connues ou non- qui réduisent l’apport d’oxygène aux organes vitaux, ou encore partype de médicaments consommés, de toxicomanie ou en fonction de laqualité de l’environnement (par ex. présence d’autres polluantsatmosphériques ou vie à haute altitude). Malheureusement, pour laplupart d’entre eux, on ne possède guère de données expérimentalesqui permettraient de définir les risques encourus en cas d’exposition àdes concentrations de monoxyde de carbone correspondant aux valeursambiantes ou quasi-ambiantes.
EHC 213: Carbon Monoxide
432
9. Intoxication oxycarbonée
La majeure partie de ce document porte sur les effets que desconcentrations relativement faibles de monoxyde de carbone peuventproduire chez des sujets humains à des taux de carboxyhémoglobineégaux ou sensiblement égaux aux valeurs les plus faibles qui soientdécelables par les techniques biomédicales actuelles. Pourtant, leseffets toxiques de ce polluant vont d’anomalies cardiovasculaires ouneurocomportementales subtiles pour de faibles concentrations dansl’air ambiant, à la perte de conscience et à la mort en cas d’expositioninstantanée à une forte concentration de monoxyde de carbone. Dansce dernier cas, la morbidité et la mortalité résultantes peuventconstituer un problème de santé publique non négligeable.
Le monoxyde de carbone est responsable d’une forte proportiondes intoxications accidentelles et parfois mortelles qui surviennentchaque année dans le monde. Il peut exister, à l’intérieur de locauxcomme en plein air, des conditions qui font qu’une petite fraction dela population se trouve exposée à des concentrations dangereuses de cegaz. A l’extérieur, c’est aux carrefours où la circulation est intense, àproximité des tuyaux d’échappement des moteurs à combustion interneou de certaines sources industrielles ou encore dans des parkings et destunnels mal ventilés que la concentration de monoxyde de carbone estla plus élevée. A l’intérieur, les valeurs les plus fortes s’observent dansles habitations dont les poêles ou autres appareils à combustionfonctionnent mal ou ont une évacuation insuffisante ou dont le systèmed’aération comporte des refoulements.
Les symptômes d’une intoxication oxycarbonée aiguë ne sont pasen très bonne corrélation avec le taux de carboxyhémoglobine mesuréà l’arrivée à l’hôpital. Un taux de carboxyhémoglobine inférieur à10 % est généralement asymptomatique. Lorsque la saturation encarboxyhémoglobine atteint une valeur de 10 à 30 %, les symptômesde l’intoxication oxycarbonée peuvent apparaître; ils consistent encéphalées, faiblesse, nausées, confusion, désorientation et troublesvisuels. Dans les cas d’exposition chronique aboutissant à des taux decarboxyhémoglobine compris entre 30 et 50 %, on constate lessymptômes suivants : dyspnée d’effort, accroissement de la fréquencerespiratoire et cardiaque et syncope. Lorsque le taux decarboxyhémoglobine dépasse 50 %, il peut y avoir coma, convulsionset finalement arrêt cardiaque et respiratoire.
Résumé et Conclusions
433
L’intoxication oxycarbonée s’accompagne fréquemment decomplications (mort immédiate, atteinte du myocarde, hypotension,arythmie, oedème pulmonaire). L’effet le plus insidieux est peut-êtrel’apparition tardive (dans les 1 à 3 semaines) de séquelles neuro-psychiatriques, avec leurs conséquences sur le plan neurocomporte-mental, notamment chez les enfants. Une intoxication oxycarbonéependant la grossesse comporte un risque élevé pour la mère, par le faitqu’elle accroît le risque de complications à court terme, de même quepour le foetus par suite du risque de mort foetale, de troubles dudéveloppement et de lésions dues à l’anoxie cérébrale. Par ailleurs, cen’est pas la gravité des troubles présentés par la mère qui permet dejuger de celle de l’intoxication foetale.
Les intoxications oxycarbonées sont fréquentes, leurs consé-quences sont graves et elles peuvent notamment entraîner une mortimmédiate, mais aussi des complications et des séquelles souventnégligées. Il convient donc d’encourager les efforts en vue de leséviter, notamment par l’éducation du public et du corps médical.
10. Valeurs-guides recommandées par l’OMS
Les valeurs-guides suivantes (les chiffres en ppm sont arrondis)et durées d’exposition en moyenne pondérée par rapport au temps ontété établies de manière à ce que le taux de 2,5 % de carboxy-hémoglobine ne soit pas dépassé, même si le sujet se livre à uneactivité physique légère ou modérée.
100 mg/m3 (87 ppm) pendant 15 min60 mg/m3 (52 ppm) pendant 30 min30 mg/m3 (26 ppm) pendant 1h10 mg/m3 (9 ppm) pendant 8 h
434
RESUMEN Y CONCLUSIONES
El monóxido de carbono (CO) es un gas incoloro e inodoro quepuede ser tóxico para el ser humano. Se produce cuando se quemancombustibles con carbono de forma incompleta y también medianteprocesos naturales o por la biotransformación de halometanos en elorganismo humano. Con la exposición externa a monóxido de carbonoadicional pueden comenzar a aparecer efectos ligeros y lasconcentraciones más elevadas pueden provocar la muerte. Los efectosdel monóxido de carbono para la salud se deben fundamentalmente ala formación de carboxihemoglobina (COHb), que reduce la capacidadde transporte de oxígeno de la sangre.
1. Química y métodos analíticos
Los métodos disponibles para la medición del monóxido decarbono en el aire ambiente van desde los sistemas totalmenteautomatizados, con la técnica de infrarrojos no dispersiva y lacromatografía de gases, hasta los manuales sencillos de tiposemicuantitativo con tubos detectores. Debido a que la formación decarboxihemoglobina en el ser humano depende de numerosos factores,entre ellos la variabilidad de las concentraciones de monóxido decarbono en el aire ambiente, la concentración de carboxihemoglobinase debería medir en lugar de calcularla. Existen varios métodosrelativamente sencillos para determinar el monóxido de carbonomediante análisis de la sangre o del aire alveolar, que está en equilibriocon la sangre. Algunos de estos métodos se han validado mediantecuidadosos estudios comparativos.
2. Fuentes y niveles de monóxido de carbono en elmedio ambiente
El monóxido de carbono es un constituyente traza de la troposferaque se forma en procesos naturales y en actividades humanas.Teniendo en cuenta que las plantas pueden metabolizar y producirmonóxido de carbono, los niveles traza se consideran un constituyentenormal del medio ambiente natural. Si bien las concentraciones demonóxido de carbono en el ambiente en las cercanías de las zonasurbanas e industriales puede superar con creces los niveles básicosmundiales, no hay informes de efectos adversos en las plantas o losmicroorganismos producidos por estos niveles de monóxido decarbono medidos actualmente. Sin embargo, las concentraciones demonóxido de carbono en el medio ambiente pueden ser perjudicialespara la salud y el bienestar humanos, en función de los niveles que
Résumé et Conclusions
435
alcancen en las zonas de trabajo y de residencia y de la susceptibilidadde las personas expuestas a los efectos potencialmente adversos.
Las tendencias en los datos sobre la calidad del aire obtenidos enestaciones de vigilancia en lugares fijos ponen de manifiesto unadisminución general de las concentraciones de monóxido de carbono,gracias a los eficaces sistemas de control de las emisiones de losvehículos más modernos. En los Estados Unidos, las emisiones de losvehículos en las autopistas representan alrededor del 50% del total; lasfuentes del transporte fuera de las autopistas contribuyen con un 13%.Los demás tipos de emisiones de monóxido de carbono son otrasfuentes de combustión, como las calderas de vapor (12%); los procesosindustriales (8%); la eliminación de residuos sólidos (3%); y otrasfuentes diversas (14%).
La concentración de monóxido de carbono en los espacioscerrados depende de la presente en el exterior, las fuentes interiores, lainfiltración, la ventilación y la mezcla de aire entre las habitaciones ydentro de ellas. En residencias que carecen de fuentes, el promedio dela concentración de monóxido de carbono es prácticamente igual al delexterior. Las concentraciones más altas de monóxido de carbono en losespacios cerrados están relacionadas con fuentes de combustión y seencuentran, por ejemplo, en aparcamientos cerrados, estaciones deservicio y restaurantes. Las concentraciones más bajas de monóxido decarbono en espacios cerrados corresponden a viviendas, iglesias einstalaciones de atención sanitaria. En estudios de exposición se hapuesto de manifiesto que el tabaquismo pasivo está asociado con unaumento de la exposición de los no fumadores de 1,7 mg/m3 (1,5 ppm)como promedio y el uso de una cocina de gas en el hogar con unaumento de alrededor de 2,9 mg/m3 (2,5 ppm). Otras fuentes quepueden contribuir al monóxido de carbono en el hogar son el espaciode combustión y los calentadores de agua, así como las cocinas decarbón o de leña.
EHC 213: Carbon Monoxide
436
3. Distribución y transformación en el medio ambiente
Hay datos recientes sobre las tendencias mundiales de laconcentración de monóxido de carbono en la troposfera que indicanuna disminución a lo largo del último decenio. Las concentracionesbásicas mundiales son del orden de 60-140 :g/m3 (50-120 ppmm). Losniveles son más altos en el hemisferio norte que en el hemisferio sur.Las concentraciones básicas medias también tienen una fluctuaciónestacional. Los niveles son más altos en los meses de invierno y másbajos en los de verano. Alrededor del 60% del monóxido de carbonoque se encuentra en la troposfera de las zonas no urbanas es atribuiblea actividades humanas, ya sea de forma directa a partir de procesos decombustión como indirecta a través de la oxidación de hidrocarburosy de metano que, a su vez, proceden de las actividades agrícolas, losvertederos y otras fuentes semejantes. Las reacciones atmosféricas enlas que interviene el monóxido de carbono pueden producir ozono enla troposfera. En otras reacciones se puede reducir la concentración deradicales hidroxilo, factor fundamental en los ciclos de eliminaciónmundial de otros muchos gases traza naturales y antropogénicos,contribuyendo posiblemente de esta manera a modificar la químicaatmosférica y, en último término, al cambio del clima mundial.
4. Exposición de la población al monóxido de carbono
Durante las actividades cotidianas normales, la población entra encontacto con el monóxido de carbono en diversos microambientes - alviajar en vehículos de motor, en el lugar de trabajo, al visitar zonasurbanas asociadas con fuentes de combustión o al cocinar y calentarsecon fuego de gas, carbón o leña- así como con el humo del tabaco. Engeneral, las exposiciones más importantes al monóxido de carbonopara la mayoría de las personas se producen en el vehículo y enmicroambientes internos.
El perfeccionamiento de pequeños sensores electroquímicosportátiles de control de la exposición personal ha permitido medir lasconcentraciones de monóxido de carbono que encuentran las personascuando se desplazan a través de numerosos microambientes internos yexternos diversos que no se pueden vigilar con estaciones situadas enun lugar fijo. Los resultados tanto de la vigilancia de la exposiciónsobre el terreno como de los estudios de creación de modelos ponen demanifiesto que no hay una correlación directa entre la exposición
Résumé et Conclusions
437
personal individual medida con los sensores de control y lasconcentraciones de monóxido de carbono determinadas solamente porlas estaciones fijas. Esta observación se debe a la movilidad de laspersonas y a la variabilidad espacial y temporal de las concentracionesde monóxido de carbono. Aunque no permiten establecer unacorrelación entre la exposición obtenida con los sensores de controlpersonales individuales y la concentración simultánea marcada por laestación fija más cercana, los estudios sobre el terreno en gran escalade la exposición humana al monóxido de carbono indican que laexposición total de las personas es más baja en los días en que lasestaciones fijas miden concentraciones más bajas de monóxido decarbono en el ambiente y más altas los días en que la concentración enel ambiente es más alta. Estos estudios señalan que cuando se ha deevaluar la exposición humana total es necesario realizar medicionespersonales del monóxido de carbono, a fin de acumular datos de lavigilancia del medio ambiente en lugares fijos. Los datos obtenidos enestos estudios sobre el terreno se pueden utilizar para crear y probarmodelos de exposición humana que representen pautas de tiempo y deactividad que se sepa que influyen en la exposición al monóxido decarbono.
La evaluación de las situaciones de exposición humana almonóxido de carbono indica que la exposición ocupacional en algunospuestos de trabajo o en el hogar con aparatos de combustióndefectuosos o poco ventilados puede ser superior a 110 mg demonóxido de carbono/m3 (100 ppm), produciendo con frecuencia, si laexposición es continuada, concentraciones de carboxihemoglobina del10% o más. En cambio, es mucho menos frecuente que el públicogeneral expuesto a los niveles del medio ambiente se encuentre conniveles de exposición tan altos. En la población general es másfrecuente la exposición a menos de 29-57 mg de monóxido decarbono/m3 (25-50 ppm) durante períodos prolongados; en los nivelesde ejercicio bajos que son normales en tales circunstancias, laconcentración de carboxihemoglobina resultante entre los nofumadores suele ser del 1%-2%. Estos niveles se pueden comparar conlos fisiológicos normales de los no fumadores, estimados en el 0,3%-0,7% de carboxihemoglobina. Sin embargo, el promedio de lasconcentraciones básicas de carboxihemoglobina en los fumadores esdel 4%, con una gama normal del 3%-8%, que pone de manifiesto laabsorción de monóxido de carbono del humo inhalado.
EHC 213: Carbon Monoxide
438
En los estudios de exposición humana se ha comprobado que losgases de escape de los vehículos de motor son la fuente principal de laselevadas concentraciones de monóxido de carbono que se dannormalmente. Estos estudios indican que el interior de los vehículos demotor tiene como promedio la concentración de monóxido de carbonomás alta de todos los microambientes (un promedio de 10-29 mg/m3 [9-25 ppm]). Además, se ha puesto de manifiesto que la exposicióndurante el desplazamiento diario al trabajo es enormemente variable,respirando algunos viajeros concentraciones de monóxido de carbonosuperiores a 40 mg/m3 (35 ppm).
El puesto de trabajo es otro entorno importante de exposición almonóxido de carbono. En general, si se exceptúa la exposición duranteel viaje diario de ida y vuelta al trabajo, la exposición en el entornolaboral es superior a la de los períodos en que no se trabaja. Lasexposiciones ocupacional y no ocupacional pueden superponerse y darlugar a una concentración más alta de monóxido de carbono en lasangre. Un aspecto todavía más importante es que el carácter dedeterminadas ocupaciones lleva consigo un riesgo mayor de exposicióna concentraciones elevadas de monóxido de carbono (por ejemplo, lasocupaciones directamente relacionadas con la conducción, elmantenimiento o el aparcamiento de vehículos). Entre los gruposprofesionales expuestos al monóxido de carbono procedente de losgases de escape figuran los mecánicos de automóviles; los empleadosde aparcamientos y de gasolineras; los conductores de autobuses,camiones o taxis; los policías; y los trabajadores de almacenes.Determinados procesos industriales pueden provocar la exposición delos trabajadores al monóxido de carbono producido directamente ocomo subproducto; entre ellos cabe mencionar la producción de acero,los hornos de coque, la producción de negro de humo y el refinado delpetróleo. Los bomberos, los cocineros y los trabajadores de laconstrucción pueden verse también expuestos en el trabajo aconcentraciones altas de monóxido de carbono. La exposiciónocupacional en industrias o en lugares de producción de monóxido decarbono es de las exposiciones individuales más altas observadas en losestudios de vigilancia sobre el terreno.
Résumé et Conclusions
439
5. Toxicocinética y mecanismo de acción delmonóxido de carbono
El monóxido de carbono se absorbe a través de los pulmones y laconcentración de carboxihemoglobina en la sangre dependerá en todomomento de varios factores. Cuando exista un equilibrio con el aireambiente, el contenido de carboxihemoglobina de la sangre dependeráfundamentalmente de las concentraciones de monóxido de carbono yde oxígeno inspirados. Sin embargo, si no se ha alcanzado elequilibrio, la concentración de carboxihemoglobina dependerá tambiénde la duración de la exposición, de la ventilación pulmonar y de laconcentración de carboxihemoglobina originalmente presente antes dela inhalación del aire contaminado. Además de su reacción con lahemoglobina, el monóxido de carbono se combina con la mioglobina,los citocromos y las enzimas metálicas, como la citocromo c oxidasay el citocromo P-450. No se conoce completamente la influencia deestas reacciones en la salud, aunque probablemente sea menosimportante con los niveles de exposición del medio ambiente que laque tiene la reacción del gas con la hemoglobina.
El intercambio de monóxido de carbono entre el aire querespiramos y el organismo humano está controlado por procesos tantofísicos (por ejemplo, transporte y difusión masivos) como fisiológicos(por ejemplo, ventilación alveolar y rendimiento cardíaco). Elmonóxido de carbono pasa fácilmente de los pulmones a la corrientesanguínea. La fase final en este proceso consiste en la unióncompetitiva del monóxido de carbono y el oxígeno a la hemoglobinaen los glóbulos rojos, formando carboxihemoglobina y oxihemoglobina(O2Hb), respectivamente. La unión del monóxido de carbono a lahemoglobina, que produce carboxihemoglobina y reduce la capacidadde transporte de oxígeno de la sangre, parece ser el principalmecanismo de acción que desencadena la inducción de los efectostóxicos de la exposición a concentraciones bajas de monóxido decarbono. No se conocen totalmente los mecanismos precisos deinducción de los efectos tóxicos mediante la formación decarboxihemoglobina, pero probablemente se deban a la inducción deun estado hipóxico en muchos tejidos de distintos órganos. Se hanpropuesto como hipótesis mecanismos alternativos o secundarios detoxicidad inducida por el monóxido de carbono (además de lacarboxihemoglobina), pero no se ha demostrado en ninguno de ellos
EHC 213: Carbon Monoxide
440
que funcione con niveles de exposición al monóxido de carbonorelativamente bajos (casi ambientales). Así pues, actualmente se aceptaque la concentración de carboxihemoglobina en la sangre representa unmarcador fisiológico útil para estimar la carga interna de monóxido decarbono debida a la contribución combinada de: 1) el monóxido decarbono de origen endógeno y 2) el monóxido de carbono de origenexógeno procedente de la exposición a fuentes externas de monóxidode carbono. La concentración de carboxihemoglobina que probable-mente se derivará de modalidades concretas (concentraciones,duración, etc.) de exposición externa al monóxido de carbono se puedecalcular razonablemente bien utilizando la ecuación de Coburn-Foster-Kane (CFK).
Por consiguiente, una característica única de la exposición almonóxido de carbono es que el nivel de carboxihemoglobina en lasangre representa un marcador biológico útil de la dosis que harecibido la persona. La cantidad de carboxihemoglobina que se formadepende de la concentración y duración de la exposición al monóxidode carbono, del ejercicio (que aumenta la cantidad de aire inhalado porunidad de tiempo), de la temperatura ambiente, del estado de salud ydel metabolismo específico de la persona expuesta. La formación decarboxihemoglobina es un proceso reversible; sin embargo, debido ala fuerte unión del monóxido de carbono a la hemoglobina, el periodode semieliminación es bastante largo, oscilando entre 2 y 6,5 horas, enfunción de la concentración inicial de carboxihemoglobina y de la tasade ventilación de las personas. Esto podría llevar a la acumulación decarboxihemoglobina, y bastarían concentraciones relativamente bajasde monóxido de carbono para producir niveles considerables decarboxihemoglobina en la sangre.
La concentración de carboxihemoglobina en la sangre se puededeterminar de manera directa mediante el análisis de la sangre o demodo indirecto midiendo la concentración de monóxido de carbono enel aire expirado. La medición del aire expirado tiene las ventajas de lafacilidad, la rapidez, la precisión y una mayor aceptación que lamedición de la carboxihemoglobina en la sangre. Sin embargo, laprecisión del procedimiento de medición de la respiración y la validezde la relación de Haldane entre la respiración y la sangre siguen sinestar claras para la exposición a concentraciones bajas de monóxido decarbono en el medio ambiente.
Résumé et Conclusions
441
Teniendo en cuenta que no se puede disponer fácilmente demediciones de la carboxihemoglobina en la población expuesta, se hanelaborado modelos matemáticos para pronosticar las concentracionesde carboxihemoglobina a partir de exposiciones conocidas almonóxido de carbono en diversas circunstancias. El modelo mejorconocido para el pronóstico de la carboxihemoglobina sigue siendo laecuación de Coburn, Forster y Kane. La solución lineal es útil paraexaminar los datos de contaminación del aire que producen nivelesrelativamente bajos de carboxihemoglobina, mientras que la soluciónno lineal ofrece una buena capacidad de pronóstico incluso para laexposición a concentraciones elevadas de monóxido de carbono. Losmodelos de regresión podría ser útiles sólo cuando las condiciones deaplicación son muy próximas a las reinantes al calcular los parámetros.
Aunque se considera que la causa principal de la toxicidad delmonóxido de carbono a niveles de exposición bajos es la hipoxia de lostejidos debida a la unión del monóxido de carbono a la hemoglobina,ciertos aspectos fisiológicos de la exposición al monóxido de carbonono se pueden explicar bien por la disminución de la presión parcial deoxígeno intracelular a causa de la presencia de carboxihemoglobina.Por consiguiente, numerosas investigaciones se han concentrado en losmecanismos secundarios de la toxicidad del monóxido de carbonorelacionada con su absorción intracelular. La unión del monóxido decarbono a muchos compuestos intracelulares está bien documentadatanto in vitro como in vivo;; sin embargo, no se sabe todavía si laabsorción intracelular de monóxido de carbono en presencia dehemoglobina es suficiente o no para provocar una disfunción aguda delórgano o efectos en la salud a largo plazo. La práctica inexistencia detécnicas sensibles capaces de evaluar la fijación del monóxido decarbono intracelular en condiciones fisiológicas ha dado lugar a unaserie de enfoques indirectos del problema, así como a numerososestudios negativos.
Los conocimientos actuales relativos a la fijación del monóxidode carbono intracelular apuntan a que con toda probabilidad son lamioglobina, que se encuentra fundamentalmente en el corazón y en elmúsculo esquelético, y la citocromo oxidasa las proteínas cuya funciónqueda inhibida por la presencia de concentraciones elevadas decarboxihemoglobina. No se conoce en este momento la importanciafisiológica de la absorción de monóxido de carbono por la mioglobina,
EHC 213: Carbon Monoxide
442
pero una concentración suficiente de carboximioglobina podría limitarpotencialmente la absorción máxima de oxígeno por el músculo enejercicio. Aunque hay pruebas que parecen indicar la existencia de unaunión considerable de monóxido de carbono a la citocromo oxidada enlos tejidos del corazón y del cerebro, no es probable que se produzcala unión de una cantidad significativa de monóxido de carbono enpresencia de concentraciones bajas de carboxihemoglobina.
6. Efectos en la salud de la exposición al monóxido decarbono
La importancia para la salud del monóxido de carbono presenteen el aire ambiente se debe fundamentalmente al hecho de que se unemediante un enlace fuerte a la molécula de la hemoglobina para formarcarboxihemoglobina, que limita la capacidad de transporte de oxígenode la sangre. La presencia de la carboxihemoglobina altera también ladisociación de la oxihemoglobina, de manera que la distribución deloxígeno a los tejidos se reduce ulteriormente. La afinidad de lahemoglobina humana por el monóxido de carbono es alrededor de 240veces superior a la del oxígeno, y las proporciones decarboxihemoglobina y oxihemoglobina que se forman en la sangredependen en gran medida de la presión parcial del monóxido decarbono y del oxígeno.
La preocupación acerca de los posibles efectos de la exposiciónal monóxido de carbono para la salud se han expuesto en ampliosestudios tanto con seres humanos como con diversas especies deanimales. Mediante una serie de protocolos experimentales se haobtenido abundante información sobre la toxicidad del monóxido decarbono, sus efectos directos en la sangre y en otros tejidos y lasmanifestaciones de estos efectos en forma de cambios en elfuncionamiento de los órganos. Sin embargo, muchos de los estudioscon animales se han realizado con concentraciones de monóxido decarbono extremadamente altas (es decir, niveles que no se encuentranen el aire ambiente). Aunque los efectos graves de la exposición a estasconcentraciones elevadas de monóxido de carbono no estándirectamente relacionados con los problemas que se derivan de laexposición a los niveles normales de monóxido de carbono en el medioambiente, han proporcionado una información valiosa acerca de los
Résumé et Conclusions
443
posibles efectos de la exposición accidental al monóxido de carbono,en particular de las exposiciones que se producen en espacios cerrados.
6.1 Efectos cardiovasculares
En adultos jóvenes sanos se ha observado claramente una menorabsorción de oxígeno y la consiguiente disminución de la capacidad detrabajo en condiciones de ejercicio máximo a partir de unaconcentración de carboxihemoglobina del 5,0%, y en varios estudiosse ha detectado una pequeña disminución en la capacidad de trabajocon concentraciones de carboxihemoglobina de sólo 2,3%-4,3%. Estosefectos pueden tener repercusiones en la salud de la población general,en cuanto a la limitación potencial de ciertas actividades profesionaleso recreativas que requieren un esfuerzo físico grande en circunstanciasde exposición a concentraciones de monóxido de carbono suficiente-mente altas.
Sin embargo, con los niveles de exposición al monóxido decarbono más comunes en el ambiente son motivo de mayorpreocupación determinados efectos cardiovasculares (es decir, elagravamiento de los síntomas de angina durante el ejercicio) que tienenprobabilidad de presentarse en un segmento de la población generalmás pequeño, pero representativo. Este grupo, formado por losenfermos con angina crónica, está considerado actualmente el de mayorriesgo sensible a los efectos de la exposición al monóxido de carbono,basándose en las pruebas de agravamiento de la angina que se produceen estos enfermos cuando se exponen a concentraciones decarboxihemoglobina del 2,9%-4,5%. La relación dosis-respuesta paralos efectos cardiovasculares en pacientes con cardiopatía coronariatodavía no se ha definido de manera concluyente y no se puededescartar por el momento la posibilidad de que puedan producirse talesefectos con concentraciones de carboxihemoglobina inferiores al 2,9% . Por consiguiente, en el presente documento se examinan nuevosestudios publicados para determinar los efectos del monóxido decarbono en el agravamiento de la angina con niveles de carboxi-hemoglobina del 2%-6%.
En cinco estudios básicos se ha investigado la posibilidad de quela exposición al monóxido de carbono favorezca la aparición deisquemia miocárdica durante el ejercicio en pacientes con cardiopatíacoronaria. En un estudio inicial se comprobó que la duración delejercicio disminuía considerablemente por la aparición del dolor de
EHC 213: Carbon Monoxide
444
pecho (angina) en pacientes con angina de pecho después de laexposición a concentraciones de carboxihemoglobina de apenas un2,9%, lo que representa un aumento de la concentración decarboxihemoglobina del 1,6% sobre el valor de referencia. Losresultados de un amplio estudio multicéntrico demostraron la apariciónde efectos en pacientes con angina inducida por el ejercicioreproducible después de la exposición a concentraciones decarboxihemoglobina del 3,2%, correspondiente a un aumento de laconcentración de carboxihemoglobina del 2,0% sobre el valor dereferencia. En otros estudios se observaron efectos semejantes enpacientes con cardiopatía coronaria obstructiva y pruebas de isquemiainducida por el ejercicio después de la exposición a concentraciones decarboxihemoglobina del 4,1% y 5,9%, respectivamente, lo querepresenta un aumento del 2,2% y del 4,2% sobre el valor dereferencia. En un estudio con enfermos de angina se observaron efectoscon concentraciones del 3% de carboxihemoglobina, lo que representaun aumento del 1,5% con respecto al valor de referencia. Así pues, laconcentración más baja con efectos adversos observados en pacientescon isquemia inducida por el ejercicio se sitúa entre el 3% y el 4% decarboxihemoglobina, equivalente a un aumento del 1,5% -2,2% conrespecto al valor de referencia. No se han estudiado los efectos en losepisodios de isquemia silenciosa, que son la mayoría de los que se danen este tipo pacientes.
Las consecuencias adversas para la salud de la exposición aconcentraciones bajas de monóxido de carbono en pacientes concardiopatía isquémica son muy difíciles de pronosticar en la poblaciónde personas con riesgo a causa de enfermedades cardíacas. Se haobservado que la exposición a concentraciones de monóxido decarbono suficientes para alcanzar un 6% de carboxihemoglobina, perono para valores inferiores de ésta, aumenta considerablemente elnúmero y la complejidad de las arritmias inducidas por el ejercicio enpacientes con cardiopatía coronaria y ectopia básica. Este resultado,junto con los estudios de series cronológicas de morbilidad ymortalidad relacionadas con el monóxido de carbono y los estudiosepidemiológicos con trabajadores de túneles, que normalmente estánexpuestos a los gases de escape de los automóviles, parece indicar quela exposición al monóxido de carbono puede crear un mayor riesgo demuerte repentina por arritmia en pacientes con cardiopatía coronaria,pero no es una prueba concluyente.
Résumé et Conclusions
445
En evaluaciones anteriores de los efectos cardiovasculares delmonóxido de carbono se ha indicado que parece haber una relaciónlineal entre la concentración de carboxihemoglobina en la sangre y ladisminución del rendimiento humano con el ejercicio máximo, medidocomo absorción máxima de oxígeno. El rendimiento durante elejercicio de las personas jóvenes, sanas, no fumadoras disminuyesistemáticamente con una concentración de carboxihemoglobina en lasangre de alrededor del 5%. En algunos estudios se ha observadoincluso una disminución a corto plazo de la duración del ejerciciomáximo con niveles de sólo un 2,3%-4,3% de carboxihemoglobina; sinembargo, esa disminución es tan pequeña que sólo suscitapreocupación en el caso de los atletas de competición, más que en laspersonas comunes que realizan las actividades cotidianas.
También hay pruebas basadas tanto en consideraciones teóricascomo en estudios experimentales con animales de laboratorio de queel monóxido de carbono puede afectar negativamente al sistemacardiovascular, en función de las condiciones de exposición utilizadasen esos estudios. Aunque se han observado alteraciones en el ritmo yla conducción cardíacos en animales sanos y en otros con insuficienciacardíaca, los resultados de esos estudios no son concluyentes. El nivelmás bajo en el cual se han observado efectos varía en función delrégimen de exposición utilizado y de las especies sometidas a prueba.Los resultados obtenidos en estudios realizados con animales indicanasimismo que el monóxido de carbono inhalado puede aumentar laconcentración de hemoglobina y la razón de hematocrito, probable-mente como reacción para compensar el efecto de la reducción de lacapacidad de transporte de oxígeno debida al monóxido de carbono.Con concentraciones altas de monóxido de carbono, el aumentoexcesivo de la hemoglobina y el valor hematocrito puede imponer unacarga adicional al corazón y comprometer el flujo sanguíneo de lostejidos.
Hay pruebas contradictorias de que la exposición al monóxido decarbono favorece la aparición de aterosclerosis en animales delaboratorio, y en la mayoría de los estudios no aparecen efectosmedibles. Igualmente, la posibilidad de que el monóxido de carbonofomente cambios significativos en el metabolismo de los lípidos quepuedan acelerar la aterosclerosis solamente se indica en un pequeñonúmero de estudios. Cualquier efecto de este tipo será como máximopoco perceptible. Por último, es probable que el monóxido de carbono
EHC 213: Carbon Monoxide
446
inhiba la agregación de las plaquetas más que fomentarla. En generalse dispone de pocos datos que indiquen que probablemente seproduciría un efecto aterogénico por la exposición en poblacioneshumanas con las concentraciones de monóxido de carbono quenormalmente se encuentra en el medio ambiente.
6.2 Efectos pulmonares agudos
No es probable que el monóxido de carbono tenga ningún efectodirecto en el tejido pulmonar, excepto en concentracionesextremadamente altas asociadas con la intoxicación por monóxido decarbono. Los estudios de los efectos del monóxido de carbono en lafunción pulmonar realizados con personas se complican por la falta deuna información adecuada sobre la exposición, el pequeño número depersonas estudiadas y la brevedad de las exposiciones investigadas. Laexposición ocupacional o occidental a los productos de combustión yla pirólisis, particularmente en espacios cerrados, pueden producir unadisminución aguda de la función pulmonar si las concentraciones decarboxihemoglobina son altas. Sin embargo, es difícil separar losefectos potenciales del monóxido de carbono de los correspondientesa otras sustancias del humo y los gases de escape irritantes del aparatorespiratorio. En estudios de poblaciones comunitarias sobre elmonóxido de carbono en el aire ambiente no se ha encontrado unarelación significativa con la función, la sintomatología y lasenfermedades pulmonares.
6.3 Efectos cerebrovasculares y en el neurocomportamiento
No se han notificado pruebas fidedignas demostrativas de unareducción de la función del neurocomportamiento en adultos jóvenessanos con concentraciones de carboxihemoglobina inferiores al 5%.Los resultados de los estudios realizados con una concentración decarboxihemoglobina del 5% o superior son equívocos. En gran partede las investigaciones realizadas con un 5% de carboxihemoglobina nose observó ningún efecto, incluso cuando intervenían comportamientossemejantes a los afectados en estudios con concentraciones más altasde carboxihemoglobina. Sin embargo, los investigadores que nopudieron encontrar una disminución del neurocomportamientorelacionada con el monóxido de carbono con concentraciones decarboxihemoglobina del 5% o superiores tal vez utilizaran pruebas queno eran suficientemente sensibles para detectar de manera fidedignapequeños efectos del monóxido de carbono. Así pues, teniendo en
Résumé et Conclusions
447
cuenta las pruebas empíricas, se puede decir que las concentracionesde carboxihemoglobina superiores o iguales al 5% pueden producir unadisminución de la función del neurocomportamiento. Sin embargo, nose puede afirmar con seguridad que los niveles de carboxihemoglobinainferiores al 5% no tengan ningún efecto. Sin embargo, solamente sehan estudiado adultos jóvenes sanos utilizando pruebas cuyasensibilidad se puede demostrar y concentraciones decarboxihemoglobina del 5% o superiores. Por consiguiente, no se hainvestigado el problema de los grupos con riesgo especial de efectosdel monóxido de carbono en el neurocomportamiento.
Un caso especial es el de las personas que están tomandomedicamentos con efectos depresores primarios o secundarios, en lasque cabría esperar que se agravara la disminución del neuro-comportamiento relacionada con el monóxido de carbono. Otrosgrupos posiblemente con más riesgo en cuanto a los efectos en elneurocomportamiento inducidos por el monóxido de carbono son losancianos y los enfermos, pero en estos grupos no se ha evaluado talriesgo.
En circunstancias normales, el cerebro puede aumentar el flujosanguíneo o la extracción de oxígeno de los tejidos para compensar lahipoxia provocada por la exposición al monóxido de carbono. Larespuesta general del sistema cerebrovascular es semejante en el feto,en el recién nacido y en el animal adulto; sin embargo, todavía se sabepoco acerca del mecanismo que determina el aumento del flujosanguíneo en el cerebro. En realidad, parece probable que el aumentodel flujo sanguíneo se deba a varios mecanismos que actúansimultáneamente, en ellos podrían intervenir aspectos metabólicos yneurales, así como la curva de disociación de la oxihemoglobina, losniveles de oxígeno en los tejidos e incluso un efecto histotóxico delmonóxido de carbono. Tampoco se sabe si estos mecanismoscompensatorios seguirían funcionando con éxito en una serie decondiciones en las que el cerebro y su sistema vascular se vencomprometidos (es decir, apoplejía, traumatismos craneoencefálicos,arteriosclerosis e hipertensión). El envejecimiento aumenta laprobabilidad de estas lesiones y enfermedades. También es posible queexistan diferencias individuales con respecto a la sensibilidad a lacarboxihemoglobina y los mecanismos compensatorios.
EHC 213: Carbon Monoxide
448
Los comportamientos que requieren una atención constante o unrendimiento duradero son los más sensibles a las alteracionesprovocadas por la carboxihemoglobina. El grupo de estudios humanossobre la coordinación entre las manos y los ojos (seguimientocompensatorio), la detección de manifestaciones no frecuentes(vigilancia) y el rendimiento continuado ofrece las pruebas másconvincentes y defendibles de los efectos de la carboxihemoglobina enel comportamiento a concentraciones de apenas un 5%. Sin embargo,estos efectos con concentraciones bajas de exposición al monóxido decarbono han sido muy pequeños y algo controvertidos. No obstante, lasconsecuencias potenciales de una deficiencia en la coordinación y lavigilancia del rendimiento continuado de tareas críticas en operadoresde maquinaria como los vehículos de transporte público pueden sergraves.
6.4 Toxicidad en el desarrollo
Los estudios realizados en varias especies de animales delaboratorio aportan pruebas convincentes de que la exposición maternaa 170-230 mg/m3 (150-200 ppm) de monóxido de carbono, que dalugar a alrededor de un 15%-25% de carboxihemoglobina, produce unareducción del peso al nacer, cardiomegalia, retrasos en la evolución delcomportamiento y alteración de la función cognoscitiva. Deexperimentos aislados parece deducirse que algunos de estos efectospueden estar presentes con concentraciones de sólo 69-74 mg/m3 (60-65 ppm; alrededor de un 6%-11% de carboxihemoglobina) mantenidasdurante toda la gestación. Los estudios en los que se relaciona laexposición humana al monóxido de carbono de fuentes del medioambiente o del humo de los cigarrillos con una reducción del peso alnacer son motivo de preocupación debido al riesgo de trastornos en eldesarrollo; sin embargo, en muchos de estos estudios no se han tenidoen cuenta todas las fuentes de monóxido de carbono. Los datos actualesrelativos a niños que parecen indicar una vinculación entre laexposición al monóxido de carbono del medio ambiente y el síndromede muerte súbita del lactante son poco convincentes.
6.5 Otros efectos sistémicos
Diversos estudios con animales de laboratorio parecen indicar queel metabolismo enzimático de los compuestos xenobióticos puedeverse afectado por la exposición al monóxido de carbono. Sin
Résumé et Conclusions
449
embargo, la mayoría de los autores de estos estudios ha llegado a laconclusión de que los efectos en el metabolismo cuando lasconcentraciones de carboxihemoglobina son bajas (#15%) puedenatribuirse por entero a la hipoxia de los tejidos producida por elaumento del nivel de carboxihemoglobina, debido a que no sonsuperiores a los efectos producidos por niveles comparables de hipoxiahipóxica. Con niveles mayores de exposición, cuando lasconcentraciones de carboxihemoglobina superan el 15%-20%, elmonóxido de carbono puede inhibir directamente la actividad de lasoxidasas de funciones múltiples. La disminución del metabolismoxenobiótico que se observa con la exposición al monóxido de carbonopuede ser importante para las personas sometidas a tratamiento conmedicamentos.
Se ha señalado que la inhalación de niveles altos de monóxido decarbono que dan lugar a concentraciones de carboxihemoglobinasuperiores al 10%-15% provocan varios otros efectos sistémicos enanimales de laboratorio, así como efectos en las personas afectadas poruna intoxicación aguda por monóxido de carbono. Los tejidos con unmetabolismo de oxígeno muy activo, como el corazón, el cerebro, elhígado, el riñón y el músculo, pueden ser particularmente sensibles ala intoxicación por monóxido de carbono. Los efectos de lasconcentraciones elevadas de monóxido de carbono en otros tejidos noson tan bien conocidos, por lo que hay más dudas acerca de ellos. Enla bibliografía hay informes de efectos en el hígado, el riñón, loshuesos y la capacidad inmunitaria del pulmón y el bazo. Por lo generalse está de acuerdo en que los daños graves de los tejidos que seproducen durante una intoxicación aguda por monóxido de carbono sedeben a uno o varios de los siguientes factores: 1) isquemia debida ala formación de carboxihemoglobina, 2) inhibición de la liberación deoxígeno a partir de la oxihemoglobina, 3) inhibición de la función delos citocromos celulares (por ejemplo las oxidasas citocrómicas) y 4)acidosis metabólica.
Sólo hay datos de un valor relativamente escaso que apuntan aposibles efectos del monóxido de carbono en la actividad fibrinolítica,y esto únicamente con niveles de exposición al monóxido de carbonobastante elevados. Asimismo, si bien hay ciertos datos que parecenindicar también que hay efectos perinatales (por ejemplo, pesoreducido al nacer, disminución del ritmo de desarrollo postnatal,síndrome de muerte súbita del lactante) asociados con la exposición al
EHC 213: Carbon Monoxide
450
monóxido de carbono, las pruebas son insuficientes para confirmarcuantitativamente dicha asociación en el ser humano o establecercualquier relación pertinente entre la exposición y el efecto.
6.6 Adaptación
Las únicas pruebas de compensación a corto o largo plazo delaumento de la concentración de carboxihemoglobina en la sangre o dela adaptación a él son indirectas. Los datos de animales de experi-mentación indican que el aumento de la concentración de carboxi-hemoglobina produce respuestas fisiológicas que tienden acontrarrestar otros efectos nocivos de la exposición al monóxido decarbono. Dichas respuestas son: 1) aumento del flujo de sangrecoronaria, 2) aumento del flujo de sangre cerebral, 3) aumento de lahemoglobina mediante una mayor hematopoyesis y 4) mayor consumode oxígeno en los músculos.
Las respuestas compensatorias a corto plazo en el flujo sanguíneoo el consumo de oxígeno pueden no ser completas, o incluso puedenno existir en ciertas personas. Por ejemplo, se sabe por estudios conanimales de laboratorio que el flujo sanguíneo coronario aumenta conla elevación de la carboxihemoglobina y en estudios clínicos humanosse ha demostrado que las personas con cardiopatía isquémicaresponden a los niveles más bajos de carboxihemoglobina (6% omenos). La consecuencia es que en algunos casos de trastornoscardiacos se altera el mecanismo compensatorio a corto plazo.
Los estudios realizados sobre neurocomportamiento ponenmanifiesto que no se produce una disminución debida al monóxido decarbono de manera constante en todos los casos, o incluso en losmismos estudios, y no se ha demostrado una relación dosis-respuestacon el aumento de los niveles de carboxihemoglobina. De estos datosse deduce que podría haber algún umbral o desfase en el mecanismocompensatorio, por ejemplo un aumento del flujo sanguíneo. Sinpruebas fisiológicas directas en animales de laboratorio, o preferible-mente en el ser humano, este concepto no pasa de ser una hipótesis.
En el caso de que pudiera demostrarse en el ser humano, elmecanismo mediante el cual se produce la adaptación a largo plazo sesupone que es un aumento de la concentración de hemoglobina debidoa una elevación de la hematopoyesis. Esta alteración de la producciónde hemoglobina se ha demostrado repetidas veces en estudios con
Résumé et Conclusions
451
animales de laboratorio, pero no se han realizado recientementeestudios que indiquen o sugieran que se ha obtenido o puede obtenersealgún beneficio de adaptación. Además, aun en el caso de que elaumento de la hemoglobina sea una característica de la adaptación, nose ha demostrado que se produzca con concentraciones bajas demonóxido de carbono en el medio ambiente.
7. Exposición al monóxido de carbono combinada conla altitud, las drogas y otros contaminantes del airey factores del medio ambiente
7.1 Efectos de la altitud elevada
Aunque hay muchos estudios en los que se comparan y contrastanlos efectos de la inhalación de monóxido de carbono con los debidosa la exposición a la altitud, son relativamente pocos los informes sobrelos efectos combinados de la inhalación de monóxido de carbono conla altitud. Hay datos que respaldan la posibilidad de que los efectos deestos dos factores de hipoxia sean como mínimo aditivos. Estos datosse obtuvieron con concentraciones de monóxido de carbono demasiadoelevadas para ser muy significativas a efectos de reglamentación.
Son aún menos los estudios de los efectos a largo plazo delmonóxido de carbono a una altitud elevada. Estos estudios indican quehay pocos cambios a concentraciones de monóxido de carbono pordebajo de 110 mg/m3 (100 ppm) y altitudes inferiores a 4570 m. Sinembargo, el feto puede ser particularmente sensible a los efectos delmonóxido de carbono con la altitud; esto es particularmente aplicablecon niveles elevados de monóxido de carbono asociados con el hábitode fumar de la madre.
7.2 Interacción del monóxido de carbono con las drogas
Hay poca información directa disponible sobre el posible aumentode la toxicidad del monóxido de carbono debido al consumo o el abusoconcomitante de drogas; sin embargo, algunos datos indican que es unproblema preocupante. Hay algunas pruebas de que pueden producirseinteracciones entre los efectos de las drogas y la exposición almonóxido de carbono en ambas direcciones, es decir, el consumo dedrogas puede aumentar la toxicidad del monóxido de carbono y la
EHC 213: Carbon Monoxide
452
exposición al monóxido de carbono puede alterar los efectos tóxicoso de otro tipo de las drogas. Casi todos los datos publicadosdisponibles sobre la combinación del monóxido de carbono con drogasse refieren al consumo de alcohol.
El consumo y el abuso de drogas psicoactivas y de alcohol estángeneralizados en la sociedad. Debido al efecto del monóxido decarbono en la función cerebral, cabe prever interacciones entre elmonóxido de carbono y las drogas psicoactivas. Por desgracia, apenashay investigaciones sistemáticas que se hayan ocupado de estacuestión. Por otra parte, se han realizado pocas investigaciones en lasque se hayan utilizado modelos para los efectos previstos derivados decombinaciones de tratamientos. Así pues, con frecuencia es imposibledeterminar si los efectos combinados de la exposición a las drogas y almonóxido de carbono son aditivos o tienen características distintas. Esimportante reconocer que incluso los efectos aditivos de lascombinaciones pueden tener importancia clínica, especialmente cuandola persona no es consciente del peligro combinado. Las pruebas másconcluyentes de una interacción potencialmente importante delmonóxido de carbono proceden de estudios con alcohol tanto enanimales de laboratorio como en el ser humano, en los que se hanobtenido por lo menos efectos aditivos. La importancia de estoaumenta por la incidencia muy probable de la combinación delconsumo de alcohol con la exposición al monóxido de carbono.
7.3 Combinación de la exposición al monóxido de carbono con otroscontaminantes del aire y factores del medio ambiente
Muchos de los datos relativos a los efectos combinados delmonóxido de carbono y de otros contaminantes presentes en el aireambiente se basan en experimentos con animales de laboratorio. Sólose conoce un pequeño número de estudios en el ser humano. En losprimeros estudios realizados en personas sanas sobre contaminantescomunes del aire, como el monóxido de carbono, el dióxido denitrógeno, el ozono o el nitrato de peroxiacetilo, no se consiguiódemostrar ninguna interacción debida a la exposición combinada. Enestudios de laboratorio no se observó ninguna interacción después deuna exposición combinada a monóxido de carbono y contaminantescomunes del aire ambiente, como el dióxido de nitrógeno o el dióxidode azufre. Sin embargo, se observó un efecto aditivo tras la exposicióncombinada a concentraciones elevadas de monóxido de carbono y
Résumé et Conclusions
453
óxido nítrico y un efecto sinérgico después de la exposición combinadaa monóxido de carbono y ozono.
Las interacciones toxicológicas de los productos de lacombustión, fundamentalmente el monóxido de carbono, el anhídridocarbónico y el ácido cianhídrico, en las concentraciones producidasnormalmente por los fuegos interiores y exteriores, han puesto demanifiesto un efecto sinérgico tras la exposición al monóxido decarbono más el anhídrido carbónico y un efecto aditivo con el ácidocianhídrico. También se observaron efectos aditivos cuando secombinaban el monóxido de carbono, el ácido cianhídrico y unaconcentración baja de oxígeno; la adición de anhídrido carbónico a estacombinación fue sinérgica.
Por último, hay estudios que indican que diversos factores delmedio ambiente, como la presión térmica y el ruido, puede ser factoresdeterminantes importantes de efectos para la salud si se combinan conla exposición al monóxido de carbono. De los efectos descritos, elúnico posiblemente con mayor interés para la exposición humananormal es la mayor disminución del rendimiento del ejercicio que seobserva cuando la presión térmica se combina con 57 mg de monóxidode carbono/m3 (50 ppm).
7.4 Humo del tabaco
Además de ser una fuente de monóxido de carbono tanto para losfumadores como para los no fumadores, el humo del tabaco es tambiénuna fuente de otras sustancias químicas que pueden tener unainteracción con el monóxido de carbono del medio ambiente. Los datosdisponibles parecen demostrar de manera convincente que laexposición aguda y crónica al monóxido de carbono atribuida al humodel tabaco puede afectar al sistema cardiopulmonar, pero la posibleinteracción del monóxido de carbono con otros productos del humo deltabaco crea confusión en los resultados. Además, no está claro si elaumento adicional de la carboxihemoglobina debido a la exposición enel medio ambiente sería en realidad aditivo con las concentraciones decarboxihemoglobina elevadas crónicamente debido al humo del tabaco,puesto que puede haber cierta adaptación fisiológica.
EHC 213: Carbon Monoxide
454
8. Evaluación de subpoblaciones potencialmente conriesgo derivado de la exposición al monóxido decarbono
La mayor parte de la información sobre los efectos del monóxidode carbono para la salud se refieren a dos grupos de poblacióncuidadosamente definidos: adultos sanos jóvenes y pacientes concardiopatía coronaria diagnosticada. De acuerdo con los efectosconocidos descritos, los pacientes con isquemia inducida por elejercicio reproducible parecen ser los mejor definidos como gruposensible dentro de la población general que corre un riesgo mayor deexperimentar efectos preocupantes en la salud (es decir, menorduración del ejercicio debido al agravamiento de los síntomascardiovasculares) con las concentraciones de exposición al monóxidode carbono del medio ambiente o las próximas a ellas que dan lugar aun descenso de los niveles de carboxihemoglobina al 3%. Un gruposensible más pequeño de individuos sanos experimenta una duraciónmenor del ejercicio con niveles análogos de exposición al monóxidode carbono, pero sólo durante un ejercicio máximo de corta duración.Por consiguiente, la disminución de la duración del ejercicio en lapoblación sana debería preocupar sobre todo a los atletas decompetición, más que a la población normal que lleva cabo lasactividades habituales de la vida cotidiana.
Sin embargo, el trabajo tanto clínico como teórico y lainvestigación experimental en animales de laboratorio pueden llevar ala hipótesis de que algunos otros grupos de población tal vez corran unriesgo probable derivado de la exposición al monóxido de carbono.Los grupos de riesgo probable identificables se pueden clasificar enfunción de las diferencias por razón de sexo; la edad (por ejemplo,fetos, niños pequeños y ancianos); las variaciones genéticas (es decir,anomalías de la hemoglobina); enfermedades existentes anteriormente,conocidas o desconocidas, ya que reducen la disponibilidad de oxígenopara tejidos críticos; o el uso de medicamentos, drogas deesparcimiento o alteraciones del medio ambiente (por ejemplo,exposición a otros contaminantes del aire o a una altitud elevada). Pordesgracia, actualmente se dispone de pocas pruebas empíricas quepermitan especificar los efectos para la salud asociados con laexposición al monóxido de carbono del medio ambiente o a unaconcentración próxima para la mayoría de los grupos con riesgoprobable.
Résumé et Conclusions
455
9. Intoxicación por monóxido de carbono
El presente documento se ocupa en su mayor parte de lasconcentraciones relativamente bajas de monóxido de carbono queinducen efectos en ser humano en el margen inferior de la detección dela carboxihemoglobina mediante la tecnología médica actual, o cercade dicho margen. Ahora bien, los efectos asociados con la exposicióna este contaminante van desde los cardiovasculares y deneurocomportamiento más leves a concentraciones bajas en el medioambiente hasta la inconsciencia y la muerte tras una exposición agudaa concentraciones elevadas de monóxido de carbono. La morbilidad yla mortalidad debidas a estas últimas exposiciones pueden ser motivode preocupación importante para la salud pública.
Al monóxido de carbono se debe un porcentaje elevado de lasintoxicaciones y muertes accidentales notificadas en todo el mundocada año. Se dan ciertas condiciones tanto del medio ambiente interiorcomo del exterior que provocan la exposición de un pequeñoporcentaje de la población a concentraciones peligrosas de monóxidode carbono. En el exterior, las mayores concentraciones de monóxidode carbono se registran cerca de los cruces de calles, con un tráficointenso, cerca de los gases de escape de los motores de combustióninterna y de fuentes industriales y en zonas poco ventiladas, como losaparcamientos cerrados y los túneles. En espacios interiores, lasconcentraciones de monóxido de carbono alcanzan un nivel máximo enlos lugares de trabajo o los hogares que tienen aparatos de combustióndefectuosos o mal ventilados o bien con corrientes descendentes ocontracorrientes.
Es escasa la correlación entre los síntomas y los signos de laintoxicación aguda por monóxido de carbono y el nivel decarboxihemoglobina medido en el momento de la llegada al hospital.Los niveles de carboxihemoglobina inferiores al 10% no se suelenasociar con síntomas. A concentraciones mayores de carboxi-hemoglobina, del 10%-30%, pueden producirse síntomas neurológicosdebidos a la intoxicación por monóxido de carbono, por ejemplo dolorde cabeza, mareos, debilidad, náuseas, confusión, desorientación yalteraciones visuales. Con una exposición continua, que produceniveles de carboxihemoglobina del 30% al 50%, se observa disnea poresfuerzo, aumento del ritmo del pulso y la respiración y síncope.
EHC 213: Carbon Monoxide
456
Cuando las concentraciones de carboxihemoglobina son superiores al50%, puede producirse coma, convulsiones y paro cardiopulmonar.
En la intoxicación por monóxido de carbono se producen confrecuencia complicaciones (muerte inmediata, trastornos del miocardio,hipotensión, arritmias, edema pulmonar). Tal vez el efecto másinsidioso de la intoxicación por monóxido de carbono sea la apariciónretardada de trastornos neuropsiquiátricos en un plazo de una a tressemanas, junto con consecuencias para el neurocomportamiento,especialmente en los niños. La intoxicación por monóxido de carbonodurante el embarazo representa un riesgo elevado para la madre,aumentando la tasa de complicaciones a corto plazo, y también para elfeto, provocando la muerte fetal, trastornos del desarrollo y lesionesanóxicas cerebrales. Además, la gravedad de la intoxicación fatal nose puede evaluar por la tasa materna.
La intoxicación por monóxido de carbono se produce confrecuencia, tiene consecuencias graves, incluso la muerte inmediata,lleva consigo complicaciones y secuelas tardías y con frecuencia se lapasa por alto. Hay que fomentar los esfuerzos de prevención y deeducación pública y médica.
10. Valores indicativos recomendados por la OMS
Los siguientes valores indicativos (valores redondeados en ppm)y los períodos de exposición como promedio ponderado por el tiempose han determinado de manera que no se supere la concentración del2,5% de carboxihemoglobina, incluso cuando una persona normalrealice un ejercicio ligero o moderado:
100 mg/m3 (87 ppm) durante 15 min60 mg/m3 (52 ppm) durante 30 min30 mg/m3 (26 ppm) durante una hora10 mg/m3 (9 ppm) durante ocho horas

457
INDEX
Absorption, 5, 124, 133Adaptation, 14, 15, 200, 210, 211, 272-274
at high altitude, 336in smokers, 17, 278, 323, 346
Ageand carboxyhaemoglobin level, 99as risk factor, 12, 15, 18, 174, 336, 337
Agricultural burning, 42, 43, 48Aircraft, 40, 124-126, 132, 133, 326Air pollutants, 16-18, 240, 241, 248, 249, 255, 275-277, 300-305, 316, 348
— see also individual air pollutantsAlcohol, 15, 16, 237-240, 274, 275Altitude, 18, 101, 123, 133, 172, 210, 316
in combination with carbon monoxide exposure, 15, 200, 210, 246-248, 319-327, 335, 336, 342, 343, 348
effect on carbon monoxide concentrations, 67effect on carbon monoxide emissions, 101, 320, 321effect on carboxyhaemoglobin formation, 321, 322effect on oxygen partial pressure, 124and haematocrit ratio, 177and pulmonary hypertension, 176
Ambient air monitoring, 2, 3, 25, 71-77, 89, 93, 345Anaemia, 123, 135, 137, 141, 294, 295, 335, 340, 348Angina, 8, 9, 126, 280-293, 298, 338Arrhythmogenic effects, 9, 10, 19, 163-166, 201, 202, 295-298, 308, 339Atherosclerosis, 10, 12, 179-186, 205, 206Atmospheric lifetime, 60-62, 67, 69Auditory effects, 263, 277, 278
Barbiturates, 239 — see also Drugs; Psychoactive drugsBehaviour, 11, 12, 190-200, 209, 217, 218, 235, 259-272, 274, 275, 336 —
see also Neurobehavioural effectsBinding
to cytochrome oxidase, 5, 7, 154, 156-160to cytochrome P-450, 5, 155, 156to haemoglobin, 7, 8, 137, 140, 150to myoglobin, 5, 7, 150-155of oxygen to haemoglobin, 5, 35, 140, 150, 212, 213
Biological exposure index, 122, 125Biological monitoring — see Measurement, in blood; Measurement, in
exhaled breathBiological tolerance limit, 122
EHC 213: Carbon Monoxide
458
Birth weight, 12-14, 214, 215, 225-227, 235, 236, 312, 313, 315, 316, 325,336, 342, 343
Brain electrical activity, 270-272Brain metabolism, 196-198, 209Breath
determining levels in, 6, 34-37measurements in populations, 93-99
Carbon dioxide, 16, 125, 139, 221as combustion product, 39, 40, 241, 242, 244, 249-251interference with carbon monoxide, 23as product of carbon monoxide metabolism, 49, 138, 150, 157
Carboxyhaemoglobinbackground levels of, 4, 124, 278, 346and carbon monoxide concentration, 4, 6, 98, 99, 121, 144, 322, 330dissociation curve, 147, 220effects associated with — see individual effectsformation of, 1, 5, 136-149, 321, 345guidelines for, 347levels in fetus, 212, 213, 220, 310, 314, 336levels in poisoning cases, 329, 330levels in populations, 4, 90-101levels in smokers, 4, 70, 91-94, 100, 122, 126, 127, 129-131, 133,
183, 213, 278, 312, 325, 342, 346measurement of, 6, 27-34, 222, 223
Carboxymyoglobin, 143, 153-155Cardiac arrhythmia, 9, 10, 19, 163-166, 210, 212, 295-298, 308, 339Cardiac hypertrophy, 172, 173, 176, 247Cardiomegaly, 12, 171-177, 203, 204, 210, 216, 227-230, 235, 248, 336Cardiovascular system
development of, 227-230diseases of, 254, 280-283, 299-310effects on, 8-10, 162-186, 212, 230, 256-258, 280-293, 321, 323-325
Ceiling limit, 120-123Central nervous system, 190-200Cerebral blood flow, 12, 14, 170, 190-196, 209, 256, 257, 273Chronic obstructive pulmonary disease, 100, 293, 294, 335, 341, 348Cigarette smoke — see Environmental tobacco smoke; Smoking; Tobacco
smokeCoal stoves, 2, 57, 71, 116Coburn-Forster-Kane (CFK) model, 6, 7, 143-149, 321, 324, 347Combustion, 2, 38-58
engines, 50-52products of, 241-245, 249, 254
Commuting, 4, 70, 77, 80-83, 106, 109, 111, 113 — see also Motorvehicles
Index
459
Concentrations, 86in ambient air, 2, 18, 74-77, 83-85, 344, 345background, 59, 344global, 2, 59, 68, 69in ice skating rinks, 80, 106, 114, 345in indoor air, 2, 18, 77-80, 103-119, 345in megacities, 101-105in motor vehicles, 4, 70, 77, 80-83, 109, 113, 132, 345
Congestive heart failure, 302-304, 335, 339CO-Oximeter, 29, 34, 222, 223, 225, 281-283, 325, 335, 337-339, 342Coronary artery disease, 9, 10, 17, 282, 284, 288, 289, 296, 298, 307, 325,
335, 337-339, 342Coronary blood flow, 14, 165, 167, 168, 298, 299Cyanide, 16, 240-244, 249, 276Cytochrome oxidase, 5, 7, 13, 150-152, 154-160, 237Cytochrome P-450, 5, 125, 150-152, 155, 156, 158, 159, 221, 239, 342
Denver Personal Monitoring Study, 25, 71, 74-77, 89Detectors, 25-27, 349Developmental toxicity, 12, 13, 211-235, 336Dichloromethane, 122, 125, 158, 159, 276, 335, 342Diffusion, 35, 36, 136, 137, 139, 142, 143, 220, 221, 257, 310, 345Distribution, 59-69
altitudinal variation in, 67global, 64-69intracellular, 150-153latitudinal variation in, 59, 61-63, 66-69seasonal variation in, 60, 64, 66
Drugs, 11, 13, 15, 16, 18, 135, 155, 221, 235, 237-240, 274, 275, 286, 288,289, 335, 341, 348
Electrocardiograms, 126, 163-165, 201, 243, 248, 280-293, 295-298, 308Elimination, 6, 136, 139, 148, 160, 161, 182, 212, 220, 327, 332, 336Emissions, 2, 38-58
global, 38, 39, 60, 62, 63, 68, 69from indoor sources, 53-58from industrial sources, 2, 40-43, 45-48, 52, 53latitudinal distribution of, 59from natural sources, 39, 42, 48, 53, 67seasonal variation in, 60, 62, 64from transportation sources, 2, 40, 41, 43-47, 50, 51, 69
Endogenous production, 6, 134-136, 138, 143, 157, 161, 335, 340, 349Environmental tobacco smoke, 71, 118-119, 132-133, 159, 278, 308-309
EHC 213: Carbon Monoxide
460
Exercisecarbon monoxide diffusion during, 139, 153, 257cardiorespiratory effects during, 8-10, 17, 256-258, 277, 279, 280,
293, 294, 323, 324cardiovascular effects during, 203, 256-258, 280-293, 296, 297effects on carbon monoxide concentrations in breath, 94, 95effects on carboxyhaemoglobin formation, 6, 147oxygen uptake during, 155, 256, 257, 277performance, 10, 17, 249, 269, 277, 287, 323, 324, 335, 339
Exposure, 70-133components of, 87-89definitions of, 88, 89estimating, 71-74, 85, 87-90indoors, 3, 77-80, 103-119measurement of, 90-101modelling of, 3, 89, 90from motor vehicles, 3, 4, 77, 80-85, 106, 113, 114, 128-133outdoors, 83-86sources of — see Sourcesin workplace, 4, 5, 71, 119-133, 305-307, 345, 347
Fetal carboxyhaemoglobin, 149, 212, 213, 220, 310, 311, 314, 336measurement of, 222, 223
Fetal haematocrit, 179Fetotoxicity, 15, 19, 179, 223-225, 234, 310-315, 344, 348 — see also
Developmental toxicity; Prenatal exposureField studies — see Personal monitoring field studiesFine motor skills, 263, 264Fireplaces, 53, 106, 107, 114-116Forest fires, 39, 42, 53, 59, 69Fuel, 2, 40, 41, 50, 51
Gas appliances, 2, 55, 56, 78, 79, 95ovens/stoves/ranges, 2, 55, 56, 71-75, 78, 106, 109, 111-115, 117,
345 space heaters, 56, 57, 106, 107, 114-117
Gas chromatography, 1, 23, 29, 223, 281Geysers — see Water heatersGuidelines
for carboxyhaemoglobin, 347EPA outdoor standard, 96, 97NIOSH standard, 129occupational exposure limits, 120-124standard for carbon monoxide detectors, 26WHO air quality, 19, 70, 101-103, 347
Index
461
Haematological disorders, 135, 141, 142, 335, 340, 348Haematology, 10, 141, 177-179, 204, 205Haemodynamics, 166-171, 202, 203Haemoglobin–carbon monoxide combining capacity, 32, 33, 35Haldane coefficient/relationship, 6, 35, 37, 140, 144, 147, 151, 222Halomethanes, 119, 124, 125, 136, 241, 276 — see also DichloromethaneHeart disease, 280-293, 299-310 — see also Coronary artery disease;
IschaemiaHeat stress, 16, 17, 245, 249, 277, 348Hospital admissions, 254, 302-305, 308, 317, 318, 333, 341, 343Hydrocarbons, 2, 23, 38, 39, 49, 51, 60, 62, 64, 67, 276, 316, 342Hydrogen cyanide, 16, 240-242, 244, 249, 251, 276Hydroxyl radicals, 3, 39, 49, 60-62, 64-66, 69, 134Hyperbaric oxygen, 161, 198, 312-314, 332, 333Hypoxia, 5, 7, 12, 13, 134, 158, 168, 169, 171, 189-196, 211, 212, 227,
236, 244
Ice skating rinks, 80, 106, 114, 345Industrial sources, 2, 40-43, 45-48, 52, 53Infrared absorption, 20, 22, 28, 59Ischaemia, 9, 13, 14, 17, 163-166, 201, 237, 280-293, 296-299, 303, 338
Kerosene space heaters, 56, 57, 78, 106, 107, 111, 113-115, 117, 254
Lung disease — see Chronic obstructive pulmonary disease; Pulmonarydisease; Respiratory effects
Lung function, 11, 188, 189, 208, 251-256Lung morphology, 186-188, 207, 250, 251
Mass balance, 60, 62, 63, 65Measurement
in ambient air, 1, 20-27in blood, 1, 6, 27-34, 222, 223in exhaled breath, 6, 34-37using personal monitors, 3, 25
Mechanism of action — see Carboxyhaemoglobin, formation of Megacities, 101-105Metalloproteins, 5, 150, 152 — see also Cytochrome c oxidase;
Cytochrome P-450; MyoglobinMethane, 2, 23, 30, 31, 39, 59-62, 65, 69Methyl chloroform, 60, 64, 65Methylene chloride — see DichloromethaneMitochondria, 151, 153, 154, 156-159, 173, 186, 187, 207, 245Mixed-function oxidases, 13, 119, 155, 156, 235, 239 — see also
Cytochrome P-450
EHC 213: Carbon Monoxide
462
Mortality, 18, 19, 54, 242, 250, 254, 299-302, 305-307, 311, 327, 328,337-339, 343, 344
Motor vehiclesconcentrations in, 4, 70, 77, 80-83, 109, 113, 132, 345emissions from, 2, 40, 41, 43-47, 50, 51, 69
Myocardial ischaemia — see IschaemiaMyoglobin, 135, 138, 228
binding to, 5, 7, 143, 150-155in oxygen transport, 7, 142, 143, 339
Neurobehavioural effects, 11, 12, 14, 19, 230-232, 235, 317-319, 325, 326Neurochemical effects, 232-234Neuromuscular effects, 234, 235Nitric oxide, 196, 240, 242, 249, 276Nitrogen oxide, 16, 83, 241, 248, 256, 276, 300, 302, 304, 305, 316Noise, 16, 245, 249, 277, 278Non-dispersive infrared (NDIR) techniques, 1, 21-23, 25
Occupational exposure, 4, 5, 71, 119-133effects on health, 252-254, 305-307levels of, 4, 77, 345limits for, 120-124types of, 4, 5, 71, 77, 124, 125, 347
Oceans, 38, 39, 67Oxygen
binding to haemoglobin, 5, 35 — see also Oxyhaemoglobincarrying capacity, 5, 8, 134, 143, 177, 194, 221, 241, 258, 335, 336,
338-340hyperbaric, 161, 198, 312-314, 332, 333partial pressure of, 7, 8, 35, 139-143, 151-154, 157, 158, 168, 221,
273, 298role in combustion, 49transport of, 220-222, 342uptake during exercise, 155, 256, 257, 277
Oxyhaemoglobin, 5, 8, 12, 13, 33, 137, 139-141, 145, 222, 237, 322, 339dissociation curve, 141, 142, 171, 314, 326
Ozone, 3, 16, 39, 60, 61, 66, 69, 83, 249, 256, 276, 301-304
Partial pressureof carbon monoxide, 8, 35, 36, 99, 137, 139, 140, 151, 153, 158of oxygen, 7, 8, 35, 139-143, 151-154, 157, 158, 168, 221, 273, 298
Particulate matter, 251, 255, 300-304Performance, 263-272Peroxyacyl nitrates, 16, 276, 277Personal exposure monitors (PEMs), 3, 25, 73-77, 83, 85, 89, 97, 106, 108,
349
Index
463
Personal monitoring field studies, 74-77, 96, 97, 106, 108-111Physical/chemical properties, 20, 21Placental oxygen transport, 212, 220-222Poisoning, 11, 13, 18, 19, 198, 236, 307, 308, 312-314, 327-337, 343, 344Pregnancy, 123, 135, 310-315, 344, 348, 349Prenatal exposure, 174, 175, 179, 203, 204, 212, 227-235Psychoactive drugs, 13, 15, 16, 237-240, 341Pulmonary disease, 99, 100, 255 — see also Chronic obstructive pulmonary
disease; Lung function; Respiratory effectsPulmonary morphology, 186-188, 207, 250, 251Pulmonary ventilation, 5, 6, 36, 139, 145, 188, 189, 208, 254, 257, 258,
323, 324, 337
Reaction time, 264Recommended exposure limit, 120Reference methods, 22, 28-33Reoxygenation, 198, 331, 332 — see also Hyperbaric oxygenRespiratory effects, 186-189, 256-258 — see also Chronic obstructive
pulmonary disease; Lung function; Pulmonary diseaseRisk groups, 8, 9, 11, 12, 17, 18, 119, 140, 252, 280-327, 335-344
Sample handling, 30Sampling, 24Short-term exposure limit, 120-122Sinks, 60-64Smoking, 2, 57, 58, 71, 112, 113, 119 — see also Environmental tobacco
smoke; Tobacco smokeand carbon monoxide levels in breath, 98, 100, 101and carboxyhaemoglobin levels in blood, 4, 70, 91-94, 100, 122, 126,
127, 133, 183, 213, 278, 312, 325, 342, 346and cardiorespiratory effects, 251, 279, 280, 323 and cardiovascular disease, 308-310and effects on atherogenesis and thrombosis, 182-184and effects on bleeding time, 185and effects on fetus, 310-312, 315, 316, 325emissions from, 57, 58, 71, 112, 114, 115, 118, 119, 278and fetal carboxyhaemoglobin levels, 213, 310, 311and reduced birth weight, 13, 226, 236, 315, 316, 342
Solid waste disposal, 40, 42, 43, 48Sources, 38-58, 60, 344
anthropogenic, 1, 2, 4, 38-58distribution of, 59-69endogenous, 1, 119, 134-136indoor, 53-58natural, 38, 39
Space heaters, 2, 56, 57, 78, 79, 106, 107, 111, 113-117, 126, 254

EHC 213: Carbon Monoxide
464
Spectrophotometry, 28-30, 33, 34, 222, 223Standards — see GuidelinesStationary combustion, 40, 41, 43, 51, 52Stoves — see Coal stoves; Gas appliances, ovens/stoves/ranges; Wood
stovesSudden infant death syndrome, 13, 114, 316, 317Sulfur dioxide, 16, 241, 248, 254, 300-302, 304, 316
Targeted studies, 106, 108, 111, 113-119Teratogenicity, 224-227Threshold limit values, 120, 122Thrombosis, 179-186, 205, 206Time budgets, 3, 73, 77, 87, 88, 108, 110Time-weighted average, 120-123, 128, 129Tobacco smoke, 2, 17, 57, 58, 91, 106, 107, 112, 113, 115, 118, 119, 183-
185, 251, 276, 278-280, 308-310, 346 — see also Environmentaltobacco smoke; Smoking
Tracking, 264-266, 268 Transportation sources — see also Occupational exposure
emissions from, 2, 40, 41, 43-47, 50, 51, 69exposure from, 3, 4, 77, 80-85, 106, 113, 114, 128-133
Uptake, 136-149, 220across alveoli–capillary barrier, 5, 136, 137, 257, 345by cytochrome oxidase, 5, 7, 154, 156-160by cytochrome P-450, 5, 155, 156by fetus, 212, 220, 310, 314, 336intracellular, 7, 138, 150-160by myoglobin, 5, 7, 150-155of oxygen, 8by soil, 61
Vascular disease, 340Ventilation — see Pulmonary ventilationVentricular fibrillation, 164-166, 201, 202Vigilance, 12, 266, 267, 271, Vision, 259-262, 319, 325, 326, 330, 331
Water heaters, 2, 79, 95, 117, 345Wood stoves, 2, 41, 43, 53, 55, 57, 71, 106, 107, 113-115, 117, 118Workplace — see Occupational exposure
Xenobiotic metabolism, 13, 119, 125, 155, 156, 158, 235

continued at end of book
THE ENVIRONMENTAL HEALTH CRITERIA SERIES
Acetaldehyde (No. 167, 1995)Acetone (No. 207, 1998)Acetonitrile (No. 154, 1993)Acrolein (No. 127, 1991)Acrylamide (No. 49, 1985)Acrylic acid (No. 191, 1997)Acrylonitrile (No. 28, 1983)Aged population, principles for evaluating the effects of chemicals (No. 144, 1992)Aldicarb (No. 121, 1991)Aldrin and dieldrin (No. 91, 1989)Allergic hypersensitization associated with exposure to chemicals, principles and methods for assessing (No. 212, 1999)Allethrins (No. 87, 1989)Aluminium (No. 194, 1997)Amitrole (No. 158, 1994)Ammonia (No. 54, 1986)Anticoagulant rodenticides (No. 175, 1995)Arsenic (No. 18, 1981)Asbestos and other natural mineral fibres (No. 53, 1986)Assessment of risks to human health from exposure to chemicals, principles for the (No. 210, 1999)Bacillus thuringiensis (No. 217, 1999)Barium (No. 107, 1990)Benomyl (No. 148, 1993)Benzene (No. 150, 1993)Beryllium (No. 106, 1990)Biomarkers and risk assessment: concepts and principles (No. 155, 1993)Biotoxins, aquatic (marine and freshwater) (No. 37, 1984)Boron (No. 204, 1998)Brominated diphenylethers (No. 162, 1994)Butanols – four isomers (No. 65, 1987)Cadmium (No. 134, 1992)Cadmium – environmental aspects (No. 135, 1992)Camphechlor (No. 45, 1984)Carbamate pesticides: a general introduction (No. 64, 1986)Carbaryl (No. 153, 1994)Carbendazim (No. 149, 1993)Carbon disulfide (No. 10, 1979)Carbon monoxide (No. 13, 1979, 1st edition) (No. 213, 1999, 2nd edition)Carbon tetrachloride (No. 208, 1999)Carcinogens, summary report on the evaluation of short-term in vitro tests (No. 47, 1985)Carcinogens, summary report on the evaluation of short-term in vivo tests (No. 109, 1990)Chlordane (No. 34, 1984)Chlordimeform (No. 199, 1997)Chlordecone (No. 43, 1984)Chlorendic acid and anhydride (No. 185, 1996)Chlorinated paraffins (No. 181, 1996)Chlorine and hydrogen chloride (No. 21, 1982)Chloroalkyl ethers, selected (No. 201, 1998)Chlorobenzenes other than hexachlorobenzene (No. 128, 1991)
Chlorofluorocarbons, fully halogenated (No. 113, 1990)Chlorofluorocarbons, partially halogenated (ethane derivatives) (No. 139, 1992) (methane derivatives) (No. 126, 1991)Chloroform (No. 163, 1994)Chlorophenols (No. 93, 1989)Chlorothalonil (No. 183, 1996)Chromium (No. 61, 1988)Chrysotile asbestos (No. 203, 1998)Copper (No. 200, 1998)Cresols (No. 168, 1995)Cyhalothrin (No. 99, 1990)Cypermethrin (No. 82, 1989)Cypermethrin, alpha- (No. 142, 1992)DDT and its derivatives (No. 9, 1979)DDT and its derivatives – environmental aspects (No. 83, 1989)Deltamethrin (No. 97, 1990)Demeton-S-methyl (No. 197, 1997)Diaminotoluenes (No. 74, 1987)Diazinon (No. 198, 1997)1,2-Dibromoethane (No. 177, 1996)Di-n-butyl phthalate (No. 189, 1997)1,2-Dichloroethane (No. 62, 1987, 1st edition) (No. 176, 1995, 2nd edition)2,4-Dichlorophenoxyacetic acid (2,4-D) (No. 29, 1984)2,4-Dichlorophenoxyacetic acid – environmental aspects (No. 84, 1989)1,3-Dichloropropene, 1,2-dichloropropane and mixtures (No. 146, 1993)Dichlorvos (No. 79, 1988)Diesel fuel and exhaust emissions (No. 171, 1996)Diethylhexyl phthalate (No. 131, 1992)Diflubenzuron (No. 184, 1996)Dimethoate (No. 90, 1989)Dimethylformamide (No. 114, 1991)Dimethyl sulfate (No. 48, 1985)Diseases of suspected chemical etiology and their prevention, principles of studies on (No. 72, 1987)Disinfectants and disinfectant by-products (No. 216, 1999)Dithiocarbamate pesticides, ethylenethiourea, and propylenethiourea: a general introduction (No. 78, 1988)Electromagnetic fields (No. 137, 1992)Endosulfan (No. 40, 1984)Endrin (No. 130, 1992)Environmental epidemiology, guidelines on studies in (No. 27, 1983)Epichlorohydrin (No. 33, 1984)Ethylbenzene (No. 186, 1996)Ethylene oxide (No. 55, 1985)Extremely low frequency (ELF) fields (No. 36, 1984)Fenitrothion (No. 133, 1992)Fenvalerate (No. 95, 1990)Flame retardants: a general introduction (No. 192, 1997)Flame retardants: tris(chloropropyl) phosphate and tris(2-chloroethyl) phosphate (No. 209, 1998)Fluorine and fluorides (No. 36, 1984)

THE ENVIRONMENTAL HEALTH CRITERIA SERIES (continued)
_________________
a Out of print
Food additives and contaminants in food, principles for the safety assessment of (No. 70, 1987)Formaldehyde (No. 89, 1989)Genetic effects in human populations, guidelines for the study of (No. 46, 1985)Glyphosate (No. 159, 1994)Guidance values for human exposure limits (No. 170, 1994)Heptachlor (No. 38, 1984)Hexachlorobenzene (No. 195, 1997)Hexachlorobutadiene (No. 156, 1994)Alpha- and beta-hexachlorocyclohexanes (No. 123, 1992)Hexachlorocyclopentadiene (No. 120, 1991)n-Hexane (No. 122, 1991)Hydrazine (No. 68, 1987)Hydrogen sulfide (No. 19, 1981)Hydroquinone (No. 157, 1994)Immunotoxicity associated with exposure to chemicals, principles and methods for assessment (No. 180, 1996)Infancy and early childhood, principles for evaluating health risks from chemicals during (No. 59, 1986)Isobenzan (No. 129, 1991)Isophorone (No. 174, 1995)Kelevan (No. 66, 1986)Lasers and optical radiation (No. 23, 1982)Lead (No. 3, 1977)a
Lead, inorganic (No. 165, 1995)Lead – environmental aspects (No. 85, 1989)Lindane (No. 124, 1991)Linear alkylbenzene sulfonates and related compounds (No. 169, 1996)Magnetic fields (No. 69, 1987)Man-made mineral fibres (No. 77, 1988)Manganese (No. 17, 1981)Mercury (No. 1, 1976)a
Mercury – environmental aspects (No. 86, 1989)Mercury, inorganic (No. 118, 1991)Methanol (No. 196, 1997)Methomyl (No. 178, 1996)2-Methoxyethanol, 2-ethoxyethanol, and their acetates (No. 115, 1990)Methyl bromide (No. 166, 1995)Methylene chloride (No. 32, 1984, 1st edition) (No. 164, 1996, 2nd edition)Methyl ethyl ketone (No. 143, 1992)Methyl isobutyl ketone (No. 117, 1990)Methylmercury (No. 101, 1990)Methyl parathion (No. 145, 1992)Methyl tertiary-butyl ether (No. 206, 1998)Mirex (No. 44, 1984)Morpholine (No. 179, 1996)Mutagenic and carcinogenic chemicals, guide to short-term tests for detecting (No. 51, 1985)
Mycotoxins (No. 11, 1979)Mycotoxins, selected: ochratoxins, trichothecenes, ergot (No. 105, 1990)Nephrotoxicity associated with exposure to chemicals, principles and methods for the assessment of (No. 119, 1991)Neurotoxicity associated with exposure to chemicals, principles and methods for the assessment of (No. 60, 1986)Nickel (No. 108, 1991)Nitrates, nitrites, and N-nitroso compounds (No. 5, 1978)a
Nitrogen oxides (No. 4, 1977, 1st edition)a
(No. 188, 1997, 2nd edition)2-Nitropropane (No. 138, 1992)Noise (No. 12, 1980)a
Organophosphorus insecticides: a general introduction (No. 63, 1986)Paraquat and diquat (No. 39, 1984)Pentachlorophenol (No. 71, 1987)Permethrin (No. 94, 1990)Pesticide residues in food, principles for the toxicological assessment of (No. 104, 1990)Petroleum products, selected (No. 20, 1982)Phenol (No. 161, 1994)d-Phenothrin (No. 96, 1990)Phosgene (No. 193, 1997)Phosphine and selected metal phosphides (No. 73, 1988)Photochemical oxidants (No. 7, 1978)Platinum (No. 125, 1991)Polybrominated biphenyls (No. 152, 1994)Polybrominated dibenzo-p-dioxins and dibenzofurans (No. 205, 1998)Polychlorinated biphenyls and terphenyls (No. 2, 1976, 1st edition)a
(No. 140, 1992, 2nd edition)Polychlorinated dibenzo-p-dioxins and dibenzofurans (No. 88, 1989)Polycyclic aromatic hydrocarbons, selected non-heterocyclic (No. 202, 1998)Progeny, principles for evaluating health risks associated with exposure to chemicals during pregnancy (No. 30, 1984)1-Propanol (No. 102, 1990)2-Propanol (No. 103, 1990)Propachlor (No. 147, 1993)Propylene oxide (No. 56, 1985)Pyrrolizidine alkaloids (No. 80, 1988)Quintozene (No. 41, 1984)Quality management for chemical safety testing (No. 141, 1992)Radiofrequency and microwaves (No. 16, 1981)Radionuclides, selected (No. 25, 1983)Resmethrins (No. 92, 1989)Synthetic organic fibres, selected (No. 151, 1993)Selenium (No. 58, 1986)

THE ENVIRONMENTAL HEALTH CRITERIA SERIES (continued)
Styrene (No. 26, 1983)Sulfur oxides and suspended particulate matter (No. 8, 1979)Tecnazene (No. 42, 1984)Tetrabromobisphenol A and derivatives (No. 172, 1995)Tetrachloroethylene (No. 31, 1984)Tetradifon (No. 67, 1986)Tetramethrin (No. 98, 1990)Thallium (No. 182, 1996)Thiocarbamate pesticides: a general introduction (No. 76, 1988)Tin and organotin compounds (No. 15, 1980)Titanium (No. 24, 1982)Tobacco use and exposure to other agents, health effects of interactions between (No. 211, 1999)Toluene (No. 52, 1986)Toluene diisocyanates (No. 75, 1987)Toxicity of chemicals (Part 1), principles and methods for evaluating the (No. 6, 1978)Toxicokinetic studies, principles of (No. 57, 1986)Tributyl phosphate (No. 112, 1991)Tributyltin compounds (No. 116, 1990)Trichlorfon (No. 132, 1992)1,1,1-Trichloroethane (No. 136, 1992)Trichloroethylene (No. 50, 1985)Tricresyl phosphate (No. 110, 1990)Triphenyl phosphate (No. 111, 1991)Tris- and bis(2,3-dibromopropyl) phosphate (No. 173, 1995)
Ultrasound (No. 22, 1982)Ultraviolet radiation (No. 14, 1979, 1st edition) (No. 160, 1994, 2nd edition)Vanadium (No. 81, 1988)Vinyl chloride (No. 215, 1999)Vinylidene chloride (No. 100, 1990)White spirit (No. 187, 1996)Xylenes (No. 190, 1997)
THE CONCISE INTERNATIONAL CHEMICAL ASSESSMENT DOCUMENT SERIES
CICADs are IPCS risk assessment documents that provide concise but critical summaries ofthe relevant scientific information concerning the potential effects of chemicals upon humanhealth and/or the environment.
Azodicarbonamide (No. 16, 1999)Benzyl butyl phthalate (No. 17, 1999)Biphenyl (No. 6, 1999)2-Butoxyethanol (No. 10, 1998)1,2-Diaminoethane (No. 15, 1999)3,3'-Dichlorobenzidine (No. 2, 1998)1,2-Dichloroethane (No. 1, 1998)Ethylenediamine (No. 15, 1999)Limonene (No. 5, 1998)Manganese and its compounds (No. 12,1999)
Methyl methacrylate (No. 4, 1998)N-Phenyl-1-naphthylamine (No. 9,1998)1,1,2,2-Tetrachloroethane (No. 3,1998)1,1,2,2-Tetrafluoroethane (No. 11,1999)o-Toluidine (No. 7, 1998)Tributylin oxide (No. 14, 1999)Triglycidyl isocyanurate (No. 8,1998)Triphenyltin compounds (No. 13,1999)
To obtain further copies of monographs in this series, please contact Marketing andDissemination, World Health Organization, 1211 Geneva 27, Switzerland (Fax: +41-22-7914857; E-mail: [email protected])

Price: Sw.fr. 96.- ISBN 92 4 157213 2Price in developing countries: Sw.fr. 67.20