Embed Size (px)
Citation preview

Caring for Paid Professional Caregivers: Investigating the Heath Status of Long-Term Care and Assisted Living
Facilities Workers in Alberta
PHASE 2
Study Report from the Five Alberta Health Services Zone, 2017-2019
SPONSORED by The Covenant Health Research Grant, University of Lethbridge Research Fund & Faculty of Health Sciences Research Support Fund.

ii
Table of Contents
Table of Contents .................................................................................................................................... ii
List of Tables .......................................................................................................................................... iv
List of Figures ......................................................................................................................................... vi
List of Acronyms .................................................................................................................................... vii
Team Members .................................................................................................................................... viii
Partners ............................................................................................................................................... viii
Acknowledgements .............................................................................................................................. viii
Ethics Approval..................................................................................................................................... viii
Executive Summary ................................................................................................................................. 1
Introduction ............................................................................................................................................ 3
Methods ................................................................................................................................................. 4
Results .................................................................................................................................................... 6
Demographic Characteristics of Participants ............................................................................................ 6
Physical Health ................................................................................................................................... 11
Health Conditions ............................................................................................................................... 12
Mental and Emotional Health .............................................................................................................. 14
Stress ................................................................................................................................................ 17
Quality of Life..................................................................................................................................... 18
Health Behavior ................................................................................................................................. 19
Absenteeism or Turnover ..................................................................................................................... 21
Regression Models, Correlations, Reliability ............................................................................................. 22
Regression Models .............................................................................................................................. 22
Correlational Statistics ........................................................................................................................ 24
Test of Reliability ................................................................................................................................ 25
Qualitative Analyses of Open-ended and Interview Questions ................................................................... 26
Limitations ............................................................................................................................................ 29

iii
Conclusions ........................................................................................................................................... 29
Recommendations ................................................................................................................................. 30
Appreciation ......................................................................................................................................... 31
References ............................................................................................................................................ 32
Appendices ........................................................................................................................................... 35
Appendix A ........................................................................................................................................ 35
Appendix B ........................................................................................................................................ 37
Appendix B1 ....................................................................................................................................... 38
Appendix B2 ....................................................................................................................................... 40
Appendix B3 ....................................................................................................................................... 40
Appendix B4 ....................................................................................................................................... 42
Appendix C ........................................................................................................................................ 42
Appendix D ........................................................................................................................................ 44
Appendix D1 ...................................................................................................................................... 44
Appendix E ......................................................................................................................................... 46
Appendix E1 ....................................................................................................................................... 49
Appendix F ......................................................................................................................................... 54
iv
List of Tables
Table 1 Participant Age and Gender ........................................................................................................... 6
Table 2 Participant Types of Shifts Worked and Hours Worked per Week ...................................................... 7
Table 3 Participant Nature of Appointment and Designation ........................................................................ 8
Table 4 Participant Years of Experience in LTC/AL and Highest Educational Attainment ................................... 9
Table 5 Descriptive Statistics ................................................................................................................... 11
Table 6 Physical Health of Caregivers ....................................................................................................... 12
Table 7 Health Conditions ....................................................................................................................... 13
Table 8 Mental and Emotional Health of Caregivers ................................................................................... 15
Table 9 Mental and Emotional Health of Caregivers ................................................................................... 16
Table 10 Evaluation of the Stress Levels of Caregivers ................................................................................ 18
Table 11 Assessing the Quality of Life of Caregivers ................................................................................... 19
Table 12 Health Behavior of Caregivers .................................................................................................... 20
Table 13 Absenteeism and Turnover ........................................................................................................ 22
Table 14 Regression Models .................................................................................................................... 23
Table 15 Correlations ............................................................................................................................. 25
Table 16 Test of Reliability ...................................................................................................................... 25
Table 17 Reliability (Reduced Version) ...................................................................................................... 26
Table 18 Rotated Factor Matrix ............................................................................................................... 35
Table 19a Total Variance Explained ......................................................................................................... 37
Table 19b (Reduced) Rotated Factor Matrix .............................................................................................. 38
Table 19c Total Variance Explained .......................................................................................................... 40
Table 19d (Reduced) Rotated Factor Matrix .............................................................................................. 40
Table 19e Total Variance Explained ......................................................................................................... 42

v
Table 20a Rotated Factor Matrix ............................................................................................................. 42
Table 20b Total Variance Explained ......................................................................................................... 43
Table 21 Codes, sub-codes from participant responses to the open-ended and interview questions ............... 46
Table 22 Sample Representation (Distribution) .......................................................................................... 54
Table 23 Location of Study Coverage ........................................................................................................ 54

vi
List of Figures
Figure 1: Participant Alberta Health Services Zone and Designation ......................................................................... 9
Figure 2: Participant Type of Appointment and Shifts worked ...............................................................................10
Figure 3: Four Factors Analysis .................................................................................................................................44
Figure 4: Five Factors Analysis ..................................................................................................................................45
Figure 5a: Themes and subthemes from participant interview and open-ended responses ..................................49
Figure 5b: Themes and subthemes from participant interview and open-ended responses ..................................50
Figure 6: Word cloud formed from the “Management attitudes towards caregivers” theme ................................51
Figure 7: Word cloud formed from the “Appropriate compensation, support, and incentives” theme .................51
Figure 8: Word cloud formed from the “Suggestions to improve caregiver work quality” theme ..........................52
Figure 9: Word cloud formed from the “Promoting healthy behaviours” theme ...................................................52
Figure 10: Clustered word frequencies from participant responses to open-ended and interview questions .......53

vii
List of Acronyms
AMOS Analysis of Moment Structures
CFI Comparative Fit Index
CHA Canadian Healthcare Association
GRA Graduate Research Assistant
LTC Long Term Care
AL Assisted Living
RMSEA Root-Mean-Square Error of Approximation
SPSS Statistical Package for Social Sciences

viii
Team Members
Olu Awosoga, PhD, MBA Faculty of Health Sciences (General), University of Lethbridge
Jon Doan, PhD, P.ENG Faculty of Art & Sciences (Kinesiology and Physical Education), University of Lethbridge
Claudia Steinke, PhD, RN Faculty of Health Sciences (Nursing), University of Lethbridge
Tolulope Sajobi, PhD Department of Community Health Sciences, University of Calgary
Sheli Murphy, PhD, RN Senior Operating Officer, Rural Health, Professional Practice, Research and Libraries, Covenant Health
Scott Baerg, MBA, BN Senior Operating Officer, Addiction and Mental Health &
Continuing Care, Covenant Health
Remi Bolarinwa, MLT, MSc. Site Administrator, Covenant Health – St Therese Villa, Lethbridge
Christina Nord, MS, PhD(c) Evolution and Behaviour, University of Lethbridge (GRA)
Stephanie Varsanyi, BSc, MS(c) Evolution and Behaviour, University of Lethbridge (GRA)
Benjamin Dosu, MA, PhD(c) Biosystems and Biodiversity, University of Lethbridge (Former GRA)
Annita Lucchesi, MA, PhD(c) CSPT, University of Lethbridge (Former GRA)
Partners
Alberta Health Services
Covenant Health & Covenant Care
Acknowledgements
Covenant Health Research Grant, Alberta Health Services
University of Lethbridge Research Fund
Faculty of Health Sciences Research Support Fund
Ethics Approval
Human Subject Research Ethical Review and approval was obtained from the Health Research Ethic Board
of Alberta (Study #1913, REB # Pro00072081, RA83256) via the University of Lethbridge and the University
of Alberta Research Committees.

1
Executive Summary
By 2030, just ten years from now, Canada’s aging population (aged 65 and over) is projected to total over
9.5 million people and represent 23% of all Canadians, an almost doubling since 2010 (Stats Canada, 2014). As the
aging population grows, so too do the needs of aging peoples and the challenges faced by their caregivers.
Research in diverse disciplines agrees on the importance of supporting employees to be effective in their jobs in
ways that promote, not compromise, their own health. Patient’s experience can be strengthened and expanded
when their caregivers are consistent, healthy, and well. It is also important to individualize health care not only
for recipients, but also for caregivers, including communication and collaboration (Kemp, Ball, & Perkins, 2019).
For example, it is important to consider the biopsychosocial demands and work-health issues of a job we may not
usually think of as ‘heavy’ or ‘physically demanding,’ such as caregiving.
This is a report on the health status of paid professional caregivers in long-term care (LTC) and Assisted
Living (AL) Facilities that was carried out in Alberta Province between June 2017 and October 2019. Thirty-Nine
LTC & AL Facilities (Table 21) participated in this study. This study adopted a questionnaire designed by Health
Canada titled “Workplace Health and Risks Survey 2008” in addition to other survey questionnaires on Wellness
and Quality of Life. Data collected from this survey instrument covered the following sections: Physical Health
(PH); Health Condition (HC); Mental and Emotional Health (MEH); Stress; Quality of Life (QOL); Health Behaviour
(HB); Turnover and Absenteeism (T&A); demographic information; and how your employer can help. Of the 1,385
questionnaires sent out to LTC & AL Facilities in Alberta Health Services Zones, 933 surveys (67.4%) were returned
with completed responses. Participants received a $5 gift card as honorarium. A proposed face-to-face qualitative
interview aspect of this study was substituted with an email communication due to time constraints as voices of
potential participants was not as strong as earlier indicated.
The sample was made up of Health Professionals (Registered Nurses (RN) 13.2%, Licensed Practical Nurses
(LPN) 12.4%, Health Care Aids (HCA) 58.1%, and Allied Health Workers (16.3%) working in continuing care facilities
across the Alberta province. Most of the participants fell within the age of 35+ years of age (73.6%) and a
significant number of participants were (48.7%) above 45 years of age. Most participants mostly worked a
combination of day, evening, and night shifts (59.3%), while only 32% worked regular day shifts. In addition, 67.3%
worked on average20-40 hours per week, while 22.4% worked between 41-60 hours per week. A majority (77.4%)
of the caregivers reported that their health was in good condition, 68.1% reported being satisfied with their overall
health conditions, and11.8% of the respondents claimed otherwise.

2
Correlation results showed that there was a strong association between the physical health of caregivers
and the following variables: health condition, mental and emotional health, and quality of life. The results also
indicated a moderate relationship between physical health and measures of stress level, health behaviour, and
turnover/absenteeism. We found that the health condition of caregivers was related to mental health and
emotional health, quality of life, stress level, health behaviour, and turnover/absenteeism. Additionally, our
analysis also revealed that LTC/AL facility managers are aware of the impact of stress on employees’ health and
are focused on ensuring that stress level is kept at minimum or controlled. This indicates that administrative
managers have vested interest in the wellbeing of their workers.
Additionally, we found a strong association between stress level, quality of life, health behaviour,
turnover/absenteeism and mental & emotional health of an average caregiver working in LTC/AL facilities in
Alberta. We also found a direct link between stress and turnover/absenteeism among caregivers in LTC/AL
facilities. Finally, our analysis indicated a moderate relationship between quality of life and health behaviour.
Result from the factor analysis revealed that 49.3% of the total variance was explained with a four factor
model which encompassed the domains of emotional health (8 items), mental health (2 items), quality of life (3
items), and work fulfilment (9 items). A confirmatory factor analysis (CFA) revealed a 4-factor structure with fairly
good fit statistics (Root Mean Square Error of Approximation = 0.08, Comparative Fit Index = 0.89). This new
measure demonstrated good internal consistency with Cronbach’s alpha values ranged between 0.77 and 0.93.
To reduce physical stress, caregivers require improved work schedules (reduced workloads and consistent
shifts) and the availability of wellness programs such as a fitness room within each LTC/AL facility. In addition,
employers can play a major role in ensuring the physical, emotional, and mental health of their caregiving
employees by employing managers that have health education and who can complement staff on a job well done,
providing logistical support to staff, regular on-the-job training/frequent workers’ education, having the
availability of the right equipment, respecting workers, showing appreciation for caregivers, and protecting
caregivers from physical and verbal abuse by residents and their family members. These are some suggestions
highlighted by respondents that may help to provide a better work environment for staff, hence better quality of
care provided to residents in the facilities.
Our goal is to inform policy makers on the invaluable contributions paid professional caregivers in LTC/AL,
and to add to the overall realization of set goals for Health of Albertans in Canada.

3
Introduction
There is a growing need for long-term care in Canada, including the services of long term care (LTC) and
assisted living (AL) Facilities (Government of Canada—Action for Seniors Report, 2019). Here, we define long-
term care (LTC) facilities as any facility providing living accommodations for individuals requiring round-the-clock
supervised care,, including both professional and paraprofessional health services, as well as personal care and
services within a more hospital-like model (Canadian Healthcare Association [CHA], 2009; Health Canada, 2013;
Government of Alberta, 2010).
Despite the myriad of initiatives begun in Canada to address the growing need to take care of the
increasing aging population, the needs of LTC and AL employees are rarely addressed in these initiative. For
example, Canada’s “Action for Seniors” report does not discuss how to address the growing need for LTC/AL
facilities, nor how they will be adequately staffed (Government of Canada—Action for Seniors Report, 2019). The
National Seniors Strategy, a call for collaboration between government and private care to address the growing
needs of the senior population, doesn’t mention any of the problems associated with retaining qualified LTC and
AL providers despite a large discussion surrounding the needs and support for unpaid caregivers (Sinha et al.,
2016).
There are numerous challenges facing LTC and AL facilities in Canada, and these challenges often relate
to the labor needs of LTC and AL facilities and quality of care the can provide (Armstrong, 2009; CHA, 2009; CUPE,
2009). LTC/AL facilities are plagued by high turnover rates, stemming from problematic management styles,
organizational policies, as well as personal factors, including personal health distress (Matthews, Carsten, Ayers,
& Menachemi, 2018; CIHI, 2011; Larrabee et al., 2003). For example, AL caregivers earn low wages, face
emotionally as well as physically demanding work, and have high turnover rates (Chou, 2012). Caregiving is a very
demanding career, and understanding these demands has the potential to illuminate strategies to increase the
quality of care clients receive. While management styles and organizational policies have received much attention
in the literature, more research is need to understand the kinds of biopsychosocial demands placed on workers.
For example, in 2011, 32% of caregivers who provided more than 21 hours of care per week reported personal
health distress as a direct result of their caregiving role (CIHI, 2011).
Research in diverse disciplines agrees on the importance of supporting employees to be effective in their
jobs in ways that promote, not compromise, their health (Andersen, Vinstrup, Villadsen, Jay, & Jakobsen, 2019;
Andersen, Villadsen, & Clausen, 2019; Januario et al., 2019). Patient’s experience can be strengthened and
expanded when their caregivers are consistent, healthy, and well. It is also important to consider the
biopsychosocial demands and work-health issues in a job we may not usually think of as ‘heavy’ or ‘physically

4
demanding.’ There is also a strong association between the quality of care caregivers provide and their quality of
life in LTC (Desimini, 2010). For example, quality of care has been found to associate with regular communication
with managers for nurses in AL facilities, including meetings and feedback in order to avoid high turnover
(Simmons, Coelho, Sandler, & Schnelle, 2018).
Based on evidence of high level of absence relating to the state of health of the health care workers in
LTC/AL, it is important that we broaden our knowledge about what factors in the LTC/AL work environment
contribute to this. Phase I and II of this research study explored the health status and quality of life of LTC/AL
workers in Alberta Province. We found a strong association between staffing and quality of care and quality of life
in LTC/AL (Desimini, 2010). We therefore identify and provide recommendations to stakeholders and policy
makers on factors that may improve quality of care provided to residents, and reduce absenteeism and turnover
in continuing care settings in Alberta Province. Doing so achieves our immediate goal of providing that same
audience with evidence-based information relating to the health status of caregivers in Alberta, Canada.
Research Questions
This research answered the following questions:
1. What factors influence caregivers’ health status, quality of life, and dedication to quality care in
continuing care settings in Alberta?
2. What are the feasible and relevant strategies that might improve caregivers’ state of health, quality
of life, retention rate and reduce absenteeism in continuing care centres in Alberta?
Methods
After obtaining an ethics approval from the Human Subject Research Ethical Review and from the Health
Research Ethic Board of Alberta (Study #1913, REB # Pro00072081, RA83256) via the University of Lethbridge and
the University of Alberta Research Committees, the Principal Investigator (PI) held a web meeting with co-
researchers to map out the plan for data collection. The PI contacted the Alberta Health Services Research
Committee for approval of the list of continuing care centres identified as targets for the study across Alberta.
The PI contacted the sites’ administrator(s) and scheduled meetings in order to present oral presentations
on the purpose/significance of the research project concerning how the research may affect their workplace.
Researchers also distributed flyers/posters/letters of invitation to participate in the research exercise and
recruitment ensued. In trying to save cost and to minimize traveling, we adopted telephone and email
communications for further conversations when clarification was needed. Questionnaires were

5
printed/reproduced and copies dropped off at each Centre (in a sealed envelope with a return envelope) for the
participants during our visit. The PI and the Graduate Research Assistant (GRA) administered the questionnaire to
1,385+ caregivers over an 8-month period. Prior to the collection of any data from participants, they were given
opportunity to review the consent form for the appropriate phase and to ask researchers questions. A well-
secured survey collection box was left onsite (inside the staff lounge) to maintain confidentiality of respondents
and surveys were picked up every two months during a six month study period by research assistants, and a
reminder letter was distributed during every follow-up visit/call. Participants were compensated with a $5 gift
card (attached to each anonymous survey) for completing survey questionnaire.
The information on the survey were entered into a Statistical Package for Social Sciences (SPSS) software
(version 24). We computed the reliability and consistency of the survey instrument using Cronbach alpha based
on the loading of questions via exploratory and confirmatory factor analysis technique. In-depth descriptive
statistics combined with other univariate and multivariate statistics were adopted for data analysis. Appropriate
parametric or non-parametric methods were used for the data analysis. Correlational statistics and regression
models were completed on the data. The research obtained new psychometrics for this survey through
exploratory factor analysis (Maximum Likelihood with Varimax-orthogonal rotation) procedure and confirmatory
factor analysis (structural equation modeling using Analysis of Moment Structures (AMOS) was used to complete
a path analysis of the dataset and to test the model). Maximum likelihood estimation procedures were used to
estimate the coefficients. How well the model fit the data were assessed using a Chi-square goodness of fit test
as well as the comparative fit index (CFI) and the root-mean-square error of approximation (RMSEA). Validity and
reliability of the survey were completed through the use of Cronbach alpha and Intraclass correlational statistics.
Descriptive analyses of the socio-demographic, health and work variables were undertaken using multivariate
logistic regression for adjustment of association that may exist, in accordance with potential confounding variables
with a 5% level of significance. The measurement of association used was odds ratio and confidence intervals of
95%. Homogeneity of the distribution of the proportions of the co-variables were analyzed using the Chi-Square
test. Study variables include self-rated health (obtained from questions under physical health, health condition,
mental and emotional health), Stress, quality of life, health behaviour, turnover and absenteeism. The co-variables
were selected for the study based on literature concerning possible association between our variables of interest
taking into account potential confounding factors.
Discussions and suggestions provided useful implications for Caregivers in LTC/AL facilities across the five
Alberta Health Services zones in the province of Alberta, operators and policy makers. Qualitative analyses of
interviews and open-ended questions were conducted in Nvivo 11 and 12.

6
Results
Demographic Characteristics of Participants
Key demographic characteristics of the respondents in our sample are identified in this section. Issues
such as age, gender, educational levels, and English as a first language are discussed. This section also describes
participant years of experience in LTC/AL, and the conditions of employment (whether they were employed for
part- or full-time, and the shifts the worked).
Age and Gender of Participants
The ages and gender of participants are presented in Table 1. Most of the participants fell within the age
of 35+ years (73.6%) and a significant number of participants (48.7%) above 45 years. This implies that there will
be inadequate supply of staff for LTC/AL facilities within the next 15 to 20 years should those aged 45+ years
decide to retire at the at the age of 65. With the number of seniors likely to double in Alberta within the same
period, this will compound the problem of the staffing shortage in LTC/AL services (AHS, June 2015). There is the
need to put in place measures that will ensure the supply of qualified staff to offset the anticipated potential staff
deficit. Table 1 also shows a female dominance (90.7%) within the staff of LTC/AL facilities. This finding confirms
that of Hussein (2017) which reveals the work of the long-term caregivers is considered highly feminine.
Table 1
Participant Age and Gender
a. Ages
Age Group Frequency Percentage
18-25 74 8.1
26-34 168 18.3
35-44 228 24.9
45-54 224 24.4
55 223 24.3
Total 917 100

7
b. Gender
Gender Frequency Percentage
Male 83 9.0
Female 833 90.7
Non-Binary 1 0.1
Unsure 1 0.1
Total 918 100
Source: Field Survey (2019)
Other Demographic Variables
In Table 2, we highlight the types of shift worked and hours worked per week by our participants; 59.3%
of the workers were involved in all-round shifts (working day, evening, and night shifts), while only 32% worked
only day shifts. In addition, 67.3% worked between 20-40 hours per week, while 22.4% of the participants worked
between 41-60 hours per week. Table 3 and Table 4 highlight the nature of appointment and designation of the
participants, and the length of time worked in an LTC/AL facility and highest education attainment of the
participants, respectively. A majority (72.5%) of the respondents confirmed English as their first language.
Table 2
Participant Types of Shifts Worked and Hours Worked per Week
a. Type of shifts worked
Type of Shift Frequency Percentage
Day 293 32.0
Evening 49 5.3
Night 29 3.2
Unsure 2 0.2
Day/Evening/Night 544 59.3
Total 917 100

8
b. Hours worked per week
Hours Worked Frequency Percentage
< 20 hours 62 6.8
20-40 hours 615 67.3
41-60 hours 205 22.4
> 60 hours 32 3.5
Total 914 100
Source: Field Survey (2019)
Table 3
Participant Nature of Appointment and Designation
a. Nature of Appointment
Appointment Frequency Percentage
Full-time 328 35.4
Part-time 494 53.3
Casual 101 10.9
Unsure 4 0.4
Total 927 100
b. Designation
Designation Frequency Percentage
RN 121 13.2
LPN 114 12.4
HCA 534 58.1
Allied Staff 150 16.3
Total 919 100
Source: Field Survey (2019)

9
a) b)
Figure 1: Participant a) Alberta Health Services Zone and b) Designation
Source: Field Survey (2019)
Table 4
Participant Years of Experience in LTC/AL and Highest Educational Attainment
a. Length of time worked in LTC/AL
Years of Experience Frequency Percentage
0-2 years 129 14.1
2-5 years 201 22.0
5-10 years 218 23.9
10-20 years 218 23.9
20+ years 148 16.2
Total 914 100
b. Highest educational attainment
Education Frequency Percentage
Less than High School Diploma 27 3.0
High school diploma 161 17.6
College Diploma 421 46.1
Bachelor/Graduate Degree 252 27.6
Others 52 5.7
Total 913 100
Source: Field Survey (2019)
10
a)
b)
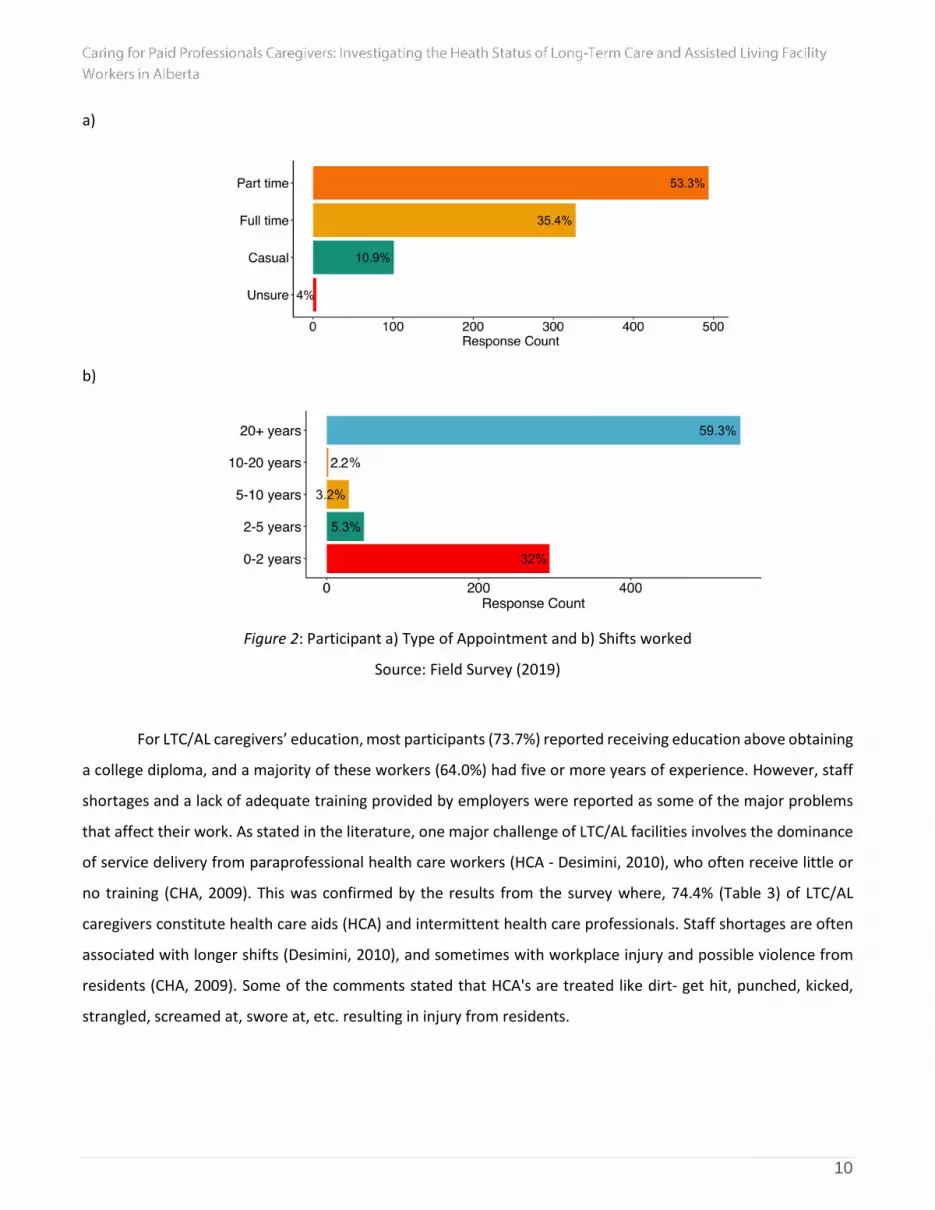
Figure 2: Participant a) Type of Appointment and b) Shifts worked
Source: Field Survey (2019)
For LTC/AL caregivers’ education, most participants (73.7%) reported receiving education above obtaining
a college diploma, and a majority of these workers (64.0%) had five or more years of experience. However, staff
shortages and a lack of adequate training provided by employers were reported as some of the major problems
that affect their work. As stated in the literature, one major challenge of LTC/AL facilities involves the dominance
of service delivery from paraprofessional health care workers (HCA - Desimini, 2010), who often receive little or
no training (CHA, 2009). This was confirmed by the results from the survey where, 74.4% (Table 3) of LTC/AL
caregivers constitute health care aids (HCA) and intermittent health care professionals. Staff shortages are often
associated with longer shifts (Desimini, 2010), and sometimes with workplace injury and possible violence from
residents (CHA, 2009). Some of the comments stated that HCA's are treated like dirt- get hit, punched, kicked,
strangled, screamed at, swore at, etc. resulting in injury from residents.

11
According to the respondents, filling the gaps associated with the staff shortage will not only make their
work easier but also increase the efficiency of care delivery at the workplace (Appendix 1 - AHS, June 2019).
Specifically, some of the respondents indicated that addressing the staffing shortage can result in:
A reduced shift day per week. Some (19%) of the workers reported to have a six to seven day shift per
week; having a five working days shift with two off days was suggested,
An increase in the number of staff per shift, which can give room for breaks during shift hours;
Effectively addressing the individual needs of residence of LTC/AL facilities (in terms of needed supply
from family members); and
A reduced workload per shift (e.g., Have more volunteers come in to do activities with staff and
residents, more casual workers to assist with assignments during shift).
Table 5
Descriptive Statistics
Variable Mean Std. Deviation Sample Size (n)
Physical Health 3.573 0.680 933
Health Condition 3.923 0.547 933
Mental & Emotional Health 3.563 0.580 933
Stress Level 3.781 0.662 933
Quality of Life 3.922 0.654 933
Health Behaviour 3.297 0.582 933
Turnover and Absenteeism 4.348 0.810 933
Note: Mean Score Rating is out of 5 Source: Authors’ Construct (2019)
Physical Health
Physical health describes the physical health conditions of the LTC/AL givers. Responses from the
caregivers are shown in Table 6. On average, 924 responded of 933 provided answers to the questions that were
posed. From the responses in the table, it can be deduced that majority of the caregivers are in good condition
(77.4%). These include 28.6% in a very good condition and 48.8% in good condition. Only 2.0 and 0.3% mentioned
that have been in a poor and very poor physical condition respectively as compared with the people of their age.
In addition, 77.1% of the caregivers are satisfied with their overall health conditions as compare to 11.8% of the
respondents that are not.

12
Table 6
Physical Health of Caregivers
Statement Very Good (%) Good (%) Moderate
(%) Poor (%)
Very Poor (%)
In comparison with people of your age, how would you rate your own state of health? (n = 868)
248 (28.6) 424 (48.8) 176 (20.3) 17 (2.0) 3 (0.3)
Statement Strongly Agree
(%) Agree (%) Neutral (%)
Disagree (%)
Strongly Disagree (%)
I feel I have a lot of energy (n = 927) 162 (17.5) 390 (42.1) 252 (27.2) 108 (11.7) 15 (1.6)
I am free of chronic disease (n = 924) 378 (40.9) 300 (32.5) 86 (9.3) 114 (12.3) 46 (5.0)
I expect my health to get better (n = 910)
152 (16.7) 377 (41.4) 280 (30.8) 81 (8.9) 20 (2.2)
I am healthy as anybody I know (n = 929)
179 (19.3) 414 (44.6) 209 (22.5) 110 (11.8) 17 (1.8)
I seem to get sick a little easier than other people (n = 916)
29 (3.2) 97 (10.6) 159 (17.4) 429 (46.8) 202 (22.1)
I am free of any physical pain (n = 922)
107 (11.6) 201 (21.8) 208 (22.6) 279 (30.3) 127 (13.8)
I feel good about my physical appearance (n = 928)
150 (16.2) 386 (41.6) 232 (25.0) 126 (13.6) 34 (3.7)
I feel my physical health limits me in my work (n = 918)
48 (5.2) 131 (14.3) 157 (17.1) 356 (38.8) 226 (24.6)
Overall, I am satisfied with my health (n = 924)
200 (21.6) 420 (45.5) 195 (21.1) 93 (10.1) 16 (1.7)
Source: Field Survey (2019)
Health Conditions
In this section, we assessed the overall health conditions of the caregivers. Respondents were asked on
the incidence of body pains, colds/flus, fatigue or low energy, allergies, presence of sores and skin diseases.
Between 922 and 930 caregivers responded to the questions which sought to find out about their health
conditions. Majority of the caregivers mentioned having at least one of the following health conditions. This could
occur sometimes, regularly and persistently.

13
• 78.0% of respondents reported having the presence of neck/back ache. This includes 44.7% of those
who sometimes have such pains; 24.7% of those who have it regularly and 8.6% of those with
persistent neck/back ache.
• 63.3% of respondents reported experiencing at least sore arms/legs; and
• 68.1% of respondents reported incidence of fatigue or low energy.
According to the respondents, to ensure that caregivers continue to have good physical health free from
pain, stiffness, fatigue, or the incidence of accidents, there are certain factors that can contribute significantly to
achieving this. These include the provision of:
• A fitness room or gym in the work environment;
• Accessories such as laundry baskets with wheels to reduce weight lifting;
• A safe working environment which enhances easy accessibility and reduce the incidence of tripping
and accidents; and
• Support employees in participating in community fitness programs.
Table 7
Health Conditions
Statement Never (%) Infrequently (%) Sometimes (%) Regular/ Often (%)
Persistent (%)
Presence of neck /back ache (n = 930)
68 (7.3) 136 (14.6) 416 (44.7) 230 (24.7) 80 (8.6)
Presence of sore arms/legs (n = 930)
127 (13.7) 215 (23.0) 366 (39.4) 172 (18.5) 50 (5.4)
Presence of chest pain (n = 925)
654 (70.7) 165 (17.8) 90 (9.7) 12 (1.3) 4 (0.4)
Feeling of tension, stiffness, or lack of flexibility in your spine (n = 926)
226 (24.4) 176 (19.0) 306 (33.0) 162 (17.5) 56 (6.0)
Incidence of fatigue or low energy (n = 923)
78 (8.5) 217 (23.5) 415 (45.0) 169 (18.3) 44 (4.8)
Incidence of colds/flu or cough (n = 928)
91 (9.8) 467 (50.3) 325 (35.0) 39 (4.2) 6 (0.6)
Incidence of headaches (n = 920)
116 (12.6) 281 (30.5) 357 (38.8) 118 (12.8) 48 (5.2)

14
Incidence of breathless with slight exertion (n = 922)
467 (50.7) 269 (29.2) 147 (15.9) 33 (3.6) 6 (0.7)
Incidence of allergies or eczema or skin rash (n = 926)
481 (51.9) 166 (17.9) 160 (17.3) 73 (7.9) 46 (5.0)
Incidence of dizziness or light-headedness (n = 929)
351 (37.8) 292 (31.4) 234 (25.2) 44 (4.7) 8 (0.9)
Incidence of accidents or near accidents or falling or tripping (n = 925)
68 (7.3) 136 (14.6) 416 (44.7) 230 (24.7) 80 (8.6)
Incidence of nausea or abdominal discomfort (n = 927)
127 (13.7) 215 (23.0) 366 (39.4) 172 (18.5) 50 (5.4)
Presence of asthma (n = 926)
654 (70.7) 165 (17.8) 90 (9.7) 12 (1.3) 4 (0.4)
Presence of hypertension (n = 926)
226 (24.4) 176 (19.0) 306 (33.0) 162 (17.5) 56 (6.0)
Presence of diabetes (n = 926)
78 (8.5) 217 (23.5) 415 (45.0) 169 (18.3) 44 (4.8)
Presence of heart disease (n = 925)
91 (9.8) 467 (50.3) 325 (35.0) 39 (4.2) 6 (0.6)
Source: Field Survey (2019)
Mental and Emotional Health
Caregivers sometimes experience mental and emotional health issues. By responding to the statements
given in Table 8 and 9, caregivers provided their agreement or disagreement with regards to having experienced
any of the mental and emotional indicators. The following provide the significant responses from the caregivers:
• At least 73.4% respondents reported having high self-esteem or feeling happy with themselves and
therefore considering themselves as happy people;
• 70.5% of the respondents reported feeling excited to be alive when they wake up in the morning;
• 78.3% of the respondents at least agreed having a good level of motivation;
• 79.0% caregivers find enjoyment and fulfillment in their work with 91.5% of them also feeling
compassion for their work;
• 59.7% respondents are in agreement with having a good sleep free of disturbing dreams; and

15
• 71.9% of the sampled caregivers reported feeling safe and secure at work with 81.3% of them having a
sense of belongingness in their work place.
In addition to these positive responses from the caregivers, the majority of the caregivers
disagreed with having experienced the following mental and emotional health issues in the last six
months.
• 58.6% of the respondents reported not feeling depressed or sad much of the time with only 21.3%
experiencing vague fears or anxiety within the specified period;
• At least 64.7% of the sampled caregivers disagreed having difficulty thinking, concentrating or being
decisive; and
• 66.0% of the respondents reported not experiencing recurring thoughts or dreams.
Table 8
Mental and Emotional Health of Caregivers
Statement Strongly
Agree (%) Agree (%) Neutral (%)
Disagree (%)
Strongly Disagree
(%)
I have high self-esteem/feel happy with myself, I am a happy person (n = 932)
224 (24.0) 460 (49.4) 193 (20.7) 43 (4.6) 12 (1.3)
I am comfortable with ‘negative’ emotions (sadness, guilt, anger, envy) (n = 922) 84 (9.1) 404 (43.8) 267 (29.0) 129 (14.0) 38 (4.1)
I feel excited to be alive when I wake up in the morning (n = 930)
258 (27.7) 398 (42.8) 223 (24.0) 45 (4.8) 6 (0.6)
I have a good level of motivation (n = 930) 236 (25.4) 492 (52.9) 166 (17.8) 34 (3.7) 2 (0.2)
I find enjoyment and fulfillment in my work (n = 927)
272 (29.3) 461 (49.7) 144 (15.5) 35 (3.8) 15 (1.6)
My sleep is free of bad/disturbing dreams (n = 923)
195 (21.1) 356 (38.6) 199 (21.6) 140 (15.2) 33 (3.6)
I feel compassion for my work (n = 926) 426 (46.0) 421 (45.5) 63 (6.8) 12 (1.3) 4 (0.4)

16
I feel a sense of belonging with where I am (n = 921) 303 (32.9) 446 (48.4) 125 (13.6) 36 (3.9) 11 (1.2)
I feel safe and secure at work (n = 929) 270 (29.1) 398 (42.8) 170 (18.3) 69 (7.4) 22 (2.4)
I feel confident with actions I do at work to address my complaints and concerns (n = 925)
219 (23.7) 415 (44.9) 187 (20.2) 78 (8.4) 26 (2.8)
I would recommend working at LTC to others (n = 919) 200 (21.8) 403 (43.9) 217 (23.6) 65 (7.1) 34 (3.7)
I am free of stress (n = 925) 60 (6.5) 139 (15.0) 254 (27.5) 330 (35.7) 142 (15.4)
I am able to handle fear and anxiety (n = 927) 140 (15.1) 482 (52.0) 215 (23.2) 70 (7.6) 20 (2.2)
I feel I am calm and filled with inner peace, tranquility, and peace of mind (n = 929)
135 (14.5) 362 (39.0) 291 (31.3) 112 (12.1) 29 (3.1)
Source: Field Survey (2019)
Table 9
Mental and Emotional Health of Caregivers
Think about the last six months and answer the following questions:
Strongly Agree (%)
Agree (%) Neutral (%) Disagree
(%)
Strongly Disagree
(%)
I felt depressed or sad much of the time in last six months (n = 932)
37 (4.0) 160 (17.2) 189 (20.3) 356 (38.2) 190 (20.4)
I have negative or critical feelings about myself (n = 929)
22 (2.4) 164 (17.7) 198 (21.3) 364 (39.2) 181 (19.5)
In the last six months I experience moodiness, temper, or angry outbursts (n = 927)
41 (4.4) 252 (27.2) 174 (18.8) 320 (34.5) 140 (15.1)
In the last six months I experience depression or lack of interest (n = 930)
47 (5.1) 207 (22.3) 158 (17.0) 323 (34.7) 195 (21.0)
I am more worried about small things (n = 929)
28 (3.0) 187 (20.1) 215 (23.1) 354 (38.1) 145 (15.6)

17
I have difficulty thinking, concentrating, or indecisiveness (n = 928)
22 (2.4) 135 (14.5) 171 (18.4) 412 (44.4) 188 (20.3)
I experience vague fears or anxiety (n = 929)
29 (3.1) 169 (18.2) 180 (19.4) 360 (38.8) 191 (20.6)
I am fidgety or restless (n = 927) 21 (2.3) 110 (11.9) 164 (17.7) 412 (44.4) 220 (23.7)
I have difficulty falling or staying asleep (n = 927)
111 (12.0) 215 (23.2) 162 (17.5) 277 (29.9) 162 (17.5)
I experience recurring thoughts or dreams (n = 918)
24 (2.6) 130 (14.2) 158 (17.2) 380 (41.4) 226 (24.6)
I do not have time to do the work that must be done (n = 929)
99 (10.7) 181 (19.5) 183 (19.7) 324 (34.9) 142 (15.3)
I have no control over how I do my work (n = 925)
147 (15.9) 334 (36.1) 149 (16.1) 217 (23.5) 78 (8.4)
I feel depressed at work (n = 926)
20 (2.2) 71 (7.7) 155 (16.7) 418 (45.1) 262 (28.3)
I feel delight when I accomplish something at work (n = 929) 248 (26.7) 478 (51.5) 119 (12.8) 51 (5.5) 33 (3.6)
I feel burned out from my work (n = 928)
96 (10.3) 200 (21.6) 281 (30.3) 244 (26.3) 107 (11.5)
I am mentally healthy (n = 931) 237 (25.5) 395 (42.4) 197 (21.2) 59 (6.3) 43 (4.6)
I am emotionally healthy (n = 931)
219 (23.5) 393 (42.2) 207 (22.2) 73 (7.8) 39 (4.2)
Source: Field Survey (2019)
Stress
Caregivers were asked to evaluate their stress levels in relations to their families, work, relationships,
finances, general status, etc. (Table 10). Majority (over 80%) of the caregivers reported having at least low,
medium, high or very high stress levels with regards to their families (83.2%); work (93.8%); health (77.0%); finance
(84.5%), and copping with daily problems (80.9%). Additionally, only 23.4% of the caregivers reported being
stressed with school; 51.3% reported not having issues with stress in regards to their sex lives.

18
Table 10
Evaluation of the Stress Levels of Caregivers
Evaluate your stress relative to the following with:
None (%) Low (%) Medium
(%) High (%)
Very High (%)
Family (n = 928) 156 (16.8) 404 (43.5) 243 (26.2) 104 (11.2) 21 (2.3)
Work (n = 925) 57 (6.2) 267 (28.9) 354 (38.3) 156 (16.9) 91 (9.8)
Significant relationship/ spouse/ partner (n =916)
315 (34.4) 360 (39.3) 158 (17.2) 58 (6.3) 25 (2.7)
Health (n = 927) 213 (23.0) 421 (45.4) 222 (23.9) 55 (5.9) 16 (1.7)
Finance (n = 924) 143 (15.5) 283 (30.6) 283 (30.6) 131 (14.2) 84 (9.1)
Sex life (n = 916) 470 (51.3) 285 (31.1) 109 (11.9) 33 (3.6) 19 (2.1)
School (n = 897) 687 (76.6) 113 (12.6) 53 (5.9) 30 (3.3) 14 (1.6)
General status (n = 923) 292 (31.6) 402 (43.6) 203 (22.0) 19 (2.1) 7 (0.8)
Emotional status (n = 928)
228 (24.6) 415 (44.7) 226 (24.4) 48 (5.2) 11 (1.2)
Coping with daily problems (n = 931)
178 (19.1) 473 (50.8) 230 (24.7) 38 (4.1) 12 (1.3)
Source: Field Survey (2019)
Quality of Life
Respondents were asked to evaluate the quality of their lives with regards to the checklist as shown in
Table 11.
• 77.0% respondents reported being at least satisfied with their life as a whole with none feeling terrible
about their lives. In addition, 79.8% reported with being satisfied with their personal lives;
• 79.6% respondents reported feeling happy or satisfied with the lives with their significant others,
partners or spouses. Only 9.3% are at least unhappy with their romantic lives;
• On the quality of life with the jobs and its relative issues, 77.7% and 71.5% respectively reported being
at least satisfied with their jobs/the actual work they do and actually accomplishing;
• In terms of health, 68.4% reported feeling good quality lives with their health; and
• 68.7% respondents feeling good quality lives with regards to how they handle problems in their lives.

19
Table 11
Assessing the Quality of Life of Caregivers
Evaluate your feelings relative to the quality of your life with:
Happy Satisfied Mixed Unhappy Terrible
Your personal life (n = 930) 459 (49.4) 283 (30.4) 170 (18.3) 16 (1.7) 2 (0.2)
Your significant other /spouse /partner (n = 881)
503 (57.1) 198 (22.5) 136 (15.4) 29 (3.3) 15 (1.7)
Your romantic life (n = 900) 429 (47.7) 234 (26.0) 154 (17.1) 60 (6.7) 23 (2.6)
Your financial needs (n = 932) 202 (21.7) 334 (35.8) 257 (27.6) 108 (11.6) 31 (3.3)
Your co-workers (n = 929) 203 (21.9) 347 (37.4) 325 (35.0) 39 (4.2) 15 (1.6)
The actual work you do (Your job) (n = 930)
328 (35.3) 392 (42.2) 176 (18.9) 25 (2.7) 9 (1.0)
Your handling of problems in your life (n = 923)
179 (19.4) 455 (49.3) 256 (27.7) 29 (3.1) 4 (0.4)
What you are actually accomplishing (n = 929) 257 (27.7) 407 (43.8) 230 (24.8) 32 (3.4) 3 (0.3)
Your physical appearance (n = 932)
231 (24.8) 368 (39.5) 238 (25.5) 74 (7.9) 21 (2.3)
Your health (n = 929) 268 (28.8) 368 (39.6) 235 (25.3) 49 (5.3) 9 (1.0)
Your life as a whole (n = 931) 342 (36.7) 375 (40.3) 194 (20.8) 19 (2.0) 1 (0.1)
Source: Field Survey (2019)
Health Behavior
In this section, we assessed the health behavior of caregivers with regards to their diets, exercising, medical
reviews, alcohol intake and smoking. The following presents the findings from the respondents as shown on Table
12.
At least 90.5% of the respondents reported having a healthy diet. This includes 37.2% of those who sometimes
have healthy diets; 43.6% of those who regularly have heathy diets, and 9.7% of those who persistently ensure a
healthy diet. In addition, 75.0% of the caregivers at least do follow the Canadian Food Guide (7-10 servings of
vegetables and fruit, 2-3 servings of meat, and 2 servings of milk). For those who reported having a healthy diet:
• 85.7% of the respondents reported at least eating diets high in fibre while 4.5% of the respondents
who are frequently eating fatty foods;

20
• 90.3% of the respondents reported drinking adequate amounts of fluids (1/2 ounce per pound body
weight); and
• 77.8% respondents reported never smoking, and44.8% consuming alcohol
In terms of routine exercising and medical reviews:
• 62.9% of the respondents reported engaging in exercise at least three times a week for at least 20
minutes each time with 35.5% respondents not having enough sleep at night (7-8 hours of sleep).
52.3% responses reported using relaxation techniques;
• Only 19.2% of the respondents reported never or infrequently visiting their doctors for medical
reviews. Also 7.5% and 19.2% respective have never and infrequently examined themselves for
warning signs of cancer (for example, breast testicles); and
• A whopping 97.5% respondents reporting trying to avoid acute health problems (colds, injuries, etc.)
Table 12
Health Behavior of Caregivers
Statement Never Infrequently Sometimes Regular/ Often Persistent
I always eat a diet high in fiber (n = 929)
32 (3.4) 101 (10.9) 388 (41.8) 366 (39.4) 42 (4.5)
I try to avoid eating high fat foods (n = 931)
42 (4.5) 107 (11.5) 419 (45.0) 316 (33.9) 47 (5.0)
I do exercise three times a week for at least 20 minutes each time (n = 932)
94 (10.1) 231 (24.8) 266 (28.5) 198 (21.2) 143 (15.3)
I do examine myself for warning signs of cancer (for example, breast, testicles, skin) (n = 933)
85 (9.1) 161 (17.3) 262 (28.1) 344 (36.9) 81 (8.7)
I drink adequate amounts of fluids (1/2 ounce per pound body weight) (n = 929)
15 (1.6) 75 (8.1) 247 (26.6) 435 (46.8) 157 (16.9)
I follow the Canadian food guide (7-10 servings of vegetables and fruit, 2-3servings of meat, and 2 servings of milk) (n = 930)
68 (7.3) 165 (17.7) 402 (43.2) 246 (26.5) 49 (5.3)
I try to avoid acute health problems (colds, injuries, etc.) (n = 930)
9 (1.0) 27 (2.9) 130 (14.0) 585 (62.9) 179 (19.2)

21
I am at the ideal body weight for someone my height (n = 924)
165 (17.9) 173 (18.7) 196 (21.1) 269 (29.1) 121 (13.1)
I get a good sleep at night (7-8 hours of sleep) (n = 928)
104 (11.2) 186 (20.0) 288 (31.0) 273 (29.4) 77 (8.3)
Overall, I have a healthy diet (n = 922)
21 (2.3) 67 (7.3) 343 (37.2) 402 (43.6) 89 (9.7)
I engage in meditation, contemplation, counseling, journaling, or other activities that help me to explore my thoughts and feelings (n = 924)
279 (30.2) 197 (21.3) 238 (25.8) 165 (17.9) 45 (4.9)
I use relaxation techniques (n = 922)
178 (19.3) 222 (24.1) 308 (33.4) 174 (18.9) 40 (4.3)
I visit my doctor for routine checkup (n = 930)
60 (6.5) 135 (14.5) 240 (25.8) 379 (40.8) 116 (12.5)
I drink alcohol (n = 926) 268 (28.9) 243 (26.2) 292 (31.5) 104 (11.2) 19 (2.1)
I smoke cigarettes (n = 926) 720 (77.8) 37 (4.0) 42 (4.5) 78 (8.4) 49 (5.3)
Statement 1 to 5 6 to 10 11 to 20 21 to 39 40 +
If you are a smoker, indicate number smoked per day (Option (0) = 719, n = 168)
49 (29.2) 52 (30.9) 49 (29.2) 18 (10.7) 0 (0)
Source: Field Survey (2019)
Absenteeism or Turnover
In the last six months, only 16.5% of the respondents absented themselves for six days or more due to ill
health and 5.9% absented due to work-related injuries respectively. At least 46.5% responses indicate at least
considering quitting the job or leaving the profession, and51.1% reported having contemplated on changing their
employment or work environment.
22
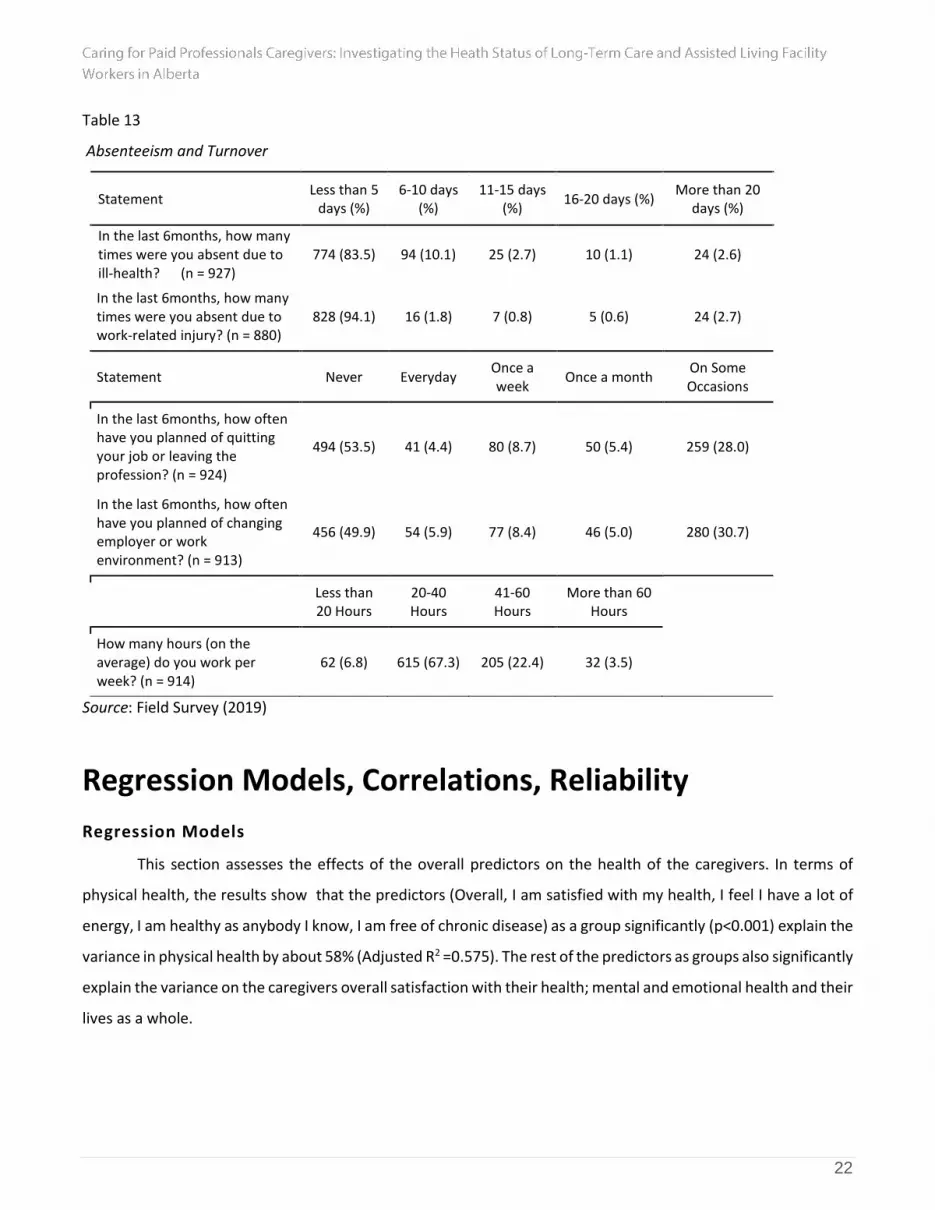
Table 13
Absenteeism and Turnover
Statement Less than 5
days (%) 6-10 days
(%) 11-15 days
(%) 16-20 days (%)
More than 20 days (%)
In the last 6months, how many times were you absent due to ill-health? (n = 927)
774 (83.5) 94 (10.1) 25 (2.7) 10 (1.1) 24 (2.6)
In the last 6months, how many times were you absent due to work-related injury? (n = 880)
828 (94.1) 16 (1.8) 7 (0.8) 5 (0.6) 24 (2.7)
Statement Never Everyday Once a week
Once a month On Some Occasions
In the last 6months, how often have you planned of quitting your job or leaving the profession? (n = 924)
494 (53.5) 41 (4.4) 80 (8.7) 50 (5.4) 259 (28.0)
In the last 6months, how often have you planned of changing employer or work environment? (n = 913)
456 (49.9) 54 (5.9) 77 (8.4) 46 (5.0) 280 (30.7)
Less than 20 Hours
20-40 Hours
41-60 Hours
More than 60 Hours
How many hours (on the average) do you work per week? (n = 914)
62 (6.8) 615 (67.3) 205 (22.4) 32 (3.5)
Source: Field Survey (2019)
Regression Models, Correlations, Reliability
Regression Models
This section assesses the effects of the overall predictors on the health of the caregivers. In terms of
physical health, the results show that the predictors (Overall, I am satisfied with my health, I feel I have a lot of
energy, I am healthy as anybody I know, I am free of chronic disease) as a group significantly (p<0.001) explain the
variance in physical health by about 58% (Adjusted R2 =0.575). The rest of the predictors as groups also significantly
explain the variance on the caregivers overall satisfaction with their health; mental and emotional health and their
lives as a whole.

23
Table 14
Regression Models
Model DV Predictors R/R2 Adjusted
R2 ANOVA Significance
1
Physical health - In comparison with people of your age, how would you rate your own state of health
(Constant), Overall, I am satisfied with my health, I feel I have a lot of energy, I am healthy as anybody I know, I am free of chronic disease, I expect my health to get better, I seem to get sick a little easier than other people
.760/.578 0.575 F(6,817) = 186.21
< .001
2 Overall, I am satisfied with my health
(Constant), Incidence of fatigue or low energy, Feeling of tension, stiffness, or lack of flexibility in your spine, Incidence of breathless with slight exertion, Presence of Diabetes, Presence of sore arms/legs, Incidence of headaches, Health Conditions - Presence of neck /back ache, Incidence of colds/flu or cough, Presence of Hypertension
.563/.317 0.310 F(9,882) = 45.57
< .001
3
Mental and emotional health - I have high self-esteem/feel happy with myself, I am a happy person
(Constant), I feel I am calm and filled with inner peace, tranquility, and peace of mind, I feel excited to be alive when I wake up in the morning, I am able to handle fear and anxiety, I am emotionally healthy, I am comfortable with ‘negative’ emotions (sadness, guilt, anger, envy), I have negative or critical feelings about myself, I have difficulty falling or staying asleep, I have a good level of motivation, I feel compassion for my work, I feel a sense of belonging with where I am, I experience recurring thoughts or dreams
.756/.572 0.566 F(11,871) = 105.73
< .001
4 Coping with daily problems
(Constant), Stress with Emotional Status, Stress with Family, Stress with General Status, Stress with Work, Stress with Finance
.739/.546 0.544 F(5,903) = 217.28
< .001
5 Your life as a whole
(Constant), Your handling of problems in your life, Your significant other /spouse /partner, Your personal life, Your co-workers, Your financial needs, What you are actually accomplishing, Your physical appearance, Your Health
.804/.646 0.643 F(8,851) =
194.13 < .001

24
6 Overall, I have a healthy diet
(Constant), Health Behaviour - I always eat a diet high in fiber, I get a good sleep at night (7-8 hours of sleep), I follow the Canadian food guide (7-10 servings of vegetables and fruit, 2-3servings of meat, and 2 servings of milk), I am at the ideal body weight for someone my height, I try to avoid eating high fat foods, I do exercise three times a week for at least 20 minutes each time, I drink adequate amounts of fluids (1/2 ounce per pound body weight), I visit my doctor for routine check up
.729/.531 0.527 F(8,898) =
126.98 < .001
Source: Field Survey (2019)
Correlational Statistics
We obtained a statistically significant correlation with medium to strong effect size, between the
responses to various sections of the survey questionnaires. The results show strong correlations among most of
the variables including:
• Physical health and health condition;
• Health conditions and mental and emotional health;
• Mental and emotional health and stress level;
• Health condition and quality of life; and
• Mental and emotional health and quality of life.
There are however moderate correlations between variables such as turnover and absenteeism and
physical health; health condition stress level; and healthy behavior.

25
Table 15
Correlations
Variable Health
condition Mental &
emotional health Stress level
Quality of life
Health behaviour
Turnover and absenteeism
Physical health .626** .606** .398** .491** .387** .278**
Health condition .541** .394** .382** .306** .269**
Mental & emotional health .560** .660** .405** .398**
Stress level .578** .349** .251**
Quality of life .434** .308**
Health behaviour .167**
Note: Correlation is significant at the 0.01 level (2-tailed). Source: Field Survey (2019)
Test of Reliability
We obtained an internal reliability with the survey variables towards the objectives of the survey.
Overall, the survey items have acceptable internal reliability, with Cronbach’s Alpha scores ranging from 0.65 to
0.93.
Table 16
Test of Reliability
Survey section Cronbach’s
Alpha
Cronbach’s Alpha based on
standardized items n
Inter-Item Correlations
(Mean, Single Measures)
Valid cases (%)
Physical health (PH) 0.833 0.842 10 .348, .333 811 (86.9%)
Health conditions (HC) 0.83 0.827 16 .230, .232 884 (94.7%)
Mental and emotional health (MEH)
0.93 0.93 31 .303, .295 833 (89.3%)
Stress 0.85 0.85 10 .360, .352 867 (92.9%)
Quality of life (QOL) 0.90 0.90 11 .444, .436 856 (91.7%)
Health behaviour (HB) 0.82 0.82 13 .265, .254 894 (95.8%)
Turnover and absenteeism (TA)
0.65 0.63 4 .295, .317 867 (92.9%)
Overall 0.96 0.96 95 .217, .213 581 (62.3%)
Source: Authors’ Construct (2019)

26
Table 17
Reliability (Reduced Version)
Survey Section Cronbach’s
Alpha
Cronbach’s Alpha based on
standardized items
N items
Inter-Item Correlations
(Mean, Single Measures)
Valid cases (%)
Mental and emotional health (MEH)
0.911 0.910 16 .387, .389 877 (94.0%)
Stress 0.853 0.853 3 .659, .660 919 (98.5%)
Quality of life (QOL) 0.771 0.765 4 .449, .457 873 (93.6%)
Health behaviour (HB) 0.770 0.782 5 .418, .400 918 (98.4%)
Turnover and absenteeism (TA)
0.880 0.880 2 .785, .785 913 (97.9%)
Overall 0.921 0.922 30 .283, .281 794 (85.1%)
Source: Authors’ Construct (2019)
Qualitative Analyses of Open-ended and Interview Questions
Responses to open-ended/interview questions concerning the role of employee health on quality of
caregiving fell mainly into two categories: examples concerning employee health and quality of life, and
suggestions as to what could be done to improve employee health and quality of life. Table 21 provides a list of
all codes, example participant responses, and the percentage of overall codes each code covered.
The top three codes comprising examples were examples related to workplace morale/interpersonal
relations (5.81%), employee morale (4.35%), and workplace policy (4.35%). Below are representative responses
from these codes:
Workplace morale/interpersonal relations:
o “If we call in sick not only do we feel bad leaving our overworked coworkers stranded”
o “Our nurse (RN) sometimes does not listen to what we suggest for our resident.”
o “Work better as a team. Huge gap between nursing and rehab.”
o “Have more volunteers come in to do activities with staff and residents, more casual
workers”
o “Physical + verbal abuse (residents towards staff) should not be tolerated by
management, the HCA's are treated like dirt- get hit, punched, kicked, strangled,
screamed at, swore at, and so much more”

27
o “Staff sitting on their phones on internet, reading [and] visiting instead of helping with
residents”
Workplace policy
o “Many employees rarely take all their breaks, go home on time and get everything
done that is expected to be done.
o “I feel uncomfortable with telephone counselling. I am not good at speech, sometimes,
I have difficulty expressing my feelings to others.”
o “…LPN and HCAs work extremely hard. I find the overall health system keeps
increasing expectations yet resources stay the same. It's taking a toll on the employees
in the system.”
Employee morale
o “Over worked, under paid, under staffed”
o “I am retiring soon because we cannot keep up with the work load. I work when it is
already busy. Then we have people with behaviors like screaming because they want
something…”
o “Care provision is a physically and mentally demanding job. It is difficult for care staff
who are not in good physical health and have a poor quality of life outside of work to
give of themselves to others”
The top three codes related to suggestions were suggestions related to workplace policy/scheduling
practices (19.16 %), employer hiring practices (10.30%), and employer behaviour (9.29%). Below are
representative responses from these codlings:
Workplace policy/scheduling practices
o “If our objective is to give quality care for all the patients/residents, we might want to
consider increasing the staff to patient ratio (more power).”
o “Shift schedules that work for employees. I know several employees who work two or
three part-time jobs just to pay the bills. Other employees only want part-time work.”
o “Existing policies need to be much stricter and enforced stronger in order to protect
workers, residents, and other staff members in the building.”
o “Improve work schedules, 7 night shifts in a row are not healthy and should not be
scheduled, reduce workload, No one should work more than 5 days in a row, Staff not
doing double shift”

28
o “Better staff to patient ratio. Manager per floor. Better on site education, Listen to staff
concerns”
o “Employment of more casual staff to reduce shift hours”
o “We need a complete overhaul in the way our LTC/AL runs”
o “Rotations are antiquated and need to be addressed, change the rotations to be fair and
effective for our units to be more effective, and productive”
o “Policy to have workers only work 5 days in a row with 2 days off”
Employer hiring practices
o “Hire more staff if the resident has more care needs. Lately this is always the case!”
o “I wish we will get more staff and more help or money from the government so we can
work in a comfortable place and take good care of the residents. We need more staff on
board so we can help as soon as they call for, because the work load is too much then
the care giver on the shift so feel helpless when we working.”
o “Our employer could assist us much better if we had more staff, or at least consistently
regular staff. We work short a lot. Have a lot of residents that need more care but do
not receive it.”
Employer behavior
o “Let workers know their work is appreciated often.”
o “Stop treating us like warm bodies to fill a work space and treat us like humans.”
o “More positive feedback and acknowledgement would be great. Usually only hear
negative feedback about my work and the work of my coworkers.”
o “Management is not respectful”
o “Better communication between employees and employers - Effective team work”
o “Staff appreciation: give a pat on the back for a job well done”
o “Need a supervisor/manager to monitor all employees as well as mediate the bickering
and in fighting”
o “Managers shouldn't be allowed to have family members in the facility they work in to
"micro manage" their care”
o “Providing training support, staff motivation and provision of logistical support, on the
job training and frequent workers education”
o “Compliment people on a job well done”

29
These codes point to a few possible themes in participant responses. The most prominent of which is that
caregivers report that they feel that their quality of life and health is largely associated with their social work
environment. Understaffing leads to stress, and calls for more staff and support; when these requests are unmet,
unaddressed, and when the difficulty of caregiving work goes unacknowledged by employers, caregivers feel
undervalued and like “warm bodies” rather than “humans”.
Limitations
Participants’ recruitment was focused only on LTC/AL facilities owned by AHS and Covenant Health
located in Alberta. Few private (for-profit/not-for-profit) LTC/AL providers and agencies were also included in this
study. A proposed face-to-face qualitative interview aspect of this study was discontinued and replaced with email
communication due to time constraints as voices of potential participants was not as strong as earlier indicated.
Conclusions
Overall, majority of the sampled caregivers for the survey reported being mentally (67.9%) and
emotionally (65.7%) healthy. Despite these positive responses, there are still unresolved mental and emotional
health issues that need to be looked at. For instance, only 31.6% of the respondents reported being free from
stress (General status). Again, even though majority of the caregivers reported feeling safe and secure at work,
the respondents expect management to deal with issues of security availability, bulling, and abuse by residents
and their relatives. On the issues of having enough time and control on how they should perform, caregivers
believe that having the time, resources, and trust from management will improve their working environment and
quality of work life.
In the last six months, only 16.5% of the respondents absented themselves for six days or more due to ill
health and 5.9% absented due to work-related injuries. Almost half of the respondents (46.5%) indicates that they
are considering quitting the job or leaving the profession (full departure out of profession) at least once a month
or on some occasion while 51.1% having contemplated on changing their employment or work environment
(lateral movement within organization).
From the qualitative analysis, it appears that the LTC & AL caregivers in this sample are at risk of “burnout,”
or a syndrome seen in individuals who do “people work” of some kind and characterized by cynicism and
emotional exhaustion (Bamonti et al., 2019). According to Bamonti et al. (2019), “burnout is operationalized as
three components: emotional exhaustion, depersonalization, and low personal accomplishment,” is also

30
associated with absenteeism and turnover (Bamonti et al., 2019). Additionally, it appears that these caregivers
would benefit greatly from immediate supervisor support and social care, two interventions, when lacking, which
have been found to be statistically significant predictors of staff turnover (Virdo & Daly, 2019).
Recommendations
In general, complaints about the staff shortage stood out in all of the responses from participants, thus:
• Filling the gaps associated with the staff shortage will not only make caregiver’s work easier but also
increase the efficiency of service delivery at the workplace.
Specifically, addressing the staffing shortage can result in:
• A reduced shift day per week. Some (19%) of the workers reported to have a six to seven shifts per
week;
• An increase in the number of staff per shift, which can give room for breaks during shift hours;
• Effectively addressing the individual needs of residents of LTC/AL facilities (in terms of supply);
• A reduced workload per shift;
• The provision of adequate training was mentioned as a major problem that affected their work;
• Care to reduce the amount of split shifts employees are scheduled.
To ensure that caregivers continue to have good physical health free from pain, stiffness, fatigue or
incidence of work related accidents, there are certain factors that can contribute significantly to achieving this.
These include the provision of:
• A fitness room or gym in the work environment;
• Accessories such as laundry baskets with wheels to reduce weight lifting;
• A safe work environment which enhances promotes accessibility and reduces the incidence of tripping
and accidents; and
• Providing supports to employees to engage in community fitness programs.
Finally, employers need to constantly acknowledge the hard work, dedication, and emotional labor that
goes into caregiving. Suggestions related to employer behavior, hiring practices, and management behavior
encompassed the largest portion of the qualitative data and make up 30.77% of participant responses to the open-
ended/interview questions. Thus:
• Employers and management should acknowledge staff individually and as teams for their hard work;

31
• Caregivers need regular, actionable, and constrictive feedback about their work;
• Employers should hire mangers with exceptional interpersonal communication skills and with the
ability to address the emotional needs of staff related to their caregiving work;
• Managers need to communicate and engage with caregivers to in developing workplace policies and
procedures because they are the ones implementing them;
• Mangers should make daily rounds to communicate with caregivers about concerns and provide
acknowledgement of good work;
• Caregivers need to feel listened to and empathized by management.
Appreciation
We want to express our appreciation to the managers, owners, and staff of AHS, Covenant Health, & all
privately owned (for-profit and not-for-profit) staff working in LTC/AL facilities in rural/urban areas across Alberta
who participated in this study. Special thanks goes to the University of Lethbridge (Research fund), Covenant
Health (Grant), Covenant Care, and the Faculty of Health Sciences (Research Support) for sponsoring this project.

32
References
Alberta Health Services (2015) http://www.albertahealthservices.ca/cc/Page13339.aspx
Alberta Health Services (June 2015) https://www.albertahealthservices.ca/assets/info/pf/if-pf-cc-patient-
based-care-ltc-summary.pdf
Andersen, Vinstrup, Villadsen, Jay, & Jakobsen. (2019). Physical and psychosocial work environmental risk
factors for back injury among healthcare workers: Prospective Cohort Study. International Journal of
Environmental Research and Public Health, 16(22), 4528. doi:10.3390/ijerph16224528
Andersen, L. L., Villadsen, E., & Clausen, T. (2019). Influence of physical and psychosocial working conditions for
the risk of disability pension among healthy female eldercare workers: Prospective cohort. Scandinavian
Journal of Public Health, 1403494819831821. Retrieved from
https://journals.sagepub.com/doi/pdf/10.1177/1403494819831821
Armstrong, P., Banerjee, A., Szebehely, M., Armstrong, H., Daly, T., & Lafrance, S. (2009). They deserve better:
The long-term care experience in Canada and Scandinavia. Ottawa: Canadian Centre for Policy
Alternatives. Ottawa, ON: CCPA.
Bamonti, P., Conti, E., Cavanagh, C., Gerolimatos, L., Gregg, J., Goulet, C., . . . Edelstein, B. (2019). Coping,
cognitive emotion regulation, and burnout in long-term care nursing staff: A preliminary study. Journal of
Applied Gerontology, 38(1), 92-111. Retrieved from
https://journals.sagepub.com/doi/pdf/10.1177/0733464817716970?casa_token=tGdKzjBuU_EAAAAA:aYy
tRZVQ73MPlMpeScGBSP2myO4NqTor5bQcZ-9EgY_jl4mb1GiGrqKumamm_I8meoEzaa7-hvvy
Canadian Healthcare Association. (2007). Guide to Canadian Healthcare Facilities, 2007-2008. Vol. 15.
Ottawa: CHA Press.)
Canadian Healthcare Association. (2009). New directions for facility-based long-term care. Canadian
Healthcare Association= Association canadienne des soins de santé. Retrieved from
http://www.cha.ca/wp-content/uploads/2012/11/CHA_LTC_9-22-09_eng.pdf
Canadian Institute for Health Information (2011). CIHI Submission: 2011 prescribed entity review.
https://www.ipc.on.ca/images/Findings/2011-PE-CIHI-rpt_1.pdf
Canadian Nursing Advisory Committee (2002). Our Health, Our Future: Creating quality workplaces
for Canadian nurses. The advisory committee on health human resources (pp. 36). Ottawa.
Retrieved from http://rcrpp.org/documents/30762_en.pdf
Canadian Union of Public Employees (CUPE) (2009). Residential long-term care in Canada: Our
33
vision for better seniors’ Care (pp. 101). Ottawa. Retrieved from http://cupe.ca/updir/CUPE-long-term-
care-seniors-care-vision.pdf
Chou, R. J.-A. (2012). Resident-centered job satisfaction and turnover intent among direct care
workers in assisted living. Research on Aging, 34(3), 337-364. doi:10.1177/0164027511428456
Desimini, N. N. (2010). Facility-based long-term care in Canada: Examining the potential for a federal
role in improving quality and consistency of access (pp. 99). Victoria, BC: University of Victoria.
Enabling the future provision of long-term care in Canada. (2019). National Institute on Ageing White Paper.
Retrieved from
https://static1.squarespace.com/static/5c2fa7b03917eed9b5a436d8/t/5d9de15a38dca21e46009548/157
0627931078/Enabling+the+Future+Provision+of+Long-Term+Care+in+Canada.pdf
Government of Alberta Report (2010) https://www.alberta.ca/search-results.aspx?q=2010+report
Government of Canada —Action for seniors report. (2014). Retrieved 02/04/2020, 2020 from
https://www.canada.ca/en/employment-social-development/programs/seniors-action-report.html
Health Canada (2013). Health Care System: Long-term facilities-based care, from http://www.hc-
sc.gc.ca/hcs-sss/home-domicile/longdur/index-eng.php
Januario, L. B., Karstad, K., Rugulies, R., Bergström, G., Holtermann, A., & Hallman, D. M. (2019). Association
between psychosocial working conditions and perceived physical exertion among eldercare workers: A
cross-sectional multilevel analysis of nursing homes, wards and workers. Int J Environ Res Public Health,
16(19). doi:10.3390/ijerph16193610
Kawamura, S.; Yamada, K.; & Morioka, I. (2015) “Fatigue symptoms and workplace related factors of
long-term care workers employed in facilities.” Journal of Occupational Health, Vol. 57, No. 3, 2015.
Kemp, C. L., Ball, M. M., & Perkins, M. M. (2019). Individualization and the health care mosaic in assisted living.
Gerontologist, 59(4), 644-654. doi:10.1093/geront/gny065
Larrabee, J. H., Janney, M. A., Ostrow, C. L., Withrow, M. L., Hobbs, G. R., & Burant, C. (2003). Predicting
registered nurse job satisfaction and intent to leave. JONA: The Journal of Nursing Administration, 33(5),
271-283. Retrieved from https://journals.lww.com/dermatologicsurgery/00005110-200305000-
00003.fulltext
Laschinger, H., Kerr, M., Severin, C., Almost, J., Thomson, D., O’Brien-Pallas, Shamien, J. McPerson,
D., LeClair, S., & Koehoorn, M. (2002). Monitoring the health of nurses in Canada: Canadian Health
Services Research Foundation (pp. 30). Ottawa, Ontario Retrieved from
http://www.cfhi-fcass.ca/migrated/pdf/researchreports/ogc/kerr_final.pdf
Leiter, M. P., & Maslach, C. (2004). Areas of worklife: A structured approach to organizational
34
predictors of job burnout. In P. Perrewé & D. C. Ganster, (Eds.), Research in occupational stress and well
being: Vol. 3. Emotional and physiological processes and positive intervention strategies: 91-134. Oxford,
UK: JAI Press/Elsevier.
Matthews, M., Carsten, M. K., Ayers, D. J., & Menachemi, N. (2018). Determinants of turnover among low wage
earners in long term care: the role of manager-employee relationships. Geriatr Nurs, 39(4), 407-413.
doi:10.1016/j.gerinurse.2017.12.004
Park, Jeongkyu; Yoon, S.; Moon, S.S.; Lee, K.H. & Park, Jueun. “The effects of occupational stress,
work-centrality, self-efficacy, and job satisfaction on intent to quit among Long-Term Care Workers in
Korea.” Home health care services quarterly, Vol. 36, No. 2, 2017.
Simmons, S. F., Coelho, C. S., Sandler, A., & Schnelle, J. F. (2018). A system for managing staff and quality of
dementia care in assisted living facilities. Journal of the American Geriatrics Society, 66(8), 1632-1637.
Retrieved from
https://onlinelibrary.wiley.com/doi/pdf/10.1111/jgs.15463?casa_token=vedRPC7g1BgAAAAA:y6uISDmH0
4S9fwEuwNjWz-Hl4vKSHCTJlhU3WqVuIy0ypRkabu4ygYceG77p1MBHOS6HKoT3wNOr8Ogi2A
Sinha, S. K., Griffin, B., Ringer, T., Reppas-Rindlisbacher, C., Stewart, E., Wong, I., & Anderson, G. (2016). An
evidence-informed national seniors strategy for Canada - 2nd edition. In. Toronto: Alliance for a National
Seniors Strategy.
Statistics Canada 2010. https://www.statcan.gc.ca › Home › Publications › 91-209-X
Turcotte, M., & Schellenberg, G. (2007). A portrait of seniors in Canada. Ottawa: Statistics Canada.
Retrieved from www.statcan.ca/english/freepub/89-519-XIE/89-519-XIE2006001.htm
Virdo, G., & Daly, T. (2019). How do supervisor support and social care matter in long-term care? Correlates of
turnover contemplation among long-term care facility workers. International Journal of Care and Caring, 3,
413-424. doi:10.1332/239788218x15411705353061
Wallace, B.H.; Roth, E.G.; Zimmerman, S. & Eckart, J.K. “Micro-aggressions: An approach to understanding the
health of workers in long-term care settings.” Journal of the American Geriatrics Society, Vol. 64, No.12,
2016.
World Health Organisation (WHO) Health Report (2013). Research for universal health coverage.
Retrieved from http://apps.who.int/iris/bitstream/10665/85761/2/9789240690837_eng.pdf?ua=1

35
Appendices
Appendix A
Table 18
Rotated Factor Matrix
Item Factor
1 2 3 4 5 6 7 8 9 10
Physical health - In comparison with people of your age, how would you rate your own state of health
I am free of any physical pain 0.554
I feel good about my physical appearance
0.622
Health conditions - Presence of neck /back ache
0.774
Presence of sore arms/legs 0.547
Feeling of tension, stiffness, or lack of flexibility in your spine
0.590
I find enjoyment and fulfillment in my work
0.740
I feel compassion for my work 0.687
I feel a sense of belonging with where I am
0.739
I feel safe and secure at work 0.672
I feel confident with actions I do at work to address my complaints and concerns
0.602
I would recommend working at LTC/AL to others
0.615
I felt depressed or sad much of the time in last six months
0.665

36
I have negative or critical feelings about myself
0.680
In the last six months I experience moodiness, temper, or angry outbursts
0.708
In the last six months I experience depression or lack of interest
0.774
I am more worried about small things
0.626
I have difficulty thinking, concentrating, or indecisiveness
0.678
I experience vague fears or anxiety
0.722
I am fidgety or restless 0.635
I am mentally healthy 0.817
I am emotionally healthy 0.918
Stress with general status 0.722
Stress with emotional status 0.791
Coping with daily problems 0.621
Your personal life 0.607
Your significant other /spouse /partner
0.887
Your romantic life 0.820
The actual work you do 0.546
Your physical appearance 0.842
Health behaviour - I always eat a diet high in fiber
0.665
I try to avoid eating high fat foods
0.589
I do exercise three times a week for at least 20 minutes each time
0.549

37
I follow the Canadian food guide (7-10 servings of vegetables and fruit, 2-3servings of meat, and 2 servings of milk)
0.611
Overall, I have a healthy diet 0.664
I engage in meditation, contemplation, counseling, journaling, or other activities that help me to explore my thoughts and feelings
0.843
I use relaxation techniques 0.737
Note: Extraction Method: Maximum Likelihood; Rotation Method: Varimax with Kaiser Normalization; Rotation
converged in 8 iterations Source: Authors’ Construct (2019)
Appendix B
Table 19a
Total Variance Explained
Factor
Initial Eigenvalues Extraction Sums of Squared Loadings Rotation Sums of Squared
Loadings
Total % of
Variance Cumulative
% Total
% of Variance
Cumulative %
Total % of
Variance Cumulative
%
1 11.795 30.244 30.244 6.136 15.734 15.734 5.082 13.030 13.030
2 3.000 7.692 37.936 4.536 11.631 27.365 3.909 10.023 23.053
3 2.537 6.506 44.443 3.281 8.414 35.778 2.537 6.506 29.559
4 1.938 4.970 49.413 1.547 3.966 39.745 2.222 5.698 35.257
5 1.670 4.281 53.694 1.941 4.978 44.722 2.056 5.271 40.528
6 1.498 3.841 57.535 1.585 4.063 48.785 1.908 4.891 45.419
7 1.319 3.381 60.916 1.563 4.007 52.792 1.722 4.416 49.835
8 1.223 3.135 64.051 1.248 3.201 55.993 1.671 4.285 54.120
9 1.170 2.999 67.050 1.249 3.202 59.195 1.531 3.926 58.047
10 1.137 2.916 69.966 0.933 2.393 61.588 1.381 3.541 61.588
Note: Extraction Method: Maximum Likelihood Source: Authors’ Construct (2019)
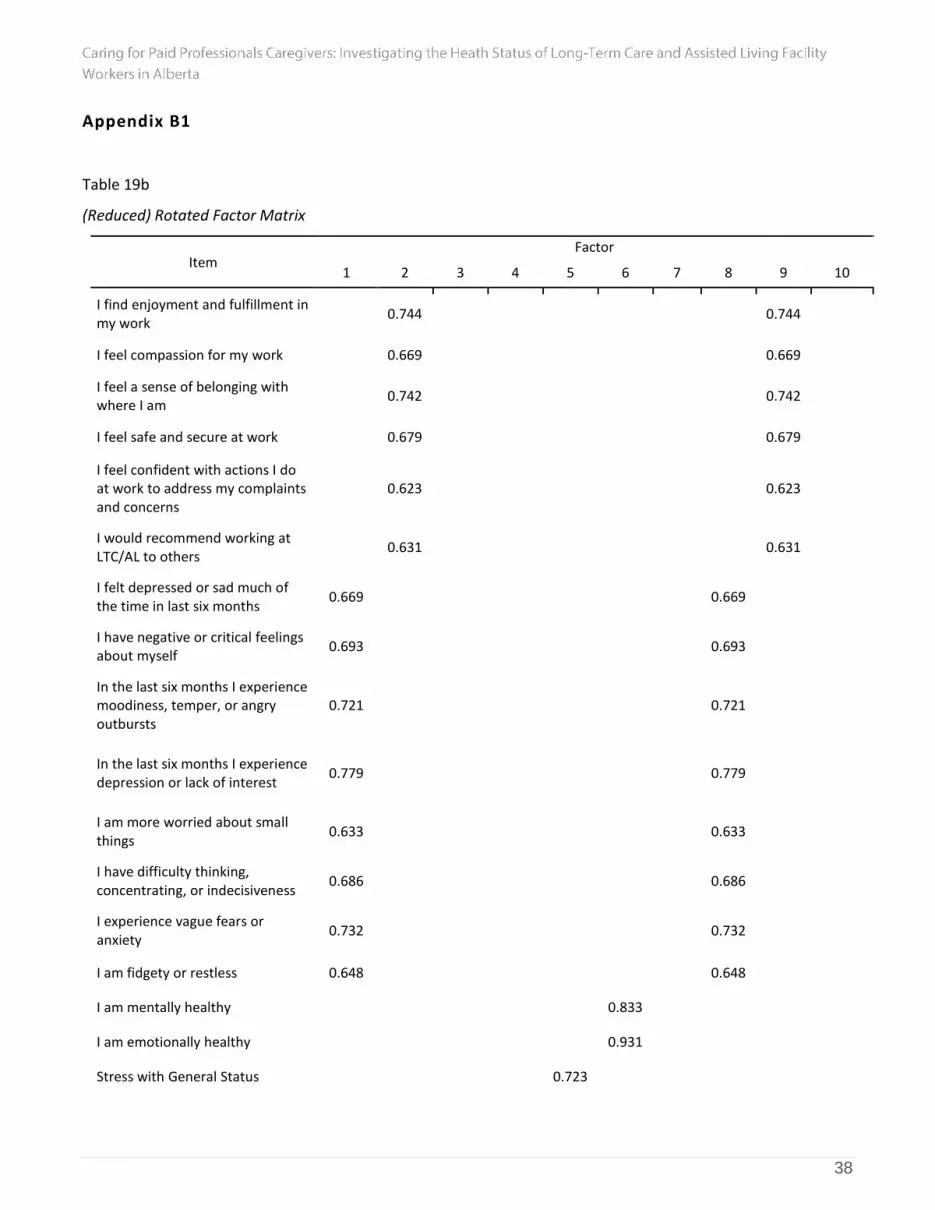
38
Appendix B1
Table 19b
(Reduced) Rotated Factor Matrix
Item Factor
1 2 3 4 5 6 7 8 9 10
I find enjoyment and fulfillment in my work
0.744 0.744
I feel compassion for my work 0.669 0.669
I feel a sense of belonging with where I am
0.742 0.742
I feel safe and secure at work 0.679 0.679
I feel confident with actions I do at work to address my complaints and concerns
0.623 0.623
I would recommend working at LTC/AL to others
0.631 0.631
I felt depressed or sad much of the time in last six months
0.669 0.669
I have negative or critical feelings about myself
0.693 0.693
In the last six months I experience moodiness, temper, or angry outbursts
0.721 0.721
In the last six months I experience depression or lack of interest
0.779 0.779
I am more worried about small things
0.633 0.633
I have difficulty thinking, concentrating, or indecisiveness
0.686 0.686
I experience vague fears or anxiety
0.732 0.732
I am fidgety or restless 0.648 0.648
I am mentally healthy 0.833
I am emotionally healthy 0.931
Stress with General Status 0.723

39
Stress with Emotional Status 0.794
Coping with daily problems 0.632
Your personal life 0.624
Your significant other /spouse /partner
0.883
Your romantic life 0.839
The actual work you do 0.561 0.561
Health Behaviour - I always eat a diet high in fiber
0.655 0.655
I try to avoid eating high fat foods 0.591 0.591
I do exercise three times a week for at least 20 minutes each time
0.556 0.556
I follow the Canadian food guide (7-10 servings of vegetables and fruit, 2-3servings of meat, and 2 servings of milk)
0.638 0.638
Overall, I have a healthy diet 0.695 0.695
I use relaxation techniques
In the last 6months, how often have you planned of quitting your job or leaving the profession?
0.72
1
Note: Extraction Method: Maximum Likelihood. Rotation Method: Varimax with Kaiser Normalization. Rotation
converged in 7 iterations
Source: Authors’ Construct (2019)

40
Appendix B2
Table 19c
Total Variance Explained
Factor
Initial Eigenvalues Extraction Sums of Squared
Loadings Rotation Sums of Squared Loadings
Total % of
Variance Cumulative
% Total
% of Variance
Cumulative %
Total % of
Variance Cumulative
%
1 9.613 32.044 32.044 4.645 15.484 15.484 4.807 16.022 16.022
2 2.885 9.618 41.662 3.884 12.945 28.429 3.794 12.648 28.670
3 2.112 7.041 48.703 3.486 11.621 40.050 2.278 7.594 36.264
4 1.883 6.277 54.981 1.789 5.963 46.013 2.136 7.121 43.384
5 1.495 4.985 59.965 1.395 4.652 50.664 1.879 6.264 49.648
6 1.244 4.146 64.111 1.395 4.649 55.313 1.729 5.765 55.413
7 1.219 4.062 68.173 1.567 5.224 60.537 1.537 5.124 60.537
Note: Extraction Method: Maximum Likelihood Source: Authors’ Construct (2019)
Appendix B3
Table 19d
(Reduced) Rotated Factor Matrix
Item Factor
1 2 3 4 5
I find enjoyment and fulfillment in my work 0.740
I feel compassion for my work 0.608
I feel a sense of belonging with where I am 0.703
I feel safe and secure at work 0.709
I feel confident with actions I do at work to address my complaints and concerns
0.663
I would recommend working at LTC/AL to others 0.699

41
I felt depressed or sad much of the time in last six months 0.685
I have negative or critical feelings about myself 0.703
In the last six months I experience moodiness, temper, or angry outbursts
0.714
In the last six months I experience depression or lack of interest
0.781
I am more worried about small things 0.638
I have difficulty thinking, concentrating, or indecisiveness 0.689
I experience vague fears or anxiety 0.739
I am fidgety or restless 0.657
I am mentally healthy 0.854
I am emotionally healthy 0.913
Your personal life 0.655
Your significant other /spouse /partner 0.876
Your romantic life 0.859
The actual work you do 0.585
Health Behaviour - I always eat a diet high in fiber 0.658
I try to avoid eating high fat foods 0.594
I do exercise three times a week for at least 20 minutes each time
0.552
I follow the Canadian food guide (7-10 servings of vegetables and fruit, 2-3servings of meat, and 2 servings of milk)
0.633
Overall, I have a healthy diet 0.689
In the last 6months, how often have you planned of quitting your job or leaving the profession?
0.513
In the last 6months, how often have you planned of changing employer or work environment?
0.534
Note: Extraction Method: Maximum Likelihood; Rotation Method: Varimax with Kaiser Normalization. Rotation
converged in 6 iterations Source: Authors’ Construct (2019)

42
Appendix B4
Table 19e
Total Variance Explained
Factor
Initial Eigenvalues Extraction Sums of Squared
Loadings Rotation Sums of Squared Loadings
Total % of
Variance Cumulative
% Total
% of Variance
Cumulative %
Total % of
Variance Cumulative
%
1 9.613 32.044 32.044 6.953 23.175 23.175 5.151 17.171 17.171
2 2.885 9.618 41.662 3.363 11.208 34.384 4.311 14.371 31.542
3 2.112 7.041 48.703 2.112 7.041 41.425 2.414 8.045 39.588
4 1.883 6.277 54.981 1.923 6.411 47.836 2.279 7.597 47.185
5 1.495 4.985 59.965 1.571 5.237 53.073 1.766 5.888 53.073
Note: Extraction Method: Maximum Likelihood Source: Authors’ Construct (2019)
Appendix C
Table 20a
Rotated Factor Matrix
Item Factor
1 2 3 4
I find enjoyment and fulfillment in my work 0.743
I feel compassion for my work 0.610
I feel a sense of belonging with where I am 0.707
I feel safe and secure at work 0.714
I feel confident with actions I do at work to address my complaints and concerns
0.667
I would recommend working at LTC/AL to others 0.699
I felt depressed or sad much of the time in last six months 0.702
I have negative or critical feelings about myself 0.712
In the last six months I experience moodiness, temper, or angry outbursts
0.733
In the last six months I experience depression or lack of interest
0.795

43
I am more worried about small things 0.645
I have difficulty thinking, concentrating, or indecisiveness 0.695
I experience vague fears or anxiety 0.730
I am fidgety or restless 0.653
I am mentally healthy 0.858
I am emotionally healthy 0.921
Your personal life 0.648
Your significant other /spouse /partner 0.884
Your romantic life 0.838
The actual work you do 0.585
In the last 6months, how often have you planned of quitting your job or leaving the profession?
0.518
In the last 6months, how often have you planned of changing employer or work environment?
0.536
Note: Extraction Method: Maximum Likelihood Source: Authors’ Construct (2019)
Table 20b
Total Variance Explained
Factor
Initial Eigenvalues Extraction Sums of Squared
Loadings Rotation Sums of Squared Loadings
Total % of
Variance Cumulative
% Total
% of Variance
Cumulative %
Total % of
Variance Cumulative
%
1 8.741 32.373 32.373 5.844 21.644 21.644 5.083 18.826 18.826
2 2.799 10.366 42.738 3.532 13.081 34.726 4.316 15.985 34.812
3 2.068 7.660 50.399 2.072 7.674 42.399 2.142 7.934 42.746
4 1.774 6.569 56.968 1.849 6.848 49.247 1.755 6.501 49.247
Source: Authors’ Construct (2019)

44
Appendix D
Figure 3: Four Factors Analysis
Source: Authors’ Construct (2019)

45
Appendix D1
Figure 4: Five Factors Analysis
Source: Authors’ Construct (2019)
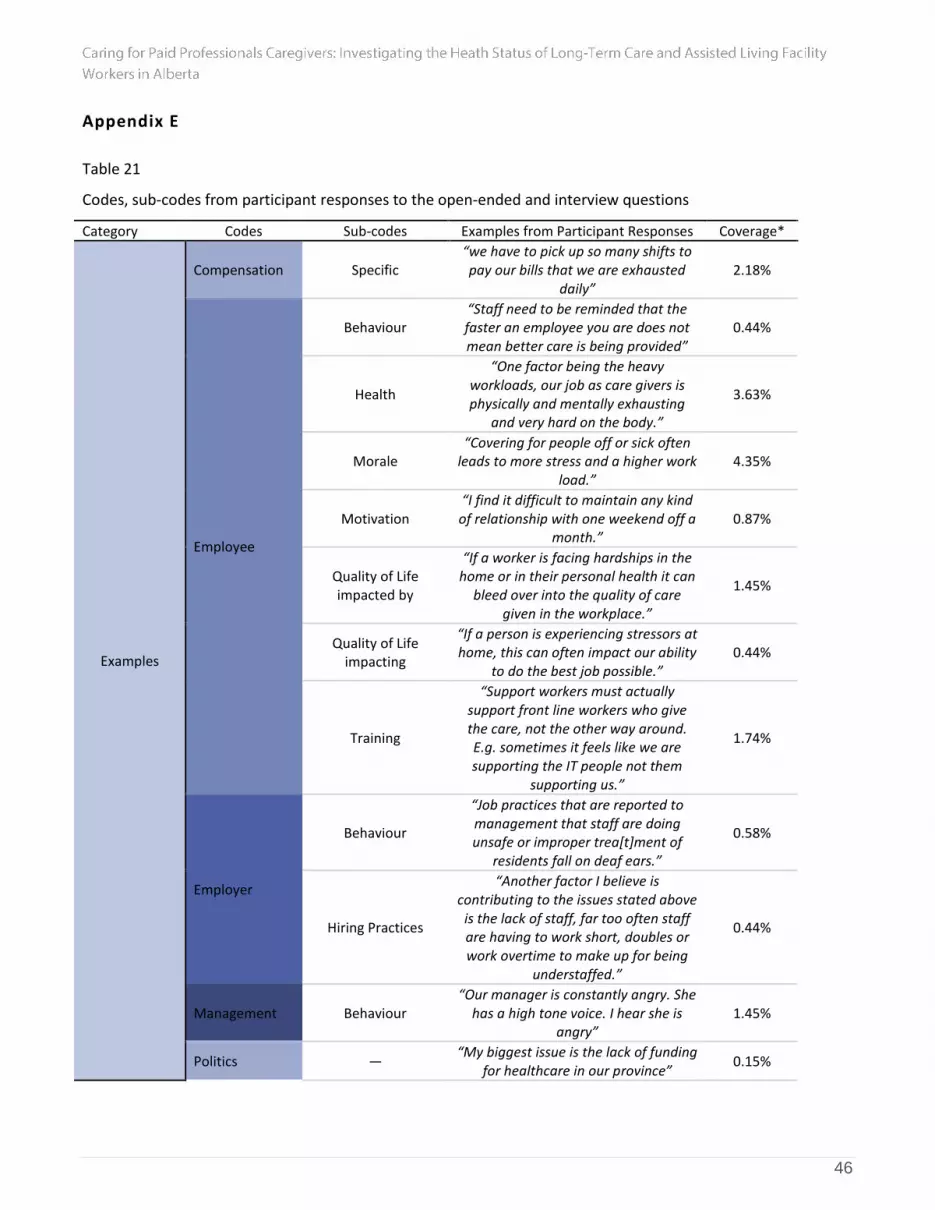
46
Appendix E
Table 21
Codes, sub-codes from participant responses to the open-ended and interview questions
Category Codes Sub-codes Examples from Participant Responses Coverage*
Examples
Compensation Specific “we have to pick up so many shifts to pay our bills that we are exhausted
daily” 2.18%
Employee
Behaviour “Staff need to be reminded that the faster an employee you are does not mean better care is being provided”
0.44%
Health
“One factor being the heavy workloads, our job as care givers is physically and mentally exhausting
and very hard on the body.”
3.63%
Morale “Covering for people off or sick often
leads to more stress and a higher work load.”
4.35%
Motivation “I find it difficult to maintain any kind of relationship with one weekend off a
month.” 0.87%
Quality of Life impacted by
“If a worker is facing hardships in the home or in their personal health it can
bleed over into the quality of care given in the workplace.”
1.45%
Quality of Life impacting
“If a person is experiencing stressors at home, this can often impact our ability
to do the best job possible.” 0.44%
Training
“Support workers must actually support front line workers who give the care, not the other way around. E.g. sometimes it feels like we are supporting the IT people not them
supporting us.”
1.74%
Employer
Behaviour
“Job practices that are reported to management that staff are doing unsafe or improper trea[t]ment of
residents fall on deaf ears.”
0.58%
Hiring Practices
“Another factor I believe is contributing to the issues stated above
is the lack of staff, far too often staff are having to work short, doubles or work overtime to make up for being
understaffed.”
0.44%
Management Behaviour “Our manager is constantly angry. She
has a high tone voice. I hear she is angry”
1.45%
Politics — “My biggest issue is the lack of funding
for healthcare in our province” 0.15%

47
Scheduling Practices
Specific
“Stop making us work short staffed. Short staffed means double the work
which creates stress, chances of accidents”
2.47%
Workplace
Demand
“Tell the truth: most job expectations are unrealistic. Expectations continue
to increase and resources stay the same. Change the things you are able
to change, and be honest with employees about the rest.”
1.02%
Environment
“Many colleagues go to the gym, eat healthy... They find it is the work
environment itself that is making them unhealthy."
3.05%
Morale & Interpersonal
Relations
“If we call in sick not only do we feel bad leaving our overworked coworkers
stranded” 5.81%
Policy
“Processes with other parts of the health care team (e.g. pharmacy):
make them safe, simple and efficient. We do not have time to be following
up with pharmacy daily. Get employee input into this.”
4.35%
Total: 34.42%
Suggestions
Compensation Specific “Fair compensation and wage
adjustments that reflect changes in costs of living”
5.37%
Employee
Behaviour “Learn how to be a team.” 2.18%
Health “Create exercise programs for
employees 2.61%
Morale “More work/home life balance. 0.15%
Support “More support for staff dealing with
difficult behaviours of residents.” 1.89%
Training
“More training for staff to how to work with clients with dementia. All
facilities should have LPN's/ RN's able to work full scope of practice.”
3.48%
Employer
Behaviour “We want our employer to hear our
complaints and concerns because we are the front liner in the floor.”
9.29%
Hiring Practices
“Employer should consider hiring more staff for LTC as it gets very busy, the
demand from residents is very high like toileting plus if you work in secure unit
(dementia) they wander, they have behaviours. It gets so hard at times.”
10.30%
Management Behaviour
“I feel that if our managers/supervisors had more time
to speak to their staff one on one management as a whole would have a
better idea of what
6.39%

48
problems/challenges are faced when working the floor.”
Workplace
Environment
“Better equipment to lift or help someone up after a fall like RAIZER.
The med lift is [in]sufficient to maneuver. Also, it is hard on the back-
causes back pain for staff. Continue having students- very big help."
4.79%
Morale
“It would be great to get back to real teamwork where each discipline was
of equal value & all staff would do the best they are able to do for the benefit
of the residents.”
4.35%
Policy, Scheduling Practices
“When cuts happen they should not affect front line workers. The staffing ratios are historically and always are acknowledged by the management
but it never change”
19.16%
Total: 69.96%
How Related —
Responses to the question, “How are
health and quality of life related to
quality of service?”
“Physical and mental health are equally important in being able to complete your daily work duties.”
2.61%
Comments — General Comments “I love working with the residents at
both sites in LTC.” 1.16%
Note: Codes are not mutually exclusive and participant responses sometimes received more than one coding;
Coverage percentages calculated in Nvivo 12; Source: Authors’ Construct (2019)

49
Appendix E1
Qualitative Analysis of transcript
We analyzed the interview and open-ended questions transcripts using NVivo 12 software to identify
the most occurring themes from the participant responses. We read the transcripts several times to successfully
obtain the final themes. Four major themes evolved, along with subthemes. The following categories show the
resulting themes in participant responses concerning the health status of LTC/AL caregivers and how health
status impacts their work, and what they believe can be done to improve it:
Section A: Themes and subthemes
Figure 5a: Themes and subthemes from participant interview and open-ended responses
Caregivers require equal support given to the entire caregiving team
Caregivers require appropriate pay and full time hours
Caregivers need more opportunities to communicate with internal staff, which will increase motivation
Caregivers need increased pay, which will increase motivation
Caregivers need opportunities to upgrade their role
Caregivers need to be given consistent schedules and less split shifts
Appropriate compensation, support, and incentives
Caregivers need more time off and vacation opportunities
Caregivers require acknowledgement from management for their difficult work
Caregivers require compassion and understanding from management regarding hardships
Caregivers require management support for complex behavioural problems of residents
Management need to acknowledge and seek-out the on-the-job experience of caregivers
Caregivers need to feel that management is fair, honest, and unbiased
Management attitudes towards caregivers

50
Figure 5b: Themes and subthemes from participant interview and open-ended responses
Source: Authors’ Construct (2019)
Healthy lifestyles should be encouraged between caregivers and management
Caregivers should be provided with wellness activities while at work, such as having access to a gym or group exercise
Caregivers should be provided with counselling services specific to the needs of LTC/AL caregivers by their employers
Promoting Healthy Behaviours
LTC/AL facilities should actively seek wellbeing among their staff and residents by providing physically and emotionally healthy work environments
Caregivers should be periodically trained and retrained for the best practices concerning caregiving physical requirements
Employers should provide flexible working hours
Caregivers should be included in management decisions that concern them
Staffing needs to be increased in resident care
Improved communication between caregivers, management, and staff
More training and workshops concerning caregiving work and promoting physical and mental health need to be provided
Paperwork requirements need to be reduced or made more efficient
Equipment needs to be updated to meet current quality standards for caregivers
Suggestions to improve caregiver work quality
The work environment needs to be improved to promote caregiver health

51
Figure 6: Word cloud formed from participant responses under the “Management attitudes towards caregivers”
theme; Source: Authors’ Construct (2019)
Figure 7: Word cloud formed from participant responses under the “Appropriate compensation, support, and
incentives” theme; Source: Authors’ Construct (2019)

52
Figure 8: Word cloud formed from participant responses under the “Suggestions to improve caregiver work
quality” theme; Source: Authors’ Construct (2019)
Figure 9: Word cloud formed from participant responses under the “Promoting healthy behaviours” theme;
Source: Authors’ Construct (2019)

53
Figure 10: Clustered word frequencies from participant responses to open-ended and interview questions
Source: Authors’ Construct (2019)
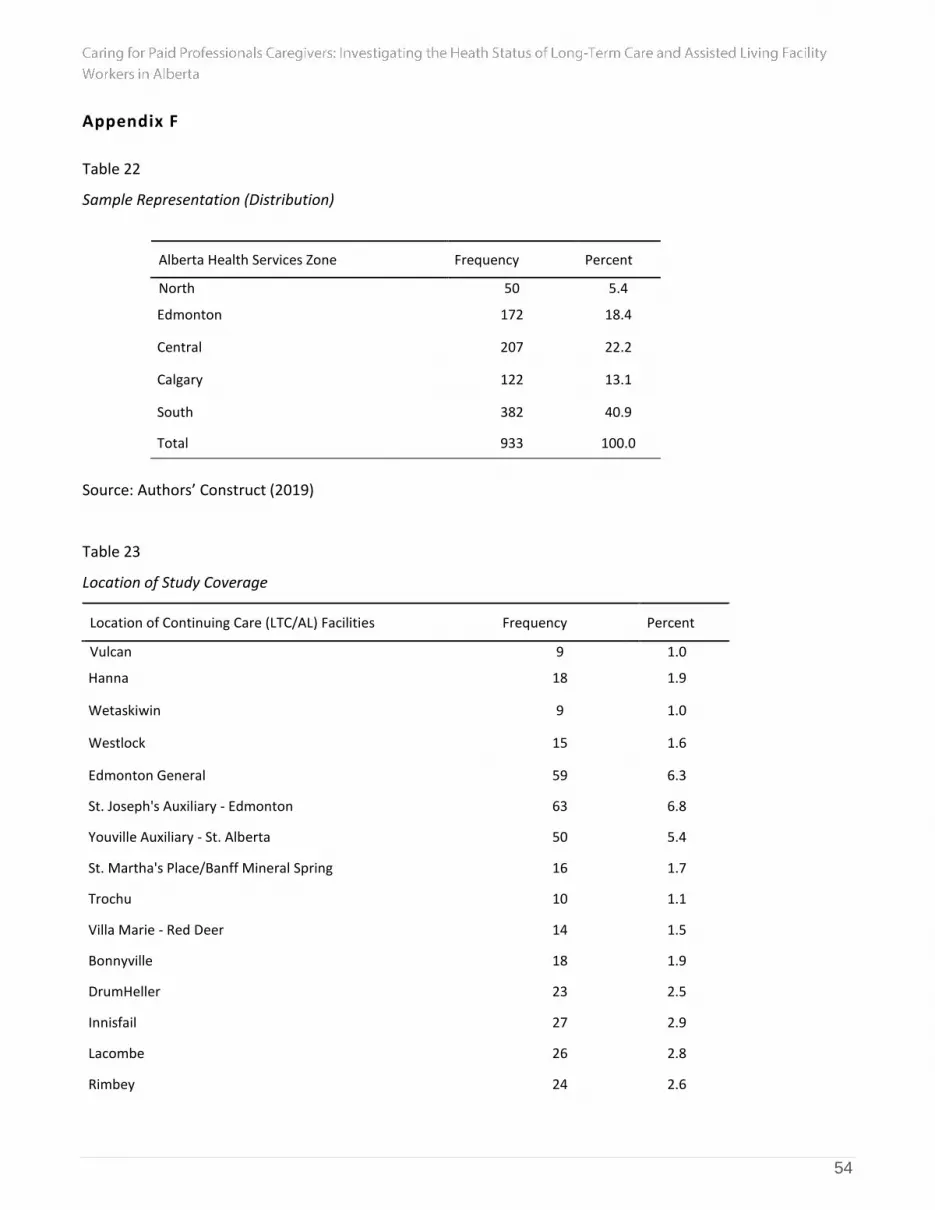
54
Appendix F
Table 22
Sample Representation (Distribution)
Alberta Health Services Zone Frequency Percent
North 50 5.4
Edmonton 172 18.4
Central 207 22.2
Calgary 122 13.1
South 382 40.9
Total 933 100.0
Source: Authors’ Construct (2019)
Table 23
Location of Study Coverage
Location of Continuing Care (LTC/AL) Facilities Frequency Percent
Vulcan 9 1.0
Hanna 18 1.9
Wetaskiwin 9 1.0
Westlock 15 1.6
Edmonton General 59 6.3
St. Joseph's Auxiliary - Edmonton 63 6.8
Youville Auxiliary - St. Alberta 50 5.4
St. Martha's Place/Banff Mineral Spring 16 1.7
Trochu 10 1.1
Villa Marie - Red Deer 14 1.5
Bonnyville 18 1.9
DrumHeller 23 2.5
Innisfail 27 2.9
Lacombe 26 2.8
Rimbey 24 2.6

55
Elk Point 17 1.8
Mannville 8 .9
Bentley 7 .8
Good_Sam_Leth 18 1.9
Good_Sam_Park_Meadows 20 2.1
St. Theresa- Lethbridge 70 7.5
Oyen 9 1.0
Didsbury 10 1.1
Ponoka 13 1.4
High River 22 2.4
Coaldale 55 5.9
Taber 9 1.0
Willow Creek - Claresholm 65 7.0
Crowsness Pass 44 4.7
Saint Michael - Lethbridge 62 6.6
Cardston 19 2.0
Milk River 8 .9
Bow Island 19 2.0
Drayton Valley Hospital and Care Centre 7 .8
Provost 17 1.8
Breton 4 .4
Piyami Lodge/Place - Green Acres 13 1.4
Golden Acres Lodge - Green Acres 11 1.2
Sunny South Lodge - Manor & Villa - Green Acres 25 2.7
Total 933 100.0
Source: Authors’ Construct (2019)


