Embed Size (px)
Citation preview
CARRYING CAPACITY OF PUBLIC WATER SUPPLY
WATERSHEDS:
A LITERATURE REVIEW OF IMPACTS ON WATER QUALITY
FROM RESIDENTIAL DEVELOPMENT
>\ JUL 2 1990 5| By: James M. Doenges
Christopher P. Allan, R. S. Robert J . Jontos, Jr., R.S.
Cynthia A. Liebler
DEP BULLETIN NO. 11
in mi mil liiiiiiiii 3 0231 00158 6002
C A R R Y I N G CAPACITY O F P U B L I C W A T E R S U P P L Y W A T E R S H E D S :
A LITERATURE REVIEW OF IMPACTS ON WATER QUALITY
FROM RESIDENTIAL DEVELOPMENT
BY JAMES M. DOENGES
CHRISTOPHER P. ALLAN, R.S. ROBERT J . JONTOS, JR. , R.S.
CYNTHIA A. L I E B L E R
OF
LAND-TECH CONSULTANTS, INC., SOUTHBURY, CONNECTICUT
MARCH 1990
This document prepared for the Litchfield Hills Council of Elected Officials, with a grant from the Connecticut Department of Environmental
Protection and funded, in part, by the U.S. Environmental Protection Agency.
Prepared for printing by the Connecticut Department of Environmental Protection, Education and Technical Publications Division and The Natural Resources Center Division, Bureau of Environmental Services, on behalf of the Planning and Standards Division of the Bureau of
Water Management. Cover design by Caryn Furbush
Text and cover printed on Cross Pointe Medallion recycled and acid free paper
DEP Bulletin 11 ISBN 0-942085-00-0
Additional Copies May Be Purchased From:
DEP Maps and Publications 165 Capitol Avenue
Room 555 Hartford, CT 06106
(203) 566-7719
Contents
List of Tables V I !
Acknowledgments
Summary I
1.0 9 1.1 Purpose and Goals of the Investigation 19 1.2 Surface Waters: Eutrophication — Causes and Concern 110
1.2.1 Monitoring 113 1.2.2 Models 114
1.3 Groundwater: Importance and Recent Legislation 116 1.4 References Cited 117
2.0 Impact of Individual On-Site Sewage Disposal Systems on Groundwater and Surface Water Quality 21
2.1 Septic System Structure,Function and Operation 121 2.1.1 Residential Wastewater Characteristics 121 2.1.2 The Septic Tank 122 2.1.3 The Leaching System 123
2.2 The Fate of Septic System Pollutants 123 2.2.1 Attenuation and Transformation Within the Soil Matrix 123
2.2.1.1 Bacteria 124 2.2.1.2 Viruses 125 2.2.1.3 Nitrogen 125 2.2.1.4 Phosphorus 126 2.2.1.5 Suspended Solids 129 2.2.1.6 Biological Oxygen Demand 129 2.2.1.7 Chlorides 129 2.2.1.8 Organic Chemicals 130
2.3 Reducing the Potential for Ground Water and Surface Water Contamination 132 2.3.1 Septic System Siting , Design and Construction 133 2.3.2 Pollutant Mass Reduction 135 2.2.3 Water Conservation 136 2.3.4 On-Site Sewage Disposal System Maintenance 136
2.3.5 Alternative and Innovative Systems 138 2.3.6 On-Site Sewage Disposal System Density 140
2.3.6.1 Alternatives To Conventional Zoning 141 2.4 References Cited 146
3.0 Long-Term Storm Water Discharge: Impacts and Mitigation Measures 51
3.1 Suspended Solids 153 3.2 Nitrogen and Phosphorus 155 3.3 Hydrocarbons 157 3.4 Heavy Metals 158 3.5 Microorganisms 160 3.6 Road De-Icing Salts 161 3.7 Biochemical Oxygen Demand and Chemical Oxygen Demand 165 3.8 Priority Pollutants 167 3.9 Pollutant Transport Mechanisms 167 3.10 Mitigating Measures 168
3.10.1 Street Sweeping 168 3.10.2 Catch Basins 169 3.10.3 Settling Basins 169 3.10.4 Wetland Treatment Systems 170
3.11 References Cited 171
4.0 Incidental Non-Point Source Discharge of Pollutants Associated With Residential Development: Impacts and Mitigation 75
4.1 Fertilizers 175 4.2 Pesticides 177 A3 Fuel Oil Storage 182 4.4 Household Hazardous Wastes 184 4.5 Construction Materials 186 4.6 Agricultural Practices 186 A.l Silviculture Practices 189 4.8 References Cited 189
5.0 Construction-Related Erosion and Sedimentation 93 5.1 Principles of Soil Erosion and Sedimentation 193
5.1.1 Factors Influencing Erosion 194 5.2 Potential Impacts on Aquatic Systems and Surface Water Quality
Associated With Erosion 195 5.3 Principles of Erosion and Sedimentation Control Design 197
5.3.1 Planning 197 5.3.2 Erosion and Sedimentation Control Measures 198
5.3.2.1 Vegetation 199 5.3.2.2 Non-Structural Erosion Control Methods 1104 5.3.2.3 Structural Measures Associated with Residential
Development 1106 5.3.2.4 Integrated Methods 1112
5.4 References Cited 1116
6.0 Groundwater Contamination Associated With Residential Development Background Information 1121 Pollutants: Sources and Types 1123 Groundwater Protection 1128 References Cited 1130
121 6.1 6.2 6.3 6.4
CONTENTS V
Appendices
A . Partial Listing of Manufacturers and Distributors of Water Conservation Products A - l
B . Model Soil-Based Zoning Regulations to Assist in Determining Minimum Lot Size B - l
C . Procedure for Determining 3/4 Acre of Buildable Land as Required and Defined by Hebron Zoning Regulations C - l
D . Non-Point Source Pollution Control: Best Management Practices D - l
E . Chesprocott Health Department Regulation Pertaning to Underground Petroleum Storage Facilities E - l
F . Connecticut Regulations—Section 22a-449(d)-l: Control of the Nonresidential Underground Storage and Handling of Oil and Petroleum F - l
G . Public Act No. 88-324: An Act Requiring Aquifer Mapping G - l
H . A Hierarchy of Land Uses Based on Groundwater Contamination Potential H - l
I . Reported Salt Tolerance of Selected Plant Species 1-1
J . Household Hazardous Waste: How to Organize a Community
Collection Day J - l
K . State of Connecticut Potable Water Quality Criteria K - l
L . Connecticut Companies Providing Underground Fuel Tank Leak Detection Services L - l
List of Tables
1-0 Trophic Status of Selected Lakes in the Litchfield Hills Region 11
1-1 Trophic Classification Scheme for Connecticut Lakes 11
1-2 Trophic Status of Connecticut Reservoirs 12
1-3 Nonpoint Sources Contributing to Water Quality Problems
in Connecticut Reservoirs 12
2-1 Characteristics of Typical Residential Wastewater 22
2-2 Phosphate Sorption Capacity of Various Soils 28
2-3 Example Wastewater Flow Reduction Methods 37
2-4 Recommended Soils Grouping 43
2-5 Procedure for Computing Minimum Lot Size and Determining Eligibility for Special Permit Application 44
3-1 Concentrations of Various Storm Water Contaminants Based
on Land Use 52
3-2 Mean Concentration of Total Suspended Solids in Urban Runoff 54
3-3 Pollutant Fractions Associated with Particle Sizes 54
3-4 Nutrients in Street Surface Contaminants 55
3-5 Mean Nutrient Concentration in Urban Runoff 56
3-6 Mean Hydrocarbon Concentration in Urban Runoff 57
3-7 Mean Heavy Metal Loading Intensities in Urban Runoff 58
3-8 Mean Heavy Metal Concentrations in Urban Runoff 59
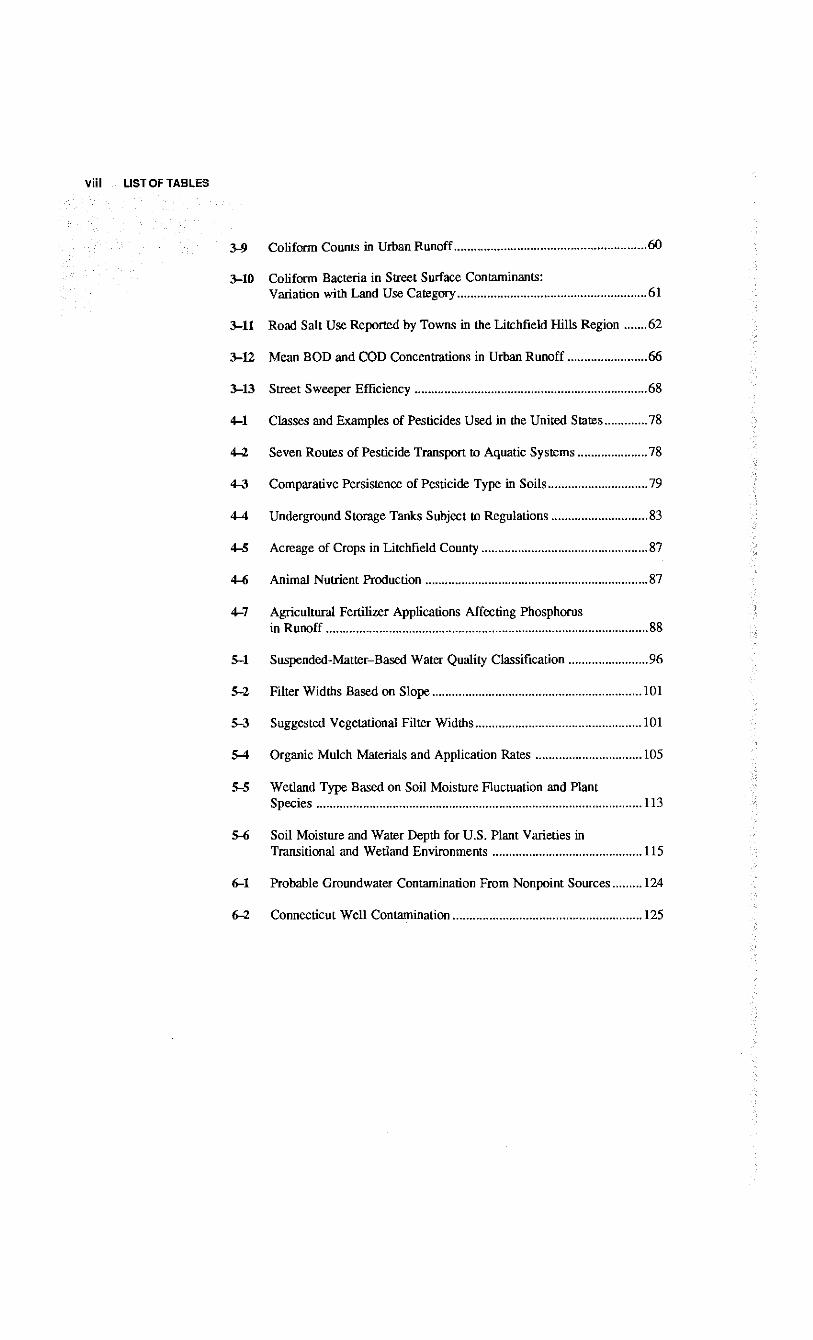
Viii LIST OF TABLES
3-9 Conform Counts in Urban Runoff 60
3-10 Conform Bacteria in Street Surface Contaminants:
Variation with Land Use Category 61
3-11 Road Salt Use Reported by Towns in the Litchfield Hills Region 62
3-12 Mean B O D and COD Concentrations in Urban Runoff 66
3- 13 Street Sweeper Efficiency 68
4-1 Classes and Examples of Pesticides Used in the United States 78
4-2 Seven Routes of Pesticide Transport to Aquatic Systems 78
4-3 Comparative Persistence of Pesticide Type in Soils 79
4-4 Underground Storage Tanks Subject to Regulations 83
4-5 Acreage of Crops in Litchfield County 87
4-6 Animal Nutrient Production 87
4-7 Agricultural Fertilizer Applications Affecting Phosphorus
in Runoff 88
5-1 Suspended-Matter-Based Water Quality Classification 96
5-2 Filter Widths Based on Slope 101
5-3 Suggested Vegetational Filter Widths 101
5-4 Organic Mulch Materials and Application Rates 105
5-5 Wetland Type Based on Soil Moisture Fluctuation and Plant Species 113
5- 6 Soil Moisture and Water Depth for U.S. Plant Varieties in
Transitional and Wetland Environments 115
6- 1 Probable Groundwater Contamination From Nonpoint Sources 124
6-2 Connecticut Well Contamination 125
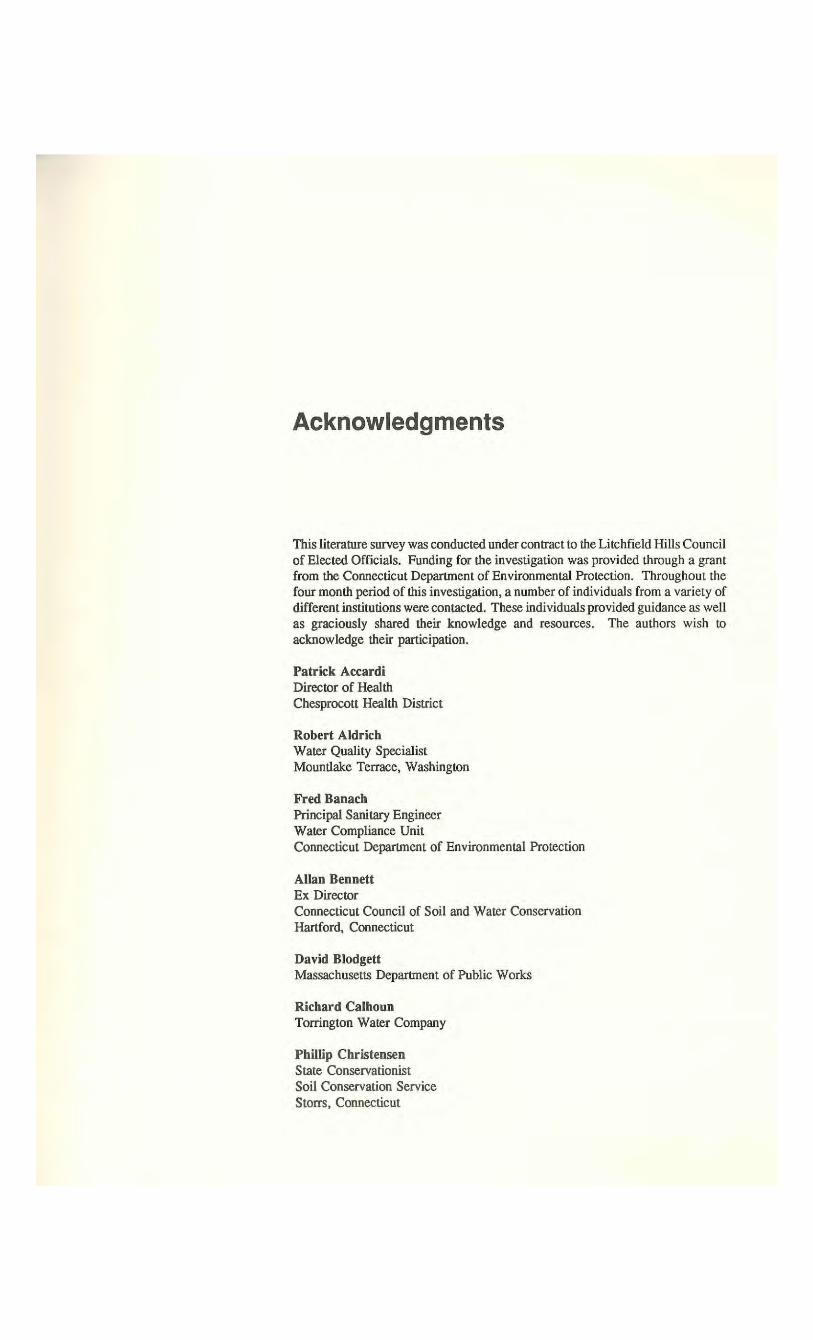
Acknowledgments
This literature survey was conducted under contract to the Litchfield Hills Council of Elected Officials. Funding for the investigation was provided through a grant from the Connecticut Department of Environmental Protection. Throughout the four month period of this investigation, a number of individuals from a variety of different institutions were contacted. These individuals provided guidance as well as graciously shared their knowledge and resources. The authors wish to acknowledge their participation.
Patrick Accardi Director of Health Chesprocott Health District
Robert Aldrich Water Quality Specialist Mountlake Terrace, Washington
Fred Banach Principal Sanitary Engineer Water Compliance Unit Connecticut Department of Environmental Protection
Allan Bennett E x Director Connecticut Council of Soil and Water Conservation Hartford, Connecticut
David Blodgett Massachusetts Department of Public Works
Richard Calhoun Torrington Water Company
Phillip Christensen State Conservationist Soil Conservation Service Storrs, Connecticut
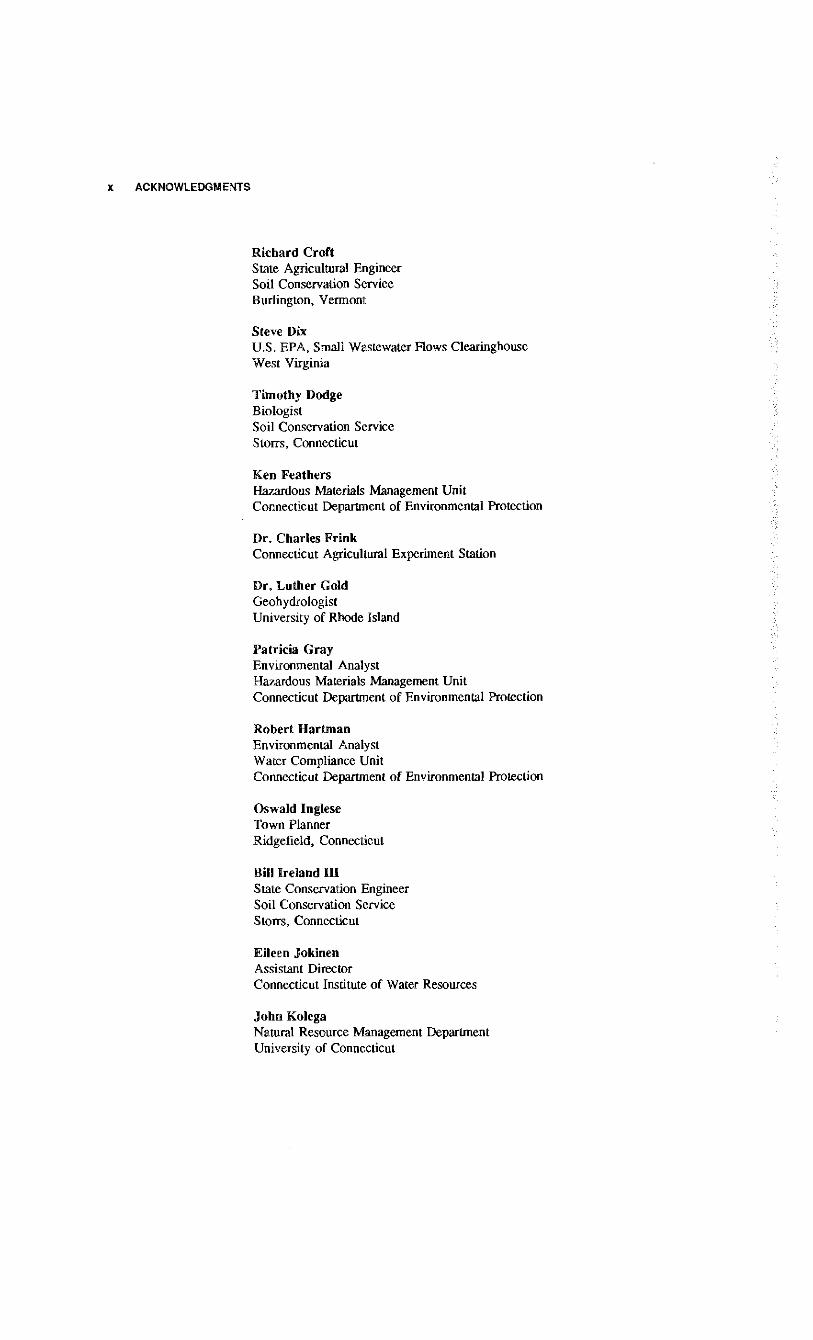
X ACKNOWLEDGMENTS
Richard Croft State Agricultural Engineer Soil Conservation Service Burlington, Vermont
Steve Dix U.S. EPA, Small Wastewater Flows Clearinghouse West Virginia
Timothy Dodge Biologist Soil Conservation Service Storrs, Connecticut
K e n Feathers Hazardous Materials Management Unit Connecticut Department of Environmental Protection
Dr . Charles Fr ink Connecticut Agricultural Experiment Station
Dr . Luther Gold Geohydrologist University of Rhode Island
Patricia Gray Environmental Analyst Hazardous Materials Management Unit Connecticut Department of Environmental Protection
Robert Hartman Environmental Analyst Water Compliance Unit Connecticut Department of Environmental Protection
Oswald Inglese Town Planner Ridgefield, Connecticut
Bill Ireland H I State Conservation Engineer Soil Conservation Service Storrs, Connecticut
Eileen Jokinen Assistant Director
Connecticut Institute of Water Resources
John Kolega Natural Resource Management Department University of Connecticut
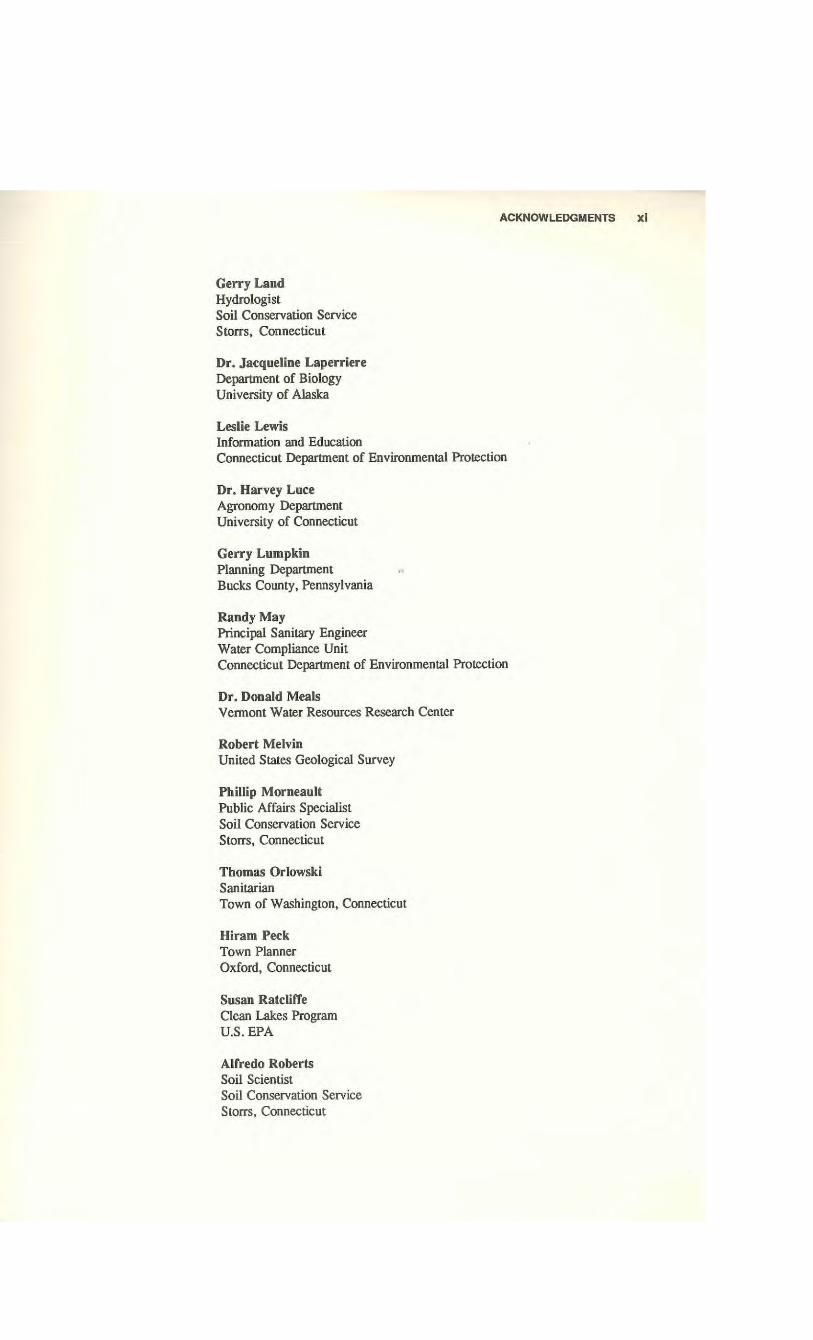
ACKNOWLEDGMENTS
Gerry Land Hydrologist Soil Conservation Service Storrs, Connecticut
Dr. Jacqueline Laperriere Department of Biology University of Alaska
Leslie Lewis Information and Education Connecticut Department of Environmental Protection
Dr. Harvey Luce Agronomy Department University of Connecticut
Gerry Lumpkin Planning Department » Bucks County, Pennsylvania
Randy May Principal Sanitary Engineer Water Compliance Unit
Connecticut Department of Environmental Protection
Dr. Donald Meals
Vermont Water Resources Research Center
Robert Melvin United States Geological Survey Phillip Morneault Public Affairs Specialist Soil Conservation Service Storrs, Connecticut
Thomas Orlowski Sanitarian Town of Washington, Connecticut
Hiram Peck Town Planner Oxford, Connecticut
Susan Ratcliffe Clean Lakes Program U.S. E P A
Alfredo Roberts Soil Scientist Soil Conservation Service Storrs, Connecticut
Xii ACKNOWLEDGMENTS
Brad Robinson Pesticide Division Connecticut Department of Environmental Protection
Michael Rourke Town Planner Hebron, Connecticut
Denise Ruzicka Lead Planning Analyst Water Supplies Unit Connecticut Deptartment of Health Services
Judy Saravis Reference Librarian U.S . E P A Region I Library
Dr. Michael Sullivan Plant Science Department University of Rhode Island
Dr. Peter Vaux Environmental Research Center University of Nevada at Las Vegas
Paul Waggoner Connecticut Agricultural Experimental Station Hamden, Connecticut
A very special thanks goes to Ms. Sandy Hardin of Land-Tech Consultants, Inc. for her patience and diligence in the preparation and revision of this report. Page layout and typesetting by Charles Evans. The authors also wish to recognize the cooperation and assistance provided by Mr. Richard Lynn, Planning Director for the Litchfield Hills Council of Elected Officials.
Summary
This study was initiated to evaluate the optimum and desirable density of residential development in public water supply watersheds based on environmental criteria. The principal objective of this study was to conduct a review of the existing literature concerning the impacts on water quality associated with residential development. Those activities typically associated with residential development including septic systems, soil erosion and sedimentation, construction related impacts, and the impacts of stormwater and non-point discharges of pollutants are addressed. This study pursues a broad realm and as such represents a beginning rather than an end. We hope that others will use this foundation to build upon as we leam more about the natural systems that sustain our activities.
A principal concern to all regions using surface water reservoirs is the topic of eutrophication. This is a natural process, which results in the filling of a lake or reservoir with organic matter, sediment and silts from the watershed as well as organic material from within the water body. The type and intensity of land use within the watershed can accelerate the eutrophication process by altering the rate and pathway of nutrient transport to the impoundment. Aquatic plant growth is limited by the nutrient present in the least amount, relative to needs of the plants. The limiting nutrients in question are usually phosphorus, sometimes nitrogen. Thus the most desirable method of controlling eutrophication is by limiting the amount of nutrients entering the aquatic system. Reservoirs generally receive more sediment than natural lakes, since they are often fed by a single dominant high flow stream. Reservoirs are also generally more efficient at sediment retention rather than nutrient retention. Therefore, sedimentation is the principal aging factor for reservoirs. The trophic status of any impoundment is largely a function of the water quality entering it.
The question, "what is the most desirable development density within public water supply watersheds?" is indeed a most difficult one to answer. As discussed in this report, many factors associated with residential development may contribute to the degradation of water quality, including on-site sewage disposal, erosion and sedimentation, stormwater runoff, and various incidental nonpoint sources of pollution. Therefore, it is important that the cumulative impact of residential development on water quality be considered in establishing minimum lot sizes in public water supply watersheds. Based on a review of the literature it appears that maximum development density of 1 dwelling per 2 acres wil l provide adequate protection of water quality as long as proper watershed development control measures are utilized. This is not to say that minimum 2 acre zoning should be used
2 CARRYING CAPACITY OF PUBLIC WATER SUPPLY WATERSHEDS
as a broad brush application; individual watersheds should be evaluated on a site-by-site basis in order to obtain a qualified estimate of carrying capacity of the individual watershed.
Large lot zoning, in itself, wil l not protect water quality in public water supply watersheds; the design, implementation, enforcement, and monitoring of those control measures presented in this report is the key to water quality protection. The authors of this report understand that it is important to note that factors other than water quality protection may be considered in establishing minimum lot sizes or assessing impacts of proposed development for specific zones within a community. These factors, such as maintenance of property values, the need for open space, traffic control, etc. may also be considered by municipal zoning commissions under Section 8-3 of the Connecticut State Statutes.
Data from the 1980 U.S. Census indicates that in Litchfield County, 50.5 percent of all housing units are served by on-site sewage disposal systems. Under most conditions, septic systems provide excellent treatment of household wastes as long as the systems are properly designed, installed and maintained. The potential for contamination of groundwater and surface water exists when any one of these three areas is lacking.
The soil environment provides most of the treatment capacity of septic systems. Upon passage through the septic system, effluent percolates through the unsaturated soil to the saturated zone, mixes with groundwater and moves down-gradient to streams and other discharge points. The transport and fate of septic system pollutants are of ultimate concern in regard to the protection of groundwater and surface water from contamination. Historically, the principal pollutants of concern include bacteria, viruses, nitrogen, and phosphorus. Other potential pollutants from septic systems include suspended solids, biological oxygen demand (BOD), chlorides and organic chemicals.
Recently, more emphasis is being placed on the potential threat of groundwater contamination from organic chemicals in residential wastewater, particularly within the recharge area of public or private groundwater supply areas. Many potentially hazardous chemicals may be present in domestic sewage. These chemicals originate from such sources as household cleaners, drain cleaners, stain removers, paint products, septic tank cleaners, and petroleum products. Home hobby activities may be particularly threatening to groundwater quality due to the hazardous chemicals associated with such activities as photographic development, furniture refinishing, metal working, horticulture, as well as arts and crafts. Studies have demonstrated that volatile organic compounds and hydrocarbons, if present in domestic sewage, make their way into the groundwater area near the on-site sewage disposal system. Contamination of groundwater by excessive use of septic tank cleaners and additives containing toxic organic chemicals has been documented. Although studies seem to indicate that the typical discharge and groundwater concentrations of organic chemicals fall far below drinking water standards, there is substantial concern that as detection levels and knowledge increase, the drinking water standards wil l become increasingly stringent while available treatment will remain somewhat fixed. The residual impact of organic chemicals in soils, sediments and drinking water supplies is still unclear and indeed may increase with continued development.
Numerous measures can be taken to minimize the possibility of water pollution from septic systems. Perhaps the most important measures are the proper siting, design and construction of on-site sewage disposal systems. Other methods include controlling septic tank influent by restricting discharge of certain chemicals, reducing wastewater flows through water conservation, use of alternative and innovative systems that reduce wastewater loading or concentrations of certain compounds to the leaching system, effective maintenance of on-site
SUMMARY 3
systems including local or regional maintenance programs, the use of zoning and other land management controls to prevent septic system installations in unsuitable areas and to restrict system densities in sensitive areas, as well as development of a monitoring program to identify failing septic systems for subsequent repair or replacement.
The most common source of impact on surface waters from subsurface sewage disposal systems is system failure that results in the discharge of untreated septic tank effluent onto the land surface and subsequent discharge into water bodies via overland flow. The potential for groundwater contamination is enhanced when systems are installed in areas of high groundwater, shallow bedrock and highly porous soils. Thus, regulation and enforcement are the most critical factors ensuring the proper siting, design and construction of on-site sewage disposal systems and the protection of groundwater and surface water quality.
One of the key questions in determining the potential for water quality degradation from on-site sewage disposal systems is how much land area is needed to reduce the concentration of pollutants in domestic sewage to acceptable levels. The pollutant of most concern in determining septic system densities is nitrate. Based on a review of the literature it appears that in most cases a minimum lot size of 1.5 to 2 acres is sufficient for the dilution of nitrate to acceptable levels. Although this requirement seems to provide adequate protection of water quality, each site must be reviewed individually to assess the potential for groundwater and/or surface water contamination.
Zoning and subdivision regulations which ultimately control the density of development and thus, density of septic systems, sometimes use soil and its ability to support on-site sewage disposal systems as one of the controlling factors. I f the ability of soils to accept and renovate sewage from residential dwellings were the only criteria applied in defining minimum lot sizes, it would be difficult to justify lot sizes greater than 2 acres. However, as discussed in this report other factors associated with residential development (erosion and sedimentation, stormwater runoff, incidental nonpoint sources of pollution) may contribute to the degradation of water quality. Therefore, it is important that the cumulative impact of residential development on water quality be considered in establishing minimum lot sizes in public water supply watersheds.
The limitation of many zoning and subdivision regulations is that they do not provide the flexibility needed to allow creative and conservation oriented land use practices. The use of "Planned Residential Development" (PRD) and "Conservation Development" standards by towns within the State may allow for protection and preservation of natural and ecologically important features without increasing site density, as long as these regulations permit density of development no greater than what is possible under conventional subdivision regulations. By allowing the clustered development of dwellings, open space can often be maximized while setting aside critical areas. These standards allow the developer to build on those areas that are best suited for development. Individual septic systems can be clustered in areas containing soils better suited for sewage disposal, while minimizing the area of disturbance and maintaining the open character of the land. Less land disturbance also minimizes impacts from erosion and sedimentation; shortened road networks result in less stormwater discharge; less landscaped area results in decreased application of fertilizers and pesticides. A l l of these factors tend to enhance water quality protection within the watershed.
Residential development is a primary cause of soil erosion and siltation of aquatic environments. The principal effect of land development is exposure of soils to the erosive actions of precipitation and stormwater runoff by the removal of vegetation and the regrading of the land surface. The potential for soil erosion from either a disturbed or undisturbed site is a function of the site's soil
4 CARRYING CAPACITY OF PUBLIC WATER SUPPLY WATERSHEDS
characteristics, type and distribution of vegetative cover, watershed topography and hydrology, and climate. Soil erosion on any site is directly proportional to increases in both the volume and velocity of runoff flowing over the site.
It has been estimated that nationwide some 40 million tons of sediment reach our water bodies annually as a result of land undergoing development from housing, industry or roadway construction. Suburban expansion has been identified as a principal source of silt to water bodies. In addition to increasing turbidity, sediment deposition in aquatic systems reduces primary productivity and species diversity while diminishing channel flow capacity and reservoir storage capacity, as well as the aesthetic appearance of recreational water bodies. Sediment, with its affinity for adsorbed nutrients as well as pesticides, heavy metals and other toxins, appears to be the principal source of phosphorus enrichment of fresh water surface bodies.
During construction, erosion and sedimentation hazards can be exacerbated by scheduling errors, unexpected difficulties in completing the work, as well as significant alterations of the watershed characteristics that increase the amount and rate of runoff leaving the site. Reduction of these potentials requires the development of a sound erosion and sediment/site construction phasing plan. The most effective control measures for soil erosion are the preservation of exiting floral associations whenever possible, and the minimization of the extent of site disturbance.
Of the three categories of control measures, (vegetative, non-structural, and structural) greater emphasis needs to be placed on the use and timely application of vegetative and non-structural measures for both short and long term soil stabilization. Vegetative controls are the most effective and the least expensive to apply and maintain, especially when native species are used. The use of existing and planted areas of vegetation, 50 to 100 feet in width, as filter strips have been shown to be a cost effective and efficient means to control sediment laden runoff, while protecting the trophic status of water bodies, and providing a suitable habitat for wildlife. Wetland, riparian, and other water bodies with a 75 foot wide vegetative buffer, with only minimal disturbance (20%) allowed for access, should be considered for the protection of water quality. While the singular application of vegetation does have its limitations, the integrated use of vegetative and structural control measures offers a sound means of providing effective erosion and sedimentation controls. Integrated design criteria can reduce maintenance requirements of structural erosion and sedimentation control measures, but it does not eliminate the need for long term commitment to providing regular cleaning of these structures.
The principal problem encountered with the application of temporary erosion control measures is improper installation and maintenance. The effectiveness of any erosion and sedimentation control plan is dependent upon sound initial site planning, timely application of the control measures, and proper installation and maintenance of those measures. To accomplish this, regular supervision and enforcement by trained personnel must be provided by the permitting agencies. Funding for enforcement programs through application fees should be given consideration. Improper application and maintenance are the principal reasons for failure of many erosion and sedimentation control measures. These factors underscore the continued need for the education of and communication between the designers, reviewers, and installers of erosion and sedimentation control plans.
Stormwater runoff has been identified as a potential source of pollutants to receiving water bodies. Potential contaminants in stormwater runoff may include suspended solids, nitrogen, phosphorus, hydrocarbons, heavy metals, bacteria, biological oxygen demand (BOD), chemical oxygen demand (COD), and road salts. Runoff from urban areas has been cited as one of the leading causes of water
SUMMARY 5
quality impairment. Data from the National Urban Runoff Program (NURP) indicates that on an annual loading basis, suspended solids in runoff from residential, commercial and light industrial areas are on an order of magnitude greater than secondarily treated sewage, while COD and coliform bacteria are comparable. Contamination of groundwater by sodium from road de-icing salts has been documented and in most cases is associated with salt storage piles. The municipalities of Connecticut apply an average of 100,000 tons of sodium chloride salt on their roadways each year. The judicious application of road salts and the substitution of alternative de-icing compounds is recommended for the mitigation of water quality impairment by road salts.
Other non-point source pollutants of concern include fertilizers, pesticides, fuel-oil storage tanks, household hazardous wastes, construction materials, agricultural practices, and silviculture practices. Fertilizers have been identified as a source of phosphorus inputs to lakes and reservoirs and phosphorus loading is one of the driving forces behind eutrophication in Connecticut. Research indicates that 5 to 10 times as much phosphorus wi l l be exported from residential watersheds as from forested watersheds. Since most phosphorus is adsorbed to soil, erosion appears to be the main mechanism of phosphorus addition to lakes and reservoirs from residential development. The education of homeowners on proper fertilizer application rates, good erosion control measures, and the preservation of freshwater wetlands can help to mitigate the potential impact of fertilizers on water quality.
The contamination of water supplies by pesticides is a serious concern due to their negative health effects, mobility in soils, ecological impacts and persistence in contaminated groundwater. It has been estimated that 500,000 to 1,200,000 pounds per year of pesticide active ingredient are applied in residential areas of the State. In Connecticut, 13 types of pesticides have been detected in groundwater in very low concentrations. Integrated pest management represents probably the best technique for decreasing the potential impacts of pesticide use by decreasing the quantities of pesticides used. Instead of sole reliance on chemical pesticides, integrated management seeks to apply the best of all available control techniques to the pest problem.
Leaking underground fuel storage tanks have been identified as a serious potential source of groundwater contamination in Connecticut. Since the average life span of an unprotected steel tank is 15 years, the C T DEP has estimated that as many as one third of all non-commercial underground storage tanks may be leaking. Once in groundwater, hydrocarbons may persist for years. Since there are no federal or state regulations pertaining to residential underground storage tanks it is recommended that individual towns or health districts adopt regulations pertaining to same.
The greatest impact from household hazardous wastes comes from improper disposal, which may lead to the contamination of both surface and groundwater resources. Household hazardous wastes are not covered under current U.S. EPA hazardous waste disposal regulations. The best available solutions to the problem of household hazardous waste are education and community collection days.
Construction sites generate many pollutants, among them solid waste, that can be toxic to aquatic organisms and degrade water for drinking and water contact recreation. It is a common practice for home builders to dispose of unwanted materials in excavated pits commonly known as "junk holes". The major potential impact of junk holes appears to be the contamination of groundwater from discarded paint products and solvents. The literature contains few references to the hazards from, or mitigation of, disposal of residential construction debris in junk holes.
Agricultural practices are a source of nutrients to both surface and groundwa-
6 CARRYING CAPACITY OF PUBLIC WATER SUPPLY WATERSHEDS
ters. As more of Connecticut's agricultural land is converted to other uses, land use planners need an understanding of the impacts on water quality posed by agricultural practices. Litchfield County contains a large portion of the prime farmland and farmland of statewide significance left in the State. Animal waste and fertilizers arc major contributors to the nitrogen and phosphorus in agricultural land runoff. In rural areas, agricultural impacts on small streams can be significant. Average phosphorus concentrations are nearly 10 times greater in streams draining agricultural lands than streams draining forested areas; the difference in average nitrogen is about 5 fold. Agricultural practices have impacted groundwater quality in Connecticut as well, usually by causing increased nitrate concentrations. As in residential use, phosphorus from fertilizer is most likely to affect surface waters by direct erosion of soil particles, while nitrogen losses through surface runoff are less than via seepage. The conversion of agricultural or undeveloped lands to golf courses, parks and athletic fields usually results in increased applications of agricultural chemicals.
Silviculture activities include timber harvesting, transportation systems for moving the timber, as well as various practices such as site preparation and timber stand improvement. Harvesting practices in Connecticut are generally limited in scope and intensity; rarely do they lead to severe water quality degradation. While timber harvesting does not generally affect nutrient export loads, site specific problems with sedimentation can occur.
In Connecticut, non-point sources of pollutants have been identified as a major threat to reservoir water quality. Land use planning must also consider the impact of suburban expansion on groundwater quality. Thirty-two percent of Connecticut's population currently relies on groundwater for its drinking water supplies. Much land potentially suitable for additional reservoirs is either already developed, prohibitively expensive or is opposed for development on an ecological basis. Therefore, much of the projected increases for future water demand wil l be supplied by increased use of aquifers. With this increased demand for potable water, the potential impact from residential land development served by onsite wastewater systems and the generation of additional sources of non-point pollutants must be considered. This concern is reflected in the adoption of Public Act #88-324, which requires the mapping of aquifers, as well as overlying land uses, and has spurred the initiation of limited investigations into the impact of organic pollutants from residential sources.
Crystalline bedrock aquifers, which underlay the majority of the State, are the principal source of drinking water for both domestic and commercial users not served by public water supplies. Precipitation is the major source of groundwater recharge. Approximately seven of the forty four to forty eight inches of rainfall that the State receives annually reaches the fractured bedrock aquifers underlying glacial till deposits. This infiltration rate is in stark contrast to the twenty-two inches of recharge that occurs annually over stratified sand and gravel aquifers, which, while containing the largest potential well yields in the State, are also very susceptible to contamination.
The quality and quantity of groundwater and surface water are so interdependent that they cannot be managed separately. While Connecticut's groundwater quality can be considered good to excellent, contamination oi potable water supplies from a variety of sources has been reported. Contamination of groundwater can come from surface impoundments, land disposal of wastewater, road de-icing salts, underground fuel tanks, pesticides, septic tank leaching areas, municipal landfills, accidental spills of ioxic waste as well as agricultural and mining activities.
Concentrations of most inorganic constituents are greater in ground water in residentially or commercially developed areas than in undeveloped or agricultural
SUMMARY 7
areas. The impact on ground water quality from properly designed, installed and maintained septic systems is generally a localized event and usually does not constitute a serious threat to ground water quality unless it is in large quantities. Generally, land developed at low density (less than 1 dwelling per 2 acres) and moderate density (1 dwelling per 1/2 acre to 1 unit per 2 acres) is considered as posing minimal or slight to moderate risk, respectively, to ground water aquifers.
Once a contaminant has entered an aquifer it generally moves very slowly. Remedial action may take years to complete, is extremely expensive, and full restoration is not generally achieved. Therefore prevention of contamination is the key to protection and management of groundwater quality. It seems prudent to extend preventative actions to adjacent upland areas as well as to the primary recharge areas. While Connecticut is a leader in various aspects of ground water quality protection, management opportunities exist for greater protection of groundwater resources in the Litchfield Hills region, i.e. adoption of local aquifer protection ordinances or other contemporary approaches to land use regulation.
SUMMARY RECOMMENDATIONS
During the course of our review of the literature regarding the impacts on water quality associated with residential development, it became apparent that many measures can be taken on a region wide or town wide basis for the control of watershed development with the ultimate goal of protecting existing and future surface water and groundwater supplies. We have presented below, a list of those measures we feel are most critical in the protection of these valuable natural resources.
1. The incorporation of public water supply watershed overlay protection zones into municipal zoning regulations should be considered. Within these overlay zones, regulations would require the use of water quality control measures such as those cited throughout this report, including establishment of a minimum lot size within the protection zone (not less than 2 acres), establishment of wetland protection buffers, the use of vegetative filter strips for erosion and sedimentation control, establishment of local or regional septic system maintenance programs, prohibition of garbage grinders, use of storm water treatment systems, regulation of underground fuel-oil storage tanks, etc.
2. Because construction related erosion and sedimentation is a major source of surface water quality impairment within residential watersheds, it is important that competent review, supervision, enforcement and certification of erosion and sediment control plans for all development be emphasized. Funding should be made available collectively or by individual towns to provide knowledgeable and competent staff for same.
3. Ideally, a more logical approach to controlling post development runoff from watershed development may be to address the entire watershed. This approach would provide for the construction of a single control measure placed at an appropriate position in the basin. This approach would require regional cooperation. The potential of this method of stormwater management merits further consideration.
4. Because of the vast importance of existing and future groundwater supplies and the serious threat of contamination from varied sources, the adoption of Groundwater Protection Ordinances by all towns within the Litchfield Hills
CARRYING CAPACITY OF PUBLIC WATER SUPPLY WATERSHEDS
region is strongly recommended, following a detailed investigation of the natural resource characteristics of the region. It is also strongly recommended that community household hazardous waste collection days continue to be encouraged.
5. It is recommended that current zoning regulations be evaluated and revised to reflect a more flexible approach to land use that incorporates performance based zoning for all pertinent natural resource criteria rather than just soils. This evaluation should consider the many benefits of conservation and/or cluster type development in the preservation and protection of natural resources. Adoption of Planned Residential Development or Conservation Development regulations would tend to enhance water quality within residential watersheds through the minimization of site disturbance and utilization of the site's optimum resource characteristics for development, provided these regulations permit development densities no greater than those allowed by existing conventional subdivision regulations.
6. It is recommended that a long term water quality monitoring program be established within the public water supply watersheds in the region. This monitoring program would identify and locate existing sources of pollution, help in evaluating the effectiveness of current land use policies, as well as the enforcement of environmental programs (i.e. wetland protection, erosion and sedimentation control), quantify the relationship between land use and water quality, and aid in the assessment of any future management actions. Any monitoring program should be preceded by a detailed mapping of current land uses within each watershed.
Respectfully submitted,
Robert J . Jontos, Jr., R.S. Christopher P. Allan, R.S .
James M. Doenges Cynthia A . Liebler
Introduction
PURPOSE AND GOALS OF THE INVESTIGATION
Much of the Litchfield Hills region of Connecticut is designated as existing or proposed public water supply watershed. As part of the Litchfield Hills Council of Elected Officials and the Connecticut Department of Environmental Protection evaluation of current land use practices, this study was initiated to evaluate the optimum and desirable residential lot size in these public water supply watershed areas based on environmental criteria.
The principal objective of this study was to conduct a review of the existing literature concerning the impacts on water quality associated with residential development Literature addressing the impacts of residential development in areas of glacial till soils, served by onsite water supply wells and septic systems is particularly germane to the region. The review also focuses on the origin, fate and migration patterns of pollutants through the soil matrix, via surface water and groundwater flows. The impact of these pollutants on the trophic state of surface water bodies, and the long term impact of chemicals originating from residential development on both surface and groundwater quality is also addressed.
Those activities typically associated with suburban and rural residential development are discussed. These include: septic system structure and function, soil erosion and sedimentation, construction related impacts, stormwater discharges, and nonpoint discharges of pollutants. Pollutants specific to each of these activities as well as transport mechanisms and control measures are addressed.
The authors of this report understand that it is important to note that factors other than water quality protection may be considered in establishing minimum lot sizes or assessing impacts of proposed development for specific zones within a community. These factors, such as maintenance of property values, the need for open space, traffic control, etc. may be considered by zoning commissions, under Section 8-3 of the Connecticut State Statutes. It should be noted that municipal agencies, boards and commissions in Connecticut receive their powers solely by delegation from the State. Despite the concept of "home rule," a municipal government or board can exercise no more power than the State, through its laws and constitution, has allowed (Ziska, 1988). The powers and duties of zoning commissions are prescribed in Chapter 126 of the Connecticut General Statutes (Ziska, 1988). Ultimately the established minimum lot sizes in a community should be based on the goals, objectives and strategies of the community as expressed through its municipal plan of development.
10 CARRYING CAPACITY OF PUBLIC WATER SUPPLY WATERSHEDS
Observations concerning the administrative and enforcement aspects of residential land development from the municipal/developer perspective are presented with recommendations for action. A discussion of factors which should be considered when establishing desirable density or development requirements on public water supply watersheds is provided.
A reference list of cited literature appears at the end of each section. An annotated bibliography of the literature is available from Land-Tech Consultants, Inc.
This study pursues a very broad subject; an enormous amount of pertinent information exists. The burden on those who prepared this study was not in finding good material to include but in deciding which to exclude. Thus, as with any investigation of this nature, this study represents a beginning rather than an end. It is our hope that this report will be considered a foundation from which to build upon as our knowledge of the capacity of those natural systems that support our existence are more fully investigated and understood.
1.2 SURFACE WATERS: EUTROPHICATION — CAUSES AND CONCERNS
Eutrophication is a term used to describe the natural process in which biological productivity increases with the age of a body of water. Generally, this biological productivity entails the incorporation of plant nutrients present in water into aquatic plants (mostly microscopic "phytoplankton"). The amounts of nutrients and aquatic plants increase through time. This natural process results in a slow filling of the lake or reservoir basin with accumulated dead aquatic plants, as well as sediments, silt, and organic matter from the watershed. Thus, all lakes and reservoirs can be seen as temporary features of the landscape. The process of eutrophication can be accelerated by the activities of people. Indeed, the accelerated eutrophication of many Connecticut lakes and reservoirs is undoubtedly associated with the type and intensity of land use in their watersheds (Norvell and Frink, 1975). Land use practices are important because they alter the rate and pathways of nutrient transport from the watershed to the receiving water body. It is important to realize that the process of eutrophication is not necessarily unidirectional; reversals are possible. It is generally agreed that the most desirable long term management approach is to control the influx of nutrients (Uttormark et al., 1974). While the identification and control of nutrient sources and transport is a major aspect of this report, the brief discussion of eutrophication that follows is included so the reader can more readily place information presented later in this report into the context of reservoir eutrophication.
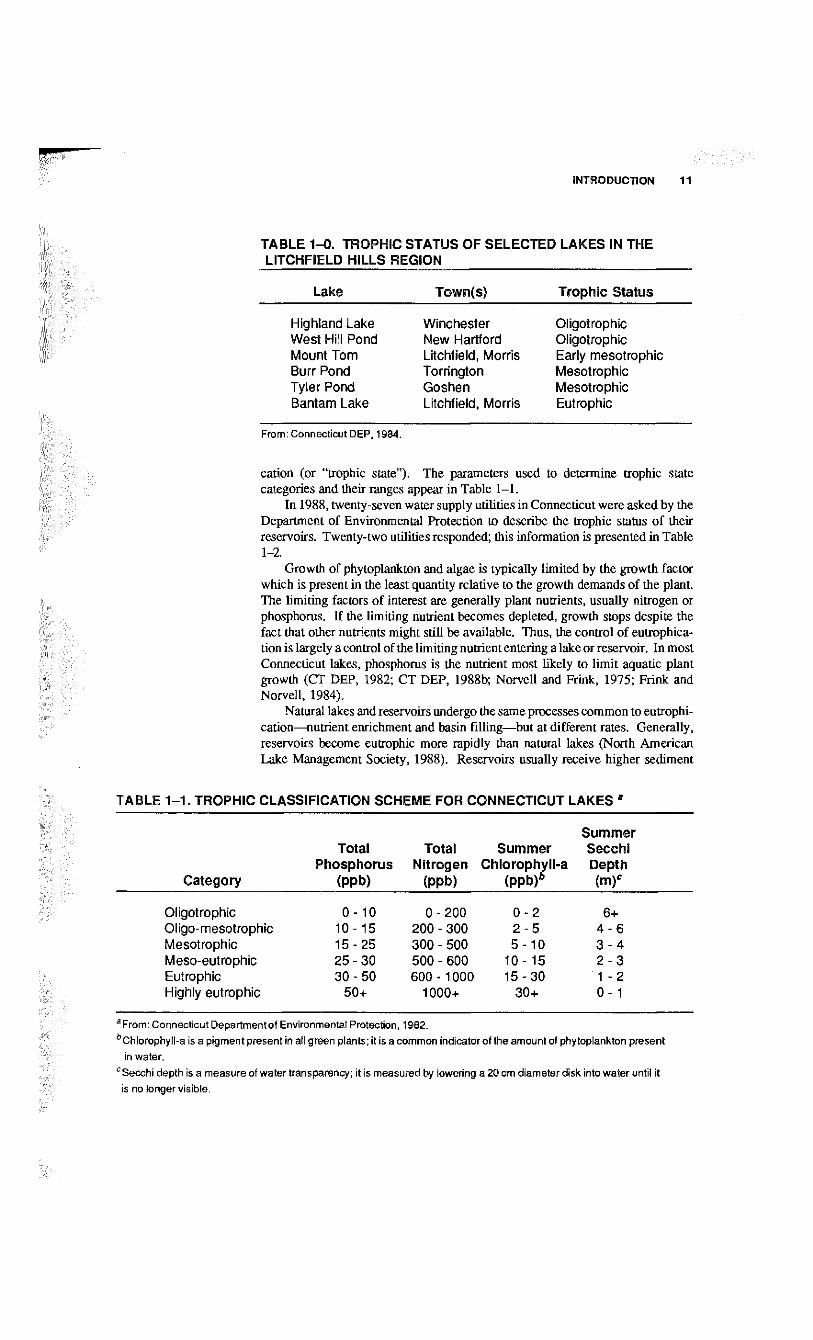
The continuum of eutrophication that stretches from a lake or reservoir's birth to its death is commonly broken into three stages termed "oligotrophic", "mesotrophic", and "eutrophic." Oligotrophic refers to lakes in the earliest stages of eutrophication; they are usually characterized by deep clear waters, low nutrient levels, low productivity (lesser amounts of phytoplankton, algae, and aquatic plants), and well oxygenated bottom waters. Eutrophic lakes are generally relatively shallow, have high nutrient levels, high productivity often characterized by nuisance blooms of algae and/or aquatic plants, declining oxygen content of bottom waters and increased rates of sedimentation. Mesotrophic lakes are those in transition between oligotrophic and eutrophic. Lakes in the Litchfield Hills region range from oligotrophic to highly eutrophic. Table 1-0, lists the trophic status of selected lakes in the Litchfield Hills Region as of 1984.
From 1978 to 1980 seventy Connecticut Lakes were studied jointly by the Connecticut Department of Environmental Protection and the Connecticut Agricultural Experiment Station for the purpose of describing the extent of eutrophi-
INTRODUCTION 11
TABLE 1-0. TROPHIC STATUS OF SELECTED LAKES IN THE LITCHFIELD HILLS REGION
Lake Town(s) Trophic Status
Highland Lake Winchester Oligotrophic West Hill Pond New Hartford Oligotrophic Mount Tom Litchfield, Morris Early mesotrophic Burr Pond Torrington Mesotrophic Tyler Pond Goshen Mesotrophic Bantam Lake Litchfield, Morris Eutrophic
From: Connecticut DEP. 1984.
cation (or "trophic state"). The parameters used to determine trophic state categories and their ranges appear in Table 1-1.
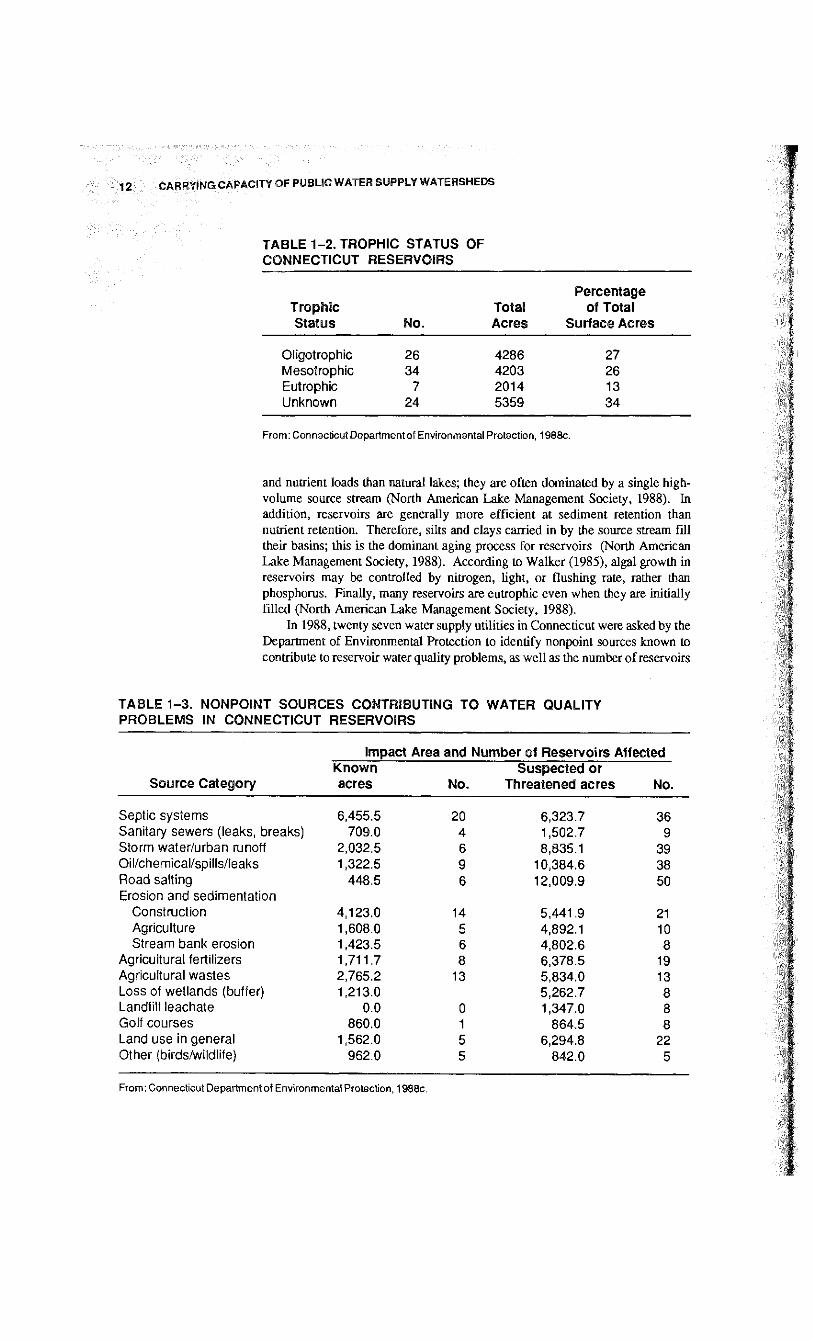
In 1988, twenty-seven water supply utilities in Connecticut were asked by the Department of Environmental Protection to describe the trophic status of their reservoirs. Twenty-two utilities responded; this information is presented in Table 1-2.
Growth of phytoplankton and algae is typically limited by the growth factor which is present in the least quantity relative to the growth demands of the plant. The limiting factors of interest are generally plant nutrients, usually nitrogen or phosphorus. I f the limiting nutrient becomes depleted, growth stops despite the fact that other nutrients might still be available. Thus, the control of eutrophica-tion is largely a control of the limiting nutrient entering a lake or reservoir. In most Connecticut lakes, phosphorus is the nutrient most likely to limit aquatic plant growth (CT DEP, 1982; C T DEP . 1988b; Norvell and Frink, 1975; Frink and Norvell, 1984).
Natural lakes and reservoirs undergo the same processes common to eutrophi-cation—nutrient enrichment and basin filling—but at different rates. Generally, reservoirs become eutrophic more rapidly than natural lakes (North American Lake Management Society, 1988). Reservoirs usually receive higher sediment
TABLE 1-1. TROPHIC CLASSIFICATION SCHEME FOR CONNECTICUT LAKES '
Summer Total Total Summer Secchi
Phosphorus Nitrogen Chlorophyll-a Depth Category (PPb) (ppb) (ppb)" (m)c
Oligotrophic 0 -10 0-200 0 - 2 6+ Oligo-mesotrophic 10-15 200 - 300 2 - 5 4 - 6 Mesotrophic 15-25 300 - 500 5 - 1 0 3 - 4 Meso-eutrophic 25-30 500 - 600 10-15 2 - 3 Eutrophic 30-50 600 -1000 15-30 1 -2 Highly eutrophic 50+ 1000+ 30+ 0 - 1
a From: Connecticut Department of Environmental Protection, 1982. b Chlorophyll-a is a pigment present in all green plants; it is a common indicator of the amount of phytoplankton present
in water. eSecchi depth is a measure of water transparency; it is measured by lowering a 20 cm diameter disk into water until it is no longer visible.
CARRYING CAPACITY OF PUBLIC WATER SUPPLY WATERSHEDS
TABLE 1-2. TROPHIC STATUS OF CONNECTICUT RESERVOIRS
Percentage Trophic Status No.
Total Acres
of Total Surface Acres
Oligotrophy 26 4286 27 Mesotrophic 34 4203 26 Eutrophic 7 2014 13 Unknown 24 5359 34
From: Connecticut Department of Environmental Protection, 1988c.
and nutrient loads than natural lakes; they arc often dominated by a single high-volume source stream (North American Lake Management Society, 1988). In addition, reservoirs are generally more efficient at sediment retention than nutrient retention. Therefore, silts and clays carried in by the source stream fill their basins; this is the dominant aging process for reservoirs (North American Lake Management Society, 1988). According to Walker (1985), algal growth in reservoirs may be controlled by nitrogen, light, or flushing rate, rather than phosphorus. Finally, many reservoirs are eutrophic even when they are initially filled (North American Lake Management Society, 1988).
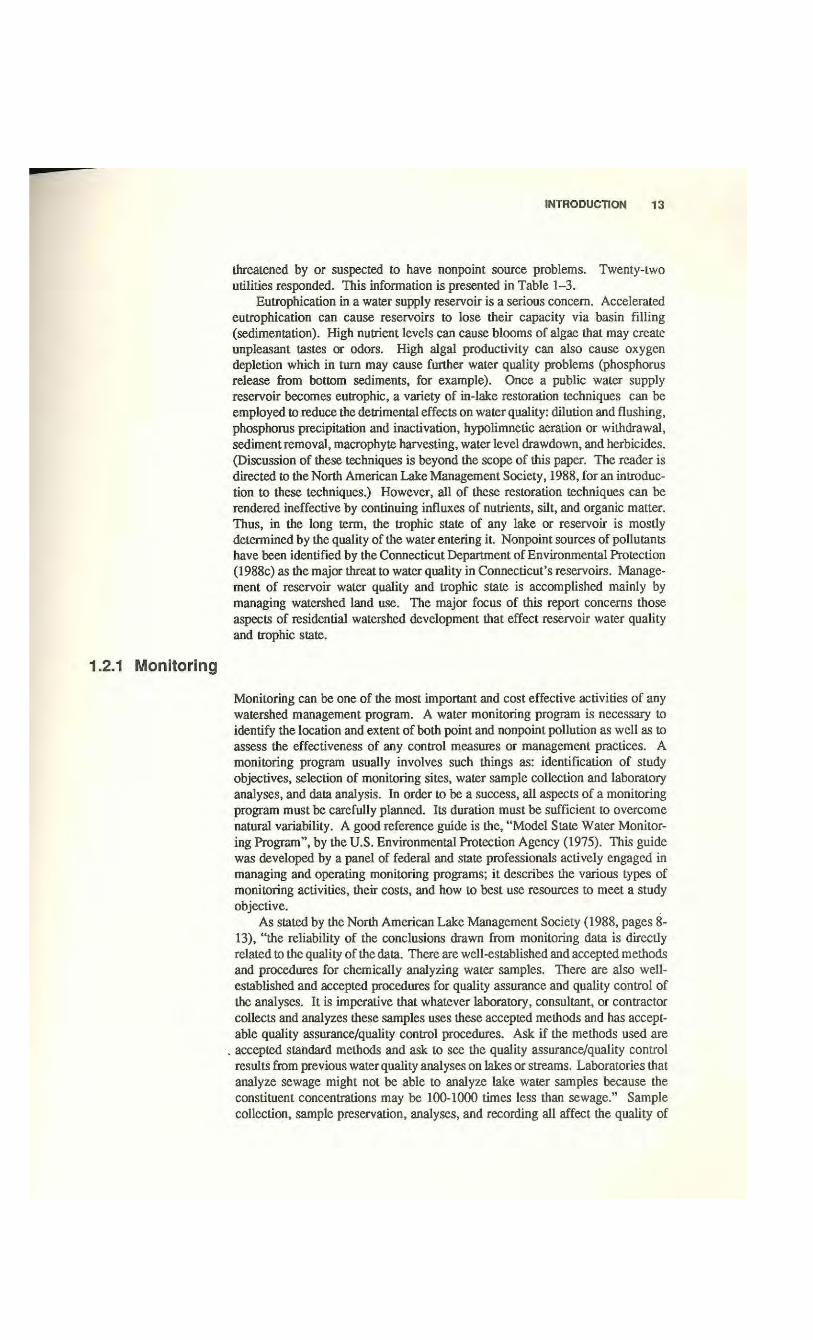
In 1988, twenty seven water supply utilities in Connecticut were asked by the Department of Environmental Protection to identify nonpoint sources known to contribute to reservoir water quality problems, as well as the number of reservoirs
TABLE 1-3. NONPOINT SOURCES CONTRIBUTING TO WATER QUALITY PROBLEMS IN CONNECTICUT RESERVOIRS
Impact Area and Number of Reservoirs Affected Known Suspected or
Source Category acres NO. Threatened acres No.
Septic systems 6,455.5 20 6,323.7 36 Sanitary sewers (leaks, breaks) 709.0 4 1,502.7 9 Storm water/urban runoff 2,032.5 6 8,835.1 39 Oil/chemical/spills/leaks 1,322.5 9 10,384.6 38 Road salting 448.5 6 12,009.9 50 Erosion and sedimentation
Construction 4,123.0 14 5,441.9 21 Agriculture 1,608.0 5 4,892.1 10 Stream bank erosion 1,423.5 6 4,802.6 8
Agricultural fertilizers 1,711.7 8 6,378.5 19 Agricultural wastes 2,765.2 13 5,834.0 13 Loss of wetlands (buffer) 1,213.0 5,262.7 8 Landfill leachate 0.0 0 1,347.0 8 Golf courses 860.0 1 864.5 8 Land use in general 1,562.0 5 6,294.8 22 Other (birds/wildlife) 962.0 5 842.0 5
From: Connecticut Department of Environmental Protection, 1988c.
INTRODUCTION 13
threatened by or suspected to have nonpoint source problems. Twenty-two utilities responded. This information is presented in Table 1-3.
Eutrophication in a water supply reservoir is a serious concern. Accelerated eutrophication can cause reservoirs to lose their capacity via basin filling (sedimentation). High nutrient levels can cause blooms of algae that may create unpleasant tastes or odors. High algal productivity can also cause oxygen depletion which in turn may cause further water quality problems (phosphorus release from bottom sediments, for example). Once a public water supply reservoir becomes eutrophic, a variety of in-lake restoration techniques can be employed to reduce the detrimental effects on water quality: dilution and flushing, phosphorus precipitation and inactivation, hypolimnetic aeration or withdrawal, sediment removal, macrophyte harvesting, water level drawdown, and herbicides. (Discussion of these techniques is beyond the scope of this paper. The reader is directed to the North American Lake Management Society, 1988, for an introduction to these techniques.) However, all of these restoration techniques can be rendered ineffective by continuing influxes of nutrients, silt, and organic matter. Thus, in the long term, the trophic state of any lake or reservoir is mostly determined by the quality of the water entering it. Nonpoint sources of pollutants have been identified by the Connecticut Department of Environmental Protection (1988c) as the major threat to water quality in Connecticut's reservoirs. Management of reservoir water quality and trophic state is accomplished mainly by managing watershed land use. The major focus of this report concerns those aspects of residential watershed development that effect reservoir water quality and trophic state.
.2.1 Monitoring
Monitoring can be one of the most important and cost effective activities of any watershed management program. A water monitoring program is necessary to identify the location and extent of both point and nonpoint pollution as well as to assess the effectiveness of any control measures or management practices. A monitoring program usually involves such things as: identification of study objectives, selection of monitoring sites, water sample collection and laboratory analyses, and data analysis. In order to be a success, all aspects of a monitoring program must be carefully planned. Its duration must be sufficient to overcome natural variability. A good reference guide is the, "Model State Water Monitoring Program", by the U.S. Environmental Protection Agency (1975). This guide was developed by a panel of federal and state professionals actively engaged in managing and operating monitoring programs; it describes the various types of monitoring activities, their costs, and how to best use resources to meet a study objective.
As stated by the North American Lake Management Society (1988, pages 8-13), "the reliability of the conclusions drawn from monitoring data is directly related to the quality of the data. There are well-established and accepted methods and procedures for chemically analyzing water samples. There are also well-established and accepted procedures for quality assurance and quality control of the analyses. It is imperative that whatever laboratory, consultant, or contractor collects and analyzes these samples uses these accepted methods and has acceptable quality assurance/quality control procedures. Ask if the methods used are
. accepted standard methods and ask to see the quality assurance/quality control results from previous water quality analyses on lakes or streams. Laboratories that analyze sewage might not be able to analyze lake water samples because the constituent concentrations may be 100-1000 times less than sewage." Sample collection, sample preservation, analyses, and recording all affect the quality of
14 CARRYING CAPACITY OF PUBLIC WATER SUPPLY WATERSHEDS
environmental data. Improper actions in any one area may result in poor data, from which, poor judgements are certain. A good reference manual is the "Handbook for Sampling and Sample Preservation of Water and Wastewater" by Berg (1982); it was developed to provide general and specific guidance in sample collection and preservation.
Since water quality affects the species composition and density, diversity, stability, productivity, and physiological condition of indigenous populations of aquatic organisms, the nature and health of the aquatic communities is an expression of the quality of the water (Weber, 1973; Standard Methods, 1985). Thus, it might be useful to include biological methods in a monitoring program. As with any aspect of a monitoring program, field and labortory studies should be well planned in advance to assure collection of unbiased and precise data which are technically defensible and ammenable to statistical evaluation. A good reference on the subject is "Biological, Field, and Laboratory Methods For Measuring the Quality of Surface Waters and Effluents" (Weber, 1973).
1.2.2 Models
"The prediction of the impact of watershed characteristics and activities on water quality is a necessary task in successful lake water quality management planning. Prediction implies the use of a conceptual, and most likely, mathematical, model to express variable relationships and make projections. To this end, many mathematical models have been developed and proposed for lake trophic quality management" (Reckhow, 1981; page 46). Empirically based lake models using data on the input and output of phosphorus were first proposed in the early 1960s. The use of models in lake management and watershed planning was greatly stimulated by Vollenweider's thorough analysis published in 1968; this work suggested criteria for nutrient loading to lakes expressed as a function of average lake depth (Reckhow, 1981). Since that time, many variations of Vollenwieder's basic theme have been proposed, including Vollenweider (1975), Dillon and Rigler (1975), Chapra (1975), Larsen and Mercier (1976), Jones and Bachman (1976), Reckhow (1979), Rast and Lee (1978), as well as Norvell et al. (1979). Discussion of all these models is beyond the scope of this report; the reader is referred to "Lake Data Analysis and Nutrient Budget Modeling" by Reckhow (1981) for a more thorough discussion of lake models.
"When used incorrectly, however, these techniques can yield misleading results that ironically have high credibility due to their mathematical or statistical basis. Therefore, it is important that the analyst understand the inherent assumptions, the limitations, and the proper use of the methods..." (Reckhow, 1981; page 56). According to the OECD (1982, page 142) phosphorus loading models assume:
• that the lake phosphorus concentration and the outflow phosphorus concentration are equal;
• that internal phosphorus loading is not present; • that the nutrient load estimate is accurate (it is unlikely that individual estimates
are more accurate than + 35%); • that nutrient load is at a steady state on an annual basis (this is seldom the case,
even in undisturbed natural systems, considerable year to year variations in nutrient load are detected due to fluctuations in annual runoff);
• no change in the phosphorus concentration within the water column; • that the basin is open and that there is an annual water surplus or outflow from
the lake (the methods cannot be applied without modification to closed basins); • that these models are to be used in phosphorus limited lakes only.
INTRODUCTION 15
Some factors are known to modify the trophic response of phosphorus inputs on lakes. Analysts using models must have a basic understanding of limnological principles in order to recognize possible causes of unexpected trophic responses following predictions based on models. Examples of areas where knowledge is essential in applying models follow (taken from OECD, 1982; page 143):
• the models employ total phosphorus which includes all phosphorus fractions present, but some of this phosphorus is not available for plant growth; the percentage of biologically available phosphorus may vary considerably in individual cases and regions;
• macrophytes and filamentous algae are ignored in the models; macrophytes may contain large amounts of phosphorus; macrophytes often act a nutrient pumps and may cause appreciable internal loading;
• in anoxic, eutrophic lakes, large and usually unknown quantities of phosphorus are released from the sediments; this is not taken into account in the loading calculations and may result in a greater trophic response than predicted from loading;
• biological activity such as by bottom feeding fish and emerging bottom dwelling invertebrate fauna often produces considerable internal loading of nutrients;
• the presence or absence of fish and types present in a lake can profoundly affect the apparent trophic response; in the absence of predation, highly abundant zooplankton reduce phytoplankton by grazing which results in lower than expected chlorophyll-a concentrations and greater water clarity;
• in reservoirs, peculiar flow regimes and hypolimetic water withdrawal (rich in nutrients) should be taken into account;
• the nutrient loading models give an estimation of average conditions; local conditions may deviate considerably, temporally and/or spatially.
Modeling is only feasible for the evaluation of problems that are understood well enough to be expressed in quantitative terms (North American Lake Management Society, 1988). Reckhow (1981) states that there is always uncertainty in the prediction of a model. Uncertainity in modeling can arise from the input data, the model parameters, or the model itself. Lake models require that all inputs of nutrients to a lake be accounted for. When data from direct monitoring is unavailable, export coefficients are used to approximate nutrient loading from various land uses. The use of export coefficients is much less costly than direct monitoring, but much less reliable as well (North American Lake Management Society, 1988). Reported values of nutrient export coefficients vary considerably. As Rekhow (1981, page 52) explains, "the selection of appropriate phophorus export coefficients is a difficult task. It is largely contingent upon the analyst matching the application lake watershed with candidate export coefficient watersheds according to characteristics that determine phosphorus export from the land. A close match should insure that the selected export coefficients are reasonably representative of conditions in the application lake watershed ... poor choice of export values contributes to an increase in error." Norvell (et al., 1979, page 5426) states that export coefficients "are too uncertain to guide effective watershed management or to predict reliably concentrations in lakes."
Despite the critical review presented above, models are widely used as both diagnostic and predictive tools. They appear to be most useful when data from a monitoring program is used, rather than relying strictly on export coefficients. The Vollenweider model has been applied successfully to over 500 waterbodies; Jones and Lee (1986) state that this model is the only approach that has been successful in predicting eutrophication-related water quality responses in such a wide variety of waterbodies. The predictive capability of the Vollenweider model is
16 CARRYING CAPACITY OF PUBLIC WATER SUPPLY WATERSHEDS
reviewed in detail by Rast et al., (1983). A model was developed by Norvell et al. (1979) that predicts phosphorus in Connecticut lakes based on hydrological characteristics and watershed land use. This model, developed at the Connecticut Agricultural Experiment Station, was based on the study of 33 Connecticut lakes that were selected to provide a range of trophic states, water loads, and watershed land uses. This model can also be applied to streams by using a residence time of zero (Frink, 1988). The standard error of estimate (6.9 parts per billion of phosphorus) of the model is substantial, particularly for oligotrophic lakes (Norvell et al., 1979).
Many other models may have applications in the protection of reservoir trophic status or watershed management. For example, Water Information Center (1989) reports a technical book is now available that includes state-of-the-art modeling techniques to represent wetland processes. The text is titled, "Wetland Modelling" and is available from Elsevier Science Publishing Company. The book emphasizes the potential for using management models to predict the effects of development on individual wetlands.
A "Model for Estimating the Hydrological Effects of Land Use Change" is described by Miller (et al., 1988). The results provided by the model have practical applications. As Miller (et al., 1988; pages 1-2) explains, "it wil l estimate water quantity as well as timing changes which might be caused by various land-use proposals. These estimated changes can be used to predict on-site as well as off-site impacts within the watershed. For example, changes in drainage patterns on-site might exacerbate flooding or low-flow problems off-site. Certain development changes might impact groundwater discharge or aquifer recharge. The model results can also be used to predict likely soil erosion and sedimentation occurences. Thus, the model can supply information which can help local decision makers evaluate the trade-offs of various land management or economic development schemes. It can also help plan for future water supplies, specifically by predicting land management techniques which wil l yield the greatest available quantity of water." The model was developed by Michael Focuzio and David Miller of the University of Connecticut Renewable Natural Resources Department. The model is appropriate for small southern New England watersheds with mixed land uses. The input information which the model requires is easily obtainable. Al l a user needs to run the model is an IBM-PC microcomputer (or any I B M - compatible microcomputer) which is outfitted with MSDOS 3.0 or higher. The model and users guide is available for $12.25 from:
The University of Connecticut, Agricultural Publications Box U-35 1376 Storrs Road Storrs, Connecticut 06269-4035
1.3 GROUNDWATER: IMPORTANCE AND RECENT LEGISLATION
During the course of this study, it became apparent that groundwater is an important topic that should be considered in all aspects of land use planning. Melvin (et al., 1987, page 1) states that "groundwater and surface water are so interrelated in Connecticut that their quality cannot be managed separately." Currently, 32% of Connecticut's population utilizes groundwater for a supply of drinking water; in rural areas it is the source of almost all domestic supply (Banach, 1988). Groundwater use in Connecticut has been increasing and state policy favors the development of future water supplies from aquifers (Handman and Grossman, 1979; Handman and Bingham, 1980). However, despite its importance, contamination of groundwater in Connecticut is widespread - every town
INTRODUCTION 17
has some area of contaminated groundwater and public or private wells have been contaminated in 116 towns (Meotti and Luby, 1988). Groundwater known or presumed to be degraded occurs beneath 8% of the State (Banach, 1988). Groundwater has been identified by Jim Murphy (CT DEP, Water Compliance Unit) as "the single most pressing public health issue a municipality must address" (CT DEP, 1988a).
The State has passed legislation to help protect Connecticut's groundwater resources. As Harrison and Dickinson reveal (1984, pg. 1-21), "in 1982, Connecticut became the only state in the country with authority to order a polluter to provide potable drinking water to persons with contaminated groundwater supplies. Under this law, if D E P has determined who is responsible for a contamination problem affecting some drinking water well or wells, an order can be issued to the polluter. Immediate delivery of bottled water is required along with the provision of treatment or an alternate supply for long-term use, according to a plan submitted to and approved by D E P in consultation with the State Department of Health Services." The law referred to is section 22a471 of the Connecticut General Statutes. In 1985, the Connecticut General Assembly passed Public Act 85-279, modifying section 8-2 and 8-23 of the General Statutes. This law mandates each Planning and Zoning Commission to consider present and future water supplies, whether existing or potential, surface or groundwater, in their land use plans and regulations (Meotti and Luby, 1988; C T DEP, 1988). In 1987, at the request of the C T DEP, the state legislature created an Aquifer Protection Task Force by amendment to Special Act 87-63 (Banach, 1988). In 1987 Public Act 88-324, "An Act Requiring Aquifer Mapping" became law. This required the D E P to establish standards describing two levels of mapping for existing and potential public water supply wellfields and their recharge areas. Level A mapping requires extensive hydrogeologic data for computer modeling of groundwater systems. Level B mapping uses simplified and less expensive mapping techniques. Public and private water companies serving 1,000 or more people are required to complete level B mapping of all existing wellfields by July 1, 1990; water companies serving more than 10,000 people must complete level A mapping by July 1, 1992. Level B maps must be approved by the C T DEP. Within three months of this approval the involved towns must authorize an existing commission or establish a new commission to inventory land uses overlying the mapped groundwater resources. A copy of Public Act 88-324 is included in this report as Appendix G.
Because of the importance of groundwater in land use planning a discussion of the general principles, sources of pollutants, and protection methodologies has been included as section 6.0 of this report.
1.4 REFERENCES CITED
Banach, F . 1988. Sources and Causes of Groundwater Pollution in Connecticut: A seminar sponsored by the Institute of Water Resources. Storrs C T , December 14, 1988.
Berg, E . L . 1982. Handbook for Sampling and Sample Preservation of Water and Wastewater. U.S. Environmental Protection Agency. Cincinnati, OH. E P A -60014-82-029.
Chapra, S.C. 1975. Comments on an empiral method of estimating the retention of phosphorus in lakes by W£. Kirchner andPJ. Dillion. Water Resour. Res. 11(6): 1033-1034.
Connecticut D.E.P. (no date given). Groundwater: Protecting a Precious Resource (A series of articles reprinted from "Connecticut Environment", the C T D E P Citizens Bulletin.)
CARRYING CAPACITY OF PUBLIC WATER SUPPLY WATERSHEDS
Connecticut D.E.P. 1982. The Trophic Classification Of Seventy Connecticut Lakes. Bulletin No. 3.
Connecticut D.E.P. 1984. Watershed Management Guide for Connecticut Lakes. Connecticut DEP, Water Compliance Unit.
Connecticut D.E.P. 1988b. Watershed Management Guide for Connecticut Lakes, Connecticut DEP, Water Compliance Unit.
Connecticut D.E.P. 1988c. State of Connecticut 1988 Water Quality Report to Congress. Connecticut DEP, Water Compliance Unit.
Dillon, P.J. and F .H . Rigler. 1975. A test of a simple nutrient budget model predicting the phosphorus concentration in lake water. J .Fish Res. Board Can. 31(11):1711-1778.
Frink, C.R. and W.A. Norvell. 1984. Chemical and Physical Properties of Connecticut Lakes. Connecticut Agricultural Experiment Station. Bulletin 817.
Frink, C.R. 1988. Personal communication on 6/7/88. Handman, E.H.; I .G. Grossman; J.W. Bingham; and J . L . Rolston. 1979. Major
Sources of Ground-Water Contamination in Connecticut. U.S. Geological Survey Water Resources Investigations Open File Rpt 79-1596. Hartford, C T .
Handman E . H . and J.W. Bingham. 1980. Effects of Selected Sources of Contamination on Ground-Water Quality at Seven Sites in Connecticut, U.S . Geological Survey Water Resources Investigations Open File Rpt 79-1596. Hartford, C T .
Harrison, E . Z . and M.A. Dickinson. 1984. Protecting Connecticut's Groundwater: A Guide to Groundwater Protection for Local Officials. Connecticut DEP.
Jones, J.R. and R.W. Bachman. 1976. Prediction of phosphorus and chlorophyll levels in lakes. J . Water Pollution Control Federation. 48 (9):2176-2182.
Jones, R .A. and G.F. Lee. 1986. Eutrophication modeling for water quality management: an update of the Vollenweider-OECD model. Water Quality ll(2):67-74.
Larsen, D.P. and H.T. Mercier. 1976. Phosphorus retention capacity of lakes. J . Fish Res. Borad Can. 33(8): 1742-1750.
Melvin, R . L . ; S.J. Grady; D.F. Healy; and F . Banach. 1987. Connecticut Groundwater Quality. U.S. Geological Survey Open File Rpt 87-00717. Hartford, C T .
Meotti, M.P. and T.S. Luby. 1988. Report of the Aquifer Protection Task Force to the General Assembly. Aquifer Protection Task Force, Connecticut General Assembly.
Miller, D.R., M.J. Focazio, M.A. Dickinson, and W.E. Archey. 1988. A User's Guide to a Model For Estimating the Hydrological Effects of Land use Change. Coop. Ext . Ser., UCONN, UMASS, Northeast Regional Center for Rural Development, Northeast Regional Climate Center.
North American Lake Management Society. 1988. The Lake and Reservior Restoration Guidance Manual, 1st edition. U.S. Environmental Protection Agency. Washington, D.C.
Norvell, W.A. and C.R. Frink. 1975. Water Chemistry and Fertility of Twenty-Three Connecticut Lakes. Connecticut Agricultural Experiment Station Bulletin 759.
Norvell, W.A., C.R. Frink and D.E . Hil l . 1979. Phosphorus in Connecticut lakes predicted by land use. Applied Biology Vol. 76, N o . l l .
OECD. 1982. Eutrophication of Waters: Monitoring, Assessment and Control. Organization For Economic Co-operation and Development. Paris, France.
Rast, W. and G.F. Lee. 1978. Summary Analysis of the North American (U.S. Portion) OECD Eutrophication Project: Nutrient Loading - Lake Response
INTRODUCTION 19
Relationships and Trophic State Indices. U.S. Environmental Protection Agency. Corvallis, OR. E P A - 600/3-79-008.
Rast, W., R .A . Jones and G.F. Lee. 1983. Predictive capability of U.S. OECD phosphorus loading!eutrophication response models. Journal Water Pollution Control Federation 55:990-1003.
Reckhow, K . H . 1979. Empirical lake models for phosphorus: development, applications, limitations, and uncertainty In Perspectives on Lake Ecosystem Modeling. D. Scavia and A. Robertson (eds.). Ann Arbor Science Publishers. Ann Arbor, MI.
Reckhow, K . H . 1981. Lake Data Analysis and Nutrient Budget Modeling. U.S. Environmental Protection Agency. Corvallis, OR.EPA-60013-81-011.
Standard Methods For the Examination of Water and Wastewater, 16th ed. 1985. American Public Health Assoc., American Water Works Assoc., Water Pollution Control Fed. Washington, D.C..
U . S. Environmental Protection Agency. 1975. Model State Water Monitoring Program. U.S. E P A Washington, D.C. EPA-440/9-74-002.
Uttormark, P.D.; J .D. Chapin; and K.M. Green. 1974. Estimating Nutrient Loadings of Lakes From Non-Point Sources. University of Wisconsin Resource Center. EPA-660/3-74-020.
Vollenweider, R .A . 1975. The Scientific Basis of Lake and Stream Eutrophication with Particular References to Phosphorus and Nitrogen as Eutrophication Factors. Organ. Econ. Coop. Dev. Paris Tec. Rep. DAS/DSI/68.
Water Information Center. 1989. Research and Development News, Vol . 30, no. 1.
Walker, W.W. 1985. Model Refinements: Rep. 3. Empirical Methods for Predicting Eutrophication in Impoundments, vol. E-81-9. U.S. Army Engineering Waterways Experiment Station. Vicksburg, MS.
Weber, C . I . (ed.) 1973. Biological Field and Laboratory Methods for Measuring the Quality of Surface Waters and Effluents. U.S. Environmental Protection Agency. Cincinnati, OH. EPA-670/4-73-001.
Ziska, M. 1988. What's Legally Required? A Guide to the Legal Rules for Making Local Land-Use Decisions. C T DEP Natural Resources Center.
2.0 Impact of Individual On-Site Sewage Disposal Systems on Groundwater and Surface Water Quality
Data from the 1980 U.S. Census Bureau indicates that in Litchfield County, 50.5 percent of all housing units are served by on-site sewage disposal systems, compared with 31.7 percent Statewide. Under most conditions, septic systems provide excellent treatment of household wastes as long as the systems are properly designed, installed and maintained. The potential for contamination of groundwater and surface water exists when any of these three areas are lacking. In order to evaluate the potential for pollution from septic systems and to develop strategies to reduce that potential, an understanding of the functioning of septic systems and the fate of potential pollutants is necessary.
2.1 SEPTIC SYSTEM STRUCTURE, FUNCTION AND OPERATION
The treatment of household wastewater by septic systems involves a number of complex processes. However, the conventional septic system consists of only two basic treatment components: the septic tank and the subsurface disposal field or leaching area. A discussion of the composition of household wastewater and the basic operation of the septic system components follows.
2.1.1 Residential Wastewater Characteristics
Household wastewater is generally characterized as having two components: "graywater" and "blackwater". Graywater contains very little organic waste and originates from showers, baths, sinks, laundry and dishwashers. The principal contributor of organics to residential wastewater is toilet waste, referred to as blackwater. Garbage grinders can also contribute large quantities of organics as well as settleable solids and grease. The use of garbage grinders is not recommended for residences served by on-site sewage disposal systems (CT. Dept. of Health Services, 1988).
Wastewater characteristics fluctuate and are dependent upon water usage which is determined by the composition and life styles of household occupants. The average daily wastewater flow from a typical residential dwelling, as reported by the U.S. Environmental Protection Agency is approximately 45 gallons/ person/day (Clements et al., 1980). A limited analysis of water consumption data from typical Connecticut households by Land-Tech Consultants determined that average daily wastewater flows range from 46.4 to 57.1 gallons/person/day. It was
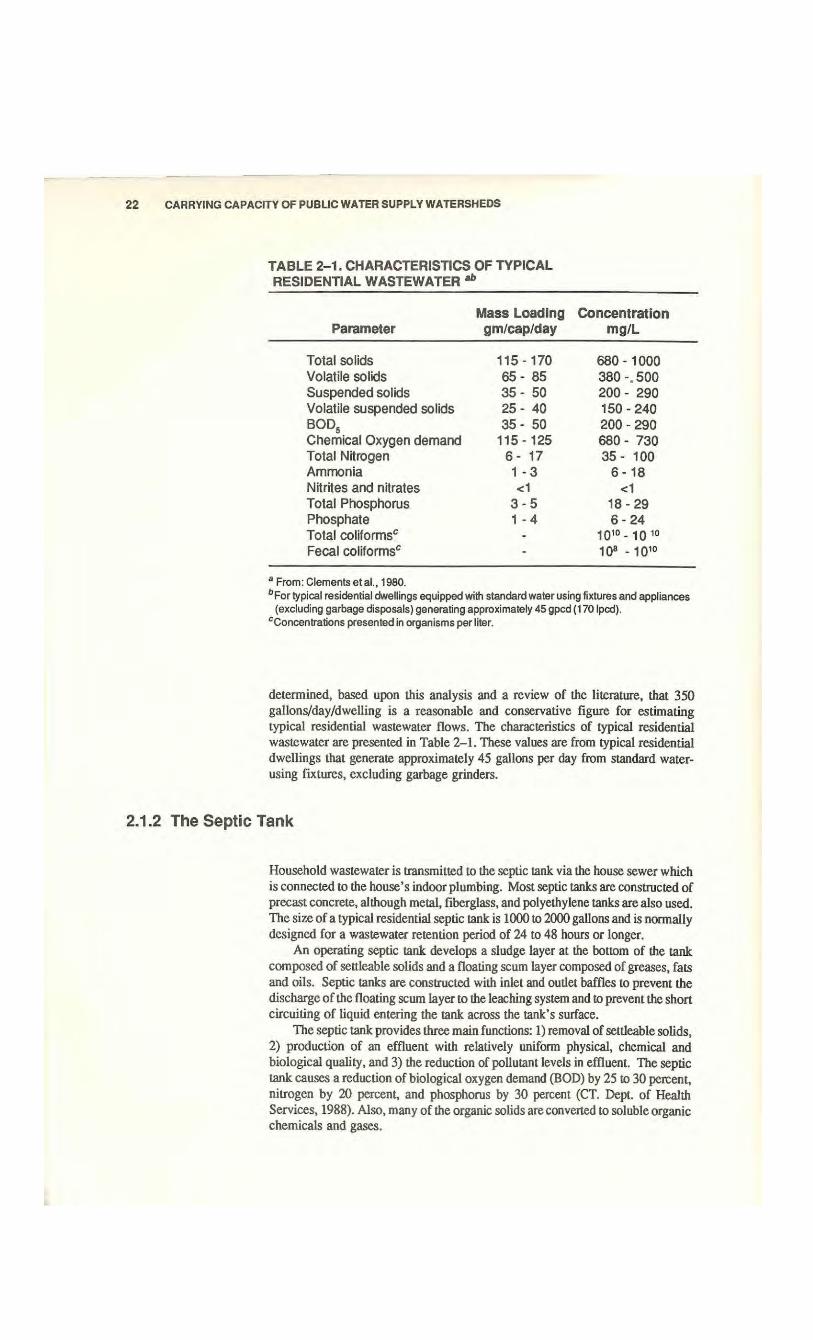
22 CARRYING CAPACITY OF PUBLIC WATER SUPPLY WATERSHEDS
TABLE 2-1. CHARACTERISTICS OF TYPICAL RESIDENTIAL WASTEWATER **
Mass Loading Concentration Parameter gm/cap/day mg/L
Total solids 115- 170 680 • 1000 Volatile solids 65 - 85 380 -.500 Suspended solids 3 5 - 50 200 - 290 Volatile suspended solids 25 - 40 150 -240 BOD 5 3 5 - 50 200 -290 Chemical Oxygen demand 115- 125 680 - 730 Total Nitrogen 6 - 17 35 - 100 Ammonia 1 - 3 6- 18 Nitrites and nitrates <1 <1 Total Phosphorus 3 - 5 18 -29 Phosphate 1 • 4 6- 24 Total coliformsc - 10 1 0 -10 1 0
Fecal coliformsc - 108 - 1 0 1 0
a From: Clements etal., 1980. b For typical residential dwellings equipped with standard water using fixtures and appliances
(excluding garbage disposals) generating approximately 45 gpcd (170 Ipcd). Concentrations presented in organisms per liter.
determined, based upon this analysis and a review of the literature, that 350 gallons/day/dwelling is a reasonable and conservative figure for estimating typical residential wastewater flows. The characteristics of typical residential wastewater are presented in Table 2 - 1 . These values are from typical residential dwellings that generate approximately 45 gallons per day from standard water-using fixtures, excluding garbage grinders.
2.1.2 The Septic Tank
Household wastewater is transmitted to the septic tank via the house sewer which is connected to the house's indoor plumbing. Most septic tanks are constructed of precast concrete, although metal, fiberglass, and polyethylene tanks are also used. The size of a typical residential septic tank is 1000 to 2000 gallons and is normally designed for a wastewater retention period of 24 to 48 hours or longer.
An operating septic tank develops a sludge layer at the bottom of the tank composed of settleable solids and a floating scum layer composed of greases, fats and oils. Septic tanks are constructed with inlet and outlet baffles to prevent the discharge of the floating scum layer to the leaching system and to prevent the short circuiting of liquid entering the tank across the tank's surface.
The septic tank provides three main functions: 1) removal of settleable solids, 2) production of an effluent with relatively uniform physical, chemical and biological quality, and 3) the reduction of pollutant levels in effluent. The septic tank causes a reduction of biological oxygen demand (BOD) by 25 to 30 percent, nitrogen by 20 percent, and phosphorus by 30 percent (CT. Dept. of Health Services, 1988). Also, many of the organic solids are converted to soluble organic chemicals and gases.
ON-SITE SEWAGE DISPOSAL SYSTEMS 23
2.1.3 The Leaching System
The general purpose of the leaching system is to dispose of septic tank effluent into the soil below the ground surface. The typical leaching system consists of a series of stone filled trenches two to three feet wide and 18 inches deep. Trenches are normally installed no greater than three to four feet below the ground surface. Trenches must follow the ground contours. Individual trenches, however can be installed at different elevations.
Alternative leaching systems consist of precast concrete or polyethylene galleries, leaching beds and leaching pits. Galleries are hollow structures constructed with an open bottom and perforated sides and are either rectangular or triangular (Tpee gallery) in shape. They are normally four feet wide and 18 to 48 inches deep. The units are placed end to end to form long trenches and, with the exception of polyethylene galleries which are backfilled with native soil or sand, are lined on either side with one foot of crushed stone.
Leaching beds are constructed in a manner similar to leaching trenches, except that the space between the trenches is excavated and backfilled with crushed stone or screened gravel. The entire bottom of a leaching bed is constructed at the same elevation.
Leaching pits are hollow structures with perforated sides and a minimum diameter of five feet and maximum depth of ten feet. They are normally constructed with precast concrete sections although they can be constructed with concrete blocks. As with leaching galleries, the side walls are surrounded with at least 12 inches of crushed stone.
In an operating leaching system, septic tank effluent is discharged to the seepage field by gravity flow or by means of a pump. After passing through the crushed stone within the leaching system, the effluent passes into the soil surrounding the system. With continued application of effluent to the soil, a biological crust develops at the stone-soil interface. With time, the entire infiltrative surface becomes crusted, creating a ponded anaerobic (without oxygen) condition within the leaching system. The crust, not the soil, now regulates the rate of infiltration of effluent into the surrounding soil. This rate is generally referred to as the long term acceptance rate ( L T A R ) and varies between 0.3 to 1.2 gallons per square foot of infiltrative surface per day (Bouma et al., 1974 and Kropf et al., 1977).
The soil environment provides most of the treatment capacity of septic systems. Upon passage through the crust layer, effluent percolates through the unsaturated soil to the saturated zone, mixes with groundwater and moves down-gradient to streams and other discharge points.
0.2 THE FATE OF SEPTIC SYSTEM POLLUTANTS
The transport and fate of septic system pollutants are of ultimate concern regarding the protection of groundwater and surface water from contamination. This section wil l address these issues so that a basic understanding of some of the processes involved can be better understood. With this knowledge, decisions regarding the design and placement of septic systems can be made with due regard to water quality protection.
2.2.1 Attenuation and Transformations Within the Soil Matrix
The septic tank and leaching fields of an operating septic system provide limited pretreatment of household wastewater. The effluent discharged from the leaching system is still heavily laden with biological and chemical pollutants. It is within
CARRYING CAPACITY OF PUBLIC WATER SUPPLY WATERSHEDS
the soil matrix surrounding the leaching system where these pollutants must be attenuated to prevent contamination of groundwater. Pollutant attenuation processes that take place within the soil matrix include physical processes such as filtration, biological processes such as microbial degradation and plant uptake, as well as chemical reactions such as adsorption, fixation, and precipitation, among others. Historically, the principal pollutanLs of concern include bacteria, viruses, nitrogen, and phosphorus. Other potential pollutants from septic systems include suspended solids, biological oxygen demand (BOD), chlorides and organic chemicals. Recently, more emphasis is being placed on the potential threat of groundwater from organic chemicals in residential wastewater, particularly within the recharge area of public or private groundwater supply areas. Each of the pollutants listed above and the attenuation processes that effect them are discussed below. Particular emphasis has been placed on bacteria, viruses, nitrogen, phosphorus and organic chemicals.
2.2.1.1 Bacteria. Household sewage contains a large quantity of bacteria, although only a very small number are normally pathogenic (disease-causing). Pathogenic bacteria are decreased in number within the septic tank through competition with and predation from other non-pathogenic bacteria. As the effluent passes through the biological crust at the stone-soil interface of the leaching system, a great many bacteria are removed through filtration. Aerobic conditions exist within the soil matrix just a few centimeters below the crust of a properly functioning septic system. A full host of soil organisms including bacteria, actinomycetes and others exist in this aerobic environment. These organisms reduce bacterial populations in effluent through competition for nutrients, and the production of antibiotics (Canter and Knox, 1985).
The primary mechanism of bacterial removal from septic effluent is believed to be filtration by the soil matrix and adsorption onto the soil particles (McNabb et al., 1977). Physical straining occurs when the bacteria are larger than the pore openings in the soil. In this respect, the finer soils such as silts and clays have a greater filtering capacity. Partial clogging of the soil pore space by organic particles in effluent may also increase the soil's straining efficiency (Canter and Knox, 1985).
The process of adsorption involves the attraction of opposite electrical charges. Soil particles and bacteria (as well as other compounds) possess either positive or negative electrical charges based on their chemical composition. Most soils carry a net negative charge. Bacteria are also known to possess a net negative charge on their surface. However, in septic effluent (which has a high ionic strength and neutral to slightly acid pH) cations (positively charged particles such as calcium, Ca + + ; magnesium, Mg + + ; sodium, Na+; and hydrogen, H + ) neutralize and sometimes supersaturate the surface of the bacteria, thus making them susceptible to adsorption to negatively charged soil particles (Canter and Knox, 1985).
The ability of soil to filter and adsorb bacteria is dependent on the amount of time available for contact between the bacteria and the soil. Contact time is dependent primarily on the flow rate of septic effluent. Ziebell et al. conducted tests on soil columns containing sands and silt loams to determine bacterial removal efficiencies. They determined that only 60 centimeters of sand removed large numbers of fecal indicators (fecal coliform and fecal streptococcus) and pathogens and that low dosing rates (10 cm/day) significantly enhanced removal. Data derived from the sill loam columns indicated that 50 cm was sufficient to remove fecal bacteria very effectively. In an analysis of bacterial movement from leaching fields, Brown (et al., 1975) determined that fecal coliform were removed by passage through approximately 100 cm of any of the three soils tested (sand, sandy clay, and clay).
ON-SITE SEWAGE DISPOSAL SYSTEMS 25
Survival time of common pathogenic bacteria in soil is approximately 3 to 6 weeks (Healy and May, 1982). Current Connecticut Department of Environmental Protection practice is to provide a minimum 3 week travel time for effluent from the leaching system to the point of concern (water supply well or down gradient property line) to allow adequate time for bacterial die-off.
Many studies have shown that properly installed and operated septic systems pose little threat to groundwater through contamination by bacteria. The potential for bacterial contamination increases under saturated flow conditions and when inadequate separating distance exists between the leaching system and fractured bedrock. Both of these conditions result in decreased travel times thus allowing less time for attenuation and die-off. In an analysis of bacterial movement through fractured bedrock, Allen and Morrison (1973) found, that at one test site, bacteria traversed a horizontal distance of 94 feet in 24 to 30 hours.
2.2.1.2 Viruses. Many of the removal mechanisms associated with bacterial attenuation also apply to viruses. Since viruses are significantly smaller than bacteria, physical filtration plays a minor role in removal. Viruses also can survive for longer periods of time in saturated environmenLs. Adsorption appears to be the principle attenuation mechanism of viruses in soil. Thus it is critical that an adequate zone of unsaturated soil exist beneath the leaching system. In a study of the efficiency of sand columns in the removal of viruses from septic tank effluent, Green and Cliver (1975) concluded that sand is effective in removing poliovirus (a presumably typical human intestinal virus) from septic tank effluent. They also determined that application rate is critical, in that i f the pore spaces between soil particles are continually saturated, a significant portion of the virus wil l not adsorb to the sand.
The C T D E P has determined that a 4 foot separating distance to ledge is a sound protective measure in preventing contamination of bedrock water supplies from viral contamination. Although the 18 inch separating distance to saturated soil (groundwater) mandated by the Connecticut Health Code is less than the 2 foot distance recommended by the sand column studies conducted by Green and Cliver (1975), the C T D E P has determined that systems designed according to the State Health Code are effective in protecting groundwater from viral contamination (Healy and May, 1982).
2.2.1.3 Nitrogen. Nitrogen in domestic sewage is present in four forms: organic nitrogen, ammonia (NH 3 ) or ammonium (NH 4
+), nitrate (N0 3 ) and nitrite ( N 0 2 ) . Since no oxygen is present in septic tank effluent, nitrogen emerges from the tank in the form of ammonium (80%) and organic nitrogen (20%). This anaerobic environment is preserved within a normally operating ponded leaching system. Due to the presence of the biological crust, aerobic conditions normally surround the leaching system. It is within this aerobic environment that the ammonium is nitrified (oxidized) to nitrate. Some of the ammonium may be also be removed by adsorbtion to soil particles before it can be converted to nitrate. The rapid transformation of ammonium beneath a septic system has been demonstrated by Walker (et al., 1979a). These authors have found that ammonium values of 62 parts per million (ppm), 1 cm below the biological crust of a leaching trench were reduced to 6 ppm at a depth of 5 cm.
Organic nitrogen that is discharged from the leaching system may be adsorbed to the soil beneath the system. However, a large percentage of the organic nitrogen will be converted to ammonium which is then transformed to nitrate. Nitrogen is further susceptible to uptake by vegetation over the leaching field.
It is estimated that approximately 40% of the total nitrogen in household wastewater is removed by the processes described above (Healy and May, 1982).
CARRYING CAPACITY OF PUBLIC WATER SUPPLY WATERSHEDS
The remainder of the nitrogen exists as nitrate which is very soluble and chemically unreactive in aerobic soils. Because of these attributes, nitrate is highly mobile and migrates freely within the soil. The only further treatment that occurs within aerobic soils is dilution.
Pollution of groundwater with nitrate from septic systems has been documented in areas of dense development (<0.5 acre lots) served by on-site septic systems over coarse sand and gravel aquifers and in areas with shallow groundwater (Miller, 1972 and Andreoli et al., 1979). Walker (et al., 1973b) has found that a minimum 0.5 acre area down gradient of systems installed in sand was required to reduce nitrate concentrations in water to the recommended drinking water standard of 10 milligrams per liter (mg/L). Miller (1972) has recommended that over highly permeable soils, a density of no greater than one dwelling per two acres of land or 300 gallons per day per acre be established in Delaware. In a study of the movement of nitrogen from a sepuc system drainfield, Starr and Sawhney (1980) calculated that the loading of nitrate from septic systems in sandy soils to groundwater aquifers below the systems is 35 kilograms per hectare (kg/h) with a density of 5 households per hectare (2 dwellings per acre). They also calculated that based on an average soil water input of 60 cm/year in the Northeast and an input of effluent to the groundwater from the sepuc systems of 14 cm/year (760 liters per household per day), the 35 kg/h of nitrate will be diluted to a concentration of about 5 mg/L. Persky (1986), in a study of groundwater quality and housing density on Cape Cod, found nitrate concentrations exceeding 5 mg/L in 25% of the wells in five of nine sample areas with housing densities exceeding 1 unit per acre. In areas with less than 1 unit per acre, nitrate concentrations exceeded 5 mg/L in 25% of the wells in only one of nine sample areas.
Current practice employed by the C T DEP is to require adequate dilution from infiltrated rainfall on the property that supports the septic system. In other words, a parcel of property must be large enough to provide adequate water from infiltrated rainfall to dilute nitrate concentrations to the recommended 10 mg/L drinking water standard. According to Thomas (et al., 1985), this requirement would dictate an absolute minimum of 0.6 acres and a recommended minimum of 1.0 acre lot size for single family homes.
Although nitrate is unreactive in aerobic soils, it can be broken down in anaerobic environments. Wetlands have been found to play a major role in the attenuation of nitrate from domestic sewage. Hence, wetlands may be very important in protecting surface water bodies from excessive nitrate loading.
Wetlands are generally characterized by fine textured soils, a high organic content, a periodically saturated soil condition and a slightly acidic pH. A l l of these characteristics provide an ideal environment for the removal of nitrate via denitrification. When oxygen is lacking, facultative anaerobic bacteria use nitrate in place of free oxygen in respiration. In this process, nitrate is first converted to nitrite and then to gaseous nitrogen (N 2 0 or N 2 ) .
In a study of the application of secondary treated wastewater to fresh water wetlands, Bartlett (et al., 1979) found that 90 to 95% of the nitrate added to wetland soil-water suspensions was reduced to nitrogenous gases. Investigations by Patrick (et al., 1976) have determined nitrate removal rates for two southern wetlands at 3.5 to 7.4 kilograms of nitrogen per hectare per day.
2.2.1.4 Phosphorus. Phosphorus is found in appreciable amounts in household waste water. It has been estimated that total per capita contribution of phosphorus to wastewater is two to six grams per day (Laak, 1977). The majority of phosphorus in wastewater is from urine with the remainder from household cleaning agents including some detergents and toothpastes (Laak, 1977). Phosphorus can be present in three forms: organic phosphorus, polyphosphate and
ON-SITE SEWAGE DISPOSAL SYSTEMS 27
orthophosphate. With time, a l forms tend to become the soluble nutrient form, orthophosphate.
Analysis of septic tank leachate shows that approximately 85% of the total phosphorus is orthophosphate (Sikora and Corey, 1976). A median value of 12 milligrams per liter of total phosphorus (10.2 milligrams per liter of orthophosphate) is found in septic tank wastewater (Sikora and Corey, 1976) of which 20% to 30% is removed through storage in sludge (Laak, 1977). The remaining phosphorus enters the soil via the septic tank leaching fields and can be used by plants, adsorbed in soil or carried away by water.
The fate of phosphorus added to the soil by septic systems is influenced by the pH of the soil, the minerals contained in the soil, the amount of phosphorus added, the amount of time allowed for reactions to take place and the temperature of the soil-water system. Considered the most important factor is pH (McNabb et al., 1977). Under strongly acid to neutral conditions, phosphorus will be adsorbed to the surfaces of iron and aluminum minerals present in the soil matrix. Under neutral to alkaline conditions, phosphorus will be adsorbed to calcium ions found on solid calcium carbonate and calcium magnesium carbonate (Sikora & Corey, 1976). These reactions take place initially when phosphorus concentration is less than 5 milligrams per liter (Sikora and Corey, 1976). When this amount is exceeded, decomposition precipitation reactions dominate. That is, the phosphate wil l form relatively insoluble precipitates with iron, aluminum and calcium (Sikora and Corey, 1976).
A laboratory technique (Langmuir's isotherm) is used to determine a soil's capacity for adsorbing phosphorus. Through knowledge of a soil's adsorption capacity, the loading rate of phosphorus to be applied and the dimension of the leaching area, the depth of penetration of the phosphorus saturated layer can be calculated. Refer to Table 2-2 for phosphorus/soil attenuation values.
These calculations can be useful in determining the effectiveness of a septic tank leaching field in protecting groundwaters from phosphorus contamination. However, it has been generally found that the amount of phosphorus retained by soils greatly exceeds the amounts predicted by the Langmuir isotherm method (Sawhney and Hil l , 1975; Stuanes, 1984). This discrepancy is due to the fact that Langmuir's isotherm considers only the adsorption capacity of a soil and not the precipitation reactions or rejuvenation of the soil adsorption capacity.
Several studies have shown that with time a soil that is saturated with phosphorus can regain its ability to adsorb phosphorus (Sawnhey and Hi l l , 1975; Tofflemire and Chen, 1977). Laak (1977) suggests that phosphorus sorption site regeneration occurs slowly (approximately 6 months) during which time phosphate combines with iron, aluminum or calcium and becomes more insoluble. As these minerals are exhausted, more iron, aluminum and calcium are redissolved into the soil solution from soil particles, making available more adsorption sites. Sawhney and Hill (1975) confirmed rejuvenation in the laboratory by alternately wetting and drying soil columns. They also found evidence of rejuvenation in the examination of an operating 12 year old leaching pit in sandy soil. Their findings indicated that phosphorus moved a horizontal distance of 135 centimeters (4.4 feet) and that the soil was not saturated with phosphorus at 15 centimeter (0.5 feet) and 30 centimeter (1 foot) distances from the pit. Phosphorus sorption capacity experiments in the laboratory with the same soil, estimated phosphorus saturation of the soil at a distance of 5 meters (16.4 feet) from the leaching pit.
Hil l (1978), citing a Wisconsin Study of sandy soils where phosphorus discharged at a concentration of 10 - 12 parts per million is reduced to less than 0.5 parts per million within a few feet of the discharge point, states, "attenuation of phosphorus by soil surrounding septic tank leaching systems is dramatic." Several studies have indicated that soils in the near vicinity of septic tank drain
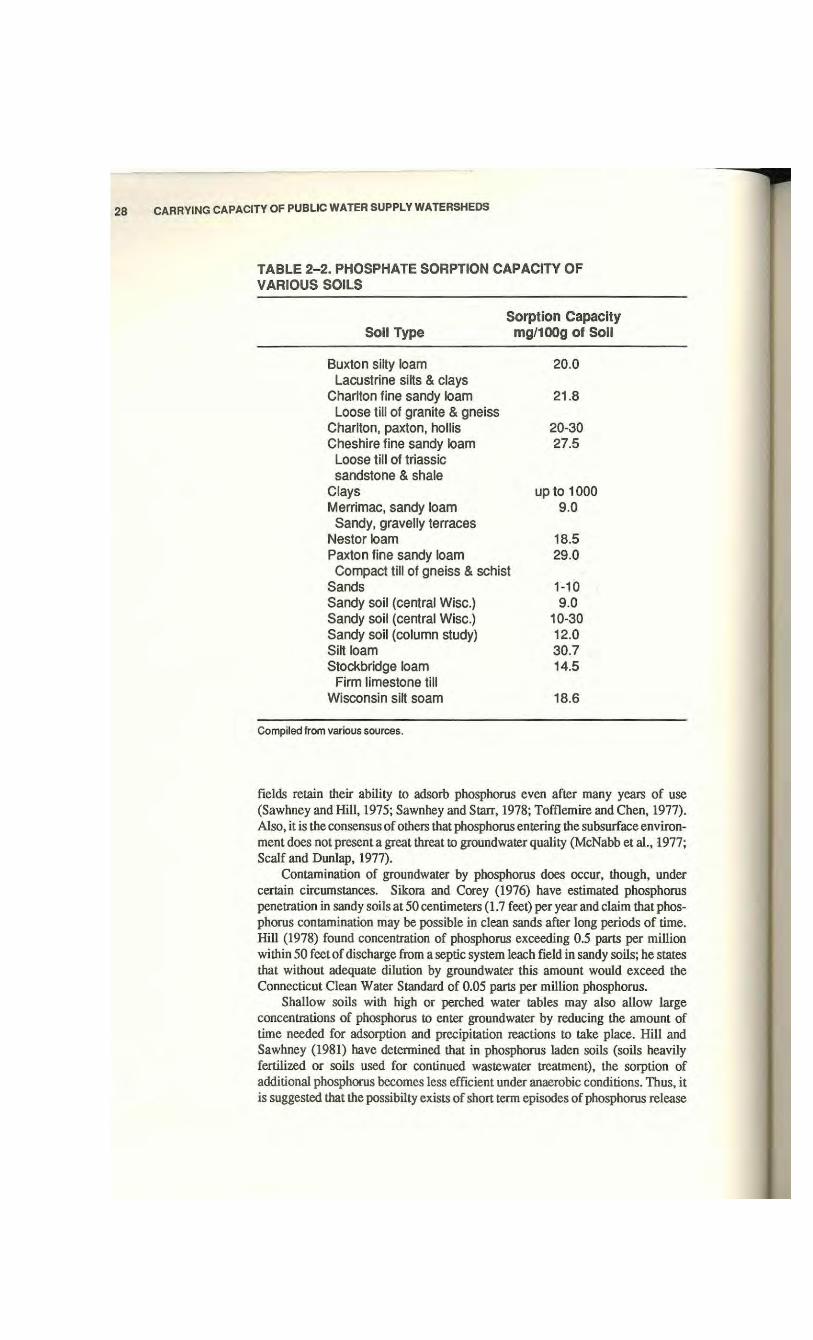
CARRYING CAPACITY OF PUBLIC WATER SUPPLY WATERSHEDS
TABLE 2-2. PHOSPHATE SORPTION CAPACITY OF VARIOUS SOILS
Sorption Capacity Soil Type mg/l00g of Soil
Buxton silty loam 20.0 Lacustrine silts & clays
Charlton fine sandy loam 21.8 Loose till of granite & gneiss
Charlton, paxton, hollis 20-30 Cheshire fine sandy loam 27.5
Loose till of triassic sandstone & shale
Clays up to 1000 Merrimac, sandy loam 9.0
Sandy, gravelly terraces Nestor loam 18.5 Paxton fine sandy loam 29.0 Compact till of gneiss & schist
Sands 1-10 Sandy soil (central Wise.) 9.0 Sandy soil (central Wise.) 10-30 Sandy soil (column study) 12.0 Silt loam 30.7 Stockbridge loam 14.5
Firm limestone till Wisconsin silt soam 18.6
Compiled from various sources.
fields retain their ability to adsorb phosphorus even after many years of use (Sawhney and Hil l , 1975; Sawnhey and Starr, 1978; Tofflemire and Chen, 1977). Also, it is the consensus of others that phosphorus entering the subsurface environment does not present a great threat to groundwater quality (McNabb et al., 1977; Scalf and Dunlap, 1977).
Contamination of groundwater by phosphorus does occur, though, under certain circumstances. Sikora and Corey (1976) have estimated phosphorus penetration in sandy soils at 50 centimeters (1.7 feet) per year and claim that phosphorus contamination may be possible in clean sands after long periods of time. Hil l (1978) found concentration of phosphorus exceeding 0.5 parts per million within 50 feet of discharge from a septic system leach field in sandy soils; he states that without adequate dilution by groundwater this amount would exceed the Connecticut Clean Water Standard of 0.05 parts per million phosphorus.
Shallow soils with high or perched water tables may also allow large concentrations of phosphorus to enter groundwater by reducing the amount of time needed for adsorption and precipitation reactions to take place. Hi l l and Sawhney (1981) have determined that in phosphorus laden soils (soils heavily fertilized or soils used for continued wastewater treatment), the sorption of additional phosphorus becomes less efficient under anaerobic conditions. Thus, it is suggested that the possibilty exists of short term episodes of phosphorus release
ON-SITE SEWAGE DISPOSAL SYSTEMS 29
from soils around septic systems if the soils are flooded by a seasonally high water table. Shallow ledge rock beneath leaching fields may also allow short-circuiting of effluent through faults and fissures causing the contamination of groundwater by phosphorus.
It is concluded that properly designed septic systems will adequately remove phosphorus from household wastewaters, and the ability of soils to remove phosphorus wil l likely outlast most systems. Phosphorus contamination of groundwater can be expected primarily in sandy soils low in organic matter, soils with high groundwater or perched water table and shallow soils over ledgerock. In these situations contamination would not be apparent until the field had been in use for a number of years.
2.2.1.5 Suspended Solids. Suspended solids in effluent are not of particular concern in surface or groundwater contamination, since septic systems appear to be very effective in their removal. Typical concentrations of suspended solids in domestic sewage are reported as 200 to 290 mg/L (Clements et al., 1980). Reported removal efficiencies of suspended solids by septic systems vary. Thomas (et al. 1985) states that within four feet of a leaching system suspended solids are reduced by 90% to 98%. Carlile (1985), citing a study by Hansel and Machmeier (1980), reports a reduction in suspended solids from 300 to 400 mg/ L in raw wastewater to zero below the trench bottom. Canter and Knox (1984) state that based on a number of studies, typical concentrations of suspended solids from septic tank effluent of 75 mg/L are reduced to typical concentrations of 18 to 53 mg/L below the system.
2.2.1.6 Biochemical Oxygen Demand. Biochemical oxygen demand (BOD) is an indirect measure of the amount of biodegradable organic matter in water. More specifically, BOD measures the amount of oxygen consumed in a water sample by bacteria during a five day test period. Domestic sewage contains a large amount of biodegradable material and a relatively high BOD concentration. Clements (et al., 1980) reports a typical BOD concentration in residential wastewater of 200 to 290 mg/L.
Anaerobic processes within the septic tank result in a B O D reduction of approximately 25 to 30% (CT. Dept. of Health Services; Laak, 1977). Further reduction occurs within the leaching system and within the aerated soil below the system. The BOD removal efficiencies, reported in the literature, indicate that properly functioning septic systems are very effective in B O D removal. Hansel and Machmeier (1980), as cited in Carlile (1985), indicate reductions in BOD from 270 to 400 mg/L in raw wastewater to less than 1 mg/L at a point 30 cm below the leaching trench. Canter and Knox (1984) report typical BOD concentrations of 140 mg/L in septic tank effluent with a reduction to 28 to 84 mg/L below the system.
Although properly constructed septic systems are unlikely to cause significant groundwater degradation through BOD contamination, leaching systems constructed in highly permeable soils with shallow groundwater may have an adverse impact on groundwater quality. Under such conditions, rapid movement of effluent into the groundwater does not permit sufficient contact with microorganisms within the aerated soil.
2.2.1.7 Chlorides. Chlorides in domestic sewage do not normally pose a significant threat to groundwater quality. The absolute value of chlorides in wastewater is dependent on those present in the household water supply. A typical concentration of chloride in domestic sewage has been reported as 70 mg/L (Thomas
CARRYING CAPACITY OF PUBLIC WATER SUPPLY WATERSHEDS
et al., 1985). Canter and Knox (1985) report a range of 37 to 101 mg/L of chloride in septic tank effluent. The taste threshold of chloride in drinking water is lOOmg/ L . The maximum allowable concentration of chloride in drinking water has been established at 250 mg/L by the U.S. Public Health Service (1962).
Chloride exists in an anionic (negatively charged, C I ) form and therefore does not adsorb to negatively charged soil particles. Thus, it is highly mobile in the aqueous phase and moves rapidly with percolating groundwater. The most important form of treatment in soil is dilution. Due to the low concentrations of chloride in domestic sewage, dilution from infiltrating water is sufficient to reduce chloride concentrations to acceptable levels on sites with subsurface sewage disposal systems.
Increased levels of chlorides in wastewater and increased potential for groundwater contamination may result from the use of ion exchange water softeners. Water softeners remove calcium and magnesium ions from hard water and replace them with sodium, making the water soft. The reactive media in a water softener periodically requires recharging to regenerate its ion exchange capability. Most often this is accomplished by replacement of the filter unit on a regular basis by a water conditioning company. However, some systems are recharged onsite by backwashing the mineral media to loosen deposits and subsequent rinsing with a concentrated brine solution. The waste brine contains high concentrations of sodium chloride and is often discharged to the septic system. Due to the concern about disruption of the normal physical and biological functions of septic systems from backwash type water softeners, their use is prohibited by section 19-13-b20 of the Connecticut Public Health Code.
2.2.1.8 Organic Chemicals. The potential for groundwater contamination by toxic organic chemicals discharged from septic systems has recently received widespread attention. Many potentially hazardous chemicals may be present in domestic sewage. These chemicals originate from such sources as household cleaners, drain cleaners, stain removers, paint, paint thinners, septic tank cleaners, and petroleum products. Home hobby activities may be particularly threatening to groundwater quality due to the significant amount of hazardous chemicals associated with such activities as photographic development, furniture refinish-ing, metal working, horticulture, and arts and crafts.
The identification of organic contaminants in domestic sewage and their transport and fate in the subsurface environment is a relatively new area of research. A variety of possibilities exist for the movement and attenuation of organics including volatilization, adsorption, microbial and plant uptake, bacterial degradation and transport in percolating ground water. These processes are dependent upon characteristics of the contaminant, soil characteristics, and subsurface environmental conditions (Canter and Knox, 1985).
Kolega (et al., 1986) has investigated the contribution of toxic chemicals to groundwater from domestic septic systems in Connecticut. The study involved the evaluation of the movement of several volatile organic compounds and hydrocarbons present in household wastewater into the surrounding groundwater. The authors state that based on results of the study it is apparent that volatile organic compounds and hydrocarbons, if present in domestic sewage, make their way into the groundwater area near the on-site sewage disposal system. It was also found, however, that none of the Connecticut Health Services potable drinking water action levels (refer to Appendix H) for several organic compounds (benzene, methylene chloride, tetrachloroethylene, toluene, 1,1,1 trichloroethane and trichlo-roethylene) were exceeded for the groundwater observations made during the two year study period. Based on this study, it appears that domestic sewage disposal

ON-SITE SEWAGE DISPOSAL SYSTEMS 31
systems may contribute E P A priority pollutants to groundwater within the vicinity of the system but not at levels that pose a serious threat to groundwater quality within the area of the systems studied (Kolega et al., 1986). It should be noted however, that many potentially toxic contaminants in sewage do not have drinking water standards adopted for them yet. Since actual toxicological data is limited, some of the organic chemicals found in domestic sewage at low levels may represent human health problems.
Due to the complicated and highly variable nature of groundwater contamination by organic chemicals, a complete review of the subject is beyond the scope of this investigation. Three potential sources of contamination from residential wastewater will be addressed to provide a better understanding of the subject. These examples include home photographic processing, home furniture stripping and the use of septic tank cleaning products.
Some of the compounds found in photographic processing solutions include acetate, thiosulfatc, sulfites, formaldehyde, butyl alcohol, benzylalcohol; 2,4 dinitrophenol; hydroquinone, p-methylaminophenol, ethylene diamine, hexylene glycol, and cytrazinic acid. Potential hazards associated with discharge of film developing and processing wastes include their high chemical oxygen demand and potential toxicity. Silver is also almost always present in processing wastewater. It has a high potential toxicity to microorganisms and aquatic life. Silver is not present in the processing chemicals, but is introduced from film into the mixing bath by reaction with thiosulfatc. According to Harrison and Dickinson (1984), discharges of small quantities of silver thiosulfate to septic systems are not expected to pose water quality problems. This is due to the silver existing in a very insoluble form (silver sulfide) in the septic tank which is periodically removed through regular septic tank pumpings.
Occasionally a ferricyanide bleach may be used as a precursor to the fixing bath. Ferricyanide is transformed into the more stable, non-biodegradable form, ferrocyanide through reaction with thiosulfate in the fixing bath. Due to ferrocya-nide's non-biodegradable nature it may simply pass through the septic system and into groundwater unaffected. Harrison and Dickinson (1984) state that since the concentrations and quantities of film processing wastewaters from home darkrooms are normally so small, the release of ferrocyanide is anticipated to be insignificant.
Although the small volumes of dilute rinsewaters generated by home darkrooms pose little threat to groundwater contamination, the disposal of spent or unused solutions of concentrated chemicals can be detrimental. These chemicals may remain untreated by conventional subsurface disposal processes and may also have a detrimental impact upon bacterial populations within the septic tank and leaching systems.
Home furniture stripping and refinishing poses another threat to groundwater quality from discharge of unused solutions and rinse water. Most household strippers contain methylene chloride in combination with alcohol (usually methanol or isopropyl alcohol) and water. The stripping process usually involves soaking the piece of furniture with the stripping solution and then scraping, wiping or brushing off the dissolved paint or finish. In some cases, the dissolved paint or finish may be removed in a rinse tank or by pressure hosing. This process produces a wastewater that must be disposed of.
According to Harrison and Dickinson (1984), methylene chloride and the alcohols are biodegradable and thereby do not present a significant threat to groundwater in low concentrations. Metals may also be present in stripping rinsewater depending upon the type of paint removed from the furniture. Lead and zinc are the most common metals found in rinsewaters because of their presence
32 CARRYING CAPACITY OF PUBLIC WATER SUPPLY WATERSHEDS
in paints (Harrison and Dickinson, 1984). Again, concentrations of these metals may be low enough in dilute rinsewaters as to not pose a serious threat to groundwater.
Many septic additives are sold which are purported by the manufacturers to reduce odors, clean, unclog, and generally enhance septic system operation. Little evidence indicates that these cleaners perform any of these functions and in actuality may hinder effective system operation. Many additives are solvents containing chlorinated hydrocarbons such as methylene chloride and trichlo-roethane. Both of these compounds are listed on the U.S. Environmental Protection Agency's list of priority pollutants, with health advisories issued for them by the E P A ' s Office of Drinking Water (Noss and Drake, 1986).
Chlorinated hydrocarbons are relatively persistent in the environment, and may readily pass through a subsurface disposal system with little or no treatment. A laboratory study of the fate of methylene chloride and trichloroethane in septic systems was conducted by Noss and Drake (1985). Their results indicated that over 75% of the applied methylene chloride was discharged in the septic tank effluent within three weeks of dosing. They also found that very little of the trichloroethane appeared in the septic tank effluenL Examination of the septic tank contents revealed a thin layer of very high concentrations of the compound at the bottom of the tank. The authors reasoned that since trichloroethane is relatively dense and not highly soluble it simply sinks to the bottom of the tank. Furthermore they reasoned that it would be expected that the compound would bleed out of the septic tank at approximately 800 ug/1 starting one week after addition.
Because of the hazardous nature of many septic tank additives and their high potential for groundwater contamination, vending of these products within the state is now restricted. Under section 22a-462 of the Connecticut General Statutes, any additive product now sold in the state must be properly labeled and registered. Furthermore, the additive must carry a statement from the manufacturer indicating that there are no toxic pollutants in the product.
Although studies seem to indicate that the typical discharge and groundwater concentrations of organic chemicals fall far below drinking water standards, there is substantial concern that as detection levels and knowledge increase, the drinking water standards will become increasingly stringent while available treatment will remain somewhat fixed (May, 1988). Connecticut potable water quality criteria are presented in Appendix K . The residual impact of organic chemicals in soils, sediments and drinking water supplies is still unclear at this time and indeed may increase with continued development density.
2.3 REDUCING THE POTENTIAL FOR GROUNDWATER AND SURFACE WATER CONTAMINATION
Numerous measures can be taken to minimize the possibility of water pollution from septic systems. Perhaps the most important measures are the proper siting, design and construction of on-site sewage disposal systems. Other methods include controlling septic tank influent by restricting discharge of certain chemicals, reducing wastewater flows through water conservation, use of alternative and innovative systems that reduce wastewater loading or concentrations of certain compounds to the leaching system, effective maintenance of on-site systems, including local or regional maintenance programs, the use of zoning and other land management controls to prevent septic system installations in unsuitable areas and to restrict system densities in sensitive areas, and development of
ON-SITE SEWAGE DISPOSAL SYSTEMS 33
a monitoring program to identify failing septic systems for subsequent repair or replacement.
2.3.1 Septic System Siting, Design and Construction
The most common source of impact on surface waters from subsurface sewage disposal systems is system failure that results in the discharge of untreated septic tank effluent onto the land surface and subsequent discharge into water bodies via overland flow. Inadequate separating distance between sewage disposal systems and surface water bodies or underground water drainage systems (i.e. curtain drains) may also cause water pollution through inadequate treatment of septic tank effluent.
The potential for groundwater contamination is enhanced when systems are installed in areas of high groundwater, shallow bedrock and highly porous soils. Systems installed without adequate separating distance to groundwater result in insufficient effluent treatment due to the absence of an aerated soil environment. Insufficient separating distance between a leaching system and bedrock lets untreated effluent enter bedrock fractures resulting in the pollution of bedrock aquifers. Due to the rapid movement of water through very porous soils as well as the soil's limited treatment capacities, large numbers of septic systems installed in very coarse sands and gravels can pose a threat to groundwater quality.
The potential for water pollution from on-site sewage disposal systems can be significantly reduced through proper siting, design and construction of these systems. The Connecticut Health Code Regulations (Sections 19-13-bl03 and 19-13-M04) regarding household sewage disposal systems, set minimum requirements for such systems. Technical Standards are also published by the Commissioner of Health Services which regulate the design, installation and operation of subsurface sewage disposal systems. Enforcement and administration of the regulations is delegated to the local directors of health and their agents.
Several publications are available to assist those responsible for the design and installation of septic systems. The U.S. E P A has published a "Design Manual - On-site Wastewater Treatment and Disposal Systems" (Clements et al., 1980). "Design of Subsurface Sewage Disposal Systems for Households and Small Commercial Buildings" is available from the State of Connecticut Department of Health Services. Concepts and requirements of the Connecticut Department of Environmental Protection regarding land treatment and disposal systems for wastewater can be found in "Seepage and Pollutant Renovation Analysis for Land Treatment, Sewage Disposal Systems" (Healy and May, 1982).
Although septic systems work extremely well when designed and constructed in compliance with code and guideline requirements, there are factors that can increase the likelihood of system failure or inadequate operation. Some of these factors as outlined by May (1988) are listed below.
• Few engineers and health officials have a profound understanding of the arcane field of on-site disposal, which tends to limit practice to knowledge of the health code.
• The code, while very good, particularly in light of other state's efforts, does have imperfections.
• The State has no ongoing training program for system installers, and requires no theoretical knowledge, which limits the ability to make correct field changes to meet site conditions.
• Pay is lacking for sufficient on-site town or district inspections to ensure that installation is propei.
CARRYING CAPACITY OF PUBLIC WATER SUPPLY WATERSHEDS
The most critical factor in the siting and design of septic systems is the site investigation. The identification of soil limitations such as seasonal high groundwater and shallow bedrock is necessary to prevent premature system failures. The investigator should be competent at interpreting soil conditions that will effect sewage disposal. Site testing usually involves the digging and examination of deep test holes and percolation tests, although other tests may be required based on site conditions.
The improper construction of septic systems is another major reason for premature system failure. Although installers must be licensed by the State of Connecticut, supervision and inspection of all installations is critical. It is important that soil characteristics are not altered prior to or during system installation through compaction or sealing of the excavated sidewalls through smearing.
The use of cluster development with on-site community sewage disposal can in many cases take advantage of a property's soil potential for sewage disposal. Rather than constructing individual septic systems on sites with marginal sewage renovation capacity, the effluent can be discharged to a large community system or clustered individual systems in an area with soils better suited for subsurface sewage disposal. Of course this technique may not be applicable in all cases, but it can be useful where site conditions are appropriate. Maintenance of community or clustered septic systems can be controlled more effectively than individual systems since the responsibility usually lies with a private community association or with the local municipality through such agencies as Water Pollution Control Authorities.
Many local zoning and subdivision regulations prohibit the use of cluster development. From the standpoint of protecting groundwater and surface water quality, these regulations may be self defeating. More flexible land use regulations can often enhance protection of natural resources as is the case with allowing cluster development with associated community or clustered sewage disposal systems. Yaro (et al., 1988) presents many beneficial aspects of cluster development and land conservation in their report dealing with development in the Connecticut River Valley. Their publication also contains a number of "state of the art" model land use ordinances dealing with such issues as open space protection, site plan review, farmland preservation and riverbank/lakeside communities.
Some Connecticut towns, such as Wilton and Ridgefield, provide for the preservation of natural and ecologically important features by encouraging flexibility of design and development through zoning regulations pertaining to "Conservation" and "Planned Residential Development" (PRD). As stated in "Zoning, Chapter 29, From The Code of The Town of Wilton," the Planning and Zoning Commission is authorized to approve Conservation Development and PRD's, provided it is determined that such developments satisfy the following objectives.
• Preserve the natural, scenic and ecologically important features of the town's remaining undeveloped land.
• Encourage flexibility of design and development in such a way as to promote the most appropriate use of land, considering its particular topography, size, shape, soils, natural features, historic assets and other similar features, and to prevent soil erosion and water pollution.
• Preserve wetlands and otherwise control new developments so as to minimize hazards resulting from stormwater runoff and stream flooding.
• Provide the maximum land area for open space, park and recreation purposes, including trails.
ON-SITE SEWAGE DISPOSAL SYSTEMS 35
• Protect and preserve the semirural character of the town's residential areas. • Facilitate the economical construction and maintenance of roads, utilities, and
other public facilities in new developments.
In Wilton, the density of development allowed in a PRD is determined by multiplying the total acreage of the property (minimum 40 acres required) by 80% and dividing by 2 for a 2 acre zone and by 1 for a 1 acre zone. Furthermore, the area of residential development can not exceed 40% of the total acreage.
In Ridgefield, the minimum property size eligible for P R D is 6 contiguous acres. The allowable density of development is determined by dividing the net development area by the minimum lot area required for the zoning district in which the property is located. In no case can the number of dwelling units exceed the number permitted i f the land was subdivided according the requirements of the district in which the land is situated. In reality the maximum number of lots permitted in a PRD or Conservation Development is often governed by the number of sites suitable for septic system construction.
2.3.2 Pollutant Mass Reduction
One of the simplest and least expensive methods of reducing the potential for groundwater and surface water contamination by septic systems is to reduce or eliminate certain wastewater constituents. Wastewater pollutant loads can be reduced by restricting use of certain products in the home.
Phosphorus loads in domestic wastewater largely result from household cleaning activities. It has been estimated that clothes washing and dish washing can account for over 70% of the phosphorus in residential wastewater (Clements et al., 1980). The use of detergents that contain either low amounts or no phosphorus are readily available and can result in significantly reduced phosphorus concentrations in wastewater.
Since garbage disposal units contribute substantial quantities of biodegradable organics, suspended solids, and grease, they increase the likelihood of premature system failure through discharge of solids and grease to the leaching system. Biochemical oxygen demand and suspended solids concentrations can be greatly reduced through the elimination of this appliance.
The disposal of solids in wastewater such as diapers, sanitary napkins, facial tissues, cooking grease and food debris is unnecessary. Al l of these items can be disposed of in a solid waste form, thus reducing the mass pollutant load of wastewater.
The segregation of black water (toilet waste) from household wastewater can significantly reduce the concentration of such pollutants as suspended solids, nitrogen, and pathogenic organisms. Black water segregation can be attained through the use of alternative toilet systems such as compost toilets, incinerator toilets, privies, recycling systems, and very-low volume flush toilets. These devices will be discussed in greater detail in section 2.3.5.
Groundwater contamination from the use of septic tank cleaners containing trichloroethylene, methyl chloride or other chlorinated organics has been documented. Many public and private drinking water wells have been closed in Long Island due to contamination with these substances (Council on Environmental Quality, 1981). Restricting the use of these products is critical in protecting groundwater, especially in water supply recharge areas. Reducing or eliminating the use of household cleaning agents containing hazardous chemicals will also lessen the chances of groundwater degradation. Local or regional hazardous waste collection days (refer to section 4.4) such as those recently held in the communi-
36 CARRYING CAPACITY OF PUBLIC WATER SUPPLY WATERSHEDS
ties of Litchfield and Torrington, can be used to collect materials such as paints, thinners, strippers, solvents, photographic processing chemicals and petroleum products that might otherwise be poured down the drain into septic systems.
2.3.3 Water Conservation
Reducing the amount of liquid discharged to a subsurface sewage disposal system through water conservation may serve to prolong the life of that system. Septic systems installed in areas of high groundwater or slowly permeable soils can benefit greatly from water conservation by maintaining an unsaturated soil profile below the system. Systems that are marginally failing due to excessive hydraulic loading can often be restored to operating condition by reducing effluent volumes.
Many techniques and devices are available to reduce household water use and concomitant wastewater flows. Examples of wastewater flow reduction methods are presented in Table 2-3. Significant water use reductions can often be obtained through improved user habits. Examples may include not letting the water run while brushing teeth or shaving, operating washing machines with only full loads, and not flushing toilets unnecessarily such as to dispose of facial tissues or cigarette butts.
Numerous commercial water conservation devices are readily available; refer to Appendix A for a partial listing of commercially available water conservation devices. Since over 70% of a typical residential dwelling wastewater flow is generated by toilets, baths, showers and clothes washers (Clements et al., 1980), major flow reductions can be obtained by directing water conservation to these fixtures. Some of the devices available for use with conventional flush toilets include tank inserts (i.e. plastic bottles, flexible panels) that displace the amount of water in the tank and water saving toilets that incorporate various methods to reduce flush water volumes. Wastewater flow reduction devices for showers include flow restrictors that reduce water volume but not pressure, manufactured reduced flow showerheads, and on/off showerhead valves that can be used to turn off water flow during washing or shampooing.
Clotheswashers are also available that use less water than conventional machines. Front loading model automatic washers can reduce water use by 40% over conventional machines. Washers with adjustable cycle settings and load adjustment features are also effective in reducing wastewater flows. Several commercially made washers use a recycle feature that allows reuse of washwater for subsequent loads.
In a study of the efficacy of water conservation for renovation of failing on-site disposal systems, Cole and Sharpe (1981) found waste flow reductions of 16.2 to 39.8% due to installation of water conservation devices. Reduced liquid volumes also resulted in increased concentrations of most septic tank effluent parameters including nitrogen, phosphorus, chemical oxygen demand and chlorides. The authors concluded, however, that although installation of water saving devices will result in higher concentrations of pollutants in septic tank effluent, mass loading should remain constant or be reduced by virtue of improved septic tank treatment. Furthermore, any increase in pollutant concentration should be more than offset by the significant decrease in hydraulic load on the leaching system.
2.3.4 On-Site Sewage Disposal System Maintenance
Typical on-site sewage disposal systems require very little maintenance. Periodic pumping of the septic tank to remove accumulated solids and grease is the only routine maintenance necessary. It is suggested that septic tanks be inspected at
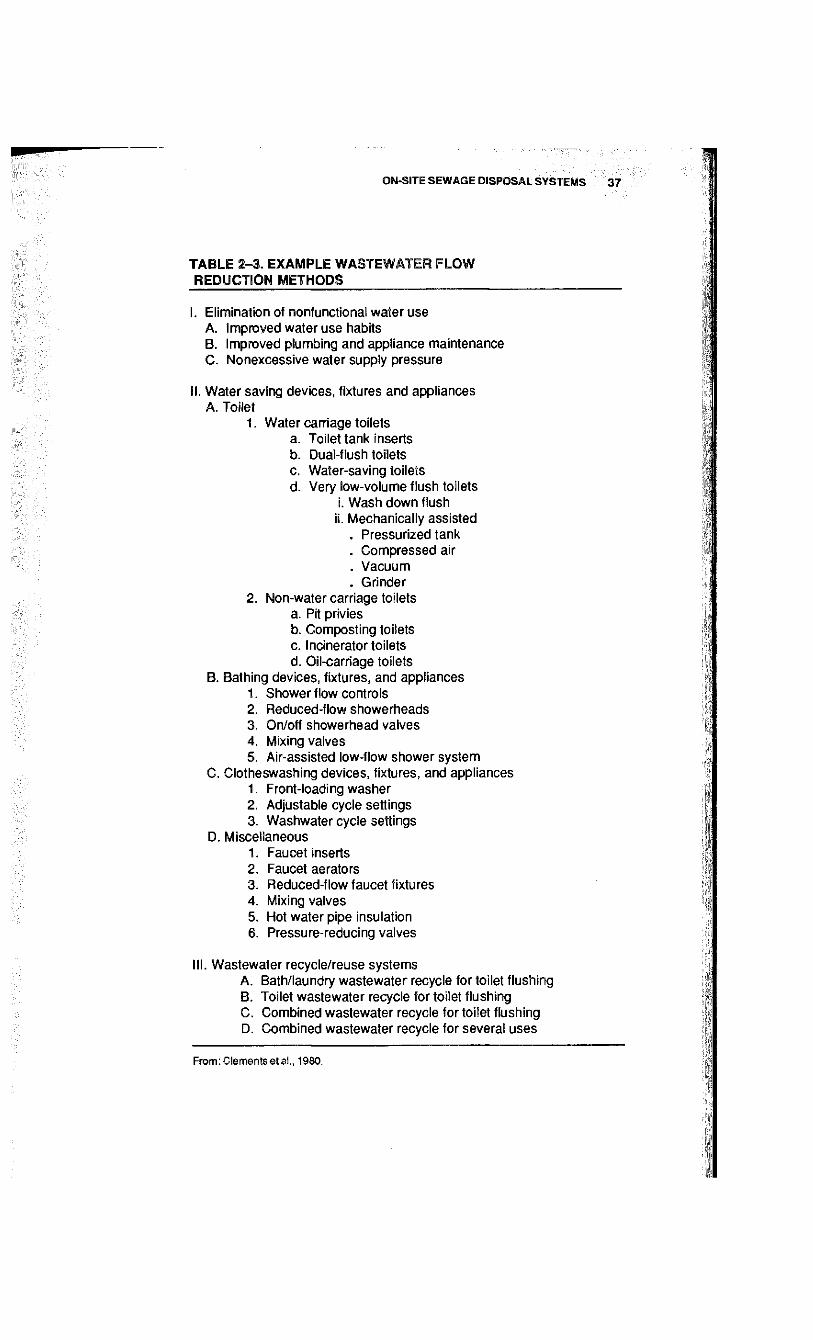
ON-SITE SEWAGE DISPOSAL SYSTEMS 37
TABLE 2-3. EXAMPLE WASTEWATER FLOW REDUCTION METHODS
I. Elimination of nonfunctional water use A. Improved water use habits B. Improved plumbing and appliance maintenance C. Nonexcessrve water supply pressure
II. Water saving devices, fixtures and appliances A. Toilet
1. Water carriage toilets a. Toilet tank inserts b. Dual-flush toilets c. Water-saving toilets d. Very low-volume flush toilets
i. Wash down flush ii. Mechanically assisted
. Pressurized tank
. Compressed air
. Vacuum
. Grinder 2. Non-water carriage toilets
a. Pit privies b. Composting toilets c. Incinerator toilets d. Oil-carriage toilets
B. Bathing devices, fixtures, and appliances 1. Shower ftow controls 2. Reduced-flow showerheads 3. On/off showerhead valves 4. Mixing valves 5. Air-assisted low-flow shower system
C. Clotheswashing devices, fixtures, and appliances 1. Front-loading washer 2. Adjustable cycle settings 3. Washwater cycle settings
D. Miscellaneous 1 . Faucet inserts 2. Faucet aerators 3. Reduced-flow faucet fixtures 4. Mixing valves 5. Hot water pipe insulation 6. Pressure-reducing valves
III. Wastewater recycle/reuse systems A. Bath/laundry wastewater recycle for toilet flushing B. Toilet wastewater recycle for toilet flushing C. Combined wastewater recycle for toilet flushing D. Combined wastewater recycle for several uses
From: Clements etal., 1980.
38 CARRYING CAPACITY OF PUBLIC WATER SUPPLY WATERSHEDS
intervals of no more than every two years to determine the rate of scum and sludge accumulation (Clements et al., 1980). At a minimum, septic tanks should be pumped every 3 to 5 years. Inlet and outlet baffles should be inspected for damage after every pump-out. Failure to remove scum and sludge deposits from septic tanks on a regular basis may result in the premature failure of a septic system due to the discharge of solids to the leaching fields which clog the system's infiltrative surfaces. Furthermore, frequent pumping of septic tanks may help prevent the loss of metals and hydrocarbons to the leaching field.
Although local health departments are required by the State Health Code to approve the design and installation of septic systems, there are no requirements regarding septic tank maintenance. Homeowners, in many cases, do not routinely have their septic tanks inspected or maintained. For this reason it would be beneficial to establish a local or regional maintenance enforcement program. Issuance of operating permits based upon satisfactory completion of routine maintenance is one tool that can be used to encourage homeowners to fulfill this responsibility. The Town of Hebron issues permits to discharge every three years based upon evidence of having the septic tank pumped out. The preparation and distribution of a homeowner's information booklet on septic system operation and maintenance is another program that can be instituted to address this issue.
2.3.5 Alternative and Innovative Systems
Most alternative and/or innovative systems are designed to provide one of the following functions: wastewater reduction, nutrient removal, disinfection, and enhanced effluent treatment. Several systems are available for the segregation and removal of blackwater from the wastewater stream. These blackwater treatment systems include compost toilets, incineration toilets, chemical or oil flush toilets, dry vault privies, chemical privies and recycling systems. These systems are primarily used to reduce the pollutant load of domestic wastewater. The segregated graywater component must be treated using a conventional subsurface disposal system.
Compost toilets are self contained treatment and disposal units for human wastes and kitchen wastes. The organic material deposited in these units is composted for approximately one year to produce a humus that is suitable for use as fertilizer. Incineration toilets are self contained units that utilize electricity or gas to attain temperatures suitable for the combustion of human wastes. Chemical or oil flush toilets utilize a chemical solution or oil as a carrier fluid instead of water. The wastes are removed from the fluid in a holding tank and the fluid is recycled. Dry vault privies consist of self contained water tight chambers for the acceptance of human waste. When the chamber is full it is either cleaned out or allowed to rest for a sufficient time period to allow for the composting of the waste material. Chemical privies are water tight vaults that contain a chemical solution that must be periodically replaced. Recycling systems are also available that treat blackwater through filtration and disinfection for reuse as toilet flush water.
Many systems have been developed to enhance the treatment capability of conventional on-site sewage disposal systems. These systems include sand filters, aerobic treatment units, disinfection units, and various nutrient removal systems.
Two basic types of sand filters have been developed, the intermittent sand filter and the recirculating sand filter. Intermittent sand filters typically consist of a sand bed underlain by gravel which is intermittendy dosed with septic tank effluent. Recirculating sand filters utilize a recirculating tank between the septic tank and sand bed for the return of a portion (usually 20%) of the filtered effluent to the recirculating tank. Sand filters primarily provide physical straining and sedimentation of suspended solids. This results in an effluent with very low
ON-SITE SEWAGE DISPOSAL SYSTEMS 39
suspended solids and biological oxygen demand concentrations. Nitrogen is normally transformed almost completely to the nitrate form. Phosphorous concentrations may be reduced up to 50% initially, but the capacity of the sand to adsorb phosphorus diminishes with time. Sand filters are also capable of reducing total and fecal coliform concentrations significandy. Aerobic treatment units can be employed on-site to remove substantial amounts of biological oxygen demand and suspended solids that are not removed through simple sedimentation. The conversion of ammonia in wastewater to nitrate and the removal of a substantial amount of pathogenic organisms is also accomplished through effluent aeration. Aerobic treatment units typically follow pre treatment by a septic tank. The unit itself normally consists of a concrete chamber which utilizes some type of mechanism to introduce oxygen into the wastewater. Aerobic treatment units rely on microorganisms for much of the wastewater treatment. Two processes are used to enhance biological growth: suspended growth and fixed growth. Each system has its own operational characteristics but both are designed to provide oxygen transfer to the wastewater, intimate contact between the microbes and the waste, and solids separation and removal (Clements et al., 1980).
Disinfection units can be used to destroy pathogenic organisms in wastewater. They are most often used on systems that discharge effluent to the soil surface or surface waters but they can also be used where bacterial or viral contamination of groundwater by septic systems has been identified. The most commonly used disinfectants for on-site application are chloride, iodine, ozone and ultraviolet light (Clements et al., 1980).
A number of nutrient removal processes have recently been developed for on-site applications. Most of these treatment processes are geared toward the removal of nitrogen and phosphorus from wastewater.
As has been already discussed, nitrification of septic tank effluent occurs readily within sand filters, aerobic treatment units, and within the aerated soil below a leaching system. Biological denitrification which converts nitrate to nitrogen gas is the goal of most nitrogen removal systems. This type of system most typically uses a chamber filled with stone that is maintained in an anaerobic state. The anaerobic chamber must be preceded by some type of aeration system for the conversion of ammonia to nitrate. An organic carbon source is added to the anaerobic tank to provide a carbon to nitrogen ratio of approximately 3:1. A passive denitrification system (Ruck System) that utilizes segregated graywater as a carbon source has been developed and used as a means of nitrogen removal from on-site septic systems (Laak, 1982; Laak, 1986).
Phosphorus removal from wastewaters can be accomplished through chemical precipitation. Methods utilized normally include the addition of the chemical to wastewater, high speed mixing and slow agitation followed by sedimentation (Clements et al., 1980). The chemicals most often used for phosphate precipitation are aluminum and iron compounds.
It has long been recognized that wetlands are effective in the removal of nitrogen and phosphorus from wastewater. Many studies have documented the significant nutrient removal capabilities of wetland systems utilized for the treatment of municipal wastewaters (Kadlec et al., 1977; Patrick et al., 1976; Bartlett et al., 1979; van der Valk et al., 1978; Kadlec, 1978; Nichols, 1983). The small scale utilization of wetlands as treatment systems for on-site subsurface sewage disposal is currenUy being investigated by Land-Tech Consultants, Inc. The typical soil sequences found in Connecticut may provide the necessary conditions for the complete renovation of wastewaters.
As stated by Luce and Welling (1983), "Pleistocene glaciation has left New England with landscapes that contain topo-drainage sequences of soils herein
40 CARRYING CAPACITY OF PUBLIC WATER SUPPLY WATERSHEDS
hypothesized to be highly effective in the removal of nitrogen from septic tank leachate." These soil sequences typically consist of upland soils underlain by a relatively impervious hardpan layer which causes effluent to flow down slope through various soil types. On a typical drumlinoid topography such as those found in Litchfield County, effluent would flow through a well drained soil such as Paxton, then through a moderately well drained soil such as Woodbridge and finally through a poorly drained wedand soil such as Ridgebury, Leicester, Whitman series. It is expected that nitrogen would be converted to nitrate within the well drained and moderately well drained soils with subsequent denitrification within the anaerobic wetland soils. Any excess nitrogen and/or phosphorus entering the wetland would be removed through plant uptake or other removal processes.
Use of most of these alternative/innovative systems is somewhat limited at this time, but there is great potential in their use for the enhancement of conventional septic system operation. The use of such methods as small home recirculating sand filters, home ozonation units, and small artificial wedands to augment residential sewage disposal may be more widespread in the future. The possibility also exists that as more alternative systems are used, land development may become more intense; sites that are unsuited for conventional septic systems may be buildable through the use of new sewage treatment technology. Since treatment efficiencies are typically enhanced by alternative sewage disposal design, a direct impact upon water quality may not result from more intense development. However, increased potential for water quality degradation from other impacts associated with residential development (i.e stormwater, non-point sources, erosion and sedimentation) may offset the benefits gained from enhanced sewage treatment.
2.3.6 On-Site Sewage Disposal System Density
One of the key questions in determining the potential for water quality degradation from on-site sewage disposal systems is how much land area is needed to reduce the concentration of pollutants in domestic sewage to acceptable levels. The pollutant of most concern in determining septic system densities is nitrate. In many areas nitrate is not generally a concern because conditions exist where nitrate is removed from effluent via denitrification. However, in very porous soils such as those existing in aquifer recharge areas, dilution is the only mechanism for nitrate removal. Therefore, adequate land area is needed for the dilution of nitrate from infiltrating water.
Holzer (1975) determined that a dilution of renovated effluent of at least one to one is required to reduce nitrate concentrations to the public health standard of 45 mg/L in permeable soils with deep water tables. Through analysis of the amount of groundwater recharge available for dilution in a typical drainage basin in eastern Connecticut, he concluded that residential development in this area should not occur at densities greater than an average of one residence per acre on well drained sites in areas covered by glacial till.
Adolphson (1985), as cited in Cogger (1988), determined in a study of nitrate contamination in an area of highly permeable soils that the greatest threat to nitrate standards occurred when average lot size was less than 0.5 acres. Miller (1972), in a study of nitrate contamination of a water table aquifer in Delaware, states that it seems likely that a flow of 300 gallons per acre per day or one 4 bedroom dwelling per 2 acres is reasonable for the simple dilution of nitrate by percolating rainwater.
The "Seepage and Pollutant Renovation Analysis for Land Treatment Sewage Disposal Systems" developed by Healy and May (1982) can be utilized
ON-SITE SEWAGE DISPOSAL SYSTEMS 41
to evaluate development density based on the dilution of nitrate from septic systems by infiltrated rainwater. According to the model, adequate dilution is required to meet the minimum goal of compliance with the drinking water standard of 10 mg/L at the downgradient property line. The model utilizes an average wastewater concentration of 35 mg/L of nitrogen per household which is reduced by septic system treatment processes to an actual soil discharge of 24 mg/ L . According to May (1988), under ideal, non-conservative conditions at least 0.6 acres is needed to dilute nitrogen. May (1988) further states that i f the measured infiltration rate utilized by the USGS is combined with a high strength wastewater (70 mg/L), lot size for nitrogen dilution would rise to 2.5 acres. He concludes that the reasonable range of adequate lot sizes is 1.5 to 2.5 acres for the purpose of diluting nitrogen.
Based on a review of the literature it appears that in most cases a minimum lot size of 2.0 acres is sufficient for the dilution of nitrate to acceptable levels. Although this requirement seems to provide adequate protection of water quality, each site must be reviewed individually to assess the potential for groundwater and/or surface water contamination.
In the development of regulations regarding septic tank density one of several approaches can be taken. These include: (1) to impose minimum lot requirements larger than those which have been found to be associated with groundwater contamination; (2) to evaluate each site individually, taking into consideration the geological and hydrological characteristics of the site; and (3) to calculate the amount of dilution of the effluent that is required before it reaches groundwater (Yates, 1985).
2.3.6.1 Alternatives To Conventional Zoning. The initial concept of zoning began in the 1920's as a proposal from the U.S. Department of Commerce. Zoning provided a mechanism through which the town's people could direct where, how and most importantly, to what density their communities would develop. These zoning decisions, although somewhat subjective, reflected the current land use patterns of the period and people's perceptions of how they felt the town or city should develop. In the years following the adoption of zoning, the concept of municipal and community planning evolved. Planning concepts began to change the preconceived notions of land use and development designations initiated by the adoption of zoning.
With low population densities in rural areas the concerns of land use or watershed carrying capacity were not given serious consideration. This same absence of concern is reflected in the high density (1/4 acre) lots served by on-site disposal systems typical of areas of urban expansion. The failure of these systems gave impetus for the development of municipal sanitary sewers and public water supplies in urban developments. With the continued expansion of suburban environments beyond the limits of municipal sewage systems, greater reliance was placed on septic systems to dispose of wastewater. Thus the adoption of minimum standards for the design and construction of on-site sewage disposal systems took place. These minimum standards provided criteria to measure the carrying capacity of land, minimum lot sizes and dwelling density. Experience with the somewhat empirical and arbitrary standards of this soils based criteria provided land planners with a tool by which to measure earlier decisions on lot size, dwelling density, and the impact of these decisions on public health and safety.
With the intensity of residential development in our more rural areas over the past twenty years, the scope of our concerns regarding land development has broadened to include a more critical view of the impact on other environmental systems resulting from residential development. In consideration of these systems
CARRYING CAPACITY OF PUBLIC WATER SUPPLY WATERSHEDS
(wetlands, surface and ground water) additional measures to protect these systems from land development have been adopted. The control measures are often viewed as arbitrary requirements because of a lack of supporting data. While similarities exist between community design standards, each has its own variations pertaining to permitted uses, density, and setbacks from various features, both natural and manmade. Efforts to provide a uniform and rational criteria for establishing a minimum residential lot size in rural areas and thus establish the density of development have focused on a common denominator: soil and it's ability to accept, treat and disperse effluent from on-site sewage disposal systems which provide the common link between all rural residential development. Another factor in selecting soil as the common factor was the availability of uniform soil data for the region prepared by the U.S. Department of Agriculture, Soil Conservation Service (SCS). The decision for using soil data and other natural resource data to determine minimum lot sizes in rural areas was further supported in Connecticut by the passage of Public Law #132, which recognized the soil survey as a basis for planning and zoning decisions (Northwestern Connecticut Regional Planning Agency, NWCRPA, 1981). As a practical matter, soils based zoning is not applicable in areas where municipal sanitary sewers and public water supplies are available.
The principal concept behind soils based zoning is the grouping of various soil types or phases with similar characteristics relating to their capacity to accept and renovate wastewater. Soil suitability ratings have been prepared by the SCS and the Connecticut Agricultural Experiment Station in the form of generalized soil mapping for counties and actual rating guides. These reports consider the suitability of a soil for effluent disposal based on the soil's permeability (ability to transmit water), depth to bedrock, slope and renovation capacity of the soil, i.e. ability to adsorb phosphorus, filter bacteria, and allow for dilution by infiltration. Based on the soil characteristics, minimum residential lot sizes were established. In typical glacially derived soil as found in Washington, Connecticut, three soil groups were designated. Group A has the least limitations and a minimum lot size of 1.0 acre. Group B has moderate limitations and a minimum lot size of 2.0 acres. Group C has the most limitations and a minimum lot size of 3.0 acres. Based on the percentages of these soil groups on the prospective parcel, a minimum lot size (not less than one acre) is determined. Identification of the various soil groups, and an example of the application of the procedure is presented in Table 2-4 and Table 2-5 respectively. A copy of the model regulation is presented in Appendix B as well.
On the basis of effective sewage disposal operation it has been suggested that soil characteristics be used to establish minimum lot size based on a factorial system using 0.5 acres as the base (University of C T ) . Episodes of well contamination have been reported on parcels of less than 0.5 acres served by both on-site well water supplies and septic systems (Miller, 1972). The various soil and site characteristics are assigned factor values. The minimum lot size of 0.5 is then multiplied by the factor to determine the size of the parcel required to support a dwelling, on-site well and septic system. The most restrictive factor is used in determining the minimal lot size. Examples of site characteristics and factors include: slowly permeable soils, factor 1.5; slopes greater than 15%, factor 2; land adjacent water courses, factor 3; shallow bedrock or aquifer primary recharge area, factor 4. Based on these sample criteria a minimum lot size of 1.0 to 2.0 acres would be required for effective septic systems operation.
Another soils based criterion used to qualify a parcel of land as a building lot is the "80/20 rule" (Town of Wilton, Weston Zoning Regulations). This criteria specifies that in one and two acre zones no more that 20% of the area contributing to the minimum lot size can be composed of water courses, wetlands or areas
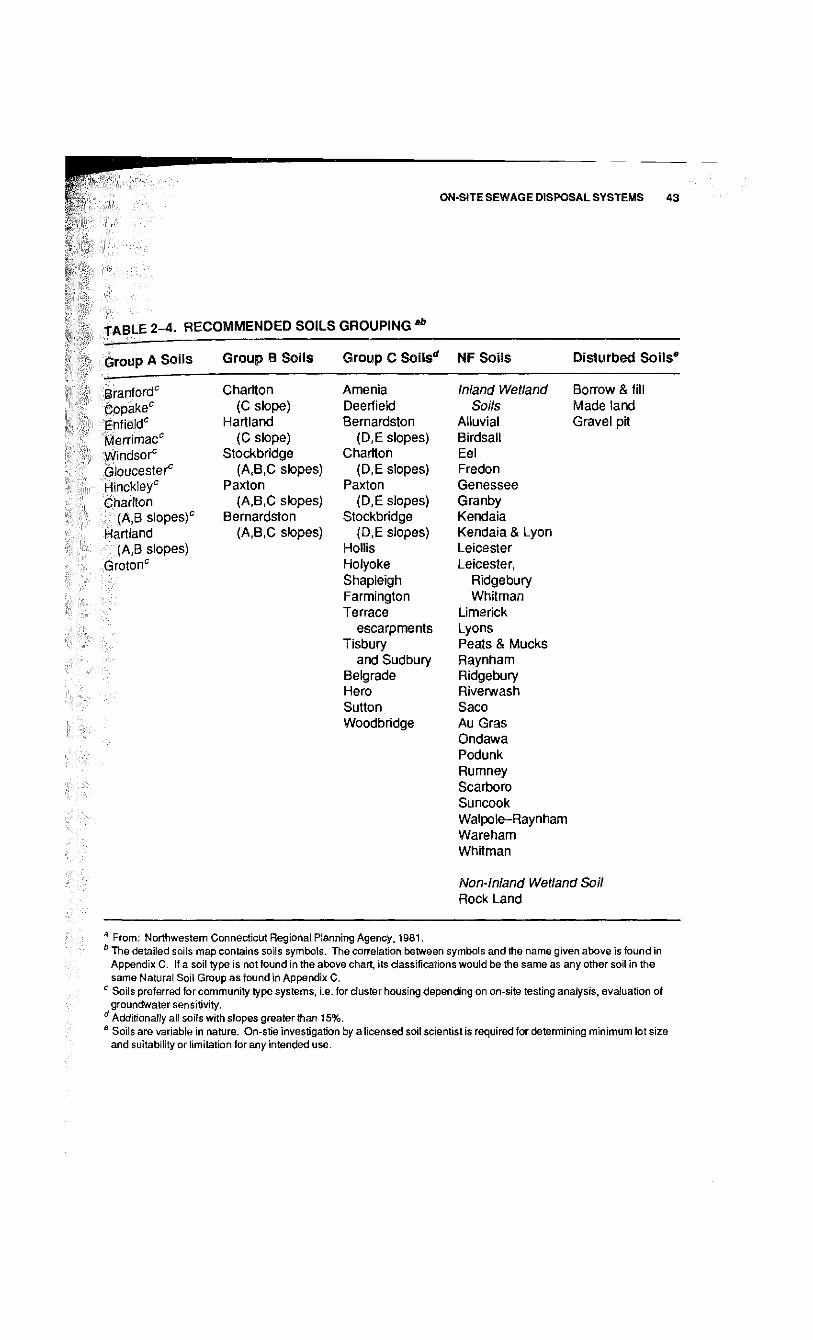
ON-SITE SEWAGE DISPOSAL SYSTEMS 43
TABLE 2-4. RECOMMENDED SOILS GROUPING a b
Group A ?o:ls Group B Soils Group C Soils* NF Soils Disturbed So i l s 6
Branfordc Charlton Amenia Inland Wetland Borrow & fill Copakec
Enfield" (C slope) Deerfield Soils Made land Copakec
Enfield" Hartland Bernardston Alluvial Gravel pit Merrimacc (C slope) (D,E slopes) Birdsall Windsorc Stockbridge Charlton Eel Gloucester0 (A,B,C slopes) (D,E slopes) Fredon Hinc:<ieyc Paxton Paxton Genessee Charlton (A,B,C slopes) (D,E slopes) Granby
(A,B 3lopes)c Bernardston Stockbridge Kendaia Hartland (A,B,C slopes) (D,E slopes) Kendaia & Lyon
(A.B slopes) Hollis Leicester Groton1-" Holyoke
Shapleigh Farmington Terrace
escarpments Tisbury
and Sudbury Belgrade Hero Sutton Woodbridge
Leicester, Ridgebury Whitman
Limerick Lyons Peats & Mucks Raynham Ridgebury Riverwash Saco Au Gras Ondawa Podunk Rumney Scarboro Suncook Walpole-Raynham Wareham Whitman
Non-Inland Wetland Soil Rock Land
a From: Northwestern Connecticut Regional Planning Agency, 1981. b The detailed soils map contains soils symbols. The correlation between symbols and the name given above is found in
Appendix C If a soil type is not found in the above chart, its classifications would be the same as any other soil in the same Natural Soil Group as found in Appendix C
c Soils preferred for community type systems, i.e. for cluster housing depending on on-site testing analysis, evaluation of groundwater sensitivity.
d Additionally all soils with slopes greater than 15%. Soils are variable in nature. On-stie investigation by a licensed soil scientist is required for determining minimum lot size and suitability or limitation for any intended use.
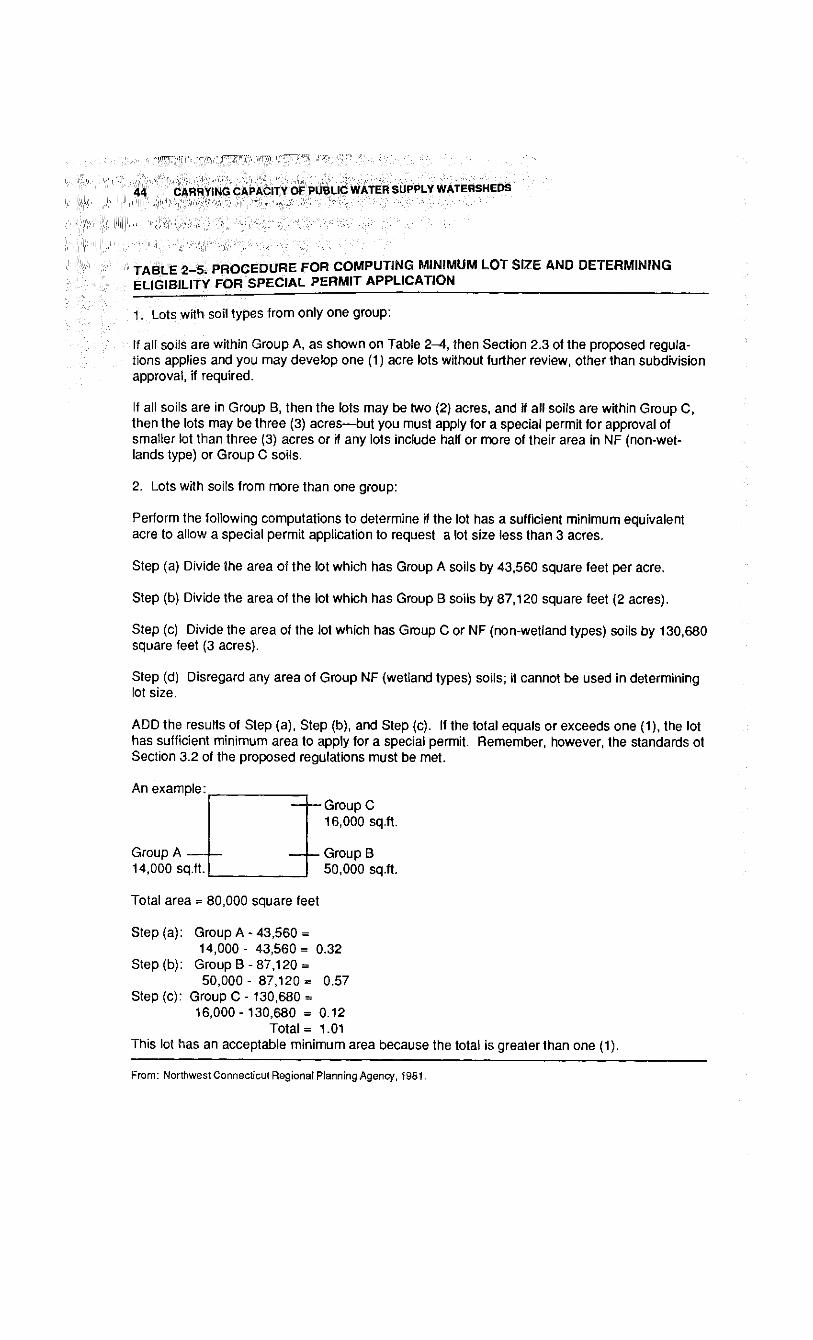
44
TABLE 2-5 PROCEDURE FOR COMPUTING MINIMUM LOT SIZE AND DETERMINING ELIGIBILITY FOR SPECIAL PERMIT APPLICATION
1 . Lots with soil types from only one group:
If all soils are within Group A, as shown on Table 2-4, then Section 2.3 of the proposed regulations applies and you may develop one (1) acre lots without further review, other than subdivision approval, if required.
If all soils are in Group B, then the lots may be two (2) acres, and if all soils are within Group C, then the lots may be three (3) acres—but you must apply for a special permit for approval of smaller lot than three (3) acres or if any lots include half or more of their area in NF (non-wetlands type) or Group C soils.
2. Lots with soils from more than one group:
Perform the following computations to determine if the lot has a sufficient minimum equivalent acre to allow a special permit application to request a lot size less than 3 acres.
Step (a) Divide the area of the lot which has Group A soils by 43,560 square feet per acre.
Step (b) Divide the area of the lot which has Group B soils by 87,120 square feet (2 acres).
Step (c) Divide the area of the lot which has Group C or NF (non-wetland types) soils by 130,680 square feet (3 acres).
Step (d) Disregard any area of Group NF (wetland types) soils; it cannot be used in determining lot size.
ADD the results of Step (a), Step (b), and Step (c). If the total equals or exceeds one (1), the lot has sufficient minimum area to apply for a special permit. Remember, however, the standards of Section 3.2 of the proposed regulations must be met.
An example:
Group A — 14,000 sq.ft.
• Group C 16,000 sq.ft.
Group B 50,000 sq.ft.
Total area = 80,000 square feet
Step (a): Group A - 43,560 = 14,000 - 43,560 = 0.32
Step (b): Group B -87,120 = 50,000 - 87,120 = 0.57
Step (c): Group C - 130,680 = 16,000- 130,680 = 0.12
Total = 1.01 This lot has an acceptable minimum area because the total is greater than one (1).
From: Northwest Connecticut Regional Planning Agency, 1981
ON-SITE SEWAGE DISPOSAL SYSTEMS 45
subject to flooding. The balance of the parcel must be comprised of upland soils but need not be contiguous. While this criterion does not directly relate to the site's capacity to dispose of septic effluent, it does affect parcel configuration and size in concert with the other minimum lot geometry required by the regulations.
An important aspect of any soil based zoning plan must be the provision for the applicant to demonstrate that existing soil limitations, which may dictate a larger minimum parcel size than is available, can be overcome by sound engineering and construction (special permit process). Soils based zoning as presented by the NWCRPA study (1981) takes advantage of the existing resource information and permits an analysis to be performed with a minimum of professional staff. Consideration must also be given to the scale at which the soil maps have been prepared. These maps should not be used in place of on-site soil testing, especially as it relates to the siting and design of on-site sewage disposal systems. A more intensive soil survey is warranted to clarify actual field conditions and soil boundaries.
Although soil based zoning can be an effective tool in regulating land development, it cannot stand alone. Zoning should be based on the Plan of Development of the community as well as natural resource data, with soil suitability being only one of the factors involved in decision making.
Other methods to determine minimum buildable lot size utilize a subtractive methodology or establish performance criteria based on the existing natural resources (topography, wetlands, water courses, hydrology) of the site as well as any use restrictions that may be imposed by existing or proposed rights of way (r.o.w.) or positive easements. The subtractive methods vary in the percentage of land that may be counted toward the minimum buildable area, but in general totally restrict the use of water bodies, wetlands or designated open space as well as designated r.o.w.'s and positive easements. After subtracting out the percentage of each land form designated by the regulations, the remaining land area is multiplied by the number of dwelling units permitted for the zone. This determines the number of units that may be permitted on the site.
The subtractive approach incorporates more natural resource data than the soils based zoning in determining the carrying capacity of a site and a clear determination of density. While the process does provide a clear direction on density (units/acre), the methodology has been criticized as requiring more prudent measurement of the resources and may not provide the flexibility required in evaluating small land holdings (NWCRPA, 1981).
The performance criteria for establishing a "minimum buildable area" have been adopted by communities to insure the long term operation of on-site sewage disposal systems. The Town of Hebron, Connecticut has adopted such performance criteria. A copy of the procedure used by the town is appended (Appendix C ) . The minimum buildable area ( M B L ) must be at least 0.75 acres in size and possess the following characterisucs.
• A parcel of contiguous land with four ninety degree angles on four sides, the shortest side not less than 100 feet long.
- Topography in the buildable area shall not exceed 20%. Irregular shaped, steep (>50%) slopes within the buildable area may not exceed 15% or 4900 square feet of the total minimum buildable area.
• Soil must have a percolation rate of no slower than 30 minutes per inch. • Ground water cannot be within 24 inches of the land surface as determined by
soil mottling (oxidation and reduction of iron in the soil caused by prolonged saturation) or direct observation of ground water during the period of February 1 through April 30th.
46 CARRYING CAPACITY OF PUBLIC WATER SUPPLY WATERSHEDS
• Ledge rock no higher than four feet below grade. Filling to achieve this depth is not permitted.
• Wetland soils may not be included in the area of buildable land nor may any area subject to flooding as determined by the Federal Emergency Management Act ( F E M A ) .
The M B L method specifically addresses the issue of wedands, which the large lot sizes as determined by the soil based zoning method does not. The M B L method typically results in lot sizes of 1.75 to 2.75 acres in size to meet the minimum building area. The prohibition of filling to achieve the four feet of cover over ledge is at variance with the current State Health code criteria which allows filling when two feet of original soil exist over ledge.
Computer models based on natural resources data have been developed in an attempt to quantify and predict the relationship between water quality and development density. The land use maps prepared from the natural resource information provide a "suitability index" of the land for specific uses. Input may include satellite information on soils and slope, flood data, geology, hydrology, vegetation, wedands character, wildlife habitat, water quality, and air quality. Other models incorporate infrastructure information such as transportation capacities, economic considerations as well as agricultural resources. As with all computer models, the output, in this case a map, is direcdy related to the input: different models will have different biases. The collection, analyses and physical input of the data can be costly and time consuming.
With the advent of mini-computer driven geographic information systems (GIS) that can compile and analyze natural resource data from remote sensing, the ability to determine the impact of specific land use patterns and management practices on water quality and natural systems on both the regional and town wide basis is now possible. While this process addresses past land use practices, it provides valuable insight into how present land planning decisions wil l affect future watershed carrying capacities. The disadvantages of this process, are the complexity of the process, the need for qualified staff to apply and interpret the data, and the costs associated with data compilation and analysis. An overview of some models commonly used in lake and resevoir management can be found in section 1.2.2; an example of aquifer modeling is given in section 6.3.
Adolphson, M.L.; L . West; and D. Sandison. 1985. Comparative impacts to groundwater - Clover/Chambers Creek Basin. In Proceedings 5th Northwest On-Site Wastewater Treatment Short Course. Dept. Civi l Engineering, University of Washington. Seattle, Washington.
Allen, M.J. and S. M . Morrison. 1973. Bacterial movement through fractured bedrock. Ground Water, vol. I I no. 2.
Andreoli, A. ; N . Bartilucci; R. Forgione; and R. Reynolds. 1979. Nitrogen removal in a subsurface disposal system. Journal Water Pollution Control Federation, vol. 51, no. 4.
Bartlett, M.S.; L . C . Brown; N.B. Hanes; and N.H. Nickerson. 1919. Denitrification in freshwater wetland soil. Journal of Environmental Quality, vol. 9 no. 4.
Bouma, J . ; J .C. Converse; and F.R. Magdoti. 1974. Dosing and resting to improve soil absorption beds. American Society of Agricultural Engineers, vol. 17, no. 2.
Brown, K.W.; J .F. Slowey; and H.W. Wolf. 1975. The movement of salts,
ON-SITE SEWAGE DISPOSAL SYSTEMS 47
nutrients, fecal coliform and virus below septic leach fields in three soils. In Proceedings of the National Home Sewage Disposal Symposium. American Society of Agricultural Engineers.
Canter, L . and R .C . Knox. 1984. Evaluation of Septic Tank System Effects on Ground Water Quality. US Environmental Protection Agency E P A 600/S2-84-107.
Canter, L .W. and R.C. Knox. 1985. Septic Tank System Effects on Ground Water Quality. Lewis Publishers, Inc. Chelsea, M I .
Carlile, B . L . 1985. Perspectives on Septic Tanks as Nonpoint Source Pollution: Proceedings of a National Conference. US Environmental Protection Agency.
Clements, E . Y . ; R J . Otis; D.H. Bauaer; R . L . Siequist; E . J . Tyler; D .E . Stewart; and J .C . Converse. 1980. Design Manual: Cm-Site Wastewater Treatment and Disposal Systems. US Environmental Protection Agency. Washington D.C.
Cogger, C . 1988. On-site septic systems: the risk of groundwater contamination. Journal of Environmental Health, vol. 51 , no. 1.
Cole, C.A. and W.E . Sharpe. 1982. Impact of water conservation on residential septic tank effluent quality. In On-Site Sewage Treatment. American Society of Agricultural Engineers.
Connecticut Department of Health Services. 1988. Design of Subsurface Sewage Disposal Systems for Households and Small Commercial Buildings. Hartford, C T .
Council on Environmental Quality. 1981. Contamination of Ground Water by Toxic Organic Chemicals. US Environmental Protection Agency. Boston, MA.
Green, K . M . and D.O. Oliver. 1975. Removal of viruses from septic tank effluent by sand columns. In Proceedings of the National Home Sewage Disposal Symposium. American Society of Agricultural Engineers.
Handman, E .H . ; I .G. Grossman; J.W. Bingham; and J . L . Rolston. 1979. Major Sources of Ground-Water Contamination in Connecticut. USGS Water Resources Investigations Open File Rpt 79-1596. Hartford, C T .
Handman, E . H . and J.W. Bingham. 1980. Effects of Selected Sources of Contamination on Ground-Water Quality at Seven Sites in Connecticut. USGS Water Resources Investigations Open File Rpt 79-1596. Hartford, C T .
Hansel, M.N. and R . E . Machmeier. 1980. On-site wastewater treatment on problem soils. In Perspectives on Non-Point Source Pollution: Proceedings of a National Conference. Kansas City, MO. US Environmental Protection Agency, vol. 52.
Harrison, E .Z . and M.A. Dickinson. 1984. Protecting Connecticut's Groundwater: A Guide to Groundwater Protection for Local Officials. Connecticut DEP .
Healy, K . A . and R. May. 1982. Seepage and Pollutant Renovation Analysis for Land Treatment Sewage Disposal Systems. Connecticut DEP. Storrs, C T .
Hi l l , D.E. 1978. Potential Contamination of Water Bodies and Water Courses From Septic Tank Drain Fields. C T Agricultural Experiment Station. New Haven, C T .
Hil l , D.E. and C.R. Frink. 1980. Septic system longevity increased by improved design. Journal Water Pollution Control.
Hi l l , D .E . and B . L . Sawhney. 1981. Removal of phosphorus from waste water by soil under aerobic and anaerobic conditions. Journal of Environmental Quality. Vol. 10, no. 4.
Holzer, T . L . 1975. Limits to growth and septic tanks. In Water Pollution Control in Low Density Areas: Proceedings of a Rural Environmental Engineering Conference. W J . Jewell and R . Swan (eds), University Press of New England. Hanover, NH.
48 CARRYING CAPACITY OF PUBLIC WATER SUPPLY WATERSHEDS
Kadlec, R.H. ; D .L . Tilton; and J .A. Kadlec. 1977. Feasibility of Utilization of Wedand Ecosystems for Nutrient Removal from Secondary Municipal Wastewater Treatment Plant Effluent. National Science Foundation. Ann Arbor, M I .
Kadlec, R .H . 1978. Wetlands for tertiary treatment In Wetiand Functions and Values: the State of our Understanding. American Water Resources Assoc.
Kolega, J J ; D.W. Hill ; and R. Laak. 1986. Contribution of Toxic Chemical to Groundwater from Domestic On-Site Sewage Disposal Systems. C T Institute of Water Resources. Storrs, C T .
Kropf, F.W.; R.Laak; and K . A . Healey. 1977. Equilibrium Operation of Subsurface Absorption Systems. Journal Water Pollution Control Federation. 1007-2016.
Laak, R. 1977. Septic Tank and Leaching Field Operation, Problems, and Renovation. Central N Y Regional Planning and Development Board. Syracuse, N Y .
Laak, R. 1982. A Passive Denitrification System for On-Site Systems. In On-Site Sewage Treatment. American Society of Agricultural Engineers, p 108-115.
Laak, R. 1986. The Ruck System. In On-site Sewage Disposal. P .L .M. Veneman and W.R. Wright (eds.) Proceedings of the Society of Soil Scientists of Southern New England.
Luce, H.D. and T .G . Welling. 1983. The Movement of Nitrates, Phosphates, and Fecal Coliform Bacteria from Disposal Systems Installed in Selected Connecticut Soils. Institute of Water Resources. Storrs, C T .
May, R . 1988. Personal correspondence to Marshall Berger, Esq. July 25, 1988. McNabb, J.F.; W.J . Dunlap; and J.W. Keeney. 1977. Nutrient, Bacterial, and
Virus Control as Related to Ground-Water Contamination. US Environmental Protection Agency. Ada, OK.
Miller, J .C. 1972. Nitrate Contamination of the Water Table Aquifer in Delaware. Delaware Geological Survey. Newark, D E .
Nichols, D.S. 1983. Capacity of Natural Wetlands to Remove Nutrients from Wastewater. Journal Water Pollution Control Federation, vol. 55. no. 5.
Northwestern Connecticut Regional Planning Agency. 1981. Using Soils Information in Zoning
Noss, R .R. and R . J . Drake. 1986. Ground Water Contamination by Septic Tank Cleaners. In On-Site Sewage Disposal. P .L .M. Veneman, and W.R. Wright (eds). Proceedings of the Society of Soil Scientists of Southern New England.
Patrick, W.H.; R.D. DeLaune; R.M. Engler; and S. Gotoh. 1976. Nitrate Removal from Water at the Water-Mud Interface in Wetlands. US Environmental Protection Agency. Corvallis, OR.
Persky, J .H. 1986. The Relation of Ground-Water Quality to Housing Density, Cape Cod, MA. U.S. Department of the Interior. Boston, MA.
Sawhney, B . L . and D.E. Hil l . 1975. Phosphate sorption characteristics of soils treated with domestic waste water. Journal of Environmental Quality, vol. 4, no. 3.
Sawhney, B . L . and J .L . Starr. 1977. Movement of phosphorus from a septic system drainfield. Journal Water Pollution Control.
Sawhney, B . L . and J .L . Starr. 1978. Are septic systems effective in removing nitrogen and phosphorous from wastewater? Frontiers of Plant Science, vol. 30, no. 2.
Scalf, M.R. and W. Dunlap. 1977. Environmental Effects of Septic Tank Systems. U.S. Environmental Protection Agency. Ada, OK.
Sikora, L . J . and R . B . Corey. 1976. Fate of nitrogen and phosphorus in soils under septic tank waste disposal fields. American Society of Agricultural Engineers, vol. 19 no. 5.
ON-SITE SEWAGE DISPOSAL SYSTEMS 49
Starr, J . L . and B . L . Sawhney. 1980. Movement of nitrogen and carbon from a septic system drainfield. Water, Air, and Soil Pollution, vol. 13.
Stuanes, A.O. 1984. Phosphorus sorption of soils to be used in wastewater renovation. Journal of Environmental Quality, vol. 13, no. 2.
Thomas, H. ; R. Barlow; and R . May. 1985. Septic Systems Manual: A Guide to On-Site Subsurface Sewage Disposal for Local Land-Use Officials. Connecticut DEP, C T Cooperative Extension Service. Storrs, CT .
Tofflemirc, T J . and M. Chen. 1977. Phosphate Removal by Sands and Soils. N .Y.S . Department of Environmental Conservation. Albany, N Y .
United States Public Health Service. 1962. Public Health Service Drinking Water Standards. U.S. Public Health Service, vol. 956.
University of Connecticut. (no date given). Using soils data to establish lot sizes. Resources for Connecticut Communities, vol. 1, no. 2.
van der Valk, A.G. ; C .B. Davis; J . L . Baker; and C .E . Beer. 1978. Natural fresh water wedands as nitrogen and phosphorus traps for land runoff. In Wetland Functions and Values: The State of Our Understanding. American Water Resources Association.
Walker, W.G.; J . Bouma; D.R. Keeney; and F.R. Magdoff. 1979a. Nitrogen transformations during subsurface disposal of septic tank effluent in sands: I . soil transformations. Journal of Environmental Quality, vol. 2, no. 4.
Walker, W.G.; J . Bouma; D.R. Keeney; and P.G. Olcott. 1979b. Nitrogen transformations during subsurface disposal of septic tank effluent in sands: II. ground water quality. Journal of Environmental Quality, vol. 2, no. 4.
Yaro, R.D.; R .G. Arendt; H .L . Dodson; and E . A . Brabec. 1988. Dealing With Change in the Connecticut River Valley: A Design Manual for Conservation and Development. The Lincoln Institute of Land Policy and The Environmental Law Foundation. Cambridge, MA.
Yates, M.V. 1985. Septic tank density and ground-water contamination. Ground Water, vol. 23, no. 5.
Ziebell, W.A.; J . L . Anderson; J.Bouma; and E.McCoy. (no date given) Fecal Bacteria: Removal From Sewage by Soils (incomplete citation).
Long-Term Storm Water Discharge: impacts and Mitigation Measures
A potential impact upon water quality from residential development is the discharge of runoff from roadways, parking areas and other impervious areas into existing waterbodies. Stormwater runoff has been identified by many researchers as a potential source of pollutants to receiving water bodies. Potential contaminants in stormwater runoff may include suspended solids, organic and inorganic nitrogen, phosphorus, hydrocarbons, heavy metals, pathogenic bacteria, and road salts. Other water quality parameters such as biochemical oxygen demand and chemical oxygen demand are also of concern.
In 1987, section 402(p) was added to the Clean Water Act to require the Environmental Protection Agency (EPA) to establish regulations setting forth National Pollutant Discharge Elimination System (NPDES) permit application requirements for: storm water discharges associated with industrial activity, municipal separate storm sewer system serving a population of 250,000 or more, and municipal separate storm sewer systems serving a population of 100,000 or more, but less than 250,000 (U.S. E P A , 1988).
The "National Water Quality Inventory, 1986 Report to Congress", an as-.«ssment of water quality by individual states, concluded that pollution from diffuse sources such as agricultural and urban areas was the leading cause of water quality impairment. To provide a better understanding of the nature of urban runoff from commercial and residential areas, their impacts on water quality, and control techniques, the E P A provided funding and guidance to the Nationwide Urban Runoff Program (NURP) from 1978 through 1983. The NURP program involved 28 separate projects around the country. The data indicates that on an annual loading basis, suspended solids in storm water draining residential, commercial and light industrial areas are around an order of magnitude greater than secondarily treated sewage. In addition, the study indicated that annual loading of chemical oxygen demand (COD) is comparable to secondarily treated sewage (U.S. EPA, 1988). Athayde et al. (1984), the authors of the N U R P final report, state that (page 6-32), "regardless of the analytical approach taken, we are forced to conclude that, i f land use category effects are present, they are eclipsed by the storm to storm variabilities and that, therefore, land use category is of little general use to aid in predicting urban runoff quality at unmonitored sites or in explaining site to site differences where monitoring data exists."
A great deal of research has been done on determining the composition and fate of urban runoff. Much of the information used in this report is taken from these studies of urban runoff. Values reported for storm water contaminant
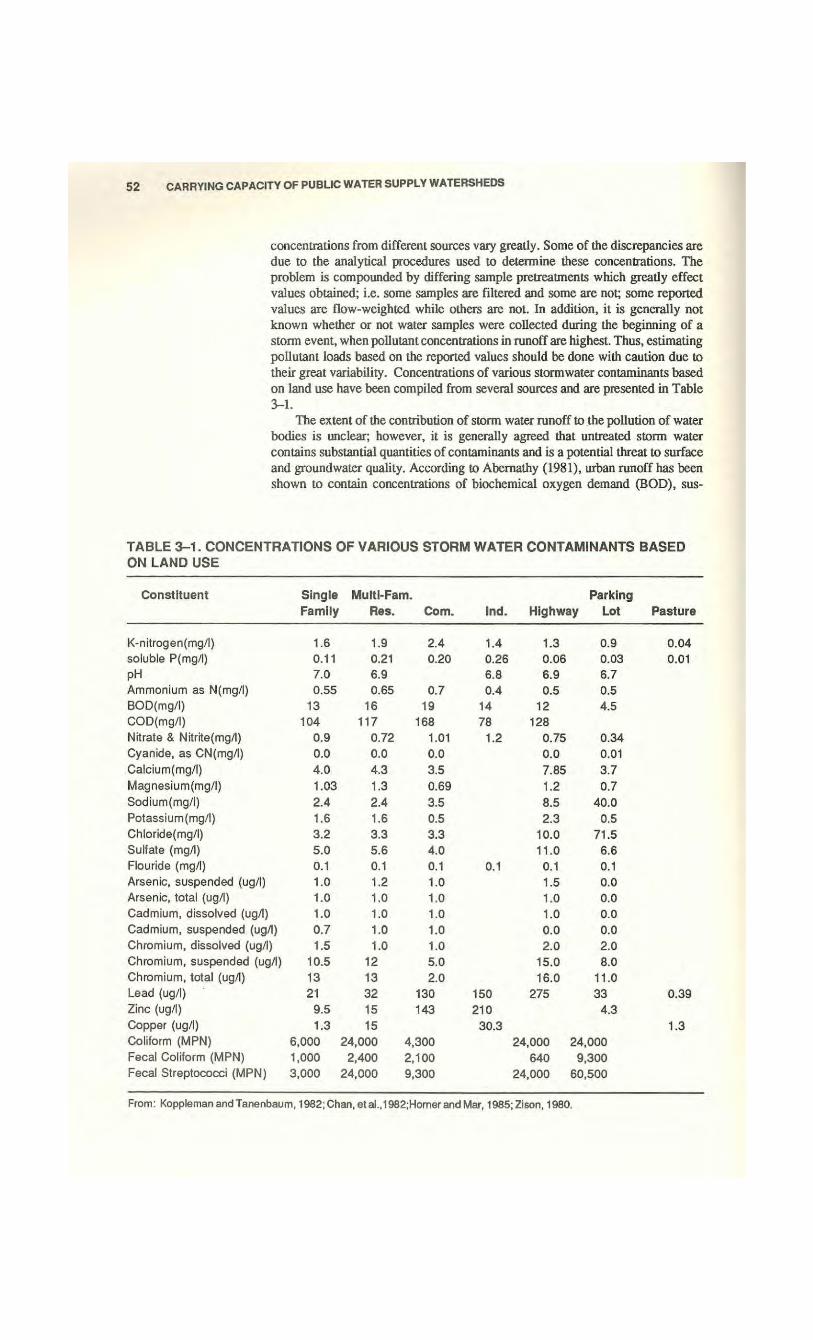
52 CARRYING CAPACITY OF PUBLIC WATER SUPPLY WATERSHEDS
concentrations from different sources vary greatly. Some of the discrepancies are due to the analytical procedures used to determine these concentrations. The problem is compounded by differing sample pretreatments which greatly effect values obtained; i.e. some samples are filtered and some are not; some reported values are flow-weighted while others are not. In addition, it is generally not known whether or not water samples were collected during the beginning of a storm event, when pollutant concentrations in runoff are highest. Thus, estimating pollutant loads based on the reported values should be done with caution due to their great variability. Concentrations of various stormwater contaminants based on land use have been compiled from several sources and are presented in Table 3-1.
The extent of the contribution of storm water runoff to the pollution of water bodies is unclear; however, it is generally agreed that untreated storm water contains substantial quantities of contaminants and is a potential threat to surface and groundwater quality. According to Abernathy (1981), urban runoff has been shown to contain concentrations of biochemical oxygen demand (BOD), sus-
TABLE 3-1. CONCENTRATIONS OF VARIOUS STORM WATER CONTAMINANTS BASED ON LAND USE
Constituent Single Multi-Fam. Parking Family Res . Com. Ind. Highway Lot Pasture
K-nitrogen(mg/l) 1.6 1.9 2.4 1.4 1.3 0.9 0.04 soluble P(mg/I) 0.11 0.21 0.20 0.26 0.06 0.03 0.01 pH 7.0 6.9 6.8 6.9 6.7 Ammonium as N(mg/I) 0.55 0.65 0.7 0.4 0.5 0.5 BOD(mg/l) 13 16 19 14 12 4.5 COD(mg/l) 104 117 168 78 128 Nitrate & Nitrite(mg/I) 0.9 0.72 1.01 1.2 0.75 0.34 Cyanide, as CN(mg/l) 0.0 0.0 0.0 0.0 0.01 Calcium(mg/I) 4.0 4.3 3.5 7.85 3.7 Magnesium(mg/I) 1.03 1.3 0.69 1.2 0.7 Sodium(mg/l) 2.4 2.4 3.5 8.5 40.0 Potassium(mg/l) 1.6 1.6 0.5 2.3 0.5 Chloride(mg/l) 3.2 3.3 3.3 10.0 71.5 Sulfate (mg/l) 5.0 5.6 4.0 11.0 6.6 Flouride (mg/l) 0.1 0.1 0.1 0.1 0.1 0.1 Arsenic, suspended (ug/l) 1.0 1.2 1.0 1.5 0.0 Arsenic, total (ug/l) 1.0 1.0 1.0 1.0 0.0 Cadmium, dissolved (ug/l) 1.0 1.0 1.0 1.0 0.0 Cadmium, suspended (ug/l) 0.7 1.0 1.0 0.0 0.0 Chromium, dissolved (ug/l) 1.5 1.0 1.0 2.0 2.0 Chromium, suspended (ug/l) 10.5 12 5.0 15.0 8.0 Chromium, total (ug/l) 13 13 2.0 16.0 11.0 Lead (ug/l) 21 32 130 150 275 33 0.39 Zinc (ug/l) 9.5 15 143 210 4.3 Copper (ug/l) 1.3 15 30.3 1.3 Coliform (MPN) 6,000 24,000 4,300 24,000 24,000 Fecal Coliform (MPN) 1,000 2,400 2,100 640 9,300 Fecal Streptococci (MPN) 3,000 24,000 9,300 24,000 60,500
From: KopplemanandTanenbaum, 1982;Chan,etal.,1982;HornerandMar, 1985;Zison, 1980.
STORM WATER DISCHARGE 53
r - d c d solids, and coliform bacteria as great or greater than treated sewage -ffl rents. The Illinois Environmental Protection Agency (1984), in a report on the j l u ? Creek Watershed Project, states that it may be more beneficial to treat urban •j-:>ff than to provide tertiary treatment for sewage.
In a thorough study, Byron and Goldman (1989) examined land use and water cMii'-ity in 10 watersheds tributary to Lake Tahoe. They found that comparisons L>ei\veen land use and runoff water quality demonstrated significant relationships . v v e e n increased watershed development and decreased water quality (as '.»o:sured by nitrate, total phosphorus, and suspended sediment). Byron and Go'iman state that for the watersheds studied, increased land disturbance resulted in ncreased water quality degradation; the long term average nutrient flux originating from non-point sources closely reflected the intensity and location of • ' . =-jrshed development. Goldman and Byron (page 87), citing studies from around the world, state that "land use often affects water quality to a greater extent thai does the geomorphology or soil types of the drainages" (Hirose and Kuramoto, 1981; Likens et al., 1977; Smart et al., 1985).
Time Scales Of Water Quality Impacts. There are three major types of water quality impacts associated with urban runoff. The discussion of these, that follows, was taken directly form the NURP final report (Athayde et al., 1984).
"The first type is characterized by rapid, short-term changes in water quality during and shortly after storm events. Examples of this water quality impact include periodic dissolved oxygen depressions due to oxidation of contaminants, or short-term increases in the receiving water concentrations of one or more toxic contaminants.
Long-term water quality impacts, on the other hand, may be caused by contaminants associated with suspended solids that settle in receiving waters and by nutrients which enter receiving water systems with long retention times. In both instances, long-term water quality impacts are caused by increased residence times of pollutants in receiving waters. Other examples of the long-term water quality impacts include depressed dissolved oxygen caused by the oxidation of organics in bottom sediments, biological accumulation of toxics as a result of uptake by organisms in the food chain, and increased lake eutrophication as a result of the recycling of nutrients contributed by urban runoff discharges. The long-term water quality impacts of urban runoff are manifested during critical periods normally considered in point source pollution studies, such as summer, low stream flow conditions, and/or during sensitive life cycle stages of organisms. Since long-term water quality impacts occur during normal critical periods, it is necessary to distinguish between the relative contribution from other sources, such as treatment plant discharges and other nonpoint sources. A site-specific analysis is required to determine the impact of various types of pollutants during critical periods.
A third type of receiving water impact is related to the quantity or physical aspects of flow and includes short-term water quality effects caused by scour and resuspension of pollutants previously deposited in the sediments. This category of impact was not addressed by NURP, in general."
The characteristics, transport and fate of storm water runoff constituents and their impacts on water bodies is discussed below.
3,1 Sl'SWEtfOFD SOLIDS
The suspended solids of urban runoff consist of mineral and low solubility chemicals. The bulk of solids found in urban runoff consist of "inert" minerals of various types (i.e., quartz feldspar, etc.) which reflect components of street
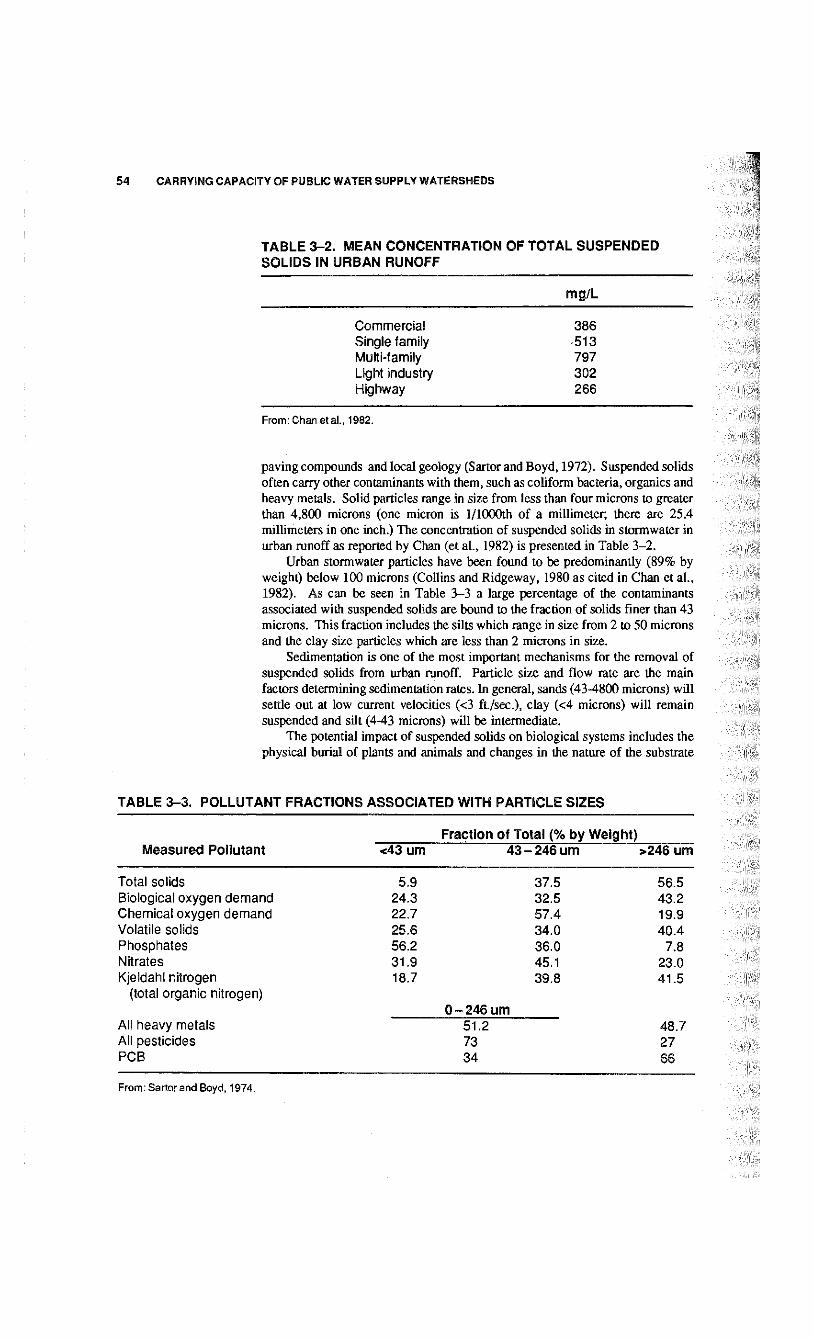
54 CARRYING CAPACITY OF PUBLIC WATER SUPPLY WATERSHEDS
TABLE 3-2. MEAN CONCENTRATION OF TOTAL SUSPENDED SOLIDS IN URBAN RUNOFF
mg/L
Commercial 386 Single family 513 Multi-family 797 Light industry 302 Highway 266
From: Chan et al., 1982.
paving compounds and local geology (Sartor and Boyd, 1972). Suspended solids often carry other contaminants with them, such as coliform bacteria, organics and heavy metals. Solid particles range in size from less than four microns to greater than 4,800 microns (one micron is l/1000th of a millimeter; there are 25.4 millimeters in one inch.) The concentration of suspended solids in stormwater in urban runoff as reported by Chan (et al., 1982) is presented in Table 3-2.
Urban stormwater particles have been found to be predominantly (89% by weight) below 100 microns (Collins and Ridgeway, 1980 as cited in Chan et al. , 1982). As can be seen in Table 3-3 a large percentage of the contaminants associated with suspended solids are bound to the fraction of solids finer than 43 microns. This fraction includes the silts which range in size from 2 to 50 microns and the clay size particles which are less than 2 microns in size.
Sedimentation is one of the most important mechanisms for the removal of suspended solids from urban runoff. Particle size and flow rate are the main factors determining sedimentation rates. In general, sands (43-4800 microns) wil l settle out at low current velocities (<3 ft./sec.), clay (<4 microns) wil l remain suspended and silt (4-43 microns) will be intermediate.
The potential impact of suspended solids on biological systems includes the physical burial of plants and animals and changes in the nature of the substrate
TABLE 3-3. POLLUTANT FRACTIONS ASSOCIATED WITH PARTICLE SIZES
Fraction of Total (% by Weight) Measured Pollutant <43 um 43 - 246 um >246 um
Total solids 5.9 37.5 56.5 Biological oxygen demand 24.3 32.5 43.2 Chemical oxygen demand 22.7 57.4 19.9 Volatile solids 25.6 34.0 40.4 Phosphates 56.2 36.0 7.8 Nitrates 31.9 45.1 23.0 Kjeldahl nitrogen 18.7 39.8 41.5
(total organic nitrogen) 0 - 246 um
All heavy metals 51.2 48.7 All pesticides 73 27 PCB 34 66
From: Sartor and Boyd, 1974.
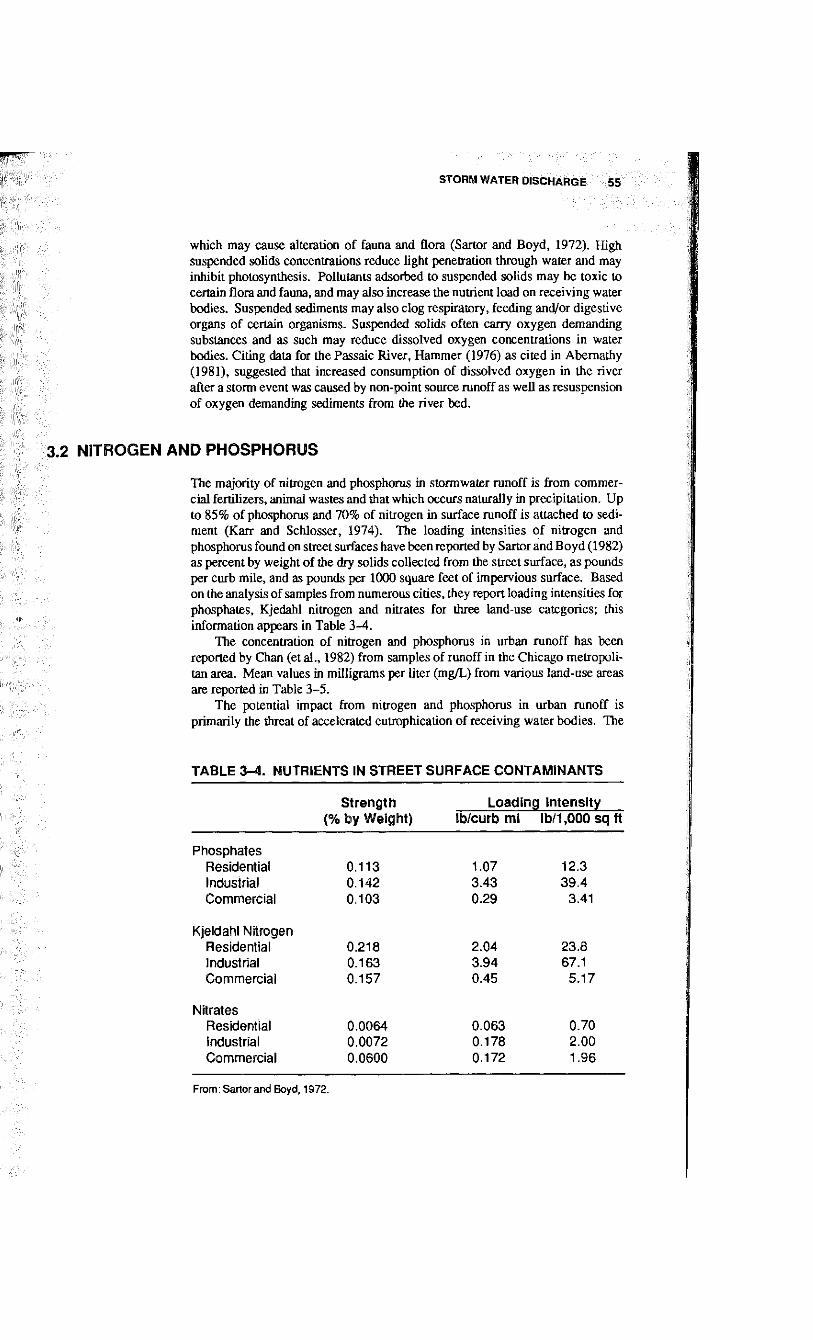
STORM WATER DISCHARGE 55
which may cause alteration of fauna and flora (Sartor and Boyd, 1972). High suspended solids concentrations reduce light penetration through water and may inhibit photosynthesis. Pollutants adsorbed to suspended solids may be toxic to certain flora and fauna, and may also increase the nutrient load on receiving water bodies. Suspended sediments may also clog respiratory, feeding and/or digestive organs of certain organisms. Suspended solids often carry oxygen demanding substances and as such may reduce dissolved oxygen concentrations in water bodies. Citing data for the Passaic River, Hammer (1976) as cited in Abernathy (1981), suggested that increased consumption of dissolved oxygen in the river after a storm event was caused by non-point source runoff as well as resuspension of oxygen demanding sediments from the river bed.
The majority of nitrogen and phosphorus in stormwater runoff is from commercial fertilizers, animal wastes and that which occurs naturally in precipitation. Up to 85% of phosphorus and 70% of nitrogen in surface runoff is attached to sediment (Karr and Schlosser, 1974). The loading intensities of nitrogen and phosphorus found on street surfaces have been reported by Sartor and Boyd (1982) as percent by weight of the dry solids collected from the street surface, as pounds per curb mile, and as pounds per 1000 square feet of impervious surface. Based on the analysis of samples from numerous cities, they report loading intensities for phosphates, Kjedahl nitrogen and nitrates for three land-use categories; this information appears in Table 3-4.
The concentration of nitrogen and phosphorus in urban runoff has been reported by Chan (et al., 1982) from samples of runoff in the Chicago metropolitan area. Mean values in milligrams per liter (mg/L) from various land-use areas are reported in Table 3-5.
The potential impact from nitrogen and phosphorus in urban runoff is primarily the threat of accelerated eutrophication of receiving water bodies. The
TABLE 3-4. NUTRIENTS IN STREET SURFACE CONTAMINANTS
AND PHOSPHORUS
Strength (% by Weight)
Loading Intensity lb/curb ml lb/1,000 sq ft
Phosphates Residential Industrial
0.113 0.142 0.103
1.07 3.43 0.29
12.3 39.4
3.41 Commercial
Kjeldahl Nitrogen Residential Industrial Commercial
0.218 0.163 0.157
2.04 3.94 0.45
23.8 67.1
5.17
Nitrates Residential Industrial Commercial
0.0064 0.0072 0.0600
0.063 0.178 0.172
0.70 2.00 1.96
From: Sartor and Boyd, 1972.
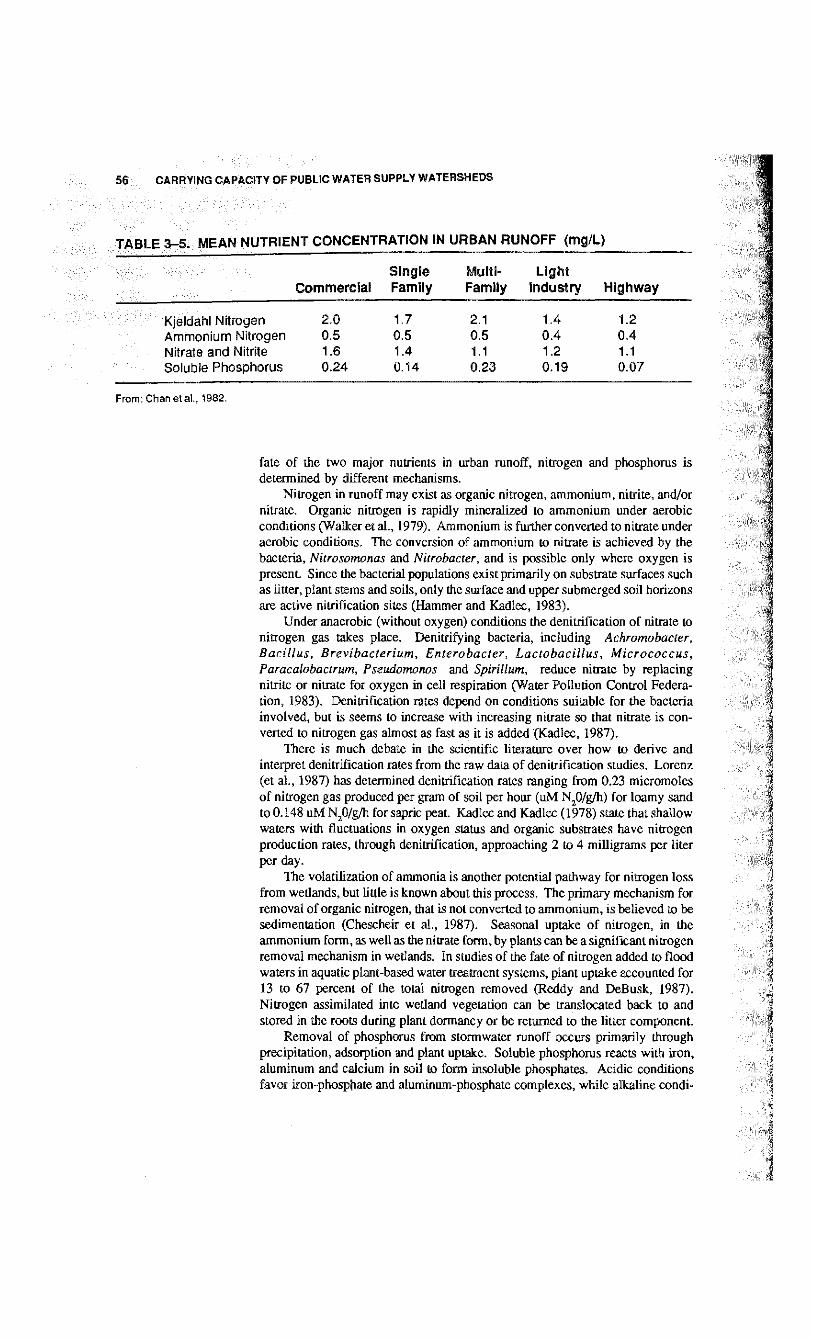
56 CARRYING CAPACITY OF PUBLIC WATER SUPPLY WATERSHEDS
TABLE 3-5, MEAN NUTRIENT CONCENTRATION IN URBAN RUNOFF (mg/L)
Single Commercial Family
Multi- Light Family Industry Highway
Kjeldahl Nitrogen Ammonium Nitrogen Nitrate and Nitrite Soluble Phosphorus
2.0 0.5 1.6 0.24
1.7 0.5 1.4 0.14
2.1 0.5 1.1 0.23
1.4 0.4 1.2 0.19
1.2 0.4 1.1 0.07
From: Chan etal., 1982.
fate of the two major nutrients in urban runoff, nitrogen and phosphorus is determined by different mechanisms.
Nitrogen in runoff may exist as organic nitrogen, ammonium, nitrite, and/or nitrate. Organic nitrogen is rapidly mineralized to ammonium under aerobic conditions (Walker et al., 1979). Ammonium is further converted to nitrate under aerobic conditions. The conversion of ammonium to nitrate is achieved by the bacteria, Nitrosomonas and Nitrobacter, and is possible only where oxygen is present. Since the bacterial populations exist primarily on substrate surfaces such as litter, plant stems and soils, only the surface and upper submerged soil horizons are active nitrification sites (Hammer and Kadlec, 1983).
Under anaerobic (without oxygen) conditions the denitrification of nitrate to nitrogen gas takes place. Denitrifying bacteria, including Achromobacter, Bacillus, Brevibacterium, Enterobacter, Lactobacillus, Micrococcus, Paracalobactrum, Pseudomonos and Spirillum, reduce nitrate by replacing nitrite or nitrate for oxygen in cell respiration (Water Pollution Control Federation, 1983). Denitrification rates depend on conditions suitable for the bacteria involved, but is seems to increase with increasing nitrate so that nitrate is converted to nitrogen gas almost as fast as it is added (Kadlec, 1987).
There is much debate in the scientific literature over how to derive and interpret denitrification rates from the raw data of denitrification studies. Lorenz (et al., 1987) has determined denitrification rates ranging from 0.23 micromoles of nitrogen gas produced per gram of soil per hour (uM N20/g/h) for loamy sand to 0.148 uM N20/g/h for sapric peat. Kadlec and Kadlec (1978) state that shallow waters with fluctuations in oxygen status and organic substrates have nitrogen production rates, through denitrification, approaching 2 to 4 milligrams per liter per day.
The volatilization of ammonia is another potential pathway for nitrogen loss from wetlands, but little is known about this process. The primary mechanism for removal of organic nitrogen, that is not converted to ammonium, is believed to be sedimentation (Chescheir et al., 1987). Seasonal uptake of nitrogen, in the ammonium form, as well as the nitrate form, by plants can be a significant nitrogen removal mechanism in wetlands. In studies of the fate of nitrogen added to flood waters in aquatic plant-based water treatment systems, plant uptake accounted for 13 to 67 percent of the total nitrogen removed (Reddy and DeBusk, 1987). Nitrogen assimilated into wetland vegetation can be translocated back to and stored in the roots during plant dormancy or be returned to the litter component.
Removal of phosphorus from stormwater runoff occurs primarily through precipitation, adsorption and plant uptake. Soluble phosphorus reacts with iron, aluminum and calcium in soil to form insoluble phosphates. Acidic conditions favor iron-phosphate and aluminum-phosphate complexes, while alkaline condi-
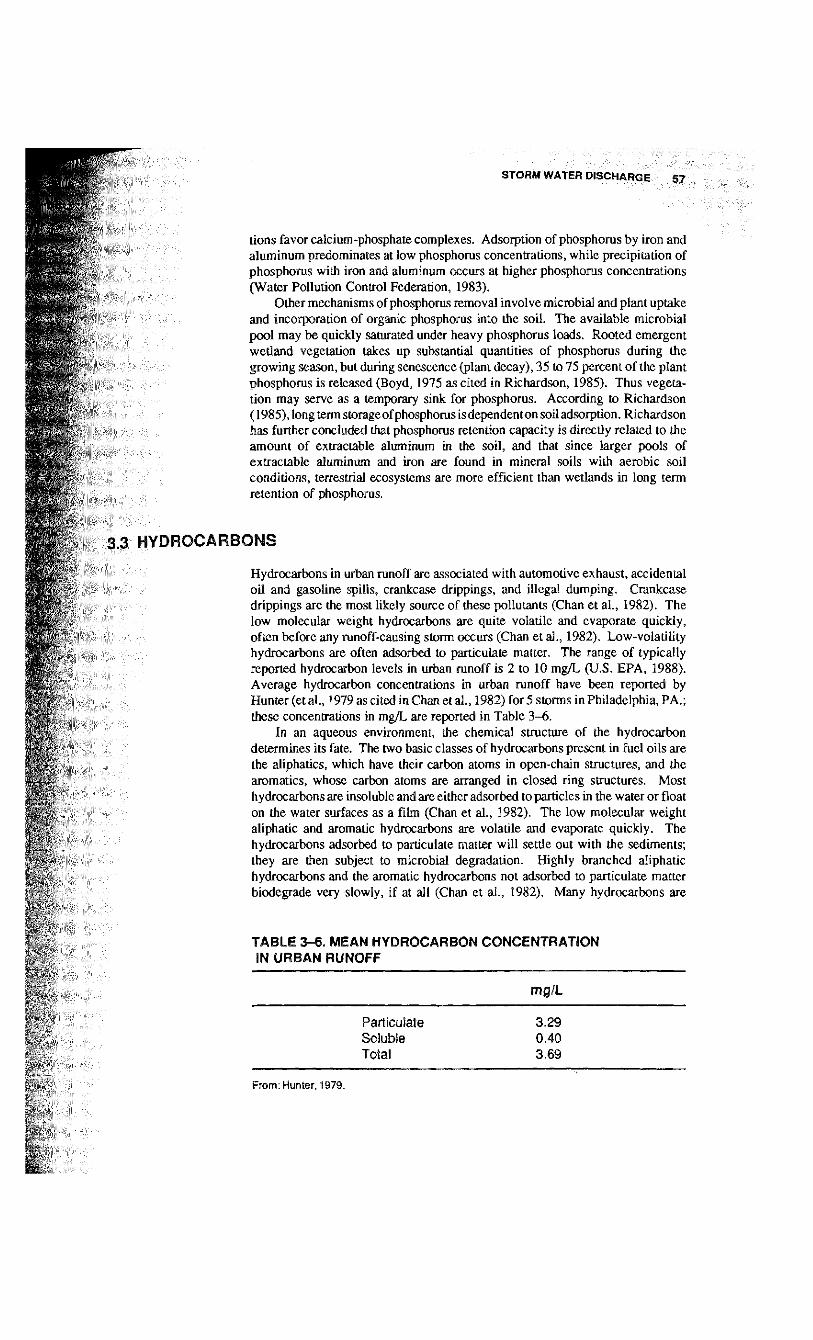
STORM WATER DISCHARGE 57
tions favor calcium-phosphate complexes. Adsorption of phosphorus by iron and aluminum predominates at low phosphorus concentrations, while precipitation of phosphorus with iron and aluminum occurs at higher phosphorus concentrations (Water Pollution Control Federation, 1983).
Other mechanisms of phosphorus removal involve microbial and plant uptake and incorporation of organic phosphorus into the soil. The available microbial pool may be quickly saturated under heavy phosphorus loads. Rooted emergent wetland vegetation takes up substantial quantities of phosphorus during the growing season, but during senescence (plant decay), 35 to 75 percent of the plant phosphorus is released (Boyd, 1975 as cited in Richardson, 1985). Thus vegetation may serve as a temporary sink for phosphorus. According to Richardson (1985), long term storage of phosphorus is dependenton soil adsorption. Richardson has further concluded that phosphorus retention capacity is directly related to the amount of extractable aluminum in the soil, and that since larger pools of extractable aluminum and iron are found in mineral soils with aerobic soil conditions, terrestrial ecosystems are more efficient than wetlands in long term retention of phosphorus.
3.3 H Y D R O C A R B O N S
Hydrocarbons in urban runoff are associated with automotive exhaust, accidental oil and gasoline spills, crankcasc drippings, and illegal dumping. Crankcase drippings are the most likely source of these pollutants (Chan et al., 1982). The low molecular weight hydrocarbons are quite volatile and evaporate quickly, often before any runoff-causing storm occurs (Chan et al., 1982). Low-volatility hydrocarbons are often adsorbed to particulate matter. The range of typically reported hydrocarbon levels in urban runoff is 2 to 10 mg/L (U.S. EPA, 1988). Average hydrocarbon concentrations in urban runoff have been reported by Hunter (et al., 1979 as cited in Chan et al., 1982) for 5 storms in Philadelphia, PA.; these concentrations in mg/L are reported in Table 3-6.
In an aqueous environment, the chemical structure of the hydrocarbon determines its fate. The two basic classes of hydrocarbons present in fuel oils are the aliphatics, which have their carbon atoms in open-chain structures, and the aromatics, whose carbon atoms are arranged in closed ring structures. Most hydrocarbons are insoluble and are either adsorbed to particles in the water or float on the water surfaces as a film (Chan et al., 1982). The low molecular weight aliphatic and aromatic hydrocarbons are volatile and evaporate quickly. The hydrocarbons adsorbed to particulate matter wil l setde out with the sediments; they are then subject to microbial degradation. Highly branched aliphatic hydrocarbons and the aromatic hydrocarbons not adsorbed to particulate matter biodegrade very slowly, i f at all (Chan et al., 1982). Many hydrocarbons are
TABLE 3-6. MEAN HYDROCARBON CONCENTRATION IN URBAN RUNOFF
mg/L
Particulate 3.29 Soluble 0.40 Total 3.69
From: Hunter, 1979.
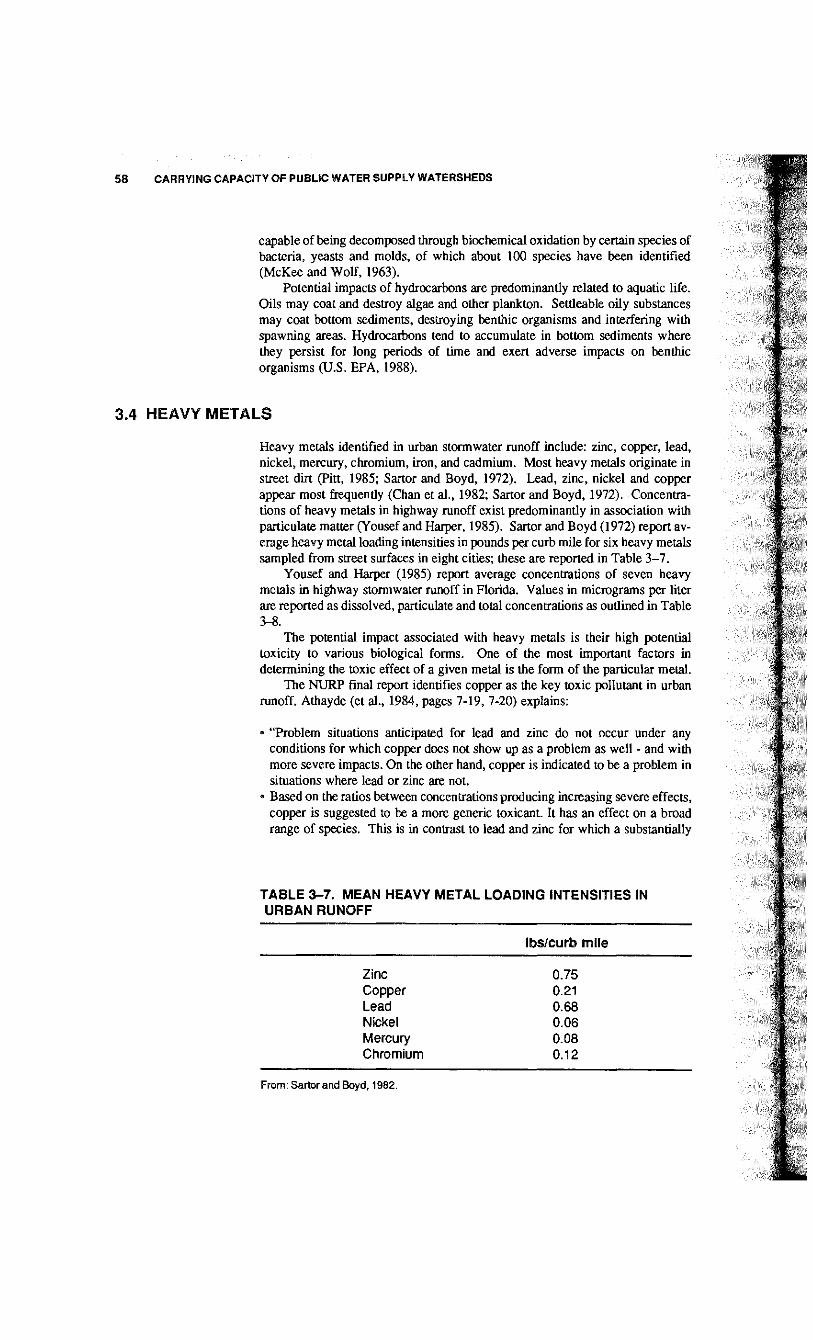
58 CARRYING CAPACITY OF PUBLIC WATER SUPPLY WATERSHEDS
capable of being decomposed through biochemical oxidation by certain species of bacteria, yeasts and molds, of which about 100 species have been identified (McKee and Wolf, 1963).
Potential impacts of hydrocarbons are predominantly related to aquatic life. Oils may coat and destroy algae and other plankton. SetUeable oily substances may coat bottom sediments, destroying benthic organisms and interfering with spawning areas. Hydrocarbons tend to accumulate in bottom sediments where they persist for long periods of time and exert adverse impacts on benthic organisms (U.S. E P A , 1988).
Heavy metals identified in urban stormwater runoff include: zinc, copper, lead, nickel, mercury, chromium, iron, and cadmium. Most heavy metals originate in street dirt (Pitt, 1985; Sartor and Boyd, 1972). Lead, zinc, nickel and copper appear most frequendy (Chan et al., 1982; Sartor and Boyd, 1972). Concentrations of heavy metals in highway runoff exist predominantly in association with particulate matter (Yousef and Harper, 1985). Sartor and Boyd (1972) report average heavy metal loading intensities in pounds per curb mile for six heavy metals sampled from street surfaces in eight cities; these are reported in Table 3-7.
Yousef and Harper (1985) report average concentrations of seven heavy metals in highway stormwater runoff in Florida. Values in micrograms per liter are reported as dissolved, particulate and total concentrations as outlined in Table
The potential impact associated with heavy metals is their high potential toxicity to various biological forms. One of the most important factors in determining the toxic effect of a given metal is the form of the particular metal.
The NURP final report identifies copper as the key toxic pollutant in urban runoff. Athayde (et al., 1984, pages 7-19, 7-20) explains:
• "Problem situations anticipated for lead and zinc do not occur under any conditions for which copper does not show up as a problem as well - and with more severe impacts. On the other hand, copper is indicated to be a problem in situations where lead or zinc are not.
• Based on the ratios between concentrations producing increasing severe effects, copper is suggested to be a more generic toxicant. It has an effect on a broad range of species. This is in contrast to lead and zinc for which a substantially
TABLE 3-7. MEAN HEAVY METAL LOADING INTENSITIES IN URBAN RUNOFF
3.4 HEAVY METALS
3-8.
lbs/curb mile
Zinc Copper
0, 0 0 0 0 0
75 21 68 .06 08 12
Lead Nickel Mercury Chromium
From: Sartor and Boyd, 1982.
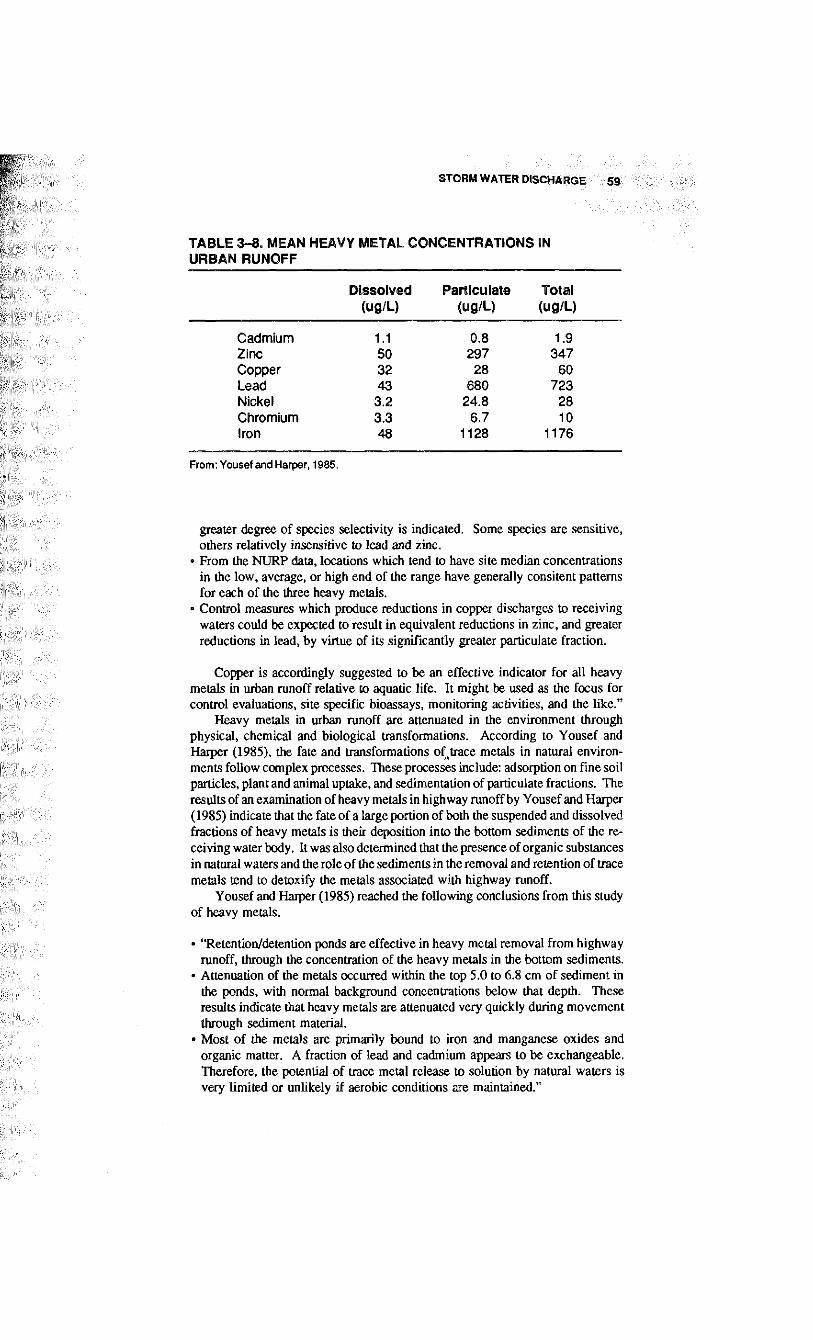
STORM WATER DISCHARGE 59
TABLE 3-8. MEAN HEAVY METAL CONCENTRATIONS IN URBAN RUNOFF
Dissolved Particulate Total (ug/L) (ug/L) (ug/L)
Cadmium 1.1 0.8 1.9 Zinc 50 297 347 Copper 32 28 60 Lead 43 680 723 Nickel 3.2 24.8 28 Chromium 3.3 6.7 10 Iron 48 1128 1176
From: You set and Harper, 1985.
greater degree of species selectivity is indicated. Some species are sensitive, others relatively insensitive to lead and zinc.
• From the NURP data, locations which tend to have site median concentrations in the low, average, or high end of the range have generally consitent patterns for each of the three heavy metals.
• Control measures which produce reductions in copper discharges to receiving waters could be expected to result in equivalent reductions in zinc, and greater reductions in lead, by virtue of its significantly greater particulate fraction.
Copper is accordingly suggested to be an effective indicator for all heavy metals in urban runoff relative to aquatic life. It might be used as the focus for control evaluations, site specific bioassays, monitoring activities, and the like."
Heavy metals in urban runoff are attenuated in the environment through physical, chemical and biological transformations. According to Yousef and Harper (1985), the fate and transformations of trace metals in natural environments follow complex processes. These processes include: adsorption on fine soil particles, plant and animal uptake, and sedimentation of particulate fractions. The results of an examination of heavy metals in highway runoff by Yousef and Harper (1985) indicate that the fate of a large portion of both the suspended and dissolved fractions of heavy metals is their deposition into the bottom sediments of the receiving water body. It was also determined that the presence of organic substances in natural waters and the role of the sediments in the removal and retention of trace metals tend to detoxify the metals associated with highway runoff.
Yousef and Harper (1985) reached the following conclusions from this study of heavy metals.
• "Retention/detention ponds are effective in heavy metal removal from highway runoff, through the concentration of the heavy metals in the bottom sediments.
• Attenuation of the metals occurred within the top 5.0 to 6.8 cm of sediment in the ponds, with normal background concentrations below that depth. These results indicate that heavy metals are attenuated very quickly during movement through sediment material.
• Most of the metals are primarily bound to iron and manganese oxides and organic matter. A fraction of lead and cadmium appears to be exchangeable. Therefore, the potential of trace metal release to solution by natural waters is very limited or unlikely if aerobic conditions are maintained."
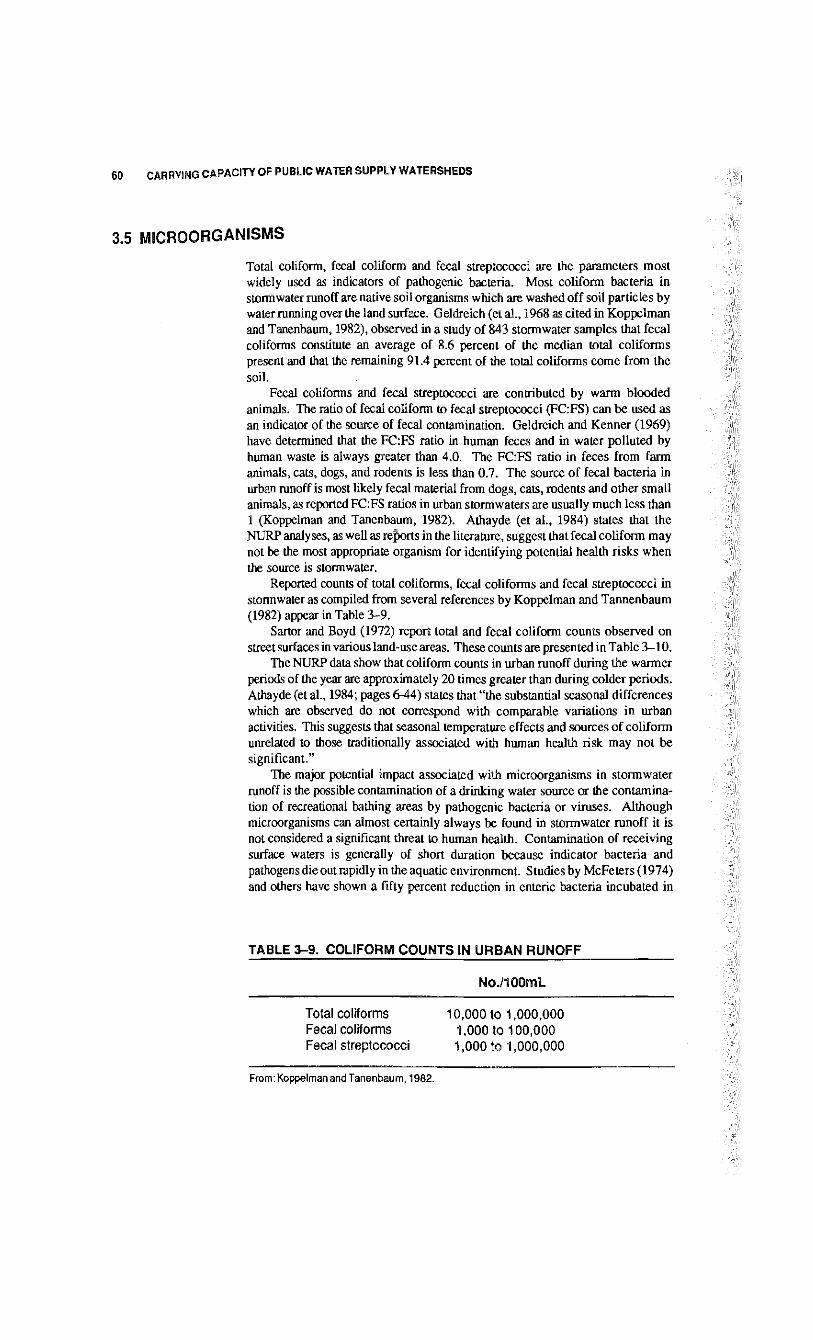
60 CARRYING CAPACITY OF PUBLIC WATER SUPPLY WATERSHEDS
3.5 MICROORGANISMS
Total coliform, fecal coliform and fecal streptococci are the parameters most widely used as indicators of pathogenic bacteria. Most coliform bacteria in storm water runoff are native soil organisms which are washed off soil particles by water running over the land surface. Geldreich (et al., 1968 as cited in Koppelman and Tanenbaum, 1982), observed in a study of 843 storm water samples that fecal coliforms constitute an average of 8.6 percent of the median total coliforms present and that the remaining 91.4 percent of the total coliforms come from the soil.
Fecal coliforms and fecal streptococci are contributed by warm blooded animals. The ratio of fecal coliform to fecal streptococci (FC:FS) can be used as an indicator of the source of fecal contamination. Geldreich and Kenner (1969) have determined that the FC:FS ratio in human feces and in water polluted by human waste is always greater than 4.0. The FC:FS ratio in feces from farm animals, cats, dogs, and rodents is less than 0.7. The source of fecal bacteria in urban runoff is most likely fecal material from dogs, cats, rodents and other small animals, as reported FC:FS ratios in urban stormwaters are usually much less than 1 (Koppelman and Tanenbaum, 1982). Athayde (et al., 1984) states that the NURP analyses, as well as reports in the literature, suggest that fecal coliform may not be the most appropriate organism for identifying potential health risks when the source is stormwater.
Reported counts of total coliforms, fecal coliforms and fecal streptococci in stormwater as compiled from several references by Koppelman and Tannenbaum (1982) appear in Table 3-9.
Sartor and Boyd (1972) report total and fecal coliform counts observed on street surfaces in various land-use areas. These counts are presented in Table 3-10.
The NURP data show that coliform counts in urban runoff during the warmer periods of the year are approximately 20 times greater than during colder periods. Athayde (et al., 1984; pages 6-44) states that "the substantial seasonal differences which are observed do not correspond with comparable variations in urban activities. This suggests that seasonal temperature effects and sources of coliform unrelated to those traditionally associated with human health risk may not be significant."
The major potential impact associated with microorganisms in stormwater runoff is the possible contamination of a drinking water source or the contamination of recreational bathing areas by pathogenic bacteria or viruses. Although microorganisms can almost certainly always be found in stormwater runoff it is not considered a significant threat to human health. Contamination of receiving surface waters is generally of short duration because indicator bacteria and pathogens die out rapidly in the aquatic environment. Studies by McFeters (1974) and others have shown a fifty percent reduction in enteric bacteria incubated in
TABLE 3-9. COLIFORM COUNTS IN URBAN RUNOFF
No./100mL
Total coliforms Fecal coliforms Fecal streptococci
10,000 to 1,000,000 1,000 to 100,000 1,000 to 1,000,000
From: Koppelman and Tanenbaum, 1982.
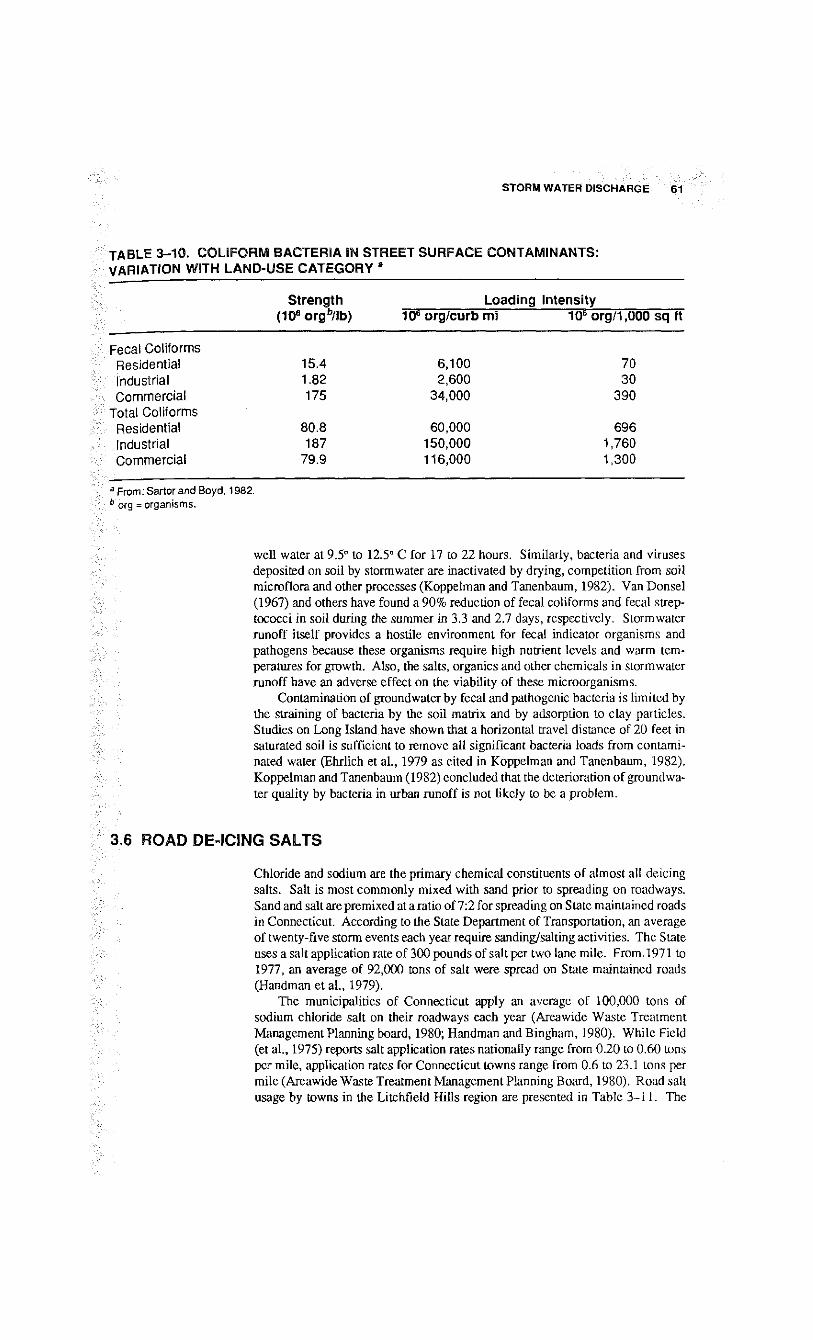
STORM WATER DISCHARGE 61
TABLE 3-10. COLIFORM BACTERIA IN STREET SURFACE CONTAMINANTS: VARIATION WITH LAND-USE CATEGORY •
Strength (108 org"/lb) 10* org/curb mi
Loading Intensity 10 6 org/1,000 sq ft
Fecal CoNfcrris Residential Indusirio!
15.4 1.82 175
6,100 2,600
34,000
70 30
390 Commercial Toial Conforms
Residential Industrial Commercial
80.8 187
79.9
60,000 150,000 116,000
696 1,760 1,300
•'From Sartor and Boyd, 1982. b org = organisms.
well water at 9.5° to 12.5° C for 17 to 22 hours. Similarly, bacteria and viruses deposited on soil by stormwater are inactivated by drying, competition from soil microflora and other processes (Koppelman and Tanenbaum, 1982). Van Donsel (1967) and others have found a 90% reduction of fecal coliforms and fecal streptococci in soil during the summer in 3.3 and 2.7 days, respectively. Stormwater runoff itself provides a hostile environment for fecal indicator organisms and pathogens because these organisms require high nutrient levels and warm temperatures for growth. Also, the salts, organics and other chemicals in stormwater runoff have an adverse effect on the viability of these microorganisms.
Contamination of groundwater by fecal and pathogenic bacteria is limited by the straining of bacteria by the soil matrix and by adsorption to clay particles. Studies on Long Island have shown that a horizontal travel distance of 20 feet in saturated soil is sufficient to remove all significant bacteria loads from contaminated water (Ehrlich et al., 1979 as cited in Koppelman and Tanenbaum, 1982). Koppelman and Tanenbaum (1982) concluded that the deterioration of groundwater quality by bacteria in urban runoff is not likely to be a problem.
Chloride and sodium are the primary chemical constituents of almost all deicing salts. Salt is most commonly mixed with sand prior to spreading on roadways. Sand and salt are premixed at a ratio of 7:2 for spreading on State maintained roads in Connecticut. According to the State Department of Transportation, an average of twenty-five storm events each year require sanding/salting activities. The State uses a salt application rate of 300 pounds of salt per two lane mile. From 1971 to 1977, an average of 92,000 tons of salt were spread on State maintained roads (Handman et al., 1979).
The municipalities of Connecticut apply an average of 100,000 tons of sodium chloride salt on their roadways each year (Areawide Waste Treatment Management Planning board, 1980; Handman and Bingham, 1980). While Field (et al., 1975) reports salt application rates nationally range from 0.20 to 0.60 tons per mile, application rates for Connecticut towns range from 0.6 to 23.1 tons per mile (Areawide Waste Treatment Management Planning Board, 1980). Road salt usage by towns in the Litchfield Hills region are presented in Table 3-11. The
3.6 ftOAD DE-ICING SALTS
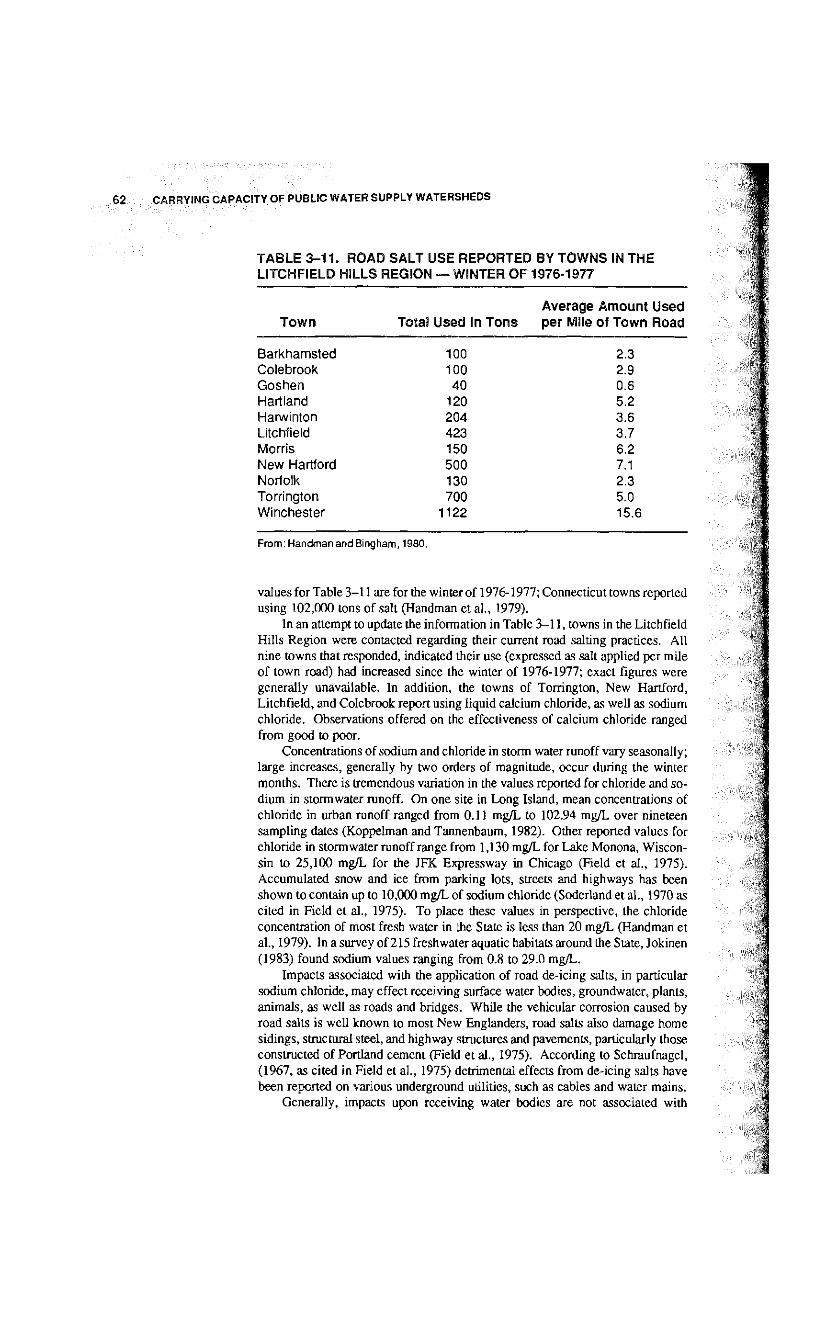
62 CARRYING CAPACITY OF PUBLIC WATER SUPPLY WATERSHEDS
TABLE 3-11. ROAD SALT USE REPORTED BY TOWNS IN THE LITCHFIELD HILLS REGION — WINTER OF 1976-1977
Average Amount Used Town Total Used in Tons per Mile of Town Road
Barkhamsted 100 2.3 Colebrook 100 2.9 Goshen 40 0.6 Hartland 120 5.2 Harwinton 204 3.6 Litchfield 423 3.7 Morris 150 6.2 New Hartford 500 7.1 Norfolk 130 2.3 Torrington 700 5.0 Winchester 1122 15.6
From: Handman and Bingham, 1980.
values for Table 3-11 are for the winter of 1976-1977; Connecticut towns reported using 102,000 tons of salt (Handman et al., 1979).
In an attempt to update the information in Table 3-11, towns in the Litchfield Hills Region were contacted regarding their current road salting practices. A l l nine towns that responded, indicated their use (expressed as salt applied per mile of town road) had increased since the winter of 1976-1977; exact figures were generally unavailable. In addition, the towns of Torrington, New Hartford, Litchfield, and Colebrook report using liquid calcium chloride, as well as sodium chloride. Observations offered on the effectiveness of calcium chloride ranged from good to poor.
Concentrations of sodium and chloride in storm water runoff vary seasonally; large increases, generally by two orders of magnitude, occur during the winter months. There is tremendous variation in the values reported for chloride and sodium in stormwater runoff. On one site in Long Island, mean concentrations of chloride in urban runoff ranged from 0.11 mg/L to 102.94 mg/L over nineteen sampling dates (Koppelman and Tannenbaum, 1982). Other reported values for chloride in stormwater runoff range from 1,130 mg/L for Lake Monona, Wisconsin to 25,100 mg/L for the J F K Expressway in Chicago (Field et al., 1975). Accumulated snow and ice from parking lots, streets and highways has been shown to contain up to 10,000 mg/L of sodium chloride (Soderland et al., 1970 as cited in Field et al., 1975). To place these values in perspective, the chloride concentration of most fresh water in the State is less than 20 mg/L (Handman et al., 1979). In a survey of 215 freshwater aquatic habitats around the State, Jokinen (1983) found sodium values ranging from 0.8 to 29.0 mg/L.
Impacts associated with the application of road de-icing salts, in particular sodium chloride, may effect receiving surface water bodies, groundwater, plants, animals, as well as roads and bridges. While the vehicular corrosion caused by road salts is well known to most New Englanders, road salts also damage home sidings, structural steel, and highway structures and pavements, particularly those constructed of Portland cement (Field et al., 1975). According to Schraufnagel, (1967, as cited in Field et al., 1975) detrimental effects from de-icing salts have been reported on various underground utilities, such as cables and water mains.
Generally, impacts upon receiving water bodies are not associated with
STORM WATER DISCHARGE 63
sodium chloride in stormwater runoff. High concentrations are necessary for these salts to have toxic effects on aquatic organisms. Reported toxicity levels of sodium chloride on freshwater fish range from 2,500 to 50,000 mg/L NaCl (McKee and Wolf, 1963). The threshold concentration of sodium chloride in natural waters reported for immobilization of Daphnia and other fish-food organisms range from 2,100 to 6,143 mg/L NaCl. Crustaceans and fish fry are also reported to be immobilized by concentrations above 43,100 mg/L (McKee and Wolf, 1963). Upon entering a water body, stormwater carrying road salt will quickly be diluted; it is unlikely that salt levels in receiving water bodies would exceed the values reported above. Field (et al. 1975, citing Sharp, 1970) states that sodium from road salts entering lakes may stimulate nuisance blue-green algal blooms by increasing the level of one of the monovalent ions essential for the optimum growth of blue-greens. (No other reference to this potential impact was found in the literature.) It has also been reported that sodium in lake water may allow mercury and other heavy metals in bottom sediments to be released to overlying waters, via the mechanism of ion exchange. (Feick et al., 1972 in Field, 1975) .
Some research has been conducted on the effects of roadway de-icing salts on roadside plantings. Field (et al., 1975) cites twelve studies indicating liberal applications of road salts lead to widespread damage of roadside vegetation. Brady (1974, page 399) explains that, "when a water solution containing a relatively large amount of dissolved salts is brought into contact with a plant cell, it wi l l cause a shrinkage of the protoplasmic lining. This action, called plasmo-lysis, increases with the concentration of the salt solution. The phenomenon is due to the osmotic movement of the water, which passes from the cell toward the more concentrated salt solution. The cell then collapses." Thus, injury to vegetation occurs with salt accumulation in plant tissues, causing a general growth reduction followed by leaf scorch and curling, leaf drop, stem dieback and a gradual decline in vigor which can ultimately result in death (Hanes et al., 1976). It is difficult to accurately forecast the tolerance of plants to salt. Likewise, absolute values of toxic concentrations of salt are difficult to diagnose because the amounts of salt contained in plant tissues vary with age, species, kind of tissue, nutrient balance, seasons of sampling, and other factors. However, applications of salt at 1,500 to 3,000 lbs/acre have been shown to cause slight to moderate damage to some plant species while severe damage occurred at 3,000 to 13,000 lbs/acre (Hanes et al.,
1976) . Brady (1974) states that young seedlings are especially sensitive to salts. A study on the effects of de-icing salts upon trees and shrubs in Connecticut concluded that areas within thirty feet of a heavily travelled highway are more hostile to the growth of many trees and shrubs than distances of thirty to eighty feet (Button et al., 1977). It can be expected therefore that some plant damage will occur within the immediate vicinity of storm drainage system outfalls. However, the replacement of less tolerant plants with species more tolerant to salt will naturally occur. A list of the reported relative tolerances of selected plant species can be found in Appendix I .
Additives present in many highway salts create additional pollution problems. Sodium ferrocyanide, used to minimize caking of salt stocks, is soluble in water and generates deadly cyanide in the presence of sunlight (Hanes et al., 1970, as cited in Field et al., 1975). Tests by the State of Wisconsin indicate that 15.5 mg/L of sodium ferrocyanide can produce 3.8 mg/L of cyanide in just thirty minutes (Hanes et al., 1970, as cited in Field et al., 1975). The Public Health Service limit for cyanide in public drinking water is 0.01 mg/L (McKee and Wolf, 1963). According to Scheidt, (1967, as cited in Field et al., 1975) tastes and odors in Connecticut domestic water supplies have been traced to sodium ferrocyanide originating from salt storage areas. In addition, chromate is added to de-icers for
64 CARRYING CAPACITY OF PUBLIC WATER SUPPLY WATERSHEDS
inhibition of corrosion (Hanes et al., 1970, as cited in Field et al., 1975). Chromium is also highly toxic; the Public Health Service limit for drinking water is 0.05 mg/L (McKee and Wolf, 1963).
The greatest potential impact to water resources from the use of road de-icing salts is on groundwater. (A review of the general principles and importance of groundwater in Connecticut is presented in section 6.0). As Handman (et al., 1979) explains, salt enters groundwater as a solution containing chloride and sodium. Little or no removal of chloride ions takes place via adsorption. Thus, chloride is used as an indicator of the rate and extent of groundwater contamination. Sodium ions, however, may be exchanged for other ions by clay minerals found in soil. This attenuation of sodium is limited; in Connecticut, decreases in concentration result primarily from dilution since most minerals in the saturated zone of aquifers adsorb few ions. Groundwater is the source of most drinking water in rural areas of the state. In a study of groundwater quality in Connecticut, Melvin (et al., 1987) reports that sodium levels exceeded the State drinking water standard of 20 mg/L in about 12% of the water samples from all aquifers. In addition to increasing the corrosiveness of water, Handman (et al., 1979) states that high chloride levels in groundwater are unacceptable to some industrial uses such as dairy processing and photographic operations. The U.S. Public Health Service (1962) drinking water standard for chloride is 250 mg/L. This standard was chosen partly on the basis of taste, according to Handman, (et al., 1979) since chloride in drinking water does not directly affect health. The rise in sodium and chloride concentrations in Connecticut can not be attributed to natural sources alone (Handman et al., 1979). While contaminations can occur anywhere salt applications are high and runoff reaches the water table, groundwater contamination is usually associated with salt storage (Handman et al., 1979; Melvin et al., 1987; Banach, 1988).
The Connecticut Department of Transportation (CT DOT) maintains 126 salt storage sites; 13 are known to have caused groundwater contamination (Handman et al., 1979). The C T DOT reports salt from stockpiles has been detected in groundwater as far as 600 feet from the storage area (Handman and Bingham, 1980) . Salt leaching from a storage area in Haddam rendered groundwater unsuitable for drinking over an area extending 1000 feet downgradient from the storage site (Handman and Bingham, 1980). The C T DOT presently covers their salt stockpiles and places them on pavement. Handman (et al., 1979, pg. 35) reports, "runoff from the paved area is either collected and directed into retention basins to prevent it from reaching groundwater, or is discharged into streams considered to have sufficient flow to adequately dilute it." However, in the same report Handman (et al., 1979, pg. 2) cautions that, "even where salt piles have been eliminated, moved, or covered, the residual salt-impregnated soil can still affect water quality." According to Fred Banach (1988), of the C T Department of Environmental Protection, the towns and the State have generally improved their awareness and effectiveness of salt storage over the last fifteen years. Virtually all towns now have separate storage for their salt piles. The towns and State were surveyed in 1987, however, and it was found that 55 sand/salt stockpiles remained uncovered (Banach, 1988).
Increasing understanding of the adverse environmental impacts of sodium chloride use has lead to the development of alternative de-icers. Urea is used on runways at some Connecticut airports and cal-salt, a mixture of calcium chloride and sodium chloride, is used in selected watershed areas of the State (Handman and Bingham, 1979). Calcium magnesium acetate (CMA), another alternative de-icer, may cause fewer impacts than sodium chloride.
According to Laperriere (1988), CMA is really a mixture of calcium acetate and magnesium acetate; the molecule, "calcium-magnesium-acetate", never
STORM WATER DISCHARGE 65
actually exists. CMA is currently being produced and marketed commercially by Chevron under the name, "Ice-B-Gone". This pellet form of CMA can be applied with the same equipment used for road salt. Ice-B-Gone is much more expensive than NaCI, but it does not have the high secondary or "hidden" costs associated with NaCI impacts. For example, C M A does not corrode concrete, zinc, aluminum or steel. Product safety data sheets supplied by Chevron state that it is benign to both herbaceous and woody plants. CMA is not toxic to fish; the lethal concentration for flathead minnows, for example, is 21,000 mg/L. In addition, C M A does not stain roads; white pavement markings remain visible. In a review of field tests of CMA, Chollar (1988) states that it loosened packed snow for easier removal by plows; it is superior to NaCI as a "snowfluffer". In addition, roadways treated with CMA showed signs of maintaining the effect from storm to storm. Depending on conditions, C M A sometimes requires a longer period of time to act than does NaCI (Chollar, 1988). According to Blodgelt (1988), the Massachusetts Department of Public Works has been using Ice-B-Gone for three years. It is used in areas with high salt concentrations in groundwater, in public water supply watersheds, and adjacent to a sensitive cranberry bog on Cape Cod. Blodgett (1988) states that as a de-icer, C M A is superior to NaCI, but the high cost of Ice-B-Gone prevents widespread use. Other users of Ice-B-Gone in the northeast include New York City, for use on its bridges, and the Castleview Convention Center in Windham, New Hampshire.
The use of CMA also creates potential environmental impacts. The degradation and utilization of the acetate component of CMA by bacteria and phytoplank-ton in surface waters consumes oxygen. Chevron and Laperriere (1988) identify this high BOD as the leading potential environmental impact of CMA. Chevron recommends that the use of Ice-B-Gone be limited or monitored in areas where runoff to receiving waters receives less than a 100:1 dilution. In an experimental study, Laperriere (1988) applied CMA directly to small ponds in Alaska. A concentration of 22 mg/L within the ponds produced no change in dissolved oxygen. At 60 mg/L, however, phytoplankton populations increased and the dissolved oxygen levels were depressed to 0-2 mg/L for weeks. Laperriere (1988) feels that CMA is a very practical alternative to NaCI, but should not be used where undiluted runoff may enter nearby lotic (standing) receiving waters. Finally, like NaCI, CMA has the potential to mobilize trace metals through ionic-exchange reactions in soils and lake sediments.
3.7 BIOCHEMICAL OXYGEN DEMAND AND CHEMICAL OXYGEN DEMAND
Biochemical oxygen demand (BOD) and chemical oxygen demand (COD) are two indices used to measure the effect of oxygen demanding pollutants on receiving waters. For the most part, such pollutants are organic substances. BOD measures the oxygen consumed in a sample by bacteria during a 5 day test period:;COD is a measure of how much oxidizable matter is consumed by chemically treating a sample with strong chemicals (i.e., concentrated sulphuric acid and potassium dichromate) at high temperature.
Reported concentrations of BOD in stormwater are quite variable. The variability of reported concentrations may be due to the inhibitory effect of toxic compounds in urban runoff that cause problems with B O D determinations (Abernathy, 1981). For different storms monitored in East York, Canada, Aber-nathy (1981) determined flow-weighted mean concentrations of BOD in urban runoff ranging from 4 mg/L to 188 mg/L. Abernathy (1981) further estimated an average loading rate of BOD in urban stormwater of 0.87 kilograms per curb kilometer per day (3.09 pounds per curb mile per day). Sartor (et al., 1974), as cited
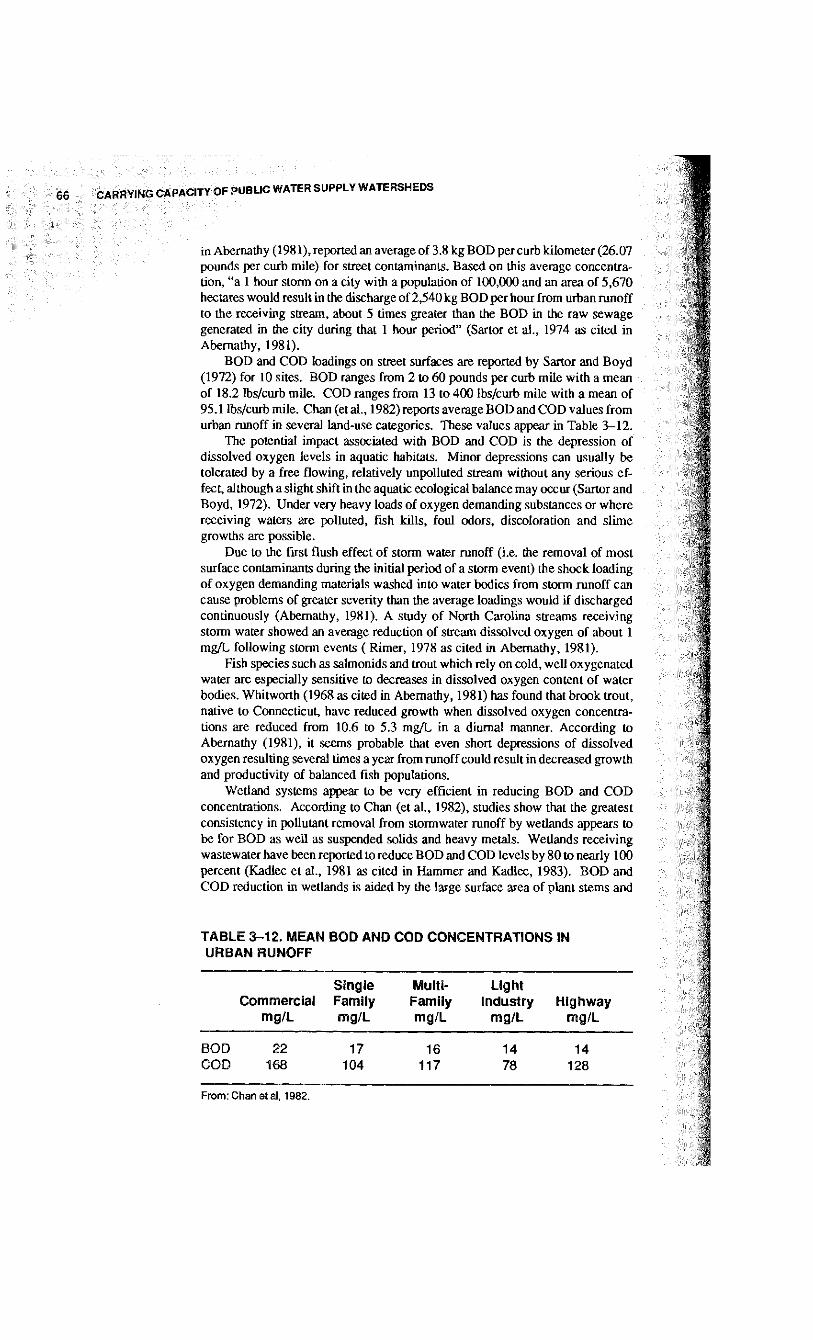
CAPACITY OF PUBLIC WATER SUPPLY WATERSHEDS
in Abernathy (1981), reported an average of 3.8 kg BOD per curb kilometer (26.07 pounds per curb mile) for street contaminants. Based on this average concentration, "a 1 hour storm on a city with a population of 100,000 and an area of 5,670 hectares would result in the discharge of2,540 kg BOD per hour from urban runoff to the receiving stream, about 5 times greater than the BOD in the raw sewage generated in the city during that 1 hour period" (Sartor et al., 1974 as cited in Abernathy, 1981).
BOD and COD loadings on street surfaces are reported by Sartor and Boyd (1972) for 10 sites. BOD ranges from 2 to 60 pounds per curb mile with a mean of 18.2 lbs/curb mile. COD ranges from 13 to 400 lbs/curb mile with a mean of 95.1 lbs/curb mile. Chan (et al., 1982) reports average B O D and COD values from urban runoff in several land-use categories. These values appear in Table 3-12.
The potential impact associated with BOD and COD is the depression of dissolved oxygen levels in aquatic habitats. Minor depressions can usually be tolerated by a free flowing, relatively unpolluted stream without any serious effect, although a slight shift in the aquatic ecological balance may occur (Sartor and Boyd, 1972). Under very heavy loads of oxygen demanding substances or where receiving waters are polluted, fish kills, foul odors, discoloration and slime growths are possible.
Due to the first flush effect of storm water runoff (i.e. the removal of most surface contaminants during the initial period of a storm event) the shock loading of oxygen demanding materials washed into water bodies from storm runoff can cause problems of greater severity than the average loadings would if discharged continuously (Abernathy, 1981). A study of North Carolina streams receiving storm water showed an average reduction of stream dissolved oxygen of about 1 mg/L following storm events ( Rimer, 1978 as cited in Abernathy, 1981).
Fish species such as salmonids and trout which rely on cold, well oxygenated water are especially sensitive to decreases in dissolved oxygen content of water bodies. Whitworth (1968 as cited in Abernathy, 1981) has found that brook trout, native to Connecticut, have reduced growth when dissolved oxygen concentrations are reduced from 10.6 to 5.3 mg/L in a diurnal manner. According to Abernathy (1981), it seems probable that even short depressions of dissolved oxygen resulting several times a year from runoff could result in decreased growth and productivity of balanced fish populations.
Wetland systems appear to be very efficient in reducing BOD and COD concentrations. According to Chan (el al., 1982), studies show that the greatest consistency in pollutant removal from stormwater runoff by wetlands appears to be for B O D as well as suspended solids and heavy metals. Wedands receiving wastewater have been reported to reduce BOD and COD levels by 80 to nearly 100 percent (Kadlec et al., 1981 as cited in Hammer and Kadlec, 1983). B O D and COD reduction in wetlands is aided by the large surface area of plant stems and
TABLE 3-12. MEAN BOD AND COD CONCENTRATIONS IN URBAN RUNOFF
Single Multi- Light Commercial Family Family Industry Highway
mg/L mg/L mg/L mg/L mg/L
BOD 22 17 16 14 14 COD 168 104 117 78 128
From: Chan et al, 1982.
STORM WATER DISCHARGE 67
litter which form a substrate for bacterial populations (Hammer and Kadlec, 1983). BOD and COD associated with settling solids can decay anaerobically. Algae provide high levels of dissolved oxygen further enhancing pollutant removal (Hammer and Kadlec, 1983).
3.8 PRIORITY POLLUTANTS
Urban runoff in Long Island was analyzed for the U.S . Environmental Protection Agency designated priority pollutants under the Nationwide Urban Runoff Program (Koppelman and Tannenbaum, 1982). Stormwater and groundwater beneath stormwater detention/retention basins were analyzed for these pollutants. The following were the most commonly occurring compounds in stormwater and groundwater: benzene, bis (2ethyl hexyl) phlhalate, chloroform, methylene chloride, toulene and 1,1,1 -trichloroethane. Methylene chloride was found to be the only pollutant that was consistently found in concentrations greater than 8 micrograms/liter. Only two storm events resulted in priority pollutant concentrations above the 50 microgram s/liter concentration cited as a maximum by the New York State Department of Health guidelines for organic chemicals in drinking water. Nationwide, NURP involved monitoring 120 priority pollutants in storm water discharges from residential, commercial and light industrial areas. Seventy-seven priority pollutants were detected in samples of storm water discharges from these land uses, including 14 inorganic and 63 organic pollutants. Twenty-four priority pollutants, including metals, inorganics, pesticides, phenols and hydrocarbons were detected in at least 10% of the discharge samples which were sampled for priority pollutants. Furthermore, the NURP data showed a significant number of these samples exceeded various fresh water quality criteria (U.S. E P A , 1988).
3.9 POLLUTANT TRANSPORT MECHANISMS
Sources of stormwater runoff include road surfaces, parking areas, paved storage areas, sidewalks, roof drains, underdrains and other land surfaces. Pollutants in stormwater runoff of most concern are those found on paved surfaces. It is here that most of the contaminants will be deposited and concentrated over time.
The sequence through which these pollutants will move can be described as follows.
1. Precipitation causes the freeing of contaminants from the paved surface. 2. The contaminants are carried by water transversely across the paved surface to
gutters or direcdy to storm sewer inlets (i.e., catch basins) via sheet-like flow. 3. Stormwater is transported to receiving water bodies or detention/retention
basins via storm sewers. 4. Stormwater is discharged to surface waters or is infiltrated into the soil matrix
below detention/retention basins.
The manner in which contaminants are flushed from paved surfaces by rainfall wil l have an effect on the ultimate fate of these contaminants. Pollutants are removed from paved surfaces via two mechanisms: (1) soluble fractions go into solution and (2) particulate matter is dislodged from the surface by the impact of falling drops and surface flow.
Experimental studies to determine the rate of contaminant removal from street surfaces at various levels of rainfall were conducted by Sartor and Boyd
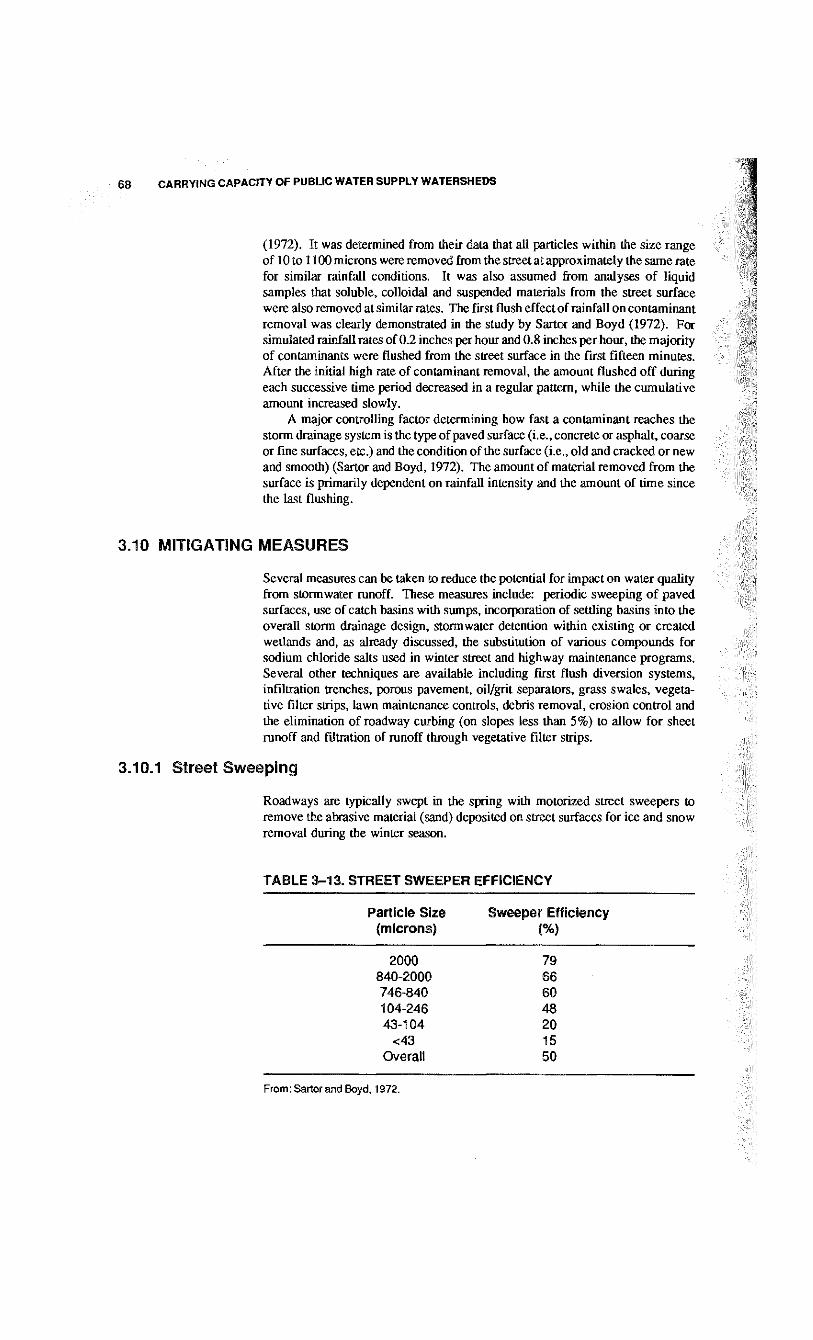
68 CARRYING CAPACITY OF PUBLIC WATER SUPPLY WATERSHEDS
(1972). It was determined from their data that all particles within the size range of 10 to 1100 microns were removed from the street at approximately the same rate for similar rainfall conditions. It was also assumed from analyses of liquid samples that soluble, colloidal and suspended materials from the street surface were also removed at similar rates. The first flush effect of rainfall on contaminant removal was clearly demonstrated in the study by Sartor and Boyd (1972). For simulated rainfall rates of 0.2 inches per hour and 0.8 inches per hour, the majority of contaminants were flushed from the street surface in the first fifteen minutes. After the initial high rate of contaminant removal, the amount flushed off during each successive time period decreased in a regular pattern, while the cumulative amount increased slowly.
A major controlling factor determining how fast a contaminant reaches the storm drainage system is the type of paved surface (i.e., concrete or asphalt, coarse or fine surfaces, etc.) and the condition of the surface (i.e., old and cracked or new and smooth) (Sartor and Boyd, 1972). The amount of material removed from the surface is primarily dependent on rainfall intensity and the amount of time since the last flushing.
Several measures can be taken to reduce the potential for impact on water quality from stormwater runoff. These measures include: periodic sweeping of paved surfaces, use of catch basins with sumps, incorporation of settling basins into the overall storm drainage design, stormwater detention within existing or created wetlands and, as already discussed, the substitution of various compounds for sodium chloride salts used in winter street and highway maintenance programs. Several other techniques are available including first flush diversion systems, infiltration trenches, porous pavement, oil/grit separators, grass swales, vegetative filter strips, lawn maintenance controls, debris removal, erosion control and the elimination of roadway curbing (on slopes less than 5%) to allow for sheet runoff and filtration of runoff through vegetative filter strips.
Roadways are typically swept in the spring with motorized street sweepers to remove the abrasive material (sand) deposited on street surfaces for ice and snow removal during the winter season.
3.10 MITIGATING MEASURES
3.10.1 Street Sweeping
TABLE 3-13. STREET SWEEPER EFFICIENCY
Particle Size (microns)
Sweeper Efficiency (%)
2000 840-2000 746-840 104-246 43-104
<43 Overall
79 66 60 48 20 15 50
From: Sartor and Boyd, 1972.
STORM WATER DISCHARGE 69
Motorized street sweepers are designed to loosen dirt and debris from the street surface, which is transported via a conveyor to a a temporary storage hopper. Spring street sweeping is a routine practice in northern areas since much of the insoluble abrasive materials used in winter road sanding remain on the streets.
In an extensive study on street sweeping effectiveness, Sartor and Boyd (1972) found a 50 percent overall removal effectiveness for street dirt and dust. Removal efficiency of conventional street sweepers is dependent on the particle size range of street surface contaminants as shown in table 3-13.
As can be seen from Table 3-3, approximately 25% of oxygen demand, 56% of phosphates, 32% of nitrates and 5 1 % of heavy metals are associated with particle sizes less than 43 microns. As can be seen from Table 3-13 above, sweepers are ineffective in removing particles finer than 43 microns (85% of the material finer than 43 microns is left behind).
Pitt (1985), through extensive data analysis, has concluded that street cleaning equipment preferentially removes the larger particles while rain events remove finer materials, and that street cleaning does not very effectively remove the available particulates. He further states that street cleaning operations are expected to improve runoff quality by a maximum of 10 percent. While it is concluded that street sweeping is not effective in removing much of the pollutant load in stormwater runoff; it is effective in reducing sediment that would otherwise be deposited in storm drainage structures, settling basins, or the receiving water bodies.
Best management practices for street cleanning appear in Appendix D.
3.10.2 Catch Basins
Catch basins work as effective sediment traps and have been shown to effectively remove the coarse granular material in stormwater runoff. Test results have shown that virtually all of the solids larger than 246 microns are removed by catch basins (Sartor and Boyd, 1972). On the other hand, catch basins remove only a small portion of the fine solids. Since it is the fine particles that most pollutants are associated with, catch basins are not effective in reducing pollutants other than some suspended solids in stormwater.
In a study of the effect of street and storm sewer cleaning on urban runoff, Pitt (1985) concluded that about 60 percent of the total available sump volumes in catch basins are used to detain particulates at a stable volume. He also concluded that cleaning catch basin sumps about twice a year is expected to reduce lead and total solid concentrations in urban runoff by 10 percent to 25 percent and COD, phosphorus, nitrogen and zinc by 5 to 10 percent.
Catch basins are also discussed in section 5.2.2.3.
3.10.3 Settling Basins
Settling basins constructed at storm drainage discharge points can effectively remove particulate matter from stormwater runoff. The efficiency of settling basins to remove suspended solids is determined by residency time within the basin and the nature of the flow pattern through the basin. Residency time depends on the volume of the basin and flow rates entering the basin. Providing meandering flows and the longest flow paths possible from inlet to outlet will maximize sediment deposition rates and overall pollutant removal effectiveness. Aerobic soil conditions present in settling basins for the majority of time are favorable for the removal of phosphorus, nitrogen, and heavy metals from highway runoff. Under aerobic conditions, organic nitrogen will be converted to ammonium and ammonium will be further converted to nitrate. The aerobic
70 CARRYING CAPACITY OF PUBLIC WATER SUPPLY WATERSHEDS
conditions wil l also facilitate the adsorption and precipitation of phosphorous. It has also been demonstrated that settling basins are effective in heavy metal removal from stormwater runoff through concentration of the heavy metals in the bottom sediments.
Detention basins on individual subdivisions, for the control of post development increases in runoff, have been used with greater frequency since the early 1970's. While their use is effective in complying with local zoning regulations and sound engineering practice, the long-term maintenance of these structures has not been viewed with favor by municipalities due to the added costs associated with berm and weir maintenance and the removal of accumulated sediment. Ideally, a more logical approach to stormwater runoff control may be to address the entire watershed. This approach would provide for the construction of a single control measure placed at an appropriate position in the basin. This approach would require inter-town cooperation since watersheds do not respect corporate boundaries. Coordination of the program could be directed by the regional planning agency, council of governments or other regional agency. Costs associated with basin construction and maintenance could be derived from application fees paid to the town from developers as well as a portion of tax revenues from the communities served. The details of such a program are beyond the scope of this report, but the potential for this approach merits further consideration.
Settling basins are also discussed in section 5.3; best management practices for detention basins are included in Appendix D.
3.10.4 Wetlands Treatment Systems
Polishing of stormwater runoff by utilizing existing or created wetlands as detention basins or stormwater treatment systems can be an effective measure in protecting surface and ground waters. It has been demonstrated that wetlands are very effective in removing a large amount of the pollutants that are present in stormwater.
One of the major functions of wetlands is the removal of suspended sediment from water moving through the wedands. Decreased flow rate due to sheet-like flow and the presence of vegetation promote fallout of suspended particles. Since sediments often carry a substantial portion of the pollutant load of stormwaters, (i.e., adsorbed nutrients, heavy metals, COD and BOD) deposition of sediments can result in the removal of nutrients and toxins from the stormwater. Also, since little reworking of the sediments occurs in wetland systems, deposition of sediments can result in virtually permanent removal of most pollutants.
Wedands provide an ideal environment for the denitrification of nitrates present in stormwaters to nitrogen gas because their substrates contain large amounts of organic carbon and because of the existence of anaerobic conditions. Denitrification has been demonstrated in many wetland studies and is generally cited as the major reason that wetlands are nitrogen traps or sinks (van der Valk et al., 1978). Dissolved nitrogen in stormwater is removed not only by denitrification, but also through assimilation by emergent and submerged plants.
Phosphorus in stormwater runoff discharged to wetlands is removed from the stormwater via precipitation or adsorption of phosphorus on organic matter and through assimilation by plants and algae. The general pattern of phosphorus removal from stormwater is nearly complete removal of phosphorus during the growing season and limited uptake with possible release during non-growth seasons.
Since heavy metals are generally adsorbed to particulate matter in stormwater runoff, and since wetlands are considered very effective in the removal of
STORM WATER DISCHARG E 71
suspended sediments, deposition of sediments effectively removes heavy metals from stormwater runoff.
The long retention times associated with wetlands allow adequate time for die-off of fecal and pathogenic microorganisms that may be present in stormwater runoff. Die-off occurs through competition with other soil microorganisms, inadequate nutrient source and other metabolic stresses (i.e., lower temperatures).
WeUand systems show great consistency in the reduction of biochemical oxygen demand and chemical oxygen demand. The large amount of surface area of plant stems and litter form a substrate for bacterial populations which are responsible for BOD and COD reductions. BOD and COD are often associated with particulate matter. Therefore, sediment deposition aids in the removal of COD and BOD from stormwater runoff.
NOES CITED
Abernathy, R.A. 1981. Oxygen Consuming Organics in Non-point Source Runoff—A Literature Review. US Environmental Protection Agency. E P A 600/ 3 81033.
Areawide Waste Treatment Management Planning Board. 1980. Managing Water Quality 1976-1980: The Connecticut 208 Program. Management Planning Board, Middletown, C T .
Athayde, D.N.; P .E . Shelley; E .D . Driscoll; D. Gaboury and G . Boyd. 1984. Results of the Nationwide Urban Runoff Program, Volume I-Final Report. U.S. Environmental Protection Agency. Washington, D.C.
Banach, F . 1988. Sources and Causes of Groundwater Pollution in Connecticut: A seminar sponsored by the Institute of Water Resources, Storrs, C T , December 14, 1988.
Blodgett, D. 1988. Massachusetts Department of Public Works, personal communication.
Brady, N.C. 1984. The Nature and Properties of Soils (8th ed.). Macmillan Publishing Co., Inc.. New York, N Y .
Button, E . G . ; and D.E. Peaslee. 1967. The Effect of Rocks Salt Upon Roadside Sugar Maples in Connecticut. Highway Research Record, no. 61.
Button E . G . ; E . J . Rubins; M.A. Woodward; and G.F. Griffin. 1977. Effect of Deicing Salts and Lead Upon Trees, Shrubs, and Soils in Connecticut. Connecticut Department of Transportation.
Byron, E . R . and C.R. Goldman. 1989. Land-use and water quality in tributary streams of Lake Tahoe, California, Nevada. Journal of Environmental Quality. Vol. 18, no. 1.
Chan, E . ; T .A. Bursztynsky; N . Hantzche; and Y . J . Litwin. 1982. The Use of Wedands for Water Pollution Control. US Environmental Protection Agency. E P A 600/28206.
Chescheir, G.M.; J.W. Gilliam; R.W. Skaggs; and R . G . Broadhead. 1987. The Hydrology and Pollutant Removal Effectiveness of Wetland Buffer Areas Receiving Pumped Agricultural Drainage Water. Water Resources Research Institute of the University of North Carolina. Raleigh, NC.
Chollar, B . H . 1988. Field evaluation of calcium magnesium acetate during the winter of 1986-87. Public Roads, vol. 52, no. 1.
Collins, P.G. and J.W. Ridgeway. 1980. Urban storm runoff quality in southeast Michigan. In The Use of Wetlands For Water Pollution Control. Journal of Environmental Engineering Division, A S C E .
Colston, N.V. 1984. Characterization and Treatment of Urban Land Runoff. US Environmental Protection Agency. E P A 671/274096.
CARRYING CAPACITY OF PUBLIC WATER SUPPLY WATERSHEDS
Erlich, G.G.; H.F. Ku; J . Vecchioli; and T .A. Ehlke. 1979. Microbiological effect of recharging the Magothy Aquifer, Bay Park, New York, with tertiary-treated sewage. In The Long Island Segment of the Nationwide Urban Runoff Program. U.S. Geological Survey Professional Paper 751-E.
Feick, et al. 1972. Release of mercury from contaminatedfreshwater sediments by the runoff of road deicing salt. Science, vol. 175.
Field, R.; E J . Sturzeski; H.E. Masters; and A.N. Tafuri. 1975. Water pollution and associated effects form street salinity. In Water Pollution Control in Low Density Areas: Proceedings of a Rural Environmental Engineering Conference. W.J . Jewell; and R.Swan (eds), University Press of New England. Hanover, NH.
Geldreich, E . E . ; L . C . Best; B .A. Kenner; and D J . Vandonsen. 1968. The bacterial aspects of stormwater pollution. Journal Water Pollution Control Federation vol. 40.
Geldreich, E . E . and B .A . Kenner. 1969. Concepts offecal streptococci in stream pollution. Journal Water Pollution Control Federation, vol. 41.
Hammer, D .E . and R.H. Kadlec. 1983. Design Principles for Wetland Treatment Systems. National Technical Information Service. Springfield, V A .
Hammer, T.R. . 1976. Planning Methodologies for Analysis of Land Use/Water Quality Relationships. Environmental Protection Agency. E P A 68-01-3551.
Handman, E .H . ; I .G. Grossman; J.W. Bingham and J . L . Rolston. 1979. Major Sources of Ground-Water Contamination in Connecticut. USGS Water Resources Investigations Open File Rpt 79-1596. Hartford, C T .
Handman, E . H . and J.W. Bingham. 1980. Effects of Selected Sources of Contamination on Ground-Water Quality al Seven Sites in Connecticut. USGS Water Resources Investigations Open File Rpt 79-1596. Hartford, C T .
Hanes, R . E . et al. 1970. Effects of Deicing Salts on Water Quality and Biota— Literature Review and Recommended Research. National Highway Research Program report no. 91.
Hanes, R . E . ; L .W. Zalazny; K . G . Verghese; R.D. Bosshart; R . E . Blasier and D.D. Wolf. 1976. Effects of Deicing Salts on Plant Biota and Soil. National Cooperative Highway Research Program Report #170.
Hirose, T and N. Kuramoto. 1981. Stream water quality as influenced by land use patterns in the Kakioka Basin, Japan. Journal of Environmental Quality 10:184-188.
Homer, R.R. and B.W. Mar. 1985. Assessing the impacts of operating highways on aquatic ecosystems. In Transportation Research Record 1017, Surface Drainage and Highway Runoff Pollutants. Transportation Research Board National Research Council.
Hunter, J . V. 1979. Contribution of urban runoff to hydrocarbon pollution. Journal Water Pollution Control Federation, vol. 51.
Hutchinson, F .E . . 1969. Effects of highway salting on the concentration of sodium and chloride in private water supplies. Research In The Life Sciences, vol. 17.
Illinois E.P.A. 1984 Blue Creek Watershed Project, Executive Summary and Recommendations. IEPA/WPC/84-008.
Jokinen, E . 1983. The Freshwater Snails of Connecticut. State Geological and Natural History Survey of Connecticut C T D E P Bulletin 109.
Kadlec, J .A. 1987. Nutrient dynamics in wetlands. In Aquatic plants for Water Treatment and Resource Recovery. K . R . Reddy; and W.H. Smith (eds), Magnolia Publishing. Orlando, F L .
Kadlec, R .H . and J.A. Kadlec. 1978. Wetlands and water quality. In Wetland Functions and Values: The State of Our Understanding P .E . Greeson; J .R.
STORM WATER DISCHARGE 73
Clark; and J.E. Clark, American Water Resources Association. Minneapolis, MN.
Kadlec, R . H . and D.E. Hammer. 1981. Wetland Utilization Community Waste Water Operations Summary. Report to NSF/ASRA/PFRA Grant #Env.-23868.
Karr, J.R. and I J . Schlosser. 1977. Impact of Nearstream Vegetation and Stream Morphology on Water Quality and Steam Biota. US Environmental Protection Agency. Athens, GA.
Kerri, K.D.; J.A. Racin; and R.B. Howell. 1985. Forecasting Pollutant Loads from Highway Runoff. In Transportation Research Record 1917, Surface Drainage and Highway Runoff Pollutants Transportation Research Board (eds.), National Research Council.
Koppelman, L . E . and E . Tanenbaum. 1982. The Long Island Segment of the Nationwide Urban Runoff Program. Long Island Regional Planning Board. Hauppauge, N Y .
Laperriere, J.D. 1988. Calcium Acetate as a Road De-icer—What a BOD. A paper presented at the International Symposium on Lake and Watershed Management, Nov. 15-18, 1988. North American Lake Management Society, St. Louis, MO.
Likens, G.E. ; F . H . Bormann, R.S . Picra, J .S. Eaton and N.M. Johnson. 1977. Biogeochemistry of a Forested Ecosystem. Springer-Verlag, New York, N Y .
Lorenz, J .S. and D.D. Biesboer. 1987. Nitrification, denitrification, and ammonia diffusion in cattail marsh. In Aquatic Plants for Water Treatment and Resource Recovery. K . R . Reddy; and W.H. Smith (eds.), Magnolia Publishing. Orlando, FL.
McFeters, G.A.; G.K. Bissonnette; J . J . Jezeski; C.A. Thompson; and D.G. Stuart. 1974. Comparative survival of indicator bacteria and enteric pathogens. Well Water, vol. 27.
McKee, J.W. and H.W. Wolf. 1963. Water Quality Criteria. California State Water Resources Control Board. Pasadena, C A .
Melvin, R . L . ; S.J. Grady; D.F. Healy; and F . Banach. 1987. Connecticut Groundwater. USGS Open File Rpt 87-0717. Hartford, C T .
Meyer, J . 1985. A Detention Basin/Artificial Wetland Treatment System to Renovate Stormwater Runoff from Urban Highway and Industrial Areas. US Environmental Protection Agency. E P A 600/52-85038.
Perry, R. ; and A.F . Mclntyre. 1984. Oil and polynuclear aromatic hydrocarbon contamination of road runoff: a comparison of treatment procedures. In. A Detention Basin/Artificial Wetland Treatment System to Renovate Stormwater Runoff from Urban Highway and Industrial Areas. US Environmental Protection Agency. E P A 600/52-85038.
Pitt, R . 1985. Characterizing and Controlling Urban Runoff Through Street Sewerage Cleaning. E P A Project Summary 600/S2-85/038.
Reddy, K . R . and W.F. Debusk. 1987. Nutrient Storage Capabilities of Aquatic and Wetland Plants. In Aquatic Plants for Water Treatment and Resource Recovery. K . R . Reddy; and W.H. Smith, (eds). Magnolia Publishing. Orlando, F L .
Richardson, C J . 1985. Mechanisms controlling phosphorus retention capacity in freshwater wetlands. Science, vol. 228 p. 1424-1427.
Rimer, A.E. et al. 1978. Characterization and impact of stormwater runofffrom various land cover types. Journal Water Pollution Control Federation, vol. 50 p. 252
Sartor, J.D. and G.B. Boyd. 1972. Water Pollution Aspects of Street Surface Contaminants. National Technical Information Service. Springifeld, V A
Sartor, J.D.; G.B. Boyd; and F J . Agardy. 1974. Water Pollution Aspects of Street
CAPACITY OF PUBLIC WATER SUPPLY WATERSHEDS
Surface Contaminants. Journal Water Pollution Control Federation, vol. 46 p. 458
Scheidt, M.E. 1967. Environmental effects of highways. Journal of the Sanitary Engineering Division, vol. ASCE93 #SA5
Sharp, R.W. 1970. Road Salt as a Polluting Element. Department of the Interior, Bureau of Sport Fisheries and Wildlife Special Environmental Release #3. Washington, D.C.
Shraufnagel, F .M. 1967. Pollution Aspects Associated with Chemical De-icing. Highway Research Board Report no. 193.
Smart, M.M.; J.R. Jones and J . L . Sebaugh. 1985. Stream-watershed relations in the Missouri Ozark Plateau Province. Journal of Environmental Quality. 14:77-82.
Soderlund, G . 1980. Physiochemical and Microbiological Properties of Urban Stormwater Runoff. In International Water Pollution Research Conference Proceedings July 29-August 3, 1980. San Francisco, C A .
United States E.P.A. 1988. National Pollutant Discharge Elimination System Permit Application Regulations for Storm Water Discharges. Federal Register. E P A 235/5349416.
United States Public Health Service. 1962. Public Health Service Drinking Water Standards. US Public Health Service no. 956.
van der Valk, A.G. ; C .B . David; J . L . Baker; and C .E . Beer. 1978. Natural Fresh Water Wetlands as Nitrogen and Phosphorus Traps for Land Runoff. In Wetland Functions and Values: The State of Our Understanding. American Water Resources Association (eds).
Van Donsel, D.J. ; E . E . Geldreich; and N.A. Clarke. 1967. Seasonal variation in survival of indicator bacteria in soil and their contribution to storm-water pollution. Applied Microbiology, vol. 15.
Walker, W.G. ; J.Bouma; D.R. Keeney; and F .R . Magdoff. 1979. Nitrogen transformations during subsurface disposal of septic tank effluent in sands: I . soil transformations. Journal of Environmental Quality, vol. 2. no. 4.
Walker, W.W. 1985. Model Refinements: Rep. 3. Empirical Methods for Predicting Eutraphication in Impoundments. U.S. Army Eng. Waterways Exp. Station. Vicksburg, MS. E-81-9.
Water Pollution Control Federation. 1983. Nutrient Control: Manual of Practice FD-7 Facilities Design. Water Pollution Control Federation. Washington, D.C.
Whipple, W.; and J .V. Hunter. 1985. Settelability of Urban Runoff Pollution. In A Detention Basin/Artificial Wetland Treatment System to Renovate Stormwater Runoff from Urban Highway and Industrial Areas. US Environmental Protection Agency. E P A 600/52-85038
Whitworth, W.R. 1968. Effects of diurnal fluctuations of DO on the growth of brook trout. Journal Fish Res Bd Canada, vol. 25
Yousef, Y . A . and H.H. Harper. 1985. Consequential Species of Heavy Metals in Highway Runoff. In Transportation Research Record 1017 Surface Drainage and Highway Runoff Pollutants. Transportation Research Board, National Research Council.
Zison, S.W. 1980. Sediment-Pollutant Relationships in Runoff from Selected Agricultural, Suburban, and Urban Watersheds. US Environmental Protection Agency. Athens, GA.
4.0 Incidental Non-Point Source Pollutants Associated With Residential Development: Impacts and Mitigation
Several potential sources of pollutants associated with residential development are discussed in other sections of this report; this is due to their importance, the amount of literature existing on these subjects, as well as the format chosen for this report. The impact of sewage disposal systems was thoroughly discussed in section 2.0 above, as was stormwater discharges in section 3.0. Construction related erosion and sedimentation is discussed below in section 5.0, followed by a discussion of groundwater in section 6.0. A discussion of other potential non-point sources of pollution follows.
4.1 .-Efi7!liZERS
In residential areas, fertilizers are commonly applied to turf lawns, home gardens, as well as ornamental shrubs and trees. The major plant nutrients common to most fertilizers are nitrogen, phosphorus and potassium. Literature contains many references to fertilizers as a source of phosphorus input to lakes and reservoirs (Moore and Thornton, 1988). As explained in section 1.2, phosphorus loading is one of the driving forces behind eutrophication in Connecticut; this discussion of fertilizer will therefore focus on phosphorus. However, it must be stated that while in most Connecticut lakes and reservoirs phosphorus is the "limiting nutrient" to the growth of phytoplankton, algae, and aquatic plants, nitrogen can also be limiting. In addition, overfertilization of suburban lawns may cause nitrogen to leach to groundwater, thereby increasing groundwater nitrate concentrations (Handman et al., 1979).
There are many studies providing nutrient export values for various land uses. For example, Uttormark et al. (1974), in his study of nutrient loadings to lakes from nonpoint sources, cites at least 25 such studies. These estimates of nutrient loading to waterways from various land uses vary considerably. Frink (1969, page 551) explains that, "some of this variability can be attributed to the large variability in the nitrogen and phosphorus content of runoff water, to analytic uncertainties, and to the difficulties of obtaining accurate flow measurements." The usefulness of many nutrient export studies is limited. Uttormark states that in studies of seepage and runoff, land use patterns are usually defined clearly, but the subsequent discussion or analysis of the transport of nutrients is questionable. In contrast, in drainage area studies nutrient flow is usually more clearly defined, but the subsequent descriptions of land use are very imprecise. The value of nutrient
CARRYING CAPACITY OF PUBLIC WATER SUPPLY WATERSHEDS
export information lies in the potential influence of nutrients in promoting eutrophication of downstream impoundments.
Perhaps the finest study to date on nutrient export from residential land uses in the Northeast was conducted by Dennis (1986) in Maine. Avoiding the pitfalls mentioned above, Dennis obtained accurate flow measurements during many precipitation events. The study focused on a 3.5 hectare (1 hectare = 2.47 acres) watershed with uniform low density sewered residential development (less than 4 units/hectare) containing as much wooded area as turf grass, and very little road surface. Impervious surfaces covered 15.2% of the watershed. An adjacent 2.4 hectare forested watershed was studied as a control. Soils in both watersheds were described as well drained glacial till (primarily Paxton, Charlton very stony, fine sandy loams); slopes on both watersheds varied from 0 to 20% with average channel slopes of 6% for the residential and 7% for the forested watershed. Dennis found that for any given storm, 5 to 10 times as much phosphorus will be exported from the residential watershed as from the forested watershed. For these storm events, the geometric mean of the ratios between developed and forested watersheds for runoff volume was 1.7:1, for peak discharge 2.6:1, for mean flow-weighted phosphorus concentration, 4.3:1; and for phosphorus export, 7.2:1. Dennis found the annual and seasonal variation in phosphorus export to be highly variable. For example, a 63% difference in precipitation from one year to the next led to nearly a 400% difference in phosphorus export. This study also demonstrated the importance of storm events in transporting phosphorus from residential watersheds. In 1983, a single storm contributed roughly half of the year's phosphorus export.
"Fertilizer phosphate added to topsoils is more likely to effect surface waters by direct erosion of soil particles and their desorption after reaching a stream then by leaching into groundwaters and subsequent seepage into these surface waters" (Weeks, 1974, page 6). The importance of erosion and sedimentation to the transport of nutrients into reservoirs can not be overemphasized. Richard Calhoun, of the Torrington Water Company, identified construction related erosion and sedimentation as the single greatest impact to reservoirs from residential development (personal communication, 1988). Erosion and sedimentation are discussed in section 5.0.
Moore and Thornton (1988) state that some lakes and reservoirs can develop nuisance algal blooms and high turbidity at total phosphorus concentrations of only 10-50 parts per billion. While the recommended maximum desirable concentration (RMDC) for total phosphorus in flowing water is 0.1 parts per mdlion, the R M D C for total phosphorus in streams flowing into lakes is 0.05 parts per million (Illinois Environmental Protection Agency, 1984). Streams in residential areas generally contain more phosphorus and other nutrients than those in woodland areas (Reckhow et al., 1980).
The education of residential homeowners on proper fertilizer application rates can help mitigate their potential impact. The "more must be better" mentality often leads to overfertilization which increases the possibility of nutrient export. The UCONN Extension Service provides a service to the public to determine whether a lawn needs fertilizer, and i f so, what the proper application rate should be to avoid overfertilization. The UCONN Soils Laboratory wil l perform the necessary analyses; for $2.00 homeowners can obtain a mailing kit with instructions on sampling their soil. Mailing kits are available at UCONN Extension Service offices, located in every county.
Another form of mitigation is the preservation of freshwater wetlands, especially those contiguous to tributary surface waters, within residential watersheds. Wetlands, "can be a very significant factor in reducing available phosphorus loadings in tributaries during the low flow period of the summer
INCIDENTAL NON-POINT SOURCES 77
growing season" (Windham Regional Planning Agency, 1982, page 4). Removal of phosphorus from overlying water in wetlands is accomplished via physical entrapment of particulate phosphorus, chemical sorption by organic matter and soil particles, uptake by aquatic plants and attached algae, and utilization by bacteria and other microorganisms ( C T DEP, 1984). Although little phosphorus is permanendy withheld on an annual basis, the "spring and summer storage, fall and winter release" is a valuable service to lake and reservoir water quality provided by wetlands (CT DEP, 1984). The attenuation and transformations of nutrients in wetlands is discussed in section 2.2; wetland treatment systems for the mitigation of stormwater impacts is discussed in section 3.10.4.
Predicting the effect of residential development on lake and reservoir water quality requires an understanding of its incremental nature. Most residential subdivisions in Connecticut are not very large; they probably lack the potential, by themselves, to contribute enough nutrients to noticeably alter a reservoir's trophic status. However, many new developments in a watershed previously forested probably pose an eventual threat to reservoir water quality. To place this in perspective, in the study cited above, Dennis (1986), presents the following hypothetical example. Consider a lake or reservoir whose entire watershed is forested. I f over the years, 10 new subdivision are built, each covering about 1% of the watershed, his study indicates that total export of phosphorus from the watershed to the lake would increase 40-90%. This substantial increase in phosphorus loading might be expected to alter a lake or reservoir's trophic status resulting in possible algal blooms and hypolimnetic oxygen depletion. In reality, this hypothetical situation is probably happening in parts of Connecticut. As Dennis concludes (page 406), "long-term maintenance of lake water quality requires that new development, even seemingly innocuous low density subdivisions, be designed and maintained so as to minimize phosphorus export." This should be kept in mind as pesticides, fuel oil storage, household hazardous wastes, and construction materials are discussed below.
4.2 PESTICIDES
Types of pesticides include: insecticides, fungicides, herbicides, weedicides, rodenticides, and nematocides. As of 1974, some 900 chemicals in 60,000 formulations were being used to control pests in the United States. Table 4 -1 lists the classes of pesticides commonly used in the United States, and examples of each group.
The issue of documented and potential pesticide contamination of water resources is receiving increasing attention. Mass and Stanley (1988) feel the reasons for the increased awareness is due to: (1) new information and concern about subtle health effects and associated risks linked to low-level pesticide exposure; (2) numerous discoveries of pesticides in groundwater coupled with the growing awareness that pesticides may persist in groundwater orders of magnitude longer than in soils or surface waters, and; (3) many newer pesticides are purposely designed to be more mobile (less strongly soil-absorbed) than their predecessors. The introduction of unwanted pesticides from spills, drift, surface runoff or groundwater discharge into a lake or reservoir can upset delicate aquatic plant balances, kil l or contaminate fisheries, limit water contact recreation, and severely contaminate drinking water (Mass and Stanley, 1988). Baker (1983; as cited in Mass and Stanley, 1988) shows that conventional water treatment does not remove many commonly used pesticides. While explaining that scientific understanding of water contamination is deficient in many areas, Mass and Stanley (1988) add that knowledge of the effectiveness of various recommended
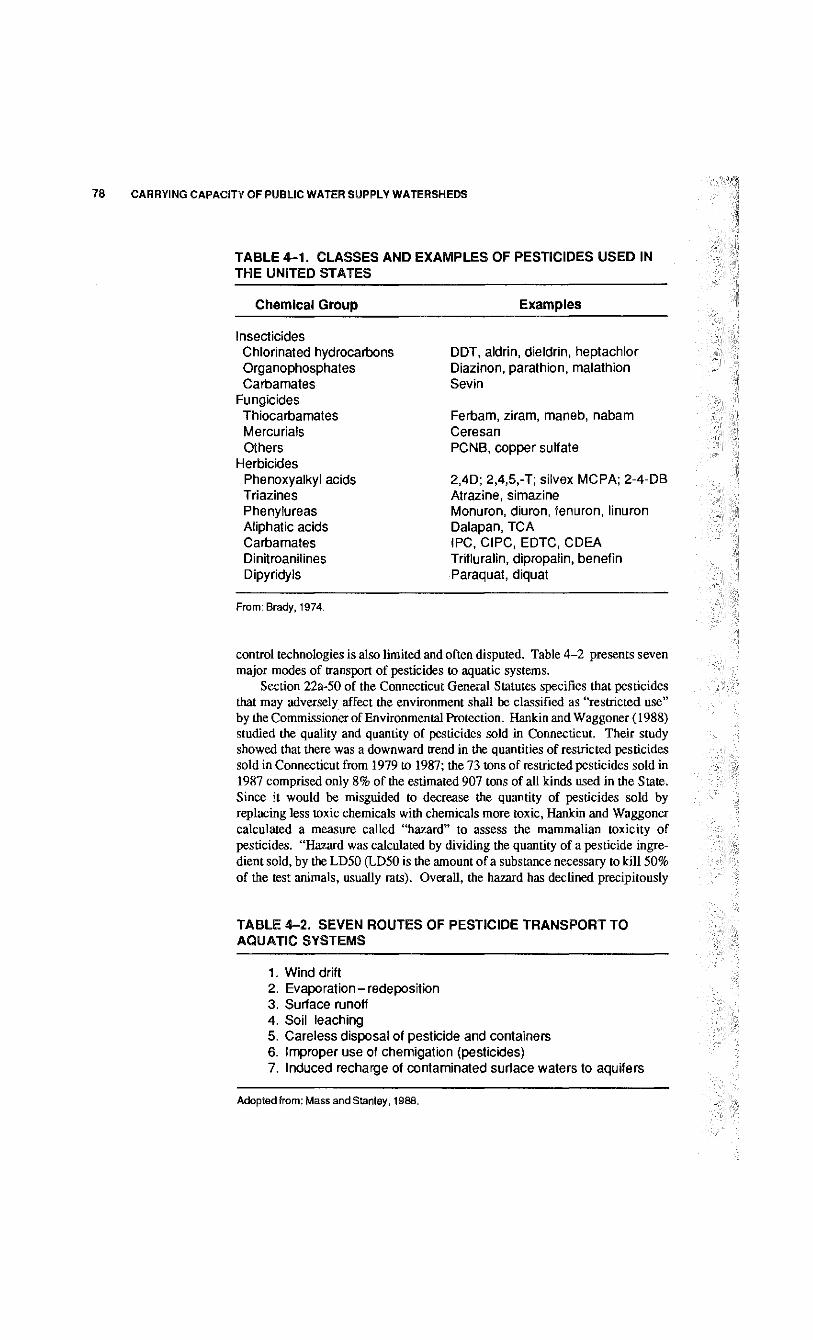
CARRYING CAPACITY OF PUBLIC WATER SUPPLY WATERSHEDS
TABLE 4-1. CLASSES AND EXAMPLES OF PESTICIDES USED IN THE UNITED STATES
Chemical Group Examples
Insecticides Chlorinated hydrocarbons Organophosphates Carbamates
Fungicides Thiocarbamates Mercurials Others
Herbicides Phenoxyalkyl acids Triazines Phenylureas Aliphatic acids Carbamates Dinitroanilines Dipyridyls
DDT, aldrin, dieldrin, heptachlor Diazinon, parathion, malathion Sevin
Ferbam, ziram, maneb, nabam Ceresan PCNB, copper sulfate
2,4D; 2,4,5,-T; silvex MCPA; 2-4-DB Atrazine, simazine Monuron, diuron, fenuron, linuron Dalapan, TCA IPC, CIPC, EDTC, CDEA Trifluralin, dipropalin, benefin Paraquat, diquat
From: Brady, 1974.
control technologies is also limited and often disputed. Table 4-2 presents seven major modes of transport of pesticides to aquatic systems.
Section 22a-50 of the Connecticut General Statutes specifies that pesticides that may adversely affect the environment shall be classified as "restricted use" by the Commissioner of Environmental Protection. Hankin and Waggoner (1988) studied the quality and quantity of pesticides sold in Connecticut. Their study showed that there was a downward trend in the quantities of restricted pesticides sold in Connecticut from 1979 to 1987; the 73 tons of restricted pesticides sold in 1987 comprised only 8% of the estimated 907 tons of all kinds used in the State. Since it would be misguided to decrease the quantity of pesticides sold by replacing less toxic chemicals with chemicals more toxic, Hankin and Waggoner calculated a measure called "hazard" to assess the mammalian toxicity of pesticides. "Hazard was calculated by dividing the quantity of a pesticide ingredient sold, by the LD50 (LD50 is the amount of a substance necessary to k i l l 50% of the test animals, usually rats). Overall, the hazard has declined precipitously
TABLE 4-2. SEVEN ROUTES OF PESTICIDE TRANSPORT TO AQUATIC SYSTEMS
1. Wind drift 2. Evaporation - redeposition 3. Surface runoff 4. Soil leaching 5. Careless disposal of pesticide and containers 6. Improper use of chemigation (pesticides) 7. Induced recharge of contaminated surface waters to aquifers
Adopted from: Mass and Stanley, 1988.
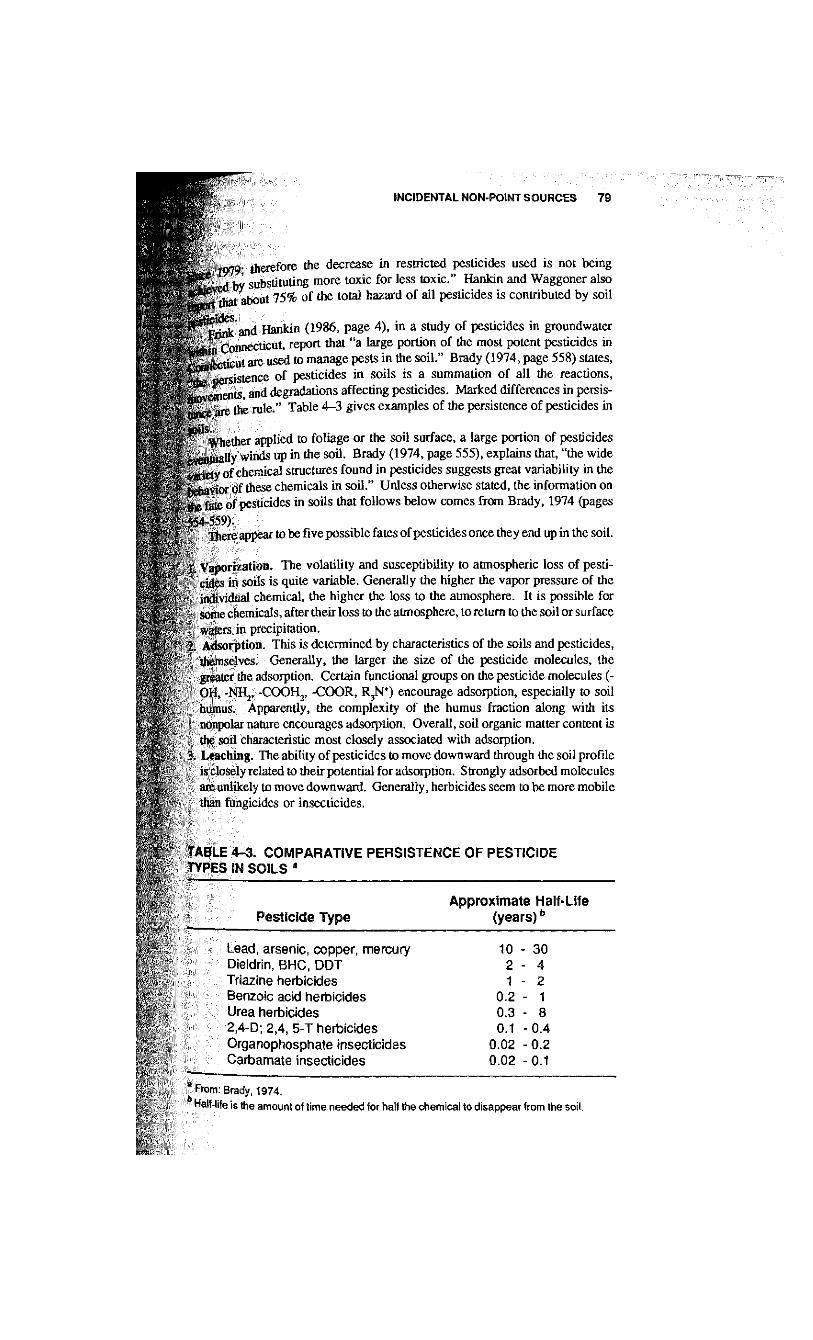
INCIDENTAL NON-POINT SOURCES 79
(TO- th' r . r ' ; the decrease in restricted pesticides used is not being a " ^ ' s u P S j t u i i n g more toxic for less toxic." Hankin and Waggoner also £hic*<-< 759c, 0 f the total hazard of all pesticides is contributed by soil report in*" a w
^ S U Fnnk and H a n v i (1986, page 4), in a study of pesticides in groundwater CtmiKtr.i .. Jport that "a large portion of the most potent pesticides in
r ccticut arc used <o manage pests in the soil." Brady (1974, page 558) states, h* ersistence of pesticides in soils is a summation of all the reactions,
ments and ucgi'adations affecting pesticides. Marked differences in persis-"ncc arc the rule." ^able 4-3 gives examples of the persistence of pesticides in
Wether applet to foliage or the soil surface, a large portion of pesticides ventually winds ui> M the soil. Brady (1974, page 555), explains that, "the wide ariety of cherried structures found in pesticides suggests great variability in the
behavior of these cnemicals in soil." Unless otherwise stated, the information on the fate of pesticides in soils that follows below comes from Brady, 1974 (pages 554-559).
There appear »o *e five possible fates of pesticides once they end up in the soil.
1 Vaporization, The volatility and susceptibility to atmospheric loss of pesticides in soils is qoite variable. Generally the higher the vapor pressure of the individual chemical, the higher the loss to the atmosphere. It is possible for some chemicals, after their loss to the atmosphere, to return to the soil or surface waters in piecini-ation.
2. Adsorption. This is determined by characteristics of the soils and pesticides, themselves. Generally, the larger the size of the pesticide molecules, the greater the adsorption. Certain functional groups on the pesticide molecules (-OH, -NHj, -CCOH 2 , -COOR, R 3 N + ) encourage adsorption, especially to soil humus. Anraienlly, the complexity of the humus fraction along with its nonpolar n:';'-i.-e encourages adsorption. Overall, soil organic matter content is the soil cnanxvcilstic most closely associated with adsorption.
3. Leaching. The ability of pesticides to move downward through the soil profile is closciy rcUncd to their potential for adsorption. Strongly adsorbed molecules arc unlikely "> •-nove downward. Generally, herbicides seem to be more mobile than fungicides or insecticides.
TABLE 4-?. COMPARATIVE PERSISTENCE OF PESTICIDE TYPES ;N SOILS 1
Approximate Half-Life r *stickte Type (years) b
1 p^ri q-senic, copper, mercury 10 • • 30 OisiJrn, BHC, DDT 2 • 4 Triazine herbicides 1 - 2 oen-.L-lc acid herbicides 0.2 - 1 U'ea herbicides 0.3 - 8 - V O ; 2,4, 5-T herbicides 0.1 - 0.4 O"09rophosphate insecticides 0.02 - 0 . 2 C:,rra :Tiate insecticides 0.02 - 0 . 1
* From: fir?*-, 1974. Half-lnt is iiii c.i-i,ouniof time needed for half the chemical to disappear from the soil.
CAPACITY OF PUBLIC WATER SUPPLY WATERSHEDS
4. Chemical Reactions. Within soils, many pesticides undergo chemical modification independent of soil organisms. Solar radiation causes slow photode-composition of some pesticides, but reactions catalyzed directly by the soil are more important. This catalysis is thought to be due largely to the silicate clay fraction, especially if the soils are acid.
5. Microbial Metabolism. Biochemical degradation by soil microorganisms is perhaps the single most important method by which pesticides are removed from soils. Certain functional groups on pesticides seem to provide points of attack for soil organisms (-OH, -COO", -NH^, -N0 2 ) . Many pesticides, such as the chlorinated hydrocarbons, are new to the earth; soil organisms have not yet evolved metabolic pathways for the rapid degradation of these compounds. Or-ganophosphate insecticides are generally degraded by microorganisms in soils. Although the rate is slow, most organic fungicides are subject to microbial degradation. Degradation is apparendy encouraged by conditions favoring overall microbial action. The diversity of soil organism populations is so great that most pesticides do not kil l a broad spectrum of soil organisms.
According to Banach (1988), 500,000 to 1,200,000 pounds of pesticide active ingredient/year are applied in residential areas statewide (this figure includes commercial applications). Banach (1988) states that preliminary data from a current E P A study identifies up to 40 pesticides as having potential to leak into groundwater. Connecticut has detected 13 types of pesticides in groundwater, most in very low concentrations (Banach, 1988). (Background information on groundwater in Connecticut is discussed in section 6.1) In a study of the effects of land use on water quality within stratified drift aquifers, water samples from wells in Newtown, Southbury, and Woodbury were analyzed for 26 insecticide and herbicide compounds (Grady and Weaver, 1988). The chlorophenoxy acid herbicides 2,4-D; 2,4,5-T; silvex, as well as the insecticide diazinon were detected. A l l these were detected in residential areas. Grady and Weaver state that the probable source of these compounds is the application of lawn and garden chemicals. Levine (et al., 1987) reports 6 active ingredients or metabolites of pesticides have been detected in groundwater samples in southern New England: aldicarb, carbofuran, dinoseb, oxamyl, E D B , and 1,2-dichloropropane. Ethylene dibromide ( E D B ) and 1,2-dichloropropane have been detected in groundwater in Connecticut; both are nematocides (Levine et al., 1987). According to Brad Robinson, of the C T DEP (1988), the State has refused registration of 1,2-dichloropropane, and the use of E D B is now illegal throughout the U.S. Banach (1988) has stated that the vast majority of wells contaminated by pesticides in Connecticut have been due to E D B . The story of E D B contamination in Connecticut groundwater that follows below was taken from Frink and Hankin (1986), unless otherwise stated.
E D B was formerly used to control pests of tobacco; it is taken up, but not concentrated by plants. Although it is used in leaded gasoline, it has been found in only about a dozen wells in the vicinity of gasoline spills. Agricultural use of E D B was banned in 1984. B y March 31,1986, 267 of 1556 private wells tested in the upper Connecticut River Valley were found to contain E D B in excess of the 0.1 parts per billion standard established by the Department of Health Services. In addition, 54 of 265 public wells sampled exceeded the tolerance level. Some wells have been found to contain more than the 0.1 ppb standard, despite the fact that applications in those areas ceased 15 years earlier. Ongoing research by the Connecticut Agricultural Experiment Station (CAES) is focusing on why E D B persists in groundwater, despite its ready degradation in laboratory studies. In an additional study by the C A E S , 95 water samples were taken from 29 towns (none in the Litchfield Hills region) and analyzed for the presence of 33 compounds (for
INCI DENTAL NON-POINT SOURCES 81
a total of 3,135 analyses). According to Frink and Hankin (1986), other than 4 wells in Cheshire where low levels of 1,2-dichloropropane were found, no samples contained detectable amounts of any pesticides tested for.
The following information concerning recent State legislation affecting the use of pesticides was excerpted from the Connecticut D E P (1988b).
Public Act 88-211: An act concerning orders issued because of pesticide contamination of groundwater. This act excuses farmers, who meet certain criteria, from having to provide potable water to those whose wells became contaminated with pesticides the farmer used on agricultural or horticultural products, or on the land. The act specifies that it does not limit private lawsuits against farmers.
Public Act 88-246: An act establishing a civil penalty for violations of pesticide statutes and creating a state emergency response commission. This act increases the penalty for (1) illegal sale or use of sodium fluoroacetate (a powerful rodenticide), (2) nonpermitted application of chemicals to state waters. The act also extends the date by which the D E P Commissioner must submit a report on pesticide pollution of groundwater to the General Assembly from July 1,1988 to July 1, 1990.
Public Act 88-247: An act concerning notification of the application of pesticides and integrated management and establishing a pesticide notification task force. This act requires pesticide application businesses to notify any abutting owner or tenant requesting notification of the time and date of application prior to applying a pesticide within 100 yards of any property line to post a sign at application time at conspicuous entry points notifying the public of the pesticide use. Commercial applicators must post a sign every 150 feet of road frontage. Notification requirements go into effect after the adoption of certain regulations by the D.E.P., which must occur by 1989. The notification requirements of this act do not apply to utilities, railroad companies, pesticide application businesses, the State, or municipalities when they apply pesticides to rights-of-way, distribution lines, and roadsides. The act requires all businesses that apply or recommend pesticide applications to register as pesticide businesses. Prior law exempted businesses with only one certified applicator.
Pesticides which enter the soil generally have the potential to contaminate groundwater if the water table is within 30 feet of the surface, according to Levine et al. (1987). Levine (et al., 1987), is a valuable reference for land use planners concerned about potential pesticide contamination of groundwater resources. It includes general information, characteristics of 102 soil types found in Connecticut that influence the potential for pesticide leaching (drainage, depth to ground-watcr/bedrock, pH, organic matter content, soil rating, and recommendations), and information on 155 pesticides which influence their potential to contaminate groundwater (KOC, KOW, K D , R F , volatility, half-life, and summary statements). In addition, this reference discusses four factors pertaining to the application of pesticides that effect whether pesticides will leach to groundwater: formulation, how applied, rate of application, and timing of application. However, the authors caution that final management decisions should be made considering specific site characteristics.
The concept of "integrated pest management" has great potential for decreasing potential impacts of pesticide use by reducing quantities of pesticides used. C.W. Huffaker, one of the pioneers of this concept, describes it (as cited in von Rumker et al., 1974, page 119) as "the system of pest management that wil l bring the most benefits, at the most reasonable cost, on a long-term basis, to the farmer and to society." Instead of sole reliance on chemical pesticides, this approach seeks to apply the best of all available control techniques to the pest problem. For example, success in combating Japanese beetle larvae that injure
82 CARRYING CAPACITY OF PUBLIC WATER SUPPLY WATERSHEDS
turf grasses has been achieved in New England via integrated pest management that utilizes milky spore disease (Chemical-Pesticides Program, Cornell University, 1983). This disease attacks the beetle larvae; the bacteria responsible is commercially available and lasts from year to year in the soil. Best management practices for integrated pest management are included in Appendix D.
Pesticide containers are never really "empty"; they usually contain small amounts of pesticides even after they have been rinsed. It is widely recognized that container disposal is part of the problem of environmental impacts posed by pesticide use. Education and household hazardous waste collection days (see section 4.4 and Appendix J) are probably the best solution to this problem, although hazardous waste collection days do not generally accept empty containers. In addition, the continued development and use of water-soluble packaging that dissolves when packages or contents are mixed in spray tanks shows tremendous potential. This allows for more accurate measuring and eliminates the problem of container disposal.
4.3 FUEL OIL STORAGE
"Any leak or spill from an underground storage facility for oil, petroleum or chemical liquids (e.g. hazardous materials), is considered a discharge to the waters of the State and is illegal" (CT DEP, 1988a, page 2). Leaking underground fuel oil storage tanks do exist; they have been documented in Connecticut and across the U.S. Although individual leaks are generally small, they constitute a serious source of groundwater contamination because they are numerous and difficult to detect (Handman et al., 1979; Handman and Bingham, 1980). Only minute quantities of gasoline are needed to produce odors in water (McKee and Wolf, 1963).
As of 1977, more than 3,200 gasoline and diesel fuel retailers were registered in Connecticut (Handman el al., 1979; Handman and Bingham, 1980), the vast majority storing fuel in underground tanks. Banach (1988) has stated there are about 60,000 underground tanks in the State each with a capacity of 2000 gallons or more. Because the average life span for an unprotected steel tank is only 15 years (Harrison and Dickinson, 1984), the C T D E P has estimated that as many as 1/3 of noncommercial underground storage tanks may be leaking.
The most common reported reason for the failure of steel tanks is corrosion of the outside surface; other principle causes include equipment failure and line rupture by earth moving equipment (Handman et al., 1979; Handman and Bingham, 1980; C T DEP, 1988a). Overfill spills are also a documented problem (CT DEP, 1988).
According to Handman (et al., 1979), since oil and gasoline are relatively insoluble they do not readily mix with groundwater; oil and gasoline tend to remain near the water table. However, fluctuations of the water table can act to disperse these contaminants vertically within the upper portion of the saturated zone. The movement of oil and gasoline within groundwater is generally downgradient at a rate that is slower than groundwater. Under certain conditions, oil and gasoline may move upgradient (Handman et al., 1979). Hydrocarbons reaching the water table from subsurface leaks may persist in groundwater for years. For example, Handman (et al., 1979) reports that although a leaking industrial fuel oil tank was removed in 1975, four years later oil was still present in the saturated zone and discharging to the nearby Pawcatuck River. Handman (et al., 1979) reports that leaked hydrocarbons in the State reached the saturated zone 50 times during the period from July 1976 to June 1977; the loss to
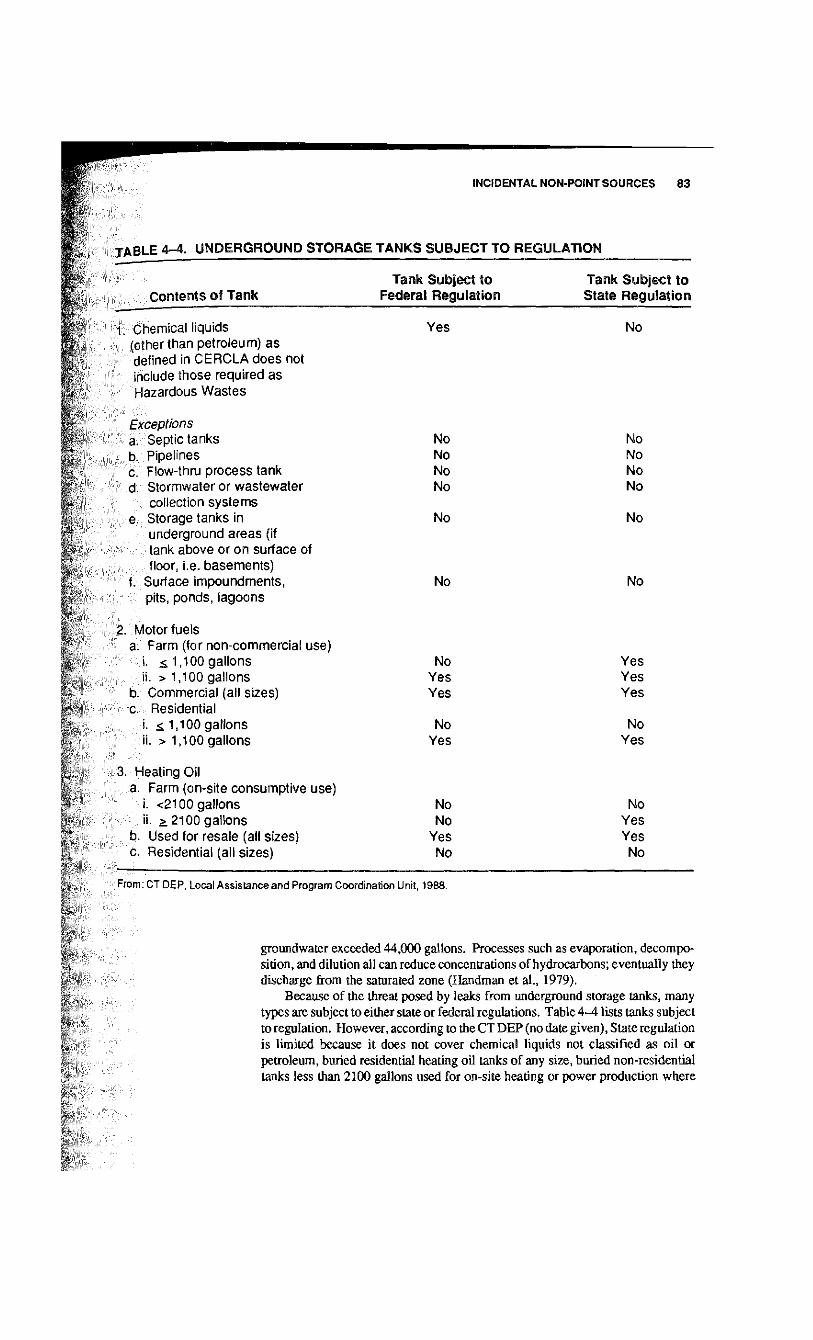
INCIDENTAL NON-POINT SOURCES 83
T A B - i -4. UNDERGROUND STORAGE TANKS SUBJECT TO REGULATION
Contents of Tank
C'r.srnica1 licjuids (other *han petroleum) as definec' in CERCLA does not include those required as Hazardous Wastes
Tank Subject to Federal Regulation
Tank Subject to State Regulation
Yes No
Exceptions a. Seoiio ;c-nks b. Pipelines c. riov'-thru process tank d. S'o.TTva'.e' or wastewater
collection systems 8. Storage ;anks in
underground areas (if tan.:<. above or on surface of floor, i.e basements)
f. Surface innpoundments, pits, ponds, iagoons
2. Moio-' .'ueis a. Form (ky non-commercial use)
i. ; 1 . ! 00 gallons i!. > 1,1u0 gallons
b Commercial (all sizes) c. Residential
'. < 1,100 gallons ii. > i.'OC gallons
3. Heading o ! i a. c9fr.i (on-site consumptive use)
i. <? 100 gallons ii. > 2100 gallons
b Used for resale (all sizes) c. Residential (all sizes)
No No No No
No
No
No Yes Yes
No Yes
No No
Yes No
No No No No
No
No
Yes Yes Yes
No Yes
No Yes Yes
No
From CT DEP, Local Assistance and Program Coordination Unit, 1988.
groundwater exceeded 44,000 gallons. Processes such as evaporation, decomposition, and dilution all can reduce concentrations of hydrocarbons; eventually they discharge from the saturated zone (Handman et al., 1979).
Because of the threat posed by leaks from underground storage tanks, many types are subject to either state or federal regulations. Table A-A lists tanks subject to regulation. However, according to the C T D E P (no date given), State regulation is limited because it does not cover chemical liquids not classified as oil or petroleum, buried residential healing oil tanks of any size, buried non-residential tanks less than 2100 gallons used for on-site heating or power production where
84 CARRYING CAPACITY OF PUBLIC WATER SUPPLY WATERSHEDS
not for resale (schools, churches, office buildings), or residual fuels (viscous liquids which do not flow at temperatures less than 60° F ) .
Appendix F of this report contains a copy of section 22a-449(d)-l of the Connecticut Regulations which covers the control of nonresidential underground storage and the handling of oil and petroleum. These regulations include standards for the design, installation, replacement, operation, maintenance, and monitoring of nonresidential underground tanks. These regulations became effective November 1, 1985.
Since there are no federal or state regulations pertaining to residential underground storage tanks, many Connecticut municipalities have acted on their own to protect groundwater. According to the C T DEP (personal communication, 1988d), 36 towns in Connecticut presently restrict, or in some way regulate, underground fuel storage tanks. Since April, 1987, the Granby Planning and Zoning Commission has had a policy of prohibiting the installation of new underground fuel tanks in new homes (CT DEP, 1988a). The Chesprocott Health District has had a regulatory program since December, 1986. According to Patrick Accardi, Director of the Health for the district (personal communication, 1988) in most new housing, fuel storage tanks have been placed inside the house. Under the Chesprocott regulations, tanks are still allowed in the ground, but they must meet strict requirements. Presently the district is trying to account for and register all existing tanks. The regulations require every underground tank 15 years old or older to be tested for leaks every 3 years. The district performs the test, for a fee, using a portable gas chromatograph. Of 75 tanks tested to date, 6 were found to be leaking. A copy of the Chesprocott Health District regulations pertaining to underground petroleum storage facilities is included in this report as Appendix E .
Cited above, the C T DEP publication, "Underground Storage Tanks: A Guide For Municipalities", is an excellent reference source; the guide presents a process for local decision making and includes necessary information for the development of a local management plan. Testing fees for companies that can check for tank leakage start at about $350.00. A list of Connecticut companies that provide underground fuel tank leak detection services is included in this report as Appendix L . Towns may wish to consider purchasing their own detection equipment; the New England Regional Laboratory of the U.S. E P A offers training on the use of gas chromatographs as a means of tank leakage detection ( C T D E P , 1988a).
4.4 HOUSEHOLD HAZARDOUS WASTE
According to Harrison and Dickinson (1984), the Code of Federal Regulations lists 4 criteria defining hazardous waste:
1. materials leaching heavy metals in excess of 100 times drinking water standards;
2. materials that are ignitable, with a flash point of less than 140 degrees F ; 3. materials that are corrosive, with a pH less than 2 or greater than 12.5; 4. materials that are readable—giving off dangerous gas, or vapors, or exploding.
Many products used in homes are hazardous, regardless of whether they meet all the criteria above: paints, thinners, furniture strippers, cleaners, solvents, waste motor oil, car wax, antifreeze, pesticides, photographic chemicals, and many others. These household products are dangerous because in addition to meeting one or more of the criteria above, human health may be affected by ingestion, inhaling gases, or absorption through the skin. The greatest impact
INCIDENTAL NON-POINT SOURCES 85
from household hazardous wastes comes from improper disposal. Improper disposal may lead to the contamination of both surface and groundwater resources.
Because of the small volumes of waste generated by individual households, as well as the difficulty of enforcing compliance, household hazardous wastes are not covered under current U.S. Environmental Protection Agency hazardous waste disposal regulations (Stanek et al., 1987). Many wastes are simply placed in the garbage. This may cause injury to refuse handlers and allows large amounts of household hazardous wastes to be concentrated in landfills, which raises serious concerns over potential water contamination from landfill leachate (Stanek et al., 1987). Another method of disposal is to pour wastes down the drain. This can lead to corroded pipes and cause dangerous fumes to re-enter the house. In addition, household wastes can interfere with the performance of on-site subsurface disposal systems and allow some toxic substances to enter groundwater. Disposal of waste in storm system catchbasins, as well as directly on the surface of the land are also common. Nationwide, it is estimated that 250,000 gallons of waste oil is discarded direcdy into stormwater systems every year (U.S. E P A , 1988). Stanek (et al., 1987) reports on a random telephone survey of Massachusetts households concerning household hazardous waste; 57% of the households disposed of automotive oil in the ground, sewer or landfill while paints and pesticides were disposed of by the same improper methods more than 90% of the time.
The best available solutions to the problem of household wastes are education and community collection days. Education can take interesting forms. Aldrich (1988) reports stenciling directly on catch basins throughout a suburban lake watershed the message "DUMP NO P O L L U T A N T S — W A T E R S H E D A R E A . " This was done with volunteer labor (Boy Scouts) at a cost of $16.00 per 100 catchbasins. Aldrich also reports that fliers explaining the hazard of waste disposal in storm sewers were distributed in areas where this type of dumping was identified during stenciling.
The Fairfield County Soil and Water Conservation District (1988) has a portable exhibit on household hazardous waste which is available to organizations, town committees, or individuals for educational use. The display must be assembled and disassembled; it comes with its own carrying case. The display is ideal for use at household hazardous waste collection days. There is no charge for the use of the exhibit.
The information on household waste collection days that appears below was taken directly from the publication, "How to Organize a Community Collection Day", which appears as Appendix J of this report. This is a good reference; the information includes everything a municipality needs to know to organize a community collection day. As of July, 1986, 24 community collection days, involving 53 towns, have been held in Connecticut. Several collection days have been held in the Litchfield Hills region. Participating communities have included Barkhamsted, New Hartford, Colebrook, Winchester, Torrington, Litchfield, Morris, Harwinton, and Goshen (Lynn, 1989). These collection days are not run as a simple garbage pickup; they require careful planning to be successful. Safety precautions and traffic control must be strictly maintained. It should be noted that household collection is not the ultimate solution to all problems posed by household hazardous wastes. For example, some types of waste such as the herbicide 2,4,5-T and wood preservatives containing pentachlorophenol, can not be collected because no legal disposal methods for these exist anywhere in the United States. A l l wastes collected are shipped out of Connecticut since the State has no treatment or disposal facilities which can process household products. Despite this, community collection days are presently the best solution to the problems posed by household hazardous wastes.
86 CARRYING CAPACITY OF PUBLIC WATER SUPPLY WATERSHEDS
4.5 CONSTRUCTION MATERIALS
The U.S. E P A (1988) reports that construction sites generate many pollutants, among them solid waste, that can be toxic to aquatic organisms and degrade water for drinking and water contact recreation. It is common practice for home builders to dispose of unwanted materials in excavated pits commonly know as "junk holes." In areas where new homes will be served by on site septic systems, the area of deepest soil most suitable for a junk hole is usually set aside for the septic system. Thus, junk holes may often be placed in areas where there is relatively shallow depths to the water table or bedrock. Materials commonly discarded into junk holes include scrap lumber, plaster, paint and coating products, and other construction debris. The major potential impact of junk holes is the contamination of groundwater from discarded paint and coating products.
Many paint and coating products contain hazardous materials as ingredients. Paints, solvents, paint removers, brush cleaners, stripping agents, primers, wood stains and preservatives commonly contain chemicals such as acetone, benzene, toluene, methanol, and turpentine. Many "Material Safety Data Sheets" supplied by manufacturers of paint products were reviewed for this report. These data sheets are required by law to include information such as hazardous ingredients, physical and chemical properties, fire and explosion hazards, reactivity data, spill or leak procedures, health hazards and other precautions (U.S. D H E W , 1974). Many paint products data sheets contain statements such as "do not dump on ground", "keep out of water courses", and "toxic to fish and wildlife." Most paint products produce carbon monoxide or other hazardous substances when they decompose. An additional hazard is posed by the mixing of these substances that can occur in a junk hole. Some paint products could undergo hazardous polymerization, give off poisonous fumes, or explode. Almost all data sheets for paint products state that the empty containers contain product residues and may be hazardous. Yet, these containers most probably end up buried in the ground.
During the course of this study, literature searches did not find any references to hazards from or mitigation of disposal of residential construction debris in "junk holes", other than that which appears above.
4.6 AGRICULTURAL PRACTICES
The scope of this study has been broadened to include a brief overview of agricultural practices. Literature searches pointed to agricultural practices as a source of nutrients to both surface and groundwater. In addition, many people settling in the State or relocating from urban centers to the rural countryside, do so because of aesthetic landscape qualities provided by current and past agricultural activities. As more of Connecticut's agricultural land is converted to other uses, land use planners and other municipal decision makers need an understanding of the impacts to water quality posed by agricultural practices. This is especially true of Litchfield County, which together with Hartford County contains 45% of the prime farmland and "farmland of statewide importance" in Connecticut (Waggoner, 1986).
From 1959 to 1982, the total area of farmland in Connecticut decreased by 50% (Melvin et al., 1987). According to Waggoner (1986), 18% of land in Litchfield County is farmland, 67% is forested (the State average is 14% farmland, 57% forested). Table 4-5 lists the acreage of crops in Litchfield County.
In 1974, Litchfield County had the largest amount of farmland of any county (100,085 acres) including the greatest area of harvested cropland (34,507 acres), the most cattle (22,796), horses (689) and sheep (900) of any county (Handman et
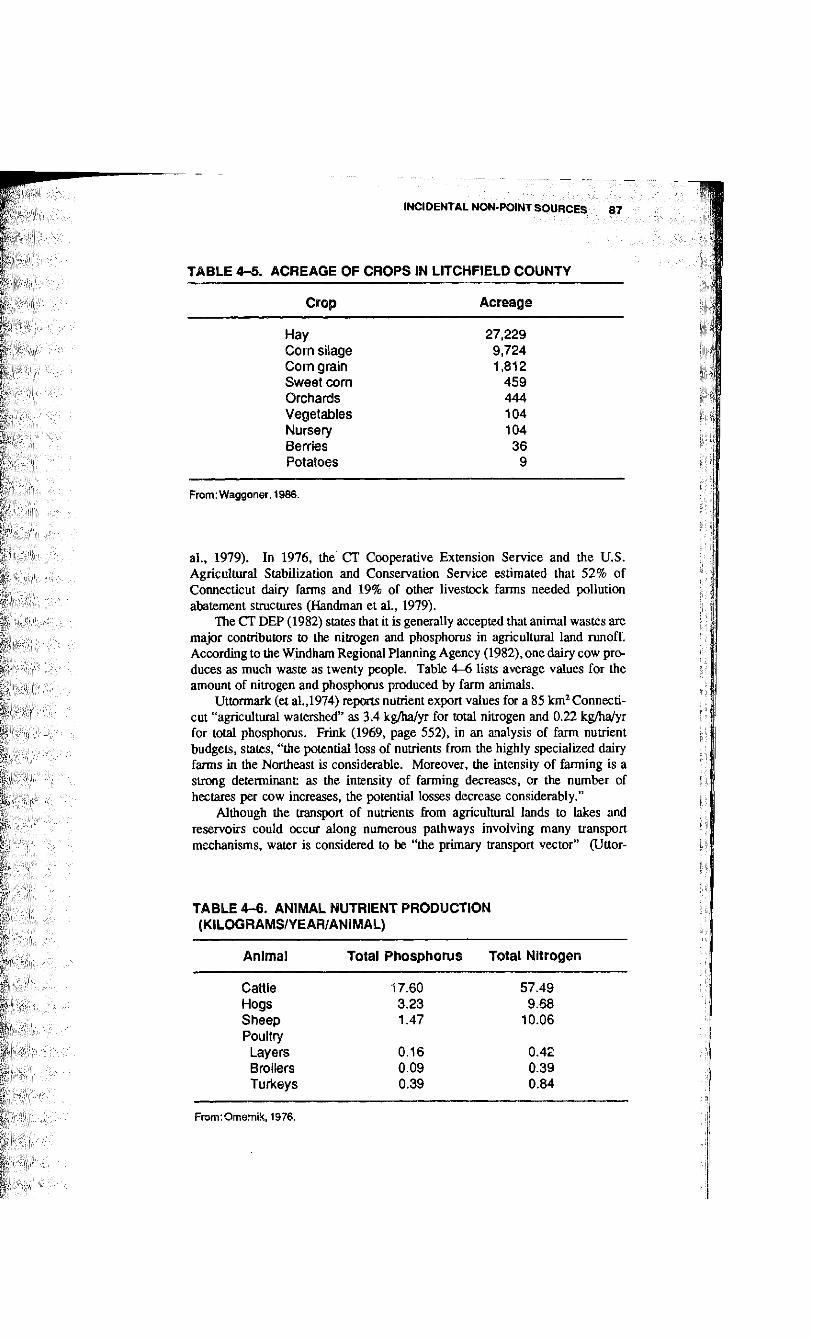
INCIDENTAL NON-POINT SOURCES
TABLE 4-5. ACREAGE OF CROPS IN LITCHFIELD COUNTY
87
Crop Acreage
Corn silage Corn grain Sweet corn Orchards Vegetables Nursery
Hay 27,229 9,724 1,812
459 444 104 104
Berries Potatoes
36 9
From: Waggoner, 1986.
al., 1979). In 1976, the C T Cooperative Extension Service and the U.S . Agricultural Stabilization and Conservation Service estimated that 52% of Connecticut dairy farms and 19% of other livestock farms needed pollution abatement structures (Handman et al., 1979).
The C T D E P (1982) states that it is generally accepted that animal wastes are major contributors to the nitrogen and phosphorus in agricultural land runoff. According to the Windham Regional Planning Agency (1982), one dairy cow produces as much waste as twenty people. Table 4-6 lists average values for the amount of nitrogen and phosphorus produced by farm animals.
Uttormark (et al.,1974) reports nutrient export values for a 85 km 2 Connecticut "agricultural watershed" as 3.4 kg/ha/yr for total nitrogen and 0.22 kg/ha/yr for total phosphorus. Frink (1969, page 552), in an analysis of farm nutrient budgets, states, "the potential loss of nutrients from the highly specialized dairy farms in the Northeast is considerable. Moreover, the intensity of farming is a strong determinant; as the intensity of farming decreases, or the number of hectares per cow increases, the potential losses decrease considerably."
Although the transport of nutrients from agricultural lands to lakes and reservoirs could occur along numerous pathways involving many transport mechanisms, water is considered to be "the primary transport vector" (Uttor-
TABLE 4-6. ANIMAL NUTRIENT PRODUCTION (KILOGRAMS/YEAR/ANIMAL)
Animal Total Phosphorus Total Nitrogen
Cattle Hogs Sheep Poultry
Layers
17.60 3.23 1.47
57.49 9.68
10.06
Broilers Turkeys
0.16 0.09 0.39
0.42 0.39 0.84
Frorrv.Omernik, 1976.
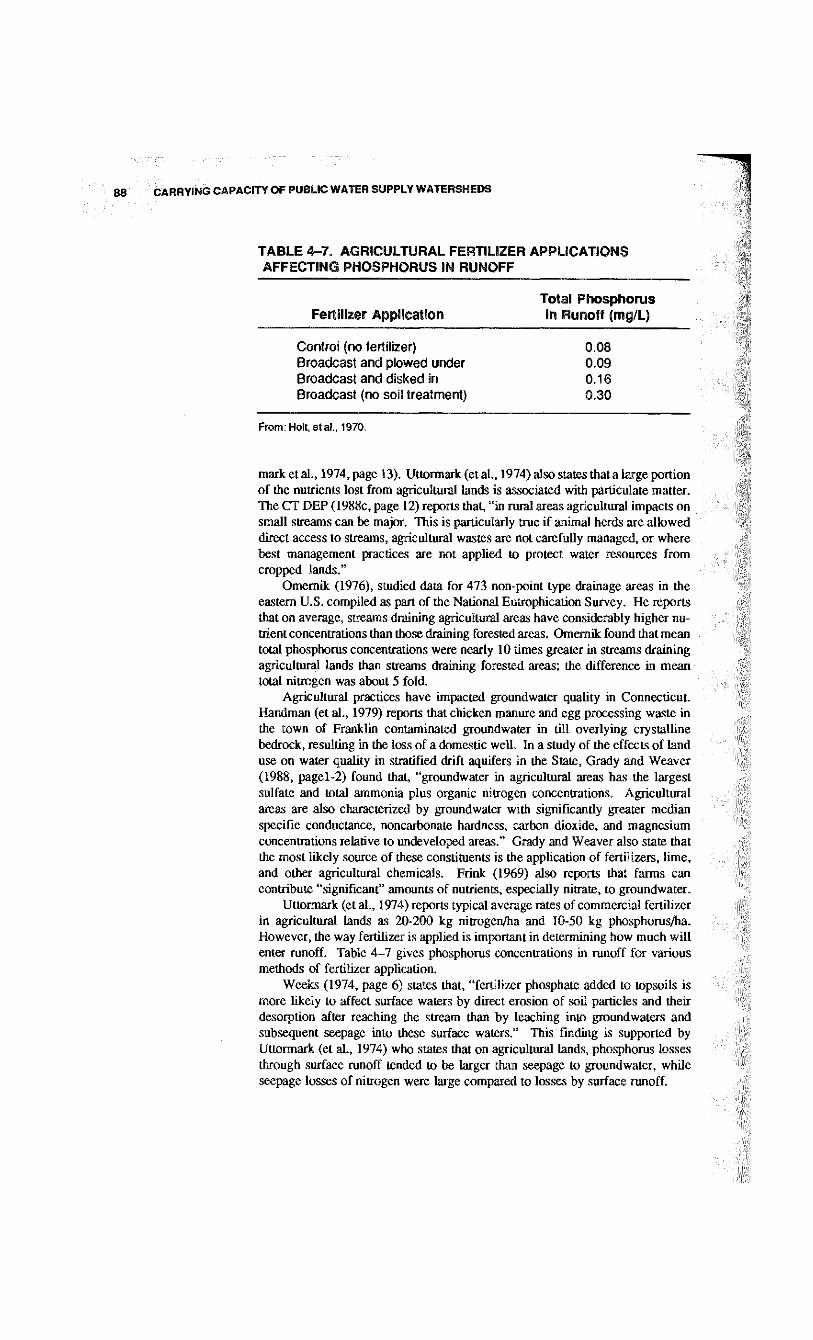
88 CARRYING CAPACITY OF PUBLIC WATER SUPPLY WATERSHEDS
TABLE 4-7. AGRICULTURAL FERTILIZER APPLICATIONS AFFECTING PHOSPHORUS IN RUNOFF
Total Phosphorus Fertilizer Application in Runoff (mg/L)
Control (no fertilizer) 0.08 Broadcast and plowed under 0.09 Broadcast and disked in 0.16 Broadcast (no soil treatment) 0.30
From .Holt, eta!., 1970.
mark et al., 1974, page 13). Uttormark (et al., 1974) also states that a large portion of the nutrients lost from agricultural lands is associated with particulate matter. The C T D E P (1988c, page 12) reports that, "in rural areas agricultural impacts on small streams can be major. This is particularly true if animal herds are allowed direct access to streams, agricultural wastes are not carefully managed, or where best management practices are not applied to protect water resources from cropped lands."
Omernik (1976), studied data for 473 non-point type drainage areas in the eastern U.S. compiled as part of the National Eutrophication Survey. He reports that on average, streams draining agricultural areas have considerably higher nutrient concentrations than those draining forested areas. Omernik found that mean total phosphorus concentrations were nearly 10 times greater in streams draining agricultural lands than streams draining forested areas; the difference in mean total nitrogen was about 5 fold.
Agricultural practices have impacted groundwater quality in Connecticut. Handman (et al., 1979) reports that chicken manure and egg processing waste in the town of Franklin contaminated groundwater in till overlying crystalline bedrock, resulting in the loss of a domestic well. In a study of the effects of land use on water quality in stratified drift aquifers in the State, Grady and Weaver (1988, page 1-2) found that, "groundwater in agricultural areas has the largest sulfate and total ammonia plus organic nitrogen concentrations. Agricultural areas are also characterized by groundwater with significantly greater median specific conductance, noncarbonate hardness, carbon dioxide, and magnesium concentrations relative to undeveloped areas." Grady and Weaver also state that the most likely source of these constituents is the application of fertilizers, lime, and other agricultural chemicals. Frink (1969) also reports that farms can contribute "significant" amounts of nutrients, especially nitrate, to groundwater.
Uttormark (et al., 1974) reports typical average rates of commercial fertilizer in agricultural lands as 20-200 kg nitrogen/ha and 10-50 kg phosphorus/ha. However, the way fertilizer is applied is important in determining how much wi l l enter runoff. Table 4-7 gives phosphorus concentrations in runoff for various methods of fertilizer application.
Weeks (1974, page 6) states that, "fertilizer phosphate added to topsoils is more likely to affect surface waters by direct erosion of soil particles and their desorption after reaching the stream than by leaching into groundwaters and subsequent seepage into these surface waters." This finding is supported by Uttormark (et al., 1974) who states that on agricultural lands, phosphorus losses through surface runoff tended to be larger than seepage to groundwater, while seepage losses of nitrogen were large compared to losses by surface runoff.
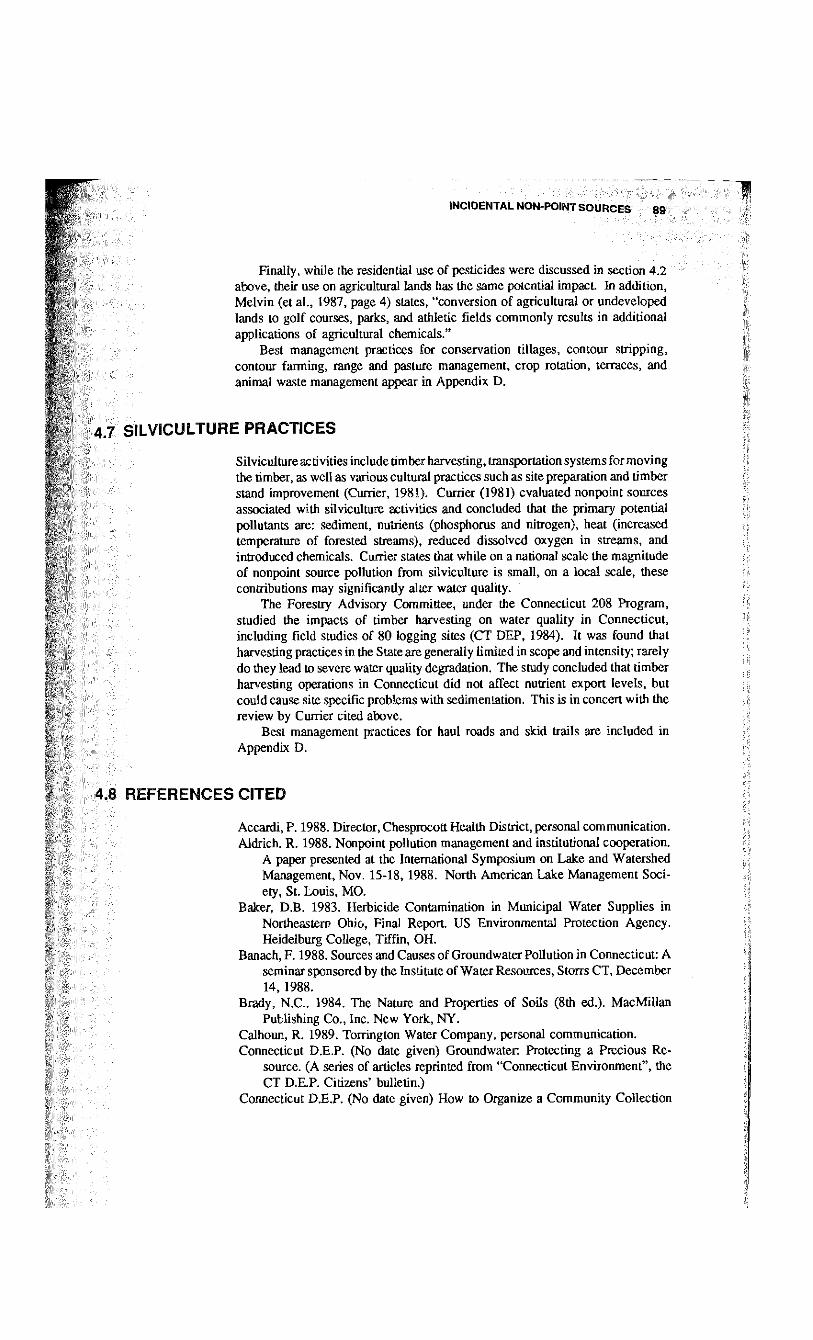
INCIDENTAL NON-POINT SOURCES 89
Finally, while the residential use of pesticides were discussed in section 4.2 above, their use on agricultural lands has the same potential impact. In addition, Mclvin (et al., 1987, page 4) states, "conversion of agricultural or undeveloped lands to golf courses, parks, and athletic fields commonly results in additional applications of agricultural chemicals."
Best management practices for conservation tillages, contour stripping, contour farming, range and pasture management, crop rotation, terraces, and animal waste management appear in Appendix D.
4 J Sr-V'C'J-Tl 'RE PRACTICES
Silviculture activities include timber harvesting, transportation systems for moving the timber, as well as various cultural practices such as site preparation and timber stand improvement (Currier, 1981). Currier (1981) evaluated nonpoint sources associated with silviculture activities and concluded that the primary potential pollutants are: sediment, nutrients (phosphorus and nitrogen), heat (increased temperature of forested streams), reduced dissolved oxygen in streams, and introduced chemicals. Currier states that while on a national scale the magnitude of nonpoint source pollution from silviculture is small, on a local scale, these contributions may significantly alter water quality.
The Forestry Advisory Committee, under the Connecticut 208 Program, studied the impacts of timber harvesting on water quality in Connecticut, including field studies of 80 logging sites ( C T DEP, 1984). It was found that harvesting practices in the State are generally limited in scope and intensity; rarely do they lead to severe water quality degradation. The study concluded that timber harvesting operations in Connecticut did not affect nutrient export levels, but could cause site specific problems with sedimentation. This is in concert with the review by Currier cited above.
Best management practices for haul roads and skid trails are included in Appendix D.
4.3 P-"FE ; :?ENCES CITED
Accardi, P. 1988. Director, Chesprocott Health District, personal communication. Aldrich. R . 1988. Nonpoint pollution management and institutional cooperation.
A paper presented at the International Symposium on Lake and Watershed Management, Nov. 15-18,1988. North American Lake Management Society, St. Louis, MO.
Baker, D.B. 1983. Herbicide Contamination in Municipal Water Supplies in Northeastern Ohio, Final Report. US Environmental Protection Agency. Heidelburg College, Tiffin, OH.
Banach, F . 1988. Sources and Causes of Groundwater Pollution in Connecticut: A seminar sponsored by the Institute of Water Resources, Storrs C T , December 14, 1988.
Brady, N.C.. 1984. The Nature and Properties of Soils (8th ed.). MacMillan Publishing Co., Inc. New York, N Y .
Calhoun, R. 1989. Torrington Water Company, personal communication. Connecticut D.E.P. (No date given) Groundwater Protecting a Precious Re
source. (A series of articles reprinted from "Connecticut Environment", the C T D.E.P. Citizens' bulletin.)
Connecticut D.E.P. (No date given) How to Organize a Community Collection
CARRYING CAPACITY OF PUBLIC WATER SUPPLY WATERSHEDS
Day. Hazardous Material Management Unit, Information and Education Unit C T D.E.P.
Connecticut D.E.P. 1982. The Trophic Classification of Seventy Connecticut Lakes. Connecticut Department of Environmental Protection, Bull . no. 3.
Connecticut D.E.P. 1984. A Watershed Management Guide to Connecticut Lakes. Connecticut D.E.P.
Connecticut D.E.P. 1988a. Underground Storage Tanks—A Guide For Municipalities. Connecticut department of Environmental Protection, Local Assistance and Program Coordination Unit, 1988.
Connecticut D.E.P. 1988b. Connecticut's New Environmental Laws. Connecticut Environment, vol. 16 (4).
Connecticut D.E.P. 1988c. State of Connecticut 1988 Water Quality Report to Congress. C T D.E.P.
Connecticut D.E.P. 1988d. Underground Fuel Storage Tank Unit, personal communication.
Cornell University. 1983. Pesticide Applicator Training Manual, Core Manual. Chemical-Pesticides Program, N E Regional Pesticide Coordinator. Cornell University, Ithaca, N Y .
Currier, J .B . 1981. Evaluation of nonpoint sources associated with silvicultural activities. In Environmental Impact of Nonpoint Source Pollution. JE.R. Overcash and J . Davidson, (eds.) Ann Arbor Science Publishers, Inc. Ann Arbor.
Dennis, J . 1986. Phosphorus export from a low density residential watershed and an adjacent forested watershed. In Lake and Reservoir Management vol I I . Proceedings from the 5th Annual International Symposium. CRedfield; J .F . Taggart; and L . M . Moore (eds.) North American Lake Management Society. Geneva, W I .
Fairfield County Soil and Water Conservation District. 1988. Firm Ground. Fairfield County Soil and Water Conservation District. Vol . 11 (6).
Frink, C.R. 1969. Water pollution potential estimatedfrom farm nutrient budgets. Agronomy Journal, vol. 61 , July-August.
Frink, C.R. and L.Mankin. 1986. Pesticides in Ground Water in Connecticut. Connecticut Agricultural Experiment Station. Bulletin 839.
Grady, S J . and M.F. Weaver. 1988. Preliminary Appraisal of the Effects of Land Use on Water Quality in Stratified-Drift Aquifers in ConnecticuL USGS Water Resources Investigations Rpt 87-4005.
Handman, E . H . ; I .G. Grossman; J.W. Bingham and J . L . Rolston, 1979. Major Sources of Ground-Water Contamination in ConnecticuL USGS Water Resources Investigations Open File Rpt. vol. 79-1069.
Handman, E . H . and J.W. Bingham. 1980. Effects of Selected Sources of Contamination on Ground-Water Quality at Seven Sites in Connecticut. USGS Water Resources Investigations Open File Rpt. vol. 79-1596.
Hankin, L . and P .E . Waggoner. 1988. Quality and Quantity of Pesticides Sold in Connecticut 1987. C T Agricultural Experiment Station. Bulletin 862.
Harrison, E Z . and M.A. Dickinson. 1984. Protecting Connecticut's Groundwater: A Guide to Groundwater Protection For Local Officials. Connecticut DEP .
Holt, R .F . ; D.R. Timmons and J . L . Latteraell. 1970. Accumulation of phosphate in water. Journal Agr Food Chem. vol. 18.
Illinois E.P.A. 1984. Blue Creek Watershed Project Executive Summary and Recommendations. Environmental Protection Agency IEPA/WPC/84-008.
Levine, R.; H.D. Luce; R . G . Bartholomew; R . G . Adams; R . F . Jeffrey; and E . H . Sautter. 1987. Soils: A Predictor of Potential for Groundwater Contamination from Pesticides. Cooperative Extension, UCONN, UMASS, U R I , Soil Conservation Service.
INCIDENTAL NON-POINT SOURCES
Lynn, R . 1989. Planning Director, Litchfield Hills Council of Elected Officials, personal communication.
Maas, R.P. and L . C . Stanley. 1988. An educational program for farmers on preventing lake contamination from agricultural pesticides. In Lake and Reservoir Management, vol. 4 (1), North American Lake Management Society.
McKee, J.W. and H.W. Wolf. 1963. Water Quality Criteria. California State Water Resources Control Board. Pasadena, C A .
Melvin, P L ; S J . Grady; D.F. Healy; and F . Banach. 1987. Connecticut Groundwater Quality. USGS Open file Rpt. 87-0717.
Moore, L . and K . Thornton (eds.) 1988. The Lake and Reservoir Restoration Guidance Manual (first ed.). North American Lake Management Society. U.S. E P A 440/5-88-002.
Omernik, J .M. 1976. The Influence of Land Use on Stream Nutrient Levels. U.S . Environmental Protection Agency. Corvallis, OR. E P A 600/376014.
Reckhow, K . H . ; M.N. Beulac and J .T. Simpson. 1980. Modeling Phosphorus Loading and Lake Response Under Uncertainty: A Manual and Compilation of Export Coefficients. US Environmental Protection Agency. Washington D.C. EPA-660/3-74-020.
Robinson, B . 1988. Connecticut DEP, personal communication. Stanek, E J . ; R.W. Tuthill; C Willis and O S . Moore. 1987. Household hazardous
waste in Massachusetts. Archives of Environmental Health, vol. 42 (2). United States Department of Health, Education, and Welfare. 1974. A Recom
mended Standard...An Identification system for Occupationally Hazardous Materials. US DHEW, Pub Hth Svs., C D C , NIOSH pub 75-126. Cincinnati, OH.
United Sates E P . A . 1988. National Pollutant Discharge Elimination System Permit Application Regulations for Storm Water Discharges. Federal Register, US Environmental Protection Agency, vol. 53, no. 235.
Uttormark, P.D.; J.D. Chapin and K . M . Green. 1974. Estimating Nutrient Loadings of Lakes From Non-Point Sources. University of Wisconsin Water Resource Center. EPA-660/3-74-020.
von Rumker, R.; E.W. Lawless; A . F . Meiners; K . A . Lawrence; G . L . Kelso; and F . Horay. 1974. Production, Distribution, Use and Environmental Impact Potential of Selected Pesticides. Council on Environmental Quality. Washington, D.C.
Waggoner, P.E. 1986. The Distribution of People and Crops Across the Land of Connecticut. Connecticut Agricultural Experiment Station Bulletin 838.
Weeks, M.E. 1974. The Effect of Land Use on the Chemical and Physical Quality of Surface and Ground Waters in Small Watersheds. Massachusetts Water Resources Center. Amherst, MA.
Windham Regional Planning Agency. 1982. Lake Management Handbook: A Guide to Quantifying Phosphorus Inputs to Lakes. Windham Regional Planning Agency. Willimantic, C T .
Construction-Related Erosion and Sedimentation !
i
5.1 PRINCIPLES OF SOIL EROSION AND SEDIMENTATION
Soil erosion is defined as the process by which the land's surface is worn away by the actions of wind, water, ice and gravity. Natural erosion occurs at a very slow and generally uniform rate. Values published by the U.S . Environmental Protection Agency (1973) as cited by Gray and Leiser (1982) establish a range of 15-100 tons of soil eroded per square mile per year for soils under natural cover, stream bank and shoreline erosion being exceptions to this generalization. Erosion of stream channels is dependent on the stream discharge, sediment loads, depth of flow and stream geometry (Gray and Leiser, 1982). Water generated erosion is the most damaging of all the erosional forces, especially in developing areas. The disturbance of the land's surface through urban development eliminates the protection provided by natural vegetation and exposes soil to the forces of erosion.
The erosion process can be viewed as a transfer of energy. The natural energy of water, as a falling rain drop at 20-30 feet per second, first detaches the exposed soil particle. As much as 100 tons per acre can be splashed into the air during a heavy rain storm. On level areas, soil particles can be transported 2 feet vertically and 5 feet horizontally. On sloped sites the net transport is down gradient. Compaction of the soil surface can also result from rainfall impact (Elison, 1948 as cited by Gray and Leiser, 1982). As water begins to run off the ground as sheet flow, the horizontal force of the water begins to move the soil particles. Sheet flow does not remain as a uniform shallow flow for more than a few feet. Small irregularities in the ground surface tend to concentrate the sheet flow into small channels referred to as rills. Rills, which are generally only a few inches deep, increase the velocity and the turbulence of, the flowing water increasing it's ability to detach more soil particles. Schwab, (et al., 1966) as cited by Gray and Leiser (1982) considers rill erosion the most important cause of soil erosion. Rills tend to coalesce, forming a single channel called a gully. The principal difference between rill and gully erosion is the depth and width of the channel. With an increase in the volume and velocity of the runoff, the gully expands in both dimensions.
Sheet and rill erosion are most typical of agricultural activities. Their rate of erosion is over periods of years. Because of the shallow low energy flows associated with these types of erosion, generally 1-2 feet per second, sediment is transported only short distances (Gray and Leiser, 1982). Rills can be removed by
5.0
94 CARRYING CAPACITY OF PUBLIC WATER SUPPLY WATERSHEDS
normal grading action (Virginia Soil and Water Conservation Commission, [V.S.W.C.C.] 1985). Gully erosion is more typically associated with land under going urban development. Runoff flows are concentrated, over short periods of time, and tend to transport sediment greater distances. (Connecticut Council of Soil and Water Conservation (C.C.S.W.C.), 1984; Gray and Leiser, 1982). Gray and Leiser (1982) cite four stages of gully development: downward cuttings, headward erosion, healing, and stabilization. These stages can be recognized by individual characteristics. Active gullies have exposed soil on both sides of the channel. The presence of vegetation in the gully indicates healing while well developed vegetation and the absence of channel down cutting is an indication of a stabilized gully. Gullies can be caused by spring activity (seeps) or freeze-thaw cycles but on construction sites they are the direct result of concentrated surface flows resulting from rilling. Unlike rills, gullies can not be graded away but require the use of riprap blankets.
5.1.1 Factors Influencing Erosion
The potential for soil erosion from either a disturbed or undisturbed site is a function of the site's: 1) soil characteristics, 2) the type and distribution of the vegetative cover, 3) topography and watershed hydrology, and 4) climate.
The soil matrix provides a medium for the development of vegetation and microbial populations. The soil also provides an environment for the transport of water as well as the physical and chemical treatment of pollutants dissolved in the percolating recharge water i.e., precipitation, septic systems. Soil types vary in their texture, organic content, structure and permeability (ability to transport water). High concentrations of fine sands and silt in the soil matrix tend to make these soils subject to erosion with the removal of their vegetative cover. Soils with higher concentrations of organic matter and clays tend to resist erosion. Once eroded however, the organic and clay content of the soil tends to remain in suspension for extended periods of time. The permeability of the soil is also influenced by the addition of organic matter and sands, which allows for the infiltration of runoff. Those soils with the highest percentages of gravel are the least erodible and posses the highest permeability rates, thus allowing for maximum infiltration of surface runoff (C.C.S.W.C., 1984).
The distribution and type of vegetative cover on a parcel of land provides indications of the type of soil conditions that exist, the duration of saturated soil conditions, and the distribution of surface runoff and groundwater seeps. From a survey of the site's floral associations, generalizations can be made as to: 1) species present and distribution, 2) which species are most successful, 3) existing and emerging patterns of floral succession, 4) the hydrologic character of the soil, 5) past land use practices, and 6) the suitability of the site for specific development From this information the land planner can use existing vegetation to protect sensitive floral areas, plan the introduction of new or additional plants to protect the soil surface, enhance runoff infiltration or filter sediment contained in runoff from disturbed soil surfaces.
The shape of the land surface has a direct influence on the ultimate use of the land by affecting the ease of access, the distribution of surface runoff, the succession of soil formation, site drainage conditions, and the ultimate development and distribution of vegetational associations (Anderson et al., 1978). The slope of the land surface also affects the movements of both solids and solutes within the soil profile. The slope of the land can be categorized into gently sloping (0-8%), moderately sloping (8-15%), moderately steep (15-25%), and steep (greater than 25%) (USDA, 1985). The steeper the slope, the more limitations to its use. Therefore those parcels with limiting slope conditions (i.e., 20% slope and
CONSTRUCTION-RELATED EROSION AND SEDIMENTATION 95
greater) will require more planning and greater expense in order to develop them in a sound environmental manner.
The angle of slope in conjunction with the vegetative cover wil l influence the moisture content of the soil by affecting the rate of surface water runoff and infiltration. Soils at the top of the slope, where slowly permeable layers are generally absent, tend to drain freely. As one progresses down the slope, the conditions change to moderately well drained and ultimately to poorly or very poorly drained conditions at the bottom of the slope. This is a generalized picture and exceptions do exist.
The degree and duration of soil saturation depends upon precipitation, the size of the watershed, and the configuration of the subsheds delineated by the surface features. A l l these factors (slope, soil, volume runoff) direcUy influence the type of vegetation that develops, and thus floral community development and ultimately long term soil suitability and resistance to erosional forces.
The potential for soil erosion is further influenced by the size of the watershed and by the slope conditions which directly affect the amount and rate of runoff. A direct relationship exists between the length and height of the slope face and the potential for soil erosion. This potential for soil erosion can be significantly reduced by limiting the area of disturbance of existing vegetation and by reducing the slope lengths. Such action can also reduce the sedimentation of down gradient environments both on and off the site.
Climatic conditions of the region, including the frequency, duration and intensity of rainfall are the principal factors in determining the amount of runoff generated over a given area. The potential for soil erosion on any site is directly proportional to increases in the volume and the velocity of runoff flowing over that site (V.S.W.C.C. , 1985). Temperature will also affect the ability of runoff to cause erosion. Frozen soils, even without vegetation, are more resistant to erosion. This condition changes with thawing and precipitation. The ability of the thawed surface layer of soil to absorb and pass runoff is diminished and thus subject to erosion by runoff. Saturated surface soils devoid of vegetation coupled with peak runoff periods with velocities greater than 5 feet per second can generate significant volumes of sediment. Transport is intermittent and generally associated with these peak periods of runoff (V.S.W.C.C., 1985). Peak periods of runoff occur only over a small percentage of the total precipitation event. As runoff velocities increase so does the ability of the runoff to erode and transport sediment. Conversely, as runoff velocities decrease, so does the potential for erosion and sedimentation of down gradient environments.
5.2 POTENTIAL IMPACTS ON A Q U A T I C S Y S T E M S AND S U R F A C E W A T E R Q'JA'.«TY A S S O C I A T E D WITH E R O S I O N
The U.S. E P A has estimated that nationally some 40 million tons of sediment reach water bodies annually as a result of the three to four thousand acres of land which undergo development daily for housing, industry and highway construction (V.S.W.C.C., 1985; US Department HUD, 1970; USDA, 1977). Existing urban land generates 200-500 tons of sediment per square mile per year. Leopold, 1968, as cited by the V.S.W.C.C. (1985), estimates that development of urban land generates from 1000 to 100,000 tons of sediment per square mile per year. In contrast, forest land is estimated to generate 15-100 tons of sediment per square mile per year (U.S. E P A , 1973).
Suburban expansion has been identified as the principal source of silt to water bodies (Faber, 1987; Wilber, 1969). Construction related erosion and sedimentation was identified in 1988 as a known source of water quality problems in
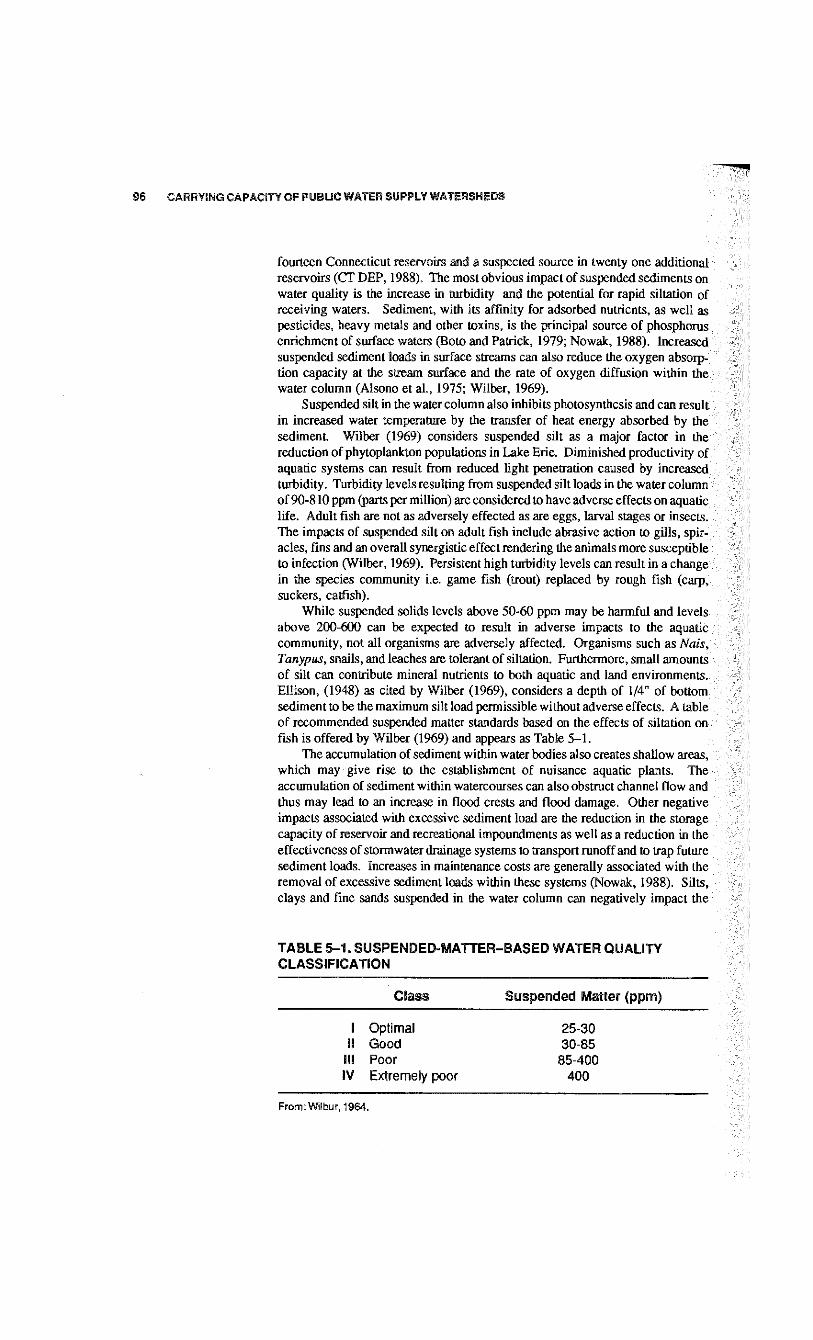
96 CARRYING CAPACITY OF PUBLIC WATER SUPPLY WATERSHEDS
fourteen Connecticut reservoirs and a suspected source in twenty one additional reservoirs (CT DEP, 1988). The most obvious impact of suspended sediments on water quality is the increase in turbidity and the potential for rapid siltation of receiving waters. Sediment, with its affinity for adsorbed nutrients, as well as pesticides, heavy metals and other toxins, is the principal source of phosphorus enrichment of surface waters (Boto and Patrick, 1979; Nowak, 1988). Increased suspended sediment loads in surface streams can also reduce the oxygen absorption capacity at the stream surface and the rate of oxygen diffusion within the water column (Alsono et al., 1975; Wilber, 1969).
Suspended silt in the water column also inhibits photosynthesis and can result in increased water temperature by the transfer of heat energy absorbed by the sediment Wilber (1969) considers suspended silt as a major factor in the reduction of phytoplankton populations in Lake Erie. Diminished productivity of aquatic systems can result from reduced light penetration caused by increased turbidity. Turbidity levels resulting from suspended silt loads in the water column of 90-810 ppm (parts per million) are considered to have adverse effects on aquatic life. Adult fish are not as adversely effected as are eggs, larval stages or insects. The impacts of suspended silt on adult fish include abrasive action to gills, spiracles, fins and an overall synergistic effect rendering the animals more susceptible to infection (Wilber, 1969). Persistent high turbidity levels can result in a change in the species community i.e. game fish (trout) replaced by rough fish (carp, suckers, catfish).
While suspended solids levels above 50-60 ppm may be harmful and levels above 200-600 can be expected to result in adverse impacts to the aquatic community, not all organisms are adversely affected. Organisms such as Nais, Tanypus, snails, and leaches are tolerant of siltation. Furthermore, small amounts of silt can contribute mineral nutrients to both aquatic and land environments. Ellison, (1948) as cited by Wilber (1969), considers a depth of 1/4" of bottom sediment to be the maximum silt load permissible without adverse effects. A table of recommended suspended matter standards based on the effects of siltation on fish is offered by Wilber (1969) and appears as Table 5 -1 .
The accumulation of sediment within water bodies also creates shallow areas, which may give rise to the establishment of nuisance aquatic plants. The accumulation of sediment within watercourses can also obstruct channel flow and thus may lead to an increase in flood crests and flood damage. Other negative impacts associated with excessive sediment load are the reduction in the storage capacity of reservoir and recreational impoundments as well as a reduction in the effectiveness of stormwater drainage systems to transport runoff and to trap future sediment loads. Increases in maintenance costs are generally associated with the removal of excessive sediment loads within these systems (Nowak, 1988). Silts, clays and fine sands suspended in the water column can negatively impact the
TABLE 5-1. SUSPENDED-MATTER-BASED WATER QUALITY CLASSIFICATION
Class Suspended Matter (ppm)
I Optimal II Good III Poor IV Extremely poor
25-30 30-85
85-400 400
From: Wilbur, 1964.
CONSTRUCTION-RELATED EROSION AND SEDIMENTATION 97
number, type and distribution of bottom dwelling organisms by suffocation via direct burial. Reduction in bottom dwelling organisms will also adversely affect available food supplies. Organisms, such as phytoplankton, living in the water column can also be affected by the reduction of sunlight penetration . Coarse grained sediments can also blanket organisms. In fast moving streams these coarse grained sediments can also act as an abrasive agent accelerating channel scour and bank cutting. A l l of these negative impacts contribute to a reduction in the aesthetic value of water bodies. This is especially true of recreational impoundments.
The principal effect of land development is exposure of soils to the erosive actions of precipitation and stormwater runoff by the removal of vegetation and grading of the land's surface (Levine et al., 1974). By removing vegetation and altering the site's topography, the soil's protective covering is removed and exposure of less pervious and possibly more erosive soil layers may result. Movement of heavy equipment over exposed soil can compact the soil and significantly alter its infiltration capacity. This results in greater volume and velocities of runoff, with the increased potential for erosion and sedimentation of both on-site and off-site areas. During construction these hazards can be exacerbated by scheduling error, unexpected difficulties in completing the work as well as significant alteration of the watershed characteristics that effect surface flow, reducing the time of concentration by increasing slope travel distances and creating impervious areas (V.S.W.C.C., 1985). Long term impacts from soil modification, such as changes in slope and permeability, can include the exposure of soil layers, which increases the susceptibility to drought conditions and diminishes the soil's ability to support vegetation. Southern and western facing slopes are more susceptible to this due to changes in temperature and moisture conditions (V.S.W.C.C., 1985).
5.3 PRINCIPLES OF EROSION AND SEDIMENTATION CONTROL DESIGN
5.3.1 Planning
To develop an effective erosion and sediment (E/S) control plan, it is imperative that the designer use wise preplanning to stage site development. The plan must reduce the potential for unnecessary site disturbances and thus the potential for soil erosion and sedimentation of down gradient environs, both on and off the site. The planning process contains three stages: 1) data collection, 2) data analysis and 3) site planning. An in-depth discussion of the process is presented in the "Connecticut Guidelines for Erosion Control" and the reader is referred to that publication and others (Christensen, 1984; Goyette, 1985; Thompson, 1984) listed in section 5.4 for a discussion of its application.
Equally important to the planning process is an understanding, on the part of both the plan preparer and the reviewer, of the technical principles involved in developing the design. These principles are briefly discussed below.
1. Let the development fit the site. Use natural resource information (topography, soil, hydrology, floral associations) to guide site development i.e. roadway alignment, structure placement, and stormwater control measures. Limit, as much as possible, the need to regrade steep slopes in areas which cannot be avoided, and insure that sound engineering principles and practices are employed to overcome these limitations. As Crafton (1987) points out, a thorough evaluation of the environmental characteristics of the site wil l allow the planner to "exploit the strengths of the site and overcome its limitations."
98 CARRYING CAPACITY OF PUBLIC WATER SUPPLY WATERSHEDS
2. Minimize the extent of the areas of soil to be disturbed and the duration of disturbance. Stage site development in a sequential manner so that only those areas that are under active construction or regrading are exposed. Work from the lower portions of the site and provide stabilization to cut and fill areas as work progresses up the slope. Install storm water control measures before constructing the storm drainage system or disturbing the soil areas contributing runoff to the detention system. Whenever possible, stage major earth moving work during seasons when erosion potential is low i.e. May to October. This is an optimal condition and is not always possible without detailed site planning and scheduling.
3. Critical to plan implementation is the timely application of appropriate temporary erosion controls i.e., silt fence, hay bales, and water diversions. The planning phase of the Erosion and Sedimentation Control Plan should identify those areas of the site that wil l require controls as a result of the prospective site development plan. Field changes in the E/S control plan can also be expected as a result of changes in scheduling of equipment and unanticipated field conditions.
4. The use of "isolation methods", including diversion swales, dikes, sediment traps or basins and vegetative filter strips are to be used to divert surface water runoff around areas of exposed soil. This action will reduce the opportunity for water generated erosion and possible sedimentation on and off the site. Permanent detention or sediment basins can be used to provide a more diverse habitat than currendy exists on the site and thus contribute to the site's wildlife support capacity, aesthetic values and the removal of pollutants contained in the runoff leaving the site (Jontos et al., 1984; Oberts and Osgood, 1988).
5. The control of post development runoff is mandated by most communities to prevent downstream flooding resulting from the creation of less permeable or impervious surfaces in the upper reaches of a watershed. Development will result in both increased volume and velocity of surface runoff leaving the developed site. Every effort should be made to keep slope lengths to less than 100 feet, slope angles to less than 10%, and to maintain as much existing vegetative cover as possible. Such actions will help to minimize post development runoff velocities and reduce the potential for soil erosion.
6. Soil stabilization throughout the life of the project is extremely important. Temporary methods which include hay, straw or wood mulches, or temporary vegetation are most effective where it is not practical to establish permanent vegetative cover. Such is the case on cut and fill slopes of temporary roadways or in areas where construction scheduling or seasonal considerations do not permit the completion of a roadway or site grading project.
7. A well thought out plan for site development phasing and sedimentation and erosion control is only effective if it is properly installed and maintained. A preconstruction meeting of all those parties involved with plan implementation and supervision is most valuable. A l l controls must be inspected on a regular basis by knowledgeable supervisors; this may be necessary on a daily, weekly, or monthly basis as required.
5.3.2 Erosion and Sedimentation Control Measures
Methods for the control of erosion and sedimentation on the construction site fall into three broad categories. These include: vegetative, non-structural and structural measures. Vegetative controls are the least expensive and most effective while structural measures are the most expensive to implement. Each of the measures can be used singularly or in combination with each other. Shaver (1987) and Ireland (1987) offer a sequence of application for these measures: (1)
CONSTRUCTION-RELATED EROSION AND SEDIMENTATION 99
preservation of existing vegetation, (2) application of temporary or permanent vegetative measures; (3) non-structural measures - used during active construction or prior to final stabilizing and (4) structured controls - the last line of defense to prevent movement of sediment off the site. As a practical matter, a fifth category, integrated measures, can be added to this list. A detailed discussion of the individual measures and the proper method of selection is beyond the scope of this report. The reader is referred to the "Connecticut Guidelines" or other references cited for a more detailed review of the selection and application procedure. A brief introduction to each of the measures commonly used in residential development is presented below.
5.3.2.1 Vegetative Measures. Use of existing vegetation to control the impact from precipitation and overland flow is the most cost effective means of erosion control on a building site. As part of the erosion and sedimentation site planning process, significant floral associations and their distribution wil l be identified. This wil l enable the site planner to protect these features from the impact of development It must be understood that not all vegetation can be saved. Those trees and shrubs that provide visual screening, wildlife habitat, or that serve now or in the future as buffers or filter strips should be given priority. Protective actions might include the use of safety or snow fencing around the drip line of significant trees (greater than 18" diameter at breast height). The drip line can be determined by dropping a vertical line (visually) from the end of the limbs. This action wil l not only protect the tree from being inadvertently damaged by heavy equipment, but also prevent the soil around the roots, which are responsible for respiration and water adsorption, from being compacted, thus protecting the tree from suffocation. Grading (cuts/fills) around the tree should be limited to the drip line, if possible. A minimum undisturbed area around the trunk of five feet is recommended by most guidelines and best management practices (BMPs) (V.S.W.C.C. , 1980; C C S . W.C., 1984; Westchester County Environmental Management Council 1981).
Where it is necessary to remove existing floral cover, temporary or permanent vegetation can be applied to stabilize exposed soil surfaces. Selection of cover type wil l be dependent on the purpose of control and the post construction climatic conditions (temperature, moisture regime) of the site. Temporary vegetative controls refer to the application of fast germinating grasses such as annual rye grass. Development of good vegetation cover wil l require 60 days and will last 2 to 12 months (Ireland, 1987). Rough graded road shoulders or stock piles of topsoil or loam are areas where this control measure is applied.
Grass seeding or sodding are considered in the list of permanent vegetative control measures that include the planting of trees and shrubs. Plantings can be used to control temperature and noise, as well as to provide visual screening, wildlife habitat, as well as stabilize soil surfaces. Whenever possible, native species which require little future maintenance should be selected. Once established, vegetation can control future erosion via the interception of falling rain, absorption of soil moisture, energy dissipation by interruption of flows, soil stabilization through the root mass and enhanced surface water infiltration (Bailey and Copeland, 1961; Gray, 1977). A direct correlation between vegetation and the stress-strength relationships in soil on slopes has been established (Gray and Lieser, 1982; Allen, 1979). The development of root masses reinforce the soil mass, retard soil movement by the physical filtration of surface runoff and restrain soil masses by soil arching. The interception of rainfall by plant foliage prevents the dislodging of the soil and soil compaction. Plant residue (leaf litter) increases surface roughness, retarding the flow of surface runoff. Incorporation of plant residues into the soil, as well as root growth, maintain soil porosity and permea-
100 CARRYING CAPACITY OF PUBLIC WATER SUPPLY WATERSHEDS
bility. Water absorption by plant roots depletes soil moisture and thus delays saturated soil conditions and contributes to reductions of runoff.
Filter Strips. The use of existing or introduced vegetation as sediment filter strips has been effectively applied on both urban and rural development sites. Within the vegetative filter strip, the objective is to retain the area in its natural condition in order to buffer the effects of development on water bodies. "Protecting a water body from development requires that the negative influence of increased runoff, sedimentation, biochemical degradation, and thermal pollution be minimized... the preserved vegetation adjacent to streams reduces the force of runoff, which in turn decreases potential sediment loads. The shade from vegetation also lessens thermal pollution associated with runoff from impervious surfaces, and leaves and litter trap harmful biological pollutants." (Thurow et al., 1975; page 12) The naturally occurring vegetative filters between the high water mark of lakes and an area of disturbance have been effective in controlling the migration of suspended soils from land under residential development (Woodward, 1988). Low density residential development (4 units/2.47 acres) can generate 5 to 10 times the volume of phosphorus as an undeveloped site (Dennis, 1986). Vegetative filters 75 feet to 189 feet in width have reduced phosphorus concentrations in runoff by 96%, and suspended solids concentrations by 99% (Woodward, 1988). The Connecticut Guidelines for Soil Erosion and Sedimentation Control (1984) recommend a minimum filter width of 15 feet for light sediment loads. This width is increased proportionately for slopes longer than 150 feet in length. It must also be noted that the vegetation within the filter strip be adapted to the proposed use and that maintenance of the strip, including the removal of accumulated sediment, is sometimes necessary. Well developed grassed or brushy areas are suited to this application as well as wooded areas with a good forest litter cover. Curbs have been eliminated on roadways with less than a 5% slope to permit passive drainage over grassed shoulders, thus eliminating point discharges and enhancing infiltration of runoff (Aldrich, 1988). The BMPs from Westchester County Environmental Management Council (1981) recommend a minimum filter width of 25 feet. This width should be increased by 3 feet for each degree of slope. Conversely, a reduction in width of one foot can be made for each three feet of width of adjacent brushy or woodland growth in good hydrologic condition (organic ground cover). Additional controls such as sediment barriers, benches, mulches or traps are required when 1) slope angles exceed 15%, 2) where slope runs are greater than 200 feet, or 3) the filter is in heavy shade or subject to traffic. Additional recommendations include the use of a level spreader before the filter. Suggested filter widths using existing vegetation based on the slope angle of land between a disturbed area (logging road) and a stream have been reported by Levine (etal., 1974). See table 5-2 for reported values. The width of the filter strip is doubled for public water supply watersheds.
U.S.D.A., SCS and the National Forest Service (1977) make additional recommendations for buffer widths in areas subject to logging as well as for municipal watersheds in other critical areas using slope as a criteria. These recommendations appear in Table 5-3. The SCS Technical Guide (USDA, 1985) recommends 25 foot wide filter strips on forested land when slopes of less than 1 % exist. This width is increased proportionately up to 65 feet for 30% slopes.
I f a grassed filter area is to be mowed, the grass should be a minimum of 4 inches in height from May to September and fertilized with 10-6-4 at a rate of 10 lbs. per 1000 square feet. While a variety of grass seed mixtures are available, Westchester County recommends a mix of 1/4 lb. redtop, 3/4 lb. creeping red fescue and 3/4 lb. of Kentucky #31 fescue. For non-mowed areas, red clover applied at 9 lbs. per acre as well as seed mixtures composed of equal parts of redtop
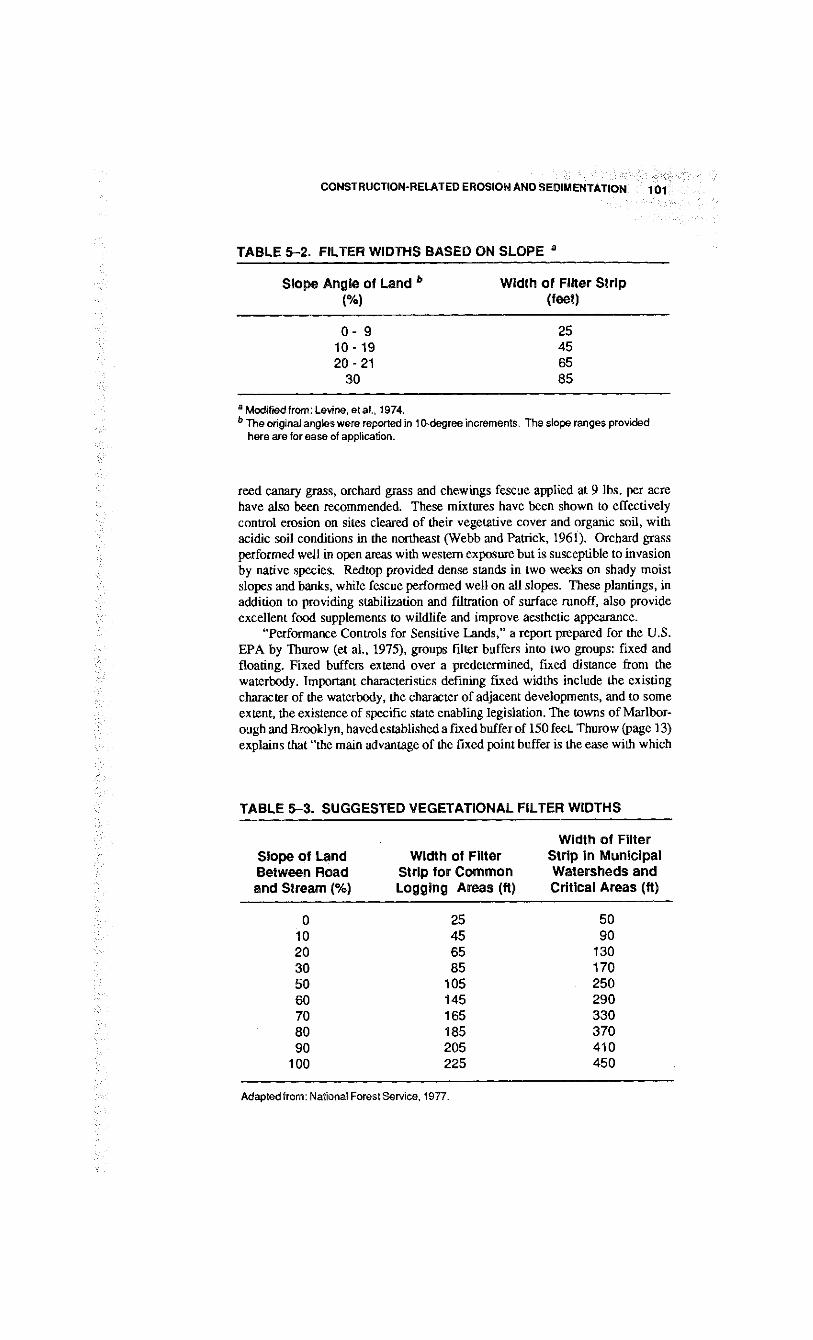
CONSTRUCTION-RELATED EROSION AND SEDIMENTATION 101
TABLE 5-2. FILTER WIDTHS BASED ON SLOPE *
Slope Angle of Land * Width of Filter Strip (%) (feet)
0 - 9 25 10-19 45 20-21 65
30 85
a Modified from: Levine, eta!., 1974. b The original angles were reported in 10-degree increments. The slope ranges provided
here are for ease of application.
reed canary grass, orchard grass and chewings fescue applied at 9 lbs. per acre have also been recommended. These mixtures have been shown to effectively control erosion on sites cleared of their vegetative cover and organic soil, with acidic soil conditions in the northeast (Webb and Patrick, 1961). Orchard grass performed well in open areas with western exposure but is susceptible to invasion by native species. Redtop provided dense stands in two weeks on shady moist slopes and banks, while fescue performed well on all slopes. These plantings, in addition to providing stabilization and filtration of surface runoff, also provide excellent food supplements to wildlife and improve aesthetic appearance.
"Performance Controls for Sensitive Lands," a report prepared for the U.S. E P A by Thurow (et al., 1975), groups filter buffers into two groups: fixed and floating. Fixed buffers extend over a predetermined, fixed distance from the waterbody. Important characteristics defining fixed widths include the existing character of the waterbody, the character of adjacent developments, and to some extent, the existence of specific state enabling legislation. The towns of Marlborough and Brooklyn, haved established a fixed buffer of 150 feet. Thurow (page 13) explains that "the main advantage of the fixed point buffer is the ease with which
TABLE 5-3. SUGGESTED VEGETATIONAL FILTER WIDTHS
Width of Filter Slope of Land Width of Filter Strip in Municipal Between Road Strip for Common Watersheds and and Stream (%) Logging Areas (ft) Critical Areas (ft)
0 25 50 10 45 90 20 65 130 30 85 170 50 105 250 60 145 290 70 165 330 80 185 370 90 205 410
100 225 450
Adapted from: National Forest Service, 1977.
102 CARRYING CAPACITY OF PUBLIC WATER SUPPLY WATERSHEDS
it is administered. It is relatively simple to determine whether a projected development will fall within the buffer or not. The key weakness is found in the rigidity of fixed boundaries. Since streams are often associated with other important resource areas such as hillsides, wooded areas, and wedands; fixed point boundaries may exclude consideration of these related sensitive areas."
A floating filter buffer varies in width, taking into account other natural resources in the area. For example, consideration could be given to adjacent sloping areas, poorly drained soils, sensitive woodlands, and areas with high water tables. Thurow (et al., 1975, pages 13-14) explains that "while the floating buffer approach assures regulatory sensitivity to critical areas... its weakness lies in the investigation and evaluation of such areas... development may or may not be allowed depending upon how the buffer is defined." Thurow recommends that local communities, with limited staff resources, consider a combination of floating and fixed filter strips. Using a combination, regulations could define a minimum fixed boundary that could be adjusted upward depending upon the location of other critical resource areas. In addition, any development abutting a fixed filter boundary could be required by ordinance to submit environmental information about other resources within the parcel. Obviously, when only a segment of a waterbody is within a town's jurisdiction, some regional or integrative approach must be found.
Best management practices for buffers are included in Appendix D.
Vegetative Stream Bank Stabilization. Keown (et al., 1988, as cited by Gray and Leiser, 1982) has identified five processes which contribute to stream bank erosion. These include: toe cutting, bank erosion, bank sloughing (saturated bank slumps), flow slides (liquification of silty or sandy stream bank soils) and piping (seepage of groundwater out of the bank). In young, low order small streams, stream bed erosion will be dominant. In mature, high order streams with high flows, the stream banks are the primary areas of erosion (Gray and Leiser, 1982). In aquatic environments, erosion controls have typically included the use of structural measures i.e., revetments or stone riprap rather than native plants to control erosion (Allen, 1979). In stream side or upland areas cleared of vegetation for construction, natural colonization by pioneer plant species will occur. These species typically belong to the group of plants referred to as grasses and herbs. These non-woody plants aid in the stabilization of the soil substrate and the accumulation of organic matter via reductions in water velocities (Kadlec and Wentz, 1974 in Allen, 1979). The stream side environment has been divided into a series of four plant zones by Scibert (1968). The boundaries of these plant zones are dependent on the slope conditions of the bank, the water regime of the soil, and the depth and velocity of stream flow. A summary of the characteristics of these zones is presented below:
Zone 1 includes the "aquatic zone", which is usually permanently submerged. Plants typical of this zone include the aquatic emergents.
Zone 2 is termed the "reed-bank zone" or "reed-grass zone." This zone is submerged for only 50% of the year and is typified by species of rushes, reed-grasses, and cattails.
Zone 3 is the "shrub zone", "willow" or "soft-wood zone" and is only flooded during average to high water periods. Typical shrub species characteristic of this zone are the shrub willow (white, crack, purple-osier), alders, shrub dogwoods, and viburnums. The shrub zone is particularly important in protecting the "impact bank" on a meander where maximum scour velocity takes place.
CONSTRUCTION-RELATED EROSION AND SEDIMENTATION 103
Zone 4, the final zone, is termed the "tree zone." This area is flooded only during periods of very high water, typically by storms which occur less frequently than that of a 2 year storm event Species of ash, elm, alder, cottonwood, maple and oak typify the zone.
The extensive root growth of all these species, especially trees and shrubs, provide stability to the stream bottom and banks via the high holding capacity of the root masses (Dean, 1979; Seibert, 1968 as cited by Allen, 1979; Department of Environmental Resources [D.E.R.] , 1986). As with other plant species, the stems of the shrubs reduce stream velocities by the friction of water moving around and over the plant stem, thus preventing undercutting of the banks or structures.
The use of native plant species to stabilize upland slopes (Gray, 1977; Gray and Lieser, 1982; Webb and Patrick, 1961) and stream banks and provide filtration of runoff has been successfully applied in New England (Allen, 1979; Jontos and Allan, 1979; C T DEP, 1986). This soil stabilization method covers rapidly, is self sustaining, and requires little to no future maintenance. In the "reed zone", the sod forming pattern of bulrushes, reed canary grass, and common reed (Phrag-miles) are effective stabilizers of stream banks and the draw down zones of reservoirs (USDA, 1972; Kadlec and Wentz, 1977). The layering effect of shrub growth as well as the high regenerative capacity from rhizomes (sucker roots) and stems make these plants resistant to the erosional impacts of ice and water ( C T D E P , 1986). Unlike trees, shrubs tend to resettle after being washed out by stream flows and restabilize the bank (Seibert, 1968).
Site stabilization with vegetation is not without limitation however. Plant species used in the areas that wil l be periodically flooded must be able to survive the period of inundation, near saturated soil conditions, and resist undermining. Species are also subject to burial by the accumulation of silt, debris and leaves (Allen, 1979). Steep bank slopes, greater than 35%, must be regraded. Stream bank slope angles of no greater than 3:1 are recommended. On sandy soil, slope ratios of 4:1 or 5:1 are suggested for greater stability ( C T D E P , 1986). Plant selection must also consider the growth preferences and characteristics of the species and its intended application. Common reed grass (Phragmites) and cattails (Jypha spp), while effective in soil stabilization, are invasive and may exclude planted or native species from colonizing an area and thus limit additional floral diversity. This is also true of some shrub species including Autumn and Russian olive, species of shrub willows, as well as multiflora and wild roses (Keller, 1988). Excessive growth of stabilizing vegetation can also block the flow of runoff in drainage swales resulting in erosion of the sidewalls and siltation of the channels. Mechanical clearing of the channels may not keep up with excessive growth. Keller (1988) has found the use of Rodeo, an herbicide often used around water, to be an effective means of controlling excessive growth.
Trees are extremely effective in stabilizing the shores and banks of water courses but require extended periods of low flow to become established and thus should not be used as the only means of soil stabilization (Allen, 1979; Dean, 1979). Trees are also subject to undercutting from flooding (Sigafoos, 1964). While little quantitative data exists on the accretion or recession of shorelines as a direct function of vegetation, a stable water level wil l permit the establishment of a well developed floral association along the shoreline (Allen, 1979; Paulet, 1972; Boto and Patrick, 1979; Dean, 1979). Gi l l (1970) indicates that the primary causes of shoreline erosion arc wave action and changes in water level. Thus, tree species selection in the draw down zone of a reservoir must be tolerant of infrequent to moderate flooding periods (Silker, 1948).
CARRYING CAPACITY OF PUBLIC WATER SUPPLY WATERSHEDS
5.3.2.2 Non-Structural Erosion Control Methods
Mulches/Netting. Non-structural methods are also referred to as temporary control measures. These measures include the use of organic mulches composed of woodchips, corn stalks, hay, straw, cellulose fiber, chemical mulches, and netting constructed of jute or nylon. These products are considered temporary as they degrade over a relatively short time period, generally two to three months; they are intended to function for only a brief period during the construction process before final stabilization is achieved (Ireland, 1987).
Mulches can be applied by machine or by hand. They can be used individually or in combination to form a mat or blanket constructed of a layer of hay, straw or coconut fiber sandwiched between two layers of netting. On sloped areas or areas of concentrated flow, mulches and blankets are anchored in place to prevent their movement and insure contact with the ground surface. Anchoring methods include the use of nylon netting held in place with wire staples, wooden pegs driven into the ground and strung with twine, chemical tacks of asphalt sprayed onto the surface of the hay or straw, or the use of a disc harrow or track machine with 1 1/2" long cleats on the tracks to punch the hay or straw into the ground surface. Cleat marks must run parallel to the slope contour otherwise rills may develop from cleat tracks running up and down the hill.
Mulches and nettings are applied to exposed soil surfaces and newly seeded surfaces to protect these areas from the erosive forces of rain and surface runoff as well as to maintain soil moisture and temperature conditions that promote seed germination (Jontos et al., 1984). To be effective, mulches must be applied in adequate depths and must be replaced periodically, especially during non-growing seasons. Table 5-4 provides application rates for various organic mulches. One half ton of straw mulch properly applied can reduce soil erosion by 75%, equal to an effectively operating sediment basin (Ireland, 1987). Unlike mats or blankets, netting alone does not control soil moisture or temperature. Blankets of straw or hay with seed mixed in with the fiber may not germinate as effectively as the seed and blanket applied individually. This is attributed to the better seed-soil contact achieved in the latter technique (Bruzzi, 1988). This observation underscores the need for good soil-blanket contact.
Sediment Fences. Sediment fences constructed of hay bales or woven split or spun bound synthetic fabrics are the most widely applied temporary E/S control measures on residential development sites. These measures are typically installed with the contour and perpendicular to the slope. Their principal function is to interrupt surface flows that may be laden with suspended sediment from areas of active construction and soil stock pile areas. Also they function to reduce flow velocities in surface channels. The open weave of the hay bale or fabric reduces the velocity of the surface flow permitting the larger sediments to settle out, while providing physical filtration of the water that passes through the barrier. Fabric silt fences should be rated at 75% sediment removal efficiency (Jankiewicz and Hamilton, 1988).
The principal problem encountered with the application of hay bales or silt fence is their improper installation and maintenance (Ireland, 1987). To be effective, each must be notched 4 to 6 inches into the ground to prevent undercutting. In addition to notching, hay bales must have the ends of the bales butted together to prevent short circuiting. The bales must also be replaced as they deteriorate. A normal period of operation for hay bales is a maximum of 60 days. Silt fence, depending on site conditions and ultraviolet stability can be used for extended periods of time (>3 months) and used over again. When installing hay bales or silt fence in a surface swale it is important to extend the ends of the barrier
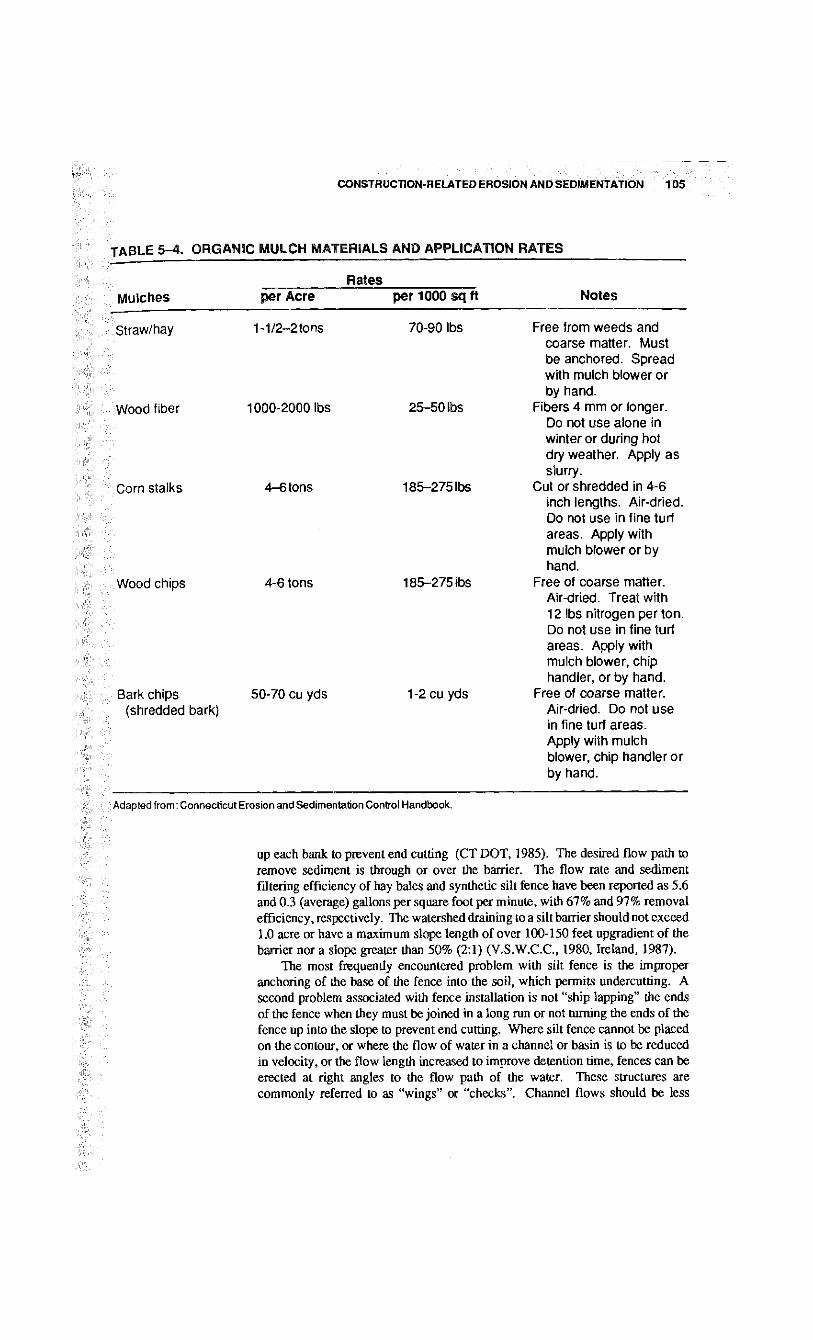
CONSTRUCTION-RELATED EROSION AND SEDIMENTATION 105
TA3L 1 O R G A N I C MULCH MATERIALS AND APPLICATION RATES
Rates Mulches per Acre per 1000 sq ft Notes
St raw hay 1-1/2-2tons 70-90 lbs
Wood fiber 1000-2000 lbs 25-50 lbs
Corn stalks 4-6 tons 185-275 lbs
Wood cnips 4-6 tons 185-275 lbs
B?rk chips 50-70 cu yds (shredded bark)
1-2 cu yds
Free from weeds and coarse matter. Must be anchored. Spread with mulch blower or by hand.
Fibers 4 mm or longer. Do not use alone in winter or during hot dry weather. Apply as slurry.
Cut or shredded in 4-6 inch lengths. Air-dried. Do not use in fine turf areas. Apply with mulch blower or by hand.
Free of coarse matter. Air-dried. Treat with 12 lbs nitrogen per ton. Do not use in fine turf areas. Apply with mulch blower, chip handler, or by hand.
Free of coarse matter. Air-dried. Do not use in fine turf areas. Apply with mulch blower, chip handler or by hand.
Adapiod from Connecticut Erosion and Sedimentation Control Handbook.
up each bank to prevent end cutting ( C T DOT, 1985). The desired flow path to remove sediment is through or over the barrier. The flow rate and sediment filtering efficiency of hay bales and synthetic sill fence have been reported as 5.6 and 0.3 (average) gallons per square foot per minute, with 67% and 97% removal efficiency, respectively. The watershed draining to a silt barrier should not exceed 1.0 acre or have a maximum slope length of over 100-150 feet upgradient of the barrier nor a slope greater than 50% (2:1) (V.S.W.C.C., 1980, Ireland, 1987).
The most frequendy encountered problem with silt fence is the improper anchoring of the base of the fence into the soil, which permits undercutting. A second problem associated with fence installation is not "ship lapping" the ends of the fence when they must be joined in a long run or not turning the ends of the fence up into the slope to prevent end cutting. Where silt fence cannot be placed on the contour, or where the flow of water in a channel or basin is to be reduced in velocity, or the flow length increased to improve detention time, fences can be erected at right angles to the flow path of the water. These structures are commonly referred to as "wings" or "checks". Channel flows should be less
106 CARRYING CAPACITY OF PUBUC WATER SUPPLY WATERSHEDS
than 1 cubic foot per second and the drainage area contributing to the swale should be less than 2 acres (V.S.W.C.C., 1980). Of paramount importance to any temporary control measure is the regular removal of accumulated sediment or the reapplication of the measure as site conditions warrant. Sediment must be removed or new barriers installed when it approaches half the height of the barrier (V.S.W.C.C. , 1980; C T DOT, 1985).
Stone Filters. Stone filters or stone check dams are another frequently used technique to prevent excessively long flows on rough graded roadways. These measures are constructed of 2.5 to 3 inch crushed stone, piled 18-24 inches high and placed on a diagonal across the entire width of the roadway at no more than 80 foot intervals. Stone filters are also placed around catch basins or at the discharge point of a stilling basin. As with silt fences or hay bales, the function of the stone filter is to reduce surface velocities and thus permit the settling of sediments. Stone filters can also incorporate a layer of filter fabric in the stone filter to reduce flows further and cause ponding of water. Personal observations and experience have shown this technique to be very effective in settling out suspended sediment. The hydraulics of the discharge channel must be evaluated to prevent unnecessary bank overflows. The ends and bottom of the fabric must be securely anchored into the stream bottom and banks to prevent undercutting and end cutting of the filter.
5.3.2.3 Structural Measures Associated with Residential Development. Structural measures for the control of erosion and sedimentation on residential developments are typically associated with the construction of the roadways and storm drainage systems. Gravel anti-tracking pads and temporary or permanent stream and wedand crossings are most often used with roadway and driveway development. Rock or grassed lined waterways, catch basins, energy dissipaters, level spreaders and detention/sediment basins are commonly used for storm drainage systems.
Anti-tracking Pads. Anti-tracking pads are intended to control the transport of soil from the construction site onto paved or unimproved roadways. The accumulation of excess soil on the road creates a road hazard. Sediment, as well as nutrients adsorbed on the surface of the soil particles, collect in the storm drainage system and eventually are discharged to an aquatic environment where degradation of the water body and water quality can occur. More than 85% of the phosphorus and greater than 70% of the nitrogen in surface runoff is adsorbed to sediment (Karr and Schlosser, 1977). Phosphorus has been shown to be adsorbed onto the finer soil particles, which are more erodible and subject to greater movement in an aquatic environment (Windham Regional Planning Agency, 1982).
The anti-tracking pad must be placed at the intersection of the road and driveway under construction. The pad should be a minimum of 4 inches thick and constructed of 2.5 to 3 inch crushed stone. Other types of pads can be used but are more elaborate in their construction and are not generally warranted for residential development. The length of the pad wil l vary depending on soil conditions and the length of the access. On sands and gravel a length of 50 feet is recommended. Soils with silts and clays may require a length of 100 feet. I f the length of the accessway is less than the recommended length of the pad than it should be reduced accordingly. The width of the pad should equal the width of the road or driveway entrance/exit (V.W.S.C.C., 1980; Connecticut Council on Soil and Water Conservation [C.C.S.W.C.], 1984). Unless circumstances warrant it, a
CONSTRUCTION-RELATED EROSION AND SEDIMENTATION 107
"wash" to remove sediment from the vehicle's tires is unnecessary. Should one be used however, the runoff should be directed to a sediment trap/ basin or other infiltration device. The trap must be maintained until a binder coat of asphalt is placed. When the stone surface becomes clogged, additional stone must be put down. The stone can be left in place to form a firm roadway base. Daily sweeping of the street intersection is still required, even with an effectively operating anti-tracking pad.
Stream/Wetland Crossing. Stream crossings, either temporary or permanent, represent one of the most significant opportunities for negative impacts on surface water quality as a result of 1) the removal of the stream bank vegetation and subsequent potential for bank erosion, and 2) sediment deposition during crossing construction. Design, placement and sequencing of construction are of equal importance.
Stream or wetland crossings are generally achieved by use of the culvert or a bridge. Culvert pipes are constructed of reinforced concrete (RCP) and corrugated metal pipe (CMP), which may be circular or elliptical in cross section and used as temporary or permanent crossings. Plastic pipe can also be used under some conditions. Each crossing must be designed to accommodate the projected flows from the watershed without causing severe flow backups with bank or channel cutting, which can contribute additional pollutants to the watercourse. A minimum pipe diameter of 15 inches is used. Even if the pipe is partially obstructed by debris or sediment, some flow capacity would be provided. Temporary crossings are generally applied within watersheds of less than one square mile and the pipe is designed to carry flows from a 2 year return frequency storm (C.C.S.W.C., 1984). Depending on the size of the stream and site conditions, fabric silt fence may be used to isolate the areas of bank activity by placing the fence parallel to the bank along the stream center line and tying both ends of the fence back into the bank above and below the crossing. Stream flows are now diverted away from the area of the crossing and filling is contained inside the barrier. Once construction has reached the fence at the center line of the stream and the berm is stabilized, the ends are attached to the opposite bank and the crossing is completed. This diversion and containment technique can also be achieved with other materials i.e. sand bags, wood or plastic flumes with similar results. Securing the bottom of the fabric fence can be difficult and crushed stone or rock is used for this purpose. Care must be taken to properly evaluate channel capacity as streams with constricted flows may be prone to flooding (CT DOT, 1985).
Riprap. Stabilization of the stream banks and the faces of the crossing can be achieved by the placement of crushed stone (riprap) 6 inches or greater in size depending on the flow characteristics of the channel. A layer of engineering fabric may also be placed between the disturbed soil surface and the stone to prevent soil from washing out from behind the stone during periods of peak flow. Structural methods of stabilization require constant upkeep and tend to reduce the degree of revegetation by native species into the area of disturbance as well as detracting from the aesthetic appearances of the site (V.S.W.C.C., 1980; Gray and Lieser, 1982). The combined use of both structures and vegetative measures can be more effective in stabilizing the crossing. Vegetation is self spreading and maintaining, and thus less expensive to maintain. It also provides more reliable and effective protection when native species are used, as well as additional aesthetic appeal and wildlife support (V.S.W.C.C., 1980; Gray and Lieser, 1982; Keller, 1988).
Best management practices for riprap are included in Appendix D.
108 CARRYING CAPACITY OF PUBLIC WATER SUPPLY WATERSHEDS
integrated Measures
Cribs. Other methods of stream bank stabilization that permit the combined use of structural and vegetative measures include: log or concrete cribs, gabions, and concrete grid pavers. These techniques require more planning and greater expense to install. Log or concrete cribs are usually built on the outside of the stream curve to armor the bank. Once installed, the cribs are filled with soil and crushed stone. The bays between the horizontal members and the top surface of the crib can then be planted or allowed to become vegetated by natural colonization. Willow and shrub dogwood species have been successfully used in association with cribs.
Cribs are economical to use and do not require skilled labor to install. A crib with live plants wil l provide a more stable structure than a crib alone. Crib structures can be used in fast flowing streams (>5 feet/second). The principal drawback to crib construction is access to materials and the site. Where a stream is naturally eroding, the crib will be undercut even if keyed into the stream bottom ( C T DEP, 1986; Gray and Leiser, 1982).
Gabions. Gabions are wire baskets that are put in place then filled with stones to form a wall or mattress. While they are used to stabilize stream banks in a fashion similar to cribs, they can also be used for stabilization of upland slopes. In urbanized areas, gabions have been used to create overhangs in the stream to improve fish habitat. Design assistance is readily available from the supplier. Gabions, like cribs, are economical and do not require skilled labor to install; however, they are labor intensive. Cuttings of shrub willows or other shrub species can be planted between the rows of gabions. The basal ends of the cuttings must penetrate into the soil behind the gabion. A vegetative cover can also soften the "engineered" appearance of the structure and provides additional durability ( C T DEP, 1986; Gray and Leiser, 1982). Walls over two tiers high should be designed by a professional engineer. Planting of the gabions or the crib walls is best done in the spring and fall when soil moisture is elevated. Low growing shrubs and vines are most appropriate for gabions or cribs.
Gr id Pavers. Grid pavers, or revetments, resemble an inverted egg carton or waffle iron with the depressions left open. They are supplied as individual blocks of variable dimension that interlock, or in units laid on a strip of engineering fabric. While some types of grid pavers can be manually installed, others require a crane to place them. Grid pavers can be made of concrete, brick or granite. Spaces between the units can be filled with stone (Crafton, 1987). To prevent soil from washing out from behind the units, a layer of filter cloth should be placed between the unit and existing grade. They can be used on steep slopes in upland or stream side applications, or used to pave emergency roadways. Grid pavers can be plowed if the snow plow blade is set high enough so as not to remove the units. The units protect the face of the slope from erosion and permit the establishment of vegetation in the open voids which are filled with soil. The major drawback to their use is the edge of the structure. This area is most susceptible to scouring and undermining. Loss of a block exposes the entire revetment to loss. To prevent this, the ends of the revetment should be riprapped (Gray and Leiser, 1982).
Surface Swales. Grass or rock lined waterways are used to direct concentrated surface flows without unnecessary erosion of exposed soil surfaces. The use of grassed lined waterways are applied to watersheds of less than 200 acres and a return storm frequency of 10 years. The maximum velocity of water flowing in the waterway is vegetation dependent, but is generally kept below 5 feet per
CONSTRUCTION-RELATED EROSION AND SEDIMENTATION 109
second. Prior to their use, waterway vegetation must be well established. I f the grassed appearance is to be maintained, the waterway must be mowed at least once per year to prevent the invasion of woody species. The Erosion and Sediment Control Guidelines cited should be consulted for swale design and proper seed selection. Best management practices for grassed waterways are included in Appendix D .
Catch Basins. Catch basins are an integral part of any stormwater management system, collecting surface runoff and redirecting flows to detention basins or discharge points. Catch basins provided with sumps work as effective sediment traps especially on the coarse grained particles (greater than 246 microns) contained in stormwater runoff (Sartor and Boyd, 1972). Approximately 60% of the total available sump storage volume is used to detain a stable volume of sediment. Hoods on catch basin oudets have also been used to reduce turbulence and improve settling in the basin (Chrusciel, 1987; Pitt, 1985). Catch basins are less effective in removing the fine grained sediments, with which pollutants are generally associated. In urban areas cleaning of the basin sumps twice annually can reduce lead and total suspended solids concentrations in urban runoff by 10 to 25 percenL Reductions of 5 to 10% can be expected for chemical oxygen demand (COD), phosphorus, nitrogen, and zinc by two annual cleanings (Pitt, 1985).
During roadway construction, the catch basins can be used to trap sediment laden runoff flows from roughed-in right-of-ways by wrapping the basin with silt fence, gravel (1-2 inch crushed stone) or hay bales. These controls can be used in conjunction with interceptor dikes (check dams) constructed of crushed stone or compacted earth to direct surface flows to the basin and filter the runoff prior to entry into the storm drainage system. When catch basins are placed in a swale, fabric fence should be placed across the flow path of the swale above and below the basin. Basins should only be encircled with fabric when the basin receives flow from all sides, otherwise erosion and sedimentation may result (CT DOT, 1985). Aldrich (1988) has reported significant reductions in sediment loads reaching catch basins by using grassed lined swales (planted with SCS waterway mix) in parking lot islands to direct flow to catch basins placed in the islands.
Catch basins are also discussed in section 3.10.2.
Energy Dissipaters. The principal use of energy dissipaters is to reduce the velocity of water runoff, and thus reduce its potential for erosion (scour) of surface channels. Dissipaters can be constructed of crushed stone (1-1/4 to 3 inch), modified riprap (6 inch), hay bales or silt fence barriers. Stone dikes placed in a stream to retard flow and trap sediment should not exceed 1/3 the depth of the channel or a two feet maximum height. The ends of the dike should be at least 0.5 feet higher than the central flow line of the dike (CT DOT, 1985; V .E .S .C .C . , 1980). Stone riprap placed in the bottom of channel, lying perpendicular to the flow and partially up the sides of the channel, can also be used as an energy dissipater for discharge points of the stormwater system or to reduce long reaches in the channel. Shallow plunge pools may also be constructed at the discharge point in association with the stone lined swale. Stone size must be matched to projected channel flows. Sediment removal is generally limited to the larger soil particles. Fines (silts and clays) are not effectively removed by riprap. A principal drawback to the use of large stones is the labor intensive removal of accumulated sediment from between the stones. A vacuum truck with proper inlet nozzle may be effective in removing the sediment from between the stones.
Hay or straw bales may also be placed in the swale to diminish flow velocities. As cited above, installation is critical and labor intensive. The stock piling of hay bales may create a fire hazard from vandals or spontaneous combustion as well as
0 CARRYING CAPACITY Of PUBLIC WATER SUPPLY WATERSHEDS
a habitat for rodents which may not be desirable in a residential environment (CT DOT, 1985).
Level Spreader/Infiltration Trenches. Level spreaders are an effective method of intercepting concentrated surface runoff from dikes or cross checks to reduce their velocity and uniformly spread the runoff over a stabilized area. Level spreaders are excavated on undisturbed ground. The bottom of the " V " shaped cross section of the spreader is at least 0.5 feet below existing grade. The side walls are sloped at 2:1 and the top width is 6 feet (minimum) (C.C.S.W.C., 1985; V.E .S .C .C . , 1980). While these structures are easy to install, it is imperative that the lower lip of the spreader be level, otherwise flows will concentrate in the low points and cause rill erosion. As sediment accumulates in the bottom of the spreader there will be a reduction in its storage capacity thus, the effectiveness of the spreader will be diminished.
Infiltration trenches have been constructed in the bottom of level spreaders to induce groundwater recharge via infiltration. Infiltration enhances water quality through soil filtration and can provide for detention of post development increases in runoff from individual residential building lots (Shaver, 1987). Other types of infiltration devices include: dry wells, detention basins in porous soils, concrete galleries, vegetated swales with check dams and vegetative filter strips. Critical design considerations on selecting the type of infiltration methods include: texture characteristics of the soil strata, seasonal ground water elevation, and depth to bedrock. Shaver (1987) cites a minimum infiltration rate (permeability of the subsoil) of 0.17 inches per hour, while Crafton (1987) cites infiltration rates for soils in hydrologic group " A " and " B " at 0.5 inches per hour, and 0.27 inches per hour for group " C " soils. Infiltration devices should be designed to accept the first 0.5 inch of runoff from impervious areas, since this first flush contains a majority of the pollutants. Maximum ponding time for surface structures should not exceed 72 hours; 24 hours for vegetated swales. The bottom of subsurface structures should be set 2-4 feet above maximum seasonal groundwater elevations to insure the availability of storage and prevent the migration of pollutants in a saturated soil matrix. Infiltration devices should not be used on slopes exceeding 20% (Shaver, 1987) or 5% for porous pavements. To avoid the potential for basement flooding, the infiltration devices should be set a minimum of 10 feet down gradient from the structure. Infiltration trenches have been designed of either 1 1/4 inch crushed stone wrapped in engineering fabric to prevent clogging, or large diameter perforated flexible pipe sleeved in engineering fabric and backfilled with or without the use of an aggregate. The void spaces between the stone and the interior of the pipe provide storage during the runoff event allowing for infiltration of runoff into the soil. When the storage capacity of the infiltration device is exceeded, excess runoff overflows the lower lip of the spreader as sheet flow, thus permitting infiltration into the vegetated soil surface located down gradient. The principal reason for failure of infiltration devices is clogging. The void spaces between the stones and the engineering filter fabric may become coated with sediment, organic matter, or oil/grease. Premature failure is more often the result of improper construction and lack of adequate sediment control leading to reduced storage capacity (Shaver, 1987).
Settling Basins. The primary function of setding basins is the removal of suspended particulate matter from stormwater runoff. The efficiency of the basin to remove suspended soils will be determined by the residency time of flows within the basin and the flow pattern through the basin. These factors are a function of the storm drainage criteria, area of disturbance, duration of the project, erodibility of the soils, slope, vegetation/mulch cover, and the environmental sensitivity of
CONSTRUCTION-RELATED EROSION AND SEDIMENTATION 111
down stream watersheds (Jankiewicz and Hamilton, 1988). The residency time will be a direct function of the volume of the basin and the flow rates entering the basin. Basin effectiveness is generally set at 70% sediment removal for a six month storm. Setting a standard of 80% removal for a 2 year storm doubles the cost of basin construction (Jankiewicz and Hamilton, 1988). The basins may be either temporary or permanent and designed as part of the entire post development stormwater control system. Temporary sediment basins are generally designed for a 10 year return frequency storm and a watershed of less than 150 acres in size. (V.E.S .C.C. , 1980; C.C.S.W.C., 1985). Virginia Guidelines require a sediment basin for disturbed watersheds 5 acres in size. (Jankiewicz and Hamilton, 1988).
Each basin is fitted with a control outiet structure to govern the rate of runoff release. These structures can consist of perforated plastic riser pipes, large corrugated metal risers with anti-vortex devices, a stone/masonry or concrete headwall fitted with a notched weir, a series of pipes of various sizes at different elevations, or a single pipe. Oudet structures must be protected against unauthorized access by children and the clogging of the outlet structure by debris. This is usually accomplished by means of a debris grate. Another important consideration is maintenance of the basin including the removal of debris and accumulated sediment, or structural repairs to the outlet or earthen berm, if one is used. Earthen berms used to create the detention basin must be stabilized with grasses or other herbaceous growth and protected from colonization by trees and muskrats. Both of these organisms will threaten the integrity of the berm by decomposition of the root masses and by burrowing, respectively. Trees can be prevented from developing by annual mowing and muskrats deterred by the use of chicken wire buried 2 to 3 feet below and 5 to 10 feet above the water line.
I f used as a permanent basin, the design of the structure must be based on prevailing design standards of the community, usually zero incremental post development runoff, as well as sound engineering practice. Prevailing design criteria include control of the 2 year through the 100 year return frequency storms. The sediment/detention basin should also be located off any existing watercourse. The placement of the basins within floodways or flood prone areas must be carefully scrutinized before considering such placement.
The effectiveness of small basins can be improved by increasing the flow path of the runoff by the introduction of baffles across the basin, or by placing the basins in tandem, thus providing a varied water regime (Construction Related Activities, Westchester County Environmental Council, 1981; Oberts and Asgood, 1988). In addition to using baffles constructed of earthen berms stabilized by cattails, Aldrich (1988) recommends a 6:1 length to width ratio (minimum) to promote removal of pollutants entering the basins (Daylor and Yonika, 1986). The removal of fine grained organic particles (<100 microns) in suspension can be enhanced by the use of commercially available upflow "inclined tube" settling devices. These structures increased sediment removal rates to an average of 60% for flow rates of 5 gallons per minute and sediment concentrations of 2000 milligrams per liter (Bergstedt et al., 1979).
Basins may be designed to remain ponded for only a short period (<24 hours) after the runoff event or remain permanenUy ponded. Shallow ponded environments are effective in removing dissolved and soluble phosphorus from surface flows via increased detention period, diffused inflow of runoff and exposure of the phosphorus binding sites of the newly exposed basin bottom (Obert and Osgood, 1988). The use of a "forcbay" (an isolated area at the stormwater inlet lined with stone or other material) has been shown to be effective in removing coarse grained sediments and allowing ease of sediment removal (Oberts and Osgood, 1988; Jontos et al., in progress). Lemonde (1987) recommends that the sediment storage volume of the forcbay should not exceed 200 cubic yards. Since this volume is
112 CARRYING CAPACITY OF PUBLIC WATER SUPPLY WATERSHEDS
easily removed every 4-5 years at minimal expense. These same investigators have also found that while narrow wetland environments (swales) are effective in reducing sediment loads, their effectiveness can be enhanced by 1) reducing flow rates to increase detention time 2) altering water levels within the wetland, and 3) by using riprapcd swales instead of culverts to connect pond and wetland systems in tandem.
Both temporary and permanently ponded basins must have access for maintenance. A berm with a 10-15 foot wide top width will provide the needed access for equipment (Lemonde, 1987). With seasonally flooded basins, Chrus-ciel (1987) recommends a 2% pitch across the basin bottom to prevent the bottom of the basin from getting spongy and thus permitting traffic over the bottom for maintenance. With wet basins the water must be removed to clear the sediment. Mosquito breeding may also be reduced by eliminating stagnant pockets within a basin by incorporating a sloped bottom.
I f the basin is to pond water permanentiy it can serve multiple uses. Additional uses include use as a firepond, wildlife habitat, and recreational area for residents (Jontos et al., in progress; Lemonde, 1987). Permanently ponded detention basins can also provide onsite recharge by the use of stone wicks (Koppelman and Tanenbaum, 1982; Jontos and Oley, 1986). Variable depths of the basins provide a greater opportunity for volunteer and introduced plantings to diversify the ecological character of the structure thus promoting habitat diversity. Depths ranging from 2-8 feet with 3:1 slopes or shelves are desirable (Lemonde, 1987; Jontos and Oley 1986; Jontos et al., in progress).
Best management practices for detention basins and sediment traps are included in Appendix D.
5.3.2.4 Integrated Methods. Modification of existing environments to detain surface flows and the creation of environments that do not presendy exist on the site should be given consideration when preparing a stormwater control plan. An example of this is the creation of a shallow marsh/pond system or wet meadow association where groundwater seeps exists on the site at a topographic low point or within a narrow surface swale with little detention capacity (Jontos et al., 1984; Oberts and Osgood, 1988).
I f an existing wetland and/or pond is to be utilized for detention, its character must be evaluated prior to designing the detention structure. Unique or unusual environments or floral associations should not be considered for modification, and every effort should be made not to alter or modify the current site conditions which support these systems. For the purposes of classifying an existing wedand system for use as a possible detention area, the classification system proposed by Anderson (et al., 1978) and presented in Table 5-5 is suggested. This system uses the degree of water table fluctuations during the growing season and the presence of specific plant species to differentiate between five wetland environments. These include: wet meadow, marshes, shrub swamps, woody swamps and open water.
Using topographic data and the post development hydrologic data, the volume of runoff and the duration of ponding can be determined for the basin. Groundwater contributions should also be considered. This information wil l indicate whether a viable pond can be supported by the volume of runoff or i f a seasonal shallow water environment wil l be best suited to the site.
Recommendations for pond development in Connecticut prepared by the SCS using surface runoff water as the primary source of pond water suggests that 1.5 acres of watershed are required to support one acre-foot of water stored (USDA, Farmers Bulletin #2256, 1973). Detention basin design data will determine the area of inundation. Based on this information, the impact on the site's natural
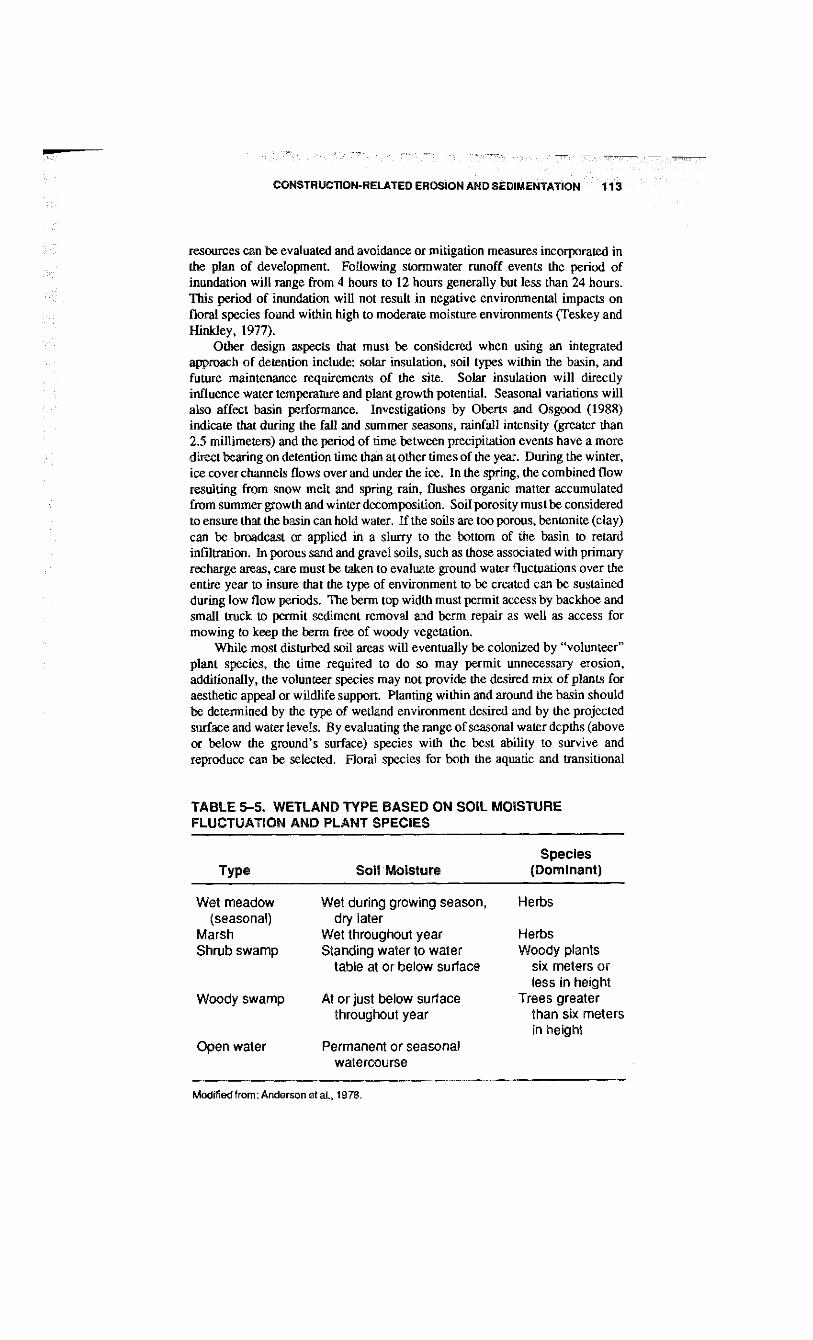
CONSTRUCTION-RELATED EROSION AND SEDIMENTATION 113
resources can be evaluated and avoidance or mitigation measures incorporated in the plan of development. Following stormwater runoff events the period of inundation will range from 4 hours to 12 hours generally but less than 24 hours. This period of inundation wil l not result in negative environmental impacts on floral species found within high to moderate moisture environments (Teskey and Hinkley, 1977).
Other design aspects that must be considered when using an integrated approach of detention include: solar insulation, soil types within the basin, and future maintenance requirements of the site. Solar insulation wil l directly influence water temperature and plant growth potential. Seasonal variations will also affect basin performance. Investigations by Oberts and Osgood (1988) indicate that during the fall and summer seasons, rainfall intensity (greater than 2.5 millimeters) and the period of time between precipitation events have a more direct bearing on detention time than at other times of the year. During the winter, ice cover channels flows over and under the ice. In the spring, the combined flow resulting from snow melt and spring rain, flushes organic matter accumulated from summer growth and winter decomposition. Soil porosity must be considered to ensure that the basin can hold water. I f the soils are too porous, bentonite (clay) can be broadcast or applied in a slurry to the bottom of the basin to retard infiltration. In porous sand and gravel soils, such as those associated with primary recharge areas, care must be taken to evaluate ground water fluctuations over the entire year to insure that the type of environment to be created can be sustained during low flow periods. The berm top width must permit access by backhoe and small truck to permit sediment removal and berm repair as well as access for mowing to keep the berm free of woody vegetation.
While most disturbed soil areas will eventually be colonized by "volunteer" plant species, the time required to do so may permit unnecessary erosion, additionally, the volunteer species may not provide the desired mix of plants for aesthetic appeal or wildlife support. Planting within and around the basin should be determined by the type of wetland environment desired and by the projected surface and water levels. By evaluating the range of seasonal water depths (above or below the ground's surface) species with the best ability to survive and reproduce can be selected. Floral species for both the aquatic and transitional
TABLE 5-5. WETLAND TYPE BASED ON SOIL MOISTURE FLUCTUATION AND PLANT SPECIES
Species Type Soil Moisture (Dominant)
Wet meadow Wet during growing season, Herbs (seasonal) dry later
Marsh Wet throughout year Herbs Shrub swamp Standing water to water Woody plants
table at or below surface six meters or less in height
Woody swamp At or just below surface Trees greater throughout year than six meters
in height Open water Permanent or seasonal
watercourse
Modified from: Anderson et al., 1978.
CAPACITY OF PUBLIC WATER SUPPLY WATERSHEDS
areas between the poorly drained soils and the well drained soils are presented in Table 5-6, Soil moisture is the principal criteria for species selection, with second consideration given to wildlife support function. Other considerations for floral species selection include long term soil stabilization, land use, and future maintenance requirements.
Plan Review and Enforcement
It has been observed by a number of authors that while development of effective erosion and sediment (E/S) control plans are important, their critical review and installation is of greater concern (Felix, 1987; Faber, 1987; Banach, 1987; Dawson, 1987). Llewelyn (1988) points out that strict erosion and sediment control ordinances arc meaningless without enforcement, so that even the poorest ordinance, stricdy enforced, is more beneficial. While education of the plan designers has improved the quality of the plans, review by local agencies composed of volunteer members with limited expertise is a problem. This is due to the turnover of members and the loss of developed expertise (Faber, 1987; Felix, 1987; Dawson, 1987). Even with the assistance of local conservation districts with the review of plans, there exists the problem of plan implementation. The absence of or inconsistent on-site inspection and enforcement of approved erosion and sediment control plans results from an inadequate number of enforcement personnel. Municipalities are either unable or unwilling to provide the funding necessary to enforce the implementation of the plans or to insure that the controls are properly maintained (Faber, 1987; Dawson, 1987; Felix, 1987; Banach, 1987). Due to a lack of staff, a single individual may be required to uphold many enforcement positions. Under expanding development pressures, this results in diminished performance in all enforcement programs.
In an effort to resolve the problem of inadequate enforcement, communities have opted to share personnel. Dawson (1987) recommends that no more than three towns be covered by a single individual. Funding for enforcement personnel has been provided by administrative or technical grants from government agencies or from application fees paid by the developer to the municipality. These fees ($20 to $60 per acre) arc based on the number of acres disturbed, number of dwelling units, duration of the project and attendant site constraints. The use of bonds to cover the cost of E/S plan implementation by the developer is another measure to insure that the plan is installed. Although, the calling of the bond and finding another contractor to install the system can be a time consuming solution, during which the site is subject to continued erosion.
Enforcement personnel are given the authority to issue "cease and correct" orders in the field where non-compliance with approved E/S plans are observed. Permitting agencies have required regular inspections by the E/S plan designer with the filing of a progress report on plan implementation and changes. Commissions cannot transfer the enforcement powers given them by the State to the consultant and therefore must provide regular on-site inspections to insure compliance. While police powers are an important tool, the need for effective communication between the reviewing agencies, the applicant and the contractor are equally important. Lemonde (1987) and Thompson (1984) suggest that precon-struction meetings between the planning officials, their enforcement personnel, and the contractor are extremely important to effectively implement the plan and provide maintenance.
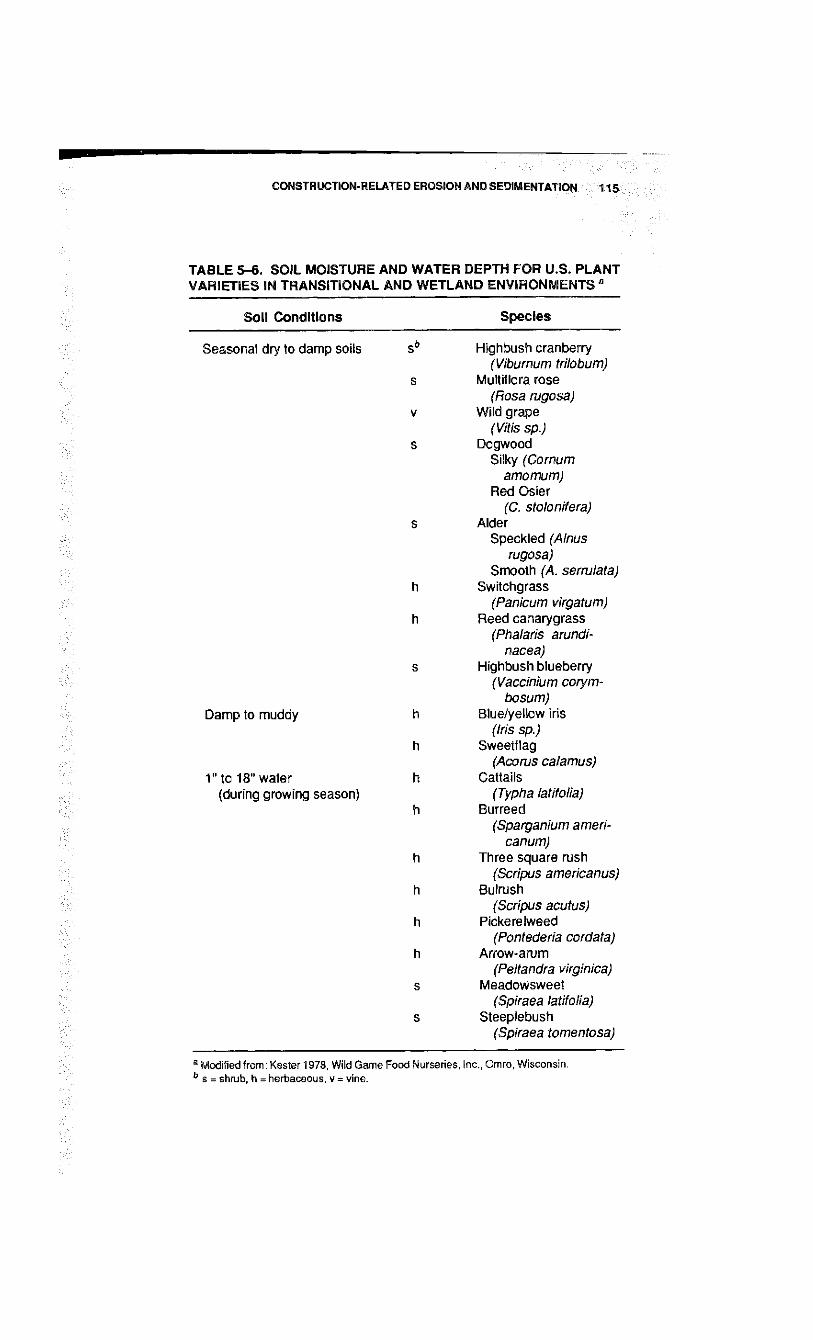
CONSTRUCTION-RELATED EROSION AND SEDIMENTATION 115
T / B L E 5-6. SOIL MOISTURE AND WATER DEPTH FOR U.S. PLANT VARIETIES IN TRANSITIONAL AND WETLAND ENVIRONMENTS "
Soil Conditions Species
Seasonal dry to damp soils sb Highbush cranberry (Viburnum trilobum)
s Multiflora rose (Rosa rugosa)
V Wild grape (Wis sp.)
s Dogwood Silky (Cornum
amomum) Red Osier
(C. stolonifera) s Alder
Speckled (Alnus rugosa)
Smooth (A. serrulata h Switchgrass
(Panicum virgatum) h Reed canarygrass
(Phalaris arundi-nacea)
s Highbush blueberry (Vaccinium corym-
bosum) Damp to muddy h Blue/yellow iris
(Iris sp.) h Sweetflag
(Acorns calamus) 1" to 18" water h Cattails
(during growing season) (Typha latifolia) h Burreed
(Sparganium ameri-canum)
h Three square rush (Scripus americanus)
h Bulrush (Scripus acutus)
h Pickerelweed (Pontederia cordata)
h Arrow-arum (Peltandra virginica)
s Meadowsweet (Spiraea latifolia)
s Steeplebush (Spiraea tomentosa)
a Modified from: Kester 1978, Wild Game Food Nurseries, Inc., Omro, Wisconsin. - 3 = shrub, h = herbaceous, v = vine.
116 CARRYING CAPACITY OF PUBLIC WATER SUPPLY WATERSHEDS
5.4 R E F E R E N C E S CITED
Aldrich, R . 1988. Nonpoint pollution management and institutional cooperation. A paper presented at the International Symposium on Lake and Watershed Management Nov. 15-18,1988. North American Lake Management Society. St. Louis, MO.
Allen, H . 1979. Role of wetland plants in erosion control of riparian shorelines. In Wetland Functions and Values: The State of Our Understanding. Proceedings of the National Symposium on Wetlands. P.Grccson; J.R. Clark; and J . E . Clark (eds.) American Water Resources Association. Minneapolis, M N
Alonso, C.V.; J.R. McHenry; and J.C.S. Hong. 1975. The Influence of suspended sediment on the reaeration of uniform streams. Water Resources, vol 9 (8).
Anderson, P.H.; M.W. Lefor, and W.C. Kcnnard. 1978. Transition Zones of Forested Inland Wetlands in Northeastern Connecticut. University of Connecticut. Storrs, C T . Rpt. 29.
Bailey, R.W. and O.L. Copeland. 1961. Vegetation and Engineering Structures in Flood and Erosion Control. USDA. Intermountain Forest and Range Experiment Station. Ogden, U T .
Banach, M. 1987. Implementation of sediment and erosion control programs: Connecticut In Proceedings of the Soil and Water Management Conference. Southern New England Chapter, Soil Conservation Society of America (eds).
Bergstedt, L . M . ; J.M. Wetzel; and J .A. Cardie. 1979. Laboratory Evaluation of Methods to Separate Fine Grained Sediment From Stormwater. U.S.EPA. EPA-600/2-79-076.
Boto, K . G . and W.W.H. Patrick, 1979. Role of wetlands in the removal of suspended sediments. In Wetiand Functions and Values: The State of Our Understanding. In Proceedings of the National Symposium on Wetlands. P.Grccson; J .R. Clark; and J . E . Clark, (eds), American Water Resources Association. Minneapolis, MN.
Bruzzi, L . 1988. Connecticut Landscaping, personal communication. Christensen, P. 1984. Developing a sediment and erosion control plan. In
Proceedings of Seminar on Sedimentation and Erosion Control. Land-Tech Consultants and C T Association of Soil and Water Conservation Districts (eds). Storrs, C T .
Chrusciel, R . 1987. Retention and detention basin design. In Proceedings of the Soil and Water Management Conference. Southern New England Chapter, Soil Conservation Society of America.
Clark, E . 1985. The ojfsite costs of soil erosion. Journal of Soil and Water Conservation, vol 40.
Connecticut Council of Soil and Water Conservation. 1984. Connecticut Guidelines for Soil Erosion and Sediment Control. C T D.E.P., Hartford, C T .
Connecticut D.E.P. 1988. Water Quality Report to Congress. C T D . E . P , Water Compliance Unit.
Connecticut D.E.P. 1986. A Watershed Management Guide for Connecticut Lakes. C T Department of Environmental Protection. Hartford, C T .
Connecticut D.O.T. 1985. Onsite Erosion and Sediment Control for Construction Activities. C T D.O.T , Office of Environmental Planning.
Crafton, C. 1987. Sediment and erosion control plans. In Proceedings of the Soil and Water Management Conference. Southern New England Chapter, Soil Conservation Society of America (eds).
Dawson, A . 1987. Role of volunteer boards in environmental regulations. In Proceedings: Soil and Water Management Conference. Southern New England Chapter, Soil Conservation Society of America (eds).
Daylor, R . , and D. Yonika. 1986. Wetland creation in the northeast. Jn Develop-
CONSTRUCTION-RELATED EROSION AND SEDIMENTATION 117
merit. Restoration and Management of Inland Wedands Workshop. Society of Wetland Scientists, North Atlantic Chapter.
Dean, R . G . 1979. The effects of vegetation on shoreline erosional process. In Wetland Functions and Values: The State of Our Understanding. In Proceedings of the National Symposium on Wetlands. P. Greeson; J .R. Clark; and J . E . Clark, (eds), American Water Resources Association. Minneapolis, MN.
Dennis, J . 1968. Phosphorus export from a low density residential watershed and an adjacent forested watershed. In Lake and Watershed Management Vol . I I . Proceedings from the 5* Annual International Symposium. G. Redfield; J .F . Taggart; and L . M . Moore (eds.). North American Lake Management Society. Geneva, W I .
Department of Environmental Resources. 1986. A Streambank Stabilization and Management Guide for Pennsylvania Landowners. Commonwealth of PA, Division of Scenic Rivers. Harrisburg, PA.
Ellison, W. 1948. Erosion by raindrops. Scientific American. August. Faber, P. 1987. Review of sediment and erosion control programs in Connecticut.
In Proceedings of the Soil and Water Management Conference. Southern New England Chapter, Soil Conservation Society of America (eds).
Felix, J . 1987. Review of sediment erosion control programs in Massachusetts. In Proceedings of the Soil and Water Management Conference Southern New England Chapter, Soil Conservation Society of America (eds).
Gi l l , C .J . 1970. The flooding tolerance of woody species—a review. Forestry Abstracts, vol. 31 (4).
Goyette, J .F . (ed.) 1985. On-Site Erosion and Sedimentation Control for Construction Activities. C T Department of Transportation. Wcthersfield, C T .
Gray, D.H. 1977. The influence of vegetation on slope processes in the Great Lakes region. In Proceedings of the Workshop on Vegetation in Stabilization of the Great Lakes Shoreline. Great Lakes Basin Commission, Ann Arbor, M I .
Gray, D.H. and A . T . Leiser. 1982 Biotechnical Slope Protection and Erosion Control. Van Nostrand Reinhold Company. New York, N Y .
Guy, H . and G .E . Ferguson. 1970. Stream sediment: an environmental problem. Journal Soil and Water Conservation, vol. 25.
Hoffman, G.R. 1977. Artificial establishment of vegetation and effects of fertilizer along shorelines of Lake Oahe and Sakakawea mainstream Missouri river reservoirs. In Proceedings of the Workshop on Vegetation in Stabilization of the Great Lakes Shoreline. Great Lakes Basin Commission. Ann Arbor, MI .
Ireland, W. 1987. Erosion control measures. In Proceedings of the Soil and Water Management Conference. Southern New England Chapter, Soil Conservation Society of America.
Jankiewicz, E . and W. Hamilton. 1988. Analysis of erosion and sediment control. Public Works Magazine, December.
Jontos, R. et al. (in progress) Plant and Animal Colonization of Wedands Created for Stormwater Management. Land-Tech Consultants, Inc. Ridgefield, CT .
Jontos, R. , A. Bruzzi and L . Bruzzi. 1984. The use of hydro-seeding/chemical mulches for soil stabilization. In Proceedings of a Seminar on Sedimentation and Erosion Control. Land-Tech Consultants and the Connecticut Association of Soil and Water Conservation District. Storrs, C T .
Jontos, R . and R . Oley. 1986. Engineering and Environmental Evaluation Prepared for Pheasant Hi l l Subdivision, Weston, CT . Land-Tech Consultants. Ridgefield, C T .
Jontos, R J . and C P . Allan. 1979. The use of vegetation for non-structural sediment control. Public Works Magazine, vol. 115 (3).
118 CARRYING CAPACITY OF PUBLIC WATER SUPPLY WATERSHEDS
Jontos, R J . and C P . Allan. 1986 The Application of natural systems to protect aquatic environments. In The Aquatic Environment: Problems and Perspectives Vol I . Fairfield University. Fairfield, C T
Kadlec, J .A. and W.A. Wentz. 1974. State-of-the-Art Survey and Evaluation of Marsh Plant Establishment Techniques: Induced and Natural U S Army Engineer Waterways Experiment Station, Vicksburg MS. vol. 1, rpt D-74-9.
Karr J .R. and I J . Schlosscr. 1977. Impact of Nearstream Vegetation and Stream Morphology on Water Quality and Stream Biota. U.S. Environmental Protection Agency. Athens, GA.
Keller, H . 1988. Herbicidal control of brush helps drainage ditches. Public Works Magazine, December.
Keown et al. 1988. Literature Survey and Preliminary Evaluation of Streambank Protection Methods. US Army Waterways Experiment Station, Vicksburg, MS. rpt H-77-9.
Kester Wild Game Food Nurseries, Inc. 1978. (Promotional information pamphlets).
Koppelman, L . E . and E . Tanenbaum. 1982. The Long Island Segment of the Nationwide Urban Runoff Program. Long Island Regional Planning Board. Hauppauge, N Y .
Lee, C.R.; R . E . Hoeppel; P.G. Hunt; and C.A. Carlson. 1976. Feasibility of the Functional Use of Vegetation to Filter, Dewater and Remove Contaminants from Dredge Spoil Material. US Army Waterways Experiment Station, Vicksburg, MS. rpt. D-76-4.
LeMonde, A. 1987. Installation and maintenance of stormwater management basins. In Proceedings of the Soil and Water Management Conference. Southern New England Chapter, Soil Conservation Society of America.
Leopold, L . 1968. Hydrology for Urban Planning—A Guidebook on the Hydro-logic Effect of Urban Land Use. U.S. Department of the Interior, Geological Survey. Washington, D.C. cir. 554.
Levine D.P; C . Dauchy; D. McCluskey; LPetry; and S. Richards. 1974. Evaluation of Inland Wetlands and Water Course Functions. Connecticut Inland Wetlands Project, Department of Environmental Protection. Hartford, C T .
Llewelyn, M. 1988. Wisconsin's Nonpoint Source Program. A paper presented at The International Symposium on Lake and Watershed Management, Nov. 15-18, 1988. North American Lake Management Society. St. Louis, MO.
Nowak, P J . 1988. The cost of excessive soil erosion.. Journal Soil and Water Conservation, vol. 43 (4).
Oberts, G .L . and R .A . Osgood. 1988. The Water Quality Effectiveness of a Detention/Wetiand Treatment System and Its Effect on an Urban Lake. A paper presented at The International Symposium on Lake and Watershed Management, Nov. 15-18, 1988. North American Lake Management Society. St. Louis, MO.
Pauiet, M.; H . Konke; and L . Lund. 1972. An interpretation of reservoir sediment: effect on watershed characteristics. Journal of Environmental Quality, vol. 1 (2).
Pitt, R . 1985. Characterizing and Controlling Urban Runoff Through Street Cleaning. E P A Project Summary 600/52-85-038.
Sartor, J .D. and G.B . Boyd. 1972. Water Pollution Aspects of Street Surface Contaminants. National Technical Information Service, Springfield, V A .
Schwab, G. ; et. al. 1966. Soil and Water Conservation Engineering. John Wiley and Son. New York, N Y .
Seibert, P. 1968. Importance of natural vegetation for the protection of banks of streams, rivers and canals. In Freshwater Council of Europe, New York, pp. 35-67.
CONSTRUCTION-RELATED EROSION AND SEDIMENTATION 119
Shaver, E . 1987. Infiltration as a stormwater management component. In Proceedings of the Soil and Water Management Conference Southern New England Chapter, Soil Conservation Society of America.
Sigafoos, R .S . 1964. Botanical Evidence of Floods and Flood Plain Deposition, Vegetation and Hydrologic Phenomena. US Geological Survey, paper 485-A.
Silker, T . H . 1948. Planting of water-tolerant trees along margins offluctuating-level reservoirs. Iowa State Journal of Science vol. 23.
Soil and Water Conservation Committee of Georgia. 1979. Onsite Erosion Control, Management Practices for Construction Activities. Soil and Water Conservation Committee, G A .
Tcskey, R.O. and T.M. Hinckley. 1977. Impact of Water Level Changes on Woody Riparian and Wetland Communities. U.S. Department of the Interior, Fish and Wildlife Service. Washington, D.C.
Thompson, D. 1984. Erosion and sediment control on construction sites. In Proceedings of Seminar on Sedimentation and Erosion Control Land-Tech Consultants and C T Association of Soil and Water Conservation District, Storrs, C T .
Thurow, et al. 1975. Performance Controls for Sensitive Lands. U.S. Environmental Protection Agency.
U.S. Department of Agriculture. 1973. Farmer's Bulletin #2256. U.S. Department of Agriculture. 1977. Woodlands of the Northeast, Erosion and
Sediment Control Guidelines. USDA, SCS, National Forest Service, US Government Printing Office. Washington, D.C.
U.S. Department of Agriculture. 1985. Technical Guide. SCS Section I V , US Government Printing Office. Washington, D.C.
U.S. Environmental Protection Agency. 1973. Comparative Costs of Erosion and Sediment Control Construction Activities. US EPA. Washington, D.C. E P A -430/973016.
U.S. Department of Housing and Urban Development. 1970. Proceedings of the National Conference on Sediment Control. Washington, D.C.
Virginia Soil and Water Conservation Commission. 1985. Virginia Erosion and Sediment Control Handbook, 2nd ed. Richmond, V A .
Webb, W . L . and E . F . Patrick. 1961. Seeding herbaceous perennials in forest areas for game,food and erosion control. New York Fish and Game Journal. vol 8 (1).
Westchester County Environmental Management Council. 1981. Construction Related Activities, Westchester County, New York—Best Management Practices Manual Series. Westchester County Environmental Management Council . White Plains, N Y .
Wilber, C . 1969. Siltation. In The Biological Aspects of Water Pollution. Windham Regional Planning Agency. 1982. Lake Management Handbook: A
Guide to Quantifying Phosphorus Inputs to Lakes. Windham Regional Planning Agency. Willimantic C T .
Woodward, S.E. 1988. The effectiveness of buffer strips to protect water quality. A paper presented at The International Symposium on Lake and Watershed Management, Nov. 15-18, 1988. North American Lake Management Society. St. Louis, MO.
6.0 Groundwater Contamination Associated With Residential Development
Section 1.3 introduced the importance of groundwater. Groundwater is a vast resource; its volume is estimated at about 50 times the annual flow of all surface water (Council of Environmental Quality, 1981). The quality and quantity of groundwater and surface water are so interdependent, that they can not be managed separately (Council on Environmental Quality, 1981; Melvin, et al., 1987). While Handman (et al., 1979) states that overall, Connecticut's groundwater quality is good to excellent, groundwater contamination is widespread; public or private wells have been contaminated in 116 towns in the State (Meotti and Luby, 1988). Harrison and Dickinson (1984, page 2-2) explain that, "the contamination of concern is that which results from persistent, toxic or hazardous, organic and inorganic material which can in very low quantities render water non-potable by existing regulatory standards." The C T D.E.P. (1988) lists improved management of groundwater resources as one of the priority issues facing the State's Water Quality Management Program.
Road de-icing salts have been identified as a significant source of groundwater contamination. The reader is referred to section 3.6 of this report for a discussion of salt and its potential impacts. Section 4.3 includes a discussion of the impacts of leaking underground fuel storage tanks. Under most conditions, on-site sewage disposal systems provide excellent treatment of household wastes as long as the systems are properly designed, installed and maintained. However, the introduction of household hazardous wastes into septic systems may contribute to groundwater degradation. What follows is a review of some basic principles of groundwater in Connecticut, sources of pollutants, and methods to protect groundwater.
For discussion of other related topics the reader is referred to the sections cited below: the impacts of sewage disposal systems on groundwater are discussed in section 2.0 of this report; household hazardous wastes are discussed in section 4.4; fertilizer and pesticide use associated with residential development are discussed in sections 4.1 and 4.2 respectively; finally, recent legislation pertaining to the protection of Connecticut's groundwater is reviewed in section 1.3.
6.1 B A C K G R O U N D INFORMATION
The process by which water enters groundwater is known as "recharge". Precipitation is the major source of groundwater recharge in Connecticut (Hand-man et al., 1979; Handman and Bingham, 1980). Annual precipitation in
122 CARRYING CAPACITY OF PUBUC WATER SUPPLY WATERSHEDS
Connecticut averages 44 to 48 inches and is distributed almost evenly throughout the year (Handman and Bingham, 1980). This is equivalent to about 70 million gallons of water falling on every square mile each month. Nearly half of this precipitation evaporates or is transpired by plants; the rest flows overland into surface water bodies or infiltrates into the ground to become groundwater (Handman and Bingham, 1980). The volume of infiltration wil l vary depending on site characteristics. Levine (et al., 1987) explains that groundwater can be divided into two zones, the saturated zone and the unsaturated zone. Within the unsaturated zone (also called the "vadose" zone), the small spaces and voids within the soil are partially filled with water and partially filled with air. Within the saturated zone, all soil pores are filled with water under hydrostatic pressure. Water can move up or down between these two zones via percolation (gravity flow), evaporation, and capillary action. The movement of groundwater depends on the properties of the soil and geologic material in which it is found (Levine, et al., 1987). Grady and Weaver (1988) state that horizontal flow is determined by the relative altitude of the water table while the rate of movement is determined by hydraulic gradients, hydraulic conductivity, and porosity. The downward movement of water is often obstructed in Connecticut by "hard pan", a dense layer of compacted glacial till resulting from the action of obstructed glacial ice flows (Levine, et al., 1987).
An aquifer can be defined as any geological condition where groundwater can be withdrawn in usable quantities (Meotti and Luby, 1988). Groundwater in Connecticut comes from aquifers composed of unconsolidated sediments (till and stratified drift) or bedrock. Both are described below.
In Connecticut, bedrock aquifers are the primary sources of water for both domestic and commercial users who are not served by public water supplies (Handman et al., 1979; Handman and Bingham, 1980; Meotti and Luby, 1988). In addition, over 1,000 bedrock wells serve as water supply sources for public water systems in the State (Meotti and Luby, 1988). Igneous, metamorphic and sedimentary bedrock are all found in Connecticut. The eastern and western highlands are underlain by crystalline metamorphic bedrock, such as granites, gneisses, and schists. Some weaker limestone and marble deposits occur in the northwest and southwest corners of the State. The central lowlands are composed of sedimentary sandstone and shales with igneous trap rock formed from basalt flows (Hill , et al., 1980; Levine, et al., 1987; Handman, et al., 1979). Crystalline bedrock aquifers are the most extensive in the State and in most places are overlain by a layer of till (Handman and Bingham, 1980). Within bedrock aquifers, water moves through a network of fractures and other large openings. Contaminants can enter along these fractures, especially where the overlying unconsolidated sediments are thin (Handman, et al., 1979; Handman and Bingham, 1980; Levine, et al., 1987). Sawhney and Raabe (1986, page 9) state that a large reduction in the concentration of a pollutant takes a long time and a "complete removal of a body of contaminated water in a bedrock aquifer may require decades or even centuries, depending upon the bedrock characteristics." According to Handman, (et al., 1979, page 9), as water moves through bedrock it is renovated litUe, if at all, so "bacteria and viruses can travel significant distances if they reach the saturated zone in a fractured bedrock aquifer."
Unconsolidated sediments are materials that have been moved by glaciers and subsequendy sorted and deposited either directly from the ice or from glacial meltwater. These sediments overlay bedrock. Major stratified drift aquifers are composed of clay, silt, sand and gravel with a water saturated thickness of ten feet or more (Melvin et al., 1987). These aquifers occur almost exclusively in stream valleys and lowlands within Connecticut Handman (et al., 1979, page 12) states that, "groundwater recharge from precipitation is much greater in stratified drift areas (average 22 inches per year) than in till areas (average 7 inches per year)
GROUNDWATER CONTAMINATION 123
because the surficial materials are more permeable and slopes gentler." Generally, water quality is better in stratified drift aquifers than in bedrock (Meotti and Luby, 1988). The Connecticut Department of Environmental Protection has identified 39 high yield stratified drift aquifers in the State (those with estimated potential yields in excess of 5 million gallons per day) and 120 moderate yield aquifers with yields large enough to serve as local or regional public water supplies (Meotti and Luby, 1988). Meotti and Luby (1988, page 5) go on to state that "there may be aquifers with significant yields not yet identified in the D E P inventory." According to Banach (1988), 8 1 % of community wells in the State are located in stratified drift deposits. However, not all stratified drift aquifers have good water bearing properties. Stratified drift that isn't interbedded with coarse layers makes poor aquifers (Handman, et al., 1987). However, these fine grained stratified drift aquifers are less susceptible to contamination than coarse grained drift because of the lower hydraulic conductivity. Many sources have indicated that Connecticut's stratified drift aquifers are susceptible to contamination (Meotti and Luby, 1988; Harrison and Dickinson, 1984; Banach, 1988; Handman, et al., 1987; Melvin, et al., 1987; Handman and Bingham, 1980; Grady and Weaver, 1988; Sawhney and Raabe, 1986). The reasons for the susceptibility of coarse grained aquifers (as stated by Handman, et al., 1979; Handman and Bingham, 1987) are as follows: (1) a high hydraulic conductivity; (2) shallow depth to the saturated zone; (3) location primarily in or near urban and industrialized areas; (4) hydraulic connections to nearby surface water bodies; (5) and recharge from direct precipitation to adjacent upland areas that flows in groundwater down gradient.
The State of Connecticut has a regime of Groundwater Quality Standards that parallels that for surface waters. Put into use in 1980, Connecticut was the first state in the country to have such a system (Banach, 1988). According to Harrison and Dickinson (1984), 22.0% of the state has a groundwater classification of " G A A " . This includes groundwaters within public water supply watersheds or within the influence of public water supply wells that are presumed suitable for direct human consumption. A groundwater classification of " G A " covers 69.7% of the state. These areas include groundwaters within the area of influence of private and potential public water supply wells that are presumed suitable for direct human consumption.
LI UTANTS: SOURCES AND TYPES
Since 1980, the water supplies of more than 150,000 people in Connecticut have been affected by contaminated groundwater; there have been 1,322 documented incidents of well pollution in the last decade (Meotti and Luby, 1988; C T DEP, 1988). Table 6-1 lists non-point sources and the types of contaminants that are probable groundwater pollutants in Connecticut.
According to the Council of Environmental Quality (1981), contamination of groundwater can come from surface impoundments, land disposal of waste water, septic tanks, municipal landfills, leaks and spills, agriculture, and natural resource extraction. Table 6-2 lists types of contaminants and the number of associated well pollution incidents known in the State.
Grady and Weaver (1988) studied the effects of land use on water quality in stratified drift aquifers within Connecticut. Their study was conducted in the towns of Woodbury, Southbury and Newtown where they felt the degree of development was characteristic of much of the northeastern United States outside of the densely populated urban areas. Grady and Weaver found that median concentrations of most inorganic constituents are greater in groundwater in residential areas
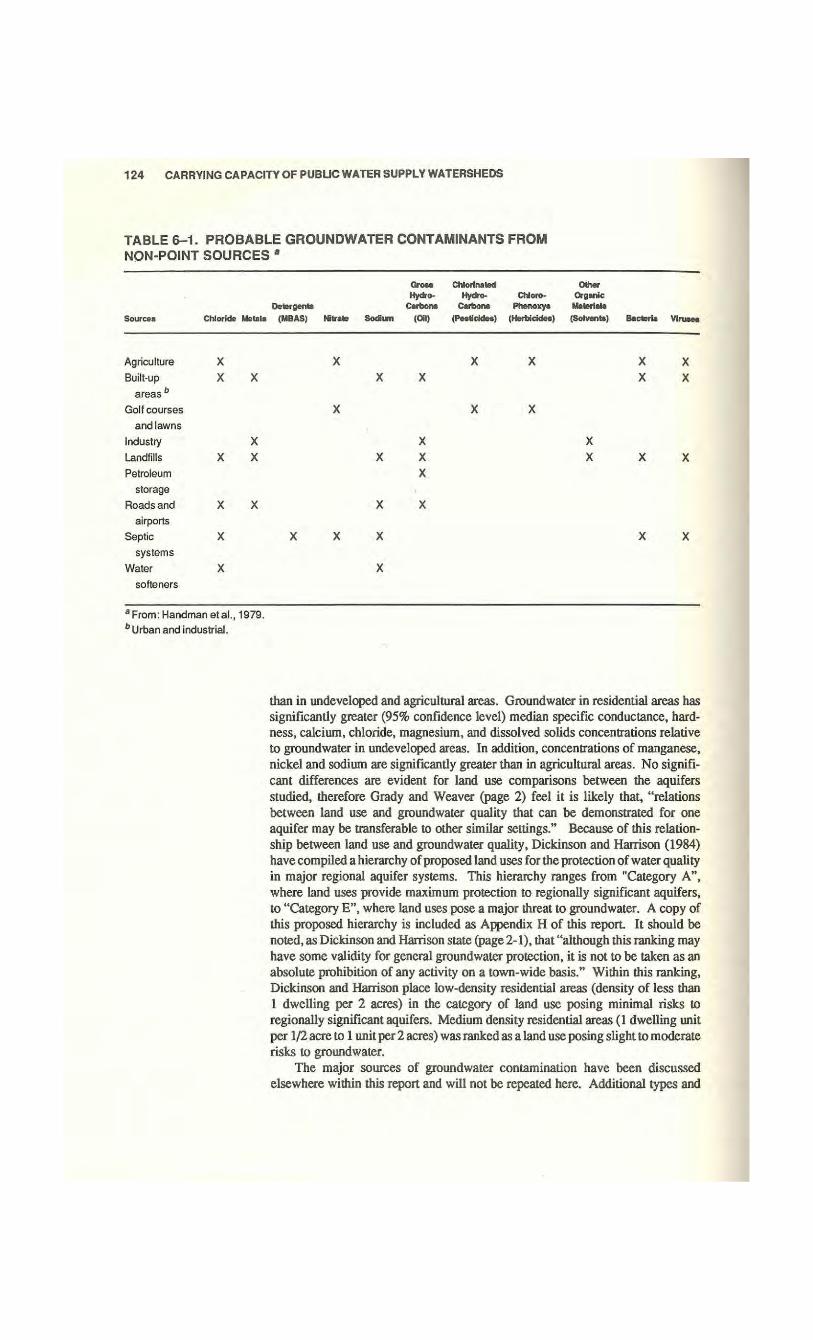
124 CARRYING CAPACITY OF PUBUC WATER SUPPLY WATERSHEDS
TABLE 6-1. PROBABLE GROUNDWATER CONTAMINANTS FROM NON-POINT SOURCES *
Gross Chlorinated Other Hydro- Hydro CMoro- Organic
Detergents Carbons carbons Phenoxys Materials Sources Chloride Metals (MBAS) Nitrate Sodium (Oil) (Pesticides) (Herbicides) (Solvents) Bacteria Viruses
Agriculture X X X X X X Built-up X X X X X X
areas b
Golf courses X y. X and lawns
Industry X }( X Landfills X X X X X X X Petroleum X
storage Roads and X X X X
airports Septic X X X X X X
systems Water X X
softeners
a From: Handman etal., 1979. b Urban and industrial.
than in undeveloped and agricultural areas. Groundwater in residential areas has significantly greater (95% confidence level) median specific conductance, hardness, calcium, chloride, magnesium, and dissolved solids concentrations relative to groundwater in undeveloped areas. In addition, concentrations of manganese, nickel and sodium are significantly greater than in agricultural areas. No significant differences are evident for land use comparisons between the aquifers studied, therefore Grady and Weaver (page 2) feel it is likely that, "relations between land use and groundwater quality that can be demonstrated for one aquifer may be transferable to other similar settings." Because of this relationship between land use and groundwater quality, Dickinson and Harrison (1984) have compiled a hierarchy of proposed land uses for the protection of water quality in major regional aquifer systems. This hierarchy ranges from "Category A " , where land uses provide maximum protection to regionally significant aquifers, to "Category E " , where land uses pose a major threat to groundwater. A copy of this proposed hierarchy is included as Appendix H of this report. It should be noted, as Dickinson and Harrison state (page 2-1), that "although this ranking may have some validity for general groundwater protection, it is not to be taken as an absolute prohibition of any activity on a town-wide basis." Within this ranking, Dickinson and Harrison place low-density residential areas (density of less than 1 dwelling per 2 acres) in the category of land use posing minimal risks to regionally significant aquifers. Medium density residential areas (1 dwelling unit per 1/2 acre to 1 unit per 2 acres) was ranked as a land use posing slight to moderate risks to groundwater.
The major sources of groundwater contamination have been discussed elsewhere within this report and will not be repeated here. Additional types and
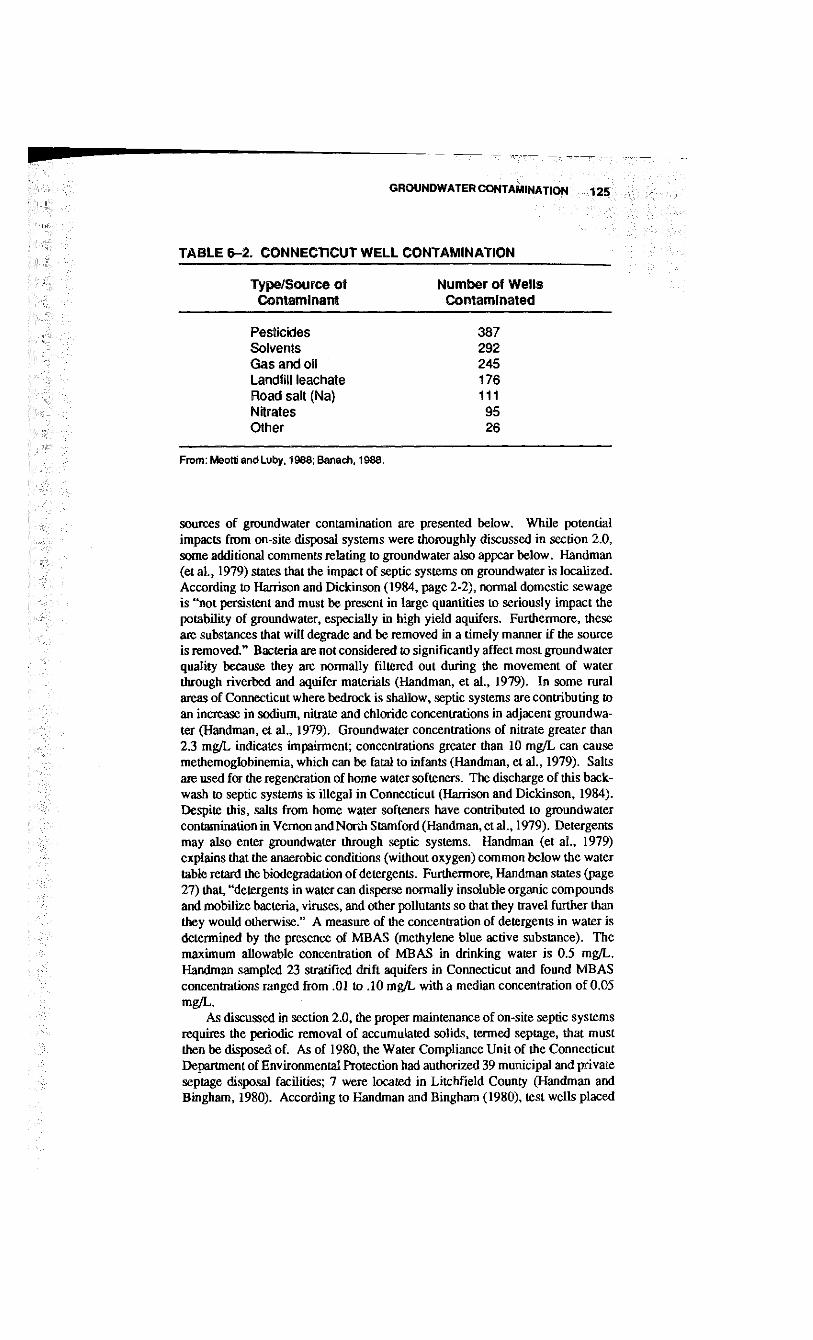
GROUNDWATER CONTAMINATION 125
FABLE 6-2. CONNECTICUT WELL CONTAMINATION
Type/Source of Number of Wells Contaminant Contaminated
Pesticides 387 Solvents 292 Gas and oil 245 Landfill leachate 176 Road salt (Na) 111 Nitrates 95 Other 26
• :rom: Meotti and Luby, 1988; Banach, 1988.
sources of groundwater contamination are presented below. While potential impacts from on-site disposal systems were thoroughly discussed in section 2.0, some additional comments relating to groundwater also appear below. Handman (et al., 1979) states that the impact of septic systems on groundwater is localized. According to Harrison and Dickinson (1984, page 2-2), normal domestic sewage is "not persistent and must be present in large quantities to seriously impact the potability of groundwater, especially in high yield aquifers. Furthermore, these are substances that will degrade and be removed in a timely manner if the source is removed." Bacteria are not considered to significantly affect most groundwater quality because they are normally filtered out during the movement of water through riverbed and aquifer materials (Handman, et al., 1979). In some rural areas of Connecticut where bedrock is shallow, septic systems are contributing to an increase in sodium, nitrate and chloride concentrations in adjacent groundwater (Handman, et al., 1979). Groundwater concentrations of nitrate greater than 2.3 mg/L indicates impairment; concentrations greater than 10 mg/L can cause methemoglobinemia, which can be fatal to infants (Handman, et al., 1979). Salts are used for the regeneration of home water softeners. The discharge of this backwash to septic systems is illegal in Connecticut (Harrison and Dickinson, 1984). Despite this, salts from home water softeners have contributed to groundwater contamination in Vernon and North Stamford (Handman, et al., 1979). Detergents may also enter groundwater through septic systems. Handman (et al., 1979) explains that the anaerobic conditions (without oxygen) common below the water table retard the biodegradation of detergents. Furthermore, Handman states (page 27) that, "detergents in water can disperse normally insoluble organic compounds and mobilize bacteria, viruses, and other pollutants so that they travel further than they would otherwise." A measure of the concentration of detergents in water is determined by the presence of MB AS (methylene blue active substance). The maximum allowable concentration of MB AS in drinking water is 0.5 mg/L. Handman sampled 23 stratified drift aquifers in Connecticut and found M B AS concentrations ranged from .01 to .10 mg/L with a median concentration of 0.05 mg/L.
As discussed in section 2.0, the proper maintenance of on-site septic systems requires the periodic removal of accumulated solids, termed septage, that must then be disposed of. As of 1980, the Water Compliance Unit of the Connecticut Department of Environmental Protection had authorized 39 municipal and private septage disposal facilities; 7 were located in Litchfield County (Handman and Bingham, 1980). According to Handman and Bingham (1980), test wells placed
126 CARRYING CAPACITY OF PUBLIC WATER SUPPLY WATERSHEDS
downgradient from septage disposal facilities in Old Saybrook and Clinton contained water with concentrations of some constituents exceeding Connecticut Department of Health drinking water standards. Elevated concentrations were found of sodium, chloride, manganese, iron, M B AS, dissolved organic carbon, and some trace metals.
Many organic chemicals can have serious and substantial health risks even at concentrations in the low parts per billion or parts per trillion range (Council of Environmental Quality, 1981). The Council of Environmental Quality report states that at higher concentrations, many organic compounds remain tasteless and odorless and cannot be detected without sensitive chemical instrumentation. Grady and Weaver (1988) explain that volatile organic compounds tend to degas when water samples are exposed to the atmosphere, making them difficult to accurately sample. They state (page 21), "there is no generally accepted best method for the collection of volatile species." In addition, there is no data to suggest how two or more organic compounds might interact in contaminated groundwater (Council on Environmental Quality, 1981). A survey of wells by the Connecticut Department of Health Services found that 25% of those tested contained some concentration of volatile synthetic organic chemicals (Harrison and Dickinson, 1984).
When wells remove quantities of water from an aquifer, hydraulically connected surface waters infiltrate down to become groundwater. This induced infiltration can become a nonpoint source of groundwater degradation, i f the nearby surface waters are of poor quality (Council on Environmental Quality, 1981; Handman, et al., 1979; Banach, 1988). Freshwater wetlands in Connecticut are often hydrologically connected to groundwaters (Council on Environmental Quality, 1981), thus, protection of wetlands often helps to preserve groundwater quality. Handman (et al., 1979, page 23) states, "induced recharge commonly provides a considerable part of the yield of large public and industrial wells tapping stratified aquifers." However, induced recharge is a concern not well addressed (Banach, 1988).
When an undeveloped area becomes developed residentially, the increase in population leads to an increase in the demand for local sources of goods and services. As a result, many residential areas of Connecticut contain zones of light industrial and/or commercial development. In their study of land uses over stratified drift aquifers in Connecticut mentioned above, Grady and Weaver (1988) found that industrial/commercial areas had significantly greater groundwater concentrations of the following inorganic constituents than did undeveloped areas: specific conductance, hardness, C 0 2 , calcium, magnesium, chloride, and dissolved solids. They also found that median dissolved solids concentrations in industrial/commercial areas are significantly greater than in agricultural areas; the frequency of arsenic, lead, and lithium detection is significantly greater in groundwater from industrial/commercial areas than for groundwater from one or more of the other land use areas. The on-site storage or disposal of industrial wastes represents another source of groundwater contamination in Connecticut. About 1,000 industrial disposal sites exist statewide; this figure excludes disposal sites abandoned before 1969 (Handman, et al., 1979). From 1955 through 1978, al least 30 reported cases of groundwater contamination occurred as a result of storage or disposal of industrial waste; 21 towns in Connecticut are known to have documented cases of groundwater contamination from these sources. Harrison and Dickinson (1984, page 9) state that "many industrial/commercial establishments have floor drains in their work areas which lead to dry wells. These dry wells then can become a source of groundwater contamination." According to Handman (et al., 1979), actions commonly taken to prevent fires or explosions,
GROUNDWATER CONTAMINATION 127
such as washing down spill sites after accidents, can inadvertently lead to contamination of surface or groundwater.
According to Handman and Bingham (1980), Connecticut generates about 8,000 tons of solid waste per day, based on a rate of 5.3 pounds/per person/per day. The disposal of municipal solid waste in Connecticut is primarily the responsibility of individual towns; landfills are the primary means of disposal (Handman, et al., 1979). However, less than 1% of Connecticut's land surface has been identified for environmentally safe disposal of solid waste (Banach, 1988). As of 1979, the Department of Environmental Protection had authorized 185 active landfills; 24 are known to have degraded groundwater quality (Handman, et al., 1979; Handman and Bingham, 1980). Handman (et al., 1979) states that 80 active landfills are located on stratified drift and another 20 are located in public water supply watersheds.
Handman (et al., 1979, page 38) explains that, "the composition of leachate differs depending on the composition of the wastes, the nature of the cover materials, the landfill design, the amount and source of water, and length of time it is in contact with the wastes." Common organic pollutants detected in landfill leachates include: acetone, benzene, toluene, methyl ethyl ketone ( M E K ) , methyl isobutyl ketone ( M I B K ) , xylenes, aliphatic and aromatic acids, and phenols (Sawhney and Raabe, 1986). Handman and Bingham (1980) state that phenolic compounds include a variety of organic chemicals derived from the breakdown of wood, petroleum products, human and animal wastes, pesticides and others; they may be transported long distances in water. Groundwater near the Bristol landfill was found to contain phenols, as well as cyanide. Sawhney and Raabe (1986) state that toluene, methane, M E K and M I B K were found in landfill leachate and well water from dwellings near the Granby municipal landfill. Handman (et al., 1979) lists bicarbonate, carbonate, sulfate, potassium, calcium, magnesium, chloride, iron, and manganese as the primary inorganic constituents of leachate, while other reported constituents include ammonia, biological and chemical oxygen demand (BOD, COD), cadmium, iron, lead, phosphate, zinc, and dissolved and suspended solids. While the C T DEP requires a minimum distance of 60 inches between the base of landfills and both bedrock and the highest groundwater position, Handman (et a l . , 1979 page 41) states, "there appears to be no reliable method to predict the degree of leachate renovation." Renovation in the unsaturated zone occurs primarily by aerobic biodegradation, filtration, adsorption, ion exchange, and pre-cipitation/complexing of the organic and inorganic chemicals in the leachate (Handman, et al., 1979). Handman explains (page 40) that, "in the saturated zone, the soluble constituents of leachate mix with groundwater and are transported in directions governed largely by the hydraulic gradients. Dispersion, dilution, adsorption, and chemical reactions also control the concentrations of constituents in groundwater. An irregular plume of leachate contaminated groundwater extends down gradient from the disposal site and moves slowly toward the points of groundwater discharge. The plume may also affect a considerable part of an aquifer i f the discharge sites are distant. Furthermore, transport may be so slow that the full impacts on groundwater quality may not be realized for many years. When leachate is detected in a well or in surface waters to which the groundwater is discharging, a substantial volume of contaminated groundwater may exist"
Handman (et al., 1979) states that engineering techniques to control or reduce the effect of landfill leachate on groundwater quality include the use of cover materials that restrict the infiltration of precipitation thereby reducing leachate production, impermeable liners that prevent or restrict leachate movement, and the removal of contaminated groundwater by pumping wells down gradient from a landfill. These techniques can be costly, but they can be effective; capping and
128 CARRYING CAPACITY OF PUBLIC WATER SUPPLY WATERSHEDS
stormwater diversion at the Granby municipal landfill rapidly lowered the concentration of pollutants in monitoring wells (Sawhney and Raabe, 1986).
6.3 GROUNDWATER PROTECTION
Sawhney and Raabe (1986) state that once contaminants enter groundwater they usually move slowly and they may be altered only slightly. The Council on Environmental Quality (1981) reports that groundwater contaminated by toxic organic chemicals may remain polluted for hundreds of thousands of years. Harrison and Dickinson (1984, page 1-20) state that, "studies to determine the source of a contamination problem are costiy, time consuming, and sometimes inconclusive." This view is echoed by Banach (1988), who states that hydroge-ologic studies needed to document contamination are tremendously expensive; costs for "Superfund" sites may be one million dollars per site or more and require years to complete. Banach (1988) adds that remedial action, i f possible, may take 10 to 20 years. According to Sawhney and Raabe (1986), there are no economical methods for decontamination of groundwater aquifers; Harrison and Dickinson (1984) state that full restoration of groundwater quality is seldom achieved. A l l this leads to the obvious conclusion, as stated by the Council on Environmental Quality (1981, page 14), that "prevention of contamination is the key to protection and management of groundwater quality." To prevent contamination, water percolating in a recharge zone must be protected. Human activities and land uses affect the quality of water recharging an aquifer. "It may be necessary to consider the effects of land use not only over the aquifer, but also in adjacent upland areas" (Handman, et al., 1979, page 12).
As Meotti and Luby (1988, page 2) state, "the scientific basis for mapping groundwater supplies is considerably more complex then, for example, the delineation of wetlands." Public Act 88-324, "An Act Requiring Aquifer Mapping," requires the Commissioner of Environmental Protection to establish standards for two levels of modeling and mapping of groundwater resources. (The act is discussed in section 1.3 and a copy of the act is included in this report as Appendix G.) Molz (et al., 1986) describes the inherent bias of commonly used aquifer models: contemporary modeling is built around two dimensional models that average out physical properties over the thickness of the aquifer, failure to account for variations in hydraulic conductivity with depth results in significant variations in groundwater flow and contaminant transport velocities. Despite these biases and limitations, models are being used. For example, one such model, D R A S T I C , presents a simple and easy-to-use approach to assess the groundwater pollution potential of any area (U.S.EPA, 1985). D R A S T I C was designed as a planning or screening tool. The most important mappable factors controlling groundwater pollution potential were determined to be:
D - depth to water table R - recharge (net) A - aquifer media S - soil media T - topography (slope) I - impact of Vadose zone C - conductivity (hydraulic) of the aquifer
The data required to use D R A S T I C is generally available from a variety of sources. The reader is referred to U.S. E P A (1985) for more information on D R A S T I C .
GROUNDWATER CONTAMINATION 129
The Connecticut DEP has devised a groundwater protection planning process for local governments (Connecticut DEP, no date given). The four phases are outlined below:
I . Data Collection and Display (natural features, water quality/quantity/distribution, land useAype/distribution, data)
I I . Evaluation (present groundwater quality/quantity/use) I I I . Protection Goals I V . Implementation/Enforcement Mechanisms (Federal and State programs,
municipal role, management tools, studies)
To obtain background information or assess the degree of groundwater degradation, it is necessary to sample groundwater. This is more involved than sampling of surface waters. Barcelona (et al., 1986) lists the essential elements of groundwater sampling: (1) evaluation of the hydrogeologic setting and program information needs; (2) proper placement and construction of the sampling well; (3) evaluation of the performance of the well and purging strategies; (4) the design and execution of sampling and analytical protocols which entail appropriate selection of sampling mechanisms and materials, as well as sample collection, handling and analysis procedures. Their report includes a flow diagram of groundwater sampling steps and a matrix diagram of sensitive chemical constituents and various sampling mechanisms. According to the Council on Environmental Quality (1981), Connecticut is a leader in various aspects of groundwater quality protection and management. Recent State legislation dealing with groundwater was reviewed in section 1.3 of this report. Federal laws affecting groundwater include: The Clean Water Act; The Safe Drinking Water Act; The Resource Conservation and Recovery Act; The Toxic Substances Control Act; The Federal Insecticide, Fungicide and Rodenticide Act; The Comprehensive Environmental Response, Compensation and Liability Act (Superfund); and the Surface Mining and Reclamation Act.
The Connecticut 208 Aquifer Protection Program was designed to aid towns in implementing local ordinances that would regulate or prohibit land uses which could result in the degradation of critical aquifers; no towns in the Litchfield Hills region participated (Areawide Waste Treatment Management Planning Board, 1980). As of 1983, at least 25 towns in Connecticut had adopted some form of aquifer protection; 21 of these towns were administrating this protection via their Planning and Zoning Commissions (Harrison and Dickinson, 1984). As of 1983, none of the towns in the Litchfield Hills region had adopted any form of aquifer or groundwater protection ordinances. Very few Connecticut towns have adopted ordinances to better protect aquifers from contamination by existing land uses and activities (Harrison and Dickinson, 1984). Information on what municipalities can do to protect their groundwater can be found in Harrison and Dickinson (1984). However, any proposed ordinances or groundwater protection should be based on and follow after, a thorough inventory and understanding of local groundwater resources. As stated above, for many rural towns, private wells in bedrock are a major source of water supply. "Consequently, a stratified drift aquifer protection zoning regulation may have the effect of driving hazardous development (particularly commercial uses) to areas of bedrock water use, where most groundwater users are actually located" (Harrison and Dickinson, 1984, page 18).
130 CARRYING CAPACITY OF PUBUC WATER SUPPLY WATERSHEDS
6.4 REFERENCES CITED
Areawide Waste Treatment Management Planning Board. 1980. Managing Water Quality, 1976-1980, The Connecticut 208 Program. Areawide Waste Treatment Management Planning Board. Middletown, C T .
Banach, F . 1988. Sources and Causes of Groundwater Pollution in Connecticut: A seminar sponsored by the Institute of Water Resources. December 14, 1988, Storrs, C T .
Barcelona, M.J.; J.P. Gibb; J .A. Helfrich; and E . E . Garske. 1986. Practical Guide for Ground-Water Sampling: Project Summary. U.S. EPA, Robert S. Ken-Environmental Research Laboratory. Ada, OK. E P A 600/5285104.
Connecticut D.E.P. 1988. State of Connecticut 1988 Water Quality Report to Congress. C T D.E.P.
Connecticut D.E.P. (no date given). Groundwater: Protecting a Precious Resource. (A series of articles reprinted from "Connecticut Environment", the C T D.E.P. citizens' bulletin).
Council of Environmental Quality. 1981. Contamination of Groundwater by Toxic Organic Chemicals. Council on Environmental Quality.
Grady, S J . and M.F. Weaver. 1988. Preliminary Appraisal of the Effects of Land Use on Water Quality in Stratified-Drift Aquifers in Connecticut. USGS Water Resources Investigations Rpt 87-4005.
Handman, E . H . ; I .G. Grossman; J.W. Bingham; and J . L . Rolston. 1979. Major Sources of Ground-Water Contamination in Connecticut. USGS Water Resources Investigations Open File RpL 79-1069.
Handman. E . H . ; and J.W. Bingham. 1980. Effects of Selected Sources of Contamination on ground-Water Quality at Seven Sites in Connecticut. USGS Water Resources Investigations Open File Rpt 79-1596.
Harrison, E . Z . and M.A. Dickinson. 1984. Protecting Connecticut's Groundwater: A Guide to Groundwater Protection For Local Officials. Connecticut D.E.P.
Hi l l , D .E ; E . H . Sautter; and W.N. Gonick. 1980. Soils of Connecticut. Connecticut Agricultural Experiment Station, Bulletin 787.
Levine, R.; H.D. Luce; R .G. Bartholomew; R .G. Adams; R.F . Jeffrey; and E H . Sautter. 1987. Soils: A Predictor of Potential for Groundwater Contamination From Pesticides. Cooperative Extension, UCONN, UMASS, U R I , Soil Conservation Service.
Melvin, P L . ; S.J. Grady; D.F Healy; and F . Banach. 1987. Connecticut Groundwater Quality. USGS Open file Rpt 87-0717.
Meotti, M.P. and T.S. Luby. 1988. Report of the Aquifer Protection Task Force to the General Assembly. Aquifer Protection Task Force, C T General Assembly.
Molz, F J . ; O. Guven; J .G. Melville; and J .F . Keely. 1986. Peformance and Analysis of Aquifer Tacer Tests with Implications for Contaminant Transport Modeling: Project Summary. U.S. E P A , Robert S. Kerr Environmental Research Laboratory. Ada, OK.
Sawhney, B . L and T .A Raabe. 1986. Groundwater Contamination: Movement of Organic Pollutants in the Granby Landfill. Connecticut Agricultural Experiment Station, Bulletin 833.
United States E P A . 1985. D R A S T I C : A standardized System for Evaluating Groundwater Pollution Potential Using Hydrogeologic Settings. U.S . E P A , Robert S. Kerr Enviromental Research Laboratory, Ada, OK.
Appendixes
Appendix A
Partial Listing of Manufacturers and Distributors of Water
Conservation Products
From Water Efficient Technologies For the Urban / Residential Sector:
Reprinted by permission and available from the
Rocky Mountain Institute 1739 Snowmass Creek Road Snowmass, CO 81654-9199
(303)927-3851 or 3128
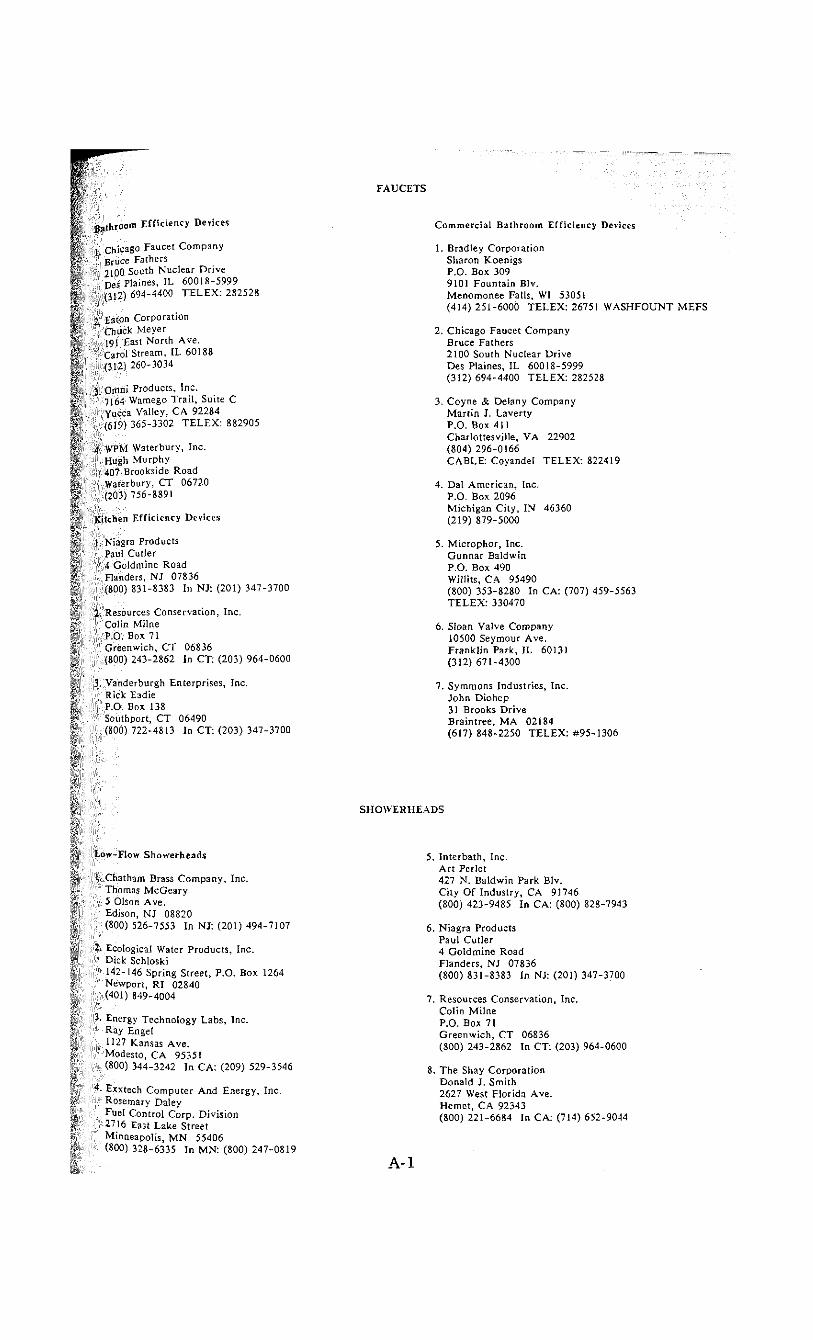
F A U C E T S
Bathroom ffficiincy Devices
1 Chicago Faucet Company ' Bruce Fathers
2)00 South Nuclear Drive Dei rSjini'-, II 60018-5999 (3l2i 694-4400 T E L E X : 282528
2 Eaton Corporation Chuck Meyer 101 Fa't North Ave. Carol Stream, I L 60188 (312) 260-3034
3. Omni Products, Inc. 7164 Wamego Trail , Suite C Yucca Valiey. CA 92284 (619) 365-3302 T E L E X : 882905
4. WPM Waterbury, Inc. Hugh Murphy 407 Brookside Road Water bury, C T 06720 (203) 750-8891
Kitchen i f f u k i K \ Devices
1. Niaera Product's Paul Cutler 4 Goldmine Rn^.d Fli:id»[-, M 0~836 (800) 831-8383 In NJ: (201) 347-3700
2. Resources Conservation, Inc. Colin Milne P.O. II. \ 71 Greenwich, C I 06836 (800) 243-2862 In C T : (203) 964-0600
3. Vanderburgh Enterprises, Inc. Rick Eadie P.O. u..x n s Southport, C T 06490 (800) 722-4813 In CT: (203) 347-3700
Commercial Bathroom Efficiency Devices
. Bradley Corporation Sharon Koenigs P.O. Box 309 9101 Fountain Blv. Menomonee Falls, WI 53051 (414) 251-6000 T E L E X : 2675! WASHFOUNT M E F S
2. Chicago Faucet Company Bruce Fathers 2100 South Nuclear Drive Des Plaines, I L 60018-5999 (312) 694-4400 T E L E X : 282528
3. Coyne & Delany Company Martin J. Laverty P.O. Box 411 Charlottesville, V A 22902 (804) 296-0166 C A B L E : Coyandel T E L E X : 822419
4. Dal American, Inc. P.O. Box 2096 Michigan City, IN 46360 (219) 879-5000
5. Microphor, Inc. Gunnar Baldwin P.O. Box 490 Willits, C A 95490 (800) 353-8280 In CA: (707) 459-5563 T E L E X : 330470
6. Sloan Valve Company 10500 Seymour Ave. Franklin Park, I L 60131 (312) 671-4300
7. Symmons Industries, Inc. John Diohep 31 Brooks Drive Braintree, MA 02184 (617) 848-2250 T E L E X : #95-1306
S H O W E R H E A D S
Low-rion Sho nor heads
1. Chatham Brass Company, Inc. Thnnij-. McGcjry 5 Olson Ave. EdiM.n. \ J C."O0 (800) 526-7553 In NJ: (201) 494-7107
2. Ecological Water Products, Inc. Di::- S:hli.ski 142-146 Spring Street, P.O. Box 1264 Newport, R I 02840 (401) 849-4004
3. Energy Technology Labs, inc. Ray Engel 11:- Kansas Ave. Mu.lo'.to, C.-\ 95351 (800) 344-3242 In CA: (209) 529-3546
4. Exxtech Computer And Energy, Inc. Rrw-inai" Daley Fuel Control Corp. Division 2716 East Lake Street Mini.eap-ili*. MN 55406 (800) 328-6335 In MN: (800) 247-0819
5. Interbath, Inc. Art Perlet 427 N. Baldwin Park Blv. City Of Industry, C A 91746 (800) 423-9485 In CA: (800) 828-7943
6. Niagra Products Paul Cutler 4 Goldmine Road Flanders, NJ 07836 (800) 831-8383 In NJ: (201) 347-3700
7. Resources Conservation, Inc. Colin Milne P.O. Box 71 Greenwich, C T 06836 (800) 243-2862 In C T : (203) 964-0600
8. The Shay Corporation Donald J . Smith 2627 West Florida Ave. Hemet, C A 92343 (800) 221-6684 In CA: (714) 652-9044
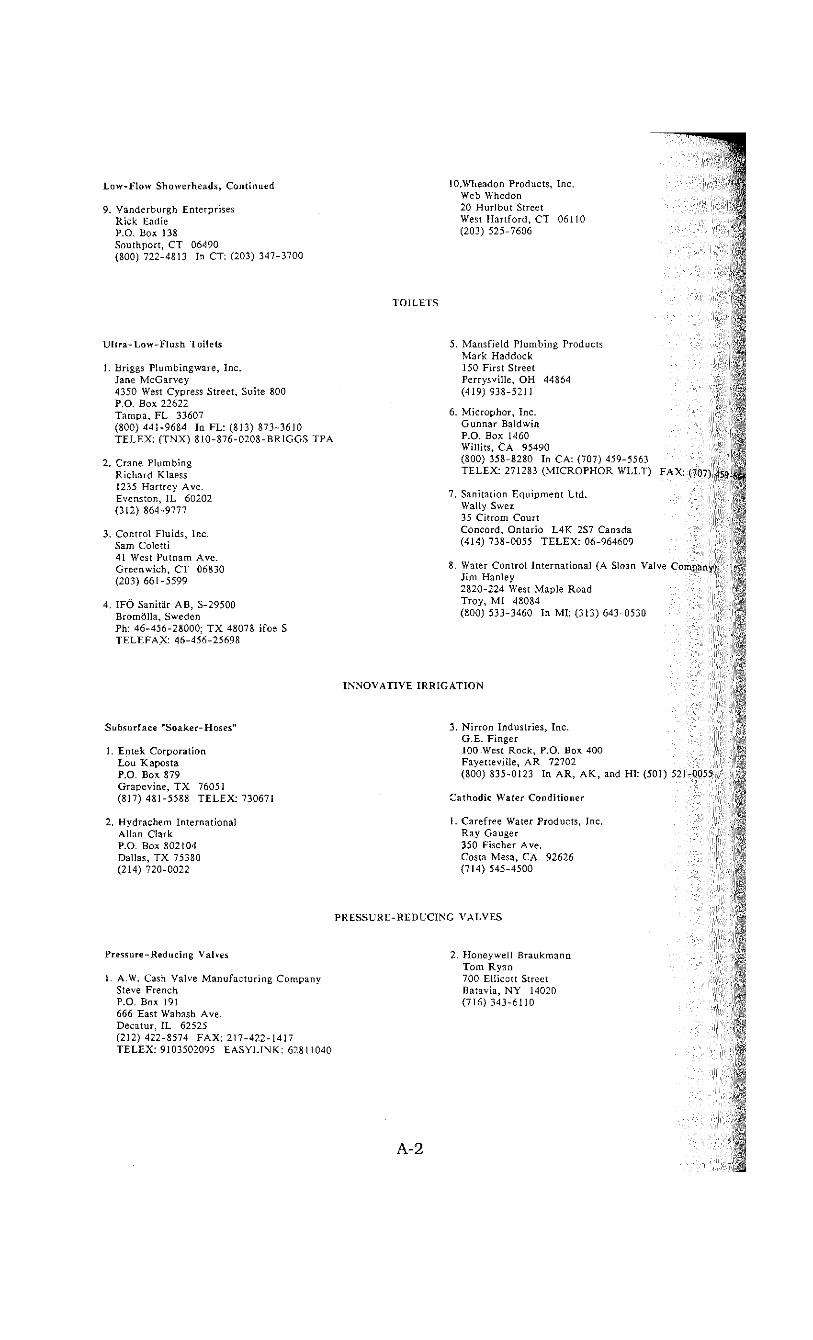
Low-Flow Showerheads, Continued
9. Vanderburgh Enterprises Rick Eadie P.O. Box 138 Southport, C T 06490 (800) 722-4813 In CT: (203) 347-3700
lO.Wheadon Products, Inc. Web Whedon 20 Hurlbut Street West Hartford, C T 06110 (203) 525-7606
T O I L E T S
Ultra-Low-Flush Toilets
1. Briggs Plumbing ware, Inc. Jane McGarvey 4350 West Cypress Street, Suite 800 P.O. Box 22622 Tampa, F L 33607 (800) 441-9684 In F L : (813) 873-3610 T E L E X : ( T N X ) 810-876-0208-BRIGGS TPA
2. Crane Plumbing Richard Klaess 1235 Hartrey Ave. Evenston, I L 60202 (312) 864-9777
3. Control Fluids, Inc. Sam Coletti 41 West Putnam Ave. Greenwich, C T 06830 (203) 661-5599
4. IFO Sanitar A B , S-29500 Bromolla, Sweden Ph: 46-456-28000; T X 48078 ifoe S T E L E F A X : 46-456-25698
5. Mansfield Plumbing Products Mark Haddock 150 First Street Perrysville, O H 44864 (419) 938-5211
6. Microphor, Inc. Gunnar Baldwin P.O. Box 1460 Willits, C A 95490 (800) 358-8280 In CA: (707) 459-5563 T E L E X : 271283 (MICROPHOR W L L T ) F A X : (707) 459.
7. Sanitation Equipment Ltd. Wally Swez 35 Citrom Court Concord, Ontario L 4 K 2S7 Canada (414) 738-0055 T E L E X : 06-964609
8. Water Control International (A Sloan Valve Company) Jim Hanley 2820-224 West Maple Road Troy, MI 48084 (800) 533-3460 In MI: (313) 643-0530
I N N O V A T I V E I R R I G A T I O N
Subsurface "Soaker-Hoses"
1. Entek Corporation Lou Kaposta P.O. Box 879 Grapevine, T X 76051 (817) 481-5588 T E L E X : 730671
3. Nirron Industries, Inc. G . E . Finger 100 West Rock, P.O. Box 400 Fayetteville, A R 72702
(800) 835-0123 In A R , A K , and HI: (501) 521-0055
Cathodic Water Conditioner 2. Hydrachem International
Allan Clark P.O. Box 802104 Dallas, T X 75380 (214) 720-0022
1. Carefree. Water Products, Ray Gauger 350 Fischer Ave. Costa Mesa, CA 92626 (714) 545-4500
Inc.
P R E S S U R E - R E D U C I N G V A L V E S
Pressure-Reducing Valves 2. Honeywell Braukmann Tom Ryan
1. A.W. Cash Valve Manufacturing Company 700 Ellicott Street Steve French Batavia, N Y 14020 P.O. Box 191 (716) 343-6110 666 East Wabash Ave. Decatur, I L 62525 (212) 422-8574 F A X : 217-422-1417 T E L E X : 9103502095 E A S Y L I N K : 62811040
A-2
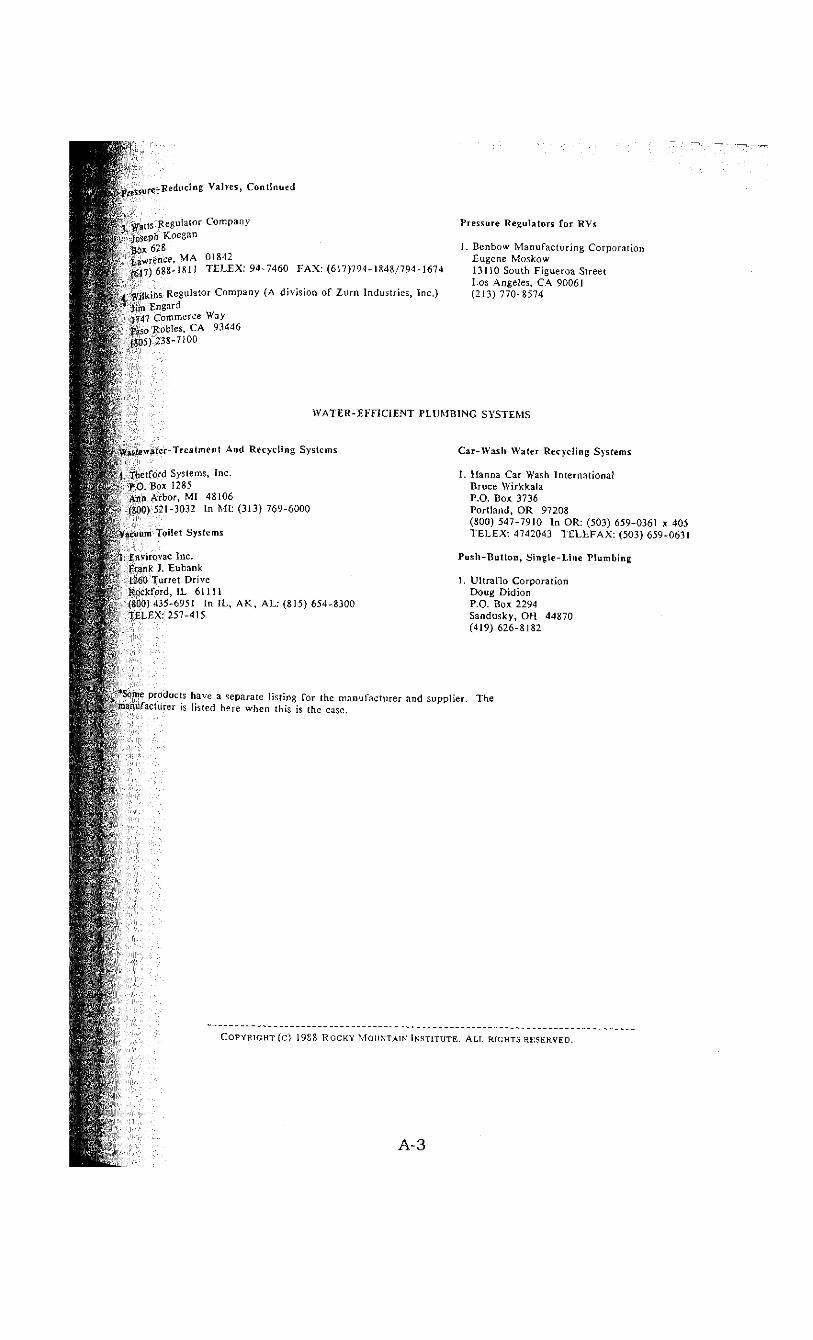
5 u r , .-K<d"C'»~ "'.ires, Continued
3any
M A 0 1 8 4 2
(61") 1 I E L E X : 94-7460 F A X : (617)794-1848/794-1674
. _ mpany (A division of Zurn Industries, Inc.) Jim Fn_—'• j-47 C-r-\ -''-<•'
| 3 i o 5 ) 238-7100
Pressure Regulators for RVs
1. Benbow Manufacturing Corporation Eugene Moskow 13110 South Figueroa Street Los Angeles, CA 90061 (213) 770-8574
W A T E R - E F F I C I E N T P L U M B I N G S Y S T E M S
Wasle».HiT-1 ri'jlm.iii ^nd Recycling Systems
1 Thetfiv.l ir. tc"- inc. P.O. ur \ \2<>< Ann Ari-nr. Ml 4;, Iu6 (800) 571-J''-: In Ml: (313) 769-6000
Vacuum I nil- 1 S\-iems
I . Tnnr'n ic Inc Frank J tut i i v 126J Turr.t IJir e ROCls'. r l . I I M i l l 1SCO1 4-5-( o l In I L , A K , A L : (815) 654-8300 7F.LFX : 5 " - J l ?
Car-Wash Water Recycling Systems
1. Hanna Car Wash International Bruce Wirkkala P.O. Box 3736 Portland, OR 97208 (800) 547-7910 In OR: (503) 659-0361 x 405 T E L E X : 4742043 T E L E F A X : (503) 659-0631
Push-Button, Single-Line Plumbing
1. Ultraflo Corporation Doug Didion P.O. Box 2294 Sandusky, O H 44870 (419) 626-8182
•Some P-..J-.I i hi-.e a separate listing for the manufacturer and supplier. The I M I I / J C - I I . - I 1 |. i;d here when this is the case.
C O P Y R I G H T (c) 1988 R O C K Y M O U N T A I N I N S T I T U T E . A L L R I G H T S R E S E R V E D .
A-3
Appendix B
Model Soil Based Zoning Regulations to Assist in
Determining Minimum Lot Size
Prepared by
Northwestern Connecticut Regional Planning Agency
Model Soil Based Zoning Regulations to Bsslst in Determining Minimum Lot Size
Suggested Language Annotations and Practice Pointers
mode- rt-.'V-'I- - o n s a r e intended to serve only as an example 'ow liK-rm^'on might be used as a performance zoning
^'hniq110 "*£ u ' ? t e t n e s l z e of residential lots. Any town T rin" 1° l , S c ( l l ' s ' - e c n n i c l u e probably will find It necessary to
iifv substantially these draft regulations. These regulations m°_ in'u.n(|(.(i for i"se in residential areas without public water or sanitary sewers.
Article. • : i m um Residential Lot Size
Section 1. L'ii'^.'ii.
ConsUenl v/il'i the objectives set forth in Section 8-2 of the Connecticut Genvral Statutes, this Article establishes a system for determining minimum residential lot sizes. The principal objectives tire (<> protect public health and safety, to provide adequate provision for water and sewerage, to promote development consistent with the suitability of the land, to control soil erosion and sedimentation, and to encourage the most efficient use of die bud.
Section 1 .
The "Purpose" section follows the wording of Section 8-2 of the Connecticut General Statutes which authorizes zoning commissions to enact regulations.
Scrtion 2. i.oi Size
2.1 Lot Si/;* permitted without further review
Snnv lots, if they are large enough and contain soils of particular ty;vs may be developed without a special permit without endangering the public health and safety. In determining the lot area fo<- Ui.* purposes of these regulations, areas with soils in Group Nf ('"L'tUmd types) shall not be included. A lot which has half or more of it* area in Group NF (non-wetland types) or Group C shall be dev.-loped only in accordance with Section 3.
A lot which includes at least one (1) acre of contiguous Croup A soil '.yt>es is allowed without further review under the Zoning Regulations.
A lot wiiii less than one (1) acre of Group A soils, which contain5; soils from other Groups, may be developed if it has at least three (:.<} prres, subject to the exceptions that Group NF (wetland tyivs! soils not be included in the lot area and, as noted above, thai. .-•-(r:u lots be subject to the procedures of Section 3.
Section 2.
2.1 The Intent of this section is to allow the development of certain lots without any further review, except subdivision approval, if required. Group A soils are ideal for subsurface sewage disposal and one (1) acre is considered sufficient even with a poor site design. This minimum only addresses the physical capacity of the land and many other planning considerations may dictate a larger minimum lot size. NF soils are "Not Feasible" for development. NF soils which are of the types defined as wetlands should not be included in calculating the lot area, though some towns may give a partial credit by including some percentage of NF (wetland type) soils in calculating the lot area. NF (non-wetland types) are rockland. They are treated as Group C soils for density purposes.
A lot which has at least one (1) acre of contiguous Group A soils can be developed without further review. A lot with three (3) acres or more of Group B, Group C and NF (non-wetland types) soils can be developed without further review; unless more than half of the lot is of Group C or NF (non-wedand types) soils, in which case a special permit is required. The intent is to allow some large lots as a matter of right even where the soils are restrictive. The belief is that suitable areas for wells and subsurface sewage disposal probably can be found if there is enough area and the external effects of any problems which arise will be minimized.
B - 1
2.2 Lot size permitted by special permit
Lot sizes in areas of soil types other than those In Group A, or consisting of Group A and other types, may be smaller than three (3) if a special permit Is granted in accordance with the following section.
2.2 This section provides an Incentive for revt of development plans and invokes a procedu* for analysis of proposals which have the pote tial for damaging the environment unless sf> plans are carefully designed.
Section 3. Special Permit for smaller minimum lot sizes
3.1 Application
Landowners are strongly encouraged to request a non-binding pre-application review by the Commission and the Director of Health. Application for a special permit to develop lots with a minimum size of less than three (3) acres, or to develop lots with more than half of their minimum lot area in Group C or Group NF (non-wetland types) soils, shall be submitted in writing in quadruplicate to the Commission and shall include the following:
3.1.1 Soils: A site plan in accordance with Section with soil types shown and the area of each type within each lot. The Commission may waive any requirements of Section if it finds the information or level of accuracy is unnecessary for a final determination.
3.1 A nonbinding, pre-application review is n o , required but would help both the applicant and Commission. Whenever possible, the applicani
should have the Director of Health review the plans to determine if more appropriate design solutions are feasible.
3.1.1 The SCS maps are the obvious source of information for this application requirement. However, the SCS maps are often lacking in detail and accuracy and this Section is intentionally drafted to allow the applicant to present additional, and even conflicting, information on soils. Ultimately, the Commission will be responsible for deciding what soils information to accept as accurate.
Where inland wetlands are involved, a joint hearing with the inland wetlands agency is strongly encouraged.
The Section refers to another Section listing the requirements for a site plan application. A town which desires to use these regulations for lot sizes using soils data must have a separate Section on site plan requirements or add them to Section 3.1.1.
The provisions allowing waiver of site plan requirements is designed to prevent the unnecessarily expensive use of Class A-2 surveys. Sometimes even Class D surveys will be unnecessary and hand drawn plans to scale may be sufficient. The intent is to minimize the cosi lo the applicant while still gaining enough information to determine whether smaller lot sizes can be safely developed.
3.1.2 Lot size computation: Computations, using the Minimum Equivalent Lot Sizes from the Table of Soil Types and the formulas in Appendix , which justify the smaller minimum lot sizes.
3.1.3 Additional Information: Such additional information as the Commission may deem necessary to evaluate fully the application.
3.1.2 The lot size computations are explained in Table 2.
3.1.3 At times, the Commission will need more information in its efforts to allow full use of the development potential of the land while protecting the public health and safety. This Section provides the authority for requesting such information. Here, the advantage of a nonbinding. preliminary review is obvious.
B-2
3.2 Siandards
Hie following standards shall apply:
3.2.1 Minimal disturbance: The lot size and type and incation of improvements shall be such as to cause minimal disturbance of sensitive lands. Including, but not limited to: •reas with steep slopes, fragile vegetative cover, natural storm ater drainage and retention areas, aquifer and ground water echarjie ore as, shallow depth to bedrock, and ridge tops.
,5.2. 'I Water resource protection: The proposed use of the lot shall protect water resources by minimizing soil erosion and sedimentation and by siting wells and subsurface sewage disposal systems in optimal locations.
3.2.3 Solar access: The lot and proposed improvements shall be designed to maximize the present and future use of solar energy.
3.2 These standards emphasize the direct concern with good site design. Many lots which are marginal for development can be successfully improved with appropriate building location, driveway design and siting of the well and subsurface sewage disposal system. These standards are intended to encourage the best use of the land by directing development onto those portions of the lot best able to accept disturbance and by protecting natural resource areas from damage.
3.3 Conditions
The special permit may be subject to such conditions as the Commission deems necessary to effect the objectives of this Article and the zoning regulations. These conditions may include, but are not limited to, the following:
3.3.1 Time limits: Limitations on the time within which to complete any or all work on the land.
3.3.2 Landscaping and restoration: Landscaping, and restoration of existing disturbed areas, to ensure stabilization of surface soils.
3.3.3 Easements and covenants: Easements, covenants and olhcr legal restrictions in perpetuity, or for a limited period, as may lie necessary to protect sensitive areas.
3.3.4 Performance bonds: Performance bonds or equivalent substitutes for not longer than five (5) years from the date of approval to cover the cost of improvements to, and stabilization of, the land; and, where deemed necessary, to ensure that water and subsurface sewage disposal systems will perform adequately.
3.3 These conditions are only suggestive of what may be required to ensure achievement of the purposes for which the regulations are adopted. Easements and covenants should be used only sparingly. The approved site plan and special permit establish the permitted land uses and often will be adequate in themselves to protect the land. Performance bonds are allowed for site plan improvements, but again, should be used only when absolutely necessary. Bonds to ensure the operation of water and sewerage systems could unnecessarily "tie up" significant capital, but should be used where there is a well-founded concern over the operation of such utility systems.
In summary, these conditions should be imposed only where the circumstances clearly warrant it.
3.4 Special provisions for community association develop ments
Dwelling units served by: a water company as defined in Section 25-32a of the Connecticut General Statutes and Section 19-13-B51b (19) of the Regulations of the State of Connecticut, or a community association sewerage system regulated pursuant to Section 25-54i of the Connecticut General Statutes may be developed at a gross density not less than dwelling units per acre. excluding areas of Group NF (non-wetland type) soils, Nardil-ss of the soil type, if the standards of Section 3.2 are met.
3.4 These optional provisions must be used in conjunction with cluster or planned residential development regulations. The intent is to encourage the siting of buildings, wells and sub surface sewage disposal systems at optimum locations. There is little sense in dividing a varied landscape into good, marginal and un-buildable lots when the natural resources can be best utilized through comprehensive development. Towns which do not have cluster or planned residential regulations should ask their town planner or regional planning agency for examples appropriate for their town.
B-3
Appendix C
Procedure for Determining 3/4 Acre of Buildable Land As Required and
Defined by Hebron Zoning Regulations
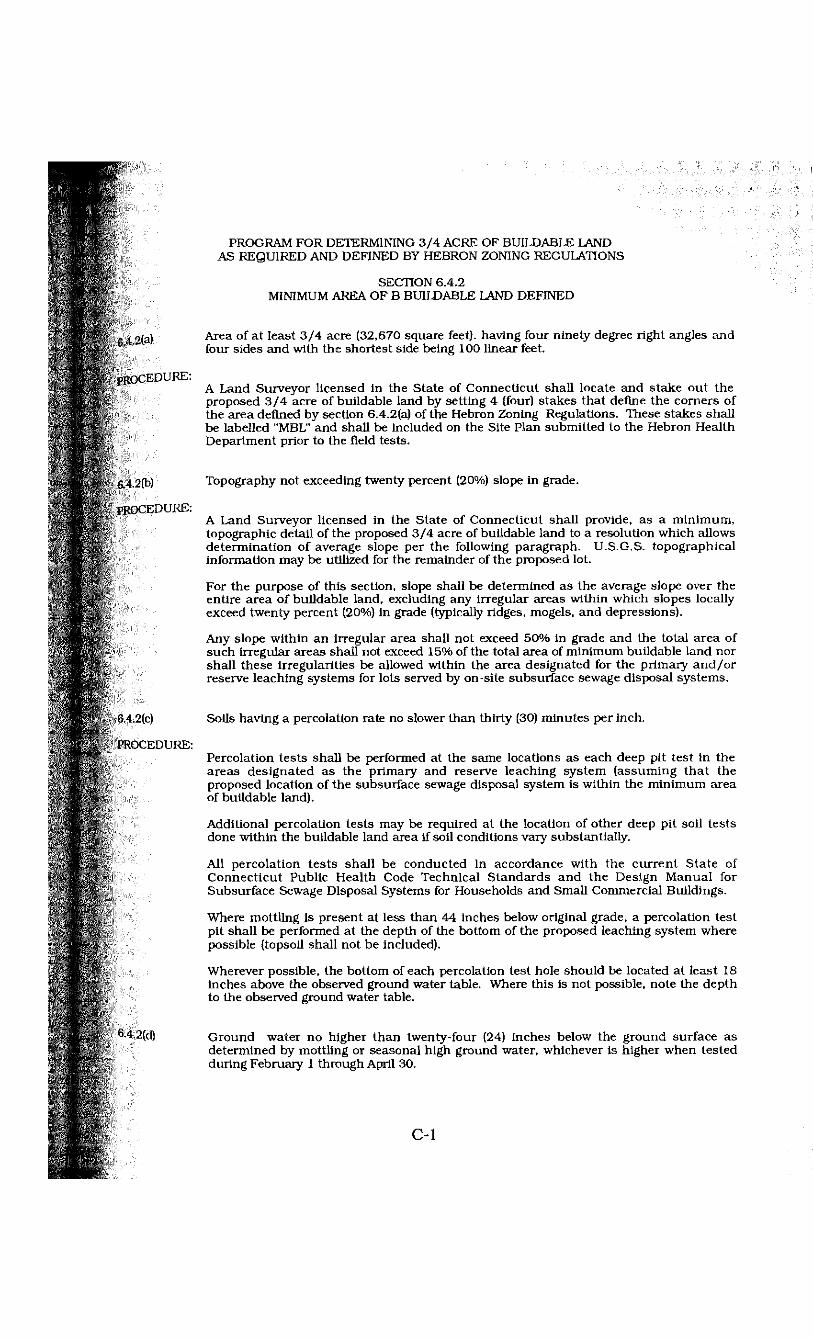
i f ?
I
i
1"
• H I
I f f !
4nfN J"
6.4.2(a)
pROCELriL'VC:
6.4.2(b)
PROCEDURE:
6.4.2(c)
PROCEDURE:
«.4.2(. CI)
PROGRAM FOR DETERMINING 3/4 ACRE OF BUILDABLE LAND AS REQUIRED AND DEFINED BY HEBRON ZONING REGULATIONS
SECTION 6.4.2 MINIMUM AREA OF B BUILDABLE LAND DEFINED
Area of at least 3/4 acre (32,670 square feet), having four ninety degree right angles and four sides and with the shortest side being 100 linear feet.
A Land Surveyor licensed in the State of Connecticut shall locate and stake out the proposed 3/4 acre of buildable land by setting 4 (four) stakes that define the corners of the area defined by section 6.4.2(a) of the Hebron Zoning Regulations. These stakes shall be labelled "MBL" and shall be included on the Site Plan submitted to the Hebron Health Department prior to the field tests.
Topography not exceeding twenty percent (20%) slope in grade.
A Land Surveyor licensed in the State of Connecticut shall provide, as a minimum, topographic detail of the proposed 3/4 acre of buildable land to a resolution which allows determination of average slope per the following paragraph. U.S.G.S. topographical information may be utilized for the remainder of the proposed lot.
For the purpose of this section, slope shall be determined as the average slope over the entire area of buildable land, excluding any irregular areas within which slopes locally exceed twenty percent (20%) in grade (typically ridges, mogels, and depressions).
Any slope within an irregular area shall not exceed 50% in grade and the total area of such irregular areas shall not exceed 15% of the total area of minimum buildable land nor shall these irregularities be allowed within the area designated for the primary and/or reserve leaching systems for lots served by on-site subsurface sewage disposal systems.
Soils having a percolation rate no slower than thirty (30) minutes per inch.
Percolation tests shall be performed at the same locations as each deep pit test in the areas designated as the primary and reserve leaching system (assuming that the proposed location of the subsurface sewage disposal system is within the minimum area of buildable land).
Additional percolation tests may be required at the location of other deep pit soil tests done within the buildable land area if soil conditions vary substantially.
All percolation tests shall be conducted in accordance with the current State of Connecticut Public Health Code Technical Standards and the Design Manual for Subsurface Sewage Disposal Systems for Households and Small Commercial Buildings.
Where mottling is present at less than 44 inches below original grade, a percolation test pit shall be performed at the depth of the bottom of the proposed leaching system where possible (topsoil shall not be included).
Wherever possible, the bottom of each percolation test hole should be located at least 18 inches above the observed ground water table. Where this is not possible, note the depth to the observed ground water table.
Ground water no higher than twenty-four (24) inches below the ground surface as determined by mottling or seasonal high ground water, whichever is higher when tested during February 1 through April 30.
C - 1
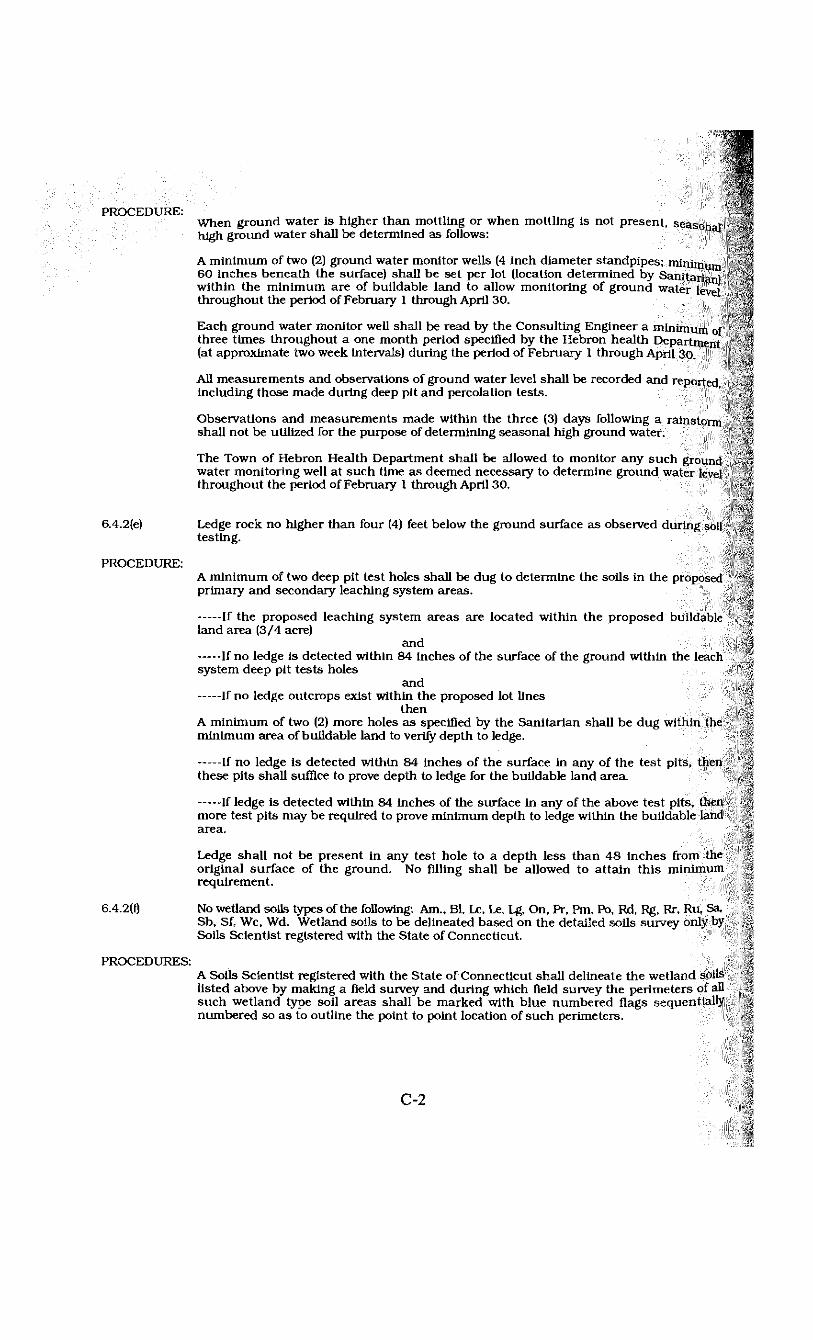
When ground water is higher than mottling or when mottling is not present, season 1 high ground water shall be determined as follows: a
A minimum of two (2) ground water monitor wells (4 inch diameter standpipes; mininmn 60 inches beneath the surface) shall be set per lot (location determined by Sanitarian) within the minimum are of buildable land to allow monitoring of ground water level throughout the period of February 1 through April 30.
Each ground water monitor well shall be read by the Consulting Engineer a minimum of three times throughout a one month period specified by the Hebron health Department (at approximate two week intervals) during the period of February 1 through April 30.
All measurements and observations of ground water level shall be recorded and reported including those made during deep pit and percolation tests.
Observations and measurements made within the three (3) days following a rainstorm shall not be utilized for the purpose of determining seasonal high ground water.
The Town of Hebron Health Department shall be allowed to monitor any such ground water monitoring well at such time as deemed necessary to determine ground water level throughout the period of February 1 through April 30.
6.4.2(e) Ledge rock no higher than four (4) feet below the ground surface as observed during soil testing.
PROCEDURE: A minimum of two deep pit test holes shall be dug to determine the soils in the proposed primary and secondary leaching system areas.
If the proposed leaching system areas are located within the proposed buildable land area (3/4 acre)
and If no ledge is detected within 84 inches of the surface of the ground within the leach
system deep pit tests holes and
If no ledge outcrops exist within the proposed lot lines then
A minimum of two (2) more holes as specified by the Sanitarian shall be dug within the minimum area of buildable land to verify depth to ledge.
If no ledge is detected within 84 inches of the surface in any of the test pits, then these pits shall suffice to prove depth to ledge for the buildable land area.
If ledge is detected within 84 inches of the surface in any of the above test pits, then more test pits may be required to prove minimum depth to ledge within the buildable land area.
Ledge shall not be present in any test hole to a depth less than 48 inches from the original surface of the ground. No filling shall be allowed to attain this minimum requirement.
6.4.2(f) No wedand soils types of the following: Am., Bl, Lc, Le, Lg, On, Pr, Pm, Po, Rd, Rg, Rr, Ru, Sa, Sb, Sf, Wc, Wd. Wetland soils to be delineated based on the detailed soils survey only by Soils Scientist registered with the State of Connecticut.
PROCEDURES: A Soils Scientist registered with the State of Connecticut shall delineate the wetland soils listed above by making a field survey and during which field survey the perimeters of all such wetland type soil areas shall be marked with blue numbered flags sequentially numbered so as to outline the point to point location of such perimeters.
C-2
such delineation of wetland soils shall be subject to the inspection and approval of the Hebron Inland Wetland Agency.
6 4 2(g) N° a r e a s within a federally mapped flood plain.
PROCEDURES: Engineer/Land Surveyor to consult latest Federal Flood Plain Maps and certify that no land areas being considered fall within a federally mapped flood plain.
J. Peter Carbone Jr. Health Office/Sanitarian Hebron 1 tealth Department 2-24-87
Approved by Planning and Zoning Commission
Date
file: Heal in Department LolW'sts.287
Appendix D
Non-Point Source Pollution Control: Best Management Practices
Reprinted, by permission from:
Lake and Reservoir Restoration Guidance Manual
1988 L. Moore and K. Thornton, Editors
North American Lake Management Society EPA-440/5-88-002
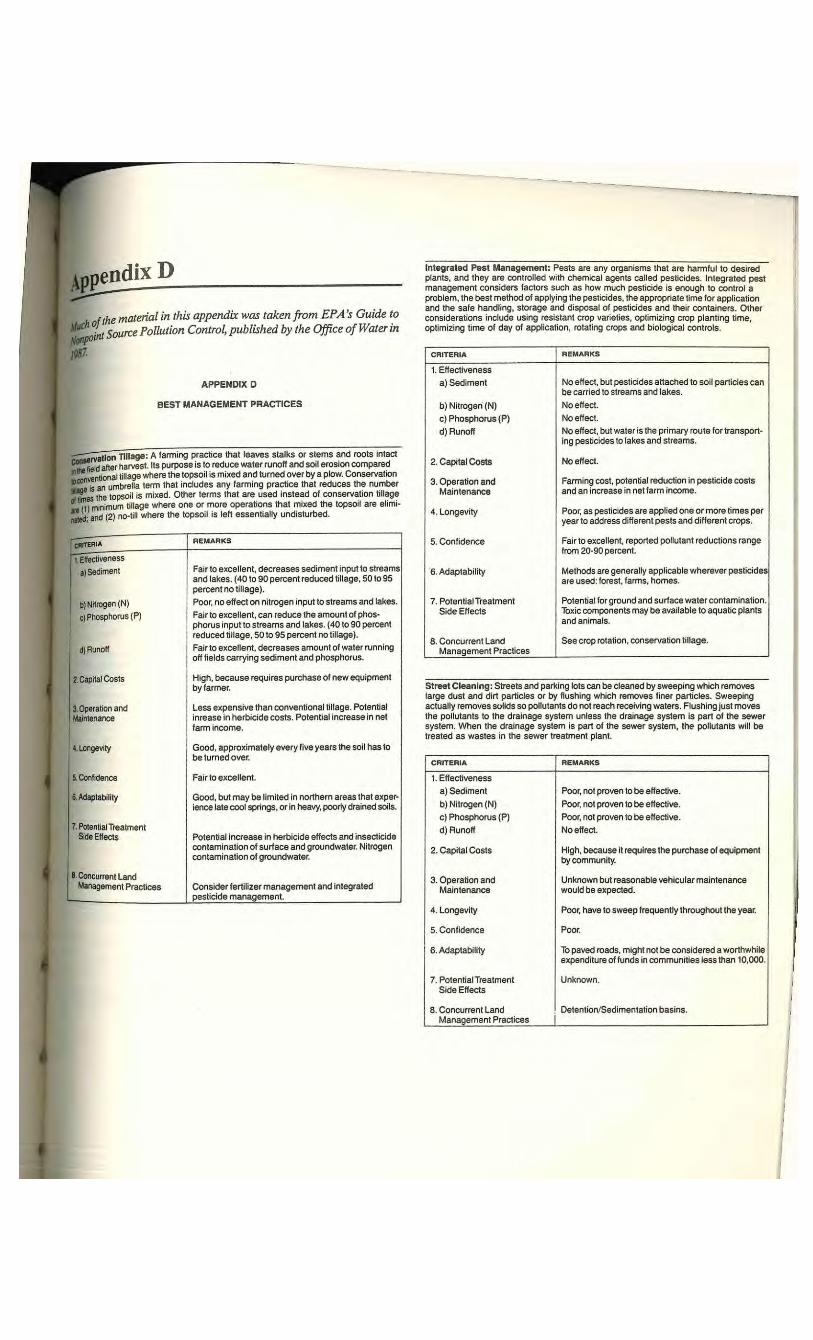
l e n d i x D
f the material in this appendix was taken from EPA's Guide to oint Source Pollution Control, published by the Office of Water in
0-
APPENDIX D
B E S T MANAGEMENT P R A C T I C E S
— ' X j i o n Til lage: A fanning practice that leaves stalks or stems and roots intact 5 6 d after harvest. Its purpose is to reduce water runoff and soil erosion compared Old after harvest. U S puipuoe la lu icuuuc wmei i U I I U M ai iu O U I I ciuaiyi i ^unipaicu
, n n^ e f l t ional tillage where the topsoil is mixed and turned over by a plow. Conservation
W is an umbrella term that includes any farming practice that reduces the number 5fmes the topsoil is mixed. Other terms that are used instead of conservation tillage ^ . • tmona u/hare nnp r,r mnrp nnpratinnfi that mixed the tnnsoil a re elimi-11) minimum tillage where one or more operations that mixed the topsoil are elimi rated and (2) no-till where the topsoil is left essentially undisturbed.
CRITERIA R E M A R K S
T/ifteSiveness a) Sediment
b) Nitrogen (N) c) Phosphorus (P)
i) Runoff
Fair to excellent, decreases sediment input to streams and lakes. (40 to 90 percent reduced tillage, 50 to 95 percent no tillage). Poor, no effect on nitrogen input to streams and lakes. Fair to excellent, can reduce the amount of phosphorus input to streams and lakes. (40 to 90 percent reduced tillage, 50 to 95 percent no tillage). Fair to excellent, decreases amount of water running off fields carrying sediment and phosphorus.
2. Capital Costs High, because requires purchase of new equipment by farmer.
3. Operation and Maintenance
Less expensive than conventional tillage. Potential inrease in herbicide costs. Potential increase in net farm income.
4. Longevity Good, approximately every five years the soil has to be turned over.
5. Confidence Fair to excellent.
6. Adaptability Good, but may be limited in northern areas that experience late cool springs, or in heavy, pooriy drained soils.
7. Potential Treatment Side Effects Potential increase in herbicide effects and insecticide
contamination of surface and groundwater. Nitrogen contamination of groundwater.
8. Concurrent Land Management Practices Consider fertilizer management and integrated
pesticide management.
Integrated Pest Management: Pests are any organisms that are harmful to desired plants, and they are controlled with chemical agents called pesticides. Integrated pest management considers factors such as how much pesticide is enough to control a problem, the best method of applying the pesticides, the appropriate time for application and the safe handling, storage and disposal of pesticides and their containers. Other considerations include using resistant crop varieties, optimizing crop planting time, optimizing time of day of application, rotating crops and biological controls.
CRITERIA R E M A R K S
1. Effectiveness a) Sediment
b) Nitrogen (N) c) Phosphorus(P) d) Runoff
No effect, but pesticides attached to soil particles can be carried to streams and lakes. No effect. No effect. No effect, but water is the primary route for transporting pesticides to lakes and streams.
2. Capital Costs No effect.
3. Operation and Maintenance
Farming cost, potential reduction in pesticide costs and an increase in net farm income.
4. Longevity Poor, as pesticides are applied one or more times per year to address different pests and different crops.
5. Confidence Fair to excellent, reported pollutant reductions range from 20-90 percent.
6. Adaptability Methods are generally applicable wherever pesticides are used: forest, farms, homes.
7. Potential Treatment Side Effects
Potential for ground and surface water contamination. Toxic components may be available to aquatic plants and animals.
8. Concurrent Land Management Practices
See crop rotation, conservation tillage.
Street Cleaning: Streets and parking lots can be cleaned by sweeping which removes large dust and dirt particles or by flushing which removes finer particles. Sweeping actually removes solids so pollutants do not reach receiving waters. Flushing just moves the pollutants to the drainage system unless the drainage system is part of the sewer system. When the drainage system is part of the sewer system, the pollutants will be treated as wastes in the sewer treatment plant.
CRITERIA R E M A R K S
1. Effectiveness a) Sediment b) Nitrogen (N) c) Phosphorus (P) d) Runoff
Poor, not proven to be effective. Poor, not proven to be effective. Poor, not proven to be effective. No effect.
2. Capital Costs High, because it requires the purchase of equipment by community.
3. Operation and Maintenance
Unknown but reasonable vehicular maintenance would be expected.
4. Longevity Poor, have to sweep frequently throughout the year.
5. Confidence Poor.
6. Adaptability To paved roads, might not be considered a worthwhile expenditure of funds in communities less than 10,000.
7. Potential Treatment Side Effects
Unknown.
8. Concurrent Land Management Practices
Detention/Sedimentation basins.
f
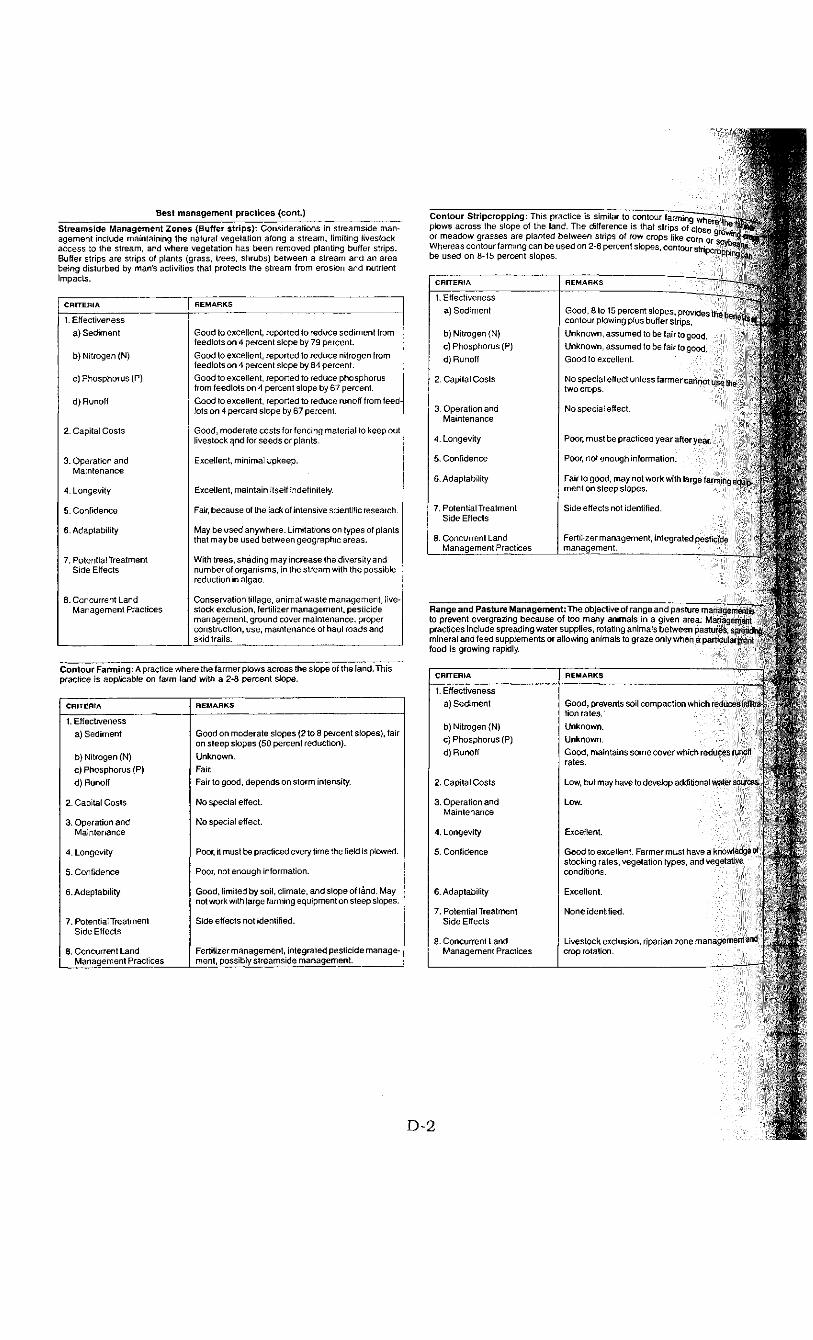
Best management practices (cont.) Streamside Management Zones (Buffer strips): Considerations in streamside management include maintaining the natural vegetation along a stream, limiting livestock access to the stream, and where vegetation has been removed planting buffer strips. Buffer strips are strips of plants (grass, trees, shrubs) between a stream and an area being disturbed by man's activities that protects the stream from erosion and nutrient impacts.
Contour Stripcropping: This practice is similar to contour farminrTwhere"-"—~~ s. plows across the slope of the land. The difference is that strips of close a ^ " 6 ! ° " , l e ' or meadow grasses are planted between strips of row crops like corn or sr> Whereas contour farming can be used on 2-8 percent slopes, contour s t r i n rm ' ' ' I e s r ' s
be used on 8-15 percent slopes. v 1
CRITERIA R E M A R K S
1. Effectiveness
a) Sediment
b) Nitrogen (N)
c) Phosphorus(P)
d) Runoff
Good to excellent, reported to reduce sediment from feedlots on 4 percent slope by 79 percent. Good to excellent, reported to reduce nitrogen from feedlots on 4 percent slope by 84 percent. Good to excellent, reported to reduce phosphorus from feedlots on 4 percent slope by 67 percent. Good to excellent, reported to reduce runoff from feed-lots on 4 percent slope by 67 percent.
2. Capital Costs Good, moderate costs for fencing material to keep out livestock a,nd for seeds or plants.
3. Operation and Maintenance
Excellent, minimal upkeep.
4. Longevity Excellent, maintain itself indefinitely.
5. Confidence Fair, because of the lack of intensive scientific research.
6. Adaptability May be used anywhere. Limitations on types of plants that may be used between geographic areas.
7. Potential Treatment Side Effects
With trees, shading may increase the diversity and number of organisms, in the stream with the possible reduction in algae.
8. Concurrent Land Management Practices
Conservation tillage, animal waste management, livestock exclusion, fertilizer management, pesticide management, ground cover maintenance, proper construction, use, maintenance of haul roads and skid trails.
Contour Farming: A practice where the farmer plows across the slope of the land. This practice is applicable on farm land with a 2-8 percent slope.
CRITERIA R E M A R K S
1. Effectiveness a) Sediment
b) Nitrogen (N) c) Phosphorus(P) d) Runoff
Good on moderate slopes (2 to 8 percent slopes), fair on steep slopes (50 percent reduction). Unknown. Fair. Fair to good, depends on storm intensity.
2. Capital Costs No special effect.
3. Operation and Maintenance
No special effect.
4. Longevity Poor, it must be practiced every time the field is plowed.
5. Confidence Poor, not enough information.
6. Adaptability Good, limited by soil, climate, and slope of land. May not work with large farming equipment on steep slopes.
7. Potential Treatment Side Effects
Side effects not identified.
8. Concurrent Land Management Practices
Fertilizer management, integrated pesticide management, possibly streamside management.
1. Effectiveness a) Sediment
b) Nitrogen (N) c) Phosphorus (P) d) Runoff
2. Capital Costs
3. Operation and Maintenance
4. Longevity
5. Confidence
6. Adaptability
7. Potential Treatment Side Effects
8. Concurrent Land Management Practices
Good, 8 to 15 percent slopes, provides the benefits,* contour plowing plus buffer strips. -
Unknown, assumed to be fair to good. Unknown, assumed to be fair to good. Good to excellent.
No special effect unless farmer cannot i ise the two crops.
No special effect. f
Poor, must be practiced year after year.
Poor, not enough information.
Fair to good, may not work with large fam-.ing equp. ment on steep slopes.
Side effects not identified.
Fertilizer management, integrated pesticide management.
Range and Pasture Management: The objective of range and pasture managenen! is to prevent overgrazing because of too many animals in a given area. M • practices include spreading water supplies, rotating animals between pasti • • • . • . mineral and feed supplements or allowing animals to graze only when a pa-food is growing rapidly.
CRITERIA R E M A R K S
1. Effectiveness a) Sediment
b) Nitrogen (N) c) Phosphorus (P) d) Runoff
Good, prevents soil compaction which reduces i n t o tion rates.' Unknown. Unknown. Good, maintains some cover which reduces runoff rates.
2. Capital Costs Low, but may have to develop additional water sources.
3. Operation and Maintenance
Low.
4. Longevity Excellent.
5. Confidence Good to excellent. Farmer must have a knowledge of stocking rates, vegetation types, and vegetative conditions.
6. Adaptability Excellent.
7. Potential Treatment Side Effects
None identified.
8. Concurrent Land Management Practices
Livestock exclusion, riparian zone management and crop rotation.
D-2
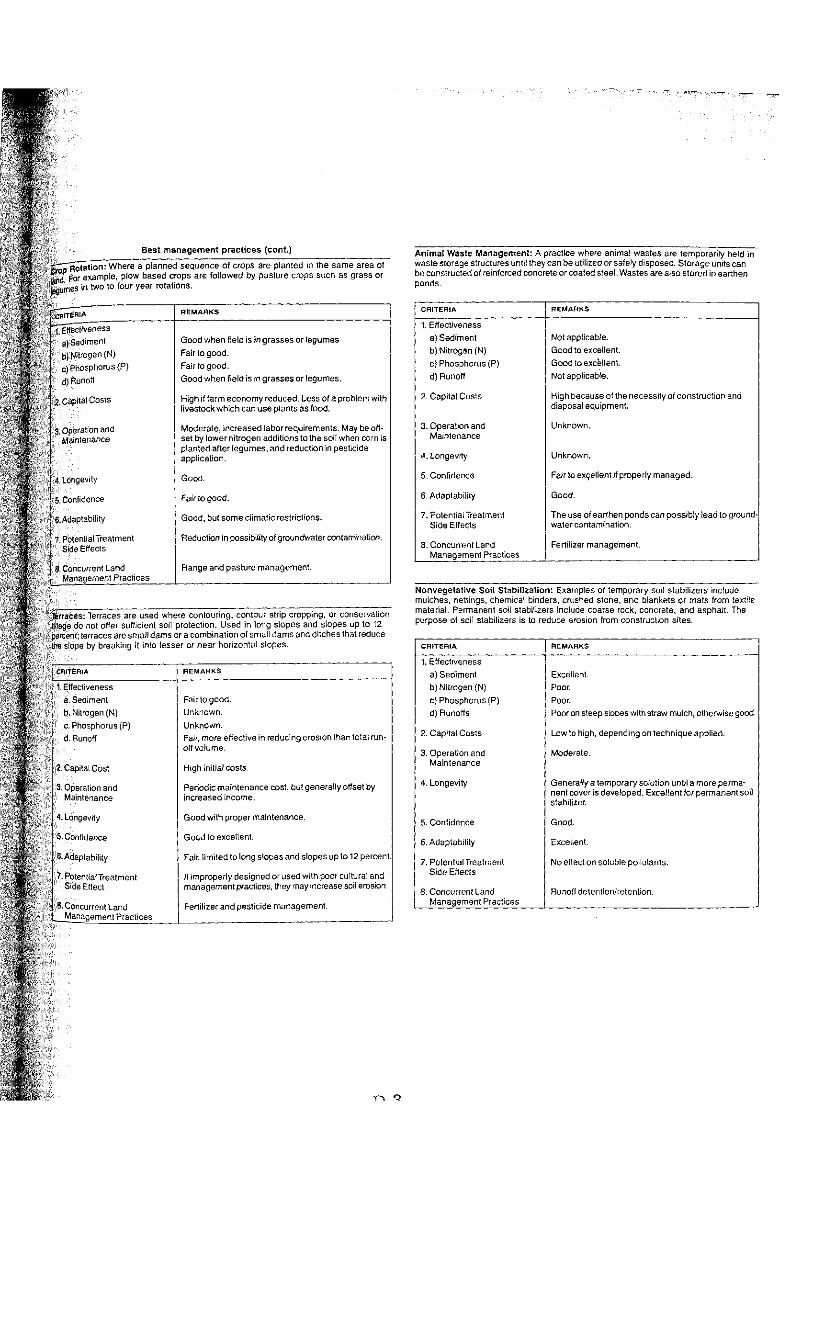
Best management practices (cont.)
? M Rotation: Where a planned sequence of crops are planted in the same area of d For example, plow based crops are followed by pasture crops such as grass or
l^urnes in two to four year rotations.
CRITERIA R E M A R K S
"^Effectiveness a) Sediment b) Nitrogen (N) c) Phosphorus (P) d) Runoff
Good when field is in grasses or legumes Fair to good. Fair to good. Good when field is in grasses or legumes.
2. Capilal Costs High if farm economy reduced. Less of a problem with livestock which can use plants as food.
3. Operation and Maintenance
Moderate, increased labor requirements. May be offset by lower nitrogen additions to the soil when corn is planted after legumes, and reduction in pesticide application.
4. Longevity Good.
5. Confidence Fair to good.
6. Adaptability Good, but some climatic restrictions.
7. PotentialTreatment Side Effects
Reduction in possibility of groundwater contamination.
8. Concurrent Land Management Practices
Range and pasture management.
Terraces: Terraces are used where contouring, contour strip cropping, or conservation tillage do not offer sufficient soil protection. Used in long slopes and slopes up to 12 percent; terraces are small dams or a combination of small dams and ditches that reduce the slope by breaking it into lesser or near horizontal slopes.
CRITERIA R E M A R K S
1. Effectiveness a. Sediment b. Nitrogen (N) c. Phosphorus (P) d. Runoff
Fair to good. Unknown. Unknown. Fair, more effective in reducing erosion than total runoff volume.
2. Capital Cost High initial costs.
3. Operation and Maintenance
Periodic maintenance cost, but generally offset by increased income.
4. Longevity Good with proper maintenance.
5. Confidence Good to excellent.
6. Adaptability Fair, limited to long slopes and slopes up to 12 percent.
7. PotentialTreatment Side Effect
If improperly designed or used with poor cultural and management practices, they may increase soil erosion.
8. Concurrent Land Management Practices
Fertilizer and pesticide management.
Animal Waste Management: A practice where animal wastes are temporarily held in waste storage structures until they can be utilized or safely disposed. Storage units can be constructed of reinforced concrete or coated steel. Wastes are also stored in earthen ponds.
CRITERIA R E M A R K S
1. Effectiveness a) Sediment b) Nitrogen (N) c) Phosphorus (P) d) Runoff
Not applicable. Good to excellent. Good to excellent. Not applicable.
2. Capital Costs High because of the necessity of construction and disposal equipment.
3. Operation and Maintenance
Unknown.
4. Longevity Unknown.
5. Confidence Fair to excellent if properly managed.
6. Adaptability Good.
7. PotentialTreatment Side Effects
The use of earthen ponds can possibly lead to groundwater contamination.
8. Concurrent Land Management Practices
Fertilizer management.
Nonvegetative Soil Stabilization: Examples of temporary soil stabilizers include mulches, nettings, chemical binders, crushed stone, and blankets or mats from textile material. Permanent soil stabilizers include coarse rock, concrete, and asphalt. The purpose of soil stabilizers is to reduce erosion from construction sites.
CRITERIA R E M A R K S
1. Effectiveness a) Sediment b) Nitrogen (N) c) Phosphorus (P) d) Runoffs
Excellent. Poor. Poor. Poor on steep slopes with straw mulch, otherwise good.
2. Capital Costs Low to high, depending on technique applied.
3. Operation and Maintenance
Moderate.
4. Longevity Generally a temporary solution until a more permanent cover is developed. Excellent for permanent soil stabilizer.
5. Confidence Good.
6. Adaptability Excellent.
7. PotentialTreatment Side Effects
No effect on soluble pollutants.
8. Concurrent Land Management Practices
Runoff detention/retention.
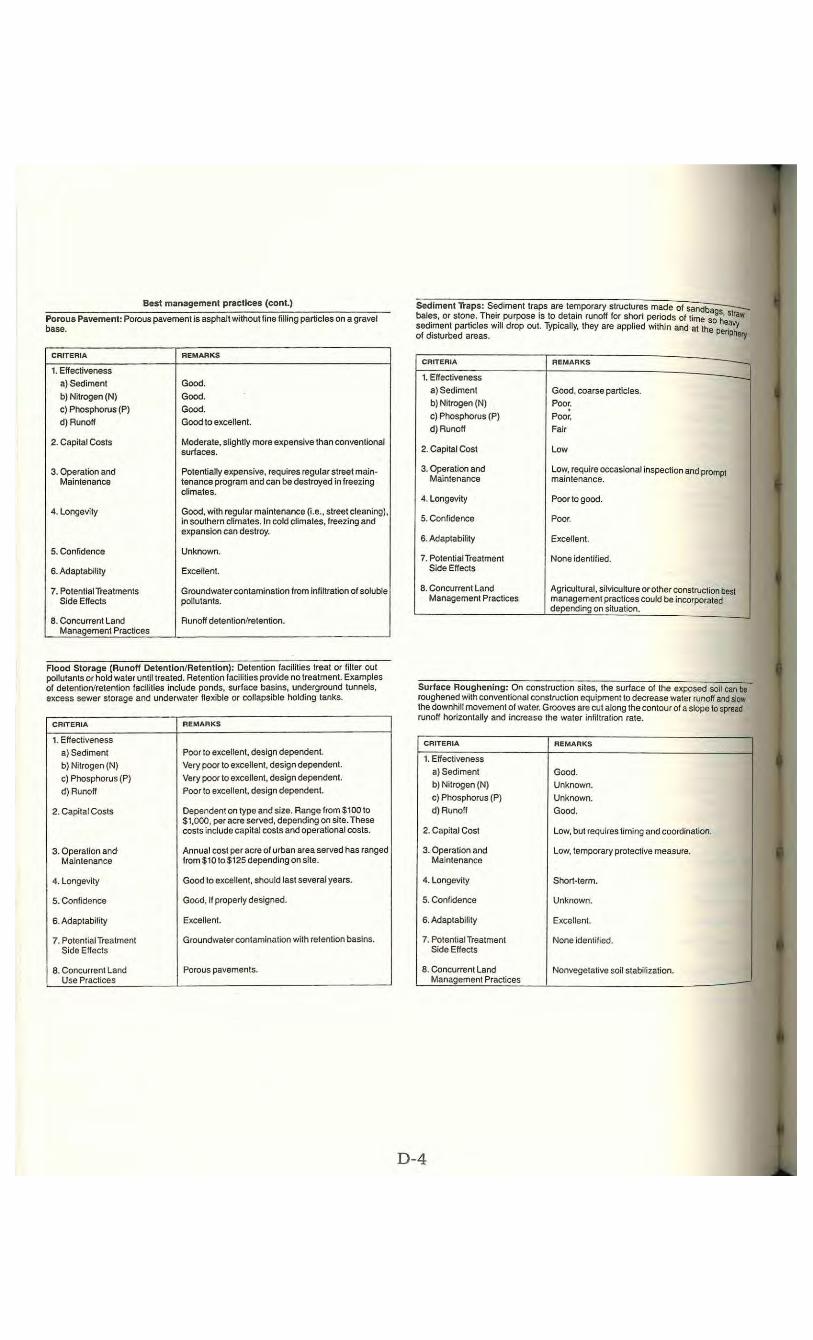
Best management practices (cont.)
Porous Pavement: Porous pavement is asphalt without fine filling particles on a gravel base.
CRITERIA R E M A R K S
1. Effectiveness a) Sediment b) Nitrogen (N) c) Phosphorus (P) d) Runoff
Good. Good. Good. Good to excellent.
2. Capital Costs Moderate, slightly more expensive than conventional surfaces.
3. Operation and Maintenance
Potentially expensive, requires regular street maintenance program and can be destroyed in freezing climates.
4. Longevity Good, with regular maintenance (i.e., street cleaning), in southern climates. In cold climates, freezing and expansion can destroy.
5. Confidence Unknown.
6. Adaptability Excellent.
7. Potential Treatments Side Effects
Groundwater contamination from infiltration of soluble pollutants.
8. Concurrent Land Management Practices
Runoff detention/retention.
Flood Storage (Runoff Detention/Retention): Detention facilities treat or filter out pollutants or hold water until treated. Retention facilities provide no treatment. Examples of detention/retention facilities include ponds, surface basins, underground tunnels, excess sewer storage and underwater flexible or collapsible holding tanks.
CRITERIA R E M A R K S
1. Effectiveness a) Sediment b) Nitrogen (N) c) Phosphorus(P) d) Runoff
Poor to excellent, design dependent. Very poor to excellent, design dependent. Very poor to excellent, design dependent. Poor to excellent, design dependent.
2. Capital Costs Dependent on type and size. Range from $100 to $1,000, per acre served, depending on site. These costs include capital costs and operational costs.
3. Operation and Maintenance
Annual cost per acre of urban area served has ranged from $10 to $125 depending on site.
4. Longevity Good to excellent, should last several years.
5. Confidence Good, if properly designed.
6. Adaptability Excellent.
7. PotentialTreatment Side Effects
Groundwater contamination with retention basins.
8. Concurrent Land Use Practices
Porous pavements.
Sediment Traps: Sediment traps are temporary structures made of s a n d b a o — " — -bales, or stone. Their purpose is to detain runoff for short periods of time so h S ' r a W
sediment particles will drop out. Typically, they are applied within and at the n e a V ^ of disturbed areas. Periphery
CRITERIA R E M A R K S —
1. Effectiveness a) Sediment Good, coarse particles. b) Nitrogen (N) Poor. c) Phosphorus (P) Poor, d) Runoff Fair
2. Capital Cost Low
3. Operation and Maintenance
Low, require occasional inspection and prompt maintenance.
4. Longevity Poorto good.
5. Confidence Poor.
6. Adaptability Excellent.
7. PotentialTreatment Side Effects
None identified.
8. Concurrent Land Management Practices
Agricultural, silviculture or other construction best management practices could be incorporated depending on situation.
Surface Roughening: On construction sites, the surface of the exposed soil can be roughened with conventional construction equipment to decrease water runoff and slow the downhill movement of water. Grooves are cut along the contour of a slope to spread runoff horizontally and increase the water infiltration rate.
CRITERIA R E M A R K S
1. Effectiveness a) Sediment Good. b) Nitrogen (N) Unknown. c) Phosphorus (P) Unknown. d) Runoff Good.
2. Capital Cost Low, but requires timing and coordination.
3. Operation and Maintenance
Low, temporary protective measure.
4. Longevity Short-term.
5. Confidence Unknown.
6. Adaptability Excellent.
7. PotentialTreatment Side Effects
None identified.
8. Concurrent Land Management Practices
Nonvegetative soil stabilization.
f
D-4
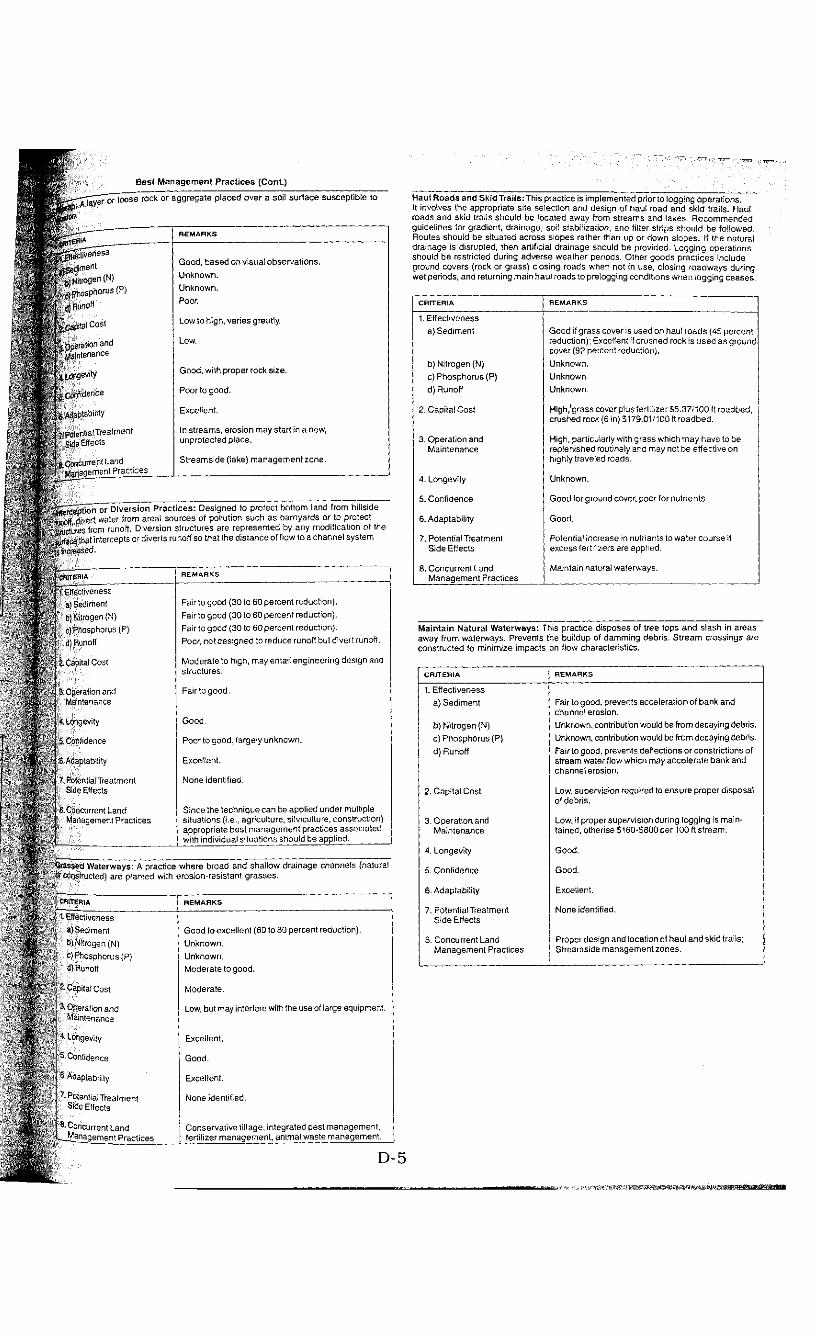
Best Management Practices (Cont.)
Wrap - " T T ^ T c T l o o s e rock or aggregate placed over a soil surface susceptible to
; j ^ £ f f e c t ^ e n e s s sjSedimerit
- I b) Nitrogen (N) - . ;phorus(P)
-1 runoff
. . .3 Cost
3 Operation and Maintenance
A L : r g e v i r y
- 5. Confidence
6 . Adaptability
7 potential Treatment Side Effects
8. Concurrent Land IdanaoernentPractices
Good, based on visual observations. Unknown. Unknown. Poor.
Low to high, varies greatly.
Low.
Good, with proper rock size.
Poor to good.
Excellent.
In streams, erosion may start in a new, unprotected place.
Streamside (lake) management zone.
iJrt^rceptorTor Diversion Practices: Designed to protect bottom land from hillside ' unoff divert water from areal sources of pollution such as barnyards or to protect
structures from runoff. Diversion structures are represented by any modification of the • surface that intercepts or diverts runoff so that the distance of flow to a channel system " is increased.
CRITERIA R E M A R K S
1. Effectiveness S)Sediment B) Nitrogen (N) g) Phosphorus (P) i ) Runoff
Fair to good (30 to 60 percent reduction). Fair to good (30 to 60 percent reduction). Fair to good (30 to 60 percent reduction). Poor, not designed to reduce runoff but divert runoff.
2. Capital Cost Moderate to high, may entail engineering design and structures.
3. Operation and Maintenance
Fair to good.
4. Longevity Good.
5. Confidence Poor to good, largely unknown.
6. Adaptability Excellent.
T.PotenlialTreatment Side Effects
None identified.
8. Concurrent Land Management Practices
Since the technique can be applied under multiple situations (i.e., agriculture, silviculture, construction) appropriate best management practices associated with individual situations should be applied.
Grassed Waterways: A practice where broad and shallow drainage channels (natural or constructed) are planted with erosion-resistant grasses.
CRITERIA R E M A R K S
1- Effectiveness a) Sediment b) Nitrogen (N) c) Phosphorus (P) S) Runoff
Good to excellent (60 to 80 percent reduction). Unknown. Unknown. Moderate to good.
2. Capital Cost Moderate.
3- Operation and Maintenance
Low, but may interfere with the use of large equipment.
4- Longevity Excellent.
5 Confidence Good.
6-Adaptability Excellent.
'•Potential Treatment Side Effects
None identified.
8. Concurrent Land ^Mjnagement Practices
Conservative tillage, integrated pest management, fertilizer management, animal waste management.
Haul Roads and SkidTrails:This practice is implemented prior to logging operations. It involves the appropriate site selection and design of haul road and skid trails. Haul roads and skid trails should be located away from streams and lakes. Recommended guidelines for gradient, drainage, soil stabilization, and filter strips should be followed. Routes should be situated across slopes rather than up or down slopes. If the natural drainage is disrupted, then artificial drainage should be provided. Logging operations should be restricted during adverse weather periods. Other goods practices include ground covers (rock or grass) closing roads when not in use, closing roadways during wet periods, and returning main haul roads to prelogging conditions when logging ceases .
CRITERIA R E M A R K S
1. Effectiveness a) Sediment
b) Nitrogen (N) c) Phosphorus (P) d) Runoff
Good if grass cover is used on haul roads (45 percent reduction); Excellent if crushed rock is used as ground cover (92 percent reduction). Unknown. Unknown. Unknown.
2. Capital Cost High/grass cover plus fertilizer $5.37/100 ft roadbed, crushed rock (6 in) $179.01/100 ft roadbed.
3. Operation and Maintenance
High, particularly with grass which may have to be replenished routinely and may not be effective on highly traveled roads.
4. Longevity Unknown.
5. Confidence Good for ground cover, poor for nutrients.
6. Adaptability Good.
7. Potential Treatment Side Effects
Potential increase in nutrients to water course if excess fertilizers are applied.
8. Concurrent Land Management Practices
Maintain natural waterways.
Maintain Natural Waterways: This practice disposes of tree tops and slash in areas away from waterways. Prevents the buildup of damming debris. Stream crossings are constructed to minimize impacts on flow characteristics.
CRITERIA R E M A R K S
1. Effectiveness a) Sediment
b) Nitrogen (N) c) Phosphorus (P) d) Runoff
Fair to good, prevents acceleration of bank and channel erosion. Unknown, contribution would be from decaying debris. Unknown, contribution would be from decaying debris. Fair to good, prevents deflections or constrictions of stream water flow which may accelerate bank and channel erosion.
2. Capital Cost Low, supervision required to ensure proper disposal of debris.
3. Operation and Maintenance
Low, if proper supervision during logging is maintained, otherise $160-$800 per 100 ft stream.
4. Longevity Good.
5. Confidence Good.
6. Adaptability Excellent.
7. PotentialTreatment Side Effects
None identified.
8. Concurrent Land Management Practices
Proper design and location of haul and skid trails; Streamside management zones.
D-5
Appendix E
Chesprocott Health District
A Regulation Pertaining to Underground Petroleum Storage Facilities
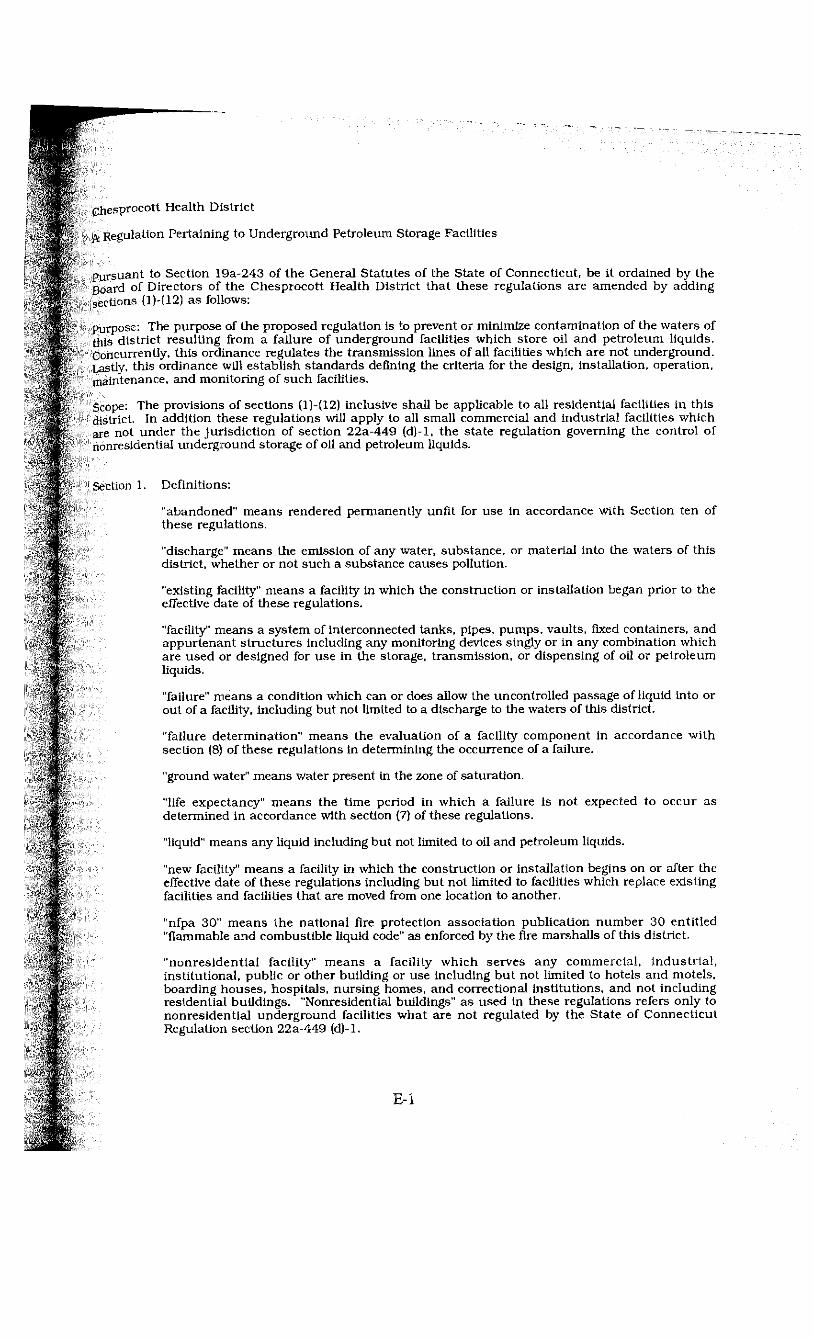
Clicsprocott Health District \ Regulation Pertaining to Underground Petroleum Storage Facilities
Pursuant to Section 19a-243 of the General Statutes of the State of Connecticut, be it ordained by the Board of Directors of the Chesprocott Health District that these regulations are amended by adding sections (1)-(12) as follows:
Purpose: The purpose of the proposed regulation is to prevent or minimize contamination of the waters of lliis district resulting from a failure of underground facilities which store oil and petroleum liquids. Concurrently, this ordinance regulates the transmission lines of all facilities which are not underground. Lastly, this ordinance will establish standards defining the criteria for the design, installation, operation, maintenance, and monitoring of such facilities.
Scope: The provisions of sections (1)-(12) inclusive shall be applicable to all residential facilities in this district. In addition these regulations will apply to all small commercial and industrial facilities which are not under the jurisdiction of section 22a-449 (d)-l, the state regulation governing the control of nonresidential underground storage of oil and petroleum liquids.
Section 1. Definitions: "abandoned" means rendered permanently unfit for use in accordance with Section ten of these regulations.
"discharge" means the emission of any water, substance, or material into the waters of this district, whether or not such a substance causes pollution.
"existing facility" means a facility in which the construction or installation began prior to the effective date of these regulations.
"facility" means a system of interconnected tanks, pipes, pumps, vaults, fixed containers, and appurtenant structures including any monitoring devices singly or in any combination which are used or designed for use in the storage, transmission, or dispensing of oil or petroleum liquids.
"failure" means a condition which can or does allow the uncontrolled passage of liquid into or out of a facility, including but not limited to a discharge to the waters of this district.
"failure determination" means the evaluation of a facility component in accordance with section (8) of these regulations in determining the occurrence of a failure.
"ground water" means water present in the zone of saturation.
"life expectancy" means the time period in which a failure is not expected to occur as determined in accordance with section (7) of these regulations.
"liquid" means any liquid including but not limited to oil and petroleum liquids.
"new facility" means a facility in which the construction or installation begins on or after the effective date of these regulations including but not limited to facilities which replace existing facilities and facilities that are moved from one location to another.
"nfpa 30" means the national fire protection association publication number 30 entitled "flammable and combustible liquid code" as enforced by the fire marshalls of this district.
"nonresidential facility" means a facility which serves any commercial, industrial, institutional, public or other building or use including but not limited to hotels and motels, boarding houses, hospitals, nursing homes, and correctional institutions, and not including residential buildings. "Nonresidential buildings" as used in these regulations refers only to nonresidential underground facilities what are not regulated by the State of Connecticut Regulation section 22a-449 (d)-l.
E~ 1
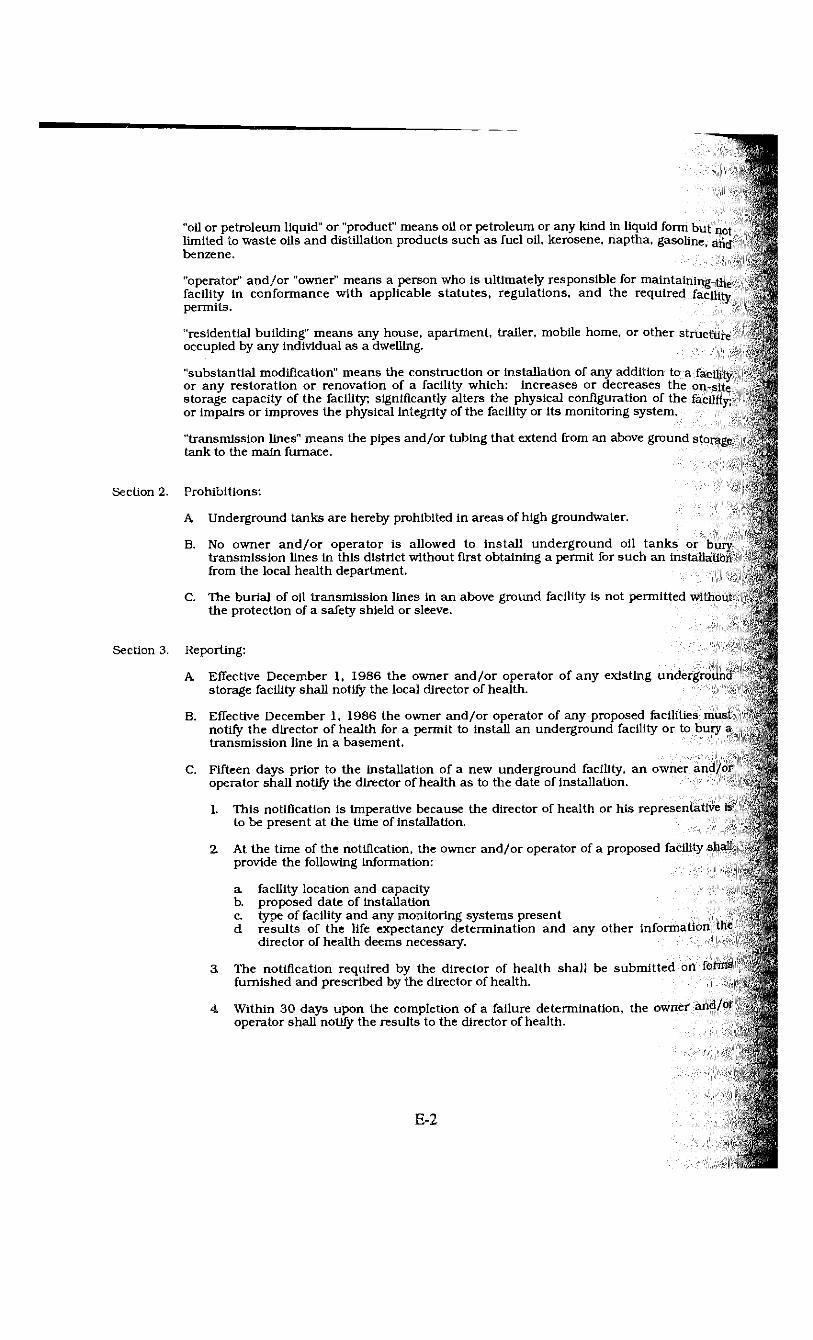
"oil or petroleum liquid" or "product" means oil or petroleum or any kind in liquid form but not limited to waste oils and distillation products such as fuel oil, kerosene, naptha, gasoline, and benzene.
"operator" and/or "owner" means a person who is ultimately responsible for maintaining the facility in conformance with applicable statutes, regulations, and the required facility permits.
"residential building" means any house, apartment, trailer, mobile home, or other structure occupied by any individual as a dwelling.
"substantial modification" means the construction or installation of any addition to a facility or any restoration or renovation of a facility which: increases or decreases the on-site storage capacity of the facility: significantly alters the physical configuration of the facility; or impairs or improves the physical integrity of the facility or its monitoring system.
"transmission lines" means the pipes and/or tubing that extend from an above ground storages tank to the main furnace.
Section 2. Prohibitions: A Underground tanks are hereby prohibited in areas of high groundwater.
B. No owner and/or operator is allowed to install underground oil tanks or bury transmission lines in this district without first obtaining a permit for such an installation from the local health department.
C. The burial of oil transmission lines in an above ground facility is not permitted without the protection of a safety shield or sleeve.
Section 3. Reporting: A Effective December 1, 1986 the owner and/or operator of any existing underground
storage facility shall notify the local director of health.
B . Effective December 1, 1986 the owner and/or operator of any proposed facilities must notify the director of health for a permit to install an underground facility or to bury a transmission line in a basement.
C. Fifteen days prior to the installation of a new underground facility, an owner and/or operator shall notify the director of health as to the date of installation.
1. This notification is imperative because the director of health or his representative is to be present at the time of installation.
2 At the time of the notification, the owner and/or operator of a proposed facility shall provide the following information:
a facility location and capacity b. proposed date of installation c. type of facility and any monitoring systems present d results of the life expectancy determination and any other information the
director of health deems necessary.
a The notification required by the director of health shall be submitted on forms furnished and prescribed by the director of health.
4 Within 30 days upon the completion of a failure determination, the owner and/or operator shall notify the results to the director of health.
Design, Construction, Installation, and Maintenance A All new facilities and any new components of a substantially modified facility shall
conform to the following standards.
1. Each underground tank shall:
a be a listed-fiberglass-reinforced plastic (frp) tank which is equipped with overfill protection and contact plates under all fill and gauge openings and is chemically compatible with the contained oil or petroleum liquids as determined by the tank manufacture's warranty;
b. be a listed steel tank with overfill expansion and externally coated with a factory applied resistant coating approved by the manufacturer for the proposed purpose, and equipped with cathodic protection and permanent cathodic protection monitoring devices, and contact plates under all fill and gauge openings.
2 Be designed specifically for the purpose of underground installation.
a All underground facility components shall be designed, constructed, and installed so as to allow failure determination of all underground storage and piping without substantial excavation.
4 All cathodic protection systems that protect underground tank components shall be tested annually. A structure to soil test voltage reading of at least negative 0.85 volts measured between the structure and the copper-copper sulfate electrode must be maintained. Voltage drops other than those across the structure electrolyte boundary must be considered for valid interpretation of the voltage measurements. This yearly record of voltage output shall be maintained by the owner and/or operator. If any cathodic protection system malfunctions or fails to meet the above structure to soil test voltage requirement, it shall be repaired as quickly as possible but in no event later than thirty days from the date of discovery that the measures are not sufficient to maintain the structure to soil test voltage of at least negative 0.85 volts.
a it is the responsibility of the owner to correct any malfunction of the cathodic protection system and report correction to the director of health within 15 days.
5 No owner and/or operator of an existing tank shall use or operate any component of a facility beyond three years after the effective date of these regulations, or longer than three years beyond its life expectancy, whichever is later, unless the existing facility is tested every three years. Otherwise, the existing facility shall be removed or abandoned in acccordance with procedures specified in nfpa 30.
6 No underground storage facility shall be moved from one location to another without prior written approval by the director of health.
7. The installation and maintenance of all underground components of a new facility shall comply in accordance with the nfpa 30 and the following specification:
a For coated steel components the excavation shall be free from materials that may cause damage to the tank coating. Extreme care shall be taken during installation to prevent the introduction of foreign material into the excavation or backfill.
b. The excavation shall extend a distance of at least one foot around the perimeter of the underground facility component.
c. To insure compliance to these regulations the tank and piping shall be pressured tested at the jobsite before being covered, enclosed, or placed in use. The pressure shall not exceed 5 pounds per square inch (psi) during which time a soap solution shall be brushed over the weld seams and pipe joints. Tin caps shall be replaced with pipe plugs or cap piping before testing.
d The bottom of the excavation should be firm and level and then covered with at least a foot of non-corrosive material such as sand, pea gravel, or no. 8 crushed stone. A full length concrete pad shall be placed into the excavation.
e. At least 6 inches and preferably 12 inches of clean sand, pea gravel, or no. 8 crushed stone must be placed on the entire surface of the pad to separate the tank from the concrete pad.
f The remainder of the excavated area shall be contained with at least 6 inches of clean sand, pea gravel, or no. 8 crushed stone,. Ashes, stones, and other corrosive materials are not to contact the tank or its components.
g. The tank must be 24-36 inches below the grade or paving. If the need arises to install a tank greater than 36 inches the tank manufacturer must be consulted for additional specifications and recommendations.
h If a manufacturer's specifications or recommendations are inconsistent with any of these regulations, the provisions which impose the most stringent and protective requirements shall prevail. Within thirty days following the completion of installation, the owner and/or operator shall submit to the director of health a statement signed by the installation contractor and the representative of the health department that the installation has been carried out in accordance with this subsection.
Section 5. Transfer or Ownership In the event that an owner and/or operator shall transfer the ownership of an underground facility a full disclosure to the transferee of the status of the facility with respect to these regulations shall be submitted at least 15 days prior to the transfer. The disclosure shall include any information previously submitted to the director of health.
Section 6. Records The owner of a new or existing facility shall assure the maintenance of up-to-date records of significant installation activities, substantial modification, abandonment, removal, or replacement of underground components or any protective devices for such components, and any other information required by the director of health. An owner and/or operator shall review all records and attest to their accuracy by signing the records no later than 7 days following the completion of the recorded activity. All records must be copied and submitted to the director of health within thirty days of the completion.
Section 7. Life Expectancy Life expectancy is defined as follows:
A For a fiber-glass reinforced plastic (frp) facility and component, the period of the manufacturer's corrosion warranty.
B. For a cathodically protected facility component which meets the requirements of subsection 4a(l)-(7) of these regulations, the period of the manufacturer's corrosion warranty or the life expectancy of the existing or replaced anode(s) as calculated using standard formulas approved in writing by the director of health.
C. For existing facility components that are not in compliance of these regulations, 15 years from the date of installation. If the date of installation cannot be documented, the life expectancy shall be determined by a method approved by the director of health.
E-4
i
• P
X Serlien 8. Failure Determination * A The failure determination on all existing facility components not in compliance with | these regulations shall be carried out within 33 to 36 months prior to the end of the life
expectancy. These existing facility components shall undergo hydrostatic pressure testing or other approved means every 3 years. If the existing facility is not functioning adequately, it shall be abandoned, replaced, or substantially modified in accordance with these regulations.
B. Failure determination on new facility components shall be done at least 6-12 months \ prior to the end of the life expectancy. At this time the facility components shall undergo
hydrostatic pressure testing or other approved means by the director of health. If the ' facility is determined to be in good condition and will remain in use, hydrostatic pressure
testing shall be repeated in 3 years. No new facility shall remain underground greater than 5 years beyond its life expectancy. At this time, the facility component shall be abandoned, replaced or substantially modified in accordance to these regulations.
SiTiionQ. Failures i A An owner and/or operator of a new or existing facility shall report any failures to the
director of health immediately.
B. An owner and/or operator of a leaking transmission line must report any failure to the director of health immediately.
C. The owner and/or operator of a new or existing facility in which a failure occurs shall immediately empty the failed facility component within 24 hours and discontinue use of the failed facility component; and:
i 1. Remove, repair, or abandon it within 90 days in accordance to the procedures \ specified in nfpa 30; or
2 Replace all damaged components within 30 days in accordance with the standards listed in these regulations.
3 If the repair to an existing oil transmission line is made, a sleeve or shield shall be placed on the line at the time of the repair.
4 An owner and/or operator of a new or existing facility which discharges oil or petroleum liquid to the environment shall immediately cease such a discharge and reclaim, recover, and properly dispose of the discharged liquid and any other substances contaminated by it. Restoration of the environment shall be of a quality and condition acceptable to the director of health.
S- (Hon 10. Abandoned Facility
A An owner and/or operator shall notify the director of health in writing within 30 days when a new or existing facility component part is abandoned.
B. A facility or facility component shall be abandoned in accordance with procedures specified in nfpa 30.
C. No owner and/or operator shall use or operate an abandoned facility.
E-5
Section 11. Penalties for Violations An owner and/or operator in violation of any of these regulations adopted under sections (l). (12), inclusive, shall be fined no greater than $100 nor less than $25 depending upon the violation. Each day that a violation of these regulations continues constitutes a separate violation.
Section 12. Severability Clause Should any section, paragraph, sentence, clause, or phrase of these regulations be declared unconstitutional or invalid for any reason, the remainder of said regulations shall not be affected thereby.
Adopted: October 15, 1986 Board of Directors Chesprocott Health District 91 North Brooksvale Road Cheshire, CT 06410
E-6
Appendix F
Section 22a-449(d)-l (as amended through February, 1990)
Control of Nonresidential Underground Storage and Handling of Oil and
Petroleum Liquids
j^i.1,ul,ll';:riC of Connecticut State Agencies are amended by adding Section 22a-449(d)-l as follow : c riioii 22a- :4i"id)-l. Control of the nonresidential underground storage and handling of oil " e t 1 and petroleum liquids.
(a) Dcfi"i|>(,,ls
alwiuU: ied" means rendered permanently unfit for use.
"abno.ii-'j :">:>s or gain" means an apparent loss or gain in liquid exceeding 0.5 percent of (1) llii- voU'-.'c rf product used or sold by the owner or operator during any seven consecutive day period, or <2) the volumetric capacity of the tank or container; whichever is greater, as rjfifrniiP.-c. by reconciliation of inventory measurements made in accordance with siit>so<-;i; " j'J of these regulations.
"disc!:.•-•go" means the emission of any water, substance or material into the waters of the suite, v'.i.-'-vr or not such substance causes pollution.
"existing facility" means a facility the construction or installation of which began prior to the elTeriiw c'ate of these regulations.
faciliiy" means a system of interconnected tanks, pipes, pumps, vaults, fixed containers and appuruv.int structures, singly or in any combination, which are used or designed to be used for ilu* storage, transmission or dispensing of oil or petroleum liquids, including any nioniionng devices. As used in these regulations, the term "facility" refers only to nonresid. ntial underground facilities.
"fail in e" means a condition which can or does allow the uncontrolled passage of liquid into or out of a lacility, and includes but is not limited to a discharge to the waters of the state without .-. permit issued pursuant to Section 22a-430 of the General Statutes.
"failure determination" means the evaluation of a facility component in accordance with subset-U:m (i) of these regulations to determine whether a failure has occurred.
"lift* oxivctancy" means the time period within which a failure is not expected co occur as deterrni'-.-d in accordance with subsection (h) of these regulations.
"life expectancy determination" means the evaluation of a facility component in accordance willi Midsection (h) of these regulations to determine its life expectancy.
"liquid" means any liquid, including but not limited to oil and petroleum liquids.
"lisle:1" • ^ans included in a list published by a testing laboratory which (1) is approved by the Commissioner of Environmental Protection in consultation with the Bureau of the State Fire Mar.-.iir.':, (2) maintains periodic inspection of production of listed equipment or materials, and (;">; .<• tates in their listing either that the equipment, material or procedure meets approp.-'ate standards or has been tested and found suitable for use in a specified manner.
"'!<">'" t: ' :iity" means a facility the construction or installation of which begins on or after the effet ii>\. date of these regulations, including but not limited to facilities which replace existinf facilities and facilities which are moved from one location to another.
-<q" means National Fire Protection Association publication number 30 entitled, "Flaminjible and Combustible Liquids Code ", as enforced by the State Fire Marshal pursuant to S -ci'.-.;n 29-320 of the Connecticut General Statutes, as amended.
"tio;>res'cIential" when referring to a facility means a facility which serves any commercial, indust.-;al, institutional, public or other building, including but not limited to hotels and moi boarding houses, hospitals, nursing homes and correctional institutions, but not •nc'i'd'- « residential buildings.
F-1
"oil or petroleum liquid" or "product" means oil or petroleum of any kind in liquid form including but not limited to waste oils and distillation products such as fuel oil, kerosene, naphtha, gasoline and benzene.
"operator" means the person or municipality in control of, or having responsiblity for, the daily operation of a facility.
"owner" means the person or municipality in possession of or having legalownership of a facility.
"residential building" means any house, apartment, trailer, mobile home or other structure occupied by individuals as a dwelling.
"substantial modification" means the construction or installation of any addition to a facility or any restoration or renovation of a facility which: increases or decreases the on-site storage capacity of the facility, significantly alters the physical configuration of the facility; or impairs or improves the physical integrity of the facility or its monitoring systems. "Substantial modification" shall not include a modification for the purpose of extending life expectancy in accordance with subparagraph (h)(2)(D) of these regulations.
"temporarily out-of-service" means not in use, in that no regular filling or drawing is occurring; or not established and maintained in accordance with these regulations; or not regularly attended and secured.
"underground" when referring to a facility or facility component means that ten percent or more of the volumetric capacity of the facility or component is below the surface of the ground and that portion which is below the surface of the ground is not fully visible for inspection.
(b) Discharges prohibited
No owner or operator shall discharge any water, substance or material, including but not limited to oil or petroleum liquids, from any facility to the waters of the state without first obtaining a permit for such discharge pursuant to Section 22a-430 of the General Statutes, as amended.
(c) Exemptions
(1) Facilities which meet all of the following criteria are exempt from subsections (d), (g), (h) and (i) of these regulations:
(A) the nominal capacity exclusive of piping is less than two thousand one hundred (2,100) gallons;
(B) the sole intended use of the oil or petroleum liquid is for on-site heating or intermittent stationary power production such as stand-by electricity generation or irrigation pump power,
(C) the oil or petroleum liquid stored is not intended for resale; and
(D) the facility is not used for the storage or handling of waste oil.
(2) Facilities which are used solely for the storage, transmission or dispensing of viscous od or petroleum liquids which will not flow at temperatures below sixty degrees Fahrenheit (60°) are exempt from the requirements of these regulations.
(3) Facilities used solely for on-site heating, process steam generation, other on-site combustion or manufacturing processes or waste oil storage are exempt from subdivision (g)(2).
F-2
[d) Reporting (1) By May 8, 1986, the owner or operator of each existing facility shall notify the
commissioner and the office of the local fire marshal of the results of the life expectancydeterminatlon required by subsection (h).
(2) Within thirty days following completion of Installation of a new facility an owner or operator shall notify the commissioner and the office of the local fire marshal of the results of the life expectancy determination required by subsection ( h) .
(3) The notification required by subdivisions (1) and (2) of this subsection shall include but not be limited to the following: facility location and capacity, date of installation, contents, type of facility, and type of monitoring systems, if any, results of life expectancy determinations, and any other information which the commissioner deems necessary.
(4) By May 8, 1986, the owner or operator of an abandoned or temporarily out-of-servtce facility shall notify the commissioner of the location, type and capacity of such facility and the date it was abandoned or removed from service.
(5) Within thirty days of completion of a failure determination required by subsection (i), the owner or operator shall notify the commissioner and the office of the local fire marshal of the result of such failure determination.
(6) Owners and operators shall report any changes in information provided in accordance with this subsection within thirty days.
(7) Each notification required by this subsection shall be submitted on forms furnished or prescribed by the commissioner.
(e) Design, construction. Installation and maintenance
(1) All new facilities and new components of substantially modified facilities shall conform to the following standards: (A) Each underground tank or container shall:
(i) be a listed fiberglass-reinforced plastic (FRP) tank which is equipped with contact plates under all fill and gauge openings and is chemically compatible with the contained oil or petroleum liquid as determined by the tank or container manufacturer's warranty; or
(ii) be a listed steel tank externally coated with a factory applied corrosion resistant coating approved by the manufacturer for the proposed use, and equipped with cathodic protection and permanent cathodic protection monitoring devices, and contact plates under all fill and gauge openings.
(B) All other underground facility components shall:
(i) be protected against corrosion by Use of non-corrosive materials or steel components with factory applied corrosion resis'cant coating and cathodic protection and permanent cathodic protection monitoring devices;
(ii) be designed, constructed and installed so as to allow failure determination of all underground piping without the need for substantial excavation; and
(iii) be chemically compatible with the contained oil or petroleum liquid as determined by the manufacturer's warranty.
(C) The installation and maintenance of underground components of new facilities and the substantial modification of underground components of new or existing facilities shall be done in accordance with NFPA 30 and the manufacturer's specifications and recommendations. If provisions of NFPA 30 are inconsistent with the manufacturer's specifications or recommendations, the provision which imposes the most stringent
F-3
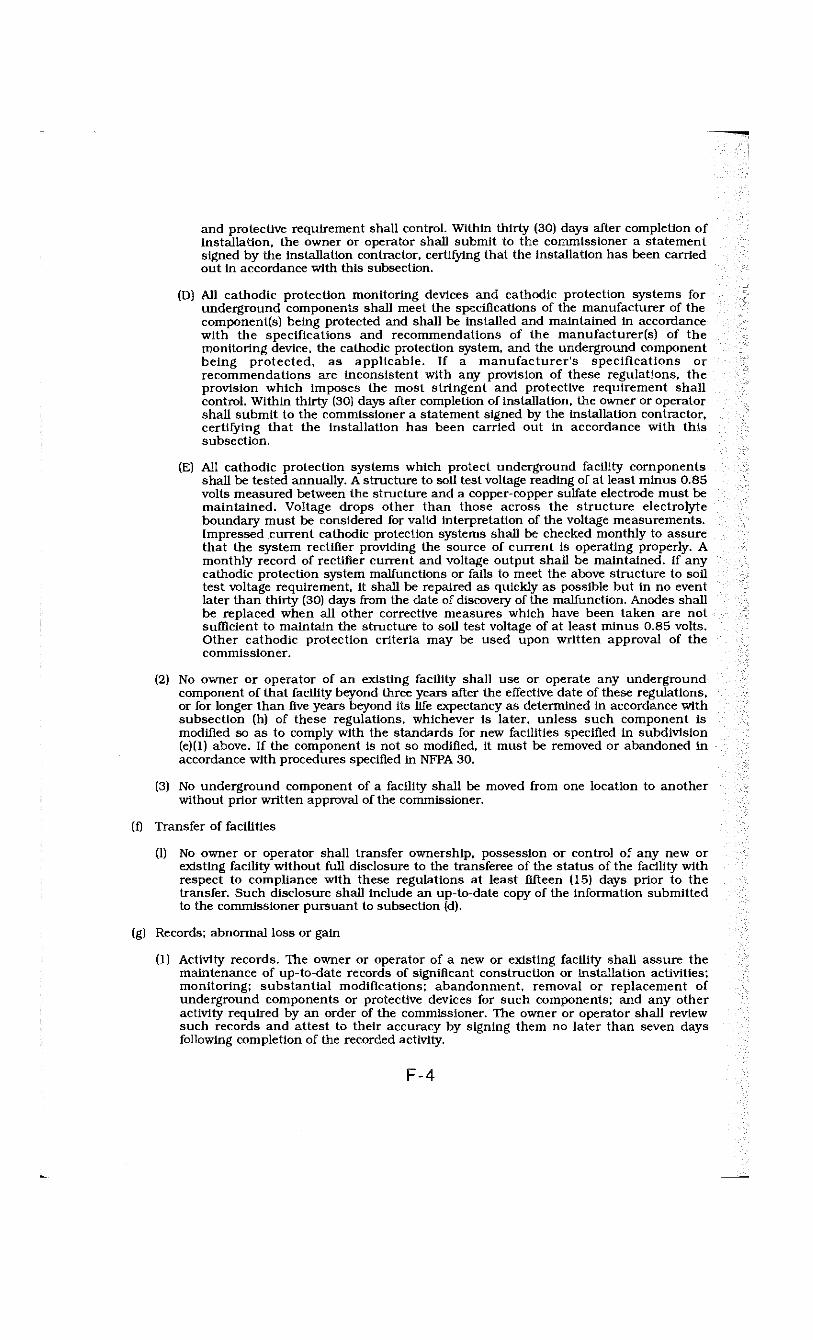
and protective requirement shall control. Within thirty (30) days after completion of installation, the owner or operator shall submit to the commissioner a statement signed by the installation contractor, certifying that the installation has been carried out in accordance with this subsection.
(D) All cathodic protection monitoring devices and cathodic protection systems for underground components shall meet the specifications of the manufacturer of the component(s) being protected and shall be installed and maintained in accordance with the specifications and recommendations of the manufacturer(s) of the monitoring device, the cathodic protection system, and the underground component being protected, as applicable. If a manufacturer's specifications or recommendations are inconsistent with any provision of these regulations, the provision which imposes the most stringent and protective requirement shall control. Within thirty (30) days after completion of installation, the owner or operator shall submit to the commissioner a statement signed by the installation contractor, certifying that the installation has been carried out in accordance with this subsection.
(E) All cathodic protection systems which protect underground facility components shall be tested annually. A structure to soil test voltage reading of at least minus 0.85 volts measured between the structure and a copper-copper sulfate electrode must be maintained. Voltage drops other than those across the structure electrolyte boundary must be considered for valid interpretation of the voltage measurements. Impressed current cathodic protection systems shall be checked monthly to assure that the system rectifier providing the source of current is operating properly. A monthly record of rectifier current and voltage output shall be maintained. If any cathodic protection system malfunctions or fails to meet the above structure to soil test voltage requirement, it shall be repaired as quickly as possible but in no event later than thirty (30) days from the date of discovery of the malfunction. Anodes shall be replaced when all other corrective measures which have been taken are not sufficient to maintain the structure to soil test voltage of at least minus 0.85 volts. Other cathodic protection criteria may be used upon written approval of the commissioner.
(2) No owner or operator of an existing facility shall use or operate any underground component of that facility beyond three years after the effective date of these regulations, or for longer than five years beyond its life expectancy as determined In accordance with subsection (h) of these regulations, whichever is later, unless such component is modified so as to comply with the standards for new facilities specified in subdivision (e)(1) above. If the component is not so modified, it must be removed or abandoned in accordance with procedures specified in NFPA 30.
(3) No underground component of a facility shall be moved from one location to another without prior written approval of the commissioner.
(f) Transfer of facilities
(1) No owner or operator shall transfer ownership, possession or control of any new or existing facility without full disclosure to the transferee of the status of the facility with respect to compliance with these regulations at least fifteen (15) days prior to the transfer. Such disclosure shall include an up-to-date copy of the information submitted to the commissioner pursuant to subsection (d).
(g) Records; abnormal loss or gain
(1) Activity records. The owner or operator of a new or existing facility shall assure the maintenance of up-to-date records of significant construction or installation activities; monitoring; substantial modifications; abandonment, removal or replacement of underground components or protective devices for such components; and any other activity required by an order of the commissioner. The owner or operator shall review such records and attest to their accuracy by signing them no later than seven days following completion of the recorded activity.
F-4
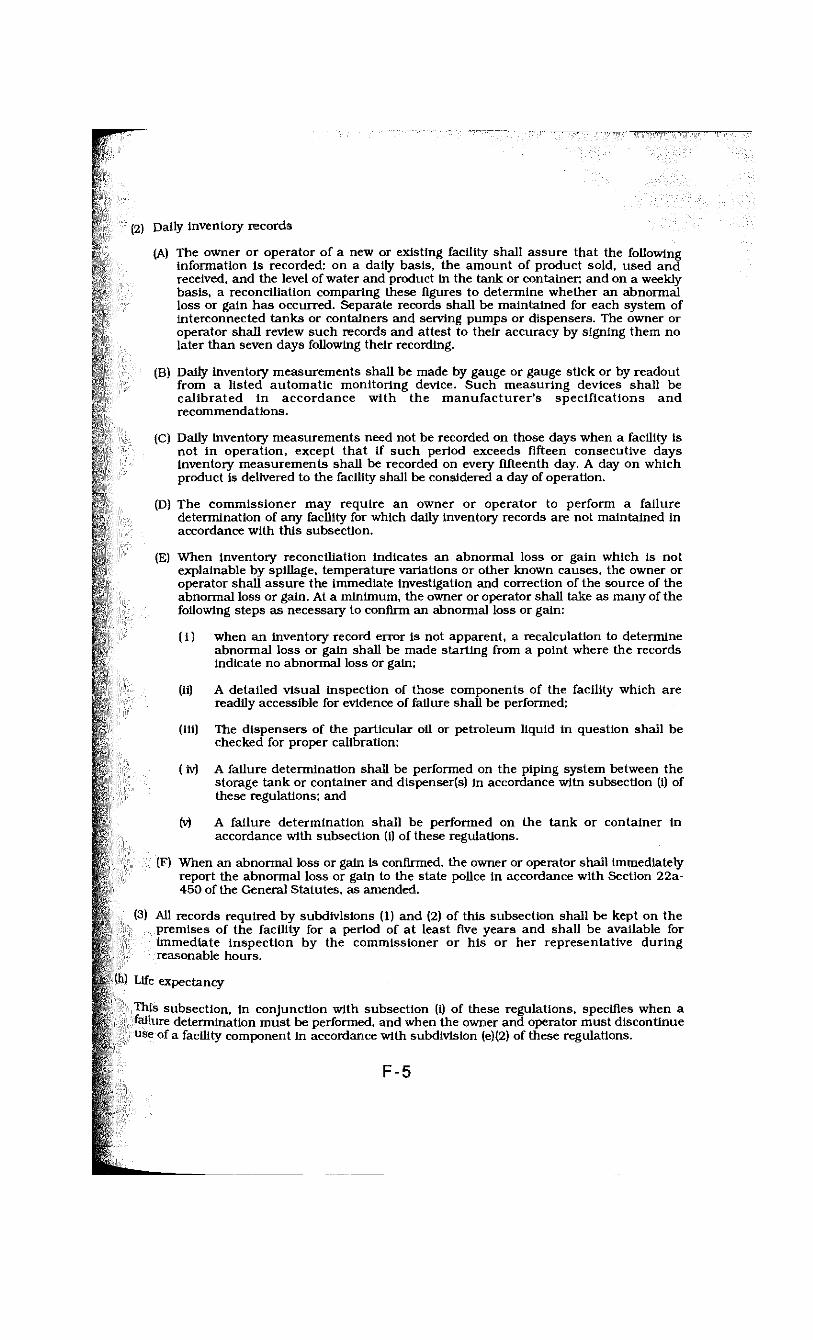
(2) Da >/ inventory records (Al The owner or operator of a new or existing facility shall assure that the following
i-.formation is recorded: on a daily basis, the amount of product sold, used and -ereived, and the level of water and product in the tank or container; and on a weekly br.s's, a reconciliation comparing these figures to determine whether an abnormal loss or gain has occurred. Separate records shall be maintained for each system of .nlerconnected tanks or containers and serving pumps or dispensers. The owner or operator shall review such records and attest to their accuracy by signing them no Inter than seven days following their recording.
[{',) Daily inventory measurements shall be made by gauge or gauge stick or by readout fro'Ti a listed automatic monitoring device. Such measuring devices shall be calibrated in accordance with the manufacturer's specifications and T ecommendations.
(C Dni!y inventory measurements need not be recorded on those days when a facility is not in operation, except that if such period exceeds fifteen consecutive days inventory measurements shall be recorded on every fifteenth day. A day on which product is delivered to the facility shall be considered a day of operation.
((")) The commissioner may require an owner or operator to perform a failure determination of any facility for which daily inventory records are not maintained in accordance with this subsection.
i'E) "When inventory reconciliation indicates an abnormal loss or gain which is not explainable by spillage, temperature variations or other known causes, the owner or operator shall assure the immediate investigation and correction of the source of the nbr.ormal loss or gain. At a minimum, the owner or operator shall take as many of the following steps as necessary to confirm an abnormal loss or gain:
11) when an inventory record error is not apparent, a recalculation to determine abnormal loss or gain shall be made starting from a point where the records indicate no abnormal loss or gain;
(it) A detailed visual inspection of those components of the facility which are readily accessible for evidence of failure shall be performed;
('.II) The dispensers of the particular oil or petroleum liquid in question shall be checked for proper calibration;
i v) A failure determination shall be performed on the piping system between the storage tank or container and dispenser(s) in accordance witn subsection (i) of these regulations; and
(vl A failure determination shall be performed on the tank or container in accordance with subsection (i) of these regulations.
(F) nen an abnormal loss or gain is confirmed, the owner or operator shall immediately r?-ort the abnormal loss or gain to the state police in accordance with Section 22a-450 of the General Statutes, as amended.
(3) A'! ffcords required by subdivisions (1) and (2) of this subsection shall be kept on the urr-.ises of the facility for a period of at least five years and shall be available for Imrnec-iate inspection by the commissioner or his or her representative during rensonnble hours.
(h) Life expectancy
This, :r-ertion, in conjunction with subsection (i) of these regulations, specifies when a failure extermination must be performed, and when the owner and operator must discontinue use ; "r -;'ity component in accordance with subdivision (e)(2) of these regulations.
F-5
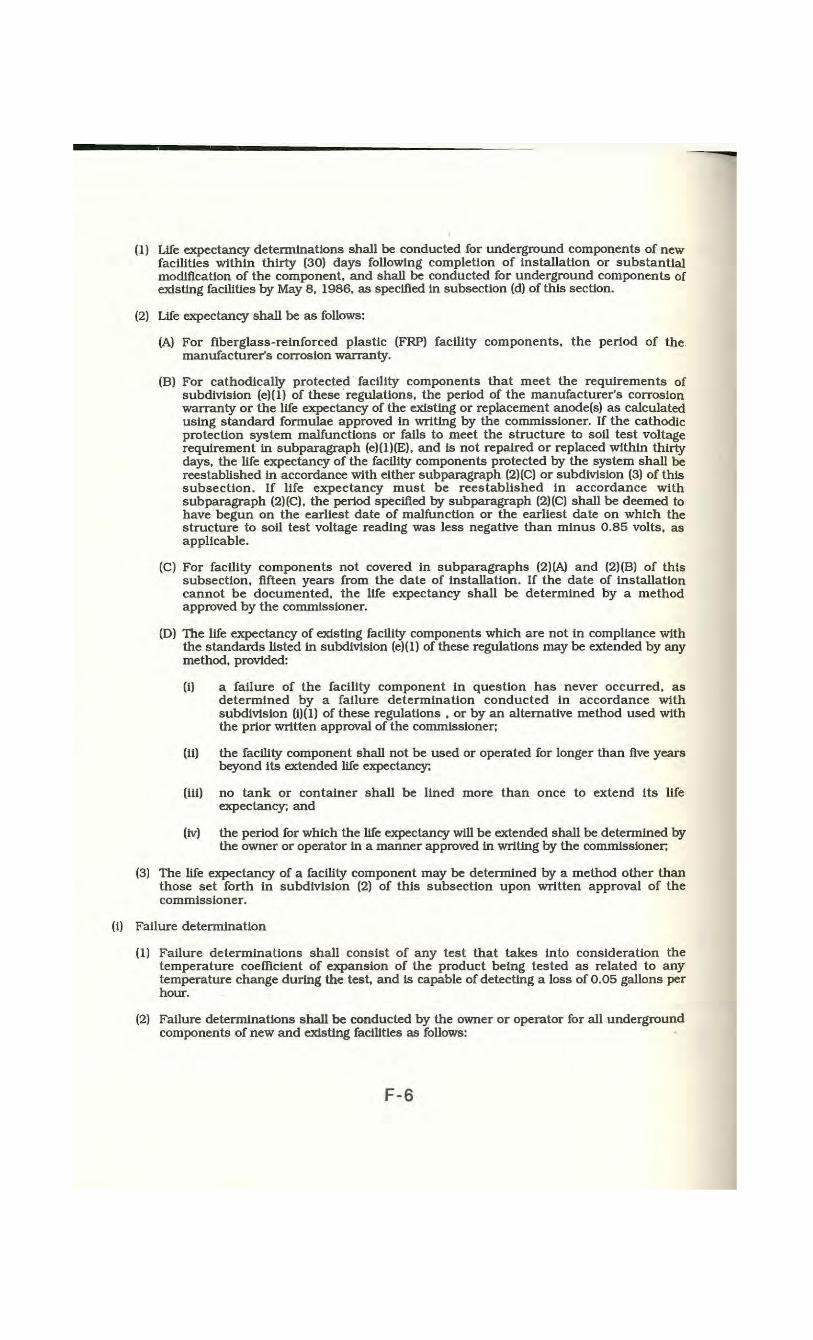
(1) Life expectancy determinations shall be conducted for underground components of new facilities within thirty (30) days following completion of installation or substantial modification of the component, and shall be conducted for underground components of existing facilities by May 8, 1986, as specified in subsection (d) of this section.
(2) Life expectancy shall be as follows:
(A) For fiberglass-reinforced plastic (FRP) facility components, the period of the manufacturer's corrosion warranty.
(B) For cathodically protected facility components that meet the requirements of subdivision (e)(1) of these regulations, the period of the manufacturer's corrosion warranty or the life expectancy of the existing or replacement anode(s) as calculated using standard formulae approved in writing by the commissioner. If the cathodic protection system malfunctions or fails to meet the structure to soil test voltage requirement in subparagraph (e)(1)(E), and is not repaired or replaced within thirty days, the life expectancy of the facility components protected by the system shall be reestablished in accordance with either subparagraph (2)(C) or subdivision (3) of this subsection. If life expectancy must be reestablished in accordance with subparagraph (2)(C), the period specified by subparagraph (2)(C) shall be deemed to have begun on the earliest date of malfunction or the earliest date on which the structure to soil test voltage reading was less negative than minus 0.85 volts, as applicable.
(C) For facility components not covered in subparagraphs (2) (A) and (2)(B) of this subsection, fifteen years from the date of installation. If the date of installation cannot be documented, the life expectancy shall be determined by a method approved by the commissioner.
(D) The life expectancy of existing facility components which are not in compliance with the standards listed in subdivision (e)(1) of these regulations may be extended by any method, provided:
(i) a failure of the facility component in question has never occurred, as determined by a failure determination conducted in accordance with subdivision (i)(l) of these regulations , or by an alternative method used with the prior written approval of the commissioner;
(ii) the facility component shall not be used or operated for longer than five years beyond its extended life expectancy;
(iii) no tank or container shall be lined more than once to extend its life expectancy; and
(iv) the period for which the life expectancy will be extended shall be determined by the owner or operator in a manner approved in writing by the commissioner;
(3) The life expectancy of a facility component may be determined by a method other than those set forth in subdivision (2) of this subsection upon written approval of the commissioner.
(i) Failure determination
(1) Failure determinations shall consist of any test that takes into consideration the temperature coefficient of expansion of the product being tested as related to any temperature change during the test, and is capable of detecting a loss of 0.05 gallons per hour.
(2) Failure determinations shall be conducted by the owner or operator for all underground components of new and existing facilities as follows:
F-6
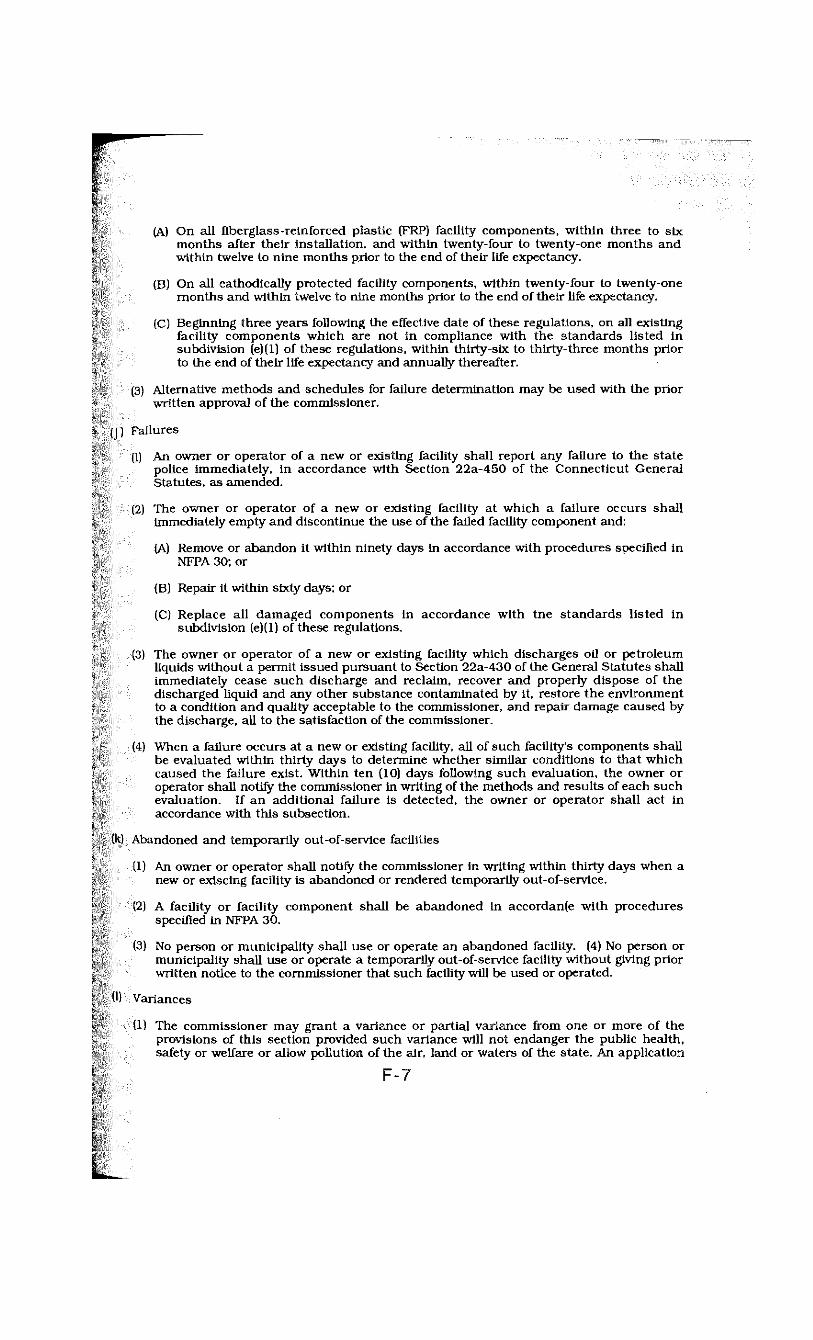
(A) On all fiberglass-reinforced plastic (FRP) facility components, within three to six months after their installation, and within twenty-four to twenty-one months and .vithin twelve to nine months prior to the end of their life expectancy.
(£5) On all cathodically protected facility components, within twenty-four to twenty-one months and within twelve to nine months prior to the end of their life expectancy.
(CI beginning three years following the effective date of these regulations, on all existing facility components which are not in compliance with the standards listed in subdivision (e)(1) of these regulations, within thirty-six to thirty-three months prior io 'he end of their life expectancy and annually thereafter.
(3) /Jicnative methods and schedules for failure determination may be used with the prior wriilcn approval of the commissioner.
(j) F a i l u r e
(1) Aj i owner or operator of a new or existing facility shall report any failure to the state poll"e immediately, in accordance with Section 22a-450 of the Connecticut General S:i>U.U'S, as amended.
(2) T"e owner or operator of a new or existing facility at which a failure occurs shall immediately empty and discontinue the use of the failed facility component and:
(A) Remove or abandon it within ninety days in accordance with procedures specified in NFPA 30; or
(B) Repair it within sixty days: or
(C) Replace all damaged components in accordance with tne standards listed in subdivision (e)(1) of these regulations.
(3) Th.-* owner or operator of a new or existing facility which discharges oil or petroleum liqu'ds without a permit issued pursuant to Section 22a-430 of the General Statutes shall immediately cease such discharge and reclaim, recover and properly dispose of the oisc'ifu-ged liquid and any other substance contaminated by it, restore the environment to a condition and quality acceptable to the commissioner, and repair damage caused by Hie discharge, all to the satisfaction of the commissioner.
(1) Vhon a failure occurs at a new or existing facility, all of such facility's components shall hi- evaluated within thirty days to determine whether similar conditions to that which crvised the failure exist. Within ten (10) days following such evaluation, the owner or ocr-aior shall notify the commissioner in writing of the methods and results of each such evaluation. If an additional failure is detected, the owner or operator shall act in prrr-rdance with this subsection.
Ik) Al>;i penned and temporarily out-of-service facilities
(1) An owner or operator shall notify the commissioner in writing within thirty days when a n.-'v or exiscing facility is abandoned or rendered temporarily out-of-service.
(1) >. KH-Uity or facility component shall be abandoned in accordanfe with procedures specified in NFPA 30.
(3) No person or municipality shall use or operate an abandoned facility. (4) No person or •iH'.Uripality shall use or operate a temporarily out-of-service facility without giving prior v~''len notice to the commissioner that such facility will be used or operated.
(1) vr..-i-..ifC3
(i 1 v ' v commissioner may grant a variance or partial variance from one or more of the provisions of this section provided such variance will not endanger the public health, ?p >'.y or welfare or allow pollution of the air, land or waters of the state. An application
F-7
for a variance shall be submitted by the owner or operator on a form furnished or prescribed by the commissioner and shall include such information as he or she requires.
(2) Failure to supply all information necessary to enable the commissioner to make a determination regarding the application shall be cause for rejection of the application.
(3) In acting on a request for a variance, the commissioner shall balance the degree to which compliance with the requirement in question would create an undue hardship for the applicant, against the benefit to the environment and the public from the applicant's strict compliance with that requirement.
(4) The commissioner may reject an application for a variance as untimely If it Is received less than ninety days prior to the required date of compliance for which the variance is sought or if the facility is not in compliance with the requirement for which the variance is sought.
(5) The commissioner may limit the duration of a variance and include in a variance any conditions which he or she deems necessary. A variance may be revoked or modified for failure to comply with any such conditions.
F-8
.(•(lon ». Subsection (e) of Section 2~a-449(d)-l of the Regulations of Connecticut .State Agencies is amended to read as follows:
|0) i K-.sign construction, installation and maintenance
(i) AJ' jew facilities and new components of substantially modified facilities shall conform '.o lie following standards:
•. Each underground tank or container shall:
(0 be a listed fiberglass-reinforced plastic (FRP) tank which is equipped with contact plates under all fill and gauge openings and is chemically compatible with the contained oil or petroleum liquid as determined by the tank or container manufacturer's warranty: or
(ii) be a listed steel tank externally coated with a factory applied corrosion resistant coating approved by the manufacturer for the proposed use, and equipped with cathodic protection and permanent cathodic protection monitoring devices, and contact plates under all fill and gauge openings.
d'.! /dl other underground facility components shall:
(i) be protected against corrosion by use of non-corrosive materials or steel components with factory applied corrosslon resistant coating and cathodic protection and permanent cathodic protection monitoring devices;
(ii) be designed, constructed and installed so as to allow failure determination of all underground piping without the need for substantial excavation; and
(iii) be chemically compatible with the contained oil or petroleum liquid as determined by the manufacturer's warranty.
(Ci The installation and maintenanace of underground components of new facilities and ihe substantial modification of underground components of new or existing facilities •.•hall be done in accordance with NFPA 30 and the manufacturer's specifications and -ecommendations. If provisions of NFPA 30 are inconsistent with the manufacturer's specifications or recommendations, the provision which imposes the most stringent and protective requirement shall control. Within thirty (30) days after the completion of installation, the owner or operator shall submit to the commissioner a statement f.iigned by the the installation contractor, certifying that the installation has been carried out in accordance with this subsection.
[["•) '\11 cathodic protection monitoring devices and cathodic protection systems for underground components shall meet the specifications of the manufacturer of the :omponent(s) being protected and shall be installed and maintained in accordance
with the specifications and recommendations of the manufacturer(s) of the monitoring device, the cathodic protection system, and the underground component >eing protected, as applicable. If a manufacturer's specifications or
recommendations are inconsistent with any provision of these regulations, the provision which imposes the most stringent and protective requirement shall control. Within thirty (30) days after completion of installation, the owner or operator ihall submit to the commissioner a statement signed by the installation contractor, :erlifying that the installation has been carried out in accordance with this .-subsection.
Ml cathodic protection sy.stems which protect underground facility components shall be tested annually. A structure to soil test voltage reading of at least minus 0.85 rolts measured between the structure and a copper-copper sulfate electrode must be naintained. Voltage drops other than those across the structure electrolyte boundary must be considered for valid interpretation of the voltage measurements. . mpressed current cathodic protection systems shall be checked monthly to assure
F-9
that the system rectifier providing the source of current is operating properly. A monthly record of rectifier current and voltage output shall be maintained. If any cathodic protection system malfunctions or fails to meet the above structure to soil test voltage requirement, it shall be repaired as quickly as possible but in no event later than thirty (30) days from the date of discovery of the malfunction. Anodes shall be replaced when all other corrective measures which have been taken are not sufficient to maintain the structure to soil test voltage of at least minus 0.85 volts. Other cathodic protection criteria may be used upon written approval of the commissioner.
(2) No owner or operator of an existing facility shall use or operate any underground component of that facility beyond [three years after the effective date of these regulations] SEPTEMBER 1, 1989, or for longer than five years beyond its life expectancy as determined in accordance with subsection (h) of these regulations, whichever is later, unless such component is modified so as to comply with the standards for new facilities specified in subdivision (e)(1) above. If the component is not so modified, it must be removed or abandoned in accordance with procedures specified in NFPA 30.
(3) No underground component of a facility shall be moved from one location to another without prior wri'cten approval oF the commissioner.
Section 2. Subsection (1) of Section 22a-449(d)-l of the Regulations of Connecticut State Agencies is amended to read as follows:
(1) Variances
(1) The commissioner may grant a variance or partial variance from one or more of the provisions of this section provided such variance will not endanger the public health, safety or welfare or allow pollution of the air, land or waters of the state. An application for a variance shall be submitted by the owner or operator on a form furnished or prescribed by the commissioner and shall include such information as he or she requires.
(2) Failure to supply all information necessary to enable the commissioner to make a determination regarding the application shall be cause for rejection of the application.
(3) In acting on a request for a variance, the commissioner shall balance the degree to which compliance with the requirement in question would create an undue hardship for the applicant, against the benefit to the environment and the public from the applicant's strict compliance with that requirement.
(4) The commissioner may reject an application for a variance as untimely if it Is received less than ninety days prior to the required date of compliance for which the variance is sought or if the facility Is not in compliance with the requirement for which the variance is sought. FOR THOSE EXISTING FACILITIES OR UNDERGROUND COMPONENTS WHICH ARE REQUIRED TO BE REMOVED OR MODIFIED BY SEPTEMBER 1, 1989 IN ACCORDANCE WITH SUBPARAGRAPH (e) (2) OF THIS SECTION. NO APPLICATION FOR A VARIANCE FROM THEREQUIREMENTS OF THAT SUBPARAGRAPH SHALL BE ACCEPTED AFTER AUGUST 1, 1988, WHICH DATE WAS THE ORIGINAL DEADLINE FOR SUCH APPLICATIONS WHEN THESE REGULATIONS WERE FIRST ADOPTED.
(5) The commissioner may limit the duration of a variance and include in a variance any conditions which he or she deems necessary. A variance may be revoked or modified for failure to comply with any such conditions. Statement of purpose: Section 22a-449(d)-1 applies to the nonresidential underground storage of oil and petroleum products. These amendments extend the deadline for removal of those underground tanks which have been in use for more than five years longer than the average life expectancy of such tanks. The deadline Is extended from November 1, 1988 to September 1, 1989. [Please note Appendix F has been scanned into this text: Consult the statutes prior to taking action involving this section.]
F-10
Appendix G
Recent State Aquifer Mapping
P.A. 89-305 An Act Concerning Aquifer Protection Areas, and Local Flood and
Erosion Control Boards
P.A. 89-365 An Act Concerning The Clean Up of Hazardous Waste
P.A. 88-324 An Act Requiring Aquifer Mapping
P.A. 88-324 PUBLIC ACTS FEBRUARY 1988 P.A. 88-324
Substitute Senate Bill No. 423 PUBLIC ACT NO. 88-324
N- \CV REQUIRING AQUIFER MAPPING.
Seci'im I . (NEW) As used in sections 2 to 6, inclusive, of this act, isting w e ! | fields" mean well fields in use by a public water supply .•em when mapping is required pursuant to section 3 of this act and rsntial fte" fields" mean those well fields identified as future sources
f sirply i" water supply plan of the public water supply system approved ursuant to section 25-32d of the general statutes.
Sec 2. (NEW) The commissioner of environmental protection 'all establish standards for two levels of modeling and mapping of the
alien in aquifers of well field areas, zones of contribution and recharge .as. SundjrJs for mapping at level A shall be established by regulations opted by the commissioner in accordance with the provisions of chapter 54
f the central Cannes and shall be based on hydrogeological data of aquifer eometry, hydraulic characteristics and connection to surface water features,
undwjicr level data and surface water discharge information for model * jlibration and pump test data for model verification. Standards for mapping t level B shall be established by guidelines developed by the commissioner nd shall be based on existing geologic mapping of known aquifer haraeterMics, limited field verification, the location of existing and itemial well fields and pumping rates.
Sec. 3. (NEW) (a) On or before July 1, 1990, each public or private •ater company serving one thousand or more persons shall map at level B all
existing well fields located within its water supply service area. On or fore Jul) 1. 1992, each public and private water company serving ten ousand or more persons shall map at level A all its existing well fields -aud wi'hin its water supply service area. The commissioner of vironmental protection may map at level B all existing well fields located
dthin the water supply service area of any public or private water company rung less th.in one thousand persons.
(h) E.ich public or private water company serving ten thousand or more persons shall map all potential well fields that are located within stratified drift aquifers identified as future sources of water supply to meet their needs m accordance with the plan submitted pursuant to section 25-33h of the general statutes (1) at level B two years after approval of such plan aid (2) at level A four years after approval of such plan. The commissioner of environmental protection shall identify and make recommendations for napping all remaining significant well fields not identified by a public or pnutc water company as a potential source of water supply within the region of in approved plan. Mapping of potential well fields by the commissioner .shall be completed at a time determined by the commissioner.
Sec. 4. (NEW) The mapping of aquifers by a public or private water company at level B and level A required pursuant to section 3 of this act shall mt be deemed to be complete unless approved by the commissioner of environmental protection.
Sec. .". (NEW) Not later than three months after approval of the commissioner of environmental protection of mapping of aquifers at level B, ts;h municipality in which such aquifers are located, acting through its kgislative body, shall authorize any board or commission, or shall establish ' new board or commission to inventory land uses overlying the mapped »ne of contribution and recharge areas of such aquifers in accordance with guidelines estibhshed by the commissioner pursuant to section 6 of this act.
Sec. 6. (NEW) The commissioner of environmental protection shall develop guidelines to be used by municipal boards or commissions in conducting the inventory of land uses required under section 5 of this act.
Sec. 7. Section 1 of special act 87-63 is amended to read as follows: (a) There is established a task force to study and review the
development of groundwater strategy. Said task force shall (1) [solicit public review and comment on the report submitted to the general assembly pursuant to special act 84-84 entitle "Protection of High and Moderate Yield Stratified Drift Aquifers", (2) define the implementation costs of recommendations of said report, (3) review implementation of the aquifer program conducted by the department of environmental protection, and (4)] propose legislation on aquifers, if appropriate, (2) STUDY THE USE OF WATER SOFTENERS ON WATER QUALITY, (3) CONSIDER MINIMUM PROTECTION STANDARDS FOR EXISTING AND FUTURE ACTIVITIES FOR WELL FIELD AREAS, ZONES OF CONTRIBUTION AND RECHARGE AREAS AND (4) RECOMMEND PROGRAMS FOR EDUCATION AND TRAINING OF UTILITIES, LOCAL AGENCIES AND OFFICIALS.
(b) The task force shall consist of [twenty-one] TWENTY-FIVE members as follows: The cochairmen and ranking members of the joint standing committees of the general assembly having cognizance of matters relating to the environment and public health, the commissioners of environmental protection, agriculture and health services and the chairman of the department of public utilities control, the secretary of the office of policy and management or their respective designees, A MUNICIPAL PLANNER, one member of the senate and one member of the house of representatives, two representing municipalities, two representing the public, one representing a private water utility company, [and] one representing a public water utility company, ONE REPRESENTING AGRICULTURE, AND ONE REPRESENTING BUSINESS AND INDUSTRY AND ONE REPRESENTING REAL ESTATE DEVELOPMENT INTERESTS. The members shall be appointed as follows: The member from the house of representatives, [and] a representative of a municipality AND A REPRESENTATIVE OF AGRICULTURE shall be appointed by the speaker of the house of representatives, the member of the senate, [and] a representative of a municipality AND THE MUNICIPAL PLANNER shall be appointed by the president pro tempore of the senate; a public member, [and] the representative of a private water utility AND THE REPRESENTATIVE OF BUSINESS AND INDUSTRY shall be appointed by the minority leader of the senate and a public member, [and] the representative of a public water utility AND THE REPRESENTATIVE OF REAL ESTATE DEVELOPMENT INTERESTS shall be appointed by the minority leader of the house of representatives.
(c) The task force shall submit a PRELIMINARY report AND A FINAL REPORT of its findings and recommendations to the general assembly on or before February 15, [1988] 1989.
Sec. 8. The sum of twenty-five thousand dollars is appropriated to the joint committee on legislative management, for the fiscal year ending June 30, 1989, from the sum appropriated to the finance advisory committee under section 1 of special act 88-20, for 1988 acts without appropriations, for the purposes of section 7 of this act.
Sec. 9. This act shall take effect from its passage except that section 8 shall take effect July 1, 1988, and sections 1 to 6, inclusive, shall take effect October 1, 1988. Approved June 2, 1988
G-1
^ 1
P.A. 89-305 P U B L I C A C T S J A N U A R Y 1989 P.A. 89-305
Substitute House Bill No. 6594 P U B L I C A C T NO. 89-305*
AN ACT CONCERNING AQUIFER PROTECTION AREAS, AND LOCAL FLOOD AND EROSION CONTROL BOARDS.
Section 1. (NEW) The general assembly finds that aquifers are an essential natural resource and a major source of public drinking water; that reliance on groundwater will increase because opportunities for development of new surface water supplies are diminishing due to the rising cost of land and increasingly intense development; that numerous drinking water wells have been contaminated by certain land use activities and other wells are now threatened; that protection of existing and future groundwater supplies demands greater action by state and local government; that a groundwater protection program requires identification and delineation of present and future water supplies in stratified drift aquifers supplying drinking water wells; that a comprehensive and coordinated system of land use regulations should be established that includes state regulations protecting public drinking water wells located in stratified drift aquifers; that municipalities with existing or proposed public drinking water wells in stratified drift aquifers should designate aquifer protection agencies; and that the state should provide technical assistance and education programs on aquifer protection to ensure a plentiful supply of public drinking water for present and future generations.
Sec. 2. (NEW) For.the purposes of this act; (1) "Regulated activity" means any action or process the commissioner of
environmental protection determines, by regulations adopted in accordance with section 3 of this act, to involve the production, handling, use, storage or disposal of material that may pose a threat to groundwater, including structures and appurtenances utilized in conjunction with the regulated activity;
(2) "Commissioner" means the commissioner of environmental protection; (3) "Well field" means the immediate area surrounding a public drinking wa
ter supply well or group of wells; (4) "Area of contribution" means the area where the water table is lowered
due to the pumping of a well and groundwater flows directly to the well; (5) "Recharge area" means the area from which groundwater flows directly to
the area of contribution; (6) "Aquifer" means a geologic formation, group of formations or part of a
formation that contains sufficient saturated, permeable materials to yield significant quantities of water to wells and springs;
(7) "Affected water company" means any public or private water company owning or operating a public water supply well within an aquifer protection area;
(8) "Stratified drift" means a predominantly sorted sediment laid down by or in meltwater from glaciers and includes sand, gravel, silt and clay arranged in layers;
(9) "Municipality" means any town, consolidated town and city, consolidated town and borough, city or borough;
(10) "Aquifer protection area" means any area consisting of well fields, areas of contribution and recharge areas, identified on maps approved by the commissioner of environmental protection pursuant to sections 22a-354b to 22-354d, inclusive, of the general statutes, as amended by this act, within which land uses or activities shall be required to comply with regulations adopted pursuant to section 8 of this act by the municipality where the aquifer protection area is located; and
(11) "Best management practice" means a practice, procedure or facility designed to prevent, minimize or control spills, leaks or other releases that pose a threat to groundwater.
Sec. 3. (NEW) (a) On or before July 1, 1990, the commissioner of environmental protection shall adopt regulations in accordance with chapter 54 of the general statutes for land use controls in aquifer protection areas. The regulations shall establish (1) best management practice standards for existing regulated activities located entirety or in part within aquifer protection areas and a schedule for compliance of nonconforming regulated activities with such standards, (2) best management practice standards for and prohibitions of regulated activities proposed to be located entirely or in part within aquifer protection areas, (3) procedures forexempting regulated activities in aquifer protection areas upon determination by the commissioner that such regulated activities do not pose a threat to the public drinking water supply and (4) requirements for design and installation of groundwater monitoring within aquifer protection areas.
(b) In adopting such regulations, the commissioner shall consider the guidelines for aquifer protection areas recommended in the report prepared pursuant to special act 87-63, as amended, and shall avoid duplication and inconsistency with other state or federal laws and regulations affecting aquifers. The regulations shall be developed in consultation with an advisory committee appointed by the commissioner. The advisory committee shall include the commissioners of administrative services and health services and the chairperson of the public utilities control authority, or their designees, members of the public, and representatives of businesses affected by the regulations, agriculture, environmental groups, municipal officers and water companies.
Sec. 4. (NEW) The commissioner of environmental protection shall develop and implement a groundwater education program. In developing such program the commissioner shall consult with the commissioner of health services, water utilities, state educational and research institutions, nonprofit environmental organizations and any other person or agency the commissioner deems necessary. The cooperative extension service at The University of Connecticut shall assist the commissioner in implementation of the program.
•Set also P.A. 89-365. S. 5 (9).
Sec. 5. (NEW) The commissioner of environmental protection shall a model municipal aquifer protection ordinance, consistent with regulation '!JB'>ARE
under section 3 of this act. The ordinance may be considered by muniem f protection agencies in adopting regulations pursuant to section 9 of this act ^ " ' ^
Sec. 6. (NEW) (a) Each person engaged in agriculture on land located ' h-an aquifer protection area and whose annual gross sales from agricultural ^ during the preceding calendar year were one thousand dollars or more shall '?L' J?-S
farm resources management plan for such land to the commissioner of envir i a
protection for his approval. (b) The soil and water conservation district where the aquifer prolectio
is located shall establish and coordinate a technical team to develop each p lanV' ' 3
team shall include a representative of the municipality in which the land is locai-d* a representative of any affected water company upon request of such munic'n-'i i " " ' water company. In developing a plan, a district shall consult with the comrn'iss * of environmental protection and agriculture, the college of agriculture and n n"* resources at The University of Connecticut, the Connecticut Agricultural Experi Station, the soil conservation service, the state agricultural and conservation corr "* tee and any other person or agency the district deems appropriate.
(c) The plan shall include a schedule for implementation and shall be period' cally updated as required by the commissioner. In developing a schedule for irrnl'" mentation, the technical team shall consider technical and economic facturs includ ing, but not limited to, the availability of state and federal funds. Any pe^on cnpaj if in agriculture in substantial compliance with a plan approved under this section shall be exempt from regulations adopted under section 8 of this act by a municipality' which the land is located. No plan shall be required to be submitted to the cornrnis sioner before July 1,1991, or six months after completion of level B mapping where the farm is located, whichever is later.
(d) On or before July 1, 1990, the commissioner of environmenlal protection, in consultation with the commissioner of agriculture, the United States Soil Con-servation Service, the cooperative extension service at The University of Connecticut and the council for soil and water conservation, shall develop regulations in accordance with chapter 54 of the general statutes for farm resources management plans Such regulations shall include, but not be limited to, provisions for manure manage-ment, storage and handling of pesticides, reduced use of pesticides through pest management practices, integrated pest management, fertilizer management and the location of underground storage tanks. In adopting such regulations, the commissioner shall consider existing state and federal guidelines or regulations affecting aquifers and agricultural resources management.
Sec. 7. (NEW) The zoning commission, planning commission or planning and zoning commission of each municipality with an aquifer protection area shall delineate on any map showing zoning districts prepared in accordance with chapter 124 or 126 of the general statutes or any special act the boundaries of aquifer protection areas, including areas of contribution and recharge areas as shown on level A maps approved pursuant to section 22a-354c of the general statutes, as amended hy section 22 of this act.
Sec. 8. (NEW) (a) Each municipality in which an aquifer protection area it located shall authorize by ordinance an existing board or commission to act as such agency not later than three months after adoption by the commissioner of regulations for aquifer protection areas pursuant to section 3 of this act and approval by the commissioner of mapping of areas of contribution and recharge areas for wells located in stratified drift aquifers in the municipality at level B pursuant to section 22a-354dof the general statutes. The ordinance authorizing the agency shall determine the number of members and alternate members, the length of their terms, the method of selection and removal, and the manner for filling vacancies. No member or alternate member of such agency shall participate in any hearing or decision of such agency of which he is a member upon any matter in which he is directly or indirectly interested in a personal c financial sense. In the event of disqualification, such fact shall be entered on the records of the agency and replacement shall be made from alternate members of an alternate to act as a member of such commission in the hearing and determination of the particular matter or matters in which the disqualification arose.
(b) Not more than six months after approval by the commissioner of mapping at level A, pursuant to section 22a-354d of the general statutes, the aquifer protection agency of the municipality in which such well is located shall adopt regulations for aquifer protection.
(c) At least one member of the agency or staff of the agency shall be a person who has completed the course in technical training formulated by the conimissionr pursuant to section 1 6 of this act. Failure to have a member of the agency or staff »if training shall not affect the validity of any action of the agency and shall be grounds re; revocation of the authority of the agency under section 13 of this act.
Sec. 9. (NEW) (a) The aquifer protection agency authorized by section i °j this act shall, by regulation, provide for (1) the manner in which the boundaries' aquifer protection areas shall be established and amended or changed, (2) the ' 0 , ™ r a
an application to conduct regulated activities within the area, (3) notice and pu •' tion requirements, (4) criteria and procedures for the review of application an V administration and enforcement. ,
(b) No regulations of an aquifer protection agency shall become effects ^ be established until after a public hearing in relation thereto is held by the ^ which parties in interest and citizens shall have an opportunity to be heard the time and place of such hearing shall be published in the form of a lega. Jds ment, appearing at least twice in a newspaper having a substantial circulation i municipality at intervals of not less than two days, the first not more than iwe" > days nor less than fifteen days, and the last not less than two days, before such. ' and a copy of such proposed regulation shall be filed in the office of the lo» n ' borough clerk, as the case may be, in such municipality, for public inspection
G-2
P.A. 89-305 PUBLIC ACTS JANUARY 1989 P.A. 89-305
«n days before such hearing, and may be published in full in such paper. A copy of the „tice and the proposed regulations or amendments thereto shall be provided to the
jjqynissioner of environmental protection, the town clerk and any affected water company at least thirty-five days before such hearing. Such regulations may be from time to time amended, changed or repealed after a public hearing in relation thereto is held by the agency at which parties in interest and citizens shall have an opportunity to be beard and for which notice shall be published in the manner specified in this subsection Regulations or changes therein shall become effective at such time as is fixed by jhe agency, provided a copy of such regulation or change shall be filed in the office of the town, city or borough clerk, as the case may be. Whenever an agency makes a change in regulations, it shall state upon its records the reason why the change was made. AH petitions submitted in writing and in a form prescribed by the agency requesting a change in the regulations shall be considered at a public hearing in the manner provided for establishment of such regulations within ninety days after receipt of such petition. The agency shall act upon the changes requested in the petition within sixty days after the hearing. The petitioner may consent to extension of the periods provided for a hearing and for adoption or denial or may withdraw such petition.
(c) Pursuant to municipal regulations adopted under subsection (b) of this section- n 0 regulated activity shall be conducted within any aquifer protection area without a permit. Any person proposing to conduct or cause to be conducted a regulated activity within an aquifer protection area shall file an application with the aquifer protection agency of each municipality wherein the aquifer in question is located. The application shall be in such form and contain such information as the agency may prescribe. The day of receipt of an application shall be the day of the next regularly scheduled meeting of such agency, immediately following the day of submission to such agency or its agent of such application, provided such meeting is no earlier than three business days after receipt, or within thirty-five days after such submission, whichever is sooner. No later than sixty-five days after the receipt of such application, the agency may hold a public hearing on such application. Notice of the hearing shall be published at least twice at intervals of not less than two days, the first not more than fifteen J.i> >• ami not fewer than ten days, and the last not less than two days before the date set for the hearing in a newspaper having a general circulation in each town where the affected aquifer, or any part thereof, is located. The agency shall send to any affected water company, at least ten days before the hearing, a copy of the notice by certified mail, return receipt requested. All applications, maps and documents relating thereto shall be open for public inspection. At such hearing any person or persons may appear and be heard. The hearing shall be completed within forty-five days of its commencement. Action shall be taken on applications within thirty-five days after the completion of a public hearing or in the absence of a public hearing within sixty-five days from the date of receipt of the application.
(d) In granting, denying or limiting any permit for a regulated activity the aquifer protection agency shall state upon the record the reason for its decision. In granting a permit the agency may grant the application as filed or grant it upon such terms, conditions, limitations or modifications of the activity intended to carry out the policies ni --.ction 1 of this act. No person shall conduct any regulated activity within an aquifer protection area which requires zoning or subdivision approval without first having obtained a valid certificate of zoning or subdivision approval, special permit, special exception or variance, or other documentation establishing that the proposal complies with the zoning or subdivision requirements adopted by the municipality pursuant to chapters 124 to 126, inclusive, of the general statutes, or any special act. The agency may suspend or revoke a permit if it finds, after giving notice to the permittee of the facts or conduct which warrant the intended action and after a hearing at which the permittee is given an opportunity to show compliance with the requirements for retention of the permit, that the applicant has not complied with the conditions or limitations set forth in the permit or has exceeded the scope of the work as set forth in the application. The agency shall send to any affected water company a copy of the notice at least ten days before the hearing by certified mail, return receipt requested. Any affected water company may, through a representative, appear and be heard at any such hearing. The applicant or permittee shall be notified of the agency's decision by certified mail, return receipt requested, within fifteen days of the date of the decision and the agency shall cause notice of its order in issuance, denial, revocation or suspension of a permit to be published in a newspaper having a general circulation in the municipality in which the aquifer protection area is located.
(e) The aquifer protection agency may require a filing fee to be deposited with the agency. The amount of such fee shall be sufficient to cover the reasonable cost of reviewing and acting on applications and petitions, including, but not limited to, the costsof certified mailings, publications of notices and decisions, and monitoring compliance with permit conditions or agency orders.
(f) Any regulations adopted by an agency under this section shall not be effective unless the commissioner of environmental protection determines that such regulations are reasonably related to the purpose of groundwater protection and not inconsistent with the regulations adopted pursuant to section 3 of this act. A regulation adopted by a municipality shall not be deemed inconsistent if such regulation establishes a greater level of protection. The commissioner shall provide written notification to the agency of approval or the reasons such regulations cannot be approved within sixty days of receipt by the commissioner of the regulations adopted by the acen*)
Sec. 10. (NEW) (a) The commissioner of environmental protection or any Person aggrieved by any regulation, order, decision or action made pursuant to sec-'lons 8 to 14, inclusive, of this act, by the commissioner or municipality, within fifteen days after publication of such regulation, order, decision or action may appeal to the superior court for the judicial district where the land affected is located, and if located "i more than one judicial district, to said court in any such judicial district, except if
such appeal is from a contested case, as defined i utes, such appeal shall be in K C ^ ^ ^ ^ ^ 1 * * « * * f « l « « -general statutes and venue shall be in * J ^ £ ^ ^ ™ £ » located, and if located in more than one judicial district to the •"•"iccieais district. Such appeal shall be made returnable to said court in the court in any such judicial
•u j t • i , . . . . . . same manner as that prescribed for civil actions brought to said court. Notice of such appeal shall be served upon the aquifer protection agency and the commissioner. The commissioner may appear as a party to any action brought by any other person within thirty days from the date such appeal is returned to the court. The appeal shall state the reasons upon which it is predicated and shall not stay proceedings on the regulation, order, decision or action, but the court may, on application and after notice, grant a restraining order. Such appeal shall have precedence in the order of trial.
(b) The court, upon the motion of the person who applied for such order, decision or action, shall make such person a party defendant in the appeal. Such defendant may, at any time after the return date of such appeal, make a motion to dismiss the appeal. At the hearing on such motion to dismiss, each appellant shall have the burden of proving his standing to bring the appeal. The court may, upon the record, grant or deny the motion. The court's order on such motion shall be a final judgment for the purpose of the appeal as to each such defendant. No appeal may be taken from any such order except within seven days of the entry of such order.
(c) No appeal taken under subsection (a) of this section shall be withdrawn and no settlement between the parties to any such appeal shall be effective unless and until a hearing has been held before the superior court and such court has approved such proposed withdrawal or settlement.
Sec .11. (NEW) (a) If upon appeal pursuant to section 10 of this act, the court finds that the action appealed from constitutes the equivalent of a taking without compensation, it shall set aside the action or it may modify the action so that it does not constitute a taking. In both instances the court shall remand the order to the aquifer protection agency for action not inconsistent with its decision.
(b) To carry out the purposes of sections 8 to 14, inclusive, of this act, a municipality may at any time purchase land or an interest in land in fee simple or other acceptable title, or subject to acceptable restrictions or exceptions, and enter into covenants and agreements with landowners.
Sec. 12. (NEW) (a) If the aquifer protection agency or its duly authorized agent finds that any person is conducting or maintaining any activity, facility or condition which violates any provision of sections 8 to 14, inclusive, of this act, or any regulation or permit adopted or issued thereunder, the agency or its duly authorized agent may issue a written order by certified mail, return receipt requested, to such person conducting such activity or maintaining such facility or condition to cease such activity immediately or to correct such facility or condition. The agency shall send a copy of such order to any affected water company by certified mail, return receipt requested. Within ten days of the issuance of such order the agency shall hold a hearing to provide the person an opportunity to be heard and show cause why the order should not remain in effect. Any affected water company may testify at the hearing. The agency shall consider the facts presented at the hearing and, within ten days of the completion of the hearing, notify the person by certified mail, return receipt requested, that the original order remains in effect, that a revised order is in effect, or that the order has been withdrawn. The original order shall be effective upon issuance and shall remain in effect until the agency affirms, revises or withdraws the order. The issuance of an order pursuant to this section shall not delay or bar an action pursuant to subsection (b) of this section. The commissioner may issue orders pursuant to sections 22a-6 to 22a-7, inclusive, of the general statutes, concerning an activity, facility or condition which is in violation of said sections 8 to 14, inclusive, if the municipality in which such activity, facility or condition is located has failed to enforce its aquifer protection regulations.
(b) Any person who commits, takes part in, or assists in any violation of any provision of sections 8 to 14, inclusive, of this act, or any ordinance or regulation promulgated by municipalities pursuant to the grant of authority herein contained, shall be assessed a civil penalty of not more than one thousand dollars for each offense. Each violation of said sections shall be a separate and distinct offense, and, in the case of a continuing violation, each day's continuance thereof shall be deemed to be a separate and distinct offense. The superior court, in an action brought by the commissioner, municipality, district or any person shall have jurisdiction to restrain a continuing violation of said sections, to issue orders directing that the violation be corrected or removed, and to assess civil penalties pursuant to this section. All costs, fees and expenses in connection with such action shall be assessed as damages against the violator together with reasonable attorney's fees which may be allowed, all ofwhich shall be awarded to the municipality, district or person bringing such action.
(c) Any person who wilfully or knowingly violates any provision of sections 8 to 14, inclusive, of this act, shall be fined not more than one thousand dollars for each day during which such violation continues or be imprisoned not more than six months or both. For a subsequent violation, such person shall be fined not more than two thousand dollars for each day during which such violation continues or be imprisoned not more than one year or both. For the purposes of this subsection, "person" shall be construed to include any responsible corporate officer.
Sec. 13. (NEW) (a) The commissioner of environmental protection may revoke the authority of a municipality to regulate aquifer protection areas pursuant to sections 8 to 14, inclusive, of this, act upon determination after a hearing that such municipality has, over a period of time, consistently failed to perform its duties under said sections. Prior to the hearing on revocation, the commissioner shall send anotice to the aquifer protection agency, by certified mail, return receipt requested, asking such agency to show cause, within thirty days, why such authority should not be revoked. A copy of the show cause notice shall be sent to the chief executive officer of the municipality that authorized the agency and to any water company owning or oper-
G-3
P.A. 89-305 PUBLIC ACTS JANUARY 1989 P.A. 89-305
ating a public water supply well within such municipality. Such water company may, through a representative, appear and be heard at any such hearing. The commissioner shall send a notice to the aquifer protection agency, by certified mail, return receipt requested, stating the reasons for the revocation and the circumstances for reinstatement. Any municipality aggrieved by a decision of the commissioner under this section to revoke its authority under said sections 8 to 14, inclusive, may appeal therefrom in accordance with the provisions of section 4-183 of the general statutes. The commissioner shall have jurisdiction over aquifers in any municipality whose authority to regulate such aquifers has been revoked. Any costs incurred by the state in reviewing applications to conduct an activity within an aquifer protection area for such municipality shall be paid by the municipality. Any fees that would have been paid to such municipality if such authority had been retained shall be paid to the state.
(b) The commissioner shall cause to be published notice of the revocation or reinstatement of the authority of a municipality to regulate aquifers in a newspaper of general circulation in the area of such municipality.
(c) The commissioner shall adopt regulations in accordance with the provisions of chapter 54 of the general statutes establishing standards for the revocation and reinstatement of municipal authority to regulate aquifers pursuant to section 8 of this act.
Sec. 14. The commissioner of environmental protection and the commissioner of transportation, within available appropriations, shall study methods to prevent contamination of drinking water in aquifer protection areas through design, construction and maintenance of transportation routes. In conducting the study, said corrimissioners shall consider prohibiting the transportation of potential groundwater contaminants through aquifer protection areas, mandating containment molding and drainage control in the design and construction of roads located within aquifer protection areas and the feasibility of nonsalt-based deicing material for roads within aquifer protection areas. The commissioners shall submit a report of their findings and recommendations to the joint standing committee of the general assembly having cognizance of matters relating to the environment on or before February 1, 1990.
Sec. 15. (NEW) The commissioner of environmental protection shall develop an incentive program to provide public recognition of users of land located within aquifer protection areas who demonstrate successful and committed efforts to protect drinking water supplies by implementing innovative approaches to groundwater protection .Such program shall also promote groundwater protection through education of members of businesses and industry and the public.
Sec. 16. (NEW) The commissioner of environmental protection shall formulate courses in technical training for members and staff of municipal aquifer protection agencies. Such courses shall provide instruction in the regulations developed pursuant to section 3 of this act, potential options for monitoring and enforcement, and technical requirements for site plan review. The commissioner may designate any organization or educational institution to provide such instruction.
Sec. 17. (NEW) The commissioner of environmental protection, in consultation with the commissioner of health services and the chairperson of the department of public utilities control, shall prepare guidelines for acquisition of lands surrounding existing or proposed public water supply well fields. In preparing such guidelines the commissioner shall consider economic implications for mandating land acquisition including, but not limited to, the effect on land values and the ability of small water companies to absorb the cost of acquisition.
Sec. 18. (NEW) (a) The commissioner of environmental protection, in consultation with the commissioner of health services and water companies, shall provide, within available appropriations, technical, coordinating and research services to promote the effective administration of this act at the federal, state and local levels.
(b) The commissioner shall have the overall responsibility for general supervision of the implementation of this act and shall monitor and evaluate the activities of federal and state agencies and the activities of municipalities to assure continuing, effective, coordinated and consistent administration of the requirements and purposes of this act.
(c) The commissioner shall prepare and submit to the general assembly and the governor, on or before December first of each year, a written report summarizing the activities of the department concerning the development and implementation of this act during the previous year. Such report shall include, but not be limited to: (1) The department's accomplishments and actions in achieving the goals and policies of this act including, but not limited to, coordination with other state, regional, federal and municipal programs established to achieve the purposes of this act; (2) recommendations for any statutory or regulatory amendments necessary to achieve such purposes; (3) a summary of municipal and federal programs and actions which affect aquifer protection areas; (4) recommendations for any programs or plans to achieve such purposes; (5) any aspects of the program or the act which are proving difficult to accomplish, suggested reasons for such difficulties, and proposed solutions to such difficulties; (6) a summary of the expenditure of federal and state funds under this act and (7) a request for an appropriation of funds necessary to match federal funds and provide continuing financial support for the program. Such report shall comply with the provisions of section 46a-78 of the general statutes.
Sec. 19. (NEW) Each water company serving ten thousand or more customers with wells in stratified drift aquifers shall prepare a municipal assistance program, which includes recommendations for site plan reviews, evaluation of risks and advice on procedures for dealing with hazardous waste spills in aquifers. Such program shall be made available to any municipality in which wells owned by the water company are located.
Sec. 20. (NEW) On or before the second Wednesday after the convening of each regular session of the general assembly, the commissioner of health services shall submit a report to the joint standing committee of the general assembly having cognizance of matters relating to the environment, which describes the status of, for the year ending the preceding June thirtieth, the water planning process established
G-4
under sections 25-33g to 25-33J, inclusive, of the general statutes, as amend h act, and efforts to expedite the process. c> this ]
Sec. 21. Section 25-32d of the general statutes is repealed and the f 1
is substituted in lieu thereof: ,e">MnwjPg j (a) Each water company as defined in section 25-32a and supply},,
one thousand or more persons or two hundred fifty or more consumers and W a "f ! o i water company as defined in said section requested by the commissioner " f V ' i " ^ services shall submit a water supply plan to the commissioner of health m- i approval with the concurrence of me commissioner of environmental prole-i " : ' : s ' f o r i concurrence of the public utilities control authority shall be required foraDn''r'"i'^* • plan submitted by a water company regulated by the authority. The corrtnii * V ! U o ' a ! health services shall consider the comments of the public utilities controla'ith ° n e ' ' any plan which may impact any water company regulated by the authority "The"* 0 ° • missioner of health services shall distribute a copy of the plan to the comnii,v,'.' C 0 : I 1" I environmental protection and the public utilities control authority. Acopvnf 1™"°' ' shall be sent to the secretary of the office of policy and management for inform ' and comment. A plan shall be revised at such time as the water company filine the ' or the commissioner of health services determines or at intervals of not less than th ' years nor more than five years after the date of initial approval. " ' e e
(b) Any water supply plan submitted pursuant to this section shall aaluji ;
the water supply needs in the service area of the water company submitting the nfo !
and propose a strategy to meet such needs. The plan shall include, but not be limited to (1) A description of existing water supply systems; (2) an analysis of lutuie *a:er ^ supply demands; (3) an assessment of alternative water supply sources which mnv ' include sources receiving sewage AND SOURCES LOCATED ON STATE LAND-(4) contingency procedures for public drinking water supply emergencies, iniludini • emergencies concerning the contamination of water, the failure of a water suppK svs- i tern or the shortage of water; (5) a recommendation for new water system develop, i ment; (6) such other information as the commissioner of health services, the tommis- i sioner of environmental protection or the public utilities control authority deems ;
necessary; [and] (7) a forecast of future land sales; AND (8) PROVISIONS FOR STRATEGIC GROUNDWATER MONITORING.
(c) The commissioner of health services, in consultation with the commis- i sioner of environmental protection and the public utilities control authority, shall adopt regulations in accordance with the provisions of chapter 54. Such regulation"; shall include, but not be limited to, a process for approval, modification or rejection of ;
plans submitted pursuant to this section and a schedule for submission of Ihe plans Sec. 22. Section 22a-354c of the general statutes is repealed and the tnllow- I
ing is substituted in lieu thereof: (a) On or before July I , 1990, each public or private water company serving
one thousand or more persons shall map at level B all AREAS OF CONTRIBUTION AND RECHARGE AREAS FOR its existing [well fields located] WELLS LOCATED IN STRATIFIED DRIFT AQUIFERS THAT ARE within its w • • service area. On or before July 1,1992. each public and private water companv serving ten thousand or more persons shall map at level A all AREAS OF CONTRIBUTION AND RECHARGE AREAS FOR its existing [well fields located] WELLS LOCATED IN STRATIFIED DRIFT AQUIFERS THAT ARE within its water supply service area. The commissioner of environmental protection may map at lei el B all existing [well fields located] WELLS LOCATED IN STRATIFIED DRIFT VJUI-FERS THAT ARE within the water supply service area of any public or private water company serving less than one thousand persons.
(b) Each public or private water company serving ten thousand or more persons shall map all [potential well fields] AREAS OF CONTRIBUTION AND RECHARGE AREAS FOR POTENTIAL WELLS that are located within stratified dnft aquifers identified as future sources of water supply to meet their needs in accordance with the plan submitted pursuant to section 25-33h, AS AMENDED BY SECTION 24 OF THIS ACT, (1) at level B two years after approval of such plan and (2) at level A four years after approval of such plan. The commissioner of environmental protection shall identify and make recommendations for mapping all remaining significant [»cil fields] WELLS LOCATED IN STRATIFIED DRIFT AQUIFERS not identified b> a public or private water company as a potential source of water supply within the region of an approved plan. Mapping of ANY OTHER AREA OF CONTRIBl'TION AN1> RECHARGE AREAS FOR potential [well fields] WELLS LOCATED IN STRATIFIED DRIFT AQUIFERS by the commissioner shall be completed at a time determined by the commissioner.
Sec. 23. (NEW) (a) On or before July 1, 1995, each public or private water company serving at least one thousand persons but not more than ten thousand persen shall map areas of contribution and recharge areas at level A for each existing stratilw drift wells located within its water supply area.
(b) Each public or private water supply company serving at least one thousand but not more than ten thousand persons shall map areas of contribution " " ' ^ charge areas for all of the potential wells located in stratified drift aquifers identihe ^ future sources of water supply in accordance with the plan submitted n> » c •' 25-33h of the general statutes, as amended by section 24 of this act, at level B not m ^ than two years after approval of the plan and at level A not more than five >«-'an" approval. „ . „
Sec. 24. Section 25-33h of the genera! statutes is repealed and the to'"'*1 * is substituted in lieu thereof: , . c (j
(a) Each water utility coordinating committee shall prepare a ^"''Vjj, ^ water system plan in the public water supply management area. Such plan s • submitted to the commissioner of health services for his approval not more!. a ^ years after the first meeting of the committee. The plan shall promote C l l 0 | ^ 0 r ' , i i among public water systems and include, but not be limited to, proviMons integration of public water systems, consistent with the protection and C , ] " J
> " ^ U J 1 V C
of public health and well-being; (2) integration of water company plans; l - " L U
P.A. 89-305 PUBLIC ACTS JANUARY 1989 P.A. 89-365
ajrvice areas; (4) joint management or ownership of services; (5) satellite management services; (6) interconnections between public water systems; (7) integration of i.nd use and water system plans; (8) minimum design standards; [and] (9) the impact
other uses of water resources, AND (10) ACQUISITION OF LAND SURROUNDING WELLS PROPOSED TO BE LOCATED IN STRATIFIED DRIFTS.
(b) The plan shall be adopted in accordance with the provisions of this section. Th e committee shall prepare a draft of the plan and solicit comments thereon from the commissioners of health services and environmental protection, the department of public utility control, the secretary of the office of policy and management and any municipality, regional planning agency or other interested party within the management area. The municipalities and regional planning agencies shall comment on, but shall not be limited to commenting on, the consistency of the plan with local and regional iand use plans and policies. The department of public utility control shall comment on, but shall not be limited to commenting on, the cost-effectiveness of the plan. The secretary of the office of policy and management shall comment on, but shall not be limited to commenting on, the consistency of the plan with state policies. The commissioner of environmental protection shall comment on, but shall not be limited to commenting on, the availability of water for any proposed diversion. The commissioner of health services shall comment on, but shall not be limited to commenting on, the availability of pure and adequate water supplies, potential conflicts over uV use of such supplies, and consistency with the goals of sections 25-33c to 25-33J. inclusive, AS AMENDED BY THIS ACT.
(c) The commissioner of health services shall adopt regulations in accordance * ith the provisions of chapter 54 establishing the contents of a plan and a procedure for approval.
Sec. 25. (NEW) The commissioner of environmental protection, in consultation with the commissioner of health services, water companies, and business and industry shall develop a strategic groundwater monitoring plan to be implemented in aquifer protection areas not more than one year after completion of level A mapping pursuant to sections 22a-354b to 22a-354d, inclusive, of the general statutes, as amended by this act.
Sec. 26. Section 19a-37 of the general statutes is repealed and the following is substituted in lieu thereof:
The commissioner of health services may adopt regulations in the public health code [pertaining to protection and location of new water supply wells or springs for residential construction or for public or semipublic use] for the preservation of the public health PERTAINING TO (1) PROTECTION AND LOCATION OF NEW WATER SUPPLY WELLS OR SPRINGS FOR RESIDENTIAL CONSTRUCTION OR FOR PUBLIC OR SEMIPUBLIC USE, AND (2) INSPECTION FOR COMPLIANCE WITH THE PROVISIONS OF MUNICIPAL REGULATIONS ADOPTED PURSUANT TO SECTION 9 OF THIS ACT.
Sec. 27. Section 22a-354e of the general statutes is repealed and the following is substituted in lieu thereof:
Not later than three months after approval of the commissioner of environmental protection of mapping of aquifers at level B, each [municipality in which such aquifers are located, acting through its legislative body, shall authorize any board or commission, or shall establish a new board or commission to] MUNICIPAL AQUIFER PROTECTION AGENCY AUTHORIZED PURSUANT TO SECTION 8 OF THIS ACT SHALL inventory land uses overlying the mapped zone of contribution and recharge areas of such aquifers in accordance with guidelines established by the commissioner pursuant to section 22a-354f. SUCH INVENTORY SHALL BE COMPLETED NOT MORE THAN ONE YEAR AFTER AUTHORIZATION OF THE AGENCY.
Sec. 28. Section 22-6c of the general statutes is repealed and the following is substituted in lieu thereof:
The commissioner of agriculture may reimburse any farmer for part of the cost of the completion of a component of a farm waste management system, provided such component has been certified by the Federal Agricultural Stabilization and Conservation Service, and the cost is in accordance with said certification. The total federal and state grant available to a farmer shall not be more than seventy-five per cent of such cost. IN MAKING GRANTS UNDER THIS SECTION THE COMMISSIONER SHALL GIVE PRIORITY TO CAPITAL IMPROVEMENTS MADE IN ACCORDANCE WITH A FARM RESOURCES PLAN PREPARED PURSUANT TO SF.CTION 6 OF THIS ACT.
Sec. 29. Subsection (a) of section 25-84 of the general statutes is repealed and the following is substituted in lieu thereof:
(a) Any municipality may, by vote of its legislative body, adopt the provisions of this section and sections 25-85 to 25-94, inclusive, and exercise through a flniiil .ind erosion control board the powers granted thereunder. In each town, except as otherwise provided by special act, the flood and erosion control board shall consist of not less than five nor more than seven members, who shall be electors of such town and whose method of selection and terms of office shall be determined by local ordinance, except that in towns having a population of less than [twenty-five] FIFTY thousand the selectmen may be empowered by such ordinance to act as such flood and erosion control board. In each city or borough, except as otherwise provided by special t, the board of aldermen, council or other board or authority having power to adopt ordinances for the government of such city or borough may act as such board. The flood and erosion control board of any town shall have jurisdiction over that part of the town outside any city or borough contained therein.
Sec. 30. (NEW) Not more than two months after approval by the commissioner of environmental protection of mapping at level B pursuant to section 22a-354d of the general statutes, the commissioner, in consultation with the commissioner of agriculture, the cooperative extension service at The University of Connecticut and any other person or agency the commissioner of environmental protection deems necessary, shall inventory agricultural land uses overlaying the mapped area.
Such inventory shall include, but not be limited to, the type and size of any agricultural operation and existing farm resource management practices. Any such inventory shall be completed not more than four months after commencement and shall be made available to technical teams established pursuant to subsection (b) of section 4 of this act.
Sec. 31. (NEW) State regulations for aquifer protection areas adopted by the commissioner of environmental protection pursuant to section 3 of this act shall be consistent with regulations adopted by said commissioner for farm resources management plans pursuant to section 6 of this act.
Sec. 32. This act shall take effect from its passage, except that sections 1 to 13, inclusive, and sections 15 to 28, inclusive, shall take effect July 1, 1989.
Approved July 3, 1989
Substitute House Bill No. 7302
PUBLIC ACT NO. 89-365
AN ACT CONCERNING THE CLEAN UP OF HAZARDOUS WASTE.
Section 1. Section 22a-114 of the general statutes is repealed and the following is substituted in lieu thereof:
The general assembly finds that improper management of hazardous wastes has contaminated the water, soil and air of the slate thereby threatening the health and safety of Connecticut citizens; that the economic benefits to the state from industry are jeopardized if hazardous waste disposal facilities are not available in Connecticut; that the safe management of hazardous wastes, including state involvement, is mandated by the Federal Resource Conservation and Recovery Act of 1976 (42 USC 6901 et seq.) and implementing regulations; that the siting of hazardous waste disposal facilities is in the best interest of Connecticut's citizens and that the public should participate in siting decisions. Therefore the general assembly declares that it is the policy of the state TO INITIATE FINAL REMEDIAL ACTION BY THE YEAR 2000 AT EACH HAZARDOUS WASTE DISPOSAL SITE LISTED ON THE EFFECTIVE DATE OF THIS ACT ON THE INVENTORY MAINTAINED BY THE COMMISSIONER OF ENVIRONMENTAL PROTECTION PURSUANT TO SECTION 22a-133c AND to assure the siting of hazardous waste disposal facilities so that the health and safety of Connecticut's citizens and the environmental and economic interests of the state are protected. The purpose of this chapter is to establish a process for the siting of hazardous waste facilities that will protect the health and safety of Connecticut citizens and assure responsible economic development and to have that siting process be at least as strict as that required by federal law.
Sec. 2. (NEW) The commissioner of environmental protection shall compile an inventory of contaminated wells and leaking underground storage tanks known to him and shall submit such inventory to the joint standing committee of the general assembly having cognizance of matters relating to the environment not later than February 1, 1990, and annually thereafter. As used in this section, "contaminated well" means any well that exceeds maximum levels for substances established in the public health code or action levels determined jointly by the commiss loners of health services and environmental protection.
Sec. 3. (NEW) (a) The commissioner of environmental protection may establish, within available appropriations, a program of grants to municipalities and regional refuse disposal districts for the clean up of landfills where wastes were disposed of and later determined to be hazardous waste as defined in section 22a-115 of the general statutes. Any grant made under this section may be used for costs incurred in the following: (1) Investigation and monitoring of soils and groundwater at or near such landfills, (2) removal of hazardous waste for disposal at another location, (3) closure of the landfill and (4) compliance with state or federal hazardous waste regulations.
(b) The commissioner of environmental protection shall adopt regulations in accordance with the provisions of chapter 54 of the general statutes to carry out the purposes of this section.
Sec. 4. Subsection (a) of section 22a-132 of the general statutes is repealed and the following is substituted in lieu thereof:
(a) There shall be paid to the commissioner of revenue services by (1) a generator of hazardous waste required to file a manifest pursuant to the Resource Conservation and Recovery Act of 1976 (42 U.S.C. 6901 et seq.), as from time to time amended, and regulations adopted by the department of environmental protection, (2) a treatment facility required to file a manifest for hazardous wastes resulting from their treatment process and (3) a generator of hazardous waste shipping hazardous waste to treatment or disposal facilities located in the state, an assessment of (A) five cents per gallon of metal hydroxide sludge from wastewater treatment of electroplating or metal finishing operations and six cents per gallon of any other hazardous waste entered on a manifest in gallons, (B) one-half of one cent per pound of metal hydroxide sludge from wastewater treatment of electroplating or metal finishing operations and three-quarters of one cent per pound of any other hazardous waste entered on a manifest in pounds or (C) ten dollars per cubic yard of metal hydroxide sludge from wastewater treatment of electroplating or metal finishing operations and twelve dollars for any other hazardous waste entered on a manifest in cubic yards. [Any] THE FOLLOWING SHALL NOT BE SUBJECT TO ASSESSMENT: (i) ANY HAZARDOUS WASTE THAT IS RECYCLED, ( i i ) ANY residue resulting from the processing or treatment of a hazardous waste at a facility approved in accordance with the Resource Conservation and Recovery Act of 1976 (42 U.S.C. 6901 etseq), as from time to time amended, [shall not be subject to assessment,] provided such residue is derived from hazardous waste received at the facility under a manifest AND ( i i i ) ANY HAZARDOUS WASTE FOR WHICH AN ASSESSMENT WAS PAH) DURING THE COURSE OF HANDLING. All assessments shall be due and payable to the commis-
G-5
P.A. 89-365 PUBLIC ACTS JANUARY 1989 P.A. 89-365
sioner of revenue services quarterly on or before the last day of the month immediately following the end of each calendar quarter. If the total assessment payable by any such generator or treatment facility for any calendar quarter is less than five dollars, such generator or treatment facility shall not be required to pay an assessment for such quarter. (A generator who or treatment facility which pays an assessment for hazardous waste pursuant to this section shall not be further assessed for such hazardous waste provided such hazardous waste is stored or reshipped without change or treatment in the container in which the amount of the assessment is determined. ] The generator or treatment facility shall note reshiptnent on a manifest in such manner as the commissioner deems necessary. FOR THE PURPOSES OF THIS SECTION, RECYCLED MEANS THAT A WASTE IS PROCESSED TO RECOVER A USABLE PRODUCT, OR THAT IT IS REGENERATED OR REUSED. BURNING FOR HEAT VALUE SHALL NOT BE CONSIDERED RECYCLING.
Sec. 3. Subsection (d) of section 22a-451 of the general statutes is repealed and the following is substituted in lieu thereof:
(d) There is established a revolving fund to be known as the emergency spill response fund, for the purpose of providing money for (1) the containment and removal or mitigation of the discharge, spillage, uncontrolled loss, seepage or filtration of oil or petroleum or chemical liquids or solid, liquid or gaseous products or hazardous wastes including the state share of payments of the costs of remedial action pursuant to the federal Comprehensive Environmental Response, Compensation, and Liability Act of 1980 (42 USC 9601 et seq.), as amended; (2) provision of potable drinking water pursuant to section 22a-471; (3) completion of the inventory required by section 22a-8a; (4) the removal of hazardous wastes that the commissioner deems to be a potential threat to human health or the environment; (5) the accomplishment of the purposes of sections 22a-134aa to 22a-134hh, inclusive, except that the amount expended for the purpose of this subdivision shall not exceed TWO HUNDRED eighty thousand dollars per year, [and] (6) (A) the provision of short-term potable drinking water pursuant to subdivision (1) of subsection (a) of section 22-471 and the preparation of an engineering report pursuant to subdivision (2) of subsection (a) of said section when pollution of the groundwaters by pesticides has occurred or can reasonably be expected to occur; (B) the study required by Special Act 86-44 and (C) as funds allow, education of the public on the proper use and disposal of pesticides and the prevention of pesticide contamination in drinking water supplies.- (7) LOANS AND LINES OF CREDIT MADE IN ACCORDANCE WITH THE PROVISIONS OF SECTION 6 OF THIS ACT; (8) THE ACCOMPLISHMENT OF THE PURPOSES OF SECTIONS 22a-133b TO 22a-133g, INCLUSIVE, AND SECTIONS 22a-134 TO 22a-134d, INCLUSIVE, INCLUDING STAFFING, AND SECTION 7 OF THIS ACT; (9) DEVELOPMENT AND IMPLEMENTATION OF A STATEWIDE AQUIFER PROTECTION PROGRAM PURSUANT TO THE PROVISIONS OF SUBSTITUTE HOUSE BILL 6594* OF THE CURRENT SESSION, INCLUDING, BUT NOT LIMITED TO, DEVELOPMENT OF STATE REGULATIONS FOR LAND USES IN AQUIFER PROTECTION AREAS, TECHNICAL ASSISTANCE AND EDUCATIONAL PROGRAMS, AND (10) RESEARCH ON TOXIC SUBSTANCE CONTAMINATION, INCLUDING RESEARCH BY THE ENVIRONMENTAL RESEARCH INSTITUTE AND THE INSTITUTE OF WATER RESOURCES AT THE UNrVERSITY OF CONNECTICUT. The amount expended under [subdivision] SUBDIVISIONS (6)TO(/0). INCLUSIVE, of this subsection shall [not exceed the sum of? BE AS FOLLOWS: UNDER SUBDIVISION (6), NOT MORE THAN the amount credited to the emergency spill response fund from the fees collected pursuant to sections 22a-66b to 22a-66j, inclusive, and section 22a-54a, fifty percent of the amount credited therein from the fees collected pursuant to subsection (g) of section 22a-50, and one-third of the amount credited therein from the fees collected pursuant to (i) subsection (f) of section 22a-54 and (ii) subsection (c) of section 22a-56; UNDER SUBDIVISION (7), NOT MORE THAN THREE MILLION DOLLARS; UNDER SUBDIVISION (8), NOT MORE THAN ONE MILLION DOLLARS PER YEAR; UNDER SUBDIVISION (9). NOT MORE THAN TWO HUNDRED FIFTY THOUSAND DOLLARS PER YEAR; AND UNDER SUBDIVISION (10), NOT MORE THAN EIGHTY THOUSAND DOLLARS PER YEAR. Any money recovered pursuant to subsections (a) and (c) of this section shall be deposited in the general fund and credited to the fund established under this section and shall be used to meet any contractual obligations incurred by the commissioner pursuant to subsection (b) of this section for such containment and removal or mitigation.
Sec. 6. (NEW) (a) A business environmental clean up revolving loan fund is created. The state, acting through the department of economic development, may provide loans or lines of credit to businesses from the business environmental clean up revolving loan fund for the purposes of the containment and removal or mitigsooo of .the discharge, spillage, uncontrolled loss, seepage or filtration of oil or petroleum or chemical liquids or solid, liquid or gaseous products or hazardous wastes. For die
purposes of this section, "business" means any business which (1) has been in bu,
t recent fiscal year before the date of the application or has less than oneh' ( • m n l n u w anrl I'W has t v p n Hnino hl1sin(»ss anH h a s mainrairiAH __ ; 8P|K§
for at least one year prior to the date of application for its loan or line of credit (2* gross revenues, including revenues of affiliates, less than three million dollars t
fifty employees and (3) has been doing business and has maintained its pnrx p»i <-fr and place of business in the state for a period of at least one year prior to the aWof*' application for assistance under this section. The department of ecomonic dr • ment shall charge and collect interest on each such loan or line of credit at a rau toV determined in accordance with regulations adopted pursuant to subsection (b) of th section. The total amount of such loans or lines of credit provided to any single x j " ness in any period of twelve consecutive months shall not exceed two hundred thoiv sand dollars. Payments made by businesses on all loans and lines of credit paid i 0 ik. treasurer for deposit in the business environmental clean up revolving loan fund shaU be credited to such fund.
(b) The commissioner of economic development shall adopt regulation, accordance with chapter 54 of the general statutes to carry out the provisions of rJm section. Such regulations shall establish loan procedures, interest, repayment lermi security requirements, default and remedy provisions and such other terms and condt! dons as the commissioner shall deem appropriate.
(c) Each such loan or extension of credit shall be authorized by the Coom. cut development authority or, if the authority so determines, by a committee of the authority consisting of the chairman and either one other member of the authority or its executive director, as specified in the determination of the authority. Any administrative expenses incurred in carrying out the provisions of this section, to the extent not paid by the authority or from moneys appropriated to the department, shall be paid from the business environmental clean up revolving loan fund. Payments from the business environmental clean up revolving loan fund to businesses or to pay such administrative expenses shall be made by the treasurer upon certification by the commissioner of economic development that the payment is authorized under the provisions of this section, under the applicable rules and regulations of the department, and, if made to a business, under the terms and conditions established by the authority or the duly appointed committee thereof in authorizing the making of tie loan or the extension of credit.
(d) On or before the second Wednesday after the convening of each regular session of the general assembly, the commissioner of economic development shall submit a report to the joint standing committee of the general assembly having cognizance of matters relating to the environmental and to the joint standing committee of the general assembly having cognizance of appropriations and the budgets of state agencies, which sets forth, for the year ending the preceding June thirtieth, the status of the fund, including the number and amount of loans made and the amount of loans outstanding.
Sec. 7. (NEW) On or before January 1,1991, the commissioner of environmental protection shall adopt regulations in accordance with chapter 54 of the general statutes setting forth standards for the clean up of hazardous waste disposal sites to fully protect health, public welfare and the environment. In establishing such standards the commissioner shall (1) give preference to clean-up methods that are permanent, if feasible, and (2) consider any factor he deems appropriate, including, but not limited to, groundwater classification of the site.
Sec. 8. Section 22a-133a of the general statutes is repealed and the following is substituted in lieu thereof:
As used in this section, sections 22a-133b to 22a-133j, inclusive, section 22a-448 and subsection (c) of section 22a-449:
( 1 ) "Commissioner" means the commissioner of environmental protection; (2) "Remedial action" means the discovery and evaluation of hazardous
waste disposal sites, the containment or removal of hazardous waste from and mitigation of the effects of hazardous waste on such sites to the satisfaction of the commissioner, including studies and reports of such sites and financial requirements for postclosure, operations, maintenance and monitoring; [, and]
(3) "CERCLA" means the Comprehensive Environmental Response, Compensation and Liability Act of 1980 (42 USC 901, et seq.), as amended; AND
(4) "FINAL REMEDIAL ACTION" MEANS ACTION CONSTITUTING A PERMANENT REMEDY AT A HAZARDOUS WASTE DISPOSAL SITE CONSISTENT WITH STANDARDS ADOPTED BY THE COMMISSIONER OF ENVIRONMENTAL PROTECTION PURSUANT TO SECTION 7 OF THIS ACT, PROVIDED TO THE EXTENT PERMANENT REMEDIES ARE NOT AVAILABLE IS A TIMELY MANNER, TEMPORARY REMEDIES TAKEN TO ACHIEVE SUCH STANDARDS SHALL BE DEEMED TO BE FINAL REMEDIAL ACTION UNTIL PERMANENT REMEDIES ARE DEVELOPED AND IMPLEMENTED.
Sec. 9. This act shall take effect from its passage.
Approved July 3, 1989 •See P.A. 89-303.
G-6
Appendix H
Excerpts from:
Protecting Connecticut's Groundwater: A Guide to Groundwater Protection
for Local Officials
by E.Z. . Harrison and M.A. Dickinson 1984
Published by the Connecticut Department of Environmental Protection
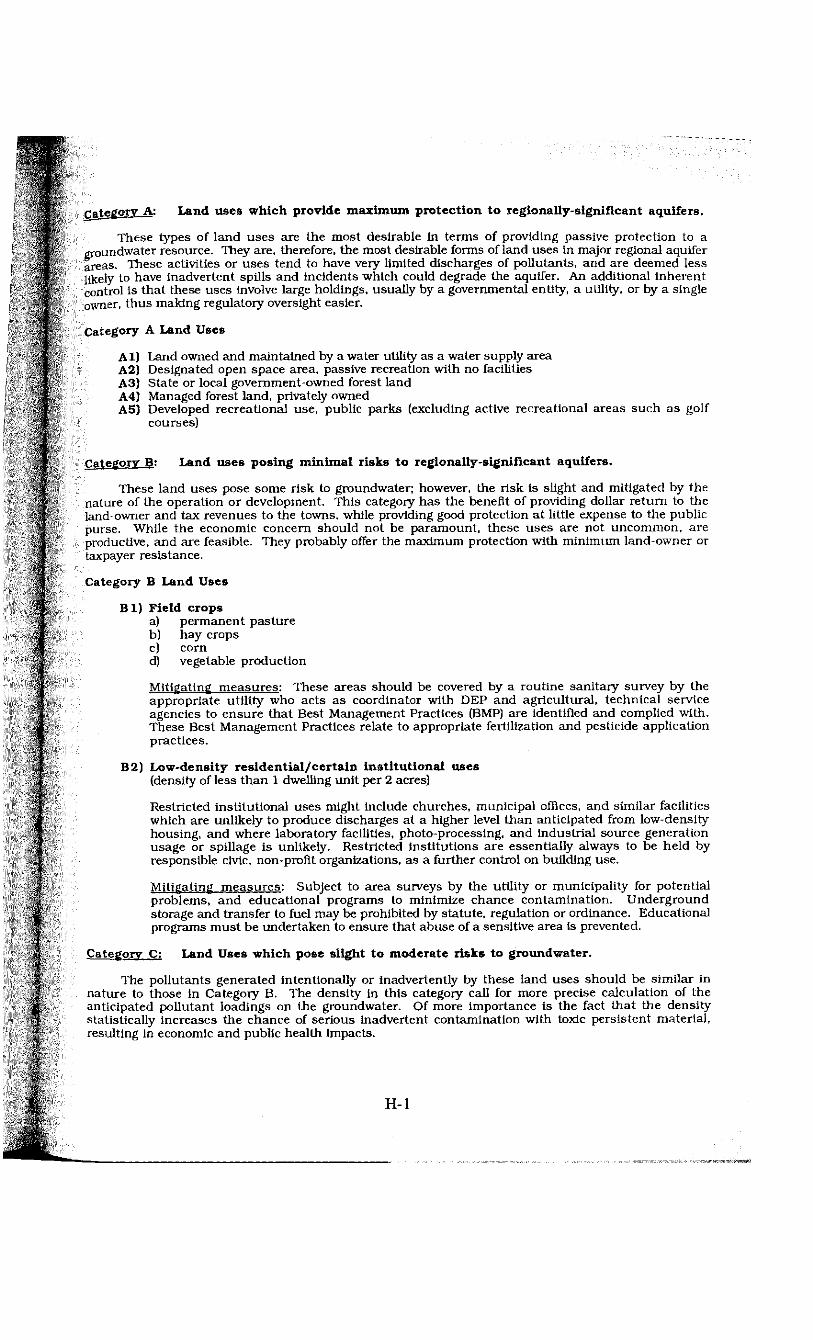
r«tggory A; Land uses which provide maximum protection to regionally-significant aquifers. These types of land uses are the most desirable in terms of providing passive protection to a
(jrouridwater resource. They are, therefore, the most desirable forms of land uses in major regional aquifer areas. These activities or uses tend to have very limited discharges of pollutants, and are deemed less likely to have inadvertent spills and incidents which could degrade the aquifer. An additional inherent conlrol is that these uses involve large holdings, usually by a governmental entity, a utility, or by a single owner, thus making regulatory oversight easier.
Category A Land Uses
A l ) Land owned and maintained by a water utility as a water supply area A2) Designated open space area, passive recreation with no facilities A3) State or local government-owned forest land A4) Managed forest land, privately owned A5) Developed recreational use, public parks (excluding active recreational areas such as golf
courses)
Category B: Land uses posing minimal risks to regionally-significant aquifers. These land uses pose some risk to groundwater; however, the risk is slight and mitigated by the
nature of the operation or development. This category has the benefit of providing dollar return to the land-owner and tax revenues to the towns, while providing good protection at little expense to the public purse. While the economic concern should not be paramount, these uses are not uncommon, are productive, and are feasible. They probably offer the maximum protection with minimum land-owner or taxpayer resistance.
Category B Land Uses
Bl) Field crops a) permanent pasture b) hay crops c) corn d) vegetable production
Mitigating measures: These areas should be covered by a routine sanitary survey by the appropriate utility who acts as coordinator with DEP and agricultural, technical service agencies to ensure that Best Management Practices (BMP) are identified and complied with. These Best Management Practices relate to appropriate fertilization and pesticide application practices.
B2) Low-density residential/certain institutional uses (density of less than 1 dwelling unit per 2 acres)
Restricted institutional uses might include churches, municipal offices, and similar facilities which are unlikely to produce discharges at a higher level than anticipated from low-density housing, and where laboratory facilities, photo-processing, and industrial source generation usage or spillage is unlikely. Restricted institutions are essentially always to be held by responsible civic, non-profit organizations, as a further control on building use.
Mitigating measures: Subject to area surveys by the utility or municipality for potential problems, and educational programs to minimize chance contamination. Underground storage and transfer to fuel may be prohibited by statute, regulation or ordinance. Educational programs must be undertaken to ensure that abuse of a sensitive area Is prevented.
Category C: Land Uses which pose slight to moderate risks to groundwater.
The pollutants generated intentionally or inadvertently by these land uses should be similar in nature to those in Category B. The density in this category call for more precise calculation of the anticipated pollutant loadings on the groundwater. Of more importance is the fact that the density statistically increases the chance of serious inadvertent contamination with toxic persistent material, • esulting in economic and public health Impacts.
H-1
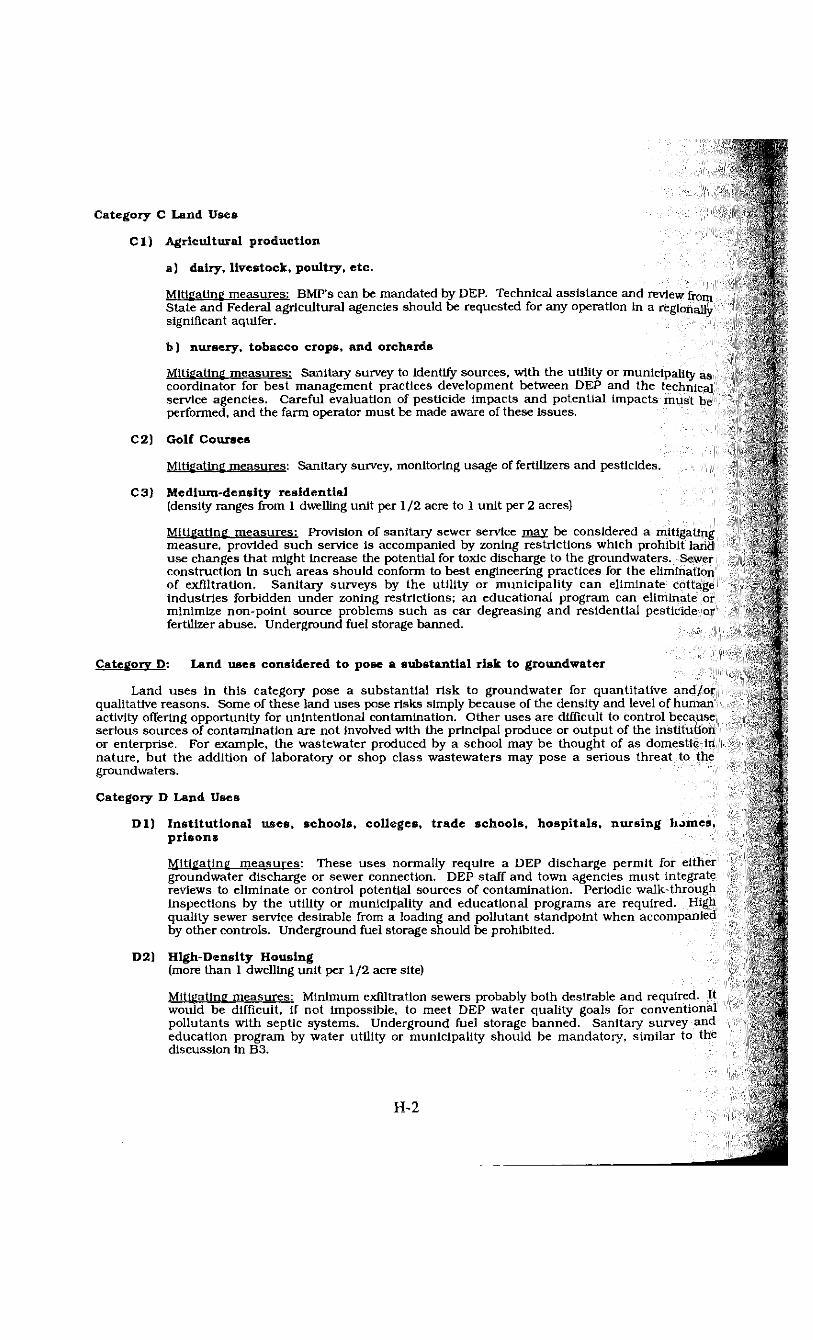
Category C Land Uses C I ) Agricultural production
a) dairy, livestock, poultry, etc.
Mitigating measures: BMP's can be mandated by DEP. Technical assistance and review from State and Federal agricultural agencies should be requested for any operation in a regionally significant aquifer.
b) nursery, tobacco crops, and orchards
Mitigating measures: Sanitary survey to identify sources, with the utility or municipality as coordinator for best management practices development between DEP and the technical service agencies. Careful evaluation of pesticide Impacts and potential impacts must be performed, and the farm operator must be made aware of these issues.
C2) Golf Courses
Mitigating measures: Sanitary survey, monitoring usage of fertilizers and pesticides.
C3) Medium-density residential (density ranges from 1 dwelling unit per 1/2 acre to 1 unit per 2 acres) Mitigating measures: Provision of sanitary sewer service may be considered a mitigating measure, provided such service is accompanied by zoning restrictions which prohibit land use changes that might increase the potential for toxic discharge to the groundwaters. Sewer construction in such areas should conform to best engineering practices for the elimination of exflltratlon. Sanitary surveys by the utility or municipality can eliminate cottage industries forbidden under zoning restrictions: an educational program can eliminate or minimize non-point source problems such as car degreaslng and residential pesticide or fertilizer abuse. Underground fuel storage banned.
Category D: Land uses considered to pose a substantial risk to groundwater
Land uses in this category pose a substantial risk to groundwater for quantitative and/or qualitative reasons. Some of these land uses pose risks simply because of the density and level of human activity offering opportunity for unintentional contamination. Other uses are difficult to control because serious sources of contamination are not involved with the principal produce or output of the institution or enterprise. For example, the wastewater produced by a school may be thought of as domestic in nature, but the addition of laboratory or shop class wastewaters may pose a serious threat to the groundwaters.
Category D Land Uses
D l ) Institutional uses, schools, colleges, trade schools, hospitals, nursing homes, pr isons
Mitigating measures: These uses normally require a DEP discharge permit for either groundwater discharge or sewer connection. DEP staff and town agencies must integrate reviews to eliminate or control potential sources of contamination. Periodic walk-through inspections by the utility or municipality and educational programs are required. High quality sewer service desirable from a loading and pollutant standpoint when accompanied by other controls. Underground fuel storage should be prohibited.
D2) High-Density Housing (more than 1 dwelling unit per 1/2 acre site) Mitigating measures: Minimum exfiltration sewers probably both desirable and required. It would be difficult, if not impossible, to meet DEP water quality goals for conventional pollutants with septic systems. Underground fuel storage banned. Sanitary survey and education program by water utility or municipality should be mandatory, similar to the discussion in B3.
H-2
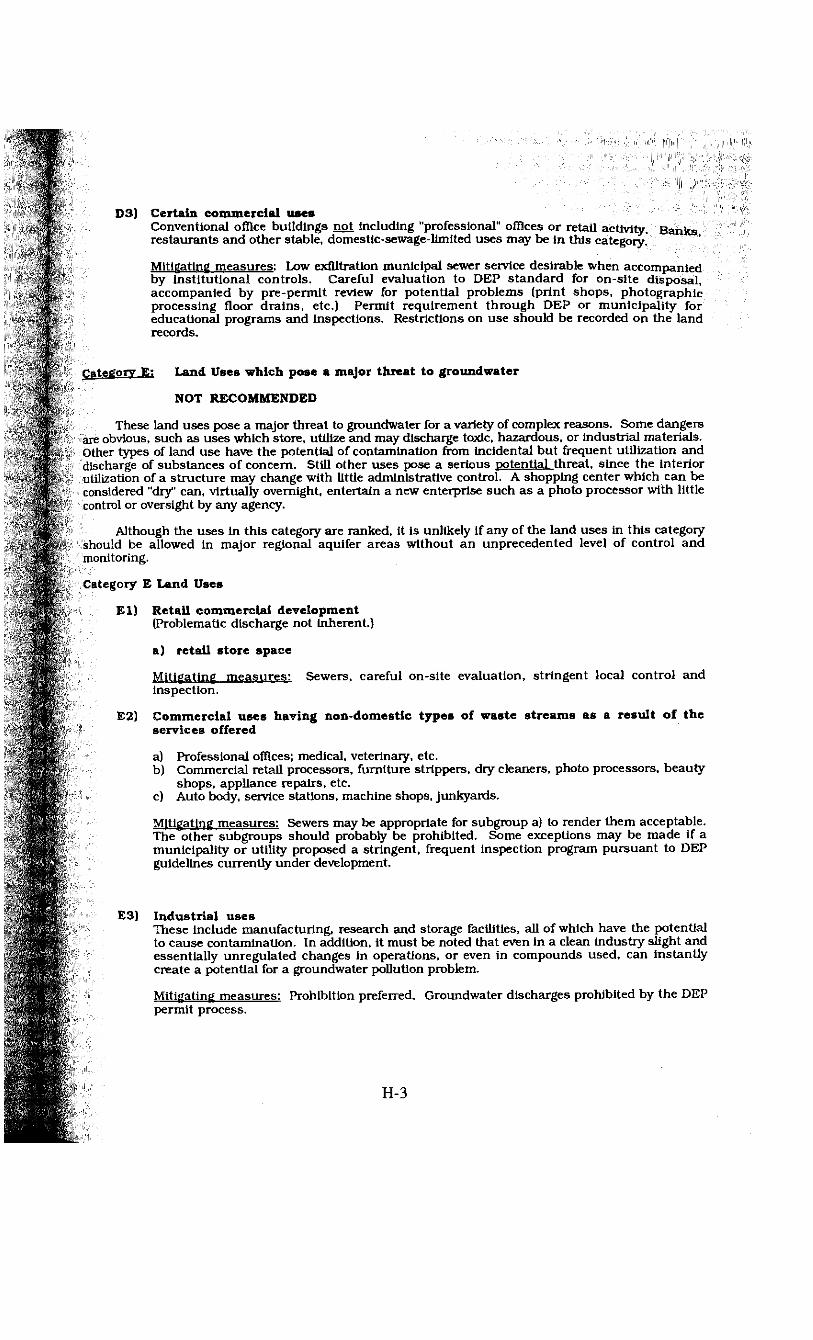
D3) Certain commercial uses Conventional office buildings not including "professional" offices or retail activity. Banks, restaurants and other stable, domestic-sewage-limited uses may be In this category.
Mitigating measures: Low exflltration municipal sewer service desirable when accompanied by Institutional controls. Careful evaluation to DEP standard for on-site disposal, accompanied by pre-permit review for potential problems (print shops, photographic processing floor drains, etc.) Permit requirement through DEP or municipality for educational programs and inspections. Restrictions on use should be recorded on the land records.
Catt:ory E ; Land Uses which pose a major threat to groundwater
NOT RECOMMENDED
These land uses pose a major threat to groundwater for a variety of complex reasons. Some dangers are obvious, such as uses which store, utilize and may discharge toxic, hazardous, or industrial materials. Otliir types of land use have the potential of contamination from incidental but frequent utilization and discharge of substances of concern. Still other uses pose a serious potential threat, since the interior utilization of a structure may change with littie administrative control. A shopping center which can be considered "dry" can, virtually overnight, entertain a new enterprise such as a photo processor with little control or oversight by any agency.
Although the uses in this category are ranked, it is unlikely if any of the land uses in this category should be allowed in major regional aquifer areas without an unprecedented level of control and monitoring.
Category E Land Uses
E l ) Retail commercial development (Problematic discharge not inherent.) a) retail store space
Mitigating measures: Sewers, careful on-site evaluation, stringent local control and inspection.
E2) Commercial uses having non-domestic types of waste streams as a result of the services offered
a) Professional offices; medical, veterinary, etc. b) Commercial retail processors, furniture strippers, dry cleaners, photo processors, beauty
shops, appliance repairs, etc. c) Auto body, service stations, machine shops, junkyards. Mitigating measures: Sewers may be appropriate for subgroup a) to render them acceptable. The other subgroups should probably be prohibited. Some exceptions may be made if a municipality or utility proposed a stringent, frequent inspection program pursuant to DEP guidelines currenuy under development.
E3) Industrial uses These include manufacturing, research and storage facilities, all of which have the potential to cause contamination. In addition, it must be noted that even in a clean industry slight and essentially unregulated changes in operations, or even in compounds used, can instantly create a potential for a groundwater pollution problem.
Mitigating measures: Prohibition preferred. Groundwater discharges prohibited by the DEP permit process.
H-3
Appendix I
Reported Salt Tolerances of Selected Plant Species
Compiled from a variety of sources, primarily Field, et. al., 1975
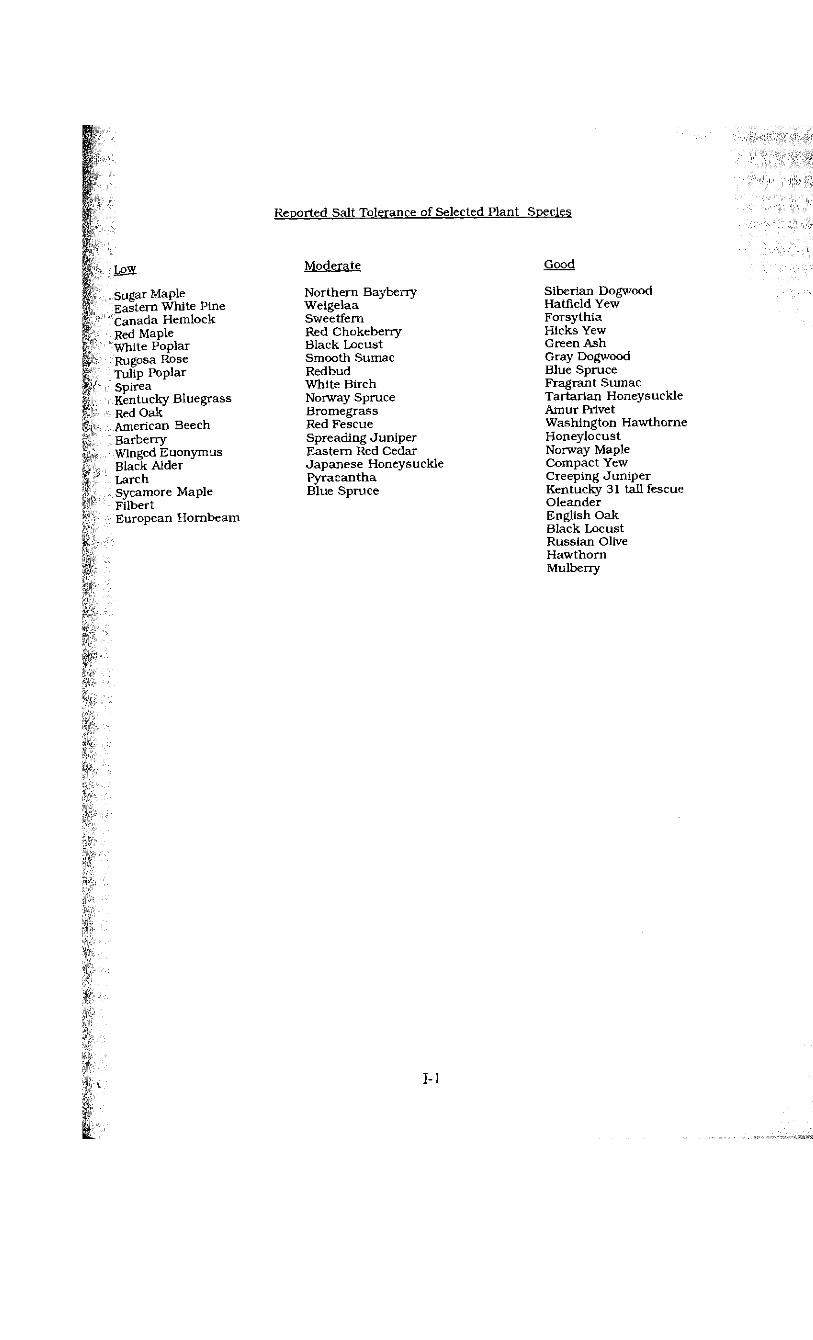
Reported Salt Tolerance of Selected Plant Species
Low
Suiiar Maple Easior.i White Pine Can.'id--. Hemlock Red .vi:-.ple Whi'e :'nplar Rugos;: Rose Ti:i»"' "i>p'ar
Spi •c Kcr lurky Bluegrass
Am-Tic-iii Beech
Wingec! liuonymus Black Alder Lar h Svrainore Maple Fil'^-r: Eurtipoan Hornbeam
Moderate Northern Bayberry Weigelaa Sweetfern Red Chokeberry Black Locust Smooth Sumac Redbud White Birch Norway Spruce Bromegrass Red Fescue Spreading Juniper Eastern Red Cedar Japanese Honeysuckle Pyracantha Blue Spruce
Good Siberian Dogwood Hatfield Yew Forsythia Hicks Yew Green Ash Gray Dogwood Blue Spruce Fragrant Sumac Tartarian Honeysuckle Amur Privet Washington Hawthorne Honeylocust Norway Maple Compact Yew Creeping Juniper Kentucky 31 tall fescue Oleander English Oak Black Locust Russian Olive Hawthorn Mulberry
I-l
Appendix J
How to Organize a Community Collection Day
HOW TO ORGANIZE
A
COMMUNITY COLLECTION DAY
Household Hazardous Waste
State of Connecticut Department Of Environmental Protection
Hazardous Material Management Unit Communication
J - 1
CONTENTS
Acknowledgement
Forward
What Are Household Hazardous Wastes?
Hazardous Household Products
Hazards of Improper Use, Storage, Disposal.
Options for Safe Disposal
Organizing a Collection Day
Selecting a Date and Location
Public Education and Publicity
Financial Support
Hiring a Licensed Hazardous Waste Management Firm
Legal and Liability Issues
Preparation of a Final Plan
Bibliography
Example Final Plan
Guidelines for Grants
ACKNOWLEDGEMENT
We wish to thank the Pioneer Valley Planning Commission of Springfield, Massachusetts and the Western Massachusetts Coalition for Safe Waste Management for allowing us to use this material. The Information originally appeared in the publication Household Hazardous Waste: A Guidebook for Organizing a Community Collection Event.
J - 2
F O R W A R D
This guidebook is intended for use by community groups which are interested in coordinating even Is to collect and safely dispose of household hazardous wastes. It provides an in-depth guide to hr.-cardous household products and their dangers, as well as a step-by-step "how to" process for organizing your community's Hazardous Waste Collection Day.
Trie Department of Environmental Protection can provide further information on household hazardous waste. Please contact either.
Paul Franson Waste Planning and Standards Unit
Department of Environmental Protection 165 Capitol Avenue
Hartford, Connecticut 06106 (203) 566-5277
Leslie Lewis Department of Environmental Protection
165 Capitol Avenue Hartford, Connecticut 06106
(203) 566-3489
If yon have any questions.
You may also wish to contact other towns which have held household hazardous waste collection days. A list of these towns is available from the DEP.
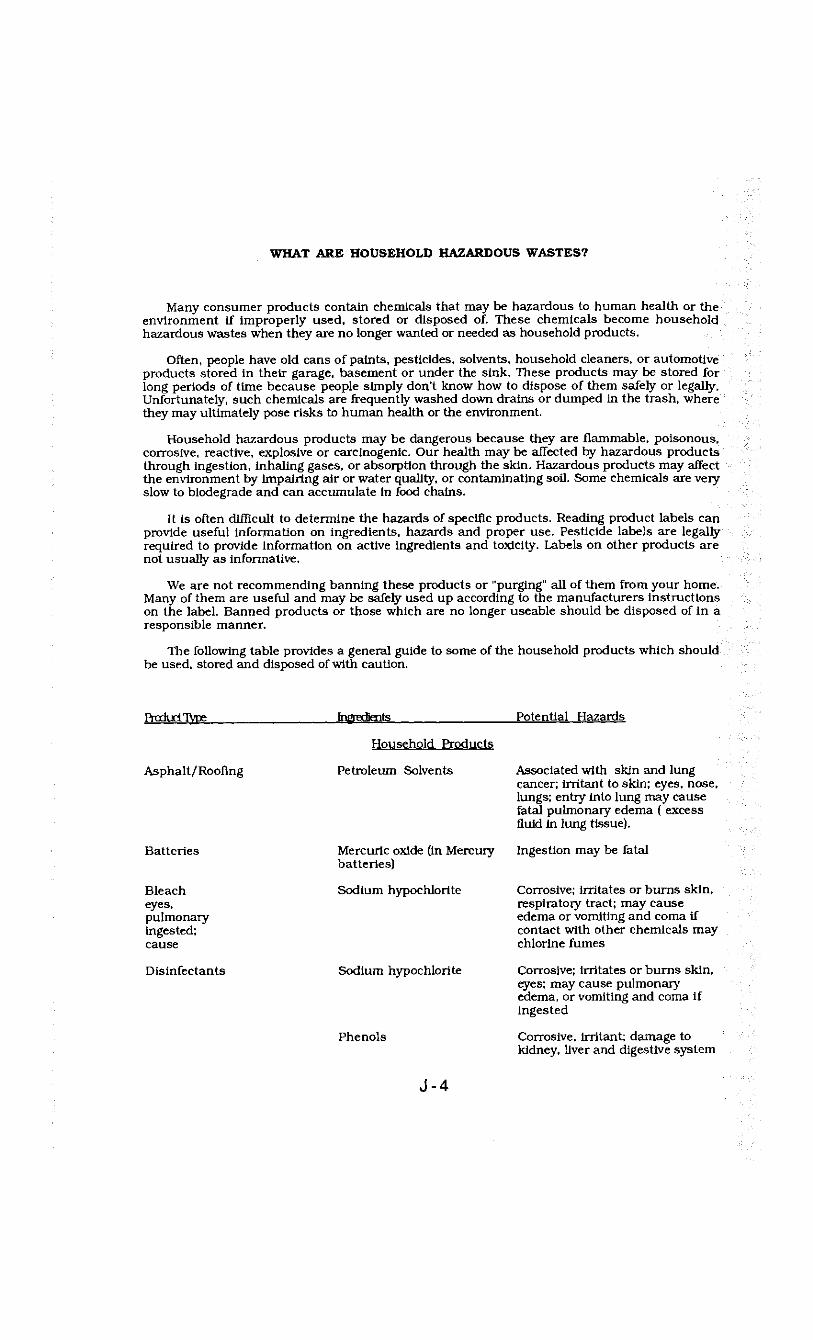
WHAT ARE HOUSEHOLD HAZARDOUS WASTES?
Many consumer products contain chemicals that may be hazardous to human health or the environment if improperly used, stored or disposed of. These chemicals become household hazardous wastes when they are no longer wanted or needed as household products.
Often, people have old cans of paints, pesticides, solvents, household cleaners, or automotive products stored in their garage, basement or under the sink. These products may be stored for long periods of time because people simply don't know how to dispose of them safely or legally. Unfortunately, such chemicals are frequently washed down drains or dumped in the trash, where they may ultimately pose risks to human health or the environment.
Household hazardous products may be dangerous because they are flammable, poisonous, corrosive, reactive, explosive or carcinogenic. Our health may be affected by hazardous products through ingestion, inhaling gases, or absorption through the skin. Hazardous products may affect the environment by impairing air or water quality, or contaminating soil. Some chemicals are very slow to blodegrade and can accumulate in food chains.
It is often difficult to determine the hazards of specific products. Reading product labels can provide useful information on ingredients, hazards and proper use. Pesticide labels are legally required to provide information on active ingredients and toxicity. Labels on other products are not usually as informative.
We are not recommending banning these products or "purging" all of them from your home. Many of them are useful and may be safely used up according to the manufacturers instructions on the label. Banned products or those which are no longer useable should be disposed of in a responsible manner.
The following table provides a general guide to some of the household products which should be used, stored and disposed of with caution.
Product Type Ingredients Potential Hazards
Household Products
Asphalt/ Roofing Petroleum Solvents Associated with skin and lung cancer; irritant to skin; eyes, nose, lungs; entry into lung may cause fatal pulmonary edema ( excess fluid in lung tissue).
Batteries Mercuric oxide (in Mercury batteries)
Ingestion may be fatal
Bleach eyes, pulmonary ingested; cause
Sodium hypochlorite Corrosive; irritates or burns skin, respiratory tract; may cause edema or vomiting and coma if contact with other chemicals may chlorine fumes
Disinfectants Sodium hypochlorite Corrosive; Irritates or burns skin, eyes; may cause pulmonary edema, or vomiting and coma if ingested
Phenols Corrosive. Irritant; damage to kidney, liver and digestive system
J -4
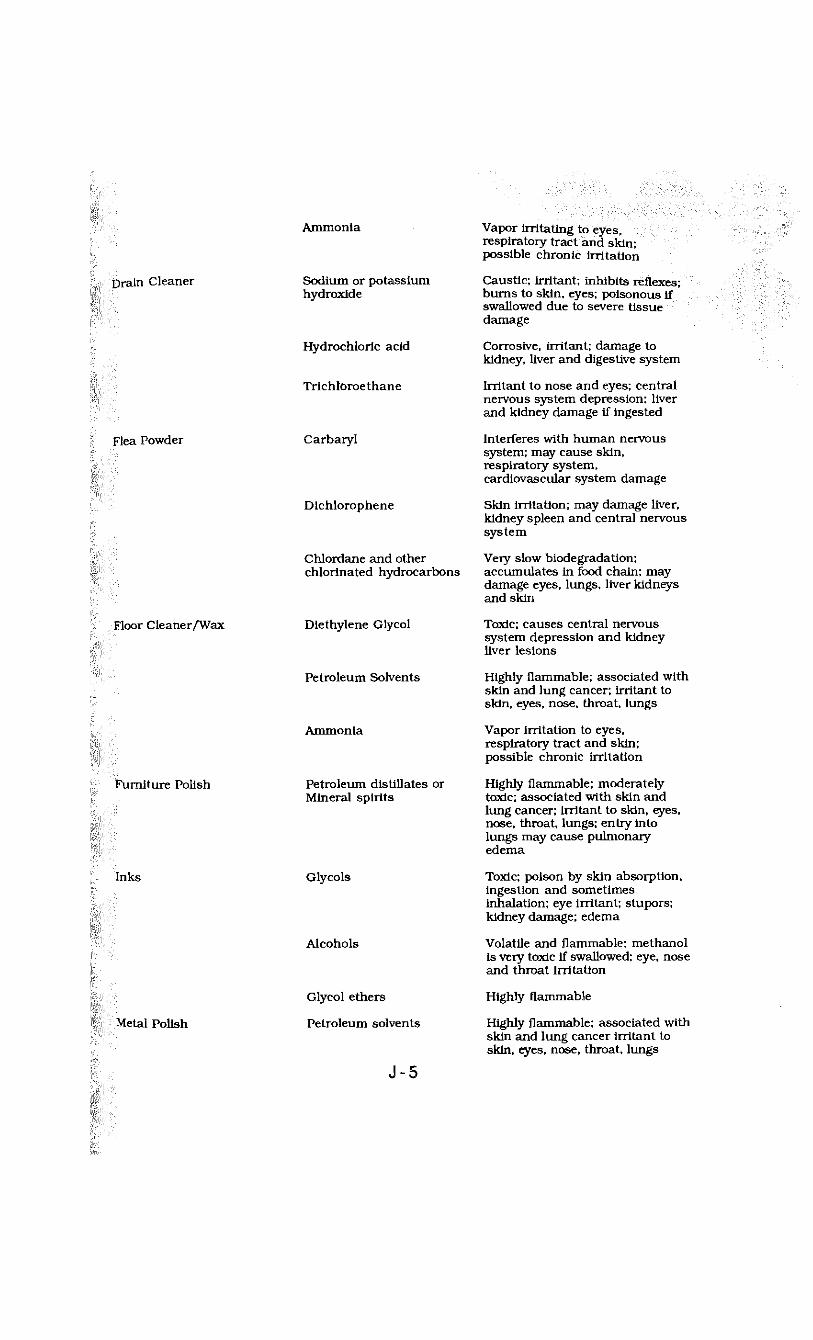
Ammonia Vapor irritating to eyes, respiratory tract and skin; possible chronic irritation
Tjivin Cleaner
Flea Powder
Floor Cleaner/Wax
Fu-niliire Polish
Inks
Mc;r. Polish
Sodium or potassium hydroxide
Hydrochloric acid
Trichloroe thane
Carbaryl
Dichlorophene
Chlordane and other chlorinated hydrocarbons
Diethylene Glycol
Petroleum Solvents
Ammonia
Petroleum distillates or Mineral spirits
Glycols
Alcohols
Glycol ethers
Petroleum solvents
J - 5
Caustic; irritant; inhibits reflexes; burns to skin, eyes; poisonous if swallowed due to severe tissue damage
Corrosive, irritant; damage to kidney, liver and digestive system
Irritant to nose and eyes; central nervous system depression; liver and kidney damage if ingested
Interferes with human nervous system; may cause skin, respiratory system, cardiovascular system damage
Skin irritation; may damage liver, kidney spleen and central nervous system
Very slow biodegradation; accumulates in food chain; may damage eyes, lungs, liver kidneys and skin
Toxic; causes central nervous system depression and kidney liver lesions
Highly flammable; associated with skin and lung cancer; irritant to skin, eyes, nose, throat, lungs
Vapor irritation to eyes, respiratory tract and skin; possible chronic irritation
Highly flammable; moderately toxic; associated with skin and lung cancer; irritant to skin, eyes, nose, throat, lungs; entry into lungs may cause pulmonary edema
Toxic; poison by skin absorption, ingestion and sometimes inhalation; eye irritant; stupors; kidney damage; edema
Volatile and flammable; methanol is very toxic if swallowed; eye, nose and throat irritation
Highly flammable
Highly flammable; associated with skin and lung cancer irritant to skin, eyes, nose, throat, lungs
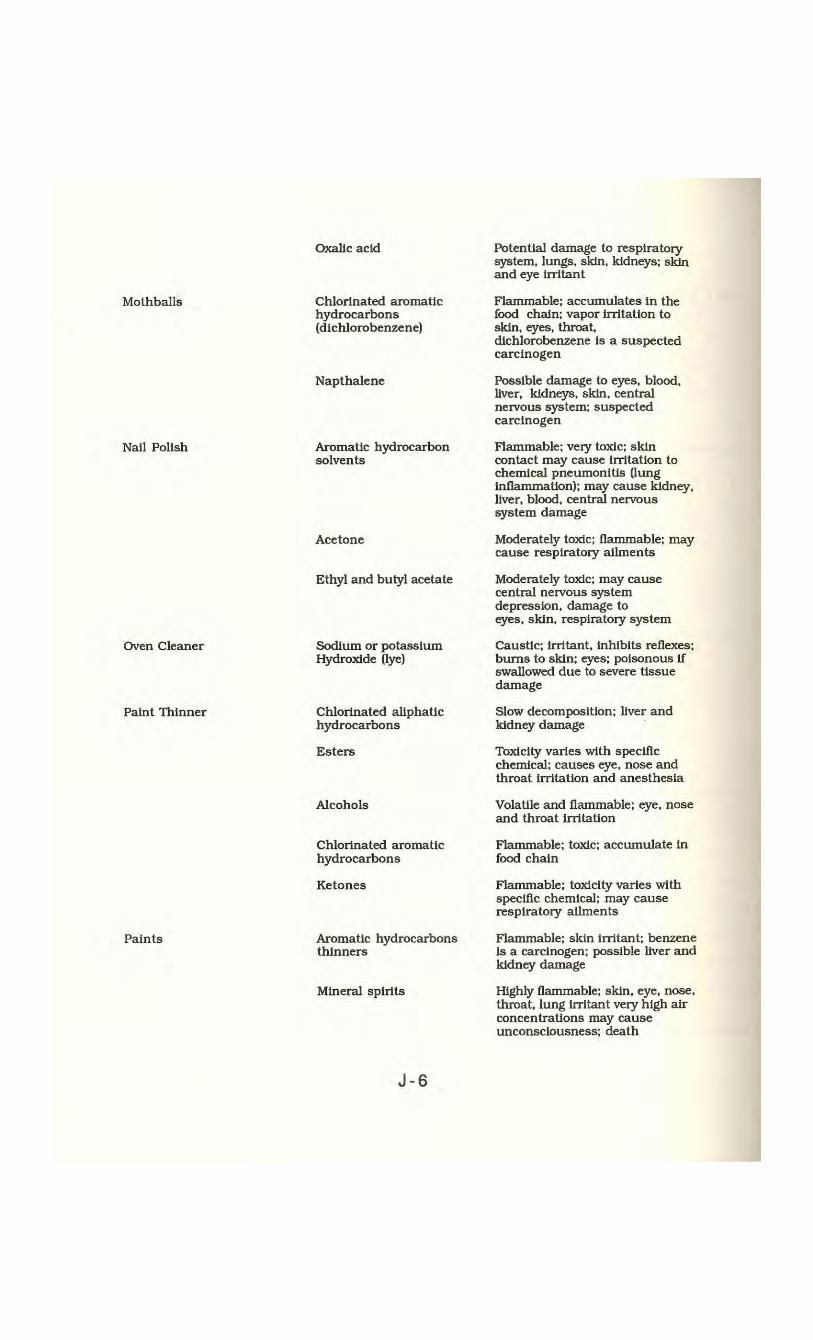
Mothballs
Nail Polish
Oven Cleaner
Paint Thinner
Oxalic acid
Chlorinated aromatic hydrocarbons (dichlorobenzene)
Napthalene
Aromatic hydrocarbon solvents
Acetone
Ethyl and butyl acetate
Sodium or potassium Hydroxide (lye)
Chlorinated aliphatic hydrocarbons
Esters
Alcohols
Potential damage to respiratory system, lungs, skin, kidneys; skin and eye irritant
Flammable; accumulates in the food chain; vapor irritation to skin, eyes, throat, dichlorobenzene is a suspected carcinogen
Possible damage to eyes, blood, liver, kidneys, skin, central nervous system; suspected carcinogen
Flammable; very toxic; skin contact may cause irritation to chemical pneumonitis (lung inflammation); may cause kidney, liver, blood, central nervous system damage
Moderately toxic; flammable; may cause respiratory ailments
Moderately toxic; may cause central nervous system depression, damage to eyes, skin, respiratory system
Caustic; irritant, inhibits reflexes; burns to skin; eyes; poisonous if swallowed due to severe tissue damage
Slow decomposition; liver and kidney damage
Toxicity varies with specific chemical; causes eye, nose and throat irritation and anesthesia
Volatile and flammable; eye, nose and throat irritation
Paints
Chlorinated aromatic hydrocarbons
Ketones
Aromatic hydrocarbons thinners
Mineral spirits
Flammable; toxic; accumulate in food chain
Flammable; toxicity varies with specific chemical; may cause respiratory ailments
Flammable; skin irritant; benzene is a carcinogen; possible liver and kidney damage
Highly flammable; skin, eye, nose, throat, lung irritant very high air concentrations may cause unconsciousness; death
J - 6
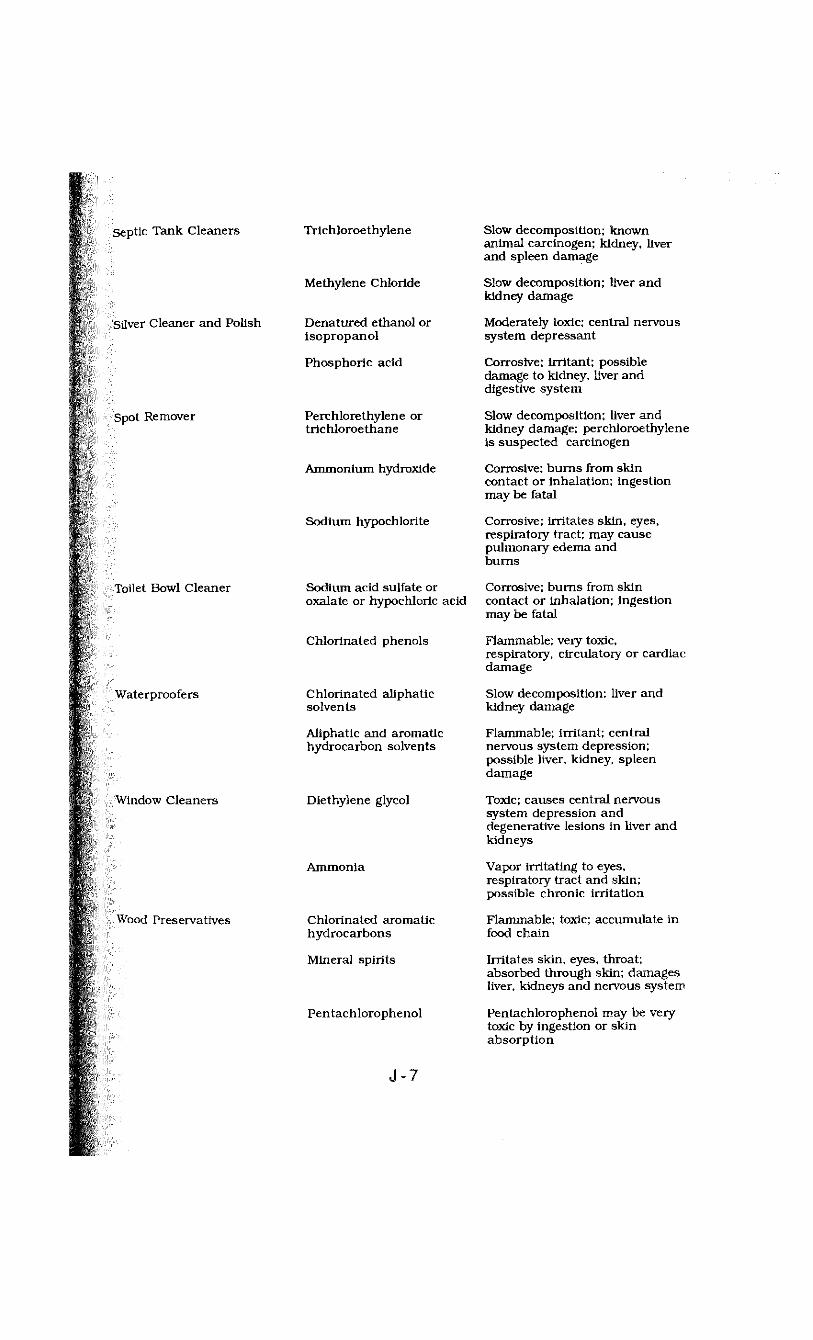
Septic Tank Cleaners
Stlwr Cleaner and Polish
Spot -Ismover
Trlchloroe thylene
Methylene Chloride
Denatured ethanol or isopropanol
Phosphoric acid
Perchlorethylene or trichloroe thane
Ammonium hydroxide
Sodium hypochlorite
Slow decomposition; known animal carcinogen; kidney, liver and spleen damage
Slow decomposition; liver and kidney damage
Moderately toxic; central nervous system depressant
Corrosive; irritant; possible damage to kidney, liver and digestive system
Slow decomposition; liver and kidney damage; perchloroethylene is suspected carcinogen
Corrosive; bums from skin contact or inhalation; ingestion may be fatal
Corrosive; irritates skin, eyes, respiratory tract; may cause pulmonary edema and burns
Toilci i.towl Cleaner
Wiiiorproofers
Wii'(io\v Cleaners
Wood Preservatives
Sodium acid sulfate or oxalate or hypochloric acid
Chlorinated phenols
Chlorinated aliphatic solvents
Aliphatic and aromatic hydrocarbon solvents
Diethylene glycol
Ammonia
Chlorinated aromatic hydrocarbons
Mineral spirits
Pentachlorophenol
Corrosive; burns from skin contact or inhalation; ingestion may be fatal
Flammable; very toxic, respiratory, circulatory or cardiac damage
Slow decomposition; liver and kidney damage
Flammable; irritant; central nervous system depression; possible liver, kidney, spleen damage
Toxic; causes central nervous system depression and degenerative lesions in liver and kidneys
Vapor irritating to eyes, respiratory tract and skin; possible chronic irritation
Flammable; food chain
toxic; accumulate in
Irritates skin, eyes, throat; absorbed through skin; damages liver, kidneys and nervous system
Pentachlorophenol may be very toxic by ingestion or skin absorption
J - 7
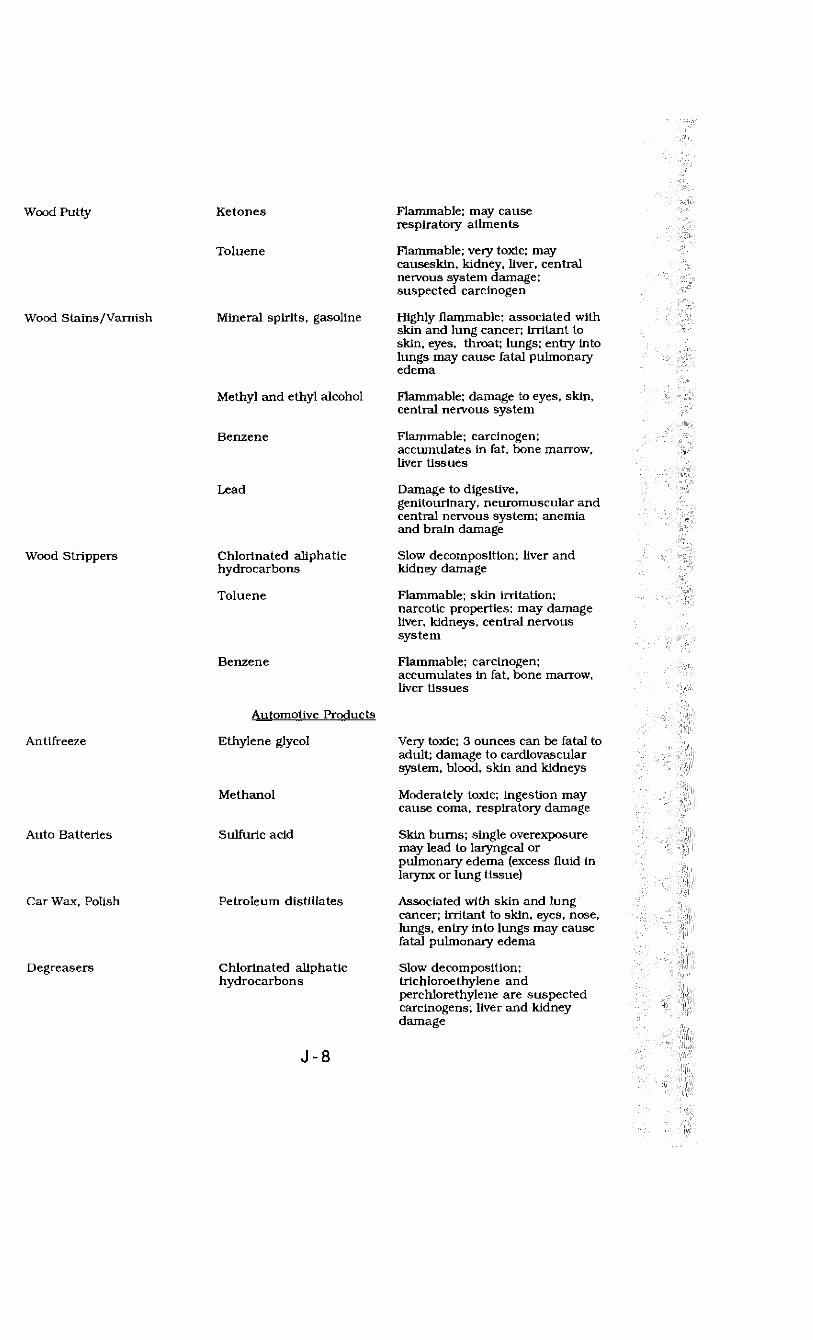
Ketones
Toluene
Mineral spirits, gasoline
Methyl and ethyl alcohol
Benzene
Lead
Chlorinated aliphatic hydrocarbons
Toluene
Benzene
Automotive Products
Ethylene glycol
Methanol
Sulfuric acid
Petroleum distillates
Chlorinated aliphatic hydrocarbons
Flammable; may cause respiratory ailments
Flammable; very toxic; may causeskin, kidney, liver, central nervous system damage; suspected carcinogen
Highly flammable: associated with skin and lung cancer; irritant to skin, eyes, throat; lungs; entry into lungs may cause fatal pulmonary edema
Flammable; damage to eyes, skin, central nervous system
Flammable; carcinogen; accumulates in fat, bone marrow, liver tissues
Damage to digestive, genitourinary, neuromuscular and central nervous system; anemia and brain damage
Slow decomposition; liver and kidney damage
Flammable; skin irritation; narcotic properties: may damage liver, kidneys, central nervous system
Flammable; carcinogen; accumulates in fat, bone marrow, liver tissues
Very toxic; 3 ounces can be fatal to adult; damage to cardiovascular system, blood, skin and kidneys
Moderately toxic; ingestion may cause coma, respiratory damage
Skin burns; single overexposure may lead to laryngeal or pulmonary edema (excess fluid in larynx or lung tissue)
Associated with skin and lung cancer; irritant to skin, eyes, nose, lungs, entry into lungs may cause fatal pulmonary edema
Slow decomposition; trichloroethylene and perchlorethylene are suspected carcinogens; liver and kidney damage
J - 8
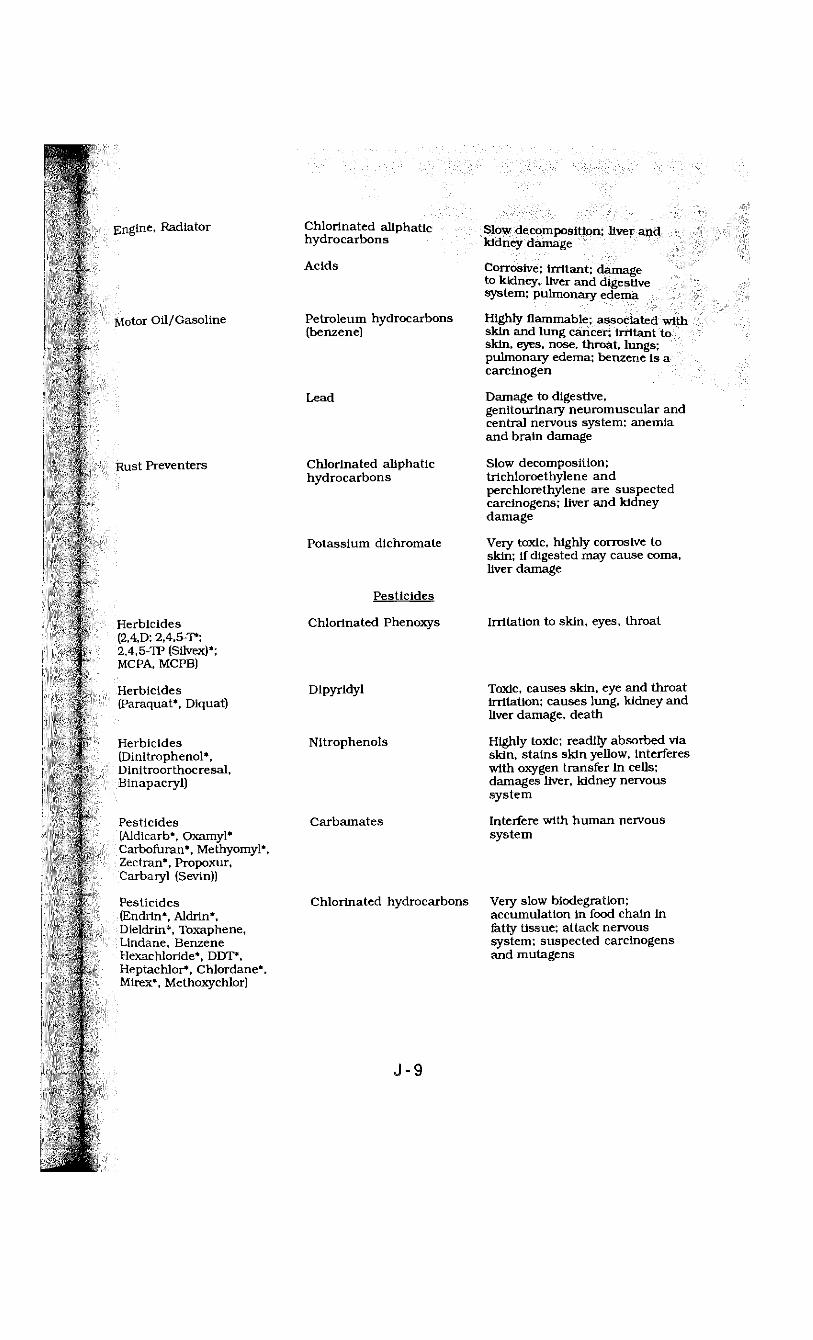
Engine, Radiator
Motor Oil/Gasoline
Rust Preventers
Herbicides (2.4.D; 2,4,5-T*; 2,4,5-TP (Silvex)*; MCPA, MCPB)
Herbicides (Paraquat*. Diquat)
Herbicides (Dinitrophenol*. Dinitroorthocresal, Binapacryl)
Pesticides (Aldicarb*. Oxamyl* Carbofuran*. Methyomyl*, Zectran*, Propoxur, Carbaryl (Sevin))
Pesticides (Endrin*. Aldrin*, Dieldrin*, Toxaphene, Lindane, Benzene Hexachloride*. DDT*, Heptachlor*. Chlordane*, Mirex*, Methoxychlor)
Chlorinated aliphatic hydrocarbons Acids
Petroleum hydrocarbons (benzene)
Lead
Chlorinated aliphatic hydrocarbons
Potassium dichromate
Pesticides
Chlorinated Phenoxys
Dipyridyl
Nitrophenols
Carbamates
Chlorinated hydrocarbons
Slow decomposition; liver and kidney damage
Corrosive; Irritant; damage to kidney, liver and digestive system; pulmonary edema
Highly flammable; associated with skin and lung cancer; irritant to skin, eyes, nose, throat, lungs; pulmonary edema; benzene is a carcinogen
Damage to digestive, genitourinary neuromuscular and central nervous system; anemia and brain damage
Slow decomposition; trichloroethylene and perchlorethylene are suspected carcinogens; liver and kidney damage
Very toxic, highly corrosive to skin; if digested may cause coma, liver damage
Irritation to skin, eyes, throat
Toxic, causes skin, eye and throat irritation; causes lung, kidney and liver damage, death
Highly toxic; readily absorbed via skin, stains skin yellow, interferes with oxygen transfer in cells; damages liver, kidney nervous system
Interfere with human nervous system
Very slow biodegration; accumulation In food chain in fatty tissue; attack nervous system; suspected carcinogens and mutagens
J - 9
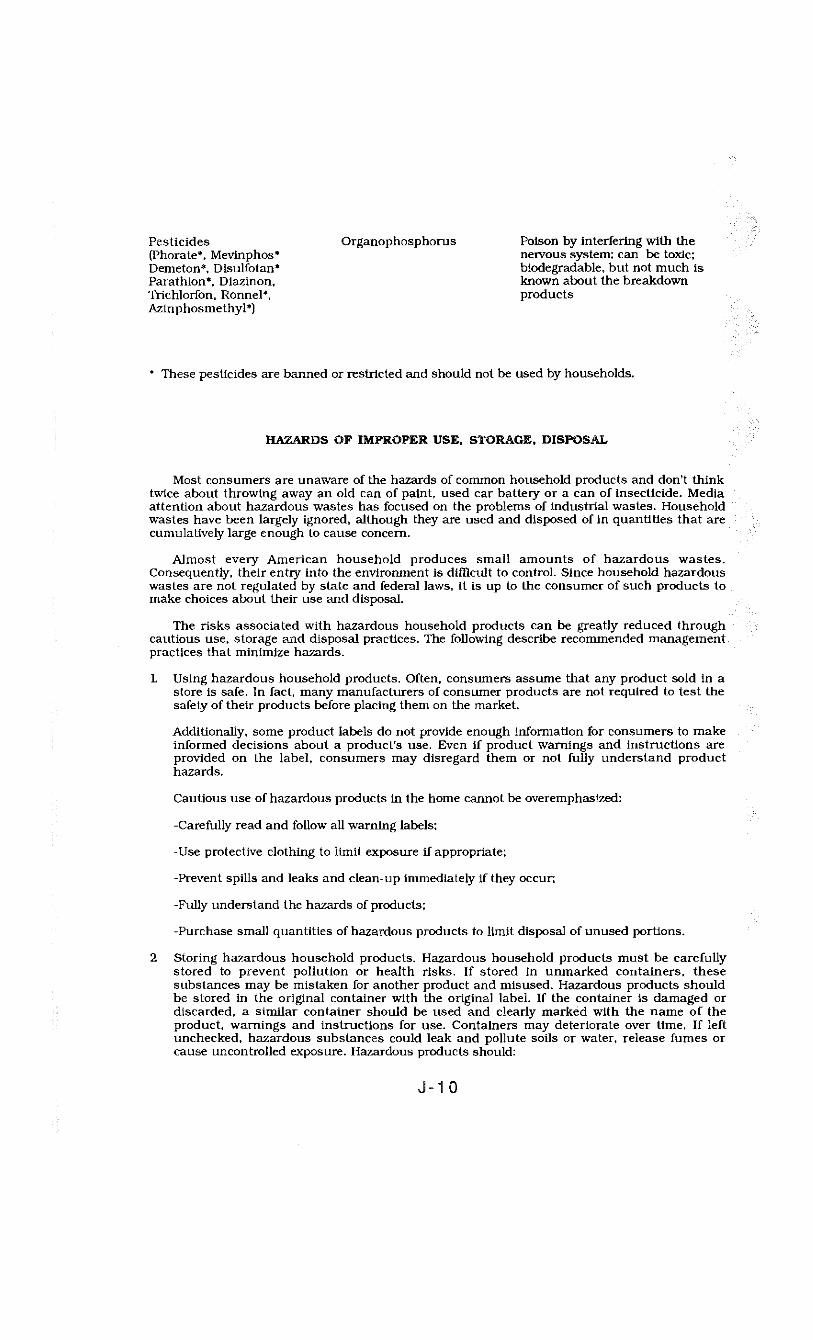
(Phorate*. Mevinphos* Demeton*, Disulfotan* Parathion*, Diazinon, Trichlorfon, Ronnel*. Azinphosmethyl*)
Pesticides Organophosphorus Poison by interfering with the nervous system; can be toxic; biodegradable, but not much is known about the breakdown products
* These pesticides are banned or restricted and should not be used by households.
HAZARDS OF IMPROPER USE, STORAGE, DISPOSAL
Most consumers are unaware of the hazards of common household products and don't think twice about throwing away an old can of paint, used car battery or a can of insecticide. Media attention about hazardous wastes has focused on the problems of industrial wastes. Household wastes have been largely ignored, although they are used and disposed of in quantities that are cumulatively large enough to cause concern.
Almost every American household produces small amounts of hazardous wastes. Consequently, their entry into the environment is difficult to control. Since household hazardous wastes are not regulated by state and federal laws, it is up to the consumer of such products to make choices about their use and disposal.
The risks associated with hazardous household products can be greatly reduced through cautious use, storage and disposal practices. The following describe recommended management practices that minimize hazards.
1. Using hazardous household products. Often, consumers assume that any product sold in a store is safe. In fact, many manufacturers of consumer products are not required to test the safety of their products before placing them on the market.
Additionally, some product labels do not provide enough information for consumers to make informed decisions about a product's use. Even if product warnings and Instructions are provided on the label, consumers may disregard them or not fully understand product hazards.
Cautious use of hazardous products in the home cannot be overemphasized:
-Carefully read and follow all warning labels;
-Use protective clothing to limit exposure if appropriate;
-Prevent spills and leaks and clean-up immediately if they occur;
-Fully understand the hazards of products;
-Purchase small quantities of hazardous products to limit disposal of unused portions.
2 Storing hazardous household products. Hazardous household products must be carefully stored to prevent pollution or health risks. If stored in unmarked containers, these substances may be mistaken for another product and misused. Hazardous products should be stored in the original container with the original label. If the container is damaged or discarded, a similar container should be used and clearly marked with the name of the product, warnings and instructions for use. Containers may deteriorate over time. If left unchecked, hazardous substances could leak and pollute soils or water, release fumes or cause uncontrolled exposure. Hazardous products should:
J-1 0
-Esc stored away from living areas;
-Ui made inaccessible to children and pets;
-Be kept isolated from food and water. a disposal of hazardous household products. Most hazardous household products are
disposed of in ways which allow them to pollute the environment, partly because the public is •.•.naware of the dangers of these disposal methods and partly because there are few safe disposal options readily available to households. When hazardous household products are discarded, they become hazardous wastes. Most often, these wastes are disposed by pouring them down the drain or storm sewer, burning them, putting them out in the trash or burying them in the backyard. All of these methods are dangerous and can threaten public health or contaminate the environment. What happens when these disposal methods are used?
.'oLiring wastes down the drain or storm sewer:
Hazardous substances which are poured down household drains may corrode plumbing, collect in the trap and release fumes, cause septic system malfunctions and contaminate groundwater supplies.
Wastes which are poured down storm sewers are discharged directly to rivers and streams. Once there, many toxic wastes decompose very slowly and may accumulate in the food chain.
'Hirowing hazardous wastes out in the trash:
Hazardous wastes which are discarded with the household trash can injure refuse workers when they handle the waste and can pollute the environment around landfills. Hazardous materials buried in landfills become ticking time bombs which can cause a fire, explode, contaminate water supplies or release toxic fumes.
burning hazardous wastes:
Burning hazardous wastes may cause an explosion, release toxic fumes into the air or concentrate toxic chemicals in the ash.
Burying or land spreading wastes:
Hazardous wastes spread on the ground or buried may contaminate soil, leach through the soil and contaminate groundwater or be carried into water bodies by surface runoff during rainstorms.
OPTIONS FOR SAFE DISPOSAL
Currently, there are few economical opdons available to householders for the safe disposal of ha a.dnus wastes. The most common disposal methods used by consumers are inappropriate for most hazardous substances. Commercial hazardous waste disposal facilities will not accept household hazardous wastes unless they are collected and combined into one shipment. The following are recommended disposal options available to households and communities. These options are not generally known by the public and may require a public education campaign in order to be widely adopted.
Substitute a non-hazardous product:
There are many non-hazardous household products available which can be used to r-vomplish the same job. Several publications listed in the bibliography describe substitute z r:ducts available to consumers. You can also get a list from the Department of Environmental Protection.
J -1 1
Buy only as much as you need: If a hazardous product must be used, the least hazardous product available should be chosen by comparing ingredients listed on the product label. Only enough material to accomplish the Job should be purchased. Any excess material should be passed on to a friend who can use it or it should be stored for future use or until a safe disposal method is available.
Use the product up or find someone who can:
Products which are still usefull and are not banned may be used up according to manufacturers' instructions. If you cannot use the product, you may be able to find someone who can. For instance local theater groups may want paint for sets. Shelters can use cleaning products. Call around in your area to find out if such an option exists. (Remember to keep all products in their original containers with labels attached!).
Hold a community collection day:
A licensed hazardous waste firm can be hired to collect household hazardous wastes and deliver them to an approved management facility. A household hazardous waste collection day Is an efficient and safe way to dispose of unwanted products.
ORGANIZING A COLLECTION DAY
In order to hold a successful household hazardous waste collection day, a great deal of organizing and advance planning is necessary. At least six months lead time should be allowed to carry out the following important organizing activities:
1. Gather information on household hazardous wastes. This brochure provides some basic information on the chemical ingredients and health effects of household products. Additional resources on toxic chemicals and on hazardous waste regulations are included in the bibliography. This information will enable you to make a presentation to demonstrate the need for your project.
2 Contact and involve all potentially interested groups. You will need the support and assistance of as many community officials and organizations as possible to develop a successful project. Contact and involve groups such as the following at the earliest stages of organizing:
Board of Selectmen: School Systems; Town Manager; Hazardous Waste Coordinator; Health Department or District; Planning Board; Environmental Groups; Conservation Commission; Fire Department; Police Department; League of Women Voters; Public Works Department; Civic Organizations; and interested citizens.
It will be important to have the cooperation of many of these groups in order to help carry out public education, financing, and other steps in the project.
3. Coordinate an initial meeting. Invite appropriate community groups to an initial meeting to discuss the project. Provide them with background information on household hazardous products and previous hazardous waste collection days.
Facilitate a discussion group to identify the steps that must be taken to organize a collection day in your community. Include the following issues in the discussion:
-Location and date for collection;
-Public education methods;
J -1 2
-Town approval and financing methods;
-Hiring a licensed hazardous waste firm. Encourage the group to come up with creative ideas to organize, publicize, and finance the project. Work out goals for the project and establish a schedule to achieve them. Try to get each member of the group to complete a task before the next meeting.
Contact the Department of Environmental Protection to request approval for your planned collection.
a Department of Environmental Protection approval should be requested early in your planning process.
b. To request approval, submit a letter to the:
Hazardous Waste Management Section Department of Environmental Protection 165 Capitol Avenue Hartford, Connecticut 06106 ATTN: Paul Franson (203) 566-5486
c. The letter should include:
1. The name of the municipality(ies) that is planning a collection;
2. The lead agency(ies) with actual responsibility for the planning;
3. The name(s) of contact(s), including phone number(s) from the lead agency(ies); name of other organizations involved so far.
4 The tentative date and hours of the planned collection;
5 The location of the proposed collection site;
d After the Department of Environmental Protection has received the written request we will schedule a meeting to discuss the plans and view the proposed site. It may be necessary after this meeting to amend your preliminary proposal.
Involve the media. One of the best ways to get the public interested in your project is through media coverage. Involve local newspaper, television and radio reporters in your project from the earliest possible point. Invite reporters to organizational meetings, develop press releases and send letters to the editor to inform the public of your concerns.
Follow-up meetings/work activities. After the initial meeting, hold regularly scheduled meetings to discuss project details and ensure that the project is moving ahead on schedule. Try to divide work tasks among subcommittees or subgroups. Get all members of the group actively involved. After the full group has decided on a date and location, the following activities can be worked on by smaller groups:
-Financing and town approval;
-Contracting with a licensed transporter/facility;
-Publicity and public awareness.
J - 1 3
SELECTING A DATE AND LOCATION
It is important to select a convenient date and location for your hazardous waste collection day that will enable and encourage the majority of people to participate.
In selecting a date, give yourself at least six months lead time to plan the project details and to prepare a good public involvement campaign. It is probably best to hold your collection day on a Saturday or Sunday in the spring or fall to attract the greatest number of participants.
In selecting a location, choose an area that is easily accessible, centrally located and well known to the general public, but not at a busy intersection where a traffic jam might result. A location that provides a safe environment for the transfer of hazardous chemicals in preferable, such as a parking lot at the local Department of Public Works garage or a high school. The location should provide sufficient space to set up the collection center and to park 20-30 cars. You should take into account any environmental drawback to the site such as storm drains or nearby water supply wells. These could be affected if a spill should occur.
For legal reasons, it is advisable to hold your event on municipally-owned property. If the event is held on private property, the owner will have to become involved in contract and insurance issues with the licensed hazardous waste firm.
In most cases, the town will be responsible for disposing of all non-hazardous trash which accumulates at the collection site. A large box or dumpster will be needed on-site.
The site should also provide shelter from rain for the waste drums and for the workers handling the wastes. If a site with a permanent shelter is unavailable, arrangements should be made for a temporary shelter such as a tarp or tent. Arrangements should also be made for sanitary facilities, hand washing, and rest/eating areas away from the waste handling zone.
PUBLIC EDUCATION AND PUBLICITY
One of the most important aspects of organizing a successful household hazardous waste collection day is the public education effort. Before people will participate, they must first understand that we all contribute to the hazardous waste problem by purchasing, using and disposing of household products containing hazardous substances. Your public education campaign should include these key points:
1. Identify which household products contain hazardous materials and which ones should be brought to the collection site.
2 Identify the environmental and health hazards of improper use and disposal of hazardous products particular to your community.
a The safe use and disposal of hazardous products requires individual judgement and personal responsibility. The common "out-of-sight, out-of-mind" attitude prevalent to waste disposal does not address the problem.
4 Consider the use of substitute products or practices which do not harm the environment. A household hazardous waste collection day provides for the safe disposal of household hazardous wastes, but it does not totally solve the hazardous waste problem. The reduction, or in some cases, the elimination of the use of hazardous products is also important.
Begin your education and publicity activities as soon as possible. Publicize early and widely to gain support for and participation in the project. The first phase of publicity should be education-oriented so people know your project is important. A few weeks before the actual collection day, publicize again. This time emphasize:
J - 1 4
-When it's happening
-Where it's happening
-What to bring and what not to bring
1 are some tips on handling safety: 1. Whenever possible, bring materials in their original, sealed containers. This will help the
hauler to determine the exact chemical make-up of the substance.
2 Don't mix different products together in one container. Some of them may react violently with each other.
3. If possible, pack containers separately in absorbant material to prevent breakage or leakage.
•V Bring rags or towels in your vehicle to clean up any spills.
5. If a leak or spill occurs en route to the site, stop the car, wipe up the substance, and open v»i ndows to vent fumes. Bring any rags or towels used to absorb a spill to the collection site for disposal.
1 Jie following are suggested educational/publicity techniques:
Classroom presentations - make arrangements to talk to students in the local school system. Bring materials to hand out. Take the opportunity to inform not only students but teachers rind parents as well. Contact the DEP for more information on curriculum materials and other programs.
Printed information - be creative. Design promotional aids such as posters, flyers, brochures, and newsletters to both publicize and educate. One publication should focus on why and how to use the collection day.
Media coverage - there are several ways to take advantage of the services provided by the local newspapers and radio and television stations. Invite reporters to all meetings and events. Submit news releases to the newspapers or call press conferences about your project. Send Public Service Announcements to radio, television and newspapers to remind the public of associated events or the actual date of collection. Radio and television Public Service Announcements can be taped for a more professional approach.
A creative way to help anticipate the level of participation is to place a coupon in the newspaper or in flyers which can be returned to the organizing committee listing the types of wastes people plan to bring.
Workshops - sponsor workshops on the use and disposal of hazardous household products. Invite expert speakers and use audio/visual aids to make your presentation attractive.
Some communities have used floats in local parades, banners, and other unusual publicity techniques to advertise their programs.
FINANCIAL SUPPORT
The budget for your project should be carefully planned. Financial support is needed for a household hazardous waste day in order to pay the licensed firm for the following costs:
-Collecting, sorting, disposing of the wastes
-Travel to and from the collection site
J -1 5
Additional funds may be needed for the costs of printing public education brochures or posters, postage and other miscellaneous expenses.
1. Municipal Budget - Municipal officials involved in your project may be able to identify municipal budget surpluses which can be applied toward a household hazardous waste collection day, such as Conservation Commission funds or income from a recycling program. Otherwise, it will be necessary to secure a special budget appropriation for your project. In either case, a broad-based effort to secure the support of both municipal officials and the general public is essential.
2 Civic Groups - Many civic groups (e.g., Rotary Club, Kiwanis) are interested in supporting projects which are in the public interest or provide community benefits. They may be willing to make a contribution of funds or materials to your project. Arrange to make a presentation to the group and bring a clear, concise, typed proposal to leave with the group for their consideration. These contacts should be made early in your planning process because civic groups often take several months to make funding decisions.
3. Businesses and Industries - Local businesses and industries, particularly those which generate hazardous wastes as a part of their operations, may also be willing to contribute funds or materials to your project as a goodwill gesture. Again, any request for assistance should be accompanied by a clear, written proposal ouUining your project.
4 Grants - Private foundations or public interest groups may have funding assistance available for environmental or public interest projects.
5. User Fees - If only partial funding is available for your project, it may be necessary to charge participants a fee for disposing of their hazardous wastes.
HIRING A LICENSED HAZARDOUS WASTE MANAGEMENT FIRM
A key element in planning your household hazardous waste collection day is selecting and contracting a hazardous waste management firm to provide sufficient personnel, materials and equipment to, at a minimum, identify and catagorize wastes collected, to properly package them, to label and mark the containers, and to transport them to a hazardous waste management facility in compliance with all applicable state and federal laws and regulations regarding hazardous waste management and the transportation of hazardous materials. Some important factors to consider when selecting a hazardous waste management firm are described below.
The DEP requires that a firm be licensed to transport all types of hazardous waste in Connecticut. This does not mean that the firm will be able to accept all types of hazardous waste at your collection day. Unfortunately, disposal methods and/or facilities do not presently exist, or may not be available to all firms you contact for all types of waste that could be collected. It is essential that you request specific information from the firms you contact about the types of waste they can and cannot accept. In addition to wastes for which no disposal methods/facilities presently exist, unknown materials may not be accepted. If a waste cannot be identified it cannot be properly packaged and disposed of. On-site identification by the firm will be, in general, limited to rudimentary field testing and not full-scale laboratory analysis. You should determine what types of field identification will be provided.
Connecticut also requires the hazardous waste firm to obtain a temporary EPA identification number to serve as the designated generator of the wastes collected. The temporary ID number is automatically issued by the DEP to the firm you contract with upon approval of your final plan for the collection day. You will receive a copy of the letter issuing the number.
You should determine how many workers the firm will provide on collection day and what they will be doing. Do they provide personnel to unload the waste from cars? If so, is there an extra charge for this service? You should also find out what types of safety and spill control equipment the firm will provide on-site at your collection day. Will they provide safety equipment to your volunteers, if necessary? Is there a charge for this equipment? Does the firm have an emergency contingency plan?
J -1 6
Hazardous waste management firms often provide a price quote that includes a fixed fee for such expenses as travel for personnel and equipment to and from your collection site and a scale of "per drum" costs for various types of waste. You shold be aware of what is being provided for the fees and prices listed in their proposals.
Determine how the firms package the various types of wastes they collect. This is essential for you to know and understand soyou can effectively evaluate the "per drum" costs each firm will quote you. The two basic packaging methods used are "lab packing" and "consolidation".
In lab packing, containers of compatible wastes brought in by householders are put directly into a larger container or drum and surrounded by an inert absorbent material before the drum is sealed and labelled for shipment. The actual amount of waste that is put in a lab-packed drum varies from firm to firm. It is dictated, in part, by the requirements of the disposal facility that will ultimately receive the waste, and it will always be less than the volume of the container it is packed in. Lab packing is tthe only acceptable method of packaging some types of waste that will be collected. You should determine what types of waste will be lab packed. In what volume containers they will be packed in, and how much waste can be put into a lab-packed drum.
In consolidation the containers of compatible wastes are opened and poured directly into a larger container; when the drum is full or no more of that type of waste Is available for packing, the container is sealed and labelled for shipment. The actual amount of waste that is put into a consolidated drum is or can closely approach the volume of the container into which it is placed. Some drums, however, cannot be filled to the very top of the container because the volatile nature of the product requires room for expansion.
Consolidation may be a more cost effective method of packing some wastes, but it is not acceptable for all wastes collected. You should determine what types of waste will be consolidated and what volume containers will be used for these types of wastes. Finally, consolidating waste requires more stringent controls, both on the part of the collection firm and on the part of the community group organizing the collection to ensure that a high level of safety is maintained.
Should you have any questions about what a particular firm is proposing, we suggest that you contact the firm directly for clarification. You may also contact the DEP with any questions you may have on proposals from hazardous waste management firms.
In summary, hazardous waste disposal costs, both for industry and for communities holding collection days, are relatively expensive and have been increasing. Therefore, it is very important that you fully understand what you are getting for what you spend.
LEGAL AND L I A B I L I T Y I S S U E S
In planning a household hazardous waste collection event, communities should consider several important legal and liability issues, including:
-Service contract with licensed collection company
-State and federal permits
-Generator status
-Liability insurance
-F.mergency preparations
J - 1 7
These issues are discussed in greater detail in the following sections: 1. Service Contract. As required by P. A. 86-298, a service contract must be developed to protect
the town against liability and to ensure safe, quality services. The contract should specify the services, permits and insurance to be provided by the collection company, the cost of all services, and provisions for the assumption of liability. The contract should be reviewed by the town's legal counsel and signed by both the community's representative and the collection company.
2 Permits. Household hazardous wastes are exempt from both the Connecticut Hazardous Waste Regulations and the Federal Resource Conservation and Recovery Act. Household generators of such wastes are not required to comply with the regulations controlling the generation, transport, or disposal of hazardous wastes. However, approval to hold a collection day must be obtained from the Connecticut Department of Environmental Protection. For the community's protection the service contract should clearly hold the collection company liable for complying with all applicable Connecticut and federal laws and regulations.
3. Generator Status. The transfer of wastes directly from residents to the licensed transporter places the responsibility as the generator of hazardous wastes on the collection company as required by P. A. 86-298. The service contract should clearly identify the collection company as the "generator of all hazardous wastes it accepts on collection day." The contract should hold the collection company wholly responsible for complying with all Connecticut and federal hazardous waste regulations regarding the generation, transport, and disposal of hazardous wastes, including all manifest requirements. The manifest is the document which accompanies a load of hazardous waste from the point of generation, through shipment, to the point of disposal.
4 Emergency Preparations. At least one trained employee or agent of the collection company should be on site to identify, accept, containerize, load and remove from the site all wastes collected. The collection company should provide the materials and equipment necessary to handle a spill or release of a hazardous substance into the environment, such as plastic liners for the collection site, absorbant materials, a fire extinguisher, and a copy of the Department of Transportation Emergency Response Handbook. The collection company should be responsible for cleaning up a spill at the site and during transport. As a precautionary measure, the local fire department or HAZMAT team should be either on call or at the site on the day of collection. The town may also wish to have a police officer on site in case of emergency or to direct traffic, if necessary.
5 Municipal Liability. It is important for the municipality to take the above precautions in order to provide protection against liability. Even though state and federal regulations identify the generator/transporter as the liable party in the event of a spill or accident, a lawsuit involving the municipality is a possibility, however unlikely. There have been no accidents or lawsuits against a municipality resulting from a household hazardous waste collection day in the past, and it is highly unlikely that a lawsuit of this type would be brought against a municipality in the future.
PREPARATION OF A FINAL PLAN
When all of the other details discussed in this manual have been finalized, your committee can begin preparation of a final, detailed plan for the collection day.
In general, the final plan should clearly identify the date of your collection, how and where the collection site will be set up; who will be on site during the collection, including a description of everyone's responsibilities, and the contingencies that have been made for safety and emergency response during the collection. After this proposal is approved, it will be the game plan for your collection, and all collection day workers should be familiar with it and know exactly what their responsibilities will be. The final plan should include:
J - 1 8
a The site location and a diagram of the site which shows where vehicles and equipment will be placed, parking areas, traffic flow, emergency and/or evacuation routes, safety barriers, any drains, streams, wells on the site, etc. ' ^
b. All responsible personnel that will be on site, including their names, organization they represent, phone number, and area of responsibility (i.e. safety, traffic control, supervision, registration). Collections must be controlled so that residents do not just drop wastes at the site in a haphazard fashion and take off. Registration table(s) should be adaquately staffed to minimize delays and should be located far enough away from sorting tables to prevent crowding and Jostling of waste. ONLY T H E HAZARDOUS WASTE FIRM'S PERSONNEL OR TRAINED. QUALIFIED VOLUNTEERS SHOULD HANDLE T H E TRANSFER OF WASTE
c. Contingencies for safety and emergency response must be made. For example, will the fire department have personnel and equipment on site or on call; will there be police on site; is there a telephone or other communication equipment available at the site; what advance information has been given to residents on safely transporting waste to the collection; who is responsible for cleaning up any on-site spills.
d. Volunteers can be valuable to a collection effort, but the can increase liability or risk if they are directly involved with handling wastes. Only trained, qualified volunteers should be used for this phase of the project. There is no restriction on volunteers helping with registration or on-site traffic control. The final plan should include, if possible, names of volunteers, how they will be identified on site, what their various roles will be, and who will be supervising them. Volunteers handling waste should list their training.
e. The name and address of the hazardous waste firm providing the collection services and a copy of the signed agreement between the firm and the town must be included in the plan.
Submit the final plan to Paul Franson at the address previously listed in this guide. The DEP may require some additional information or clarification after reviewing the plan. When the plan is determined to be complete, a letter of approval will be sent and the hazardous waste management firm will be issued a temporary EPA Identification number to be used on the collection day.
Approval of the final plan also qualifies a municipality for any grant funds that may be available. The DEP will provide you with the guidelines for grant application.
Although the final plan should guide your actions on the collection day, it is not "carved in stone". The DEP representative who is on site that day will help you modify your plan if necessary. An example final plan is included in the back of this guide.
J -1 9
BIBLIOGRAPHY
Dickman, Claire, Christine Luboff, Lolly Smith-Greathouse. Sleuth - Educational Activities on the Disposal of Household Hazardous Waste. Household Hazardous Waste Disposal Project. Metro Toxicant Program, Seattle: Metropolitan Seattle Water Quality Division for the U.S. Environmental Protection Agency, 1982.
Fritsch, Albert J . , The Household Pollutants Guide. For the Center for Science in the Public Interest, New York, Anchor Press/Doubleday, 1978.
Galvin, David V., Public Opinions and Actions. Report C of the Household Hazardous Waste Disposal Project Metro Toxicant Program, Seattle, Metropolitan Seattie Water Quality Division for the U.S. Environmental Protection Agency, 1982.
Golden Empire Health Planning Center, Household Hazardous Waste Solving the Disposal Dilemma. Sacramento, CA, 1984
Laderman, Rachel, and others, Toward a Comprehensive Program for the Management of Household Hazardous Wastes in Massachusetts The Environmental Institute, University of Massachusetts, Amherst, 1985.
Lawless, Edward W., Thomas L. Ferguson, Alfred F. Meiners Guidelines for the Disposal of Small Quantities of Unused Pesticides. Cincinnati, National Environmental Research Center, Office of Research and Development, U.S. Environmental Protection Agency, 1982.
Mackison, Frank W., R. Scott Stricoff and Lawrence Partridge, ed., NIOSH/OSHA Pocket Guide to Chemical Hazards. Washington, D.C, September, 1978.
Metropolitan Area Planning Council, A Guide to the Safe Use and Disposal of Hazardous Household Products. Boston, Massachusetts,
Ridgley, Susan M., Toxicants in Consumer Products. Household Hazardous Waste Disposal Project Metro Toxicant Program, Seattle, Metropolitan Seattle Water Quality Division for the U.S. Environmental Protection Agency, 1982.
Sierra Club. Training Materials on Toxic Substances: Tools for Effective Action, San Francisco , Sierra Club Information Services, 1981
United States Environmental Protection Agency, A Survey of Household Hazardous Wastes and Related Collection Programs, office of Solid Waste, Washington, DC, 1986.
J -20
EXAMPLE ONLY
FINAL PLAN FOR A HOUSEHOLD HAZARDOUS WASTE COLLECTION
Date of the Collection: Saturday, May 9, 1987 Towns Participating in the Collection: Cleanville and Recycleton Collection Site: Cleanville Public Works Garage, 123 South Street, Cleanville, CT 06000 Hours of the Collection: 9 AM until 3 PM Contractor Haz-Away, Inc., Straight Road, Wampus, NY
Both Wayne Waste (Cleanville's Sanitarian) and Edna Exchange (Recycleton's First Selectwoman) will be at the collection site from 8 AM until the wastes collected are trucked off-site. Wayne can be reached at 555-4321. Edna can be reached at 834-9586. They will be representing their respective towns and will be the lead people in charge of the collection event. Wayne will also screen the types of waste being brought in and determine which, if any, of it can be disposed of in the solid waste dumpster instead of given to the contractor.
Helen Helpful will coordinate all volunteers on-site as per the guidance of Wayne and Edna. Helen is with the Recycleton Garden Club.
Volunteers will be as follows: The Recycleton Men's Club will provide three of its members to post signs directing residents
to the collection site before the collection begins. They will then remain on-site during the collection to direct traffic in the Public Works Garage yard. After the collection, they will remove the signs they posted earlier.
The Cleanville League of Women Voters will provide nine of its members to register residents coming into the collection, collect survey data and pass out information about both Information about both Cleanville's and Recycleton's Paper, Glass, and Waste Oil Recycling Programs. They have worked out a schedule with Helen, so that there will be three League members on-site at any given time for an approximate two hour shift.
The contractor, Waste-Away, Inc., will not be providing personnel to unload the wastes from the residents vehicles. Therefore, we have solicited two volunteers from the Cleanville Chemical Company, who are residents of Cleanville, to unload the vehicles. They are Calla Chemistry and Frank Formula. Both have had extensive experience working with chemicals at Cleanville Chemical Company, and Calla is in charge of that company's Hazardous Waste Program. Both will be on-site during the collection hours and will be provided with safety equipment (respirator, Tyvek suit, rubber gloves, and hardhat with face shield) by the contractor. The Recycleton High School will provide two lab carts for them to use in unloading the vehicles, and the contractor has said they will brief them on how to screen the wastes for unacceptable items before they unload the vehicles and how to segregate them on the sorting tables after they have unloaded them.
The Cleanville Police Department will have a uniformed officer on-site during the collection hours to direct traffic off of and back onto South Street to prevent the possibility of traffic congestion or accidents.
The Recycleton Fire Department and the Cleanville Volunteer Fire Department have been briefed on the collection day plans. The Recycleton Fire Department will have it's HazMat Team on-site with a truck and three men. The Cleanville Fire Department will be on call, and is located approximately 2 miles from the collection site.
J -21
The Winslow Hospital in Recycleton has been briefed on the collection day plans and feels it is prepared to deal with the types of emergencies that could occur at the collection.
The Cleanville Public Works Garage will be open so volunteers and contractor workers can use the sanitary facilities and the lunch room. A hose with running water is available and will be set up to be used as an emergency shower, if necessary. Arrangements have been made to allow the contractor to use the last three bays of the garage in case of inclement weather. There are two storm drains at the Public Works Garage yard that will be covered with sheets of plastic and hay bales by the Public Works staff prior to the collection.
The local MacBurger franchise has offered to provide hot coffee/soda throughout the collection day, and lunch for the volunteers and contractor workers. Helen Helpful's husband will make the pickups.
A local refuse company, Sal's Solid Waste, has donated a 30 cubic yard roll-off dumpster for the collection. He will bring it to the site before 9 AM and place it where the contractor wants. Wayne will call him after the collection is over and the contractor no longer needs it, and Sal's will send someone over to pick up the dumpster. Arrangements have been made to allow this dumpster of solid waste to be taken to the Cleanville Landfill immediately after the Sal's picks it up.
Both the Cleanville and Recycleton High School Chemistry Department's have provided a list of unwanted items to the Collection Committee. It has been decided to include these wastes in the collection. The lists have in turn been submitted to the contractor, who has said they can handle them, and the schools have been scheduled to come to the collection site at 8:30 AM with the wastes on their lists, as per the instructions of the contractor, to avoid delays in accepting wastes from residents.
No hazardous waste will be accepted knowingly from any business or industry that is subject to the Connecticut or Federal Hazardous Waste Regulations for Generators or Small Quantity Generators.
There will be a limit on the size of the container a resident can bring waste in. According to the contractor the maximum container size is five gallons. This along with the ban on regulated waste have been publicized well in advance.
Additionally, the contractor has advised the collection committee of the type of waste they cannot accept. It is herbicides with the active ingredient of 2,4,5-T or Silvex or Esters of Silvex. This has been publicized well in advance, too, and residents have been advised not to bring them to the collection and to keep them stored safely and with the label information intact.
The collection committee has informed the contractor that the collection will be stopped once allocated funds are expended. It is anticipated that the allocated funds will be adequate, however, preparations have been made to inform residents of what to do with their wastes should the funds expire and the collection has to be stopped. These preparations include the distribution of handbills asking residents to safely store their wastes until next Spring's collection day.
Should you have any questions, or require more information, please call either Wayne Waste or Edna Exchange.
Attachments:
Sketch of Collection Site (showing work stations, etc.) Copy of the signed contract (between Waste-Away, Inc. the Towns of Cleanville and Recycleton)
HOUSEHOLD HAZARDOUS WASTE GRANT GUIDELINES
1) The Commissioner of Environmental Protection may make a grant to any municipality, any group of municipalities, any regional planning agency organized under the provisions of Chapter 127 of the General Statutes, any regional council of elected officials organized under the provisions of Chapter 50 of the General Statutes, or any regional council of governments organized under the provisions of Sections 4-1241 to 4-124p, Inclusive, of the General Statutes sponsoring a chemical disposal day. The grant shall be not more than fifty percent of the cost to the grantee of conducting such collection day. (Contractor's cost only).
2) Funds will be allocated on a first-come, first-served basis. The DEP will not deem a grant application to be complete until the grantee has obtained a letter from the Commissioner authorizing the household hazardous waste collection.
3) Letter of authorization will be forwarded after the DEP has reviewed and approved a comprehensive written plan that complies with the collection requirements specified in department guidelines and provided that the grantee has contracted with a licensed hazardous waste transportation firm to service the collection.
4) Any grantee shall be eligible for additional grants, provided no grantee shall be eligible for more than two grants in a fiscal year.
5) Grantees will be reimbursed for expenses after the collection has taken place and final cost figures are available.
6) As the bulk of the funds are expended, it may not be possible to reimburse all grantees at the full fifty (50) percent rate. The grantee will receive as much money as remains in the grant fund at the time that payment is required. The DEP will inform grantees at the time of application if full reimbursement is not possible.
7) The grantee must fill out all forms and provide all documentation required by the Commissioner of the Department of Environmental Protection.
8) Grantees will keep and maintain for the period of three years such records of receipt and disposal of all eligible funds as may be required for an audit.
9) The state shall have the right to audit, at its request, for a period of three years after the completion of the Grantee's performance of this agreement. The grantee shall, at Its own expense, provide for an audit acceptable to the grantor, in accordance with the provisions of Section 7-396a of the Connection General Statutes. Any such audit shall be performed by an authorized State Auditor or by a public accounting firm mutually acceptable to the State and the Grantee.
J - 2 3
Appendix K
Potable Water Quality Criteria
Connecticut Department of Health Services
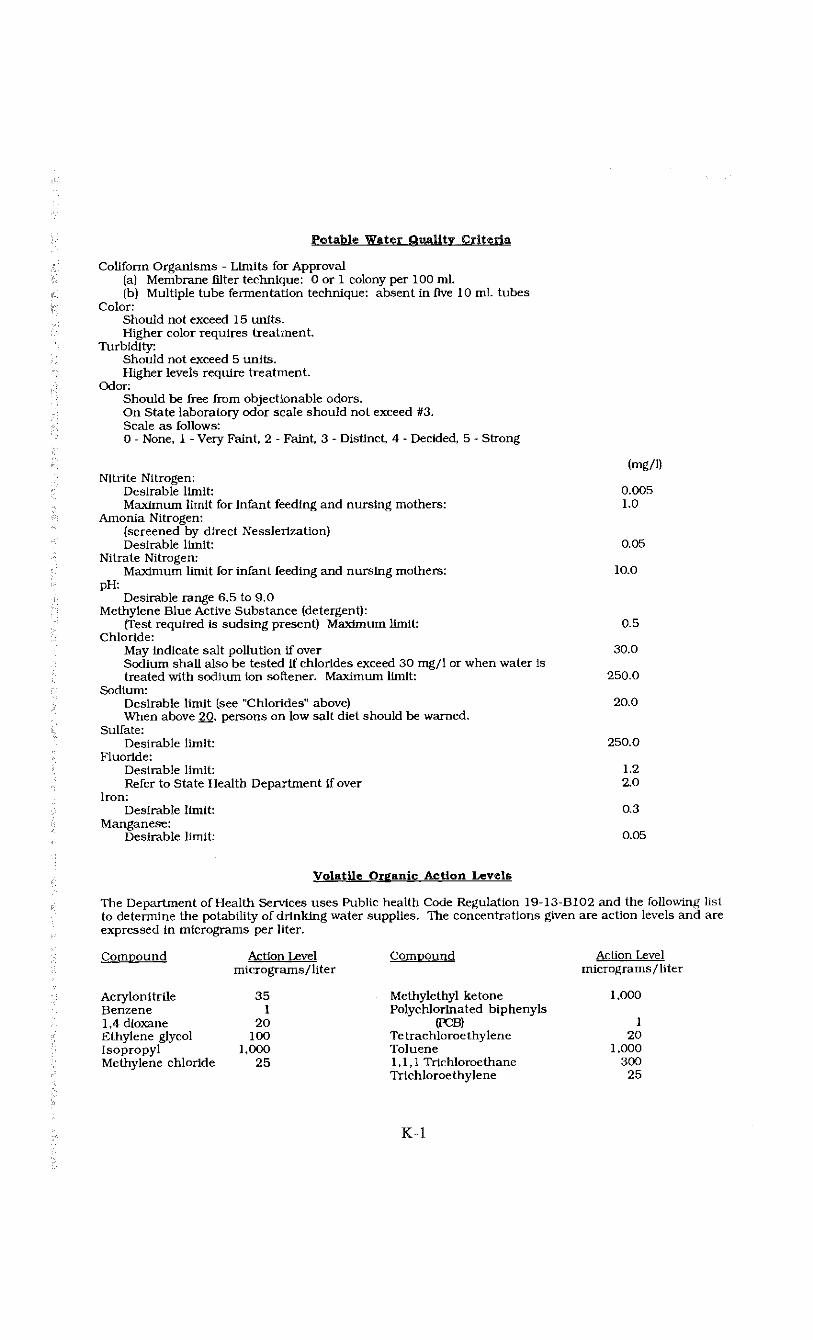
Potable Water Quality Criteria
Coliform Organisms - Limits for Approval (a) Membrane filter technique: 0 or 1 colony per 100 ml. (b) Multiple tube fermentation technique: absent in five 10 ml. tubes
Color: Should not exceed 15 units. Higher color requires treatment.
Turbidity: Should not exceed 5 units. Higher levels require treatment.
Odor: Should be free from objectionable odors. On State laboratory odor scale should not exceed #3. Scale as follows: 0 - None, 1 - Very Faint, 2 - Faint. 3 - Distinct, 4 - Decided, 5 - Strong
(mg/1) Nitrite Nitrogen:
Desirable limit: 0.005 Maximum limit for infant feeding and nursing mothers: 1.0
Amonia Nitrogen: (screened by direct Nesslerization) Desirable limit: 0.05
Nitrate Nitrogen: Maximum limit for infant feeding and nursing mothers: 10.0
pH: Desirable range 6.5 to 9.0
Methylene Blue Active Substance (detergent): (Test required is sudsing present) Maximum limit: 0.5
Chloride: May indicate salt pollution if over 30.0 Sodium shall also be tested if chlorides exceed 30 mg/1 or when water is treated with sodium ion softener. Maximum limit: 250.0
Sodium: Desirable limit (see "Chlorides" above) 20.0 When above 20, persons on low salt diet should be warned.
Sulfate: Desirable limit: 250.0
Fluoride: Desirable limit: 1.2 Refer to State Health Department if over 2.0
Iron: Desirable limit: 0.3
Manganese: Desirable limit: 0.05
Volatile Organic Action Levels
The Department of Health Services uses Public health Code Regulation 19-13-B102 and the following list to determine the potability of drinking water supplies. The concentrations given are action levels and are expressed in micrograms per liter.
Compound Action Level micrograms/liter
Acrylonitrile 35 Benzene 1 1,4 dioxane 20 Ethylene glycol 100 Isopropyl 1,000 Methylene chloride 25
Compound
Methylethyl ketone Polychlorinated biphenyls
(PCB) Tetrachloroe thylene Toluene 1,1,1 Trichloroethane Trichloroethylene
Action Level micrograms/liter
1,000
1 20
1,000 300 25
K-1
i
1
Appendix L
i
i
National Fire Protection Association:
NFPA 329 Tank Testing Firms
Connecticut Department Of Environmental Protection
Underground Storage Tank Program *
i
I
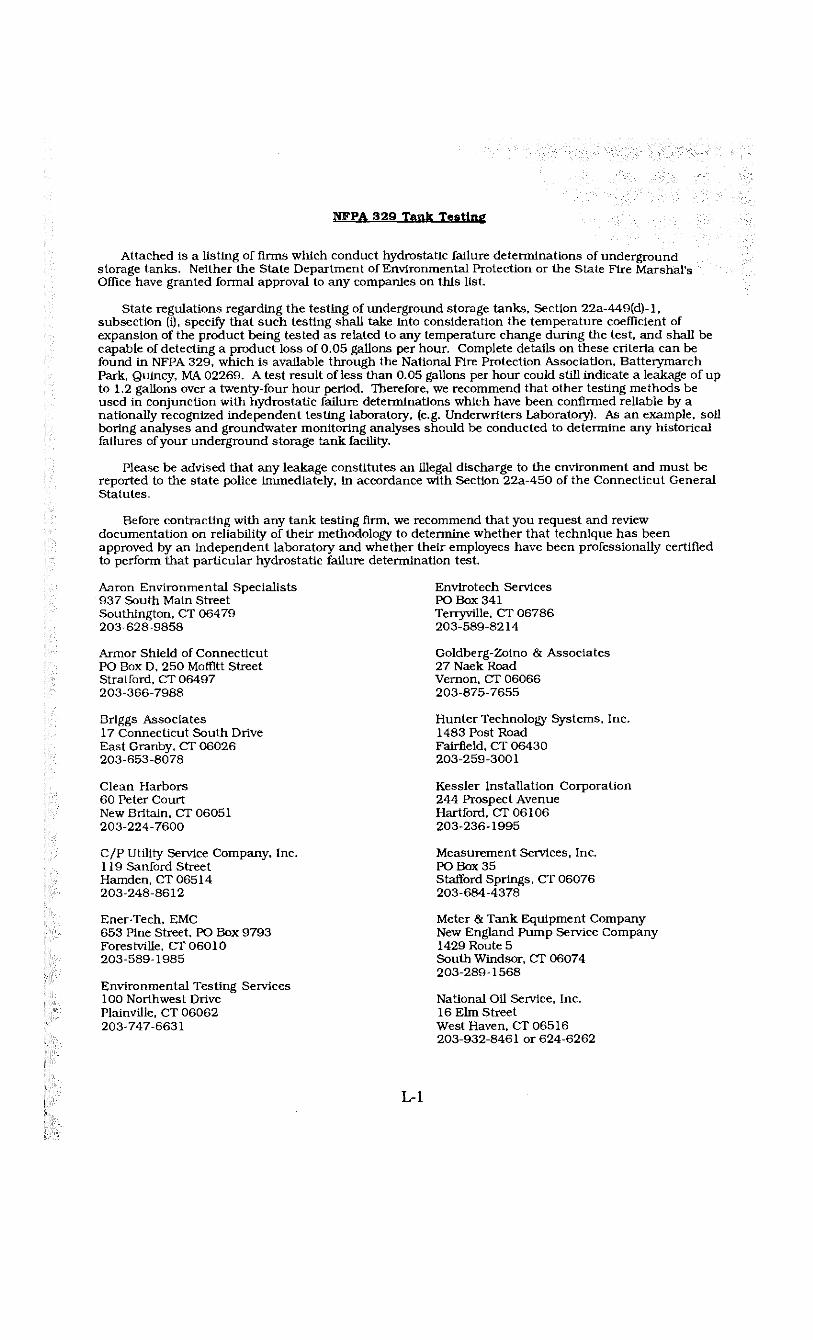
NFPA 329 Tank Testing
Attached is a listing of firms which conduct hydrostatic failure determinations of underground storage tanks. Neither the State Department of Environmental Protection or the State Fire Marshal's Office have granted formal approval to any companies on this list.
State regulations regarding the testing of underground storage tanks, Section 22a-449(d)-l, subsection (i), specify that such testing shall take into consideration the temperature coefficient of expansion of the product being tested as related to any temperature change during the test, and shall be capable of detecting a product loss of 0.05 gallons per hour. Complete details on these criteria can be found in NFPA 329, which is available through the National Fire Protection Association, Batterymarch Park, Quincy, MA 02269. A test result of less than 0.05 gallons per hour could still indicate a leakage of up to 1.2 gallons over a twenty-four hour period. Therefore, we recommend that other testing methods be used in conjunction with hydrostatic failure determinations which have been confirmed reliable by a nationally recognized independent testing laboratory, (e.g. Underwriters Laboratory). As an example, soil boring analyses and groundwater monitoring analyses should be conducted to determine any historical failures of your underground storage tank facility.
Please be advised that any leakage constitutes an illegal discharge to the environment and must be reported to the state police immediately, in accordance with Section 22a-450 of the Connecticut General Statutes.
Before contracting with any tank testing firm, we recommend that you request and review documentation on reliability of their methodology to determine whether that technique has been approved by an independent laboratory and whether their employees have been professionally certified to perform that particular hydrostatic failure determination test.
Aaron Environmental Specialists 937 South Main Street Southington, CT 06479 203-628-9858
Envirotech Services PO Box 341 Terryville, CT 06786 203-589-8214
Armor Shield of Connecticut PO Box D, 250 Moffitt Street Stratford, CT 06497 203-366-7988
Goldberg-Zoino & Associates 27 Naek Road Vernon, CT 06066 203-875-7655
Briggs Associates 17 Connecticut South Drive East Granby, CT 06026 203-653-8078
Hunter Technology Systems, Inc. 1483 Post Road Fairfield, CT 06430 203-259-3001
Clean Harbors 60 Peter Court New Britain, CT 06051 203-224-7600
Kessler Installation Corporation 244 Prospect Avenue Hartford, CT 06106 203-236-1995
C/P Utility Service Company, Inc. 119 Sanford Street Hamden, CT 06514 203-248-8612
Measurement Services, Inc. POBox35 Stafford Springs, CT 06076 203-684-4378
Ener-Tech, EMC 653 Pine Street, PO Box 9793 Forestville, CT 06010 203-589-1985
Environmental Testing Services 100 Northwest Drive Plainville, CT 06062 203-747-6631
Meter & Tank Equipment Company New England Pump Service Company 1429 Route 5 South Windsor, CT 06074 203-289-1568
National Oil Service, Inc. 16 Elm Street West Haven, CT 06516 203-932-8461 or 624-6262
1 1
Northeast Tank Services PO Box 316, 71 Chestnut Drive Derby, CT 06418 203-878-8378
William Pasqualini & Sons 245 Massapeag Side Road Uncasville, CT 06382 203-848-8655
Ram Ent./Precision Testing 100 Cedar Lane Torrington, CT 06790 203-496-8960
Tri-S, Inc. 25 Pinney Street Ellington, CT 06029 203-875-2110
Petronics, Inc. 2019 John Fitch Boulevard South Windsor, CT 06074 203-528-0366
Massachusetts Con-Test PO Box 591 East Longmeadow, MA 01028 413-525-1198
Groundwater Technology, Inc. 220 Norwood Park South Norwood, MA 02062 617-769-7600
Earth Science Technology 241 King Street Northampton, MA 01060 1-800-826-5006
Industrial Systems, Inc. 1264 Union Street West Springfield, MA 01089 413-734-8480
Environmental Applications, Inc. 69 Hickory Drive Waltham, MA 02154 617-890-3922
Leak Detection Systems, 152 King Street Cohasset, MA 02025 617-383-2305
Inc.
Environmental Products & Services, PO Box 51009 Springfield , MA 01151 413-543-8700
Inc. P.M. Environmental, Inc. PO Box 392 Manchester, MA 01944 1-800-628-2799
Zecco, Inc. d/b/a Northboro Waste Rem. 345 West Main Street Northboro, MA 01532 617-393-2537
New Hampshire American Tank Testing, Inc. 191 Critchett Road Candia, NH 03034 603-483-2000
New Jersey Herbert Lutz Tank Lining 2020 Clinton Street PO Box 605 Linden, NJ 07036 201-862-6633
PCA Engineering 177 Royal Avenue PO Box 227 Hawthorne, NJ 07507 201-427-8540
Tank & Line Compliance PO Drawer 919 Lafayette, NJ 07848 201-383-0800
L-2