Embed Size (px)
Citation preview
Tailoring print materials to match literacy levels - a challengefor document designers and practitioners in adult literacy
Adelia Carstens, School for Languages, University of Pretoria,
Pretoria 0002.
Abstract
One in three South Africans aged 20 and older have not completed
primary school, or have no schooling at all. Communication
specialists who are in the business of writing public information
documents need to take cognizance of this fact if they are
committed to producing documents that meet the needs and skills
levels of their different audiences. They also need a basic
understanding of the reading strategies of both highly skilled and
less skilled readers, an awareness of the differences in processing
and acceptance of visuals by skilled and unskilled viewers, and the
ability to translate the relevant user variables into textual
variables. This article is aimed at giving an overview of the most
important theories that describe and/or explain how low-literate
audiences process and react to printed information, and to match
these theories with research-based principles and best practices
for designing reader-centred public information documents. The
outcome of the article is a comprehensive set of design heuristics
for low-literacy public information materials, based on relevant
information-processing features that have been derived from the
literature on reading comprehension and visual literacy.
1. Introduction
Adult literacy skills are essential for the economic success and
social advancement of both individuals and societies (InternationalFinal version
1
Adult Literacy Survey 2004). Today's knowledge economy demands
understanding and use of information from various types of texts in
different media. A major challenge for communication specialists
is to design materials that will facilitate this process. However,
due to time and budget constraints these practitioners often rely
on gut-feelings and general style sheets for plain language
writing, which may result in the production of materials that do
not fit the needs and the skills of the intended audiences.
The main objective of this contribution is to give an overview of
the most important theories that describe how low-literate
audiences process and react to printed information, and to match
these theories with research-based principles and best practices
for designing low-literacy materials. On the basis of the evidence
from process and practice a comprehensive set of design heuristics
for low-literacy public information materials is compiled to assist
document designers and practitioners in adult literacy.
2. The literacy situation in South Africa
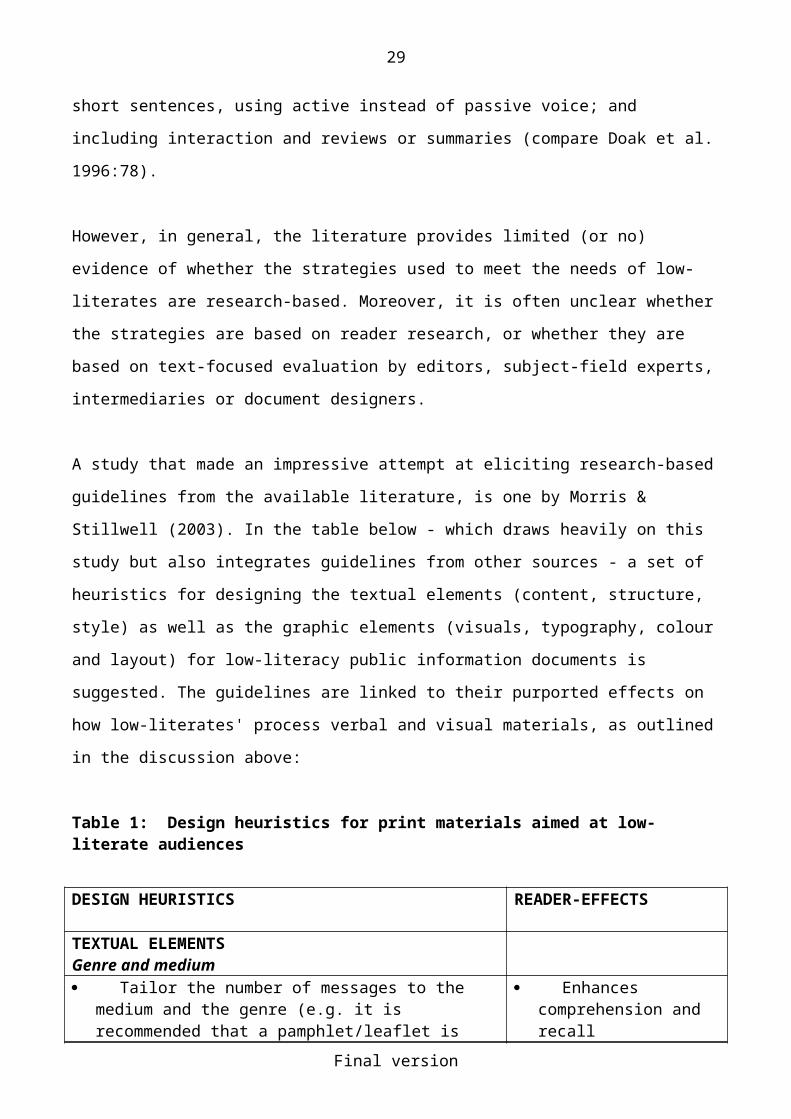
According to the 2001 census, 17,9% of the South African population
received no formal schooling, and 16% received some primary
schooling, but did not complete primary school (see graph below).
Final version
2
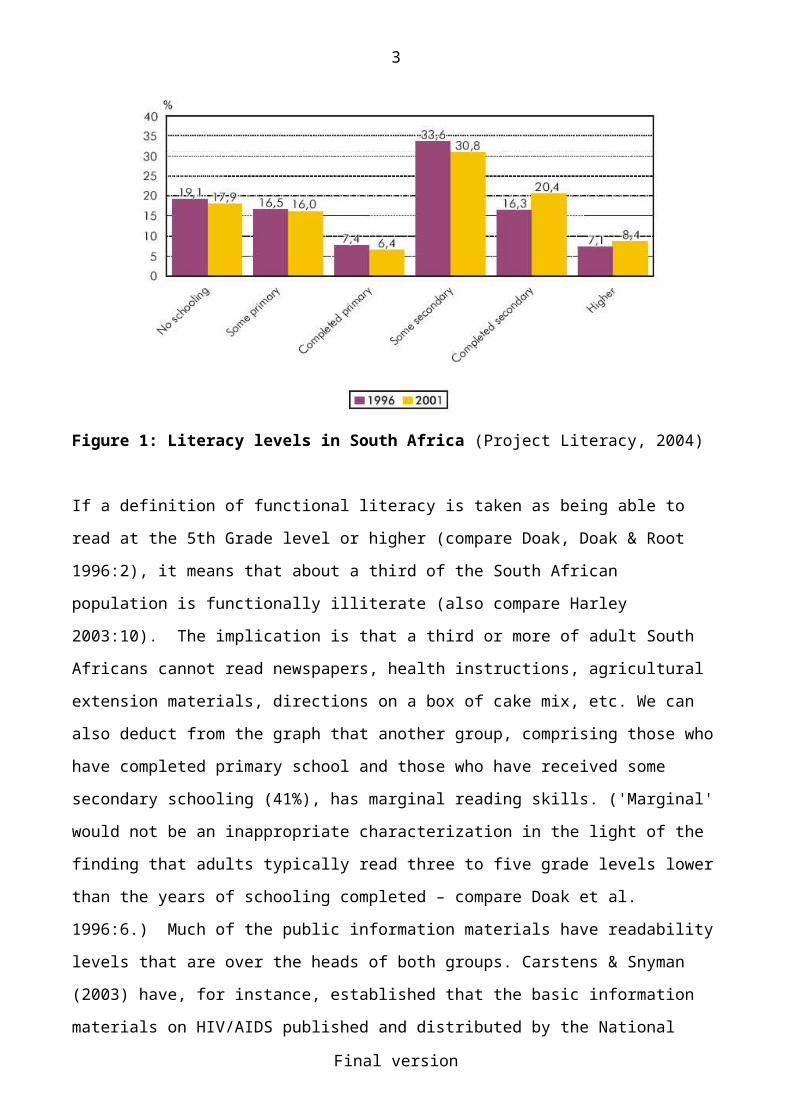
Figure 1: Literacy levels in South Africa (Project Literacy, 2004)
If a definition of functional literacy is taken as being able to
read at the 5th Grade level or higher (compare Doak, Doak & Root
1996:2), it means that about a third of the South African
population is functionally illiterate (also compare Harley
2003:10). The implication is that a third or more of adult South
Africans cannot read newspapers, health instructions, agricultural
extension materials, directions on a box of cake mix, etc. We can
also deduct from the graph that another group, comprising those who
have completed primary school and those who have received some
secondary schooling (41%), has marginal reading skills. ('Marginal'
would not be an inappropriate characterization in the light of the
finding that adults typically read three to five grade levels lower
than the years of schooling completed – compare Doak et al.
1996:6.) Much of the public information materials have readability
levels that are over the heads of both groups. Carstens & Snyman
(2003) have, for instance, established that the basic information
materials on HIV/AIDS published and distributed by the National
Final version
3
Department of Health has a readability level of just below 60
(equivalent to Grade 9).
These figures may lead one to conclude that print (including
formats such as pamphlets, package inserts, posters and flip
charts, newsletters, fact sheets, booklets, training manuals) is
not an appropriate medium to use for instructional materials in
South Africa. The print media have also derived a 'bad name' from
their links to theories and models that involve mainly a one-way
flow of knowledge from the information producers (research
scientists) to the clients or recipients.
However, the literature on communicating with low-literate people
(particularly in the fields of health promotion and agricultural
extension), has pointed out several advantages of print materials
(Morris & Stilwell 2003:72; PATH 2002:5; Zimmerman & Perkin 1982),
which can be subsumed under three headings:
Production and delivery: inexpensive production and distribution,
easy storage, repeated use, transfer to others, tailored to
specific geographical, linguistic and cultural needs;
Information transfer: awareness creation, instruction, persuasion
(behaviour change), reinforcement, accurate and uniform
transmission of factual and technical information;
Literacy promotion: enhancement of visual and verbal reading
skills.
3. Theories and models of how low-literate people process
information
Final version
4
The following two sections give an overview of the various stages
of verbal and visual processing, emphasizing the differences
between skilled and unskilled readers and viewers.
3.1 Processing verbal information
According to McKeon (2003) there are many models that attempt to
explain the complex process of reading. However, in order to
understand the multitude of difficulties that might face a low-
literate person, she summarizes the reading process in five steps:
stimulus (perception), decoding, encoding, output and feedback. Each step
occurs automatically for the fluent reader, yet the low-literate
might encounter stumbling blocks in one or more of the steps.
The main differences between the processing skills and strategies
of experienced and inexperienced readers are summarized below under
the headings McKeon proposes. However, the fourth step, output, has
been omitted as it is assumed that 'oral or silent reading' refers
to the entire process, and not to a single step only. Recall will be
discussed as a last step, since remembering information is a
crucial element of reading, especially if it entails learning and
applying information in new situations.
(i) Stimulus (perception)
According to McKeon (2003) the stimulus or input phase involves
acuity (the ability to actually see the page) as well as the
ability to discriminate between letters, words, numbers, pictures,
or whatever is on the page. To the processes that characterize
this phase Field (2003:18) adds matching the whole to a
Final version
5
representation stored in long-term memory, and allocating an
identity or category to the sensation.
Perception involves periods of fixation, when the eye rests upon a
point in the text, and saccades (a series of rapid eye movements
along the line of printing or viewing). At the end of a printed
line, the reader makes a return sweep to the following line (Field
2003:73). Low-literate readers will make more and longer fixations
than skilled readers when decoding written text. Less skilled
reading also has a much higher level of regression (reverting to
one or more former fixations). According to Field (2003:75)
regression in the average reader only adds about 10 percent to the
fixations; in an unskilled reader, it accounts for much more. Poor
readers will also take longer in the matching and categorization
stages (Pretorius 2002:30).
(ii) Decoding
Decoding is the word recognition stage, and many low-literates
severely lack strategies for recognizing words (McKeon 2003). Often
they have sight words which they have memorized to 'get by', but
they are not skilled in other ways to identify words which they
have never seen. In health-related materials low-literate readers
will know key words such as 'exit', 'x-ray', etc. from sight or
memory. They often attempt to sound out the words they do not know,
but since the orthography may differ widely from the phonetics in
certain languages, this may not work.
Wagner & Torgesen (1987, quoted by De Jong & Van der Leij 1998:50),
found phonological abilities to be a major determinant of the
Final version
6
development of word decoding. Lack of vocabulary knowledge is
therefore not the most important explanation for decoding problems,
although it does play an important role in reading comprehension.
It is to be expected that poor decoding skills will influence
reading speed. Low-literate readers decode one word at a time (Doak
et al. 1996:4-5). If word recognition occurs slowly and with
difficulty, it causes a bottleneck in the reading process. The
reader then does not have many resources left for higher level
processing. This results in poor comprehension, since a word-by-
word reading strategy causes readers to forget what they have read
in the first part of a sentence before getting to the end of it.
Because their energy is being used up in word-by-word processing,
they do not look for informational coherence and consistency in a
text, and often fail to detect and repair semantic inconsistencies
(compare Doak et al. 1996:4; as well as Garner 1980 and Paris &
Myers, 1981, in Pretorius 2002:41).
To compensate for a lack of decoding skills, low-literates often
depend on the context of the situation to provide cues, for
example, a patient may look at the word apple on a nutritional
brochure and presume to know the word because of an accompanying
picture.
(iii) Encoding
Encoding entails comprehending the information. One of the most
important differences between skilled and less skilled readers is
the ability to identify main ideas and to recognize the gist of a
text. The researchers Yuill & Oakhill (1991, in Pretorius 2002:35),
Final version
7
found that good comprehenders identified the main point in a text
79% of the time, whereas the poor comprehenders were only
successful 46% of the time. These findings were corroborated by
Carstens & Snyman (2003) in their pilot research on how well the
Departement of Health's leaflet on HIV/AIDS Counseling (Khomanani
Campaign) was understood by low-literate clinic patients. Among the
27 respondents only 15 could give an approximation of the main
point of the particular leaflet, namely 'guidance for people who
[intend to] go for an HIV test'. Ten of the other 17 simply
answered that the leaflet was 'about AIDS', one identified condom
use as the main point, and one answered 'abstinence from sex'
(Carstens & Snyman 2003:126). One of the reasons why low-literates
may fail to grasp the main message is because of the discrepancy
between their prior knowledge and experience, and the prior
knowledge that the author of the document had presupposed (McKeon
2003).
Other differences are that less skilled readers fail to make
inferences from the context, perceive relationships between parts
of the texts (Doak et al. 1996:4), and apply relevant information
to new situations (use analogy as an inference strategy). They
may, for instance, not realize that an anecdote in a health
brochure has personal relevance.
Low-literate readers often also lack basic cognitive skills, such
as the ability to categorize concepts hierarchically. Doak et al.
(1996:3-4) quote the example of a poor reader who reads in a health
brochure that a person on dialysis is not supposed to eat shellfish
and poultry, without realizing that the fried chicken he eats
Final version
8
regularly falls under the superordinate category 'poultry'. For
foreign language readers of English the problem of relating
hyponyms to superordinates may be compounded by lexical or
referential gaps in the primary language (compare Field 2003:14).
The National Cancer Institute (NCI 1994) emphasizes the tendency
among low-literate readers to think in immediate rather than
futuristic terms, and literal/concrete interpretation of
information. They cite McKeever et al.'s (1956) example of a
situation where a leaflet on treating diarrhea in babies stated
that the mother must 'push fluids'. The mother literally pushed
fluids by tipping the baby's bottle upside-down and forcing the
fluid even when the baby's responses had begun to slow down. The
baby suffocated.
According to Yuill & Oakhill (2003:196) less-skilled readers often
have difficulty with the successful resolution of referents in a
text, leading to ineffective comprehension. This may be
attributable to the fact that unskilled readers fail to build an
integrated representation of text as they read, and may be unable
to retrieve the referent from the preceding text. Therefore they
may fail to link anaphora (e.g. pronouns) to their antecedents
(e.g. proper names, commmon nouns, noun phrases or larger discourse
structures).
According to Coleman, Coon, Mohrmann, Hardin, Stewart, Gibson,
Cantrell, Lord, & Heard (2003:67) research shows that, even with
easy-to-read-material, people with low literacy skills learn less,
partly because they do not expect to learn much from printed
Final version
9
materials. If materials do not address information they believe to
be beneficial or relevant, they will not be motivated to read it.
(iv) Feedback
Feedback entails thinking about information and knowing when one
understands and when one does not understand. McKeon (2003) regards
this stage as crucial. For the low-literate reader knowledge of
one's own understanding may not be evident. This is one reason why
low-literates' self-reports on reading comprehension are not
reliable.
Low-literate readers have been found to struggle when asked to
pinpoint where exactly they have difficulties understanding a text.
They also have difficulty in backtracking, checking on difficult
sections, using fix-up strategies, and recognizing inconsistencies
in a text (Pretorius 2002:41).
Final version
10
(v) Memory
It is a well-researched fact that weak readers do not have good
recall of what they have read, and may often recall inconsequential
details rather than main points. One of the reasons provided by
reading research scholars (Pretorius 2002:37) is that weak readers'
ability to remember information is linked to their ability to
perceive text structure. Weak readers typically have problems
recognizing the organization of a text. Poor recall of a text may
also be an indication of poor comprehension, since it is easier to
remember things that one understands.
3.2 Processing visual information
The superiority of pictures to verbal text in terms of attracting
attention, increasing the speed of message transfer, stimulating
motivation, and enhancing recall, have been emphasized by
educationists and visual literacy experts (Mayer 1999; Mayer &
Gallini 1990; Mayer & Sims 1994; Paivio, 1986; Sinatra 1986;
Wileman 1993), as well as by experts on low-literacy materials
(Doak et al. 1996:91; 94).
However, opinions are widely divergent on exactly how unskilled
viewers differ from skilled viewers in their interpretation of
pictures. Scholars working in the field of visual studies and
information design argue that there is little difference between
the processing of visuals by experienced and inexperienced
'readers'. This view is often referred to as the 'universality
hypothesis'. On the other hand, researchers in development contexts
have pointed out significant differences between processing by
skilled and unskilled viewers.
Final version
11
According to Messaris (1994:10), in the literature on this issue
there are three broad categories of pictorial conventions that
might pose interpretational obstacles to a first-time or
inexperienced viewer, namely the unrealistic reproduction of
colours and degrees of illumination of the real world (e.g. by
unshaded outline drawings, black-and-white photographs); the
failure to represent the third dimension on a flat, two-dimensional
surface; and the omission of details in the shapes of persons and
other objects (e.g. sketches, stick figures). However, the growing
body of systematic research on the interpretational abilities of
pictorially inexperienced viewers has revealed that only one of the
three categories listed above causes any appreciable degree of
trouble to inexperienced viewers (Messaris 1994:10), namely the
rendition of three dimensions by two-dimensional means. In other
words, previous experience is not a prerequisite for the
interpretation of outline drawings, black-and-white photographs,
sketches, or stick figures – to name only four kinds of pictures.
Messaris (1994:11-13) then explains the general process of how the
brain 'translates' the retinal image into a mental representation
of identifiable objects in three-dimensional space:
1. Visual information is transmitted from the retina to the brain via a two-
dimensional array of light and colour values, to detect the
outlines of objects and the edges of surfaces. This results in
a mental representation that can be thought of as
corresponding to an outline drawing.
2. Assigning depth to the various parts of the outline by calculating distances
between the viewer and each part of the scene.
Final version
12
3. Identification of the object by means of the outlines, and matching them
against a 'dictionary of object structures' in the brain's
memory (Messaris 1994:13).
For Messaris (1994:13) these principles suggest that our ability to
perceive and comprehend such incomplete images as sketches and
stick figures may be an extension of an everyday, real-life
perceptual skill rather than something we have to learn with
specific reference to pictorial conventions. Therefore, sketches
and other incomplete images should not greatly curtail the ability
of inexperienced viewers to identify objects in pictures, and many
pictorial conventions that might at first glance seem unrealistic,
appear to be interpretable on the basis of any viewer's real-world
visual skills. Messaris argues that even in the case of depth
perception it would be hard to argue that the informational cues
typically used by more experienced viewers constitute an arbitrary,
exclusively pictorial set of conventions.
Development Communication practitioners and researchers paint a
different picture of the relationship between visual literacy and
picture processing. Unfortunately the literature on pictorial
processing by low-literates is somewhat dated, as demonstrated by
the resource lists of recent publications on pictorial
communication in developing countries, such as Hoffmann 2000. This
evidence seems to point to a general lack of recently undertaken
research on pictorial processing and visual literacy in development
contexts. Moreover, "almost all studies lack a purposeful
theoretical orientation" (Hoffmann 2000:136).
Final version
13
The differences in visual processing by skilled and unskilled
viewers that are mentioned in the available literature will be
outlined and exemplified below in terms of attention/perception,
decoding, and comprehension factors.
(i) Attention/perception
According to Doak et al. (1996:93) skilled readers systematically
scan a visual to find the central meaning/concept, quickly identify
principal features, are able to separate key points from details,
and quickly interpret the selected information to arrive at a
meaning. In contrast, low-literates' eyes wander about the page
without finding the central focus, skip over principal features,
and often focus on a particular detail. As a result they are slow
to interpret perceptual information. This claim resonates with the
positive correlation other researchers have found between the
number of eye fixations and visual literacy (Pettersson 1989:68).
Ausburn & Ausburn (1983:113), who investigated the difference
between the pictorial analysis skills of students in developing
countries (Papua New Guinea) and students in developed countries,
found that Papua New Guinea students were not as skilled in
visualization, spatial scanning speed, detail/background
separation, visual detail analysis and comparison, and ignoring of
visual distraction as age peers in technologically developed
countries. In another study (on which they report in the same
article) they found that students with no schooling had more
difficulty in finding a 'starting place' in analyzing complex
figures than those who had some schooling.
Final version
14
(ii) Decoding (object identification)
An aspect of visual literacy that is generally ignored by visual
studies experts is the importance of a vocabulary of symbols (or
visual conventions) in order to interpret many drawings used in
mass media printed documents. The visually literate understand the
difference between a cartoon speech balloon and a thought balloon;
and for them sequential frames indicate the passing of time or
people acting and reacting to each other. Additionally, there is an
artistic tradition in Western illustration which uses highlights to
show reflections on shiny surfaces. Thus an eye will be drawn with
a small white mark in it which is completely understood by those
for whom the convention is familiar. The reaction to such a mark in
much of the illiterate world is that the eye is damaged (blind and
covered with a grey cataract). (Bradley 1995:74; PATH 2002:2;
Hoffmann 2000:141). Visually inexperienced 'lookers' will easily
interpret a dotted line from a woman's eyes to an apple on a table
as 'a woman seeing an apple', while the low-literate individual
might see a stick coming from the apple that pokes a woman in the
eye (PATH 2002:2).
According to PATH (2002:2) symbols often have different meanings in
different cultures. In the 1976 study in Nepal (Linney 1995:24),
respondents proved to have difficulty in understanding symbols like
crosses, ticks and arrows.
Final version
15
(iii) Comprehension
PATH (2002:2) emphasizes that low-skilled viewers have problems
with comprehending the pictorial conventions that indicate depth
perspective. Research conducted during the 1960's by Holmes in
Kenya (Linney 1995:23) and Hudson in South Africa (referred to by
Bradley 1995) support this claim. Hudson's respondents were, for
instance, unable to interpret the size of an object as an
indication of its distance from the artist/reference point.
Bradley's (1995:74) conclusion on the basis of evidence such as
this is that there are both graphic and environmental conventions
that need to be learnt before 'realistic' pictures can be
understood without someone to explain them. A possible reason why
some Inexperienced viewers seem to have more difficulty in
interpreting depth perspective than others, is familiarity with
content through cultural, environmental and societal experience
(Zimmer & Zimmer 1978:37). Segall, Campbell & Herskovits (1963)
found that people who lived on plains where there was a large
horizon, and great distances could be viewed, understood
perspective conventions because they were used to seeing figures
getting smaller as they went away. Conversely, people who lived in
forests or in high-rise cities were limited in their visual
understanding of graphic conventions that are used to represent
distance.
Final version
16
Picture 'syntax' is another stumbling block for low-literates.
Linney (1995:24) points out that visually unskilled persons have
difficulty understanding sequences of pictures. They do not
necessarily look at a series of pictures from left to right, or
assume that there is any connection between the pictures in a
series (also compare Hoffmann 2000:142).
Art style has also been mentioned as a factor that may influence
visual comprehension (PATH 2002:2). A comprehensive study conducted
in Nepal in the mid 1970's showed that from the six styles that
were used detailed, shaded line drawings were understood best
(72%), followed by photographs with background blocked out (67%),
simple, unshaded line drawings (62%), silhouettes (61%),
photographs without the background blocked out (59%), and lastly
stylized drawings (49%). The research undertaken by Cook in Papua
New Guinea during the 1980's (Linney 1995:26) corroborated these
findings and also showed that the detailed, shaded line drawing was
the most understandable art-style. Fuglesang (1970), however, found
that photographs in which the background had been blocked out,
leaving only the main pictorial elements, were the easiest to
understand.
Bradley (1995:11) emphasises the role of culture in visual
comprehension:
Although some pictures and diagrams are universally
understood, there are many that are only understood within
their own culture and others that seek to impose a cultural
form on others.
and
Final version
17
The assumption of universality should be examined carefully
however, particularly when diagrams are being used.
She claims (1995:11) that pie charts are not universally
understood, especially in countries where pies are not part of the
cuisine. Although similar circular forms can be found in the
cooking of most countries, for example chapattis in India, they are
not sliced into portions for distribution but torn by an individual
to accompany less solid food.
Exactly which aspects of picture processing are influenced by
cultural acceptability, cultural convention and cultural taboo have
not yet been researched conclusively. It is, for instance, unclear
whether the emotional reaction of a reader who has been offended by
pictures (e.g. a picture indicating meat as a dietary component,
when meat-eating is not part of the viewer's culture) will lead to
a loss of attention, a loss of motivation or inadequate
comprehension (McKeon 2003).
Understanding new information by linking it to culturally-based
conceptual models has been demonstrated by the research of Cornwall
(1992) in Zimbabwe. Cornwall researched the ineffectiveness of
standard pictures and diagrams of reproductive anatomy as shown in
family planning clinics all over the world. The ineffectiveness
seemed to stem from the fact that these visuals instantiated the
Western medical model of reproductive anatomy and the way that the
female reproductive system works. More success was achieved when
illustrations were used that reflected ordinary people's knowledge
of the body, and that were derived from body maps or diagrams drawn
Final version
18
by local women on paper or on the ground. These drawings reflected
knowledge from a more practical experience of the physical workings
of the body, the dissection of animals, experience of pregnancies,
and advice from peers and older women.
4. Evaluating the appropriateness of materials
Materials assessment studies document that many education materials
are not easily accessible to the average adult. The literature
shows evidence of continued efforts to assess such materials and
ensure that the level of literacy required for comprehension is
appropriate (Daiker 1992; Doak & Doak 1987; Meade & Byrd 1989).
Rudd, Moeykens & Colton (1999) mention numerous examples of health
materials that had been tested, and which scored between Grade 9
and 12 reading levels – i.e. at least four levels above the
literacy levels of low-literate readers.
The most commonly used tool for measuring the readability of verbal
materials is the readability index. The main function of
readability indexes is to give a quick assessment of writing
density. More than thirty different formulas for calculating
readability have been developed since the 1940's (Morris & Stilwell
2003:76), of which the most popular ones are the Fog Index, the
Flesch Reading Ease Score, the Flesch-Kincaid Grade Level Score,
the Smog Index, the Dale-Chall Readability Index and the Spache
Readability Index. Some are simple hand-calculated indexes (SMOG
and Fry), whereas others are calculated by dedicated readability
software (RightWriter, Sensible Grammar, Liptak) or word processor
software packages (Flesch Reading Ease and Flesch-Kincaid formulas
in MsWord and WordPerfect). However, the use of readability indexes
Final version
19
has been widely criticized. Meade and Smith (1991, in Morris &
Stilwell 2003:77), warn that the power and precision of readability
indexes may "give a false sense of the validity of the process of
assigning grade level equivalencies to text … [and] cause one to
overlook the other important factors associated with being able to
read". These authors also point out that the usefulness of
readability measures for predicting the reading ability of neo-
literates is still largely unknown, especially those reading in a
second or third language.
In an attempt to confront the inadequacies of readability formulas
(i.e. the narrow focus on the complexity of words and sentences)
Doak et al. (1996) developed a suitability assessment of materials
instrument (SAM), which takes content, literacy demand, graphics,
layout, typography, learning stimulation (motivation) and cultural
appropriateness into consideration. SAM also has the advantage that
it produces both quantitative and qualitative data: a suitability
score can be calculated, and rich explanatory data is generated
from the comments. Although the authors (Doak et al. 1996:49)
concede that 'there is a continuing need for more comprehensive
evaluation instruments' they still regard SAM as 'a logical step
toward meeting that need'. In the end human judgment and common
sense, rather than mechanized analysis, are important when writing
and assessing information materials (Meade & Smith 1991).
Measuring the suitability of visual materials is even more
difficult, and not many measures of picture suitability have been
attempted. As far as can be ascertained, none have been specially
designed to measure suitability for visually unskilled viewers.
Final version
20
Pettersson (1989) discusses six types of pretests for measuring
picture quality in general, namely observation (attention) ratings,
utility/originality matrixes, ratings of communicative impact (existing vs. new
information); interest scales (interesting vs. boring), legibility/readability
matrixes, and picture readability indexes. Only the last two may be relevant
in measuring the appropriateness of visuals for unskilled viewers.
The so-called 'picture readability index' will be discussed
briefly.
The picture readability index was devised by Pettersson (1984,
referred to in Pettersson 1989) on the basis of his understanding
of the way a picture is executed with respect to different
variables in the visual language. The actual purpose is to
determine to what extent the rating of a picture by experts
(designers), coincides with the reception by actual viewers. He
named this instrument the BLIX-index. A picture's readability can
be assessed by calculating its BLIX-value. The greater the
readability of a picture, the greater its functional, communicative
impact.
Unlike the readability indexes devised for verbal text, the BLIX
index does not merely deal with issues of formal complexity, but
caters for a whole range of variables at three important levels,
namely legibility, reading value and aesthetic value. BLIX values
initially ranged from 0 (i.e. a virtually incomprehensible picture)
to 5 (i.e. a very comprehensible picture). The BLIX value of a
picture was initially calculated on the basis of the rating of up
to 19 variables that researchers had found to be important for
Final version
21
instructional message design. Experiments with ranking and rating
of test-pictures show that pictures with high BLIX values were
ranked and rated better than those with lower values by children as
well as by adults.
Pettersson (1989:164) later revised the BLIX index, and offered the
following (digital) rating scheme:
Questions Yes/No
1. (a) Colour picture: The picture is executed in a
true-to-life colour.
(b) Black & white picture: the contrast and gray scale in
the picture are clear.
2. The picture has a shape other than a square or a
rectangle or covers an entire page.
3. The picture has a legend which is brief, easy to
understand and deals with the picture.
4. The picture is unambiguous and not too 'artistic'.
5. The picture has a dominant centre of interest at or
near its optical centre (middle of the picture) and
few details which can be regarded as distracting.
Although the 'questions' seem to address issues that are important
for visually unskilled readers, they need to be operationalised in
more concrete, and picture-specific terms. Even in connection with
standard viewing contexts Pettersson (1989:165) acknowledges that
BLIX only represents the average difficulty or ease with which a
picture can be read (as judged by a visual expert - AC).
Final version
22
5. Assessing the literacy level of the reader
When designing materials for low-literate adults it is important to
know how well they can read and comprehend. As discussed
previously, successful interpretation of printed verbal texts
depends on several subprocesses, including perception, decoding,
comprehension, memory and reflection. In health education primarily
two types of tests are used: those testing reading (decoding)
skills, and those testing comprehension.
(i) Reading tests
Rudd et al. (1999) discuss the following tools commonly used to
assess patients' ability to decode texts on health-related matters:
1. The Rapid Estimate of Adult Literacy in Medicine or REALM (Davis, Crouch,
Long, Jackson, Bates, George & Bairnsfather 1991; Davis,
Mayeaux, Fredrickson, Bocchini, Jackson. & Murphy 1994)
For this test participants read from a list of 125 common
medical terms, arranged in four columns according to the
number of syllables they contain. REALM performed well in
identifying patients with low reading ability, and a shortened
version was subsequently developed and assessed. The shortened
version takes two minutes, and performed as well as the longer
version in assessment of concurrent validity.
2. Wide Range Achievement Test – Revised (WRATR) (Davis et al. 1994)
The WRATR is commonly used in educational settings, and
requires a participant to read aloud lists of words that
become increasingly difficult. When ten words have been
consecutively mispronounced, the test is stopped, and a raw
Final version
23
score, between 1 and 89, is computed and converted into a
grade equivalent.
Although Doak et al. (1996) prefer the REALM test – one reason
being that it takes less time to administer – it can only be
applied in health contexts. Moreover, REALM offers less precision
since scores are given as a range of grade levels rather than a
specific grade level as in WRATR.
A general disadvantage of reading tests such as WRATR and REALM is
that they do not require that patients understand the words – only
that they are able to pronounce them. Davis, Michielutte, Askov,
Williams & Weiss (1998) caution that these tests cannot determine
the type of reading difficulty or its cause, and thus cannot be
expected to diagnose specific problems. They may, however, prove
useful in identifying patients for whom standard approaches and
materials may not be effective.
(ii) Comprehension tests
The method usually applied to determine whether a reader has
understood a text is the cloze test. The subject can also be required
to transform what was read into other words (tell in his/her own
words what the text means), or a listening test can be applied.
In health settings the cloze test is normally used for patients who
have a WRATR/REALM score of the sixth Grade or higher (compare Doak
et al. 1996:35). The standard cloze test comprises a relevant text
of which every fifth word is deleted until about 50 words have been
deleted, which then have to be filled in by the respondent. If a
Final version
24
significant number of the respondents score below 40% on the cloze
test, the material used in the test is not appropriate for them.
Either the text has to be adapted or a different method has to be
used. The Test of Functional Health Literacy in Adults – TOHFLA
(Parker, Baker, Williams & Nurss 1995) is a specific version of the
cloze test developed for testing hospital materials (medical aid
application forms, instructions for preparing for an upper
gastrointestinal series, a standard hospital consent form, and
labeled prescription vials). This test was developed in English and
in Spanish, and includes a seventeen-item list of numerical ability
and a fifty-item test of reading comprehension applying the cloze
procedure.
A huge problem facing document designers in developing countries
where the local languages (languages other than the [colonial]
lingua franca) are used in instructional materials for low-literate
audiences, is that no tests are available in these languages. The
materials developer has to rely on literacy statistics and
respondents' self reports. The problems with these methods of
determining reading level are that nearly all nonreaders or poor
readers will seek to conceal the fact due to the strong social
stigma attached to illiteracy. If asked to read a passage from a
text they will often use excuses such as "I forgot my glasses" or
"my eyes are tired" (compare Doak et al. 1996:6). Moreover, as
mentioned above, years of schooling is not a good measure of
literacy level.
Final version
25
As far as could be ascertained, no tests for measuring the
readability of visuals by actual viewers (skilled or unskilled)
have been compiled.
6. Shortcomings of low-literacy materials
One of the most important challenges for materials developers and
educators in adult literacy is to tailor printed materials to match
the needs of their audiences. They have to provide materials that
are easily understood, that help the reader to learn, and that are
motivating (which includes being culturally suitable). However,
according to Doak et al. (1996:73) most current materials have
shortcomings. Frequently occurring problems with verbal materials
are the following:
Too much information is included.
An information overload will discourage poor readers, affect the
attention they pay to the document, bury the main message and
obscure the priority of information. The problem will be
compounded by the absence of a strong external structure (in
other words if the layout, use of typography and chunking of the
text do not provide cues to the reader).
Readability levels are too high for the average person.
Long words will significantly decrease decoding effectiveness and
long sentences will influence decoding/comprehension by
increasing cognitive load. Complex sentences will specifically
hinder the reader in resolving referents through the successful
interpretation of anaphora.
Final version
26
Difficult/uncommon words are seldom explained.
Unless difficult or uncommon words are explained through
paraphrase or examples problems will arise in the decoding phase.
The reader is not encouraged to interact with the material.
If the text is read passively, without the reader experiencing
personal involvement, learning and recall will be adversely
affected.
The main problems that emerge from the literature on visual
materials for low-literates are the following:
Readers cannot identify with the visual.
Socio-cultural and demographic variables (including ethnic group,
gender, dress, social customs, acquaintance with symbols,
architectural and landscape settings, etc.) may cause the reader
not to pay attention to the message at all. These factors may also
influence the acceptability of the message and decrease motivation
to read. (compare Tomaselli & Tomaselli 1984; Doak et al. 1996:99).
Comprehension may also be hindered if the visual fails to evoke a
schema against which to interpret the new information.
The artistic style hinders identification.
Art style does not merely affect likeability, but may also
influence comprehensibility. Highly stylized images may not be
recognized, and processing already be halted in the perceptual
phase.
The depiction of depth perception is unclear.
Final version
27
If readers experience problems with linear perspective (e.g. the
lines of a road converging towards the horizon), depth perception
on the basis of the relative size of objects (e.g. similar objects
decreasing in size as they recede towards the horizon), and
occlusion (superposition and overlapping of objects), the message
may be misunderstood. Misunderstanding may arise from the fact that
objects are not recognized, relationships between objects not
comprehended, or the fact that the picture does not reflect real-
life experience (which may have an impact on believability).
Too much detail is included.
Too much detail, for example too many figures or objects, or a busy
background (Doak et al. 1996:103) may cause the eyes of the
visually unskilled reader to wander about the page without finding
the central focus of the visual, or focusing on the wrong detail
(Doak et al. 1996:93).
Visuals and related text are separated.
If visuals are placed after the text which they explain, or if they
are not printed on the same page as the related text and no
explanatory captions are provided (Doak et al. 1996:104), the
viewer may fail to benefit from the supporting relationship. A low-
literate reader may even completely fail to grasp the message.
7. Proposed design heuristics
Many manuals and handbooks provide guidelines for designing low-
literacy printed materials. They mostly highlight the importance of
layout, typeface, style and size; white space; primacy of key
information; using short words and explaining hard words; using
Final version
28
short sentences, using active instead of passive voice; and
including interaction and reviews or summaries (compare Doak et al.
1996:78).
However, in general, the literature provides limited (or no)
evidence of whether the strategies used to meet the needs of low-
literates are research-based. Moreover, it is often unclear whether
the strategies are based on reader research, or whether they are
based on text-focused evaluation by editors, subject-field experts,
intermediaries or document designers.
A study that made an impressive attempt at eliciting research-based
guidelines from the available literature, is one by Morris &
Stillwell (2003). In the table below - which draws heavily on this
study but also integrates guidelines from other sources - a set of
heuristics for designing the textual elements (content, structure,
style) as well as the graphic elements (visuals, typography, colour
and layout) for low-literacy public information documents is
suggested. The guidelines are linked to their purported effects on
how low-literates' process verbal and visual materials, as outlined
in the discussion above:
Table 1: Design heuristics for print materials aimed at low-literate audiences
DESIGN HEURISTICS READER-EFFECTS
TEXTUAL ELEMENTSGenre and medium Tailor the number of messages to the
medium and the genre (e.g. it is recommended that a pamphlet/leaflet is
Enhances comprehension and recall
Final version
29
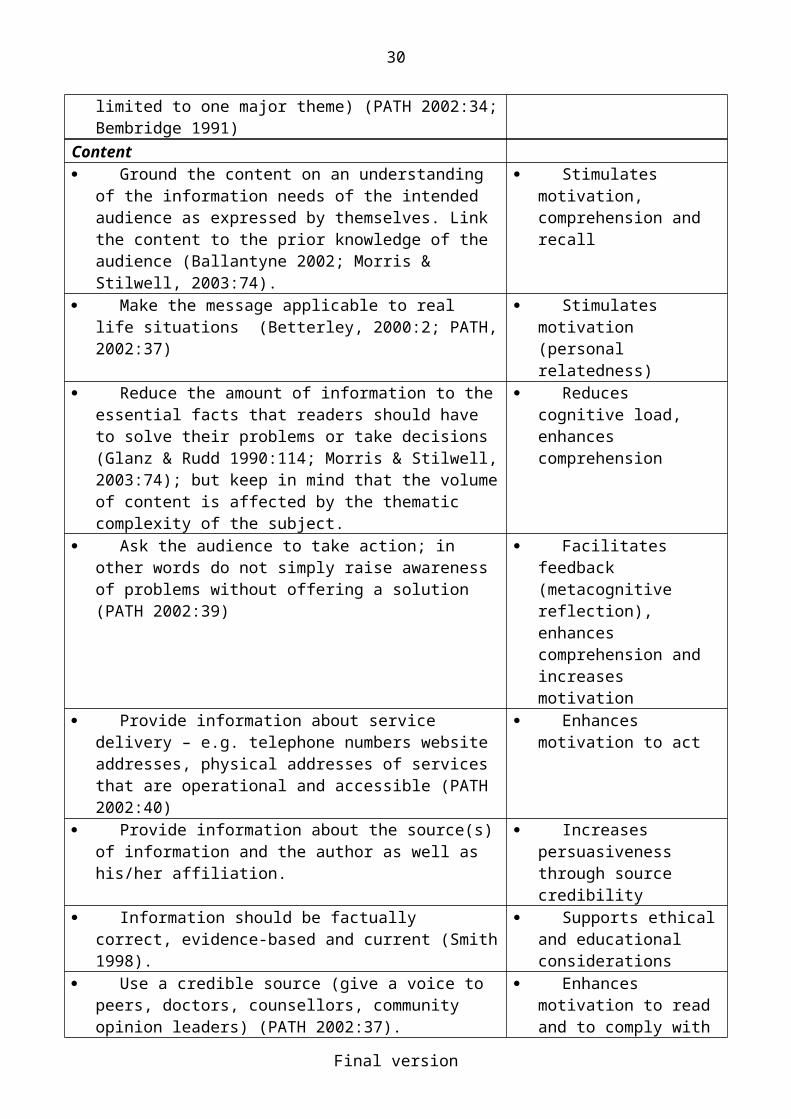
limited to one major theme) (PATH 2002:34;Bembridge 1991)
Content Ground the content on an understanding
of the information needs of the intended audience as expressed by themselves. Link the content to the prior knowledge of the audience (Ballantyne 2002; Morris & Stilwell, 2003:74).
Stimulates motivation, comprehension and recall
Make the message applicable to real life situations (Betterley, 2000:2; PATH,2002:37)
Stimulates motivation (personal relatedness)
Reduce the amount of information to theessential facts that readers should have to solve their problems or take decisions (Glanz & Rudd 1990:114; Morris & Stilwell,2003:74); but keep in mind that the volumeof content is affected by the thematic complexity of the subject.
Reduces cognitive load, enhances comprehension
Ask the audience to take action; in other words do not simply raise awareness of problems without offering a solution (PATH 2002:39)
Facilitates feedback (metacognitive reflection), enhances comprehension and increases motivation
Provide information about service delivery – e.g. telephone numbers website addresses, physical addresses of services that are operational and accessible (PATH 2002:40)
Enhances motivation to act
Provide information about the source(s)of information and the author as well as his/her affiliation.
Increases persuasiveness through source credibility
Information should be factually correct, evidence-based and current (Smith1998).
Supports ethicaland educational considerations
Use a credible source (give a voice to peers, doctors, counsellors, community opinion leaders) (PATH 2002:37).
Enhances motivation to read and to comply with
Final version
30
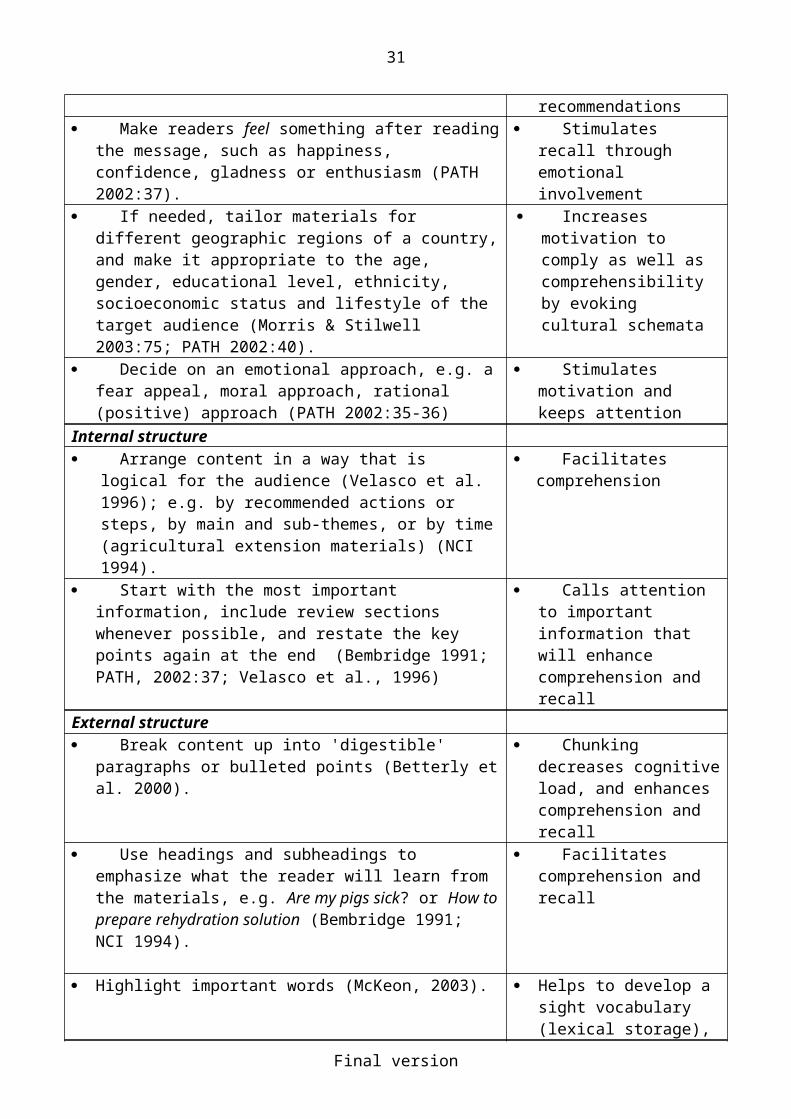
recommendations Make readers feel something after reading
the message, such as happiness, confidence, gladness or enthusiasm (PATH 2002:37).
Stimulates recall through emotional involvement
If needed, tailor materials for different geographic regions of a country,and make it appropriate to the age, gender, educational level, ethnicity, socioeconomic status and lifestyle of the target audience (Morris & Stilwell 2003:75; PATH 2002:40).
Increases motivation to comply as well as comprehensibility by evoking cultural schemata
Decide on an emotional approach, e.g. afear appeal, moral approach, rational (positive) approach (PATH 2002:35-36)
Stimulates motivation and keeps attention
Internal structure Arrange content in a way that is
logical for the audience (Velasco et al. 1996); e.g. by recommended actions or steps, by main and sub-themes, or by time(agricultural extension materials) (NCI 1994).
Facilitates comprehension
Start with the most important information, include review sections whenever possible, and restate the key points again at the end (Bembridge 1991; PATH, 2002:37; Velasco et al., 1996)
Calls attention to important information that will enhance comprehension and recall
External structure Break content up into 'digestible'
paragraphs or bulleted points (Betterly etal. 2000).
Chunking decreases cognitiveload, and enhances comprehension and recall
Use headings and subheadings to emphasize what the reader will learn from the materials, e.g. Are my pigs sick? or How toprepare rehydration solution (Bembridge 1991; NCI 1994).
Facilitates comprehension and recall
Highlight important words (McKeon, 2003). Helps to develop a sight vocabulary (lexical storage),
Final version
31
and thereby aids word-recognition (through lexical access)
Style and language Write as you talk, i.e. use a
conversational style (Doak et al. 1996:78); and use peer language whenever appropriate (NCI 1994).
Increases motivation through personal involvement and enhances comprehension
Use simple, everyday terms, yet take care not to distort the scientific and technical facts (Morris & Stilwell 2003:74-75).
Simplifies the decoding process, and enhances comprehension without compromising accuracy
If technical terms have to be used, explain them or give examples (Doak et al.1996:78).
Lowers text density and facilitates comprehension
Use the active voice (Doak et al. 1996:78; PATH 2002:40).
Decreases cognitive load caused by limiting syntactic transformation
Do not translate information verbatim; rather reconceptualize and rewrite in a language and style appropriate to the specific cultural group or community.
Enhances comprehension by linking to existingcognitive models
GRAPHIC ELEMENTSVisuals Be aware of the sensory input level of
the reader so as to draw them to the content of visuals (McKeon 2003).
Optimizes visualperception
Use a visual on the cover (NCI 1994). Motivates the reader to open thedocument; sets thetone and mood; facilitates comprehension by acting as an
Final version
32
advance organizer. Use pictures to illustrate the key
points in materials for explanatory and instructional purposes (Leichter et al. 1981; Murphy et al. 1999).
Enhances comprehension and recall
Use captions (limited to about 15 wordsper line) together with visuals (Mayer et al. 1996; White 1988).
Facilitates comprehension and recall through dual coding; promotes literacy
Show familiar pictures that reflect cultural images (representing objects, style of dress, building styles, etc, thatare familiar to the viewer) (NCI 1994; PATH 2002:36).
Increases motivation (throughpositive affect) and facilitates comprehension (through linking tocultural schemata)
Use cues (such as arrows, a splash of colour, underlining, circling, magnifying,etc.) to direct the eyes to important points (Doak et al 1996:103; 106).
Optimize visual perception through enhancing acuity
Free images from clutter and distraction, and remove detail from the background to focus on key elements (NCI 1994).
Facilitates encoding and comprehension
Use visuals for testimonials (Doak et al. 1996:111).
Gives realism totestimonials, whichhelps to capture and hold attention
Layout Make the general appearance attractive
(Frost et al. 1999). Helps to attract
and keep attention Make the purpose of the document
immediately clear on the cover page (Morris & Stilwell 2003:79).
Instils motivation to read
Arrange the text and visual material inthe rest of the document to maximize the legibility of the text (Morris & Stilwell 2003:79).
Optimizes perception
Separate blocks of text and graphics bymaking use of enough white space (Velasco et al. 1996:40).
Decreases cognitive load by helping to encode fewer chunks of
Final version
33
information in theworking memory
Make headings stand out, but keep them close enough to the allied text in order to unambiguously indicate their affiliations (NCI 1994).
Provides an overview to facilitate comprehension and recall
Restrict line length to between 50 and 70 characters in continuous text (Morris & Stilwell 2003:79).
Increases readability (perception and encoding)
The space between letters must be less than the space between words, and word space must be less than the space between lines (Velasco et al. 1996).
Facilitates perception and encoding (word recognition).
Use left alignment rather than full justification, especially in the case of narrow columns or text wrapped around textboxes and graphics (Betterley 2000; Parker1997; Velasco et al. 1996)
Facilitates readability as unequal spaces between words reduce reading speed, and justification may lead to lines beingreread or skipped.
Typography The choice of type size and weight
(boldness) is more important than the choice of typeface. So, never use font sizes smaller than 12 points (Glanz & Rudd1990; NCI 1994) and never use light, spindly font types (e.g. Coronet, Futura Light) that do not provide adequate contrast between text and background (Morris & Stilwell 2003:79). Misanchuk's (1989) study (quoted by Morris & Stilwell,2003:79) of learners' preferences revealedthat a Bookman 13 point font was preferredabove all other type and size combinations. Type size will also partially be determined by characteristicsof the typeface, e.g. x-height.
Increases readability (decoding), and comprehension (through chunking, queuing and filtering of information) and enhances motivationto read.
Use fonts between 14 and 16 points for Assists the reader
Final version
34
readers with poor eyesight (RNIB 2000, quoted by Morris & Stilwell 2003:80)
in the perception phase
Use serif typefaces for continuous text and sans serifs for short sections of textthat need to be highlighted or stand alone, such as headings and captions (Velasco et al. 1996).
Increases visual perception, decoding and comprehension (by emphasizing queueing of information)
Do not use too many font types in one document, as it may distract or confuse the reader; preferably not more than two (Betterly et al., 2000).
Influences perception, and comprehension (cognitive load)
Use variation in font types, as well as typographic highlighting (weight, slant, underlining and all caps) to emphasize important words, phrases or paragraphs (NCI 1994) and make the information structure of the document apparent (e.g. the information hierarchy; similar and different information types such as warnings, notes, instructions, captions, etc.) (Keyes 1993).
Enhances decoding, comprehension, recall and searching
Never use all caps for continuous text.Save this for labels, short headings, etc.Rather use a combination of upper and lower case. (Pettersson 2002; Schriver 1997; Velasco et al. 1996).
Affects perception and word-recognition, thereby decreasing reading speed
Colour Colour must be used to attract and enhance and not detract and distract from the overall presentation of the message (Betterley 2000). This implies that not too many colours must be used in one document.
Affects attention and perception
Ensure good contrast between the colourof the paper and the colour of the print (Nitzke & Voichick 1992).
Good legibility enhances readability (visualperception)
Colour can be used as a backdrop for the printed text, but should not be so bright or dark that it reduces the legibility of the text. (NCI 1994).
Colour may serveas a stimulus to read.
Final version
35
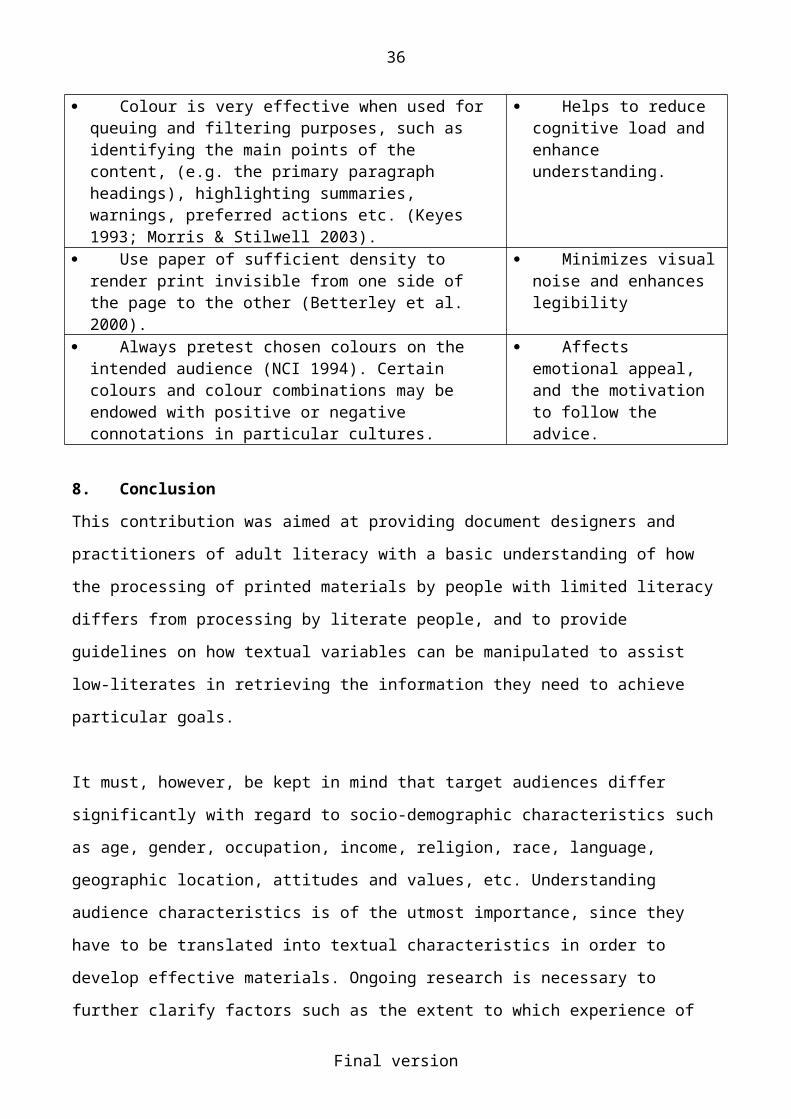
Colour is very effective when used for queuing and filtering purposes, such as identifying the main points of the content, (e.g. the primary paragraph headings), highlighting summaries, warnings, preferred actions etc. (Keyes 1993; Morris & Stilwell 2003).
Helps to reduce cognitive load and enhance understanding.
Use paper of sufficient density to render print invisible from one side of the page to the other (Betterley et al. 2000).
Minimizes visualnoise and enhances legibility
Always pretest chosen colours on the intended audience (NCI 1994). Certain colours and colour combinations may be endowed with positive or negative connotations in particular cultures.
Affects emotional appeal, and the motivation to follow the advice.
8. Conclusion
This contribution was aimed at providing document designers and
practitioners of adult literacy with a basic understanding of how
the processing of printed materials by people with limited literacy
differs from processing by literate people, and to provide
guidelines on how textual variables can be manipulated to assist
low-literates in retrieving the information they need to achieve
particular goals.
It must, however, be kept in mind that target audiences differ
significantly with regard to socio-demographic characteristics such
as age, gender, occupation, income, religion, race, language,
geographic location, attitudes and values, etc. Understanding
audience characteristics is of the utmost importance, since they
have to be translated into textual characteristics in order to
develop effective materials. Ongoing research is necessary to
further clarify factors such as the extent to which experience of
Final version
36
pictorial conventions influences picture perception and
comprehension. Such research must also consider the role of the
cultural background and physical environment as possible
determinants of miscommunication. In addition, local research needs
to be done on the relation between stylistic preferences and
cognitive factors such as paying attention, being motivated to
read, remembering the message, and being persuaded to follow the
advice. A participatory approach, involving members of the intended
user-group throughout the process, is strongly advised.
Yet even if the design and development process is preceded by
authentic audience research and audience participation, and the
empirically-based advice given in the above matrix is followed,
pretesting remains essential to ensure effectiveness. Key issues to
probe are attractiveness, comprehension, (cultural) acceptability, self-efficacy
(whether readers feel that they have the skills to carry out the
instruction), and persuasiveness (whether the message is able to
convince the audience that they should take action) (Doak et al.
1996:169; NCI 1994).
RESOURCE LIST
Ausburn, F. & Ausburn, J. 1983. Visual Analysis Skills among Two
Populations in Papua New Guinea. Educational Communication and
Technology 31(2): 112-122.
Ballantyne, P. 2002. Recognising alternative rationalities in the
deployment of information systems. Electronic Journal on Information
Systems in Developing Countries 3(7): 1-15. Online. Available:
Final version
37
http://www.is.cityu.edu.hk/Research/ejisdc/vol13/v3r7.pdf.
Bembridge, T.J. 1991. Practical guidelines for agricultural extension workers: A field
manual. Halfway House: Development Bank of South Africa.
Betterley, C. 2000. Guide to evaluating written nutrition education materials.
Ames: Iowa State University.
Betterley, C., Dobson, B. & Ouverson, C. 2000. Written nutrition education
materials review form. Ames: Iowa State University.
Bradley, S.M. 1995. How people use pictures. An annotated bibliography. London:
International Institute for Environment and Development and
the British Council.
Carstens, A. & Snyman, M. 2003. How effective is the Department of
Health's leaflet on HIV/AIDS Counselling for low-literate South
Africans? Tydskrif vir Nederlands en Afrikaans (Journal for Dutch and
Afrikaans) 10(1):112-136.
Coleman, E.A., Coon, S., Mohrmann, C., Hardin, S., Stewart, B.S.,
Gibson, R., Cantrell, M., Lord, J. & Heard, J. 2003.
Developing and testing lay literature about breast cancer
screening for African American women. Clinical Journal of Oncology
Nursing 7(1):66-71.
Cornwall, Andrea. 1992. Body mapping in health. RRA Notes 16: 69-76.
International Institute of Environment and Development.
London.
Daiker, B.L. 1992. Evaluating health and safety lectures: How to
measure lucidity. AAOHN Journal 40(9): 438-445.
Daneman, M. 1991. Individual differences in reading skills. In
Barr, R. (Ed.). Handbook of reading research. London: Longman.
Davis, T.C., Crouch, M.A., Long, S.W., Jackson, R.H., Bates, P.,
George, R.B. & Bairnsfather, L.E. 1991. Rapid assessment of
literacy levels of adult primary care patients. Family Medicine
Final version
38
23(6): 433-435.
Davis, T.C., Mayeaux E.J., Fredrickson, D., Bocchini, J.A.,
Jackson, R.H. & Murphy, P.W. 1994. Reading ability of parents
compared with reading level of pediatric patient education
materials. Pediatrics 93: 460-468.
Davis, T.C., Michielutte, R., Askov, E.N., Williams, M.V. & Weiss,
B.D. 1998. Practical assessment of adult literacy in health
care. Health Education and Behaviour 25(5): 613-624.
De Jong, P. & Van der Leij, A. 1998. General and specific abilities
as predictors of reading achievement. In: Reitsema, P. &
Verhoeven, L. (Eds.) 1998. Problems and interventions in literacy
development. Dordrecht: Kluwer Academic Publishers.
Doak, C.C. Doak, L.G. & Root, J.H. 1996. Teaching patients with low literacy
skills. Philadelphia: J.B. Lippincott Company.
Doak, L.G. & Doak, C.C. 1987. Lowering the silent barriers to
compliance for patients with low literacy skills. Promoting
Health 8(4): 6-8.
Field, J. 2003. Psycholinguistics. London & New York: Routledge.
Frost, M.H., Thompson, R. & Thiermann, K.B. 1999. Importance of
format and design in print patient information. Cancer Practice
7(1): 22-27.
Fuglesang, Andreas. 1970. Picture style preference. OVAC Bulletin
22:46-48.
Glanz, K. & Rudd, R.E. 1990. Readability and content analysis of
print cholesterol education materials. Patient Education and
Counseling 16: 109-118.
Harley, A. 2003. Talking Adult Learning (November edition). Cape Town:
Adult Learning Network
Final version
39
Hoffmann, V. 2000. Picture supported communication in Africa. Weikersheim:
Margraf Verlag.
International Adult Literacy Survey. 2004. Literacy in the
information age. Online. Available:
http://www.nald.ca/nls/ials/infoage/infoage1.htm.
Keyes, E. 1993. Typography, color and information structure.
Technical Communication, Fourth Quarter pp. 638-654.
Leichter, S.B., Nieman, J.A., Moore, R.W., Collins, P & Rhodes, A.
1981. Readability of self-care instructional pamphlets for
diabetic patients. Diabetes Care 4(6): 627-630.
Linney, B. 1995. Pictures, people and power. Hong Kong. MacMillan
Education.
Mayer, R. 1999. Research-based principles for the design of
instructional messages. The case of multimedia explanations.
Document Design 1(1): 7-19.
Mayer, R.E. & Gallini, J.K. 1990. When is an illustration worth ten
thousand words? Journal of Educational Psychology 82: 715-726.
Mayer, R.E. & Sims, V.K. 1994. For whom is a picture worth a
thousand words? Extensions of a dual-coding theory of
multimedia learning. Journal of Educational Psychology 86:389-401.
Mayer, R.E., Bove, W., Bryman, A., Mars, R. & Tapangco, L. 1996.
When less is more: Meaningful learning from visual and verbal
summaries of science textbook lessons. Journal of Educational
Psychology 88(1):64-73.
McKeever, N. Conrath, C & Skinner, M.L. 1956. Stimulating improved health
behaviour of American Indians. U.S. Public Health Service.
McKeon, C.A. 2003. Health Care Communication with Low-literate Patients,
Literacy Online. Proceedings of the 1996 Conference on
Final version
40
Literacy. Online. Available:
http://www.literacyonline.org/products/ili/pdf/ilproccm.pdf
Meade, C.D. & Byrd, J.C. 1989. Patient literacy and the readability
of smoking education literature. American Journal of Public Health 79:
204-206.
Meade, C.D. & Smith, C.F. 1991. Readability formulas: cautions and
criteria. Patient Education and Counseling 17: 153-158.
Messaris, P. 1994. Visual Literacy. Image, Mind & Reality. Boulder, Colorado:
Westview Press.
Morris, C.D. & Stilwell, C. 2003. Getting the write message right:
Review of guidelines for producing readable print agricultural
information materials. SA Journal for Library and Information Science
69(1): 71-83.
Murphy, D.A., O Keefe, Z.H. & Kaufman, A.H. 1999. Improving
comprehension and recall of information for an HIV vaccine
trial among women at risk for HIV: Reading level
simplification and inclusion of pictures to illustrate key
concepts. AIDS Education and Prevention 11(5): 389 – 399.
NCI (National Cancer Institute). 1994. Clear & simple. Developing
effective print materials for low-literate readers. Online.
Available:
http://oc.nci.NCI.gov/services/Clear_and_Simple/HOME.HTM.
Nitzke, S. & Voichick, J. 1992. Overview of reading and literacy
research and applications in nutrition education. Journal of
Nutrition Education 24(5): 261-266.
Paivio, A. 1986. Mental Representations: A dual coding approach. New York:
Holt, Rinehart & Winston.
Parker, R.C. 1997. Parker's one-minute designer. Revised edition. New
York: IDG Books.
Final version
41
Parker, R.M., Baker, D.W., Williams, M.V. & Nurss, J.R. 1995. The
test of functional health literacy in adults: A new instrument
for measuring patients' literacy skills. Journal of General Internal
Medicine 10(10): 537-541.
PATH (Program for Appropriate Technology in Health). 2002. Developing
materials on HIV/AIDS/STIs for low-literate audiences. Online. Available:
http://www.fhi.org/en/HIVAIDS/Publications/manualsguidebooks/l
owliteracyquide.htm
Pettersson, R. 1989. Visuals for information: Research and practice. Englewood
Cliffs NJ: Educational Technology Publications.
Pettersson, R. 2002. Information design. Document Design Companion
Series. Amsterdam: Benjamins.
Pretorius, E.J. 2002.The reading process. In: Swanepoel, P.H. &
Hubbard, E.H. (Eds.). Text quality: theories, models and techniques.
Tutorial Letter 501/2/2002. pp. 22-47. Pretoria. Unisa:
Project Literacy. 2004. Education Statistics. Online. Available:
http://www.projectliteracy.org.za/education.htm.
Rudd, R.E., Moeykens, B.A., & Colton, T.C. 1999. Health and
Literacy. A Review of Medical and Public Health Literature.
Annual Review of Adult Learning and Literacy. New York: Jossey-Bass.
Online. Available: www.cete.org/acve/docs/pab00016.pdf
Schriver, K.A. 1997. Dynamics in Document Design. NY: Wiley and Sons.
Segall, M.H., Campbell, D.T., Herskovits, M.J. 1963. Cultural
differences in the perception of geometric illusions. Science
139:769-771.
Sinatra, R. 1986. Visual literacy connections to thinking, reading and writing.
Springfield, IL: Charles C. Thomas.
Smith, S. 1998. Reviewer's checklist for health information
materials. Online. Available:
Final version
42
http:///www.prenataled.com/pdf//evaluate.pdf.
Stokes, S. n.d. Visual literacy in teaching and learning: A
literature perspective. Electronic Journal for the Integration of Technology
in Education 1(1). Online. Available:
ejite.isu.edu/Volume1No1/pdfs/stokes.pdf.
Tomaselli, K.G. & Tomaselli, R. 1984. Media graphics as an
interventionist strategy. Information Design Journal 4(2): 99-117.
Velasco, M.R., Kowalski, R. & Lowe, J.C. 1996. Technology transfer
materials: Are we learning the technology of transfer? European
Journal of Agricultural Education and Extension 3: 35-46.
White, J.V. 1988. Graphic design for the electronic age. New York: Watson-
Guptill.
Wileman, R.E. 1993. Visual communicating. Englewood Cliffs, N.J. Educational Technology Publications.
Yuill, N. & Oakhill, J. 2003. Anaphor resolution. In: Field, J.
Psycholinguistics. London & New York: Routledge. pp. 195-200.
Zimmer, A. & Zimmer, F. 1978. Visual literacy in communication: Designing for
development. Tehran: Hulton Educational Publications Ltd.
Zimmerman, M.L. & Perkin, G.W. 1982. Instructing through pictures:
Print materials for people who do not read. Information Design
Journal 3(2): 119-134.
Final version
43