Embed Size (px)
Citation preview
1
Value-chain analysis of cassava in south-central coastal Vietnam
Ho Cao Viet et al1
Abstract
Value-chain analysis of cassava was carried out in the Binh Dinh, Phu Yen and Ninh Thuan
provinces of south-central coastal (SCC) Vietnam to assess limitations that occurred from the
production to the consumption stage and to develop strategies and make recommendations to
enhance profitability for farmers.
The key findings of cassava value-chain analysis are: (i) farmers and enterprise agents play a very
important role in the chain; however, the processing factory is the primary factor that influences the
whole cassava chain; (ii) information about the market and price governs farmer’s benefit and
income; (iii) cooperation and coordination among farmers are the best choices to reduce risk and
loss if the price were to depreciate; (iv) interaction between cassava producers and beef-cattle
enterprises is necessary for sustainable farming system; and (v) small-scale starch-processing units
are dependent upon the price of cassava root to mitigate risks.
Introduction
Cassava production came into force in Vietnam at the beginning of the 21st century when some
cassava-starch-processing factories were established in Binh Dinh and Phu Yen provinces. Initially,
the cassava-processing units were very traditional, small-scale and low capacity, using simple
equipment and family for labour. The product was mainly supplied to the local people and sold in
small markets. After that, processing factories started to process cassava tuber and root to
manufacture large amounts of flour and chips to sell to overseas markets such as China, Singapore
and Thailand, and a small portion was used as a raw material for the domestic industry. With time,
realising the potential of cassava as a niche and cash crop, farmers started to shift their focus from
other crops to cassava cultivation. Cassava now plays an important role for farming households,
particularly for the poor in south-central coastal (SCC) Vietnam. Over 90% of cassava produced
annually is processed into high-value products, such as cassava chips and starch, to supply both
domestic and overseas markets. These products are the main source of income for farmers,
processors and other agents in the value chain, including collectors, middlemen, dealers,
wholesalers, retailers, enterprises, processing units, companies and factories. The by-products of
cassava are also used as animal feed (for livestock such as cattle and pigs) in this region, and this
aspect has played a very imported role in improving the income of farms.
Surveys of different actors involved in the cassava value chain were conducted to collect
information, analyse the chain and assess if it could be improved for the benefit of all the
1 Lecturer in the Faculty of Business Adnimistration - Van Hien University.
Email of correspondant: [email protected]
2
participants. The price of cassava root fluctuates based on supply and demand in the world market,
which affects its production domestically. Price fluctuation is also indirectly influenced by the way
vertical coordination occurs among farmers and other value-chain actors such as like powder-
processing units, factories and related enterprises. Based on the survey results, there was a need to
identify limitations that would occur during the process of the cassava supply chain and to further
improve it to create a better social and economic environment for all involved.
The specific objectives for this cassava value-chain project were to:
analyse markets and identify the advantages and disadvantages of the process
support activities and recommend policies for implementation and improvement of the value
chain
identify short-term solutions and develop long-term strategies by engaging stakeholders and
agents.
Methodology
Analytical frameworks were adopted from international organisations involved in evaluating value
chains, such asDeutsche Gesellschaft für Internationale Zusammenarbeit (GIZ), ACDI/VOCA and
Making Markets Work for the Poor (M4P), and were applied to develop the investigation
framework in the context of cassava value-chain research. The methodology of value-chain study of
the Food and Agriculture Organization of the United Nations (FAO) (Bockel and Tallec 2005) was
also applied.
Qualitative methods
The participatory rural appraisal (PRA) method, formal discussions, key informal panel (KIP)
discussions, problem trees, SWOT (strengths, weaknesses, opportunities and threats) analysis and
Venn diagram were used to identify the: (i) structure of the chain in different provinces; (ii)
interaction of each factor, including the actors in the chain; and (iii) impact of institutions and
policies on the chain. Collection and analysis of secondary data (annual reports of people
committees, statistical data, scientific reports and information from the Ministry of Agriculture and
Rural Development (MARD), Department of Agriculture and Rural Development (DARD) in each
province, non-government organisations (NGOs), plus institutional and political papers) were also
were. Individual in-depth interviews, case studies and observations added to the data collection.
These databases were updated yearly.
Quantitative methods
Face-to-face interviews or discussions were held with the value-chain actors to collect data which
were subjected to statistical analysis, cost–benefit analysis and value-added analysis to build a
scenario to interpret the overall chain, including subchains and products.
Survey sampling strategy and participants
A non-probability sampling method (proportionate quota sampling combined with a convenience
sampling approach) was used in this study mainly due to financial (approach) and technical
constraints (timescale and performance). Hence, there was limited the ability of the surveyors to
3
expand the sample size of the actors involved in the cassava value chain. Consequently, although
the population of farmers was very large, surveying was restricted to one commune in each of the
three study provinces. These comprised:
Cat Trinh commune, Phu Cat district, Binh Dinh province
An Chan commune, Tuy An district, Phu Yen province
Phuoc Dinh commune, Ninh Phuoc district, Ninh Thuan province.
From each of these communes, 30 farming households with different land sizes were selected to
carry out annual surveys and face-to-face interviews. The other actors included eight
collectors/middlemen of various levels, five dealers (who trade cassava chips), five processing units
(cassava flour and starch) and three processing factories (starch and other products).
Data analysis
Descriptive statistics were used to analyse the data. The basis for calculating the benefit: cost ratio
is presented in Table 1 and financial factors that were considered for the descriptive statistics for the
cassava value chain are outlineded in Figures 1 and 2.
Table 1. Economic parameters used in the cost–benefit analysis
Parameter Formula
Production (total income)
(P)
(Productivity × Selling price of main product per unit) +
Income from by-products (if any)
Total cost (TC) Variable costs (VC) + Fixed costs (FC)
Fixed costs Maintenance + Depreciation + Tax
Variable costs Fertilisers + Pesticides + Labour wage
Collectors/middlemen costs
Input materials + Labour wage + Transportation + Energy (fuel,
electrivity) + Tax on product (if any)
Processing unit costs Input materials + Labour wage + Transportation + Energy +
Tax
Intermediate Cost (IC) Input materials + Energy
Gross profit (GPr) Production (P) – Total cost (TC)
Value added (VA) Labour wage + Interest on loan + Communication fee + Tax +
Maintenance & repair + Depreciation + Gross profit
Net profit (NPr) Gross profit (after tax)
World cassava production and trade
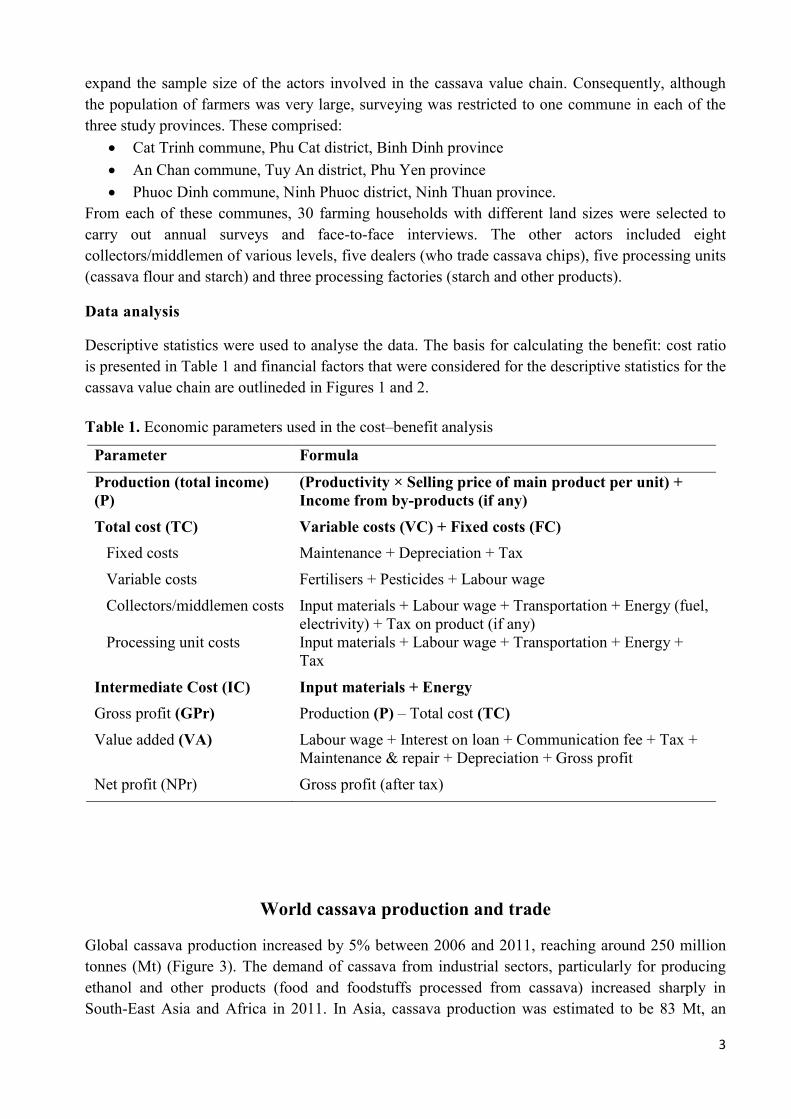
Global cassava production increased by 5% between 2006 and 2011, reaching around 250 million
tonnes (Mt) (Figure 3). The demand of cassava from industrial sectors, particularly for producing
ethanol and other products (food and foodstuffs processed from cassava) increased sharply in
South-East Asia and Africa in 2011. In Asia, cassava production was estimated to be 83 Mt, an
4
increase of 6% in 2011. Thailand was the largest producer of cassava in Asia, with a total
production of 30 Mt; however, Thai production reduced by 8% in 2011 due to pest damage (pink
hibiscus mealybug). China produced around 8.5 Mt in 2011.
Figure 3. World cassava production of cassava, 2006–2011. Source: FAO (2011)
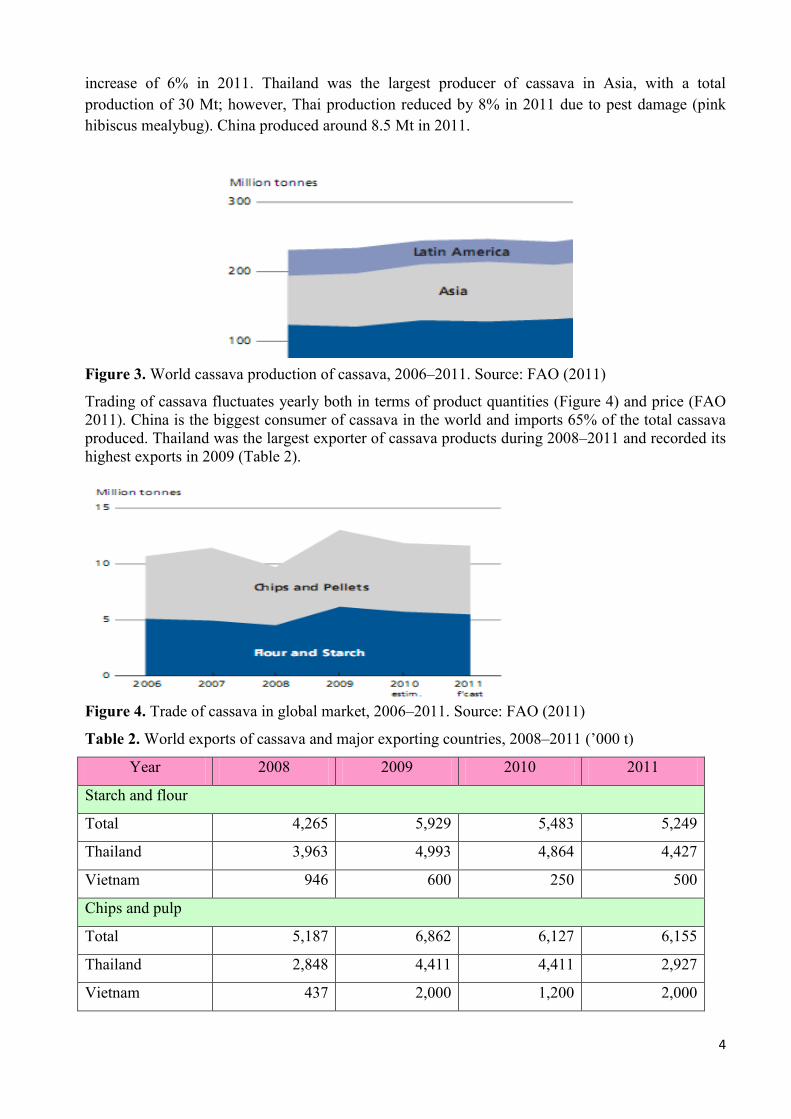
Trading of cassava fluctuates yearly both in terms of product quantities (Figure 4) and price (FAO
2011). China is the biggest consumer of cassava in the world and imports 65% of the total cassava
produced. Thailand was the largest exporter of cassava products during 2008–2011 and recorded its
highest exports in 2009 (Table 2).
Figure 4. Trade of cassava in global market, 2006–2011. Source: FAO (2011)
Table 2. World exports of cassava and major exporting countries, 2008–2011 (’000 t)
Year 2008 2009 2010 2011
Starch and flour
Total 4,265 5,929 5,483 5,249
Thailand 3,963 4,993 4,864 4,427
Vietnam 946 600 250 500
Chips and pulp
Total 5,187 6,862 6,127 6,155
Thailand 2,848 4,411 4,411 2,927
Vietnam 437 2,000 1,200 2,000
5
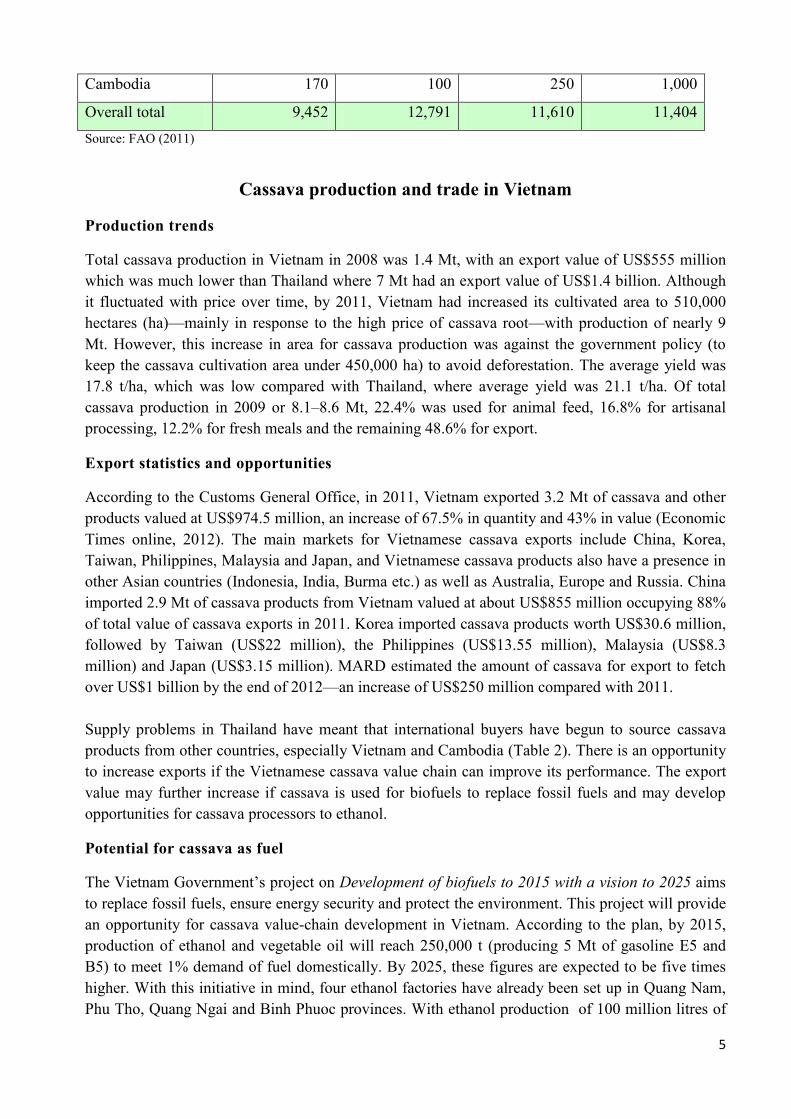
Cambodia 170 100 250 1,000
Overall total 9,452 12,791 11,610 11,404
Source: FAO (2011)
Cassava production and trade in Vietnam
Production trends
Total cassava production in Vietnam in 2008 was 1.4 Mt, with an export value of US$555 million
which was much lower than Thailand where 7 Mt had an export value of US$1.4 billion. Although
it fluctuated with price over time, by 2011, Vietnam had increased its cultivated area to 510,000
hectares (ha)—mainly in response to the high price of cassava root—with production of nearly 9
Mt. However, this increase in area for cassava production was against the government policy (to
keep the cassava cultivation area under 450,000 ha) to avoid deforestation. The average yield was
17.8 t/ha, which was low compared with Thailand, where average yield was 21.1 t/ha. Of total
cassava production in 2009 or 8.1–8.6 Mt, 22.4% was used for animal feed, 16.8% for artisanal
processing, 12.2% for fresh meals and the remaining 48.6% for export.
Export statistics and opportunities
According to the Customs General Office, in 2011, Vietnam exported 3.2 Mt of cassava and other
products valued at US$974.5 million, an increase of 67.5% in quantity and 43% in value (Economic
Times online, 2012). The main markets for Vietnamese cassava exports include China, Korea,
Taiwan, Philippines, Malaysia and Japan, and Vietnamese cassava products also have a presence in
other Asian countries (Indonesia, India, Burma etc.) as well as Australia, Europe and Russia. China
imported 2.9 Mt of cassava products from Vietnam valued at about US$855 million occupying 88%
of total value of cassava exports in 2011. Korea imported cassava products worth US$30.6 million,
followed by Taiwan (US$22 million), the Philippines (US$13.55 million), Malaysia (US$8.3
million) and Japan (US$3.15 million). MARD estimated the amount of cassava for export to fetch
over US$1 billion by the end of 2012—an increase of US$250 million compared with 2011.
Supply problems in Thailand have meant that international buyers have begun to source cassava
products from other countries, especially Vietnam and Cambodia (Table 2). There is an opportunity
to increase exports if the Vietnamese cassava value chain can improve its performance. The export
value may further increase if cassava is used for biofuels to replace fossil fuels and may develop
opportunities for cassava processors to ethanol.
Potential for cassava as fuel
The Vietnam Government’s project on Development of biofuels to 2015 with a vision to 2025 aims
to replace fossil fuels, ensure energy security and protect the environment. This project will provide
an opportunity for cassava value-chain development in Vietnam. According to the plan, by 2015,
production of ethanol and vegetable oil will reach 250,000 t (producing 5 Mt of gasoline E5 and
B5) to meet 1% demand of fuel domestically. By 2025, these figures are expected to be five times
higher. With this initiative in mind, four ethanol factories have already been set up in Quang Nam,
Phu Tho, Quang Ngai and Binh Phuoc provinces. With ethanol production of 100 million litres of
6
ethanol production per year per factory, the total demand for cassava is estimated to be about 1 Mt
of dried root per year, requiring nearly 58,000 ha of cassava plantation, assuming the yield to be 17
t/ha. With a further 10 ethanol-production projects being set up, the Ministry of Trade estimates that
510,000 ha with an average yield of 15.7 t/ha would be required for this use alone. Given that the
cultivation area for cassava already exceeds the limit set by government (as discussed above), to
meet demaned it would be necessary to improve cassava yield by introducing new varieties and/or
new cultivation techniques to achieve similar yield levels as in India (31.4 t/ha) and Thailand (21.1
t/ha) (KHPT 2010).
Fluctuations in price of cassava products and impact on cultivated area
The domestic cassava price of roots and processed products such as chips and starch fluctuated
during 2009–2012. In 2010–2011, the farm-gate price of cassava root (Vietnamese dong (VND)35
million /ha) and dried chips (5,300 VND/kg) and were double that of the previous year (information
compiled from KIP discussions in Binh Dinh, Phu Yen and Ninh Thuan provinces). This higher
price of cassava attracted farmers to shift from other crops (such as sugarcane) to cassava
cultivation.
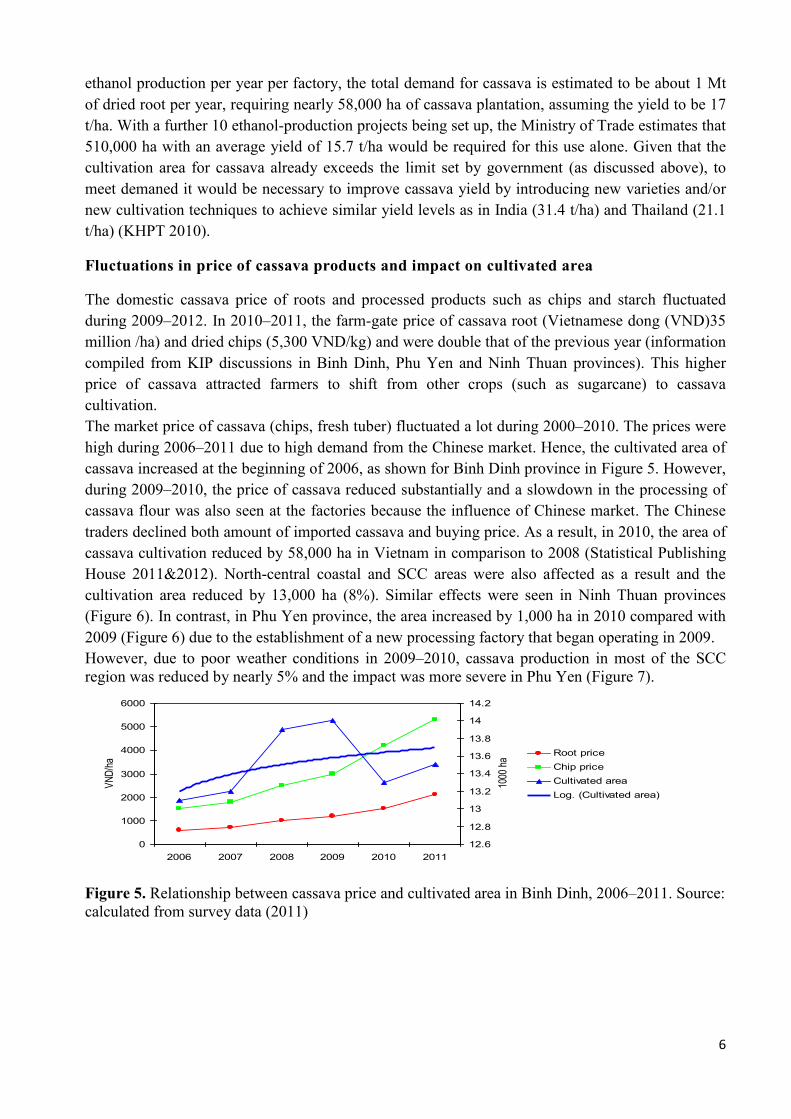
The market price of cassava (chips, fresh tuber) fluctuated a lot during 2000–2010. The prices were
high during 2006–2011 due to high demand from the Chinese market. Hence, the cultivated area of
cassava increased at the beginning of 2006, as shown for Binh Dinh province in Figure 5. However,
during 2009–2010, the price of cassava reduced substantially and a slowdown in the processing of
cassava flour was also seen at the factories because the influence of Chinese market. The Chinese
traders declined both amount of imported cassava and buying price. As a result, in 2010, the area of
cassava cultivation reduced by 58,000 ha in Vietnam in comparison to 2008 (Statistical Publishing
House 2011&2012). North-central coastal and SCC areas were also affected as a result and the
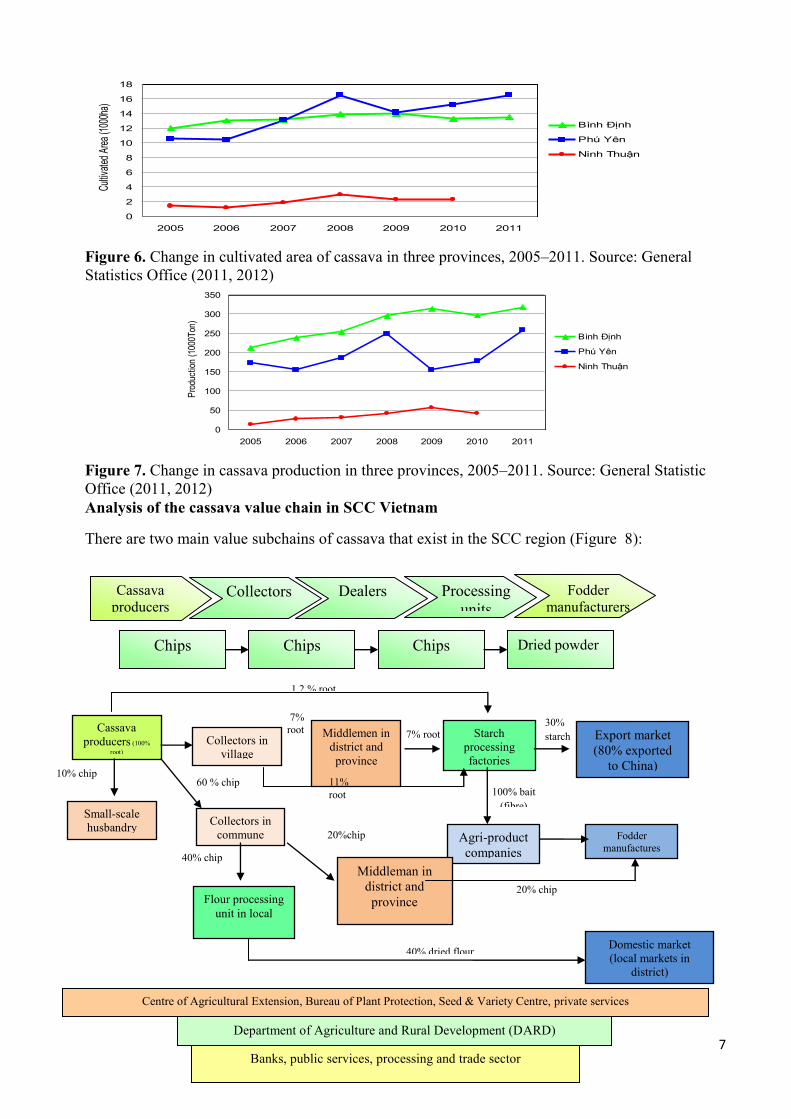
cultivation area reduced by 13,000 ha (8%). Similar effects were seen in Ninh Thuan provinces
(Figure 6). In contrast, in Phu Yen province, the area increased by 1,000 ha in 2010 compared with
2009 (Figure 6) due to the establishment of a new processing factory that began operating in 2009.
However, due to poor weather conditions in 2009–2010, cassava production in most of the SCC
region was reduced by nearly 5% and the impact was more severe in Phu Yen (Figure 7).
0
1000
2000
3000
4000
5000
6000
2006 2007 2008 2009 2010 2011
VN
D/h
a
12.6
12.8
13
13.2
13.4
13.6
13.8
14
14.2
1000
ha
Root price
Chip price
Cultivated area
Log. (Cultivated area)
Figure 5. Relationship between cassava price and cultivated area in Binh Dinh, 2006–2011. Source:
calculated from survey data (2011)
7
0
2
4
6
8
10
12
14
16
18
2005 2006 2007 2008 2009 2010 2011
Culti
vate
d Ar
ea (1
000h
a)
Bình Định
Phú Yên
Ninh Thuận
Figure 6. Change in cultivated area of cassava in three provinces, 2005–2011. Source: General
Statistics Office (2011, 2012)
0
50
100
150
200
250
300
350
2005 2006 2007 2008 2009 2010 2011
Pro
duct
ion
(100
0Ton
)
Bình Định
Phú Yên
Ninh Thuận
Figure 7. Change in cassava production in three provinces, 2005–2011. Source: General Statistic
Office (2011, 2012)
Analysis of the cassava value chain in SCC Vietnam
There are two main value subchains of cassava that exist in the SCC region (Figure 8):
Chips Chips
Chips
Dried powder
Cassava
producers Collectors Processing
units
Dealers Fodder
manufacturers
Starch
processing
factories
Export market
(80% exported
to China)
Agri-product
companies
Fodder
manufactures
30%
starch
100% bait
(fibre)
Middlemen in
district and
province
7% root Cassava
producers (100%
root) Collectors in
village
7%
root
1 2 % root
Small-scale
husbandry
10% chip
Collectors in
commune
Middleman in
district and
province
60 % chip
20%chip
Flour processing
unit in local
40% chip
20% chip
Domestic market
(local markets in
district)
40% dried flour
11%
root
Centre of Agricultural Extension, Bureau of Plant Protection, Seed & Variety Centre, private services
Department of Agriculture and Rural Development (DARD)
Banks, public services, processing and trade sector
8
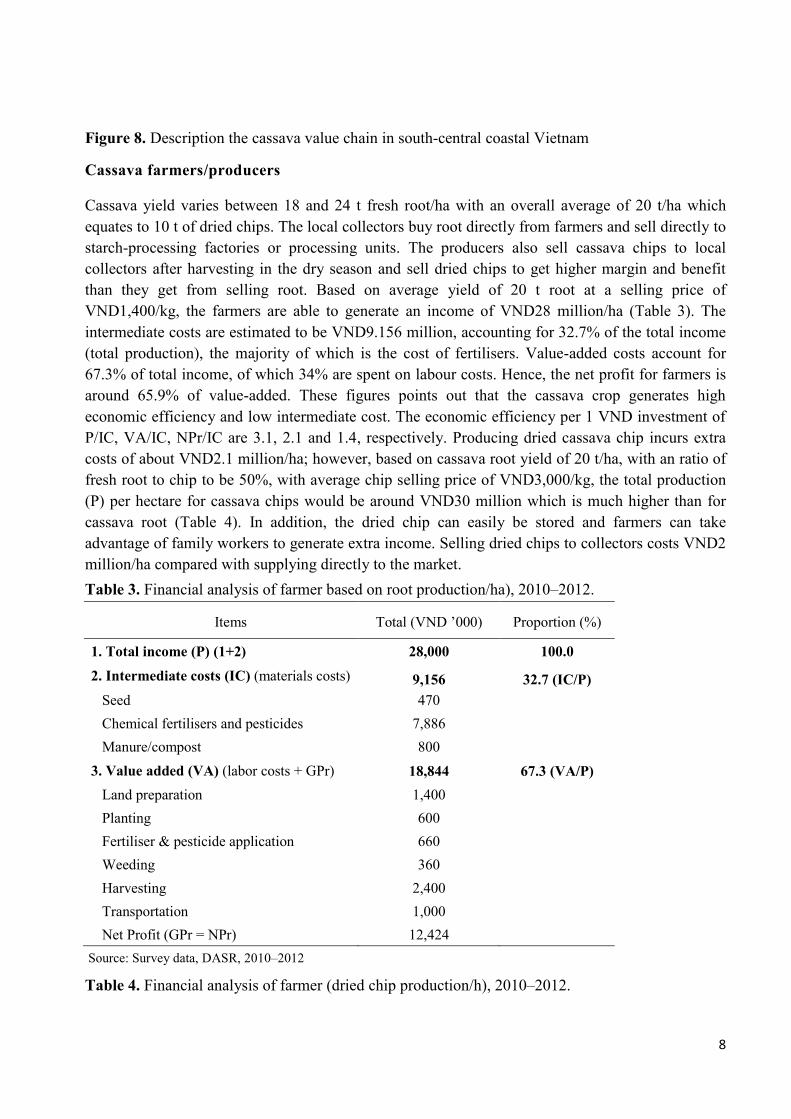
Figure 8. Description the cassava value chain in south-central coastal Vietnam
Cassava farmers/producers
Cassava yield varies between 18 and 24 t fresh root/ha with an overall average of 20 t/ha which
equates to 10 t of dried chips. The local collectors buy root directly from farmers and sell directly to
starch-processing factories or processing units. The producers also sell cassava chips to local
collectors after harvesting in the dry season and sell dried chips to get higher margin and benefit
than they get from selling root. Based on average yield of 20 t root at a selling price of
VND1,400/kg, the farmers are able to generate an income of VND28 million/ha (Table 3). The
intermediate costs are estimated to be VND9.156 million, accounting for 32.7% of the total income
(total production), the majority of which is the cost of fertilisers. Value-added costs account for
67.3% of total income, of which 34% are spent on labour costs. Hence, the net profit for farmers is
around 65.9% of value-added. These figures points out that the cassava crop generates high
economic efficiency and low intermediate cost. The economic efficiency per 1 VND investment of
P/IC, VA/IC, NPr/IC are 3.1, 2.1 and 1.4, respectively. Producing dried cassava chip incurs extra
costs of about VND2.1 million/ha; however, based on cassava root yield of 20 t/ha, with an ratio of
fresh root to chip to be 50%, with average chip selling price of VND3,000/kg, the total production
(P) per hectare for cassava chips would be around VND30 million which is much higher than for
cassava root (Table 4). In addition, the dried chip can easily be stored and farmers can take
advantage of family workers to generate extra income. Selling dried chips to collectors costs VND2
million/ha compared with supplying directly to the market.
Table 3. Financial analysis of farmer based on root production/ha), 2010–2012.
Items Total (VND ’000) Proportion (%)
1. Total income (P) (1+2) 28,000 100.0
2. Intermediate costs (IC) (materials costs) 9,156 32.7 (IC/P)
Seed 470
Chemical fertilisers and pesticides 7,886
Manure/compost 800
3. Value added (VA) (labor costs + GPr) 18,844 67.3 (VA/P)
Land preparation 1,400
Planting 600
Fertiliser & pesticide application 660
Weeding 360
Harvesting 2,400
Transportation 1,000
Net Profit (GPr = NPr) 12,424
Source: Survey data, DASR, 2010–2012
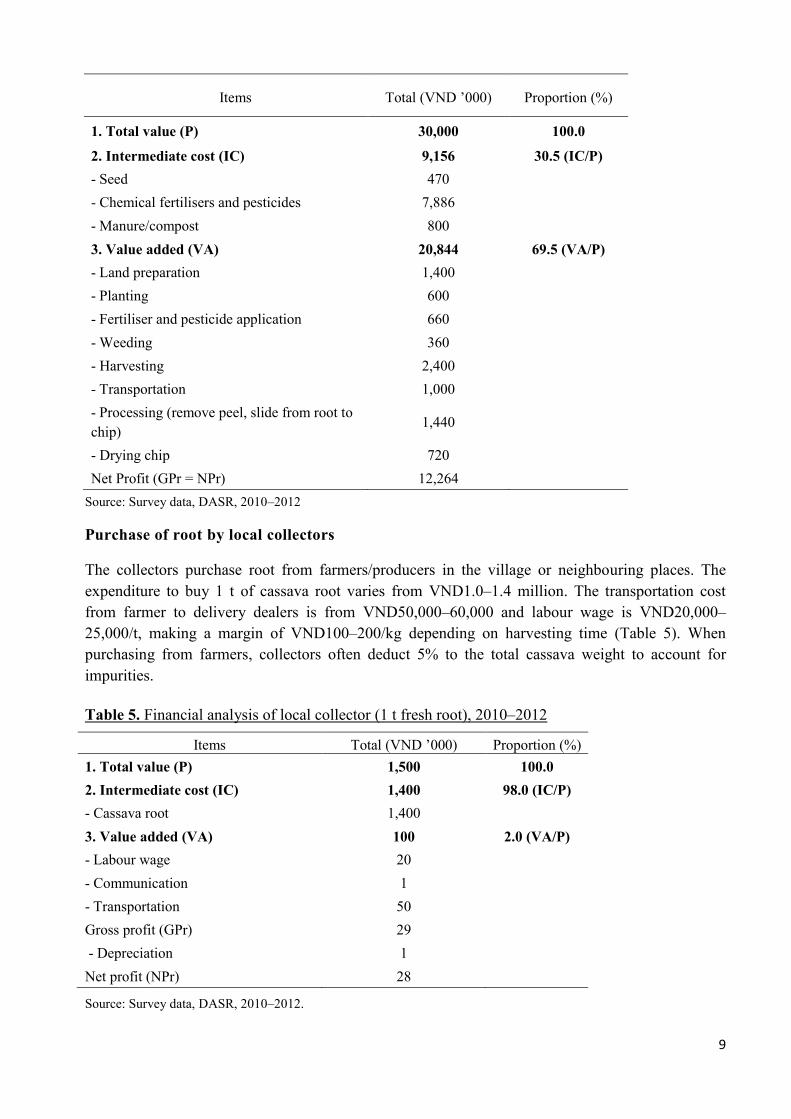
Table 4. Financial analysis of farmer (dried chip production/h), 2010–2012.
9
Items Total (VND ’000) Proportion (%)
1. Total value (P) 30,000 100.0
2. Intermediate cost (IC) 9,156 30.5 (IC/P)
- Seed 470
- Chemical fertilisers and pesticides 7,886
- Manure/compost 800
3. Value added (VA) 20,844 69.5 (VA/P)
- Land preparation 1,400
- Planting 600
- Fertiliser and pesticide application 660
- Weeding 360
- Harvesting 2,400
- Transportation 1,000
- Processing (remove peel, slide from root to
chip) 1,440
- Drying chip 720
Net Profit (GPr = NPr) 12,264
Source: Survey data, DASR, 2010–2012
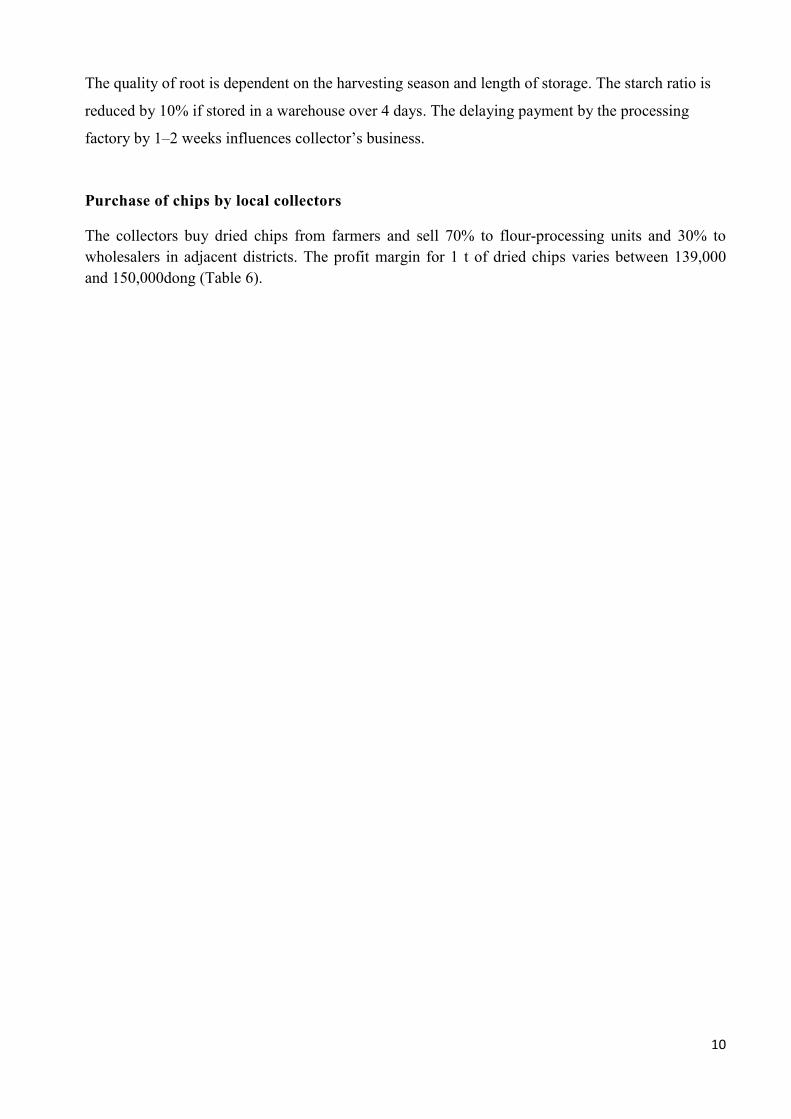
Purchase of root by local collectors
The collectors purchase root from farmers/producers in the village or neighbouring places. The
expenditure to buy 1 t of cassava root varies from VND1.0–1.4 million. The transportation cost
from farmer to delivery dealers is from VND50,000–60,000 and labour wage is VND20,000–
25,000/t, making a margin of VND100–200/kg depending on harvesting time (Table 5). When
purchasing from farmers, collectors often deduct 5% to the total cassava weight to account for
impurities.
Table 5. Financial analysis of local collector (1 t fresh root), 2010–2012
Items Total (VND ’000) Proportion (%)
1. Total value (P) 1,500 100.0
2. Intermediate cost (IC) 1,400 98.0 (IC/P)
- Cassava root 1,400
3. Value added (VA) 100 2.0 (VA/P)
- Labour wage 20
- Communication 1
- Transportation 50
Gross profit (GPr) 29
- Depreciation 1
Net profit (NPr) 28
Source: Survey data, DASR, 2010–2012.
10
The quality of root is dependent on the harvesting season and length of storage. The starch ratio is
reduced by 10% if stored in a warehouse over 4 days. The delaying payment by the processing
factory by 1–2 weeks influences collector’s business.
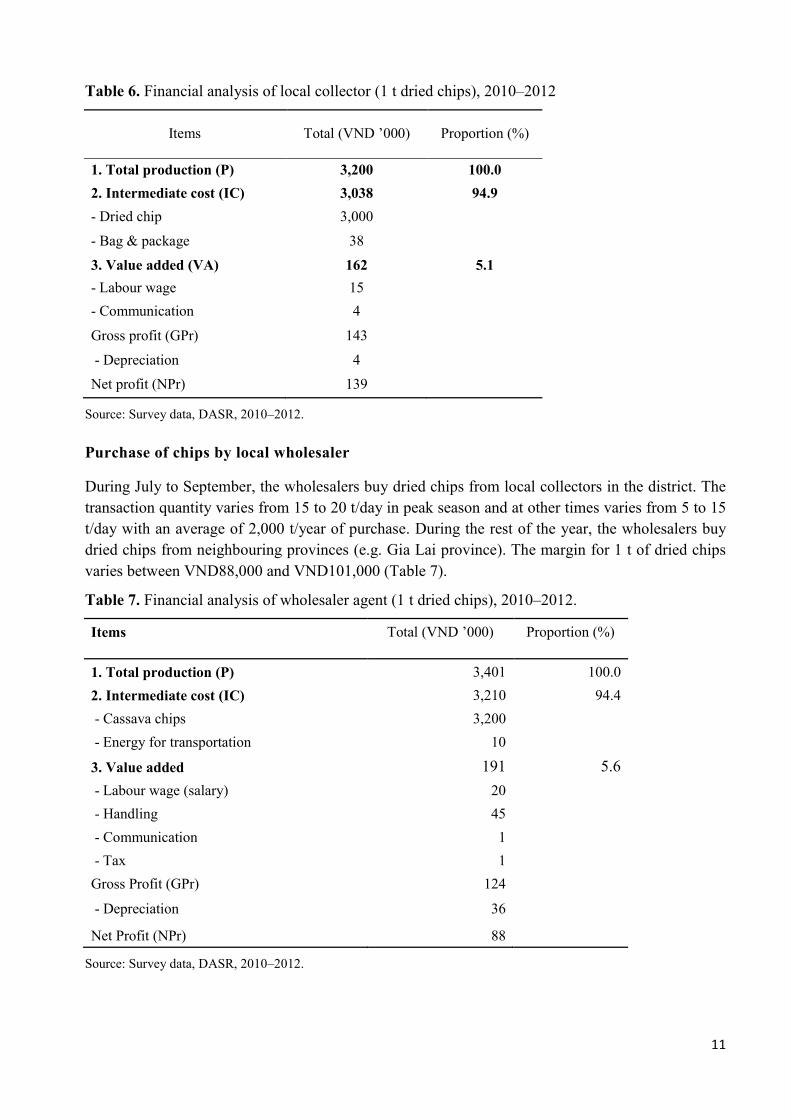
Purchase of chips by local collectors
The collectors buy dried chips from farmers and sell 70% to flour-processing units and 30% to
wholesalers in adjacent districts. The profit margin for 1 t of dried chips varies between 139,000
and 150,000dong (Table 6).
11
Table 6. Financial analysis of local collector (1 t dried chips), 2010–2012
Items Total (VND ’000) Proportion (%)
1. Total production (P) 3,200 100.0
2. Intermediate cost (IC) 3,038 94.9
- Dried chip 3,000
- Bag & package 38
3. Value added (VA) 162 5.1
- Labour wage 15
- Communication 4
Gross profit (GPr) 143
- Depreciation 4
Net profit (NPr) 139
Source: Survey data, DASR, 2010–2012.
Purchase of chips by local wholesaler
During July to September, the wholesalers buy dried chips from local collectors in the district. The
transaction quantity varies from 15 to 20 t/day in peak season and at other times varies from 5 to 15
t/day with an average of 2,000 t/year of purchase. During the rest of the year, the wholesalers buy
dried chips from neighbouring provinces (e.g. Gia Lai province). The margin for 1 t of dried chips
varies between VND88,000 and VND101,000 (Table 7).
Table 7. Financial analysis of wholesaler agent (1 t dried chips), 2010–2012.
Items Total (VND ’000) Proportion (%)
1. Total production (P) 3,401 100.0
2. Intermediate cost (IC) 3,210 94.4
- Cassava chips 3,200
- Energy for transportation 10
3. Value added 191 5.6
- Labour wage (salary) 20
- Handling 45
- Communication 1
- Tax 1
Gross Profit (GPr) 124
- Depreciation 36
Net Profit (NPr) 88
Source: Survey data, DASR, 2010–2012.
12
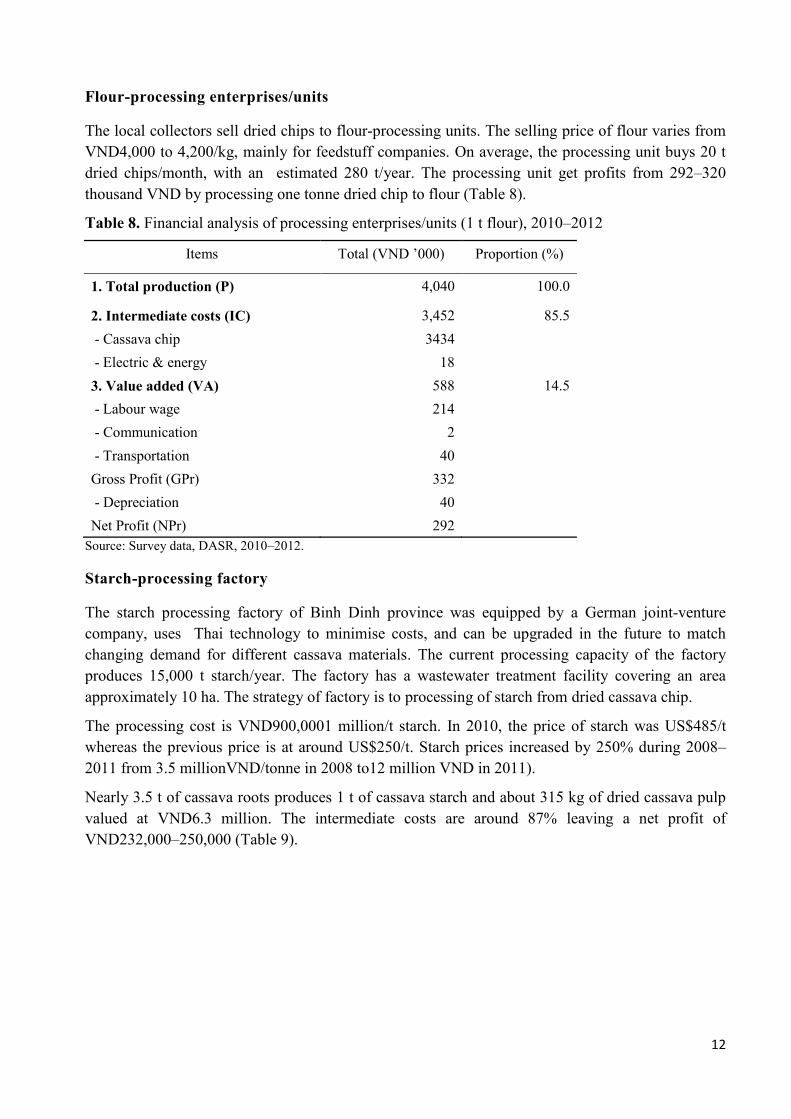
Flour-processing enterprises/units
The local collectors sell dried chips to flour-processing units. The selling price of flour varies from
VND4,000 to 4,200/kg, mainly for feedstuff companies. On average, the processing unit buys 20 t
dried chips/month, with an estimated 280 t/year. The processing unit get profits from 292–320
thousand VND by processing one tonne dried chip to flour (Table 8).
Table 8. Financial analysis of processing enterprises/units (1 t flour), 2010–2012
Items Total (VND ’000) Proportion (%)
1. Total production (P) 4,040 100.0
2. Intermediate costs (IC) 3,452 85.5
- Cassava chip 3434
- Electric & energy 18
3. Value added (VA) 588 14.5
- Labour wage 214
- Communication 2
- Transportation 40
Gross Profit (GPr) 332
- Depreciation 40
Net Profit (NPr) 292
Source: Survey data, DASR, 2010–2012.
Starch-processing factory
The starch processing factory of Binh Dinh province was equipped by a German joint-venture
company, uses Thai technology to minimise costs, and can be upgraded in the future to match
changing demand for different cassava materials. The current processing capacity of the factory
produces 15,000 t starch/year. The factory has a wastewater treatment facility covering an area
approximately 10 ha. The strategy of factory is to processing of starch from dried cassava chip.
The processing cost is VND900,0001 million/t starch. In 2010, the price of starch was US$485/t
whereas the previous price is at around US$250/t. Starch prices increased by 250% during 2008–
2011 from 3.5 millionVND/tonne in 2008 to12 million VND in 2011).
Nearly 3.5 t of cassava roots produces 1 t of cassava starch and about 315 kg of dried cassava pulp
valued at VND6.3 million. The intermediate costs are around 87% leaving a net profit of
VND232,000–250,000 (Table 9).
13
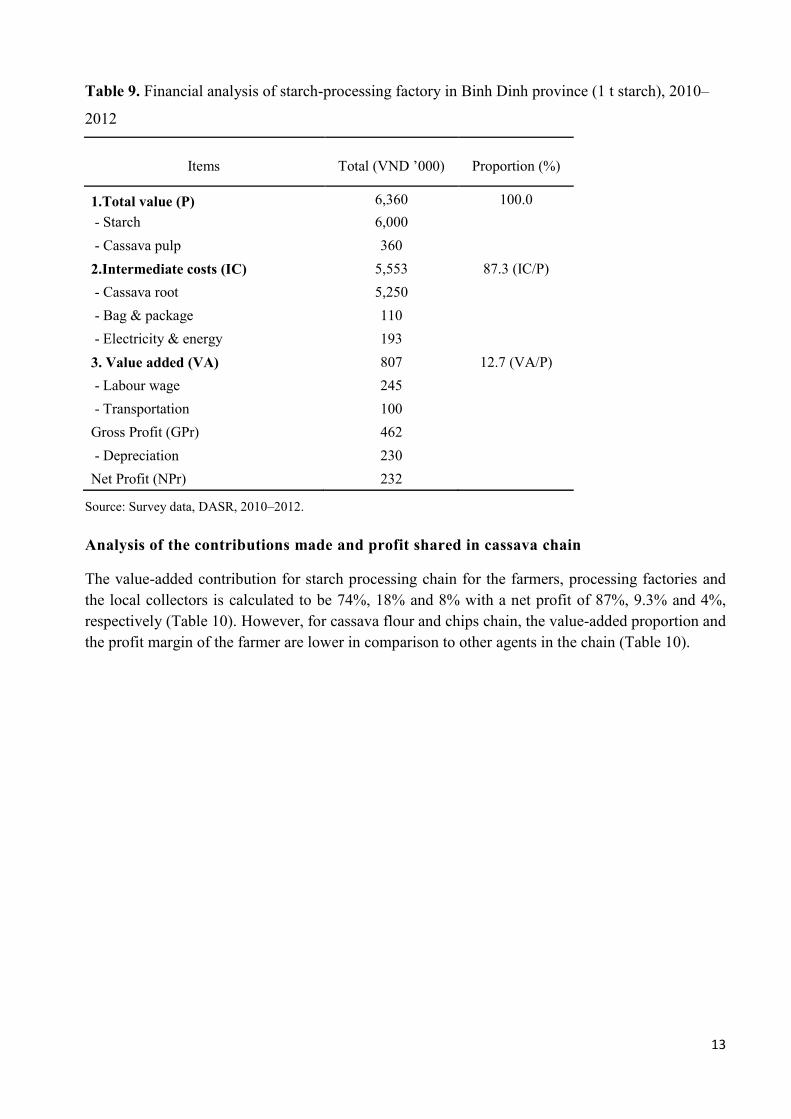
Table 9. Financial analysis of starch-processing factory in Binh Dinh province (1 t starch), 2010–
2012
Items
Total (VND ’000)
Proportion (%)
1.Total value (P) 6,360 100.0
- Starch 6,000
- Cassava pulp 360
2.Intermediate costs (IC) 5,553 87.3 (IC/P)
- Cassava root 5,250
- Bag & package 110
- Electricity & energy 193
3. Value added (VA) 807 12.7 (VA/P)
- Labour wage 245
- Transportation 100
Gross Profit (GPr) 462
- Depreciation 230
Net Profit (NPr) 232
Source: Survey data, DASR, 2010–2012.
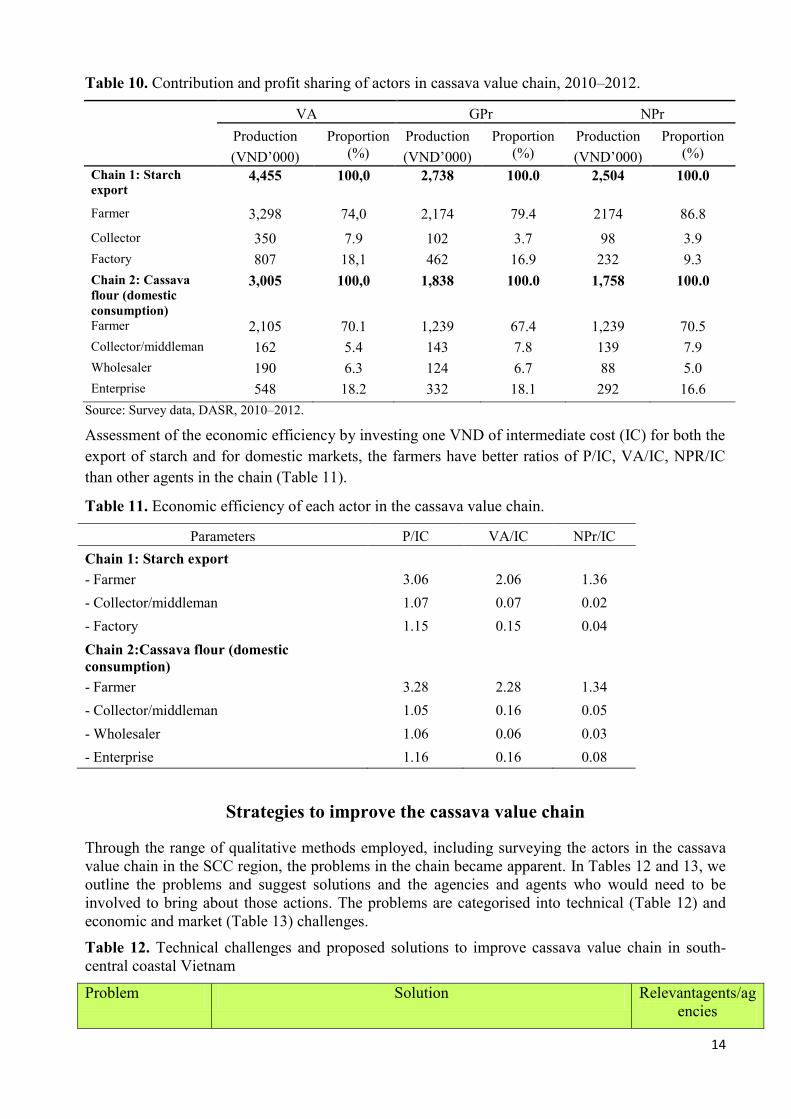
Analysis of the contributions made and profit shared in cassava chain
The value-added contribution for starch processing chain for the farmers, processing factories and
the local collectors is calculated to be 74%, 18% and 8% with a net profit of 87%, 9.3% and 4%,
respectively (Table 10). However, for cassava flour and chips chain, the value-added proportion and
the profit margin of the farmer are lower in comparison to other agents in the chain (Table 10).
14
Table 10. Contribution and profit sharing of actors in cassava value chain, 2010–2012.
VA GPr NPr
Production
(VND’000)
Proportion
(%)
Production
(VND’000)
Proportion
(%)
Production
(VND’000)
Proportion
(%)
Chain 1: Starch
export 4,455 100,0 2,738 100.0 2,504 100.0
Farmer 3,298 74,0 2,174 79.4 2174 86.8
Collector 350 7.9 102 3.7 98 3.9
Factory 807 18,1 462 16.9 232 9.3
Chain 2: Cassava
flour (domestic
consumption)
3,005 100,0 1,838 100.0 1,758 100.0
Farmer 2,105 70.1 1,239 67.4 1,239 70.5
Collector/middleman 162 5.4 143 7.8 139 7.9
Wholesaler 190 6.3 124 6.7 88 5.0
Enterprise 548 18.2 332 18.1 292 16.6
Source: Survey data, DASR, 2010–2012.
Assessment of the economic efficiency by investing one VND of intermediate cost (IC) for both the
export of starch and for domestic markets, the farmers have better ratios of P/IC, VA/IC, NPR/IC
than other agents in the chain (Table 11).
Table 11. Economic efficiency of each actor in the cassava value chain.
Parameters P/IC VA/IC NPr/IC
Chain 1: Starch export
- Farmer 3.06 2.06 1.36
- Collector/middleman 1.07 0.07 0.02
- Factory 1.15 0.15 0.04
Chain 2:Cassava flour (domestic
consumption)
- Farmer 3.28 2.28 1.34
- Collector/middleman 1.05 0.16 0.05
- Wholesaler 1.06 0.06 0.03
- Enterprise 1.16 0.16 0.08
Strategies to improve the cassava value chain
Through the range of qualitative methods employed, including surveying the actors in the cassava
value chain in the SCC region, the problems in the chain became apparent. In Tables 12 and 13, we
outline the problems and suggest solutions and the agencies and agents who would need to be
involved to bring about those actions. The problems are categorised into technical (Table 12) and
economic and market (Table 13) challenges.
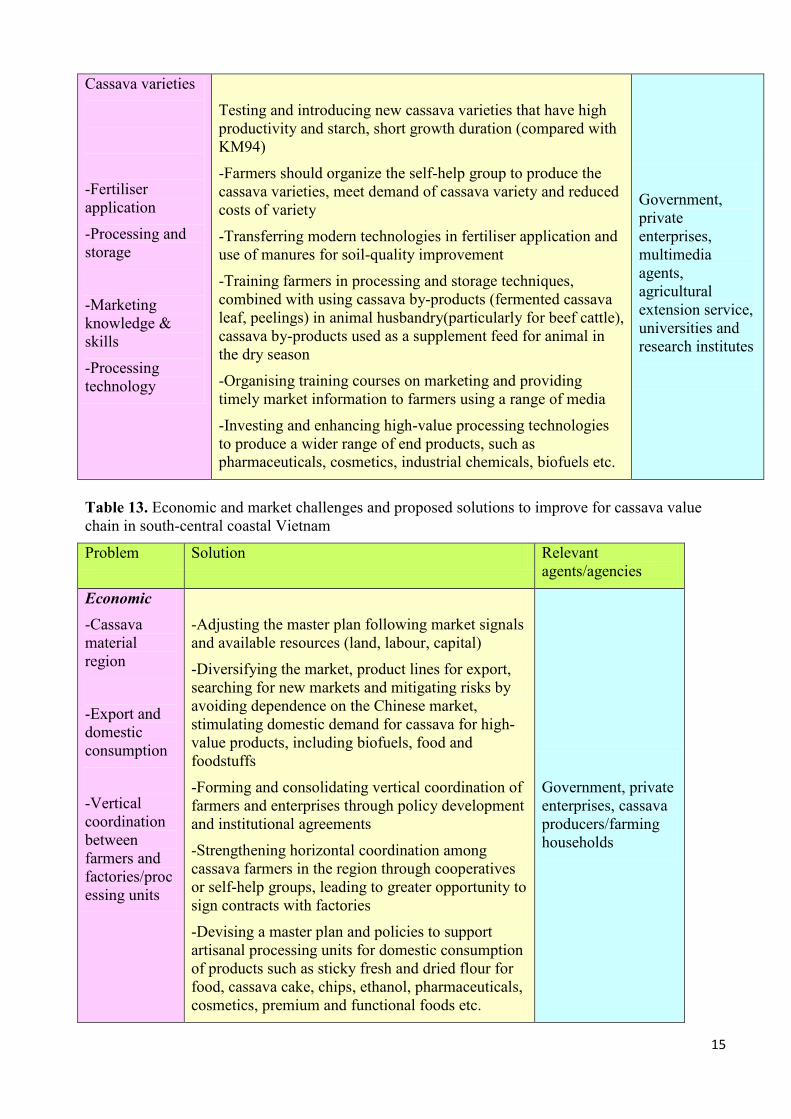
Table 12. Technical challenges and proposed solutions to improve cassava value chain in south-
central coastal Vietnam
Problem Solution Relevantagents/ag
encies
15
Cassava varieties
-Fertiliser
application
-Processing and
storage
-Marketing
knowledge &
skills
-Processing
technology
Testing and introducing new cassava varieties that have high
productivity and starch, short growth duration (compared with
KM94)
-Farmers should organize the self-help group to produce the
cassava varieties, meet demand of cassava variety and reduced
costs of variety
-Transferring modern technologies in fertiliser application and
use of manures for soil-quality improvement
-Training farmers in processing and storage techniques,
combined with using cassava by-products (fermented cassava
leaf, peelings) in animal husbandry(particularly for beef cattle),
cassava by-products used as a supplement feed for animal in
the dry season
-Organising training courses on marketing and providing
timely market information to farmers using a range of media
-Investing and enhancing high-value processing technologies
to produce a wider range of end products, such as
pharmaceuticals, cosmetics, industrial chemicals, biofuels etc.
Government,
private
enterprises,
multimedia
agents,
agricultural
extension service,
universities and
research institutes
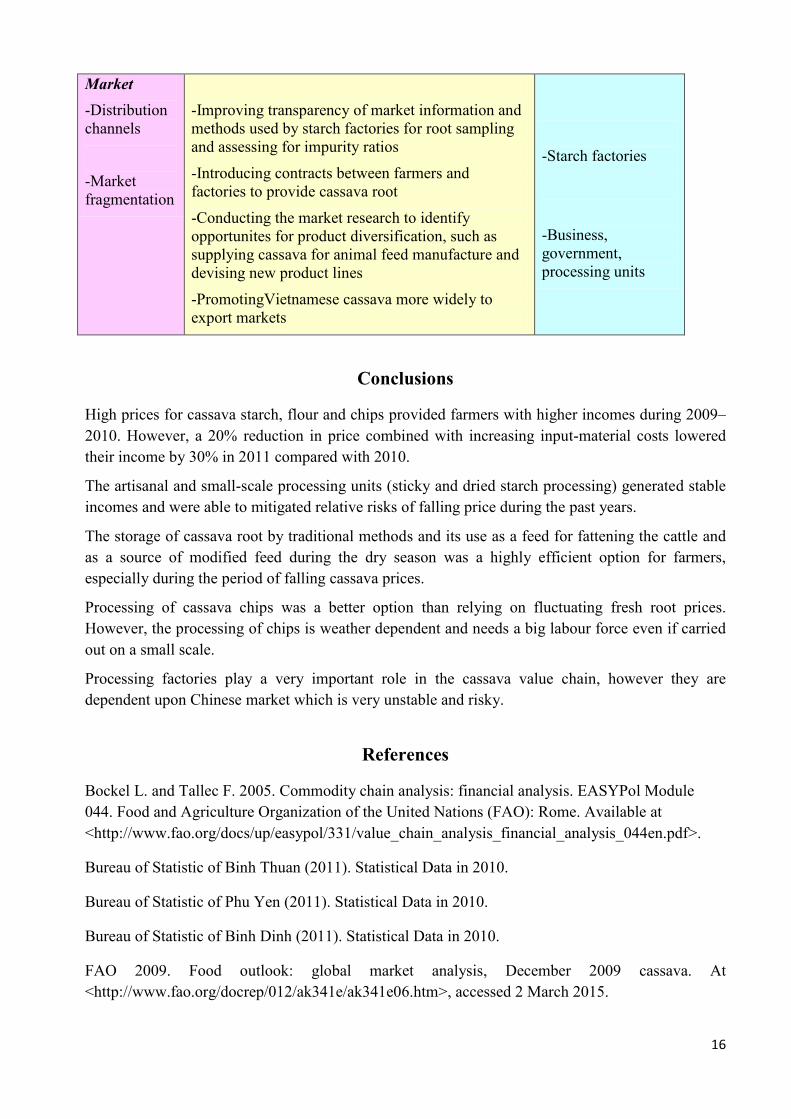
Table 13. Economic and market challenges and proposed solutions to improve for cassava value
chain in south-central coastal Vietnam
Problem Solution Relevant
agents/agencies
Economic
-Cassava
material
region
-Export and
domestic
consumption
-Vertical
coordination
between
farmers and
factories/proc
essing units
-Adjusting the master plan following market signals
and available resources (land, labour, capital)
-Diversifying the market, product lines for export,
searching for new markets and mitigating risks by
avoiding dependence on the Chinese market,
stimulating domestic demand for cassava for high-
value products, including biofuels, food and
foodstuffs
-Forming and consolidating vertical coordination of
farmers and enterprises through policy development
and institutional agreements
-Strengthening horizontal coordination among
cassava farmers in the region through cooperatives
or self-help groups, leading to greater opportunity to
sign contracts with factories
-Devising a master plan and policies to support
artisanal processing units for domestic consumption
of products such as sticky fresh and dried flour for
food, cassava cake, chips, ethanol, pharmaceuticals,
cosmetics, premium and functional foods etc.
Government, private
enterprises, cassava
producers/farming
households
16
Market
-Distribution
channels
-Market
fragmentation
-Improving transparency of market information and
methods used by starch factories for root sampling
and assessing for impurity ratios
-Introducing contracts between farmers and
factories to provide cassava root
-Conducting the market research to identify
opportunites for product diversification, such as
supplying cassava for animal feed manufacture and
devising new product lines
-PromotingVietnamese cassava more widely to
export markets
-Starch factories
-Business,
government,
processing units
Conclusions
High prices for cassava starch, flour and chips provided farmers with higher incomes during 2009–
2010. However, a 20% reduction in price combined with increasing input-material costs lowered
their income by 30% in 2011 compared with 2010.
The artisanal and small-scale processing units (sticky and dried starch processing) generated stable
incomes and were able to mitigated relative risks of falling price during the past years.
The storage of cassava root by traditional methods and its use as a feed for fattening the cattle and
as a source of modified feed during the dry season was a highly efficient option for farmers,
especially during the period of falling cassava prices.
Processing of cassava chips was a better option than relying on fluctuating fresh root prices.
However, the processing of chips is weather dependent and needs a big labour force even if carried
out on a small scale.
Processing factories play a very important role in the cassava value chain, however they are
dependent upon Chinese market which is very unstable and risky.
References
Bockel L. and Tallec F. 2005. Commodity chain analysis: financial analysis. EASYPol Module
044. Food and Agriculture Organization of the United Nations (FAO): Rome. Available at
<http://www.fao.org/docs/up/easypol/331/value_chain_analysis_financial_analysis_044en.pdf>.
Bureau of Statistic of Binh Thuan (2011). Statistical Data in 2010.
Bureau of Statistic of Phu Yen (2011). Statistical Data in 2010.
Bureau of Statistic of Binh Dinh (2011). Statistical Data in 2010.
FAO 2009. Food outlook: global market analysis, December 2009 cassava. At
<http://www.fao.org/docrep/012/ak341e/ak341e06.htm>, accessed 2 March 2015.
17
FAO (2010). Food Outlook December 2010 – Global Market Analysis.
http://www.fao.org/docrep/012/ak341e/ak341e06.htm
FAO (Food and Agriculture Organization of the United Nations) 2011. Market assessment: cassava.
Pp. 39–43 in ‘Food Outlookglobal market analysis, November 2011’. FAO: Rome. Accessible at
<http://www.fao.org/docrep/014/al981e/al981e00.pdf>.
Hồ Cao Việt (2012). Báo cáo chuỗi giá trị khoai mì và bò thịt vùng Duyên hải Nam Trung bộ
(Analyis of cassava & beefcatle in SCC). Trình bày tại Hội thảo tổng kết dự án ACIAR, tháng
3/2013 tại Bình Định. (Ho Cao Viet (2012). Report on the analysis of value chains of beef-cattle
and cassava in SCC region. Presented in the final workshop of ACIAR project, March 2013, in
Binh Dinh province)
DARD of Phu Yen (2009). Planning for Agriculture and Rural Development in 5 years 2006–2010
DARD of Ninh Thuan (2011). Annual Report on general situation of agricultural production in
2011.
DARD of Ninh Thuan (2006). Project on development of beef-cattle husbandry in Ninh Thuan,
2006–2010.
DARD (2010). Annual Report on the Analysing value chain of beef-cattle and cassava for South
Central Coastal Vietnam
General Statistics Office of Vietnam 2011. Statistical Yearbook 2010. Statistical Publishing House:
Hanoi.
KHPT (Khoahoc Pho Thong—Press Release Information Science) 2010. Problems facing cassava
production. At <http://www.khoahocphothong.com.vn /news/detail/4091/bai-toan-su-dung-khoai-
mi-san-xuat-nhien-lieu.html>, accessed 2 March 2015. [In Vietnamese]
Tran Tien Khai, Ho Cao Viet et al. (2011). Analysis of value chain of coconut in Ben Tre province
(project DPRP/2011). University of Economics of Hochiminh City (UEH).
Trần Tiến Khai, Hồ Cao Việt, Lê Văn Gia Nhỏ, Nguyễn Văn An (2012). Ước lượng tài chính của
chuỗi giá trị dừa Bến Tre (Financial estimation for coconut value chain in Ben Tre province) . Tạp
chí Phát triển Kinh tế (Economics Development Magazine). Số 265 (Volume 265). Trang 46–51
(page 46-51).


