Embed Size (px)
Citation preview

RESEARCH ARTICLE
CD39 Expression Identifies TerminallyExhausted CD8+ T CellsPrakash K. Gupta1,2☯, Jernej Godec1,3☯, David Wolski4☯, Emily Adland2, Kathleen Yates1,Kristen E. Pauken5, Cormac Cosgrove6, Carola Ledderose7, Wolfgang G. Junger7, SimonC. Robson8, E. JohnWherry5, Galit Alter6, Philip J. R. Goulder2, Paul Klenerman2, ArleneH. Sharpe3,9, Georg M. Lauer4, W. Nicholas Haining1,9,10*
1 Department of Pediatric Oncology, Dana-Farber Cancer Institute, Boston, Massachusetts, United States ofAmerica, 2 Peter Medawar Building for Pathogen Research, University of Oxford, Oxford, United Kingdom,3 Department of Microbiology and Immunobiology and Evergrande Center for Immunologic Diseases,Harvard Medical School and Brigham andWomen’s Hospital, Boston, Massachusetts, United States ofAmerica, 4 Gastrointestinal Unit, Massachusetts General Hospital and Harvard Medical School,Massachusetts, United States of America, 5 Department of Microbiology and Institute for Immunology,University of Pennsylvania Perelman School Medicine, Philadelphia, Pennsylvania, United States ofAmerica, 6 Ragon Institute of Massachusetts General Hospital, Harvard University and MassachusettsInstitute of Technology, Cambridge, Massachusetts, United States of America, 7 Department of Surgery,Beth Israel Deaconess Medical Center, Harvard Medical School, Boston, Massachusetts, United States ofAmerica, 8 Division of Gastroenterology, Department of Medicine, Beth Israel Deaconess Medical Center,Harvard University, Boston, Massachusetts, United States of America, 9 Broad Institute of MIT and Harvard,Cambridge, Massachusetts, United States of America, 10 Division of Hematology/Oncology, Children'sHospital, Harvard Medical School, Boston, Massachusetts, United States of America
☯ These authors contributed equally to this work.*[email protected]
AbstractExhausted T cells express multiple co-inhibitory molecules that impair their function and
limit immunity to chronic viral infection. Defining novel markers of exhaustion is important
both for identifying and potentially reversing T cell exhaustion. Herein, we show that the
ectonucleotidse CD39 is a marker of exhausted CD8+ T cells. CD8+ T cells specific for HCV
or HIV express high levels of CD39, but those specific for EBV and CMV do not. CD39
expressed by CD8+ T cells in chronic infection is enzymatically active, co-expressed with
PD-1, marks cells with a transcriptional signature of T cell exhaustion and correlates with
viral load in HIV and HCV. In the mouse model of chronic Lymphocytic Choriomeningitis
Virus infection, virus-specific CD8+ T cells contain a population of CD39high CD8+ T cells
that is absent in functional memory cells elicited by acute infection. This CD39high CD8+ T
cell population is enriched for cells with the phenotypic and functional profile of terminal
exhaustion. These findings provide a new marker of T cell exhaustion, and implicate the
purinergic pathway in the regulation of T cell exhaustion.
Author Summary
Chronic viral infection induces an acquired state of T cell dysfunction known as exhaus-tion. Discovering surface markers of exhausted T cells is important for both to identify
PLOS Pathogens | DOI:10.1371/journal.ppat.1005177 October 20, 2015 1 / 21
OPEN ACCESS
Citation: Gupta PK, Godec J, Wolski D, Adland E,Yates K, Pauken KE, et al. (2015) CD39 ExpressionIdentifies Terminally Exhausted CD8+ T Cells. PLoSPathog 11(10): e1005177. doi:10.1371/journal.ppat.1005177
Editor: Daniel C. Douek, Vaccine Research Center,UNITED STATES
Received: June 15, 2015
Accepted: August 30, 2015
Published: October 20, 2015
Copyright: © 2015 Gupta et al. This is an openaccess article distributed under the terms of theCreative Commons Attribution License, which permitsunrestricted use, distribution, and reproduction in anymedium, provided the original author and source arecredited.
Data Availability Statement: All relevant data arewithin the paper and its Supporting Information files.Raw microarray files are publicly available at http://www.ncbi.nlm.nih.gov/geo/query/acc.cgi?acc=GSE72752.
Funding: The author(s) received no specific fundingfor this work.
Competing Interests: The authors have declaredthat no competing interests exist.

exhausted T cells as well as to develop potential therapies. We report that the ectonucleoti-dase CD39 is expressed by T cells specific for chronic viral infections in humans and amouse model, but is rare in T cells following clearance of acute infections. In the mousemodel of chronic viral infection, CD39 demarcates a subpopulation of dysfunctional,exhausted CD8+ T cells with the phenotype of irreversible exhaustion. CD39 expressiontherefore identifies terminal CD8+ T cell exhaustion in mice and humans, and implicatesthe purinergic pathway in the regulation of exhaustion.
IntroductionIn acute infections, antigen-specific T cells differentiate into activated effector cells and theninto memory T cells which rapidly gain effector functions and re-expand on subsequentencounter with the same pathogen [1]. In contrast, during chronic infections, pathogen-spe-cific T cells gradually lose effector functions, fail to expand, and can eventually become physi-cally deleted [2]. These traits are collectively termed T cell exhaustion, and have been describedboth in animal models of chronic viral infection as well as in human infections with hepatitis Cvirus (HCV) and human immunodeficiency virus (HIV) [2–4]. Identifying reversible mecha-nisms of T cell exhaustion is therefore a major goal in medicine.
Prolonged or high-level expression of multiple inhibitory receptors such as PD-1, Lag3, andCD244 (2B4) is a cardinal feature of exhausted T cells in both animal models and human dis-ease [5–7]. Expression of PD-1 appears to be a particularly important feature of exhaustedCD8+ T cells, as the majority of exhausted cells in mouse models of chronic infection expressthis receptor, and blockade of the PD-1:PD-L1 axis can restore the function of exhausted CD8+
T cells in humans and mouse models [2,6]. However, in humans, many inhibitory receptorsalso can be expressed by a large fraction of fully functional memory CD8+ T cells. PD-1, forinstance, can be expressed by up to 60% of memory CD8+ T cells in healthy individuals, mak-ing it challenging to use PD-1 to identify exhausted CD8+ T cells in humans, particularly whenthe antigen-specificity of potentially exhausted CD8+ T cells is not known [8].
Studies in mice and humans suggest that exhausted CD8+ T cells are not a homogeneouspopulation, but instead include at least two subpopulations of T cells that differentially expressthe transcription factors T-bet and Eomesodermin (Eomes) [9–11]. T-bethigh CD8+ T cells rep-resent a progenitor subset with proliferative potential that give rise to Eomeshigh CD8+ T cells,which are terminally differentiated and can no longer proliferate in response to antigen or berescued by PD-1 blockade [9,12]. Both populations express PD-1, but Eomeshigh exhaustedcells express the highest levels of PD-1. However, no specific cell-surface markers of this termi-nally differentiated population of exhausted cells have thus far been identified.
CD39 (ENTPD1) is an ectonucleotidase originally identified as an activation marker onhuman lymphocytes and as the vascular ecto-ADPase [13], but has subsequently been shownto be a hallmark feature of regulatory T cells [14–16]. CD39 hydrolyzes extracellular ATP andADP into adenosine monophosphate, which is then processed into adenosine by CD73, anecto-5'-nucleotidase [17]. Adenosine is a potent immunoregulator that binds to A2A receptorsexpressed by lymphocytes causing accumulation of intracellular cAMP, preventing T cell acti-vation and NK cytotoxicity [18–20]. Loss of CD39 in Tregs markedly impairs their ability tosuppress T cell activation, suggesting that the juxtacrine activity of CD39 serves to negativelyregulate T cell function [15]. However, blood CD8+ T cells have generally been reported to beCD39– [14,21–23], and the expression of this marker on exhausted T cells has not beenexamined.
CD39 Expression Identifies Terminally Exhausted CD8+ T Cells
PLOS Pathogens | DOI:10.1371/journal.ppat.1005177 October 20, 2015 2 / 21

In this study, we demonstrate that, in contrast to CD8+ T cells from healthy donors, anti-gen-specific CD8+ T cells responding to chronic viral infection in humans and a mouse modelexpress high levels of biochemically active CD39. CD39+ CD8+ T cells co-express PD-1 and areenriched for a gene signature of T cell exhaustion. In the mouse model of chronic LCMV infec-tion, high levels of CD39 expression demarcate terminally differentiated virus-specific CD8+ Tcells within the pool of exhausted CD8+ T cells. Thus, CD39 provides a specific, pathologicalmarker of exhausted CD8+ T cells in chronic viral infection in humans and mouse models ofchronic viral infection.
Results
CD39 is expressed by CD8+ T cells responding to chronic infectionWe surveyed the expression of CD39 by CD8+ T cells from healthy adult subjects withoutchronic viral infection. Consistent with previous reports we found that only a small fraction(mean 6%) of CD8+ T cells in healthy individuals expressed CD39 (Fig 1A and 1B) [14,21–23].This small population of CD39+ CD8+ T cells in healthy donors was primarily found in thecentral and effector memory compartments while virtually no naive CD8+ T cells expressedCD39 (S1 Fig). We next focused on CD39 expression by antigen-specific CD8+ T cells specificfor latent viruses in healthy subjects and found that only a very small fraction of CMV- orEBV-specific CD8+ T cells expressed CD39 (Fig 1A and 1B) (mean 3% and 7% respectively).
We next measured CD39 expression by T cells specific for the chronic viral pathogens HCVand HIV. We measured CD39 expression in 57 subjects with acute HCV infections (23 withacute resolving infection and 34 with chronically evolving infection), and in 40 subjects withHIV infection (28 chronic progressors and 12 controllers; clinical characteristics of the subjectsare summarized in S1 Table). We found a mean of 51% of HCV-specific CD8+ T cells and 31%of HIV-specific CD8+ T cells expressed CD39, a number significantly higher than CD8+ T cellsspecific for EBV or CMV, or in total CD8+ T cell populations from healthy individuals (Fig 1Aand 1B). A slightly greater fraction of virus-specific CD8+ T cells from HCV-infected subjectsexpressed CD39 than did those from HIV-infected subjects.
In subjects with chronic infection, the frequency of CD39-expressing cells in the virus-spe-cific (tetramer+) CD8+ T cell population was significantly higher than in the total CD8+ T cellpopulation (Fig 1C and 1D). However the fraction of total CD8+ T cells expressing CD39 inthe CD8+ T cell compartment of individuals with HCV or HIV infection was slightly increasedcompared to healthy controls (Fig 1E), consistent with the presence of other, unmeasuredvirus-specific CD8+ T cells that were also CD39+ in the tetramer−fraction of CD8+ T cells.Thus CD39 is expressed infrequently by CD8+ T cells in healthy donors, but marks a large frac-tion of pathogen-specific cells CD8+ T cells in patients with chronic infection.
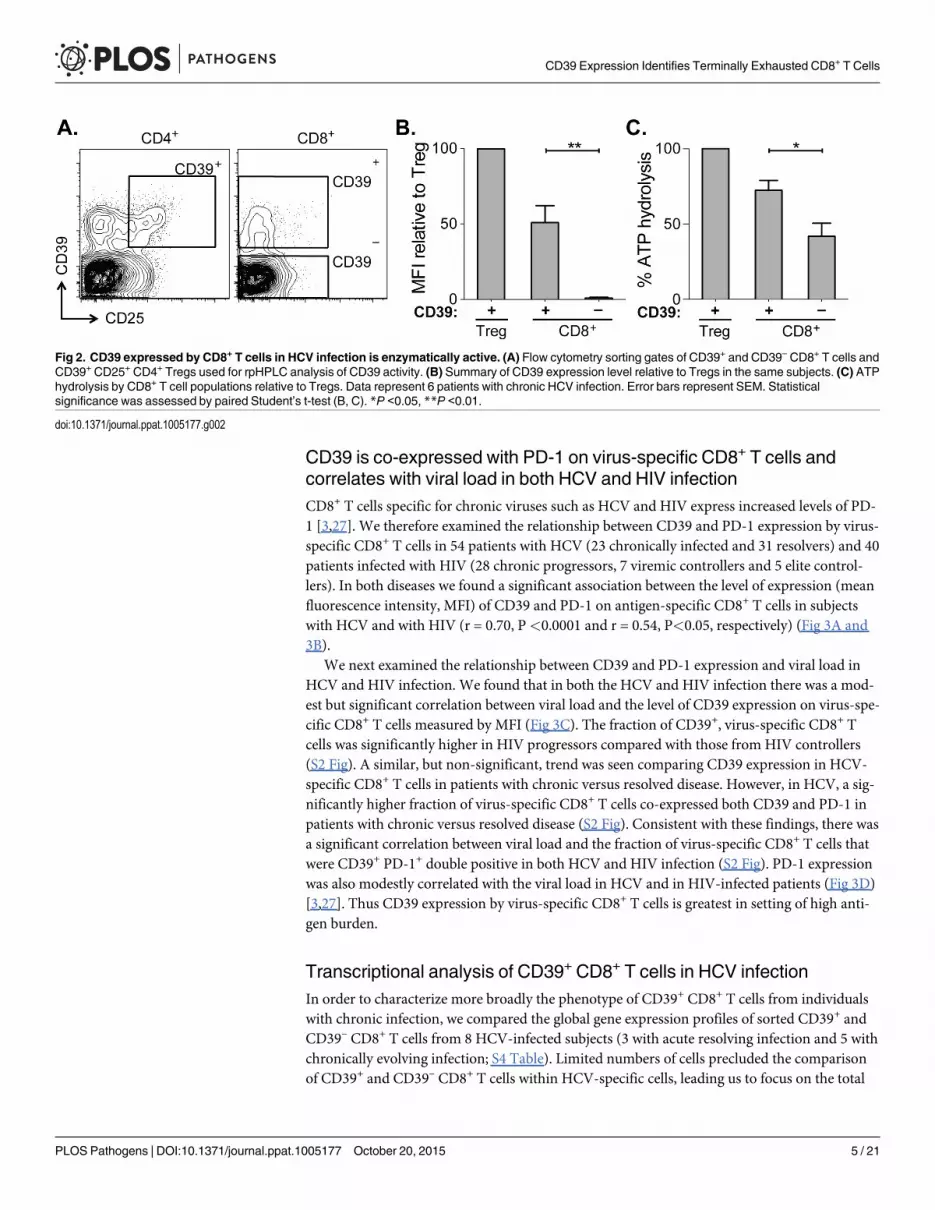
CD39 expressed by CD8+ T cells hydrolyzes ATPCD39 expressed by regulatory T cells catalyzes the hydrolysis of ADP to 5’-AMP [14–16] butits enzymatic activity can be regulated by a range of post-transcriptional mechanisms [PMID.We therefore tested CD39 expressed by CD8+ T cells from patients infected with chronic HCVwas functional using ATP hydrolysis as a surrogate marker of CD39 activity [24–26]. Wesorted CD39– and CD39+ CD8+ T cells from six HCV-infected individuals (four with chronicinfection and two with resolved infection) and incubated equal numbers of cells in the presenceof extracellular ATP (eATP). Remaining levels of eATP were measured in the supernatant byHPLC. As a control, we assessed ATP hydrolysis by CD4+ CD25+ CD39+ regulatory T cells(Tregs) sorted from the same individuals (Fig 2A).
CD39 Expression Identifies Terminally Exhausted CD8+ T Cells
PLOS Pathogens | DOI:10.1371/journal.ppat.1005177 October 20, 2015 3 / 21

Within the CD39+ CD8+ T cell population the level of CD39 expression was lower than inTregs (Fig 2B). Consistent with reduced CD39 expression relative to Tregs, ATP hydrolysis byCD39+ CD8+ T cells was less than that by Tregs (Fig 2C). However ATP hydrolysis by CD39+
CD8+ T cells was significantly greater than that of CD39– cells (Fig 2C). Thus CD39 expressedby CD8+ T cells in HCV infection is enzymatically active and capable of hydrolyzing ATP.
Fig 1. CD39 is highly expressed by virus-specific CD8+ T cells in chronic viral infection. (A) Expression of CD39 by virus-specific CD8+ T cells. Plotsare gated on CD8+. (B) Fraction of total or antigen-specific CD8+ T cells expressing CD39. (C, D) Comparison of CD39 expression by total CD8+ T cells withvirus-specific CD8+ T cells from patients with HCV (C) and HIV (D) infections. (E) Fraction of total CD8+ T cells expressing CD39 in healthy, HIV or HCVinfected donors. Error bars represent SEM. Statistical significance was assessed by Kruskal-Wallis test (B, E), or Wilcoxon test (C, D). *P <0.05, ***P<0.001, ****P <0.0001.
doi:10.1371/journal.ppat.1005177.g001
CD39 Expression Identifies Terminally Exhausted CD8+ T Cells
PLOS Pathogens | DOI:10.1371/journal.ppat.1005177 October 20, 2015 4 / 21
CD39 is co-expressed with PD-1 on virus-specific CD8+ T cells andcorrelates with viral load in both HCV and HIV infectionCD8+ T cells specific for chronic viruses such as HCV and HIV express increased levels of PD-1 [3,27]. We therefore examined the relationship between CD39 and PD-1 expression by virus-specific CD8+ T cells in 54 patients with HCV (23 chronically infected and 31 resolvers) and 40patients infected with HIV (28 chronic progressors, 7 viremic controllers and 5 elite control-lers). In both diseases we found a significant association between the level of expression (meanfluorescence intensity, MFI) of CD39 and PD-1 on antigen-specific CD8+ T cells in subjectswith HCV and with HIV (r = 0.70, P<0.0001 and r = 0.54, P<0.05, respectively) (Fig 3A and3B).
We next examined the relationship between CD39 and PD-1 expression and viral load inHCV and HIV infection. We found that in both the HCV and HIV infection there was a mod-est but significant correlation between viral load and the level of CD39 expression on virus-spe-cific CD8+ T cells measured by MFI (Fig 3C). The fraction of CD39+, virus-specific CD8+ Tcells was significantly higher in HIV progressors compared with those from HIV controllers(S2 Fig). A similar, but non-significant, trend was seen comparing CD39 expression in HCV-specific CD8+ T cells in patients with chronic versus resolved disease. However, in HCV, a sig-nificantly higher fraction of virus-specific CD8+ T cells co-expressed both CD39 and PD-1 inpatients with chronic versus resolved disease (S2 Fig). Consistent with these findings, there wasa significant correlation between viral load and the fraction of virus-specific CD8+ T cells thatwere CD39+ PD-1+ double positive in both HCV and HIV infection (S2 Fig). PD-1 expressionwas also modestly correlated with the viral load in HCV and in HIV-infected patients (Fig 3D)[3,27]. Thus CD39 expression by virus-specific CD8+ T cells is greatest in setting of high anti-gen burden.
Transcriptional analysis of CD39+ CD8+ T cells in HCV infectionIn order to characterize more broadly the phenotype of CD39+ CD8+ T cells from individualswith chronic infection, we compared the global gene expression profiles of sorted CD39+ andCD39– CD8+ T cells from 8 HCV-infected subjects (3 with acute resolving infection and 5 withchronically evolving infection; S4 Table). Limited numbers of cells precluded the comparisonof CD39+ and CD39– CD8+ T cells within HCV-specific cells, leading us to focus on the total
Fig 2. CD39 expressed by CD8+ T cells in HCV infection is enzymatically active. (A) Flow cytometry sorting gates of CD39+ and CD39– CD8+ T cells andCD39+ CD25+ CD4+ Tregs used for rpHPLC analysis of CD39 activity. (B) Summary of CD39 expression level relative to Tregs in the same subjects. (C) ATPhydrolysis by CD8+ T cell populations relative to Tregs. Data represent 6 patients with chronic HCV infection. Error bars represent SEM. Statisticalsignificance was assessed by paired Student’s t-test (B, C). *P <0.05, **P <0.01.
doi:10.1371/journal.ppat.1005177.g002
CD39 Expression Identifies Terminally Exhausted CD8+ T Cells
PLOS Pathogens | DOI:10.1371/journal.ppat.1005177 October 20, 2015 5 / 21

Fig 3. CD39 expression correlates with PD-1 expression and viral load in chronic viral infection. (A)CD39 and PD-1 expression in chronic HCV (left) or HIV infection (right). Representative plots demonstratetotal (gray) and virus-specific (red) CD8+ T cells. (B) Correlation between CD39 and PD-1 expression byHCV- (left) and HIV-specific (right) CD8+ T cells. (C) Correlation between CD39 expression by virus-specificCD8+ T cells and viral load count in HCV (left) or HIV (right) infection. (D) Correlation between PD-1expression by virus-specific CD8+ T cells and viral load in HCV (left) or HIV (right) infection. Correlation wasassessed by Pearson correlation coefficient (B, C, D). MFI; mean fluorescence intensity.
doi:10.1371/journal.ppat.1005177.g003
CD39 Expression Identifies Terminally Exhausted CD8+ T Cells
PLOS Pathogens | DOI:10.1371/journal.ppat.1005177 October 20, 2015 6 / 21

CD8+ population of antigen-experienced CD8+ T cells (S4 Table). Because naive CD8+ T cellsexpress little CD39 (S1 Fig), we excluded this population from the sorted cells (S3 Fig) to enabledirect comparison of antigen-experienced CD39+ and CD39– CD8+ T cells.
We first used unbiased clustering approaches to identify whether CD39+ and CD39– CD8+
T cells showed distinct patterns of gene expression. Analysis of gene expression profiles usingconsensus hierarchical clustering (Fig 4A) showed two distinct clusters of samples that
Fig 4. Transcriptional analysis of CD39+ and CD39– CD8+ T cells in HCV infection. (A) Consensus hierarchical clustering of expression profiles fromCD39+ (black) and CD39– (grey) CD8+ T cells from 8 HCV infected patients. Clustering is based on the top 10% of genes by variance across the dataset.Sample similarity (1-Pearson correlation coefficient) is annotated with color from low (white) to high (green). (B)Gene set enrichment map displaying GeneOntology gene sets enriched (FDR < 0.1) in CD39+ CD8+ T cells from (A). Nodes (in red) are sized in proportion to gene set size; connecting line thicknessrepresents extent of gene member overlap between gene sets. (C)Gene set enrichment analysis of a signature of 200 genes up-regulated in exhaustedCD8+ T cells from the mouse model of chronic viral infection versus acute infection (day 30 post infection) in the ranked list of genes differentially expressedby CD39+ vs. CD39– CD8+ T cells. Leading edge genes are indicated by orange symbols. (D) Volcano plot of all genes (grey) or exhausted leading edgegenes (orange) from (C).
doi:10.1371/journal.ppat.1005177.g004
CD39 Expression Identifies Terminally Exhausted CD8+ T Cells
PLOS Pathogens | DOI:10.1371/journal.ppat.1005177 October 20, 2015 7 / 21

corresponded almost exactly to CD39+ and CD39– populations, suggesting that that in bothacute and chronic infection, CD39 expression demarcates two types of CD8+ T cells withmarkedly different patterns of gene expression. Supervised analysis of differential gene expres-sion identified 619 genes differentially expressed (FDR<0.15) between CD39+ and CD39–
CD8+ T cells (S4 Table). Inspection of the list of differentially expressed genes revealed manywith known roles in CD8+ T cell biology including increased expression of the inhibitoryreceptors PD-1 and CTLA-4 in CD39+ CD8+ T cells.
To identify biological processes that were differentially active in CD39+ vs. CD39– cells, weperformed gene set enrichment analysis using the Gene Ontology collection of gene sets [28].We found no significant enrichment of GO terms in the CD39– CD8+ subset. In contrast, 21gene sets significantly enriched (FDR<0.1) in CD39+ population, almost all of which wererelated to mitosis and cell-cycle associated genes or cytoskeleton organization (Fig 4B). Thissuggests that CD39+ CD8+ T cells in chronic viral infection show coordinate up-regulation ofgenes related to proliferation.
The expression of CD39 by CD8+ T cells in chronic but not acute/latent infection, suggeststhat it may be a marker of T cell exhaustion. We therefore tested whether the profile of CD39+
CD8+ T cells was enriched for genes expressed by exhausted CD8+ cells. Previous studies ofgene expression in CD8+ T cells in the mouse model of chronic viral infection with the Clone13 strain of LCMV have identified signatures of T cell exhaustion that are also enriched inexhausted CD8+ T cells in humans [29–31]. We therefore curated a signature of 200 genes up-regulated by exhausted CD8+ T cells responding to chronic infection relative to functionalmemory CD8+ T cells generated by acute infection (LCMV Armstrong strain). We found thatthe exhausted CD8+ T cell signature from LCMVmodel was significantly enriched in CD39+
vs. CD39– CD8+ T cells in subjects with HCV infection (Fig 4C). We focused on the “leadingedge” genes contributing most to the enrichment [32], which correspond to genes up-regulatedboth in the mouse exhausted signature and in the human CD39+ profile. As expected, the lead-ing edge genes included PD-1 (PDCD1), a feature of both human CD39+ CD8+ T cells and ofexhausted CD8+ T cells in the mouse model (Fig 4D). In addition we found that up-regulationof many genes associated with proliferation including BUB1, TOP2A andMKI67 was commonto mouse exhausted CD8+ T cells and human CD39+ CD8+ T cells. Thus CD39+ CD8+ T cellsin HCV infection and exhausted CD8+ T cells in a mouse model of chronic infection sharetranscriptional features that include genes related to proliferation.
CD39 is increased in exhausted CD8+ T cells in the mouse model ofchronic LCMV infectionBecause the mouse signature of CD8+ T cell exhaustion was significantly enriched in the tran-scriptional profile of CD39+ CD8+ T cells in HCV-infected patients, we next asked if CD39 wasup-regulated by CD8+ T cells in the mouse model of chronic viral infection. To address thisquestion we compared two well-described mouse models of viral infection using two strains ofLCMV: LCMV Armstrong that causes an acute infection that is resolved in up to 8 days; andLCMV Clone 13 that persists in mice for up to 3 months and leads to T cell exhaustion [5,6].
We measured CD39 expression and compared it to PD-1 expression in CD8+ T cellsresponding to each infection. While naive CD8+ T cells expressed neither CD39 nor PD-1 (Fig5A), both were rapidly and coordinately up-regulated by antigen-experienced cells followingeither infection (day 7 post infection [d7 p.i.], Fig 5B). However, in acute infection, the fractionof CD39 bright PD-1+ population decreased with time. In contrast, high expression of CD39and PD-1 was maintained in Clone 13 infection. The accumulation of CD39 bright PD-1+ cells
CD39 Expression Identifies Terminally Exhausted CD8+ T Cells
PLOS Pathogens | DOI:10.1371/journal.ppat.1005177 October 20, 2015 8 / 21

Fig 5. CD39 is highly up-regulated by exhausted CD8+ T cells in a mousemodel of chronic infection. (A, B) Expression of CD39 and PD-1 by CD44–
naive mouse CD8+ T cells (A) and in CD8+ T cells at indicated times following LCMV Armstrong (acute) or Clone 13 (chronic) infection (B). Representativeplots show total (black) and H-2Db GP276-286 tetramer-specific CD8+ T cells (red). Summary of results in 5 mice per group is shown in bar-graphs on the right.Statistical significance was assessed with Mann-Whitney test. *P < 0.5, **P < 0.01.
doi:10.1371/journal.ppat.1005177.g005
CD39 Expression Identifies Terminally Exhausted CD8+ T Cells
PLOS Pathogens | DOI:10.1371/journal.ppat.1005177 October 20, 2015 9 / 21

among the total CD8+ population was most apparent in the H-2Db GP276-286 tetramer-specificCD8+ T cells (Fig 5B).
Thus after chronic viral infection, antigen-specific CD8+ T cells can be identified by highexpression of both CD39 and PD-1. This difference in expression of both markers betweenchronic and acute infection is noticeable as early as d7 p.i. but becomes more pronounced withtime after infection.
CD39 expression correlates with a terminally exhausted phenotype invirus-specific CD8+ T cells in chronic infectionHaving determined that high, persistent expression of CD39 is a feature of LCMV-specificCD8+ T cells during chronic LCMV infection, we next sought to further characterize the phe-notype of CD39+ CD8+ T cells during Clone 13 infection. We analyzed CD39 expression inantigen-experienced, CD44+ CD8+ T cells and found that mice infected with Clone 13 devel-oped a population of cells with particularly high expression of CD39 (CD39high). This popula-tion was entirely absent in mice infected with the acute LCMV Armstrong strain at d35 p.i.,which only exhibited the presence of intermediate levels of CD39 staining (CD39int) (Fig 6A).Further characterization of the two sub-populations in Clone 13 infected mice revealed thatthe CD39high cells showed more down-regulation of CD127 (Fig 6B) and higher expression ofPD-1 (Fig 6C) than did the CD39int population.
Because the highest levels of PD-1 are characteristic of terminally exhausted CD8+ T cells inchronic infection [12,33], we tested whether CD39high T cells in chronic infection showedother phenotypic characteristics of terminal exhaustion. Analysis of expression of two addi-tional co-inhibitory receptors, CD244 (2B4) and Lag3, showed that a significantly higher frac-tion of CD39high cells co-expressed multiple receptors, consistent with terminal exhaustion. Incontrast, CD39int CD8+ T cells were generally negative for all three receptors analyzed (Fig 6Dand 6E). We next examined the expression of the transcription factors T-bet and Eomes. Wefound that the CD39high subset of CD8+ T cells was comprised primarily of Eomeshigh T-betlow
terminally exhausted phenotype, while the CD39int CD8+ T cells showed a comparable distri-bution of both (Fig 6F). Similarly, we found that in CD8+ T cells from subjects with eitherHCV or HIV infection, the CD39+ CD8+ T cell compartment contained a significantly higherratio of Eomeshigh T-betlow: Eomeslow T-bethigh relative to CD39– CD8+ T cells (S4 Fig). Thusin both humans and mice with chronic viral infection, CD39+ CD8+ T cells show a phenotypeconsistent with previous descriptions of terminal exhaustion [9].
CD39 correlates with reduced functionality in virus-specific CD8+ T cellsin chronic infectionWe next examined the functional properties of CD39high and CD39int CD8+ T cells from micewith chronic LCMV infection. Co-production of cytokines IFN-γ and TNFα is a featureof virus-specific T cells responding to acute infection and in the early stages of chronic infec-tion but is progressively lost as exhaustion evolves [2]. To compare the functionality ofCD39high and CD39int virus-specific CD8+ T cells, we isolated CD8+ T cells from mice withchronic infection at d35 post-infection and stained for IFN-γ and TNFα following in vitrostimulation with GP33-41 peptide. We found a significantly smaller fraction of antigen-specificcoproduced IFN-γ and TNFα in CD39high CD8+ T cells compared to CD39int CD8+ T cells(Fig 7A and 7B).
To confirm this finding, we analyzed the function of transferred P14 CD8+ T cells in chronicinfection. The P14 TCR transgene recognizes the GP33-41 peptide of LCMV presented on H-2Db. We found that both the frequency of IFN-γ-producing and IFN-γ/TNFα co-producing
CD39 Expression Identifies Terminally Exhausted CD8+ T Cells
PLOS Pathogens | DOI:10.1371/journal.ppat.1005177 October 20, 2015 10 / 21

P14 T cells was significantly lower in CD39high CD8+ T cells compared to CD39int CD8+ T cells(Fig 7C and 7D). The defect in cytokine secretion was not only observed in terms of the fre-quency of cytokine-secreting cells, but also in the amount of cytokine detected per cell. Evenamong cells that did secrete IFN-γ, we found the MFI of expression to be significantly lower inCD39high CD8+ T cells compared to CD39int CD8+ T cells (Fig 7E and 7F). Thus high levels ofCD39 expression demarcate a population of exhausted cells with the poorest function inchronic infection.
Fig 6. CD39 identifies terminally exhausted CD8+ T cells in mice with chronic LCMV infection. (A) Expression of CD39 and CD44+ by mouse CD8+ Tcells 30–35 days following LCMV Armstrong (left) or Clone 13 (right) infection. (B, C) Representative histograms (left) of CD127 (B) and PD-1 (C) expressionby CD39high and CD39int CD8+ T cells from Clone 13 (red and blue, respectively) and CD39int from Armstrong (filled gray) infected mice on d35 p.i. (left).Fraction of CD127+ (B) and MFI of PD-1 in PD-1+ cells (C) is shown on the right. Results are from 5 mice. (D) Fraction of CD39high and CD39int CD44+ CD8+ Tcells expressing different combinations of co-inhibitory receptors PD-1, 2B4, and Lag3. (E) Average number of co-inhibitory receptors expressed by CD39int
(left) or CD39high (right) CD8+ T cells at d35 p.i. following LCMVClone 13 infection. (F) Representative plots of T-bet and Eomes expression in CD39int (left)and CD39high (right) cells as in (A). Summary of results is shown on the right. Data are representative of three experiments of 5 mice per group. Statisticalsignificance was assessed with Student’s t-test (B, C, F) with Holm-Sidak multiple comparison correction (D). **P < 0.01, ****P < 0.0001.
doi:10.1371/journal.ppat.1005177.g006
CD39 Expression Identifies Terminally Exhausted CD8+ T Cells
PLOS Pathogens | DOI:10.1371/journal.ppat.1005177 October 20, 2015 11 / 21

DiscussionThe state of CD8+ T cell exhaustion is characterized by widespread changes in gene expressionrelative to functional memory CD8+ T cells [5]. However, in humans, identification of specificT cell exhaustion markers that are not shared by more functional CD8+ T cell populations hasbeen challenging [8]. We show that high-level expression of the ectonucleotidase CD39 is char-acteristic of CD8+ T cells specific for chronic viral infections in humans and mice, but is other-wise rare in the CD8+ T cell compartment of healthy donors. Persistent, high-level expressionis also seen in the LCMVmouse model of chronic viral infection, suggesting that CD39 expres-sion is a phenotypic marker of CD8+ T cell exhaustion. Moreover, within the exhausted popu-lation in the mouse model, CD39high CD8+ T cells express the highest levels of PD-1, co-express multiple inhibitory receptors and have profoundly impaired function. We found thatin both mice and humans, CD39 is expressed preferentially by CD8+ T cells that are T-betlow/Eomeshigh. These data suggest that CD39 expression by CD8+ T cells is a pathological findingand demarcates the population of CD8+ T cells previously identify as being terminallyexhausted [9].
The fact that peripheral blood CD8+ T cells in humans can express CD39 is surprising. Pre-vious data have shown that CD39 expression is restricted to CD4+ regulatory T cells, Th17cells, and small populations of regulatory-like CD8+ T cells [14,21–23]. Indeed, we find that inthe bulk population of CD8+ T cells in healthy donors only a small minority of CD8+ T cellsexpresses CD39. However, CD39 is abundantly expressed by virus-specific CD8+ T cells in twohuman chronic infections (HIV and HCV). This helps explain why CD39+ CD8+ T cells havenot been appreciated in earlier studies that have focused on healthy individuals, and suggeststhat, in steady-state conditions, the expression of CD39 by CD8+ T cells is a pathological occur-rence that is related to the development of T cell exhaustion. Whether the small fraction of
Fig 7. Terminally exhausted CD8+ T cells marked by high levels of CD39 are most impaired in their effector function. (A) Representative plotsshowing the production of IFN-γ and TNFα in CD39int or CD39high CD8+ T cells 36 days following LCMVClone 13 infection. (B) Quantification of cells in (A)that produce both TNFα and IFN-γ relative to IFN-γ only. (C, D) Cytokine production by P14 cells (C) gated from an infection as in (A) and summary of IFN-γand TNFα producing cells. (E, F) Mean fluorescence intensity (MFI) of IFN-γ in IFN-γ positive endogenous (E) and transferred P14 cells (F). Statisticalsignificance was assessed with paired Student’s t-test. *P < 0.05, **P < 0.01, ***P < 0.001, ****P < 0.0001.
doi:10.1371/journal.ppat.1005177.g007
CD39 Expression Identifies Terminally Exhausted CD8+ T Cells
PLOS Pathogens | DOI:10.1371/journal.ppat.1005177 October 20, 2015 12 / 21

CD8+ T cells expressing CD39 in healthy donors represents acutely activated CD8+ T cells, orthose exhausted by asymptomatic chronic pathogens or inflammatory signals is an importantquestion for future studies.
Several features of CD39-expressing CD8+ T cells suggest that CD39 is a diagnostically valu-able marker of T cell exhaustion. First, in both human and mouse CD8+ T cells responding tochronic infection, CD39 is co-expressed with PD-1, an inhibitory receptor expressed by themajority of exhausted T cells [5,6]. Second, CD39 expression correlates with viral load in sub-jects with HIV and HCV infection suggesting that the conditions of high levels of inflammationand antigen load that lead to exhaustion also increase CD39 expression in the virus-specificpool of CD8+ T cells, as has been observed for PD-1 [3,34]. Third, gene signatures characteris-tic of exhausted mouse CD8+ T cells are enriched in CD39+ cells relative to CD39– CD8+ Tcells in subjects with HCV infection, underscoring the association between CD39 expressionand T cell exhaustion. Finally, chronic LCMV infection in the mouse model increases CD39expression by exhausted virus-specific CD8+ T cells, and elicits a population of CD39high cellsthat are absent in functional memory cells. Previous studies show that CD39, like PD-1, is tran-siently up-regulated by acute T cell activation [14,35]. Additional studies will therefore berequired to determine the extent to which T cell activation (rather than exhaustion per se) con-tributes to the up-regulation of CD39 and PD-1 in chronic infection. However, the strong asso-ciation between CD39 expression and the hallmark phenotypic features of T cell exhaustion inhumans and a mouse model suggests that it can serve as a valuable marker of the exhausted Tcells state.
The expression of molecules, such as PD-1, that inhibit T cell function has been used toidentify exhausted CD8+ T cells in several studies of human chronic infection and cancer [2].However, there are important distinctions between the pattern of CD39 expression and thatof inhibitory receptors. Many inhibitory receptors, such as PD-1 [3,8,36] and CD244 [37,38]are also expressed by a substantial fraction of CD8+ T cells in healthy donors that are notexhausted. In contrast, CD39 expression is found in only a very small minority of CD8+ T cellsfrom healthy donors. This expression pattern suggests that CD39 expression, particularly incombination with PD-1, may be useful as a more specific phenotype of exhausted CD8+ T cells,at least in HCV and HIV infection. In addition, CD39 may provide a useful marker to isolateexhausted CD8+ T cells in settings such as tumor-specific responses where very few reagentsare available to identify antigen-specific T cells. Importantly, while CD39 is rare in the CD8+
compartment in healthy donors, it is expressed by CD4+ Tregs–as is PD-1 –making it difficultto distinguish between exhausted CD4+ T cells and Tregs by CD39 expression alone.
Analysis of global expression profiles of CD39+ versus CD39– CD8+ T cells in HCV-infectedsubjects showed that the CD39+ fraction was strongly enriched for genes related to prolifera-tion. This may at first seem counterintuitive, given the functional defects that have beendescribed in exhausted CD8+ T cells [2,5]. However, data from the mouse model of chronicinfection suggest that, unlike memory CD8+ T cells, exhausted CD8+ T cells are dependent oncontinuous exposure to viral antigen to ensure their survival and undergo extensive cell divi-sion at a rate higher than that seen in physiological homeostatic proliferation of the memoryCD8+ T cell pool [39]. Exhausted CD8+ T cells therefore have a paradoxical increase in theirproliferation in vivo despite reduced proliferative potential in vitro [40], explaining theincreased expression of proliferation-associated genes in CD39+ CD8+ T cells in HCV infectionand in mouse exhausted CD8+ T cells [9,41].
Recent studies of exhausted CD8+ T cells have revealed that two distinct states of virus-spe-cific CD8+ T cells exist in chronically infected mice and humans [9,10]. Differential expressionof the T-box transcription factors T-bet and Eomes characterize two populations, which form aprogenitor-progeny relationship. T-bethigh cells display low intrinsic turnover but are capable
CD39 Expression Identifies Terminally Exhausted CD8+ T Cells
PLOS Pathogens | DOI:10.1371/journal.ppat.1005177 October 20, 2015 13 / 21

of proliferation in response to persisting antigen, giving rise to Eomeshigh terminal progeny. Incontrast, Eomeshigh CD8+ T cells responding to chronic infection had reduced capacity toundergo additional proliferation in vivo. The T-betlow /Eomeshigh exhausted subset of CD8+ Tcells correspond to the PD-1 bright population that has also been shown to be unresponsive toPD-1:PD-L1 blockade. These data suggest that the differential expression of these transcriptionfactors identifies subpopulations of exhausted CD8+ T cells with fundamentally different fatesand functional profiles. Our data show that in the LCMVmouse model of chronic infectionand in HIV infection, the CD39high subset of CD8+ T cells demarcates T-betlow /Eomeshigh
cells. Consistent with this, CD39+ CD8+ T cells in the mouse model express the highest levelsof PD-1, co-express multiple inhibitory receptors and show marked functional defects. Thesefindings suggest that CD39 may be a marker not only of the exhausted state, but specifically ofthe most terminally exhausted cells, at least in the mouse model. Additional studies of the fateof transferred CD39+ vs. CD39– exhausted CD8+ T cells in the mouse model, and broader sur-veys of CD39 expression in human chronic infections will be required to determine whetherthis marker can be used as a surrogate for terminal exhaustion. However, the strong associationbetween CD39 expression and the key features of terminal exhaustion suggests that it mayprove a useful marker to help distinguish between "reversible" and "irreversible" T cell exhaus-tion. Moroever, the fact that isolating CD39+ cells does not require intracellular staining (as isrequired for T-bet and Eomes) makes this marker useful for studying the function of this termi-nally exhausted cells ex vivo.
The fact that CD39 is expressed by a slightly larger fraction of HCV-specific CD8+ T cellsthan HIV-specific CD8+ T cells may be related to differences in the timing of blood samplingduring the course of infection, or may be due to differences in the extent of antigen-load andinflammation in the two infections. Alternatively, it may be consistent with a model in whichHCV-specific CD8+ T cells are in a more “terminal” state of exhaustion than CD8+ T cells spe-cific for HIV. This possibility is supported by profound loss of HCV-specific CD8+ T cells overthe course of chronic infection [42] that is not seen in the HIV-specific CD8+ T cell pool, con-sistent with the clonal deletion seen in mouse models of extreme CD8+ T cell exhaustion[43,44]
It is tempting to speculate that expression of CD39 contributes to the dysfunction ofexhausted T cells [45]. For instance, the expression of CD39 might enable CD8+ T cells to pro-vide negative regulation in an autocrine or juxtacrine fashion via adenosine [18–20] in thesame manner as Tregs [15,35]. The fact that CD39 requires both a substrate (ATP) and adownstream enzyme (CD73) to generate adenosine could provide a mechanism to ensure thatthis negative signaling occurred only in certain contexts such as in inflamed, damaged tissueswhere the extracellular concentrations of ATP are high and CD73-expressing cells are present[46]. Moreover, CD39-expressing CD8+ T cells may contribute to the general inhibitory milieuby contributing to the inhibition of activated T cells that express the adenosine receptor but arenot yet exhausted. It will therefore be important to determine whether inhibition of CD39activity could provide an additional therapeutic strategy to rescue the function of exhausted Tcells.
Materials and Methods
Human SubjectsHealthy human donors were recruited at the Kraft family Blood Donor Center, Dana-FarberCancer Institute. All human subjects with HCV infection were recruited at the GastrointestinalUnit and the Department of Surgery of the Massachusetts General Hospital (Boston, MA) (S1Table).
CD39 Expression Identifies Terminally Exhausted CD8+ T Cells
PLOS Pathogens | DOI:10.1371/journal.ppat.1005177 October 20, 2015 14 / 21

Individuals with chronic HCV infection (n = 82) were defined by positive anti-HCV anti-body and detectable viral load. Patients with spontaneous clearance of HCV, termed resolvers(n = 30), were defined by positive anti-HCV antibody but an undetectable viral load for at least6 months. The estimated time of infection was calculated either using the exposure date or thetime of onset of symptoms and peak ALT (which are assumed to be 7 weeks post infection). AllHCV patients were treatment naive and studied at 5.9 and 219.7 weeks post infection. HCVRNA levels were determined using the VERSANT HCV RNA 3.0 (bDNA 3.0) assay (BayerDiagnostics).
All HIV infected subjects (n = 40) were recruited at the Ragon Institute at the MassachusettsGeneral Hospital (Boston, USA) or the Peter Medawar Building for Pathogen Research(Oxford, UK) (S2 Table). HIV controllers included elite controllers (n = 5) defined as havingHIV RNA below the level of detection (<75 viral copies per ml) and viremic controllers (n = 7)with HIV RNA levels< 2,000 viral copies per ml. HIV chronic progressors (n = 28) weredefined as having> 2,000 viral copies per ml. All subjects were off therapy. Viral load duringchronic infection was measured using the Roche Amplicor version 1.5 assay.
MHCClass I TetramersMajor histocompatibility complex (MHC) class I HIV Gag-specific tetramers were producedas previously described [47] or obtained from Proimmune. CMV- and EBV-specific MHCclass I dextramers conjugated with FITC and APC were purchased from Immudex. MouseMHC class I tetramers of H-2Db complexed with LCMV GP276-286 were produced as previ-ously described [48,49]. Biotinylated complexes were tetramerized using allophycocyanin-con-jugated streptavidin (Molecular Probes). The complete list of multimers can be found insupplemental materials (S3 Table).
Antibodies and flow cytometryThe following anti-human (hu) and anti-mouse (m) fluorochrome-conjugated antibodies wereused for flow cytometry: huCD8α (RPA-T8), huCD4 (OKT4), huCD3 (OKT3), huCD39 (A1),huPD-1 (EG12.2H7), huCD25 (BC96), huCCR7 (G043H7), huCD45RA (HI100), huT-bet(4B10), mCD8α (53–6.7), mCD4 (GK1.5), mCD3 (145-2C11), mCD244.2 (m2B4 (B6)458.1),mPD-1 (RMP1-30), mLag3 (C9B7W), mCD44 (IM7), mCD127 (A7R34), mTNFα (MP6XT22) (all from Biolegend), mT-bet (04–46; BD Pharmingen), mCD39 (24DMS1), mIFN-γ(XMG1.2), huEomes (WD1928) and mEomes (Dan11mag) (eBioscience). Intracellular stain-ing was performed following surface staining and fixed and permeabilized using the FoxP3/Transcription Factor Staining Buffer Set (eBioscience). Cells were sorted by BD FACS ARIA IIand all other analyses were performed on BD LSR II and BD LSR Fortessa flow cytometersequipped with FACSDiva v6.1. Gates were set using Full Minus One (FMO) controls. Datawere analyzed using FlowJo software v9.8 (Treestar).
For intracellular cytokine analysis of mouse T cells, 2x10⁶ splenocytes were cultured in thepresence of GP33-41 peptide (0.2 μg/ml) (sequence KAVYNFATM), brefeldin A (BD), andmonensin (BD) for 4.5 hours at 37°C. Following staining for surface antigens, cells were per-meabilized and stained for intracellular cytokines with the Cytofix/Cytoperm kit according tomanufacturer's instructions (BD Biosciences).
Mice and infectionsWild-type C57BL/6J mice were purchased from The Jackson Laboratory. Female mice (6–8weeks old) were infected with 2 x 10⁵ plaque forming units (p.f.u.) of LCMV-Armstrong intra-peritoneally or 4 x 10⁶ p.f.u. of LCMV-Clone 13 intravenously and analyzed at indicated time
CD39 Expression Identifies Terminally Exhausted CD8+ T Cells
PLOS Pathogens | DOI:10.1371/journal.ppat.1005177 October 20, 2015 15 / 21

points by homogenizing the spleen into a single-cell suspension, Ammonium-Chloride-Potas-sium lysis of red blood cells, followed by antibody staining. For experiments involving P14 celltransfers, Ly5.1+ P14s were isolated from peripheral blood, and 500 P14 cells were transferredi.v. into 5–6 week old wild-type female mice one day prior to infection. Viruses were propa-gated as described previously [48–50].
HPLC analysis of ATP levelsThe concentration of ATP hydrolyzed by CD8+ T cells from subjects with HCV infection(n = 6) was assessed by high performance liquid chromatography (HPLC) as previouslydescribed [51]. Briefly, 10,000 CD39+ CD8+ T cells were sorted and placed on ice to minimizeATP production by cells. 20 μM of ATP was added and incubated for 1 h at 37°C in 5% CO2
to allow for cellular activity to increase and CD39-mediated ATP hydrolysis to occur.Samples were then placed in an ice bath for 10 min to halt enzymatic activity, collected, andcentrifuged for 10 min at 380 x g and 0°C. Cells were discarded and supernatant centrifugedagain to remove remaining cells (2350 x g, 5 min, 0°C). The resulting RPMI samples (160 μl)were treated with 10 μl of an 8 M perchloric acid solution (Sigma-Aldrich) and centrifuged at15,900 x g for 10 min at 0°C to precipitate proteins. In order to neutralize the pH of the result-ing solutions and to remove lipids, supernatants (80 μl) were treated with 4 M K2HPO4 (8 μl)and tri-N-octylamine (50 μl). These samples were mixed with 50 μl of 1,1,2-trichloro-trifluor-oethane and centrifuged (15,900 x g, 10 min, 0°C) and this last lipid extraction step wasrepeated once. The resulting supernatants were subjected to the following procedure to gener-ate fluorescent etheno-adenine products: 150 μl supernatant (or nucleotide standard solution)was incubated at 72°C for 30 min with 250 mMNa2HPO4 (20 μl) and 1 M chloroacetaldehyde(30 μl; Sigma-Aldrich) in a final reaction volume of 200 μl, resulting in the formation of 1,N6-etheno derivatives as previously described [51]. Samples were placed on ice, alkalinizedwith 0.5 M NH4HCO3 (50 μl), filtered with a 1 ml syringe and 0.45 μM filter and analyzedusing a Waters HPLC system and Supelcosil 3 μM LC-18T reverse phase column (Sigma), con-sisting of a gradient system described previously, a Waters autosampler, and a Waters 474 fluo-rescence detector [52]. Empower2 software was used for the analysis of data and all sampleswere compared with water and ATP standard controls as well as a sample with no cells todetermine background degradation of ATP.
Microarray data acquisitionCD8+ T cells from subjects with HCV infection were sorted and pelleted and re-suspended in TRI-zol (Invitrogen). RNA extraction was performed using the RNAdvance Tissue Isolation kit (Agen-court). Concentrations of total RNA were determined with a Nanodrop spectrophotometer orRibogreen RNA quantification kits (Molecular Probes/Invitrogen). RNA purity was determined byBioanalyzer 2100 traces (Agilent Technologies). Total RNA was amplified with theWT-OvationPico RNA Amplification system (NuGEN) according to the manufacturer's instructions. Afterfragmentation and biotinylation, cDNA was hybridized to HG-U133A 2.0 microarrays (Affyme-trix). Data have been deposited in Gene Expression Omnibus with accession code GSE72752.
StatisticsPrior to analysis, microarray data were pre-processed and normalized using robust multichipaveraging, as previously described [53]. Differentially gene expression and consensus clustering[54] were performed using Gene-E software (www.broadinstitute.org/cancer/software/GENE-E/), and gene set enrichment analysis was performed as described previously using genesets from MSigDB [55] or published resources [29,32].
CD39 Expression Identifies Terminally Exhausted CD8+ T Cells
PLOS Pathogens | DOI:10.1371/journal.ppat.1005177 October 20, 2015 16 / 21

Consensus hierarchical clustering was performed using the top 10% of genes that variedacross the dataset, without reference to sample identity. Consensus cluster assesses the “stabil-ity” of the clusters discovered using unbiased methods such as hierarchical clustering i.e. therobustness of the putative clusters to sampling variability. The basic assumption is that if thedata represent a sample of items drawn from distinct sub-populations, a different sampledrawn from the same sub-populations, would result in cluster composition and number shouldnot be radically different. Therefore, the more the attained clusters are robust to sampling vari-ability, the greater the likelihood that the observed clusters represent real structure. The resultof consensus clustering is a matrix that shows, for each pair of samples, the proportion of clus-tering runs on sub-sampled data in which those two items cluster together (shown on a scale of0 to 1).
Enrichment Map analysis of GSEA results was performed as described [56]. The gene signa-ture of exhaustion was generated by identifying the top 200 genes upregulated in CD8+ T cellsresponding to chronic vs. acute LCMV infection in microarray data from a previously pub-lished study [29].
Ethics statementAll human subjects were recruited with recruited with written informed consent in accordancewith Dana-Farber Cancer Institute IRB approval DFCI 00–159, Partners IRB approvals2010P002121, 2010P002463, 1999P004983, and Oxford Research Ethics Committee approval06/Q1604/12. The mouse work was performed under a protocol 01214 approved by the HMAInstitutional Animal Care and Use Committee (IACUC), in strict accordance with the recom-mendations in the Guide for the care and use of Laboratory Animals of the National Institutesof Health. The Harvard Medical School animal management program is accredited by theAssociation for the Assessment and Accreditation of Laboratory Animal Care International(AAALAC).
Supporting InformationS1 Fig. CD39 is expressed by few CD8+ T cells in health donors. Fraction of CD39+ cells innaïve CD8+ T and central memory (CM), effector memory (EM) and effector memory RA+
(EMRA) subpopulations of CD8+ T cells based on CD45RA and CCR7 staining from 18healthy human donors. Error bars represent SEM. Statistical significance was assessed by Fried-man test. ��P<0.01, ���P<0.001.(TIF)
S2 Fig. CD39 and PD-1 co-expression in HCV and HIV. (A, B) Fraction of HCV-specific (A)and HIV-specific (B) CD8+ T cells expressing PD-1, CD39, or both in patients with persistenthigh viral load (black) or patients controlling the disease (grey). Correlation of the fraction ofPD-1 and CD39 double positive virus specific CD8+ T cells with the viral load in the blood inHCV (C) and HIV (D) infected patients. Statistical significance was assessed by Mann-Whit-ney test with Bonferroni correction (A, B). �P<0.05. Correlation was assessed by Pearson cor-relation coefficient (C, D). MFI; mean fluorescence intensity.(TIF)
S3 Fig. Cell sorting strategy for microarray analysis. Gating strategy for CD39+ and CD39–
live non-naive CD8+ T cells from HCV-infected patients.(TIF)
S4 Fig. Comparison of T-bet and Eomes expression by CD39+ and CD39– CD8+ T cells inpatients with chronic viral infection. (A, D) Expression of CD39 in CD8+ T cells in patients
CD39 Expression Identifies Terminally Exhausted CD8+ T Cells
PLOS Pathogens | DOI:10.1371/journal.ppat.1005177 October 20, 2015 17 / 21

infected with HCV (A) and HIV (D). (B, E) Expression of transcription factors T-bet andEomes on CD39– and CD39+ populations identified in (A) and (D). (C, F) Summary of theratio of terminally exhausted Eomeshigh/T-betlow CD8+ T cells in CD39– and CD39+ subsets inHCV (C) and HIV (F) infection. Statistical significance was assessed with paired Student’s t-test. �P< 0.05, ���P< 0.001.(TIF)
S1 Table. Clinical characteristics of the subjects with HCV infection.(XLSX)
S2 Table. Clinical characteristics of the subjects with HIV infection.(XLSX)
S3 Table. The complete list of MHC-peptide multimers used in the study.(XLSX)
S4 Table. List of genes differentially expressed in CD39+ vs CD39– CD8+ T cells in HCVinfected subjects (FDR<0.15).(XLSX)
Author ContributionsConceived and designed the experiments: PKG JG DW EJW GML PK AHSWNH. Performedthe experiments: PKG JG DW KY KEP CC EA CL. Analyzed the data: PKG JG DW KY KEPEA. Contributed reagents/materials/analysis tools: WGJ SCR GA PJRG. Wrote the paper: PKGJG DW PK AHS GMLWNH.
References1. Kaech SM, Cui W (2012) Transcriptional control of effector and memory CD8+ T cell differentiation. Nat
Rev Immunol 12: 749–761. doi: 10.1038/nri3307 PMID: 23080391
2. Wherry EJ (2011) T cell exhaustion. Nat Immunol 12: 492–499. PMID: 21739672
3. Day CL, Kaufmann DE, Kiepiela P, Brown JA, Moodley ES, et al. (2006) PD-1 expression on HIV-spe-cific T cells is associated with T-cell exhaustion and disease progression. Nature 443: 350–354. PMID:16921384
4. Lechner F, Wong DK, Dunbar PR, Chapman R, Chung RT, et al. (2000) Analysis of successful immuneresponses in persons infected with hepatitis C virus. J Exp Med 191: 1499–1512. PMID: 10790425
5. Wherry EJ, Ha SJ, Kaech SM, HainingWN, Sarkar S, et al. (2007) Molecular signature of CD8+ T cellexhaustion during chronic viral infection. Immunity 27: 670–684. PMID: 17950003
6. Barber DL, Wherry EJ, Masopust D, Zhu B, Allison JP, et al. (2006) Restoring function in exhaustedCD8 T cells during chronic viral infection. Nature 439: 682–687. PMID: 16382236
7. Kroy DC, Ciuffreda D, Cooperrider JH, Tomlinson M, Hauck GD, et al. (2014) Liver environment andHCV replication affect human T-cell phenotype and expression of inhibitory receptors. Gastroenterol-ogy 146: 550–561. doi: 10.1053/j.gastro.2013.10.022 PMID: 24148617
8. Duraiswamy J, Ibegbu CC, Masopust D, Miller JD, Araki K, et al. (2011) Phenotype, function, and geneexpression profiles of programmed death-1(hi) CD8 T cells in healthy human adults. J Immunol 186:4200–4212. doi: 10.4049/jimmunol.1001783 PMID: 21383243
9. Paley MA, Kroy DC, Odorizzi PM, Johnnidis JB, Dolfi DV, et al. (2012) Progenitor and terminal subsetsof CD8+ T cells cooperate to contain chronic viral infection. Science 338: 1220–1225. doi: 10.1126/science.1229620 PMID: 23197535
10. Buggert M, Tauriainen J, Yamamoto T, Frederiksen J, Ivarsson MA, et al. (2014) T-bet and Eomes aredifferentially linked to the exhausted phenotype of CD8+ T cells in HIV infection. PLoS Pathog 10:e1004251. doi: 10.1371/journal.ppat.1004251 PMID: 25032686
11. Kurktschiev PD, Raziorrouh B, Schraut W, Backmund M, Wachtler M, et al. (2014) Dysfunctional CD8+T cells in hepatitis B and C are characterized by a lack of antigen-specific T-bet induction. J Exp Med211: 2047–2059. doi: 10.1084/jem.20131333 PMID: 25225458
CD39 Expression Identifies Terminally Exhausted CD8+ T Cells
PLOS Pathogens | DOI:10.1371/journal.ppat.1005177 October 20, 2015 18 / 21

12. Blackburn SD, Shin H, Freeman GJ, Wherry EJ (2008) Selective expansion of a subset of exhaustedCD8 T cells by alphaPD-L1 blockade. Proc Natl Acad Sci U S A 105: 15016–15021. doi: 10.1073/pnas.0801497105 PMID: 18809920
13. Kaczmarek E, Koziak K, Sevigny J, Siegel JB, Anrather J, et al. (1996) Identification and characteriza-tion of CD39/vascular ATP diphosphohydrolase. J Biol Chem 271: 33116–33122. PMID: 8955160
14. Kansas GS, Wood GS, Tedder TF (1991) Expression, distribution, and biochemistry of human CD39.Role in activation-associated homotypic adhesion of lymphocytes. J Immunol 146: 2235–2244. PMID:1672348
15. Deaglio S, Dwyer KM, GaoW, Friedman D, Usheva A, et al. (2007) Adenosine generation catalyzed byCD39 and CD73 expressed on regulatory T cells mediates immune suppression. J Exp Med 204:1257–1265. PMID: 17502665
16. Borsellino G, Kleinewietfeld M, Di Mitri D, Sternjak A, Diamantini A, et al. (2007) Expression of ectonu-cleotidase CD39 by Foxp3+ Treg cells: hydrolysis of extracellular ATP and immune suppression. Blood110: 1225–1232. PMID: 17449799
17. Junger WG (2011) Immune cell regulation by autocrine purinergic signalling. Nature Publishing Group:Nature Publishing Group. pp. 201–212. doi: 10.1038/nri2938 PMID: 21331080
18. Zarek PE, Huang CT, Lutz ER, Kowalski J, Horton MR, et al. (2008) A2A receptor signaling promotesperipheral tolerance by inducing T-cell anergy and the generation of adaptive regulatory T cells. Blood111: 251–259. PMID: 17909080
19. Huang S, Apasov S, Koshiba M, Sitkovsky M (1997) Role of A2a extracellular adenosine receptor-mediated signaling in adenosine-mediated inhibition of T-cell activation and expansion. Blood 90:1600–1610. PMID: 9269779
20. Lokshin A, Raskovalova T, Huang X, Zacharia LC, Jackson EK, et al. (2006) Adenosine-mediated inhi-bition of the cytotoxic activity and cytokine production by activated natural killer cells. Cancer Res 66:7758–7765. PMID: 16885379
21. Moncrieffe H, Nistala K, Kamhieh Y, Evans J, Eddaoudi A, et al. (2010) High Expression of the Ectonu-cleotidase CD39 on T Cells from the Inflamed Site Identifies Two Distinct Populations, One Regulatoryand One Memory T Cell Population. The Journal of Immunology. pp. 134–143. doi: 10.4049/jimmunol.0803474 PMID: 20498355
22. Pulte D, Furman RR, Broekman MJ, Drosopoulos JH, Ballard HS, et al. (2011) CD39 expression on Tlymphocytes correlates with severity of disease in patients with chronic lymphocytic leukemia. ClinLymphomaMyeloma Leuk 11: 367–372. doi: 10.1016/j.clml.2011.06.005 PMID: 21816376
23. Boer MC, van Meijgaarden KE, Bastid J, Ottenhoff TH, Joosten SA (2013) CD39 is involved in mediat-ing suppression by Mycobacterium bovis BCG-activated human CD8(+) CD39(+) regulatory T cells.Eur J Immunol 43: 1925–1932. doi: 10.1002/eji.201243286 PMID: 23606272
24. Robson SC, Kaczmarek E, Siegel JB, Candinas D, Koziak K, et al. (1997) Loss of ATP diphosphohy-drolase activity with endothelial cell activation. J Exp Med 185: 153–163. PMID: 8996251
25. Papanikolaou A, Papafotika A, Murphy C, Papamarcaki T, Tsolas O, et al. (2005) Cholesterol-depen-dent lipid assemblies regulate the activity of the ecto-nucleotidase CD39. J Biol Chem 280: 26406–26414. PMID: 15890655
26. Wu Y, Sun X, Kaczmarek E, Dwyer KM, Bianchi E, et al. (2006) RanBPM associates with CD39 andmodulates ecto-nucleotidase activity. Biochem J 396: 23–30. PMID: 16478441
27. Kasprowicz V, Schulze Zur Wiesch J, Kuntzen T, Nolan BE, Longworth S, et al. (2008) High level ofPD-1 expression on hepatitis C virus (HCV)-specific CD8+ and CD4+ T cells during acute HCV infec-tion, irrespective of clinical outcome. J Virol 82: 3154–3160. PMID: 18160439
28. Ashburner M, Ball CA, Blake JA, Botstein D, Butler H, et al. (2000) Gene ontology: tool for the unifica-tion of biology. The Gene Ontology Consortium. Nat Genet 25: 25–29. PMID: 10802651
29. Doering TA, Crawford A, Angelosanto JM, Paley MA, Ziegler CG, et al. (2012) Network analysis revealscentrally connected genes and pathways involved in CD8+ T cell exhaustion versus memory. Immunity37: 1130–1144. doi: 10.1016/j.immuni.2012.08.021 PMID: 23159438
30. Quigley M, Pereyra F, Nilsson B, Porichis F, Fonseca C, et al. (2010) Transcriptional analysis of HIV-specific CD8+ T cells shows that PD-1 inhibits T cell function by upregulating BATF. Nat Med 16:1147–1151. doi: 10.1038/nm.2232 PMID: 20890291
31. Baitsch L, Baumgaertner P, Devevre E, Raghav SK, Legat A, et al. (2011) Exhaustion of tumor-specificCD8(+) T cells in metastases frommelanoma patients. J Clin Invest 121: 2350–2360. doi: 10.1172/JCI46102 PMID: 21555851
32. Subramanian A, Tamayo P, Mootha VK, Mukherjee S, Ebert BL, et al. (2005) Gene set enrichmentanalysis: a knowledge-based approach for interpreting genome-wide expression profiles. Proc NatlAcad Sci U S A 102: 15545–15550. PMID: 16199517
CD39 Expression Identifies Terminally Exhausted CD8+ T Cells
PLOS Pathogens | DOI:10.1371/journal.ppat.1005177 October 20, 2015 19 / 21

33. Blackburn SD, Shin H, HainingWN, Zou T, Workman CJ, et al. (2009) Coregulation of CD8+ T cellexhaustion by multiple inhibitory receptors during chronic viral infection. Nat Immunol 10: 29–37. doi:10.1038/ni.1679 PMID: 19043418
34. Trautmann L, Janbazian L, Chomont N, Said EA, Gimmig S, et al. (2006) Upregulation of PD-1 expres-sion on HIV-specific CD8+ T cells leads to reversible immune dysfunction. Nat Med 12: 1198–1202.PMID: 16917489
35. Jenabian MA, Seddiki N, Yatim A, Carriere M, Hulin A, et al. (2013) Regulatory T cells negatively affectIL-2 production of effector T cells through CD39/adenosine pathway in HIV infection. PLoS Pathog 9:e1003319. doi: 10.1371/journal.ppat.1003319 PMID: 23658513
36. Petrovas C, Casazza JP, Brenchley JM, Price DA, Gostick E, et al. (2006) PD-1 is a regulator of virus-specific CD8+ T cell survival in HIV infection. J Exp Med 203: 2281–2292. PMID: 16954372
37. Pita-Lopez ML, Gayoso I, DelaRosa O, Casado JG, Alonso C, et al. (2009) Effect of ageing on CMV-specific CD8 T cells from CMV seropositive healthy donors. Immun Ageing 6: 11. doi: 10.1186/1742-4933-6-11 PMID: 19715573
38. Rey J, Giustiniani J, Mallet F, Schiavon V, Boumsell L, et al. (2006) The co-expression of 2B4 (CD244)and CD160 delineates a subpopulation of human CD8+ T cells with a potent CD160-mediated cytolyticeffector function. Eur J Immunol 36: 2359–2366. PMID: 16917959
39. Shin H, Blackburn SD, Intlekofer AM, Kao C, Angelosanto JM, et al. (2009) A role for the transcriptionalrepressor Blimp-1 in CD8(+) T cell exhaustion during chronic viral infection. Immunity 31: 309–320.doi: 10.1016/j.immuni.2009.06.019 PMID: 19664943
40. Migueles SA, Laborico AC, Shupert WL, Sabbaghian MS, Rabin R, et al. (2002) HIV-specific CD8+ Tcell proliferation is coupled to perforin expression and is maintained in nonprogressors. Nat Immunol 3:1061–1068. PMID: 12368910
41. Shin H, Blackburn SD, Blattman JN, Wherry EJ (2007) Viral antigen and extensive division maintainvirus-specific CD8 T cells during chronic infection. J Exp Med 204: 941–949. PMID: 17420267
42. Cox AL, Mosbruger T, Lauer GM, Pardoll D, Thomas DL, et al. (2005) Comprehensive analyses of CD8+ T cell responses during longitudinal study of acute human hepatitis C. Hepatology 42: 104–112.PMID: 15962289
43. Zajac AJ, Blattman JN, Murali-Krishna K, Sourdive DJ, Suresh M, et al. (1998) Viral immune evasiondue to persistence of activated T cells without effector function. J Exp Med 188: 2205–2213. PMID:9858507
44. Moskophidis D, Lechner F, Pircher H, Zinkernagel RM (1993) Virus persistence in acutely infectedimmunocompetent mice by exhaustion of antiviral cytotoxic effector T cells. Nature 362: 758–761.PMID: 8469287
45. Seddiki N, Brezar V, Draenert R (2014) Cell exhaustion in HIV-1 infection: role of suppressor cells. CurrOpin HIV AIDS 9: 452–458. doi: 10.1097/COH.0000000000000087 PMID: 25010895
46. Toth I, Le AQ, Hartjen P, Thomssen A, Matzat V, et al. (2013) Decreased frequency of CD73+CD8+ Tcells of HIV-infected patients correlates with immune activation and T cell exhaustion. J Leukoc Biol94: 551–561. doi: 10.1189/jlb.0113018 PMID: 23709688
47. Leisner C, Loeth N, Lamberth K, Justesen S, Sylvester-Hvid C, et al. (2008) One-pot, mix-and-readpeptide-MHC tetramers. PLoS One 3: e1678. doi: 10.1371/journal.pone.0001678 PMID: 18301755
48. Wherry EJ, Blattman JN, Murali-Krishna K, van der Most R, Ahmed R (2003) Viral persistence altersCD8 T-cell immunodominance and tissue distribution and results in distinct stages of functionalimpairment. J Virol 77: 4911–4927. PMID: 12663797
49. Murali-Krishna K, Altman JD, Suresh M, Sourdive DJ, Zajac AJ, et al. (1998) Counting antigen-specificCD8 T cells: a reevaluation of bystander activation during viral infection. Immunity 8: 177–187. PMID:9491999
50. Ahmed R, Salmi A, Butler LD, Chiller JM, Oldstone MB (1984) Selection of genetic variants of lympho-cytic choriomeningitis virus in spleens of persistently infected mice. Role in suppression of cytotoxic Tlymphocyte response and viral persistence. J Exp Med 160: 521–540. PMID: 6332167
51. Lazarowski ER, Tarran R, Grubb BR, van Heusden CA, Okada S, et al. (2004) Nucleotide release pro-vides a mechanism for airway surface liquid homeostasis. J Biol Chem 279: 36855–36864. PMID:15210701
52. Chen Y, Corriden R, Inoue Y, Yip L, Hashiguchi N, et al. (2006) ATP release guides neutrophil chemo-taxis via P2Y2 and A3 receptors. Science 314: 1792–1795. PMID: 17170310
53. Haining WN, Ebert BL, Subrmanian A, Wherry EJ, EichbaumQ, et al. (2008) Identification of an evolu-tionarily conserved transcriptional signature of CD8 memory differentiation that is shared by T and Bcells. J Immunol 181: 1859–1868. PMID: 18641323
CD39 Expression Identifies Terminally Exhausted CD8+ T Cells
PLOS Pathogens | DOI:10.1371/journal.ppat.1005177 October 20, 2015 20 / 21

54. Monti S TP, Mesirov J, Golub T (2003) Consensus Clustering: A Resampling-Based Method for ClassDiscovery and Visualization of Gene Expression Microarray Data. Machine Learning 52: 91–118.
55. Liberzon A (2014) A description of the Molecular Signatures Database (MSigDB) Web site. MethodsMol Biol 1150: 153–160. doi: 10.1007/978-1-4939-0512-6_9 PMID: 24743996
56. Merico D, Isserlin R, Stueker O, Emili A, Bader GD (2010) Enrichment map: a network-based methodfor gene-set enrichment visualization and interpretation. PLoS One 5: e13984. doi: 10.1371/journal.pone.0013984 PMID: 21085593
CD39 Expression Identifies Terminally Exhausted CD8+ T Cells
PLOS Pathogens | DOI:10.1371/journal.ppat.1005177 October 20, 2015 21 / 21


