Embed Size (px)
Citation preview
CEE VEE AGRIENCE PVT. LTD
0
PARTICULARS PAGE NO. EXECUTIVE SUMMARY
1. PREAMBLE 2. THE COMPANY 3. THE PROMOTERS 4. THE PROJECT 5. COST OF PROJECT 6. MEANS OF FINANCE 7. SALIENT FEATURES 8. KEY PROJECTED FINANCIALS
PROJECT INFORMATION
9. INDUSTRY OVERVIEW 10. MARKET SCENARIO 11. NEW PROJECT 12. COST OF THE PROJECT AND DESCRIPTION
a. LAND AND SITE DEVELOPMENT b. BUILDING AND CIVIL WORKS c. PLANT AND MACHINERY d. MISCELLANEOUS FIXED ASSETS e. CONTINGENCIES AND ESCALATION f. PREOPERATIVE EXPENSES g. MARGIN MONEY FOR WORKING CAPITAL
13. MEANS OF FINANCE 14. MANUFACTURING PROCESS 15. RAW MATERIAL AND UTILITIES 16. MANPOWER REQUIREMENT 17. TECHNICAL ASPECTS AND LAYOUT AND FACILITIES 18. GOVERNMENT APPROVALS 19. SCHEDULE OF IMPLEMENTATION 20. SWOT ANALYSIS 21. FINANCIAL INDICATORS 22. SENSITIVITY ANALYSIS 23. ASSUMPTIONS
24. FINANCIAL PROJECTIONS
a. PROJECTED PROFITABILITY b. PROJECTED BALANCE SHEET c. PROJECTED CASH FLOWS d. DEBT SERVICE COVERAGE RATIO e. BREAK EVEN POINT f. INTERNAL RATE OF RETURN g. PAY BACK PERIOD h. DEPRECIATION CALCULATION i. REPAYMENT
1 3 3 4 4 5 6 7
8 18
25 25 26 26 27 30 30 31 31
32 34 38 41 42 47 48 49 50 51 52
56 58 60 61 62 63 63 64 66
CEE VEE AGRIENCE PVT. LTD
1
EXECUTIVE SUMMARY
PREAMBLE
Agriculture plays a vital role in Indian economy. Large population in the country depends
upon agriculture for its survival. Approximately 620 million rural Indians depend on
agriculture. Agriculture sector represents 17% of India’s GDP. Agriculture productivity is
dependent on various factors like soil properties, climate conditions, irrigation facilities, seed
qualities, technique of farming, prevention from pests etc, but more importantly usage of
primary, secondary and optimum nutrient. The loss of soil fertility in many developing
countries posses an immediate threat to food production. Chemical fertilizers have played
an important role in making the country self reliant in food production. It is essential to
encourage the use of nitrogenous phosphatic and pottasic fertilizer so as to achieve the
desirable consumption ratio according to agro climatic and crop requirements to maintain
the soil health and to sustain the crop productivity.
PIONEER INDUSTRY OF THE COUNTRY
About 60 percent of the India’s workforce is dependent on agriculture for their livelihood.
Substantial evidence has demonstrated that chemical fertilizers have played a vital role in
success of India’s Green Revolution and consequent self reliance in food grain production.
Fertililizers consumption has increased from less than 1 kg per hectare in 1951-1952 to
143.13 kgs in 2011-12.
The fertilizer industry presents one of the most energy intensive sectors within the Indian
economy and is therefore of particular interest in the context of both local and global
environmental discussions. Increase in productivity through the adoption of more efficient
and cleaner technologies in the manufacturing sector will be most effective in merging
economic, environmental, and social development objectives. A historical examination of
productivity growth in India’s industries embedded into a broader analysis of structural
composition and policy changes will help identify potential future development strategies
that lead towards a more sustainable development path.
CEE VEE AGRIENCE PVT. LTD
2
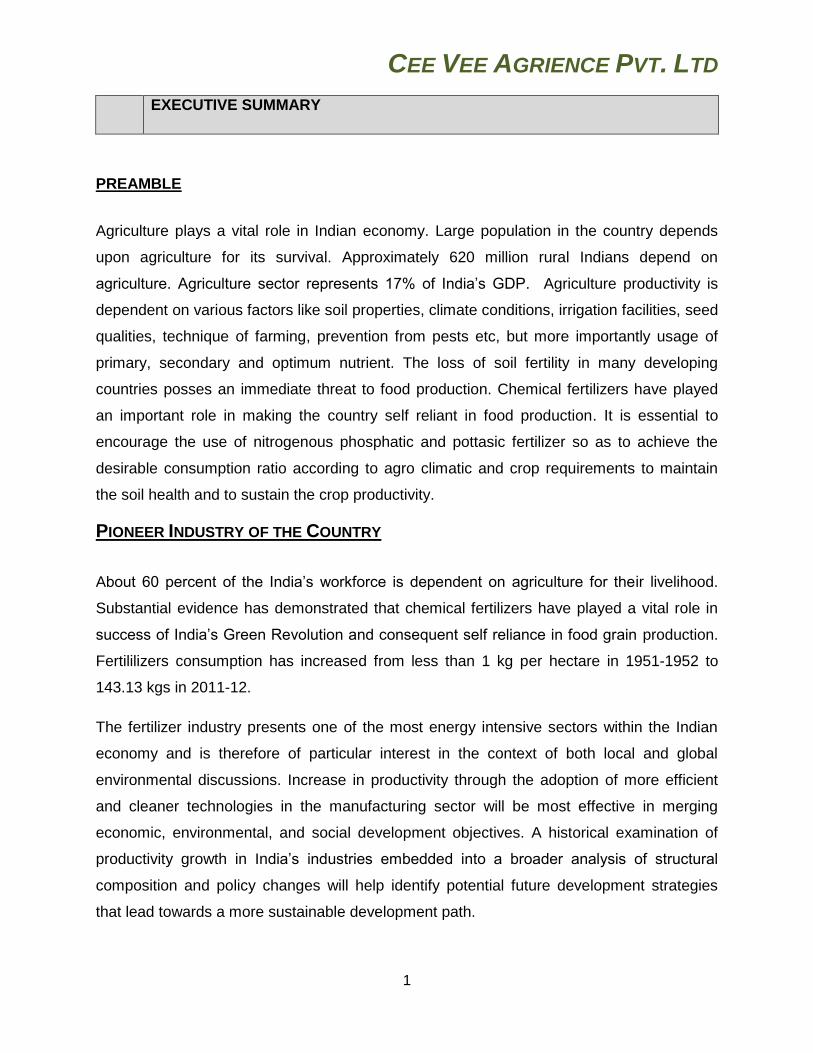
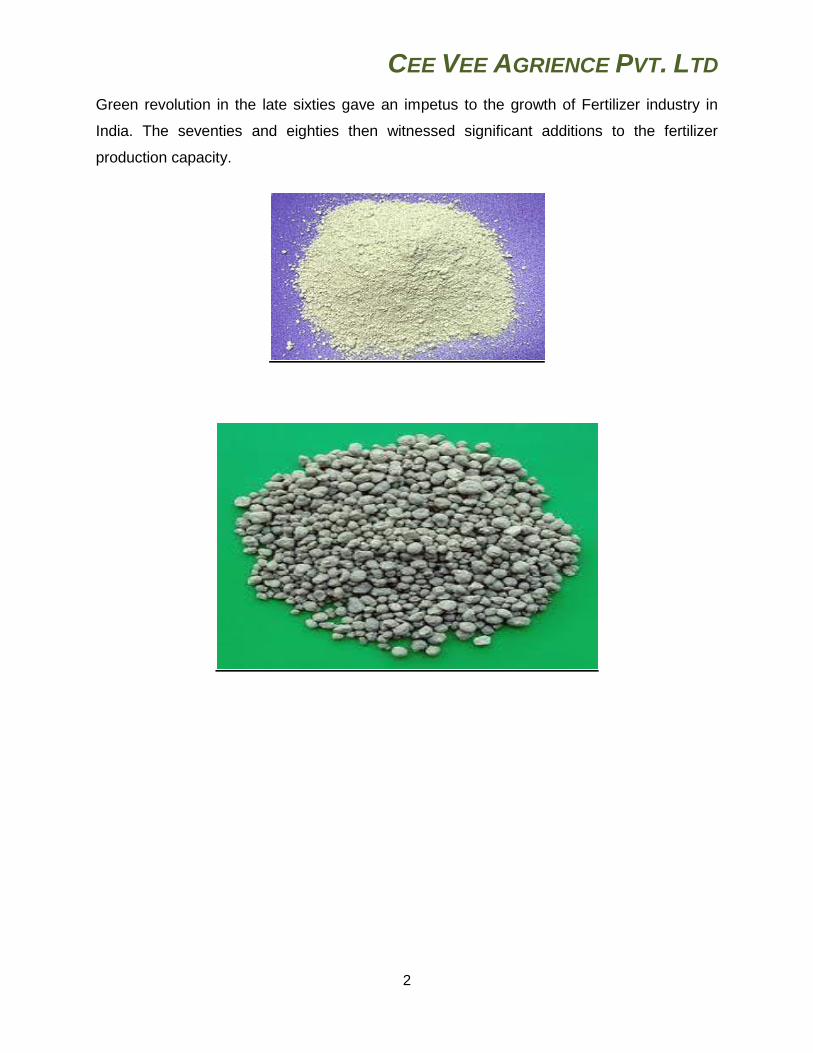
Green revolution in the late sixties gave an impetus to the growth of Fertilizer industry in
India. The seventies and eighties then witnessed significant additions to the fertilizer
production capacity.
CEE VEE AGRIENCE PVT. LTD
3
THE COMPANY
Name Cee Vee Agrience Pvt. Ltd. (CVA)
Address Santushti , Mahanadi Road , Madhusudan Nagar , Tulasipur ,
Cuttack , Orissa - 753008
Location of Plant Nua Sasan , Nuasasan Industral Estate , Athgarh , Orissa
Sector Private
Constitution Private Limited Company
Industry Agriculture - Fertilizers
INTRODUCTION
Cee Vee Agrience Pvt. Ltd. (CVA) was incorporated for setting up a fertilizer plant,
manufacturing the economical and widely used Single Super Phosphate (SSP) unit in
Orissa. Due to omnipotent qualities, it can be used in various types of agricultural produce
ranging from coconut to flower, wheat to fruits and vegetables. SSP is most viable when
produced and distributed, focused on localized market. Orissa government is encouraging
multi cropping and diversification into cash crops. Therefore, we feel that our product will
find ready and receptive market due to this encouraging scenario. However, the company
has held discussions with Paradeep Phosphates Limited wherein they have shown
inclination to enter into a long term marketing arrangement. Thus we do not foresee any
possible difficulty in marketing of the product.
PROMOTERS
The Promoter, C.V. Ramu, hails from Cuttack, Orissa. He has completed his education from
Cuttack and Delhi. He has done his MBA from the prestigious IMT, Ghaziabad. Mr. Ramu
completed his college education from the well known Ravenshaw College, Cuttack in 1989
and then went on to complete his MBA course. He successfully completed the same in
1992 and started his working in Delhi. He is a Marketing & Finance professional, with
exposure and experience with very large Multinationals and Indian companies. He has
experience in both manufacturing as well as Service industries and has worked for some
CEE VEE AGRIENCE PVT. LTD
4
large companies like Escorts, TATA Group & Reliance. The promoter comes from a well-to-
do and meritorious family in Orissa.
THE PROJECT
CVA proposes to set up a 100 TPD plant manufacturing the economical and widely used
Single Super Phosphate fertilizer. It can be used in various types of agricultural produce
ranging from coconuts to flowers, wheat to fruits and vegetables, floriculture to cotton
cultivation etc. The production process is very simple and economical and the fertilizer
yields good results in all kinds of soil conditions. In markets like Orissa, where the
Government is encouraging multi-cropping and diversification into cash crops, it turns out to
be a viable product. Currently, the Orissa market is serviced by manufacturers from
neighbouring states resulting in inconsistent supplies as they give priority to their home
consumers and only supply the residual quantity to Orissa. Thus a plant in Orissa is in great
demand. The installed capacity of the plant is proposed to be 30,000 TPA.
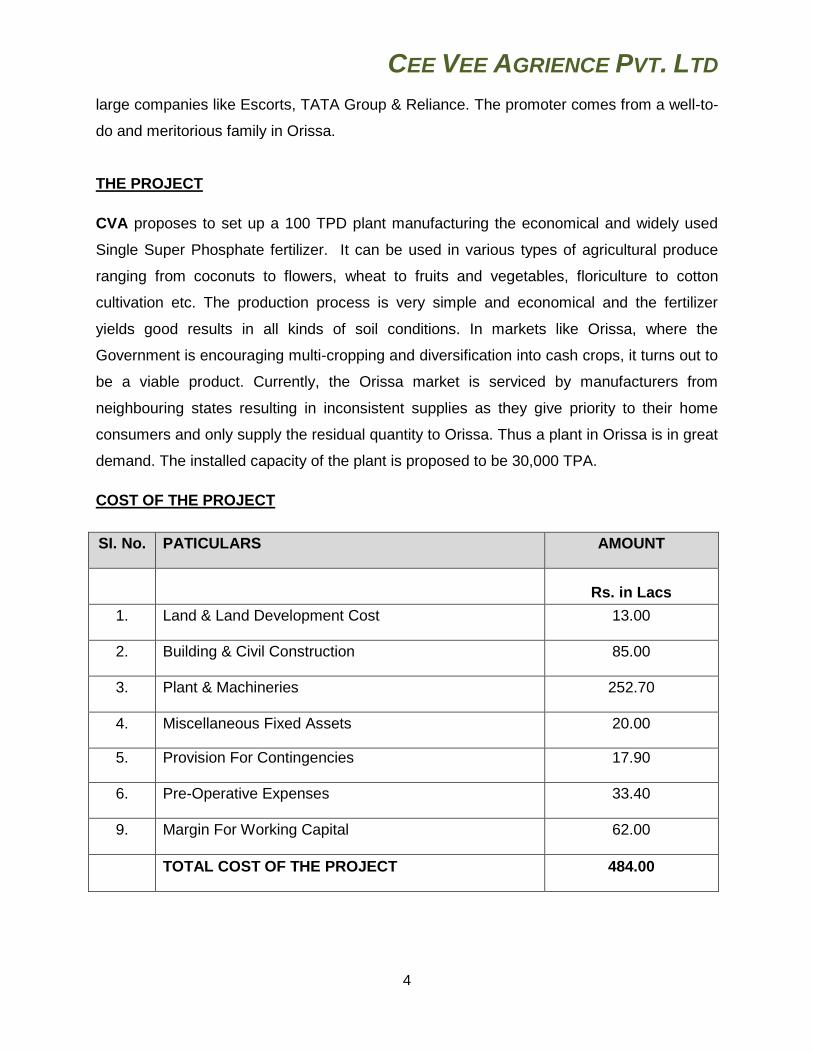
COST OF THE PROJECT
SI. No. PATICULARS AMOUNT
Rs. in Lacs
1. Land & Land Development Cost 13.00
2. Building & Civil Construction 85.00
3. Plant & Machineries 252.70
4. Miscellaneous Fixed Assets 20.00
5. Provision For Contingencies 17.90
6. Pre-Operative Expenses 33.40
9. Margin For Working Capital 62.00
TOTAL COST OF THE PROJECT 484.00
CEE VEE AGRIENCE PVT. LTD
5
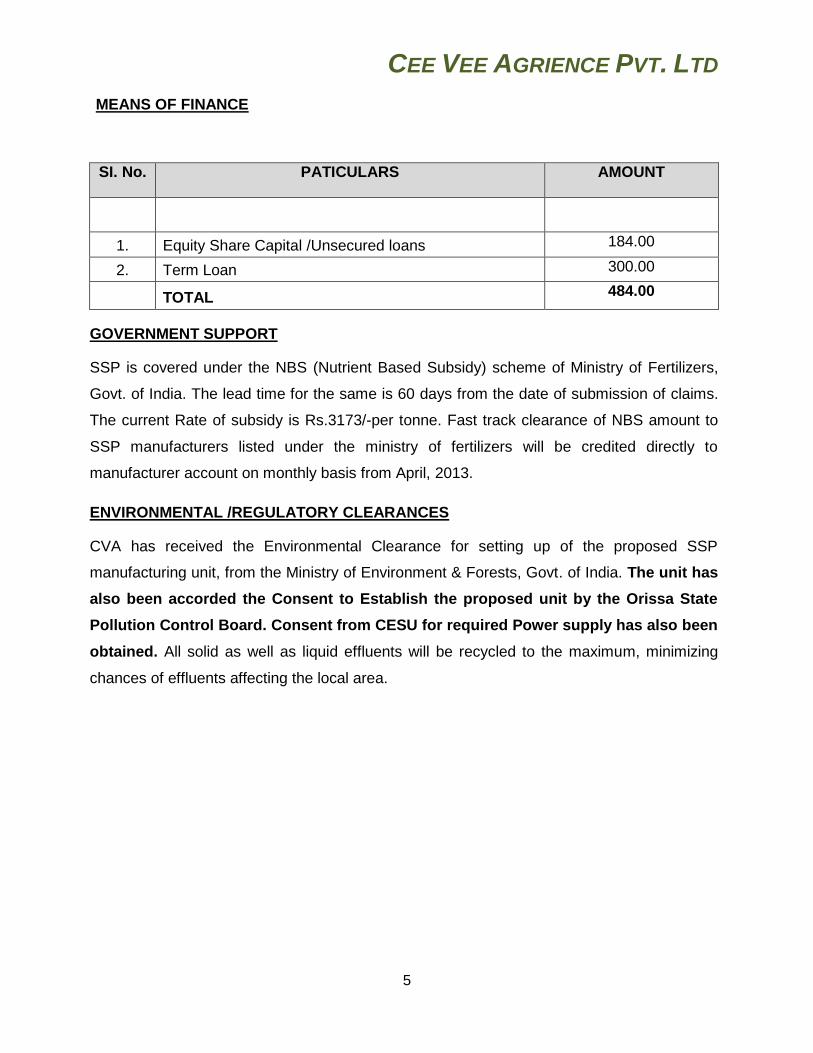
MEANS OF FINANCE
SI. No. PATICULARS AMOUNT
1. Equity Share Capital /Unsecured loans 184.00
2. Term Loan 300.00
TOTAL 484.00
GOVERNMENT SUPPORT
SSP is covered under the NBS (Nutrient Based Subsidy) scheme of Ministry of Fertilizers,
Govt. of India. The lead time for the same is 60 days from the date of submission of claims.
The current Rate of subsidy is Rs.3173/-per tonne. Fast track clearance of NBS amount to
SSP manufacturers listed under the ministry of fertilizers will be credited directly to
manufacturer account on monthly basis from April, 2013.
ENVIRONMENTAL /REGULATORY CLEARANCES
CVA has received the Environmental Clearance for setting up of the proposed SSP
manufacturing unit, from the Ministry of Environment & Forests, Govt. of India. The unit has
also been accorded the Consent to Establish the proposed unit by the Orissa State
Pollution Control Board. Consent from CESU for required Power supply has also been
obtained. All solid as well as liquid effluents will be recycled to the maximum, minimizing
chances of effluents affecting the local area.
CEE VEE AGRIENCE PVT. LTD
6
SALIENT FEATURES OF THE PRODUCT
Single Super Phosphate is a very simple, convenient and cheapest fertilizer that
supports various types of agricultural produce.
SSP enhances the Phosphatic content in the soil, thereby enabling the soil to be more
porous for effective growth of the roots and fulfill 15% of the total phosphate requirement
of the company.
SSP is extensively used in agri-economies as it is cheap, affordable and provides the
basic ingredient to soil. Lowest price per kg (in non-urea space), preferred by small and
marginal farmers.
Multi-nutrient fertilizer containing P2O5 as primary nutrient and Sulphur and Calcium as
secondary nutrients.
Utilizes acid effluent from other chemical industry and thus reduces nation's cost of
effluent disposal.
It is the cheapest source of Sulphur for the soil.
Only phosphatic fertilizer that can utilize Indian rock phosphate deposits.
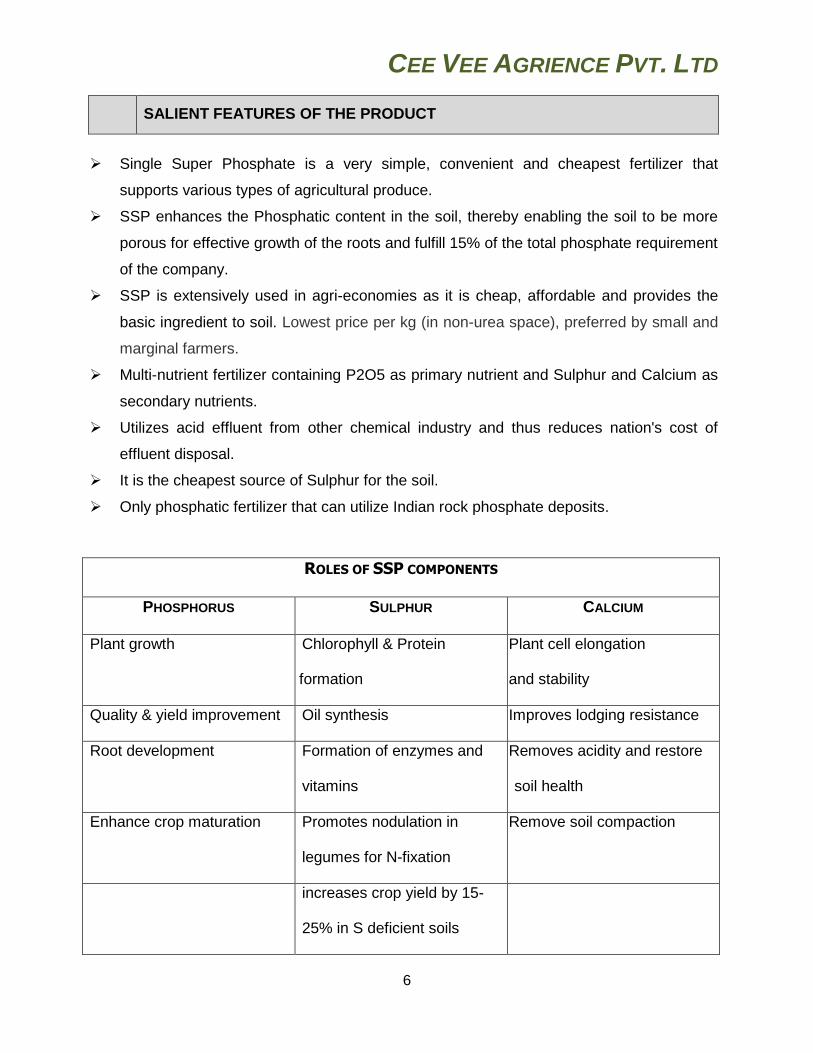
ROLES OF SSP COMPONENTS
PHOSPHORUS SULPHUR CALCIUM
Plant growth Chlorophyll & Protein
formation
Plant cell elongation
and stability
Quality & yield improvement Oil synthesis Improves lodging resistance
Root development Formation of enzymes and
vitamins
Removes acidity and restore
soil health
Enhance crop maturation
Promotes nodulation in
legumes for N-fixation
Remove soil compaction
increases crop yield by 15-
25% in S deficient soils
CEE VEE AGRIENCE PVT. LTD
7
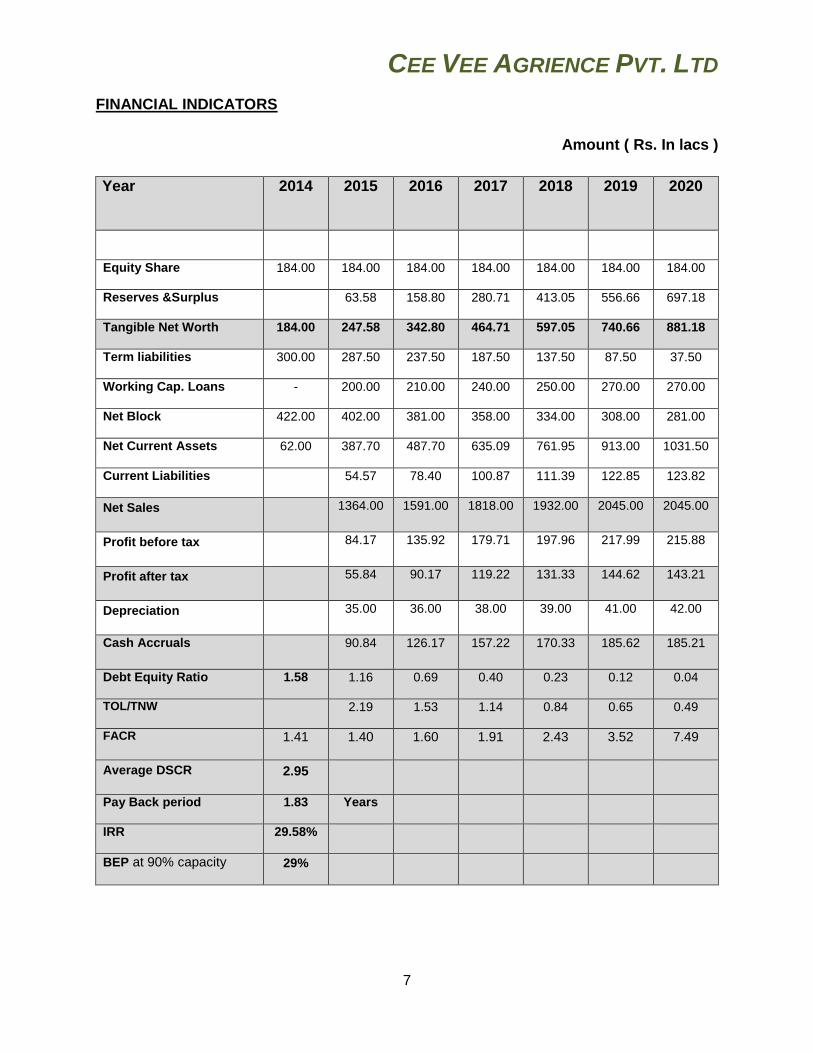
FINANCIAL INDICATORS
Amount ( Rs. In lacs )
Year
2014 2015 2016 2017 2018 2019 2020
Equity Share 184.00 184.00 184.00 184.00 184.00 184.00 184.00
Reserves &Surplus 63.58 158.80 280.71 413.05 556.66 697.18
Tangible Net Worth 184.00 247.58 342.80 464.71 597.05 740.66 881.18
Term liabilities 300.00 287.50 237.50 187.50 137.50 87.50 37.50
Working Cap. Loans - 200.00 210.00 240.00 250.00 270.00 270.00
Net Block 422.00 402.00 381.00 358.00 334.00 308.00 281.00
Net Current Assets 62.00 387.70 487.70 635.09 761.95 913.00 1031.50
Current Liabilities 54.57 78.40 100.87 111.39 122.85 123.82
Net Sales 1364.00 1591.00 1818.00 1932.00 2045.00 2045.00
Profit before tax 84.17 135.92 179.71 197.96 217.99 215.88
Profit after tax 55.84 90.17 119.22 131.33 144.62 143.21
Depreciation 35.00 36.00 38.00 39.00 41.00 42.00
Cash Accruals 90.84 126.17 157.22 170.33 185.62 185.21
Debt Equity Ratio 1.58 1.16 0.69 0.40 0.23 0.12 0.04
TOL/TNW 2.19 1.53 1.14 0.84 0.65 0.49
FACR 1.41 1.40 1.60 1.91 2.43 3.52 7.49
Average DSCR 2.95
Pay Back period 1.83 Years
IRR 29.58%
BEP at 90% capacity 29%
CEE VEE AGRIENCE PVT. LTD
8
INDUSTRY SCENARIO OF SSP
SECTOR BACKGROUND Single super phosphate (SSP) is a high-in-demand fertilizer mostly used at the time of
preparation of land for farming. It is a straight phosphatic multi-nutrient fertilizer which
contains 16% water soluble P2O5, 12% sulphur, 21% calcium and some other essential
micro nutrients in small proportions. The first SSP plant is said to have been established by
EID Parry in the year 1906. Manufacturing of SSP is based on perhaps the simplest
chemical reaction amongst chemical fertilizer industry. The main raw materials required are
Rock phosphate and sulphuric acid. SSP, a poor farmer's fertilizer (price-wise compared to
DAP- Diammonium phosphate), is an option to optimise the use of phosphatic fertilizers and
helps treat sulphur deficiency in soils (40% Indian soil is sulphur deficient). Several crops
such as oilseeds, pulses, sugarcane, tea etc require more sulphur and phosphate, a
phenomenon that is fulfilled with the use of SSP. SSP is classified into two categories,
namely Single Super Phosphate (SSP) and Granulated Single Super Phosphate (GSSP).
HISTORY OF REGULATION:
After decontrol of fertilizers in India in August 1992, the Government of India has been
implementing a Concession Scheme for decontrolled Phosphatic and Potassic (P&K)
fertilizers. SSP is one the decontrolled fertilizers covered under the Scheme. The
Department of Fertilizers (DOF), after taking over the Concession Scheme from the
Department of Agriculture and Cooperation in 2000, modified the guidelines for the Scheme
so as to promote use of specified grades of rock phosphate purchased from notified
sources for manufacture of SSP, with a view to ensure availability of quality SSP to farmers
and to minimize possibility of sale of non-standard SSP to farmers. Till April 2010, the
government, kept prices artificially low to maintain affordability and controlled retail prices of
all fertilizers. As a result, Indian farmers were insulated from international price hikes.
The Ministry of Chemicals and Fertilizers approved the Nutrient Based Subsidy (NBS) in
March 2010 in an effort to decontrol prices. Since the announcement, fertilizer sales
volumes have risen significantly. For example, in FY11, sales of complex fertilizers other
than DAP rose by ~40% despite a significant increase in prices. Under the new regime,
CEE VEE AGRIENCE PVT. LTD
9
there is a fixed subsidy for nutrients and unlike in the past, when the government set the
MRP, the current regime lets manufacturers determine their own selling prices. However,
we cannot totally rule out the possibility of government intervention returning in the case of
large fluctuations in price in future. On 5th May 2011, the Government announced the
revised nutrient subsidy rates applicable for FY12. Nutrient subsidies increased
substantially from the rates in FY11. On an annual basis, subsidy on Phosphorous has
increased the most due to the rapid rise in DAP and Phosphoric Acid prices. This is
because raw material prices have increased sharply in the international market, leading to
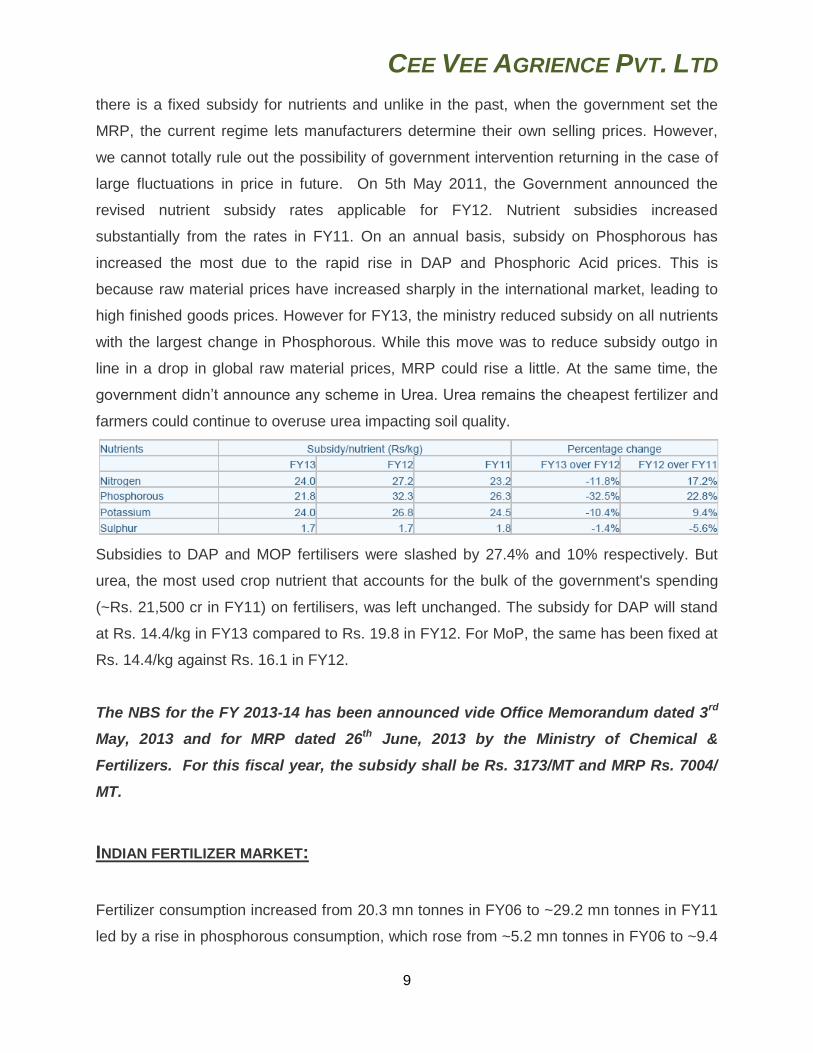
high finished goods prices. However for FY13, the ministry reduced subsidy on all nutrients
with the largest change in Phosphorous. While this move was to reduce subsidy outgo in
line in a drop in global raw material prices, MRP could rise a little. At the same time, the
government didn’t announce any scheme in Urea. Urea remains the cheapest fertilizer and
farmers could continue to overuse urea impacting soil quality.
Subsidies to DAP and MOP fertilisers were slashed by 27.4% and 10% respectively. But
urea, the most used crop nutrient that accounts for the bulk of the government's spending
(~Rs. 21,500 cr in FY11) on fertilisers, was left unchanged. The subsidy for DAP will stand
at Rs. 14.4/kg in FY13 compared to Rs. 19.8 in FY12. For MoP, the same has been fixed at
Rs. 14.4/kg against Rs. 16.1 in FY12.
The NBS for the FY 2013-14 has been announced vide Office Memorandum dated 3rd
May, 2013 and for MRP dated 26th
June, 2013 by the Ministry of Chemical &
Fertilizers. For this fiscal year, the subsidy shall be Rs. 3173/MT and MRP Rs. 7004/
MT.
INDIAN FERTILIZER MARKET:
Fertilizer consumption increased from 20.3 mn tonnes in FY06 to ~29.2 mn tonnes in FY11
led by a rise in phosphorous consumption, which rose from ~5.2 mn tonnes in FY06 to ~9.4
CEE VEE AGRIENCE PVT. LTD
10
mn tonnes in FY11. The consumption of fertilisers increased by 7% during FY2012 but the
consumption growth was lower as compared with that in FY2011 (when consumption had
grown by 14%). Fertilizer demand is expected to rise at a CAGR of ~8% to ~40-45 mn
tonnes in FY16. Phosphorous is expected to account for a bulk of that increase at a CAGR
of ~15% to ~16-18 mn tonnes in FY16 following increased availability of complex fertilizers
after the Nutrient Based Scheme (NBS) came into effect. Producers are now given a
subsidy on the volume of nutrient sold as opposed to that on the volume of product sold
earlier. This gives the producers incentive to sell other fertilizers besides urea and DAP.
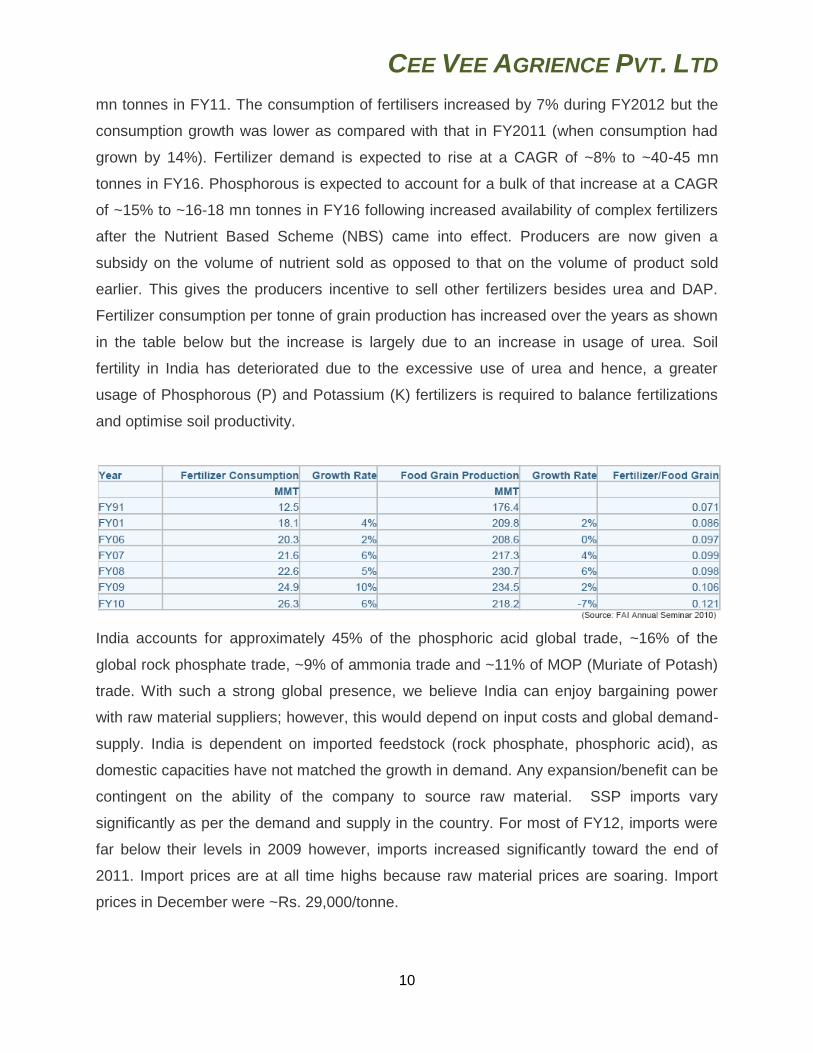
Fertilizer consumption per tonne of grain production has increased over the years as shown
in the table below but the increase is largely due to an increase in usage of urea. Soil
fertility in India has deteriorated due to the excessive use of urea and hence, a greater
usage of Phosphorous (P) and Potassium (K) fertilizers is required to balance fertilizations
and optimise soil productivity.
India accounts for approximately 45% of the phosphoric acid global trade, ~16% of the
global rock phosphate trade, ~9% of ammonia trade and ~11% of MOP (Muriate of Potash)
trade. With such a strong global presence, we believe India can enjoy bargaining power
with raw material suppliers; however, this would depend on input costs and global demand-
supply. India is dependent on imported feedstock (rock phosphate, phosphoric acid), as
domestic capacities have not matched the growth in demand. Any expansion/benefit can be
contingent on the ability of the company to source raw material. SSP imports vary
significantly as per the demand and supply in the country. For most of FY12, imports were
far below their levels in 2009 however, imports increased significantly toward the end of
2011. Import prices are at all time highs because raw material prices are soaring. Import
prices in December were ~Rs. 29,000/tonne.
CEE VEE AGRIENCE PVT. LTD
11
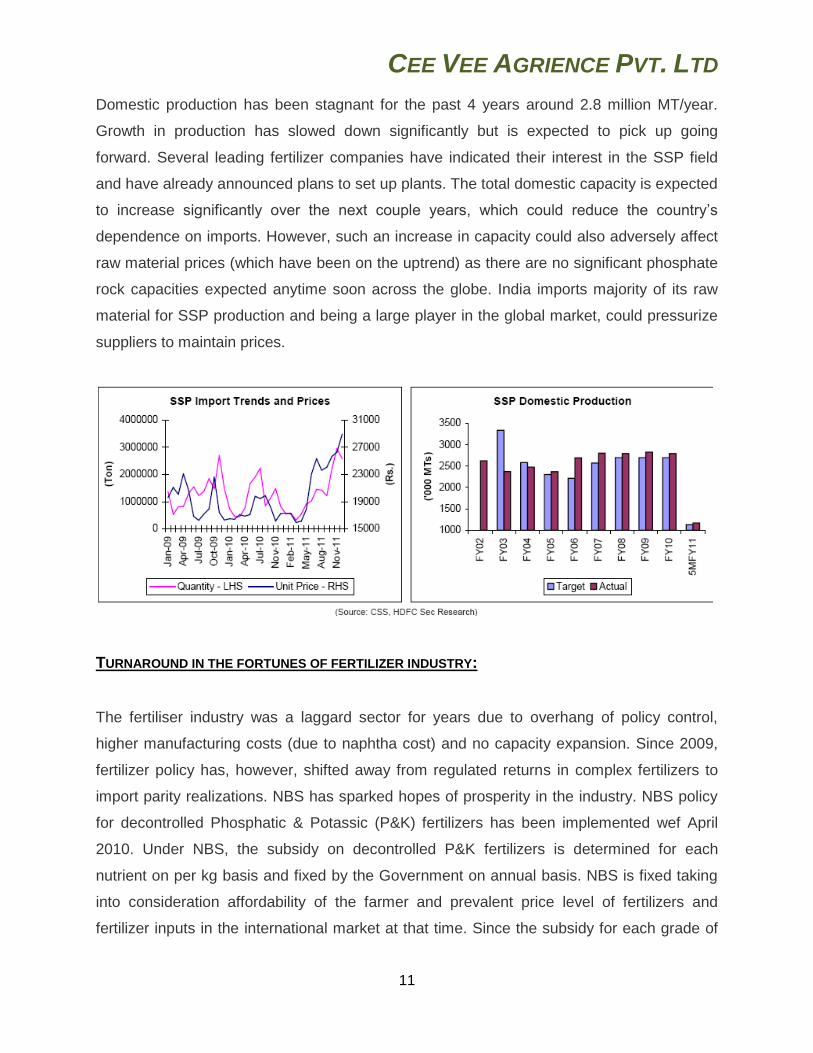
Domestic production has been stagnant for the past 4 years around 2.8 million MT/year.
Growth in production has slowed down significantly but is expected to pick up going
forward. Several leading fertilizer companies have indicated their interest in the SSP field
and have already announced plans to set up plants. The total domestic capacity is expected
to increase significantly over the next couple years, which could reduce the country’s
dependence on imports. However, such an increase in capacity could also adversely affect
raw material prices (which have been on the uptrend) as there are no significant phosphate
rock capacities expected anytime soon across the globe. India imports majority of its raw
material for SSP production and being a large player in the global market, could pressurize
suppliers to maintain prices.
TURNAROUND IN THE FORTUNES OF FERTILIZER INDUSTRY:
The fertiliser industry was a laggard sector for years due to overhang of policy control,
higher manufacturing costs (due to naphtha cost) and no capacity expansion. Since 2009,
fertilizer policy has, however, shifted away from regulated returns in complex fertilizers to
import parity realizations. NBS has sparked hopes of prosperity in the industry. NBS policy
for decontrolled Phosphatic & Potassic (P&K) fertilizers has been implemented wef April
2010. Under NBS, the subsidy on decontrolled P&K fertilizers is determined for each
nutrient on per kg basis and fixed by the Government on annual basis. NBS is fixed taking
into consideration affordability of the farmer and prevalent price level of fertilizers and
fertilizer inputs in the international market at that time. Since the subsidy for each grade of
CEE VEE AGRIENCE PVT. LTD
12
fertilizers is fixed for a year, the Maximum Retail Price (MRP) of fertilizers at farm gate level
has been freed. Accordingly, the MRP of P&K fertilizers is decided and fixed by the fertilizer
producing companies or the importers. However, they are required to print MRP along with
applicable amount of subsidy on each fertilizer bag clearly.
The international prices of fertilizers and its raw materials in the year 2011 increased
substantially as compared to the prices in the year 2010. This increase in international
prices of fertilizers and its raw materials were taken into account while fixing the subsidy
rate under the NBS Scheme for the year 2011-12. However, any further increase or
decrease in international prices of fertilizers and its raw material is expected to have some
effect in the MRP of these fertilizers. The NBS was a life-changer for the industry and
potential for profits of companies has increased.
SSP IMPORTS AND IMPORT PRICES HAVE INCREASED SIGNIFICANTLY IN FY12 AND COMPLEX
FERTILIZER OUTPUT IS EXPECTED TO INCREASE IN FY13:
SSP imports in 9MFY12 were ~32% higher than that in 9MFY11. SSP import prices in FY12
have been significantly higher as well. As seen in the chart above titled “Import Trends and
Prices”, a spike in import prices is observed from May 2011 along with a rise in import
quantity. This has resulted in ~80% rise in value of imports of SSP. It is evident that the
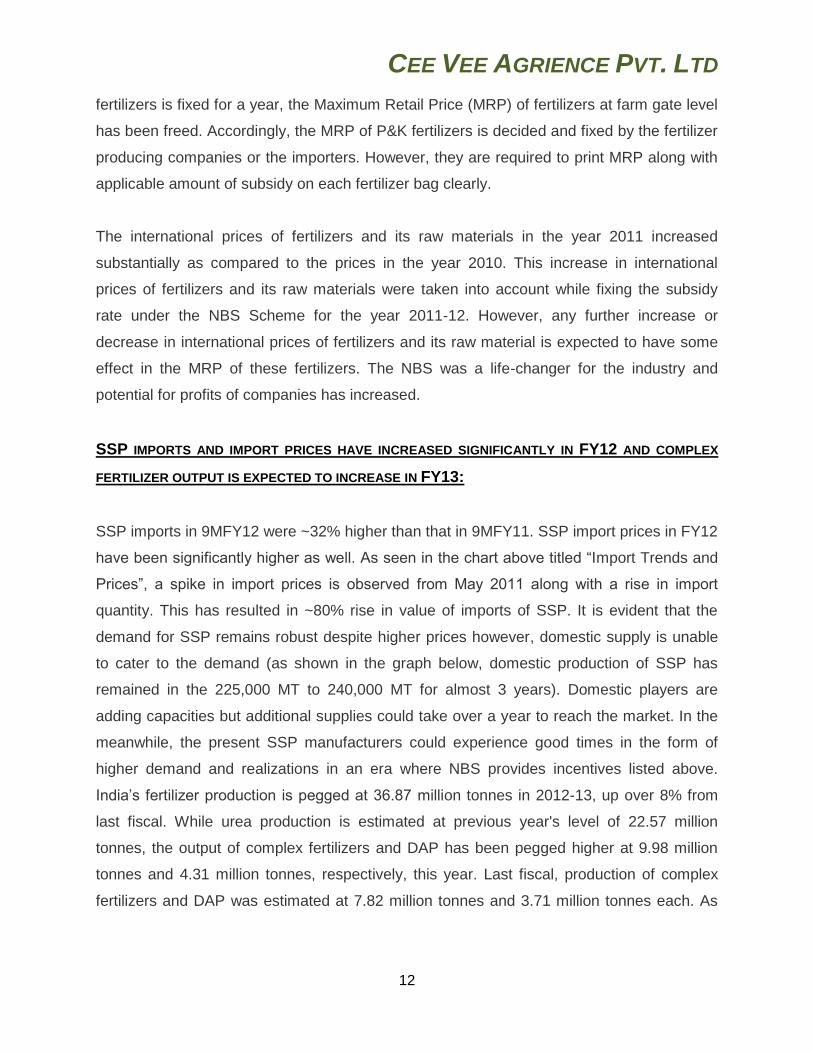
demand for SSP remains robust despite higher prices however, domestic supply is unable
to cater to the demand (as shown in the graph below, domestic production of SSP has
remained in the 225,000 MT to 240,000 MT for almost 3 years). Domestic players are
adding capacities but additional supplies could take over a year to reach the market. In the
meanwhile, the present SSP manufacturers could experience good times in the form of
higher demand and realizations in an era where NBS provides incentives listed above.
India’s fertilizer production is pegged at 36.87 million tonnes in 2012-13, up over 8% from
last fiscal. While urea production is estimated at previous year's level of 22.57 million
tonnes, the output of complex fertilizers and DAP has been pegged higher at 9.98 million
tonnes and 4.31 million tonnes, respectively, this year. Last fiscal, production of complex
fertilizers and DAP was estimated at 7.82 million tonnes and 3.71 million tonnes each. As
CEE VEE AGRIENCE PVT. LTD
13
estimated by the government, complex fertilizer output is expected to increase by ~28% in
FY13, indicating a possible good year for SSP.
POSSIBLE DECONTROL OF UREA PRICES:
In an effort to decontrol prices, the Ministry of Chemicals and Fertilizers approved the NBS
in March 2010. The introduction of this subsidy led to the freedom of pricing. However, due
to its high demand and usage and low price, urea price was not decontrolled. The
government has increased urea prices at times indicating an effort to decontrol them as well
but the final plunge is yet to be taken. Indian farmers overuse urea, as it is cheap because
of high government subsidy. This also results in the government spending close to Rs.
21,500 cr on Urea subsidy (FY11), which accounts for ~40% of the government’s total
fertilizer subsidy expense. An overdose of urea has led to degradation of land quality, a
problem that could be solved by using phosphoric fertilizers to neutralize the land. A
possible decontrol in urea pricing could lead to a significant jump in its price and hence, loss
of attractiveness. Presently the price of Urea is ~Rs. 5.3/kg while that of SSP is ~Rs. 6.0/kg
and DAP ~Rs.19.0/kg. While the difference between urea and SSP does not seem too
large, that between SSP and DAP is wide enough. Hence to restore soil quality, the farmer
will be willing to buy SSP (slightly expensive compared to urea – but far cheaper than DAP).
If Urea prices are decontrolled, they are likely to become higher than those of SSP and
CEE VEE AGRIENCE PVT. LTD
14
farmers would consider shifting to SSP even more to enhance the quality of their land. That
being said, the timing and certainty of such decontrol (of urea) cannot be ascertained
presently. As per reports, the fertilizer ministry is likely to send the new urea policy
proposing a 10% hike in prices to the Cabinet for approval. In the past ten years, the
government has raised urea prices only once by 10% to Rs. 5.3/kg. If the prices are revised,
it will help the government to reduce its subsidy bill by ~ Rs. 2,000 crore.
POSITIVE OUTLOOK FOR THE FERTILIZER INDUSTRY IN THE BUDGET FOR 2012-2013:
Finance Minister Pranab Mukherjee in his budget speech for FY13 made announcements
that are likely to benefit fertilisers and agriculture related companies. The provision for
fertiliser subsidy was reduced to Rs. 60,794 crore from Rs. 67,199 cr in FY12.
The government announced that investment -linked deduction of capital expenditure
incurred is proposed to be provided at the enhanced rate of 150% as against 100% at
present for fertilizer. It exempted 5% customs duty on import of equipment for initial setting
up or substantial expansion of fertilizer projects for a period of three years. The finance
minister in his speech also said that the focus would now be to encourage the use of SSP
more because for the government that subsidy is easy to control and good for the crops as
well. Basic customs duty on a few soluble fertilizers and liquid fertilizers, other than urea,
has been reduced from 7.5% to 5% and from 5% to 2.5% respectively. Also, complete
exemption from basic customs duty will be provided to new fertilizer projects, a move that
will encourage new entrants and push existing players to set up new plants.
FALL IN DAP IMPORTS AND CONTINUED PRICE DIFFERENTIAL DENOTE SHIFT IN BUYING FROM
DAP TO SSP:
Import of key fertiliser DAP has declined by 7% to 6.87 million tonnes in the April-February
period of FY12. India had imported 7.41 million tonnes of the important crop nutrient in the
year-ago period. The requirement of DAP in the rabi 2011-12 season (October-February)
stood at 5.16 million tonnes, while the availability of the soil nutrient was 5.62 million tonnes
during the period. Reduction in DAP usage could indicate an increase in SSP usage in the
CEE VEE AGRIENCE PVT. LTD
15
same period. DAP is significantly more expensive than SSP and Urea. DAP costs ~Rs.
19/kg while SSP costs only Rs. 6/kg and Urea costs ~Rs. 5.3/kg. The huge price differential
discourages farmers from using DAP. Moreover, over the years, the price difference
between DAP and Urea has widened from ~50% in FY11 to ~70% in FY12. However, the
landed cost of imported DAP has fallen in the last six months, from $ 675-660 a tonne to
around $ 540, with expectations of it easing further to $ 510-520 levels. As DAP consists of
46% phosphorous (compared to 16% in SSP), it is more impacted by phosphorous prices. A
higher reduction in subsidy on phosphorous and in turn on DAP has helped SSP become
more competitive vis-à-vis DAP. This situation could reverse only if there is a sharp
reduction in prices of phosphorous. In such an event, reduction in DAP prices could
cannibalise SSP consumption. Till then SSP consumption could keep rising steadily.
CONCERNS
AGRICULTURAL PRODUCTIVITY AND SEASONALITY:
The fertilizer industry is entirely dependant on the agriculture industry, which in turn is
dependant on several factors such as quality of seeds and soil, irrigation and weather.
Weather is a factor beyond the control of any individual and any extreme weather in a year
(drought, flood, excess heat/cold etc) could negatively impact the sales of the industry.
Moreover, the kharif and rabi seasons in the agriculture industry make demand for fertilizers
seasonal. Q4 is traditionally a dull quarter across the SSP industry with low volumes
followed by Q2, which means that the results of Q4FY12 might not be impressive across the
board.
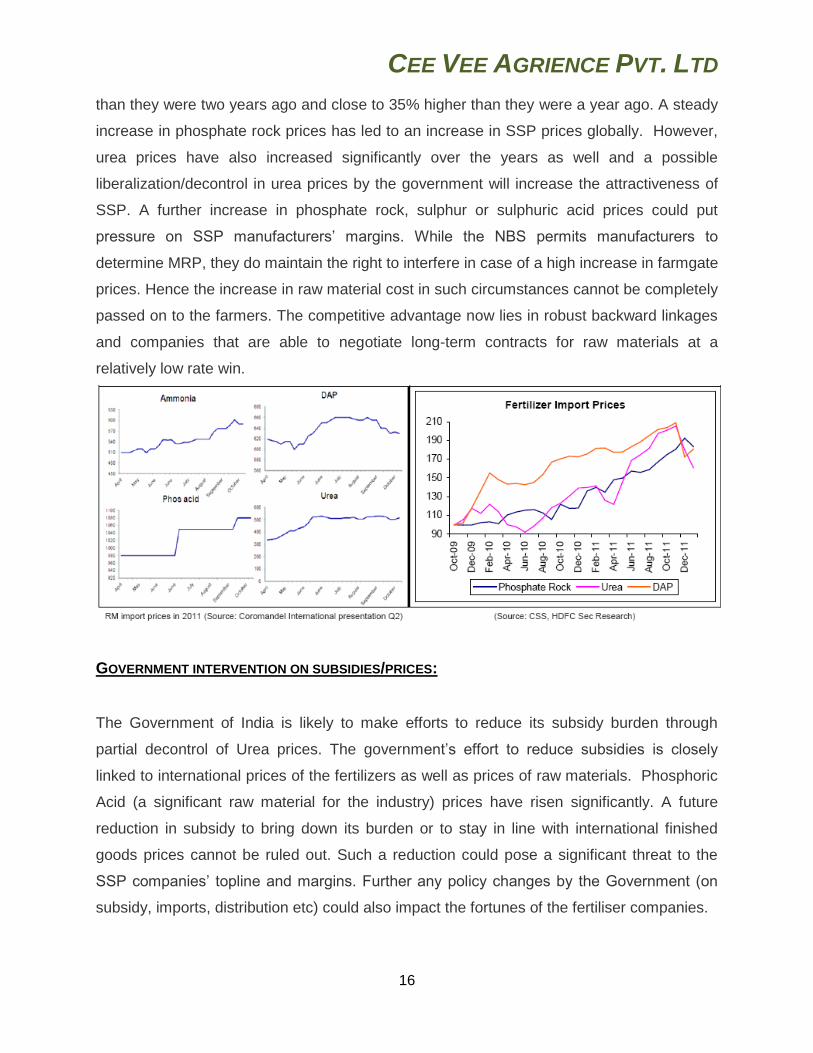
RAW MATERIAL PRICES:
Major raw materials of the industry are Phosphate rock, Sulphuric Acid, Sulphur and
Calcium. Sulphur prices have been rising and landed cost for the raw material in September
2011 was close to 40% higher than that in September 2010. While prices are still far below
their 2007-2008 highs, the current uptrend could diminish margins. Phosphate rock prices
have been rising steadily for a couple of years as well and are currently close to 70% higher
CEE VEE AGRIENCE PVT. LTD
16
than they were two years ago and close to 35% higher than they were a year ago. A steady
increase in phosphate rock prices has led to an increase in SSP prices globally. However,
urea prices have also increased significantly over the years as well and a possible
liberalization/decontrol in urea prices by the government will increase the attractiveness of
SSP. A further increase in phosphate rock, sulphur or sulphuric acid prices could put
pressure on SSP manufacturers’ margins. While the NBS permits manufacturers to
determine MRP, they do maintain the right to interfere in case of a high increase in farmgate
prices. Hence the increase in raw material cost in such circumstances cannot be completely
passed on to the farmers. The competitive advantage now lies in robust backward linkages
and companies that are able to negotiate long-term contracts for raw materials at a
relatively low rate win.
GOVERNMENT INTERVENTION ON SUBSIDIES/PRICES:
The Government of India is likely to make efforts to reduce its subsidy burden through
partial decontrol of Urea prices. The government’s effort to reduce subsidies is closely
linked to international prices of the fertilizers as well as prices of raw materials. Phosphoric
Acid (a significant raw material for the industry) prices have risen significantly. A future
reduction in subsidy to bring down its burden or to stay in line with international finished
goods prices cannot be ruled out. Such a reduction could pose a significant threat to the
SSP companies’ topline and margins. Further any policy changes by the Government (on
subsidy, imports, distribution etc) could also impact the fortunes of the fertiliser companies.
CEE VEE AGRIENCE PVT. LTD
17
FOREX RISK:
Forex risk is a major concern for most players in the industry as most of the raw material
used in the industry is imported. Rama Phosphate used Rs. 75.5 cr of forex in FY11.
Khaitan Chemicals used ~Rs. 94.8 cr in FY11 and earned only Rs. 0.9 cr in the year.
Liberty Phosphates used Rs. 74.6 cr of forex in FY11 and earned only Rs. 0.3 cr of forex in
the year. As mentioned earlier, India is dependent on imported feedstock (rock phosphate,
phosphoric acid), as domestic capacities have not matched the growth in demand. With the
current depreciation in the value of the Rupee, companies could report forex losses in the
coming quarters/year. Forex loss for 9MFY12 for Khaitan Chemicals and Liberty
Phosphates was Rs. 13.8 cr and Rs. 5.5 cr respectively.
CONCLUSION
After the NBS was put into effect in 2010, non-urea fertilizers have seen good times. SSP
is highly nutritious for the soil and the government is trying to promote its use to prevent soil
from getting exhausted due to overuse of Urea. The India fertilizer market has been growing
with the fertilizer quantity per kilo of food grain steadily rising. While the NBS’ goal is to
decontrol the fertilizer industry, the government could still interfere when required. India is
one of the largest fertilizer consumers in the world and with stagnant domestic supply,
imports have been increasing. Several large players are in the process of adding SSP
capacities as the current market structure makes it an extremely profitable venture. Finished
goods prices have increased significantly due to decontrol and an increase in global raw
material prices. Despite a fall in DAP prices, there is a large price difference between DAP
and SSP and a relatively small price difference between SSP and Urea. In the possible
scenario of decontrolled Urea prices, SSP companies will benefit significantly. SSP sales
depend on agriculture, which makes it a seasonal industry. All SSP manufacturers import
raw material, exposing them all to forex risk. Moreover, government regulation in a farmer-
sensitive industry is always a major concern. Seeing the niche price-nutrient advantage, it
is believed that the SSP space is expected to perform well in the near to medium term.
CEE VEE AGRIENCE PVT. LTD
18
MARKET SCENARIO
Fertilizer in the agricultural process is an important area of concern. Fertilizer industry in
India has succeeded in meeting the demand of all chemical fertilizers in the recent years.
An impetus to the growth of fertilizer industry in India was given by Green revolution in
Sixties. Further a significant addition to the production was witnessed in seventies and
eighties. The fertilizer industry has played a pivotal role in achieving self sufficiency in food
grains as well as in rapid and sustained agricultural growth.
India is third largest producer and consumer in the world after China and the United States.
According to given Statistics, total capacity of the industry as on 30.01.2003 has reached a
level of 121.10 lakh MT of nitrogen (inclusive of an installed capacity of 208.42 lakh MT of
urea after reassessment of capacity) and 53.60 lakh MT of phosphate nutrient. The growth
of Indian fertilizer has been largely determined by the policies pursued by the government
which mainly confine to controls on the pricing, distribution and movement of fertilizers. The
industry is capital intensive and the production process energy intensive with the combined
cost of feedstock and fuel accounting for anywhere between 55 and 80 per cent of cost of
production, depending on the type of fertilizers.
PRESENT STATUS OF FERTLIZER INDUSTRY
India being the third largest producer and consumer of fertilizers in the world with an
installed capacity of Nitrogen (N) and Phosphate (P) nutrients at 14 million tones p.a. Urea,
a nitrogenous type of fertilizer, is most widely consumed in India. Currently the urea
capacity is 20.2 million tonnes while consumption is 21.7-million tonnes. Fertilizer
production is highly energy intensive with cost of feedstock and fuel alone accounting for
between 55 to 80 per cent of the cost of production. Plants in India is based primarily on
three feed stock naphtha, fuel oil and natural gas with a significant proportion of domestic
capacity of urea plants based on naphtha or fuel oil which cost more than natural gas. High
cost feedstock and increased production/consumption have caused a steady increase in
fertilizer subsidy. The investment in the fertilizer industry witnessed a rapid growth rate over
the successive plan periods for creation of new capacities and expansion of the existing
units. The amount increased to Rs 154.77 bn by the end of the Eighth Plan and to Rs
256.44 bn by the end of the Ninth Plan.
CEE VEE AGRIENCE PVT. LTD
19
Over the past few years, the import dependence for the supply of urea, phosphatic fertilizers
and DAP has increased as the domestic production has not been sufficient to meet the
demand, thus leaving a gap between demand and supply. The entire demand for potassium
fertilizer is met through imports as the domestic sources of potash are of low-quality and are
uneconomical for exploitation. This has also led to an increase in the subsidy outgo. To
support the domestic fertilizer production, the government has announced a cut back in the
customs duty on crude and unrefined sulphur from 5% to 2% during FY09 and has
exempted naphtha from the import duty. India is capable of attaining self-sufficiency in urea
production considering the current availability and projected availability of hydrocarbon
(natural gas) resources in India; natural gas is an important feedstock for urea. In the past
years, the import dependence has increased in the sector due to the lack of significant
investments and rising demand and supply gap. India has been importing urea from the
UAE and the CIS countries continuously over the years, however, currently China has been
emerging as the largest-importing country.
Over the years, near stagnation in capacity expansion and lack of investments in the
fertilizer sector increased the demand-supply gap, and therefore, the imports. Unless,
sufficient capacity expansion and exploitation of new sources of raw material does not take
place, the burden of subsidy is not likely to come down.
FERTILZERS DEMAND & CONSUMPTION
Growing population and shrinking land resources have led to vertical expansion of
agriculture, that is, have increased the number of crop cycles. Fertilizers play an important
role in increasing the fertility of the soil and thus productivity. However, fertilizer
consumption also depends on various agriculture related factors such as soil quality,
farming methods, cropping pattern, rainfall and irrigation patterns, different geographical
aspects, calamities, availability of technology and information, varieties and quality of seeds
as well as access to capital and credit and other inputs. Moreover, macro oriented factors
such as crop-related market forces and fertilizer pricing policies also influence fertilizer
consumption. The average annual growth of fertilizer consumption achieved at the end of
the Tenth Plan was about4%. During the start of the Tenth Plan Period, that is, FY03, the
country was drought affected, and therefore, its consumption of fertilizers fell by about
7.30% over the previous year. However, the growth in consumption started picking up
CEE VEE AGRIENCE PVT. LTD
20
during the following years. In fact, the increase in consumption was higher than the growth
in production and the balance was met with imports.
INVESTMENT AND GROWTH IN SSP FERTILIZERS
SSP is a cheaper alternative to the popular diammonium phosphate (DAP) and is obtained
through a chemical reaction between rock phosphate and sulphuric acid. It provides critical
potassium nutrients to soils while also adding calcium and sulphur micronutrients at a
relatively low price.
SSP DEMAND GROWTH
SSP demand in India has grown in recent years as the cost of its more expensive
substitute, DAP, has risen. DAP prices have gained in recent years due to rising demand for
phosphate products, which has put the product out of reach for many of India’s food
producers. The situation was exacerbated when the Indian government announced a 27.4-
percent reduction in phosphate fertilizer price support for the 2012 to 2013 fiscal year in
March of last year.
India’s modern nutrient-based subsidy policy for complex fertilizers was introduced in 1992
after the sector was “decontrolled” and witnessed rapidly expanding prices. Subsidies were
extended to SSP in 1993, and a number of changes to the subsidy formula occurred along
the way.
But with recent claw backs in the nutrient-price assistance that is provided to farmers, SSP
has become the only phosphate fertilizer that many Indian farmers can afford.
SSP production is primarily attractive because of its low price point. The relative ease of
production and the fact that it can be produced using locally sourced rock phosphate, a
quality of phosphate that is not appropriate for DAP production, are also making it an
increasingly popular product. Currently, all Indian DAP products are imported from foreign
producers like Moroccan phosphate producer Office Cherifien des Phosphates and Russian
fertilizer group Phosagro (MCX:PHOR). That is problematic because in 2011 India used
about twice as much DAP as it did SSP, with 7 and 3.1 million tonnes respectively being
consumed, according to Fertilizer Association of India data provided by Reuters.
CEE VEE AGRIENCE PVT. LTD
21
The belief is that higher DAP prices will cause SSP demand to increase, allowing it to
potentially rise to 4 million tonnes in 2012.
NUTRIENT BASED SUBSIDY
In the context of Nation’s food security, the declining response of agricultural productivity to
increased fertilizer usage in the country and to ensure the balanced application of fertilizers,
the Government has introduced the Nutrient Based Subsidy (NBS) Policy with effect from
1.4.2010 for decontrolled P & K fertilizers (w.e.f. 1.5.2010 for SSP). As per this policy, the
fertilizers namely DAP, MOP, NPKS complexes, MAP, TSP, Ammonium Sulphate (AS) and
Single Super Phosphate (SSP) are provided to the farmers at the subsidized rates based on
the nutrients (N, P, K & S) contained in these fertilizers.. NBS has been announced for
2010-11 on annual basis based on prevailing international prices and price trends. The
details of Nutrient Based Subsidy Policy are as under:
NBS is applicable for Di Ammonium Phosphate (DAP, 18-46-0), Muriate of Potash (MOP),
Mono Ammonium Phosphate (MAP, 11-52-0), Triple Super Phosphate (TSP, 0-46-0), 12
grades of complex fertilizers and Ammonium Sulphate (AS - (Caprolactum grade by GSFC
and FACT), which were covered under the earlier Concession Scheme for Phosphatic and
Potassic (P&K) fertilizers up to 31st March 2010 and Single Super Phosphate (SSP).
Primary nutrients, namely Nitrogen 'N', Phosphate 'P' and Potash 'K' and nutrient Sulphur
'S' contained in the fertilizers mentioned above are eligible for NBS.
Any variant of the fertilizers mentioned above with secondary and micro-nutrients (except
Sulphur 'S'), as provided for under FCO, is also eligible for subsidy. The secondary and
micro-nutrients (except 'S') in such fertilizers attracts a separate per tonne subsidy to
encourage their application along with primary nutrients.
NBS to be paid annually on each nutrient namely, 'N', 'P', 'K' and 'S' has been decided by
the Government for 2010-11 on recommendation of IMC. For 2010-11, per kg NBS and per
tonne NBS for each subsidized fertilizer w.e.f 1st April 2010 has been announced.
Distribution and movement of fertilizers along with import of finished fertilizers, fertilizer
inputs and production by indigenous units continues to be monitored through the online web
CEE VEE AGRIENCE PVT. LTD
22
based "Fertilizer Monitoring System (FMS)" as being done under the outgoing Concession
Scheme for P&K fertilizers.
20% of the price decontrolled fertilizers produced/imported in India is now in the movement
control under the Essential Commodities Act 1955 (ECA). Department of Fertilizers will
regulate the movement of these fertilizers to bridge the supplies in under-served areas.
In addition to NBS, freight for the movement and distribution of the decontrolled fertilizers by
rail and road is being provided to enable wider availability of fertilizers in the country.
Import of all the subsidized P&K fertilizers, including 13 grades of complex fertilizers has
been placed under Open General License (OGL). Earlier, no concession was available for
imported complex fertilizers. Now, NBS is available for imported complex fertilizers also.
However, subsidy will not be applicable on imported Ammonium Sulphate (AS), as NBS is
applicable only to Ammonium Sulphate produced by FACT and GSFC, both Public Sector
entities. Import of Urea is canalized during the first phase of NBS Policy and Urea continues
under Government control. MRP of Urea has been increased by 10% w.e.f. 1.4.2010 and is
' 5310 PMT.
Though the market price of subsidized fertilizers, except Urea is determined based on
demand-supply balance, the fertilizer companies are required to print Maximum Retail Price
(MRP) along with applicable subsidy on the fertilizer bags clearly. Any sale above the
printed net MRP is punishable under the EC Act.
Manufacturers of customized fertilizers and mixture fertilizers are eligible to source
subsidized fertilizers from the manufacturers/ importers after their receipt in the districts as
inputs for manufacturing customized fertilizers and mixture fertilizers for agricultural
purpose. There is no separate subsidy on sale of customized fertilizers and mixture
fertilizers.
The NBS is being released through the industry during the first phase. The payment of NBS
to the manufacturers/ importers of DAP/MOP/Complex Fertilizers/ MAP/TSP, SSP and AS
is released as per the procedure notified by the Department.
CEE VEE AGRIENCE PVT. LTD
23
BENEFITS OF NUTRIENT BASED SUBSIDY (NBS):
The NBS announced in March 2010 has had several positive implications for non-urea
fertilizer manufacturers. Some benefits include:
Companies can now compete on cost efficiency, brand equity, distribution network
etc by charging competitive prices.
Companies can introduce various innovative products as opposed to the specific
products as mentioned under the Product Based Subsidy Scheme earlier.
Companies with stronger bargaining power with raw material suppliers can broaden
their margins.
Non-urea companies can compete as in a free market.
Companies can develop brands, an exercise that could benefit the company in the
long-term.
The government can reduce its subsidy related administrative expense.
MARKET DEMAND
SSP companies are currently on a good run. After the NBS was put into effect in 2010, non-
urea fertilizers have seen good times. SSP is highly nutritious for the soil and the
government is trying to promote its use to prevent soil from getting exhausted due to
overuse of Urea. The India fertilizer market has been growing with the fertilizer quantity per
kilo of food grain steadily rising. While the NBS’ goal is to decontrol the fertilizer industry,
the government could still interfere when required. India is one of the largest fertilizer
consumers in the world and with stagnant domestic supply, imports have been increasing.
Several large players are in the process of adding SSP capacities as the current market
structure makes it an extremely profitable venture. Finished goods prices have increased
significantly due to decontrol and an increase in global raw material prices. Despite a fall in
DAP prices, there is a large price difference between DAP and SSP and a relatively small
price difference between SSP and Urea. In the possible scenario of decontrolled Urea
prices, SSP companies will benefit significantly. SSP sales depend on agriculture, which
makes it a seasonal industry.
CEE VEE AGRIENCE PVT. LTD
24
In the state of Orissa, the entire market is currently supplied by manufacturers of SSP from
either Andhra Pradesh or West Bengal resulting in inconsistent supplies as these states
meet their home demands and supply only the residual production to Orissa. Being a cost-
effective fertilizer, SSP is critical for the small and marginal farmers who don’t have the
financial strength to purchase other high priced fertilizers. With a low cost fertilizer easily
available, added with suitable incentives to the stockists, consumption would be high.
Additionally, with a local production facility and transport subsidy available, the
transportation costs would be substantially reduced. Alternatively, SSP can be sold to large
companies wishing to increase their product mix by procuring SSP from small
manufacturers on a regular basis. SSP is also an exportable commodity with key markets
like Thailand and Bangladesh identified by the Government of India.
CEE VEE AGRIENCE PVT. LTD
25
NEW PROJECT
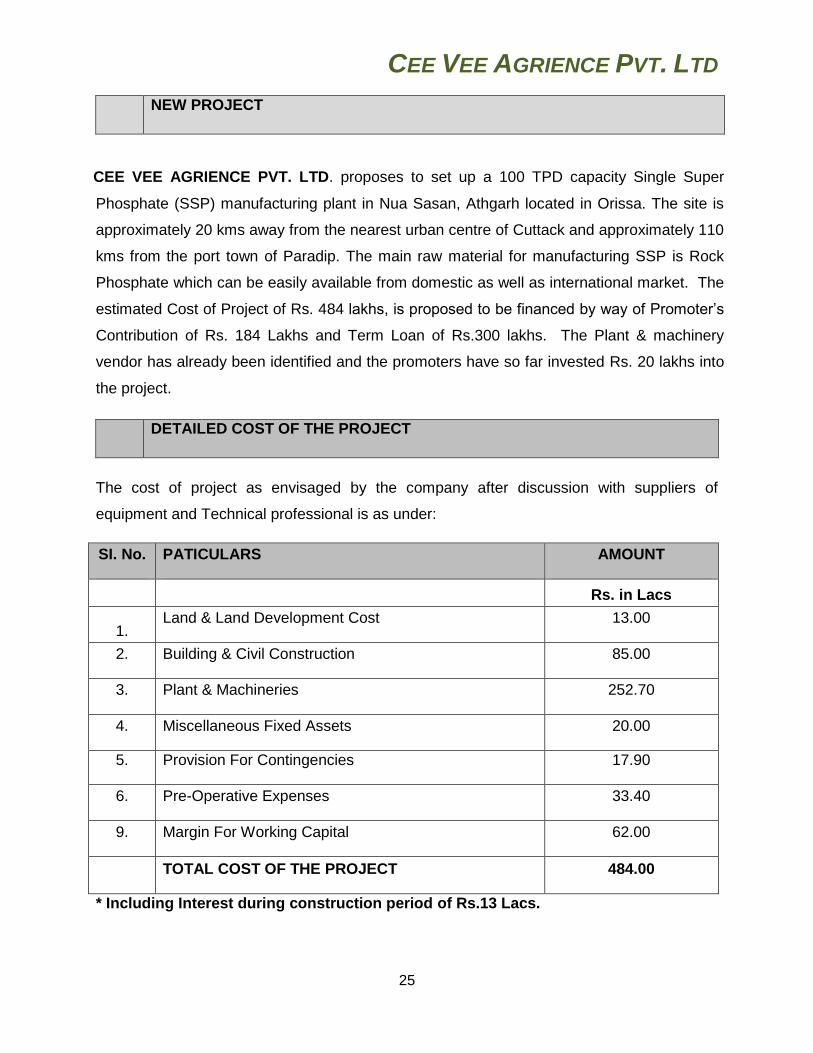
CEE VEE AGRIENCE PVT. LTD. proposes to set up a 100 TPD capacity Single Super
Phosphate (SSP) manufacturing plant in Nua Sasan, Athgarh located in Orissa. The site is
approximately 20 kms away from the nearest urban centre of Cuttack and approximately 110
kms from the port town of Paradip. The main raw material for manufacturing SSP is Rock
Phosphate which can be easily available from domestic as well as international market. The
estimated Cost of Project of Rs. 484 lakhs, is proposed to be financed by way of Promoter’s
Contribution of Rs. 184 Lakhs and Term Loan of Rs.300 lakhs. The Plant & machinery
vendor has already been identified and the promoters have so far invested Rs. 20 lakhs into
the project.
DETAILED COST OF THE PROJECT
The cost of project as envisaged by the company after discussion with suppliers of
equipment and Technical professional is as under:
SI. No. PATICULARS AMOUNT
Rs. in Lacs
1. Land & Land Development Cost 13.00
2. Building & Civil Construction 85.00
3. Plant & Machineries 252.70
4. Miscellaneous Fixed Assets 20.00
5. Provision For Contingencies 17.90
6. Pre-Operative Expenses 33.40
9. Margin For Working Capital 62.00
TOTAL COST OF THE PROJECT 484.00
* Including Interest during construction period of Rs.13 Lacs.
CEE VEE AGRIENCE PVT. LTD
26
The Item wise details of cost are provided below: -
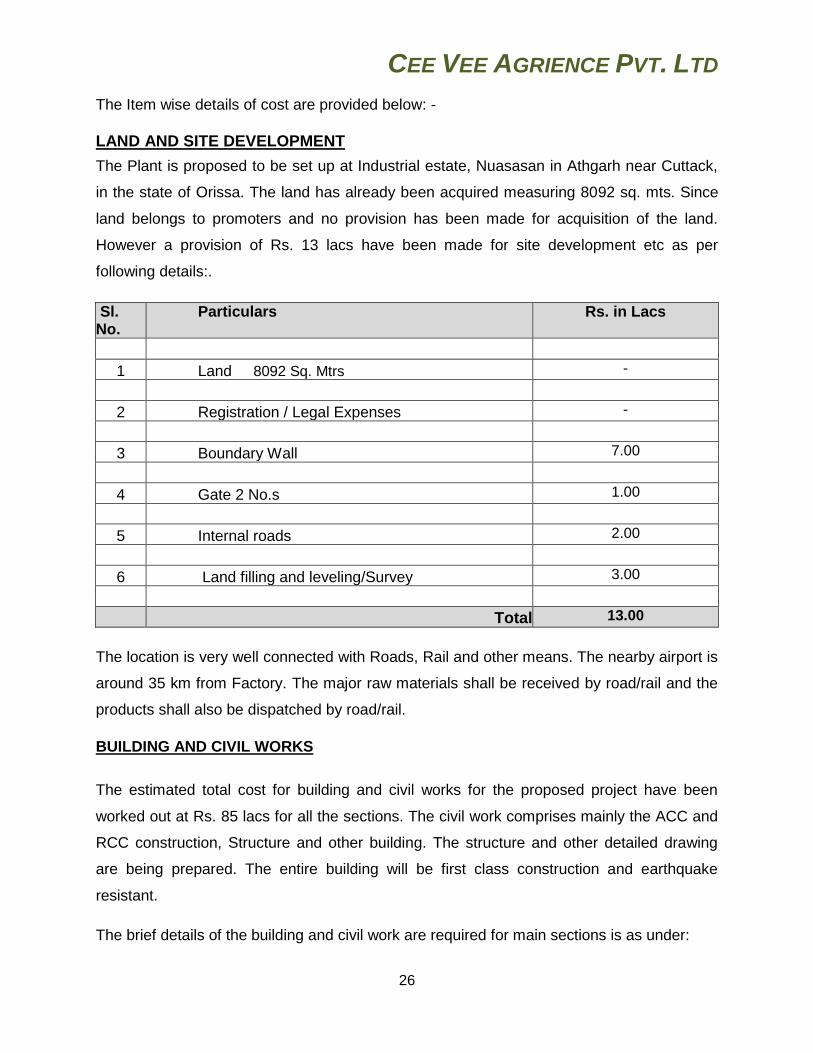
LAND AND SITE DEVELOPMENT
The Plant is proposed to be set up at Industrial estate, Nuasasan in Athgarh near Cuttack,
in the state of Orissa. The land has already been acquired measuring 8092 sq. mts. Since
land belongs to promoters and no provision has been made for acquisition of the land.
However a provision of Rs. 13 lacs have been made for site development etc as per
following details:.
Sl. No.
Particulars
Rs. in Lacs
1 Land 8092 Sq. Mtrs -
2 Registration / Legal Expenses -
3 Boundary Wall 7.00
4 Gate 2 No.s 1.00
5 Internal roads 2.00
6 Land filling and leveling/Survey 3.00
Total 13.00
The location is very well connected with Roads, Rail and other means. The nearby airport is
around 35 km from Factory. The major raw materials shall be received by road/rail and the
products shall also be dispatched by road/rail.
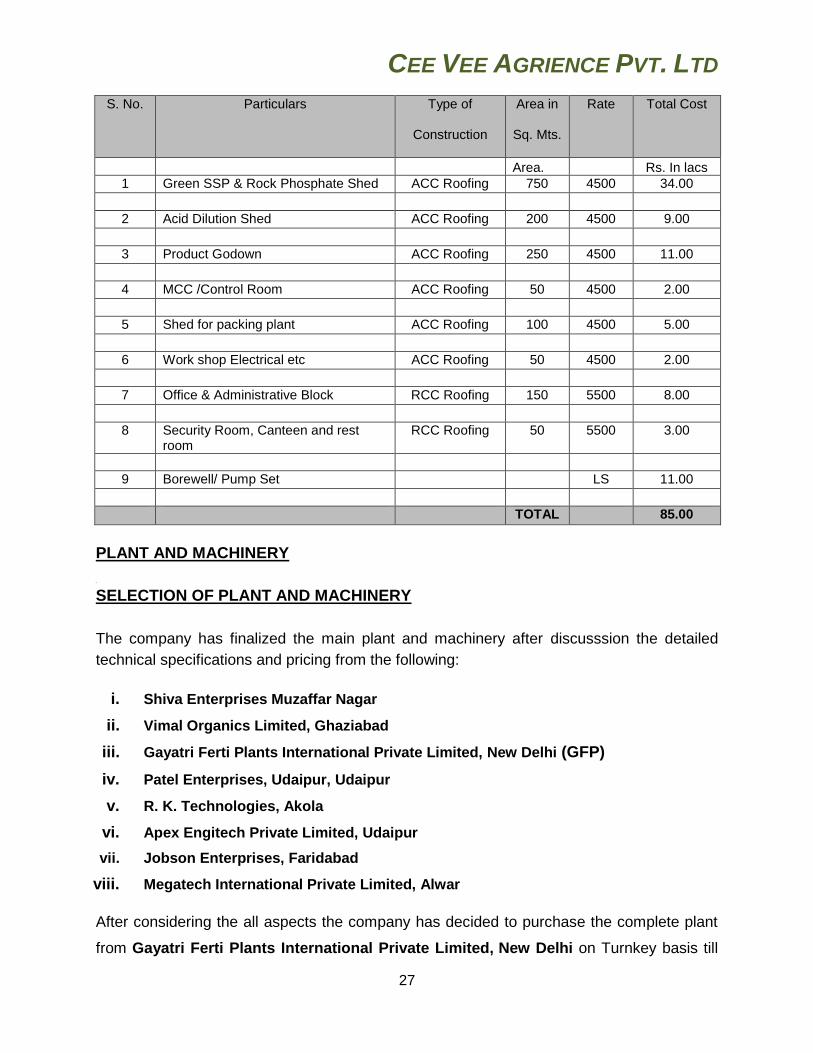
BUILDING AND CIVIL WORKS
The estimated total cost for building and civil works for the proposed project have been
worked out at Rs. 85 lacs for all the sections. The civil work comprises mainly the ACC and
RCC construction, Structure and other building. The structure and other detailed drawing
are being prepared. The entire building will be first class construction and earthquake
resistant.
The brief details of the building and civil work are required for main sections is as under:
CEE VEE AGRIENCE PVT. LTD
27
S. No. Particulars Type of
Construction
Area in
Sq. Mts.
Rate Total Cost
Area. Rs. In lacs
1 Green SSP & Rock Phosphate Shed ACC Roofing 750 4500 34.00
2 Acid Dilution Shed ACC Roofing 200 4500 9.00
3 Product Godown ACC Roofing 250 4500 11.00
4 MCC /Control Room ACC Roofing 50 4500 2.00
5 Shed for packing plant ACC Roofing 100 4500 5.00
6 Work shop Electrical etc ACC Roofing 50 4500 2.00
7 Office & Administrative Block RCC Roofing 150 5500 8.00
8 Security Room, Canteen and rest room
RCC Roofing 50 5500 3.00
9 Borewell/ Pump Set LS 11.00
TOTAL 85.00
PLANT AND MACHINERY
<
SELECTION OF PLANT AND MACHINERY
The company has finalized the main plant and machinery after discusssion the detailed
technical specifications and pricing from the following:
i. Shiva Enterprises Muzaffar Nagar
ii. Vimal Organics Limited, Ghaziabad
iii. Gayatri Ferti Plants International Private Limited, New Delhi (GFP)
iv. Patel Enterprises, Udaipur, Udaipur
v. R. K. Technologies, Akola
vi. Apex Engitech Private Limited, Udaipur
vii. Jobson Enterprises, Faridabad
viii. Megatech International Private Limited, Alwar
After considering the all aspects the company has decided to purchase the complete plant
from Gayatri Ferti Plants International Private Limited, New Delhi on Turnkey basis till
CEE VEE AGRIENCE PVT. LTD
28
the erection and commissioning. GFP’s team of technical personnel will assemble, erect, &
take trials of the equipments and commission the plant. The erection and commissioning of
the plant at site takes about 3 months under normal conditions. GFP will send the erection
team at site as 70% of the material exported to save time in erection and commissioning.
The inspection of equipments may be done before dispatch or any time during fabrication at
our site by the client or their representative at their own cost. We shall be sending the
photographs of the equipments on weekly basis to the clients on mail.
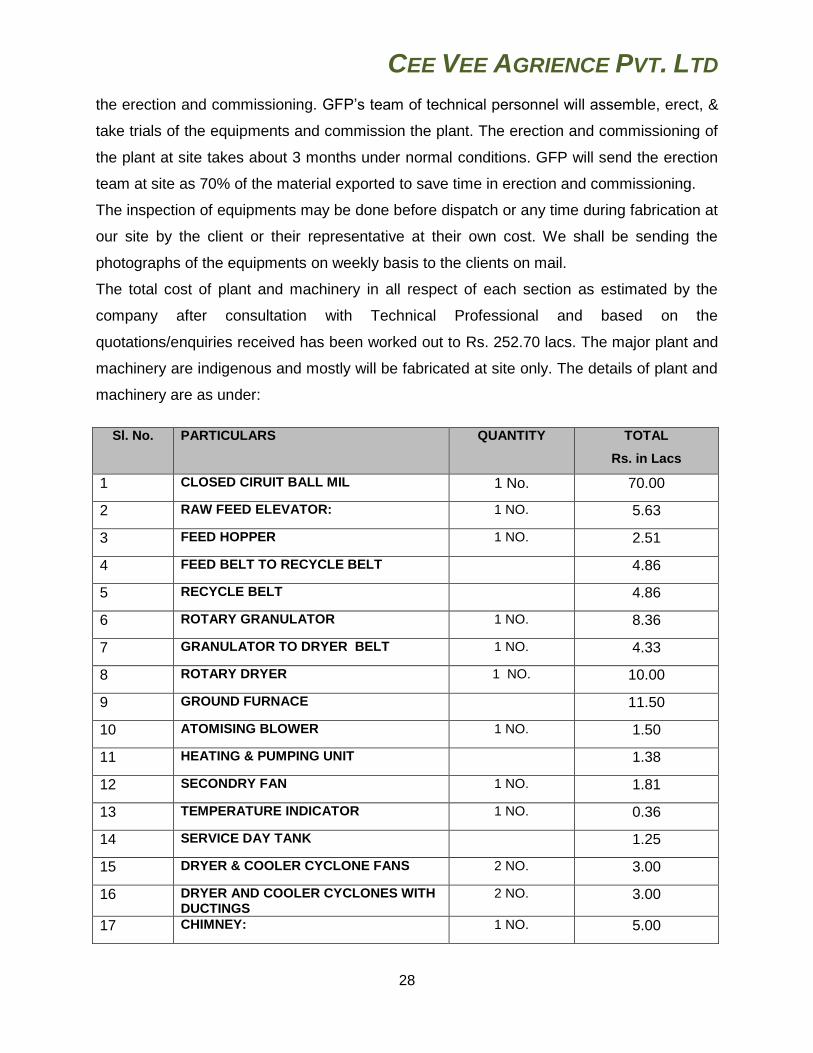
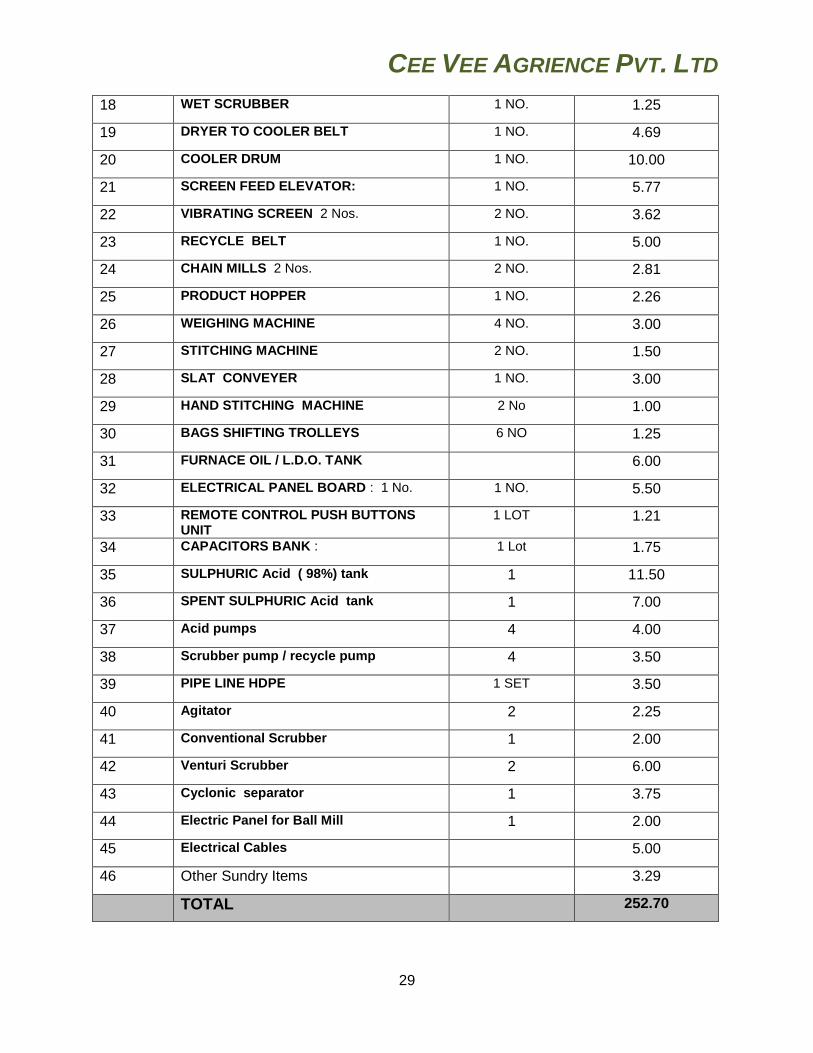
The total cost of plant and machinery in all respect of each section as estimated by the
company after consultation with Technical Professional and based on the
quotations/enquiries received has been worked out to Rs. 252.70 lacs. The major plant and
machinery are indigenous and mostly will be fabricated at site only. The details of plant and
machinery are as under:
Sl. No. PARTICULARS QUANTITY TOTAL
Rs. in Lacs
1 CLOSED CIRUIT BALL MIL 1 No. 70.00
2 RAW FEED ELEVATOR: 1 NO. 5.63
3 FEED HOPPER 1 NO. 2.51
4 FEED BELT TO RECYCLE BELT 4.86
5 RECYCLE BELT 4.86
6 ROTARY GRANULATOR 1 NO. 8.36
7 GRANULATOR TO DRYER BELT 1 NO. 4.33
8 ROTARY DRYER 1 NO. 10.00
9 GROUND FURNACE 11.50
10 ATOMISING BLOWER 1 NO. 1.50
11 HEATING & PUMPING UNIT 1.38
12 SECONDRY FAN 1 NO. 1.81
13 TEMPERATURE INDICATOR 1 NO. 0.36
14 SERVICE DAY TANK 1.25
15 DRYER & COOLER CYCLONE FANS 2 NO. 3.00
16 DRYER AND COOLER CYCLONES WITH DUCTINGS
2 NO. 3.00
17 CHIMNEY: 1 NO. 5.00
CEE VEE AGRIENCE PVT. LTD
29
18 WET SCRUBBER 1 NO. 1.25
19 DRYER TO COOLER BELT 1 NO. 4.69
20 COOLER DRUM 1 NO. 10.00
21 SCREEN FEED ELEVATOR: 1 NO. 5.77
22 VIBRATING SCREEN 2 Nos. 2 NO. 3.62
23 RECYCLE BELT 1 NO. 5.00
24 CHAIN MILLS 2 Nos. 2 NO. 2.81
25 PRODUCT HOPPER 1 NO. 2.26
26 WEIGHING MACHINE 4 NO. 3.00
27 STITCHING MACHINE 2 NO. 1.50
28 SLAT CONVEYER 1 NO. 3.00
29 HAND STITCHING MACHINE 2 No 1.00
30 BAGS SHIFTING TROLLEYS 6 NO 1.25
31 FURNACE OIL / L.D.O. TANK 6.00
32 ELECTRICAL PANEL BOARD : 1 No. 1 NO. 5.50
33 REMOTE CONTROL PUSH BUTTONS UNIT
1 LOT 1.21
34 CAPACITORS BANK : 1 Lot 1.75
35 SULPHURIC Acid ( 98%) tank 1 11.50
36 SPENT SULPHURIC Acid tank 1 7.00
37 Acid pumps 4 4.00
38 Scrubber pump / recycle pump 4 3.50
39 PIPE LINE HDPE 1 SET 3.50
40 Agitator 2 2.25
41 Conventional Scrubber 1 2.00
42 Venturi Scrubber 2 6.00
43 Cyclonic separator 1 3.75
44 Electric Panel for Ball Mill 1 2.00
45 Electrical Cables 5.00
46 Other Sundry Items 3.29
TOTAL 252.70
CEE VEE AGRIENCE PVT. LTD
30
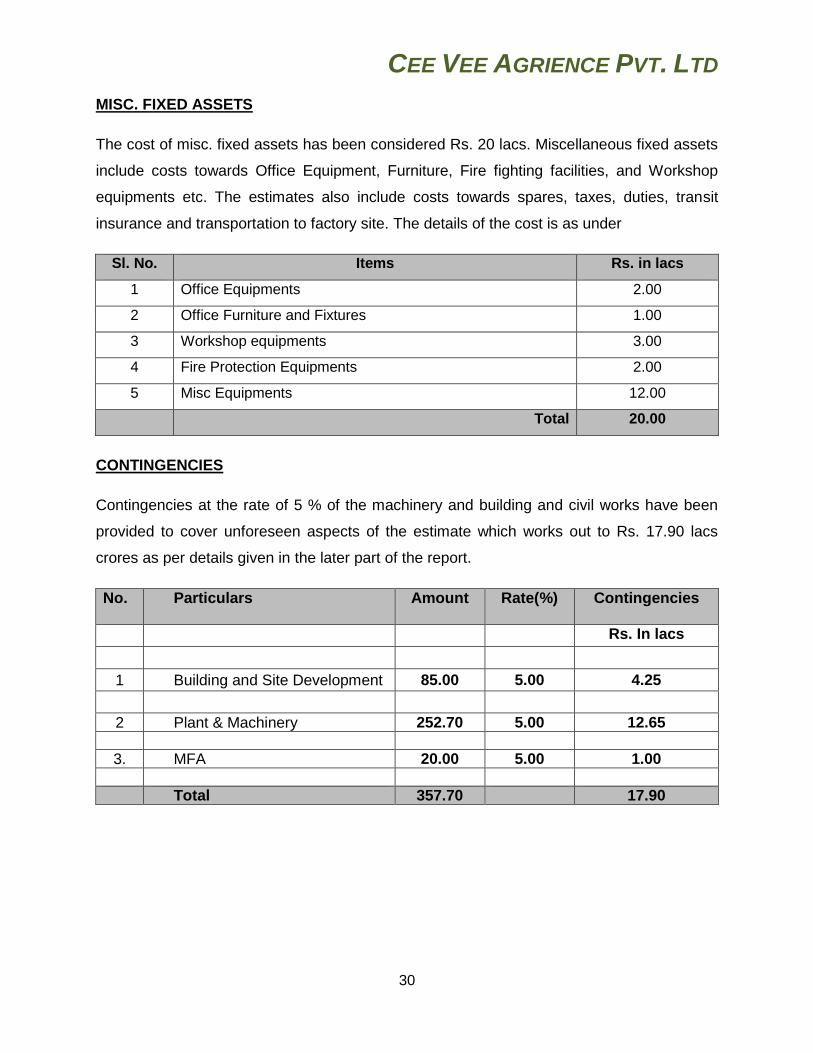
MISC. FIXED ASSETS
The cost of misc. fixed assets has been considered Rs. 20 lacs. Miscellaneous fixed assets
include costs towards Office Equipment, Furniture, Fire fighting facilities, and Workshop
equipments etc. The estimates also include costs towards spares, taxes, duties, transit
insurance and transportation to factory site. The details of the cost is as under
Sl. No. Items Rs. in lacs
1 Office Equipments 2.00
2 Office Furniture and Fixtures 1.00
3 Workshop equipments 3.00
4 Fire Protection Equipments 2.00
5 Misc Equipments 12.00
Total 20.00
CONTINGENCIES
Contingencies at the rate of 5 % of the machinery and building and civil works have been
provided to cover unforeseen aspects of the estimate which works out to Rs. 17.90 lacs
crores as per details given in the later part of the report.
No. Particulars Amount Rate(%) Contingencies
Rs. In lacs
1 Building and Site Development 85.00 5.00 4.25
2 Plant & Machinery 252.70 5.00 12.65
3. MFA 20.00 5.00 1.00
Total 357.70 17.90
CEE VEE AGRIENCE PVT. LTD
31
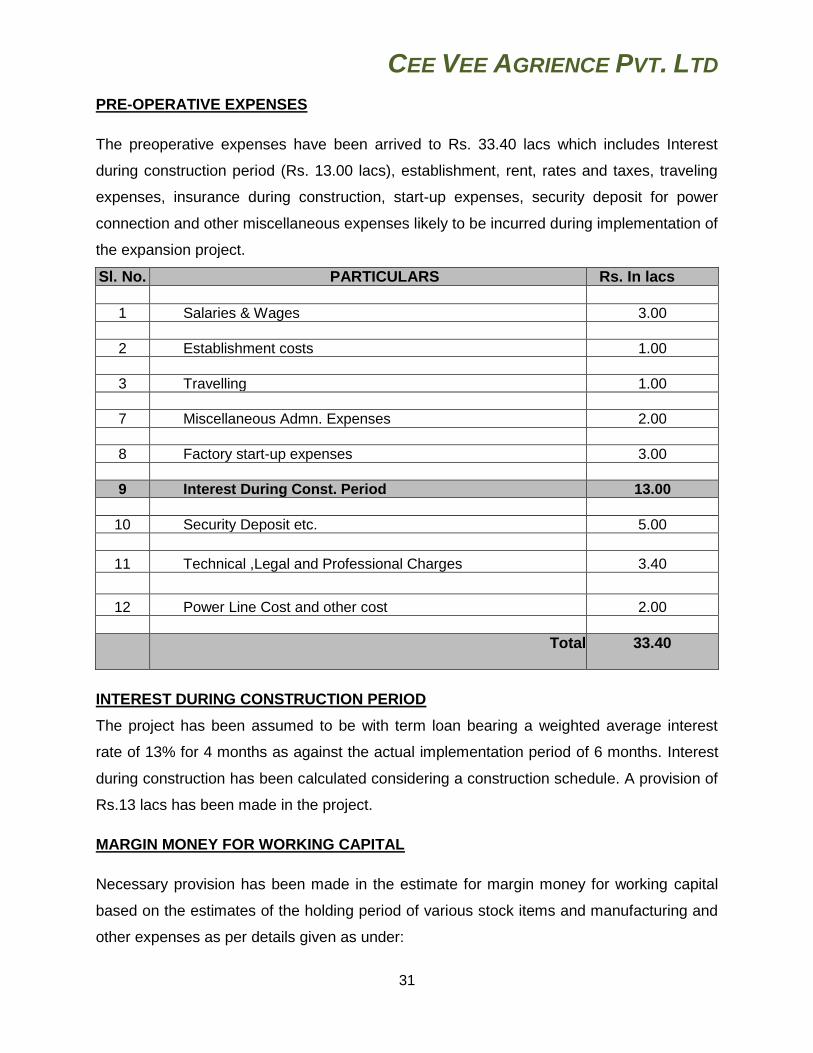
PRE-OPERATIVE EXPENSES
The preoperative expenses have been arrived to Rs. 33.40 lacs which includes Interest
during construction period (Rs. 13.00 lacs), establishment, rent, rates and taxes, traveling
expenses, insurance during construction, start-up expenses, security deposit for power
connection and other miscellaneous expenses likely to be incurred during implementation of
the expansion project.
Sl. No. PARTICULARS Rs. In lacs
1 Salaries & Wages 3.00
2 Establishment costs 1.00
3 Travelling 1.00
7 Miscellaneous Admn. Expenses 2.00
8 Factory start-up expenses 3.00
9 Interest During Const. Period 13.00
10 Security Deposit etc. 5.00
11 Technical ,Legal and Professional Charges 3.40
12 Power Line Cost and other cost 2.00
Total
33.40
INTEREST DURING CONSTRUCTION PERIOD
The project has been assumed to be with term loan bearing a weighted average interest
rate of 13% for 4 months as against the actual implementation period of 6 months. Interest
during construction has been calculated considering a construction schedule. A provision of
Rs.13 lacs has been made in the project.
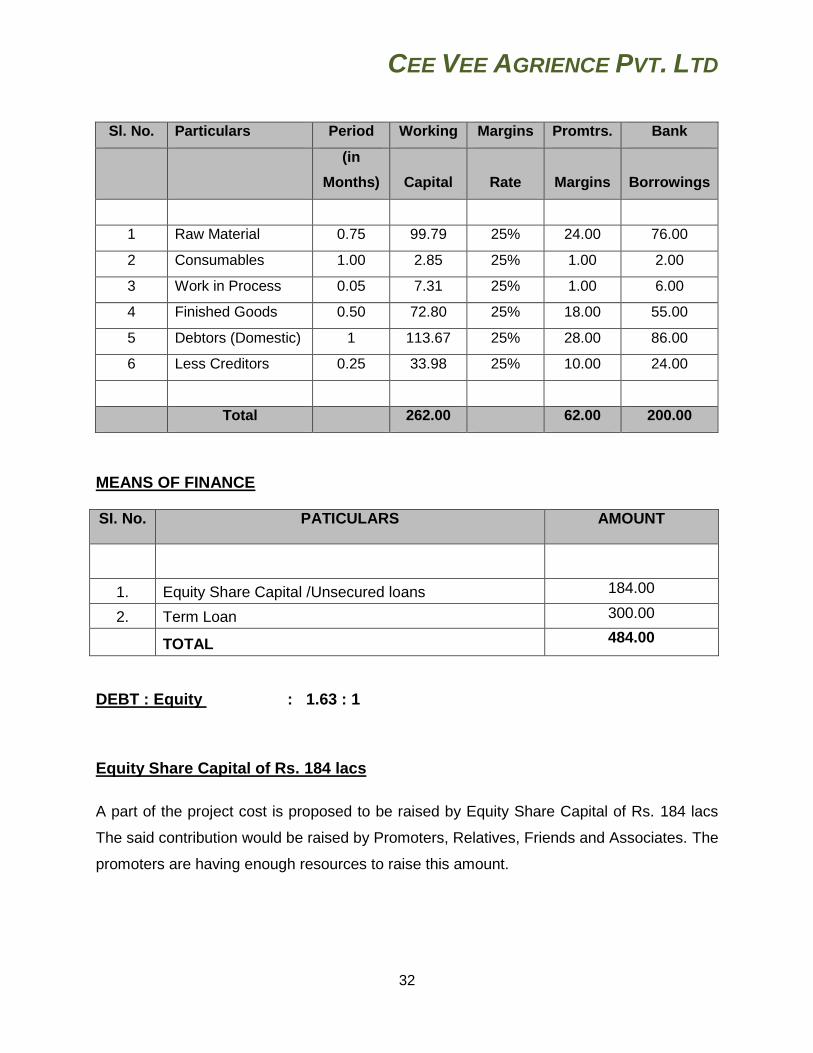
MARGIN MONEY FOR WORKING CAPITAL
Necessary provision has been made in the estimate for margin money for working capital
based on the estimates of the holding period of various stock items and manufacturing and
other expenses as per details given as under:
CEE VEE AGRIENCE PVT. LTD
32
Sl. No. Particulars Period Working Margins Promtrs. Bank
(in
Months) Capital Rate Margins Borrowings
1 Raw Material 0.75 99.79 25% 24.00 76.00
2 Consumables 1.00 2.85 25% 1.00 2.00
3 Work in Process 0.05 7.31 25% 1.00 6.00
4 Finished Goods 0.50 72.80 25% 18.00 55.00
5 Debtors (Domestic) 1 113.67 25% 28.00 86.00
6 Less Creditors 0.25 33.98 25% 10.00 24.00
Total 262.00 62.00 200.00
MEANS OF FINANCE
SI. No. PATICULARS AMOUNT
1. Equity Share Capital /Unsecured loans 184.00
2. Term Loan 300.00
TOTAL 484.00
DEBT : Equity : 1.63 : 1
Equity Share Capital of Rs. 184 lacs
A part of the project cost is proposed to be raised by Equity Share Capital of Rs. 184 lacs
The said contribution would be raised by Promoters, Relatives, Friends and Associates. The
promoters are having enough resources to raise this amount.
CEE VEE AGRIENCE PVT. LTD
33
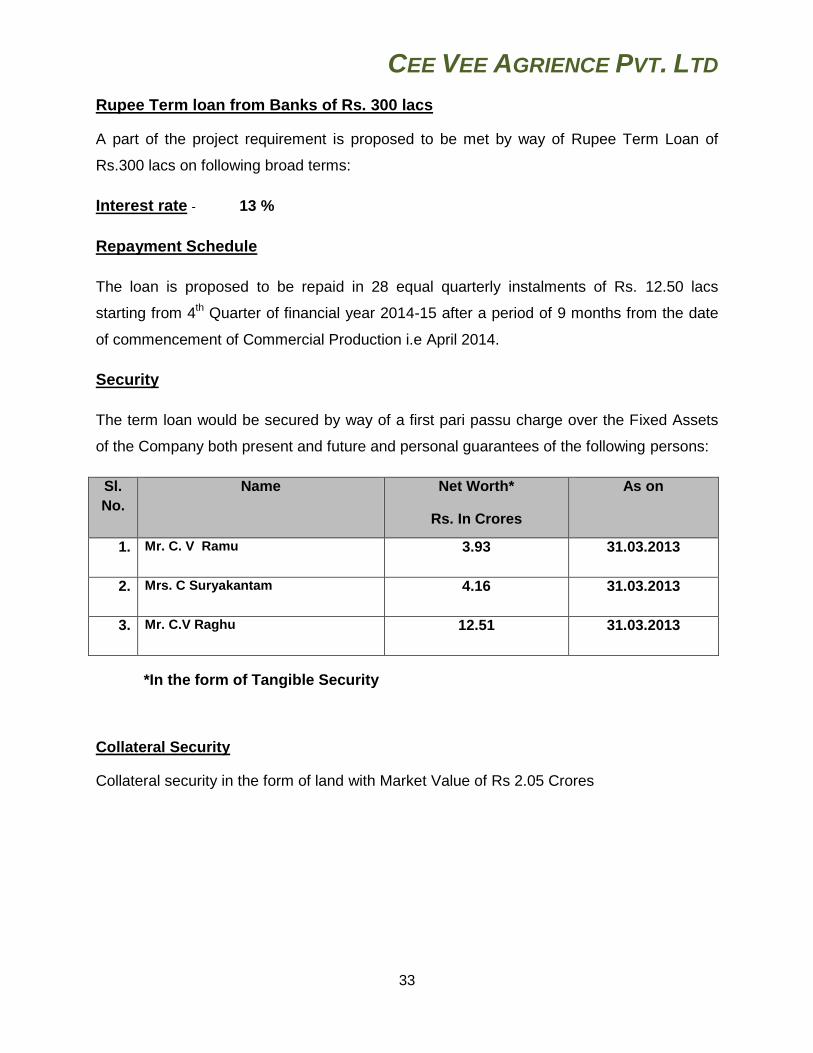
Rupee Term loan from Banks of Rs. 300 lacs
A part of the project requirement is proposed to be met by way of Rupee Term Loan of
Rs.300 lacs on following broad terms:
Interest rate - 13 %
Repayment Schedule
The loan is proposed to be repaid in 28 equal quarterly instalments of Rs. 12.50 lacs
starting from 4th Quarter of financial year 2014-15 after a period of 9 months from the date
of commencement of Commercial Production i.e April 2014.
Security
The term loan would be secured by way of a first pari passu charge over the Fixed Assets
of the Company both present and future and personal guarantees of the following persons:
Sl.
No.
Name Net Worth*
Rs. In Crores
As on
1. Mr. C. V Ramu 3.93 31.03.2013
2. Mrs. C Suryakantam 4.16 31.03.2013
3. Mr. C.V Raghu 12.51 31.03.2013
*In the form of Tangible Security
Collateral Security
Collateral security in the form of land with Market Value of Rs 2.05 Crores
CEE VEE AGRIENCE PVT. LTD
34
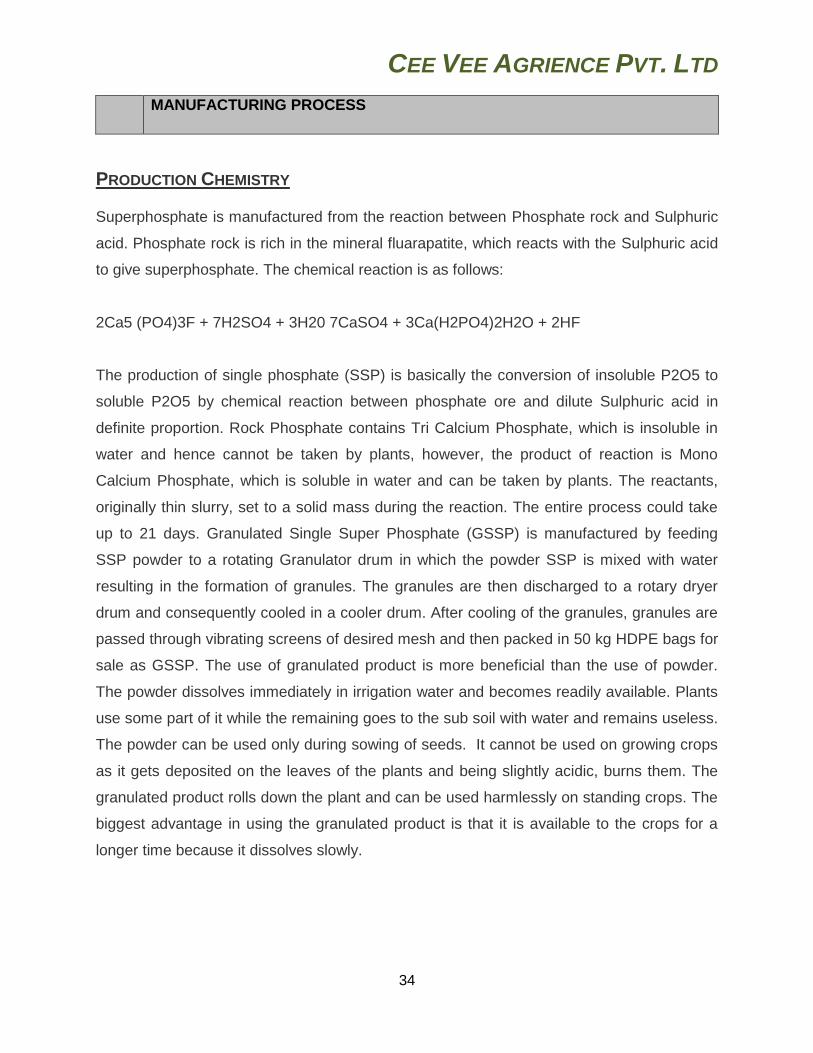
MANUFACTURING PROCESS
PRODUCTION CHEMISTRY Superphosphate is manufactured from the reaction between Phosphate rock and Sulphuric
acid. Phosphate rock is rich in the mineral fluarapatite, which reacts with the Sulphuric acid
to give superphosphate. The chemical reaction is as follows:
2Ca5 (PO4)3F + 7H2SO4 + 3H20 7CaSO4 + 3Ca(H2PO4)2H2O + 2HF
The production of single phosphate (SSP) is basically the conversion of insoluble P2O5 to
soluble P2O5 by chemical reaction between phosphate ore and dilute Sulphuric acid in
definite proportion. Rock Phosphate contains Tri Calcium Phosphate, which is insoluble in
water and hence cannot be taken by plants, however, the product of reaction is Mono
Calcium Phosphate, which is soluble in water and can be taken by plants. The reactants,
originally thin slurry, set to a solid mass during the reaction. The entire process could take
up to 21 days. Granulated Single Super Phosphate (GSSP) is manufactured by feeding
SSP powder to a rotating Granulator drum in which the powder SSP is mixed with water
resulting in the formation of granules. The granules are then discharged to a rotary dryer
drum and consequently cooled in a cooler drum. After cooling of the granules, granules are
passed through vibrating screens of desired mesh and then packed in 50 kg HDPE bags for
sale as GSSP. The use of granulated product is more beneficial than the use of powder.
The powder dissolves immediately in irrigation water and becomes readily available. Plants
use some part of it while the remaining goes to the sub soil with water and remains useless.
The powder can be used only during sowing of seeds. It cannot be used on growing crops
as it gets deposited on the leaves of the plants and being slightly acidic, burns them. The
granulated product rolls down the plant and can be used harmlessly on standing crops. The
biggest advantage in using the granulated product is that it is available to the crops for a
longer time because it dissolves slowly.
CEE VEE AGRIENCE PVT. LTD
35
MANUFACTURING PROCESS
Superphosphate is the fertilizer most commonly used in agriculture, to ensure that soil has a
sufficiently high phosphorous content. It is manufactured from the reaction between sulfuric
acid and ’phosphate rock’ (rock rich in the mineral fluorapatite, Ca5(PO4)3F) :
2Ca5(PO4)3F + 7H2SO4 + 3H2O → 7CaSO4 + 3Ca(H2PO4)2.H2O + 2HF
The basic reaction in the manufacture of superphosphate is the reaction of insoluble
phosphate rock with sulfuric acid to form the soluble calcium di-hydrogen phosphate,
Ca(H2PO4)2. This is described by the following equation:
PO4 3- + H2SO4 → H2PO4- + SO42-
The phosphate rock, imported from Egypt, Jordan, Morocco, Algeria and the USA, is mainly
fluorapatite, Ca5(PO4)3F and is equivalent to 70 - 85% Ca3(PO4)2 by weight. The actual
composition of the phosphate rock varies with the source. The sulfuric acid is produced on
the site as described in the previous section. The reactions occurring during the production
of superphosphate are complex and are usually summarised as follows:
1. Ca5(PO4)3F + 5H2SO4 → 5CaSO4 + 3H3PO4 + HF
2. Ca5(PO4)3F + 7H3PO4 + 5H2O → 5Ca(H2PO4)2.H2O + HF
These reactions can be combined to give the overall equation:
2Ca5(PO4)3F + 7H2SO4 + 3H2O → 7CaSO4 + 3Ca(H2PO4)2 .H2O + 2HF
The production of Single Super Phosphate (SSP) is the conversion of insoluble P2O5 to
soluble P2O5 by chemical reaction between phosphate ore and dilutes sulphuric Acid in
definite proportion. Rock Phosphate contains Tri Calcium Phosphate which is insoluble in
water and hence cannot be taken by plants, however, the product of reaction is mono
calcium phosphate, which is soluble in water and can be taken by plants . The reactants,
originally thin slurry, set to solid mass during the reaction.
There are other reactions occurring at the same time. For example, virtually all the HF
reacts with other silica minerals associated with the fluorapatite (silicates, quartz) to form
silicon tetra fluoride. These gaseous emissions are recovered as hydrofluosilicic acid
CEE VEE AGRIENCE PVT. LTD
36
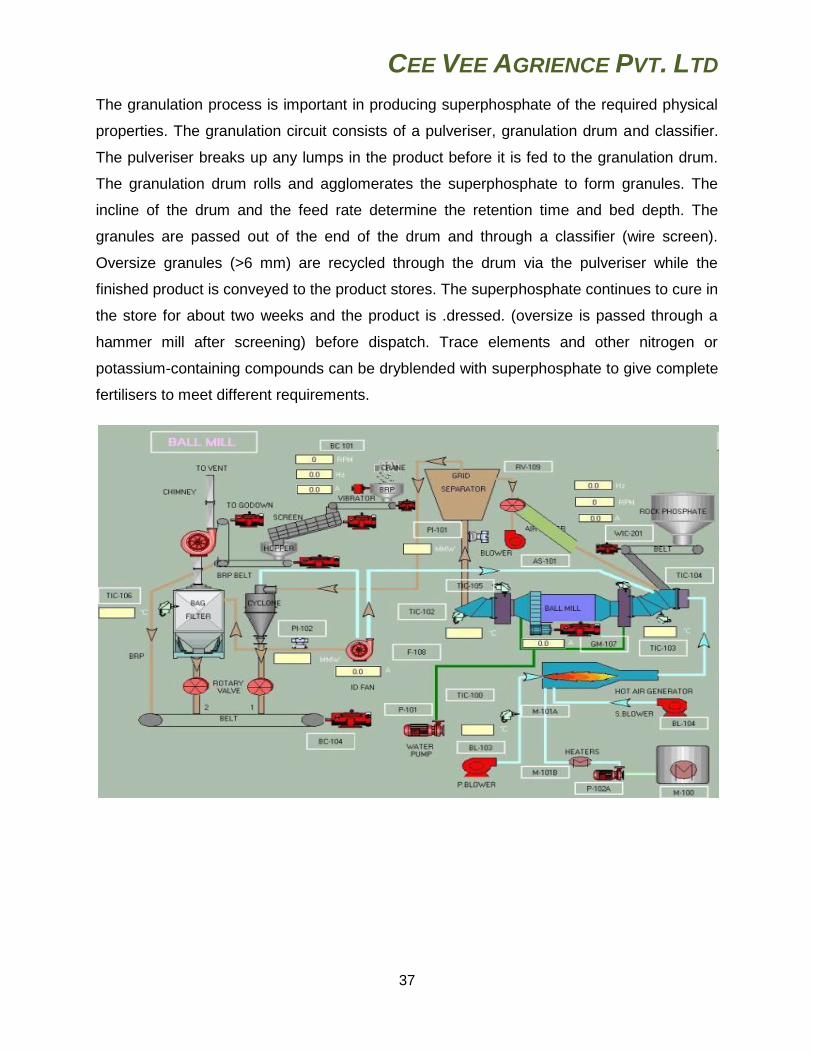
(H2SiF6) in the scrubbing system. Carbonates in the rock also react with sulfuric acid. The
production of superphosphate consists of three distinct steps. See the process flow diagram
Step 1 - Phosphate rock blending and grinding
Phosphate rock from different sources have different phosphate, fluoride and silica
contents. These rocks are mixed in the blending plant to produce a product with a total
phosphate concentration of 15%. The phosphate rock mixture is passed through a hammer
mill which reduces the particle size to 0.5cm or less. The coarsely ground rock is then
passed through an air swept roller mill (Bradley Mill) to attain a rock grist of approximately
75% less than 75 microns. The powdered rock is stored in a large hopper. The powder
handling system is fitted with a dust collection system.
Step 2 - Superphosphate manufacture
The ground rock and sulfuric acid are reacted in a horizontal mixer. The feed rates are
approximately:
• Phosphate rock - 25 tonnes/hour
• 98% Sulfuric acid - 14.5 tonnes/hour
• Water - 6 tonnes/hour
A continuous flow of the sloppy mix drops out of the mixer into the Broadfield Den. The den
consists of a slowly moving floor (approx. 300 mm/min) to enable setting of the .cake. and
reciprocating sides, which prevent the superphosphate adhering to the walls. The partially
matured superphosphate cake is cut out of the den with a rotating cutter wheel after a
retention time of approximately 30 minutes. Additives such as limestone, potassium chloride
(potash) and ammonium sulphate may be added to the superphosphate before it is worked
further in the conditioner.The conditioner consists of a set of rotating paddles which break-
up and knead the product. Water is usually added to improve the product consistency for
granulation.
Step 3 - Granulation
CEE VEE AGRIENCE PVT. LTD
37
The granulation process is important in producing superphosphate of the required physical
properties. The granulation circuit consists of a pulveriser, granulation drum and classifier.
The pulveriser breaks up any lumps in the product before it is fed to the granulation drum.
The granulation drum rolls and agglomerates the superphosphate to form granules. The
incline of the drum and the feed rate determine the retention time and bed depth. The
granules are passed out of the end of the drum and through a classifier (wire screen).
Oversize granules (>6 mm) are recycled through the drum via the pulveriser while the
finished product is conveyed to the product stores. The superphosphate continues to cure in
the store for about two weeks and the product is .dressed. (oversize is passed through a
hammer mill after screening) before dispatch. Trace elements and other nitrogen or
potassium-containing compounds can be dryblended with superphosphate to give complete
fertilisers to meet different requirements.
CEE VEE AGRIENCE PVT. LTD
38
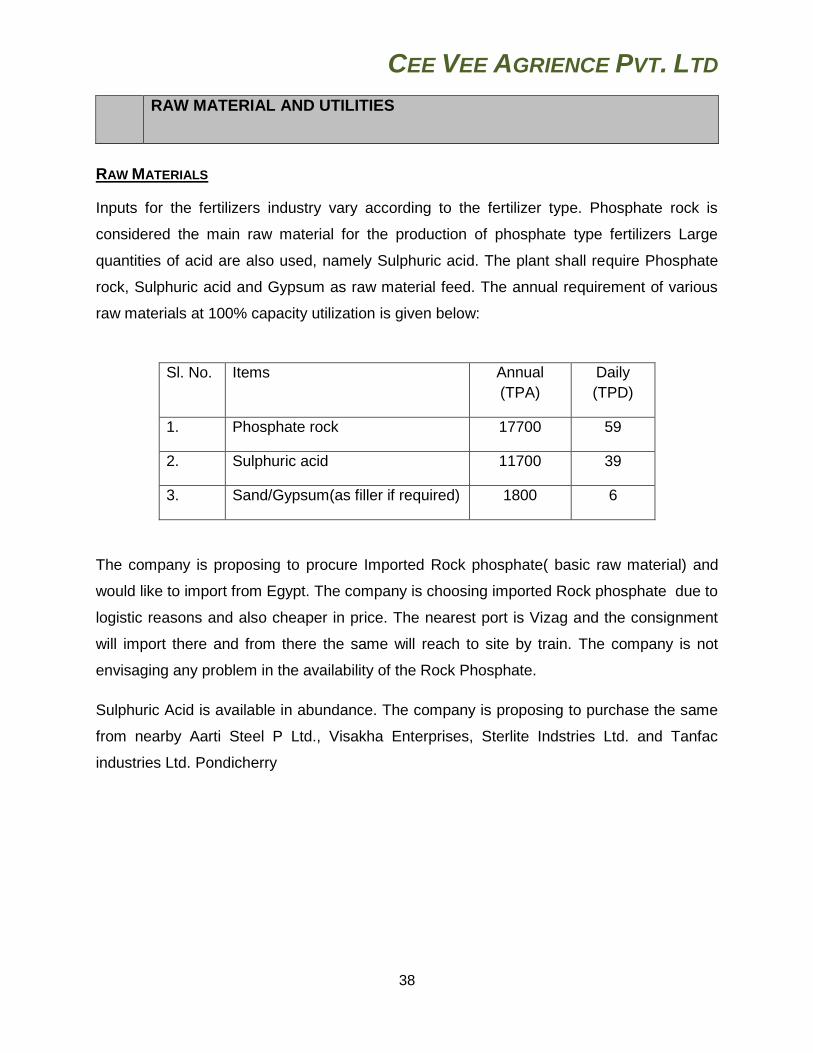
RAW MATERIAL AND UTILITIES
RAW MATERIALS
Inputs for the fertilizers industry vary according to the fertilizer type. Phosphate rock is
considered the main raw material for the production of phosphate type fertilizers Large
quantities of acid are also used, namely Sulphuric acid. The plant shall require Phosphate
rock, Sulphuric acid and Gypsum as raw material feed. The annual requirement of various
raw materials at 100% capacity utilization is given below:
Sl. No. Items Annual
(TPA)
Daily
(TPD)
1. Phosphate rock 17700 59
2. Sulphuric acid 11700 39
3. Sand/Gypsum(as filler if required) 1800 6
The company is proposing to procure Imported Rock phosphate( basic raw material) and
would like to import from Egypt. The company is choosing imported Rock phosphate due to
logistic reasons and also cheaper in price. The nearest port is Vizag and the consignment
will import there and from there the same will reach to site by train. The company is not
envisaging any problem in the availability of the Rock Phosphate.
Sulphuric Acid is available in abundance. The company is proposing to purchase the same
from nearby Aarti Steel P Ltd., Visakha Enterprises, Sterlite Indstries Ltd. and Tanfac
industries Ltd. Pondicherry
CEE VEE AGRIENCE PVT. LTD
39
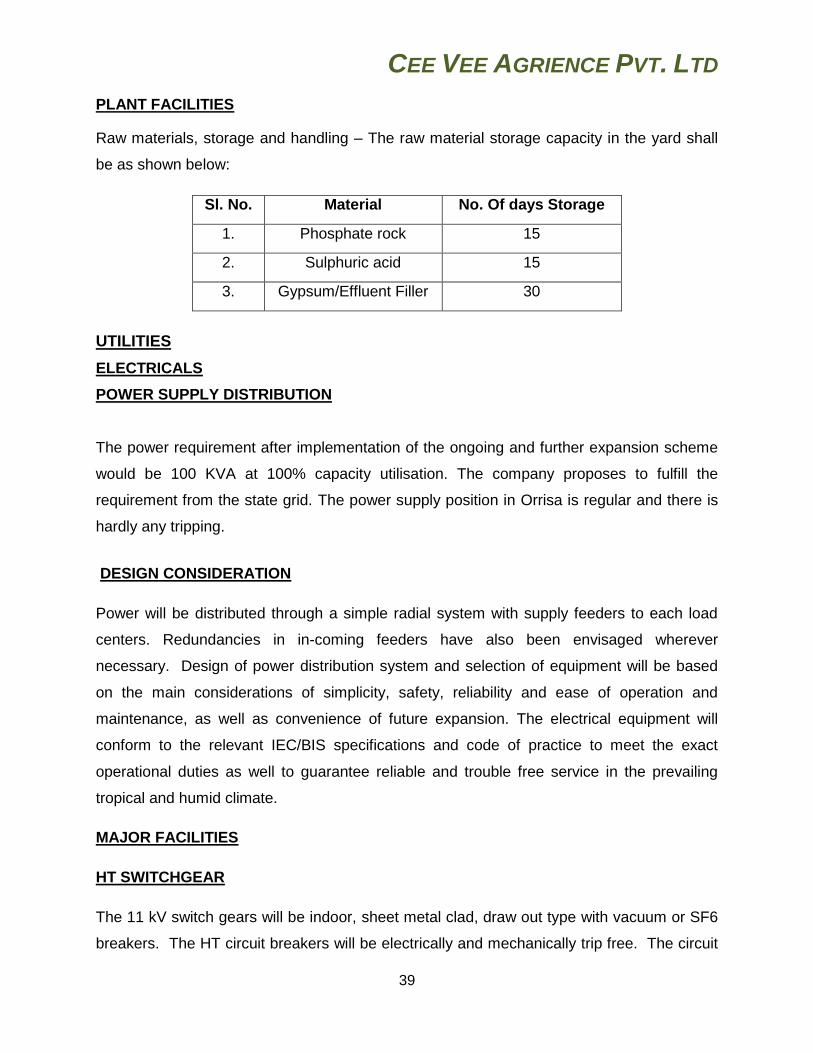
PLANT FACILITIES
Raw materials, storage and handling – The raw material storage capacity in the yard shall
be as shown below:
Sl. No. Material No. Of days Storage
1. Phosphate rock 15
2. Sulphuric acid 15
3. Gypsum/Effluent Filler 30
UTILITIES
ELECTRICALS
POWER SUPPLY DISTRIBUTION
The power requirement after implementation of the ongoing and further expansion scheme
would be 100 KVA at 100% capacity utilisation. The company proposes to fulfill the
requirement from the state grid. The power supply position in Orrisa is regular and there is
hardly any tripping.
DESIGN CONSIDERATION
Power will be distributed through a simple radial system with supply feeders to each load
centers. Redundancies in in-coming feeders have also been envisaged wherever
necessary. Design of power distribution system and selection of equipment will be based
on the main considerations of simplicity, safety, reliability and ease of operation and
maintenance, as well as convenience of future expansion. The electrical equipment will
conform to the relevant IEC/BIS specifications and code of practice to meet the exact
operational duties as well to guarantee reliable and trouble free service in the prevailing
tropical and humid climate.
MAJOR FACILITIES
HT SWITCHGEAR
The 11 kV switch gears will be indoor, sheet metal clad, draw out type with vacuum or SF6
breakers. The HT circuit breakers will be electrically and mechanically trip free. The circuit
CEE VEE AGRIENCE PVT. LTD
40
breakers will be electrically operated stored energy type and operated from 220V DC
control source. All necessary protection, metering and signaling arrangements will be
provided.
LT SWITCHGEAR
The 415V circuit breaker will be of indoor construction, sheet metal clad, air break draw-out
type. The breakers will have a short-circuit rating of 40 kA (symmetrical). The circuit
breaker will be arranged for power closing and shunt tripping. The switch boards will be of
unit type construction with facilities for addition of switchgear on both sides.
TRANSFORMER
The transformers 500 KVA will be designed for temperature rise not exceeding 450 C in
winding when measured by resistance method and 350 C in oil when measured by
thermometer method, after continuous full load run. All transformers will be equipped with
the standard relevant fittings and accessories and would confirm to relevant IS
specifications.
CABLING
Power inside the plant will be transmitted and distributed through underground cables.
Wherever necessary and where the cables are in small number, they will be directly buried
underground. These underground cables will have steel armoring. In covered building and
in sub-stations wherever possible, cables will be run in covered concrete ducts or column
mounted cable structures. Cable sizes will be selected after taking into account all the
derating factors for the ambient conditions.
ILLUMINATION
The illumination levels envisaged for different areas, indoor and outdoor, will be as per the
existing practices and confirm to the norms for industrial production units to ensure
comfortable and safe working conditions.
WATER SUPPLY FACILITIES
Most of the water is used for indirect cooling purpose and the rest for process use,
conveyance of sludges, fire and drinking needs, etc. In order to conserve the requirement
of raw water drawn from the source as well as to minimise effluent treatment facilities,
CEE VEE AGRIENCE PVT. LTD
41
recirculation systems are considered. Cascading will be adopted to further reduce the
water requirement and the effluent discharge from the plant will be reduced to minimum.
REQUIREMENT OF WATER
The make-up water requirement of the plant is estimated as 1 m3/h including drinking water
needs for plant and few residences. The source of water for the proposed plant will be from
Bore wells and a provision for the same has been made in the project.
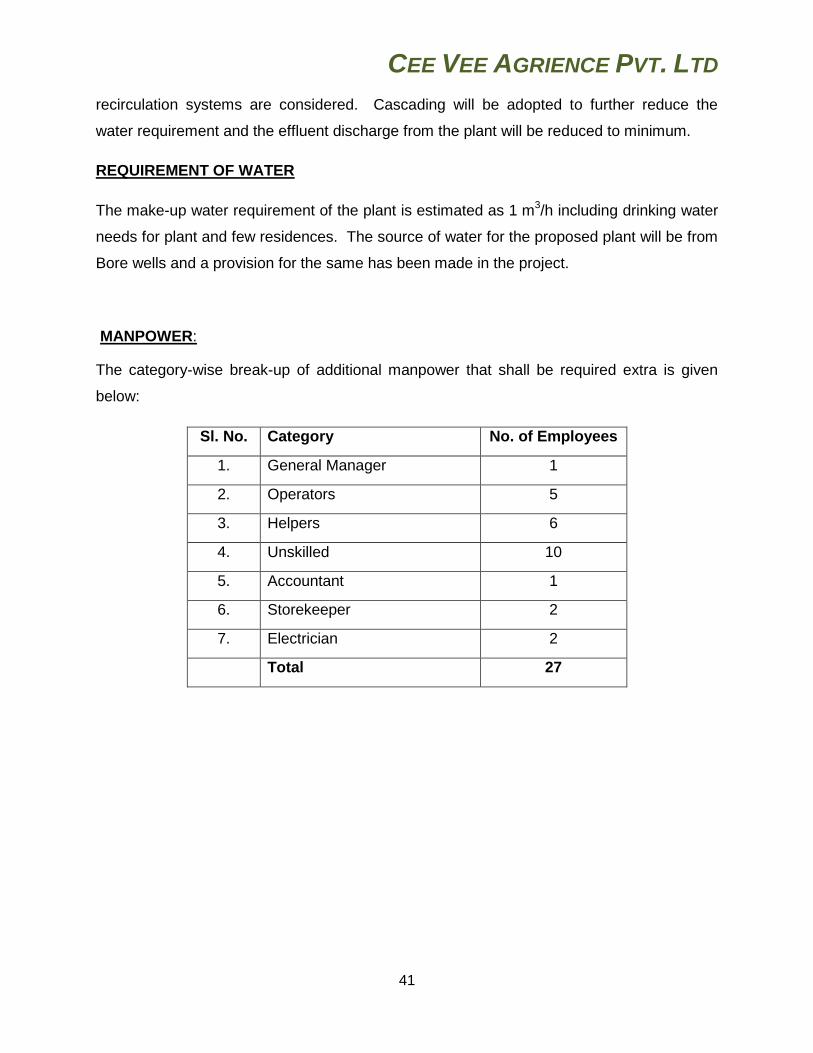
MANPOWER:
The category-wise break-up of additional manpower that shall be required extra is given
below:
Sl. No. Category No. of Employees
1. General Manager 1
2. Operators 5
3. Helpers 6
4. Unskilled 10
5. Accountant 1
6. Storekeeper 2
7. Electrician 2
Total 27
CEE VEE AGRIENCE PVT. LTD
42
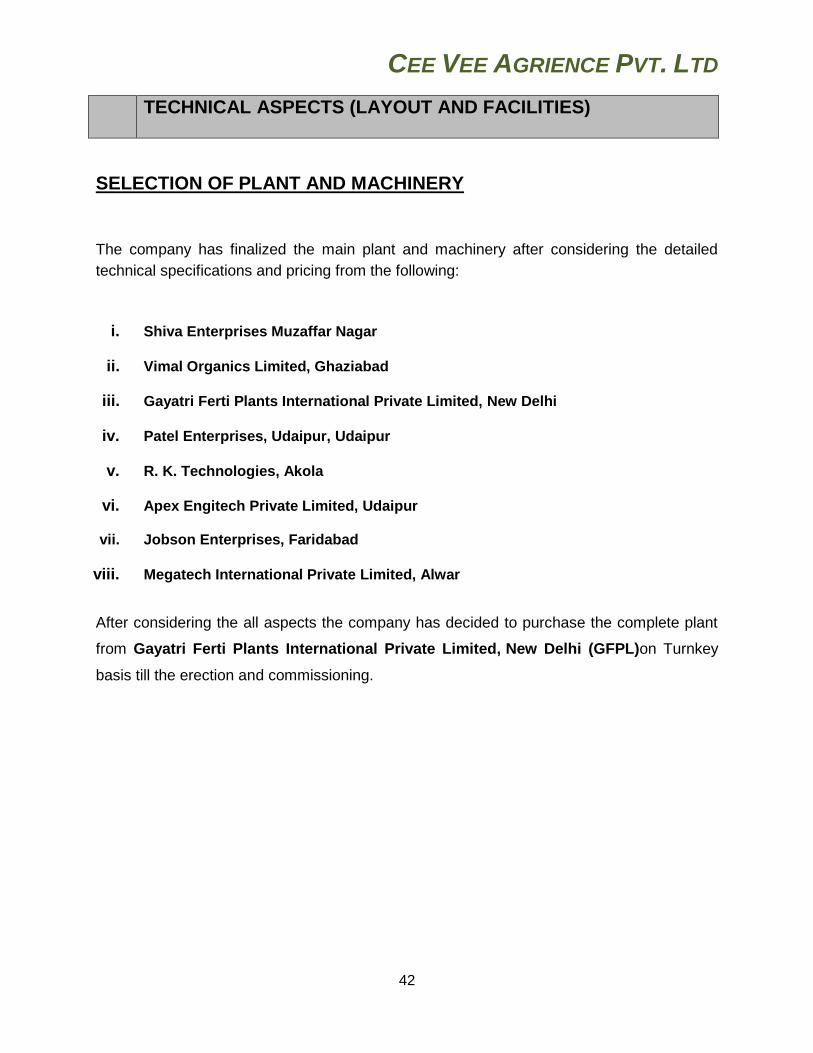
TECHNICAL ASPECTS (LAYOUT AND FACILITIES)
SELECTION OF PLANT AND MACHINERY
The company has finalized the main plant and machinery after considering the detailed
technical specifications and pricing from the following:
i. Shiva Enterprises Muzaffar Nagar
ii. Vimal Organics Limited, Ghaziabad
iii. Gayatri Ferti Plants International Private Limited, New Delhi
iv. Patel Enterprises, Udaipur, Udaipur
v. R. K. Technologies, Akola
vi. Apex Engitech Private Limited, Udaipur
vii. Jobson Enterprises, Faridabad
viii. Megatech International Private Limited, Alwar
After considering the all aspects the company has decided to purchase the complete plant
from Gayatri Ferti Plants International Private Limited, New Delhi (GFPL)on Turnkey
basis till the erection and commissioning.
CEE VEE AGRIENCE PVT. LTD
43
ABOUT THE SUPPLIER
GFPL is having manufacturing facility of SSP plants at RIICO Industrial.Area, Khushkhera,
Distt. Alwar, Rajasthan is located at national highway No. 8 Delhi Jaipur highway, 55 km
from Indra Gandhi International Airport, New Delhi. The company manufactures and export
plant & machinery for making fertilizers like SSP, TSP, GSSP, NPK, Zinc Sulphate Gypsum
Granulation and Alum etc. on turnkey basis. The company also does erection &
commissioning, run the plant for one month under their supervision, Train the manpower in
running and maintenance of the plant and hand over to the party. We work further to keep
the company up front suggesting innovation, & modification. They also supply the spares
timely and help the party in developing spares in-house / locally.
Mr. K. R. Sharma, M. Tech IIT Delhi, Managing Director of Gayatri is having 30 years
experience in
1. Top management: Administration, Production, Maintenance, Quality Control,
Pollution Control, Liaison with Govt. Agencies, Purchase, Inventory Control and
logistics.
2. Consultant : Supplied complete consultancy for fabrication, erection, Commissioning
and commercial running of SSP, GSSP, NPK, ZnSO4 Hepta Hydrate and mono
Hydrate, Ferric and Non ferric Alum, Renovation and Refitting of Sulphuric Acid
Plants
3. Industrialist (exporter) Design, Fabricate, Export, Assemble, Erection, Commission,
commercially run, Train the manpower in operation and maintenance of the plant
and supply spare parts.
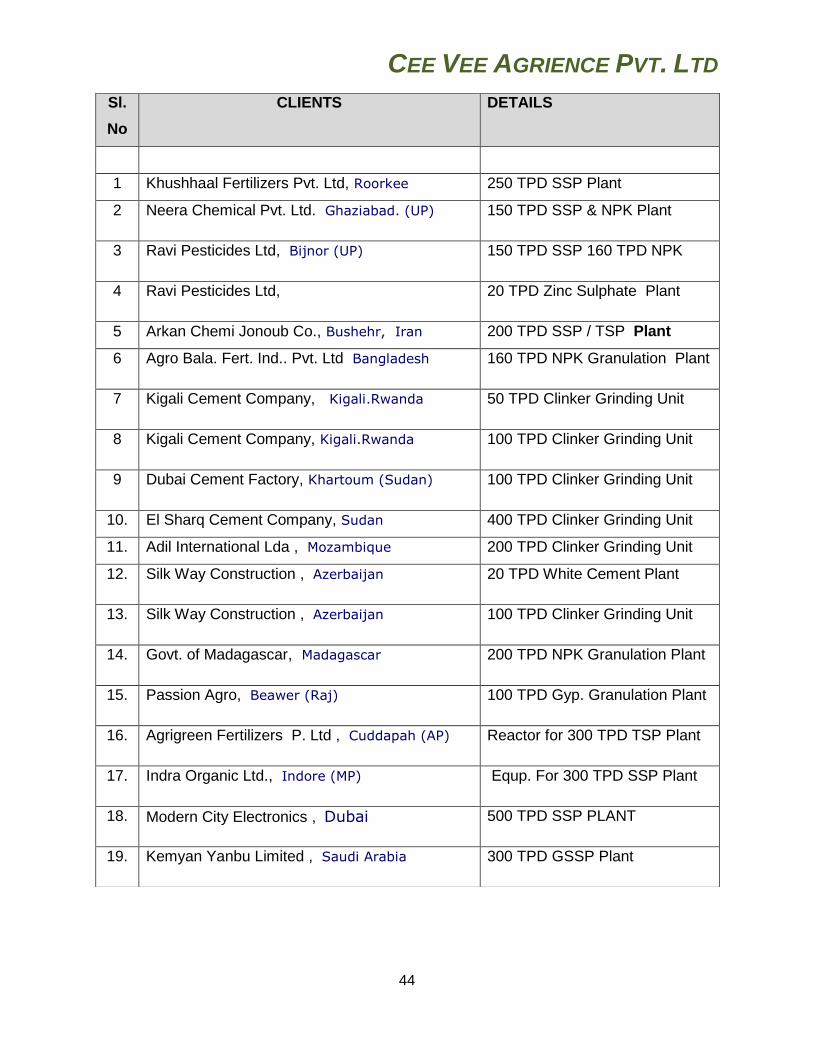
GFPL have done so many projects and has experience in doing the projects successfully in
the countries / regions beside India having no or less infrastructure. The following are the
project done by GFPL:
CEE VEE AGRIENCE PVT. LTD
44
Sl.
No
CLIENTS DETAILS
1 Khushhaal Fertilizers Pvt. Ltd, Roorkee 250 TPD SSP Plant
2 Neera Chemical Pvt. Ltd. Ghaziabad. (UP) 150 TPD SSP & NPK Plant
3 Ravi Pesticides Ltd, Bijnor (UP) 150 TPD SSP 160 TPD NPK
4 Ravi Pesticides Ltd, 20 TPD Zinc Sulphate Plant
5 Arkan Chemi Jonoub Co., Bushehr, Iran 200 TPD SSP / TSP Plant
6 Agro Bala. Fert. Ind.. Pvt. Ltd Bangladesh 160 TPD NPK Granulation Plant
7 Kigali Cement Company, Kigali.Rwanda 50 TPD Clinker Grinding Unit
8 Kigali Cement Company, Kigali.Rwanda 100 TPD Clinker Grinding Unit
9 Dubai Cement Factory, Khartoum (Sudan) 100 TPD Clinker Grinding Unit
10. El Sharq Cement Company, Sudan 400 TPD Clinker Grinding Unit
11. Adil International Lda , Mozambique 200 TPD Clinker Grinding Unit
12. Silk Way Construction , Azerbaijan 20 TPD White Cement Plant
13. Silk Way Construction , Azerbaijan 100 TPD Clinker Grinding Unit
14. Govt. of Madagascar, Madagascar 200 TPD NPK Granulation Plant
15. Passion Agro, Beawer (Raj) 100 TPD Gyp. Granulation Plant
16. Agrigreen Fertilizers P. Ltd , Cuddapah (AP) Reactor for 300 TPD TSP Plant
17. Indra Organic Ltd., Indore (MP) Equp. For 300 TPD SSP Plant
18. Modern City Electronics , Dubai 500 TPD SSP PLANT
19. Kemyan Yanbu Limited , Saudi Arabia 300 TPD GSSP Plant
CEE VEE AGRIENCE PVT. LTD
45
GENERAL LAYOUT
The general layout of the proposed project would be finalized after considering the
following main factors.
i) Smooth and sequential flow of materials
ii) Maximum utilisation of area with space provision for future expansion.
iii) Shortest possible lead for communication network
iv) Predominant wind direction
v) Profile of the land
vi) Adequate green belt along the plant boundary
There are various steps for the manufacture of SSP. The layout will ensure smooth
movement of various materials to and from the plant as well as smooth movement within
the plant. The layout will also ensure smooth operation of the facilities and improved
working conditions.
GENERA PLANT STORAGE
One central store with adequate storage racks and handling facilities for storage of spares,
equipments, electrics, etc. has been envisaged. Consumables and oil & lubrication will be
stored in the lean to portion of the store-building.
INSPECTION AND QUALITY CONTROL FACILITIES
The proposed SSP unit will produce high quality products as per specifications/grades of
the end users and according to the stipulations of various standards. In order to achieve this
objective, efficient and stringent quality assurance measures are to be enforced at every
stage of production. Quality assurance can be implemented effectively.
The laboratory therefore, will have the following responsibilities:
- Testing of incoming raw materials, etc
- Testing of finished products
- Feedback assistance to the main production units for timely
CEE VEE AGRIENCE PVT. LTD
46
Corrective measures to eliminate process irregularities
- Undertaking short term investigations for in-plant failures
- Investigation of customers’ complaints.
REPAIR AND MAINTENANCE FACILITIES
To ensure uninterrupted operation of various production and service equipment, the plant
will be provided with repair and maintenance facilities which will help to maintain the various
technological equipment in healthy working condition. There in plant repair and
maintenance facility will help in providing appropriate and timely action for repair of
important equipment with appropriate checks at different stages. Facilities for capital
repairs and major overhauls are not envisaged as provision for such specialised
arrangement inside the shop will not be economically viable.
VENTILATION FACILITIES
Buildings and production will generally be provided natural ventilation. Mechanical
ventilators will be provided for premises where adequate ventilation cannot be provided by
natural means. Depending upon the specific requirement, the shops/buildings will be
provided with either exhaust ventilation or plenum ventilation. The system design will take
into account the requirements of air change as well as excess heat removal. Hot work areas
will be provided with portable man-coolers for localised cooling. Man-coolers will be
provided also in a few other areas where the premises are manned and have high heat
radiation.
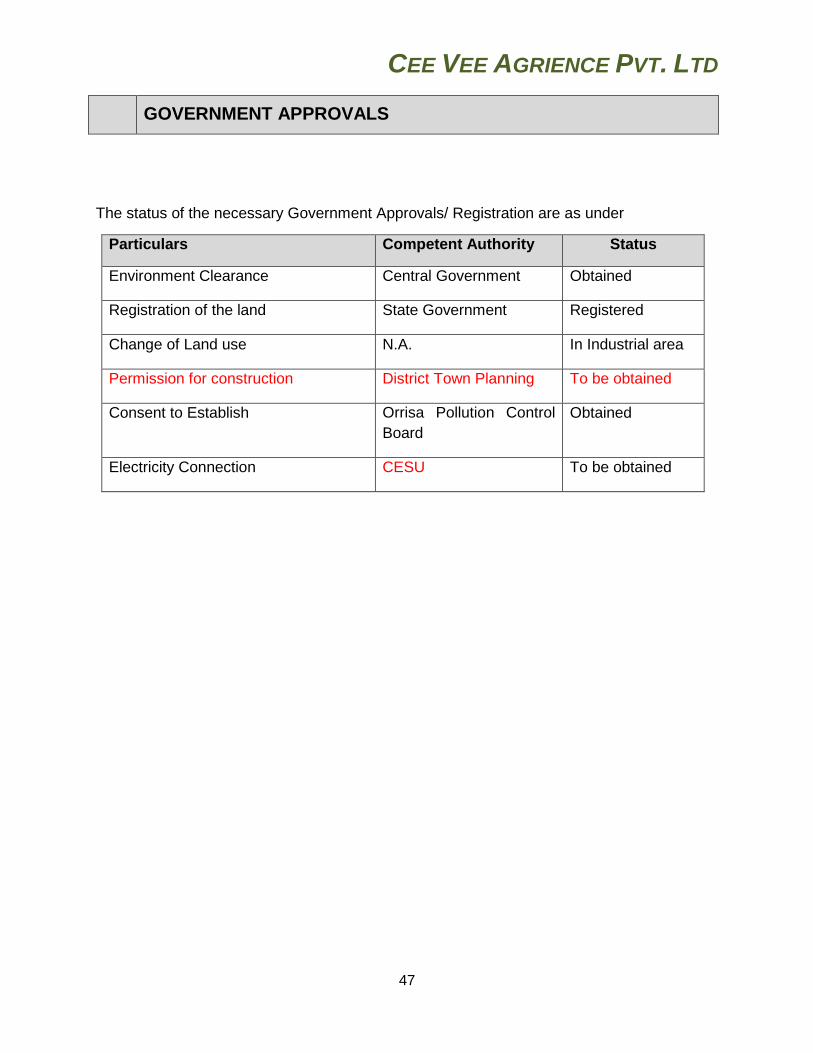
CEE VEE AGRIENCE PVT. LTD
47
GOVERNMENT APPROVALS
The status of the necessary Government Approvals/ Registration are as under
Particulars Competent Authority Status
Environment Clearance Central Government Obtained
Registration of the land State Government Registered
Change of Land use N.A. In Industrial area
Permission for construction District Town Planning To be obtained
Consent to Establish Orrisa Pollution Control
Board
Obtained
Electricity Connection CESU To be obtained
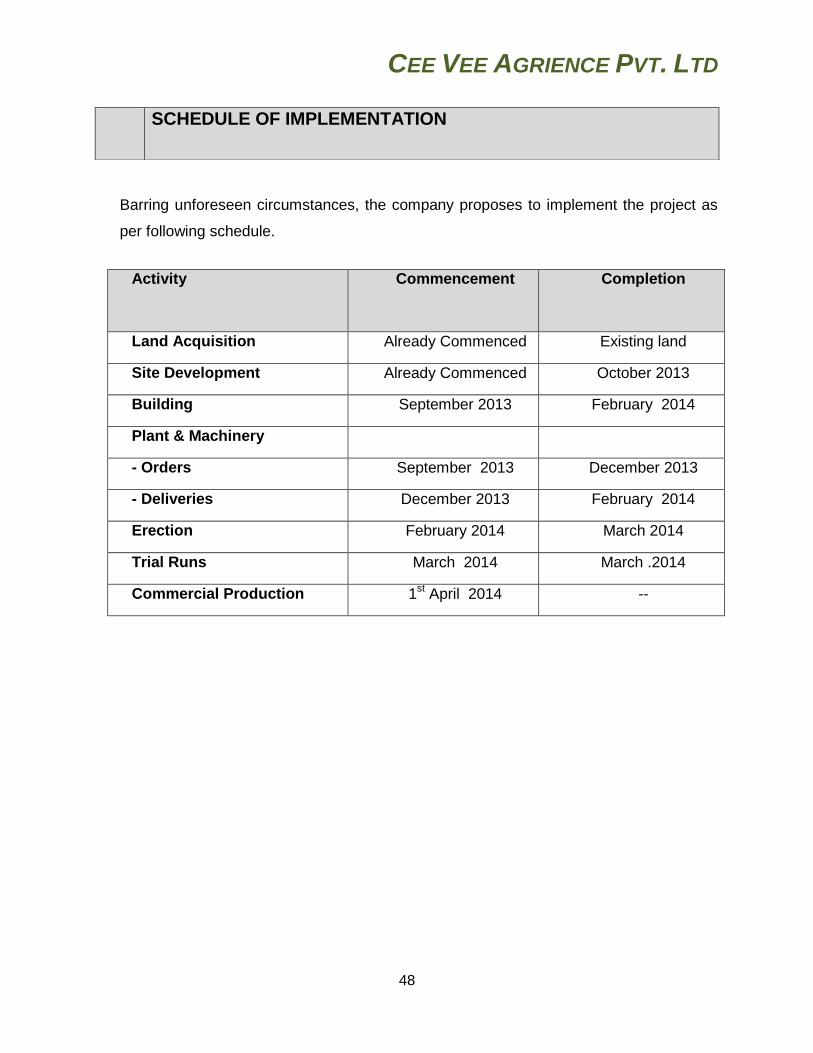
CEE VEE AGRIENCE PVT. LTD
48
Barring unforeseen circumstances, the company proposes to implement the project as
per following schedule.
Activity Commencement Completion
Land Acquisition Already Commenced Existing land
Site Development Already Commenced October 2013
Building September 2013 February 2014
Plant & Machinery
- Orders September 2013 December 2013
- Deliveries December 2013 February 2014
Erection February 2014 March 2014
Trial Runs March 2014 March .2014
Commercial Production 1st April 2014 --
SCHEDULE OF IMPLEMENTATION
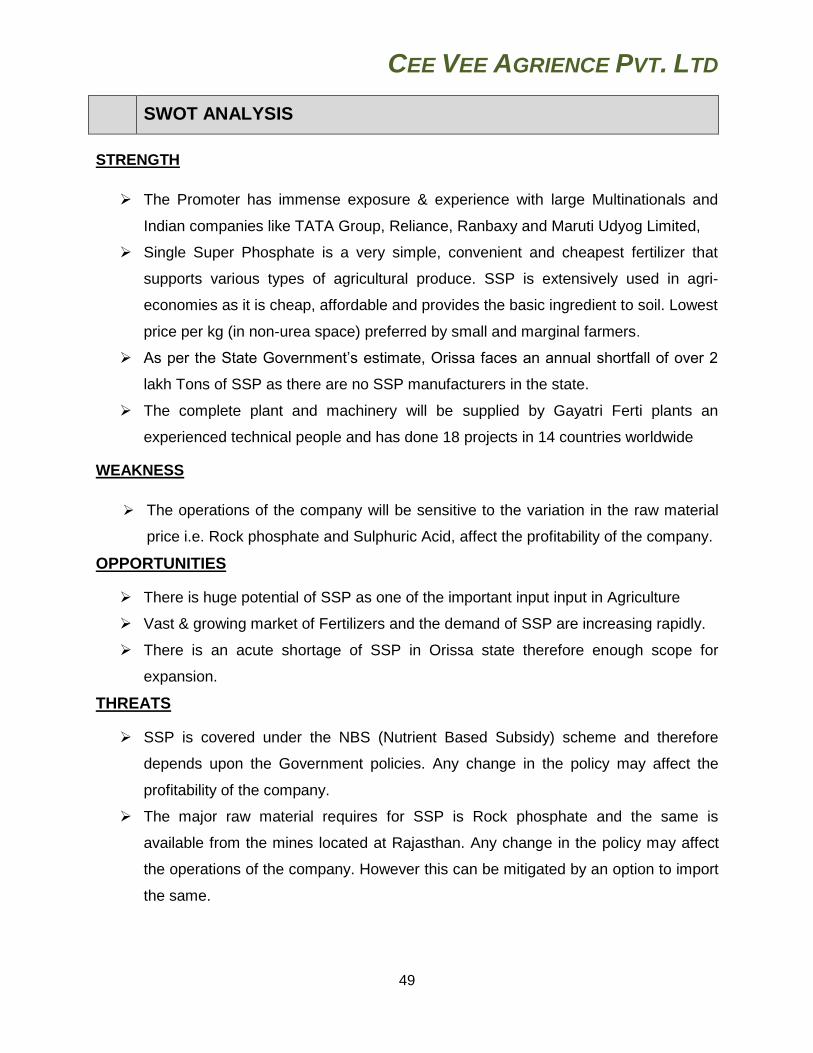
CEE VEE AGRIENCE PVT. LTD
49
SWOT ANALYSIS
STRENGTH
The Promoter has immense exposure & experience with large Multinationals and
Indian companies like TATA Group, Reliance, Ranbaxy and Maruti Udyog Limited,
Single Super Phosphate is a very simple, convenient and cheapest fertilizer that
supports various types of agricultural produce. SSP is extensively used in agri-
economies as it is cheap, affordable and provides the basic ingredient to soil. Lowest
price per kg (in non-urea space) preferred by small and marginal farmers.
As per the State Government’s estimate, Orissa faces an annual shortfall of over 2
lakh Tons of SSP as there are no SSP manufacturers in the state.
The complete plant and machinery will be supplied by Gayatri Ferti plants an
experienced technical people and has done 18 projects in 14 countries worldwide
WEAKNESS
The operations of the company will be sensitive to the variation in the raw material
price i.e. Rock phosphate and Sulphuric Acid, affect the profitability of the company.
OPPORTUNITIES
There is huge potential of SSP as one of the important input input in Agriculture
Vast & growing market of Fertilizers and the demand of SSP are increasing rapidly.
There is an acute shortage of SSP in Orissa state therefore enough scope for
expansion.
THREATS
SSP is covered under the NBS (Nutrient Based Subsidy) scheme and therefore
depends upon the Government policies. Any change in the policy may affect the
profitability of the company.
The major raw material requires for SSP is Rock phosphate and the same is
available from the mines located at Rajasthan. Any change in the policy may affect
the operations of the company. However this can be mitigated by an option to import
the same.
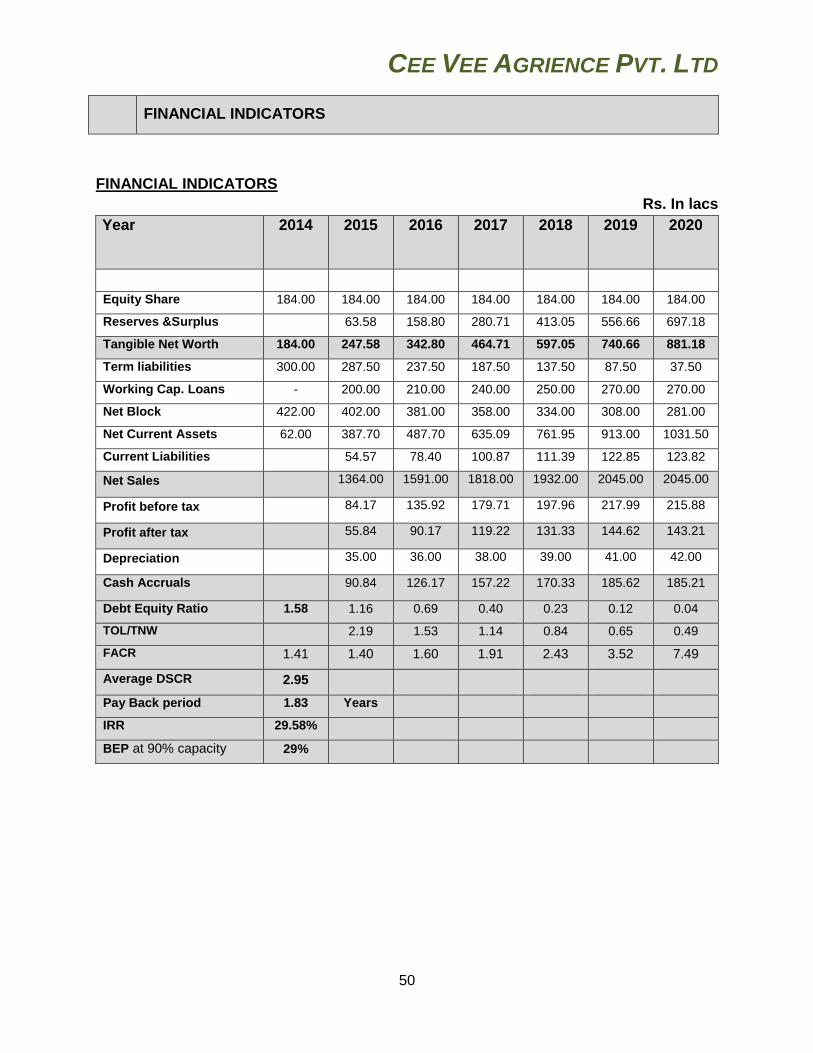
CEE VEE AGRIENCE PVT. LTD
50
FINANCIAL INDICATORS
FINANCIAL INDICATORS
Rs. In lacs
Year
2014 2015 2016 2017 2018 2019 2020
Equity Share 184.00 184.00 184.00 184.00 184.00 184.00 184.00
Reserves &Surplus 63.58 158.80 280.71 413.05 556.66 697.18
Tangible Net Worth 184.00 247.58 342.80 464.71 597.05 740.66 881.18
Term liabilities 300.00 287.50 237.50 187.50 137.50 87.50 37.50
Working Cap. Loans - 200.00 210.00 240.00 250.00 270.00 270.00
Net Block 422.00 402.00 381.00 358.00 334.00 308.00 281.00
Net Current Assets 62.00 387.70 487.70 635.09 761.95 913.00 1031.50
Current Liabilities 54.57 78.40 100.87 111.39 122.85 123.82
Net Sales 1364.00 1591.00 1818.00 1932.00 2045.00 2045.00
Profit before tax 84.17 135.92 179.71 197.96 217.99 215.88
Profit after tax 55.84 90.17 119.22 131.33 144.62 143.21
Depreciation 35.00 36.00 38.00 39.00 41.00 42.00
Cash Accruals 90.84 126.17 157.22 170.33 185.62 185.21
Debt Equity Ratio 1.58 1.16 0.69 0.40 0.23 0.12 0.04
TOL/TNW 2.19 1.53 1.14 0.84 0.65 0.49
FACR 1.41 1.40 1.60 1.91 2.43 3.52 7.49
Average DSCR 2.95
Pay Back period 1.83 Years
IRR 29.58%
BEP at 90% capacity 29%
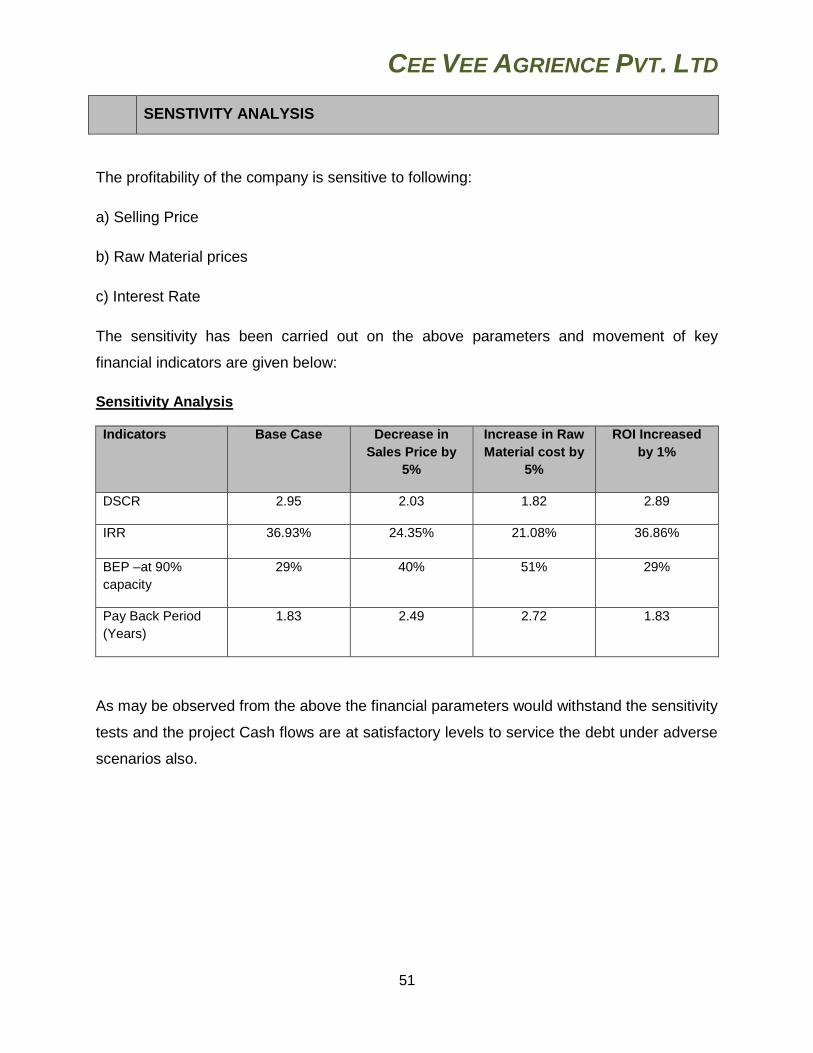
CEE VEE AGRIENCE PVT. LTD
51
SENSTIVITY ANALYSIS
The profitability of the company is sensitive to following:
a) Selling Price
b) Raw Material prices
c) Interest Rate
The sensitivity has been carried out on the above parameters and movement of key
financial indicators are given below:
Sensitivity Analysis
Indicators Base Case Decrease in
Sales Price by
5%
Increase in Raw
Material cost by
5%
ROI Increased
by 1%
DSCR 2.95 2.03 1.82 2.89
IRR 36.93% 24.35% 21.08% 36.86%
BEP –at 90%
capacity
29% 40% 51% 29%
Pay Back Period
(Years)
1.83 2.49 2.72 1.83
As may be observed from the above the financial parameters would withstand the sensitivity
tests and the project Cash flows are at satisfactory levels to service the debt under adverse
scenarios also.
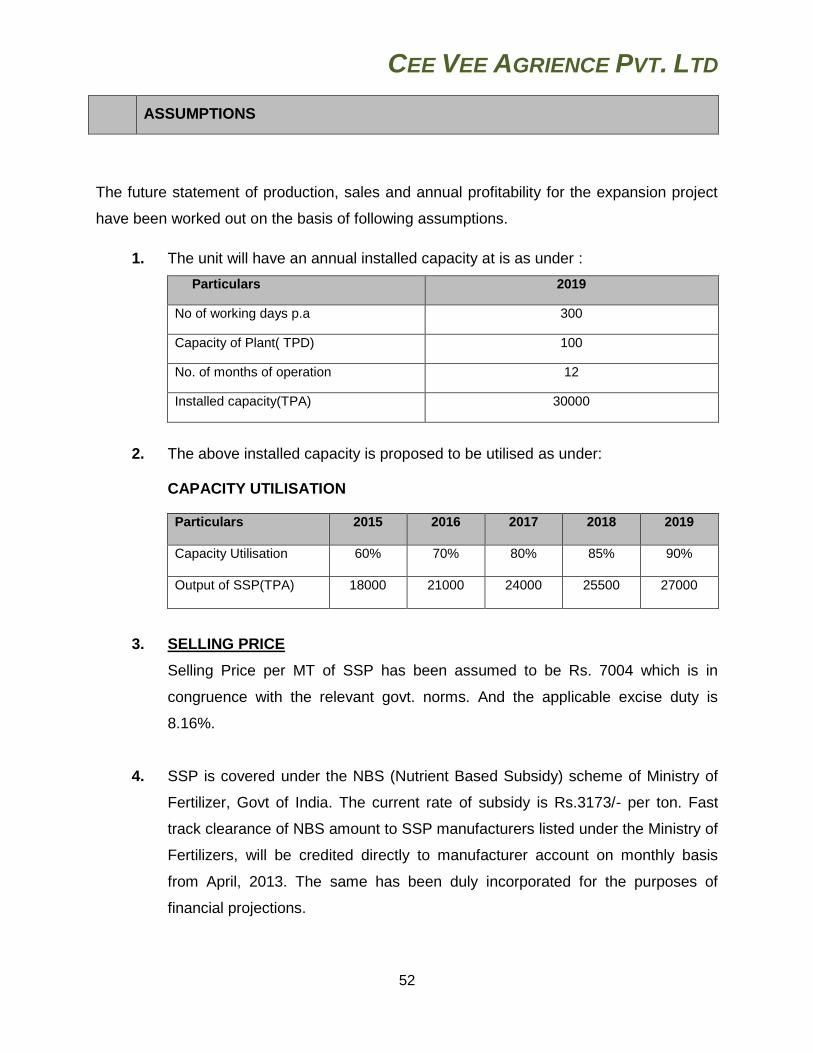
CEE VEE AGRIENCE PVT. LTD
52
ASSUMPTIONS
The future statement of production, sales and annual profitability for the expansion project
have been worked out on the basis of following assumptions.
1. The unit will have an annual installed capacity at is as under :
Particulars 2019
No of working days p.a 300
Capacity of Plant( TPD) 100
No. of months of operation 12
Installed capacity(TPA) 30000
2. The above installed capacity is proposed to be utilised as under:
CAPACITY UTILISATION
Particulars 2015 2016 2017 2018 2019
Capacity Utilisation 60% 70% 80% 85% 90%
Output of SSP(TPA) 18000 21000 24000 25500 27000
3. SELLING PRICE
Selling Price per MT of SSP has been assumed to be Rs. 7004 which is in
congruence with the relevant govt. norms. And the applicable excise duty is
8.16%.
4. SSP is covered under the NBS (Nutrient Based Subsidy) scheme of Ministry of
Fertilizer, Govt of India. The current rate of subsidy is Rs.3173/- per ton. Fast
track clearance of NBS amount to SSP manufacturers listed under the Ministry of
Fertilizers, will be credited directly to manufacturer account on monthly basis
from April, 2013. The same has been duly incorporated for the purposes of
financial projections.
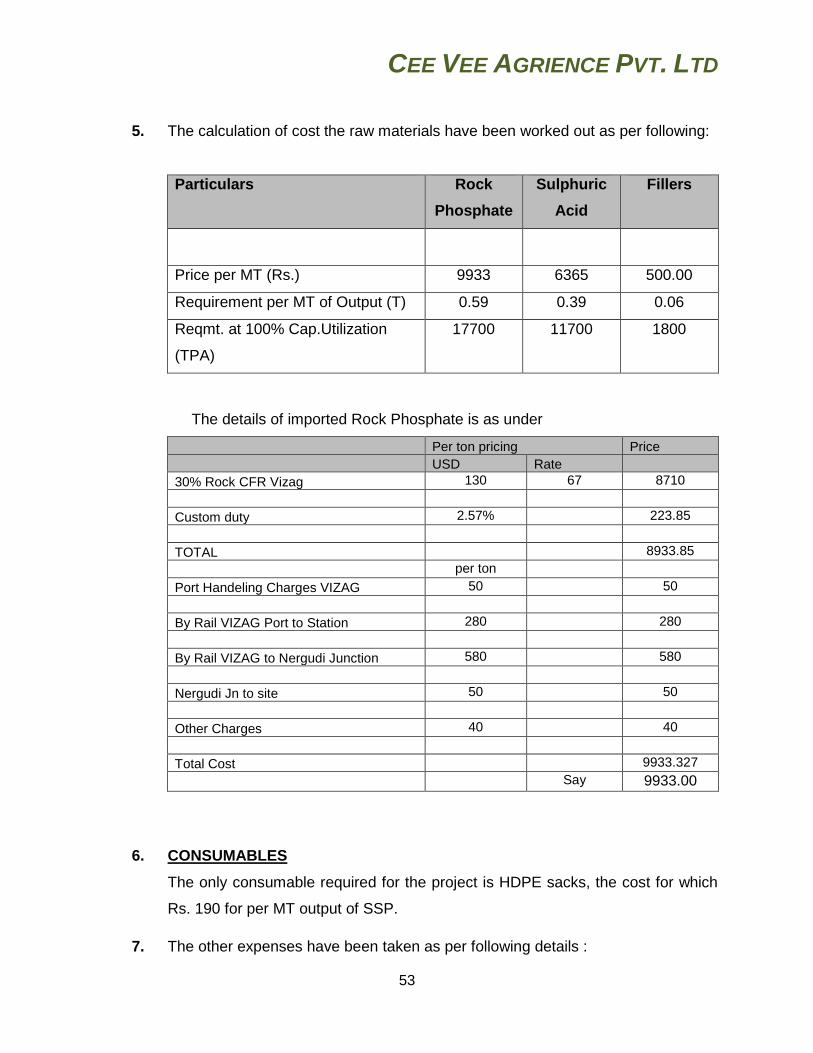
CEE VEE AGRIENCE PVT. LTD
53
5. The calculation of cost the raw materials have been worked out as per following:
Particulars Rock
Phosphate
Sulphuric
Acid
Fillers
Price per MT (Rs.) 9933 6365 500.00
Requirement per MT of Output (T) 0.59 0.39 0.06
Reqmt. at 100% Cap.Utilization
(TPA)
17700 11700 1800
The details of imported Rock Phosphate is as under
Per ton pricing Price
USD Rate
30% Rock CFR Vizag 130 67 8710
Custom duty 2.57% 223.85
TOTAL 8933.85
per ton
Port Handeling Charges VIZAG 50 50
By Rail VIZAG Port to Station 280 280
By Rail VIZAG to Nergudi Junction 580 580
Nergudi Jn to site 50 50
Other Charges 40 40
Total Cost 9933.327
Say 9933.00
6. CONSUMABLES
The only consumable required for the project is HDPE sacks, the cost for which
Rs. 190 for per MT output of SSP.
7. The other expenses have been taken as per following details :
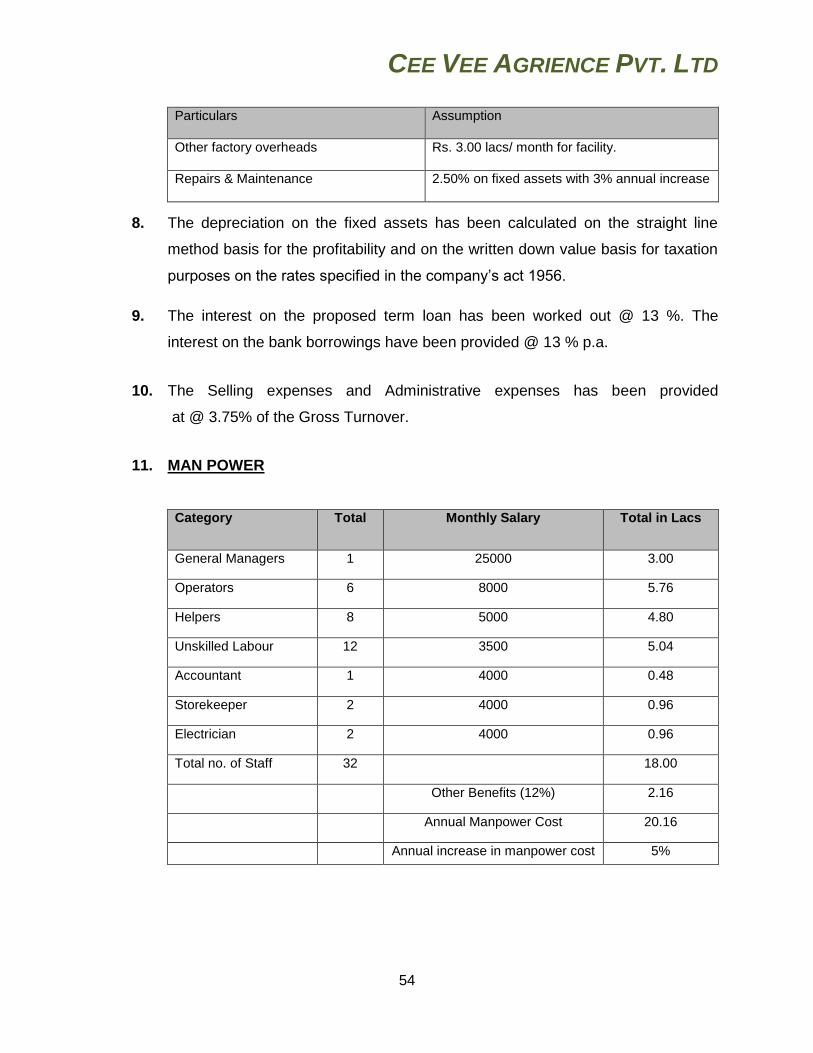
CEE VEE AGRIENCE PVT. LTD
54
Particulars Assumption
Other factory overheads Rs. 3.00 lacs/ month for facility.
Repairs & Maintenance 2.50% on fixed assets with 3% annual increase
8. The depreciation on the fixed assets has been calculated on the straight line
method basis for the profitability and on the written down value basis for taxation
purposes on the rates specified in the company’s act 1956.
9. The interest on the proposed term loan has been worked out @ 13 %. The
interest on the bank borrowings have been provided @ 13 % p.a.
10. The Selling expenses and Administrative expenses has been provided
at @ 3.75% of the Gross Turnover.
11. MAN POWER
Category Total Monthly Salary Total in Lacs
General Managers 1 25000 3.00
Operators 6 8000 5.76
Helpers 8 5000 4.80
Unskilled Labour 12 3500 5.04
Accountant 1 4000 0.48
Storekeeper 2 4000 0.96
Electrician 2 4000 0.96
Total no. of Staff 32 18.00
Other Benefits (12%) 2.16
Annual Manpower Cost 20.16
Annual increase in manpower cost 5%
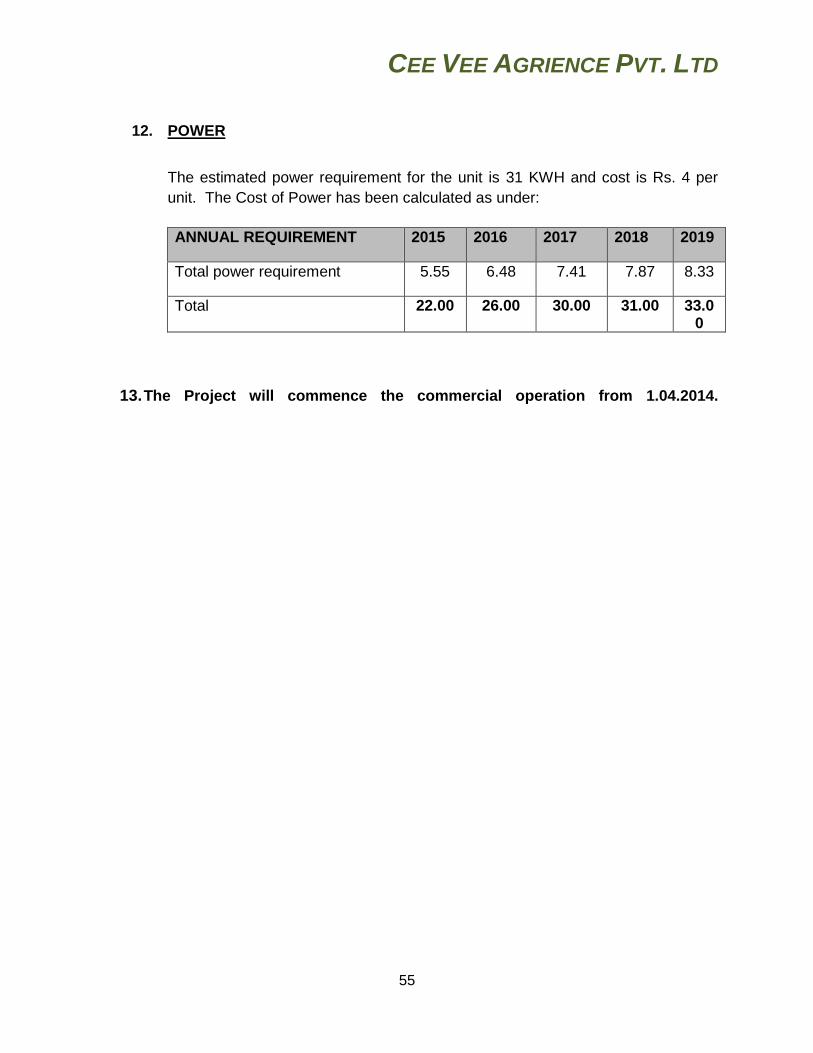
CEE VEE AGRIENCE PVT. LTD
55
12. POWER
The estimated power requirement for the unit is 31 KWH and cost is Rs. 4 per
unit. The Cost of Power has been calculated as under:
ANNUAL REQUIREMENT 2015 2016 2017 2018 2019
Total power requirement 5.55 6.48 7.41 7.87 8.33
Total 22.00 26.00 30.00 31.00 33.00
13. The Project will commence the commercial operation from 1.04.2014.
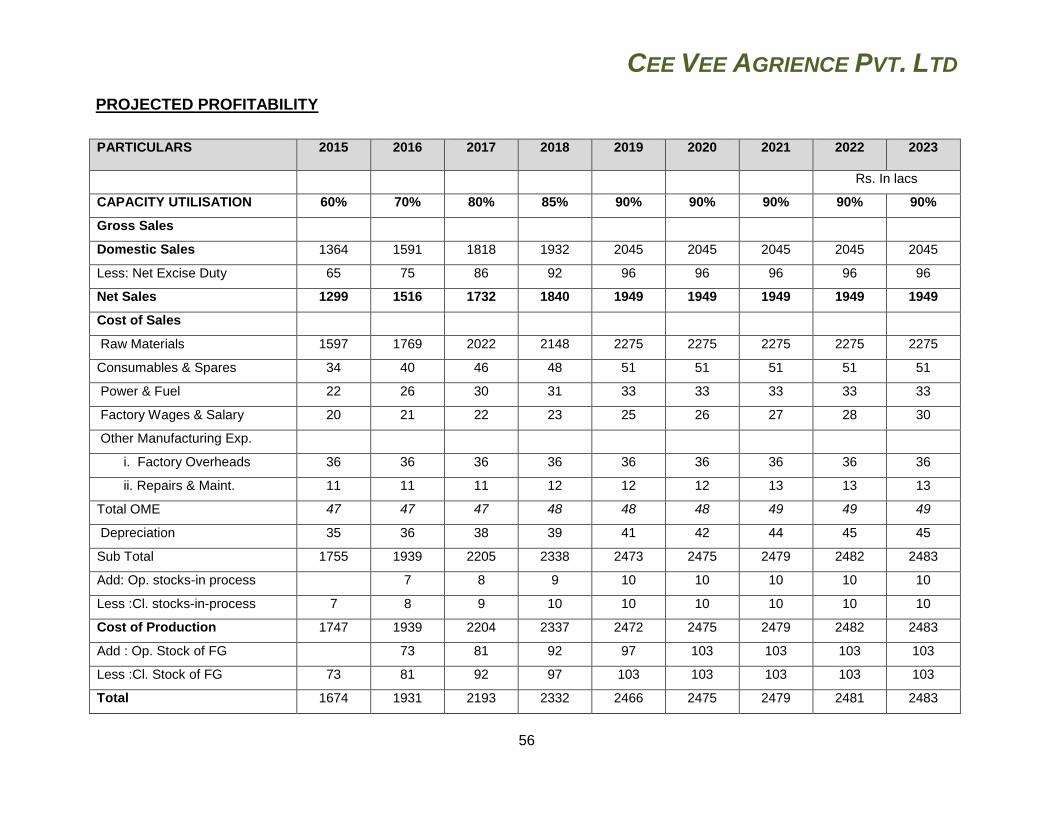
CEE VEE AGRIENCE PVT. LTD
56
PROJECTED PROFITABILITY
PARTICULARS 2015 2016 2017 2018 2019 2020 2021 2022 2023
Rs. In lacs
CAPACITY UTILISATION 60% 70% 80% 85% 90% 90% 90% 90% 90%
Gross Sales
Domestic Sales 1364 1591 1818 1932 2045 2045 2045 2045 2045
Less: Net Excise Duty 65 75 86 92 96 96 96 96 96
Net Sales 1299 1516 1732 1840 1949 1949 1949 1949 1949
Cost of Sales
Raw Materials 1597 1769 2022 2148 2275 2275 2275 2275 2275
Consumables & Spares 34 40 46 48 51 51 51 51 51
Power & Fuel 22 26 30 31 33 33 33 33 33
Factory Wages & Salary 20 21 22 23 25 26 27 28 30
Other Manufacturing Exp.
i. Factory Overheads 36 36 36 36 36 36 36 36 36
ii. Repairs & Maint. 11 11 11 12 12 12 13 13 13
Total OME 47 47 47 48 48 48 49 49 49
Depreciation 35 36 38 39 41 42 44 45 45
Sub Total 1755 1939 2205 2338 2473 2475 2479 2482 2483
Add: Op. stocks-in process 7 8 9 10 10 10 10 10
Less :Cl. stocks-in-process 7 8 9 10 10 10 10 10 10
Cost of Production 1747 1939 2204 2337 2472 2475 2479 2482 2483
Add : Op. Stock of FG 73 81 92 97 103 103 103 103
Less :Cl. Stock of FG 73 81 92 97 103 103 103 103 103
Total 1674 1931 2193 2332 2466 2475 2479 2481 2483
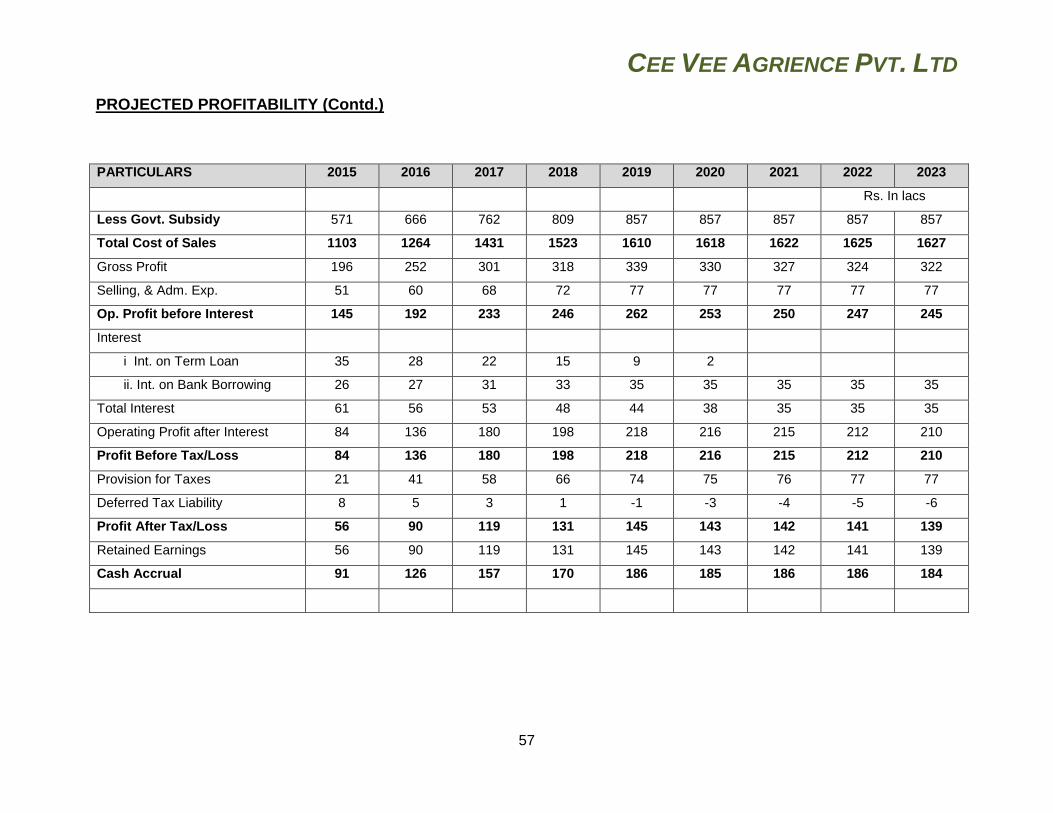
CEE VEE AGRIENCE PVT. LTD
57
PROJECTED PROFITABILITY (Contd.)
PARTICULARS 2015 2016 2017 2018 2019 2020 2021 2022 2023
Rs. In lacs
Less Govt. Subsidy 571 666 762 809 857 857 857 857 857
Total Cost of Sales 1103 1264 1431 1523 1610 1618 1622 1625 1627
Gross Profit 196 252 301 318 339 330 327 324 322
Selling, & Adm. Exp. 51 60 68 72 77 77 77 77 77
Op. Profit before Interest 145 192 233 246 262 253 250 247 245
Interest
i Int. on Term Loan 35 28 22 15 9 2
ii. Int. on Bank Borrowing 26 27 31 33 35 35 35 35 35
Total Interest 61 56 53 48 44 38 35 35 35
Operating Profit after Interest 84 136 180 198 218 216 215 212 210
Profit Before Tax/Loss 84 136 180 198 218 216 215 212 210
Provision for Taxes 21 41 58 66 74 75 76 77 77
Deferred Tax Liability 8 5 3 1 -1 -3 -4 -5 -6
Profit After Tax/Loss 56 90 119 131 145 143 142 141 139
Retained Earnings 56 90 119 131 145 143 142 141 139
Cash Accrual 91 126 157 170 186 185 186 186 184
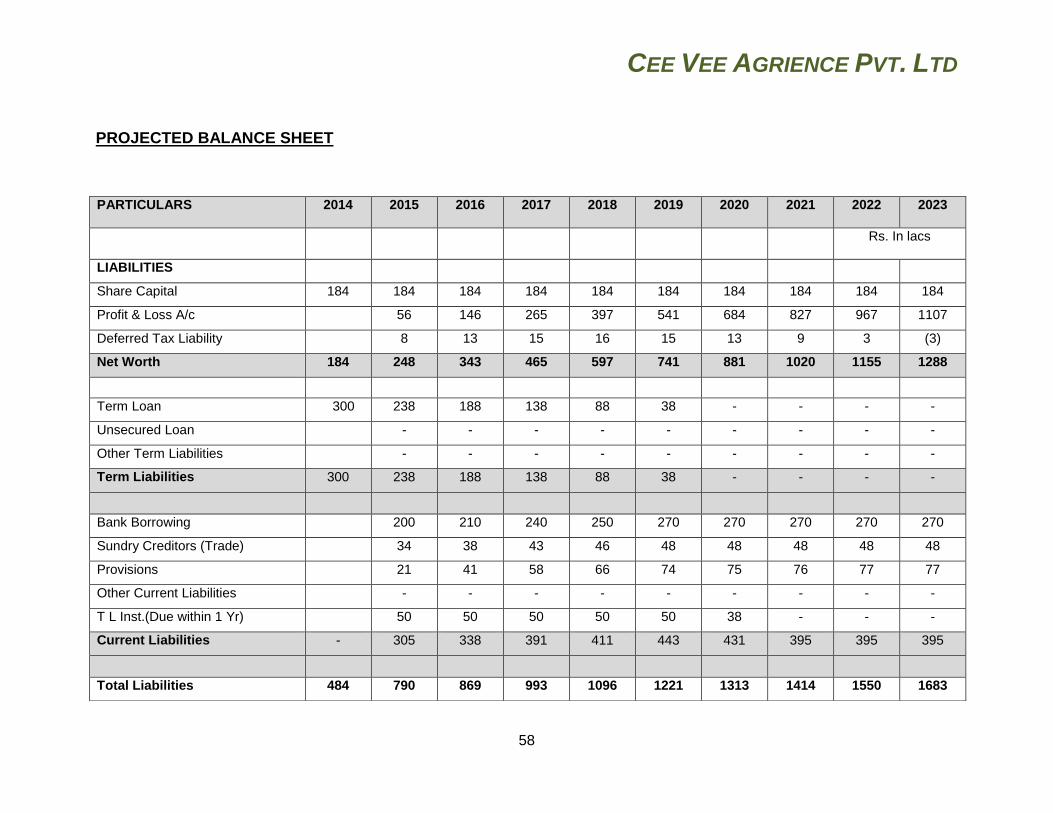
CEE VEE AGRIENCE PVT. LTD
58
PROJECTED BALANCE SHEET
PARTICULARS 2014 2015 2016 2017 2018 2019 2020 2021 2022 2023
Rs. In lacs
LIABILITIES
Share Capital 184 184 184 184 184 184 184 184 184 184
Profit & Loss A/c 56 146 265 397 541 684 827 967 1107
Deferred Tax Liability 8 13 15 16 15 13 9 3 (3)
Net Worth 184 248 343 465 597 741 881 1020 1155 1288
Term Loan 300 238 188 138 88 38 - - - -
Unsecured Loan - - - - - - - - -
Other Term Liabilities - - - - - - - - -
Term Liabilities 300 238 188 138 88 38 - - - -
Bank Borrowing 200 210 240 250 270 270 270 270 270
Sundry Creditors (Trade) 34 38 43 46 48 48 48 48 48
Provisions 21 41 58 66 74 75 76 77 77
Other Current Liabilities - - - - - - - - -
T L Inst.(Due within 1 Yr) 50 50 50 50 50 38 - - -
Current Liabilities - 305 338 391 411 443 431 395 395 395
Total Liabilities 484 790 869 993 1096 1221 1313 1414 1550 1683
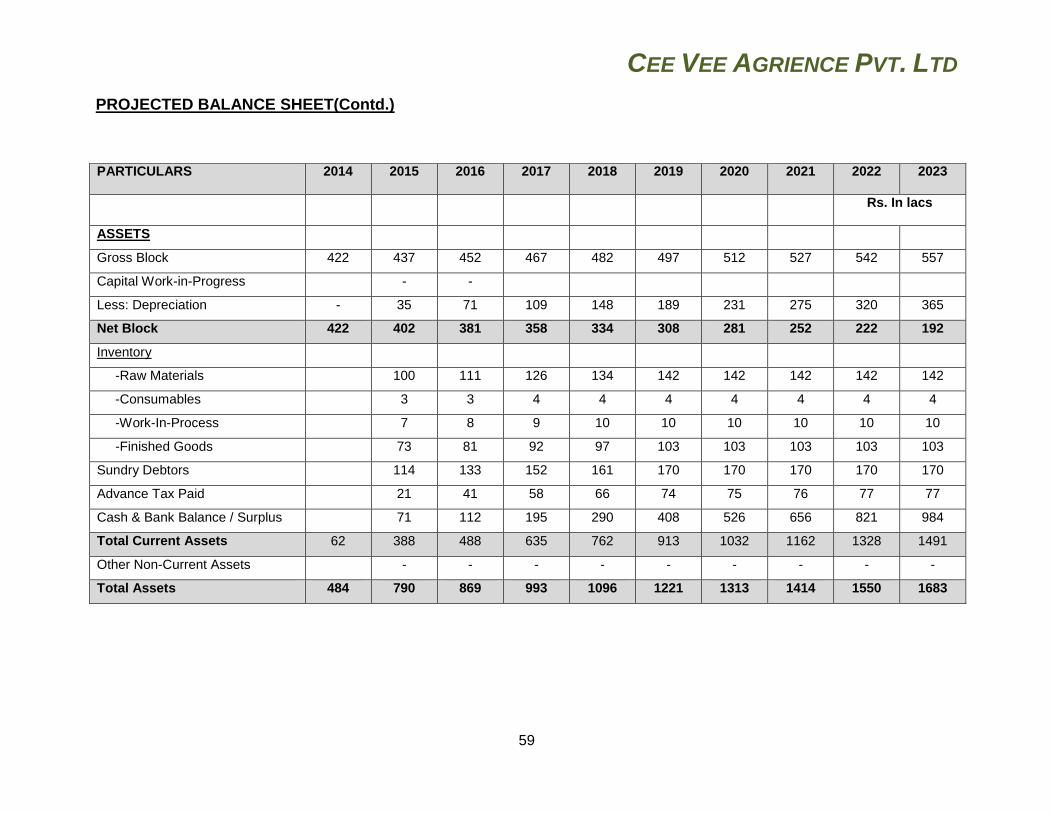
CEE VEE AGRIENCE PVT. LTD
59
PROJECTED BALANCE SHEET(Contd.)
PARTICULARS 2014 2015 2016 2017 2018 2019 2020 2021 2022 2023
Rs. In lacs
ASSETS
Gross Block 422 437 452 467 482 497 512 527 542 557
Capital Work-in-Progress
- -
Less: Depreciation - 35 71 109 148 189 231 275 320 365
Net Block 422 402 381 358 334 308 281 252 222 192
Inventory
-Raw Materials 100 111 126 134 142 142 142 142 142
-Consumables 3 3 4 4 4 4 4 4 4
-Work-In-Process 7 8 9 10 10 10 10 10 10
-Finished Goods 73 81 92 97 103 103 103 103 103
Sundry Debtors 114 133 152 161 170 170 170 170 170
Advance Tax Paid 21 41 58 66 74 75 76 77 77
Cash & Bank Balance / Surplus 71 112 195 290 408 526 656 821 984
Total Current Assets 62 388 488 635 762 913 1032 1162 1328 1491
Other Non-Current Assets - - - - - - - - -
Total Assets 484 790 869 993 1096 1221 1313 1414 1550 1683
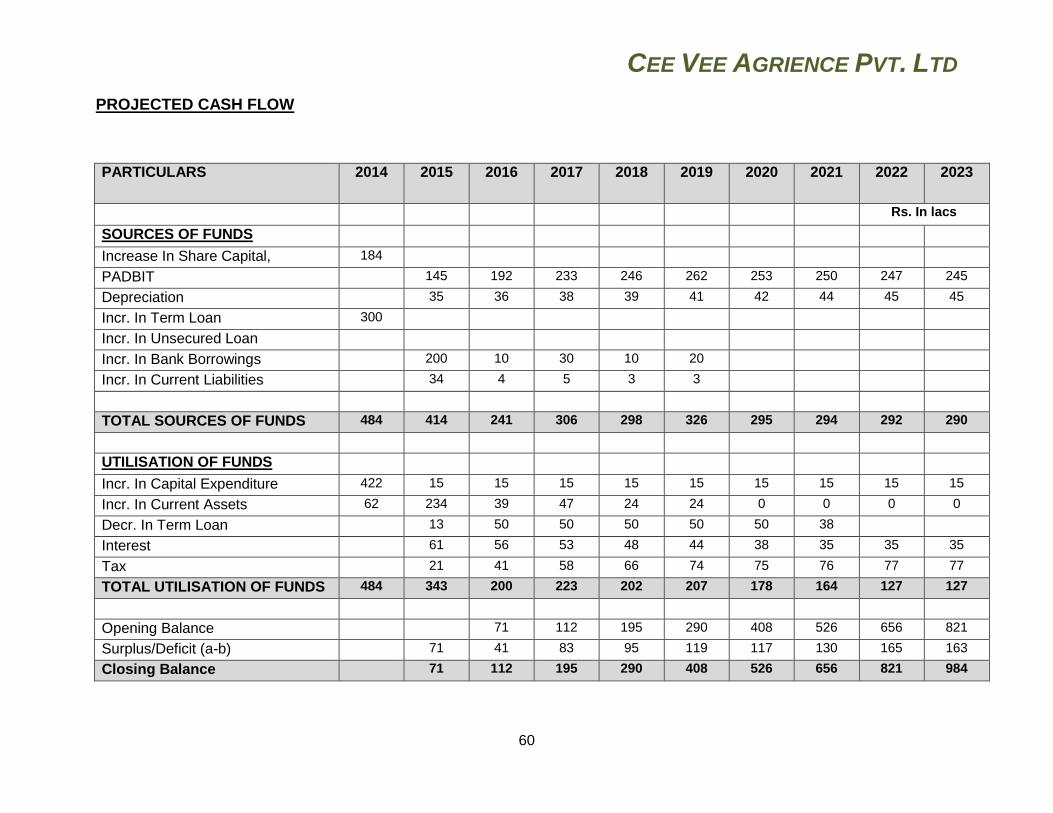
CEE VEE AGRIENCE PVT. LTD
60
PROJECTED CASH FLOW
PARTICULARS 2014 2015 2016 2017 2018 2019 2020 2021 2022 2023
Rs. In lacs
SOURCES OF FUNDS
Increase In Share Capital, 184
PADBIT 145 192 233 246 262 253 250 247 245
Depreciation 35 36 38 39 41 42 44 45 45
Incr. In Term Loan 300
Incr. In Unsecured Loan
Incr. In Bank Borrowings 200 10 30 10 20
Incr. In Current Liabilities 34 4 5 3 3
TOTAL SOURCES OF FUNDS 484 414 241 306 298 326 295 294 292 290
UTILISATION OF FUNDS
Incr. In Capital Expenditure 422 15 15 15 15 15 15 15 15 15
Incr. In Current Assets 62 234 39 47 24 24 0 0 0 0
Decr. In Term Loan 13 50 50 50 50 50 38
Interest 61 56 53 48 44 38 35 35 35
Tax 21 41 58 66 74 75 76 77 77
TOTAL UTILISATION OF FUNDS 484 343 200 223 202 207 178 164 127 127
Opening Balance 71 112 195 290 408 526 656 821
Surplus/Deficit (a-b) 71 41 83 95 119 117 130 165 163
Closing Balance 71 112 195 290 408 526 656 821 984
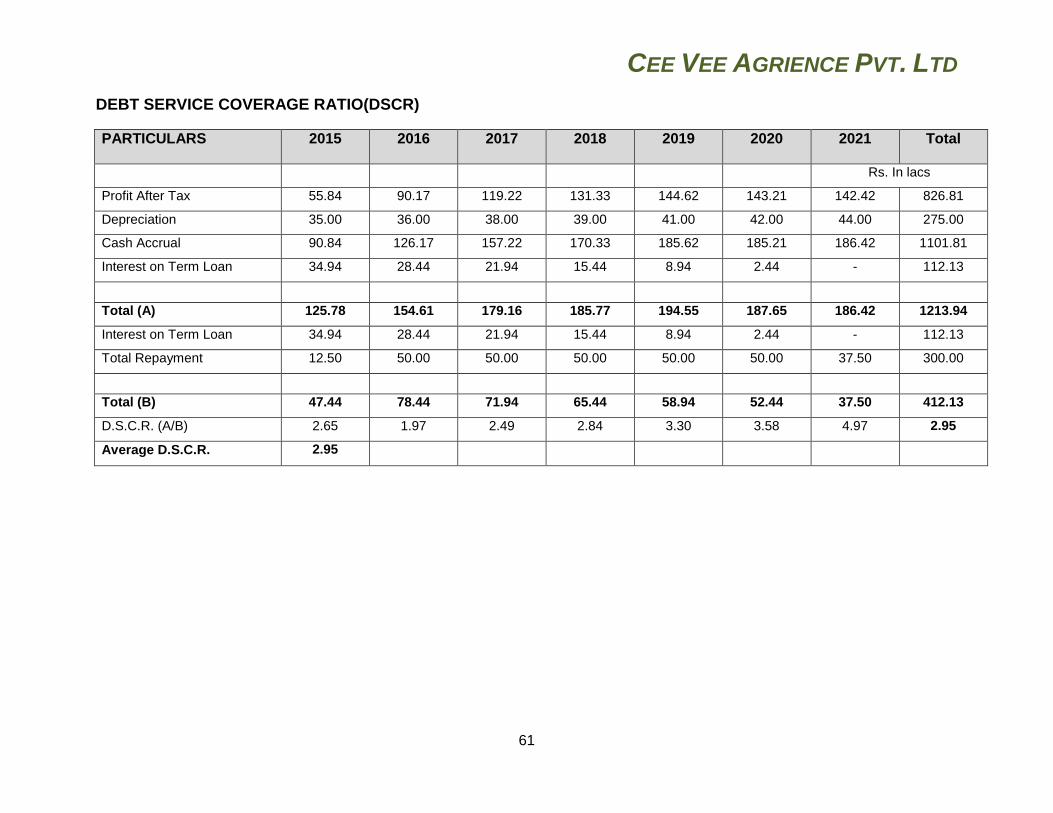
CEE VEE AGRIENCE PVT. LTD
61
DEBT SERVICE COVERAGE RATIO(DSCR)
PARTICULARS 2015 2016 2017 2018 2019 2020 2021 Total
Rs. In lacs
Profit After Tax 55.84 90.17 119.22 131.33 144.62 143.21 142.42 826.81
Depreciation 35.00 36.00 38.00 39.00 41.00 42.00 44.00 275.00
Cash Accrual 90.84 126.17 157.22 170.33 185.62 185.21 186.42 1101.81
Interest on Term Loan 34.94 28.44 21.94 15.44 8.94 2.44 - 112.13
Total (A) 125.78 154.61 179.16 185.77 194.55 187.65 186.42 1213.94
Interest on Term Loan 34.94 28.44 21.94 15.44 8.94 2.44 - 112.13
Total Repayment 12.50 50.00 50.00 50.00 50.00 50.00 37.50 300.00
Total (B) 47.44 78.44 71.94 65.44 58.94 52.44 37.50 412.13
D.S.C.R. (A/B) 2.65 1.97 2.49 2.84 3.30 3.58 4.97 2.95
Average D.S.C.R. 2.95
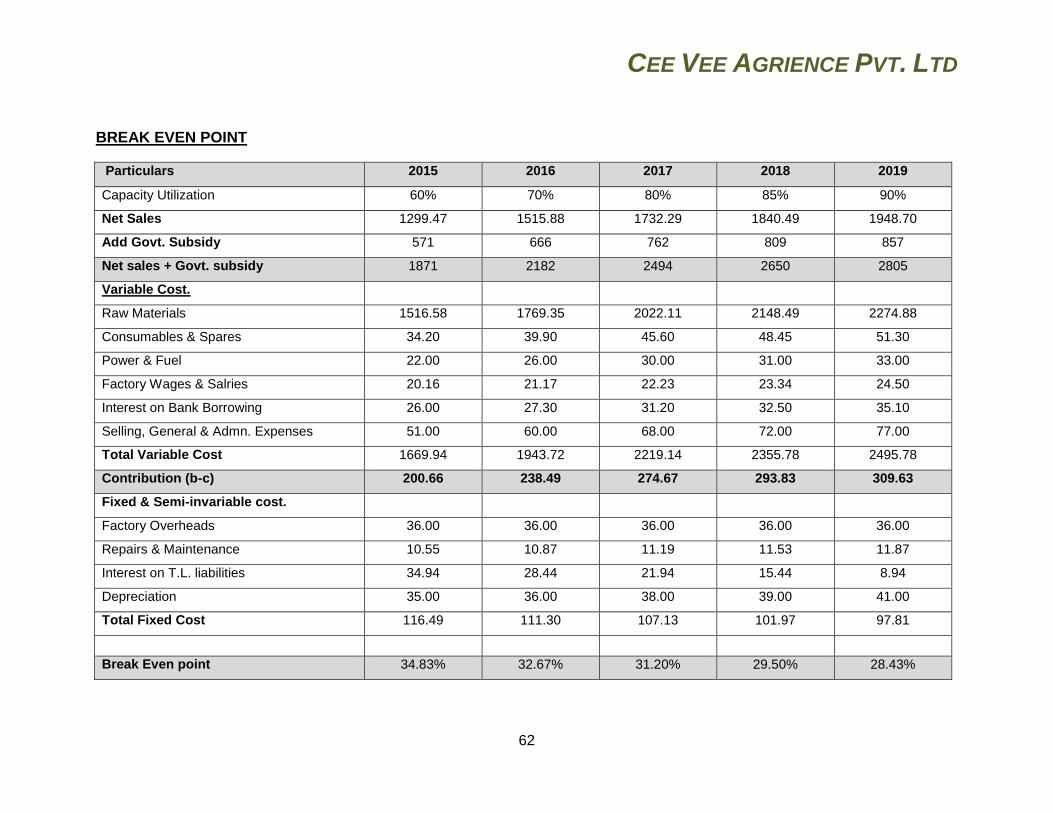
CEE VEE AGRIENCE PVT. LTD
62
BREAK EVEN POINT
Particulars 2015 2016 2017 2018 2019
Capacity Utilization 60% 70% 80% 85% 90%
Net Sales 1299.47 1515.88 1732.29 1840.49 1948.70
Add Govt. Subsidy 571 666 762 809 857
Net sales + Govt. subsidy 1871 2182 2494 2650 2805
Variable Cost.
Raw Materials 1516.58 1769.35 2022.11 2148.49 2274.88
Consumables & Spares 34.20 39.90 45.60 48.45 51.30
Power & Fuel 22.00 26.00 30.00 31.00 33.00
Factory Wages & Salries 20.16 21.17 22.23 23.34 24.50
Interest on Bank Borrowing 26.00 27.30 31.20 32.50 35.10
Selling, General & Admn. Expenses 51.00 60.00 68.00 72.00 77.00
Total Variable Cost 1669.94 1943.72 2219.14 2355.78 2495.78
Contribution (b-c) 200.66 238.49 274.67 293.83 309.63
Fixed & Semi-invariable cost.
Factory Overheads 36.00 36.00 36.00 36.00 36.00
Repairs & Maintenance 10.55 10.87 11.19 11.53 11.87
Interest on T.L. liabilities 34.94 28.44 21.94 15.44 8.94
Depreciation 35.00 36.00 38.00 39.00 41.00
Total Fixed Cost 116.49 111.30 107.13 101.97 97.81
Break Even point 34.83% 32.67% 31.20% 29.50% 28.43%
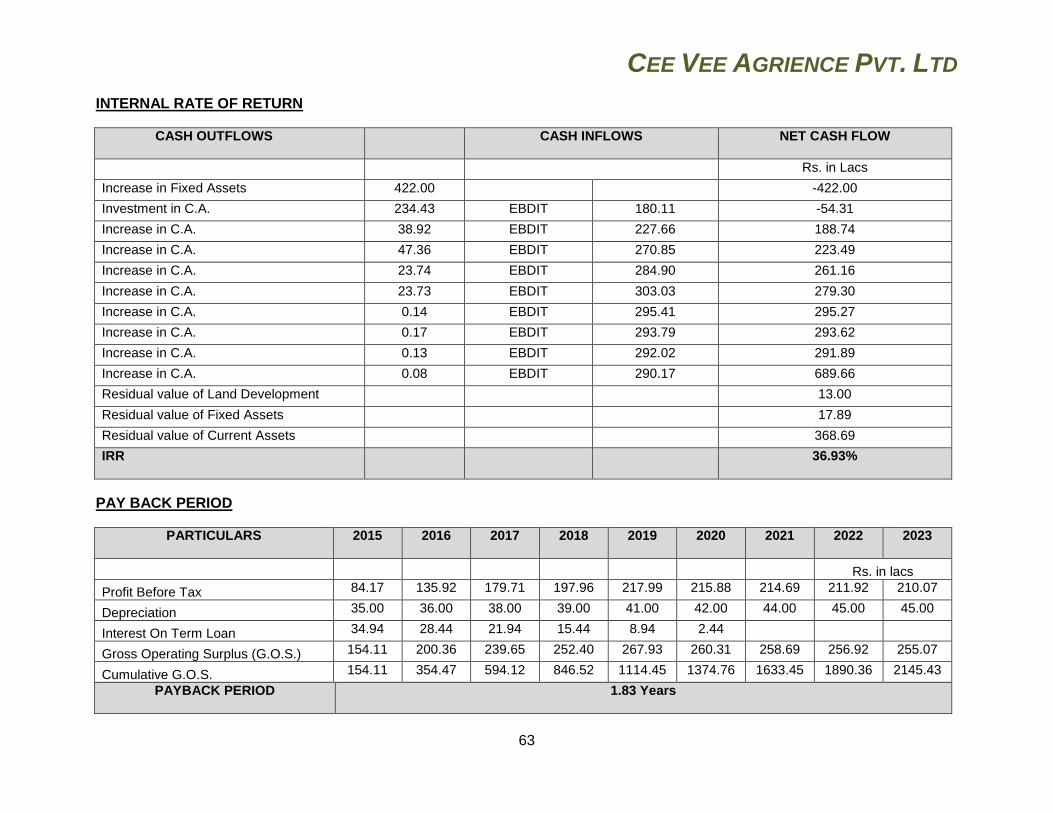
CEE VEE AGRIENCE PVT. LTD
63
INTERNAL RATE OF RETURN
CASH OUTFLOWS CASH INFLOWS NET CASH FLOW
Rs. in Lacs
Increase in Fixed Assets 422.00 -422.00
Investment in C.A. 234.43 EBDIT 180.11 -54.31
Increase in C.A. 38.92 EBDIT 227.66 188.74
Increase in C.A. 47.36 EBDIT 270.85 223.49
Increase in C.A. 23.74 EBDIT 284.90 261.16
Increase in C.A. 23.73 EBDIT 303.03 279.30
Increase in C.A. 0.14 EBDIT 295.41 295.27
Increase in C.A. 0.17 EBDIT 293.79 293.62
Increase in C.A. 0.13 EBDIT 292.02 291.89
Increase in C.A. 0.08 EBDIT 290.17 689.66
Residual value of Land Development 13.00
Residual value of Fixed Assets 17.89
Residual value of Current Assets 368.69
IRR 36.93%
PAY BACK PERIOD
PARTICULARS 2015 2016 2017 2018 2019 2020 2021 2022 2023
Rs. in lacs
Profit Before Tax 84.17 135.92 179.71 197.96 217.99 215.88 214.69 211.92 210.07
Depreciation 35.00 36.00 38.00 39.00 41.00 42.00 44.00 45.00 45.00
Interest On Term Loan 34.94 28.44 21.94 15.44 8.94 2.44
Gross Operating Surplus (G.O.S.) 154.11 200.36 239.65 252.40 267.93 260.31 258.69 256.92 255.07
Cumulative G.O.S. 154.11 354.47 594.12 846.52 1114.45 1374.76 1633.45 1890.36 2145.43
PAYBACK PERIOD 1.83 Years
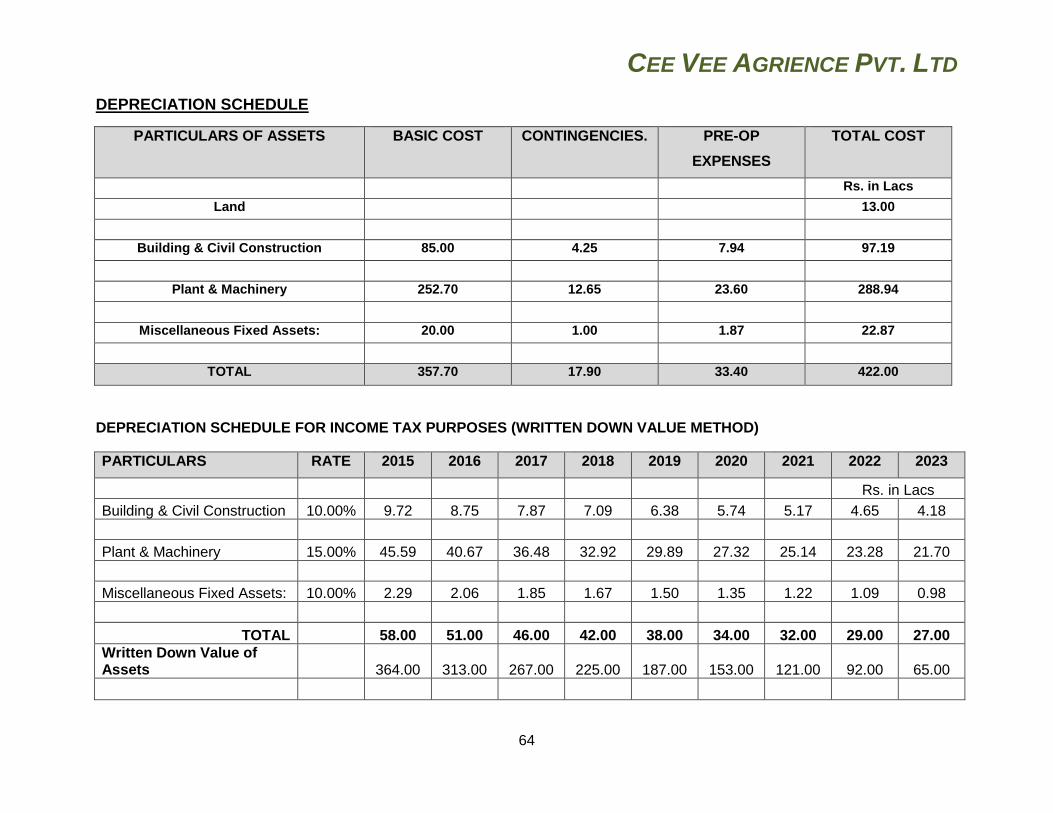
CEE VEE AGRIENCE PVT. LTD
64
DEPRECIATION SCHEDULE
PARTICULARS OF ASSETS BASIC COST CONTINGENCIES. PRE-OP
EXPENSES
TOTAL COST
Rs. in Lacs
Land 13.00
Building & Civil Construction 85.00 4.25 7.94 97.19
Plant & Machinery 252.70 12.65 23.60 288.94
Miscellaneous Fixed Assets: 20.00 1.00 1.87 22.87
TOTAL 357.70 17.90 33.40 422.00
DEPRECIATION SCHEDULE FOR INCOME TAX PURPOSES (WRITTEN DOWN VALUE METHOD)
PARTICULARS RATE 2015 2016 2017 2018 2019 2020 2021 2022 2023
Rs. in Lacs
Building & Civil Construction 10.00% 9.72 8.75 7.87 7.09 6.38 5.74 5.17 4.65 4.18
Plant & Machinery 15.00% 45.59 40.67 36.48 32.92 29.89 27.32 25.14 23.28 21.70
Miscellaneous Fixed Assets: 10.00% 2.29 2.06 1.85 1.67 1.50 1.35 1.22 1.09 0.98
TOTAL 58.00 51.00 46.00 42.00 38.00 34.00 32.00 29.00 27.00
Written Down Value of Assets
364.00
313.00
267.00
225.00
187.00
153.00
121.00
92.00
65.00
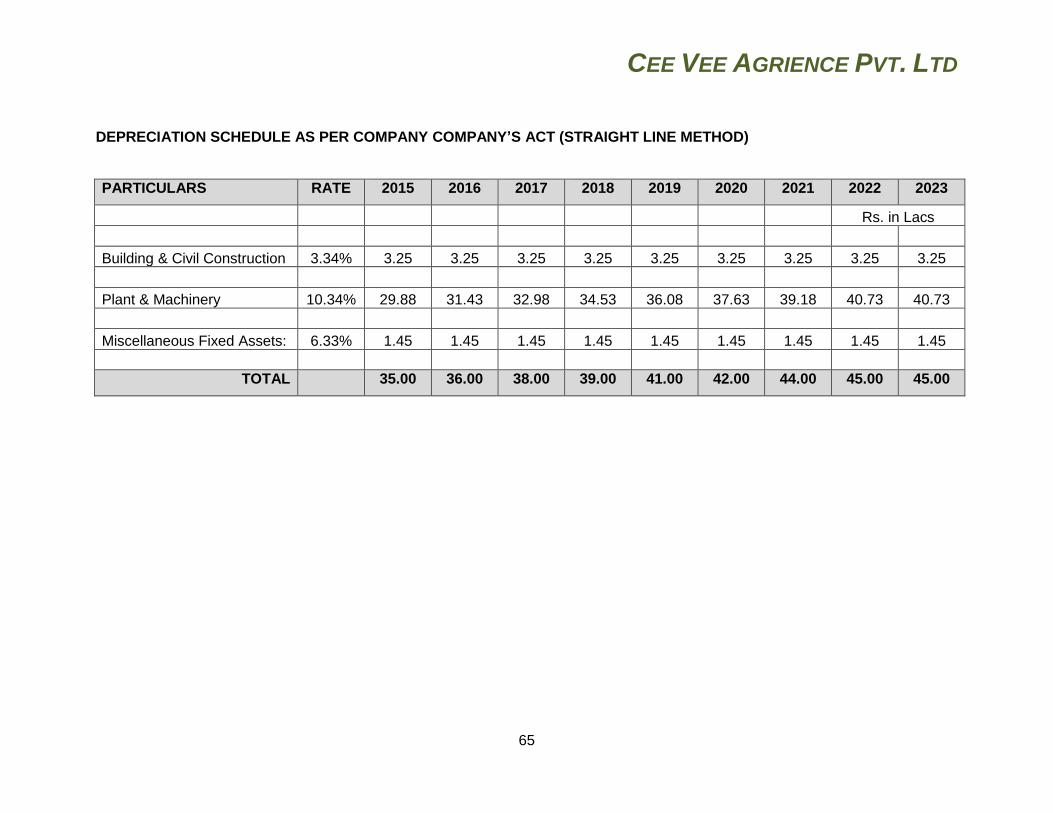
CEE VEE AGRIENCE PVT. LTD
65
DEPRECIATION SCHEDULE AS PER COMPANY COMPANY’S ACT (STRAIGHT LINE METHOD)
PARTICULARS RATE 2015 2016 2017 2018 2019 2020 2021 2022 2023
Rs. in Lacs
Building & Civil Construction 3.34% 3.25 3.25 3.25 3.25 3.25 3.25 3.25 3.25 3.25
Plant & Machinery 10.34% 29.88 31.43 32.98 34.53 36.08 37.63 39.18 40.73 40.73
Miscellaneous Fixed Assets: 6.33% 1.45 1.45 1.45 1.45 1.45 1.45 1.45 1.45 1.45
TOTAL 35.00 36.00 38.00 39.00 41.00 42.00 44.00 45.00 45.00
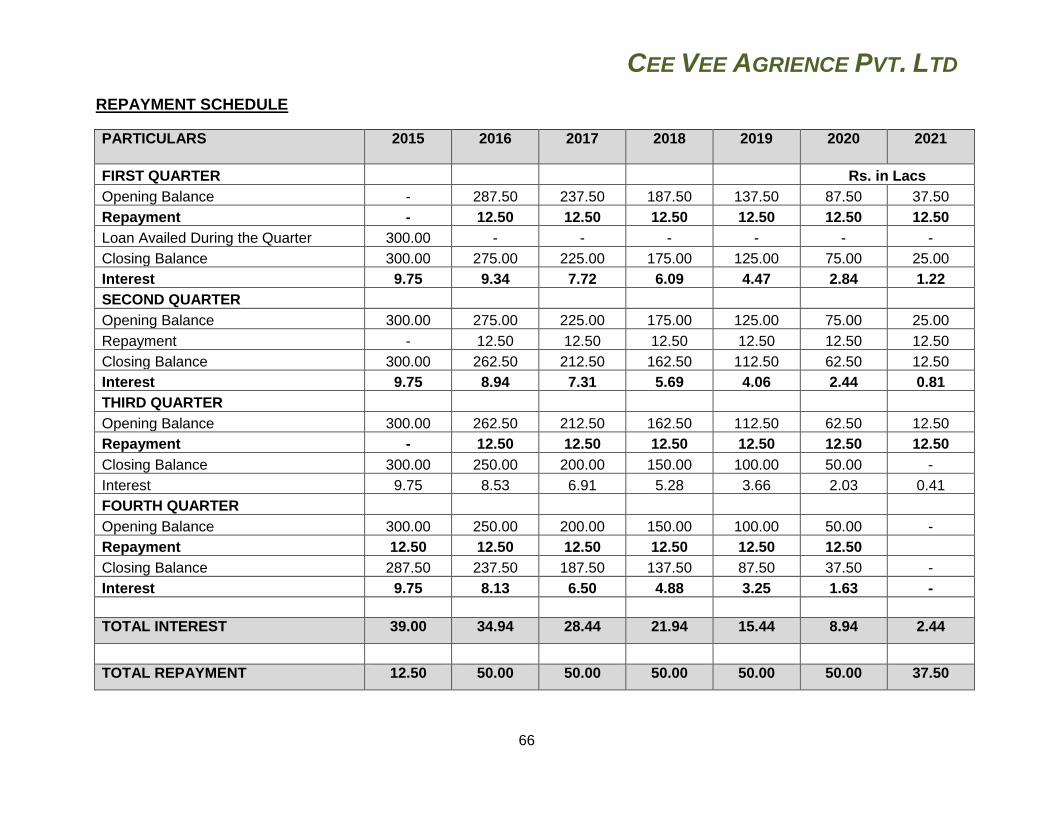
CEE VEE AGRIENCE PVT. LTD
66
REPAYMENT SCHEDULE
PARTICULARS 2015 2016 2017 2018 2019 2020 2021
FIRST QUARTER
Rs. in Lacs
Opening Balance - 287.50 237.50 187.50 137.50 87.50 37.50
Repayment - 12.50 12.50 12.50 12.50 12.50 12.50
Loan Availed During the Quarter 300.00 - - - - - -
Closing Balance 300.00 275.00 225.00 175.00 125.00 75.00 25.00
Interest 9.75 9.34 7.72 6.09 4.47 2.84 1.22
SECOND QUARTER Opening Balance 300.00 275.00 225.00 175.00 125.00 75.00 25.00
Repayment - 12.50 12.50 12.50 12.50 12.50 12.50
Closing Balance 300.00 262.50 212.50 162.50 112.50 62.50 12.50
Interest 9.75 8.94 7.31 5.69 4.06 2.44 0.81
THIRD QUARTER Opening Balance 300.00 262.50 212.50 162.50 112.50 62.50 12.50
Repayment - 12.50 12.50 12.50 12.50 12.50 12.50
Closing Balance 300.00 250.00 200.00 150.00 100.00 50.00 -
Interest 9.75 8.53 6.91 5.28 3.66 2.03 0.41
FOURTH QUARTER Opening Balance 300.00 250.00 200.00 150.00 100.00 50.00 -
Repayment 12.50 12.50 12.50 12.50 12.50 12.50 Closing Balance 287.50 237.50 187.50 137.50 87.50 37.50 -
Interest 9.75 8.13 6.50 4.88 3.25 1.63 -
TOTAL INTEREST 39.00 34.94 28.44 21.94 15.44 8.94 2.44
TOTAL REPAYMENT 12.50 50.00 50.00 50.00 50.00 50.00 37.50
CEE VEE AGRIENCE PVT. LTD
67
NOTES