Embed Size (px)
Citation preview

Cellular automaton modelling of ductile iron microstructure in the thin wall casting
This article has been downloaded from IOPscience. Please scroll down to see the full text article.
2012 IOP Conf. Ser.: Mater. Sci. Eng. 33 012083
(http://iopscience.iop.org/1757-899X/33/1/012083)
Download details:
IP Address: 149.156.200.14
The article was downloaded on 06/05/2013 at 15:42
Please note that terms and conditions apply.
View the table of contents for this issue, or go to the journal homepage for more
Home Search Collections Journals About Contact us My IOPscience

Cellular automaton modelling of ductile iron microstructure in the thin wall casting
A A Burbelko1
AGH University of Science and Technology, 23 Reymonta Str., Krakow, Poland , D Gurgul, W Kapturkiewicz, M Górny
E-mail: [email protected] Abstract. The mathematical model of the globular eutectic solidification in 2D was designed. Proposed model is based on the Cellular Automaton Finite Differences (CA-FD) calculation method. Model has been used for studies of the primary austenite and of globular eutectic grains growth during the ductile iron solidification in the thin wall casting. Model takes into account, among other things, non-uniform temperature distribution in the casting wall cross-section, kinetics of the austenite and graphite grains nucleation, and non-equilibrium nature of the interphase boundary migration.
1. Introduction Nodular graphite cast iron, also known as ductile iron (DI), has major applications in critical engi-neering parts due to its mechanical properties and castability. The mechanical and physical properties of this material depend on the shape and number of the graphite grains and microstructure of the me-tallic matrix.
Solidification of DI was a subject of many computer modelling programs described in literature [1 -5], in which the stationary conditions of carbon diffusion in austenite is pre-assumed. Recently, a tendency for production of thin-walled castings has been observed [6-8]. In this technology, the proc-ess of the fast solidification may be very far from equilibrium and steady-state conditions [9
The purpose of the present work is a two-dimension model development for simulation of the DI structure formation during the solidification in the condition of non steady-state temperature and diffu-sion fields in the thin-wall casting.
].
2. Model of process The CA-FD is one of the known methods of the simulation of microstructure formation during the solidification [10, 11]. In the CA microstructure modelling the outer grain shape is the result of the simulation and does not superimposed beforehand. The model development for a one-phase micro-structure evolution is a subject of the numerous researches [12 -21]. Model of the eutectic solidification of DI in the uniform temperature field and superimposed cooling rate is known [22
Presented model is based on the CA-FD technique and will predict solidification of DI in the non-uniform temperature field during the cooling of the thin-wall casting in the sand mould. Model takes into account the continuous nucleation of austenite and graphite grains from liquid controlled by un-dercooling, separate non-equilibrium growth of graphite nodules and austenite dendrites at the first
].
1 To whom any correspondence should be addressed.
MCWASP XIII IOP PublishingIOP Conf. Series: Materials Science and Engineering 33 (2012) 012083 doi:10.1088/1757-899X/33/1/012083
Published under licence by IOP Publishing Ltd 1

solidification stage, and the following cooperative growth of graphite-austenite eutectic in the binary Fe-C system. A set of six cell states for microstructure modelling: three mono-phase states – "liquid", "austenite", and "graphite" – and three two-phase states were used.
At the beginning, all of the cells in the CA lattice are in the "liquid" state and have initial tempera-ture. The analysed casting domain is in the thermal contact with a sand mould with a normal initial temperature. Nucleation and growth of the solid grains are possible when the temperature of the liquid drops below the liquidus.
2.1. Heat and mass diffusion The numerical solution of the nonlinear Fourier equation was used for heat flow in the analyzed do-mains (casting and mould):
( ) TqTTc +∇λ∇=τ∂
∂ (1)
where: T is the temperature, τ is the time, λ is the thermal conductivity, and c is the volumetric specific heat, qT
Solute diffusion in the domains of every phase was calculated in the same manner as temperature distribution, by the numerical solution of the diffusion equation with a source term at the interface:
is the latent heat generation rate.
( ) CqCDC+∇∇=
τ∂∂
(2)
where D is the solute diffusion coefficient, and C is the solute concentration in this phase. Both source functions are equal to zero outside of the interface cells. In the interface cells the value
of the heat and mass sources for the finite-difference scheme are:
τ∂
∂= β
β→α
fLqT (3)
( )τ∂
∂−= β
βα
fCCqC (4)
where Lα→β is the volumetric latent heat of α→β transformation, Cα and Cβ are the carbon concentra-tions in the vanishing and growing phases, and Δfβ
For thermal and diffusion calculation in the casting region, the following boundary conditions were used: at the top and bottom of the grid – periodic boundary condition; at the left side – symmetry BC; at the right side – mould with an absence of mass flow and heat flow through the border according to Newton law:
is the growth of the new phase volume fraction during the time step.
( )mc TThq −= (5)
where h is the heat transfer coefficient (value of 500 W·m-2K-1 was assumed), and Tc and Tm
The details of solution are described in [
are the temperature values of the casting and mould surfaces in the contact.
23
2.2. Nucleation
].
According to [24] undercooling of the nucleation from liquid during ductile iron solidification in the thin wall reaches up to 65 K below the equilibrium temperature. Grain nucleation in industrial alloys has a heterogeneous nature. The substrates for the nucleus are randomly distributed in the bulk. Bulk distribution of differently-sized substrates also has a stochastic nature. The undercooling value of sub-strate activation is a function of its size. Functional relationship between the active substrate fraction
MCWASP XIII IOP PublishingIOP Conf. Series: Materials Science and Engineering 33 (2012) 012083 doi:10.1088/1757-899X/33/1/012083
2

and undercooling ΔT should be a feature of the probability distribution law [25
The number of active substrates in the domain V of the melt with an undercooling ΔT below the liquidus may be calculated on the basis of the cumulative distribution function F(ΔT):
]. The undercooling value of each phase should be calculated relative to the appropriate liquidus lines.
( )VTFNN ∆= max (6)
where: NmaxWhen one substrate position doesn't have any influence on another substrate’s positions, the ran-
dom variable calculated as the number of substrates in any random domain V will have the Poisson statistical distribution with the mean value ν = N
is the maximum specific number of substrates for nucleation.
max
V. For this statistical distribution the probability density function is
( ) !kekP kr ν= ν−
(7)
where: e is the Euler-Mascheroni constant, and k is the estimated number of substrates. The method of nucleation modelling for a CA lattice is known [25]. According to [25] the
undercooling values randomly generated with a statistical distribution curve are attributed to randomly chosen cells. If a cell is chosen several times (i.e., if it contains more than one nucleation site), only the smaller nucleation undercooling is used. If the CA cell is too high/large in size, the calculated grain density will be underestimated. A modified version of this algorithm was used in this paper.
The probability of the lack of a nucleus in the cell (k = 0) according to Poisson's statistic is equal to:
( ) ν−== ekPr 0 (8)
The probability of one substrate (k = 1) in the cell is represented by the following equation:
( ) ν−ν== ekPr 1 (9)
The probability of more than one substrates in one cell may be calculated as:
( ) ( )ν+ν−=> ν− 111 ekPr (10)
The next way of substrate placement and the undercooling of nucleation selection is proposed based on the mean number of active substrates in one cell:
( )υ∆=ν TFNmax (11)
where υ is a cell’s volume (or surface for 2D). For each of the cells in the CA a random number p should be generated with an equiprobability
distribution in the (0..1] range. For small domains when 1<<ν this value is equal to probability of one substrate presence in the analyzed domain. Because for small cells ( ) 11or0 →== kkPr and ( ) 01 →>kPr , the condition of the precise one substrate present in the cell is the following inequality:
( )υ∆< TFNp max (12)
The nucleation undercooling in this case should be estimated on the basis of the inverse function of the above-mentioned cumulative distribution curve (fractile):
( )[ ]1max
1 −− υ=∆ NpFT (13)
The solid grain will begin to grow when the undercooling exceeds the above level. The substrates are present (and nucleation is possible) only in cells with a positive ΔT value.
MCWASP XIII IOP PublishingIOP Conf. Series: Materials Science and Engineering 33 (2012) 012083 doi:10.1088/1757-899X/33/1/012083
3
The method of continuous nucleation prediction used in modelling has been presented in details in the [26
The Weibull statistical distribution was used in this paper for nucleation modelling [].
27
]. The spe-cific number of active substrates is given by:
( )1max exp −∆⋅−= TbNn (14)
where NmaxThe undercooling of nucleation can be calculated as
and b is a nucleation parameters.
( )[ ]{ } 11maxln
−−υ−=∆ NpbT (15)
where p is a random number generated with an equiprobability distribution in the (0..1] range. The values for Nmax
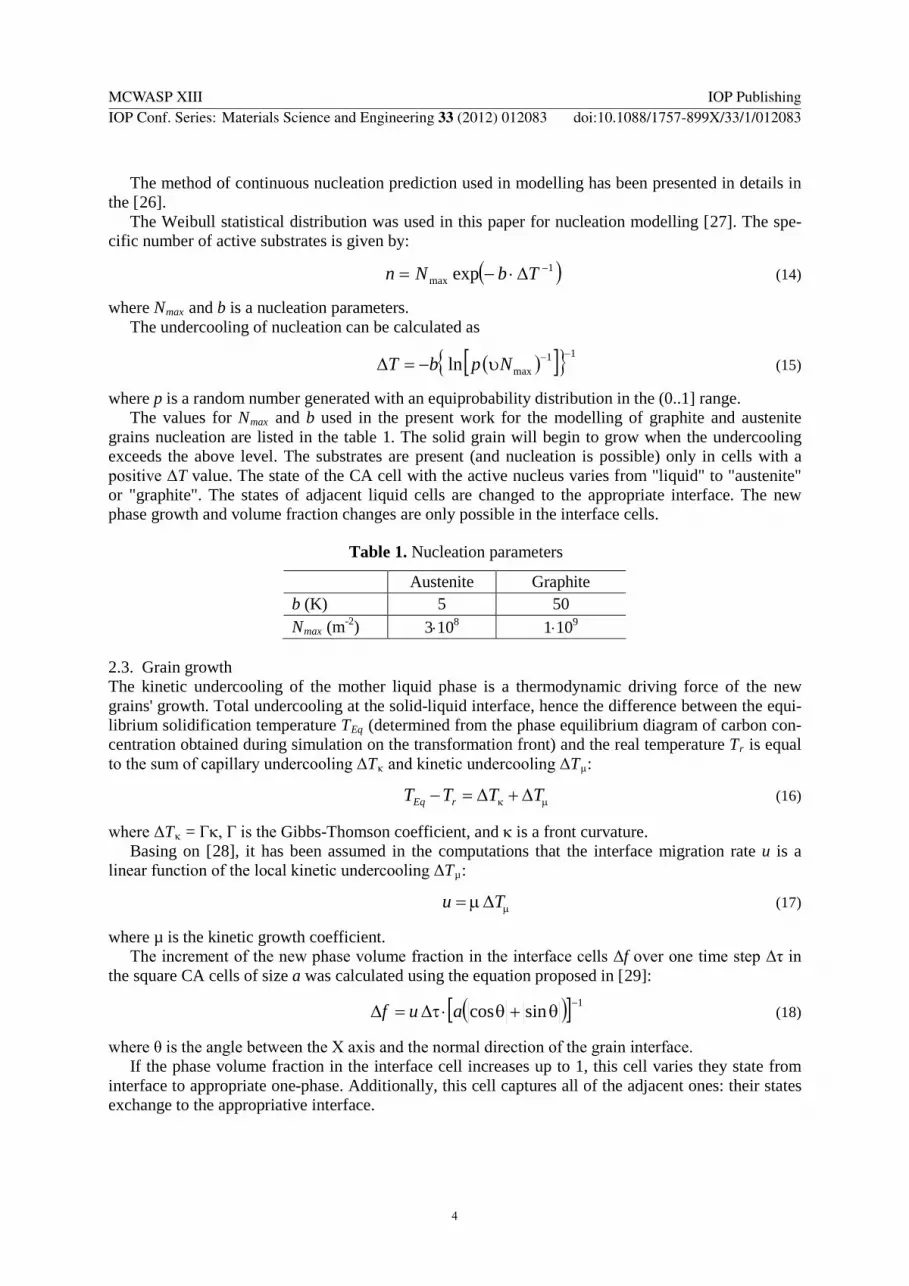
Table 1. Nucleation parameters
and b used in the present work for the modelling of graphite and austenite grains nucleation are listed in the table 1. The solid grain will begin to grow when the undercooling exceeds the above level. The substrates are present (and nucleation is possible) only in cells with a positive ΔT value. The state of the CA cell with the active nucleus varies from "liquid" to "austenite" or "graphite". The states of adjacent liquid cells are changed to the appropriate interface. The new phase growth and volume fraction changes are only possible in the interface cells.
Austenite Graphite b (K) 5 50 Nmax (m-2 3⋅10) 1⋅108
2.3. Grain growth
9
The kinetic undercooling of the mother liquid phase is a thermodynamic driving force of the new grains' growth. Total undercooling at the solid-liquid interface, hence the difference between the equi-librium solidification temperature TEq (determined from the phase equilibrium diagram of carbon con-centration obtained during simulation on the transformation front) and the real temperature Tr is equal to the sum of capillary undercooling ΔTκ and kinetic undercooling ΔTμ
:
µκ ∆+∆=− TTTT rEq (16)
where ΔTκ
Basing on [ = Γκ, Γ is the Gibbs-Thomson coefficient, and κ is a front curvature.
28], it has been assumed in the computations that the interface migration rate u is a linear function of the local kinetic undercooling ΔTµ
:
µ∆µ= Tu (17)
where µ is the kinetic growth coefficient. The increment of the new phase volume fraction in the interface cells Δf over one time step Δτ in
the square CA cells of size a was calculated using the equation proposed in [29
]:
( )[ ] 1sincos −θ+θ⋅τ∆=∆ auf (18)
where θ is the angle between the X axis and the normal direction of the grain interface. If the phase volume fraction in the interface cell increases up to 1, this cell varies they state from
interface to appropriate one-phase. Additionally, this cell captures all of the adjacent ones: their states exchange to the appropriative interface.
MCWASP XIII IOP PublishingIOP Conf. Series: Materials Science and Engineering 33 (2012) 012083 doi:10.1088/1757-899X/33/1/012083
4

The normal direction of the grain boundary in the interface cells was determined by the approach of the F-vector [30
]. The angle θ between the growth direction (normal to the grain boundary) and the positive X-axis direction was calculated as follows:
⋅=θ
−
∑∑1
,,,
,,,arctan
jijiji
jijiji fxfy (19)
where: fi,j is the volume fraction of the phase in the cell (i,j), and xi,j and yi,j(19)
are the relative coordinates of the adjacent cells. The summation in concerning the 20 neighbouring cells gives the best re-sults of normal direction estimation [29].
Another details of the used CA-FD model of a two-phase eutectic solidification were introduced elsewhere [31, 32
3. Parameters for modelling
].
Computations of the diffusion field and microstructure were carried out on a grid of 200×1000 cells. The side of each cell was 1 μm in length. An initial uniform carbon concentration in the binary Fe-C liquid was assumed, equal to 0.04675 part of the mass fraction (eutectic equivalent SC
Parameters used in the modelling are shown in the table 2. = 1.10).
Table 2. Thermo-physical parameters used in the modelling.
Heat conductivity (W⋅m-1⋅K-1 ): – liquid λ 30 L [16] – austenite λ 20 γ [33– graphite
] λ 20 gr [16]
– mould λ 0,65 m Diffusivity of carbon in (m2 /s): – liquid D 1.25⋅10L [-9 34– austenite
] D 5⋅10γ [-10 16]
Transition heat (J/m3 ): – liquid – austenite L 19.7⋅10L/γ [8 33] – liquid – graphite L 16.2⋅10L/gr 5 – austenite – graphite L 8.8⋅10γ/gr 5 Specific heat (J⋅m-3⋅K-1 ): – liquid c 5.6⋅10v,L [6 33] – austenite c 5.84⋅10v, γ [6 16] – graphite c 1.78⋅10v,gr [6 33] – mould c 1.67⋅10m 6 Gibbs-Thomson coefficient for interface (m⋅K): – austenite – liquid Γ 1.9⋅10γ/L [-7 33] – graphite – liquid Γ 7.0⋅10gr/L -6 – graphite – austenite Γ 9.45⋅10gr/γ -6 Kinetic coefficient of the interface (m⋅s-1⋅K-1 ): – austenite – liquid µ 10γ/L [-3 35– graphite – liquid
] µ 10gr/L -8
– graphite – austenite µ 10gr/γ -8
MCWASP XIII IOP PublishingIOP Conf. Series: Materials Science and Engineering 33 (2012) 012083 doi:10.1088/1757-899X/33/1/012083
5

On the long sides of this mesh the periodic boundary condition (BC) was used [36] and on the short sides of this mesh the adiabatic one was used. Initial temperature of alloy is equal to 1637 K. For the temperature field simulation the following BC were using: the periodic BC for long sides, the adiabatic one at the casting axis (left side in the figure 1) and Newton BC with heat transfer coefficient h = 500 W∙m-2∙K-1
Casting is cooled in the green sound mould. For the temperature field calculation the 5×500 "rare" mesh was used with the spatial step equal to 50 μm. Mould initial temperature was equal to T
between casting and mould (right side in figure 1).
m = 298 K. On the long sides of this mesh the periodic BC was used. On the short outer side the Newton BC was assumed with h = 100 W∙m-2∙K-1
4. Results of modelling
.
The history of microstructure formation in the 2 mm casting is presented in figure 1.
(a)
(b)
(c)
(d)
(e)
(f)
← plate axes mould wall →
Figure 1. Microstructure of the DI (simulation results); cooling time: a) 3.8 s, b) 4.8 s, c) 6.8 s; d) 10.4 s; e) 13.4 s; f) 17.4 s.
MCWASP XIII IOP PublishingIOP Conf. Series: Materials Science and Engineering 33 (2012) 012083 doi:10.1088/1757-899X/33/1/012083
6

The comparison of the virtual microstructure and microstructure of the real 2 mm casting (non-etched) is shown respectively in figures 2a and 2b. The simulated graphite nodules size and bulk distribution are similar to the experimental one.
(a)
(b)
Figure 2. Final microstructure of the DI in the 2 mm wall: a) simulation for SC = 1.1, separate austenite grains have different colour (results of modelling are repeated 4 times due to symmetry and periodic boundary conditions); b) real casting, DI with SC
= 1.1 (un-etched).
Figure 3 shows the cooling kinetics (modelling) for five simulations and the curve of the mean temperature value calculated on the base of these primary results. Primary results were obtained for the identical initial and border conditions.
Figure 3. Five cooling curves obtained in the simulations with the identical initial and boundary conditions (points) and mean value of the temperature (solid line). Differences between presented primary cooling curves are the results of stochastic nature of the grain nucleation (random nucleation moments and places).
MCWASP XIII IOP PublishingIOP Conf. Series: Materials Science and Engineering 33 (2012) 012083 doi:10.1088/1757-899X/33/1/012083
7

The observed differences between presented primary cooling curves are the results of stochastic nature of the grain nucleation (random nucleation moments and places according to description in the subsection 2.2). There is visible the big undercooling below the eutectic temperature. The range of the maximum undercooling is 50...54 K.
The kinetics of austenite and graphite growth during solidification is presented in figure 4.
Figure 4. Kinetics of austenite and graphite growth (modelling).
5. Conclusions The CA-FD computer model for the simulation of the DI solidification in thin wall was presented. The results of modelling were compared with the experimental microstructure. Results obtained in the 2 mm width casting wall confirm the model accuracy.
The model is well worked for thin walled ductile iron casting, for the high level undercooling be-low the equilibrium temperature and very fast solidification process.
Acknowledgements This work was supported by Polish NCN project No. N N508 621140.
References [1] Stefanescu D M, Catalina A, Guo X, Chuzhoy L, Pershing M A and Biltgen G L 1998
Prediction of room temperature mcrostructure and mechanical properties in iron castings Modeling of Casting, Welding and Advanced Solidification Processes VIII (San Diego, CA, June 7-12, 1998) ed B G Thomas and C Beckermann (TMS, Warrendale) pp 455–462
[2] S.M. Yoo, A. Ludwig and P.R. Sahm 1997 Numerical simulation of solidification of nodular cast iron in permanent molds Proc. of the 4th decennial Intern. Conf. on Solidification
MCWASP XIII IOP PublishingIOP Conf. Series: Materials Science and Engineering 33 (2012) 012083 doi:10.1088/1757-899X/33/1/012083
8
Processing (Sheffield, UK, 07-10. July, 1997) ed J Beech and H Jones (Ranmoor House, Univ. of Sheffield) pp. 494–497
[3] Chang S, Shangguan D and Stefanescu D 1992 Metal. Trans. A. 23A 1333 [4] Skaland T, Grong O and Grong T 1993 Metal. Trans. A. 24A 2347 [5] Onsoien M, Grong O, Gundersen O and Skaland T 1999 Metl. Mat. Trans. A. 30A 1053 [6] Fraś E and Górny M 2011 Foundry Trade J. Int. 185 85 [7] Labrecque C and Gagne M 2003 Int. J. of Cast Metals Res. 16 313 [8] Stefanescu D M, Ruxanda R E and Dix L P 2003 Int. J. of Cast Metals Res. 16 319 [9] Fredriksson H, Stjerndahl J and Tinoco J 2005 Mat. Sci. Eng. A. 413 363 [10] Rafii-Tabar H and Chirazi A 2002 Physics Reports-Review Section of Physics Letters 365 145 [11] Lee P D, Chirazi A, Atwood R C and Wang W 2004 Mat. Sci. Eng. A. 365 57 [12] Umantsev A R, Vinogradov V V and Borisov V T 1985 Kristallografia 30 455 (in Russian) [13] Rappaz M and Gandin Ch A 1993 Acta Met. et Mater. 41 345 [14] Pan S and Zhu M 2010 Acta Mater. 58 340 [15] Guillemot G, Gandin Ch A and Bellet M 2007 J. of Crystal Growth 303 58 [16] Beltran-Sanchez L and Stefanescu D M 2004 Metall. Mat. Trans. A. 35 2471 [17] Pavlyk V and Dilthey U 2004 Modelling and Simulation in Materials Science and Engineering
12 33 [18] Zhu M F and Hong C P 2002 ISIJ Int. 42 520 [19] Jarvis D J, Brown S G R and Spittle J A 2000 Mat. Sci. Techn. 16 1420 [20] Burbelko A A, Fraś E, Kapturkiewicz W and Gurgul D 2010 Mat. Sci. Forum 649 217 [21] Burbelko A A, Fraś E, Kapturkiewicz W and Olejnik E 2006 Mat. Sci. Forum 508 405 [22] Zhao H L, Zhu M F and Stefanescu D M 2011 Key Eng. Materials 457 324 [23] Kapturkiewicz W, Burbelko A A, Fraś E, Górny M and Gurgul D 2010 J. of Achievments in
Materials and Manufacturing Engineering 43 310 [24] Górny M. 2010 ISIJ International 50 847 [25] Gandin Ch A and Rappaz M 1994 Acta Metall. Mater. 42 2233 [26] Burbelko A, Fraś E, Gurgul D, Kapturkiewicz W and Sikora J 2011 Key Eng. Materials
457 330 [27] Fraś E, Wiencek K, Burbelko A A and Górny M 2006 Mat. Sci Forum 508 425 [28] Hoyt J and Asta M 2002 Phys. Rev. B 65 1 [29] Burbelko A A, Kapturkiewicz W and Gurgul D 2007 Analysis of causes and means to reduce
artificial anisotropy in modelling of the solidification process on cellular automaton Proc. of the 4th decennial Intern. Conf. on Solidification Processing (Sheffield, UK, 07-10. July, 1997) ed J Beech and H Jones (Ranmoor House, Univ. of Sheffield) pp 31–35
[30] Dilthley U and Pavlik V 1998 Numerical simulation of dendrite morphology and grain growth with modified cellular automata Modeling of Casting, Welding and Advanced Solidification Processes VIII (San Diego, CA, June 7-12, 1998) ed B G Thomas and C Beckermann (TMS, Warrendale) pp 589–596
[31] Burbelko A and Gurgul D 2011 Computer Methods in Materials Science 11 128 [32] Gurgul D and Burbelko A A 2010 Archives of Metallurgy and Materials 55 53 [33] Tablicy fiziczeskih velichin 1976 ed. Kikoin I.K (Moskwa Avtomizdat) (in Russian) [34] Magnin P, Mason J T and Trivedi R 1991 Acta Met. et Mater. 39 469 [35] Burbelko A 2004 Mezomodelowanie krystalizacji metodą automatu komórkowego (Kraków,
UWND AGH) (in Polish) [36] Chopard B and Droz M 2005 Cellular Automata Modeling of Physical Systems (Cambridge
University Press)
MCWASP XIII IOP PublishingIOP Conf. Series: Materials Science and Engineering 33 (2012) 012083 doi:10.1088/1757-899X/33/1/012083
9


