Embed Size (px)
Citation preview

E U R O P E A N J O U R N A L O F C A N C E R 4 4 ( 2 0 0 8 ) 7 5 0 – 7 5 9
. sc iencedi rec t .com
ava i lab le at wwwjournal homepage: www.ejconl ine.com
Cellular response to oxidative stress and ascorbic acid inmelanoma cells overexpressing c-glutamyltransferase
Chiara Giommarellia, Alessandro Cortib, Rosanna Supinoa, Enrica Favinia, Aldo Paolicchib,Alfonso Pompellab, Franco Zuninoa,*aPreclinical Chemotherapy and Pharmacology Unit, Fondazione IRCCS Istituto Nazionale Tumori, Via Venezian 1, 20133 Milan, ItalybDepartment of Experimental Pathology, University of Pisa, Pisa, Italy
A R T I C L E I N F O
Article history:
Received 25 September 2007
Received in revised form
24 January 2008
Accepted 8 February 2008
Available online 7 March 2008
Keywords:
Melanoma
c-glutamyltransferase
Oxidative stress
Ascorbic acid
Catalase
0959-8049/$ - see front matter � 2008 Elsevidoi:10.1016/j.ejca.2008.02.010
* Corresponding author: Tel.: +39 02 23902267E-mail address: franco.zunino@istitutotu
A B S T R A C T
The extracellular c-glutamyltransferase-mediated metabolism of glutathione has been
implicated in prooxidant events which may have impact on cellular functions including
drug resistance. This study was performed in two GGT-transfected melanoma clones to
explore the hypothesis that GGT expression in tumour cells is implicated in modulation
of cell behaviour under stress conditions. Our results show that GGT-overexpression in
melanoma cells was associated with resistance to oxidative stress produced by prooxidant
agents such as hydrogen peroxide and ascorbic acid. In GGT-overexpressing cells, ability to
tolerate oxidative stress was evidenced by the presence of a moderate level of ROS and lack
of DNA damage response following treatment with H2O2. Cellular response to oxidative
stress induced by ascorbic acid was detectable only in the clone with low GGT activity
which also exhibited an increased susceptibility to apoptosis. The increased resistance of
the GGT-overexpressing clone was not related to intracellular GSH content but rather to
the increased expression of catalase and to a reduced efficiency of iron-mediated formation
of toxic free radicals. Taken together, these findings are consistent with a contribution of
GGT in the mechanisms of drug resistance, because induction of oxidative stress is a rele-
vant event in the apoptotic response to cytotoxic agents.
� 2008 Elsevier Ltd. All rights reserved.
1. Introduction
c-Glutamyltransferase (GGT), an ecto-enzyme over-expressed
in a number of tumour cell types, is involved in cellular
homeostasis of the major antioxidant tripeptide, glutathione
(GSH). GGT catalyses the first step in the hydrolysis of extra-
cellular GSH, ultimately allowing the recovery of cysteine,
and for this reason it has been traditionally regarded as a
major factor in the reconstitution of cellular antioxidant
defences. Indeed, several studies have been devoted to the
relationship between GGT expression and maintainance of
cellular levels of GSH, which plays an important role in cancer
er Ltd. All rights reserved
; fax: +39 02 23902692.mori.mi.it (F. Zunino).
resistance to cytotoxic therapy.1 However, recent evidence
supports a complex role of GGT in modulation of redox equi-
libria, with pathophysiological effects on both intracellular
functions and extracellular microenvironment.2 We have pro-
posed that some of these effects may be implicated in tumour
progression and drug resistance.3 The persistent, low-level
oxidative stress associated with GGT expression4 might in
fact stimulate the induction in cancer cells of protective sys-
tems involved in detoxification and/or resistance to cytotoxic
agents.
To further explore the hypothesis that GGT (over)expres-
sion may provide cancer cells with survival advantages
.

E U R O P E A N J O U R N A L O F C A N C E R 4 4 ( 2 0 0 8 ) 7 5 0 – 7 5 9 751
under stress conditions, in the present study we have
investigated the cellular response of two human melanoma
cell clones, characterised by a marked difference in GGT
expression, to two agents affecting cellular redox status,
hydrogen peroxide (H2O2) and ascorbic acid (AA). The results
provide evidence that GGT overexpression in melanoma
cells is associated with increased resistance to oxidative
stress and AA-induced apoptosis. This effect is unrelated
to cellular content of GSH, but rather appears to depend
on the induction of protective (antioxidant, antiapoptotic)
mechanisms.
2. Materials and methods
2.1. Chemicals
Unless otherwise indicated, all reagents were from Sigma
Chemical Co. (St. Louis, MO, USA).
2.2. Cell lines and culture conditions
Two human melanoma cell clones expressing different GGT
activity and obtained as previously described5 were used.
Briefly, the c21/GGT clone and the c21/basal clone expressing
high (90.78 ± 3.40 mU/mg of cellular protein) and low
(0.34 ± 0.13 mU/mg of cellular protein) GGT activity respec-
tively, were obtained by stable transfection of low-expressing
GGT activity Me665/2/21 clone (c21) with the full-length cDNA
of human GGT. Cells were routinely grown in RPMI 1640 med-
ium, supplemented with 10% (v/v) heat-inactivated foetal calf
serum, 2 mM L-glutamine (L-Gln) and 0.5 mg/ml G418 (Gibco),
at 37 �C in a 5%/95% CO2/air atmosphere.
2.3. Determination of GGT activity
Confluent cell monolayers were harvested with hypotonic ly-
sis buffer (10 mM Tris–HCl, pH 7.8) and disrupted by a tight-
fitting glass–glass Dounce homogeniser (30 strokes, 4 �C).
Determination of GGT activity was performed according to
Huseby and Strømme6 using c-glutamyl-p-nitroanilide as sub-
strate and glycyl-glycine as transpeptidation acceptor. The
amounts of p-nitroaniline formed were measured by reading
the absorbance at 405 nm and using a molar extinction coef-
ficient of 9200 mol/LÆ cm. One unit of GGT activity was defined
as 1 lmol of substrate transformed/ml/min. The results were
expressed as mU/mg protein.
2.4. Drugs and treatment conditions
Experiments with hydrogen peroxide (H2O2, 3% solution in
water; OLCELLI Farmaceutici, Italy) and ascorbic acid (AA,
1000 mg/5 ml; S.A.L.F., Italy) were performed by incubating
cells for 2 h at 37 �C in RPMI 1640 medium supplemented with
10% (v/v) heat-inactivated foetal calf serum. In a separate set
of experiments, incubations with AA were performed in the
presence of glutathione (GSH, 0.5 mmol/L) and glycyl-glycine
(glygly, 20 mmol/L), in order to achieve full activation of
GGT.6 Other experiments were performed in the presence of
the iron chelators deferoxamine mesylate (DFO; 500 lM) and
2,2 0-bipyridyl (BIP; 500 lM) and the antioxidant catalase
(200 U/ml). Other experimental details are given in the leg-
ends to individual figures.
2.5. Cell viability assay
Cell sensitivity to hydrogen peroxide and ascorbic acid was
determined by growth inhibition assay. Briefly, cells were
seeded in 12-well plates (50,000 cells/well), 24 h before exper-
iments. Cells were exposed to the drugs for 2 h and then
washed, medium was changed, and cultures were grown up
to 72 h.
After 72 h, adherent cells were trypsinised and counted
by a cell counter (Coulter Electronics, Luton, UK). IC50 val-
ues, derived from dose-response curves, were defined as
drug concentrations required for 50% inhibition of cell
growth.
2.6. Reactive oxygen species (ROS) determination
Intracellular production of ROS was determined using the
H2O2 sensitive compound 2 0,7 0-dichlorofluorescin diacetate
(DCFH-DA, Molecular Probes, Invitrogen, USA) as previously
described.7
This method measures the formation of intracellular ROS.
After diffusion into viable cells, DCFH-DA is converted by
intracellular esterase to 2 0,7 0-dichlorofluorescin (DCFH) which
is able to react quantitatively with reactive oxygen species
within the cell thus producing the fluorescent dye 2 0,7 0-
dichlorofluorescin (DCF). The latter remains trapped within
the cells and can be measured as an index of intracellular
ROS production.
Twenty-four hours after a 2 h treatment with H2O2 or ascor-
bic acid, cells were incubated with DCFH-DA (10 lmol/L; dis-
solved in DMSO), at 37 �C for 20 min. Culture medium was
then removed, adherent and floating cells were washed twice
with phosphate-buffered saline (PBS) and then collected. DCF
fluorescence was detected by a flow cytometer (Becton Dickin-
son); for each sample 10,000 events were collected.
2.7. Cell cycle analysis
For cell cycle analysis, 24 h after drug treatments cells were
washed, fixed in ice-cold 70% ethanol, and stored at )20 �C.
Subsequently, samples were rehydratated with PBS and cellu-
lar DNA was stained with 10 lg/ml propidium iodide in PBS,
containing RNase A (66 U/ml). Cell cycle distribution was
determined by flow cytometry, and data were analysed by Cell
Quest� software; for each sample 40,000 events were
collected.
2.8. Western blot analysis
Cells were rinsed twice with ice-cold PBS supplemented
with 0.1 mM sodium orthovanadate, and then lysed in hot
sample buffer.8 After determination of protein concentra-
tion, whole-cell extracts were separated by SDS polyacryl-
amide gel electrophoresis (PAGE) and transferred onto
nitrocellulose membranes. Immunoreactive bands were
revealed by enhanced chemiluminescence detection (Amer-
sham Biosciences, Rockford, IL) using anti-Bcl-2 (Dako,

Table 1 – Melanoma clones characterisation
c21/GGT c21/basal
GGT activity (mU/mg protein) 90.78 ± 3.4 0.344 ± 0.13
GSH content
(nmol GSH eq./mg protein)
51.25 ± 10.75 67.56 ± 8.6
GSSG content 1.05 ± 0.12 0.33 ± 0.32
GSSG/GSH ratio (%) 2.05 0.49
Doubling time (h) 24 ± 0.8 24 ± 1.2
752 E U R O P E A N J O U R N A L O F C A N C E R 4 4 ( 2 0 0 8 ) 7 5 0 – 7 5 9
Denmark), anti-Bax and anti-caspase 3 (BD Pharmingen,
USA), anti-c-H2AX (Upstate Biotechnology, USA), anti-RPA-2
(NeoMarker, USA), anti-cytochrome C (BD Pharmingen),
anti-phospho-p53(Ser15) (Cell Signaling Technology, USA)
and anti-actin (Sigma) antibodies.
2.9. Determination of apoptosis
Apoptosis was determined by TUNEL assay 72 h after 2 h
exposure to treatments. Treated cells were fixed in 4% para-
formaldehyde (RT, 60 min), washed and resuspended in
ice-cold PBS. The in situ cell death detection kit (Roche, Ger-
many) was used according to the manufacturer’s instructions,
and samples were analysed by flow cytometry.
2.10. Determination of cytochrome c release frommitochondria
Melanoma cells were exposed to equitoxic H2O2 (100 lM and
4.6 mM for c21/basal and c21/GGT, respectively) or ascorbic
acid concentrations (0.03 mM and 0.06 mM for c21/basal and
c21/GGT, respectively) for 2 h. Floating and adherent cells
were harvested and cytosolic extracts were prepared as de-
scribed.9 Briefly, cells were disrupted by a Dounce homoge-
niser (30 strokes) in ice-cold lysis buffer (20 mM HEPES-KOH,
pH 7.5, 10 mM KCl, 1.5 mM MgCl2, 1 mM EDTA, 1 mM EGTA,
250 mM sucrose, 0.5 mM phenyl-methyl-sulfonyl fluoride,
10 lg/ml leupeptin, 10 lg/ml aprotinin and 10 lg/ml trypsin
inhibitor), then samples were centrifuged at 20,000 g for
20 min. Supernatants were stored at )70 �C until gel electro-
phoresis. Cytosolic protein extracts were run on a 15%
SDS-PAGE gel and processed for Western blot analysis as de-
scribed above.
2.11. Determination of catalase activity
The Amplex Red Catalase Assay Kit, used for this determina-
tion, was purchased from Molecular Probes (USA). In this as-
say, catalase first reacts with hydrogen peroxide to produce
water and oxygen, then the Amplex Red reagent reacts with
any unreacted H2O2 in the presence of horseradish peroxidase
(HRP) to produce the highly fluorescent oxidation product,
resorufin.
Catalase activity was determined 24 h after cell treat-
ments. Briefly, cells were rinsed twice with ice-cold PBS
supplemented with 0.1 mM sodium orthovanadate and then
lysed in hot sample buffer.8 Samples were then used to eval-
uate spectrophotometrically (550 nm) catalase activity
according to manufacturer’s instructions.
2.12. Other determinations
Protein content was determinated by the method of Bradford
(Bio-Rad protein assay). Glutathione peroxidase activity was
determined as described.10 Glutathione (GSH) and glutathione
disulfide (GSSG) were determined by enzymatic/spectropho-
tometric method.5
The reported values represent the mean ± standard devia-
tion (SD) of at least three independent experiments. Statisti-
cal significance was assessed by ANOVA.
3. Results
3.1. Biochemical characterisation of cell clones
The study was performed on two human melanoma clones,
characterised by a marked difference in GGT activity (Table
1), the c21/GGT clone exhibiting a high GGT activity
(90.8 ± 3.4 mU/mg protein), in contrast to the low activity
of the c21/basal clone (approx. 180 times lower). In spite
of the substantial difference in GGT activity and expression
(not shown), the GSH content was marginally higher in the
c21/basal clone. Interestingly, the content of GSSG was
appreciably increased in the GGT-overexpressing clone
and the increased GSSG/GSH ratio supports conditions of
oxidative stress. Cell doubling time was not modified by
transfection procedures, and was approximately 24 h in
both clones.
3.2. Cell response to H2O2-induced oxidative stress
We have investigated whether the overexpression of GGT
could influence the antiproliferative activity of hydrogen
peroxide. The effects of H2O2 were investigated both in
standard cell culture conditions and in medium supple-
mented with GSH (500 lM) and glycyl-glycine (20 mM), in
order to achieve full activation of GGT.6 As shown in
Fig. 1, when cells were exposed for 2 h to hydrogen perox-
ide under standard conditions, a different response was ob-
served, with an IC50 value for c21/GGT cells (2.3 mM) about
50 times higher than that observed for c21/basal cells
(0.05 mM). Similar differences were observed when clones
were exposed to H2O2 in conditions of full GGT activation
(data not shown).
On the basis of these results, two equitoxic hydrogen per-
oxide concentrations (4.6 mM and 100 lM for c21/GGT and
c21/basal clone, respectively, causing approx. 70% inhibition
of cell growth in standard culture medium) were chosen for
subsequent experiments.
3.3. Effects of H2O2 on intracellular ROS production
Analysis of ROS production was performed 24 h after the end
of H2O2 treatment. As shown in Fig. 2, in spite of the higher
concentration of H2O2 applied, in the c21/GGT clone the extent
of intracellular ROS production was lower than in c21/basal
cells.
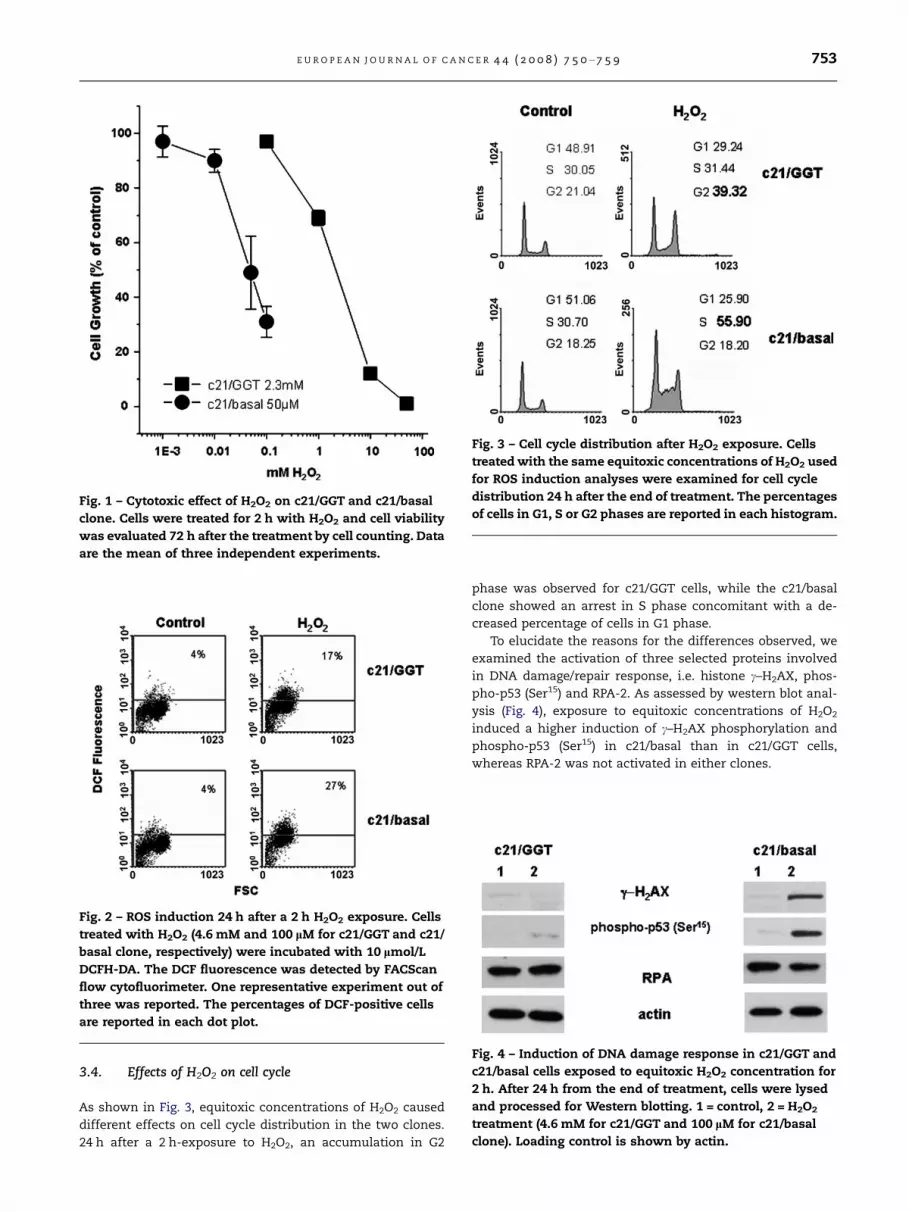
Fig. 3 – Cell cycle distribution after H2O2 exposure. Cells
treated with the same equitoxic concentrations of H2O2 used
for ROS induction analyses were examined for cell cycle
distribution 24 h after the end of treatment. The percentages
of cells in G1, S or G2 phases are reported in each histogram.
Fig. 4 – Induction of DNA damage response in c21/GGT and
c21/basal cells exposed to equitoxic H2O2 concentration for
2 h. After 24 h from the end of treatment, cells were lysed
and processed for Western blotting. 1 = control, 2 = H2O2
treatment (4.6 mM for c21/GGT and 100 lM for c21/basal
clone). Loading control is shown by actin.
Fig. 1 – Cytotoxic effect of H2O2 on c21/GGT and c21/basal
clone. Cells were treated for 2 h with H2O2 and cell viability
was evaluated 72 h after the treatment by cell counting. Data
are the mean of three independent experiments.
Fig. 2 – ROS induction 24 h after a 2 h H2O2 exposure. Cells
treated with H2O2 (4.6 mM and 100 lM for c21/GGT and c21/
basal clone, respectively) were incubated with 10 lmol/L
DCFH-DA. The DCF fluorescence was detected by FACScan
flow cytofluorimeter. One representative experiment out of
three was reported. The percentages of DCF-positive cells
are reported in each dot plot.
E U R O P E A N J O U R N A L O F C A N C E R 4 4 ( 2 0 0 8 ) 7 5 0 – 7 5 9 753
3.4. Effects of H2O2 on cell cycle
As shown in Fig. 3, equitoxic concentrations of H2O2 caused
different effects on cell cycle distribution in the two clones.
24 h after a 2 h-exposure to H2O2, an accumulation in G2
phase was observed for c21/GGT cells, while the c21/basal
clone showed an arrest in S phase concomitant with a de-
creased percentage of cells in G1 phase.
To elucidate the reasons for the differences observed, we
examined the activation of three selected proteins involved
in DNA damage/repair response, i.e. histone c–H2AX, phos-
pho-p53 (Ser15) and RPA-2. As assessed by western blot anal-
ysis (Fig. 4), exposure to equitoxic concentrations of H2O2
induced a higher induction of c–H2AX phosphorylation and
phospho-p53 (Ser15) in c21/basal than in c21/GGT cells,
whereas RPA-2 was not activated in either clones.

Fig. 5 – Antiproliferative effect of ascorbic acid. Dose-
dependent effects 72 h after a 2 h ascorbic acid treatment of
c21/GGT and c21/basal cells, in GGT activating condition.
Data are the mean of three independent experiments.
754 E U R O P E A N J O U R N A L O F C A N C E R 4 4 ( 2 0 0 8 ) 7 5 0 – 7 5 9
3.5. Effects of ascorbic acid on cell proliferation
Exposure to AA for 2 h was able to exert an antiproliferative
effect, which was two times higher in c21/basal than in c21/
GGT cells (Fig. 5). Again, the differences observed between
the two clones were similar in standard culture conditions
and in the medium enriched with GSH and glycyl-glycine to
activate GGT, even if in the latter condition AA citotoxicity
was higher (Table 2). On the basis of these results, two equi-
toxic concentrations of AA (0.06 mM and 0.03 mM for c21/
GGT and c21/basal, respectively, causing approximately 30%
inhibition of cell growth in GGT activating condition) were
chosen for subsequent experiments.
3.6. Iron-mediated antiproliferative effects of H2O2
and ascorbic acid
The involvement of redox-active iron in oxidative stress pro-
cesses is a well established mechanism.11 To explore the pos-
Table 2 – Comparison of sensitivity of c21/GGT and c21/basal cells to ascorbic acid in standard culture mediumand in GGT activating condition
IC50 (mM)
c21/GGT c21/basal
Standard culture medium 0.4 ± 0.06 0.2 ± 0.07
GGT activating condition 0.1 ± 0.05 0.049 ± 0.001
sible role of iron in H2O2 and AA cytotoxicity, we evaluated the
cellular response to these oxidative agents after lowering
extra- and/or intracellular free (ionic) iron concentrations. In
order to remove extracellular iron, incubation mixtures were
pre-treated with the iron chelator DFO, 1 h at 37 �C, before cell
treatments. As shown in Fig. 6A-B, pre-treatment with DFO
resulted in a reduced antiproliferative activity of H2O2 and
AA in both clones. Interestingly, when the same incubation
mixtures were pre-treated with bipyridyl, an iron chelator
capable of entering the cell and chelating both extra- and intra-
cellular free iron,12 the antiproliferative effect of H2O2 and AA
was almost completely prevented (Fig. 7A-B). The crucial role
played by redox-active iron was further confirmed in experi-
ments carried out at equimolar concentrations of AA. Indeed,
in the presence of bipyridyl the sensitivity of c21/basal cells
to AA was markedly reduced, down to a value similar to that
observed in c21/GGT cells (from 65% to 40% dead cells, Fig. 8A).
3.7. Suppression of AA antiproliferative effects byexogenous catalase
Further experiments were performed to assess the involve-
ment of hydrogen peroxide in AA antiproliferative effect. As
shown in Fig. 8B, after pre-treatment with catalase (200 U/ml,
1 h, 37 �C) sensitivity to AA was significantly reduced in both
clones, and the difference between clones was abolished.
Fig. 6 – Cellular sensitivity of c21/GGT (A) and c21/basal (B)
cells to H2O2 and ascorbic acid in the presence or absence of
DFO. Cells were treated for 2 h with a medium pre-incubated
with ascorbic acid or H2O2 in the presence/absence of DFO
(500 lM; 1 h, 37 �C). 1 = control; 2 = H2O2 (4.6 mM and 100 lM
for c21/GGT and c21/basal, respectively); 3 = AA (0.06 mM
and 0.03 mM for c21/GGT and c21/basal, respectively).

Fig. 8 – Cellular sensitivity of c21/GGT and c21/basal clone to
ascorbic acid 0.06 mM in the presence or absence of
bipyridyl (BIP) (A) or in the presence or absence of catalase
200 U/ml (B). (A) Cells were treated for 2 h with a medium
pre-incubated with ascorbic acid (equimolar concentration,
0.06 mM) in the presence/absence of bipyridyl (500 lM; 1 h,
37 �C). 1 = control; 2 = AA 0.06 mM; 3 = AA (0.06 mM in the
presence of bipyridyl 500 lM). (B) Cells were treated with a
medium containing ascorbic acid (equimolar concentration,
0.06 mM) or ascorbic acid and catalase 200 U/ml. 1 = control;
2 = AA 0.06 mM and 3 = AA (0.06 mM in the presence of
catalase 200 U/ml).
Fig. 7 – Cellular sensitivity of c21/GGT (A) and c21/basal (B)
cells to H2O2 and ascorbic acid in the presence or absence of
bipyridyl (BIP). Cells were treated for 2 h with a medium pre-
incubated with ascorbic acid or H2O2 in the presence/
absence of bipyridyl (500 lM; 1 h, 37 �C). 1 = control; 2 = H2O2
(4.6 mM and 100 lM for c21/GGT and c21/basal, respectively);
3 = AA (0.06 mM and 0.03 mM for c21/GGT and c21/basal,
respectively).
E U R O P E A N J O U R N A L O F C A N C E R 4 4 ( 2 0 0 8 ) 7 5 0 – 7 5 9 755
3.8. AA treatment causes induction of apoptosis and ROSproduction
Fig. 9 shows the results obtained with TUNEL assay 72 h after
treating clones for 2 h with equitoxic concentration of AA.
Ascorbic acid was able to cause a marked apoptotic cell death
in c21/basal clone (27% TUNEL positive cells) while no apprecia-
ble effect was detectable in c21/GGT cells (3% TUNEL positive
cells). Deeper analysis of the apoptotic behaviour of the two
clones showed that cytochrome c release was induced by AA
treatment in both clones (Fig. 10A), whereas cleavage of CPP32
was detectable only in c21/basal clone (Fig. 10B). No differences
were observed either for Bax or Bcl-2 protein levels (Fig. 10B).
Fig. 11 shows intracellular ROS induction in the two clones
under the same experimental conditions used in TUNEL as-
say. DCF fluorescence induced by AA in c21/basal was at least
six times higher than in c21/GGT cells.
3.9. AA treatment activates DNA damage response andcell cycle arrest
DNA damage and cell cycle progression were investigated
24 h after AA treatment. The results showed an activation of
DNA-damage responsive histone c-H2AX and phospho-p53
(Ser15), which was more marked in c21/basal cells (Fig. 12).
Cell cycle analysis indicated an accumulation of both clones
in S phase (Table 3), suggesting the activation of a DNA dam-
age checkpoint.
3.10. Constitutive catalase activity in c21/GGT cells
In order to elucidate the cellular basis for lower presence of
ROS after H2O2 and AA treatment in c21/GGT cells, two major
cellular enzymes involved in hydrogen peroxide catabolism,
catalase and glutathione peroxidase, were investigated. Basal
catalase activity was actually two times higher in c21/GGT
than in c21/basal cells (Fig. 13). This difference reflected the
expression of the enzyme as documented by Western blot
analysis. Treatment with H2O2 induced a further increase of
catalase activity, more evident in c21/basal cells. A marked
induction of catalase activity (56%) was caused by AA treat-
ment only in c21/basal cells. In all conditions studied, cata-
lase activity was anyway higher in c21/GGT cells. In both

Fig. 10 – Effect of ascorbic acid treatment on the apoptotic
pathway. (A) Effect of ascorbic acid on cytochrome c release.
The two cell lines were exposed to equitoxic concentration
of ascorbic acid and the cytosolic extracts were prepared
24 h after the drug exposure. (B) Bax, Bcl-2 and CPP32
cleavage levels. Total cellular extracts were obtained 24 h
after cell treatment. Tubulin is shown as a control for protein
loading. Lane 1: control; lane 2: ascorbic acid.
Fig. 9 – Apoptosis induced by ascorbic acid. Cells were
exposed for 2 h to 0.06 mM and 0.03 mM ascorbic acid
corresponding to equitoxic value in c21/GGT and c21/basal
cells, respectively. Apoptosis was detected by TUNEL assay
72 h after the end of the treatment and determined by FACS
analysis. Numbers in the dot-plots indicate the percentage
of tunel positive cells.
Fig. 11 – ROS induction by ascorbic acid. Cells were exposed
for 2 h to 0.06 mM and 0.03 mM ascorbic acid for c21/GGT
and c21/basal cells, respectively. After 24 h, ROS levels were
detected by DCFH-DA assay and determined by FACS
analysis.
Fig. 12 – Induction of DNA damage response in c21/GGT and
c21/basal cells exposed to equitoxic ascorbic acid concen-
tration for 2 h. Protein expression of phospho-p53 (Ser15),
RPA, c-H2AX, and actin (loading control) after ascorbic acid
treatment. 1 = Control, 2 = ascorbic acid treatment (0.06 mM
and 0.03 mM for c21/GGT and c21/basal respectively).
756 E U R O P E A N J O U R N A L O F C A N C E R 4 4 ( 2 0 0 8 ) 7 5 0 – 7 5 9
clones, no substantial modifications were found in catalase
expression after treatments.
With regard to glutathione peroxidase basal activity, no
differences were found between the two clones (8.5 ± 1.1
and 8.4 ± 0.8 mU/mg of protein for c21/GGT and c21/basal
cells, respectively).
4. Discussion
In the melanoma cell system used in the present study, we
found that overexpression of GGT was associated with a re-
duced sensitivity to oxidative stress caused by H2O2, as well
as to cytotoxic effects of ascorbic acid. The GGT-overexpress-
ing c21/GGT cells were markedly more resistant to H2O2 and
AA treatments, approx. 50- and 2-fold more than the c21/ba-
sal clone (Figs. 1 and 5). The ability of ascorbic acid to induce
indirectly oxidant effects is a well established phenomenon,
described in different cell types13–15 and different culture con-
ditions,16,17 and likely related to AA interactions with trace
levels of transition metal ions present in many incubation
media. Thus, an increased resistance of c21/GGT clone to oxi-
dative injury could explain both observations. Only moderate

Table 3 – Cell cycle distribution of c21/GGT and c21/basal cells after treatment with equitoxic concentration of ascorbic acid(one experiment representative of three is shown)
c21/GGT c21/basal
G1 S G2 G1 S G2
Control 52.3 28.04 19.66 47.69 29.22 23.1
Ascorbic acid 29.17 48.46 22.37 32.97 53.82 13.21
Fig. 13 – Catalase activity and expression. Cells were
exposed for 2 h to H2O2 or to ascorbic acid, and catalase
activity and expression were determined 24 h after treat-
ment (see Materials and Methods for details). Actin is
shown as loading control. One representative analysis out
of three is shown. 1, control; 2, H2O2 (4.6 mM and 100 lM for
c21/GGT and c21/basal cells, respectively); 3, Ascorbic Acid
(0.06 mM and 0.03 mM for c21/GGT and c21/basal cells,
respectively).
E U R O P E A N J O U R N A L O F C A N C E R 4 4 ( 2 0 0 8 ) 7 5 0 – 7 5 9 757
levels of ROS were indeed produced in c21/GGT cells following
exposure to relatively high concentrations of H2O2 (Fig. 2),
while paradoxically higher levels of ROS were produced in
c21/basal clone (Fig. 9) exposed to substantially lower (equi-
toxic) H2O2 concentrations. Consistent with this finding,
H2O2 treatment produced no DNA damage response in c21/
GGT clone, i.e. neither histone c–H2AX phosphorylation nor
S phase checkpoint activation, wherease a typical DNA dam-
age response was found in c21/basal clone, with S phase cell
accumulation and phosphorylation of both histone c–H2AX
and p53 (Fig. 4).
The increased catalase expression and activity observed in
untreated c21/GGT cells (two times higher as compared to
c21/basal, Fig. 13) could account for the increased ability of
this clone to tolerate oxidative stress, and likely reflects an
adaptation phenomenon. In fact, GGT-mediated metabolism
of extracellular GSH is known to produce prooxidant effects,
including production of H2O2.18 The occurrence of low but
persistent oxidative stress in c21/GGT cells is consistent with
a higher GSSG/GSH ratio (Table 1). It is likely that the ongoing
GGT-mediated production of prooxidant can induce activa-
tion of protective pathways, including catalase expression.
Anyway, a short-time exposure to cytotoxic concentrations
of hydrogen peroxide or AA resulted in a significant induction
of catalase activity, but not of its expression level. Thus it is
conceivable that an acute oxidative stress causes an activa-
tion of the catalase already present in the cell, whereas a
low persistent oxidative stress, present in the GGT-over-
expressing cells as a consequence of GGT-mediated extracel-
lular metabolism of GSH, results in modulation of protein
expression (Fig. 13).
Ascorbic acid was used in this study as a prooxidant agent
to explore possible pharmacological implications of the fea-
tures acquired by the GGT-overexpressing phenotype, because
AA may have a therapeutic potential in melanoma.19,20 In
spite of a comparable perturbation induced by AA on cell cycle
with partial accumulation of cells in S-phase, the final out-
come was substantially different in the two clones. In the
more sensitive c21/basal clone, typical manifestations of oxi-
dative stress were observed, including production of ROS
(Fig. 11), DNA damage response (c–H2AX and p53 phosphoryla-
tion, Fig. 12) and activation of cell death pathways (cyto-
chrome c release and caspase activation, Fig. 10). In contrast,
following AA treatment the less responsive c21/GGT clone
exhibited only marginal signs of genotoxic stress, with no evi-
dence of apoptotic cell death. Such findings might be ex-
plained by the occurrence in c21/GGT clone of marginal,
easily repairable DNA damage, and/or by a lack of recognition
of DNA lesions. AA is known to induce prooxidant effects, and
it was shown that the formation of H2O2 is a critical step in its
cytotoxicity.13–15 In agreement with this interpretation, the
addition of exogenous catalase provided a substantial protec-
tion in our experiments (Fig. 8B). Therefore, the increased
resistance of c21/GGT cells to AA more likely reflects their in-
creased ability to detoxify H2O2 following upregulation of cel-
lular catalase activity.
It is well established that prooxidant rather than antioxi-
dant effects of AA depend on its interactions with transition
metal ions, in particular iron.21 Iron can also interact with
H2O2 in the so-called Fenton reaction, leading to production
of highly reactive and toxic hydroxyl radicals.22 Indeed, data
reported indicate that free, redox-active iron is implicated in
the phenomena observed. When the iron-chelating agent
DFO was added to incubation mixtures, attenuation of cyto-
toxicity of both H2O2 and AA was in fact observed (Fig. 6),
and even stronger protection was achieved using 2,20-bipyri-
dyl, an agent able to permeate cells and hence to chelate both
extracellular and intracellular free iron (Figs. 7 and 8A). Rele-
vant to this point is the observation that, following exposure
to an equimolar concentration (60 lM), the differential toxic-
ity of AA between the two clones can be abolished by treating
the c21/basal clone with 2,2 0-bipyridyl. The lower sensitivity
of the GGT-expressing clone could thus support a lower

Fig. 14 – Scheme for the proposed mechanism of action of AA and H2O2 on the two melanoma clones and possible defence
mechanisms. AA, ascorbic acid; BIP, bipyridyl; CAT, catalase; DFO, deferoxamine; DHA, dehydroascorbic acid.
758 E U R O P E A N J O U R N A L O F C A N C E R 4 4 ( 2 0 0 8 ) 7 5 0 – 7 5 9
content of intracellular free iron, required for the efficiency of
redox-cycling processes, necessary to overdraw the inner
oxidative burst. Indeed, free iron is known to participate in
reaction resulting in free radical formation and oxidative
stress leading to DNA damage and cell death. On the other
hand, we have previously shown that iron-mediated oxida-
tion of extracellular AA can favour its uptake by melanoma
cells, and that this process is suppressed by iron chelation.23
Protection offered by DFO and bipyridyl against AA effects
may also depend on this phenomenon.
In conclusion, our study provides evidence that overex-
pression of GGT in melanoma cells is associated with in-
creased resistance to oxidative stress depending on the
induction of protective mechanisms against reactive oxygen
species. Such a resistance to oxidative stress can explain
the decreased susceptibility of GGT-expressing cells to effects
of ascorbic acid. The marked resistance of GGT-overexpress-
ing cells to oxidative stress can thus have important pharma-
cological implications because production of oxidative stress
is a relevant event in the apoptotic response to several cyto-
toxic agents. Fig. 14 depicts our proposed mechanism of cellu-
lar stress induced by H2O2 or AA, and the possible defence
mechanisms involved. Altogether, the results of the present
study further support the implication of GGT as a factor in
drug resistance of tumour cells.
Conflict of interest statement
None declared.
Acknowledgements
This work was partially supported by the Associazione
Italiana per la Ricerca sul Cancro, Milan, by the Ministero
della Salute, Rome and by the Fondazione Italo Monzino,
Milan, Italy. The financial support of the Fondazione Fibrosi
Cistica (FFC), Verona, Italy, is also kindly acknowledged.
R E F E R E N C E S
1. Pompella A, De Tata V, Paolicchi A, Zunino F. Expression ofgamma-glutamyltransferase in cancer cells and itssignificance in drug resistance. Biochem Pharmacol2006;71:231–8.
2. Paolicchi A, Dominici S, Pieri L, Maellaro E, Pompella A.Glutathione catabolism as a signaling mechanism. BiochemPharmacol 2002;64:1027–35.
3. Pompella A, Corti A, Paolicchi A, Giommarelli C, Zunino F.gamma-Glutamyltransferase, redox regulation and cancerdrug resistance. Curr Opin Pharmacol 2007;7:360–6.
4. Dominici S, Paolicchi A, Corti A, Maellaro E, Pompella A.Prooxidant reactions promoted by soluble and cell-boundgamma-glutamyltransferase activity. Methods Enzymol2005;401:484–501.
5. Franzini M, Corti A, Lorenzini E, et al. Modulation of cellgrowth and cisplatin sensitivity by membrane gamma-glutamyltransferase in melanoma cells. Eur J Cancer2006;42:2623–30.
6. Huseby NE, Stromme JH. Practical points regarding routinedetermination of gamma-glutamyl transferase (gamma-GT)in serum with a kinetic method at 37 C. Scand J Clin Lab Invest1974;34:357–63.
7. Li J, Tang Q, Li Y, et al. Role of oxidative stress in the apoptosisof hepatocellular carcinoma induced by combination ofarsenic trioxide and ascorbic acid. Acta Pharmacologica Sinica2006;27:1078–84.
8. Zuco V, Zanchi C, Cassinelli G, et al. Induction of apoptosisand stress response in ovarian carcinoma cell lines treatedwith ST1926, an atypical retinoid. Cell Death Differ2004;11:280–9.
9. Milner AE, Palmer DH, Hodgkin EA, et al. Induction of apoptosisby chemotherapeutic drugs: the role of FADD in activation of

E U R O P E A N J O U R N A L O F C A N C E R 4 4 ( 2 0 0 8 ) 7 5 0 – 7 5 9 759
caspase-8 and synergy with death receptor ligands in ovariancarcinoma cells. Cell Death Differ 2002;9:287–300.
10. Paolicchi A, Lorenzini E, Perego P, et al. Extra-cellular thiolmetabolism in clones of human metastatic melanoma withdifferent gamma-glutamyl transpeptidase expression:implications for cell response to platinum-based drugs. Int JCancer 2002;97:740–5.
11. Aust SD, Morehouse LA, Thomas CE. Role of metals in oxygenradical reactions. J Free Radic Biol Med 1985;1:3–25.
12. Konijn AM, Glickstein H, Vaisman B, Meyron-Holtz EG, SlotkiZI, Cabantchik ZI. The cellular labile iron pool andintracellular ferritin in K562 cells. Blood 1999;94:2128–34.
13. Peterkofsky B, Prather W. Cytotoxicity of ascorbate and otherreducing agents towards cultured fibroblasts as a result ofhydrogen peroxide formation. J Cell Physiol 1977;90:61–70.
14. Duarte TL, Almeida GM, Jones GD. Investigation of the role ofextracellular H2O2 and transition metal ions in the genotoxicaction of ascorbic acid in cell culture models. Toxicol Lett2007;170:57–65.
15. Park S, Han SS, Park CH, et al. Ascorbic acid inducesapoptosis in acute myeloid leukemia cells via hydrogenperoxide-mediated mechanisms. Int J Biochem Cell Biol1994;36:2180–95.
16. Clement MV, Ramalingam J, Long LH, Halliwell B. The in vitrocytotoxicity of ascorbate depends on the culture medium
used to perform the assay and involves hydrogen peroxide.Antioxid. Redox Signal 2001;3:157–63.
17. Sakagami H, Satoh K, Sugaya K, et al. Effect of the type ofserum in the medium on sodium ascorbate-inducedcytotoxicity. Anticancer Res 1996;16:1937–41.
18. Dominici S, Valentini M, Maellaro E, et al. Redox modulationof cell surface protein thiols in U937 lymphoma cells: the roleof gamma-glutamyl transpeptidase-dependent H2O2
production and S-thiolation. Free Rad Biol Med 1999;27:623–35.19. Lin SY, Lai WW, Chou CC, et al. Sodium ascorbate inhibits
growth via the induction of cell cycle arrest and apoptosisin human malignant melanoma A375.S2 cells. Melanoma Res2006;16:509–19.
20. Roomi MW, Ivanov V, Netke S, Kalinovsky T, Niedzwiecki A,Rath M. In vivo and in vitro antitumor effect of ascorbic acid,lysine, proline and green tea extract on human melanomacell line A2058. In Vivo 2006;20:25–32.
21. Minotti G, Aust SD. Redox cycling of iron and lipidperoxidation. Lipids 1992;27:219–26.
22. Halliwell B, Gutteridge JMC. Free Radicals in Biology andMedicine. Oxford: Oxford Science Publications; 1999.
23. Corti A, Raggi C, Franzini M, Paolicchi A, Pompella A, CasiniAF. Plasma membrane gamma-glutamyltransferase activityfacilitates the uptake of vitamin C in melanoma cells. FreeRadic Biol Med 2004;37:1906–15.


