Embed Size (px)
Citation preview
Cement and Concrete Research 42 (2012) 1072–1082
Contents lists available at SciVerse ScienceDirect
Cement and Concrete Research
j ourna l homepage: ht tp : / /ees .e lsev ie r .com/CEMCON/defau l t .asp
Influence of the applied voltage on the Rapid Chloride Migration (RCM) test
P. Spiesz ⁎, H.J.H. BrouwersDepartment of the Built Environment, Eindhoven University of Technology, P.O. Box 513, 5600 MB Eindhoven, The Netherlands
⁎ Corresponding author. Tel.: +31 40 247 5904; fax:E-mail address: [email protected] (P. Spiesz).
0008-8846/$ – see front matter © 2012 Elsevier Ltd. Alldoi:10.1016/j.cemconres.2012.04.007
a b s t r a c t
a r t i c l e i n f oArticle history:Received 18 October 2011Accepted 19 April 2012
Keywords:Concrete (E)Chloride (D)Diffusion (C)Electrochemical properties (C)Migration
This study addresses the influence of the applied voltage (electrical field) on the value of the chloride migra-tion coefficient, as determined with the Rapid Chloride Migration (RCM) test, and on other properties of ce-ment based mortars. It is shown that in the investigated ranges of applied voltages, the chloride migrationcoefficients, computed from two different chloride transport models, are relatively constant. However,other properties of mortars are changing due to the application of the electrical field. It is shown that the re-sistance of the test samples increases during the migration test (therefore the DC current during the test de-creases). Moreover, the mass of the samples increases and this increase is found to be proportional to thechloride penetration depth. The pH of the catholyte solution (10% NaCl water solution) increases significantlyduring the migration test, thus the test conditions change as the OH− to Cl− proportion changes. Further-more, the measured values of the polarization of the electrodes confirm the value of 2 V, assumed in theguidelines for the RCM test. Also, a dark coloration is observed on samples split after the test, prior tospraying with the colorimetric chlorides indicator. This coloration is attributed to a liquid-saturation of thesamples only in the colored region and not in the entire volume of the sample, as is assumed after performingthe vacuum-saturation prior to the migration tests.
© 2012 Elsevier Ltd. All rights reserved.
1. Introduction
In the case of deteriorated concrete elements/structures being in fre-quent contact with a chloride bearing environment (e.g. de-icing saltsor seawater), the chloride initiated corrosion of the reinforcing steel isthemain reason of the deteriorations in themajority of cases. Therefore,a proper design of the concrete cover (the layer of concrete covering thesteel), considering its quantity (thickness) and quality (permeability tochlorides), is very important from the point of view of service life andmaintenance work. In order to quantify the chloride ingress speed inconcrete, the chloride diffusion/migration coefficient is used, becausethe diffusion controls the ingress of chlorides. There are various labora-tory test methods for determining the chloride diffusion/migration co-efficient. In the past mainly the ‘natural’ diffusion test methods wereused, in which concrete samples are exposed to a chloride solution fora long period, so the chlorides are penetrating the samples due to theconcentration gradient. However, recently the application of electricallyaccelerated test methods has significantly increased due to their shorttesting period and simplicity. The Rapid Chloride Migration (RCM)test, described in the guidelineNTBuild 492 [1], is one of the acceleratedtestmethods, which is nowadays very often used. The output of this testmethod—the chloride migration coefficient DRCM—has been incorporat-ed into the DuraCrete model [2] for the service life design of concrete
+31 40 243 8595.
rights reserved.
structures. However, as demonstrated in Spiesz et al. [3], theDRCM, com-puted according to the ‘traditional’ RCM model [1,4], has to be treatedcarefully because of oversimplifications of this theoretical model,which are reflected by the deviation of the chloride concentration pro-files measured after the RCM test from the theoretical profiles. Asshown in the improved RCM model [3], when taking into account thenon-linear chloride binding isotherm and the non-equilibrium condi-tions between the free- and bound-chlorides (due to the short durationof the RCM test, which usually amounts to only 24 h), the transport ofchlorides in concrete by migration can be predicted more accuratelythan given by the ‘traditional’ model.
Other important aspects regarding the chloride migration in con-crete are the test conditions and their influence on the results of thetest. According to the guideline for the RCM test [1], the value of thevoltage applied during the test is adjustable, and depends upon thevalue of the initial current, which is measured at the DC voltage of30 V. Based on the value of this current, which basically reflects the per-meability of concrete (its permeability is related with its conductivityand therefore with the measured current), the value of the voltage ap-plied during the RCM test and the duration of the test are adjusted, fol-lowing Table 1 [1]. This action is performed in order to obtain asufficient chloride penetration depth for concretes with low permeabil-ity, for which the initial voltage of 30 V would result in a too shallowchloride penetration depth, and to prevent the chloride breakthroughfor concretes with high permeability (i.e. the chloride penetrationdepth obtained after the test should be within certain limits regardlessof the permeability of concrete). As demonstrated in [4] and shown in
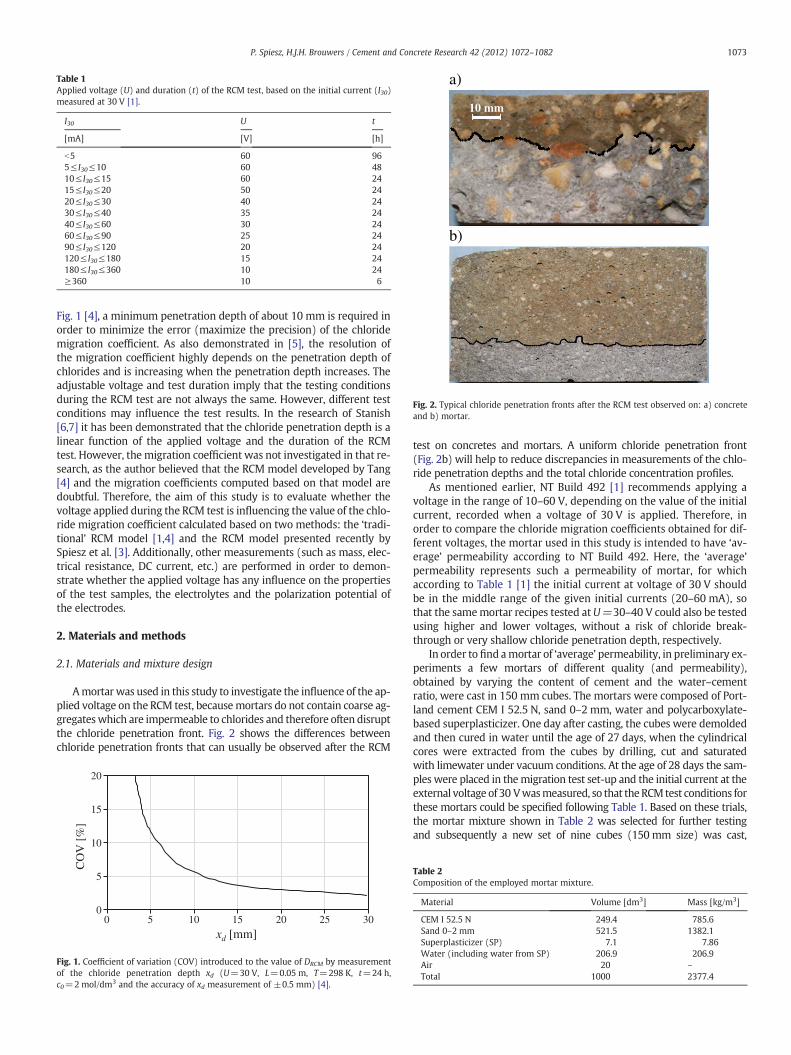
Table 1Applied voltage (U) and duration (t) of the RCM test, based on the initial current (I30)measured at 30 V [1].
I30 U t
[mA] [V] [h]
b5 60 965≤ I30≤10 60 4810≤ I30≤15 60 2415≤ I30≤20 50 2420≤ I30≤30 40 2430≤ I30≤40 35 2440≤ I30≤60 30 2460≤ I30≤90 25 2490≤ I30≤120 20 24120≤ I30≤180 15 24180≤ I30≤360 10 24≥360 10 6
a)
b)
10 mm
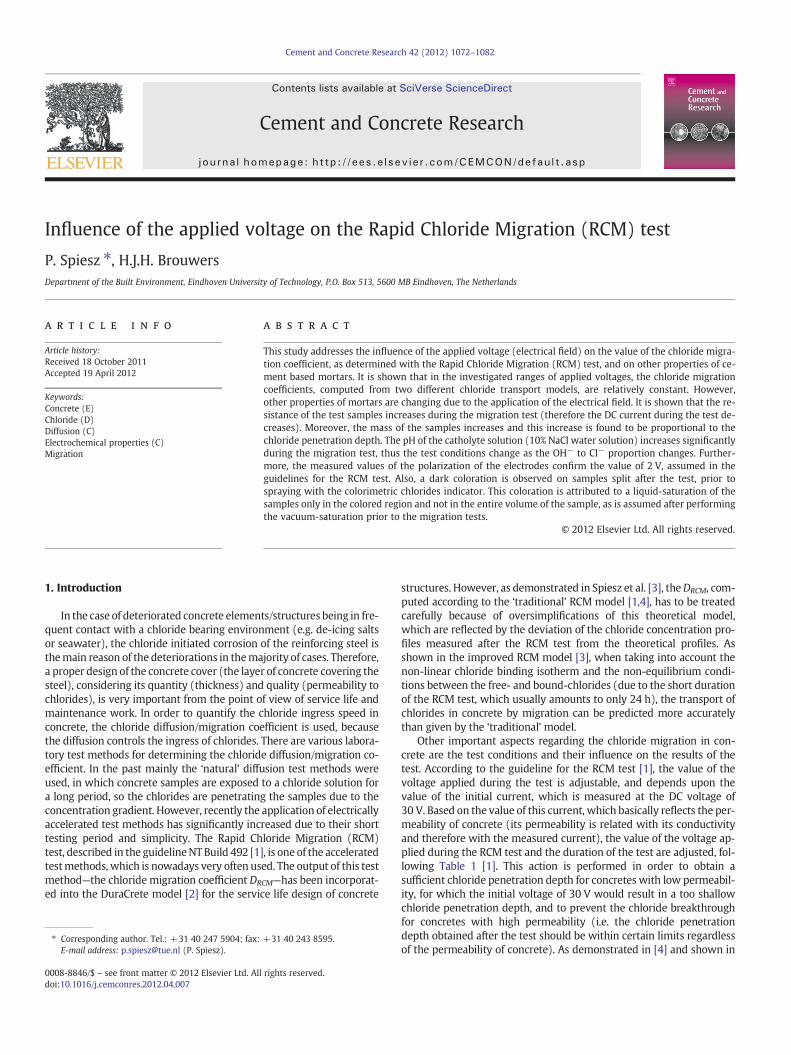
Fig. 2. Typical chloride penetration fronts after the RCM test observed on: a) concreteand b) mortar.
1073P. Spiesz, H.J.H. Brouwers / Cement and Concrete Research 42 (2012) 1072–1082
Fig. 1 [4], a minimum penetration depth of about 10 mm is required inorder to minimize the error (maximize the precision) of the chloridemigration coefficient. As also demonstrated in [5], the resolution ofthe migration coefficient highly depends on the penetration depth ofchlorides and is increasing when the penetration depth increases. Theadjustable voltage and test duration imply that the testing conditionsduring the RCM test are not always the same. However, different testconditions may influence the test results. In the research of Stanish[6,7] it has been demonstrated that the chloride penetration depth is alinear function of the applied voltage and the duration of the RCMtest. However, the migration coefficient was not investigated in that re-search, as the author believed that the RCM model developed by Tang[4] and the migration coefficients computed based on that model aredoubtful. Therefore, the aim of this study is to evaluate whether thevoltage applied during the RCM test is influencing the value of the chlo-ride migration coefficient calculated based on two methods: the ‘tradi-tional’ RCM model [1,4] and the RCM model presented recently bySpiesz et al. [3]. Additionally, other measurements (such as mass, elec-trical resistance, DC current, etc.) are performed in order to demon-strate whether the applied voltage has any influence on the propertiesof the test samples, the electrolytes and the polarization potential ofthe electrodes.
2. Materials and methods
2.1. Materials and mixture design
Amortarwas used in this study to investigate the influence of the ap-plied voltage on the RCM test, becausemortars do not contain coarse ag-gregateswhich are impermeable to chlorides and therefore often disruptthe chloride penetration front. Fig. 2 shows the differences betweenchloride penetration fronts that can usually be observed after the RCM
0
5
10
15
20
0 5 10 15 20 25 30
CO
V [
%]
Fig. 1. Coefficient of variation (COV) introduced to the value of DRCM by measurementof the chloride penetration depth xd (U=30 V, L=0.05 m, T=298 K, t=24 h,c0=2mol/dm3 and the accuracy of xd measurement of ±0.5 mm) [4].
test on concretes and mortars. A uniform chloride penetration front(Fig. 2b) will help to reduce discrepancies in measurements of the chlo-ride penetration depths and the total chloride concentration profiles.
As mentioned earlier, NT Build 492 [1] recommends applying avoltage in the range of 10–60 V, depending on the value of the initialcurrent, recorded when a voltage of 30 V is applied. Therefore, inorder to compare the chloride migration coefficients obtained for dif-ferent voltages, the mortar used in this study is intended to have ‘av-erage’ permeability according to NT Build 492. Here, the ‘average’permeability represents such a permeability of mortar, for whichaccording to Table 1 [1] the initial current at voltage of 30 V shouldbe in the middle range of the given initial currents (20–60 mA), sothat the samemortar recipes tested atU=30–40 V could also be testedusing higher and lower voltages, without a risk of chloride break-through or very shallow chloride penetration depth, respectively.
In order to find amortar of ‘average’ permeability, in preliminary ex-periments a few mortars of different quality (and permeability),obtained by varying the content of cement and the water–cementratio, were cast in 150 mm cubes. The mortars were composed of Port-land cement CEM I 52.5 N, sand 0–2 mm, water and polycarboxylate-based superplasticizer. One day after casting, the cubes were demoldedand then cured in water until the age of 27 days, when the cylindricalcores were extracted from the cubes by drilling, cut and saturatedwith limewater under vacuum conditions. At the age of 28 days the sam-ples were placed in themigration test set-up and the initial current at theexternal voltage of 30 Vwasmeasured, so that theRCMtest conditions forthese mortars could be specified following Table 1. Based on these trials,the mortar mixture shown in Table 2 was selected for further testingand subsequently a new set of nine cubes (150 mm size) was cast,
Table 2Composition of the employed mortar mixture.
Material Volume [dm3] Mass [kg/m3]
CEM I 52.5 N 249.4 785.6Sand 0–2 mm 521.5 1382.1Superplasticizer (SP) 7.1 7.86Water (including water from SP) 206.9 206.9Air 20 –
Total 1000 2377.4
1074 P. Spiesz, H.J.H. Brouwers / Cement and Concrete Research 42 (2012) 1072–1082
demolded after one day and cured in water. Three of these cubes weretested for their compressive strength at the age of 28 days and a meanvalue of 97.8 N/mm2 was recorded. This high strength can be explainedby a high cement content and low w/c ratio in the mix.
2.2. Rapid Chloride Migration test
Six cylindrical cores (Φ=100 mm) were extracted from theremaining mortar cubes at the age of 27 days. From these cores 12specimens of 50 mm in height were sliced for the RCM test (two spec-imens from each core, 10–20 mm of the outermost surfaces of eachcore were cut off) and stored in water. One day prior to the RCMtest, each series of the test samples was saturated with limewaterunder vacuum conditions. The vacuum-saturation was performed fol-lowing the procedure described in [1,8]: surface-dry samples wereplaced vertically in a desiccator connected to a vacuum-pump and apressure of 40 mbar was applied for 3 h. Then, with the vacuum-pump still running, the desiccator was slowly filled with limewaterto immerse all the samples completely. After that, for an additionalhour, the vacuum was maintained before allowing air to re-enterthe desiccator. The samples were kept in the solution for about18 h. The RCM test was performed on the saturated samples at theage of 28, 29 and 30 days. Power sources with constant voltage out-puts (adjustable in the range of 0–80 V, accuracy of 0.05 V) wereused. The scheme of the RCM test set-up is shown in Fig. 3. Four mor-tar samples were tested at the same time. The used volume of thecatholyte (10% NaCl aq. solution) was about 14 l while the volumeof the anolyte (0.3 M NaOH solution) was approximately 0.3 l pertest specimen. The electrolytes were refreshed after each series of ex-periments. After the migration test, three mortar samples were splitand sprayed with a 0.1 M AgNO3 solution in order to determine thepenetration depth of chlorides, while the total chloride concentrationprofile was measured on the fourth sample.
In order to investigate the influence of the applied voltage on thechloride migration coefficient, three series of mortar specimens weretested at three different voltages. According to the plan of the expe-riment, a mortar of ‘average’ permeability according to Table 1(20b I30b60 mA; hence U in the range of 30–40 V) was prepared. Be-sides testing the mortar at the voltage of U=30–40 V, also tests at thevoltages U+20 V and U−20 V were planned. However, as will beexplained later, this initial plan had to be modified due to the veryshallow chloride penetration depths obtained in the firstexperiments.
Fig. 3. RCM test set-up.
2.3. Chloride concentration profile measurements
Immediately after finishing the RCM test, the mortar samples wereground in layers. A surface layer of 0.5 mm was ground at first andthen 1 mm layers were ground consecutively, until a depth of approx-imately 5 mm farther than the chloride penetration depth measuredpreviously on split samples (by the AgNO3 colorimetric method)was achieved. The grinding process was finished 2–3 h after finishingthe RCM test. About 4 g of mortar dust was collected from the surfacelayer and about 8 g from each deeper layer. Afterwards, the dust wassieved on a 0.25 mm sieve (in practice, all the ground material ispassing this sieve). Subsequently, this passing fraction was dried ina ventilated oven at 105 °C, until a constant mass was reached. Inorder to extract the chlorides, 2 g of dried powder from each analyzedlayer was poured into a beaker together with 35 ml of distilled waterand 2 ml of 1 M HNO3, shaken manually for 1 min and heated up toreach the boiling point. Next, the solution was cooled down, filtered,and its volume was adjusted to 100 ml by adding distilled water. 10 mlsampleswere analyzed for the chloride concentration by using an auto-matic potentiometric titration unit and 0.01 MAgNO3 solution as the ti-trant. The measured concentration was expressed as the mass ofchlorides in 100 g of dry mortar. The minimum chloride concentration(Cbi—the background concentration) which could be measured by thetitration unit was 0.03 gCl/100 gmortar.
2.4. Polarization potential measurements
The polarization potential of the electrodes is included in the formu-las for calculating the DRCM coefficient in NT Build 492 [1] and amountsto 2 V. In [9] the measured values of the polarization potential of thestainless-steel electrodes used in the Rapid Chloride Permeability test(RCPT) [8] are given. The cumulative values of the polarization potentialfor both electrodes are reported to be in the range of 1.91–2.36 V for theapplied external voltage of 6 up to 30 V. However, the test set-up for theRCPT test is different than the test set-up employed for the RCM test(e.g. electrolytes and their volumes or applied voltages), so the polariza-tion potential during the RCM testmay vary from the values reported in[9].
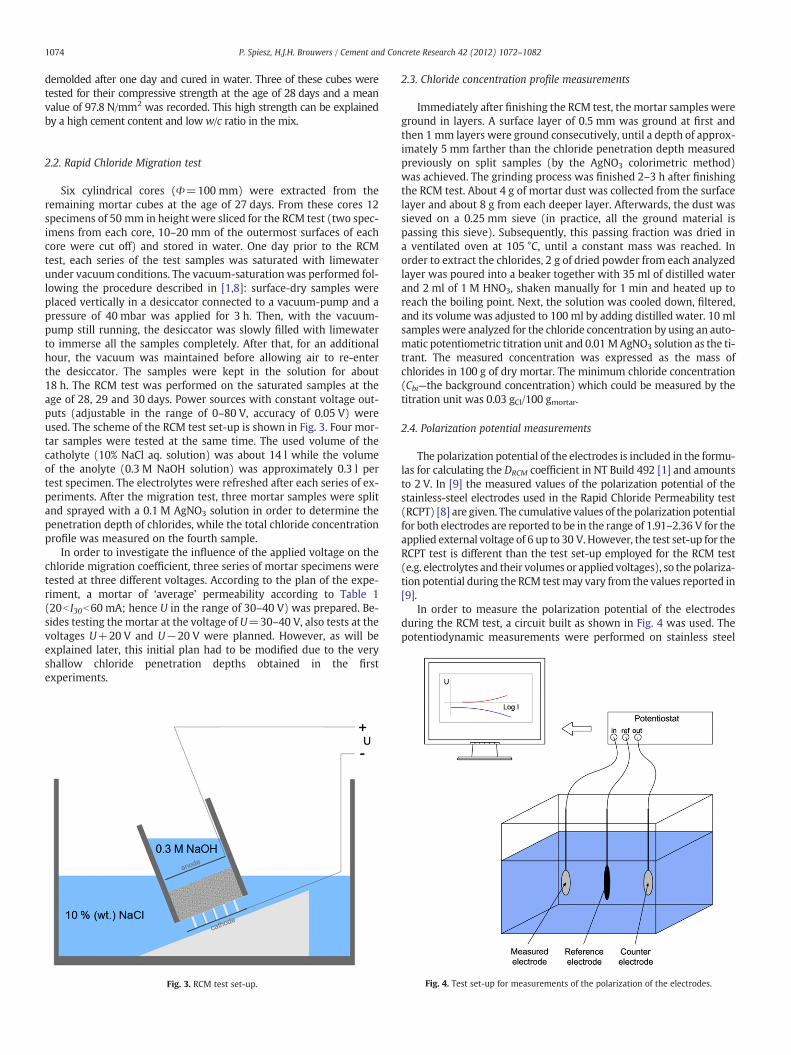
In order to measure the polarization potential of the electrodesduring the RCM test, a circuit built as shown in Fig. 4 was used. Thepotentiodynamic measurements were performed on stainless steel
Fig. 4. Test set-up for measurements of the polarization of the electrodes.
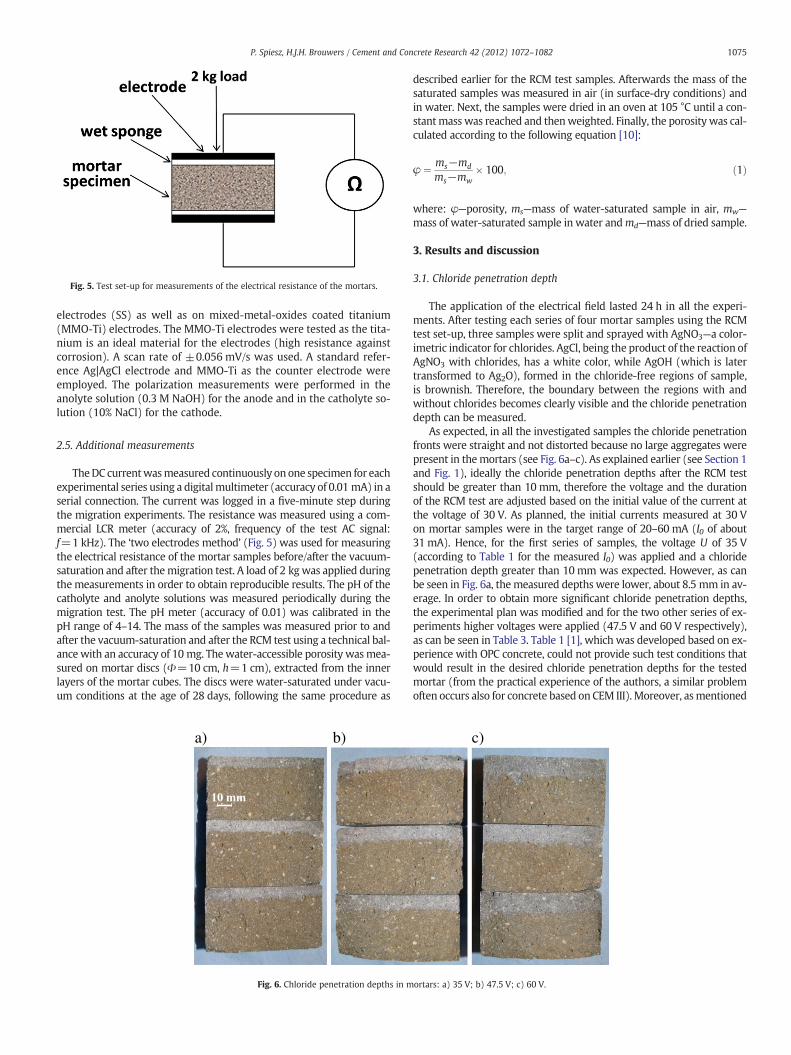
Fig. 5. Test set-up for measurements of the electrical resistance of the mortars.
1075P. Spiesz, H.J.H. Brouwers / Cement and Concrete Research 42 (2012) 1072–1082
electrodes (SS) as well as on mixed-metal-oxides coated titanium(MMO-Ti) electrodes. The MMO-Ti electrodes were tested as the tita-nium is an ideal material for the electrodes (high resistance againstcorrosion). A scan rate of ±0.056 mV/s was used. A standard refer-ence Ag|AgCl electrode and MMO-Ti as the counter electrode wereemployed. The polarization measurements were performed in theanolyte solution (0.3 M NaOH) for the anode and in the catholyte so-lution (10% NaCl) for the cathode.
2.5. Additional measurements
TheDC currentwasmeasured continuously on one specimen for eachexperimental series using a digitalmultimeter (accuracy of 0.01 mA) in aserial connection. The current was logged in a five-minute step duringthe migration experiments. The resistance was measured using a com-mercial LCR meter (accuracy of 2%, frequency of the test AC signal:f=1 kHz). The ‘two electrodes method’ (Fig. 5) was used for measuringthe electrical resistance of the mortar samples before/after the vacuum-saturation and after themigration test. A load of 2 kgwas applied duringthemeasurements in order to obtain reproducible results. The pH of thecatholyte and anolyte solutions was measured periodically during themigration test. The pH meter (accuracy of 0.01) was calibrated in thepH range of 4–14. The mass of the samples was measured prior to andafter the vacuum-saturation and after the RCM test using a technical bal-ance with an accuracy of 10 mg. Thewater-accessible porosity wasmea-sured on mortar discs (Φ=10 cm, h=1 cm), extracted from the innerlayers of the mortar cubes. The discs were water-saturated under vacu-um conditions at the age of 28 days, following the same procedure as
a) b)
10 mm
Fig. 6. Chloride penetration depths in m
described earlier for the RCM test samples. Afterwards the mass of thesaturated samples was measured in air (in surface-dry conditions) andin water. Next, the samples were dried in an oven at 105 °C until a con-stantmass was reached and thenweighted. Finally, the porosity was cal-culated according to the following equation [10]:
φ ¼ ms−md
ms−mw� 100; ð1Þ
where: φ—porosity, ms—mass of water-saturated sample in air, mw—
mass of water-saturated sample in water andmd—mass of dried sample.
3. Results and discussion
3.1. Chloride penetration depth
The application of the electrical field lasted 24 h in all the experi-ments. After testing each series of four mortar samples using the RCMtest set-up, three samples were split and sprayed with AgNO3—a color-imetric indicator for chlorides. AgCl, being the product of the reaction ofAgNO3 with chlorides, has a white color, while AgOH (which is latertransformed to Ag2O), formed in the chloride-free regions of sample,is brownish. Therefore, the boundary between the regions with andwithout chlorides becomes clearly visible and the chloride penetrationdepth can be measured.
As expected, in all the investigated samples the chloride penetrationfronts were straight and not distorted because no large aggregates werepresent in themortars (see Fig. 6a–c). As explained earlier (see Section 1and Fig. 1), ideally the chloride penetration depths after the RCM testshould be greater than 10 mm, therefore the voltage and the durationof the RCM test are adjusted based on the initial value of the current atthe voltage of 30 V. As planned, the initial currents measured at 30 Von mortar samples were in the target range of 20–60 mA (I0 of about31 mA). Hence, for the first series of samples, the voltage U of 35 V(according to Table 1 for the measured I0) was applied and a chloridepenetration depth greater than 10 mm was expected. However, as canbe seen in Fig. 6a, the measured depths were lower, about 8.5 mm in av-erage. In order to obtain more significant chloride penetration depths,the experimental plan was modified and for the two other series of ex-periments higher voltages were applied (47.5 V and 60 V respectively),as can be seen in Table 3. Table 1 [1], which was developed based on ex-perience with OPC concrete, could not provide such test conditions thatwould result in the desired chloride penetration depths for the testedmortar (from the practical experience of the authors, a similar problemoften occurs also for concrete based on CEM III). Moreover, asmentioned
c)
ortars: a) 35 V; b) 47.5 V; c) 60 V.
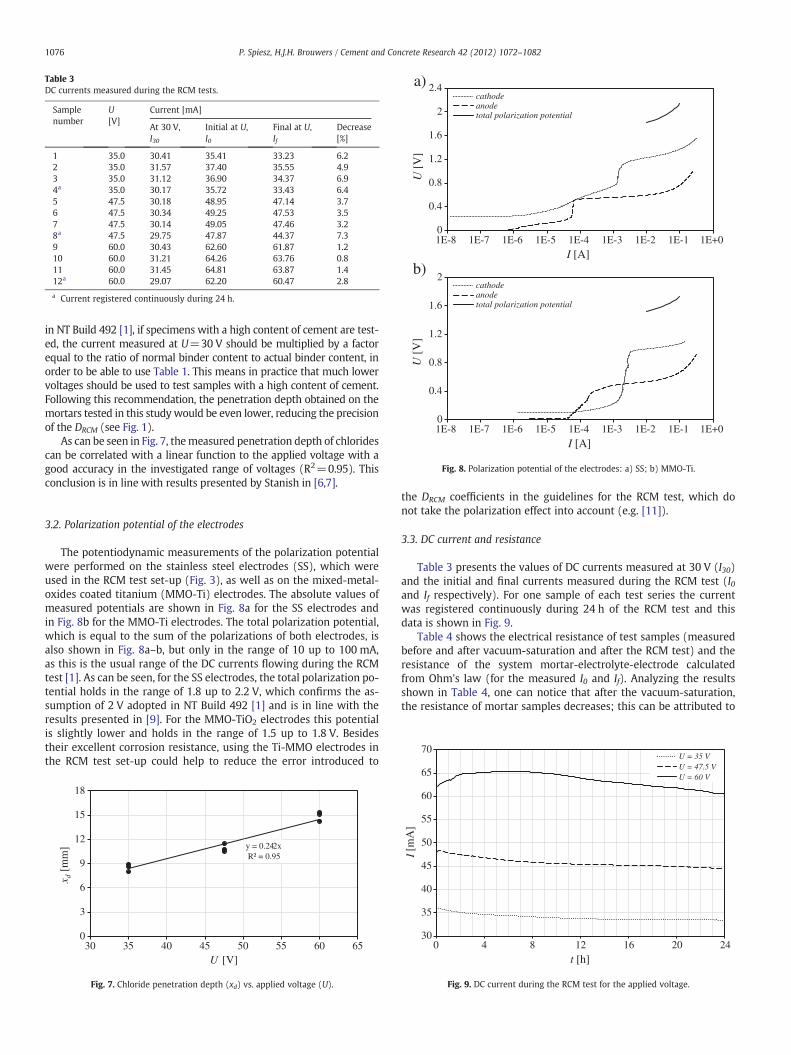
Table 3DC currents measured during the RCM tests.
Samplenumber
U[V]
Current [mA]
At 30 V,I30
Initial at U,I0
Final at U,If
Decrease[%]
1 35.0 30.41 35.41 33.23 6.22 35.0 31.57 37.40 35.55 4.93 35.0 31.12 36.90 34.37 6.94a 35.0 30.17 35.72 33.43 6.45 47.5 30.18 48.95 47.14 3.76 47.5 30.34 49.25 47.53 3.57 47.5 30.14 49.05 47.46 3.28a 47.5 29.75 47.87 44.37 7.39 60.0 30.43 62.60 61.87 1.210 60.0 31.21 64.26 63.76 0.811 60.0 31.45 64.81 63.87 1.412a 60.0 29.07 62.20 60.47 2.8
a Current registered continuously during 24 h.
a)
b)
0
0.4
0.8
1.2
1.6
2
2.4
1E-8 1E-7 1E-6 1E-5 1E-4 1E-3 1E-2 1E-1 1E+0
cathodeanodetotal polarization potential
0
0.4
0.8
1.2
1.6
2cathodeanodetotal polarization potential
1E-8 1E-7 1E-6 1E-5 1E-4 1E-3 1E-2 1E-1 1E+0
Fig. 8. Polarization potential of the electrodes: a) SS; b) MMO-Ti.
1076 P. Spiesz, H.J.H. Brouwers / Cement and Concrete Research 42 (2012) 1072–1082
in NT Build 492 [1], if specimens with a high content of cement are test-ed, the current measured at U=30 V should be multiplied by a factorequal to the ratio of normal binder content to actual binder content, inorder to be able to use Table 1. This means in practice that much lowervoltages should be used to test samples with a high content of cement.Following this recommendation, the penetration depth obtained on themortars tested in this studywould be even lower, reducing the precisionof the DRCM (see Fig. 1).
As can be seen in Fig. 7, themeasured penetration depth of chloridescan be correlated with a linear function to the applied voltage with agood accuracy in the investigated range of voltages (R2=0.95). Thisconclusion is in line with results presented by Stanish in [6,7].
70U = 35 VU = 47.5 V
3.2. Polarization potential of the electrodes
The potentiodynamic measurements of the polarization potentialwere performed on the stainless steel electrodes (SS), which wereused in the RCM test set-up (Fig. 3), as well as on the mixed-metal-oxides coated titanium (MMO-Ti) electrodes. The absolute values ofmeasured potentials are shown in Fig. 8a for the SS electrodes andin Fig. 8b for the MMO-Ti electrodes. The total polarization potential,which is equal to the sum of the polarizations of both electrodes, isalso shown in Fig. 8a–b, but only in the range of 10 up to 100 mA,as this is the usual range of the DC currents flowing during the RCMtest [1]. As can be seen, for the SS electrodes, the total polarization po-tential holds in the range of 1.8 up to 2.2 V, which confirms the as-sumption of 2 V adopted in NT Build 492 [1] and is in line with theresults presented in [9]. For the MMO-TiO2 electrodes this potentialis slightly lower and holds in the range of 1.5 up to 1.8 V. Besidestheir excellent corrosion resistance, using the Ti-MMO electrodes inthe RCM test set-up could help to reduce the error introduced to
y = 0.242xR² = 0.95
0
3
6
9
12
15
18
30 35 40 45 50 55 60 65
Fig. 7. Chloride penetration depth (xd) vs. applied voltage (U).
the DRCM coefficients in the guidelines for the RCM test, which donot take the polarization effect into account (e.g. [11]).
3.3. DC current and resistance
Table 3 presents the values of DC currents measured at 30 V (I30)and the initial and final currents measured during the RCM test (I0and If respectively). For one sample of each test series the currentwas registered continuously during 24 h of the RCM test and thisdata is shown in Fig. 9.
Table 4 shows the electrical resistance of test samples (measuredbefore and after vacuum-saturation and after the RCM test) and theresistance of the system mortar-electrolyte-electrode calculatedfrom Ohm's law (for the measured I0 and If). Analyzing the resultsshown in Table 4, one can notice that after the vacuum-saturation,the resistance of mortar samples decreases; this can be attributed to
30
35
40
45
50
55
60
65
0 4 8 12 16 20 24
U = 60 V
Fig. 9. DC current during the RCM test for the applied voltage.
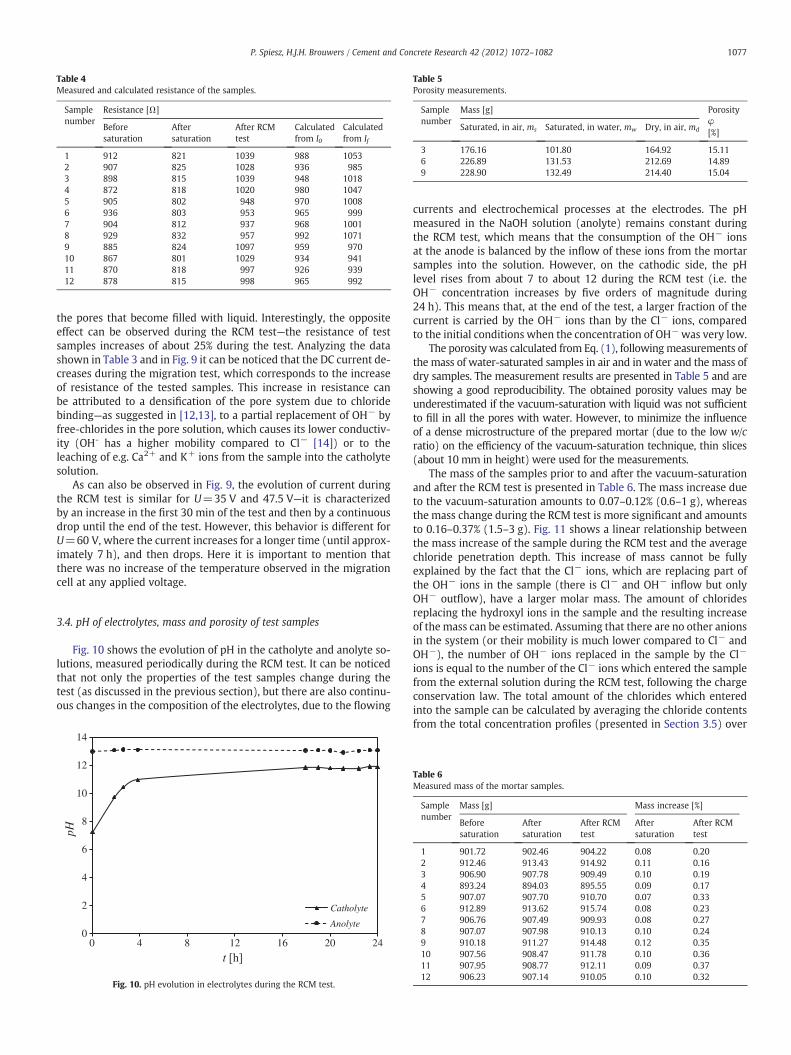
Table 4Measured and calculated resistance of the samples.
Samplenumber
Resistance [Ω]
Beforesaturation
Aftersaturation
After RCMtest
Calculatedfrom I0
Calculatedfrom If
1 912 821 1039 988 10532 907 825 1028 936 9853 898 815 1039 948 10184 872 818 1020 980 10475 905 802 948 970 10086 936 803 953 965 9997 904 812 937 968 10018 929 832 957 992 10719 885 824 1097 959 97010 867 801 1029 934 94111 870 818 997 926 93912 878 815 998 965 992
Table 5Porosity measurements.
Samplenumber
Mass [g] Porosityφ[%]
Saturated, in air, ms Saturated, in water, mw Dry, in air, md
3 176.16 101.80 164.92 15.116 226.89 131.53 212.69 14.899 228.90 132.49 214.40 15.04
1077P. Spiesz, H.J.H. Brouwers / Cement and Concrete Research 42 (2012) 1072–1082
the pores that become filled with liquid. Interestingly, the oppositeeffect can be observed during the RCM test—the resistance of testsamples increases of about 25% during the test. Analyzing the datashown in Table 3 and in Fig. 9 it can be noticed that the DC current de-creases during the migration test, which corresponds to the increaseof resistance of the tested samples. This increase in resistance canbe attributed to a densification of the pore system due to chloridebinding—as suggested in [12,13], to a partial replacement of OH− byfree-chlorides in the pore solution, which causes its lower conductiv-ity (OH- has a higher mobility compared to Cl− [14]) or to theleaching of e.g. Ca2+ and K+ ions from the sample into the catholytesolution.
As can also be observed in Fig. 9, the evolution of current duringthe RCM test is similar for U=35 V and 47.5 V—it is characterizedby an increase in the first 30 min of the test and then by a continuousdrop until the end of the test. However, this behavior is different forU=60 V, where the current increases for a longer time (until approx-imately 7 h), and then drops. Here it is important to mention thatthere was no increase of the temperature observed in the migrationcell at any applied voltage.
3.4. pH of electrolytes, mass and porosity of test samples
Fig. 10 shows the evolution of pH in the catholyte and anolyte so-lutions, measured periodically during the RCM test. It can be noticedthat not only the properties of the test samples change during thetest (as discussed in the previous section), but there are also continu-ous changes in the composition of the electrolytes, due to the flowing
0
2
4
6
8
10
12
14
0 4 8 12 16 20 24
pH
Catholyte
Anolyte
Fig. 10. pH evolution in electrolytes during the RCM test.
currents and electrochemical processes at the electrodes. The pHmeasured in the NaOH solution (anolyte) remains constant duringthe RCM test, which means that the consumption of the OH− ionsat the anode is balanced by the inflow of these ions from the mortarsamples into the solution. However, on the cathodic side, the pHlevel rises from about 7 to about 12 during the RCM test (i.e. theOH− concentration increases by five orders of magnitude during24 h). This means that, at the end of the test, a larger fraction of thecurrent is carried by the OH− ions than by the Cl− ions, comparedto the initial conditions when the concentration of OH− was very low.
The porosity was calculated from Eq. (1), followingmeasurements ofthe mass of water-saturated samples in air and in water and the mass ofdry samples. The measurement results are presented in Table 5 and areshowing a good reproducibility. The obtained porosity values may beunderestimated if the vacuum-saturation with liquid was not sufficientto fill in all the pores with water. However, to minimize the influenceof a dense microstructure of the prepared mortar (due to the low w/cratio) on the efficiency of the vacuum-saturation technique, thin slices(about 10 mm in height) were used for the measurements.
The mass of the samples prior to and after the vacuum-saturationand after the RCM test is presented in Table 6. The mass increase dueto the vacuum-saturation amounts to 0.07–0.12% (0.6–1 g), whereasthe mass change during the RCM test is more significant and amountsto 0.16–0.37% (1.5–3 g). Fig. 11 shows a linear relationship betweenthe mass increase of the sample during the RCM test and the averagechloride penetration depth. This increase of mass cannot be fullyexplained by the fact that the Cl− ions, which are replacing part ofthe OH− ions in the sample (there is Cl− and OH− inflow but onlyOH− outflow), have a larger molar mass. The amount of chloridesreplacing the hydroxyl ions in the sample and the resulting increaseof the mass can be estimated. Assuming that there are no other anionsin the system (or their mobility is much lower compared to Cl− andOH−), the number of OH− ions replaced in the sample by the Cl−
ions is equal to the number of the Cl− ions which entered the samplefrom the external solution during the RCM test, following the chargeconservation law. The total amount of the chlorides which enteredinto the sample can be calculated by averaging the chloride contentsfrom the total concentration profiles (presented in Section 3.5) over
Table 6Measured mass of the mortar samples.
Samplenumber
Mass [g] Mass increase [%]
Beforesaturation
Aftersaturation
After RCMtest
Aftersaturation
After RCMtest
1 901.72 902.46 904.22 0.08 0.202 912.46 913.43 914.92 0.11 0.163 906.90 907.78 909.49 0.10 0.194 893.24 894.03 895.55 0.09 0.175 907.07 907.70 910.70 0.07 0.336 912.89 913.62 915.74 0.08 0.237 906.76 907.49 909.93 0.08 0.278 907.07 907.98 910.13 0.10 0.249 910.18 911.27 914.48 0.12 0.3510 907.56 908.47 911.78 0.10 0.3611 907.95 908.77 912.11 0.09 0.3712 906.23 907.14 910.05 0.10 0.32
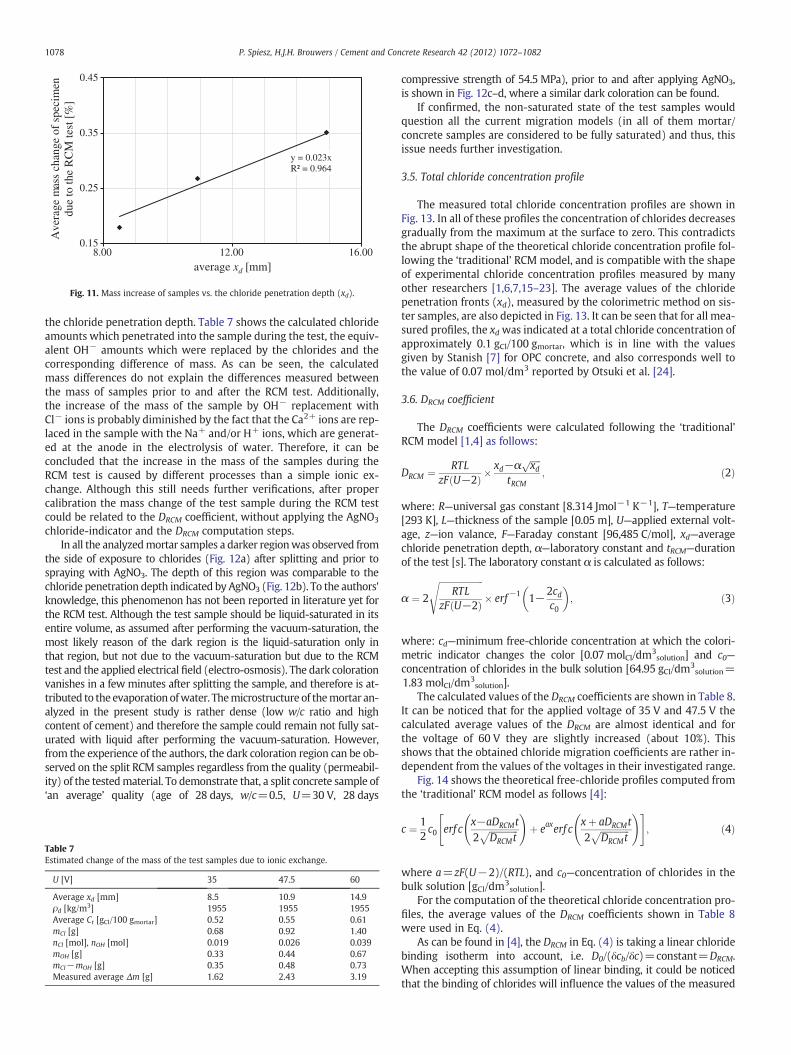
y = 0.023xR² = 0.964
0.15
0.25
0.35
0.45
8.00 12.00 16.00
Fig. 11. Mass increase of samples vs. the chloride penetration depth (xd).
1078 P. Spiesz, H.J.H. Brouwers / Cement and Concrete Research 42 (2012) 1072–1082
the chloride penetration depth. Table 7 shows the calculated chlorideamounts which penetrated into the sample during the test, the equiv-alent OH− amounts which were replaced by the chlorides and thecorresponding difference of mass. As can be seen, the calculatedmass differences do not explain the differences measured betweenthe mass of samples prior to and after the RCM test. Additionally,the increase of the mass of the sample by OH− replacement withCl− ions is probably diminished by the fact that the Ca2+ ions are rep-laced in the sample with the Na+ and/or H+ ions, which are generat-ed at the anode in the electrolysis of water. Therefore, it can beconcluded that the increase in the mass of the samples during theRCM test is caused by different processes than a simple ionic ex-change. Although this still needs further verifications, after propercalibration the mass change of the test sample during the RCM testcould be related to the DRCM coefficient, without applying the AgNO3
chloride-indicator and the DRCM computation steps.In all the analyzedmortar samples a darker regionwas observed from
the side of exposure to chlorides (Fig. 12a) after splitting and prior tospraying with AgNO3. The depth of this region was comparable to thechloride penetration depth indicated by AgNO3 (Fig. 12b). To the authors'knowledge, this phenomenon has not been reported in literature yet forthe RCM test. Although the test sample should be liquid-saturated in itsentire volume, as assumed after performing the vacuum-saturation, themost likely reason of the dark region is the liquid-saturation only inthat region, but not due to the vacuum-saturation but due to the RCMtest and the applied electrical field (electro-osmosis). The dark colorationvanishes in a few minutes after splitting the sample, and therefore is at-tributed to the evaporation ofwater. Themicrostructure of themortar an-alyzed in the present study is rather dense (low w/c ratio and highcontent of cement) and therefore the sample could remain not fully sat-urated with liquid after performing the vacuum-saturation. However,from the experience of the authors, the dark coloration region can be ob-served on the split RCM samples regardless from the quality (permeabil-ity) of the testedmaterial. To demonstrate that, a split concrete sample of‘an average’ quality (age of 28 days, w/c=0.5, U=30 V, 28 days
Table 7Estimated change of the mass of the test samples due to ionic exchange.
U [V] 35 47.5 60
Average xd [mm] 8.5 10.9 14.9ρd [kg/m3] 1955 1955 1955Average Ct [gCl/100 gmortar] 0.52 0.55 0.61mCl [g] 0.68 0.92 1.40nCl [mol], nOH [mol] 0.019 0.026 0.039mOH [g] 0.33 0.44 0.67mCl−mOH [g] 0.35 0.48 0.73Measured average Δm [g] 1.62 2.43 3.19
compressive strength of 54.5 MPa), prior to and after applying AgNO3,is shown in Fig. 12c–d, where a similar dark coloration can be found.
If confirmed, the non-saturated state of the test samples wouldquestion all the current migration models (in all of them mortar/concrete samples are considered to be fully saturated) and thus, thisissue needs further investigation.
3.5. Total chloride concentration profile
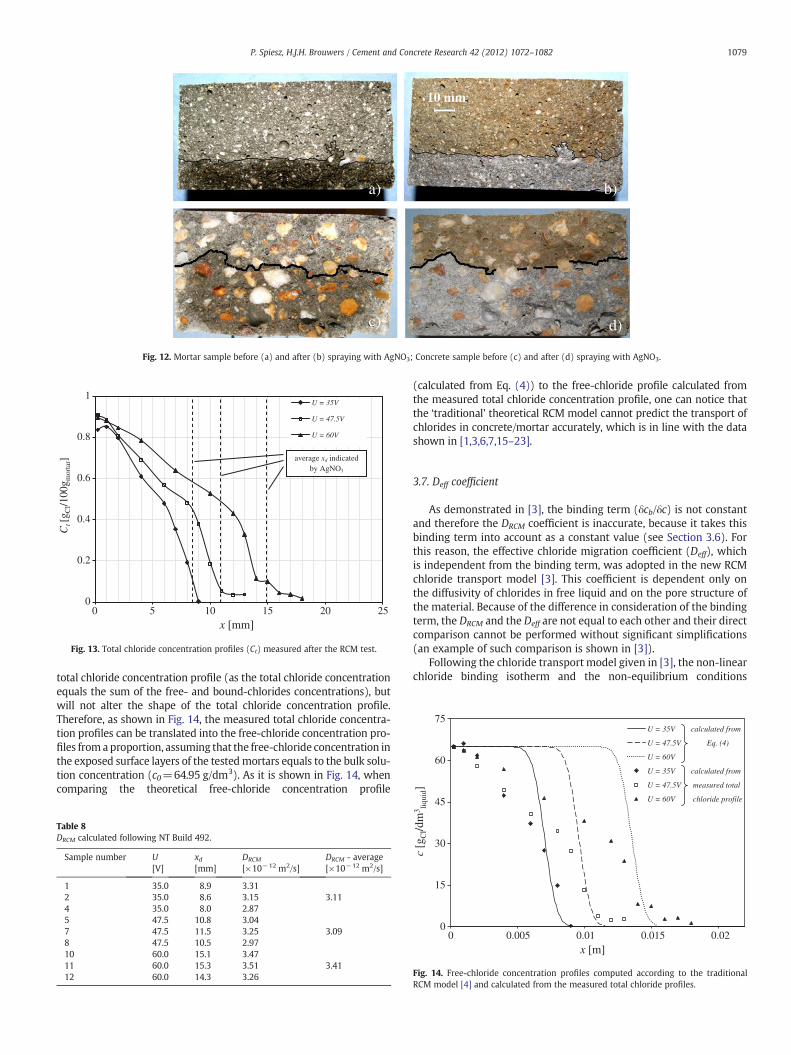
The measured total chloride concentration profiles are shown inFig. 13. In all of these profiles the concentration of chlorides decreasesgradually from the maximum at the surface to zero. This contradictsthe abrupt shape of the theoretical chloride concentration profile fol-lowing the ‘traditional’ RCM model, and is compatible with the shapeof experimental chloride concentration profiles measured by manyother researchers [1,6,7,15–23]. The average values of the chloridepenetration fronts (xd), measured by the colorimetric method on sis-ter samples, are also depicted in Fig. 13. It can be seen that for all mea-sured profiles, the xd was indicated at a total chloride concentration ofapproximately 0.1 gCl/100 gmortar, which is in line with the valuesgiven by Stanish [7] for OPC concrete, and also corresponds well tothe value of 0.07 mol/dm3 reported by Otsuki et al. [24].
3.6. DRCM coefficient
The DRCM coefficients were calculated following the ‘traditional’RCM model [1,4] as follows:
DRCM ¼ RTLzF U−2ð Þ �
xd−αffiffiffiffiffixd
ptRCM
; ð2Þ
where: R—universal gas constant [8.314 Jmol−1 K−1], T—temperature[293 K], L—thickness of the sample [0.05 m], U—applied external volt-age, z—ion valance, F—Faraday constant [96,485 C/mol], xd—averagechloride penetration depth, α—laboratory constant and tRCM—durationof the test [s]. The laboratory constant α is calculated as follows:
α ¼ 2
ffiffiffiffiffiffiffiffiffiffiffiffiffiffiffiffiffiffiffiffiRTL
zF U−2ð Þ
s� erf−1 1−2cd
c0
� �; ð3Þ
where: cd—minimum free-chloride concentration at which the colori-metric indicator changes the color [0.07 molCl/dm3
solution] and c0—concentration of chlorides in the bulk solution [64.95 gCl/dm3
solution=1.83 molCl/dm3
solution].The calculated values of the DRCM coefficients are shown in Table 8.
It can be noticed that for the applied voltage of 35 V and 47.5 V thecalculated average values of the DRCM are almost identical and forthe voltage of 60 V they are slightly increased (about 10%). Thisshows that the obtained chloride migration coefficients are rather in-dependent from the values of the voltages in their investigated range.
Fig. 14 shows the theoretical free-chloride profiles computed fromthe ‘traditional’ RCM model as follows [4]:
c ¼ 12c0 erf c
x−aDRCMt2
ffiffiffiffiffiffiffiffiffiffiffiffiffiDRCMt
p !
þ eaxerf cxþ aDRCMt2
ffiffiffiffiffiffiffiffiffiffiffiffiffiDRCMt
p !" #
; ð4Þ
where a=zF(U−2)/(RTL), and c0—concentration of chlorides in thebulk solution [gCl/dm3
solution].For the computation of the theoretical chloride concentration pro-
files, the average values of the DRCM coefficients shown in Table 8were used in Eq. (4).
As can be found in [4], the DRCM in Eq. (4) is taking a linear chloridebinding isotherm into account, i.e. D0/(δcb/δc)=constant=DRCM.When accepting this assumption of linear binding, it could be noticedthat the binding of chlorides will influence the values of the measured
10 mm
a) b)
c) d)
Fig. 12. Mortar sample before (a) and after (b) spraying with AgNO3; Concrete sample before (c) and after (d) spraying with AgNO3.
0
0.2
0.4
0.6
0.8
1
0 5 10 15 20 25
U = 35V
U = 47.5V
U = 60V
average xd indicated by AgNO3
Fig. 13. Total chloride concentration profiles (Ct) measured after the RCM test.
60
75U = 35V calculated from
U = 47.5V Eq. (4)
U = 60V
U = 35V calculated from
U = 47.5V measured total
1079P. Spiesz, H.J.H. Brouwers / Cement and Concrete Research 42 (2012) 1072–1082
total chloride concentration profile (as the total chloride concentrationequals the sum of the free- and bound-chlorides concentrations), butwill not alter the shape of the total chloride concentration profile.Therefore, as shown in Fig. 14, the measured total chloride concentra-tion profiles can be translated into the free-chloride concentration pro-files fromaproportion, assuming that the free-chloride concentration inthe exposed surface layers of the testedmortars equals to the bulk solu-tion concentration (c0=64.95 g/dm3). As it is shown in Fig. 14, whencomparing the theoretical free-chloride concentration profile
Table 8DRCM calculated following NT Build 492.
Sample number U[V]
xd[mm]
DRCM
[×10−12 m2/s]DRCM - average[×10−12 m2/s]
1 35.0 8.9 3.312 35.0 8.6 3.15 3.114 35.0 8.0 2.875 47.5 10.8 3.047 47.5 11.5 3.25 3.098 47.5 10.5 2.9710 60.0 15.1 3.4711 60.0 15.3 3.51 3.4112 60.0 14.3 3.26
(calculated from Eq. (4)) to the free-chloride profile calculated fromthe measured total chloride concentration profile, one can notice thatthe ‘traditional’ theoretical RCM model cannot predict the transport ofchlorides in concrete/mortar accurately, which is in line with the datashown in [1,3,6,7,15–23].
3.7. Deff coefficient
As demonstrated in [3], the binding term (δcb/δc) is not constantand therefore the DRCM coefficient is inaccurate, because it takes thisbinding term into account as a constant value (see Section 3.6). Forthis reason, the effective chloride migration coefficient (Deff), whichis independent from the binding term, was adopted in the new RCMchloride transport model [3]. This coefficient is dependent only onthe diffusivity of chlorides in free liquid and on the pore structure ofthe material. Because of the difference in consideration of the bindingterm, the DRCM and the Deff are not equal to each other and their directcomparison cannot be performed without significant simplifications(an example of such comparison is shown in [3]).
Following the chloride transport model given in [3], the non-linearchloride binding isotherm and the non-equilibrium conditions
0
15
30
45
0 0.005 0.01 0.015 0.02
U = 60V chloride profile
Fig. 14. Free-chloride concentration profiles computed according to the traditionalRCM model [4] and calculated from the measured total chloride profiles.
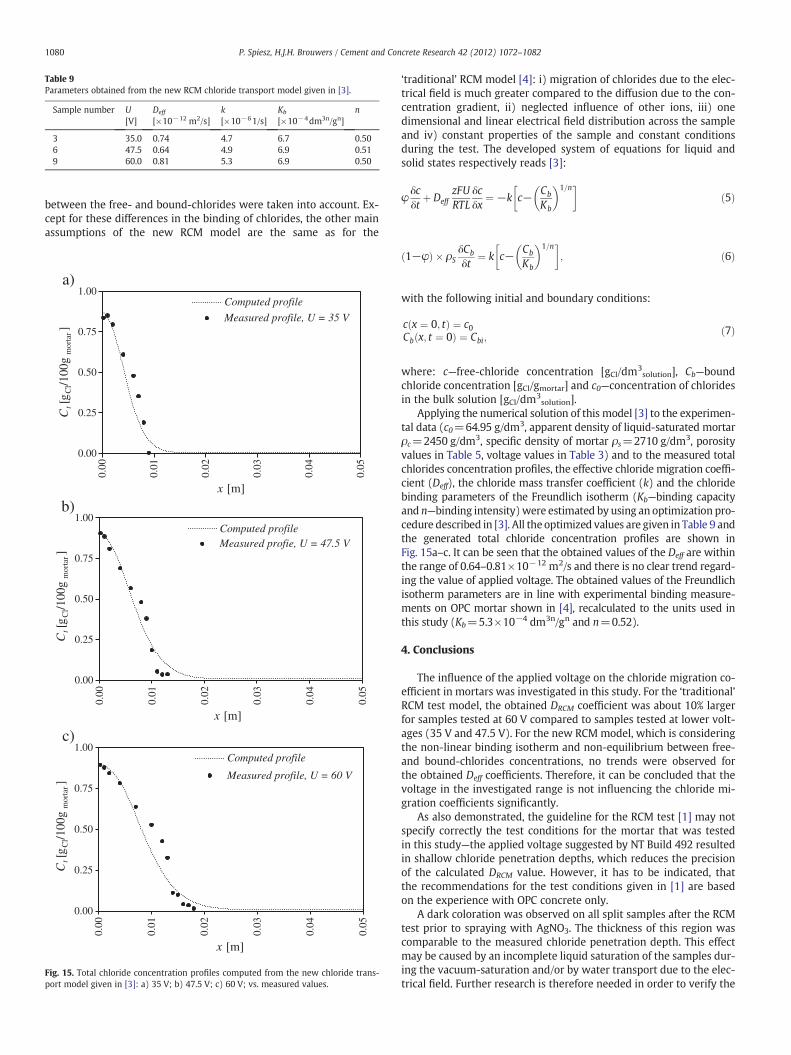
Table 9Parameters obtained from the new RCM chloride transport model given in [3].
Sample number U[V]
Deff
[×10−12 m2/s]k[×10−61/s]
Kb
[×10−4dm3n/gn]n
3 35.0 0.74 4.7 6.7 0.506 47.5 0.64 4.9 6.9 0.519 60.0 0.81 5.3 6.9 0.50
1080 P. Spiesz, H.J.H. Brouwers / Cement and Concrete Research 42 (2012) 1072–1082
between the free- and bound-chlorides were taken into account. Ex-cept for these differences in the binding of chlorides, the other mainassumptions of the new RCM model are the same as for the
a)
b)
c)
0.00
0.25
0.50
0.75
1.00
0.00
0.01
0.02
0.03
0.04
0.05
Computed profile
Measured profile, U = 35 V
0.00
0.25
0.50
0.75
1.00
0.00
0.01
0.02
0.03
0.04
0.05
Computed profileMeasured profie, U = 47.5 V
0.00
0.25
0.50
0.75
1.00
0.00
0.01
0.02
0.03
0.04
0.05
Computed profile
Measured profile, U = 60 V
Fig. 15. Total chloride concentration profiles computed from the new chloride trans-port model given in [3]: a) 35 V; b) 47.5 V; c) 60 V; vs. measured values.
‘traditional’ RCM model [4]: i) migration of chlorides due to the elec-trical field is much greater compared to the diffusion due to the con-centration gradient, ii) neglected influence of other ions, iii) onedimensional and linear electrical field distribution across the sampleand iv) constant properties of the sample and constant conditionsduring the test. The developed system of equations for liquid andsolid states respectively reads [3]:
φδcδt
þ DeffzFURTL
δcδx
¼ −k c− Cb
Kb
� �1=n� �ð5Þ
1−φð Þ � ρSδCb
δt¼ k c− Cb
Kb
� �1=n� �; ð6Þ
with the following initial and boundary conditions:
c x ¼ 0; tð Þ ¼ c0Cb x; t ¼ 0ð Þ ¼ Cbi;
ð7Þ
where: c—free-chloride concentration [gCl/dm3solution], Cb—bound
chloride concentration [gCl/gmortar] and c0—concentration of chloridesin the bulk solution [gCl/dm3
solution].Applying the numerical solution of this model [3] to the experimen-
tal data (c0=64.95 g/dm3, apparent density of liquid-saturated mortarρc=2450 g/dm3, specific density of mortar ρs=2710 g/dm3, porosityvalues in Table 5, voltage values in Table 3) and to the measured totalchlorides concentration profiles, the effective chloride migration coeffi-cient (Deff), the chloride mass transfer coefficient (k) and the chloridebinding parameters of the Freundlich isotherm (Kb—binding capacityand n—binding intensity)were estimated by using an optimization pro-cedure described in [3]. All the optimized values are given in Table 9 andthe generated total chloride concentration profiles are shown inFig. 15a–c. It can be seen that the obtained values of the Deff are withinthe range of 0.64–0.81×10⁻¹² m2/s and there is no clear trend regard-ing the value of applied voltage. The obtained values of the Freundlichisotherm parameters are in line with experimental binding measure-ments on OPC mortar shown in [4], recalculated to the units used inthis study (Kb=5.3×10⁻⁴ dm3n/gn and n=0.52).
4. Conclusions
The influence of the applied voltage on the chloride migration co-efficient in mortars was investigated in this study. For the ‘traditional’RCM test model, the obtained DRCM coefficient was about 10% largerfor samples tested at 60 V compared to samples tested at lower volt-ages (35 V and 47.5 V). For the new RCMmodel, which is consideringthe non-linear binding isotherm and non-equilibrium between free-and bound-chlorides concentrations, no trends were observed forthe obtained Deff coefficients. Therefore, it can be concluded that thevoltage in the investigated range is not influencing the chloride mi-gration coefficients significantly.
As also demonstrated, the guideline for the RCM test [1] may notspecify correctly the test conditions for the mortar that was testedin this study—the applied voltage suggested by NT Build 492 resultedin shallow chloride penetration depths, which reduces the precisionof the calculated DRCM value. However, it has to be indicated, thatthe recommendations for the test conditions given in [1] are basedon the experience with OPC concrete only.
A dark coloration was observed on all split samples after the RCMtest prior to spraying with AgNO3. The thickness of this region wascomparable to the measured chloride penetration depth. This effectmay be caused by an incomplete liquid saturation of the samples dur-ing the vacuum-saturation and/or by water transport due to the elec-trical field. Further research is therefore needed in order to verify the
1081P. Spiesz, H.J.H. Brouwers / Cement and Concrete Research 42 (2012) 1072–1082
effectiveness of the vacuum-saturation technique recommended bythe guidelines and to study the electro-osmosis during the migrationtests.
As also demonstrated, the properties of the mortar and the elec-trolytes change during the RCM test. The increasing resistance ofthe samples was the reason of decreasing currents, which was ob-served during all the experiments. However, the evolution of the cur-rent at 60 V was somewhat different compared to lower voltages.Changes of the mass and resistance before and after the applicationof the electrical field were observed on the test samples. The mass in-crease was found to be proportional to the chloride penetrationdepth and the resistance was found to be increased with about 25%after the test, regardless of the value of the applied voltage. The pHof the catholyte solution increased significantly during the RCMtest. This means that, with time, a larger fraction of the currentflows in the system due to OH− migration instead of the Cl− migra-tion. The influence of these non-constant properties of the samplesand changing test conditions on the migration test needs to be fur-ther investigated.
The measured polarization of the stainless-steel electrodes con-firmed the value of 2 V assumed in the NT Build 492 [1]. Additionally,the polarization of titanium based electrodes was measured, as the ti-tanium is a better suited material to be used as electrode.
List of symbols
Roman
a Migration constant a=zF(U−2)/(RTL) [1/m] c Free-chloride concentration [gCl/dm3solution]
cd
Minimum free-chloride concentration detected with 0.1 MAgNO3[gCl/dm3
solution]
c0 Free-chloride concentration in bulk solution [gCl/dm3solution]
cb
Bound-chlorides concentration [gCl/dm3solution]
Cb Bound-chlorides concentration [gCl/gmortar] Cbi Initial bound-chlorides concentration [gCl/gmortar] Ct Total concentration of chlorides [gCl/100 gmortar]
COV Coefficient of variation [%] D Chloride diffusion coefficient [m2/s] D0 Intrinsic chloride diffusion coefficient [4] [m2/s] Deff Effective chloride migration coefficient [3] [m2/s] DRCM Apparent chloride migration coefficient [1,4] [m2/s] f Frequency [Hz] F Faraday constant [C/mol] h Height of mortar sample [cm] I Current [mA] I0 Initial current during the RCM test [mA] I30 Current measured at U=30 V [mA] If Final current during the RCM test [mA] k Chloride mass transfer coefficient [1/s] Kb Chloride binding capacity [dm3n/gn] L Thickness of specimen [m] mCl Mass of chloride [g] md Mass of dried sample [g] mOH Mass of hydroxyl ions [g] ms Mass of water-saturated sample measured in air [g] mw Mass of water-saturated sample measured in water [g] n Chloride binding intensity parameter –nCl
Moles of chlorides [mol] nOH Moles of hydroxyls [mol] R Universal gas constant [Jmol−1 K−1] t Time [s] or [h] tRCM Duration of the RCM test [s] T Temperature [K] U Voltage [V] x Distance [m] or [mm] xd Chloride penetration depth [m] or [mm] z Ion valence –Greek
α Laboratory constant for the RCM test –φ
Total water-accessible porosity of mortar –Φ
Diameter of cylindrical mortar sample [cm] ρc Apparent density of liquid-saturated mortar [g/dm3] ρd Apparent density of dry mortar [g/dm3] ρs Specific density of mortar [g/dm3] Δm Mass difference of the sample prior to and after the RCMtest
[g]Acknowledgments
The authors wish to express their gratitude to ir. J.J.W. Gulikers(Rijkswaterstaat Centre for Infrastructure, Utrecht, the Netherlands)for his advice and support of this research, to Dipl. -Ing. Ch. Helm(IBAC, RWTH Aachen, Germany) for performing the polarization mea-surements, to Dipl. Eng. M.V.A. Florea (TU Eindhoven) for her helpand to the following sponsors of the Building Materials researchgroup at TU Eindhoven: Rijkswaterstaat Centre for Infrastructure,Graniet-Import Benelux, Kijlstra Betonmortel, Struyk Verwo, Attero,Enci, Provincie Overijssel, Rijkswaterstaat Directie Zeeland, A&GMaasvlakte, BTE, Alvon Bouwsystemen, V.d. Bosch Beton, Selor,Twee “R” Recycling, GMB, Schenk Concrete Consultancy, Intron, Geo-chem Research, Icopal, BN International, APP All Remove, Consensor,Eltomation, Knauf Gips, Hess ACC Systems and Kronos (chronologicalorder of joining).
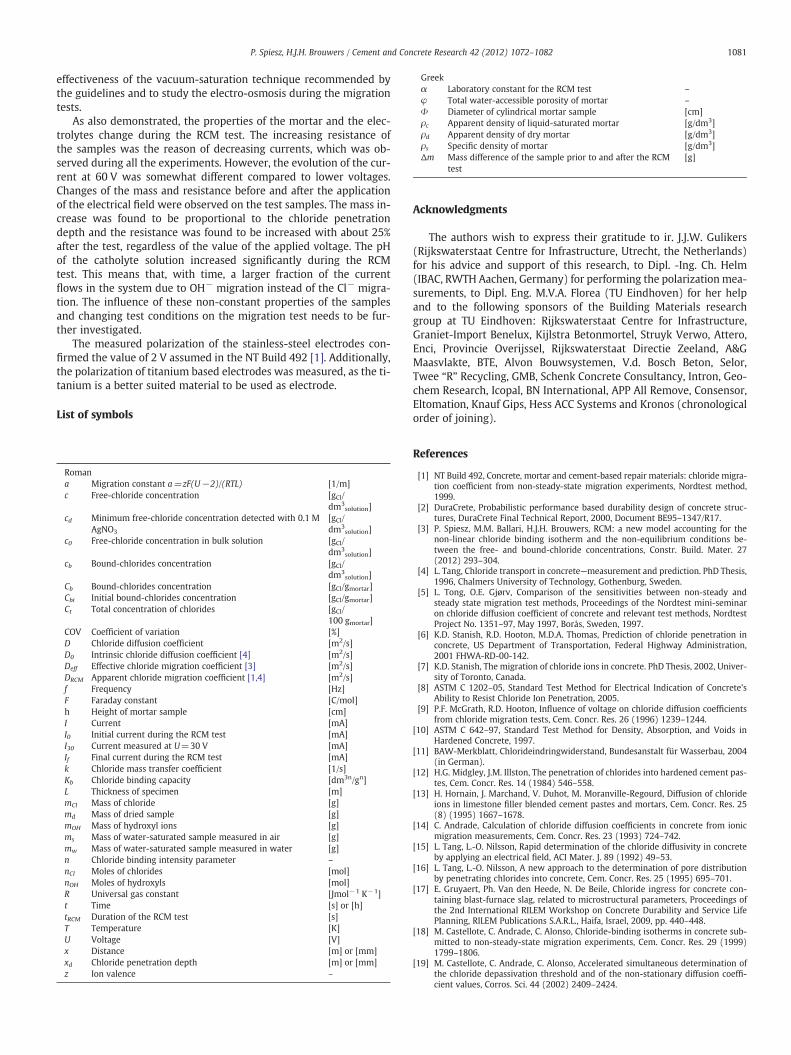
References
[1] NT Build 492, Concrete, mortar and cement-based repair materials: chloride migra-tion coefficient from non-steady-state migration experiments, Nordtest method,1999.
[2] DuraCrete, Probabilistic performance based durability design of concrete struc-tures, DuraCrete Final Technical Report, 2000, Document BE95–1347/R17.
[3] P. Spiesz, M.M. Ballari, H.J.H. Brouwers, RCM: a new model accounting for thenon-linear chloride binding isotherm and the non-equilibrium conditions be-tween the free- and bound-chloride concentrations, Constr. Build. Mater. 27(2012) 293–304.
[4] L. Tang, Chloride transport in concrete—measurement and prediction. PhD Thesis,1996, Chalmers University of Technology, Gothenburg, Sweden.
[5] L. Tong, O.E. Gjørv, Comparison of the sensitivities between non-steady andsteady state migration test methods, Proceedings of the Nordtest mini-seminaron chloride diffusion coefficient of concrete and relevant test methods, NordtestProject No. 1351–97, May 1997, Borås, Sweden, 1997.
[6] K.D. Stanish, R.D. Hooton, M.D.A. Thomas, Prediction of chloride penetration inconcrete, US Department of Transportation, Federal Highway Administration,2001 FHWA-RD-00-142.
[7] K.D. Stanish, The migration of chloride ions in concrete. PhD Thesis, 2002, Univer-sity of Toronto, Canada.
[8] ASTM C 1202–05, Standard Test Method for Electrical Indication of Concrete'sAbility to Resist Chloride Ion Penetration, 2005.
[9] P.F. McGrath, R.D. Hooton, Influence of voltage on chloride diffusion coefficientsfrom chloride migration tests, Cem. Concr. Res. 26 (1996) 1239–1244.
[10] ASTM C 642–97, Standard Test Method for Density, Absorption, and Voids inHardened Concrete, 1997.
[11] BAW-Merkblatt, Chlorideindringwiderstand, Bundesanstalt für Wasserbau, 2004(in German).
[12] H.G. Midgley, J.M. Illston, The penetration of chlorides into hardened cement pas-tes, Cem. Concr. Res. 14 (1984) 546–558.
[13] H. Hornain, J. Marchand, V. Duhot, M. Moranville-Regourd, Diffusion of chlorideions in limestone filler blended cement pastes and mortars, Cem. Concr. Res. 25(8) (1995) 1667–1678.
[14] C. Andrade, Calculation of chloride diffusion coefficients in concrete from ionicmigration measurements, Cem. Concr. Res. 23 (1993) 724–742.
[15] L. Tang, L.-O. Nilsson, Rapid determination of the chloride diffusivity in concreteby applying an electrical field, ACI Mater. J. 89 (1992) 49–53.
[16] L. Tang, L.-O. Nilsson, A new approach to the determination of pore distributionby penetrating chlorides into concrete, Cem. Concr. Res. 25 (1995) 695–701.
[17] E. Gruyaert, Ph. Van den Heede, N. De Beile, Chloride ingress for concrete con-taining blast-furnace slag, related to microstructural parameters, Proceedings ofthe 2nd International RILEM Workshop on Concrete Durability and Service LifePlanning, RILEM Publications S.A.R.L., Haifa, Israel, 2009, pp. 440–448.
[18] M. Castellote, C. Andrade, C. Alonso, Chloride-binding isotherms in concrete sub-mitted to non-steady-state migration experiments, Cem. Concr. Res. 29 (1999)1799–1806.
[19] M. Castellote, C. Andrade, C. Alonso, Accelerated simultaneous determination ofthe chloride depassivation threshold and of the non-stationary diffusion coeffi-cient values, Corros. Sci. 44 (2002) 2409–2424.
1082 P. Spiesz, H.J.H. Brouwers / Cement and Concrete Research 42 (2012) 1072–1082
[20] Q. Yuan, Fundamental studies on test methods for the transport of chloride ionsin cementitious materials. PhD Thesis, 2009, University of Ghent, Belgium.
[21] C.C. Yang, C.T. Chiang, Relation between the chloride migration coefficients ofconcrete from the colourimetric method and the chloride profile method,J. Chin. Inst. Eng. 32 (2009) 801–809.
[22] C. Andrade, M. Castellote, C. Alonso, C. González, Relation between colourimetricchloride penetration depth and charge passed in migration tests of the type ofstandard ASTM C1202-91, Cem. Concr. Res. 29 (1999) 417–421.
[23] P.A. Claisse, H.I. Elsayad, E. Ganjian, Modelling the rapid chloride permeabilitytest, Cem. Concr. Res. 40 (2010) 405–409.
[24] N. Otsuki, S. Nagataki, K. Nakashita, Evaluation of AgNO3 solution spray methodfor measurements of chloride penetration into hardened cementitious matrixmaterials, ACI Mater. J. 89 (6) (1992) 587–592.