Embed Size (px)
Citation preview

CEO INCENTIVE-BASED COMPENSATION AND REIT PERFORMANCE
Magdy C. Noguera† Finance Doctoral Candidate Mississippi State University Michael J. Highfield†† Assistant Professor of Finance Mississippi State University Abstract: We test the effect of incentive-based compensation on REIT performance using the alignment of interest hypothesis. In addition, we build on previous models on total compensation to examine the determinants of incentive-based compensation. Contrary to our expectations, we do not find a positive relation between compensation and subsequent performance. Instead, we find a negative relation between one-year subsequent stock return and incentive based compensation awards. Interestingly, this relation does not persist for the stock returns three year after compensation is awarded and is not found when ROA is the measure of performance. With regard to the determinants of incentive based compensation, we find that CEO ownership, board of director characteristics, and institutional ownership are consistent determinants of the level of incentive based compensation awarded to REIT CEOs. First Draft: August 28, 2005 Current Draft: January 17, 2006
JEL Classification: G12; G14; G24 Keywords: REIT, IPO; Underpricing; Aftermarket; Partial Adjustment
† Magdy C. Noguera is finance doctoral candidate at Mississippi State University. Address: Department of Finance and Economics, College of Business and Industry, Post Office Box 9580, Mississippi State University, Mississippi State, Mississippi, 39762-9580. Office phone: 662.325.1986. Fax: 662.325.1977. Electronic mail: [email protected]. †† Contact Author: Michael J. Highfield, CFA is an Assistant Professor of Finance at Mississippi State University. Address: Department of Finance and Economics, College of Business and Industry, Post Office Box 9580, Mississippi State University, Mississippi State, Mississippi, 39762-9580. Office phone: 662.325.1984. Fax: 662.325.1977. Electronic mail: [email protected]. The authors thank Randy Campbell, Greg Nagel, John Rigsby, Larry White, and seminar participants at Mississippi State University. This paper is derived in part from Ms. Noguera’s finance Ph.D. dissertation at Mississippi State University. Financial support for this project was provided by the Department of Finance and Economics, the Office of Graduate Studies in Business, and the Warren Chair of Real Estate at Mississippi State University. All errors remain the sole property of the authors.
CEO INCENTIVE-BASED COMPENSATION AND REIT PERFORMANCE Abstract We test the effect of incentive-based compensation on REIT performance using the alignment of interest hypothesis. In addition, we build on previous models on total compensation to examine the determinants of incentive-based compensation. Contrary to our expectations, we do not find a positive relation between compensation and subsequent performance. Instead, we find a negative relation between one-year subsequent stock return and incentive based compensation awards. Interestingly, this relation does not persist for the stock returns three year after compensation is awarded and is not found when ROA is the measure of performance. With regard to the determinants of incentive based compensation, we find that CEO ownership, board of director characteristics, and institutional ownership are consistent determinants of the level of incentive based compensation awarded to REIT CEOs.

CEO INCENTIVE-BASED COMPENSATION AND REIT PERFORMANCE
1. INTRODUCTION
Agency problems are ubiquitous in the corporate finance literature and a continuous
concern for corporate America. Thus, compensation contracts for CEOs and corporate managers
are commonly designed to encourage these agents to act in the best interests of shareholders.
Interestingly, there is empirical evidence that compensation practices vary across industries. For
example, Ittner, Lambert, and Lacker (2003) document that the use of stock options and
restricted stock in high-tech, new-economy firms substantially exceeds the equity compensation
in large, old-economy manufacturing firms. In another example, Murphy (2003) documents that
the use of managerial stock options is extremely common, but options are used less frequently in
the highly regulated utility industry.
The REIT industry is also highly regulated. In order to maintain their federal tax-exempt
status, REITs must meet several conditions. First, they must distribute 90 percent of their taxable
income as dividends. Second, qualified REITs must have at least 100 shareholders while
adhering to the five or fewer rule, a prohibition against five or fewer shareholders owning 50
percent or more of the shares. Third, they must have at least 75 percent of their assets invested in
real estate oriented investments, cash and/or government securities. Finally, they must generate
at least 75 percent of their income from rent, mortgages, and the sale of property. With this in
mind, REITs should provide an interesting laboratory to investigate performance-based
managerial compensation given the fact that they are highly regulated financial firms yet pay
substantial incentive-based compensation. Incentive-based compensation, for the purpose of this
study, is long-term compensation including stock options, restricted stock, and long-term
incentive plan awards. It is different than equity based compensation in that incentive-based

REIT Incentive-Based Compensation 2
compensation includes long term incentive plans whose payoff is not necessarily equity. For
instance, long term incentive plans (LTIPs) include specific compensation once set performance
goals are attained for a period longer than one fiscal year from the date of the award. The
performance measure can be in terms of accounting ratios, the firm’s stock price, or any other
measure and the actual payoff can be in cash, equity, or a combination thereof.
In this work, we contribute to the literature by addressing two previously unexplored
topics in the REIT managerial compensation research. First, we determine the relation between
incentive-based compensation and subsequent performance. The alignment of interest hypothesis
states that managerial remuneration is a device to align the interests of shareholders and thus,
suggests a positive relation between compensation and subsequent performance. By using a one-
way fixed effect regression in an unbalanced panel sample for the period 1999-2003, we test the
impact of incentive based compensation awarded at time t in subsequent performance (t+1 and
t+3) as measured by REIT ROA and stock returns.
Second, while the determinants of total and cash compensation have been directly
examined in the context of REITs, the literature has yet specifically examined the determinants
of incentive-based compensation. Given the strict nature of the regulatory requirements for firms
that elect REIT status, it is reasonable to assume that these regulations affect REIT corporate
governance mechanisms and thus affect the need for or lack of need for incentive-based
compensation. For example, Campbell, Ghosh, and Sirmans (2001) attribute the lack of hostile
takeovers among REITs to their regulatory environment. They argue that the disperse ownership
for REITs, resulting from the five or fewer rule, diminishes the effectiveness of monitoring by
the market for corporate control and makes board and other monitoring mechanisms more

REIT Incentive-Based Compensation 3
critical. On the other hand, if regulations limit managerial discretion over corporate decision
making, corporate governance is likely to be less critical.
Using Ghosh and Sirmans (2005) as a guide, we examine the determinants of incentive-
based compensation in light of the structure of the board of directors, CEO ownership, the level
of debt contracting, institutional holdings and other factors such as firm’s size, investment
opportunities, prior year performance, and other economic determinants. However, we refine
Ghosh and Sirmans (2005) study by examining the effect of institutional ownership rather than
that of blockholder ownership. Although blockholders may be effective monitors of
management, generally by exerting hostile takeovers (Gorton and Kahl, 1999), blockholders are
limited in the REIT industry because of the five or fewer rule. In contrast, institutional
shareholders are not subject to the same rule, are permanent blockholders, and thus can provide
some monitoring of management. To address endogeneity concerns, we employ a two-stage least
squares procedure in an unbalanced panel sample for the period 1999-2003, where
compensation, performance and CEO ownership are treated as endogenous variables and all
other control and explanatory variables are exogenous variables.
To summarize our findings, contrary to our expectations, we do not find a positive
relation between compensation and subsequent performance. Instead, we find a negative relation
between one-year subsequent stock return and incentive based compensation awarded at time t.
Interestingly, such relation does not persist for the case stock returns three year after
compensation is awarded and is not found when ROA is the measure of performance The partial
result for the case of stock returns is consistent with the findings of Pennathur, Gilley, and Shelor
(2005) in the relation between change in stock returns and stock option awards but inconsistent
with agency theory and other findings (Ryan and Wiggins(2000); Scott, Anderson, and Loviscek

REIT Incentive-Based Compensation 4
(2001)). As far as the determinants of incentive based compensation, we find that CEO
ownership, whether the CEO chairs the board or not, board size, and institutional ownership are
consistent determinants of the level of incentive based compensation awarded to REITs CEOs. In
addition, we find that residential, industrial, mixed, and health care REITs pay more incentive-
based compensation to their CEOs than self-storage REITs.
Sections 2 and 3 investigate the current research in the area of REIT executive
compensation. In Section 2 we examine the major theories explaining the relation between
managerial compensation and firm performance, and we will also discuss the empirical evidence
supporting or rejecting these theories. Next, in Section 3 we present the theories surrounding the
determinants of executive compensation, the empirical evidence on these theories as presented
the corporate finance and REIT literature and our testable hypotheses. Section 4 presents our
data, provides details on our empirical models, and summarizes our hypotheses in the context of
our empirical tests. Section 5 presents our results on the relation between incentive-based
compensation and REIT performance, and Section 6 presents our results for the determinants of
cash and incentive-based compensation. Lastly, Section 7 concludes the dissertation.
2. COMPENSATION AND FIRM PERFORMANCE
As originally described by Jensen and Meckling (1976), the traditional principal-agent
problem found in the agency theory literature is based on the situation where a CEO has
incentives and goals that are in direct conflict with the best interests of shareholders.
Compensation schemes are one of several mechanisms employed to alleviate such situations.
Agency theory states that when managerial actions are unobservable, optimal incentive contracts
are needed to link the manager’s wealth to firm value in order to induce managers to behave in

REIT Incentive-Based Compensation 5
the best interest of shareholders. However, empirical evidence shows that not all forms of
compensation provide effective alignment incentives.
Studying the pay-performance sensitivity of CEO wealth, Jensen and Murphy (1990) and
Hall and Liebman (1998) demonstrate that cash compensation is a poor alignment mechanism.
First, Jensen and Murphy (1990) examine the 1974–1988 period and find a median change in
CEO wealth of $2.59 per $1,000 change in shareholder wealth, or approximately 0.26 percent.
Using a more recent sample period of 1980–1994, Hall and Liebman (1998) find that cash
compensation sensitivity to performance is 0.22. Thus, they show that CEO cash compensation,
defined as annual salary plus cash bonus, and firm performance are somewhat dissociated. They
conclude that cash compensation does not provide alignment incentive for managers to act in the
best interest of shareholders.
In contrast to the results for cash compensation, researchers have found a stronger link
between performance and stock-based compensation. Hall (1998), Lewellen, Loderer, and
Martin (1987), and Core, Guay, and Lacker (2003), suggest that equity-based compensation
vehicles are more appropriate to provide alignment incentive to CEOs. Hall and Liebman (1998)
find that CEO ownership and stock options create a strong link between firm performance and
changes in CEO wealth. The reasons are simple. Cash compensation is paid regardless of firm
performance. If shareholders want performance, they must tie CEO compensation directly to
performance, typically, stock performance. This also seems to be understood outside of academic
circles. In fact, Hall and Liebman (1998) find that stock options constitute an important fraction
of total compensation in their sample. For instance, the mean value of stock options granted was
about 25 percent of the total direct compensation during the period 1982–1984, but it increased
to approximately 50 percent of total direct compensation a decade later, 1992–1994.

REIT Incentive-Based Compensation 6
Additional evidence for a relation between incentive-based compensation and
performance is provided by Mehran (1995) who examines the relation between CEO equity-
based compensation, stock ownership, and firm performance. He finds that performance is
positively related to both equity-based compensation and insider ownership. More recently,
Stammerjohan (2004) examines the relation between different forms of compensation and
subsequent (1, 3, and 5-year) stock returns. He concludes that stock options provide CEO with
incentives for maximizing firm value while annual bonuses, which are short term reward
compensation, do not. In short, from Mehran (1995), Jensen and Murphy (1990) Hall and
Liebman (1998), and Stammerjohan (2004) we conclude that it is how CEOs are paid, not how
much they are paid, that matters.
Nonetheless, continuous research in this subject is needed for two important reasons.
First, boards can choose incentive remuneration vehicles other than equity-based compensation
vehicles. For instance, long-term performance plans can be distributed in cash, equity, or any
combination thereof. In these cases, it is important to assess the efficiency of these alternative
forms of incentive compensation. Second, compensation practices change across time. For
example, stock options have been extremely popular over the last two decades due to their
favorable accounting treatment. However, this artificial bias in favor of stock options is likely to
disappear with the mandatory expensing of stock options that became effective in January 2006.
In fact, as noted by Thatcher (2005), other forms of incentive-based compensation like restricted
stocks have already become increasingly popular in REIT and non-REIT CEO compensation
contracts. In summary, as new compensation schemes are developed and put into practice, their
effectiveness needs to be assessed. This is typically done through assessing their impact on
performance.

REIT Incentive-Based Compensation 7
Another relevant consideration regarding the usage of incentive compensation as an
alignment mechanism is the increasingly growing critique of equity-based compensation
vehicles. First, as noted by Stammerjohan (2004), equity-based compensation appears to
encourage short-term rather than long-term performance, a non-maximizing shareholder wealth
practice. Second, researchers have argued that the design of executive compensation creates its
own agency costs.
Bebchuk and Fried (2003) state that, due to the dispersed ownership of publicly traded
companies, managers do have influence over their own pay arrangements and use that power to
favor weak and even perverse incentives. Jensen (2005) mentions that the usage of equity-based
compensation has exacerbated the agency costs of overvalued equity, a value destruction
practice. Efendi, Srivastava, and Swanson (2004) provide some empirical support to these
hypotheses. In contrast, Thatcher (2005) provides a less radical explanation for the existence of
less than perfect incentive compensation schemes. She suggests that companies may have been
historically unable to use better performance incentives simply because their accounting
treatment under Accounting Principles Board opinion number twenty five (APB 25) and the
challenge of designing meaningful and understandable performance objectives for the awards.
Given that firms will potentially switch among incentive vehicles in response to specific
performance goals or changes in rules and regulations, we concentrate on incentive-based
compensation rather than strictly equity-based compensation. Equity based compensation studies
focus solely on stock options, restricted stock, or a combination thereof. Following Kole (1997)

REIT Incentive-Based Compensation 8
we concentrate on incentive-based compensation which is long-term compensation including
restricted stock, stock options, and long-term incentive plan awards1.
Both equity based compensation and LTIPs designed as an alignment mechanism under
the agency theory framework have been widely studied for non-REITs, but the determinants of
incentive-based compensation for REIT CEOs and its effect on REIT performance remain a
timely empirical question. Therefore, in this work, we examine the relation between incentive-
based compensation and REIT performance. In an agency theory framework, compensation
should be structured to serve as an incentive for managers to act on the best interest of
shareholders. Thus, we hypothesize that
H1: Incentive-based compensation impacts positively REIT subsequent performance. If incentive-based compensation shows a positive relation to subsequent performance,
this result would be consistent with the alignment of interest hypothesis. On the other hand, a
negative relation or evidence of no relation between these two variables would make not clear
why REIT CEOs are paid incentive based compensation. It could be that due to the highly
regulated nature of the REIT industry, other monitoring and alignment mechanisms into place,
substitute for incentive-based compensation and thus, incentive-based compensation is not
needed.
..2.1. The Evidence for REITs
Managerial compensation has been examined in the context of REITs to some extent. For
example, Cannon and Vogt (1995) find a positive relation between cash salary and annual REIT
stock returns. However, Alshimmiri (2004) finds a weak negative relation between cash
compensation and firm performance as measured by Tobin’s Q. More recently, Ghosh and
1 Long term incentive plans (LTIPs) include specific compensation which is paid once set performance goals occur for a period longer than one fiscal year from the date of the award. The performance measure can be in terms of accounting ratios, the firm’s stock price, or any other measure.

REIT Incentive-Based Compensation 9
Sirmans (2005) find that total and cash compensation are positively related to contemporaneous
performance as measured by ROA and ROE. However, these studies do not focus on incentive
based compensation.
The most similar research to date is the Scott, Anderson, and Loviscek’s (2001)
investigation of the link between performance compensation, defined as total compensation
minus cash compensation, and REIT market performance. He finds a positive relation between
current performance compensation and previous year REIT stock returns which implies that
REIT market performance is even a more important explanatory variable of performance-based
compensation than prior research suggested. However, Scott, Anderson, and Loviscek (2001)
research has limited relevance since the sample does not include the value of stock options, an
important component of incentive-based compensation. In fact, the 2003 SNL Financial Review
reports that “for REITs, options constituted a slightly declining portion of total compensation in
2002, at 21.4% of total option adjusted compensation, versus 22.7% in 2001 and 23.8% in 2000.
Restricted stock, however, rose in importance, from 13.1% of total option-adjusted compensation
in 1999 to 23.1% in 2002.” 2 Although this decline is most likely due to the switch to restrictive
stock documented by Thatcher (2003), it seems troublesome to investigate performance-based
compensation while leaving out approximately 23.1 percent of the incentive-based
compensation. We seek to fill this gap in the literature by examining all forms of long term
incentive based compensation in this work. However, we acknowledge the following limitation
in our study. As noted by Stammerjohan (2004), an aggregate incentive-based compensation
measure is imperfect since not all compensation arrangements provide the same incentives. For
example, Thatcher (2005) affirms that stock options and restricted stock provide two very
2 The Executive Compensation Review in the 2003 edition of SNL Real Estate Securities Weekly, available at http://www.snl.com/real_estate/archive/20030721.asp, page 1

REIT Incentive-Based Compensation 10
different incentives to the CEO. Restricted stock, as a full-value award, does not provide as much
leverage or as strong an incentive for performance as do stock options or SARs because the
restricted stock continues to have value even if the stock price decreases over the vesting period.
A grantee benefits if the value increases, but they do not suffer a complete loss if the stock price
declines. Bryan and Hwang (2000) conclude that restricted stock is relatively inefficient in
inducing risk averse CEOs to accept risky, value-increasing investment projects due to its linear
payoffs. However, as noted by Thatcher (2005), restricted stock has a stronger retention power
than options or SARs. The separate analysis of each form of incentive-based compensation
constitutes material for future research.
3. THE DETERMINANTS OF COMPENSATION
Much of the existing empirical work in CEO compensation concentrates on how various
characteristics of the firms are associated with different compensation schemes. In general,
economic determinants as well as monitoring and alignment mechanisms have been found to
affect the value maximizing structure of CEO compensation.
3.1. Economic Determinants
Economic determinants which can have impact on CEOs’ compensation include firm
characteristics such as size, investment opportunities, risk (total or idiosyncratic), prior or current
year performance, and leverage. For the case of REITs, we argue that their property focus can
also have an impact on CEOs compensation. In the following subsections we will discuss a
variety of economic determinants of managerial compensation as presented in the previous
literature.

REIT Incentive-Based Compensation 11
3.1.1. Firm size
Firm size typically proxies for the complexity of firms’ operations; therefore, larger firms
may be more difficult to monitor and therefore firm size may positively impact the use of
incentive-based compensation. However, empirical evidence on the relation between
compensation and size is mixed. For non-REITs, Mehran (1995) finds no relation between
equity-based compensation and firm’s size while Ryan and Wiggins (2000), Core, Holthausen,
and Larcker (1999), and Stammerjohan (2004) find a positive relation between size and a given
type of compensation.
For REITs, Hardin (1998) finds a positive relation between cash compensation and size.
In addition, Scott, Anderson, and Loviscek (2001) find a positive relation between performance
compensation and firm size. However, they find size unrelated to total compensation. Pennathur,
Gilley, and Shelor (2005) find a negative relation between size and stock option awards but they
find no relation between size and the stock option awards mix (ratio of stock options awarded to
total CEO’s compensation).
3.1.2 Investment opportunities
Smith and Watts (1992) suggest that manager actions are less observable if the firm has
more investment opportunities. As information asymmetries grow, it becomes more difficult for
shareholders to observe managerial behavior and growth opportunities. As suggested by Ryan
and Wiggins (2000), firms with high growth opportunities get more of their value from future
cash flows. Thus, it is rational to find that firms with high investment opportunities use more
incentive-based compensation to reward their CEOs. Consistent with this hypothesis, Mehran
(1995), Ryan and Wiggins (2000), Core Holthausen, and Larcker (1999) and Bryan and Hwang
(2000) find a positive relation between investment opportunities and different forms of CEOs

REIT Incentive-Based Compensation 12
compensation for non-REITs. In contrast, Yermack (1995) finds no significant relation between
stock option awards and investment opportunities.
For REITs, the evidence is truly mixed. For example, Ghosh and Sirmans (2005) find a
negative relation between investment opportunities and total compensation. Pennathur, Gilley,
and Shelor (2005) find a positive relation to stock option awards, and Delcoure (2005) finds no
link between REITs market-to-book ration and long-term compensation.
Typically, expenditures on research and development and the market-to-book ratio are
commonly used as proxies for investment or growth opportunities in non-REITs. Only Delcoure
(2005) employs the market-to-book ratio as proxy for growth opportunities for REITs. In
contrast, Ghosh and Sirmans (2005) and Pennathur, Gilley, and Shelor (2005) employ as
measures of growth opportunities the ratio of Real Estate Investment to total assets and changes
in Real Estate Investment respectively, because a market-to-book ratio for a REIT can be
interpreted as the ratio between the current market value of real estate holdings and their book
value, a simple historical value appreciation measure.
3.1.3. Firm Performance
Previous or current year performances has traditionally been tied to CEO compensation
because the board of directors commonly uses past accounting and market performance measures
as a guide in evaluating CEO performance at the time of setting the CEO’s annual compensation
contracts. Thus, in an agency framework, it is reasonable to assume that incentive-based
compensation must be an increasing function of firm performance in order to serve as both an
incentive and alignment mechanism to hire and retain the best CEOs. Empirical evidence almost
conclusively supports such a hypothesis. For non-REITs, Yermack (1995) Core Holthausen, and
Larcker (1999), and Stammerjohan (2004) find a positive relation between previous performance

REIT Incentive-Based Compensation 13
and different forms of compensation. For REITs, Ghosh and Sirmans (2005) find that both ROA
and stock returns are positively related to total compensation in the next period. In contrast,
Scott, Anderson, and Loviscek (2001) find such a relation only for performance compensation,
but they find no such relation between total compensation and past performance. Finally,
Pennathur, Gilley, and Shelor (2005) find that options awards and the option awards mix, the
ratio of option awards to cash compensation, are negatively related to stock returns. They explain
that this may be due to the fact that their sample period is a recessionary period for REITs and
options may be awarded in such circumstances to incentive managers to enhance REIT
performance. In summary, performance measures, whether they are accounting or market
measures, in most cases seem to positively impact compensation.
3.1.4. Risk
As firms bear more business (or total) risk, their cash flows become more uncertain and it
becomes more difficult to monitor CEOs. In addition, Bryan and Hwang (2000) argue that under
uncertainty, managers have the incentive to undertake a safer project over a risky one due to the
fact that they bear the total risk of their investment choice while shareholders do not. To control
both situations, firms may rely on incentive-based compensation.
Yermack (1995) and Bryan and Hwang (2000) find a positive relation between use of
stock options or restricted stocks awards and noise in accounting earnings. Core Holthausen, and
Larcker (1999) use two measures of firm risk and find exactly opposite results. Using the
standard deviation of ROA as a proxy for firm risk, they find a negative relation between firm
risk and total and cash compensation but no relation to salary. Using the standard deviation of
stock returns, they find no relation between firm risk and total and cash compensation and a
negative relation for salary. Similarly, Ryan and Wiggins (2000) find no significant relation

REIT Incentive-Based Compensation 14
between equity-based compensation and noise in accounting earnings, and Mehran (1995) finds
no significant relation between business risk and equity-based compensation.
For REITs, Pennathur, Gilley, and Shelor (2005) find a positive relation between the
standard deviation of monthly returns and both stock options awards and stock options mix.
Likewise, Delcoure (2005) finds a positive relation between funds from operations (FFO)
volatility and long-term compensation.
3.1.5. Leverage
Following the logic given in Smith and Watts (1992), if incentive-based compensation is
instituted to align the interests of managers and shareholders at the expense of debtholders,
heavily leveraged firms should decrease such compensation since their agency costs of debt are
exacerbated for firms in such circumstances. However, Mehran (1995), Yermack (1995), and
Stammerjohan (2004) find leverage is unrelated to compensation. In contrast, Ryan and Wiggins
(2000) finds a positive relation between debt and compensation, but Bryan and Hwang (2000)
find the opposite. With regard to REITs, Ghosh and Sirmans (2005) include a proxy for leverage
in their analysis and find a non-significant relation, and Delcoure (2005) finds no relation
between short-or long-term debt and any type of compensation.
In short, with the exception of the positive relation between prior year (or current)
performance and all forms of compensation, the empirical evidence is mixed for all the other
factors. The main reason for such heterogeneous results could be that compensation schemes, as
well as the focus of academic research, have varied across time. That is, before equity-based
compensation became popular in the early 1990s compensation studies concentrated on the level
REIT Incentive-Based Compensation 15
of compensation.3 Currently, the structure of compensation is dominated by equity-based
incentives.
3.1.6. Property focus
The property type variables are included as control variables for variations in the level of
transparency in corporate governance for REITs. The SNL Financial database classifies REITs
as “self-storage”, “shopping center”, “regional mall”, “retail:other”, “multy-family”,
“manufactured homes”, “office”, “industrial”, “specialty”, “diversified”, “hotel”, and “health
care”. We create binary variables as follows: RETAIL is equal to 1 for REITs with focus on
shopping center, regional mall, or retail:other; zero otherwise; RESIDENTIAL is equal to 1 if the
REIT focuses on multi-family or manufactured homes, zero otherwise; MIXED is equal to 1 if
the REIT focuses on specialty or diversified; zero otherwise; and HOTEL, OFFICE,
INDUSTRIAL, and HEALTHCARE are equal to one for REITs with focus on hotels, offices,
industries, and health care respectively. The reference focus is self-storage following Scott,
Anderson, and Loviscek (2001). Besides, in a rough ranking from least to most transparent
REITs4, self-storage is considered to have an average ranking on transparency.
3.2. Governance Structure and Compensation
In addition to the economic determinants discussed above, corporate governance
practices have also been found to influence compensation. Board composition, CEO ownership,
and debt monitoring are common devices used to alleviate agency problems; however, empirical
findings are mixed as to what extent and effect these monitoring and alignment mechanisms are
associated with compensation practices.
3 Even though some of the studies included all forms of monetary compensation in their measures, cash compensation was actually a predominant portion of total compensation in those studies. 4 From the least to the most transparent REITs: multi-family, industrial, retail, self-storage, health care, office, and hotel REITs.

REIT Incentive-Based Compensation 16
3.2.1 CEO Ownership
In the context of agency theory, a one-to-one relation between firm value and CEO
ownership seems like novel concept; however, as noted by Hall and Liebman (1998), this idea
overlooks two practical considerations. On one hand, it is impossible and impractical for
managers to have significant ownership in the companies they manage because this would
require an enormous amount of CEO wealth and it would force CEOs to ignore the fundamental
principle of diversification. Moreover, excessive CEO ownership has a perverse effect on
manager’s attitude towards risk. If managers are risk averse, excessive CEO ownership distorts
the original incentive since their personal wealth would be substantially and directly tied to
company performance, thus, they will avoid risky projects in order to protect their private
wealth. Stammerjohan (2004) studies this hypothesis and finds that as CEO ownership increases,
only contemporaneous performance increases. This evidence suggests that non-diversified CEOs
may make overly conservative decisions in response to risk aversion in attempts to protect
current personal wealth. Thus, large personal stock ownership does not provide the automatic
“alignment of interest” so widely assumed in the executive compensation literature. Given that
Hall and Liebman (1998) suggest a small percentage of CEO ownership, absent other effective
monitoring mechanisms, will not be sufficient to induce value-maximizing decisions, then we
can deduce that CEO ownership is an important determinant of compensation, but only in an
optimal quantity.
It is expected that a CEO with optimal amount of ownership in his company would
behave more as a shareholder and would make managerial decisions to enhance shareholders
wealth. In setting compensation schemes, CEOs with share ownership would still agree to be
paid incentive-based compensation but at a reasonable level. Therefore, I hypothesize that:

REIT Incentive-Based Compensation 17
H2: CEO Ownership is inversely related to incentive based compensation
Unfortunately, the relation between CEO ownership and compensation is still not clear.
Mehran (1995), Core, Holthausen, and Larcker (1999), and Bryan and Hwang (2000) find a
negative and significant relation between CEO ownership and different forms of compensation.
However, Yermack (1995) and Kole (1997) do not find any relation between CEO ownership
and different forms of compensation.
To make matters more difficult, the empirical evidence for REITs is scarce and even
more confusing. Hardin (1998) finds a positive relation between cash compensation and CEO
ownership, but Ghosh and Sirmans (2005) find a negative and significant relation between CEO
ownership and total, cash, and salary compensation. Their results are consistent with the
hypothesis that as CEOs have more ownership interest in the firm they will favor fair executive
compensation packages and will try to keep incentive compensation at a reasonable level. This
way, they will avoid excessive exposure of their personal wealth to the risks of the firms.
3.2.2 Structure of the Board of Directors
The board of directors is the main internal mechanism of corporate governance in place at
any corporation. Since the board of directors monitors managers and makes executive
compensation decisions, it is typical to included board features in compensation models.
Specifically, the most common are the size of the board, the composition of the board, director
characteristics, and the influence of the CEO on the board.
The size and composition of the board may provide evidence of board effectiveness and
independency. Feng, Ghosh, and Sirmans (2005) argue that small boards and boards with a large
number of outside directors, compared to large boards or those with many inside directors, may
be more efficient and act more independently on behalf of shareholders. In fact, they find that

REIT Incentive-Based Compensation 18
REITs with small boards outperform those with large boards in terms of five year average ROA
and market to book ratio. However, they find no evidence that boards with more outside
directors leads to better financial performance. They provide as possible explanation that
independent, small boards tend to have more outside directors but more of these directors joined
the board after the current CEO was appointed; hence, the independence of outside directors
could be compromised due to CEO involvement in their appointments.
To the point that small boards are more efficient, agreements on the level and type of
compensation arrangements for REIT CEOs can be expected to be better than in the case of large
boards. As board size increases, it is reasonable to think that becomes more difficult to
coordinate board actions. Therefore, I hypothesize that
H3: There is a positive relation between board size and incentive-based compensation Undesirable director traits are also important. For example, directors who are older than
69, who are paid by the company in excess of his board pay, or who perform functions on
different boards at the same time might be unable to fulfill their obligations properly. Directors
who are interlocked, where an officer of the firm serves on the board of that outside director’s
company, might also have a conflict of interest.
Finally, the influence of CEOs on boards is usually measured in the form of number of
directors appointed by the CEO and whether the CEO is chairman of the board. A CEO that
chairs the board and has the power to name directors is assumed to have more control on board
decisions, for his own benefit, than in the case where a CEO neither chairs the board nor
appoints directors. Therefore, I hypothesize that
H4: There is a positive relation between the CEO leading the board and incentive-based compensation
REIT Incentive-Based Compensation 19
Core, Holthausen, and Larcker (1999), find that less independent boards, with
undesirable director traits, and under the influence of CEOs tend to award higher levels of
compensation to their CEOs. In a similar vein, Ghosh and Sirmans (2005), in their study of the
relation between board structure and compensation for REITs, find a positive relation between
board size (inefficient boards) and total compensation. Moreover, they also observe a positive
relation between CEOs chairing the board and total compensation when performance is
measured by stock return. Finally, Ryan and Wiggins (2000) find that the number of outside
directors is positively related to equity-based compensation. This can be explained by the
common belief among directors that awarding equity-based compensation is the only effective
alignment measure.
3.2.3. Debt Monitoring
As summarized by Bathala, Moon, and Rao (1994), significant use of debt financing may
result in a substantial increase of bankruptcy risk and also increase other agency problems such
as asset substitution and underinvestment. However, Myers (1977) suggests that debt can also be
used to alleviate such agency problems. The need to pay interest and principal periodically
reduces the control that managers have over the firm’s cash flows. In addition, it subjects
managers to monitoring by debtholders or other capital market agents such as credit-rating
companies like Standard and Poor’s or Moody’s Investor Services. REITs provide an
opportunity to test for the monitoring benefits of debt rather than for controlling for agency cost
of debt.
First, REITs invest in tangible assets which, in accordance to capital structure theory,
make them less sensitive to bankruptcy risk compared with other firms. Second, despite the logic
that REITs may rely on debt as a source of financing due to their requirement to pay out 90

REIT Incentive-Based Compensation 20
percent of their taxable income every year, REITs should prefer equity financing over debt
financing. After all, REITs do not obtain a tax shelter for the use of debt, and if they issue debt
they must compete with other firms who enjoy tax savings by paying a competitive interest rate.
Accordingly, for the period 1991-1996, Ghosh, Nag, and Sirmans (1997) report that REITs rely
more on equity than debt to finance new projects. Third, Smith and Watts (1992) state that
regulated firms are expected to have higher leverage and pay out higher dividends. In
consequence, to fund investment opportunities, regulated firms will depend on capital markets
and will be subject to monitoring by capital market agents. Fourth, Highfield, Roskelley, and
Zhao (2006) study agency costs of debt for REITs, rooted in Myers (1977) theory, by examining
the maturity of REITs debt issues and the matching of their debt maturity to asset maturity. They
find that REITs with relatively high market-to-book ratios tend to issue short term debt but they
find no evidence that REITs match debt maturity to asset maturity. Their results provide at least
partial empirical evidence that REITs, by shortening the maturity of their debt issues, reduce
their agency costs of debt. For all the mentioned reasons, I hypothesized that
H5: Debt monitoring substitute for incentive-based compensation; that is, debt is negatively related to incentive-based compensation
In compensation studies for non-REITs, leverage is typically a control variable for
agency costs of debt. Mehran (1995), Yermack (1995), and Stammerjohan (2004) find leverage
is unrelated to compensation. In contrast, Ryan and Wiggins (2000) finds a positive relation
between debt and compensation, but Bryan and Hwang (2000) find the opposite. In the case of
REITs, Delcoure (2005) controls for the debt-equity agency conflict and finds no relation
between short- or long-term debt and any kind of compensation. Ghosh and Sirmans (2005)
include leverage in their regression analysis; also finding it unrelated to compensation.

REIT Incentive-Based Compensation 21
3.2.4 Institutional Ownership
In general, no distinction is made in compensation studies between a blockholder and an
institutional shareholder. With the exception of Ryan and Wiggins (2000) who find a positive
relation between institutional shareholders and equity-based compensation and Delcoure (2005),
who finds a negative relation between institutional shareholders and long-term compensation,
most researchers concentrate on investigating the relation between blockholders and
compensation. Since blockholders can be any external holder of a significant portion of
outstanding shares (individual investor, corporations, or institutional investors) but we believe
that institutional shareholders have legal and ethical requirements that exceed those of single
blockholders. In addition, as noted by Bathala, Moon, and Rao (1994), institutional investors
often undertake a protagonist role on corporate governance activities due not only to their
significant growing participation in the ownership of outstanding equity, but also to their
inability to follow an “exit policy” in their portfolio strategies. Exit policy refers to the deliberate
unloading of a block of shares by institutional shareholders as a pressure mechanism against the
managers of the firm when the institutional shareholder disagrees with their actions or strategies
for the future. Furthermore, institutional shareholders are not subject to the five or fewer rule for
REITs, are permanent blockholders, and thus are able to provide monitoring of management
which blockholders cannot. Therefore, we seek to exclusively assess the monitoring capability of
institutional shareholders in this work and hypothesize that
H6: Institutional holdings are negatively related to incentive-based compensation
For the purpose of this study, and following Bathala, Moon, and Rao (1994), institutional
holdings are assumed to be exogenously determined since managers do not have direct control
on the level of institutional ownership of equity in the firm.

REIT Incentive-Based Compensation 22
3.3. The Interrelation between Monitoring and Alignment Mechanisms
The relation between board structure, firm performance and CEO compensation has been
widely explored; however, most studies analyze performance or compensation including one
monitoring mechanism at a time. Thus, by isolating them from the effect of others monitoring
instruments, we cannot observe which mechanisms are dominant.5
For example, in addition to incentive-based compensation, corporate governance relies on
other alignment and monitoring mechanisms to control managerial actions. Bathala, Moon and
Rao (1994) and Hall and Liebman (1998) suggest that the existence of other internal and external
monitoring mechanisms determine the extent to which debt, managerial ownership, and other
devices are utilized to minimize agency conflicts. In fact, Delcoure (2005) Lippert and Moore
(1995), and Core, Holthausen, and Larcker (1999) have acknowledged their interrelationships
and tested whether they are complements or substitutes.
Based on Core, Holthausen, and Larcker (1999), Ghosh and Sirmans (2005) analyze the
effects of board structure on cash compensation and total compensation for REITs. Since
economic theory suggests that ownership, board structure, and performance are often
endogenously determined, they perform a two-stage least squares procedure to account for the
perceived endogeneity problem. In addition, to be able to estimate their simultaneous equation
model, they treat all board of directors variables as exogenous variables. In order to examine the
determinants of CEO incentive based compensation for REITs, we employ the two-stage least
squares procedure as well. Following their methods, we also treat all board features as exogenous
variables.
5 See Feng, Ghosh, and Sirmans (2005) and Ghosh and Sirmans (2003) on the relation between board structure and performance, Chan, Leung and Wang (1998) on institutional investment and performance, and Han (2004) on insider ownership and REITs value.

REIT Incentive-Based Compensation 23
3.4. The Evidence for REITs
In contrast to the large amount of research conducted on CEO compensation for typical
corporate firms, and despite the growing usage of different incentive compensation vehicles in
CEOs compensation contracts, the topic of incentive based compensation has yet to be fully
examined in the context of Real Estate Investment Trusts. There are many reasons for this void
in the real estate literature. Most notably, limitations on data availability may have led most
previous REIT studies to focus on cash and total compensation rather than incentive-based
compensation, or even equity-based, compensation.6
As far as stock-based compensation is concerned, Pennathur, Gilley, and Shelor (2005)
examine the determinants of option awards. They find a negative relation between changes in
stock returns and option awards, and they also find a negative relation between stock returns and
the options award mix, or ratio of awarded stock options to cash compensation. They suggest
that such findings may be due to the fact that their sample covers the period 1997-2000 and
during years 1998 and 1999 REITs experienced negative returns, most likely due to investor
preference for high tech companies stocks at the time. Therefore, to the extent that their findings
may be driven by the market conditions of that time, their results may not be robust.
Our research should supplement their results by analyzing the determinants of incentive-
based compensation independently of market conditions. For this purpose, the determinants of
incentive compensation will be analyzed for the time spanning from January 1, 1999 through
6 Ghosh and Sirmans (2005) work on the effect of board structure on CEO compensation and find that CEO compensation is higher when board of directors are not independent and are subject to CEO’s influence. Hardin (1998) works on the determinants of cash compensation and finds that REITs size, type, and the number of years since IPOs took place, are all positively related to cash compensation while the dividend cash flow to senior executive is negatively related. Chopin et al (1995) analyze the relation between CEO’s total compensation and sales and profits (as performance measures) and find a positive relation between sales and compensation but little impact of profits on compensation.

REIT Incentive-Based Compensation 24
December 31, 2004. As indicated by the NAREIT index level this period is indicative of a
complete market cycle for REITs.7
One other paper on REIT executive compensation deserves special attention. Delcoure
(2005) analyzes executive compensation in terms of salary, bonus, and long-term compensation
for 32 REITs between 1999 and 2001. She finds a positive relation between long-term
compensation and CEO stock ownership and volatility of funds from operations (FFO). Also, she
finds a negative relation between long-term compensation and institutional ownership. Her
results support both the “passing-the-baton” hypothesis and the “substitute” hypothesis. The
“passing-the-baton” hypothesis states that boards under the influence of CEOs award larger
compensation whereas the “substitute” hypothesis states that monitoring by boards, in the
presence of other monitoring mechanisms, makes incentive compensation less needed and thus,
lower. Although very similar to our study in that Delcoure’s (2005) analyzes the determinants of
the different forms of REIT CEO compensation, her study has several issues which we will
attempt to address.
First, her long-term compensation measure does not include the value of stock options
granted in any given year. Second, her results may be not reliable due to the relatively small
sample size of only 32 firms. Third, she ignores important determinants of compensation cited by
Ghosh and Sirmans (2005) such as firm size, previous year performance, and the structure of the
board of directors. Fourth, her econometric models do not address the simultaneity between CEO
ownership and compensation. Our study will attempt to address these issues.
7 The levels of the NAREIT composite index were 1,099 (year 1998), 1,019.39 (year 1999), 1,288.51 (year 2000) in accordance to NAREIT and 1,494.65 (year 2001), 1,572.61 (year 2002), 2,177.53 (year 2003), 2,839.7 (year 2004) in accordance to FTSE NAREIT.

REIT Incentive-Based Compensation 25
4. DATA AND METHODS
4.1. Data
The sample is initially identified from a list of exchange-traded, equity, hybrid, and
operating REITs reported in the SNL Financial REIT Database (SNL). The financial variables of
interest, CEO cash compensation, CEO incentive-based compensation, institutional holdings,
and CEO ownership data are collected from the SNL Financial REIT Database. Stock returns are
collected from the Center for Research in Security Prices (CRSP) file. Board of directors
characteristics are obtained from proxy statements.
We obtain a sample of 185 REITs from SNL for 1998. Of these observations, 152 are
equity REITs, 11 are hybrid REITs, and 22 are Real Estate Operating Companies (REOCs). All
REITs must be public and trading on the NYSE, AMEX, or NASDAQ. As shown in Table 1,
SNL reports information on real estate companies with SIC codes ranging from 6500 to 7011. As
denoted by the Securities and Exchange Commission, a REIT must be reported as SIC code
6798; thus, we drop all observations with SIC codes other than 6798. In cases where the SIC
codes is unobservable in SNL we use the SIC code reported in the company’s proxy statement. If
SNL reports an SIC code of 6798 but the proxy reports an SIC code not equal to 6798 we use
SNL’s classification. This screen reduces the sample to 158 observations with an SIC code of
6798.
We then screen for missing data. Twenty-eight observations did not have total market
value of common equity as of the end of 1998; thus, we are left with 134 equity, hybrid, or
operating REITs. Turning to the proxies, board data for 21 of the firms is not obtainable; thus,
the sample is reduced to 113 firms. Same procedure is repeated year by year for the whole

REIT Incentive-Based Compensation 26
period. The final sample is an unbalanced panel data with 440 observations. The descriptive
statistics for the full sample and by year are provided in Table 2.
As shown in Table 2, Panel A, the average REIT CEO received around forty percent of
his compensation in the form of incentive based compensation. In addition, during the period
1998-2003, REIT CEOs held approximately 7.65 percent of the REIT total outstanding shares.
As far as performance is concerned, the average REIT experienced stock returns of 8.535
percent. The return on assets is 3.381 percent for the period. As far as board of directors’
characteristics, the average REIT has a board with around 8 members, and almost sixty two
percent of all boards were led by the CEO serving as chairman of the board. Approximately 67.5
percent of board members were outside directors. Finally, the average REIT had an average
market capitalization of almost one and a half billion, a net property investment of almost
eighteen times the amount of REIT FFO, long-term debt that represented around 3.75 percent of
their total capitalization, and very low institutional holdings as indicated by a Herfindahl index
of 132.
Pearson correlation coefficients for all variables in the sample are provided in Table 3.
While some variables are statistically correlated, the degree of correlation between independent
variables does not appear to be a large concern as indicated by the size of the coefficients.
4.2. Methods
4.2.1. Compensation and REIT Performance
In order to determine increased compensation is associated with improved REIT
performance, we propose the following empirical models:
1 2 3 ,RETURN COMP REINVEST MKTCAPα β β β= + + + (1)
and

REIT Incentive-Based Compensation 27
1 2 3 ,ROA COMP REINVEST MKTCAPα β β β= + + + (2)
where RETURN and ROA are one-year and three-year cumulative stock returns using daily data
and the ratio of earnings before interest and taxes (before extraordinary items) to total
capitalization, respectively. COMP is the natural log of incentive-based compensation
(IBCOMP).8 The last two variables are control variables representing the ratio of net property
investment to FFO (REINVEST) and the natural logarithm of total capitalization of the firm
(MKTCAP)9.
Following Stammerjohan (2004) these models are based on the following sequence of
events: (1) Prior to t-l the CEO and firm set a compensation contract for services performed
during the year beginning at t-l and ending at t; (2) The CEO makes decisions that affect current
and future firm performance during the year; (3) Compensation resulting from the contract is
observable at t; and (4) Contemporaneous firm performance is observable at t and subsequent
firm performance is observable over subsequent periods at times t+k.
4.2.2. The Determinants of Compensation
Ghosh and Sirmans (2005), Ryan and Wiggins (2000), Core Holthausen, and Larcker
(1999), and Bathala, Moon, and Rao (1994) clearly identify interrelations among CEO
compensation, CEO ownership, and firm performance. Thus, if we ignore the interrelations
between variables when examining the determinants of incentive-based compensation for REITs
our models will render biased estimates. This occurs because an important assumption of the
classical ordinary-least squares (OLS) model is that the error term is uncorrelated with the
8 We also use the ratio of total incentive based compensation to total compensation. in these models as a robustness check. The results are similar. 9 MKTCAP is total market capitalization. That is, the market capitalization of common equity, assuming the conversion of all operating partnership units into common stock plus total debt plus preferred equity plus redeemable preferred plus trust preferred plus preferred minority Interest in operating partnership units. Debt is shown at book value. All preferred interests are calculated at liquidation value.

REIT Incentive-Based Compensation 28
independent variables. In the presence of endogeneity, this OLS assumption is violated.
Therefore, one needs to employ the two-stage-least squares (2SLS) methodology. Therefore, like
Ghosh and Sirmans (2005), we will employ a 2SLS procedure.
We use two systems of simultaneous equations to account for stock returns and return on
assets as the performance variable respectively. The equations are very similar to the ones
employed by Ghosh and Sirmans (2005) but with the dependent variable being incentive based
compensation instead of total compensation:
1 2 3 4
5 6 7 8
1 2 3 4
5 6 5
6 7
j j k k
j j
IBCOMP ROA CEOOWN MKTCAP REINVESTBSIZE CEOCHAIR INST OUTSIDERSYEAR FOCUS
ROA IBCOMP CEOOWN REINVEST MKTCAPREINVEST REINVEST OUTSIDERSCEOCHAIR DE YEAR
α β β β ββ β β ββ β
α β β β ββ β ββ β β
= + + + ++ + + ++ +
= + + + +
+ + ++ + + +
1 2 3
4 5 6 7 ,
k kFOCUS
CEOOWN ROA IBCOMP BSIZEOUTSIDERS CEOCHAIR INST DE
β
α β β ββ β β β
= + + +
+ + + +
(3)
and
1 2 3 4
5 6 7 8
1 2 3 4
5 6 5
6 7
j j k k
j
IBCOMP RETURN CEOOWN MKTCAP REINVESTBSIZE CEOCHAIR INST OUTSIDERSYEAR FOCUS
RETURN IBCOMP CEOOWN REINVEST MKTCAPREINVEST REINVEST OUTSIDERSCEOCHAIR DE
α β β β ββ β β ββ β
α β β β ββ β ββ β β
= + + + ++ + + ++ +
= + + + +
+ + ++ + +
1 2 3
4 5 6 7 ,
j k kYEAR FOCUS
CEOOWN RETURN IBCOMP BSIZEOUTSIDERS CEOCHAIR INST DE
β
α β β ββ β β β
+
= + + +
+ + + +
(4)

REIT Incentive-Based Compensation 29
where the endogenous variables are the natural log of total compensation that is incentive-based
(IBCOMP), REIT performance (ROA or RETURN), and CEO ownership (CEOOWN). Incentive-
based compensation refers to pay for long-term performance, not to the method of payment. That
is, incentive-based compensation includes long-term incentives such as equity-based incentives
(stock options and restricted stocks) as well as long-term performance plans that can be paid in
cash, equity, or both cash and equity. This is an important difference with respect to other studies
that concentrate on the role of stock options and restricted stocks in providing incentives to
increase the stock price while completely ignoring other incentives.10 We also differ from Scott,
Anderson, and Loviscek (2001) in that we include the estimated value of options granted in a
given year. Thus, IBCOMP is the natural log of the sum of restricted stock, long-term incentive
plans, and estimated value of options awarded divided by the CEO’s total compensation.
Following Core, Holthausen, and Larcker (1999), we value stock options at 25% of their
exercise price. The grants of restricted stocks and the value of long term performance plans are
taken as reported by the SNL Financial Database. As Core, Holthausen, and Larcker (1999) do,
we acknowledge that the valuation of long term compensation is complicated and that in reality,
the amount of compensation that will ultimately be received from any form of long-term
compensation plan is uncertain.
REIT performance is measured using either stock return in system (3) or return on assets
in system (4). RETURN is the cumulative stock market return for the year prior to the year in
which compensation is awarded. ROA is the ratio of earnings before interest and taxes (before
extraordinary items) divided by total capitalization for the year prior to the year in which
compensation is awarded.
10 See Yermack (1995), Hall and Liebman (1998), Bryan and Hwang (2000), Core, Guay and Larcker (2003)

REIT Incentive-Based Compensation 30
The exogenous variables in systems (3) and (4) are MKTCAP, REINVEST, the standard
deviation of daily stock returns over the past year (SDRETURN), the standard deviation of ROA
over the past three years (SDROA), the number of directors in the board (BSIZE), the number of
outside directors (OUTSIDERS), a binary variable equal to one for CEOs serving as chairman of
the board, zero otherwise (CEOCHAIR),11 the ratio of long-term debt to total capitalization
(LTDE), property focus (Health Care, Hotel, Residential, Retail, Office, and Mixed) and the
percentage of outstanding shares owned by institutional shareholders (INST). Table 4 presents
our predicted effects based on the hypotheses developed in Section 4.
5. RESULTS ON PERFORMANCE
Table 5 shows the results of performance models. Contrary to our expectations, we do not
find a positive relation between compensation and subsequent performance. Instead, we find a
negative relation between one-year subsequent stock return and incentive based compensation
awarded at time t. Interestingly, such relation does not persist for the case stock returns three
year after compensation is awarded and is not found when ROA is the measure of performance
The partial result for the case of stock returns is consistent with the findings of Pennathur, Gilley,
and Shelor (2005) in the relation between change in stock returns and stock option awards but
inconsistent with agency theory and other findings (Ryan and Wiggins(2000); Scott, Anderson,
and Loviscek (2001)).
6. RESULTS ON DETERMINANTS
In general, economic determinants such as size, investment opportunities, risk (total or
idiosyncratic), prior or current year performance, and leverage as well as monitoring and
alignment mechanisms (such as CEO ownership and institutional or blockholders ownership)
11 These board of director variables are chosen since they are consistently found significant by Ghosh and Sirmans (2005) and Core Holthausen, and Larcker (1999)

REIT Incentive-Based Compensation 31
have been found to affect CEO compensation schemes. In this section, we present the results for
the determinants of incentive-based compensation for REITs CEOs.
6.1 OLS results
Ghosh and Sirmans (2005) find positive relations between total compensation and ROA,
board size, and old directors as well as negative relations between total compensation and growth
opportunities, CEO stock ownership, outsider stock ownership, and blockholder ownership. In
the case of cash compensation, they find positive relations between total cash compensation and
ROA, stock returns, debt to total equity, and board size as well as negative relations between
total cash compensation and growth opportunities, directors appointed by the CEO, CEO stock
ownership, outsider stock ownership, and blockholder ownership. Table 6 shows the results on
the relation between incentive-based compensation and economic and governance determinants.
As shown in Table 6, our results consistently support for two of our hypotheses. First,
similar to Ghosh and Sirmans (2005), we find that CEO ownership is inversely related to
incentive based compensation. This could mean that CEOs with high stock ownership prefer
cash compensation over incentive based compensation in order to reduce excessive exposure of
their personal wealth to the firm’s risk. Second, we find a positive relation between the CEO
serving as chairman of the board and incentive-based compensation. This is consistent with the
idea that as the CEO has more power over the board, he is more able to extract additional
compensation.
The results for the remaining hypotheses are as follows. We find that institutional
ownership is positively related to incentive based compensation, which is inconsistent with
previous results for other types of compensation other than those reported by Ryan and Wiggins
(2000). That is, we reject the hypothesis that concentrated institutional shareholders monitor
REIT Incentive-Based Compensation 32
REIT managers thereby substituting for the role of incentive-based compensation. Instead, we
find evidence suggesting that institutional shareholders seek more incentive-based compensation
to further align managers’ interests with their own. In addition, unlike Ghosh and Sirmans (2005)
and contrary to our expectations, we find that board size is inversely related to incentive based
compensation. This implies that CEOs in REITs with larger boards receive lower incentive-
based compensation. Such a result goes against the hypothesis that larger boards are less
effective in monitoring activities. Finally, consistent with previous compensation literature for
REITs, we find debt to be unrelated to incentive-based compensation. This is a peculiar result
since we could expect a leverage variable to capture either agency costs of debt or debt
monitoring power. As suggested by John and John (1993) and Bryan, Nash, and Patel (2006), a
possible explanation could be the lack of usage of proxies that target agency problems better.
However, the effect of CEO incentive-based compensation on the agency costs of debt for REITs
or a fancier measure for debt monitoring constitute by themselves topics out of the scope of this
dissertation ideally to be addressed in further research efforts.
As far as economic determinants, we find that REIT size matters at the time to set
incentive based compensation programs. Consistent with most of the previous literature, the
larger the firm, the more complex its operation, and thus there is more need for using incentive-
based compensation to align managers and shareholders interest. Surprisingly, the year on which
incentive-based compensation is awarded seems not to be important. This implies that the levels
of incentive based compensation are set independently of the market conditions. Finally,
incentive- based compensation is an increasing function of the REIT property focus (the
reference level is self-storage, following Scott, Anderson, and Loviscek (2001)

REIT Incentive-Based Compensation 33
6.2 Two-Stage Least Squares Results The academic literature points out that compensation, firm performance, and CEO stock
ownership are endogenously determined. That is, the CEO stock ownership may be a function of
performance and vice versa. In the same token, compensation could be influenced by
performance. In such scenario, OLS results are unreliable because of simultaneous equation
bias. Therefore, to address these endogeneity issues, we solve a system of simultaneous
equations with CEO incentive based compensation, performance, and CEO ownership as the
endogenous variables. Economic determinants and other governance variables are treated as
exogenous variables. In order to solve the system, at least two exogenous variables must be
dropped from each equation so the equation is identified. We rely on theory or prior research to
determine the exogenous variables to be included or excluded in each of the equations.
Following Ghosh and Sirmans, (2005) we drop the market capitalization and the debt to equity
variable from the compensation equations. We also drop institutional holdings and board size
from the performance equations.12
Table 7 shows the results for the 2SLS procedure. For both measures of performance, and
after accounting for all interrelations among performance, compensation, and CEO ownership,
we find that CEO ownership and the size of the board are negatively related to incentive based
compensation, whereas whether or not the CEO leads the boards and institutional holdings are
found to be positively associated to the level of incentive based compensation. These results
confirm those of the OLS procedure. In addition, some of the property focus dummies lose
significance as well. Only health care (for the case of stock returns) retail, office, mixed, and
industrial still show a positive relation with respect to incentive based compensation.
12 We acknowledge, as previous researchers have, that the exclusion of variables driven by the identification requirement can result in unreliable results. However, this seems not to be the case in our study because we drop alternative variables and run the models, as robustness checks, and the results for both the compensation and performance equations stay the same

REIT Incentive-Based Compensation 34
As far as the results for the performance equation, we find that only debt influences performance
and it does it negatively. In addition, both ROA and RETURN vary depending on the year. In the
case of ROA, during years 2001 and 2002, REITs had lower ROAs compared to the ROA in year
1999. In contrast, returns have been consistently better since year 1999.
Finally, in system 1, the only result that indicates some interrelation between incentive-
based compensation, performance, and CEO ownership is the negative relation between
incentive-based compensation and CEO ownership in the compensation equation. In the
performance equation, we find negative relations between ROA and growth opportunities, debt,
and a greater decrease in ROA for years 2002 and 2003 compared to year 1999. Finally, in the
CEO ownership equation, we find a negative relation between CEO ownership and board size
and also find CEO ownership to be positively affected by the CEO duality in the board. In
system 2, the performance equation shows a negative relation between return and debt, better
stock returns for years 2001, 2002, and 2003 compared to returns in year 1999, and lower returns
for health care and hotel REITs compared to those of self-storage REITs. Finally, CEO
ownership is found to be positively affected by stock returns. In addition, the results found in
system 1 are confirmed. That is, there is a negative relation between CEO ownership and board
size and a positive relation between CEO ownership and the CEO duality in the board.
7. SUMMARY AND CONCLUSION
Even though incentive-based compensation has grown to comprise an important part of REIT
CEOs total pay, incentive-based compensation has not been explicitly studied yet for Real Estate
Investment Trusts (REITs). Besides, in an agency framework, the alignment role of incentive
based compensation remains an empirical question for REITs. The fact that REITs are subject to
strict regulations, in exchange for corporate tax exemption, may affect REITs compensation

REIT Incentive-Based Compensation 35
practices in two ways. On one hand, REITs managers may be better monitored than their
counterparts in other industries making unnecessary to rely on incentive-based compensation. On
the other hand, regulations can negatively affect REITs corporate governance mechanisms and
thus, make incentive-based compensation a key alignment mechanism for REITs CEOs.
In this paper, we test the effect of incentive based compensation on REIT performance.
Specifically, we test the alignment hypothesis, that of incentive-based compensation being
positively related to performance. In addition, we build on Ghosh and Sirmans (2005) models to
examine the determinants of incentive-based compensation.
Contrary to our expectations, we do not find a positive relation between compensation
and subsequent performance. Instead, we find a negative relation between one-year subsequent
stock return and incentive based compensation awards. Interestingly, such relation does not
persist for the case stock returns three year after compensation is awarded and is not found when
ROA is the measure of performance. The partial result for the case of stock returns is consistent
with the findings of Pennathur, Gilley, and Shelor (2005) in the relation between change in stock
returns and stock option awards but inconsistent with agency theory and other findings (Ryan
and Wiggins(2000); Scott, Anderson, and Loviscek (2001). As far as the determinants of
incentive based compensation, we find that CEO ownership, board of directors characteristics,
and institutional ownership are consistent determinants of the level of incentive based
compensation awarded to REITs CEOs. Specifically, CEO ownership and board size are found
to be negative related to incentive-based compensation while whether the CEO chairs or not and
institutional holdings are positively related to incentive-based compensation. In addition, we find
that residential, industrial, mixed, and health care REITs pay more incentive-based compensation
to their CEOs than self-storage REITs.

REIT Incentive-Based Compensation 36
REFERENCES Alshimmiri, Turki, 2004, Board Composition, Executive Remuneration, and Corporate
Performance: The Case of REITs, Corporate Ownership and Control 2, 104-118. Bathala, Chenchuramaiah T., Kenneth P. Moon, and Ramesh P. Rao, 1994, Managerial
ownership, debt policy, and the impact of institutional holdings: An agency perspective, Financial Management 23, 38-50.
Bebchuk, Lucian A., and Jesse M. Fried, 2003, Executive Compensation as an Agency Problem,
Journal of Economic Perspectives 17, 71-92. Beiner, Stefan, Wolfgang, Drobetz, Frank, Schmid, and Heinz, Zimmermann, 2004, Is board size
an independent corporate governance mechanism, Kyklos, 57, 3, 327-356. Bryan, Stephen, Robert, Nash, and Ajay, Patel 2006, Can the agency costs if debt and equity
explain the changes in executive compensation during the 1990s, Journal of Corporate Finance 12, 516-535.
Bryan, Stephen, and LeeSeok Hwang, 2000, CEO Stock-Based Compensation: An Empirical
Analysis of Incentive-Intensity, Relative Mix, and Economic Determinants. , Journal of Business 73, 661-693.
Campbell, Robert D., Chinmoy, Ghosh, and C. F. Sirmans, 2001, The Information Content of
Method of Payment in Mergers: Evidence from Real Estate Investment Trusts (REITs). Real Estate Economics 29, 361-387.
Cannon, Susanne E., and Stephen C. Vogt, 1995, REITs and Their Management: An Analysis of
Organizational Structure, Performance and Management Compensation Journal of Real Estate Research 10, 297-317.
Chan, Su Han; Wai K. Leung, and Ko Wang, 1998, Institutional Investment in REITs: Evidence
and Implications Journal of Real Estate Research 16, 357-374. Chopin, Marc C., Ross N. Dickens, and Roger M. Shelor, 1995, An Empirical Examination of
Compensation of REIT Managers, Journal of Real Estate Research 10, 263-277. Core, John E., Wayne Guay, and David F. Larcker, 2003, Executive equity compensation and
incentives: A survey, Economic Policy Review 9, 27-50. Core, John E., Robert W. Holthausen, and David F. Larcker, 1999, Corporate Governance, Chief
executive officer compensation, and firm performance, Journal of Financial Economics 51, 371-406.

REIT Incentive-Based Compensation 37
Delcoure, Natalya, 2005, The Influence of Firm Operating Characteristics on Incentive Compensation in the Executive Suite: Equity REITs vs. REOCs, Investment Management and Financial Innovations 0, 83-97.
Efendi, Jap, Anup Srivastava, and Edward P. Swanson, 2004, Why do corporate managers
misstate financial statements? The role of option compensation, corporate governance, and other factors. Working Paper, Texas A&M University.
Feng, Zhilan, Chinmoy Ghosh, and C. F. Sirmans, 2005, How Important is the Board of
Directors to REIT Performance?, Journal of Real Estate Portfolio Management 11, 3, 281-293.
Ghosh, Chimnoy, Raja Nag, and C. F. Sirmans, 1997, Financing Choice by Equity REITs, Real
Estate Finance 41-50. Ghosh, Chinmoy, and C. F. Sirmans, 2005, On REIT CEO Compensation: Does Board Structure
Matter?, Journal of Real Estate Finance & Economics 30 397-428. Ghosh, Chinmoy, and C. F. Sirmans, 2003, Board Independence, Ownership Structure, and
Performance: Evidence from Real Estate Investment Trusts, Journal of Real Estate Finance & Economics 26,2-3, 287-318.
Hall, Brian J., and Jeffrey B. Liebman, 1998, Are CEOs really paid as bureaucrats?, The
Quarterly Journal of Economics 113, 653-691. Han, Bing, 2006, Insider Ownership and Firm Value: Evidence from Real Estate Investment
Trust, Journal of Real Estate Finance & Economics 32, 4, 471-493. Hardin, William G., 1998, Executive Compensation in EREITs: EREIT Size is But One
Determinant, Journal of Real Estate Research 16, 401-409. Highfield, Michael J., Kenneth D. Roskelley, and Fang Zhao, 2006, The Determinants of the
Debt Maturity Decision for Real Estate Investment Trusts, Journal of Real Estate Research, Forthcoming.
Ittner, Christopher D., Richard A. Lambert, and David F. Larcker, 2003, The Structure and
Performance Consequences of Equity Grants to Employees of New Economy Firms, Journal of Accounting and Economics 34, 89-127.
Jensen, Michael C., 2005, Agency Costs of Overvalued Equity Financial Management 34, 5-19. Jensen, Michael C. and Kevin J. Murphy, 1990, CEO Incentives -- It's Not How Much You Pay,
But How, Harvard Business Review 68, 138-149. John, Teresa A. and Kose John, 1993, Top Management Compensation and Capital, Journal of
Finance, 48, 3, 949-974.

REIT Incentive-Based Compensation 38
Kole, Stacey R., 1997, The complexity of compensation contracts, Journal of Financial
Economics 43, 79-104. Lewellen, Wilbur, Claudio Loderer, and Kenneth Martin, 1987, Executive compensation and
executive incentive problem, Journal of Accounting and economics 9, 287-310. Lippert, Robert L., and Willian T. Moore, 1995, Monitoring versus bonding: Shareholder rights
and management compensation, Financial Management 24, 54-62. Mehran, Hamid, 1995, Executive compensation structure, ownership, and firm performance,
Journal of Financial Economics 38, 163-184. Myers, Stewart C., 1977, The Determinants of Corporate Borrowings, Journal of Financial and
Economics 5, 2, 147-175. Murphy, Kevin J., 2003, Stock-Based Pay in New Economy Firms, Journal of Accounting and
Economics 34, 3, 129-147. Pennathur, Anita K., Otis W. Gilley, and Roger M. Shelor , 2005, An Analysis of REIT CEO
Stock-Based Compensation, Real Estate Economics 33 I, 189-202. Ryan, Harley E., and Roy A. Wiggins, 2000, Differences in the compensation structures of the
CEO and other senior managers, Journal of Business and Economic Studies 6, 22-39. Scott, John L., Randy I. Anderson, and Anthony L. Loviscek, 2001, Are REIT CEOs rewarded
for performance? Another look, Journal of Real Estate Portfolio Management 7, 247-252.
Smith, Clifford W. and Ross L. Watts, 1992, The investment opportunity set and corporate
financing, dividend, and compensation policies, Journal of Financial Economics 32, 263-292.
Stammerjohan, William, 2004, CEO compensation and subsequent firm performance: An
empirical investigation, Corporate Ownership & Control 2, 86-103. Thatcher, Laura G., 2005, Equity-based compensation, Journal of Deferred Compensation 10,
50-71. Yermack, David, 1995, Do corporations award CEO stock options effectively?, Journal of
Finance and Economics 39, 237-269.

Table 1. Real Estate Related Standard Industrial Classification (SIC) Codes This table provides the description for real estate related standard industrial classification (SIC) codes 6500 through 7011 as outlined by the United States Department of Labor and the Bureau of Labor Statistics.
6500 Real Estate
6510 Real Estate Operators (No Developers) & Lessors
6512 Operators of Nonresidential Buildings
6513 Operators of Apartment Buildings
6519 Lessors of Real Property, NEC
6531 Real Estate Agents & Managers (For Others)
6532 Real Estate Dealers (For Their Own Account)
6552 Land Subdividers & Developers (No Cemeteries)
6770 Blank Checks
6792 Oil Royalty Traders
6794 Patent Owners & Lessors
6795 Mineral Royalty Traders
6798 Real Estate Investment Trusts
6799 Investors, NEC
7000 Hotels, Rooming Houses, Camps & Other Lodging Places
7011 Hotels & Motels

Table 2. Descriptive statistics. Panel A shows descriptive statistics for the full sample for the period 1999-2003 and panel B shows descriptive statistics by year. Compensation is at time t, all other variables are at time t-1. IBCOMP% is the ratio of total incentive based compensation to total compensation, MKTCAP is the natural logarithm of total capitalization, ROA is the ratio of earnings before interest and taxes (before extraordinary items) to average assets and SDROA is the standard deviation of ROA over the last three years. RETURN is the 1-year cumulative stock return, using daily stock return data, and SDRETURN is the standard deviation of one-year daily stock returns. REINVEST is the ratio of Net Property Investment to Funds from Operations. BSIZE is the number of directors in the board, OUTSIDERS is the ratio of outside directors to the total number of directors in the board, CEOCHAIR is an indicator variable that equals one if the CEO leads the board of directors, zero otherwise, and CEOOWN is the CEO’s share ownership as a percentage of the total outstanding shares. Finally, INST is the percentage of outstanding shares owned by institutional investors and LTDE is the ratio of long-term debt to total capitalization. Panel A: Descriptive statistics for the full Sample Variable N Mean Median Standard Minimum Maximum Deviation IBCOMP(%) 440 40.043 42.413 29.067 0.000 100.000 MKTCAP 440 20.921 21.071 1.250 16.118 24.020 ROA(%) 440 3.381 3.277 2.314 -5.067 13.164 SDROA 440 1.185 0.860 1.192 0.023 11.311 RETURN(%) 440 8.535 7.455 24.105 -66.237 95.627 SDRETURN 440 0.102 0.014 1.328 0.008 24.233 REINVEST 440 17.921 13.673 64.564 -268.820 1240.000 BSIZE 440 7.898 8.000 2.035 4.000 15.000 OUTSIDERS(%) 440 67.502 66.667 11.915 30.000 93.333 CEOCHAIR (%) 440 61.591 100.000 48.693 0.000 .100.000 CEOOWN (%) 440 7.649 3.496 11.289 0.000 79.128 INST (%) 440 44.070 43.963 26.730 0.000 100.00 LTDE (%) 440 37.323 39.522 16.810 0.000 83.207

Panel B: Descriptive statistics by year
Variable N Mean Median Standard Minimum Maximum Deviation Year 1999
IBCOMP(%) 81 36.249 37.631 29.328 0.00000 100.00 MKTCAP 81 20.808 20.928 1.322 16.213 23.471 ROA(%) 81 3.804 3.717 2.422 -3.324 9.147 SDROA 81 1.778 1.255 1.605 0.152 11.311 RETURN(%) 81 -10.632 -9.218 14.131 -58.739 18.898 SDRETURN 81 0.316 0.016 2.691 0.008 24.233 REINVEST 81 19.489 14.463 31.596 3.325 292.629 BSIZE 81 7.741 7.000 2.011 4.000 13.000 OUTSIDERS(%) 81 65.722 66.667 11.925 30.000 90.000 CEOCHAIR (%) 81 59.259 100.000 49.441 0.000 .100.000 CEOOWN (%) 81 6.686 3.035 9.131 0.117 42.978 INST (%) 81 43.404 43.692 24.875 0.003 87.941 LTDE (%) 81 33.587 36.089 16.957 0.000 68.554 Year 2000
IBCOMP(%) 93 41.072 43.317 27.618 0.00000 100.00 MKTCAP 93 20.695 20.851 1.273 16.118 23.449 ROA(%) 93 3.956 3.923 2.303 -1.940 13.164 SDROA 93 1.118 0.840 0.947 0.034 5.072 RETURN(%) 93 -3.838 -2.873 14.587 -52.922 27.638 SDRETURN 93 0.016 0.015 0.005 0.009 0.049 REINVEST 93 15.639 13.472 17.310 4.507 175.627 BSIZE 93 7.871 8.000 2.060 4.000 15.000 OUTSIDERS(%) 93 67.229 66.667 11.432 40.000 90.909 CEOCHAIR (%) 93 58.065 100.000 49.613 0.000 .100.000 CEOOWN (%) 93 7.684 3.762 11.451 0.079 70.575 INST (%) 93 41.182 38.118 26.042 0.088 89.473 LTDE (%) 93 36.990 39.384 15.767 0.000 70.000
Year 2001
IBCOMP(%) 89 40.735 45.295 29.326 0.00000 100.00 MKTCAP 89 20.910 21.051 1.220 17.876 23.758 ROA(%) 89 3.494 3.314 2.156 -5.051 10.491 SDROA 89 0.960 0.653 1.062 0.084 6.650 RETURN(%) 89 22.798 23.219 24.143 -66.237 90.181 SDRETURN 89 0.171 0.014 1.465 0.008 13.834 REINVEST 89 28.520 12.837 130.325 -14.619 1240 BSIZE 89 7.933 8.000 1.976 4.000 13.000 OUTSIDERS(%) 89 67.763 70.000 12.539 37.500 92.308 CEOCHAIR (%) 89 65.169 100.000 47.914 0.000 .100.000 CEOOWN (%) 89 8.070 3.615 12.006 0.160 72.584 INST (%) 89 40.645 37.395 27.402 0.000 93.018 LTDE (%) 89 38.690 39.755 17.290 0.000 70.500
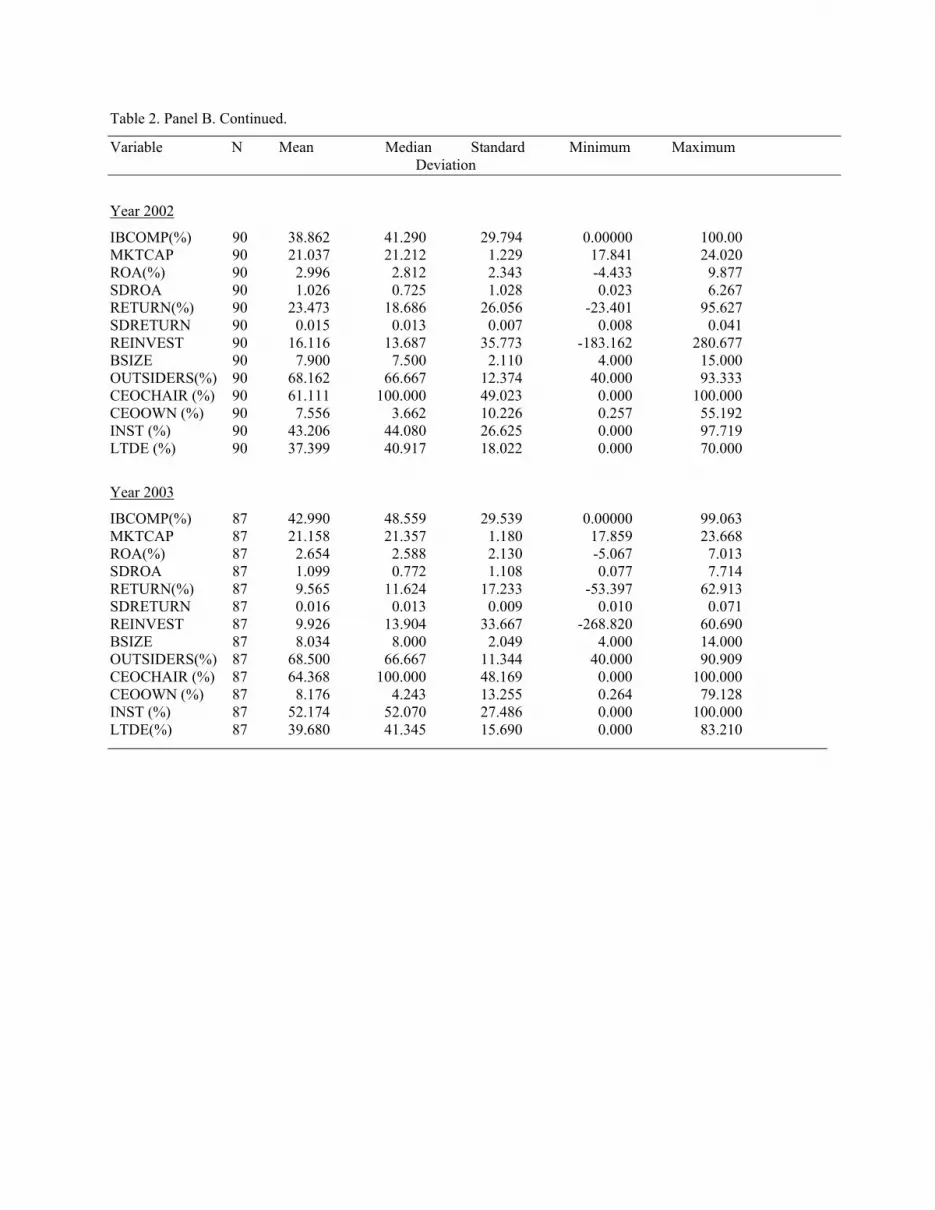
Table 2. Panel B. Continued.
Variable N Mean Median Standard Minimum Maximum Deviation
Year 2002
IBCOMP(%) 90 38.862 41.290 29.794 0.00000 100.00 MKTCAP 90 21.037 21.212 1.229 17.841 24.020 ROA(%) 90 2.996 2.812 2.343 -4.433 9.877 SDROA 90 1.026 0.725 1.028 0.023 6.267 RETURN(%) 90 23.473 18.686 26.056 -23.401 95.627 SDRETURN 90 0.015 0.013 0.007 0.008 0.041 REINVEST 90 16.116 13.687 35.773 -183.162 280.677 BSIZE 90 7.900 7.500 2.110 4.000 15.000 OUTSIDERS(%) 90 68.162 66.667 12.374 40.000 93.333 CEOCHAIR (%) 90 61.111 100.000 49.023 0.000 100.000 CEOOWN (%) 90 7.556 3.662 10.226 0.257 55.192 INST (%) 90 43.206 44.080 26.625 0.000 97.719 LTDE (%) 90 37.399 40.917 18.022 0.000 70.000
Year 2003
IBCOMP(%) 87 42.990 48.559 29.539 0.00000 99.063 MKTCAP 87 21.158 21.357 1.180 17.859 23.668 ROA(%) 87 2.654 2.588 2.130 -5.067 7.013 SDROA 87 1.099 0.772 1.108 0.077 7.714 RETURN(%) 87 9.565 11.624 17.233 -53.397 62.913 SDRETURN 87 0.016 0.013 0.009 0.010 0.071 REINVEST 87 9.926 13.904 33.667 -268.820 60.690 BSIZE 87 8.034 8.000 2.049 4.000 14.000 OUTSIDERS(%) 87 68.500 66.667 11.344 40.000 90.909 CEOCHAIR (%) 87 64.368 100.000 48.169 0.000 100.000 CEOOWN (%) 87 8.176 4.243 13.255 0.264 79.128 INST (%) 87 52.174 52.070 27.486 0.000 100.000 LTDE(%) 87 39.680 41.345 15.690 0.000 83.210

Table 3. Pearson Correlation Coefficients This table provides Pearson correlation coefficients between incentive based compensation and economic, board structure, and monitoring variables. IBCOMP is the ratio of total incentive based compensation to total compensation, MKTCAP is the natural logarithm of total capitalization, ROA is the ratio of earnings before interest and taxes (before extraordinary items) to average assets and SDROA is the standard deviation of ROA over the last three years RETURN is the 1-year cumulative stock return, using daily stock return data, and SDRETURN is the standard deviation of one-year daily stock returns. REINVEST is the ratio of Net Property Investment to Funds from Operations (FFO). BSIZE is the number of directors in the board, OUTSIDERS is the ratio of outside directors to the total number of directors in the board, CEOCHAIR is an indicator variable that equals 1 if the CEO leads the board of directors, zero otherwise, and CEOOWN is the CEO’s share ownership as a percentage of the total outstanding shares. Finally, INST is the percentage of outstanding shares owned by institutional investors, and LTDE is the ratio of total long-term debt to total assets. Correlation coefficients that are significant at the 5 percent level are in italics.
Variables 1 2 3 4 5 6 7 8 9 10 11 12 13 1.IBCOMP 1.000 2.MKTCAP 0.379 1.000 3.RETURN 0.081 0.088 1.000 4.SDRETURN -0.047 -0.039 -0.058 1.000 5. ROA 0.128 0.068 0.117 -0.076 1.000 6. SDROA -0.111 -0.221 -0.263 0.056 0.007 1.000 7.REINVEST -0.080 -0.156 -0.101 0.035 -0.142 -0.006 1.000 8.BSIZE 0.020 0.425 0.028 -0.091 -0.000 -0.102 -0.058 1.000 9.OUTSIDERS 0.174 0.093 0.049 -0.053 -0.033 0.031 0.005 0.059 1.000 10.CEOCHAIR 0.129 0.029 -0.002 0.003 -0.014 -0.055 0.027 -0.120 -0.029 1.000 11.CEOOWN -0.203 -0.279 0.004 0.055 -0.158 -0.003 0.106 -0.188 -0.080 0.144 1.000 12.INST 0.368 0.707 0.038 -0.108 0.036 -0.135 -0.112 0.215 0.109 - 0.048 -0.298 1.000 13.LTDE -0.105 -0.207 -0.093 0.003 -0.381 0.025 0.046 0.015 0.099 -0.146 0.066 -0,052 1.000

Table 4. Predicted Effects The predicted relations between incentive-based compensation and economic determinants, board structure, CEO ownership, and external monitoring variables respectively. IBCOMP% is the ratio of total incentive based compensation to total compensation, MKTCAP is the natural logarithm of total capitalization, RETURN is the 1-year cumulative stock return, using daily stock return data, and SDRETURN is the standard deviation of one-year daily stock returns. ROA is the ratio of earnings before interest and taxes (before extraordinary items) to average assets and SDROA is the standard deviation of ROA over the last three years REINVEST is the ratio of Net Property Investment to Funds from Operations. BSIZ.E is the number of directors in the board, OUTSIDERS is the ratio of outside directors to the total number of directors in the board, CEOCHAIR is an indicator variable that equals 1 if the CEO leads the board of directors, zero otherwise, and CEOOWN is the CEO’s share ownership as a percentage of the total outstanding shares. INST is the percentage of outstanding shares owned by institutional investors, and LTDE is the ratio of long term debt to total capitalization.
Variable Predicted effect on CEO Incentive-Based Compensation
IBCOMP N/A
MKTCAP +
RETURN +
ROA +
SDRETURN ?
SDROA ?
REINVEST +
BSIZE +
OUTSIDERS ?
CEOCHAIR +
CEOOWN −
INST −
LTDE −
YEAR ?
Property Focus ?

Table 5. One-way Fixed Effects Results on Performance
The dependent variables are RETURN, the cumulative subsequent stock return, and ROA, the ratio of Earnings before Interest and Taxes to average assets as of the next period. IBCOMP is the natural log of the dollar amount of incentive based compensation. MKTCAP is the natural logarithm of total capitalization and REINVEST is the ratio of Net Property Investment to Funds from Operations. .Statistical significance is displayed by the use of one (10%), two (5%), or three (1%) stars. PANEL A: Dependent variable: One-year subsequent performance
ROA RETURN
INTERCEPT 11.738 474.554*** (1.21) (2.98) IBCOMP -0.008 -3.868*** (-0.13) (-3.60) MKTCAP -0.323 -20.630** (-0.63) (-2.47) REINVEST 0.005 0.011 (0.96) (0.14) Adjusted R-Square 0.723 0.268 Observations 376 376 PANEL B: Dependent variable: Three year subsequent performance
ROA RETURN
INTERCEPT 20.390** 292.137 (2.16) (0.74) IBCOMP -0.015 -3.211 (-0.31) (-1.59) MKTCAP -0.877* -11.017 (-1.95) (-0.59) REINVEST -0.009*** -0.192 (-2.81) (-1.37) Adjusted R-Square 0.893 0.735 Observations 348 348

Table 6. OLS results
The dependent variable is IBCOMP, the natural logarithm of the total dollar amount of CEO incentive based compensation. MKTCAP is the natural logarithm of total capitalization, ROA is the ratio of net income (before extraordinary items) to average assets and SDROA is the standard deviation of ROA over the last three years. RETURN is the 1-year cumulative stock return, using daily stock return data, and SDRETURN is the standard deviation of one-year daily stock returns. REINVEST is the ratio of Net Property Investment to Funds from Operations. BSIZE is the number of directors in the board, OUTSIDERS is the ratio of outside directors to the total number of directors in the board, CEOCHAIR is an indicator variable that equals 1 if the CEO leads the board of directors, zero otherwise, and CEOOWN is the CEO’s share ownership as a percentage of the total outstanding shares. Finally, INST is the percentage of outstanding shares owned by institutional investors, and LTDE is the ratio of total long-term debt to total capitalization. YR 00, YR 01, YR02, and YR03 are binary variables that have value 1 for observations in years 2000, 2001, 2002, and 2003 respectively, and 0 otherwise. Finally, Health Care, Hotel, Residential, Retail, Office, Industrial, and Mixed are dummy variables for REITs property focus. Statistical significance is displayed by the use of one (10%), two (5%), or three (1%) stars.
Model 1 Model 2
INTERCEPT 2.750 (1.00) 3.917 (-1.06) MKTCAP 0.313 (2.36)** 0.289 (2.21)** ROA 0.060 (1.20) SDROA 0.074 (0.88) RETURN 0.003 (0.67) SDRETURN -0.067 (-0.87) REINVEST 0.003 (0.63) 0.002 (0.37) BSIZE -0.109 (-2.05)** -0.112 (-2.09)** OUTSIDERS 1.083 (1.32) 0.945 (1.14) CEOCHAIR 0.575 (2.85)*** 0.576 (2.85)*** CEOOWN -3.163 (-3.02)*** -3.322 (-3.16)*** INST 0.025 (4.75)*** 0.025 (4.50)*** LTDE -0.001 (-0.22) -0.003 (-0.54) YR00 0.469 (1.56) 0.380 (1.28) YR01 0.469 (1.53) 0.251 (0.72) YR02 0.390 (1.26) 0.148 (0.42) YR03 0.388 (1.26) 0.199 (0.62) Health Care 2.076 (3.26)*** 2.226 (3.50)*** Hotel 1.447 (2.35)** 1.449 (2.31)** Residential 1.199 (2.08)** 1.207 (2.09)** Retail 1.767 (3.20)*** 1.765 (3.17)*** Office 0.835 (1.42) 0.927 (1.56) Industrial 2.075 (3.31)*** 2.139 (3.40)*** Mixed 2.132 (3.55)*** 2.180 (3.62)*** Adjusted R-Square 0.238 0.236 Observations 390 390

Table 7. Two-Stage Least Squares Results
The endogenous variables are IBCOMP, the natural logarithm of the total dollar amount of CEO incentive based compensation, ROA is the performance variable in system 1 and is defined as the ratio of net income (before extraordinary items) to average assets or RETURN, the 1-year cumulative stock return, using daily stock return data; and CEOOWN is the CEO’s share ownership as a percentage of the total outstanding shares. REINVEST is the ratio of Net Property Investment to Funds from Operations. LTDE is the ratio of total long-term debt to total capitalization. BSIZE is the number of directors in the board, OUTSIDERS is the ratio of outside directors to the total number of directors in the board, CEOCHAIR is an indicator variable that equals 1 if the CEO leads the board of directors, zero otherwise, and Finally, INST is the percentage of outstanding shares owned by institutional investors, and YR 00, YR 01, YR02, and YR03 are binary variables that have value 1 for observations in years 2000, 2001, 2002, and 2003 respectively, and 0 otherwise. Finally, Health Care, Hotel, Residential, Retail, Office, Industrial, and Mixed are dummy variables for REITs property focus. Statistical significance is displayed by the use of one (10%), two (5%), or three (1%) stars. Panel A: System 1
IBCOMP$ ROA CEOOWN
INTERCEPT 11.148 (5.04)*** 13.357 (2.75)*** 0.252 (2.83)* Endogenous variables IBCOMP$ 0.097 (0.53) -0.008 (-0.99) ROA 0.114 (0.58) 0.002 (0.39) CEOOWN -24.757(-1.89)* -0.623 (-0.08) Exogenous variables MKTCAP -0.376 (-1.53) REINVEST 0.004 (0.56) -0.010 (-1.93)* LTDE -0.046 (-7.15)*** 0.000 (0.40) BSIZE -0.245 (-1.84)* -0.007 (-3.06)*** OUTSIDERS 0.772 (0.64) -0.781 (-0.89) -0.056 (-1.27) CEOCHAIR 1.336 (2.55)** -0.308 (-0.83) 0.034 (3.01)*** INST 0.019 (1.89)* -0.000 (-1.23) YR00 0.411 (0.98) 0.126 (0.41) YR01 0.503 (1.14) -0.324 (-1.05) YR02 0.446 (0.95) -0.732 (-2.37)** YR03 0.510 (1.01) -0.988 (-3.16)*** Health Care 1.214 (1.22) Hotel 1.197 (1.21) Residential 1.217 (1.44) -0.430 (-0.67) Retail 3.354 (2.53)** -0.149 (-0.18) Office 1.550 (1.55) -0.165 (-0.25) Industrial 2.047 (2.34)** 0.372 (0.47) Mixed 2.936 (2.90)*** 0.374 (0.49) Adjusted R-Square 0.099 0.261 0.091 Observations 390 390 390

Table 7. 2SLS results (Cont.)
Panel B: System 2
IBCOMP$ RETURN CEOOWN
INTERCEPT 10.741 (7.14)*** 34.097 (0.76) 0.262 (3.02)*** Endogenous variables IBCOMP$ 2.422 (1.31) -0.008 (-1.01) RETURN 0.006 (0.20) 0.001 (3.10)*** CEOOWN -14.496 (-1.66)* -20.320 (-0.28) Exogenous variables MKTCAP -3.378 (-1.45) REINVEST 0.002 (0.31) 0.064 (1.24) LTDE -0.207 (-3.16)*** 0.000 (0.61) BSIZE -0.157 (-1.70)* -0.007 (-3.12)*** OUTSIDERS 0.716 (0.70) 11.486 (1.29) -0.069 (-1.58) CEOCHAIR 0.991 (2.58)** -2.990 (-0.87) 0.035 (3.20)*** INST 0.026 (3.42)*** -0.000 (-1.38) YR00 0.359 (0.96) 5.415 (1.74) YR01 0.201 (0.18) 34.127 (10.93)*** YR02 0.111 (0.10) 33.788 (10.83)*** YR03 0.190 (0.28) 19.425 (6.14)*** Health Care 1.683 (2.03)** -14.540 (-1.72)* Hotel 1.069 (1.25) -14.776 (-2.03)** Residential 0.993 (1.60) -1.328 (-0.20) Retail 2.396 (2.74)*** 5.600 (0.72) Office 1.041 (1.43) -0.267 (-0.04) Industrial 1.911 (2.78)*** -4.381 (-0.55) Mixed 2.429 (3.30)*** 1.752 (0.23) Adjusted R-Square 0.167 0.388 0.109 Observations 390 390 390


