Embed Size (px)
Citation preview

NEURO
Cerebral perfusion and glucose metabolism in Alzheimer’sdisease and frontotemporal dementia: two sides of the same coin?
Sander C. J. Verfaillie & Sofie M. Adriaanse & Maja A. A. Binnewijzend &
Marije R. Benedictus & Rik Ossenkoppele & Mike P. Wattjes & Yolande A. L. Pijnenburg &
Wiesje M. van der Flier & Adriaan A. Lammertsma & Joost P. A. Kuijer &
Ronald Boellaard & Philip Scheltens & Bart N. M. van Berckel & Frederik Barkhof
Received: 15 December 2014 /Revised: 19 February 2015 /Accepted: 24 February 2015# The Author(s) 2015. This article is published with open access at Springerlink.com
AbstractObjectives Alzheimer’s disease (AD) and frontotemporal(FTD) dementia can be differentiated using [18F]-2-deoxy-2-fluoro-D-glucose (FDG)-PET. Since cerebral blood flow(CBF) is related to glucose metabolism, our aim was to inves-tigate the extent of overlap of abnormalities between AD andFTD.
Methods Normalized FDG-PET and arterial spin labelling(ASL-MRI)-derived CBF was measured in 18 AD patients(age, 64±8), 12 FTD patients (age, 61±8), and 10 controls(age, 56±10). Voxel-wise comparisons, region-of-interest(ROI), correlation, and ROC curve analyses were performed.Results Voxel-wise comparisons showed decreased CBF andFDG uptake in AD compared with controls and FTD in both
All authors are affiliated with the Neuroscience Campus Amsterdam &VU University Medical Centre
Electronic supplementary material The online version of this article(doi:10.1007/s00330-015-3696-1) contains supplementary material,which is available to authorized users.
S. C. J. Verfaillie (*) : S. M. Adriaanse :M. A. A. Binnewijzend :M. R. Benedictus : R. Ossenkoppele :M. P. Wattjes :A. A. Lammertsma :R. Boellaard :B. N. M. van Berckel :F. BarkhofDepartment of Radiology & Nuclear Medicine, VU UniversityMedical Centre, Amsterdam, The Netherlandse-mail: [email protected]
S. M. Adriaansee-mail: [email protected]
M. A. A. Binnewijzende-mail: [email protected]
M. R. Benedictuse-mail: [email protected]
R. Ossenkoppelee-mail: [email protected]
M. P. Wattjese-mail: [email protected]
A. A. Lammertsmae-mail: [email protected]
R. Boellaarde-mail: [email protected]
B. N. M. van Berckele-mail: [email protected]
F. Barkhofe-mail: [email protected]
S. C. J. Verfaillie : S. M. Adriaanse :M. A. A. Binnewijzend :M. R. Benedictus : R. Ossenkoppele :Y. A. L. Pijnenburg :W. M. van der Flier : P. ScheltensAlzheimer Centre and Department of Neurology, VU UniversityMedical Centre, P.O. Box 7057, 1007MB Amsterdam, The Netherlands
Y. A. L. Pijnenburge-mail: [email protected]
W. M. van der Fliere-mail: [email protected]
P. Scheltense-mail: [email protected]
W. M. van der FlierDepartment of Epidemiology & Biostatistics, VU UniversityMedical Centre, Amsterdam, The Netherlands
J. P. A. KuijerDepartment of Physics and Medical Technology, VU UniversityMedical Centre, Amsterdam, The Netherlandse-mail: [email protected]
Eur RadiolDOI 10.1007/s00330-015-3696-1

precuneus and inferior parietal lobule (IPL). Compared withcontrols and AD, FTD patients showed both hypometabolismand hypoperfusion in medial prefrontal cortex (mPFC). ASLand FDG were related in precuneus (r=0.62, p<0.001), IPL(r=0.61, p<0.001), and mPFC across groups (r=0.74,p<001). ROC analyses indicated comparable performanceof perfusion and metabolism in the precuneus (AUC, 0.72and 0.74), IPL (0.85 and 0.94) for AD relative to FTD, andin the mPFC in FTD relative to AD (both 0.68).Conclusions Similar patterns of hypoperfusion andhypometabolism were observed in regions typically associat-ed with AD and FTD, suggesting that ASL-MRI providesinformation comparable to FDG-PET.Key Points• Similar patterns of hypoperfusion and hypometabolism wereobserved in patients with dementia.
• For both imaging modalities, parietal abnormalities werefound in Alzheimer’s disease.
• For both imaging modalities, prefrontal abnormalities werefound in frontotemporal dementia.
Keywords PerfusionMRI . Positron-emission tomography .18F-FDG . Alzheimer’s disease . Frontotemporal dementia
Introduction
Alzheimer’s disease (AD) and frontotemporal dementia(FTD) are among the most common types of dementia, andboth are characterized by progressive impairment of cogni-tive, behavioural, and daily functioning [1, 2]. Early in thecourse of the disease in particular, clinical presentation ofFTD and ADmay overlap or may be misdiagnosed as anotherpsychiatric or neurological disorder. Brain glucose metabo-lism measured using [18F]-2-deoxy-2-fluoro-D-glucose (18F-FDG) positron emission tomography (PET) provides impor-tant additional diagnostic information about brain function[3]. Glucose metabolism reflects neuronal (dys)function,which is thought to be an early marker of dementia, precedingstructural magnetic resonance imaging (MRI) findings such ascortical atrophy and clinical symptoms [4]. Bilateral temporaland parietal glucose hypometabolism is present in patientswith AD of mild severity [5–7]. In contrast, patients withFTD show marked hypometabolism in the prefrontal cortex(PFC) [8–10]. For this reason, FDG is able to accurately dif-ferentiate between AD and FTD [3, 7, 11] with a high level ofspecificity [12, 13].
The disadvantages of PET include radiation exposure andthe relatively high cost. A potential alternative to FDG-PET isthe assessment of cerebral blood flow (CBF) measured byperfusion MRI, as CBF is thought to be closely related to
metabolism [14]. CBF can be measured non-invasively usingarterial spin labelling (ASL), whichmakes use ofmagneticallylabelled water in the arterial blood supply as an endogenoustracer [15, 16]. Indeed, comparisons between CBF measuredwith ASL and single-photon emission computed tomographyprovided almost equivalent diagnostic information in AD[17]. As such, like FDG, ASL may be suitable to identifyunique disease-related patterns.
Among the advantages of ASL are its relatively short ac-quisition time, low cost, lack of radiation exposure, non-inva-siveness, and easy incorporation into standard MRI protocols.ASL studies in patients with AD have shown lower CBF inparietal and temporal regions and in the posterior cingulatecortex (PCC) [18–21], very similar to findings with FDG. InFTD, lower levels of CBF were found in the right frontalregions in comparison to controls, while higher CBF levelswere found in the temporal-parietal regions and PCC com-pared to AD [22, 23].
The first study directly comparing FDG and ASL betweenpatients with AD and healthy subjects showed correspondingdeficits primarily in the angular gyrus and PCC [24, 25]. Assuch, ASL may have potential clinical use in the diagnosticworkup of dementia. While ASL sequences could be availablein nearly every hospital equipped with MRI, perfusion mapsare not yet commonly used for diagnostic decision-making.ASL is also a relatively new technique and needs further val-idation against the more established FDG-PET. Before ASLcan serve as a more solid biomarker for differential diagnosisin single subjects, several dementia types must first be com-pared at a group level with ASL compared to FDG imaging.To date, no study has compared ASL with FDG in FTD, orcompared FTD with AD together with its discriminative per-formance. The use of a retrospective design allowed us toinvestigate brain function in patients with a mild disease statewhile ensuring that a clinical diagnosis was maintained atapproximately two years. Therefore, the aim of this studywas to compare FDG (metabolism) and ASL (perfusion) im-aging in the same subjects, andmore importantly, to determinethe extent of overlap with regard to aberrant brain functionbetween the imaging techniques.
Methods
Subjects
A convenience sample comprising 18 patients with AD, 12patients with behavioural-variant FTD, and 10 controls withavailable FDG and ASL images from the Amsterdam Demen-tia Cohort were included [26]. Subjects were eligible if theinterval between FDG and ASL examinations was 6 monthsor less. All patients visited the VU University Medical Centreoutpatient memory clinic between October 2010 and October
Eur Radiol

2012. All underwent standardized dementia screening: medi-cal history, neuropsychological assessment, physical and neu-rological examinations, laboratory testing, and a structuralbrain MRI. Clinical diagnosis was established by consensusamong a multidisciplinary team prior to PET imaging, andwithout knowledge of the ASL data.
AD patients fulfilled the National Institute of Neurologicaland Communicative Disorders and Stroke/Alzheimer’s Dis-ease and Related Disorders Association criteria for probableAD [27]. Alzheimer’s pathology was verified in all AD pa-tients using non-displaceable binding potential parametric im-ages based on 90-min dynamic Pittsburgh Compound-B (PIB)PET scans. All FTD patients met the criteria for probablebehavioural-variant FTD [28]. AD and FTD patients wereeligible if the diagnosis was maintained over a clinicalfollow-up period of at least 1 year. Controls were patients withsubjective memory complaints who lacked verified cognitivedisorders or any relevant psychiatric disorders, and whoshowed no evidence of neurodegenerative disorder on MRI[19]. In addition, controls were required to have normal CSFAß1-42 levels in order to exclude possible preclinical ADcases.
The study was approved by the Medical Ethics ReviewCommittee, and all subjects provided written informedconsent.
PET
Fifteen minutes prior to injection, patients were instructed torest with their eyes closed and wearing earplugs in a dimly litroom with minimal background noise. Forty-five minutes af-ter intravenous bolus injection of 188±8 MBq 18F-FDG, pa-tients underwent a 15-min emission examination (3×5-minframes). FDG emission scans were obtained using a GeminiTF 64 PET-CT (Philips Medical Systems, Cleveland, OH,USA) or ECAT EXACT HR+ (Siemens/CTI, Knoxville,TN, USA) scanner (AD, n=6/n=12; FTD, n=7/n=5; controlsn=3/n=7, respectively). Details with respect to image acqui-sition have been described elsewhere [29]. All PET unrecon-structed data (sinograms) were normalized and corrected forrandom events, dead time, scatter, and decay. Attenuation cor-rection was performed using a low-dose CT (PET-CT) ortransmission scan (ECAT HR+). The reconstruction protocolhas been described elsewhere [30], but included standard re-construction algorithms for both systems (ECAT HR+: stan-dard filtered back-projection; PET-CT 3D row-action maxi-mum likelihood algorithm). Finally, standardized uptakevalues (SUVs) were calculated, normalized for injected doseand body weight and length, using an in-house-developedsoftware tool for kinetic and parametric analysis of dynamicPET studies. SUV images were normalized to global uptakeusing SPM8 (Statistical Parametric Mapping; Wellcome TrustCentre for Neuroimaging, London, UK).
MRI
MR images were acquired on a 3 T whole-body MR system(Signa HDxt; GE Medical Systems, Milwaukee, WI, USA)using an 8-channel head coil. The MRI acquisition protocolhas been extensively described elsewhere [19], and included asagittal 3D T1-weighted inversion recovery fast spoiled gra-dient echo. ASL-MRI sequencing was provided by GE.Pseudo-continuous ASL perfusion images (3D fast spin-echo acquisition with background suppression; post-label de-lay, 2.0 s; repetition time [TR]=9 ms; echo time [TE]=4.8 s;spiral readout, 8 arms×512 samples; 36×5.0 mm axial slices;3.2×3.2 mm2 in-plane resolution; reconstructed pixel size,1.7×1.7 mm2; acquisition time, 4 min) were calculated aftersubtracting labelled from control images. Both T1-weightedand ASL images were corrected for gradient non-linearity inall three directions. Perfusion was normalized to global perfu-sion using SPM8, as described for FDG.
Image analysis
Pre-processing and between-group image comparisons wereperformed using SPM8 in MATLAB (MathWorks, Release2010a). Parametric images of FDG-SUV and ASL-derivedCBF were co-registered to the structural T1 image, and spa-tially registered to the Montreal Neurological Institute (MNI)space (voxel size, 2.0×2.0×2.0 mm3) [31]. ASL images werespatially smoothed using an 8-mm full-width-at-half-maximum Gaussian kernel corresponding to the smoothingkernel of FDG images at reconstruction. Group effects wereinvestigated separately for ASL and FDG with a voxel-wisecontrast including covariates (age and sex) to adjust for com-mon confounding effects [32]. To reliably and validly com-pare normalized signals of the techniques in grey matter, pro-portional scaling, mean global calculation, and grey mattermasking was applied in SPM8. Because we were interestedin the concordance of spatial abnormality patterns and corre-sponding standard normal deviate relative to controls, SPM-derived mean z-scores were extracted from multiple signifi-cant clusters (thresholded at p<0.001, uncorrected for multi-ple comparisons [cluster size≥10]).
To investigate the extent to which FDG and ASL werecorrelated, region-of-interest (ROI) analyses were performed.Based on the most significant clusters derived from patient-versus-control comparisons that (partially) overlapped be-tween FDG and ASL, post hoc ROI analysis was performedusing MarsBaR (MARSeille Boîte À Région d'Intérêt [Mar-seille Region of Interest Toolbox]) (v 0.43, Marseille, France).Functional ROIs encompassed both FDG and ASL regionalabnormal clusters at a liberal threshold (defined through SPMlocal maxima p<0.05 uncorrected), ensuring a target region ofadequate size.
Eur Radiol

In total, three separate ROIs were created for AD (n=2) andFTD (n=1) signature regions (Supplementary Fig. 2). ROIcoordinates for AD were as follows: precuneus (xyz ASL−10/−68/30, FDG −2/−70/32) and inferior parietal lobule(IPL) (xyz ASL 44/−56/46, FDG 46/−58/40). ROI coordi-nates for FTD were mPFC (xyz ASL 2/62/6, FDG 6/60/6).Next, a combined (ASL+FDG) signature ROI was saved as asingle cluster, and trimmed with a box (20×20×20 mm3) atintermediate voxel coordinates (precuneus: −6/−69/31, IPL:45/−57/43, mPFC: 4/61/6). Trimming was done to removeextraneous voxels (i.e. outside signature region). ROI valueswere extracted with default settings.
Statistical analysis
Demographic and clinical data were analysed using SPSSsoftware (IBM SPSS Statistics for Windows Version 20.0;IBM Corp., Armonk, NY, USA). If data deviated from nor-mality (using Kolmogorov-Smirnov tests for non-normality),non-parametric tests were used, as indicated. Demographicdata (age, weight, and body length) and MMSEwere assessedusing analysis of variance (ANOVA). Gender differenceswere assessed using χ2 tests. Across groups, the relationshipbetween FDG and ASL was investigated using the Pearsoncorrelation.
Across-group (AD, FTD, controls) comparative perfor-mance was investigated using binary logistic regression, withall FDG and ASL ROI values entered simultaneously as input,and a dummy-coded dementia group as dependent variable.Multicollinearity assumptions were investigated using linearregression methods. Further, to investigate the extent to whichFDG and ASL were able to discriminate between AD andFTD, receiver operating characteristic (ROC) curves weregenerated to obtain an area under the curve (AUC). Specifi-cally, separate ASL and FDG ROI values from AD and FTDpatients were used as input (test variable); the dementia groupwas set as state variable. In addition, mean difference scores ofsignature ROIs were calculated to determine whethersubtracting signature regions would result in better discrimi-native performance.
Results
Demographic and clinical variables are presented in Table 1.Age, gender, time intervals, and FDG SUV normalizationvariables (body weight and length, injected dose) did not dif-fer among groups. Likewise, there was no difference in fre-quency distribution of PET systems (PET-CT and HR+)among the groups (χ2(2)=1.6, p=0.21). The combined de-mentia groups showed lower MMSE scores (F[38, 1])=1.8,p=0.01) than controls, but did not differ between each other.All amyloid PET scans of the AD patient group were
classified as consistent with abnormal amyloid load. AllFTD patients had normal cerebrospinal fluid (CSF) Aß1-42levels (n=3) or negative amyloid PETscan (n=8). In one FTDpatient, amyloid-specific information was missing. Figure 1shows raw ASL and FDG images with corresponding MRI ofa typical AD and FTD patient.
Figure 2 shows regional abnormalities derived from groupcomparisons projected onto anMNI glass brain, while Fig. 3Ashows z-scores for FTD and AD compared to controls (MNIcoordinates with corresponding cluster sizes are displayed inSupplementary Table 2). In AD compared to controls, bothlower metabolism (FDG) and lower perfusion (ASL) werefound in the bilateral precuneus, bilateral inferior parietal lob-ule (IPL), and dorsolateral prefrontal cortex (DLPFC). In ad-dition, AD patients showed lower perfusion in theorbitofrontal cortex (OFC). Compared with controls, FTD pa-tients showed both lower metabolism and lower perfusion inmPFC, OFC, and temporal poles. In addition, hypoperfusionwas found in the supplementary motor area (SMA) andhypometabolism in the DLPFC in FTD. Overall, mean age-and sex-adjusted z-scores (reflecting normal deviates) werecomparable between ASL and FDG in patient groups relativeto controls.
Compared with FTD patients, patients with AD showedlower metabolism in the precuneus and bilateral IPL, whilelower perfusion was observed in the precuneus and left IPL(Fig. 3B). In addition, lower perfusion was found in the mid-dle temporal gyrus (MTG) with AD compared to FTD, withthe opposite pattern in the SMA, OFC, temporal poles, andmPFC. Likewise, lower metabolism was found in the OFC,SMA, mPFC, temporal poles, and anterior PFC (aPFC) inFTD relative to AD.While OFC hypometabolism was locatedin anteromedial orbitofrontal regions, hypoperfusion wasfound predominantly in posterolateral regions, extending tothe temporal poles.
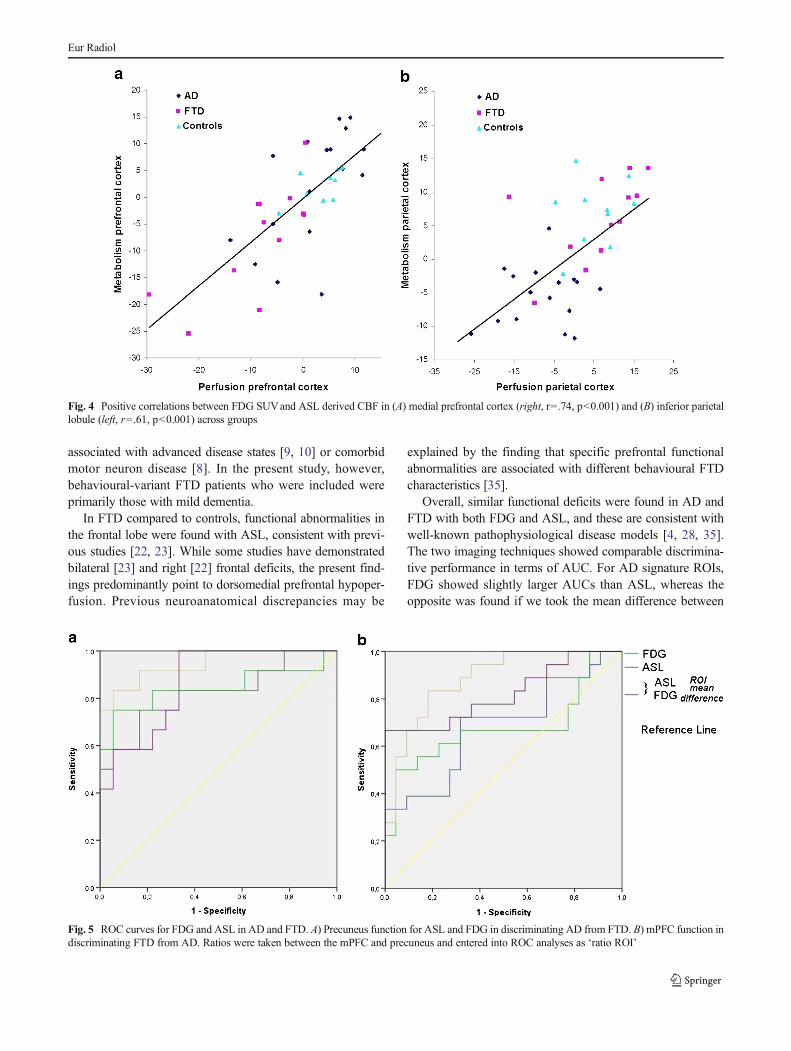
Correlations between regional FDG and ASL values areshown in Fig. 4. Across groups, a strong correlation betweenFDG and ASL was found in mPFC (r=.74, p<0.001;Fig. 4A), IPL (r=.61, p<0.001; Fig. 4B), and precuneus(r=.62, p<0.001).
The predictive value of the separate ROIs ([IPL, precuneus,mPFC]×FDG+ASL) in all groups (AD, FTD, controls) forAD and FTDwas investigated using logistic regression. Therewas a significant fit of the data in AD (χ2(6)=44.1, p<0.001)predicted by IPL metabolism (β±SE, 0.54±0.31, p =0.046),but not by IPL (β±SE, 0.71±0.31) or precuneus (β±SE, 0.88±0.12) perfusion, or precuneus (β±SE, 0.94±0.1113) metab-olism. Testing was performed to exclude significantmulticollinearity, and showed no violations (all variables: tol-erance>0.41, VIF<2.46). In contrast, for FTD, there was asignificant fit of the data (χ2(6)=32.1, p<0.001) predictedby mPFC perfusion (β±SE, 0.74±0.16, p=0.026), but notmPFC (β±SE, 0.89±0.15) metabolism. Multicollinearity
Eur Radiol

testing showed no violations (all variables: tolerance>0.40,VIF<2.52).
To investigate the discriminative power of ASL and FDGfor AD and FTD, ROC curves were generated. Figure 5 shows
ROC curves for AD and FTD based on precuneus (Fig. 5A)and mPFC (Fig. 5B) ROI values. Precuneus AUC was 0.74for FDG and 0.72 for ASL. For IPL, the AUC was 0.94 forFDG and 0.85 for ASL. For mPFC, the AUC was 0.68 forboth FDG and ASL. Additionally, ratios (between mPFC andprecuneus, and mPFC and IPL) were used for discriminatingAD from FTD, which showed AUC values of 0.80 and 0.90for the precuneus, and 0.89 and 0.96 for the IPL for FDG andASL, respectively. Likewise, for discriminating FTD fromAD, mPFC showed an AUC of 0.82 for FDG and 0.89 forASL.
Table 1 Demographic and clinical data
Patient groupCharacteristics
ADN=18
FTDN=12
ControlsN=10
Test-statistic (p value)
Age in years (SD) 64 (8) 61 (8) 56 (10) F(37,2)=1.9, p=0.17
Gender 61 % male 42 % male 90 % male χ2(2)=5.5, p=0.06
MMSE (SD) 24 (4) 24 (4) 27 (3) F(37,2)=2.6, p=0.09
Median years of complaints (interquartile range)* 2.0 (1.9) 2.3 (1.9) n.a. U=101.5, p=0.78
Scan interval in months (SD) 2.1 (1) 2.2 (2) 1.9 (2) F(37,2)=.8, p=0.5
FDG SUV normalization variables
Body
Weight in kg (SD) 78 (11) 75 (15) 86 (17) F(37,2)=2.2, p=0.13
Length in cm (SD) 176 (9) 169 (10) 175 (9) F(37,2)=1.5, p=0.23
Injected dose in MBq (SD) 190 (8) 187 (8) 188 (7) F(37,2)=.97, p=0.39
Abbreviations: cm centimetre, kg kilogram, MBq megabecquerel, SD standard deviation, SUV standardized uptake value
*Obtained through interviews with relatives of patients
Fig. 1 Transversal FDG and ASL images of an FTD (first and secondrows, MMSE 26) and an AD (third and fourth rows, MMSE 17) patientwith early-onset disease. Both transversal planes show predominantlyprefrontal abnormalities in FTD and parietal abnormalities in AD. Redcolour reflects normal metabolism and perfusion
Fig. 2 Functional brain abnormalities of AD and FTD compared tocontrols projected onto a MNI glass brain. Predominantly parietal,precuneus aberrant function is visible in AD compared to controls,while FTD compared to controls shows mostly prefrontal abnormalitieswith both FDG and ASL. For illustrative purposes, images werethresholded at p<0.005
Eur Radiol

Discussion
In this study, FDG and ASL were compared between AD andFTD patients. The main finding of this study was that similarspatial abnormalities in glucose metabolism and perfusionwere seen in AD and FTD patients compared with cognitivelynormal subjects in areas consistent with disease models. Over-all, these findings reinforce the role for ASL in assessing spa-tial patterns of aberrant brain function in dementia, and sug-gest the potential for use in memory clinics.
To date, quantitative and qualitative FDG studies in ADhave consistently demonstrated glucose hypometabolism inthe bilateral temporal-parietal and precuneal regions AD[5–7], which are associated with neuropsychological deficits[33] and structuralMRI atrophy [34]. The present FDG resultson AD are in line with previous reports, indicating severelyabnormal metabolism, especially in bilateral IPL.
The present study also demonstrated ASL hypoperfusion inbilateral IPL in patients with AD compared with controls,consistent with a previous study using voxel-wise analyses[21]. In another study, unilateral IPL hypoperfusion was seen[20], possibly as a result of globally decreased perfusion [19].Hypoperfusion was also observed in the bilateral precuneus inAD patients compared with controls. These results are all inline with voxel-wise ASL studies in AD reporting decreasedCBF in the PCC and parietal cortex compared with controls[18–21].
With regard to FTD, metabolic impairment, often asym-metric, has been reported in the frontal, basal ganglia, anteriorcingulate cortex, and temporal regions [7–9]. The presentFDG results are partially in line with these existing reports,as hypometabolismwas observed in the frontal lobes and tem-poral poles but not in basal ganglia. One possible explanationmay relate to the fact that subcortical metabolic deficits are
Fig. 3 Panel A shows FDG andASL regional mean z-scores ofAD (left) and FTD (right)compared to controls. Panel Bshows AD < FTD (left) and FTD< AD (right) perfusion andmetabolism abnormalities
Eur Radiol
associated with advanced disease states [9, 10] or comorbidmotor neuron disease [8]. In the present study, however,behavioural-variant FTD patients who were included wereprimarily those with mild dementia.
In FTD compared to controls, functional abnormalities inthe frontal lobe were found with ASL, consistent with previ-ous studies [22, 23]. While some studies have demonstratedbilateral [23] and right [22] frontal deficits, the present find-ings predominantly point to dorsomedial prefrontal hypoper-fusion. Previous neuroanatomical discrepancies may be
explained by the finding that specific prefrontal functionalabnormalities are associated with different behavioural FTDcharacteristics [35].
Overall, similar functional deficits were found in AD andFTD with both FDG and ASL, and these are consistent withwell-known pathophysiological disease models [4, 28, 35].The two imaging techniques showed comparable discrimina-tive performance in terms of AUC. For AD signature ROIs,FDG showed slightly larger AUCs than ASL, whereas theopposite was found if we took the mean difference between
Fig. 4 Positive correlations between FDG SUVand ASL derived CBF in (A) medial prefrontal cortex (right, r=.74, p<0.001) and (B) inferior parietallobule (left, r=.61, p<0.001) across groups
Fig. 5 ROC curves for FDG and ASL in AD and FTD. A) Precuneus function for ASL and FDG in discriminating AD from FTD. B) mPFC function indiscriminating FTD from AD. Ratios were taken between the mPFC and precuneus and entered into ROC analyses as ‘ratio ROI’
Eur Radiol

AD and FTD ROIs. For AD, the IPL showed slightly betterdifferentiation from FTD compared to the precuneus with bothFDG and ASL. In addition, regression analyses indicated thatIPL metabolism was the strongest predictor for AD comparedto all other ROIs, versus ASL prefrontal perfusion in FTD.Nevertheless, regional FDG and ASL values were correlatedin the precuneus, IPL, and, most clearly, in the frontal lobeacross groups. In contrast, voxel-wise abnormalities weremost comparable in AD versus controls, and to a lesser extentin FTD. This might be caused by distinct and broad frontaldeficiencies known to be present in FTD. To date, only onestudy has been reported in which a voxel-wise comparisonbetween ASL and FDG was performed in AD. Chen et al.showed overlapping functional abnormalities in the PCCand angular gyri [24]. The present results endorse those find-ings, but additionally provide first evidence of largely over-lapping functional abnormalities in imaging techniques forFTD already at an early stage with only mild disease severity.The current findings further demonstrate comparable discrim-inatory ability for FDG and ASL between the two most com-mon early-onset dementia groups.
While overlapping ASL perfusion abnormalities relative toFDG were demonstrated at a group level, future studies arenecessary to clarify the clinical potential of this application forsingle subjects, while also controlling for common confound-ing effects. The capabilities of ASL should also be investigat-ed in more complex dementia cases or variants, or even inother neuropsychiatric disorders. In addition, to ensure generaluse, performance should be tested on different MRI systems.Lastly, for potential clinical use, visualization and assessmentof CBF maps could benefit from scientific agreement onsmoothing kernels for optimal signal-to-noise ratio.
Functional brain imaging may be hampered by partial vol-ume effects (PVE) that can occur due to cerebral atrophy. Sinceour primary aim was to compare imaging technique perfor-mance in such a way that it could be extrapolated to a realisticclinical setting, our data was uncorrected for PVE. We there-fore cannot distinguish true decreases in brain tissue perfusionand metabolism from apparent decreases in brain function dueto atrophy. However, even though partial volume corrections(PVCs) were not performed CBF has been determined previ-ously both with and without PVC across several dementiagroups [36]. Binnewijzend and colleagues (2014) showed thatafter PVC, CBF consistently increased, but proportional differ-ences remained similar across groups. Furthermore, there areconcordant reports of functional brain abnormalities persistingafter PVC in AD and FTD [37–39]. In addition, similar pro-cessing pipelines were used for FDG and ASL in the currentstudy, and applying these corrections could have introducedunwanted variability in key brain regions. At this time, no idealPVCs are available for either ASL or FDG [40].
This study had several other potential limitations. We useda convenience sample comprising patients with extensive
differential diagnoses, which may have biased our results inthat clear-cut cases (i.e. FDG scan not necessary) were notincluded. For this reason, not all FTD patients exhibitedfrontotemporal atrophy on MRI. Notwithstanding this issue,the study did show overlapping aberrant function already incases with mild disease severity, which renders it suitable forearly diagnosis. Another limitation was that subjects with cog-nitive complaints but without any verified abnormalities wereused as a reference group, which consisted primarily of males.Despite statistically adjusting analyses for gender effects, thismight have influenced our results. On the other hand, Liu andcolleagues showed no specific regional hypoperfusion relatedto gender effects [32]. It is thus likely that our regional abnor-malities do reflect dysfunction related to AD and FTD pathol-ogy. Furthermore, current knowledge is limited with regard tobrain function in healthy subjects with cognitive complaints,although one could argue that more rigorously defined con-trols might be ‘healthier’ than the ‘normal’ elderly population,and that our control group better reflects clinical practice.Lastly, many uncontrolled factors such as smoking and caf-feine intake may have affected measurements to a certainextent.
In conclusion, comparable reduced cerebral perfusion andmetabolism were observed, predominantly in the parietal cor-tex and PCC in AD and in the frontal lobes in FTD, in linewith pathophysiological disease models. As such, ASL can beconsidered as a promising adjunct to clinical investigations,even for early diagnosis.
Acknowledgments Research of the VUmc Alzheimer Center is part ofthe neurodegeneration research program of the Neuroscience CampusAmsterdam. The authors thank Ajit Shankaranarayanan of GEHealthcarefor providing the 3D pseudo-continuous ASL sequence that was used toobtain data for this paper.
The scientific guarantor of this publication is Prof. Dr. FrederikBarkhof. The authors of this manuscript declare relationships with thefollowing companies:
Dr. F. Barkhof serves on the editorial boards of Brain, European Radi-ology, Radiology, Multiple Sclerosis, Neuroradiology and Neurology, andserves as a consultant for Bayer Schering Pharma, Sanofi-Aventis, BiogenIdec, TEVA, Synthon BV, Merck Serono, Jansen Alzheimer Immunother-apy, Novartis, Genzyme, and Roche. Dr. Barkhof receives research sup-port from the Dutch MS Society (EU-FP7). Dr. Barkhof has receivedconsulting fees or honoraria for the consultancy mentioned above.
Dr. B.N.M. van Berckel receives research support from theAlzheimer Assistance Foundation, the Center for Translational Mo-lecular Imaging, the Alzheimer Association, De Hersenstichting Ne-derland, and the Internationale Stichting Alzheimer Onderzoek. Dr.van Berckel receives no personal compensation from theseorganizations.
Dr. Wiesje van der Flier has received research funding and speakerhonoraria from Boehringer Ingelheim; all funds were paid to herinstitution.
Dr. P. Scheltens receives grant support (for the institution; the VUmcAlzheimer Center, see also below) fromGEHealthcare, DanoneResearchand Merck. In the past 2 years, he has received speakers’ fees (paid to theinstitution) from Lilly, GE Healthcare, Lundbeck, Danone, and JanssenAI-Pfizer.
Eur Radiol

Dr. Wattjes serves as a consulant for Biogen Idec and Roche and as aneditorial board member of European Radiology.
S.C.J. Verfaillie, S.M. Adriaanse, M.A.A. Binnewijzend, M.R. Bene-dictus, R. Ossenkoppele, A.A. Lammertsma, Y.A.L. Pijnenburg, R.Boellaard, and J.P.A. Kuijer report no disclosures.
The authors of this manuscript declare no relationships with any com-panies whose products or services may be related to the subject matter ofthe article.
This study has received funding by Research of the VUmc AlzheimerCenter. The VUmc Alzheimer Center is supported by Alzheimer Neder-land and Stichting VUmc Fonds.
Dr. W.M. van der Flier and Dr. J.P.A. Kuijer (authors) kindly providedstatistical advice for this manuscript. Institutional review board approvalwas obtained. Written informed consent was obtained from all subjects(patients) in this study. Some study subjects have been previously report-ed in Eur Radiol. 2014 Sep;24(9):2326-33. doi: 10.1007/s00330-014-3172-3. Five of 12 ASL scans of FTD patients and five of 18 ASL scansof AD patients have been used before. None of the FDG and ASL controlscans have been published previously. Methodology: retrospective cross-sectional study, performed at one institution.
Open Access This article is distributed under the terms of the CreativeCommons Attribution Noncommercial License which permits anynoncommercial use, distribution, and reproduction in any medium,provided the original author(s) and the source are credited.
References
1. Alzheimer’s Association (2012) 2012 Alzheimer's disease facts andfigures. Alzheimers Dement 8:131–168
2. Ratnavalli E, Brayne C, Dawson K, Hodges JR (2002) The preva-lence of frontotemporal dementia. Neurology 58:1615–1621
3. Bohnen NI, Djang DS, Herholz K, Anzai Y, Minoshima S (2011)Effectiveness and safety of 18F-FDG PET in the evaluation of demen-tia: a review of the recent literature. J Nucl Med 53:59–71
4. Jack CR Jr, Knopman DS, Jagust WJ et al (2013) Tracking patho-physiological processes in Alzheimer's disease: an updated hypothet-ical model of dynamic biomarkers. Lancet Neurol 12:207–216
5. Hoffman JM, Welsh-Bohmer KA, Hanson M et al (2000) FDG PETimaging in patients with pathologically verified dementia. J NuclMed 41:1920–1928
6. Minoshima S, Giordani B, Berent S, Frey KA, Foster NL, Kuhl DE(1997) Metabolic reduction in the posterior cingulate cortex in veryearly Alzheimer's disease. Ann Neurol 42:85–94
7. Mosconi L, Tsui WH, Herholz K et al (2008) Multicenter standard-ized 18F-FDG PET diagnosis of mild cognitive impairment,Alzheimer's disease, and other dementias. J Nucl Med 49:390–398
8. Jeong Y, Cho SS, Park JM et al (2005) 18F -FDG PET findings infrontotemporal dementia: an SPM analysis of 29 patients. J NuclMed46:233–239
9. Diehl-Schmid J, Grimmer T, Drzezga A et al (2007) Decline of ce-rebral glucose metabolism in frontotemporal dementia: a longitudinal18F-FDG-PET study. Neurobiol Aging 28:42–50
10. Grimmer T, Diehl J, Drzezga A, Forstl H, Kurz A (2004) Region-specific decline of cerebral glucose metabolism in patients withfrontotemporal dementia: a prospective 18F -FDG-PET study.Dement Geriatr Cogn Disord 18:32–36
11. Foster NL, Heidebrink JL, Clark CM et al (2007) FDG-PET im-proves accuracy in distinguishing frontotemporal dementia andAlzheimer's disease. Brain 130:2616–2635
12. Panegyres PK, Rogers JM, McCarthyM, Campbell A, Wu JS (2009)Fluorodeoxyglucose-positron emission tomography in the differen-tial diagnosis of early-onset dementia: a prospective, community-based study. BMC Neurol 9:41
13. Rabinovici GD, Rosen HJ, Alkalay A et al (2011) Amyloid vs FDG-PET in the differential diagnosis of AD and FTLD. Neurology 77:2034–2042
14. Roy CS, Sherrington CS (1890) On the regulation of the blood-supply of the brain. J Physiol 11:85–158
15. Alsop DC, Detre JA (1998) Multisection cerebral blood flow MRimaging with continuous arterial spin labeling. Radiology 208:410–416
16. Detre JA, Leigh JS, Williams DS, Koretsky AP (1992) Perfusionimaging. Magn Reson Med 23:37–45
17. Takahashi H, Ishii K, Hosokawa C et al (2013) Clinical application of3D arterial spin-labeled brain perfusion imaging for Alzheimer dis-ease: comparison with brain perfusion SPECT. AJNR Am JNeuroradiol
18. Alsop DC, Dai W, GrossmanM, Detre JA (2010) Arterial spin label-ing blood flow MRI: its role in the early characterization ofAlzheimer's disease. J Alzheimers Dis 20:871–880
19. Binnewijzend MA, Kuijer JP, Benedictus MR et al (2012) Cerebralblood flow measured with 3D pseudocontinuous arterial spin-labeling MR imaging in Alzheimer disease and mild cognitive im-pairment: a marker for disease severity. Radiology 267:221–230
20. Dai W, Lopez OL, Carmichael OT, Becker JT, Kuller LH, Gach HM(2009)Mild cognitive impairment and Alzheimer disease: patterns ofaltered cerebral blood flow at MR imaging. Radiology 250:856–866
21. Johnson NA, Jahng GH, Weiner MWet al (2005) Pattern of cerebralhypoperfusion in Alzheimer disease and mild cognitive impairmentmeasured with arterial spin-labeling MR imaging: initial experience.Radiology 234:851–859
22. Du AT, Jahng GH, Hayasaka S et al (2006) Hypoperfusion infrontotemporal dementia and Alzheimer disease by arterial spin la-beling MRI. Neurology 67:1215–1220
23. Hu WT, Wang Z, Lee VM, Trojanowski JQ, Detre JA, Grossman M(2010) Distinct cerebral perfusion patterns in FTLD and AD.Neurology 75:881–888
24. Chen Y, Wolk DA, Reddin JS et al (2011) Voxel-level comparison ofarterial spin-labeled perfusion MRI and FDG-PET in Alzheimer dis-ease. Neurology 77:1977–1985
25. Musiek ES, Chen Y, KorczykowskiM et al (2012) Direct comparisonof fluorodeoxyglucose positron emission tomography and arterialspin labeling magnetic resonance imaging in Alzheimer's disease.Alzheimers Dement 8:51–59
26. van der Flier WM, Pijnenburg YA, Prins N et al (2014) Optimizingpatient care and research: the Amsterdam Dementia Cohort. JAlzheimers Dis 41:313–327
27. McKhann GM, Knopman DS, Chertkow H et al (2011) The diagno-sis of dementia due to Alzheimer's disease: recommendations fromthe National Institute on Aging-Alzheimer's Association workgroupson diagnostic guidelines for Alzheimer's disease. Alzheimers Dement7:263–269
28. Rascovsky K, Hodges JR, Knopman D et al (2011) Sensitivity ofrevised diagnostic criteria for the behavioural variant offrontotemporal dementia. Brain 134:2456–2477
29. Ossenkoppele R, Zwan MD, Tolboom N et al (2012) Amyloid bur-den and metabolic function in early-onset Alzheimer's disease: pari-etal lobe involvement. Brain 135:2115–2125
30. Ossenkoppele R, Tolboom N, Foster-Dingley JC et al (2012)Longitudinal imaging of Alzheimer pathology using [(11)C]PIB,[(18)F]FDDNP and [(18)F]FDG PET. Eur J Nucl Med Mol Imaging
31. Jenkinson M, Smith S (2001) A global optimisation method for ro-bust affine registration of brain images. Med Image Anal 5:143–156
Eur Radiol

32. Liu Y, Zhu X, Feinberg D et al (2012) Arterial spin labeling MRIstudy of age and gender effects on brain perfusion hemodynamics.Magn Reson Med 68:912–922
33. Edison P, Archer HA, Hinz R et al (2007) Amyloid, hypometabolism,and cognition in Alzheimer disease: an [(11)C]PIB and [18F]FDGPET study. Neurology 68:501–508
34. Koedam EL, Lehmann M, van der Flier WM et al (2011) Visualassessment of posterior atrophy development of a MRI rating scale.Eur Radiol 21:2618–2625
35. Borroni B, Grassi M, Premi E et al (2012) Neuroanatomical corre-lates of behavioural phenotypes in behavioural variant offrontotemporal dementia. Behav Brain Res 235:124–129
36. Binnewijzend MA, Kuijer JP, van der Flier WM et al (2014) Distinctperfusion patterns in Alzheimer's disease, frontotemporal dementiaand dementia with Lewy bodies. Eur Radiol 24:2326–2333
37. Ibanez V, Pietrini P, Alexander GE et al (1998) Regional glucosemetabolic abnormalities are not the result of atrophy in Alzheimer'sdisease. Neurology 50:1585–1593
38. Shimizu S, Zhang Y, Laxamana J et al (2010) Concordance anddiscordance between brain perfusion and atrophy in frontotemporaldementia. Brain Imaging Behav 4:46–54
39. Meltzer CC, Zubieta JK, Brandt J, Tune LE, Mayberg HS, Frost JJ(1996) Regional hypometabolism inAlzheimer's disease asmeasuredby positron emission tomography after correction for effects of partialvolume averaging. Neurology 47:454–461
40. Hutton BF, Thomas BA, Erlandsson K et al (2013) What approach tobrain partial volume correction is best for PET/MRI? Nucl InstMethods Phys Res A 29–33
Eur Radiol


