Embed Size (px)
Citation preview
2
PREPARED BY C, MURAPE; B, TARUVINGA; N, MUNGWINI & D, MUYECHE
CFI2101 CFI2101 CFI2101
NATIONAL UNIVERSITY OF SCIENCE & TECHNOLOGY
DEPARTMENT OF FINANCE
CORPORATE FINANCE I
(CFI2101)
2014/2015 ACADEMIC YEAR
3
PREPARED BY C, MURAPE; B, TARUVINGA; N, MUNGWINI & D, MUYECHE
CFI2101 CFI2101 CFI2101
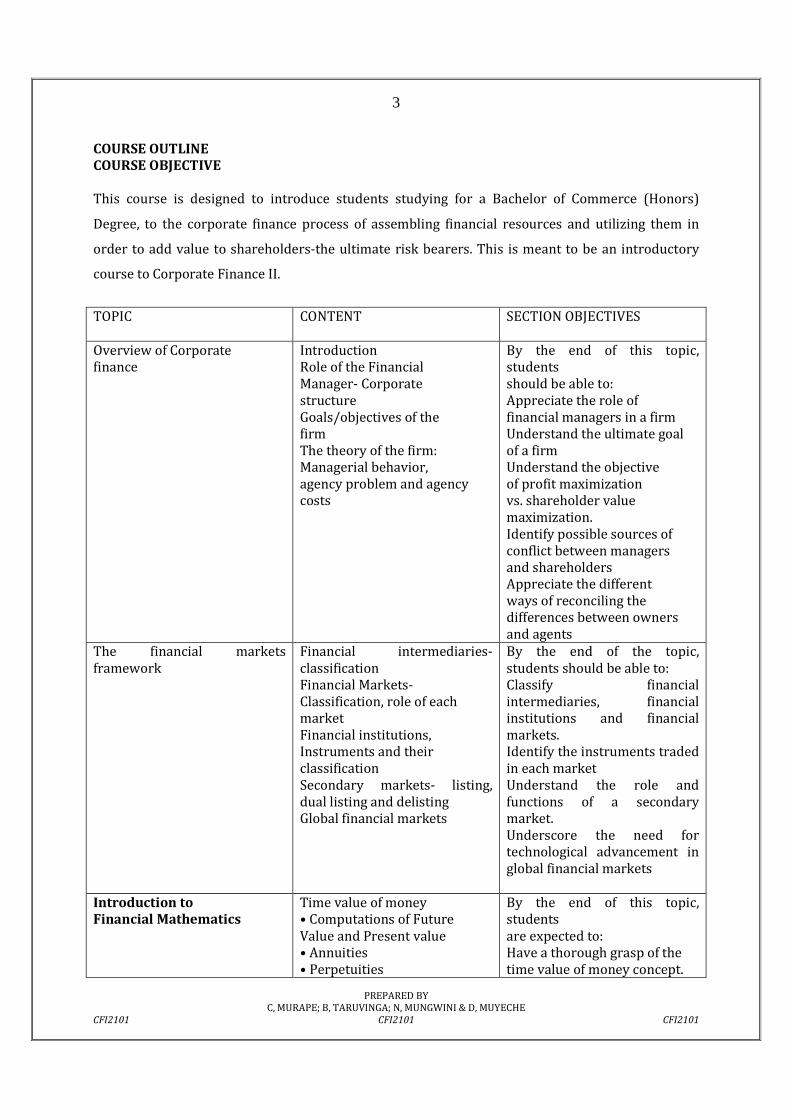
COURSE OUTLINE COURSE OBJECTIVE This course is designed to introduce students studying for a Bachelor of Commerce (Honors)
Degree, to the corporate finance process of assembling financial resources and utilizing them in
order to add value to shareholders-the ultimate risk bearers. This is meant to be an introductory
course to Corporate Finance II.
TOPIC
CONTENT SECTION OBJECTIVES
Overview of Corporate finance
Introduction Role of the Financial Manager- Corporate structure Goals/objectives of the firm The theory of the firm: Managerial behavior, agency problem and agency costs
By the end of this topic, students should be able to: Appreciate the role of financial managers in a firm Understand the ultimate goal of a firm Understand the objective of profit maximization vs. shareholder value maximization. Identify possible sources of conflict between managers and shareholders Appreciate the different ways of reconciling the differences between owners and agents
The financial markets framework
Financial intermediaries-classification Financial Markets- Classification, role of each market Financial institutions, Instruments and their classification Secondary markets- listing, dual listing and delisting Global financial markets
By the end of the topic, students should be able to: Classify financial intermediaries, financial institutions and financial markets. Identify the instruments traded in each market Understand the role and functions of a secondary market. Underscore the need for technological advancement in global financial markets
Introduction to Financial Mathematics
Time value of money • Computations of Future Value and Present value • Annuities • Perpetuities
By the end of this topic, students are expected to: Have a thorough grasp of the time value of money concept.

4
PREPARED BY C, MURAPE; B, TARUVINGA; N, MUNGWINI & D, MUYECHE
CFI2101 CFI2101 CFI2101
• Compounding periods • Effective annual interest rates
Have an appreciation of computations of Future value and Present value of different cash flow streams
Valuation of equity and debt securities
Discount Cash-flow(DCF) valuation model Bond fundamentals and bond valuation Valuation of common stock Valuation of preferred stock
By the end of the topic, students are expected to: Appreciate value of assets as PV of expected future cash flows Appreciate the discount rates used in each model. Able to determine the expected future cash flows Appreciate r/ship between the price of asset and other input fin variables.
Capital Budgeting
The capital budgeting process, Basic principles of capital budgeting Project classification and identification of relevant cash flows Independent versus mutually exclusive projects, Capital budgeting techniques: net present value (NPV), internal rate of return (IRR), payback period (PBP), discounted payback (DPBP). NPV profile, comparison of NPV and IRR methods when evaluating independent and mutually exclusive projects,
By the end of this topic, students should be able to: Appreciate the concept of limited financial resources Understand the difference between independent projects and mutually exclusive projects Appreciate the steps in the capital budgeting making process Familiarize with the different capital budgeting tools and their application in aiding decision making. Appreciate the Pros and Cons associated with each tool Calculate the relevant cash flows associated with a particular cash flow
Risk and Return
Types of risk Measures of risk (measuring stand alone risk)-probability, expected return, standard deviation, variance Risk aversion Relationship between risk and return
By the end of this topic, students should be able to: Define the risk types Explain the measures of risk Calculate risk, standard deviation Explain the relationships between risk and return
Portfolio Theory and CAPM Risk in Portfolio context Portfolio risk & Return-
After completion of this topic, the
5
PREPARED BY C, MURAPE; B, TARUVINGA; N, MUNGWINI & D, MUYECHE
CFI2101 CFI2101 CFI2101
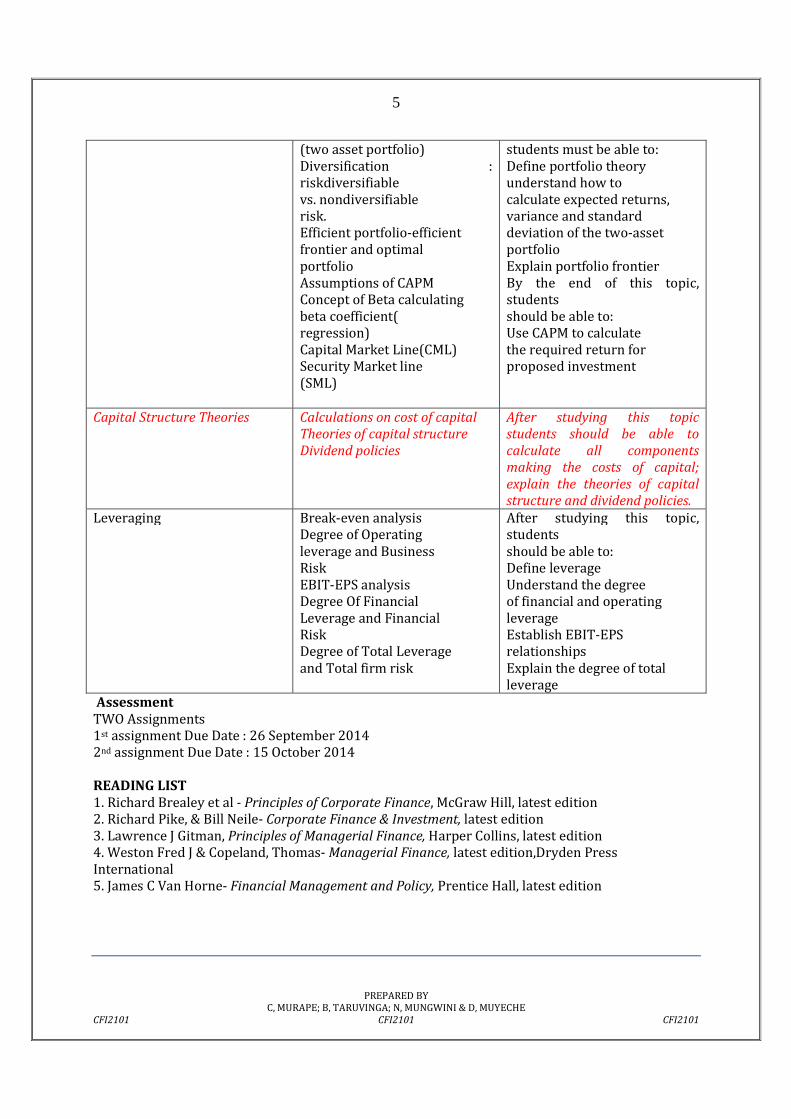
(two asset portfolio) Diversification : riskdiversifiable vs. nondiversifiable risk. Efficient portfolio-efficient frontier and optimal portfolio Assumptions of CAPM Concept of Beta calculating beta coefficient( regression) Capital Market Line(CML) Security Market line (SML)
students must be able to: Define portfolio theory understand how to calculate expected returns, variance and standard deviation of the two-asset portfolio Explain portfolio frontier By the end of this topic, students should be able to: Use CAPM to calculate the required return for proposed investment
Capital Structure Theories
Calculations on cost of capital Theories of capital structure Dividend policies
After studying this topic students should be able to calculate all components making the costs of capital; explain the theories of capital structure and dividend policies.
Leveraging
Break-even analysis Degree of Operating leverage and Business Risk EBIT-EPS analysis Degree Of Financial Leverage and Financial Risk Degree of Total Leverage and Total firm risk
After studying this topic, students should be able to: Define leverage Understand the degree of financial and operating leverage Establish EBIT-EPS relationships Explain the degree of total leverage
Assessment TWO Assignments 1st assignment Due Date : 26 September 2014 2nd assignment Due Date : 15 October 2014 READING LIST 1. Richard Brealey et al - Principles of Corporate Finance, McGraw Hill, latest edition 2. Richard Pike, & Bill Neile- Corporate Finance & Investment, latest edition 3. Lawrence J Gitman, Principles of Managerial Finance, Harper Collins, latest edition 4. Weston Fred J & Copeland, Thomas- Managerial Finance, latest edition,Dryden Press International 5. James C Van Horne- Financial Management and Policy, Prentice Hall, latest edition
6
PREPARED BY C, MURAPE; B, TARUVINGA; N, MUNGWINI & D, MUYECHE
CFI2101 CFI2101 CFI2101
Chapter1: OVERVIEW OF CORPORATE FINANCE
This topic identifies the ultimate goal of a firm, different roles a financial manager plays in a firm,
pointing out the possible sources of conflict between managers and shareholders with a view of
reconciling the differences so as to ensure overall organizational success.
1.1 Corporate finance: definition
Corporate finance is a key function of all business firms that deal with long-term and short-
term financial decisions taken by firms to maximize their value and minimize their risk. It is
concerned with areas like financial forecasting, financial planning and budgeting,
procurement of funds (capital structure decisions), investment analysis (capital budgeting
decisions), optimal utilization of funds, credit management, cash management and
inventory management.
In short, corporate finance is all about decisions that are made by corporations and their effect on
value creation. Corporations are identified by 3 distinct characteristics;
� They are legal entities
� They have limited liability
� There is separation of ownership and control
1.1.1 Types of corporations
1. Public companies
2. Private companies
3. Limited liability companies e,g partnerships, professional firms etc
Corporate finance has 3 main areas of concern
� Capital budgeting; What long term investments should the firm undertake?
� Capital structure: what debt to equity mix is required to finance operations? Where will the
firm get the long term financing to pay for its investments?
� Working capital management: how should the firm manage its everyday financial activities?
7
PREPARED BY C, MURAPE; B, TARUVINGA; N, MUNGWINI & D, MUYECHE
CFI2101 CFI2101 CFI2101
1.2 The objective of the firm
The main objective of a firm is to maximize shareholder value by increasing the value of the
company’s stock.
Other objectives the firm may pursue are;
Survival
Maximizing market share
Maximizing profits
Employee safety
Ethical and environmental concerns
Social responsibility
Class discussion: profit maximisation vis-a-vi shareholder value maximization
1.3 Role of financial managers
In any corporation the finance manager is responsible for 2 basic decisions;
� Financing decisions
� Investment decisions
The finance manager manages the existing assets of the firm and invests in new assets. The job of
the finance manager is to procure funds to carry out business activities, grow the business, make
long-term investments, and judicially disburse and utilize the funds. He/she takes investment
decisions to buy real assets. Real assets produce real cash flows that increase the value of the
existing shareholders. The enhanced value of the firm retains existing investors and attracts
potential investors.
A finance manager also carries out treasury operations, which deal with effective management of
the surplus cash. The surplus cash is invested in the money market and in other liquid capital
market instruments. The treasury management deals with operations in the forex market, tax
planning, maintenance of the share price, and so on.
The role of a finance manager has moved beyond traditional accounting functions like
preparing accounting and financial statements, collecting revenues and disbursing
expenses. Today, organizations have become large and more complex. Financial
management now involves a broader horizon where value maximization has gained prime
importance .The new-millennium finance manager is concerned with all the business
8
PREPARED BY C, MURAPE; B, TARUVINGA; N, MUNGWINI & D, MUYECHE
CFI2101 CFI2101 CFI2101
activities that involve funds, directly or indirectly. He/she does not restrict himself/herself
to specific activities. Some of the duties the finance manager is supposed to perform are as
follows:
1.3.1 Forecasting and planning
A finance manager has to forecast and predict the short- and long-term requirement of
money by the business and also forecast the activity levels of the various business
operations so that it preplans what to manufacture and deliver at what price to the
customers. The finance manager has to take these decisions in the light of both the external
and internal factors that affect the business activities.
1.3.2 Analysing and evaluating the investment activities
A finance manager needs to understand and evaluate the various activities of the business,
especially the long-term investment activities. He/she needs to understand the costs and
benefits associated with the long-term investments, i.e., their feasibility. As a rule, firms go
for those long-term investment activities which generate positive value for the firm and the
rest are rejected.
1.3.3 Coordination and control
A finance manager focuses on the generation of the funds and their allocation to various
organizational activities. The various organizational activities are to be coordinated and
controlled to ensure cost effectiveness and maximum efficiency in terms of value
generation.
1.3.4 Understanding the finance market
The growth and activeness of the capital market ensures that the finance managers can
gain immensely from the capital market knowledge. The finance managers have to decide
the mode of short-term investments in the money market, and the liquid investments and
the long-term investments in the stock market. These investments have to be liquid as well
as profitable so that they add value to the firm's invested amount.
1.3.5 Risk management
A very important function of a finance manager is to understand risk management of the
business. He/she needs to evaluate the risks the business faces. The various risks faced by
the firm are to be managed proactively and necessary arrangements should be made to
eliminate, reduce and avoid them. He/she also needs to analyse and categorize the various
risks faced by the business.
9
PREPARED BY C, MURAPE; B, TARUVINGA; N, MUNGWINI & D, MUYECHE
CFI2101 CFI2101 CFI2101
1.3.6 Performance measurement
In the end, a finance manager is supposed to evaluate the performance of his/her firm. The
financial performance of the firm is appraised holistically, activity wise and department
wise. These performance appraisals are evaluated with the set targets to determine
positive and negative deviations, if any.
1.4 The Agency Problem and Control of the Corporation
A financial manager acts in the best interests of the stockholders by taking actions that
increase stock value. However, in large corporations ownership can be spread over a huge
number of stockholders. This dispersion of ownership arguably means that management
effectively controls the firm. In this case, will management necessarily act in the best
interests of the stockholders? Put another way, might not management pursue its own
goals at the stockholders’expense?
1.4.1 Agency Relationships
The relationship between stockholders and management is called an agency relationship.
An agency relationship exists whenever someone (the principal) hires another (the agent)
to represent his or her interests. Hence the relationship between stockholders and
management and that of management and creditors is called an agency relationship. In all
such relationships there is a possibility of a conflict of interest between the principal and
the agent. Such a conflict is called an agency problem.
Sources of shareholder value drivers
� Revenue enhancement
� Operating costs reduction
� Cost of capital reduction
� Asset utilization
Goals of management may include
� Management of salaries (compensation)
� Protection of their employment (job security)
� Maximizing profits
� Empire building
10
PREPARED BY C, MURAPE; B, TARUVINGA; N, MUNGWINI & D, MUYECHE
CFI2101 CFI2101 CFI2101
Managing the agency problem
Strategic financial management should therefore ensure that the agency problem is
managed to reasonable levels so that shareholder value is enhanced.
The divergence of management and shareholder objectives can be managed through;
Market forces
Agency costs
Organizational structuring
Questions
1. Evaluate the following statement “Managers should not focus on the current stock
value as doing so will lead to an overemphasis on short term profits at the expense
of long term profits”.
2. Suppose you were the financial manager of a non-profit making organization, what
kinds of goals would be appropriate?
3. Suppose you own stock in a company. The current price per share is $25. Another
company has just announced that it wants to buy your car and will pay $35 per
share to acquire all the outstanding stock. Your company’s management
immediately begins fighting off this hostile bid. Is management acting in the
shareholder’s best interest? Justify your answer.
4. Why is the goal of financial management to maximize current share price rather
than future share price?
5. The emergence of strong financial markets has changed the face of how businesses
and capital are to be managed. In line with this statement, explain how the duties of
a finance manager has been affected.
11
PREPARED BY C, MURAPE; B, TARUVINGA; N, MUNGWINI & D, MUYECHE
CFI2101 CFI2101 CFI2101
Chapter2: The Financial Markets Framework
This topic looks at how the financial intermediaries and financial markets are structured and
classified, as well as the instruments traded in these markets. It concludes by analyzing the global
financial markets.
Financial Intermediaries
Financial intermediaries make up the main conduit through which surplus units lend to the deficit
units or vis-a-vi (the conduit through which deficit units borrow from surplus units).
Financial intermediaries are institutions who are always prepared to play the role of a deficit unit
towards a particular surplus unit and a surplus unit towards a particular deficit unit at the same
time. This way the pitfalls of direct financing are eliminated.
In executing their role, financial intermediaries create financial securities or instruments which are
basically pieces of paper serving as acknowledgement of the act of either having borrowed or
loaned and also agreeing to abide by the terms of the transaction. While the financial intermediary
borrows from the surplus unit, it is not the primary or the ultimate user of the funds, hence it issues
a primary security to the deficit unit (which is the primary borrower) to reflect the essence of the
whole transaction and flow of funds.
Classification of financial instruments issued by financial intermediaries.
1 Primary securities (issued by ultimate borrowers)
a)Representing the obligations of the private sector
i.Bankers acceptances
ii.Trade Bills
iii.Promissory Notes
iv.Company Debentures
v.Securitized Mortgages
12
PREPARED BY C, MURAPE; B, TARUVINGA; N, MUNGWINI & D, MUYECHE
CFI2101 CFI2101 CFI2101
b)Representing the obligations of the public sector
i.Treasury Bills
ii.Government Stocks
c)Representing the obligations of the quasi-public sector
i.Municipal Bonds
ii.Parastatal Stocks
iii.Prescribed Asset Bills
2.Indirect Securities (issued by financial intermediaries)
a)Representing the obligations of private banks
i.Negotiable certificates of deposit
b)Representing the obligations of public and semi public banks
i.Treasury Bills, Notes and Bonds
ii.Development Banks paper
3.Repurchase agreements
Functions of financial intermediaries
� Diversification of risk
� Pooling of small quantities of surplus funds into a bigger fund
� Bringing into the financial system savings that would otherwise have not been brought into
the formal system.
� Enabling deficit units to spend beyond their current income
� Efficient allocation of funds.
Classification of financial intermediaries
13
PREPARED BY C, MURAPE; B, TARUVINGA; N, MUNGWINI & D, MUYECHE
CFI2101 CFI2101 CFI2101
They are divided into two broad catagories; deposit taking and non deposit taking
intermediaries.further subcategories are also attached to each broad category as shown below
1.Deposit taking intermediaries
a)Banking intermediaries
i.The central bank
ii.Infrastructural development banks
iii.Commercial banks
iv.Discount houses
b)Non banking intermediaries
i.Building societies
ii.Savings banks (POSB)
2.Non deposit taking intermediaries
a)Contractual intermediaries
i.Insurance and life assurance companies
ii.Pension and provident fund companies
iii.National Investment trusts
b)Portfolio institutions
i.Unit trusts
ii.Investment trusts
c)Other financial intermediaries
i.Finance companies
ii,Trusts
14
PREPARED BY C, MURAPE; B, TARUVINGA; N, MUNGWINI & D, MUYECHE
CFI2101 CFI2101 CFI2101
2.1 Financial Markets
Financial markets is the umbrella term for all the economic units i.e surplus and deficit units, financial
institutions and financial instruments, which all interact for the benefit of the participants involved in
the economy.
These basically consist of the following:
a. Money markets
It is the market for short term securities. These provide short term debt funding and
investment opportunities through the issuing of instruments or claims whose tenure is less
than one year. Money markets are split into primary and secondary markets. The primary
market are markets in which securities are created and issued for the first time whilst the
secondary market is where previously issued securities are bought and sold among
investors.
b. Capital markets
These provide long term funding (debt and equity) and investment opportunities through
the issuing and trading of instruments or claims whose tenure is more than a year. They can
also be divided into primary and secondary markets. Capital markets can also be sub-
divided into stock markets and bond markets.
• Stock markets are those markets epitomized by the stock exchange (secondary market
shares), provide funding through the issuing in the primary markets, of ownership claims or
securities called common stock or shares.
• Bond markets provide long term debt funding through issuing (in the primary market) and
trading in the secondary market of bonds, debentures and notes.
c. Commodities markets
These facilitates the trading of commodities like agricultural products and minerals.
d. Foreign exchange markets

15
PREPARED BY C, MURAPE; B, TARUVINGA; N, MUNGWINI & D, MUYECHE
CFI2101 CFI2101 CFI2101
These facilitate international trade and access to services from countries by providing a
platform through which economic agents in one country can transform purchasing power
from their currency to another currency.
e. Derivative markets
These offer hedging and portfolio insurance services by providing instruments that can be
used to manage financial or price risk.
f. Insurance markets
These provide a platform for the redistribution of various kinds of risk.
2.1.2 Secondary markets
These are markets in which securities are traded. There are two main markets:
� Organized exchanges
� Over the counter exchanges
2.1.2.1Organized exchanges
Stock markets operate as auction markets as buyers and sellers are matched. Examples of stock
exchanges:
Zimbabwe Stock exchange
New York stock exchange
London stock exchange
Zambia stock exchange
2.1.2.2 Over the counter markets
It is an interchangeable organization that is used to describe any buying or selling activities in
securities that does not take place on an exchange.
It is also called a dealer market in that business is conducted across borders by brokers and dealers
via communication lines such as internet, telephone etc
16
PREPARED BY C, MURAPE; B, TARUVINGA; N, MUNGWINI & D, MUYECHE
CFI2101 CFI2101 CFI2101
2.1.3 Importance of secondary markets
� They provide an indication of the value of a company.
� Secondary markets provide liquidity by enabling investors to sell their shares.
� It provides a forum for exchange hence reducing search costs.
2.2 Listing on the stock exchange
An exchange does not deal in securities of all companies. It has to select the companies whose
shares can be allowed to be bought and sold by setting strict standards and entry requirements for
listing.
2.2.1Reasons for listing
� It increases liquidity.
� It facilitates the raising of new cash.
� It enables founders to diversify their portfolios.
� To establish value of the company.
� Prestigious reasons.
2.2.1.2 Disadvantages of listing
� Costs of reporting
� Disclosure requirements
� Self dealings
� Inactive low markets
� Control
2.2.2 Dual listing
Dual listing is whereby a company is listed on more than one stock exchange.
17
PREPARED BY C, MURAPE; B, TARUVINGA; N, MUNGWINI & D, MUYECHE
CFI2101 CFI2101 CFI2101
Generally such a company’s primary listing is on a stock exchange in its country of incorporation
and its secondary listing is on an exchange in another country.
Examples of Companies in Dual listing
Old Mutual- which has the primary listing in London Stock Exchange, a secondary listing on
Johannesburg Stock exchange and Zimbabwe Stock exchange.
PPC- has primary listing on the Johannesburg Stock exchange and a secondary listing on Zimbabwe
Stock exchange.
Hwange Colliery- which has primary listing on the Zimbabwe Stock exchange and a secondary
listing on Luxembourg Stock exchange.
2.2.2.1Reasons for dual listing
� Improved accessibility to funds- the stock exchange provides companies with the facility to
raise cash.
� To gain access to a larger investor base.
� Improved visibility and access.
2.2.2.2 Disadvantages of dual listing
� The company has to comply with the listing requirements of both markets.
� Costs of reporting.
� Accessibility of information- need to ensure that the same information is availed to both
markets.
2.2.3 Delisting
It is the process of making a public company private. It can be voluntary or it can be caused by the
company falling short of listing requirements.
18
PREPARED BY C, MURAPE; B, TARUVINGA; N, MUNGWINI & D, MUYECHE
CFI2101 CFI2101 CFI2101
2.2.3.1 Reasons for delisting
� Undervalued shares e g Interfresh
� Financial flexibility
� Mergers and Acquisitions-
� Financial problems of entities/ viability problems
� Control issues
� Fear of takeover
2.3 Money market instruments
Money market instruments can be classified into two categories ; interest bearing and zero coupon
(discount) instruments.
Interest bearing instruments
1. Certificates of deposit
Discount securities
1. Treasury bills
2. Bankers Acceptances
3. Commercial paper
4. Trade bills
Student to research on these.
Global financial markets
This is the linkage of national financial market segments (commodities markets, foreign exchange
markets, derivative markets etc)to form various international market segments whose integration
results in a universal or global financial market.
19
PREPARED BY C, MURAPE; B, TARUVINGA; N, MUNGWINI & D, MUYECHE
CFI2101 CFI2101 CFI2101
Factors leading to the globalization of financial markets
Deregulation
� Deregulation
� Technological advancement
Class discussion
How has deregulation and technological advancements assisted in the globalization of financial
markets.
20
PREPARED BY C, MURAPE; B, TARUVINGA; N, MUNGWINI & D, MUYECHE
CFI2101 CFI2101 CFI2101
Chapter 3:
Introduction to Financial Mathematics
Topic Objectives
Have a thorough grasp of the time value of money concept.
Have an appreciation of computations of Future value, Present value, ordinary
annuity and annuity dues.
3.0 The primary objective of financial management is to maximize the value of the firm’s
stock. Stock values depend in part on the timing of the cash flows investors expect to
receive from an investment—a dollar expected soon is worth more than a dollar expected
in the distant future. Therefore, it is essential for financial managers to have a clear
understanding of the time value of money and its impact on stock prices.
The principles of time value analysis (also called discounted cash flow (DCF) analysis) have
many applications in corporate finance eg
Valuation of long term securities
Valuation of assets
Capital budgeting
Lease or buy decisions etc
3.1 Time Value of Money
Most of the principles of financial decision making are based on a simple concept: that of
time preferences. All things equal one would prefer to receive a sum of money now rather
than the same amount sometime in the future. Offered a simple choice between USD1,000
now and USD1,000 in a year’s time: the choice is clear. One would take the money now. For
21
PREPARED BY C, MURAPE; B, TARUVINGA; N, MUNGWINI & D, MUYECHE
CFI2101 CFI2101 CFI2101
parting with cash or money for some time, an investor would expect to be rewarded in the
form of interest. Interest calculations are straight forward and they form one of the basic
building blocks of financial mathematics.
3.2 Definition of terms
• Time Lines – is a diagrammatic representation of cash-flows which is used by
analysts to help visualize what is happening in a particular problem and then to help
set up the problem for solution.
• Present Value is the current worth of a future sum of money or stream of cash
flows given a specified rate of return. Future cash flows are discounted at the given
interest rate, and the higher the discount rate, the lower the present value of the
future cash flows. Determining the appropriate discount rate is the key to properly
valuing future cash flows, whether they be earnings or obligations.
• Future Value is the value of an asset or cash at a specified date in the future that is
equivalent in value to a specified sum today. A dollar in hand today is worth more
than a dollar to be received in the future because, if you had it now, you could invest
it, earn interest, and end up with more than one dollar in the future. The process of
going from today’s values, or present values (PVs), to future values (FVs) is called
compounding.
• Annuity - An annuity is a series of equal payments or receipts that occur at evenly
spaced intervals. Leases and rental payments are examples. The payments or
receipts occur at the end of each period for an ordinary annuity while they occur at
the beginning of each period for an annuity due.
• Perpetuity - is an infinite and constant stream of identical cash flows.
22
PREPARED BY C, MURAPE; B, TARUVINGA; N, MUNGWINI & D, MUYECHE
CFI2101 CFI2101 CFI2101
Smple interest
Interest is the price paid for the use of borrowed money. Interest is paid by the party who
uses or borrows the money to the party who lends them the money. For example: if a
company borrows $1,000 from the bank at an interest of 10% per year/annum, simple
interest payable on the amount borrowed can be expressed as;
Simple interest =12% of $1,000
12/100 X $1,000
$120
Therefore future value of the borrowed funds at the end of 1 year will be:
�� = ��������1 + �� �� = ���1 + ��
= $1000�1 + 0.12�
= 1120
Compound interest
If interest is charged on the outstanding amount more than once in a year, then interest is
said to be compounded. In such a case, then the future value is:
�� = ���1 + ���
�ℎ���
i is the interest rate per compounding period = ��
n is the number of compounding periods in the investment period=t*m
Continuous compounding
Continuous Compounding is a situation in which interest is added continuously rather than
at discrete points in time. As such, continuous compounding produces higher future value
than periodic compounding with any frequency m, given the same initial principal P and
interest rate r.
23
PREPARED BY C, MURAPE; B, TARUVINGA; N, MUNGWINI & D, MUYECHE
CFI2101 CFI2101 CFI2101
�� = ��� ∗ !"
Present value of an annuity
Suppose you were offered the following alternatives: (1) a three-year annuity with
payments of $100 or (2) a lump sum payment today. Suppose you have no need for the
money during the next three years, so if you accept the annuity, you would deposit the
payments in a bank account that pays 5 percent interest per year. Similarly, the lump sum
payment would be deposited into a bank account. How large must the lump sum payment
today be to make it equivalent to the annuity?
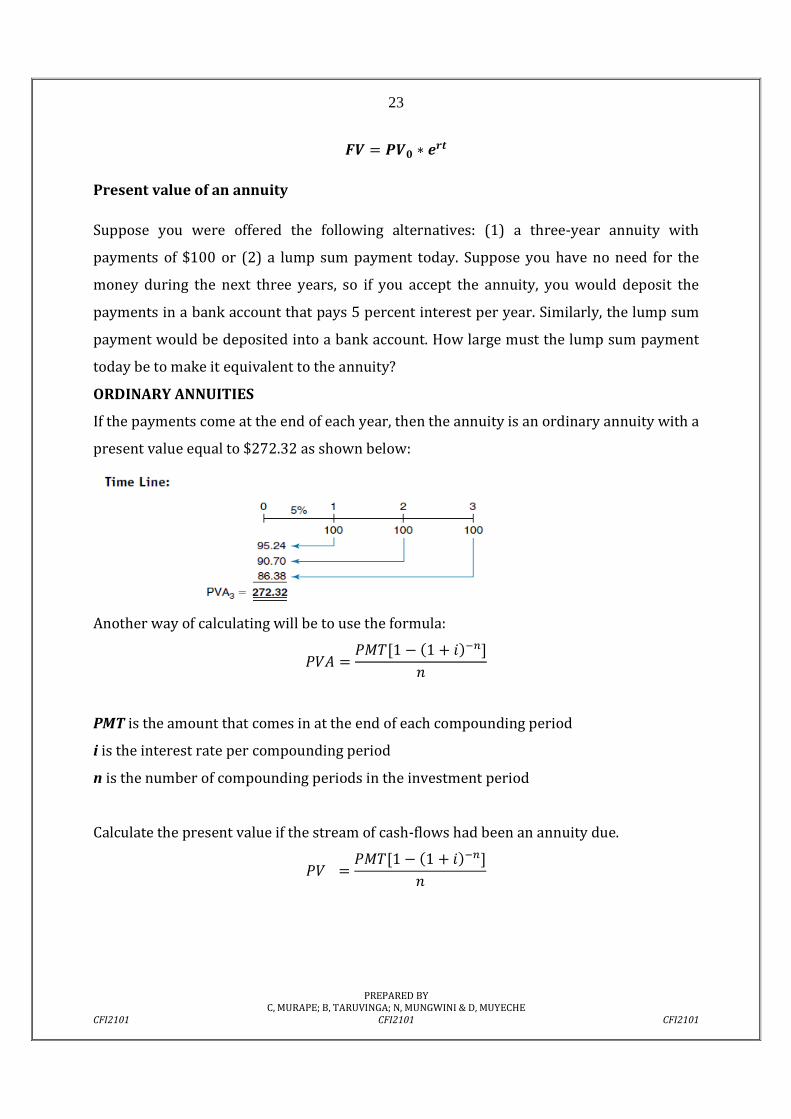
ORDINARY ANNUITIES
If the payments come at the end of each year, then the annuity is an ordinary annuity with a
present value equal to $272.32 as shown below:
Another way of calculating will be to use the formula:
��# = �$%[1 − �1 + ��(�]�
PMT is the amount that comes in at the end of each compounding period
i is the interest rate per compounding period
n is the number of compounding periods in the investment period
Calculate the present value if the stream of cash-flows had been an annuity due.
�� = �$%[1 − �1 + ��(�]�
24
PREPARED BY C, MURAPE; B, TARUVINGA; N, MUNGWINI & D, MUYECHE
CFI2101 CFI2101 CFI2101
COMPARISON OF DIFFERENT TYPES OF INTEREST RATES
Finance deals with three types of interest rates: nominal rates, iNom; periodic rates, iPER; and
effective annual rates, EAR or EFF%. Therefore, it is essential that you understand what
each one is and when it should be used.
Nominal, or quoted, rate. This is the rate that is quoted by banks, brokers, and other
financial institutions, also called the Annual Percentage Rate (APR). However, to be
meaningful, the quoted nominal rate must also include the number of compounding
periods per year. For example, a bank might offer 6 percent, compounded quarterly, on
CDs, or a mutual fund might offer 5 percent, compounded monthly, on its money market
account. Nominal rates can be compared with one another, but only if the instruments being
compared use the same number of compounding periods per year.
2. Periodic rate, iPER. This is the rate charged by a lender or paid by a borrower each
period. It can be a rate per year, per six-month period, per quarter, per month, per day, or
per any other time interval.
i+,- = r/01m
Here iNom is the nominal annual rate and m is the number of compounding periods per
year.
The periodic rate is the rate that is generally shown on time lines and used in calculations.
3. Effective annual rates
If we are comparing the costs of loans that require payments more than once a year, or the
rates of return on investments that pay interest more frequently, then the comparisons
should be based on equivalent (or effective) rates of return. This concept of effective
annual rate or equivalence of nominal rates implies that accumulating or present-valuing
payments using equivalent rates produces the same answer. If rm is on an mthly nominal
basis, and rn is on an nthly nominal basis, in order for the present value of F payable at time
N years to be the same with either rate requires
��1 + �3� �� = ��1 + �4
� ��.(EAR)
25
PREPARED BY C, MURAPE; B, TARUVINGA; N, MUNGWINI & D, MUYECHE
CFI2101 CFI2101 CFI2101
CH 3: Time Value of Money Practise Questions
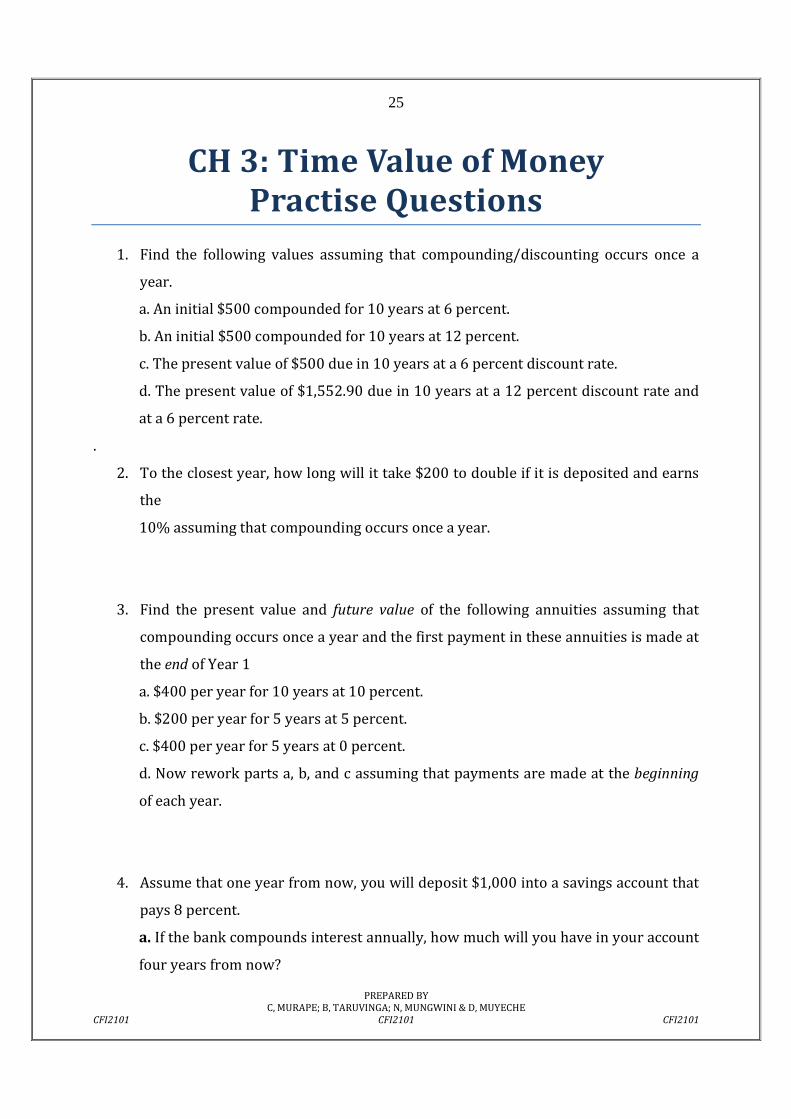
1. Find the following values assuming that compounding/discounting occurs once a
year.
a. An initial $500 compounded for 10 years at 6 percent.
b. An initial $500 compounded for 10 years at 12 percent.
c. The present value of $500 due in 10 years at a 6 percent discount rate.
d. The present value of $1,552.90 due in 10 years at a 12 percent discount rate and
at a 6 percent rate.
.
2. To the closest year, how long will it take $200 to double if it is deposited and earns
the
10% assuming that compounding occurs once a year.
3. Find the present value and future value of the following annuities assuming that
compounding occurs once a year and the first payment in these annuities is made at
the end of Year 1
a. $400 per year for 10 years at 10 percent.
b. $200 per year for 5 years at 5 percent.
c. $400 per year for 5 years at 0 percent.
d. Now rework parts a, b, and c assuming that payments are made at the beginning
of each year.
4. Assume that one year from now, you will deposit $1,000 into a savings account that
pays 8 percent.
a. If the bank compounds interest annually, how much will you have in your account
four years from now?
26
PREPARED BY C, MURAPE; B, TARUVINGA; N, MUNGWINI & D, MUYECHE
CFI2101 CFI2101 CFI2101
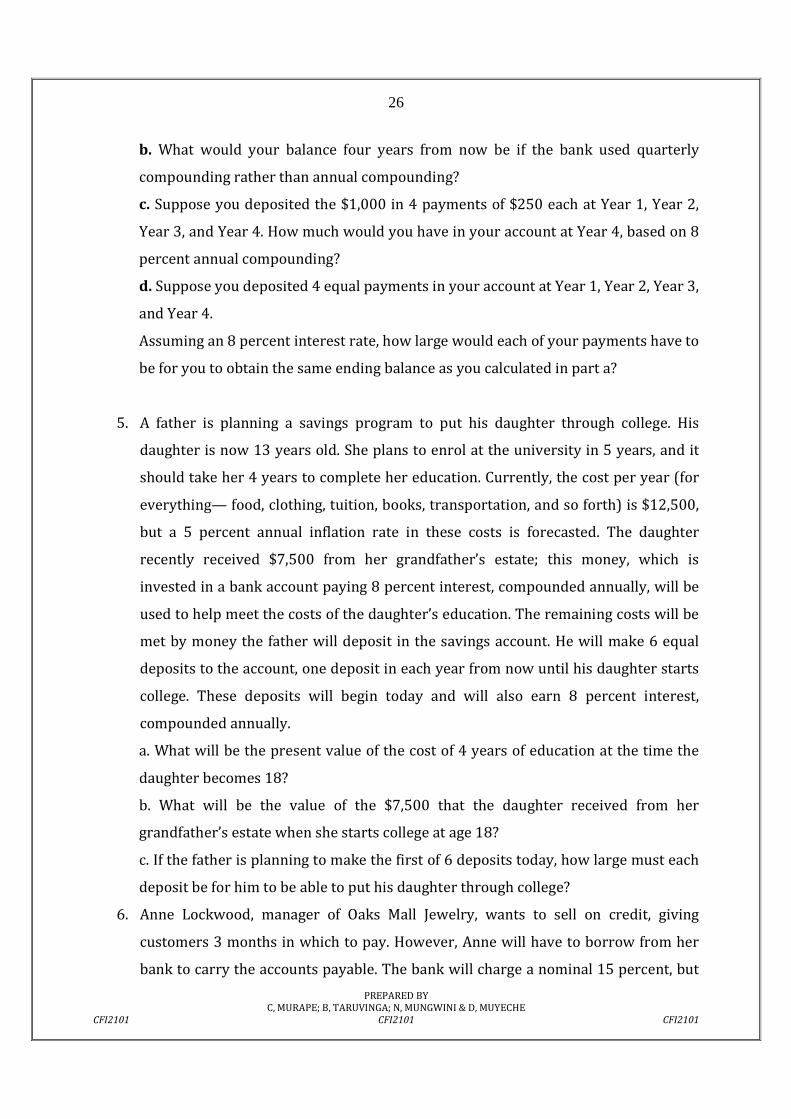
b. What would your balance four years from now be if the bank used quarterly
compounding rather than annual compounding?
c. Suppose you deposited the $1,000 in 4 payments of $250 each at Year 1, Year 2,
Year 3, and Year 4. How much would you have in your account at Year 4, based on 8
percent annual compounding?
d. Suppose you deposited 4 equal payments in your account at Year 1, Year 2, Year 3,
and Year 4.
Assuming an 8 percent interest rate, how large would each of your payments have to
be for you to obtain the same ending balance as you calculated in part a?
5. A father is planning a savings program to put his daughter through college. His
daughter is now 13 years old. She plans to enrol at the university in 5 years, and it
should take her 4 years to complete her education. Currently, the cost per year (for
everything— food, clothing, tuition, books, transportation, and so forth) is $12,500,
but a 5 percent annual inflation rate in these costs is forecasted. The daughter
recently received $7,500 from her grandfather’s estate; this money, which is
invested in a bank account paying 8 percent interest, compounded annually, will be
used to help meet the costs of the daughter’s education. The remaining costs will be
met by money the father will deposit in the savings account. He will make 6 equal
deposits to the account, one deposit in each year from now until his daughter starts
college. These deposits will begin today and will also earn 8 percent interest,
compounded annually.
a. What will be the present value of the cost of 4 years of education at the time the
daughter becomes 18?
b. What will be the value of the $7,500 that the daughter received from her
grandfather’s estate when she starts college at age 18?
c. If the father is planning to make the first of 6 deposits today, how large must each
deposit be for him to be able to put his daughter through college?
6. Anne Lockwood, manager of Oaks Mall Jewelry, wants to sell on credit, giving
customers 3 months in which to pay. However, Anne will have to borrow from her
bank to carry the accounts payable. The bank will charge a nominal 15 percent, but
27
PREPARED BY C, MURAPE; B, TARUVINGA; N, MUNGWINI & D, MUYECHE
CFI2101 CFI2101 CFI2101
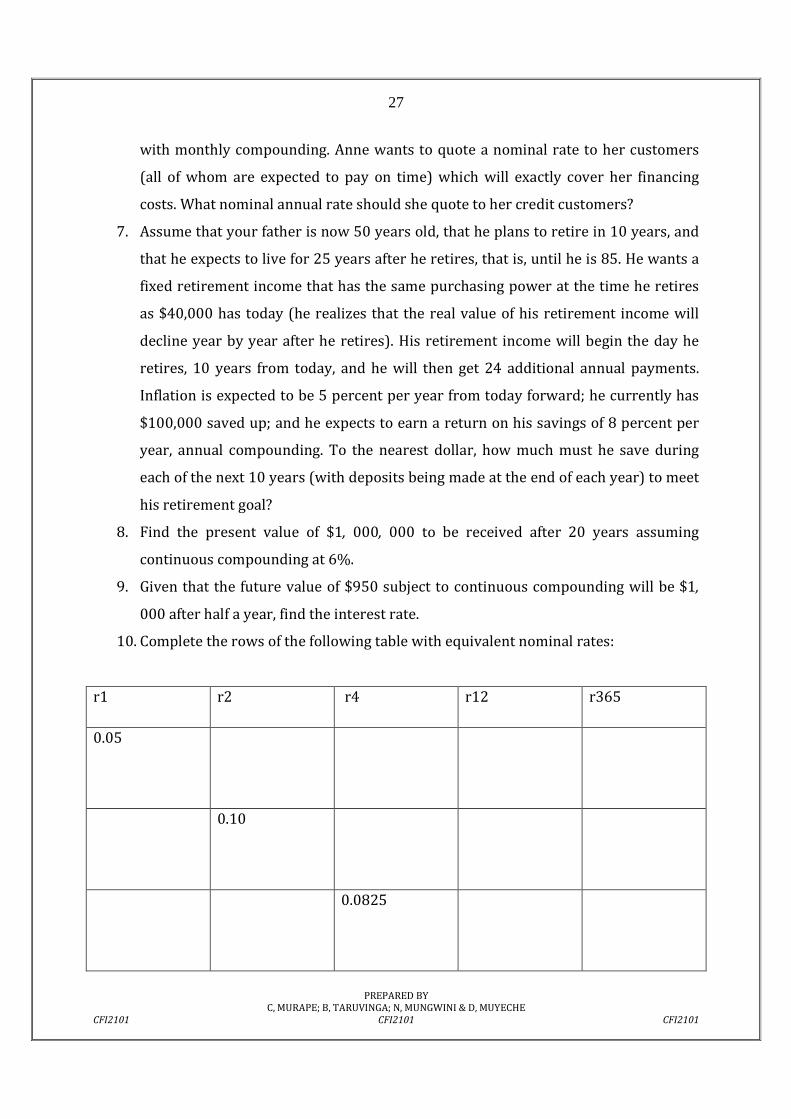
with monthly compounding. Anne wants to quote a nominal rate to her customers
(all of whom are expected to pay on time) which will exactly cover her financing
costs. What nominal annual rate should she quote to her credit customers?
7. Assume that your father is now 50 years old, that he plans to retire in 10 years, and
that he expects to live for 25 years after he retires, that is, until he is 85. He wants a
fixed retirement income that has the same purchasing power at the time he retires
as $40,000 has today (he realizes that the real value of his retirement income will
decline year by year after he retires). His retirement income will begin the day he
retires, 10 years from today, and he will then get 24 additional annual payments.
Inflation is expected to be 5 percent per year from today forward; he currently has
$100,000 saved up; and he expects to earn a return on his savings of 8 percent per
year, annual compounding. To the nearest dollar, how much must he save during
each of the next 10 years (with deposits being made at the end of each year) to meet
his retirement goal?
8. Find the present value of $1, 000, 000 to be received after 20 years assuming
continuous compounding at 6%.
9. Given that the future value of $950 subject to continuous compounding will be $1,
000 after half a year, find the interest rate.
10. Complete the rows of the following table with equivalent nominal rates:
r1 r2 r4 r12 r365
0.05
0.10
0.0825

28
PREPARED BY C, MURAPE; B, TARUVINGA; N, MUNGWINI & D, MUYECHE
CFI2101 CFI2101 CFI2101
0.0450
0.0775
11. If an annual payment annuity of 100 is to be received from time 8 to time 20, show
that the value of this 7-year deferred, 13-year annuity
29
PREPARED BY C, MURAPE; B, TARUVINGA; N, MUNGWINI & D, MUYECHE
CFI2101 CFI2101 CFI2101
CHAPTER 4:
VALUATION OF LONG TERM
SECURITIES
4.1 VALUE DEFINED
The value of an asset is the present value of expected future benefits usually represented
by cash flows discounted at a required rate of return.
4.1.1 Market value: Market value is the market price at which the asset (or a similar asset)
trades in an open market place.
4.1.2 Intrinsic value: This is the price a security ought to have if all valuation factors are
taken into account. Thus, intrinsic value is the economic value of the security. This value is
the present value of the cash-flows, provided an appropriate required rate of return for the
risk involved was used.
4.2 BOND VALUATION
A bond is a long-term debt instrument issued by a corporation or government. The
borrower (corporate issuing the bond) agrees to make payments of interest and principal,
on specific dates, to the holders of the bond. Bond valuation involves discounting the
cashflow stream that the security holder would receive over the life of the instrument. The
discounting rate is dependent on the risk associated with the bond.
Characteristics of Bonds:
1. Par Value / face value
- It is the stated face value of the bond. This is the amount paid to the bond holder
(investor) on the maturity of the bond.
30
PREPARED BY C, MURAPE; B, TARUVINGA; N, MUNGWINI & D, MUYECHE
CFI2101 CFI2101 CFI2101
- The par value represents the amount the issuer borrows and promises to repay on the
maturity date.
2. Coupon Rate
- It is the annual or semi-annual or quarterly interest payment paid to investors.
3. Yield
- It is the required rate of return on the bond. It is the rate of interest required by investors
in order to entice them to invest in a bond and this is usually the rate of return on the best
available alternative investment of equal risk. They yield changes with changes in interest
rates in the economy and credit worthiness of the issuer.
4. Maturity
- Bonds have specific maturity dates on which the par value must be repaid.
- The effective maturity of a bond declines each year after it has been issued.
Bond classification
Bonds can be classified according to the coupon payments that the bond makes as follows:
(a). Straight Bonds / ballet Bonds / Vanilla Bonds
It is the most common type of bond. The bond pays regular usually semi-annual fixed
coupon over a fixed period to maturity to return.
(b). Zero Coupon Bonds
They do not make coupon payments. The investors receive the par value at maturity date
but receive no interest payments.
- They are issued at a discount and the investors return comes from the difference between
the issue price and payment of the par value at issue e.g. bond issued at $700 yet its par
value is $1, 000, on maturity the investor gets the $1, 000.
(c). Variable Rate / Floating Rate
Floating rate bonds make payments that are tied to some measure of current market rate.
The payments can be linked to an index or from a current market rate e.g. Treasury Bills
rate or LIBOR.
Besides using the coupon rates to classify bonds, bonds can also be classified as follows:
31
PREPARED BY C, MURAPE; B, TARUVINGA; N, MUNGWINI & D, MUYECHE
CFI2101 CFI2101 CFI2101
(d) Callable Bonds- Callable bonds give the issuer the rights but not the obligation to
redeem the bond before maturity. The issuer however must pay the bond holders a
premium.
(e) Puttable Bonds. These bonds give bond holders the right but not the obligations to sell
their bonds back to the issuer at predetermined price and date.
(f) Irredeemable Bonds / Perpetuals. These are bonds which do not have redemption
dates. Interest on them will be paid indefinitely.
(g)Convertible Bonds It is one that can be converted at the option of the holder into
certain number of shares in that company. E.g. D ltd issues bonds for $1000 to mature in
December 2008. The buyer will be given an option to convert the bond into shares worth
for example 200 shares and hence becomes a shareholder.
7.2.1 Valuation of Perpetual Bonds
It is a bond that never matures. Its present value is equal to the capitalised value of an
infinite stream of interest payments. It is calculated as:
� = 56
Where: V = Present value
C = Periodic coupon payments
i = Periodic required rate of return
4.2.2 Bonds with a finite maturity
i. Coupon paying bonds
Instead of considering interest streams only the terminal/maturity/face value is also
considered. It is calculated as:
� = ∑ 5�896�: +
;�896�3
�<=8
Where: F = Maturity value or Face Value
i= periodic required rate of return
32
PREPARED BY C, MURAPE; B, TARUVINGA; N, MUNGWINI & D, MUYECHE
CFI2101 CFI2101 CFI2101
t = Period
n = Number of years to maturity
Example
A bond has a par value of $1,000 with 10% coupon paid over nine years. The required rate
of return is 12%. Calculate its value.
( ) ( )1 2 9 9
100 100 100 1000...........
1.12 1.12 1.12 1.12 $100 5.328 $1,000 0.361
$532.80 $361.00
$893.80
V = + + + +
= += +=
Assuming the required rate of return was 8% the value becomes $1,124.70. The present
value is greater than the par value because the required rate of return is less than the
coupon rate. In this case investors will be willing to pay a premium to buy the bond. In the
previous case, with the required rate of return at 12%, investors would be willing to buy
the bond only if it is sold at a discount from par value.
Thus: If k > coupon rate the bond will sell at a discount.
If k < coupon rate the bond will sell at a premium.
If k = coupon rate the bond will sell at par value.
i. Zero-coupon bonds
It pays no interest but sells at a deep discount from its face value. Thus the investor buys
the bond at below face value and redeems it at face value on maturity. The present value is:
( )1
n
MVV
k=
+
Example
33
PREPARED BY C, MURAPE; B, TARUVINGA; N, MUNGWINI & D, MUYECHE
CFI2101 CFI2101 CFI2101
Assuming the bond with a face value of $1,000, with a 10-year maturity and required rate
of return of 12%, calculate its value.
( )10
1000$322.00
1.12V = =
ii. Semi-annual Compounding
Use the formula taking care of the time of compounding, e.g. for coupon paying bond.
( ) ( )2
21
2
1 12 2
n
t nt
I MVV
k k=
= ++ +
∑
Bond Yields
Yield to Maturity
This is the rate of interest would you earn on your investment if you bought the bond and
held it to maturity. The yield to maturity can also be viewed as the bond’s promised rate of
return, which is the return that investors will receive if all the promised payments are
made. However, the yield to maturity equals the expected rate of return only if (1) the
probability of default is zero and (2) the bond cannot be called. If there is some default risk,
or if the bond may be called, then there is some probability that the promised payments to
maturity will not be received, in which case the calculated yield to maturity will differ from
the expected return.
The YTM for a bond that sells at par consists entirely of an interest yield, but if the bond
sells at a price other than its par value, the YTM will consist of the interest yield plus a
positive or negative capital gains yield. Note also that a bond’s yield to maturity changes
whenever interest rates in the economy change, and this is almost daily. One who
purchases a bond and holds it until it matures will receive the YTM that existed on the
purchase date, but the bond’s calculated YTM will change frequently between the purchase
date and the maturity date.
Yield to Call
34
PREPARED BY C, MURAPE; B, TARUVINGA; N, MUNGWINI & D, MUYECHE
CFI2101 CFI2101 CFI2101
If you purchased a bond that was callable and the company called it, you would not have
the option of holding the bond until it matured. Therefore, the yield to maturity would not
be earned. For example, if XYZ 10 percent coupon bonds were callable, and if interest rates
fell from 10 percent to 5 percent, then the company could call in the 10 percent bonds,
replace them with 5 percent bonds, and save
$100 _ $50 _ $50 interest per bond per year. This would be beneficial to the company, but
not to its bondholders. If current interest rates are well below an outstanding bond’s
coupon rate, then a
callable bond is likely to be called, and investors will estimate its expected rate of return as
the yield to call (YTC) rather than as the yield to maturity.
Here N is the number of years until the company can call the bond; call price is the price the
company must pay in order to call the bond (it is often set equal to the par value plus one
year’s interest); and rd is the YTC.
Current Yield
The current yield is the annual interest payment divided by the bond’s current price. For
example, if XYZ’s bonds with a 10 percent coupon were currently selling at $985, the bond’s
current yield would be 10.15 percent ($100/$985).
Unlike the yield to maturity, the current yield does not represent the rate of return that
investors should expect on the bond. The current yield provides information regarding the
amount of cash income that a bond will generate in a given year, but since it does not take
account of capital gains or losses that will be realized if the bond is held until maturity (or
call), it does not provide an accurate measure of the bond’s total expected return.
The fact that the current yield does not provide an accurate measure of a bond’s total
return can be illustrated with a zero coupon bond. Since zeros pay no annual income, they
always have a current yield of zero. This indicates that the bond will not provide any cash
interest income, but since the bond will appreciate in value over time, its total rate of
return clearly exceeds zero.

35
PREPARED BY C, MURAPE; B, TARUVINGA; N, MUNGWINI & D, MUYECHE
CFI2101 CFI2101 CFI2101
4.3 PREFERRED STOCK VALUATION
It pays a fixed dividend at regular intervals, but at the discretion of the board of directors. It
has preference over common stock in the payment of dividends and claims on assets. It has
no stated maturity date. All preferred stocks have a call feature. The present value formula
is:
D
Vk
=
Where: D = Stated annual dividend per share, and
k = Discount rate.
NB: If the call feature is incorporated the formula becomes the same as that of coupon
paying bonds.
4.4 COMMON STOCK VALUATION
The value of a share of common stock can be viewed as the discounted value of all expected
cash dividends provided by the issuing firm until the end of time. Its value is:
( ) ( ) ( )
( )
1 21 2
1
..........1 1 1
1
tt
t
D D DV
k k k
D
k
∞∞
∞
=
= + + ++ + +
= +
∑
Where: D = Cash dividend at the end of time t, and
k = Discount rate.
For finite common stock or those we intend to sell in the future the formula becomes:
( ) ( ) ( ) ( )
1 21 2 ..........
1 1 1 1n n
n n
D PD DV
k k k k= + + + +
+ + + +
Where: Pn = the expected sales price at the end of period n.
36
PREPARED BY C, MURAPE; B, TARUVINGA; N, MUNGWINI & D, MUYECHE
CFI2101 CFI2101 CFI2101
In this case the foundation for the valuation of common stock are dividends. For those
common stocks that do not pay dividends the valuation by investor will be based on
expected future selling price.
4.4.2 Dividend Discount Models
These models are designed to compute the intrinsic value of common stock. The valuation
is dependent on the assumptions of the expected growth pattern of stock.
i. Constant Growth Model
Dividends are expected to grow at a constant rate. The value can be calculated as:
( )
( )( )
( )( )
( )
2
0 0 02
1 1 1..........
1 1 1
D g D g D gV
k k k
∞
∞
+ + += + + +
+ + +
Where: D0 = Present dividend per share, and
g = Growth rate, which in this case is constant.
Assuming k is greater than g the equation can be summarised as:
( )
1DV
k g=
−
Where: ( )1 0 1D D g= + , which is dividend in period 1.
Constant growth model is usually applicable to companies in their mature stage.
Example
A company’s dividend per share at t1 is $4, the dividend is expected to grow at 6% forever
and the discount rate is 14%. Calculate the value of the stock.
4$50
0.14 0.06V = =
−
Assuming the same company has retention rate of 40% and earnings per share at t1 of
$6.67.

37
PREPARED BY C, MURAPE; B, TARUVINGA; N, MUNGWINI & D, MUYECHE
CFI2101 CFI2101 CFI2101
( )( )1
1 0.47.5
0.14 0.06
7.5*6.67 $50
Vtimes
E
V
−= =
−⇒ = =
ii. Zero Growth Model
Dividends remain constant. The formula becomes:
1DV
k=
iii. Growth Phases Model
Expected dividends can grow at different percentages over the life of the stock. Usually
they start with high growth (even above k) and then it reduces later on.
Example
Assuming the dividend is expected to grow at 10% for the first five years and thereafter at
6%. Value can be calculated as:
( )( )
( )( )
( )( ) ( ) ( )
550 5
1 6
50 6
51
1.10 1.06
1 1
1.10 1
0.061 1
t t
t tt t
t
tt
D DV
k k
D DV
kk k
−∞
= =
=
= ++ +
⇒ = + −+ +
∑ ∑
∑
4.5 YIELD TO MATURITY (YTM) ON BONDS
This is the expected rate of return on a bond if bought at its current market price and held
to maturity. The rate, k, which equates the discounted value of the expected cash inflows to
the security’s current market price, is also referred to as the security’s (market) yield.
NB: The investors’ required rate of return is equal to the security’s (market) yield only
where the intrinsic value of the security to the investor is equal to the security’s market
value (price), i.e.:
38
PREPARED BY C, MURAPE; B, TARUVINGA; N, MUNGWINI & D, MUYECHE
CFI2101 CFI2101 CFI2101
( ) ( )0
1 1 1
n
t nt
I MVP
k k=
= ++ +
∑
Given the value of MV, P0, and I one can calculate the value of k using interpolation.
Example
Assuming a bond with a par value of $1,000; current market value of $761; 12 years to
maturity; and 8% coupon rate. Gives a k of 12% (YTM).
4.5.2 Behaviour of Bond Prices
i. When the market required rate of return is greater than the coupon rate the bond
price will be less than its face value. Thus bond is selling at a discount of face value.
Bond discount is the amount by which face value exceed current price.
ii. When the market required rate of return is less than coupon rate the bond price will
be greater than its face value. Thus the bond is selling at a premium over face value.
Bond premium is the amount by which bond price exceeds face value.
iii. When the market required rate of return is equal to the coupon rate, bond price is
equal to the face value. The bond is said to be selling at par.
iv. If interest increases leading to an increase in the market required rate of return the
bond price will fall, and the reverse is true.
NB: Interest rate risk (yield risk) is the variation in the market price of a security
caused by changes in interest rates. An investor incurs interest rate risk only if the
bond is sold before maturity and interest rate has changed since the time of
purchase.
v. For a given change in market required rate of return, the price of a bond will change
by a greater amount, the longer is its maturity. Thus the longer the maturity, the
greater the risks of a price change to the investor when changes occur in the overall
level of interest rates.
vi. For a given change in market required rate of return, the price of a bond will change
by proportionally more, the lower the coupon rate. Thus the bond price volatility is
39
PREPARED BY C, MURAPE; B, TARUVINGA; N, MUNGWINI & D, MUYECHE
CFI2101 CFI2101 CFI2101
inversely related to the coupon rate. This is due to the fact that investors realise
their returns later with a low-coupon-rate bond than with a high-coupon-rate bond.
4.6 YIELD ON PREFERRED STOCK
It is derived from the formula for preferred stock price. Thus:
00
D D
P kk P
= ⇒ =
Where: D = annual dividend per share of preferred stock, and
k = Market required rate of return or yield on preferred stock.
Example
Assuming the current market price of a company’s 10%, $100 par value preferred stock is
$91.25. Calculate the yield.
$10
10.96%91.25
k = =
4.7 YIELD ON COMMON STOCK
This is the rate of return that sets the discounted value of the expected cash dividends from
a share of common stock equal to the share’s current market price. Applying the constant
dividend growth model it implies that:
( )
1 10
0
D D
P k gk g P
= ⇒ = +−
Thus common stock yield comes from expected dividend yield 1
0
D
P
and capital gains yield
( )g .
Example

40
PREPARED BY C, MURAPE; B, TARUVINGA; N, MUNGWINI & D, MUYECHE
CFI2101 CFI2101 CFI2101
What market yield is implied by a share of common stock currently selling for $50 whose
dividends are expected to grow at a rate of 10% per year and whose dividend is currently
at $2.20.
( )1: $2.20 1.1
$2.42
2.42: 0.1
50 14.84%
First D
Then k
==
= +
=
41
PREPARED BY C, MURAPE; B, TARUVINGA; N, MUNGWINI & D, MUYECHE
CFI2101 CFI2101 CFI2101
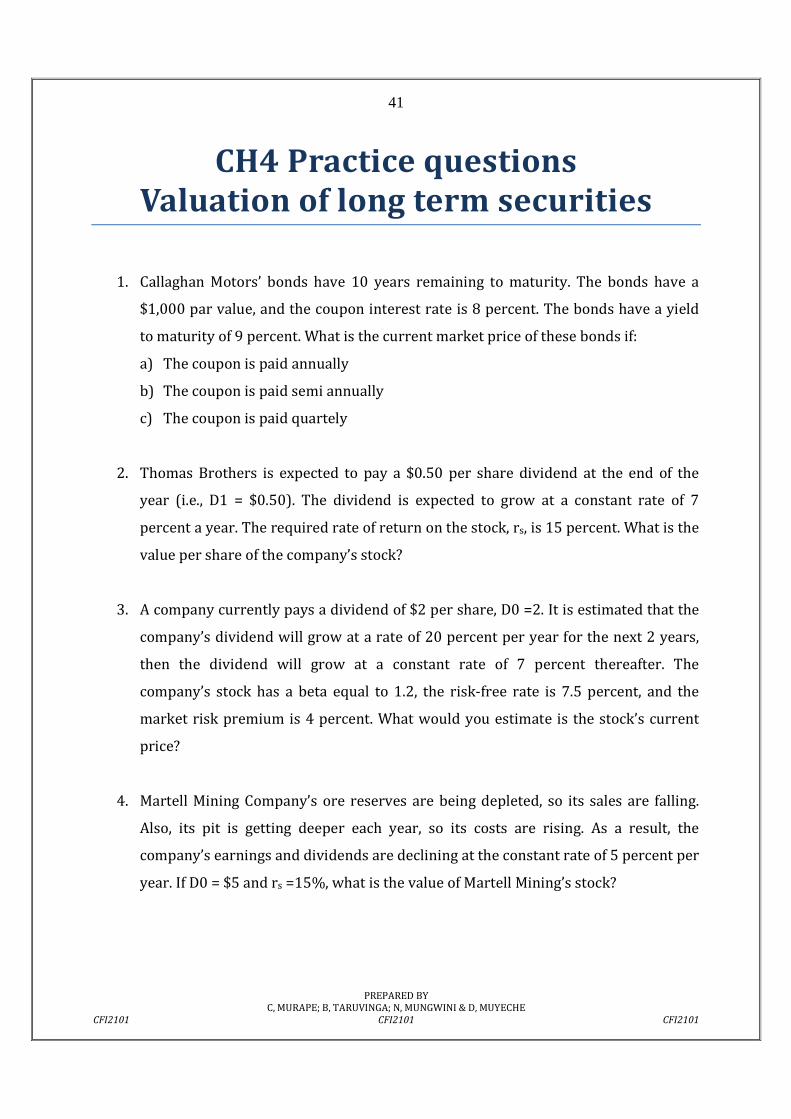
CH4 Practice questions Valuation of long term securities
1. Callaghan Motors’ bonds have 10 years remaining to maturity. The bonds have a
$1,000 par value, and the coupon interest rate is 8 percent. The bonds have a yield
to maturity of 9 percent. What is the current market price of these bonds if:
a) The coupon is paid annually
b) The coupon is paid semi annually
c) The coupon is paid quartely
2. Thomas Brothers is expected to pay a $0.50 per share dividend at the end of the
year (i.e., D1 = $0.50). The dividend is expected to grow at a constant rate of 7
percent a year. The required rate of return on the stock, rs, is 15 percent. What is the
value per share of the company’s stock?
3. A company currently pays a dividend of $2 per share, D0 =2. It is estimated that the
company’s dividend will grow at a rate of 20 percent per year for the next 2 years,
then the dividend will grow at a constant rate of 7 percent thereafter. The
company’s stock has a beta equal to 1.2, the risk-free rate is 7.5 percent, and the
market risk premium is 4 percent. What would you estimate is the stock’s current
price?
4. Martell Mining Company’s ore reserves are being depleted, so its sales are falling.
Also, its pit is getting deeper each year, so its costs are rising. As a result, the
company’s earnings and dividends are declining at the constant rate of 5 percent per
year. If D0 = $5 and rs =15%, what is the value of Martell Mining’s stock?
42
PREPARED BY C, MURAPE; B, TARUVINGA; N, MUNGWINI & D, MUYECHE
CFI2101 CFI2101 CFI2101
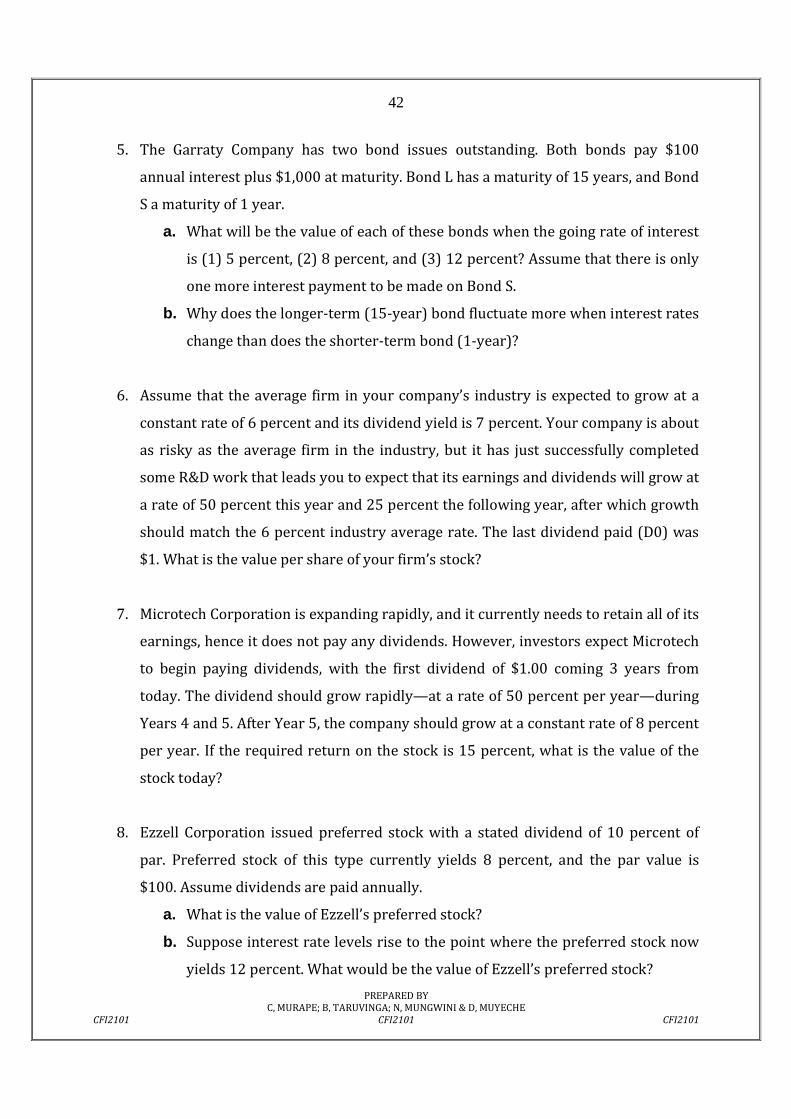
5. The Garraty Company has two bond issues outstanding. Both bonds pay $100
annual interest plus $1,000 at maturity. Bond L has a maturity of 15 years, and Bond
S a maturity of 1 year.
a. What will be the value of each of these bonds when the going rate of interest
is (1) 5 percent, (2) 8 percent, and (3) 12 percent? Assume that there is only
one more interest payment to be made on Bond S.
b. Why does the longer-term (15-year) bond fluctuate more when interest rates
change than does the shorter-term bond (1-year)?
6. Assume that the average firm in your company’s industry is expected to grow at a
constant rate of 6 percent and its dividend yield is 7 percent. Your company is about
as risky as the average firm in the industry, but it has just successfully completed
some R&D work that leads you to expect that its earnings and dividends will grow at
a rate of 50 percent this year and 25 percent the following year, after which growth
should match the 6 percent industry average rate. The last dividend paid (D0) was
$1. What is the value per share of your firm’s stock?
7. Microtech Corporation is expanding rapidly, and it currently needs to retain all of its
earnings, hence it does not pay any dividends. However, investors expect Microtech
to begin paying dividends, with the first dividend of $1.00 coming 3 years from
today. The dividend should grow rapidly—at a rate of 50 percent per year—during
Years 4 and 5. After Year 5, the company should grow at a constant rate of 8 percent
per year. If the required return on the stock is 15 percent, what is the value of the
stock today?
8. Ezzell Corporation issued preferred stock with a stated dividend of 10 percent of
par. Preferred stock of this type currently yields 8 percent, and the par value is
$100. Assume dividends are paid annually.
a. What is the value of Ezzell’s preferred stock?
b. Suppose interest rate levels rise to the point where the preferred stock now
yields 12 percent. What would be the value of Ezzell’s preferred stock?

43
PREPARED BY C, MURAPE; B, TARUVINGA; N, MUNGWINI & D, MUYECHE
CFI2101 CFI2101 CFI2101
9. [Excel] You are given a 5-year and a 30-year bond, each with a par of 1000 and a
semiannual coupon rate of 8%. Calculate the price of each at an 8% semiannual
yield, and graph each price function over the range of semiannual yields 0%-16% on
the same set of axes. What pattern do you notice between the graphs?
44
PREPARED BY C, MURAPE; B, TARUVINGA; N, MUNGWINI & D, MUYECHE
CFI2101 CFI2101 CFI2101
Chapter 5: CAPITAL BUDGETING
5.0 Definition
The capital budgeting process is the process of identifying and evaluating capital projects,
that is, projects where the cash flow to the firm will be received over a period longer than a
year. Any corporate decisions with an impact on future earnings can be examined using
this framework. Decisions about whether to buy a new machine, expand business in
another geographic area, move the corporate headquarters etc can be examined using a
capital budgeting analysis.
Capital budgeting may be the most important responsibility that a financial manager has
because
• capital budgeting decisions often involves the purchase of costly long-term assets
with lives of many years. The decisions made may determine the future success of
the firm.
• the principles underlying the capital budgeting process also apply to other
corporate decisions, such as working capital management and making strategic
mergers and acquisitions.
• making good capital budgeting decisions is consistent with management's primary
goal of maximizing shareholder value.
5.1 Why is capital a limited resource ? In the form of either debt or equity, capital is a very limited resource.
There is a limit to the volume of credit that the banking system can create in the
economy.
Commercial banks and other lending institutions have limited deposits from which
they can lend money to individuals, corporations, and governments. In addition, the
Central Bank requires each bank to maintain part of its deposits as reserves. Having
45
PREPARED BY C, MURAPE; B, TARUVINGA; N, MUNGWINI & D, MUYECHE
CFI2101 CFI2101 CFI2101
limited resources to lend, lending institutions are selective in extending loans to their
customers.
But even if a bank were to extend unlimited loans to a company, the management of
that company would need to consider the impact that increasing loans would have on
the overall cost of financing.
In reality, any firm has limited borrowing resources that should be allocated among
the best investment alternatives.
One might argue that a company can issue an almost unlimited amount of common
stock to raise capital.
Increasing the number of shares of company stock, however, will serve only to
distribute the same amount of equity among a greater number of shareholders. In other
words, as the number of shares of a company increases, the company ownership of the
individual stockholder may proportionally decrease.
The argument that capital is a limited resource is true of any form of capital, whether
debt or equity (short-term or long-term, common stock) or retained earnings, accounts
payable or notes payable, and so on. Even the best-known firm in an industry or a
community can increase its borrowing up to a certain limit.
Once this point has been reached, the firm will either be denied more credit or be
charged a higher interest rate, making borrowing a less desirable way to raise capital.
Faced with limited sources of capital, management should carefully decide whether a
particular project is economically acceptable. In the case of more than one project,
management must identify the projects that will contribute most to profits and,
consequently, to the value (or wealth) of the firm. This, in essence, is the basis of capital
budgeting.
5.2 The capital budgeting process
The capital budgeting process has four administrative steps:
Step 1: Idea generation. The most important step in the capital budgeting process is
generating good project ideas. Ideas can come from a number of sources including senior
management, functional divisions, employees, or outside the company.
46
PREPARED BY C, MURAPE; B, TARUVINGA; N, MUNGWINI & D, MUYECHE
CFI2101 CFI2101 CFI2101
Step 2: Analyzing project proposals. Since the decision to accept or reject a capital project is
based on the project's expected future cash flows, a cash flow forecast must be made for
each project to determine its expected profitability.
Step 3: Create the firm-wide capital budget. Firms must prioritize profitable projects
according to the timing of the project's cash flows, available company resources, and the
company's overall strategic plan. Many projects that are attractive individually may not
make sense strategically.
Step 4:Monitoring decisions and conducting a post-audit. It is important to follow up on all
capital budgeting decisions. An analyst should compare the actual results to the projected
results, and project managers should explain why projections did or did not match actual
performance. Since the capital budgeting process is only as good as the estimates of the
inputs into the
model used to forecast cash flows, a post-audit should be used to identify systematic errors
in the forecasting process and improve company operations.
5.3 Definition of terms:
a)Cash-flows Versus Profits
The focus of capital budgeting is on cash-flows and the timing of the cash-flows, because
they easily measure the impact upon the firms’ wealth. Profit on the other hand does not
always represent the net increase or decrease in cash-flows. Some of the figures in
standard financial statements may not have a corresponding cash effect for the same
period.
b)Independent Versus Mutually Exclusive Projects
Independent projects are projects that are unrelated to each other, and allow for each
project to be evaluated based on its own profitability. For example, if projects A and B are
independent, and both projects are profitable, then the firm could accept both projects.
Mutually exclusive means that only one project in a set of possible projects can be accepted
and that the projects compete with each other. If projects A and B were mutually exclusive,
the firm could accept either Project A or Project B, but not both. A capital budgeting
47
PREPARED BY C, MURAPE; B, TARUVINGA; N, MUNGWINI & D, MUYECHE
CFI2101 CFI2101 CFI2101
decision between two different stamping machines with different costs and output would
be an example of choosing between two mutually exclusive projects.
c)Unlimited Funds Versus Capital Rationing
If a firm has unlimited access to capital, the firm can undertake all projects with expected
returns that exceed the cost of capital. Many firms have constraints on the amount of
capital they can raise, and must use capital rationing. If a firm's profitable project
opportunities exceed the amount of funds available, the firm must ration, or prioritize, its
capital expenditures with the goal of achieving the maximum increase in value for
shareholders given its available capital.
d)Conventional Versus Unconventional Cash-flows
If the pattern of cash-flows accruing to the project being evaluated involve only starting
with an outflow and then being followed by inflows, then the cash-flows are said to be
conventional. With unconventional cash flows, cash-flows come first and the investment
cost is paid later.
5.4 Evaluation Techniques
1.Payback period
2. Discounted Payback
3. Net present value (NPV)
4. Profitability index
5. Internal rate of return (IRR)
6.Modified internal rate of return (MIRR)
i) Payback Period
The payback period (PBP) is the number of years it takes to recover the initial cost of an
investment. Since the payback period is a measure of liquidity, for a firm with liquidity
concerns, the shorter a project's payback period, the better. However, project decisions
should not be made on the basis of their payback periods because of its drawbacks.
48
PREPARED BY C, MURAPE; B, TARUVINGA; N, MUNGWINI & D, MUYECHE
CFI2101 CFI2101 CFI2101
The main drawbacks of the payback period are that it does not take into account either the
time value of money or cash flows beyond the payback period, which means terminal or
salvage value wouldn't be considered. These drawbacks mean that the payback period is
useless as a measure of profitability.
The main benefit of the payback period is that it is a good measure of project liquidity.
Firms with limited access to additional liquidity often impose a maximum payback period,
and then use a measure of profitability, such as NPV or IRR, to evaluate projects that satisfy
this maximum payback period constraint.
ii) Discounted Payback Period
The discounted payback method uses the present values of the project's estimated cash
flows. It is the number of years it takes a project to recover its initial investment in present
value terms, and therefore must be greater than the payback period without discounting.
The discounted payback period addresses one of the drawbacks of the payback period by
discounting cash flows at the project's required rate of return. However, the discounted
payback period still does not consider any cash flows beyond the payback period, which
means that it is a poor measure of profitability. Again, its use is primarily as a measure of
liquidity.
iii) Net Present Value (NPV)
The NPV is the sum of the present values of all the expected incremental cash flows if a
project is undertaken. The discount rate used is the firm's cost of capital, adjusted for the
risk level of the project. For a normal project, with an initial cash outflow followed by a
series of expected after-tax cash inflows, the NPV is the present value of the expected
inflows minus the initial cost of the project.
>�� = ? @�"
�A + B� "C
"=�
= D�E +D�8
�1 + F�8 +D�G
�1 + F�G +⋯+ D���1 + F��
49
PREPARED BY C, MURAPE; B, TARUVINGA; N, MUNGWINI & D, MUYECHE
CFI2101 CFI2101 CFI2101
where:
CFo = the initial investment outlay (a negative cash flow)
CFt =after tax cash flow at time t
K = required rate of return for project
A positive NPV project is expected to increase shareholder wealth, a negative NPV project
is expected to decrease shareholder wealth, and a zero NPV project has no expected effect
on shareholder wealth.
For independent projects, the NPV decision rule is simply to accept any project with a
positive NPV and to reject any project with a negative NPV. For mutually exclusive projects,
the projects have to be ranked and the one with the highest NPV accepted.
iv) Profitability Index (PI)
The profitability index (PI) is the present value of a project's future cash flows divided
by the initial cash outlay.
�I = ��JK��K�J�LI��M��NOM�P
As you can see, the profitability index is closely related to the NPY. The PI is the ratio
of the present value of future cash flows to the initial cash outlay, while the NPV is the
difference between the present value of future cash flows and the initial cash outlay.
If the NPV of a project is positive, the PI will be greater than one. If the NPV is
negative, the PI will be less than one. It follows that the decision rule for the PI is:
If PI > 1.0, accept the project
If PI < 1.0, reject the project.
v) Internal Rate of Return (IRR)
For a normal project, the internal rate of return (IRR) is the discount rate that makes the
present value of the expected incremental after-tax cash inflows just equal to the initial cost
of the project. More generally, the IRR is the discount rate that makes the present values of
50
PREPARED BY C, MURAPE; B, TARUVINGA; N, MUNGWINI & D, MUYECHE
CFI2101 CFI2101 CFI2101
a project's estimated cash inflows equal to the present value of the project's estimated cash
outflows. That is, IRR is the discount rate that makes the following relationship hold:
PV (inflows) = PV (outflows)
The IRR is also the discount rate for which the NPV of a project is equal to zero.
Q�� = 0 = D�E +D�8
�1 + IRR�8 +D�G
�1 + IRR�G +⋯+ D���1 + IRR��
To calculate the IRR, the trial-and-error method is usually used, that is, keep guessing IRRs
until you get one that gives u a positive NPV and one that give you a negative NPV. An
estimation formula is then used to solve for the IRR as follows:
IRR = �M��9STU� +JL�M�V�Q��
JL�M�V�Q�� + |��XM�V�Q��| ��M��(STU� − �M��9STU�
IRR decision rule: First, determine the required rate of return for a given project. This is
usually the firm's cost of capital.
If IRR > the required rate of return, accept the project.
If IRR < the required rate of return, reject the project.
iv) Modified IRR (MIRR)
The MIRR is similar to the IRR, but is theoretically superior in that it overcomes two
weaknesses of the IRR. The MIRR correctly assumes reinvestment at the project’s cost of
capital and avoids the problem of multiple IRRs.
There are 3 basic steps of the MIRR:
(1) Estimate all cash flows as in IRR.
(2) Calculate the future value of all cash inflows at the last year of the project’s life.
(3) Determine the discount rate that causes the future value of all cash inflows
determined in step 2, to be equal to the firm’s investment at time zero. This
discount rate is known as the MIRR.
NB. Note that the PV costs = initial capital outlay.
51
PREPARED BY C, MURAPE; B, TARUVINGA; N, MUNGWINI & D, MUYECHE
CFI2101 CFI2101 CFI2101
MIRR is better than IRR because
1. MIRR correctly assumes reinvestment at project’s cost of capital.
2. MIRR avoids the problem of multiple IRRs.
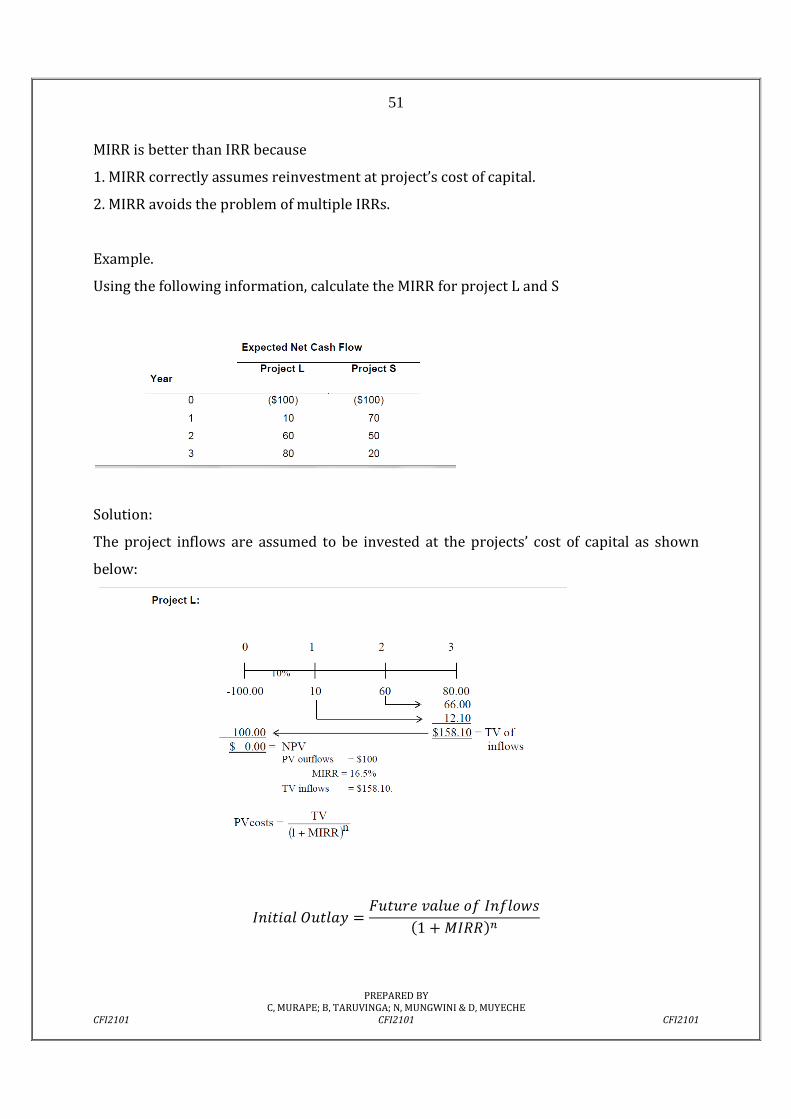
Example.
Using the following information, calculate the MIRR for project L and S
Solution:
The project inflows are assumed to be invested at the projects’ cost of capital as shown
below:
I��M��NOM�P = �OMO��V�O�JKI�K�J�L�1 + $IRR��
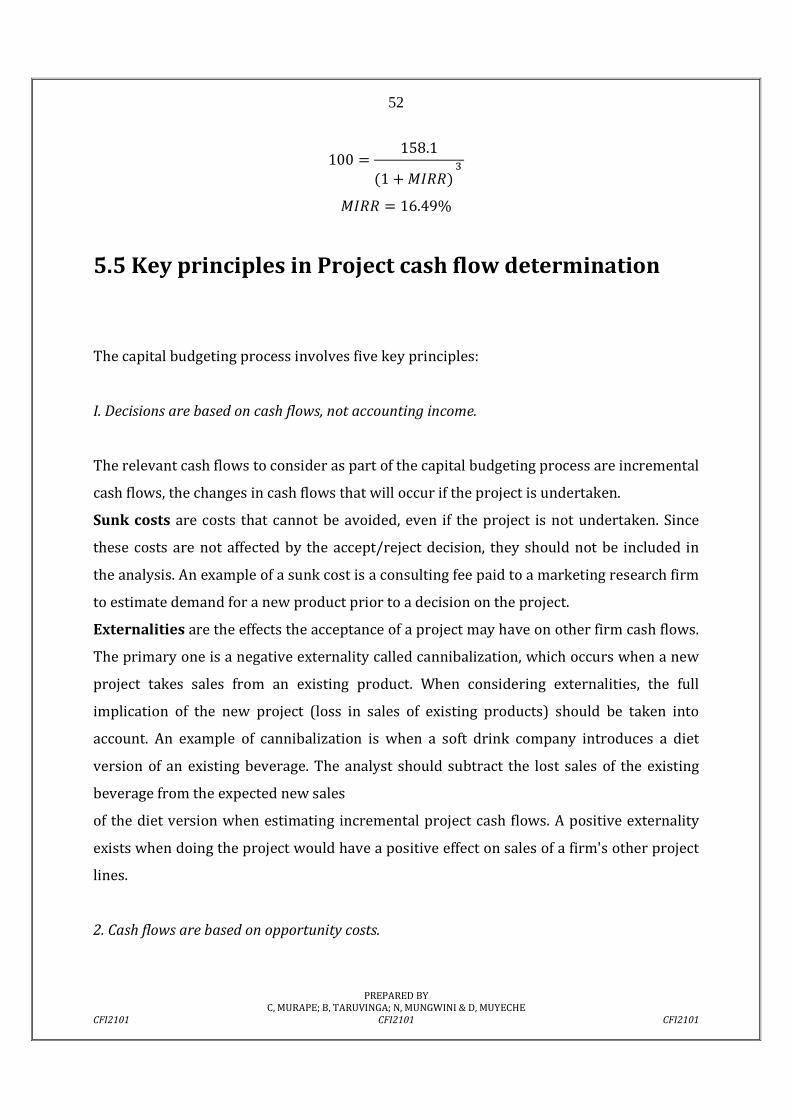
52
PREPARED BY C, MURAPE; B, TARUVINGA; N, MUNGWINI & D, MUYECHE
CFI2101 CFI2101 CFI2101
100 = 158.1�1 +$IRR�[
$IRR = 16.49%
5.5 Key principles in Project cash flow determination
The capital budgeting process involves five key principles:
I. Decisions are based on cash flows, not accounting income.
The relevant cash flows to consider as part of the capital budgeting process are incremental
cash flows, the changes in cash flows that will occur if the project is undertaken.
Sunk costs are costs that cannot be avoided, even if the project is not undertaken. Since
these costs are not affected by the accept/reject decision, they should not be included in
the analysis. An example of a sunk cost is a consulting fee paid to a marketing research firm
to estimate demand for a new product prior to a decision on the project.
Externalities are the effects the acceptance of a project may have on other firm cash flows.
The primary one is a negative externality called cannibalization, which occurs when a new
project takes sales from an existing product. When considering externalities, the full
implication of the new project (loss in sales of existing products) should be taken into
account. An example of cannibalization is when a soft drink company introduces a diet
version of an existing beverage. The analyst should subtract the lost sales of the existing
beverage from the expected new sales
of the diet version when estimating incremental project cash flows. A positive externality
exists when doing the project would have a positive effect on sales of a firm's other project
lines.
2. Cash flows are based on opportunity costs.
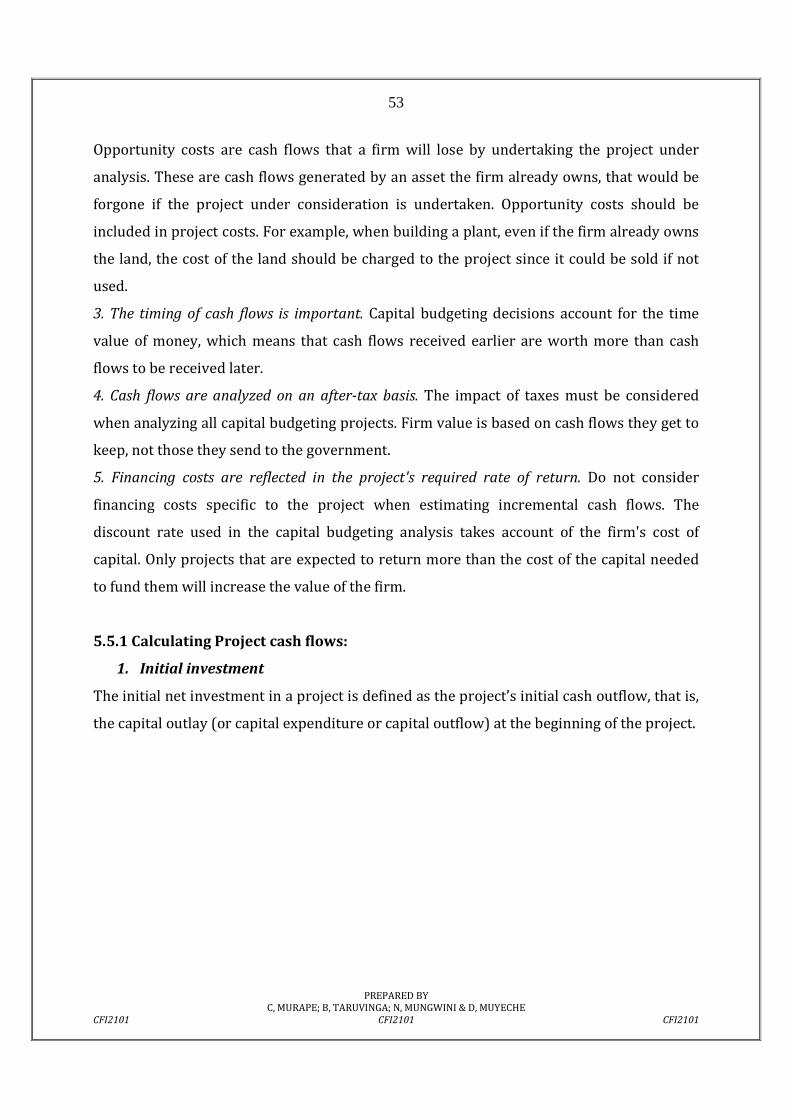
53
PREPARED BY C, MURAPE; B, TARUVINGA; N, MUNGWINI & D, MUYECHE
CFI2101 CFI2101 CFI2101
Opportunity costs are cash flows that a firm will lose by undertaking the project under
analysis. These are cash flows generated by an asset the firm already owns, that would be
forgone if the project under consideration is undertaken. Opportunity costs should be
included in project costs. For example, when building a plant, even if the firm already owns
the land, the cost of the land should be charged to the project since it could be sold if not
used.
3. The timing of cash flows is important. Capital budgeting decisions account for the time
value of money, which means that cash flows received earlier are worth more than cash
flows to be received later.
4. Cash flows are analyzed on an after-tax basis. The impact of taxes must be considered
when analyzing all capital budgeting projects. Firm value is based on cash flows they get to
keep, not those they send to the government.
5. Financing costs are reflected in the project's required rate of return. Do not consider
financing costs specific to the project when estimating incremental cash flows. The
discount rate used in the capital budgeting analysis takes account of the firm's cost of
capital. Only projects that are expected to return more than the cost of the capital needed
to fund them will increase the value of the firm.
5.5.1 Calculating Project cash flows:
1. Initial investment
The initial net investment in a project is defined as the project’s initial cash outflow, that is,
the capital outlay (or capital expenditure or capital outflow) at the beginning of the project.
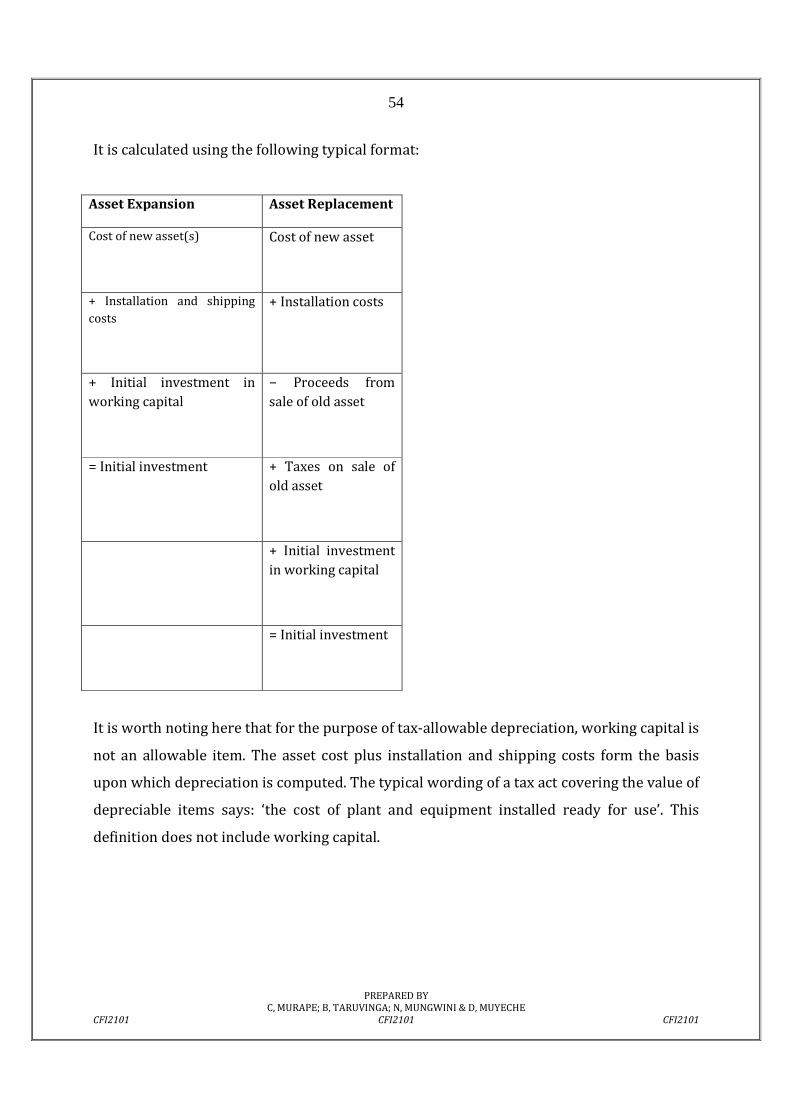
54
PREPARED BY C, MURAPE; B, TARUVINGA; N, MUNGWINI & D, MUYECHE
CFI2101 CFI2101 CFI2101
It is calculated using the following typical format:
Asset Expansion Asset Replacement
Cost of new asset(s)
Cost of new asset
+ Installation and shipping
costs
+ Installation costs
+ Initial investment in
working capital
− Proceeds from
sale of old asset
= Initial investment
+ Taxes on sale of
old asset
+ Initial investment
in working capital
= Initial investment
It is worth noting here that for the purpose of tax-allowable depreciation, working capital is
not an allowable item. The asset cost plus installation and shipping costs form the basis
upon which depreciation is computed. The typical wording of a tax act covering the value of
depreciable items says: ‘the cost of plant and equipment installed ready for use’. This
definition does not include working capital.

55
PREPARED BY C, MURAPE; B, TARUVINGA; N, MUNGWINI & D, MUYECHE
CFI2101 CFI2101 CFI2101
2. Net operating cash flows
A project’s after-tax net operating cash flows for any given year during the economic life of
the project may be calculated using the following typical format. To focus on the format
without being distracted by the details of the timing of cash flows for sales and cost of
goods sold, it is assumed that they are all cash flows received or paid during the year. More
explicitly, it is assumed that all sales are for cash and that opening and closing inventories
remain unchanged (hence, the cost of goods sold equals purchases) and that all purchases
are in cash. In fact, the forecasts of sales revenues and costs of goods sold are generally
done on a cash basis and the distinction between cash and non-cash values for a given year
is not an issue.

56
PREPARED BY C, MURAPE; B, TARUVINGA; N, MUNGWINI & D, MUYECHE
CFI2101 CFI2101 CFI2101
Calculation of net operating cash inflows
Asset Expansion
Cash inflow from sales
− Cost of goods sold
− Selling, general, administrative and other
expenses
− Depreciation
= Taxable income
− Tax payable
= Net income (after tax)
+ Depreciation
= After-tax net operating cash flow
This method ‘adds back’ all non cash items that are included in the calculation of taxable
income so as to come up with project cash flows.
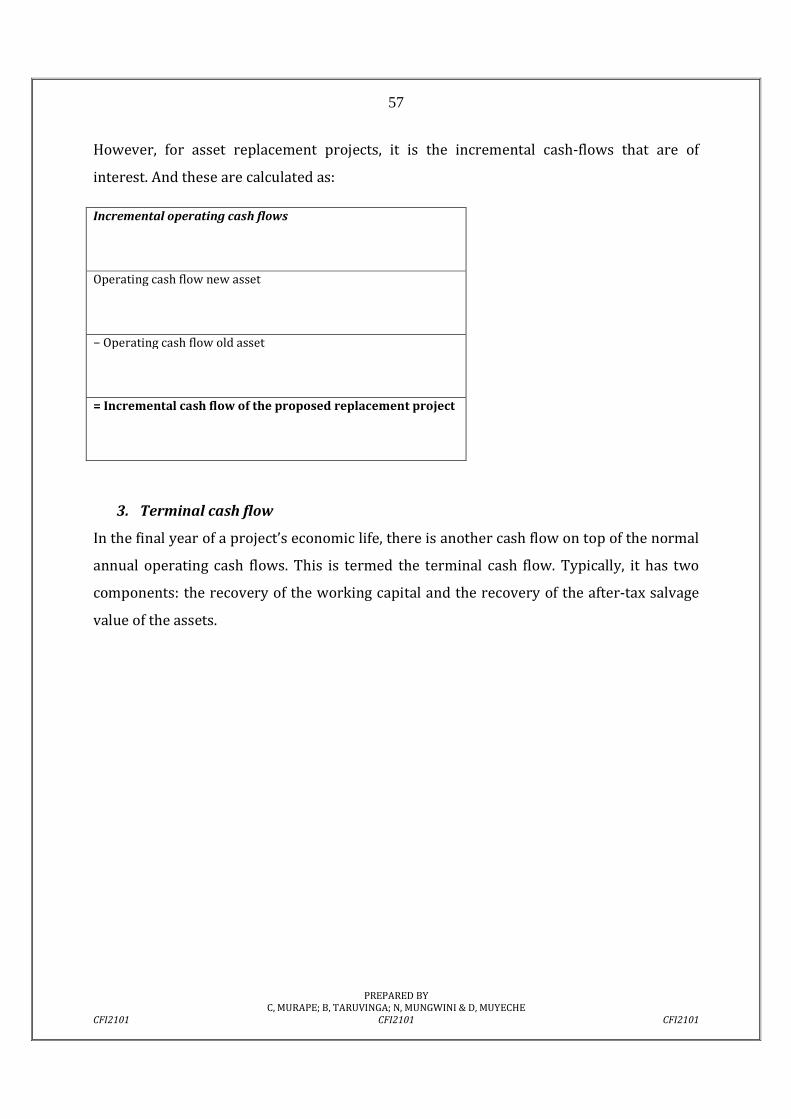
57
PREPARED BY C, MURAPE; B, TARUVINGA; N, MUNGWINI & D, MUYECHE
CFI2101 CFI2101 CFI2101
However, for asset replacement projects, it is the incremental cash-flows that are of
interest. And these are calculated as:
Incremental operating cash flows
Operating cash flow new asset
− Operating cash flow old asset
= Incremental cash flow of the proposed replacement project
3. Terminal cash flow
In the final year of a project’s economic life, there is another cash flow on top of the normal
annual operating cash flows. This is termed the terminal cash flow. Typically, it has two
components: the recovery of the working capital and the recovery of the after-tax salvage
value of the assets.
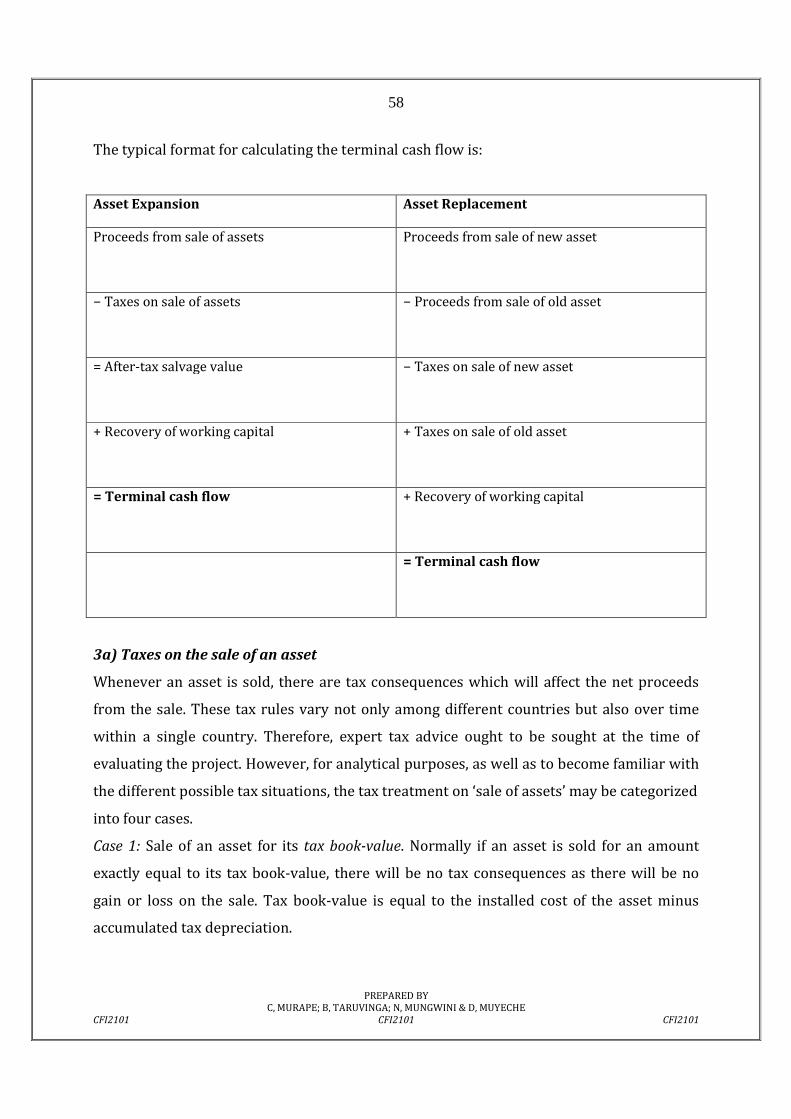
58
PREPARED BY C, MURAPE; B, TARUVINGA; N, MUNGWINI & D, MUYECHE
CFI2101 CFI2101 CFI2101
The typical format for calculating the terminal cash flow is:
Asset Expansion Asset Replacement
Proceeds from sale of assets
Proceeds from sale of new asset
− Taxes on sale of assets
− Proceeds from sale of old asset
= After-tax salvage value
− Taxes on sale of new asset
+ Recovery of working capital
+ Taxes on sale of old asset
= Terminal cash flow
+ Recovery of working capital
= Terminal cash flow
3a) Taxes on the sale of an asset
Whenever an asset is sold, there are tax consequences which will affect the net proceeds
from the sale. These tax rules vary not only among different countries but also over time
within a single country. Therefore, expert tax advice ought to be sought at the time of
evaluating the project. However, for analytical purposes, as well as to become familiar with
the different possible tax situations, the tax treatment on ‘sale of assets’ may be categorized
into four cases.
Case 1: Sale of an asset for its tax book-value. Normally if an asset is sold for an amount
exactly equal to its tax book-value, there will be no tax consequences as there will be no
gain or loss on the sale. Tax book-value is equal to the installed cost of the asset minus
accumulated tax depreciation.
59
PREPARED BY C, MURAPE; B, TARUVINGA; N, MUNGWINI & D, MUYECHE
CFI2101 CFI2101 CFI2101
Case 2: Sale of an asset for less than its tax book-value. In this case there will be a loss,
which is equal to sale proceeds minus tax book-value. This loss may be treated as an
operating loss, thus reducing the total tax payment.
Case 3: Sale of an asset for more than its tax book-value but less than its original cost. In
this case the amount equal to the book-value may be treated as a tax-free cash flow while
the remainder which is in excess of the book-value may be taxed at the same rate as that
applied to the operating income.
Case 4: Sale of an asset for more than its original cost. In this case part of the gain may be
treated as ordinary income and part may be treated as capital gain. The part treated as
ordinary income may be equal to the difference between the original cost and the current
tax book-value. The capital gain portion may be the amount in excess of the original asset
cost. The tax rates for the two components may be different.
In all four cases the tax book-value will be equal to the ‘written down book-value’, a more
commonly used accounting term. Since we are using tax-allowable rates and methods of
depreciation for our analyses, these amounts will be the same. To concentrate on the
analytical side of project evaluation, we adopt only the simplest tax treatment. We assume
that a single flat corporate tax rate applies, and that it applies both to taxable income from
operations and to any gain (or loss) from the sale of assets. Gain (or loss) from the sale of
assets is defined, for simplicity, as being equivalent to the sale proceeds minus tax book-
value.
3b) Recovery of working capital
Normally the total value of the pool of working capital is assumed to be recovered at
the termination of the project. This is a capital cash inflow and has no taxation implications.

60
PREPARED BY C, MURAPE; B, TARUVINGA; N, MUNGWINI & D, MUYECHE
CFI2101 CFI2101 CFI2101
Chapter 5: Practice questions
Question 1
You are considering a project whose cash flows are given below:
(a) Calculate the present values of the future cash flows of the project.
(b) Calculate the project’s net present value.
(c) Calculate the internal rate of return.
(d) Should you undertake the project?
Question 2
Your firm is considering two projects with the following cash flows:
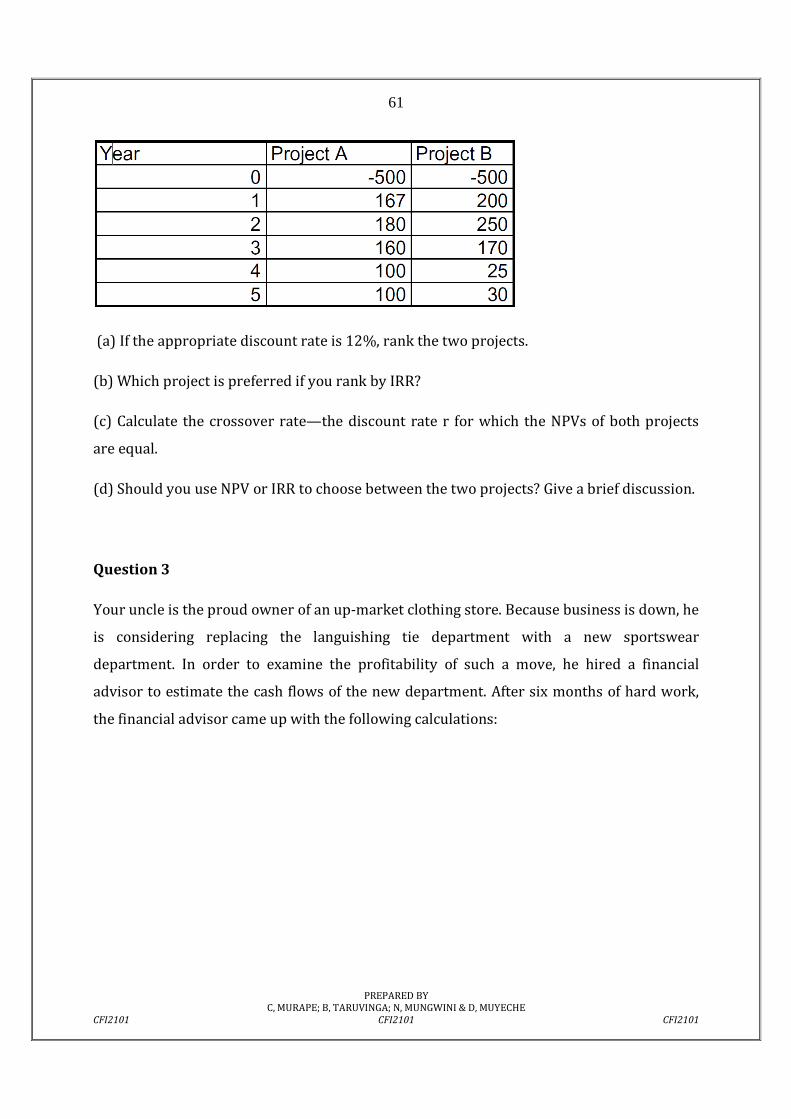
61
PREPARED BY C, MURAPE; B, TARUVINGA; N, MUNGWINI & D, MUYECHE
CFI2101 CFI2101 CFI2101
(a) If the appropriate discount rate is 12%, rank the two projects.
(b) Which project is preferred if you rank by IRR?
(c) Calculate the crossover rate—the discount rate r for which the NPVs of both projects
are equal.
(d) Should you use NPV or IRR to choose between the two projects? Give a brief discussion.
Question 3
Your uncle is the proud owner of an up-market clothing store. Because business is down, he
is considering replacing the languishing tie department with a new sportswear
department. In order to examine the profitability of such a move, he hired a financial
advisor to estimate the cash flows of the new department. After six months of hard work,
the financial advisor came up with the following calculations:
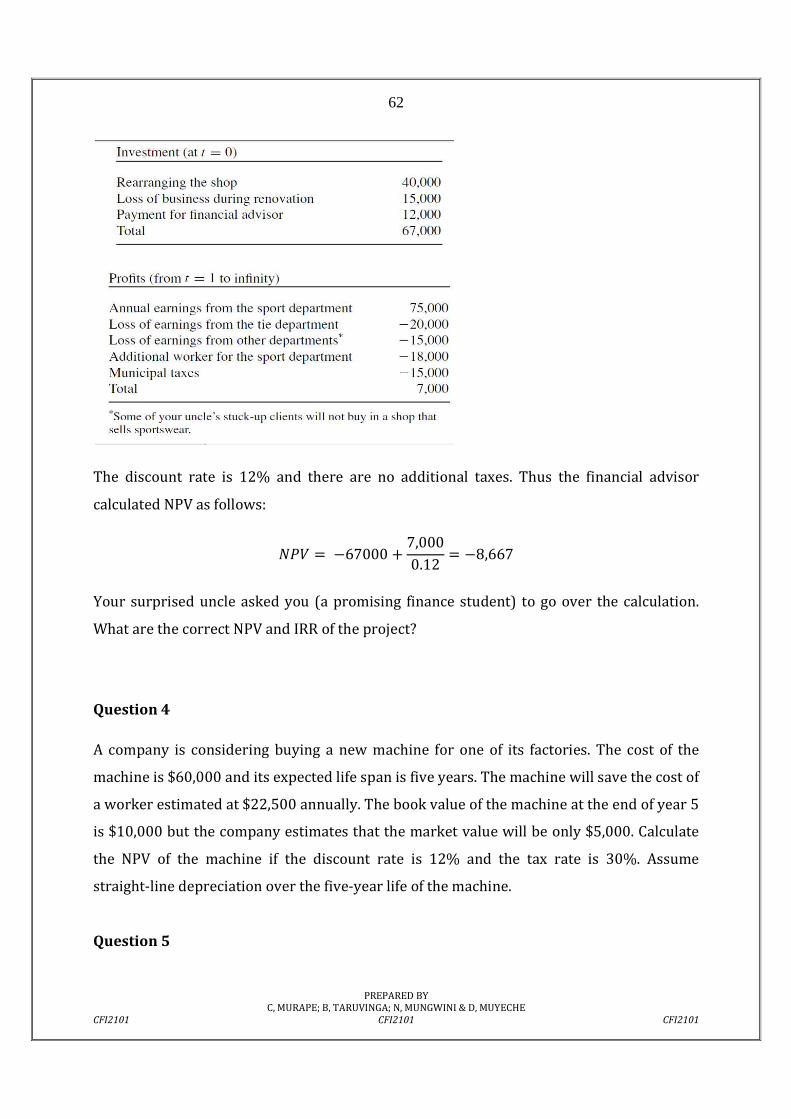
62
PREPARED BY C, MURAPE; B, TARUVINGA; N, MUNGWINI & D, MUYECHE
CFI2101 CFI2101 CFI2101
The discount rate is 12% and there are no additional taxes. Thus the financial advisor
calculated NPV as follows:
Q�� = −67000 + 7,0000.12 = −8,667
Your surprised uncle asked you (a promising finance student) to go over the calculation.
What are the correct NPV and IRR of the project?
Question 4
A company is considering buying a new machine for one of its factories. The cost of the
machine is $60,000 and its expected life span is five years. The machine will save the cost of
a worker estimated at $22,500 annually. The book value of the machine at the end of year 5
is $10,000 but the company estimates that the market value will be only $5,000. Calculate
the NPV of the machine if the discount rate is 12% and the tax rate is 30%. Assume
straight-line depreciation over the five-year life of the machine.
Question 5
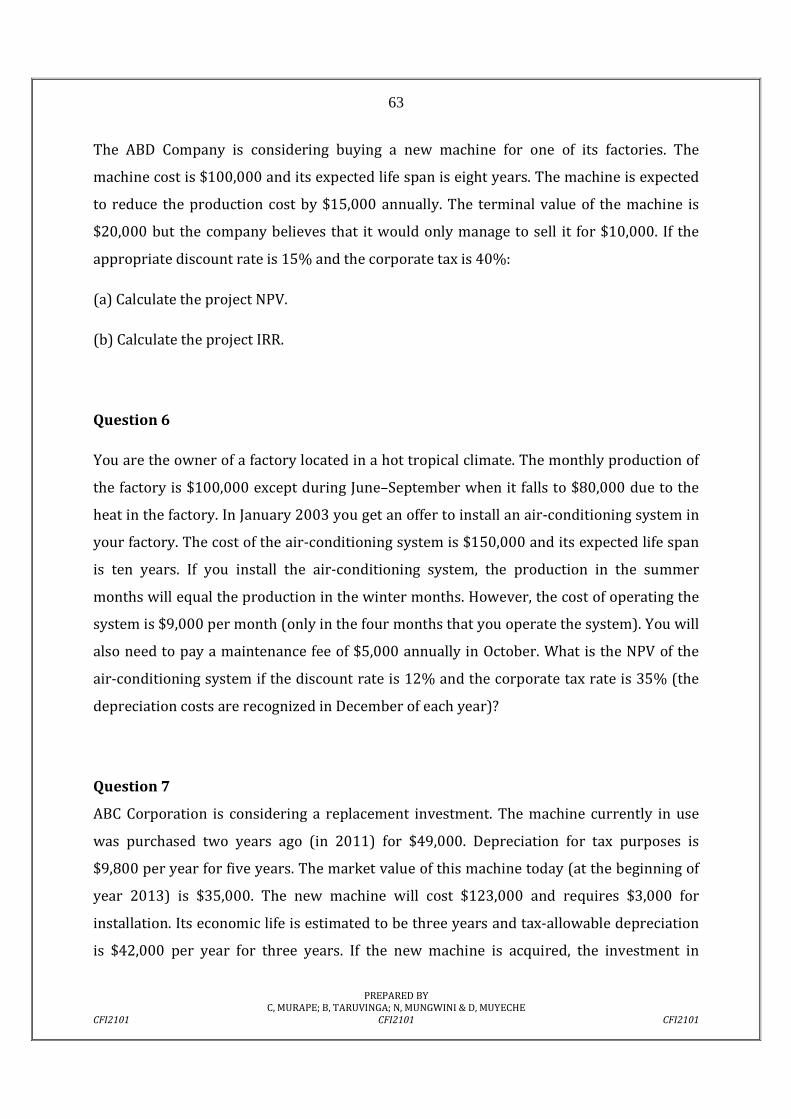
63
PREPARED BY C, MURAPE; B, TARUVINGA; N, MUNGWINI & D, MUYECHE
CFI2101 CFI2101 CFI2101
The ABD Company is considering buying a new machine for one of its factories. The
machine cost is $100,000 and its expected life span is eight years. The machine is expected
to reduce the production cost by $15,000 annually. The terminal value of the machine is
$20,000 but the company believes that it would only manage to sell it for $10,000. If the
appropriate discount rate is 15% and the corporate tax is 40%:
(a) Calculate the project NPV.
(b) Calculate the project IRR.
Question 6
You are the owner of a factory located in a hot tropical climate. The monthly production of
the factory is $100,000 except during June–September when it falls to $80,000 due to the
heat in the factory. In January 2003 you get an offer to install an air-conditioning system in
your factory. The cost of the air-conditioning system is $150,000 and its expected life span
is ten years. If you install the air-conditioning system, the production in the summer
months will equal the production in the winter months. However, the cost of operating the
system is $9,000 per month (only in the four months that you operate the system). You will
also need to pay a maintenance fee of $5,000 annually in October. What is the NPV of the
air-conditioning system if the discount rate is 12% and the corporate tax rate is 35% (the
depreciation costs are recognized in December of each year)?
Question 7
ABC Corporation is considering a replacement investment. The machine currently in use
was purchased two years ago (in 2011) for $49,000. Depreciation for tax purposes is
$9,800 per year for five years. The market value of this machine today (at the beginning of
year 2013) is $35,000. The new machine will cost $123,000 and requires $3,000 for
installation. Its economic life is estimated to be three years and tax-allowable depreciation
is $42,000 per year for three years. If the new machine is acquired, the investment in
64
PREPARED BY C, MURAPE; B, TARUVINGA; N, MUNGWINI & D, MUYECHE
CFI2101 CFI2101 CFI2101
accounts receivable is expected to rise by $8,000, the inventory by $25,000 and accounts
payable by $13,000. The annual income before depreciation and taxes is expected to be
$65,000 for the next three years (2013, 2014 and 2015) with the old machine, and
$122,000, $135,000 and $130,000 for the 1st, 2nd and 3rd years, respectively, with the
new machine. The salvage values of the old and new machines three years from today (end
of 2015) is expected to be $3,500 and $4,000, respectively. The income tax rate is 25%.
This income tax applies to operating income as well as to the book gains or losses on the
machinery.
Required:
Calculate:
a) The project cash-flows for the replacement project.
b) Calculate NPV if the required rate of return for this project is 15%.
c) Advise ABC Corporation on whether they should replace the old machine.
Question 8
NUST Corporation is considering the purchase of a new item of equipment to replace the
current one. The new equipment will cost $100,000 and requires $7,000 in installation
costs. It will be depreciated using the straight line method over a five-year period. The old
equipment was purchased for $40,000 five years ago. It was being depreciated using the
straight line method over a five-year economic life. The old machine’s market value today is
$45,000. As a result of the proposed replacement the corporation’s investment in working
capital is expected to increase by $12,000. The tax rate is 30%.
a) Calculate the book-value of the old machine.
(b) Calculate the taxes, if any, attributable to the sale of the old machine.
(c) Determine the initial investment associated with the proposed equipment replacement.
Question 9
A new machine can be purchased for $15,000 with an economic life of 10 years and a
salvage value at that time of $3000. Its operating disbursements are $8,000 p.a. The
present machine has a net realizable value of $3000 and its operating disbursements are
65
PREPARED BY C, MURAPE; B, TARUVINGA; N, MUNGWINI & D, MUYECHE
CFI2101 CFI2101 CFI2101
$10,000 p.a. If the present machine is not replaced now, it is expected to continue on this
service for 10 years. The salvage value will be zero. Alternatively, the present machine can
be overhauled and modernized for $4000, which will change the operating disbursements
to $9,000 p.a. In this case the economic life is also expected to be 10 years, but with a
salvage value of $1,500 at that date. The minimum required rate of return is 25%. Which
course of action should be selected?
Question 10
You are a financial analyst for Damon Electronics Company. The director of capital
budgeting has asked you to analyze two proposed capital investments, Projects X and Y.
Each project has a cost of $10,000, and the cost of capital for each project is 12 percent. The
projects’ expected net cash flows are as follows:
EXPECTED NET CASH FLOWS
YEAR PROJECT X PROJECT Y
0 ($10,000) ($10,000)
1 6,500 3,500
2 3,000 3,500
3 3,000 3,500
4 1,000 3,500
a. Calculate each project’s payback period, net present value (NPV), internal rate of return
(IRR), and modified internal rate of return (MIRR).
b. Which project or projects should be accepted if they are independent?
c. Which project should be accepted if they are mutually exclusive?
d. How might a change in the cost of capital produce a conflict between the NPV and IRR
rankings of these two projects? Would this conflict exist if k were 5 percent? (Hint: Plot the
NPV profiles.)
Question 11
B. Davis Industries must choose between a gas-powered and an electric-powered forklift
truck for moving materials in its factory. Since both forklifts perform the same function, the
firm will choose only one. The electric- powered truck will cost more, but it will be less
66
PREPARED BY C, MURAPE; B, TARUVINGA; N, MUNGWINI & D, MUYECHE
CFI2101 CFI2101 CFI2101
expensive to operate; it will cost $22,000, whereas the gas-powered truck will cost
$17,500. The cost of capital that applies to both investments is 12 percent. The life for each
type of truck is estimated to be 6 years, during which time the net cash flows for the
electric-powered truck will be $6,290 per year and those for the gas-powered truck will be
$5,000 per year. Annual net cash flows include depreciation expenses. Calculate the NPV
and IRR for each type of truck, and decide which to recommend.
Question 12
Kandy Corporation is considering a replacement investment. The machine currently in use
was originally purchased two years ago for $65,000. Tax-allowable depreciation is $13,000
per year for five years. The current market value of this machine is $23,000. The new
machine being considered would cost $140,000, and require $4,000 shipping costs and
$2,000 installation costs. The economic life of the machine is estimated as three years. Tax-
allowable depreciation is $70,000 per year for the first two years. If the new machine is
acquired, the investments in accounts receivable is expected to increase by $9,000, the
inventory by $13,000, and accounts payable by $15,000. The before-tax net operating cash
flow is estimated as $120,000 per year for the next three years with the old machine and
$143,000 per year for the next three years with the new machine. The expected resale
value of the old and new machines in three years’ time would be $4,000 and $6,600,
respectively. The corporate tax rate is 30%.
(a) Calculate the initial investment associated with the proposed replacement decision.
(b) Calculate the incremental operating cash flows of the proposed replacement decision.
(c) Calculate the terminal cash flows associated with the proposed replacement decision.
(d) Compute the NPV of the replacement project assuming a discount rate of 6% per
annum.
(e) What is the proposed investment’s IRR?
(f) Use the computed IRR and NPV results and discuss the project accept/reject decision.
67
PREPARED BY C, MURAPE; B, TARUVINGA; N, MUNGWINI & D, MUYECHE
CFI2101 CFI2101 CFI2101
Chapter 8: LEVERAGE: OPERATING AND
FINANCIAL
• Introduction
• Chapter Objectives
• Capital Structure Defined
• Meaning of Financial Leverage
• Measures of Financial Leverage
• Financial Leverage of Companies in Zimbabwe (possible research area)
• Financial Leverage and the Shareholders’ Return
• EPS and ROE Calculations;
• Analysing Alternative Financial Plans: Constant EBIT
• Interest Tax Shield;
• Analysing Alternative Financial Plans: Varying EBIT
• Combining Financial and Operating Leverages
• Degree of Operating Leverage;
• Degree of Financial Leverage;
• Combined Effect of Operating and Financial Leverages
• Summary
INTRODUCTION
A firm has to decide in which way it will finance its projects. Given the fact that a firm has to
enhance/maximise shareholder value, management has to make decisions that in actual fact add to
that value. If for instance a new project like the construction of a new plant or purchasing a new
machine has to be made, the financing side to such projects must be decided on. Should a firm
employ equity or debt or both? What are the implications of debt-equity mix on ROE or EPS?
OBJECTIVES
After the completion of this topic, students must be able to:
68
PREPARED BY C, MURAPE; B, TARUVINGA; N, MUNGWINI & D, MUYECHE
CFI2101 CFI2101 CFI2101
• explicate the concept of financial and operating leverage
• discuss the alternative measures of financial leverage
• understand the risk and return implications of financial leverage
• analyse the combined effect of financial and operating leverage
• highlight the difference between operating risk and financial risk
CAPITAL STRUCTURE DEFINED
The concept of capital structure will be looked at in detail in Corporate Finance II (CFI2201). A
brief look at a firm’s simple balance sheet shows the assets side. Assets are financed by capital.
Capital can be split into either equity or debt. The structure of capital is a profile of how assets are
financed. Capital structure if not monitored may exceed optimal levels and may in most instances
mimic the law of diminishing returns. The current topic has nothing to do with optimal capital
structure but analysing the effect of different mixes of debt and equity on the returns of the firm to
equity. The term capital structure is used to represent the proportionate relationship between debt
and equity. Equity includes paid-up share capital, share premium and reserves and surplus
(retained earnings).
If you are to be a responsible financial manager you should seek answers to the following questions
while making the financing decision:
• How should the investment project be financed?
• Does the way in which the investment projects are financed matter?
• How does financing affect the shareholders’ risk, return and value?
• Does there exist an optimum financing mix in terms of the maximum value to the firm’s
shareholders?
• Can the optimum financing mix be determined in practice for a company?
• What factors in practice should a company consider in designing its financing policy?
MEANING OF FINANCIAL LEVERAGE
Financial leverage refers to the use of debt to acquire additional assets. Financial leverage is also
known as trading on equity. The use of the term trading on equity is derived from the fact that it is
the owner’s equity that is used as a basis to raise debt; that is, the equity that is traded upon. The
supplier of debt has limited participation in the company’s profits and, therefore, he will insist on

69
PREPARED BY C, MURAPE; B, TARUVINGA; N, MUNGWINI & D, MUYECHE
CFI2101 CFI2101 CFI2101
protection in earnings and protection in values represented by ownership equity. (How does he
insist?)
If Dominic uses $20,000 of his cash resources to purchase 8 hectares of arable land in Muzarabani
with a total cost of $20, 000, he is not using financial leverage. If on the other hand Thando has a
passion for cattle ranching and uses $45,000 of her cash savings and borrows $32,000 to purchase
20 hectares of land having a total cost of $77,000. Thando is using financial leverage. Thando is
controlling $45,000 of the land which translates to 58% of the land.
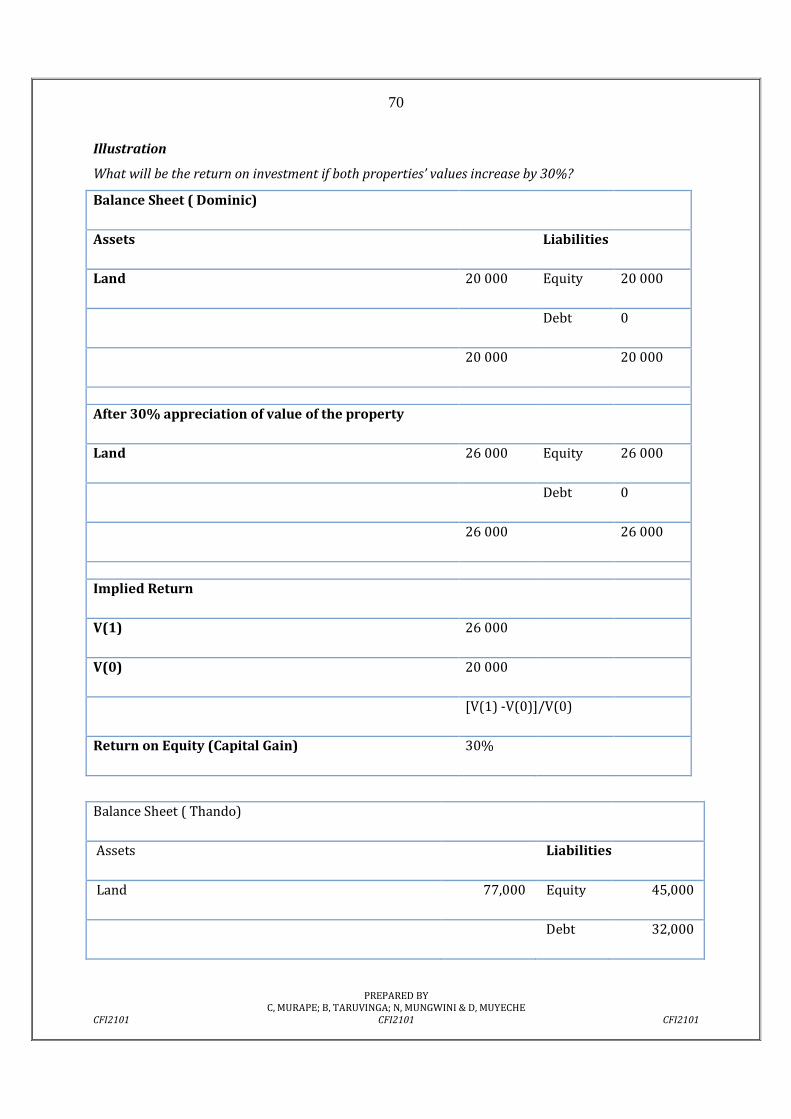
70
PREPARED BY C, MURAPE; B, TARUVINGA; N, MUNGWINI & D, MUYECHE
CFI2101 CFI2101 CFI2101
Illustration
What will be the return on investment if both properties’ values increase by 30%?
Balance Sheet ( Dominic)
Assets Liabilities
Land 20 000 Equity 20 000
Debt 0
20 000 20 000
After 30% appreciation of value of the property
Land 26 000 Equity 26 000
Debt 0
26 000 26 000
Implied Return
V(1) 26 000
V(0) 20 000
[V(1) -V(0)]/V(0)
Return on Equity (Capital Gain) 30%
Balance Sheet ( Thando)
Assets Liabilities
Land 77,000 Equity 45,000
Debt 32,000
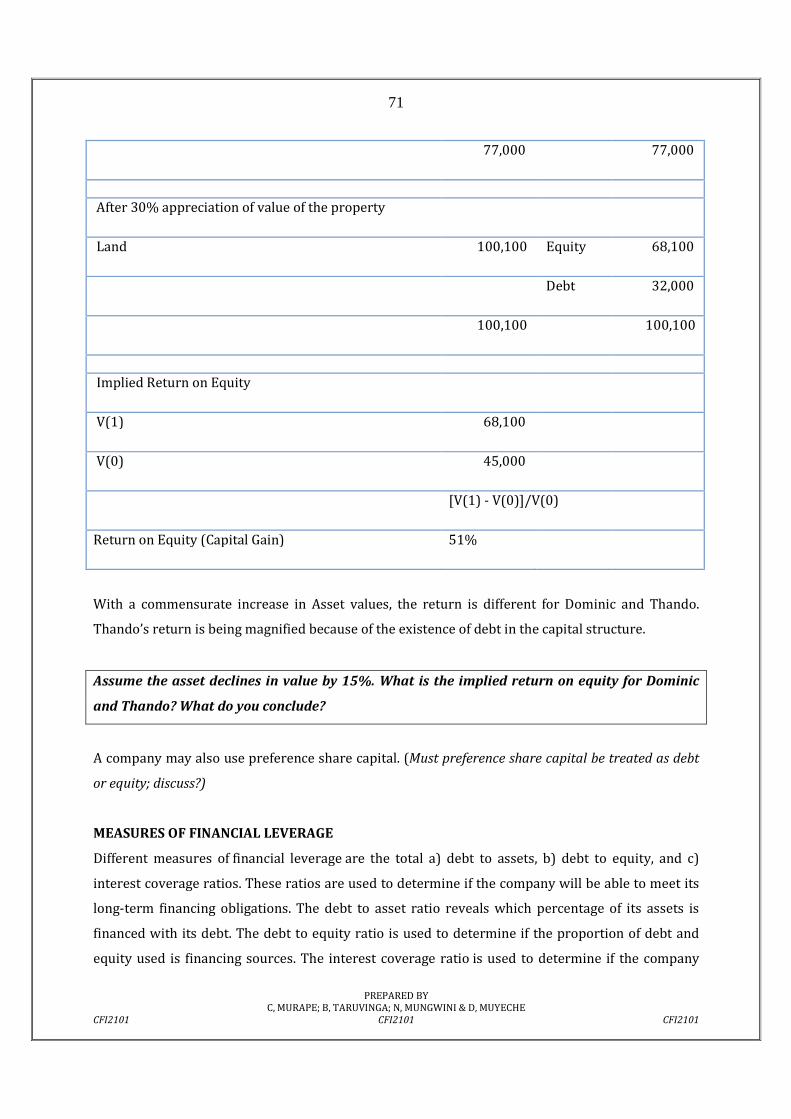
71
PREPARED BY C, MURAPE; B, TARUVINGA; N, MUNGWINI & D, MUYECHE
CFI2101 CFI2101 CFI2101
77,000 77,000
After 30% appreciation of value of the property
Land 100,100 Equity 68,100
Debt 32,000
100,100 100,100
Implied Return on Equity
V(1) 68,100
V(0) 45,000
[V(1) - V(0)]/V(0)
Return on Equity (Capital Gain) 51%
With a commensurate increase in Asset values, the return is different for Dominic and Thando.
Thando’s return is being magnified because of the existence of debt in the capital structure.
Assume the asset declines in value by 15%. What is the implied return on equity for Dominic
and Thando? What do you conclude?
A company may also use preference share capital. (Must preference share capital be treated as debt
or equity; discuss?)
MEASURES OF FINANCIAL LEVERAGE
Different measures of financial leverage are the total a) debt to assets, b) debt to equity, and c)
interest coverage ratios. These ratios are used to determine if the company will be able to meet its
long-term financing obligations. The debt to asset ratio reveals which percentage of its assets is
financed with its debt. The debt to equity ratio is used to determine if the proportion of debt and
equity used is financing sources. The interest coverage ratio is used to determine if the company
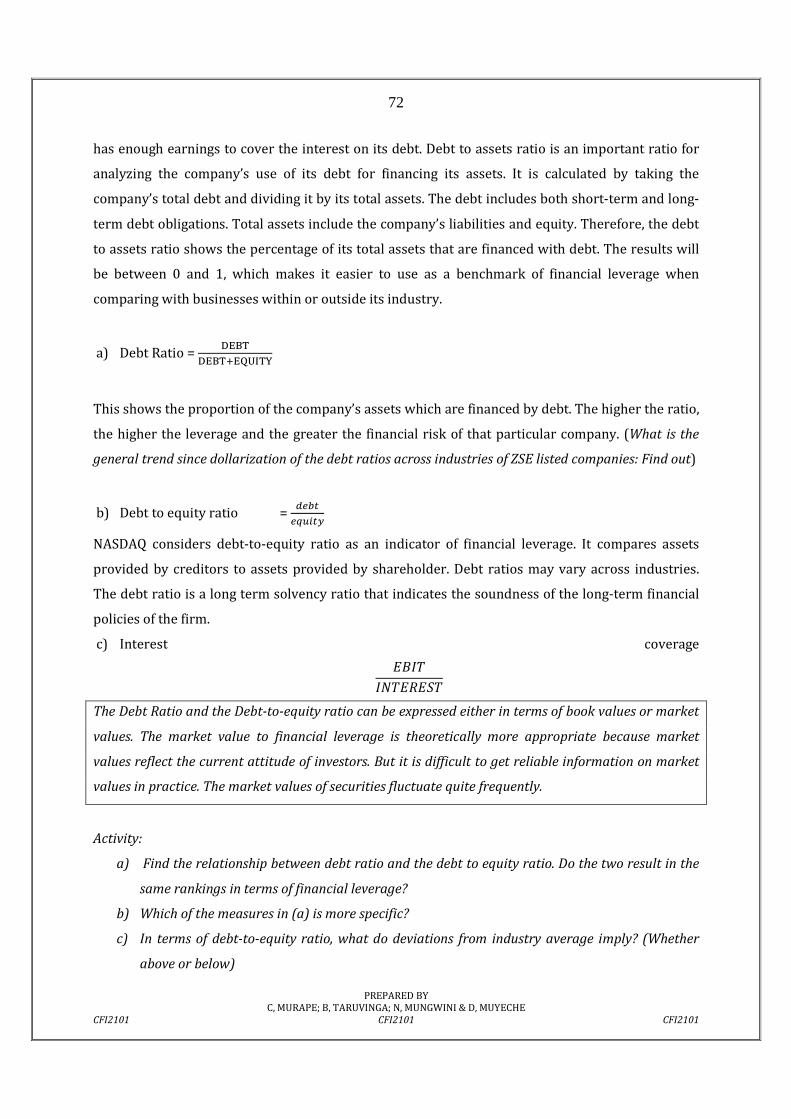
72
PREPARED BY C, MURAPE; B, TARUVINGA; N, MUNGWINI & D, MUYECHE
CFI2101 CFI2101 CFI2101
has enough earnings to cover the interest on its debt. Debt to assets ratio is an important ratio for
analyzing the company’s use of its debt for financing its assets. It is calculated by taking the
company’s total debt and dividing it by its total assets. The debt includes both short-term and long-
term debt obligations. Total assets include the company’s liabilities and equity. Therefore, the debt
to assets ratio shows the percentage of its total assets that are financed with debt. The results will
be between 0 and 1, which makes it easier to use as a benchmark of financial leverage when
comparing with businesses within or outside its industry.
a) Debt Ratio = b,cd
b,cd9,efgdh
This shows the proportion of the company’s assets which are financed by debt. The higher the ratio,
the higher the leverage and the greater the financial risk of that particular company. (What is the
general trend since dollarization of the debt ratios across industries of ZSE listed companies: Find out)
b) Debt to equity ratio = ijk<jlm6<n
NASDAQ considers debt-to-equity ratio as an indicator of financial leverage. It compares assets
provided by creditors to assets provided by shareholder. Debt ratios may vary across industries.
The debt ratio is a long term solvency ratio that indicates the soundness of the long-term financial
policies of the firm.
c) Interest coverage
opI%IQ%oRoq%
The Debt Ratio and the Debt-to-equity ratio can be expressed either in terms of book values or market
values. The market value to financial leverage is theoretically more appropriate because market
values reflect the current attitude of investors. But it is difficult to get reliable information on market
values in practice. The market values of securities fluctuate quite frequently.
Activity:
a) Find the relationship between debt ratio and the debt to equity ratio. Do the two result in the
same rankings in terms of financial leverage?
b) Which of the measures in (a) is more specific?
c) In terms of debt-to-equity ratio, what do deviations from industry average imply? (Whether
above or below)
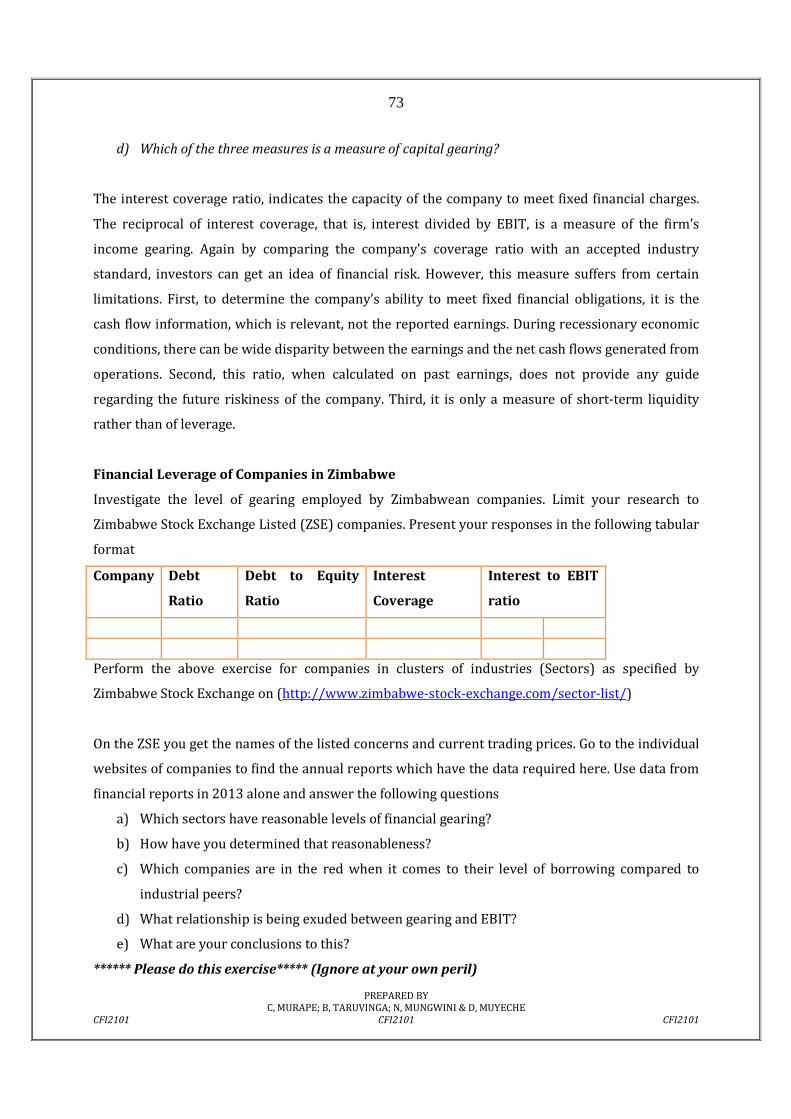
73
PREPARED BY C, MURAPE; B, TARUVINGA; N, MUNGWINI & D, MUYECHE
CFI2101 CFI2101 CFI2101
d) Which of the three measures is a measure of capital gearing?
The interest coverage ratio, indicates the capacity of the company to meet fixed financial charges.
The reciprocal of interest coverage, that is, interest divided by EBIT, is a measure of the firm’s
income gearing. Again by comparing the company’s coverage ratio with an accepted industry
standard, investors can get an idea of financial risk. However, this measure suffers from certain
limitations. First, to determine the company’s ability to meet fixed financial obligations, it is the
cash flow information, which is relevant, not the reported earnings. During recessionary economic
conditions, there can be wide disparity between the earnings and the net cash flows generated from
operations. Second, this ratio, when calculated on past earnings, does not provide any guide
regarding the future riskiness of the company. Third, it is only a measure of short-term liquidity
rather than of leverage.
Financial Leverage of Companies in Zimbabwe
Investigate the level of gearing employed by Zimbabwean companies. Limit your research to
Zimbabwe Stock Exchange Listed (ZSE) companies. Present your responses in the following tabular
format
Company Debt
Ratio
Debt to Equity
Ratio
Interest
Coverage
Interest to EBIT
ratio
Perform the above exercise for companies in clusters of industries (Sectors) as specified by
Zimbabwe Stock Exchange on (http://www.zimbabwe-stock-exchange.com/sector-list/)
On the ZSE you get the names of the listed concerns and current trading prices. Go to the individual
websites of companies to find the annual reports which have the data required here. Use data from
financial reports in 2013 alone and answer the following questions
a) Which sectors have reasonable levels of financial gearing?
b) How have you determined that reasonableness?
c) Which companies are in the red when it comes to their level of borrowing compared to
industrial peers?
d) What relationship is being exuded between gearing and EBIT?
e) What are your conclusions to this?
****** Please do this exercise***** (Ignore at your own peril)
74
PREPARED BY C, MURAPE; B, TARUVINGA; N, MUNGWINI & D, MUYECHE
CFI2101 CFI2101 CFI2101
FINANCIAL LEVERAGE AND THE SHAREHOLDER RETURN
What is the firm’s motive in the use of financial leverage? What is the underlying assumption in that
motive?
Financial leverage measures firm’s exposure to the financial risk. A high level of financial leverage
allows shareholders to obtain a high return on equity, but they are also exposed to a higher risk of
significant loss, if the return on assets is lower. The financial leverage employed by a firm is
intended to earn more on the fixed charges funds than their relative costs. The primary motive of a
company in using financial leverage is to magnify the shareholders ‘return under favourable
economic conditions. The role of financial leverage in magnifying the return of the shareholders is
based on the assumptions that the fixed-charges funds (such as the loan from financial institutions
and banks or debentures) can be obtained at a cost lower than the firm’s rate of return on net
assets. Thus, when the difference between the earnings generated by assets financed by the fixed-
charges funds and costs of these funds is distributed to the shareholders, the earnings per share
(EPS) or return on equity (ROE) increases. However, EPS or ROE will fall if the company obtains the
fixed-charges funds at a cost higher than the rate of return on the firm’s assets. It should, therefore,
be clear that EPS, ROE and ROI are the important figures for analysing the impact of financial
leverage.
Empirical Findings on Financial Leverage and Shareholders return.
Mehta A M (2014), in his research titled “Myth vs. Fact; Influence of Financial Leverage on
Shareholder’s Return (An Empirical Study of Sugar Sector of Pakistan from Year 2005-2010)”,
concluded that debt-to-equity ratio (financial leverage), influences the return on equity. He
confirms that this in actual fact matches with available literature.
Rehman (2013) whilst investigating the same industry of in Pakistan produced mixed results as
espoused by a positive relationship between debt-to-equity ratio with return on assets and sales
growth. A negative relationship was also established between debt to equity ratio and with
earnings per share ,net profit margin and return on equity. The differences are coming in because
the periods under study is different between Mehta AM (2014) and Rehman (2013)
Saini R (2012) as he investigates the impact of financial leverage on shareholders return and
market capitalisation for the Telecommunication sector in India, concludes there is positive
75
PREPARED BY C, MURAPE; B, TARUVINGA; N, MUNGWINI & D, MUYECHE
CFI2101 CFI2101 CFI2101
correlation between financial leverage and shareholder return but negative correlation between
financial leverage and market capitalization.
In as much as these relationships hold, there has to be an optimal level of financial leverage as we
are going to discover in Corporate Finance II (CFI2201). You are however encouraged to go through
the abovementioned journal articles to get a clearer picture of how the conclusions were arrived at.
But take note of the void that exists in literature for similar firms in Africa in general and Zimbabwe
in particular.
EPS and ROE calculations
Kindly find out how best we can calculate EPS and ROE from literature in accounting and finance.
Your understanding of this will be of paramount importance to you for purposes of understanding
the topic in question. You must be able to compute both (EPS and ROE) in a world with or without
taxes.
How does the financial leverage affect EPS and ROE? We shall describe two situations to illustrate
the impact of the financial leverage on EPS and ROE. First, we shall analyse the impact of the
alternative financial plans on EPS and ROE assuming that EBIT is constant. Second, we shall assume
that EBIT varies and shows the effect of the alternative financial plans on EPS and ROE under the
conditions of varying EBIT.
Analysing Alternative Financial Plans: Constant EBIT
Imagine a green-field venture, Mutimutema Ltd., is being formed by Masakadza Family Trust. The
management of the firm is expecting a before-tax rate of return of 24 per cent on the estimated total
investment of $500,000. This implies EBIT = $500,000 *0.24 = $120,000. The firm is considering
two alternative financial plans: (i) either to raise the entire funds by issuing 50,000 ordinary shares
(equity) at 10 per share, or (ii) to raise $250,000 by issuing 25,000 ordinary shares at $10 per share
and borrow $250,000 at 15 per cent rate of interest. The tax rate is 50 per cent. What are the effects
of the alternative plans for the shareholders’ earnings? The table below illustrates the
computations.
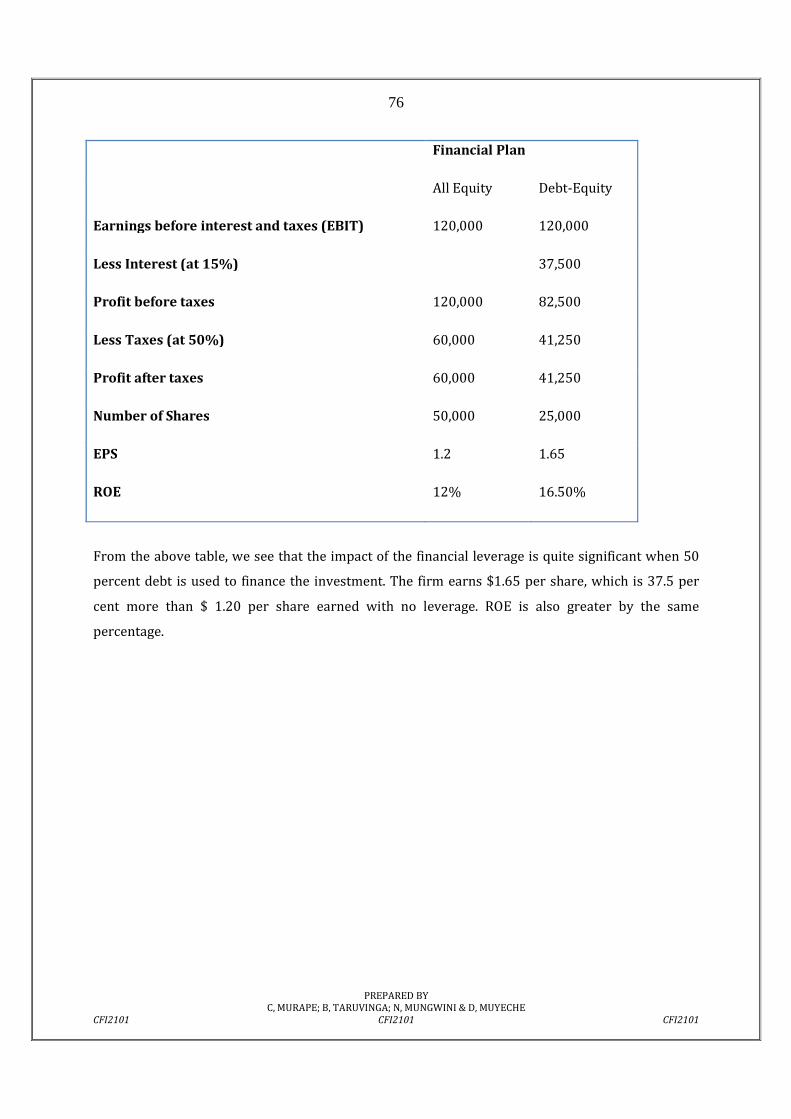
76
PREPARED BY C, MURAPE; B, TARUVINGA; N, MUNGWINI & D, MUYECHE
CFI2101 CFI2101 CFI2101
Financial Plan
All Equity Debt-Equity
Earnings before interest and taxes (EBIT) 120,000 120,000
Less Interest (at 15%) 37,500
Profit before taxes 120,000 82,500
Less Taxes (at 50%) 60,000 41,250
Profit after taxes 60,000 41,250
Number of Shares 50,000 25,000
EPS 1.2 1.65
ROE 12% 16.50%
From the above table, we see that the impact of the financial leverage is quite significant when 50
percent debt is used to finance the investment. The firm earns $1.65 per share, which is 37.5 per
cent more than $ 1.20 per share earned with no leverage. ROE is also greater by the same
percentage.
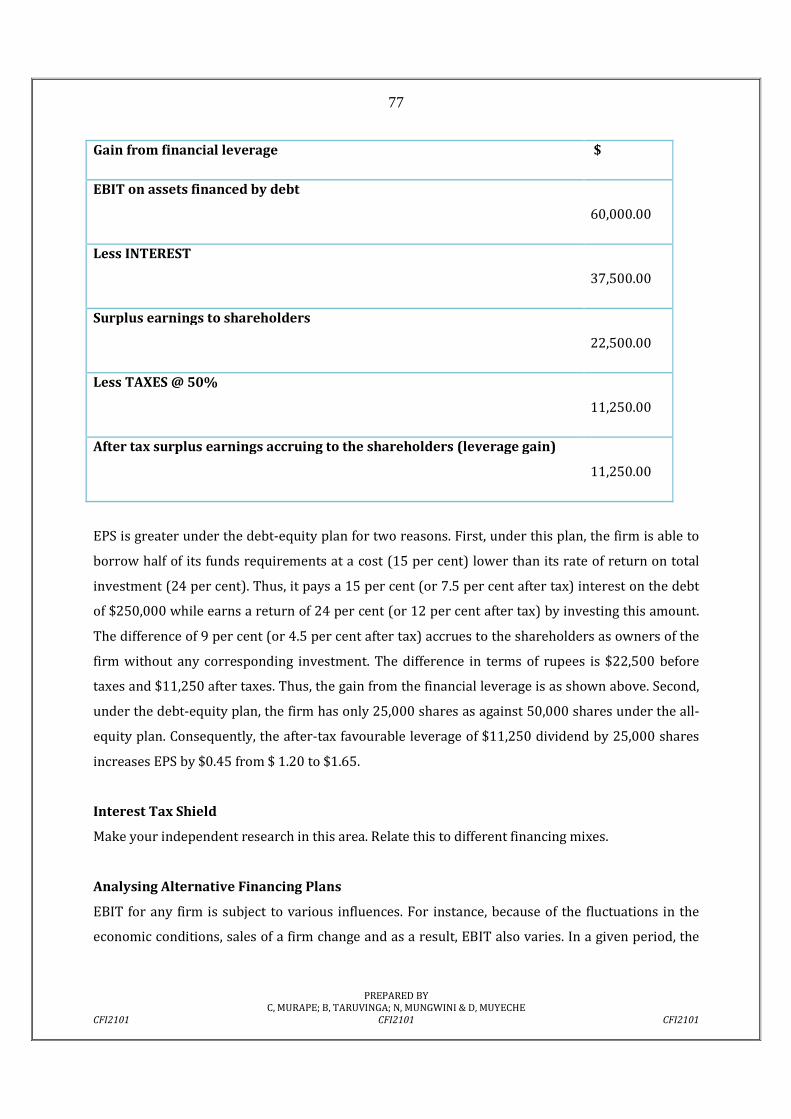
77
PREPARED BY C, MURAPE; B, TARUVINGA; N, MUNGWINI & D, MUYECHE
CFI2101 CFI2101 CFI2101
Gain from financial leverage $
EBIT on assets financed by debt
60,000.00
Less INTEREST
37,500.00
Surplus earnings to shareholders
22,500.00
Less TAXES @ 50%
11,250.00
After tax surplus earnings accruing to the shareholders (leverage gain)
11,250.00
EPS is greater under the debt-equity plan for two reasons. First, under this plan, the firm is able to
borrow half of its funds requirements at a cost (15 per cent) lower than its rate of return on total
investment (24 per cent). Thus, it pays a 15 per cent (or 7.5 per cent after tax) interest on the debt
of $250,000 while earns a return of 24 per cent (or 12 per cent after tax) by investing this amount.
The difference of 9 per cent (or 4.5 per cent after tax) accrues to the shareholders as owners of the
firm without any corresponding investment. The difference in terms of rupees is $22,500 before
taxes and $11,250 after taxes. Thus, the gain from the financial leverage is as shown above. Second,
under the debt-equity plan, the firm has only 25,000 shares as against 50,000 shares under the all-
equity plan. Consequently, the after-tax favourable leverage of $11,250 dividend by 25,000 shares
increases EPS by $0.45 from $ 1.20 to $1.65.
Interest Tax Shield
Make your independent research in this area. Relate this to different financing mixes.
Analysing Alternative Financing Plans
EBIT for any firm is subject to various influences. For instance, because of the fluctuations in the
economic conditions, sales of a firm change and as a result, EBIT also varies. In a given period, the
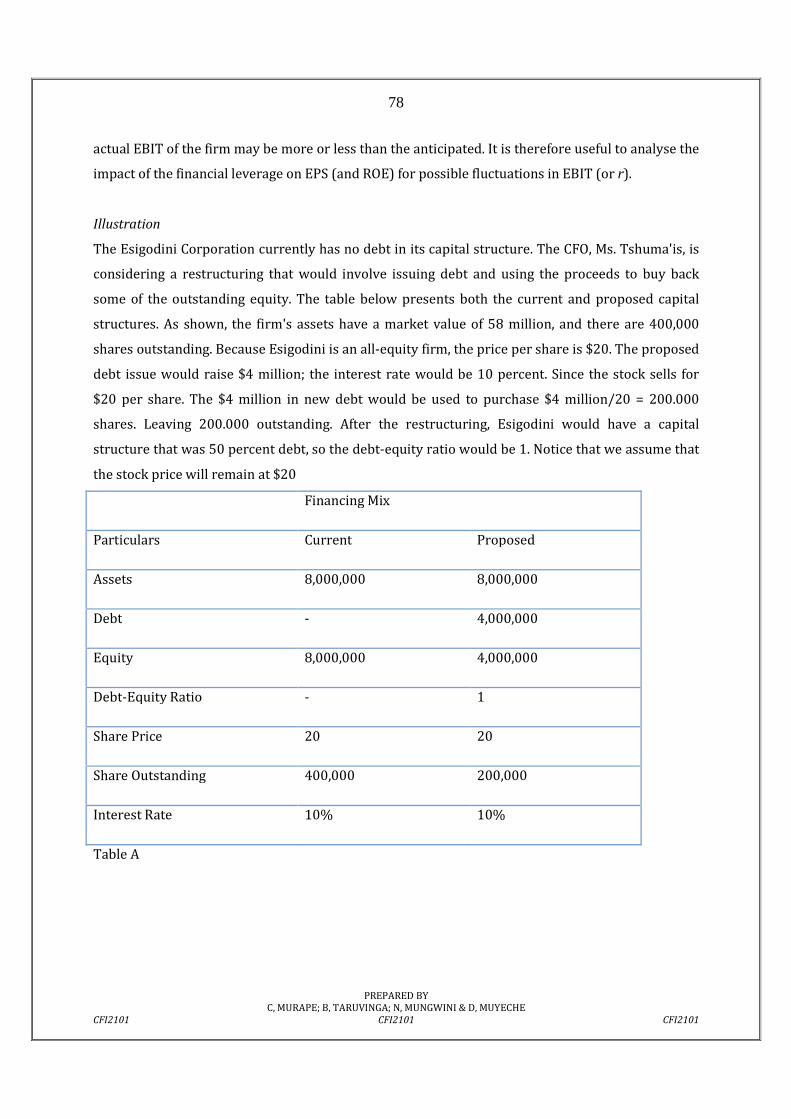
78
PREPARED BY C, MURAPE; B, TARUVINGA; N, MUNGWINI & D, MUYECHE
CFI2101 CFI2101 CFI2101
actual EBIT of the firm may be more or less than the anticipated. It is therefore useful to analyse the
impact of the financial leverage on EPS (and ROE) for possible fluctuations in EBIT (or r).
Illustration
The Esigodini Corporation currently has no debt in its capital structure. The CFO, Ms. Tshuma'is, is
considering a restructuring that would involve issuing debt and using the proceeds to buy back
some of the outstanding equity. The table below presents both the current and proposed capital
structures. As shown, the firm's assets have a market value of 58 million, and there are 400,000
shares outstanding. Because Esigodini is an all-equity firm, the price per share is $20. The proposed
debt issue would raise $4 million; the interest rate would be 10 percent. Since the stock sells for
$20 per share. The $4 million in new debt would be used to purchase $4 million/20 = 200.000
shares. Leaving 200.000 outstanding. After the restructuring, Esigodini would have a capital
structure that was 50 percent debt, so the debt-equity ratio would be 1. Notice that we assume that
the stock price will remain at $20
Financing Mix
Particulars Current Proposed
Assets 8,000,000 8,000,000
Debt - 4,000,000
Equity 8,000,000 4,000,000
Debt-Equity Ratio - 1
Share Price 20 20
Share Outstanding 400,000 200,000
Interest Rate 10% 10%
Table A
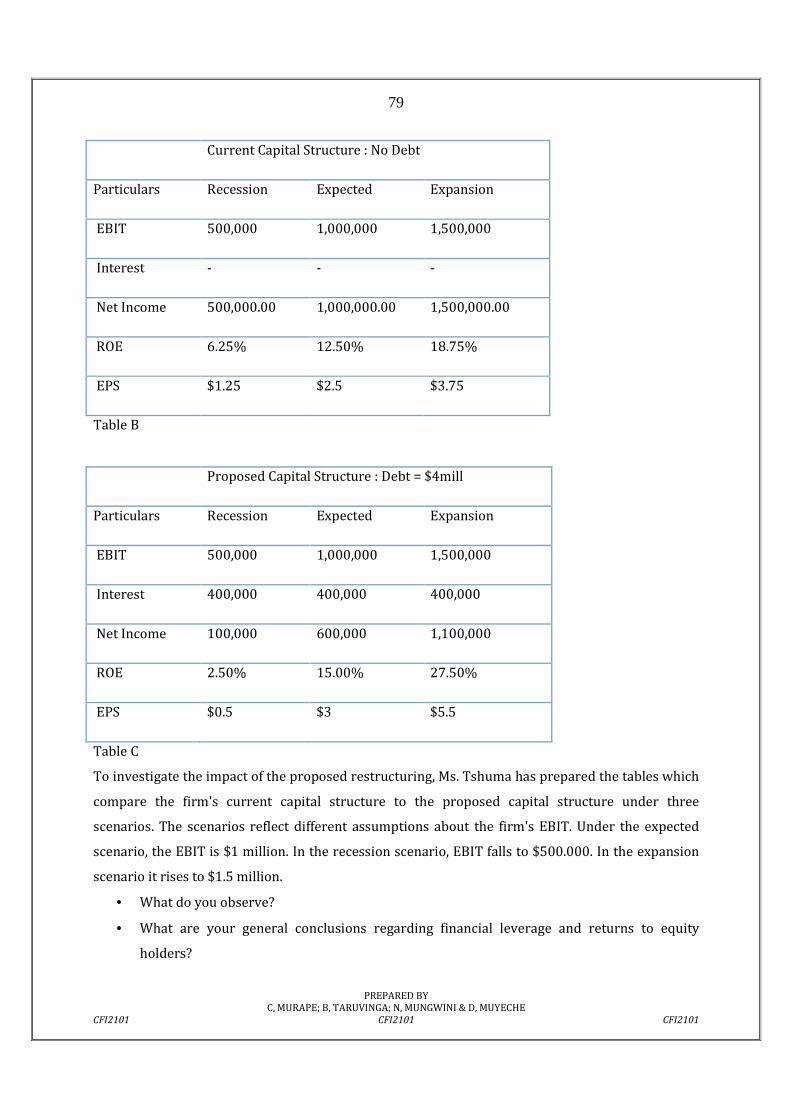
79
PREPARED BY C, MURAPE; B, TARUVINGA; N, MUNGWINI & D, MUYECHE
CFI2101 CFI2101 CFI2101
Current Capital Structure : No Debt
Particulars Recession Expected Expansion
EBIT 500,000 1,000,000 1,500,000
Interest - - -
Net Income 500,000.00 1,000,000.00 1,500,000.00
ROE 6.25% 12.50% 18.75%
EPS $1.25 $2.5 $3.75
Table B
Proposed Capital Structure : Debt = $4mill
Particulars Recession Expected Expansion
EBIT 500,000 1,000,000 1,500,000
Interest 400,000 400,000 400,000
Net Income 100,000 600,000 1,100,000
ROE 2.50% 15.00% 27.50%
EPS $0.5 $3 $5.5
Table C
To investigate the impact of the proposed restructuring, Ms. Tshuma has prepared the tables which
compare the firm's current capital structure to the proposed capital structure under three
scenarios. The scenarios reflect different assumptions about the firm's EBIT. Under the expected
scenario, the EBIT is $1 million. In the recession scenario, EBIT falls to $500.000. In the expansion
scenario it rises to $1.5 million.
• What do you observe?
• What are your general conclusions regarding financial leverage and returns to equity
holders?
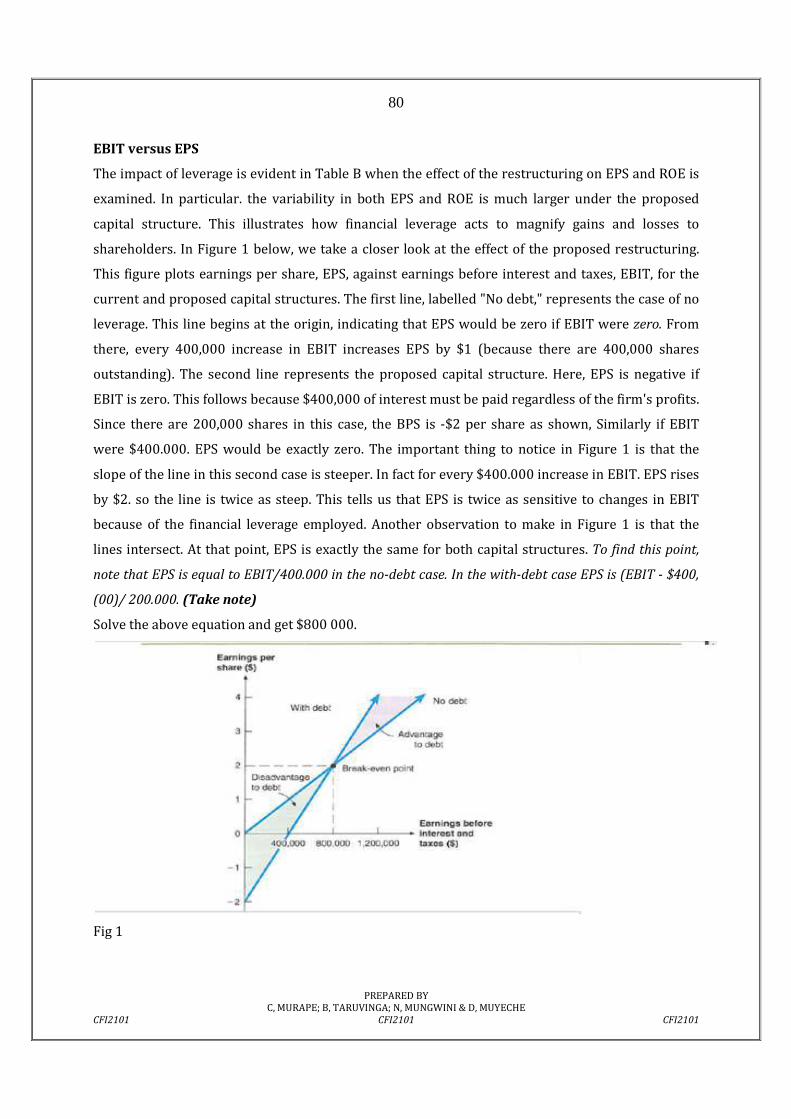
80
PREPARED BY C, MURAPE; B, TARUVINGA; N, MUNGWINI & D, MUYECHE
CFI2101 CFI2101 CFI2101
EBIT versus EPS
The impact of leverage is evident in Table B when the effect of the restructuring on EPS and ROE is
examined. In particular. the variability in both EPS and ROE is much larger under the proposed
capital structure. This illustrates how financial leverage acts to magnify gains and losses to
shareholders. In Figure 1 below, we take a closer look at the effect of the proposed restructuring.
This figure plots earnings per share, EPS, against earnings before interest and taxes, EBIT, for the
current and proposed capital structures. The first line, labelled "No debt," represents the case of no
leverage. This line begins at the origin, indicating that EPS would be zero if EBIT were zero. From
there, every 400,000 increase in EBIT increases EPS by $1 (because there are 400,000 shares
outstanding). The second line represents the proposed capital structure. Here, EPS is negative if
EBIT is zero. This follows because $400,000 of interest must be paid regardless of the firm's profits.
Since there are 200,000 shares in this case, the BPS is -$2 per share as shown, Similarly if EBIT
were $400.000. EPS would be exactly zero. The important thing to notice in Figure 1 is that the
slope of the line in this second case is steeper. In fact for every $400.000 increase in EBIT. EPS rises
by $2. so the line is twice as steep. This tells us that EPS is twice as sensitive to changes in EBIT
because of the financial leverage employed. Another observation to make in Figure 1 is that the
lines intersect. At that point, EPS is exactly the same for both capital structures. To find this point,
note that EPS is equal to EBIT/400.000 in the no-debt case. In the with-debt case EPS is (EBIT - $400,
(00)/ 200.000. (Take note)
Solve the above equation and get $800 000.
Fig 1
81
PREPARED BY C, MURAPE; B, TARUVINGA; N, MUNGWINI & D, MUYECHE
CFI2101 CFI2101 CFI2101
When EBIT is $800,000, EPS is $2 per share under either capital structure. This is labelled as the
break-even point in Figure 1: we could also call it the indifference point. If EBIT is above this level.
leverage is beneficial; if it is below this point, it is not. There is another, more intuitive, way of
seeing why the break-even point is $800,000.Notice that, if the firm has no debt and its EBIT is
$800,000, its net income is also $800,000. In this case, the ROE is $800,000/8,000.000 = 10%. This
is precisely the same as the interest rate on the debt, so the firm earns a return that is just sufficient
to pay the interest.
Work to do
The Inkomo Corporation has decided in favour of a capital restructuring. Currently, Inkomo uses no-
debt financing. Following the restructuring, however, debt will be $1 million. The interest rate on the
debt will be 9 percent. Inkomo currently has 200,000 shares outstanding, and the price per share IS
$20 If the restructuring is expected to increase EPS, what is the minimum level for EBIT that Inkomo's
management must be expecting? Ignore taxes in your response
⇔ Kindly research on Break Even EBIT, homemade leverage and corporate borrowing
Concept check
1. What impact does financial leverage have on EPS and ROE?
2. What is known as the indifference point in EBIT/EPS analysis?
3. Differentiate between degree of operating leverage (DOL) and degree of financial leverage (DFL).
Combining Operating and Financial leverage
Operating leverage affects a firm’s operating profit (EBIT), while financial leverage affects profit
after tax or the earnings per share. The combined effect of two leverages can be quite significant for
the earnings available to ordinary shareholders.
Degree of Operating Leverage
The degree of operating leverage (DOL) is defined as the percentage change in the earnings
before interest and taxes relative to a given percentage change in sales. Thus:
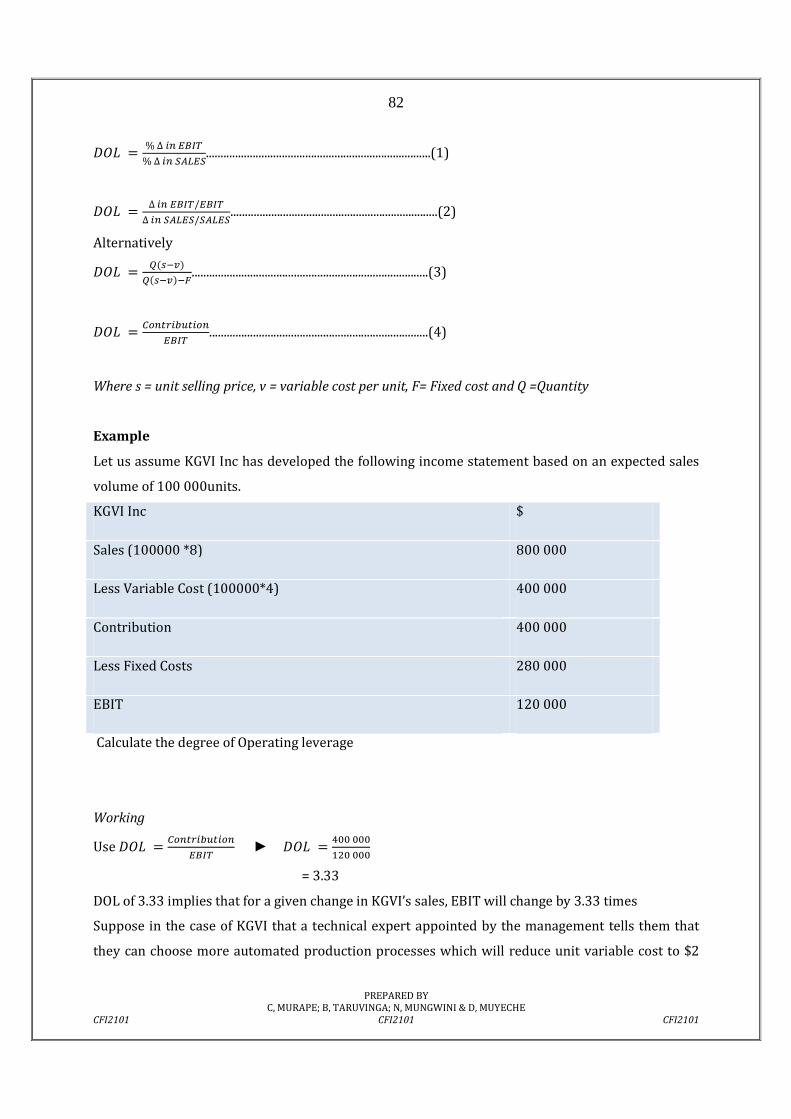
82
PREPARED BY C, MURAPE; B, TARUVINGA; N, MUNGWINI & D, MUYECHE
CFI2101 CFI2101 CFI2101
rNs = %∆6�uvwx%∆6�yz{uy.............................................................................(1)
rNs = ∆6�uvwx/uvwx∆6�yz{uy/yz{uy.......................................................................(2)
Alternatively
rNs = }�~(��}�~(��(;.................................................................................(3)
rNs = 5��<�6km<6��uvwx ...........................................................................(4)
Where s = unit selling price, v = variable cost per unit, F= Fixed cost and Q =Quantity
Example
Let us assume KGVI Inc has developed the following income statement based on an expected sales
volume of 100 000units.
KGVI Inc $
Sales (100000 *8) 800 000
Less Variable Cost (100000*4) 400 000
Contribution 400 000
Less Fixed Costs 280 000
EBIT 120 000
Calculate the degree of Operating leverage
Working
Use rNs = 5��<�6km<6��uvwx ► rNs = �EEEEE
8GEEEE
= 3.33
DOL of 3.33 implies that for a given change in KGVI’s sales, EBIT will change by 3.33 times
Suppose in the case of KGVI that a technical expert appointed by the management tells them that
they can choose more automated production processes which will reduce unit variable cost to $2
83
PREPARED BY C, MURAPE; B, TARUVINGA; N, MUNGWINI & D, MUYECHE
CFI2101 CFI2101 CFI2101
but will increase fixed costs to $480,000. If the management accepts the expert’s advice,
RECONSTRUCT THE INCOME STATEMENT
Degree of Financial Leverage
The percentage change in a firm’s earnings per share (EPS) resulting from a 1 percent change in
operating profit. The degree of financial leverage calculates the proportional change in net income
that is caused by a change in the capital structure of a business to either increase or decrease the
amount of debt for which the company is liable.
The degree of financial leverage is useful for modelling what may happen to the net income of a
business in the future, based on changes in its operating income, interest rates, and/or amount of
debt burden. In particular, when debt is added to a business, this introduces interest expense,
which is a fixed cost. Since interest cost is a fixed cost, it increases the breakeven point at which a
business begins to turn a profit. The result is usually a higher level of risk, where a company can
earn a great deal more money above its breakeven level from the funds provided by the additional
debt, but the higher breakeven level also means that the company will lose more money if sales dip
below the higher breakeven point.
When a company has a high degree of financial leverage, the volatility of its stock price will likely
increase and reflect the volatility of its earnings. When a company has a high level of stock price
volatility, it must record a higher expense associated with any stock options it has granted. This
constitutes an additional cost of taking on more debt.
The metric can also be used to compare the results of several businesses to see which ones have
more financial risk built into their capital structures. This information might lead an investor to buy
the shares of a company with a higher degree of financial risk during an expanding economy, since
he should earn outsized profits on higher sales volume. Conversely, the same information would
lead an investor to buy the shares of a company with a lower degree of financial risk during a
contracting economy, since its lower breakeven point should mitigate its losses. Thus, this type of
analysis can be used to compare and contrast the likely financial performance of companies within
a single industry, and reapportion investments among them, depending on the economic
environment
84
PREPARED BY C, MURAPE; B, TARUVINGA; N, MUNGWINI & D, MUYECHE
CFI2101 CFI2101 CFI2101
Computing DFL
r�s = %∆6�uTy%∆6�uvwx............................(5)
r�s = ∆6�uvwx/uvwx∆6�yz{uy/yz{uy...................(6)
r�s = }�~(��(;}�~(��(;(wSx.....................(7)
Degree of Total Leverage
Use the following links to get an understanding of degree of total leverage
1) http://www.investopedia.com/terms/d/dcl.asp
2) http://web2.aabu.edu.jo/tool/course_file/lec_notes/502331_leverage.ppt
3) http://www.investorwords.com/18071/degree_of_combined_leverage_DCL.html
To Sum Up
• The debt-equity mix of a firm is called its capital structure. The term financial structure, on
the other hand, is used in a broader sense, and it includes equity and all liabilities of the
firm.
• The capital structure decision is a significant financial decision since it affects the
shareholders’ return and risk, and consequently, the market value of shares.
• The use of the fixed-charges capital like debt with equity capital in the capital structure is
described as financial leverage or trading on equity. The main reason for using financial
leverage is to increase the shareholders’ return.
• Consider an example : suppose you have an opportunity of earning 20 per cent on an
investment of $100 for one year. If you invest your own money, your return will be 20 per
cent. On the other hand, you can borrow, say, $50 at 10 per cent rate of interest from your
friend and put your own money worth $50. You shall get total earnings of $20, out of which
you will have to pay $5 as interest to your friend. You shall be left with $15 on your
investment of $50, which gives you a return of 30 per cent. You have earned more at the
cost of your friend.
85
PREPARED BY C, MURAPE; B, TARUVINGA; N, MUNGWINI & D, MUYECHE
CFI2101 CFI2101 CFI2101
Chapter8: Chapter Review Questions
1) Given that Morris Corporation has decided in favor of a capital restructuring that involves
increasing its existing $5 million in debt to 525 million. The interest rate on the debt is 12
percent and is not expected to change. The firm currently has one million shares
outstanding and the price per share is $40. If the restructuring is expected to increase the
ROE what is the minimum level for EBIT that Morris' management must be expecting.
Ignore taxes in your answer.
2) Explain what is meant by business and financial risk. Suppose Firm A has greater business
risk than Firm B. Is it true that Firm A also has a higher cost of equity capital? Explain
3) Kyle Corporation is comparing two different capital structures, an all-equity plan (Plan 1)
and a levered plan (Plan II). Under Plan I, Kyle would have 900,000 shares of stock
outstanding. Under Plan II, there would he 650,000 shares of stock outstanding and S10
million in debt outstanding. The interest rate on the debt is 10 percent, and there are no
taxes.
a) If EBIT is 51.5 million, which plan will result in the higher EPS')
b) If EBIT is $5 million, which plan wi II result in the higher EPS?
c) What is the break-even EBIT?
4) A company currently has assets of $5 million. The firm is 100 percent equity financed. The
company currently has net income of $1 million, and it pays out 40 percent of its net income
as dividends. Both net income and dividends are expected to grow at a constant rate of 5
percent per year. There are 200,000 shares of stock outstanding, and it is estimated that the
current cost of capital is 13.40 percent. The company is considering a recapitalization
where it will issue $1 million in debt and use the proceeds to repurchase stock. Investment
bankers have estimated that if the company goes through with the recapitalization, its
before-tax cost of debt will be 11 percent, and the cost of equity will rise to 14.5 percent.
Tax rate is 40%
a) What is the current share price of the stock (before the recapitalization)?
b) Assuming that the company maintains the same payout ratio, what will be its stock price
following the recapitalization?
86
PREPARED BY C, MURAPE; B, TARUVINGA; N, MUNGWINI & D, MUYECHE
CFI2101 CFI2101 CFI2101
REFERENCES FOR CHAPTER 8
1) Totala CAS and Pachori NK (2012), Influence of Financial Leverage on Shareholders Return
and Market Capitalization: A Study of Automotive Cluster Companies of Pithampur, (M.P.),
India, 2nd International Conference on Humanities, Geography and Economics (ICHGE'2012)
Singapore April 28-29, 2012
2) Saini R, (2012), Impact of financial leverage on shareholders returns and market
capitalisation: Empirical evidence of Telecommunications sector companies, India,
International Journal of Research in IT, Management and Engineering, Volume2, Issue12
(December-2012)
3) Rehman S S F U (2013), “Relationship between Financial Leverage and Financial
Performance: Empirical Evidence of Listed Sugar Companies of Pakistan, Global Journal of
Management and Business Research Finance, Volume 13 Issue 8 Version 1.0 Year 2013
4) Ross A, Westerfield RW and Jordan BD (2008), Essentials of Corporate Finance 6th Edition,
McGraw Hill, New York
Websites
1) http://www.investopedia.com/terms/d/dcl.asp
2) http://web2.aabu.edu.jo/tool/course_file/lec_notes/502331_leverage.ppt
3) http://www.investorwords.com/18071/degree_of_combined_leverage_DCL.html
4) http://www.wisegeek.com/what-are-the-different-measures-of-financial-leverage.htm
5) http://www.nasdaq.com/investing/glossary/d/debt-equity-ratio
6) http://www.accountingtools.com/questions-and-answers/what-is-degree-of-financial-
leverage.html
7) http://application.dbuglobal.com/assets/Pu18FM1004/CPu18FM1004/UNIT%207%20FI
NANCIAL%20AND%20OPERATING%20LEVERAGE.pdf


