Embed Size (px)
Citation preview

1
Challenging Hydrological Panaceas: Evidence from the Niger River Basin
John Ward, David Kaczan, Andrew Ogilvie and Anna Lukasiewicz1
Introduction
In 2009, 700 million people in 43 countries were estimated to live below the water-
stress threshold of 1700 cubic metres per person. By 2025 that number is estimated to
reach three billion (UNDP 2006). Global water diversions for agriculture represent
approximately 70 per cent of total water consumption and are expected to grow by up
to 17 per cent by 2025 (de Fraiture and others 2001). Climate change and rapidly
expanding populations in the developing world threaten to exacerbate water related
poverty and undermine alleviating efforts. There is an enduring consensus that the
extent of West Africa’s poverty remains both acute and chronic and efforts to address
water related poverty and agricultural water use are identified as key elements in
poverty reduction.
From the perspective of policy initiatives to alleviate poverty, what remains unclear is
the relationship between water related poverty with the widely deployed metrics of
poverty, and methods to identify and estimate co-determinants. The primary focus of
this chapter is the evaluation of spatial and statistical methods to quantify the extent,
magnitude and location of the potential non-water and water related determinants of
poverty in the Niger Basin, West Africa (Ward and others 2009).
Water poverty occurs as the combined effect of factors including increasing and
competing water demand, changes in hydrological regimes due in part to climate
change, increasing population, environmental degradation, reduced water quality,
impediments to water access, conflict, corruption and changing levels of water
productivity. These relationships are dynamic and likely to vary spatially and
temporally. Past policy responses have relied on poverty assessments that are
generally not spatially explicit coupled with hydrological models based on historical
flows that may be redundant under regimes of climate change. Policy initiatives that
rely solely on hydrologic probabilities, or fail to account for the different causal
relationships of spatially differentiated poverty may be either ineffective or accelerate
poverty levels and disparities of well being.
Water poverty occurs when people are unable to access dependable water resources or
lack the capacity to use them. Water may be insufficient for basic needs, for food
production or for wider economic and environmental services. Water scarcity is
commonly thought to arise due to physical or economic constraints, although Molle
and Mollinga (2003) distinguish three further causes of scarcity: managerial,
institutional and political scarcity. This distinction reflects the complex nature of
water poverty and points to the need to look beyond technical and financial means
alone to reduce water poverty.
Institutional arrangements for poverty alleviation and the unit of analysis where
decisions are made and implemented can occur at the whole of basin, national,
administrative district and community scale. Regional perspectives of poverty that
guide policy decisions cannot be presumed to be aligned or concordant with basin
1 John Ward is a Senior Research Scientist with CSIRO Sustainable Ecosystems. David Kaczan
is an M.Sc. candidate at the University of Alberta, Canada. Andrew Ogilvie, IRD UMR G-eau, is the
deputy coordinator of the Niger Basin Focal Project and Anna Lukasiewicz is PhD candidate at Charles
Sturt University, Australia. The contributions of the Dogon village of Bamani and the support of the
Challenge Program for Water and Food are acknowledged with appreciation

2
differentiation of poverty, livelihood vulnerability or institutional diversity (Hyman
and others 2005). An important focus of the research described in this chapter was to
guide methodological development and application that imputes variables at scales
that simultaneously align water productivity, access and poverty data.
Alignment indicates opportunities for water policy formulation that is administratively
and politically feasible across the Niger Basin countries. The analysis was intended to
guide water management policy formulation in the direction of the causes of poverty,
threats to livelihoods and increased vulnerability at scales that reflect hot spots of
priority where social units are most threatened or exposed. With such analysis,
measures of water productivity and access, when significant, can be incorporated into
aspects of policies that support sustainable livelihoods and become an integral part of
mainstream development support.
We hypothesise that water policy design and ultimately performance, are sensitive to
spatial scale effects and as a consequence, initiatives to reduce poverty will need to
account for the spatial variation of poverty and include an expanded array of poverty
determinants.
The first research objective we describe in this chapter identifies methodologies
capable of integrating impact analysis and policy formulation that reliably
differentiates poverty at multiple scales. The second research objective describes
poverty mapping as a unit of analysis that aligns water productivity and water access
with poverty data, revealing opportunities for politically feasible water policy
formulation. The final objective describes an evidence based and spatially explicit
analysis that guides effective policy development in the direction of the causes of
poverty at scales that reflect the most exposed communities.
To achieve these objectives we considered four core questions:
1. How can water related poverty be defined, measured and spatially referenced,
particularly in economies where a majority of provisioning or livelihood
activities remain non-monetized?
2. Do the explanatory relationships of water poverty differ at variable spatial
scales of decision-making? If so, what is an appropriate scale or unit of
analysis to capture the heterogeneity of poverty, to identify areas of critical
need and to quantify the diversity of explanatory variables?
3. What is the most appropriate scale to reliably inform policy innovation,
formulation and intervention that is feasible and most likely to be effective in
poverty alleviation?
4. When constructing vulnerability or water poverty indices, is there a reliable
alternative to subjectively determined weightings of composite variables? Is
there a rapid and feasible alternative when expert opinion or participatory
processes are unreliable or not available?
Water poverty and water scarcity
In terms of agricultural water use, Cook and Gichucki (2007) define water wealth–
poverty as “a function of water availability and water productivity of the agricultural
water management system that enables people to derive a livelihood from it”. This
definition takes into account three variables:
The water system – which determines availability and reliability of water;

3
The agricultural system – which converts water into livelihood support
through food, income or other attributes. This is defined by water productivity;
The livelihood system – which modifies water access according to social
relations, institutions or organizations;
Black and Hall (2003) suggest that the water-poor include those whose livelihoods are
persistently threatened by drought or flood, those who are constrained from improving
agricultural productivity due to uncertain water availability, those who are water-
constrained from growing higher value products and those who live with a high level
of water-associated disease and cannot avoid such risks.
It follows that improvements in water access will lead to improved food security,
health and economic prosperity, addressing simultaneously multiple dimensions of
poverty (Molden 2007). Although other non-water constraints can prevent these
benefits from materialising (Hanjra and Gichucki 2008), improving the water situation
can have a disproportionately large positive impact due to the number and variety of
linkages in the water-poverty nexus.
The Niger River Basin Authority (2005), Namara and others (2009) and Hussain and
Hanjra (2004) argue that increased irrigation and proximity to dams in West Africa
provides a pathway out of poverty, indicating community opportunities and capacity
to access and transform water into food. However, despite agricultural productivity
growth being expected to reduce poverty in the rural agriculture-dominant economies
of West Africa (Thirtle and others 2003) poverty prevails in areas of good soil quality,
high productivity and sufficient water availability.
A person who lacks safe and affordable water for the purposes of drinking, washing
and deriving income is water insecure. When a large number of people are water
insecure in a particular geographic area, that area is considered water scarce
(Rijsberman 2006).
Finally, water scarcity may result not only from environmental factors but also due to
a community’s economic situation. Economic water scarcity is defined by the lack of
financial means to develop otherwise abundant water resources, contributing to an
underperformance in agricultural productivity (Hussain and Hanjra 2004; Cook and
Gichucki 2007). Regions of economic water scarcity offer attractive opportunities for
investment towards poverty alleviation (Fan and others 2000) and much of sub-
Saharan Africa (SSA) may be categorized as an area of high potential for water
productivity enhancement along these lines (Molden and others 2001).
Turton and Warner (2002) discuss water scarcity as a product of a ‘first-order’
resource scarcity and a ‘second-order’ social scarcity. The former is due to physical
limitations while the latter refers to the institutional ability to utilise the resource in
question and thus manage scarcity. Countries that suffer from both order scarcities are
considered ‘water-poor’ and may consequently find themselves trapped in a spiral of
under-development.
Accordingly the conceptual links between water and poverty are well developed
(Castillo and others 2007). A large number of causal relationships have been
hypothesized; however there remains a need for research that convincingly
demonstrates how an improvement in a community’s water situation changes the
incidence of poverty (Rijsberman 2003; Asian Development Bank 2004).

4
Furthermore, it is likely that these causal relationships are spatially, temporally and
institutionally scale-dependent.
Brown and Lall (2006) demonstrate this by using variables of mean annual
temperature, mean annual precipitation, intra- and inter-annual variability and spatial
variability of rainfall to predict macro-economic performance. As well as
demonstrating the significance of temporal variability of rainfall on gross domestic
product (GDP), they argue that different water policies are required for different
categories of water-concerned countries. Those with insufficient mean rainfall require
‘soft’ policies (efficiency, water trading, food importation), while those with
inadequate temporal distribution require ‘hard’ policies (construction of water
impoundments).
The remainder of this chapter describes spatially explicit analyses that attempt to
differentiate and quantify the relative importance of water and non-water related
determinants of poverty and as a corollary, the potential role of “soft” and “hard”
policies to reduce poverty in the Niger Basin.
8.1.1 Poverty profile of the Niger Basin
The Niger River has a total length of approximately 4,200 km, making it the third-
longest river in Africa (after the Nile and the Congo/Zaire Rivers). Theoretically the
basin covers 2,170,500 km², although the active (hydrologically connected) basin is
smaller, at approximately 1,500,000 km² (see Figure 1). The basin’s extent lies over
ten riparian countries, namely Nigeria, Mali, Niger, Algeria, Guinea where the
sources are located, Cameroon, Burkina Faso, Benin, Côte d’Ivoire and Chad.
The river traverses agro-ecological zones of considerable diversity. The source waters
originate in the wet monsoonal uplands of Guinea and provide the bulk of river flows.
The Niger flows through the generally flat Sudanian and Sahelian regions of Mali.
This region includes the Niger Inner Delta, a large area of wetlands and floodplains
recognized for both its ecological and agricultural importance. The Niger then passes
through the southern region of the Sahara desert, before turning to the south-east and
flowing towards Nigeria. A major tributary, the Benue River, joins the Niger in
Central Nigeria.
The population of the Niger Basin countries is approximately 277 million, of which
approximately 94 million live within the extent of the river basin (UN Population
Division 2006). Population growth of the basin countries is high, with a long term
average (1975-2005) of between 2.5 and 3.5 per cent (UNDP 2007). The demographic
profile is female biased and young, with 44 per cent of the basin’s population under
15 years of age. The proportion of the basin’s inhabitants living in urban areas is
around 30 per cent, although this proportion is smaller in the Sahelian regions (Niger
Basin Authority 2005). Despite recent economic growth as measured by GDP in
Nigeria for example2, economic development in West African nations remains low.
When ranked by GDP (purchasing power parity, per capita), all nine countries of the
Niger Basin fall in the bottom quarter of national incomes. The United Nations
Human Development Index, a composite ranking based on national income, life
expectancy and adult literacy rate, ranks all the Niger Basin countries in the lowest
quintile of countries (UNDP 2007).
2 (http://www.africaneconomicoutlook.org/en/outlook/macroeconomic-performances-in-africa/economic-
growth/west-africa/)

5
Insert Figure 1 here
Figure 1 Study region showing the active Niger Basin, major tributaries, basin countries and 3rd
level administrative districts
The proportion of people living below the poverty line (US$1.25 per day) is high
throughout the Niger Basin countries and especially acute in Burkina Faso (70.3 per
cent), Guinea (70.1 per cent) and Niger (65.9 per cent) (World Bank 2009). This
amounts to an estimated 138 million poor in the basin countries, of which a
disproportionate number live in rural areas. The labour force is concentrated in
industries associated with agriculture, although agriculture as a share of GDP is often
disproportionately low. This is partially due to low productivity, a problem common
across SSA where the average annual cereal yield is 1,230 kg/ha, compared with over
3,000 kg/ha in South America and Asia (Castillo and others 2007; Hanjra and
Gichucki 2008). Furthermore, a large proportion of food production occurs within
subsistence-based economic systems, and is therefore not recorded under
conventional national accounting measures such as GDP.
Life expectancies are in the bottom 15 per cent of all countries worldwide in the Niger
Basin. Childhood mortality rates (death prior to the age of five) of up to 250 per 1000
live births are approximately two to three times higher than neighbouring countries in
northern and southern Africa (Balk and others 2003). The region is characterized by a
high prevalence of endemic and epidemic communicable diseases. Respiratory
diseases, malaria and diarrhoeal diseases are the largest causes of child mortality
(ECOWAS-SWAC/OECD 2008). Human Immunodeficiency Virus (HIV) infection
rates are considered high (between 1.1 per cent and 7.1 per cent); although less severe
than those in southern Africa. Across the study region countries, 53 per cent of people
used an improved source of drinking water in 2004, and only 37 per cent had access to
adequate sanitation facilities, statistics that are low by world standards
(UNICEF 2008).
Adult rates of literacy are some of the lowest in the world, and female literacy levels
are significantly less than those for males (UNDP 2007). Recent UNESCO (2008)
figures indicate substantial improvements over the previous decade. Primary
education participation rates have increased in all the basin countries, with Niger,
Mali, Chad and Benin increasing net enrolment ratios by more than ten per cent.
Economic output in the Niger Basin countries, and especially in the Sahelian
countries, is highly dependant on the Niger River. However the Niger Basin
Authority (2005), argues that the basin has further untapped potential and that
additional water resources would become available with further infrastructure
development. Contingent on focused investment, the Niger Basin Authority (2005)
contends that expansions are possible in dry land agriculture, irrigation and electricity
development.
Climatic variability is estimated to reduce the exploitable environmental value of the
basin’s agricultural regions, and a 30 per cent long term reduction in rainfall in the
Sahelian regions since the 1970s may be indicative of a new, drier, climatic regime
(Niger Basin Authority 2005). However, it is important to recognize that protracted
dry spells have occurred before and the current climate’s stability or degree of
permanency is a subject of ongoing debate. Reductions in rainfall have also led to a

6
reduction in surface flows of between 20-50 per cent. An increase in climate
variability has made the Sahel region and its people more vulnerable to desertification
and land degradation, a process that is a function of climate change, increased human
activity and land management. The impact of climate change on the population of the
Niger Basin is potentially severe; however the lack of consensus in modelling
predictions leaves Governments to consider and resolve multiple outcomes arising
from a number of possible land use scenarios and water development trajectories
(Mitchell and others 2004).
Table 1 summarises the development status for Niger Basin countries according to an
array of commonly applied poverty metrics. Such indicators have become
increasingly widespread and favoured by decision-makers. Although indices capture
the multifaceted nature of a complex issue, they amalgamate and often arbitrarily
weight disparate pieces of information. Indices provide a viewpoint for a particular
purpose, and implicitly represent the personal values of their architects (Molle and
Mollinga 2003). Yet composite indicators retain their prominence: they simplify and
rationalize complex problems, they allow for easy comparisons, they suggest
scientific legitimacy and they are easily communicated.
Widely deployed poverty measures such as individual or household income, often fail
to reflect the many dimensions of poverty, notably when considering the mostly
cashless, subsistence farming society of West Africa (among others see Cook and
Gichucki 2007; World Bank 2009). Index measures attempt to capture the multi-
dimensional nature of either poverty or vulnerability by aggregating a range of
selected social-economic indicators; however they rely on subjective or even arbitrary
construction of composite indices and attribution of variable weights (Vincent 2004).
Indicators that objectively measure a single dimension (eg. childhood mortality rate)
may offer the closest depiction of poverty in these communities (Molle and Mollinga
2003).

7
Table 1 Poverty and water situation indicators for countries of the Niger Basin.
GD
P (
PP
P,
pe
r
ca
pit
a)
Po
pu
lati
on
be
low
po
ve
rty lin
e (
US
$1
.25
/da
y)
Lif
e e
xp
ec
tan
cy
at
Bir
th
Un
de
r 5
mo
rta
lity
rate
To
tal
Avail
ab
le
Ren
ew
ab
le W
ate
r
Res
ou
rce
s
Wa
ter
Po
ve
rty
Ind
ex
Bas
ic H
um
an
Nee
ds
In
de
x
So
cia
l
Vu
lne
rab
ilit
y
Ind
ex
HD
I
Gin
i C
o-e
ffic
ien
t
2007 2007 2007 2007 2005 2002 2000 2004 2007-8 2007
$US/capita % Years % m3/yr/capita
100-lowest poverty 0-highest poverty
50L-minimum basic needs
Index value (higher – more vulnerable)
Index value (higher – more developed) (rank in brackets)
100-complete inequality, 0-complete equality
Benin 1,500 47.3 55.4 19.1 3,820 39.3 15 0.584 0.437 (163) 36.5
Burkina Faso 1,200 70.3 51.4 15.0 930 41.5 17 0.658 0.370 (176) 39.5
Cameroon 2,300 32.8 49.8 14.9 17,520 53.6 33 0.640 0.532 (144) 44.6
Chad 1600 61.9 50 20.8 4,860 38.5 11 0.618 0.388 (170) -
Cote d'Ivoire 1,800 23.3 47.4 19.5 4,790 45.7 28 0.584 0.432 (166) 44.6
Guinea 1,000 70.1 54.8 15.0 26,220 51.7 26 0.562 0.456 (160) 38.1
Mali 1,200 51.4 53.1 21.8 7,460 40.6 6 0.585 0.380 (173) 40.1
Niger 700 65.9 55.8 25.6 2,710 35.2 20 0.725 0.374 (174) 50.5
Nigeria 2,200 64.4 46.4 19.4 2,250 43.9 24 0.621 0.470 (158) 43.7
OECD* mean 37, 496 n/a 78.3 0.52 39,085 39.7 n/a n/a 0.939 10.39
Non OECD* mean 10 898 n/a 66.1 6.76 26,802 23.6 n/a n/a 0.686 18.65
Compiled from Gleick, 1999; Lawrence and others, 2002; Vincent, 2004; UNESCO, 2006; UNDP, 2007; CIA, 2008; World Bank, 2009;*OECD mean based on the 27 high income countries as defined by the World Bank (2009).
8
Water poverty in the Niger Basin
Water poverty occurs when people do not have access to dependable water resources or lack
the capacity to use them. Water may be insufficient for basic needs, for food production or
for wider economic and environmental services.
There exist a number of indicators designed to measure or characterise water poverty (see
Table 1). Like poverty indicators, these require moving from raw data towards a composite
aggregated indicator and as a result often gain in simplicity what they lose in precision. The
widely used Falkenmark “water stress index” (Falkenmark and others 1989) defines a
threshold of 1,700m3 of total available renewable water resources (TARWR) per capita per
year, under which a country is deemed to suffer from water scarcity. All countries except
Burkina Faso exceed this threshold; however the indicator fails to capture spatio-temporal
variations, crucial in a country such as Mali that spans from a sub-humid to a hyper-arid
climate. A more comprehensive measurement of water poverty is the Water Poverty
Index (WPI), which notably takes into account communities’ ability to access and use water
but suffers from the use of arbitrary weights and must ideally be generated at a local rather
than national or regional scale (Sullivan and Meigh 2003).
Relationships between water and poverty
Though indices provide an overview of the poverty and water situations faced in the basin,
they are not designed to reflect the linkages between water and poverty. Composite indices
intrinsically mask the importance of individual factors, confounding interpretation of the
potential causes of water poverty and the formulation of subsequent interventions.
Furthermore, identifying a state of water poverty (i.e. low level of water resource, access or
use) may not necessarily explain the associated level of poverty, manifest as reduced levels
of livelihood, well-being or economic poverty.
To address the question of a hypothetical relationship between water and poverty at the
national scale, we estimated statistical relationships using poverty maps and correlation
coefficients. Significant correlations do not imply causality but point towards water resource
factors that may influence poverty. At the national scale, weak correlations between widely
used water and poverty metrics of between 0.02 and 0.47 are characteristic for all African
nations (excluding small island states). Table 2 summarises the correlation matrix between
the Falkenmark Index of water availability and widely used poverty indices. Note that data
for Libya, Liberia and Somalia were unavailable and the table does not include small island
states. To this extent, at a national level there is little evidence for a strong association
between a country’s water situation and its development performance on the African
continent. Note that the Total Available Renewable Water Resource (TARWR) correlation
with the WPI is to be expected given that the latter incorporates a form of the total water
resources statistic. Similarly the WPI also incorporates measures of the Human
Development Index.
9
Table 2: Correlation matrix of poverty indices and the Falkenmark index of water availability
(TARWR) , based on 48 African countries (2001-2002 data)
TARWR WPI Headcount Ratio HDI GSI
TARWR1 - - - - -
Water Poverty Index1 0.30* - - - -
Headcount Ratio2 0.26 -0.34* - - -
Human Development Index3 -0.21 0.67* -0.58* - -
Genuine Savings Indicator4 -0.18 -0.08 -0.17 0.16 -
Social Vulnerability Index5 0.07 -0.47* 0.48* -0.48* -0.02
* - statistically significant correlation (p < 0.05) 1 Lawrence, and others (2002); 2 World Bank (2009); 3 UNDP (2007); 4 Hamilton and Celemens (1999); 5 Vincent (2004).
In this analysis we hypothesised that variables associated with water access and productivity
would significantly affect observed levels of poverty. We therefore modelled poverty
indices as individual variables and examined an expanded array of water and non-water
poverty determinants at high resolution spatial scales to detect statistical relationships.
For this study we relied on three common poverty variables and assessed the role of water
related variables in explaining the observed distribution in each for the countries of the
Niger River Basin. The basin is socially and economically heterogeneous, has a high
proportion of subsistence livelihoods and a relatively large non-market, hybrid economy. A
singular monetary measure of poverty (for instance, household income) is unlikely to
capture either the full magnitude or distribution of poverty. We therefore used two health
variables: child mortality and child stunting (height for age ratios) and a composite relative
wealth index. The singular dimension of the first two variables avoids the problem of
subjective weighting of composite indices and provides evidence based poverty measures
that intersect cultural, economic and policy boundaries (Setboonsarng 2005). Note that the
wealth index is country specific and cannot be compared internationally (Rutstein and
Johnson 2004). Data were taken from the Demographic and Health Surveys (Measure DHS
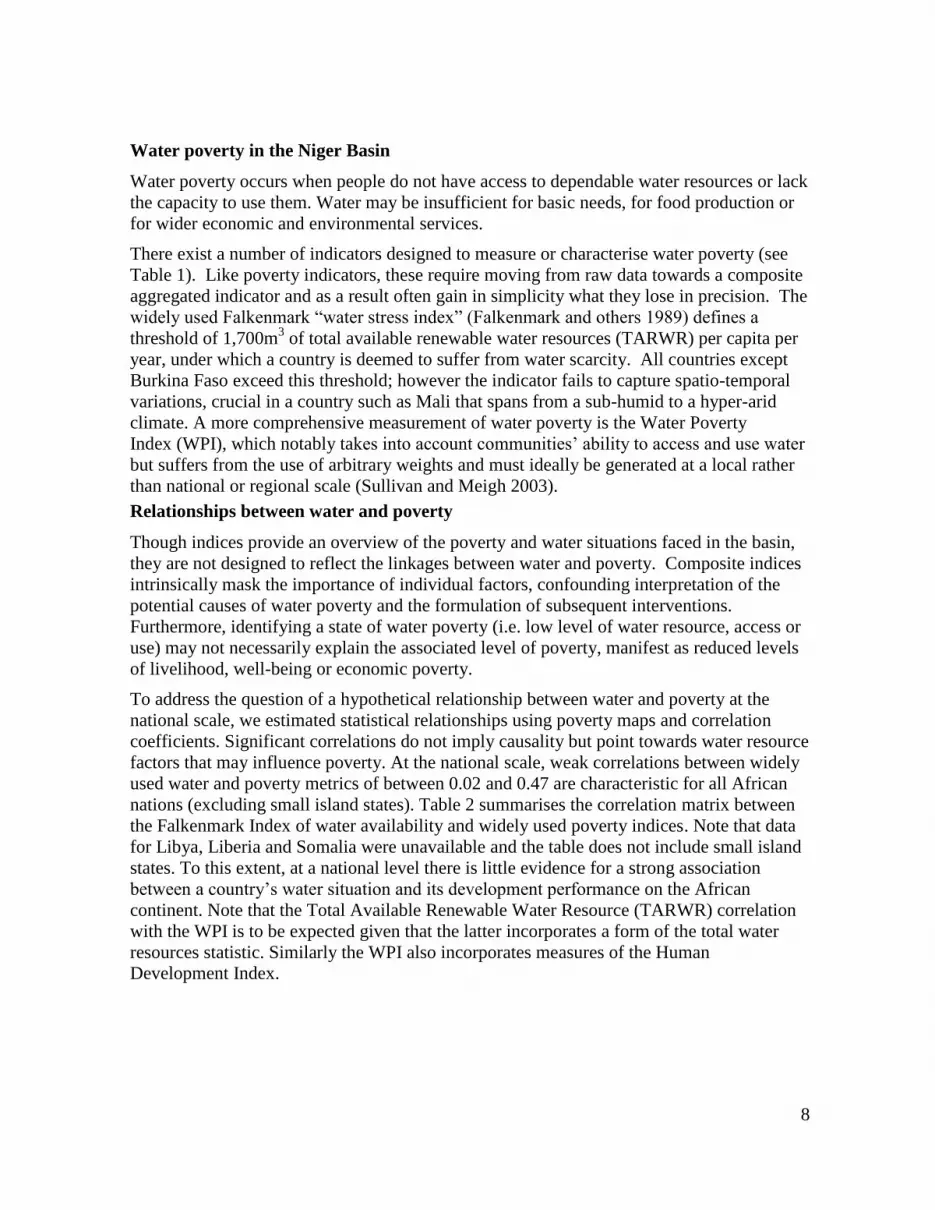
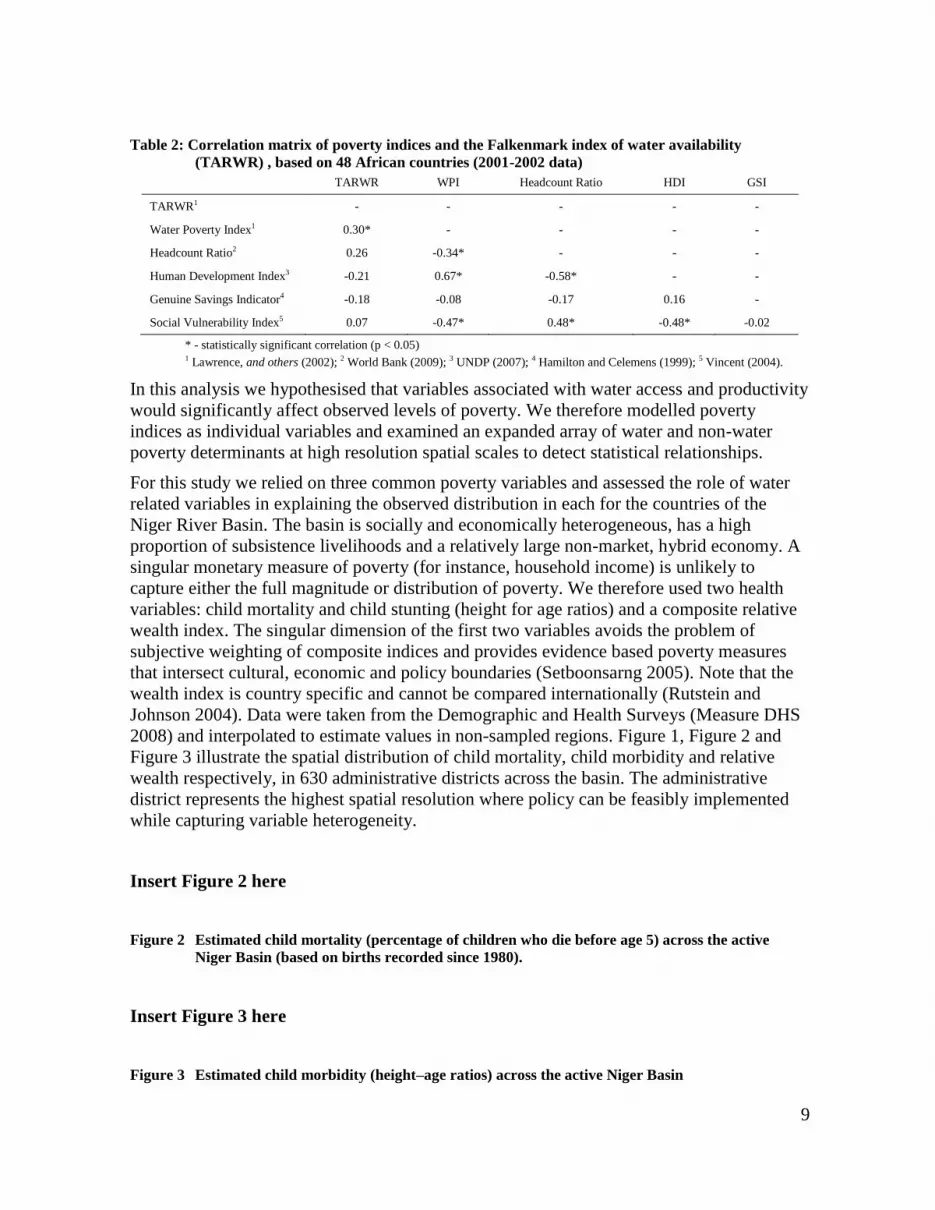
2008) and interpolated to estimate values in non-sampled regions. Figure 1, Figure 2 and
Figure 3 illustrate the spatial distribution of child mortality, child morbidity and relative
wealth respectively, in 630 administrative districts across the basin. The administrative
district represents the highest spatial resolution where policy can be feasibly implemented
while capturing variable heterogeneity.
Insert Figure 2 here
Figure 2 Estimated child mortality (percentage of children who die before age 5) across the active
Niger Basin (based on births recorded since 1980).
Insert Figure 3 here
Figure 3 Estimated child morbidity (height–age ratios) across the active Niger Basin

10
Insert Figure 4 here
Figure 4 Estimated relative wealth across the active Niger Basin, as indicated by possessions, land
ownership, housing material, employees. Values are relative within countries, not between
countries.
Whole of basin assessment
The poverty estimates were assessed for statistical correlation with possible poverty
determinants, both water and non-water related, and were undertaken in the first instance at
a basin scale using geographically weighted regression (GWR). The explanatory variables
employed in the analysis are detailed in Annex 1. GWR formally accounts for significant
spatial correlations or spatial patterning, which can otherwise bias regression results and
lead to misinterpretation (Ward and others 2009). This demonstrated that the influence of
different poverty determinants (such as geographical isolation, education levels and
availability of water) is variable over the Niger Basin; unsurprising given the socio-
economic and biophysical diversity of this large study area.
Furthermore, considerable disparity between results analysed for child mortality and child
stunting was found despite the widely accepted relationship between these variables. This
highlights the need for poverty analysis that incorporates a number of alternative poverty
metrics for cross validation. At the whole of basin scale, we considered robust only those
results that were supported by both the mortality and morbidity analyses.
The total available renewable water resources (TARWR) (cf. Figure 5 and 5A) was
significant (p<0.05 for all statistical tests, unless noted otherwise) in north west Nigeria, east
Nigeria and central Mali.
TARWR was only occasionally associated with poverty, suggesting that social or
institutional factors of water use are more important than water availability. The quality of
water used by households appears to be as important, or more so, than the total quantity of
water available in the environment.
The use of unprotected well or surface water is generally positively correlated with
increased child mortality and increased stunting. In North West Nigeria and east Nigeria, a
1 per cent decrease in the number of people using unprotected water is correlated with an up
to 2.4 per cent decrease in child mortality.
Increased irrigation development is correlated with reductions in child stunting in central
Mali, north west Nigeria, central and eastern Nigeria and north Burkina Faso.
Increased time spent in education is significantly correlated with a decrease in both child
mortality and child stunting. In much of the Mali Inner Delta, a one year increase in the
average level of education is associated with an approximately 3 per cent decrease in child
mortality.
Education and access to improved water quality (see Figure 6A, and Figure 7 and 7A
respectively) are variables that are significant and relatively stationary across the study area.

11
They can therefore be addressed with whole of catchment scale policies with less attention
to regional differences. Certainly, a variable as important as education will require its own
nuances due to cultural factors; however, its gross importance is relatively spatially
consistent.
The variables demonstrated to be statistically non-stationary (i.e. their influence varies
across the landscape) may be more appropriately addressed using a geographically targeted
policy approach. The differences in coefficient estimates are likely to be symptomatic of the
ways in which a variable influences communities subject to local conditions.
Note that in Figure 5A, Figure 6A and Figure 7A, blue represents districts where the
variable in question was not found to have a significant impact, green represents correlation
with decreased childhood mortality, and yellow and orange represent correlation with
increased childhood mortality. Data limitations mean that the identified areas should be
considered approximate only and some contrasting results would require additional detailed
analysis.
Insert Figure 5 here
Figure 5 Total available renewable water resources and irrigation areas within the active Niger Basin
Source: FAO, 2007; FAO, 2000)
Insert Figure 5A here
Figure 5A Map of total available water resources and associated change in child mortality
estimated with GWR
Insert Figure 6 here
Figure 6 Map of education levels (average years) across the Niger River Basin
Insert Figure 6A here
Figure 6A Map of education levels and association with child mortality estimated using GWR
Insert Figure 7 here

12
Figure 7 Water source: proportion of people using unprotected well or surface water. Note: Guinea is
not comparable to rest of active basin due to omission of some data
Insert Figure 7A here
Figure 7A Map of unprotected water and association with child mortality estimated using GWR
National and sub-national poverty analysis (LISA clusters)
Policy decisions are often made at the state or national level, and regional perspectives of
poverty cannot be presumed to be aligned or concordant with the differentiation of poverty,
livelihood vulnerability or institutional diversity across the entire Niger Basin (Hyman and
others 2005). A finer resolution of poverty analysis was used as an alternative to a whole of
basin analysis, enabling the identification of poverty hotspots at a sub-national scale.
Anselin (2005) has developed localized indicators of spatial correlation (LISA) to account
for spatial clustering at defined local scales. These clusters represent areas that have
significantly elevated poverty levels (P<0.05), referred to as ‘hotspots’(Ward and others
2009).
There is broad convergence in the hotspots found using different poverty measures. A
hotspot indicates those regions where the poverty measure is spatially correlated and
significantly worse than the basin median. Figure 6(A) shows child mortality hotspots
(coloured red) in central Mali and the Inner Niger Delta, north Burkina Faso and north west
Nigeria. Figure 6(B) shows hotspots of child stunting (coloured red) clustered in southern
Mali, north eastern Burkina Faso, north west Nigeria and south west Nigeria (stunting is
measured by a height for age ratio hence low values indicate worse conditions). Figure 6(C)
shows hotspots of low relative wealth or asset value (coloured red). Because the wealth
index cannot be compared internationally (Rutstein and Johnson, 2004) this map provides
less robust evidence; however it shows very similar results to the other metrics. Poverty
hotspots occur in south Mali, east Burkina Faso and north west Nigeria.
Insert Figure 8 (A) here
Figure 8 (A) LISA clusters of child mortality (proportion of children who die before age 5 yrs)
across active Niger Basin. Moran’s I value of 0.679 indicates moderate spatial
autocorrelation in this variable.
Insert Figure 8 (B) here

13
Figure 8 (B) LISA clusters of child mortality (height for age ratios) across active Niger Basin.
Moran’s I value of 0.833 indicates high spatial autocorrelation in this variable.
Insert Figure 8 (C) here
Figure 8 (C) LISA clusters of relative wealth across active Niger Basin. Moran’s I value of 0.767
indicates moderate spatial autocorrelation in this variable.
Potential causative factors of each poverty hotspot were explored using spatially explicit
regression analysis. As indicated by the ‘whole of basin’ approach, this sub-basin scale
assessment also found considerable differences in the way poverty manifests in different
regions. Table 4 details the coefficients and statistics, typical of the spatial lag regressions
for child mortality, morbidity and wealth, estimated for north west Nigeria. Nearest
neighbour relationships were used to determine the spatial weights matrix and estimate the
spatial lag regression model according to Anselin (2005).
In north west Nigeria, water quality is the primary water-related factor that correlated with
poverty. A 1 per cent decrease in the number of people who access their primary drinking
water from unprotected well or surface water is associated with a 1.1 per cent decrease in
child mortality. Weaker evidence was found linking water access to child mortality: an
average reduction of ten minutes travelling time taken to access the primary water source is
correlated with a 1.7 per cent decrease in child mortality rates. Similarly, a 1 per cent
increase in a district’s irrigated area corresponds with a 0.04 standard deviation
improvement in height-for-age ratios. Education is the strongest non-water correlate: A one
year increase in average years of schooling is associated with a 0.6 per cent decrease in
child mortality rates where all other factors are held constant.
The central Mali region is an important area of the Niger Basin containing the Ramsar listed
Inner Delta – a highly productive flood plain covering an area of more than 80, 000 km2.
This region is characterised by average child mortality rates of 240 per 1000 live births. The
relationship between water and poverty is ambiguous in this region. Non-water variables
were more clearly correlated with poverty. For instance, a one-year increase in the average
years of schooling is associated with a 3.1 per cent decrease in child mortality rates.
In east Burkina Faso, the use of unprotected water is correlated to poverty suggesting that
quality is more important than quantity or access in this region. Environmental degradation,
as measured by the World Wildlife Fund’s ‘Human Footprint’ score significantly explained
wealth and child mortality. An increase in environmental damage was associated with an
increase in child mortality and a decrease in wealth.
In east Nigeria and north Cameroon, the use of unprotected water sources is significantly
correlated both with reduced wealth and increased child mortality. A 1 per cent decrease in
the use of unprotected well and surface waters is associated with a 0.16 per cent decrease in
child mortality. Evidence was also found for a positive correlation of dams and irrigation on
poverty levels. Education is associated with reduced poverty in the wealth and mortality

14
models, and a one-year increase in average education levels is associated with a 0.7 per cent
decrease in child mortality. Table 3 summarises the water and non-water determinants of
poverty, estimated using spatial lag regression at the scale of administrative district.
Table 3 Summary of spatial lag regressions at the scale of identified poverty hotspots
Poverty Hotspot Measure of poverty Water poverty
variables
Non-water poverty
variables
Utility of the
TARWR variable
North West Nigeria Identified using all three metrics.
Wealth index model strongest (R2 =
0.956)
Water access
Unprotected water
Irrigation
TARWR
Education
Telephones
Moderate – child
mortality only
Central Mali and the Inner Delta
Identified only in child mortality. Wealth index model strongest (R2 =
0.816)
Unprotected water Education
Telephones
Malaria
Limited – contradictory signs
East Burkina Faso Identified using all three metrics. Child
morbidity model strongest (R2 =
0.791). Consistency of results weak.
Unprotected water Education
Environ. damage
Limited – child
morbidity only,
contrary signs
East Nigeria and North Cameroon
Identified only in wealth index. Child mortality model strongest (R2 = 0.647)
Unprotected water Education
Population density
Malaria
Limited – not significant
South and Central
Nigeria (‘wealth hotspot’)
Identified using all three metrics.
Wealth index model strongest (R2 = 0.632)
Unprotected water Access to towns
Education
Electricity
Telephones
Limited –
contrary sign, small effect

15
Table 4 Variables explaining wealth, morbidity and mortality at the administrative scale in the north
western Nigeria region.
Wealth Index Child Height for Age
Ratio (s.d)
Child Mortality Rate
(proportion)
(Constant) -0.32330 ** -2.90450 *** -0.07228 *
Population density (people/km2) 0.00017 *** -0.00018 ** 0.00001
Population (people) - - -
Telephones (proportion) - 1.32720 ** 0.05563
Electricity (proportion) - - 0.01361
Net Primary Product (produced) (tonnes/0.25°
cell)
- - -
Access (’00 km) - 0.52565 0.03358
Education (years) 0.07467 ** 0.08867 *** -0.00655 ***
Forest Cover (proportion) -0.16014 0.22228 0.01170
Cattle density (units/km2) -0.00217 -0.01003 ** -0.00076 **
Chicken density (units/km2) 0.00130 *** - 0.00024
Sheep density (units/km2) 0.00003 -0.00381 ** 0.00021
Goat density (units/km2) - 0.00257 0.00006
Pig density (units/km2) - -0.01177 -0.02104 ***
Unprotected water (proportion) -0.73068 *** -0.34122 0.10797 ***
Water Access (minutes) -0.00046 -0.00408 0.00171 ***
Dams (’00 km) -0.23005 *** 0.03517 0.00041
Irrigation (percent) 0.00645 0.04289 * 0.00126
Precipitation (mm/yr) 0.00083 *** 0.00064 0.00008 *
TARWR (m3/yr/km2/person) -0.00014 -0.00034 -0.00015 **
Drought Economic Risk (decile) 0.00346 -0.01672 -0.00159
Human footprint (1-100 index) - - 0.00109
Malaria prevalence (parasite ratio) -0.43230 * 0.44091 * 0.03178
Moran’s I for residuals -0.014 -0.059 0.017
Akaike information criterion -92.14 6.77 -327.14
Aprox. pseudo adj. R2 0.95 0.92 0.89
Spatial weights matrix 3 nearest neighbours 2 nearest neighbours 1 nearest neighbour
Sample size 34 65 71
* = statistically significant at 90% confidence level, ** = 95%, ***=99%. Note that a positive child morbidity
coefficient means increasing height for age ratios and thus an improvement in health.
At a national level TARWR is only weakly correlated with widely used development and
poverty indicators. Even at district scales, the total quantity of water available per capita is
only occasionally significant in predicting child mortality, morbidity or the asset index.
Water quality, however, was more clearly associated with these measures of poverty. At
most poverty hotspots there were significant correlations between the proportion of people
drinking from unprotected water sources and the incidence of poverty. The area of irrigated
16
land was associated with decreases in poverty in only two cases, north west Nigeria (by one
poverty metric) and in eastern Nigeria and northern Cameroon (by two metrics). Other
variables were tested for correlations with poverty such as the spatial distribution of
livestock (sheep, cattle, goats, pigs and chickens), the percentage of human appropriation of
net primary productivity and forest cover. While there is evidence that some of these
variables play a role in explaining poverty levels in some locations they were not
systematically reliable or significant determinants.
Links between poverty and water, poverty and agricultural productivity
A statistical relationship between water quality and child health poverty measures seems
consistent with the vital role given to water and sanitation in alleviating poverty (UNDP/SEI
2006). Insufficient access to clean water is known to impact on human health, through the
development of water-borne diseases (e.g. diarrhoea, cholera) and water washed diseases
(e.g. scabies, trachoma) (Bradley 1974). Diarrhoea is the third cause of child mortality in
West Africa after malaria and respiratory infections (ECOWAS-SWAC/OECD 2008) and
new water borne diseases such as Whipple disease are still emerging (Fenollar and others
2009).
Literature suggests that agricultural water management provides a pathway out of rural
poverty (Namara and others 2009; Hanjra and Gichucki 2008; Hanjra and others 2009). In
this study, weak correlations were found between agricultural water determinants and
poverty variables. TARWR does not account for difficulties in accessing water and
therefore only provides a theoretical value of water potentially available for agriculture.
The metric also does not translate into annual inflow and recharge variations, crucial in
countries that regularly experience drought and flooding in the same year (Rijsberman
2006). Although TARWR is a commonly used indicator, in the Niger Basin it neither
reflects accurately the water availability situation of a community nor its poverty status.
Hussain and Hanjra (2004) argue that increased irrigation and proximity to dams provides a
pathway out of poverty, indicating community opportunities and capacity to access and
transform water into food. This analysis found such a relationship in only some instances.
The spatial regression analyses suggest either that irrigation’s contribution to rural welfare
is low in the Niger Basin, or that the spatial extent of irrigation is too limited at present to
cause any detectable reduction in poverty at this scale of analysis. The literature suggests
that irrigation will be crucial for the future economic development of the basin, along with
improvements in the productivity of rain-fed agriculture. However, it may be that the
benefits of irrigation do not yet accrue to the people engaged in its practice, or that they do
so at levels too small to register in these analyses.
The relative wealth advantage of the Office du Niger, illustrated in Figure 8 (C) and the
analysis of Zwarts and others (2006) suggest that so far the benefits of irrigation are
confined to local irrigators and external investors and do not sufficiently accrue to the local
poor.
The Office du Niger region is one of the oldest and largest irrigation schemes in SSA and
expansion of irrigated agriculture is cited as a factor in regional poverty reduction. In
general terms expansion can be accomplished by either improved water efficiencies reliant

17
on existing impoundments or the construction of new dams (e.g. the proposed Fomi dam in
Guinea) associated with maintaining existing water efficiencies.
A successful rehabilitation of the area undertaken between 1983 and 1994 saw average rice
paddy yields triple to 5 tonnes/ha. Previously abandoned lands were cultivated and the
settler population grew by 222 per cent (Aw and Dejou, 1996). By 2004, the average paddy
yields had increased to 6.5 tonnes/ha; water use dropped from 1,500m3/t to 250m
3/t and
cultivation intensity climbed from 60 per cent to 115 per cent (Diemer, 2004).
As an alternative to engineered solutions, successful rehabilitation was achieved by micro
management and institutional reforms, implemented by the Malian government in return for
capital investment by donor countries (Zwarts and others 2005, 2006; Molden 2007).
Institutional reforms included the privatization of non-irrigation activities enabling farmers
to sell produce and purchase agricultural inputs at will. Decision making has gradually
shifted from government officials to famers’ representatives, formalized by three year
performance contracts between the government and farmers. The arrangements have
improved the effectiveness of incentives, evidenced by increased agricultural outputs and
subsequent net productivity.
In this study, agriculture related indicators including primary productivity, soil quality or
livestock numbers, provide limited explanatory power of poverty levels. A similar study in
Malawi by Benson and others (2005) found that a rise in maize yields actually resulted in
increased poverty, presumably due to equity issues, with higher yields not benefiting local
populations. Despite agricultural productivity growth being expected to reduce poverty in
the rural agriculture-dominant economies of West Africa (Thirtle and others 2003), poverty
prevails in areas of good soil quality, high productivity and sufficient water availability.
These results point to the complexity involved in transforming available water into adequate
food production and a pathway out of poverty. Beyond reliable water access, food
production relies on several additional conditions being met such as access to land, labour,
seeds, fertiliser, pesticides, tools and machinery, fuel, storage, transformation processes,
roads, markets and political security. Hanjra and others (2009) point to significant
correlations between these variables and agricultural productivity; however variable
interactions are critical in determining resultant poverty. Some of these factors may be
spatially stationary at the regional scale (such as roads and access to markets); others such
as access to land may vary widely from one family or ethnic tribe compared to another
within the same village and therefore require detailed analysis. The latter structural
indicators of poverty are notably caused by the positioning of individuals in the
socioeconomic structure (Mulwafu and Msosa 2005).
Overall, it is difficult to isolate one contributing factor to poverty. Instead, the evidence
from this analysis promotes a multi-variate consideration of the capabilities (e.g. level of
training, diverse income sources, capital and support networks) of a household or
community (Chambers and Conway 1992), as these determine whether they will fall or
subsist in a state of poverty. The absence, presence or quality of water do not in themselves
act as determinants of poverty. More accurately it is what people choose to do with
available water, within the parameters of their capabilities, that influences poverty (Bidou
and Droy 2009). For instance, access to clean water may be seen as an implicit guarantee of

18
improved health, but if wells are not maintained or communities prefer the taste of the water
from the nearby pond (Becerra and others,2009), then reduced poverty levels may not be
evident.
Research application in policy deliberations
The final whole of basin analysis was comprised of 13 variables, producing spatially
explicit predictive models with R2 values between 0.6 and 0.99 for both child mortality and
child morbidity. A number of other variables were excluded due to multi-collinearity. The
results demonstrated that the magnitude of variable effect is spatially dependent and as a
corollary, we can conclude that landscape heterogeneity matters. Hence, use of the results
provides high resolution, spatially referenced information, allowing more targeted policy
development and implementation. Even with only this constrained vector of variables
included, the model’s predictions of poverty closely match our original estimation (see
Figure 7, Ward and others 2009).
The purpose of variable aggregation into a cadastral representation of poverty was to
provide an evidence based, comprehensive and interpretable representation of the water
poverty situation to assist policy deliberations and interventions. As poverty is a multi-
dimensional, synthetic construct, collating the identified components with statistically
estimated weighting coefficients is necessary for integrated and improved understanding.
However, for assessing the potential impacts of different policy effects, a more tangible
output is required. In Figures 9, Figure 10 and Figure 11, we remodel the original dependent
variables, child mortality and child morbidity (stunting) and adjust specified independent
variables to predict the likely effects of such a change. The models were constructed from
the geographically weighted regression (GWR) results, meaning that the impact of a
uniform independent variable change (for instance from a particular policy approach) will
manifest differently in different parts of the Niger Basin.
We consider six policy outcome hypotheticals:
a uniform increase in average education (by two years and by four years, see Figure
9),
a uniform decrease in the use of surface and unprotected well water (by 10 per cent
and by 20 per cent, see Figure 10)
a uniform increase in irrigation intensity (by 10 per cent and by 20 per cent, see
Figure 11).
The colour scheme used to represent changes in the poverty variables are standard across
all three figures, allowing for visual comparison of the different strategies. Whilst uniform
adjustments to these determinants is unrealistic, as a modelling exercise it demonstrates the
differential effect of such change on different regions of the Basin, and where such changes
could be expected to deliver the greatest impact.
Insert Figure 10 here

19
Figure 9 Predicted effect on child mortality and child morbidity (stunting) levels due to an increase in
the average number of years of education, in the active Niger Basin.
Education appears to be the most universally effective means of reducing poverty, with
improvements in health predicted for much of Mali, north west Nigeria, east Burkina Faso
and central Nigeria. In particular, the poverty hotspot around the Inner Niger Delta appears
substantially alleviated by an additional four years in average education.
Insert Figure 10 here
Figure 10 Predicted effect on child mortality and child morbidity (stunting) levels due to a reduction in
the proportion of people obtaining their primary water supply from surface water or
unprotected well water, in the active Niger Basin.
A uniform reduction in the proportion of people using surface water or unprotected well
water represents a likely improvement in the quality of water used. Our model suggests that
this approach could substantially alleviate child mortality in north-west and central Nigeria,
although other areas are affected only very slightly.
Insert Figure 11 here
Figure 11 Predicted effect on child mortality and child morbidity (stunting) levels due to an increase in
irrigation intensity in the active Niger Basin.
Figure 11 illustrates the predicted impacts from a uniform increase in irrigation intensity
across the Niger Basin. According to the spatially weighted analysis of available data, a
policy initiative based on increasing irrigation intensity did not lead to a prediction of
substantial reductions in child mortality and child morbidity. This suggests that either
irrigation’s contribution to rural welfare is low in the Niger Basin, or that the current spatial
extent of irrigation is too limited to cause any detectable reduction in poverty at this scale
of analysis. As previously stated, Hanjra and Gichuki (2008) and the NBA (2005) propose
that irrigation will be crucial for the future economic development of the basin, along with
improvements in the productivity of rain-fed agriculture (Castillo and others 2007).
However, it may be that the benefits of irrigation do not yet accrue to the people engaged in
its practice, or that they do so at levels too small to register in these analyses.
Conclusion
Policy decisions are often made at state or national level, and regional perspectives or
understanding of poverty cannot be presumed to be aligned or concordant with the
differentiation of poverty, livelihood vulnerability or institutional diversity across the entire
Niger Basin (Hyman and others 2005). More effective policy that influences water access or
productivity is likely to be reliant on mixes of sequenced instruments tailored to address
temporally and spatially diverse poverty patterns. An important focus of this research was
the development and application of methods capable of aligning water management and

20
poverty data at scales that are administratively and politically feasible across the Niger
Basin countries.
The first research objective was to identify methodologies capable of integrating impact
analysis and policy formulation that reliably differentiates poverty at these multiple scales.
A second research objective was to map poverty as a unit of analysis that aligns water
productivity and water access with poverty data, revealing opportunities for water policy
formulation. A final objective was to provide evidence based analysis that guides effective
policy development in the direction of the causes of poverty at scales that reflect the most
exposed communities.
The lack of a comprehensive metric that reliably captures the multi factorial characteristics
of water poverty has led to a raft of measurement techniques, each with advantages and
disadvantages. Attempting to develop another poverty index or measurement criteria was
not the aim of this research. Our primary aim was to assess and develop methods to detect
and analyse a hypothetical relationship between water and poverty through statistical
methods and poverty mapping.
To account for a high proportion of subsistence livelihoods and a large non-market, hybrid
economy we used child mortality, child stunting and a composite wealth index as poverty
metrics. The analysis of spatially referenced child mortality, child morbidity and the wealth
index identified three major poverty hotspots in the Niger Basin. These are situated in
southern Mali and the Inner Delta, north east Burkina Faso and north west Nigeria (as
summarised in Figure 12).
Figure 12 Overlayed map of major poverty hotspots
There is broad convergence in the spatial correlation between poverty measures illustrated
in Figure 12. Communities situated in regions of intersecting hotspots for the three poverty
metrics are those expected to face the greatest poverty and vulnerability challenges.
We found that education and access to improved water quality are the only variables that are
consistently significant and relatively stationary across the entire basin. At all scales,
education is the most consistent non-water predictor of poverty while access to protected

21
water sources is the best water related predictor of poverty. They can therefore be addressed
with whole of catchment scale policies with less attention to regional differences.
The variables demonstrated to be statistically non-stationary (i.e. their influence varies
across the landscape) may be more appropriately addressed using a geographically targeted
policy approach. The differences in coefficient estimates are likely to be symptomatic of the
ways in which a variable influences communities subject to local conditions.
Similar studies evaluating the significance of explanatory variables in poverty mapping have
found limited correlations between poverty and agro-ecological or socioeconomic
determinants (Hyman and others 2005). While established relations between water variables
and poverty exist, notably water quality impacts on health and therefore poverty, these vary
substantially through space and time. Access to water for agriculture and productive
purposes plays a crucial role in poverty alleviation but is not a sufficient condition and much
will depend on the capabilities and endowments of a given household or community. The
research completed as part of this study indicates that landscape and scale matter in water
poverty. Interactions between environmental, social and institutional factors are complex
and an evaluation of poverty and its causes requires analysis at multiple spatial resolutions.
The poverty maps, estimated at a high resolution scale, can be viewed as evidence based,
easy to interpret participatory tools, rather than a final product. The cadastral representation
of poverty vectors enable the community, policy makers and administrators to visually
evaluate the relative effectiveness of alternative policy incentives and actions, the relative
distribution of resources and investment priorities.
Combining research from the Challenge Programe on Water and Food
(www.waterandfood.org) with the poverty coefficients developed here for the Niger Basin is
intended to provide a reliable basis for agencies to explore the social and economic
dimensions that enable adaptive water system management. Agencies are then able to
concentrate on regions and cases that describe incremental but large change and investigate
social sources of renewal and re-organization.
Estimating the covariance of significant, spatially referenced factors that comprise water
related poverty in the Niger Basin, combined with geographic information system mapping
would enhance the usefulness of deliberative tools. This would be especially salient to
evaluating portfolio approaches to poverty reduction, targeted sequencing of instruments
and prioritization of investments across several factors. This is the subject of ongoing
research.
References
Anselin, L. (2005) Exploring spatial data with GeoDa: A Workbook, Spatial Analysis
Laboratory, Department of Geography, University of Illinois, Urbana, Illinois.
Aw, D. and Dejou, C. (1996) Office du Niger: Ensuring food security for Mali. World Bank
Findings: Africa region no. 61.

22
Aw, D., and Dejou, C. (1996) Office du Niger: Ensuring food security for Mali, World Bank
Findings: Africa region no. 61.
Balk, .D; Pullum, T;. Storeygard, A.; Greenwell, F. and Neuman, M. (2003) Spatial
Analysis of Childhood Mortality in West Africa, Calverton, Maryland, USA: ORC Macro
and Center for International Earth Science Information Network (CIESIN), Columbia
University.
Becerra, S.; Dia, A.H.; Gangneron, F. (2009) Madame : Bidon ! ou la gestion publique et
sociale de la crise de l'eau au Mali. Journée d'étude Changements environnementaux et
adaptation, CERTOP, Université de Toulouse-Le Mirail, 2 avril 2009
Belsley, D. A.; Kuh, E. and Welsch, R.E. (1980) Regression diagnostics: Identifying
influential data and sources of collinearity. New York: John Wiley and Sons.
Benson, T.; Chamberlin, J.; and Rhinehart, I. (2005) An investigation of the spatial
determinants of the local prevalence of poverty in rural Malawi, Food Policy 30:532–550
Bidou, J-E. and Droy, I. (2009) Décrire la construction temporelle des vulnérabilités :
observatoires ruraux et analyse historique des moyens d’existence dans le sud malgache in
Peltier, A. and Beccera, S. (eds) Risques et environnement: recherches interdisciplinaires
sur la vulnérabilité des sociétés. L'Harmattan, 155-170.
Bradley, D.J. (1974) Chapter in Human Rights in Health, Ciba Foundation
Symposium 23:81–98.
Brown, C and Lall, U (2006) ‘Water and economic development: the role of variability and
a framework for resistance’, Natural Resources Forum 30:306-317.
Castillo, G.; Namara, R.; Ravnborg, H.; Hanjra.; M Smith, L.; Hussein, M.; Bene, C.; Cook,
S.; Hirsch, D.; Polak, P.; Vaalee, D. and van Koppen, B. (2007) Reversing the flow:
agricultural water management pathways for poverty reduction’, in Molden, D. (ed.) Water
for Food, Water for Life: A Comprehensive Assessment of Water Management in
Agriculture. International Water Management Institute and Earthscan, Washington D.C.
Chambers R. and Conway, G. (1992) Sustainable rural livelihoods: practical concepts for
the 21st century, Brighton, Institute of Development Studies
Central Intelligence Agency (CIA) (2008) The World Factbook. Central Intelligence
Agency, Washington D.C. Available online [15 March 08] at <
www.cia.gov/library/publications/the-world-factbook/index.html >
Cook, S. and Gichucki, F. (2007) Analyzing water poverty: Water, agriculture and poverty
in the basins: CGIAR Challenge Program on Water and Food.
Diemer, G. (2004) Reform of Governance of the Office du Niger in Mali International
Network on Participatory Irrigation Management Newsletter 12.
ECOWAS-SWAC/OECD (2008) Communicable diseases, Population series. Available
online [4 Nov 09] at < http://www.oecd.org/dataoecd/56/39/40997324.pdf >

23
Falkenmark, M. (1989) The Massive Scarcity Now Threatening Africa: Why Isn't it Being
Addressed? Ambio 18(2):112-118.
Fan, S, Hazell, P and Haque, T (2000) ‘Targeting public investments by agro-ecological
zone to achieve growth and poverty alleviation goals in rural India’, Food Policy 25: 411-
428.
Food and Agriculture Organistation (FAO) (2000) ‘Water Resources and irrigation in
Africa’, Aquastat, Food and Agriculture Organization, Rome. Available online [29 Sep 08]
at < http://www.fao.org/nr/water/aquastat/watresafrica/index.stm >
FAO (2007) ‘Annual total evapotranspiration’, Food and Agriculture Organization, Rome.
Available online [29 Sep 08] at <
http://www.fao.org/geonetwork/srv/en/metadata.show?id=30533&currTab=distribution >
FAO (2007a) ‘Global map of irrigation areas – version 4.0.1’, aquastat, Food and
Agriculture Organization, Rome. Available online [29 Sep 08] at <
http://www.fao.org/nr/water/aquastat/irrigationmap/index10.stm >
FAO (2007b) ‘Auxiliary vector database component – RWDB2 Administrative Centres and
Populated Places’, African Water Resources Database, Technical manual and workbook,
FAO, Rome.
Fenollar, F.; Trape, J-J.; Bassene, H.; Sokhna, C.; Raoult, D. (2009) Tropheryma whipplei
in faecal samples from children, Senegal. Emerging Infectious Diseases, 15(6): 922-4
Füssel, H. (2007) Vulnerability: A generally applicable conceptual framework for climate
change research, Global Environmental Change, 17:155-167.
Gleick, P. (1999) The human right to water. Water Policy, 5(1):487-503.
Grafton, R.Q.; Abramowicz, W.; Dupont, D.; Nelson, H.; Hill, R.J. and Renzetti, S. (2004)
The Economics of the Environment and Natural Resources. Blackwell Publishing
Hamilton, K. and Clemens, M. (1999) Genuine savings rates in developing countries. World
Bank Economic Review, 13(2):333-356.
Hanjra, M, Ferede, T and Gutta, D.G. (2009) Reducing poverty in sub-Saharan Africa
through investments in water and other priorities, Agricultural Water Management
96:1062–1070.
Hanjra, M. and Gichuki, F. (2008) Investments in agricultural water management for
poverty reduction in Africa: Case studies of Limpopo, Nile, and Volta river basins’. Natural
Resources Forum32:185-202.
Hilborn, R. and Walters, J. (1976) in Grafton, R.Q.; Abramowicz, W.; Dupont, D.; Nelson,
H.; Hill, R.J. and Renzetti, S. (2004) The Economics of the Environment and Natural
Resources. Blackwell Publishing

24
Hussain, I. and Hanjra, M.A. (2004) Irrigation and poverty alleviation: review of the
empirical evidence, Irrigation and Drainage 53:1–15.
Hyman, G., Larrea, C. and Farrow, A. (2005) ‘Methods, results and policy implications of
poverty and food security mapping assessments’. Food Policy 30:453–460
Imhoff, M, Bounoua, L, Ricketts, T, Loucks, C, Harriss, R and Lawrence, W (2004) Global
Patterns in Net Primary Productivity, Global Patterns in Human Appropriation of Net
Primary Productivity, Human Appropriation of Net Primary Productivity as a Percentage of
Net Primary Productivity’, Socioeconomic Data and Applications Center (SEDAC),
available online [29 Sep 08] at < http://sedac.ciesin.columbia.edu/es/hanpp.html >
Kristjanson, P.; Radeny, M.; Baltenweck, I.; Ogutu, J. and Notenbaert, A. (2005) Livelihood
mapping and poverty correlates at a meso-level in Kenya. Food Policy 30:568-583.
Kasperson, J. and Kasperson, R. (2001) Global environmental risk, United Nations
University Press and Earthscan, Tokyo.
Krantz, L. (2001) The Sustainable Livelihood Approach to Poverty Reduction: An
Introduction: Swedish International Development Agency, Stockholm.
Lawrence, P.; Meigh, J. and Sullivan, C. (2002) The Water Poverty Index: an International
Comparison. Keele Economics Research Papers no. 19, Keele University, Keele, UK.
Measure DHS (2008) ‘Country Datasets: Benin (2001), Burkina Faso(2003),
Cameroon (2004), Cote d’Ivoire (1998-9), Guinea (2005), Mali (2006), Niger (2006),
Nigeria (2003)’, Macro International, Calverton, Maryland, USA. Available online [29 Sep
08] at < http://www.measuredhs.com >
Mitchell, T.; Carter, T.; Jones, P.; Hulme, M.; New, M. (2004) A comprehensive set of
high-resolution grids of monthly climate for Europe and the globe: the observed
record (1901-2000) and 16 scenarios (2001-2100)’, Working Paper 55, Tyndall Centre for
Climate Change Research, University of East Anglia, Norwich, UK.
Molden, D. (ed.) (2007) Water for Food, Water for Life: A Comprehensive Assessment of
Water Management in Agriculture. International Water Management Institute and
Earthscan, Washington D.C.
Molle, F. and Mollinga, P (2003) Water policy indicators: conceptual problems and policy
issues. Water Policy 5:529-544.
Mulwafu, W. and Msosa, H.K. (2005) IWRM and poverty reduction in Malawi: a socio-
economic analysis. Physics and Chemistry of the Earth 30:961–967
Namara, R.; Hanjra, M.; Castillo, G.; Ravnborg, H.M.; Smith, L.; Van Koppen, B. (2009)
Agricultural water management and poverty linkages, Agricultural Water Management
97(4): 520-527/
Niger Basin Authority (2005) Regional Synthesis on National Multi-sectoral Studies, Niger
Basin Authority, Niamey, Niger.

25
Preston, B. L. and Stafford Smith, M. (2008) Framing vulnerability and adaptive capacity
assessment. Paper presented at the Pre-Workshop Draft, Climate Adaptation Flagship
Workshop.
Rijsberman, F.R. (2006) Water scarcity: fact or fiction? Agricultural Water
Management 80(1–3):5–22.
Rutstein, S. and Johnson, K. (2004) The DHS Wealth Index, DHS Comparative Reports no.
6, Measure DHS, Calverton, Maryland, USA.
Setboonsarng, S. (2005) Child malnutrition as a poverty indicator: an evaluation in the
context of different development interventions in Indonesia, ADB Institute Discussion Paper
no. 21, Asian Development Bank, Manila.
Sullivan, C.A. and Meigh, J.R. (2003) The Water Poverty Index: Its role in the context of
poverty alleviation. Water Policy 5(5-6): 513-528.
Thirtle, C.; Lin L. and Piesse, J. (2003) The impact of research-led agricultural productivity
growth on poverty reduction in Africa, Asia and Latin America. World Development (2003),
pp. 1959–1975.
Turton, A.R and Warner, J.F. (2002) Exploring the population/water resources nexus in the
developing world, The Woodrow Wilson Institute ‘Environmental Change and Security
Project’, Washington D.C., USA.
UNDP/SEI (2006) Linking Poverty Reduction and Water Management, prepared on behalf
of the Poverty-Environment Partnership, 82 pages. Available online [3 Nov 09] at <
http://www.energyandenvironment.undp.org/undp/index.cfm?DocumentID=5689andmodul
e=Libraryandpage=Document >
UNDP (2007) Human Development Report 2007/2008: Fighting Climate Change. United
Nations Development Program, New York.
UNDP (2007) Human Development Report 2007/2008: Fighting Climate Change. United
Nations Development Program, New York.
UNESCO (2006) The State of the Resource in Water: A Shared Responsibility. United
Nations Educational Scientific and Cultural Organisation and World Meteorological
Organisation, New York.
UNESCO (2008) Education for all: global monitoring report, regional overview: sub-
Saharan Africa. United Nations Educational Scientific and Cultural Organisation, New
York.
UN Population Division (2006) World Population Prospects: the 2006 Revision Population
Database. Accessed online [12 Dec 08] at < http://esa.un.org/unpp/index.asp?panel=1 >
UNICEF (2008) ‘State of the World’s Children’, United Nations Children’s Fund, New
York
Vincent, K. (2004) Creating an index of social vulnerability to climate change for Africa.
Working Paper 56, Tyndall Centre for Climate Change Research, School of Environmental
Sciences, University of East Anglia, Norwich, UK.

26
Ward, J.; Kaczan, D. and Lukasiewicz, A. (2009) A water poverty analysis of the Niger
River Basin, West Africa. Report for Niger Basin Focal Project as part of The CGIAR
Challenge Program on Water and Food, Colombo, Sri Lanka.
Wisner, B.; Blaikie, P. and Cannon, T. (2004) ‘At Risk: natural hazards, people’s
vulnerability and disasters’ (2nd
Edn.) Routledge, London.
World Bank (2009) PovcalNet online Poverty Analysis Tool. Available online [4th
Feb 09]
at < http://go.worldbank.org/NT2A1XUWP0 >
Zwarts, L.; Bvan Beukering, P.; Kone, B. and Wymenga, E. (2005) The Niger, A Lifeline:
Effective water management in the Upper Niger Basin. Mali / The Netherlands: RIZA,
Lelystad / Wetlands International, Sévaré / Institute for Environmental Studies, Amsterdam.
Zwarts, L; Beukering, P; Koné, B.; Wymenga, E; Taylor, D. (2006) The Economic and
Ecological Effects of Water Management Choices in the Upper Niger River: Development
of Decision Support Methods. International Journal of Water Resources
Development 22:135-156.
List of abbreviations
DHS Demographic and Health Surveys
ECOWAS-SWAC Economic Community of West African States-The Sahel and West
Africa Club
GDP Gross Domestic Product
GSI Genuine Savings Indicator
GWR Geographically Weighted Regression
HDI Human Development Index
(LISA) Localized indicators of spatial auto-correlation
NBA Niger Basin Authority
OECD Organisation for Economic Cooperation and Development
PPP Purchasing Power Parity
SSA Sub Saharan Africa
SVI Social Vulnerability Index
TARWR Total Available Renewable Water Resource
UN United Nations
UNDP United Nations Development Program
UNDP/SEI UNESCO United Nations Educational, Scientific and Cultural Organisation
UNICEF United Nations Children’s Fund
WPI Water Poverty Index

27
Annex 1
Regression Variables: The independent variables included in the regression models are
described in Table 5. Of primary interest are the water-related variables. Other variables
were selected to represent different forms of capital: physical (electricity, telephones,
roads), human (population density, education) financial (livestock density) and natural
(productivity, forest cover, environmental degradation, malaria). These were selected based
on the findings of Kristjanson and others (2005). Variables were compiled in a geographic
information system (GIS) and then sampled to provide average values of each variable in
each study unit. All variables were initially included in the models, with variables removed
on the basis of high multi-collinearity (variance inflation factors >10, see Belsley and others
1980). The electricity and telephone variables were excluded from wealth index models (as
they are themselves components of the index).
Table 5: Independent variables considered in the analysis of poverty prevalence.
Variable Description and source Assumed
relationship with child
mortality
Mean Std. Dev.
Dependent. Variables
Child mortality Proportion of children who die before their 5th birthday n/a 0.15 0.06
Child morbidity Average height for age ratio (standard deviations below healthy
reference median)
n/a -1.40 0.62
Water variables
Precipitation Precipitation (millimetres/year) Source: FAO (2007)
Negative 1006 563
TARWR TARWR (total available renewable water resources) of Niger sub
basins. Includes actual inflows into sub basin, plus internal water resources (rainfall). All relevant parameters (water volume) measured at
the sub basin level (bigger than administrative districts), and are
assumed constant across sub basin. (Specified with area and per capita component (m3/year/km2/person)
Source: FAO (2000)
Negative 6.2 54.9
Unprotected water Proportion of a district whose main water source is surface water or unprotected well water. The average is taken at the household level;
estimation based on an inverse distance weighting interpolation across
landscape.
Source: Measure DHS (2008)
Positive 0.51 0.23
Water Access Average time taken to collect water from the primary water source. The average is taken at a household level; estimation based on an inverse
distance weighting interpolation across landscape.
Source: Measure DHS (2008)
Positive 23.1 14.3
Dams Average direct distance from district to a large dam (’00 km).
Source: FAO (2006)
Positive 1.11 0.93
Irrigation Is the percentage of a district that is under irrigation. Source: FAO (2007a)
Negative 0.5 1.9
Other variables Drought economic
risk
Economic loss (GDP) due to drought. Calculated both as a proportion of
GDP. Global decile scale based on historical experience. Areas with less
than 5 persons/km2 and without significant agriculture are given a zero value.
Source: Centre for Hazards and Risk Research (2005)
Positive 7.2 2.3
Population density (2005)
Population density of administrative district in 2005 (people/km2). Source: CIESIN (2005)
Unknown 167 426
Population (2005) Population of administrative district in 2005 (number of people).
Source: CIESIN (2005)
Negative 117 794 124 736

28
Telephones Proportion of a district with a telephone in the home. The average is taken at the household level; estimation based on an inverse distance
weighting interpolation across landscape. Source: Measure DHS (2008)
Negative 0.05 0.06
Electricity Proportion of a district with electricity in the home. The average is taken
at the household level; estimation based on an inverse distance weighting interpolation across landscape.
Source: Measure DHS (2008)
Negative 0.31 0.27
Access Average direct distance from district to an administrative centre or large populated place (’00 km).
Source: FAO (2007b)
Positive 0.27 0.15
Education Average years of education. The average is taken at the individual level; estimation based on an inverse distance weighting interpolation across
landscape.
Source: Measure DHS (2008)
Negative 2.7 3.0
NPP (produced) Net primary productivity (NPP). Net amount of solar energy converted
to plant organic matter through photosynthesis (tonnes of carbon per
0.25° cell) Source: Imhoff, and others. (2004)
Negative 2.9*1011 1.6*1011
Malaria Estimated prevalence of malaria parasite in children 2-9 years. Data is
from surveys and modelling based on climate, altitude, vegetation cover and agro-ecological zones (proportion).
Source: MARA (1998)
Positive 0.43 0.18
Human footprint Normalized scores from the Human Influence Index, a measure of environmental damage. Relative values range from 0 (least influence) to
100 (most influence) for the biome found in that district.
Source: SEDAC (2005a)
Positive 29.9 7.8
Forest cover
proportion
Proportion of district occupied by closed, open or fragmented forest.
Source: Global Forest Resources Assessment (2000)
Negative 0.33 0.32
Cattle density Average density of stock across the district (units/km2).
Source: FAO (2007b)
Negative 17.2 14.6
Chicken density Average density of stock across the district (units/km2).
Source: FAO (2007b)
Negative 90.4 169.6
Sheep density Average density of stock across the district (units/km2).
Source: FAO (2007b)
Negative 20.5 23.1
Goat density Average density of stock across the district (units/km2). Source: FAO (2007b)
Negative 31.6 45.9
Pig density Average density of stock across the district (units/km2).
Source: FAO (2007b)
Negative 3.7 13.8


