Embed Size (px)
Citation preview
i
THE ROLE OF PLANT PHYSIOLOGY THE ROLE OF PLANT PHYSIOLOGY THE ROLE OF PLANT PHYSIOLOGY THE ROLE OF PLANT PHYSIOLOGY
IN CLIMATE CHANGE ADAPTATIONIN CLIMATE CHANGE ADAPTATIONIN CLIMATE CHANGE ADAPTATIONIN CLIMATE CHANGE ADAPTATION
AND MITIGATIONAND MITIGATIONAND MITIGATIONAND MITIGATION
AHMAD NAZARUDIN MOHD ROSELIAHMAD NAZARUDIN MOHD ROSELIAHMAD NAZARUDIN MOHD ROSELIAHMAD NAZARUDIN MOHD ROSELI
TSAN FUI YINGTSAN FUI YINGTSAN FUI YINGTSAN FUI YING
ROOHAIDA OTHMANROOHAIDA OTHMANROOHAIDA OTHMANROOHAIDA OTHMAN
PHEBE DINGPHEBE DINGPHEBE DINGPHEBE DING
NORMANIZA OSMANNORMANIZA OSMANNORMANIZA OSMANNORMANIZA OSMAN
21st Malaysian Society of Plant Physiology Conference (MSPPC 2010)
ISBN 978-967-10840-0-7 Trans. Malaysian Soc. Plant Physiol. 19
First Published, 2011
ii
TRANSACTIONS OF THE MALAYSIAN SOCIETY OF PLANT PHYSIOLOGY VOL. 19
THE ROLE OF PLANT PHYSIOLOGY
IN CLIMATE CHANGE ADAPTATION AND MITIGATION
21st Malaysian Society of Plant Physiology Conference (MSPPC 2010) held at Equatorial Hotel, Brinchang, Cameron Highlands, Pahang, Malaysia
13-14 December 2010
Ahmad Nazarudin Mohd Roseli Tsan Fui Ying
Roohaida Othman Phebe Ding
Normaniza Osman
Organized by
Malaysian Society of Plant Physiology
Co-organized by
Malaysian Agricultural Research and Development Institute
MSPP is a professional scientific body dedicated towards promoting research and development
in tropical plant biology
ISBN 978-967-10840-0-7 Trans. Malaysian Soc. Plant Physiol. 19
First Published, 2011
iii
Contents
Page Table of contents iii
CHAPTER 1: PLANT GROWTH AND DEVELOPMENT 1
1. Growth Performance of Latex Timber Clones Nurul Atiqah, M.R., Tsan, F.Y. and Razali, A.K.
2
2. Effects of Harvesting Techniques on Growth Performance of Gigantochloa scortechinii (Buluh Semantan) Abd Razak, O., Hashim, M.N., Rosdi, K. and Ahmad Zuhaidi, Y.
9
3. Effects of Night Break on Stevia rebaudiana Armizatul, S.A.H., Mohd Aziz, R., Wira, A.B. and Azhar, K.
14
4. Changes in Tannin Concentration of Rastali Banana (Musa AAB Rastali) During Growth and Development Tee, Y.K. and Ding, P.
18
5. Effect of K-Fertigation Levels on Tomato Sap and Plant Performance Wira, A.B., Abd Jamil, Z. and Armizatul, S.A.H.
21
6. Effects on Growth Performance of 13 Years Old Aquilaria malaccensis (Karas) Interplanted with Azadirachta excelsa (Sentang) Lok, E.H. and Ahmad Zuhaidi, Y.
25
7. Physical and Cellular Structure Changes of Rastali Banana (Musa AAB Rastali) During Growth and Development Tee, Y.K., Ding, P. and Nor Aini, A.R.
28
CHAPTER 2: POSTHARVEST TECHNOLOGY AND QUALITY CONTROL 34
8. Growth Performance and Nutrient Concentration of ‘Hijau’ Lemongrass (Cymbopogon
citratus) as Affected by Maturity Stages at Harvest Tajidin, N.E., Ahmad, S.H., Rosenani, A.B. and Munirah, M.
35
9. Determination of Optimum Harvest Maturity and Postharvest Quality of Rastali Banana (Musa AAB Rastali) During Fruit Ripening Tee, Y.K. and Ding, P.
39
10. Evaluation of Hot Water Dip Treatment on Postharvest Anthracnose Control of Banana
Amin, M., Ding, P., Jugah, K. and Parviz, A.
43
11. Estimation of Postharvest Losses at Various Stages of the Supply Chain for Tomato (Lycopersicum esculentum) and Cabbage (Brassica oleracea var. Capitata) Humam, M., Mahmud, T.M.M., Ahmad, S.H. and Selamat, A.
47
12. Removal of Astringency in Rastali Banana Using Ethanol Ding, P. and Mohamad Ikram, M.S.
50
ISBN 978-967-10840-0-7 Trans. Malaysian Soc. Plant Physiol. 19
First Published, 2011
iv
CHAPTER 3: ECOPHYSIOLOGY AND STRESS BIOLOGY 54
13. Performance of a Nine Year-Old Stand of Sentang (Azadirachta excelsa) Grown on Site
with Monsoon Climate Hashim, M.N., Ahmad Zuhaidi, Y., Rosdi, K., Abd Razak, O., Norhazaedawati, B. and
Mahpar, A.
55
14. The Physiological Adjustment on Selected Pre-Treated Plants – An Adaptation Rohailah, M.I.
and Normaniza, O.
58
15. Effects of Root Zone Cooling Using Water Chilling System on Plant Physiological Responses and Fruit Yield of Tomato var. Baccarat under Greenhouse Condition Mohd Aziz, R., Abd Jamil, Z., Armizatul, S.A.H., Md. Noh, I., Hafiz, H. and
Norahshekin, A.R.
62
CHAPTER 4: PEST AND DISEASE MANAGEMENT 66
16. Screening and In vitro Biocontrol Activities of Bacillus subtilis Against Anthracnose of
Papaya (Carica papaya var. Frangi) Hasan,
M.F., Mahmud, T.M.M., Kadir, J., Ding, P. and Zaidul, I.S.M.
67
17. Spray Drift Effect in Control Plot of a Supervised Residue Trial of Fungicide in a Carambola Plot Ngan, C.K., Khairatul, A.M., Mohammad Shahid, S., Jamiah, J. and Lim, K.P.
72
CHAPTER 5: BEST PRACTICES AND CURRENT TECHNIQUES 75
18. Extraction of Jatropha curcas Fruits for Antifungal Activity Rahman, M.M., Ahmad, S.H., Mahmud, T.M.M. and Rahman, M.Z.A.
76
19. Floristic Composition of Weed Community in Selected Vegetable Fields in Malaysia Ketaren, B.K., Abdul Shukor, J., Ahmad, S.H. and Rosenani, A.B.
80
20. Phenolic Compound in Some Urban Trees Rohana, M.A., Ahmad Nazarudin, M.R. and Tsan, F.Y.
85
CHAPTER 6: BIOTECHNOLOGY
89
21. Functional Analysis of Phytochelatin Synthase (PCS) cDNA from Eucheuma
denticulatum Othman, R., Suganthi, M. and Hasbullah, D.
90
22. Genetic Transformation of Rice Subspecies Japonica (Oryza sativa) with Isopentyl Transferase (ipt) Gene and Glutenin Promoter Using the Biolistic Method Nur Natasya Elya, K., Ismanizan, I. and Alina, W.
93
23. In Vitro Proliferation of Phaleria macrocarpa by Using Shoot Tip and Nodal Segment Tsan, F.Y., Mohd Faiz, A.R. and Nurhazwani, J.
98
24. Biosensor for Detection of Malachite Green-Anti Fungal Agent Used in Aquaculture Industry Zamri, I., Faridah, S.,
Nur Azura, M.S., Noor Azlina, M., Gayah, A.R. and Othman, M.
103

ISBN 978-967-10840-0-7 Trans. Malaysian Soc. Plant Physiol. 19
First Published, 2011
v
CHAPTER 7: CLIMATE CHANGE, MODELING AND SIMULATION
107
25. Impacts of Climate Change on Biodiversity and the Adaptation Measures Philip, E. and Abdul Rahim, N.
108
26. National Greenhouse Gas Inventory from Land Use Change and Forestry for Peninsular Malaysia and Sarawak in 2008 Chong, Y.M., Philip, E.
and Abdul Rahim, N.
111
27. Topographic Effects on Stand Structure in the Logged-Over Lowland Dipterocarp Forest Mohd Razman, S., Tan S.A., Khali, A.H. and Abd Rahman, K.
114
ISBN 978-967-10840-0-7 Trans. Malaysian Soc. Plant Physiol. 19
First Published, 2011
1
CHAPTER 1
PLANT GROWTH AND
DEVELOPMENT
ISBN 978-967-10840-0-7 Trans. Malaysian Soc. Plant Physiol. 19
First Published, 2011
2
Growth Performance of Latex Timber Clones
Nurul Atiqah, M.R., Tsan, F.Y.* and Razali, A.K. Faculty of Plantation and Agrotechnology, Universiti Teknologi MARA (UiTM), 40450 Shah Alam, Selangor, Malaysia. *E-mail: [email protected]
Introduction
Rubber, or scientifically known as Hevea brasiliensis from the Euphorbiaceae family, is a major plantation crop in Malaysia. Total export earnings in rubber industry made a significant contribution to the economy of Malaysia. The export of rubber products gave increasing economic contribution from RM5.682 billion in 2000 to RM10.587 billion in 2009 (Malaysian Rubber Export Promotion Council, 2010). Currently, Malaysia is world’s top exporter of natural rubber gloves, catheters and latex thread. Rubber is a perennial crop that can survive within 1,000 km north and south of the equator, except for the arid regions. It has approximately thirty years economic life-span. It can reach a height of 18-20 m when the tree is fully mature (Webster and Paardekooper, 1989). This species is commonly propagated by vegetative propagation of grafting onto seedling root stocks. It normally takes four to six years after planting before it is ready for tapping. Besides latex extraction, some rubber clones have recently been found as attractive sources for timber production. It is, in fact, originally forest vegetation. It is categorized as light hardwood and most suitable for the furniture industry (PROSEA, 1995). Such latex timber clones (LTCs) as raw materials for downstream activities should, hence, be ensured to serve dual purposes, namely for production of latex and timber. Planting of LTCs is based on new concept of a 15 year life cycle. Latex production is scheduled between seven to nine years before the trees are felled for timbers. It is a new concept as compared to the 30 year conventional wood harvesting before replanting. The good prices of rubberwood and support from the government in the establishment of rubber plantation for wood extraction through the provision of financial and fiscal incentives are driving forces for this venture (MRB, 2009). However, appropriate and adequate agronomic inputs are required to guarantee sustainable production of LTCs within the shorter life span. This study was a brief survey study on the growth of LTCs grown at two local plantations. The plantations are funded by the Malaysian government in the form of soft loan through Malaysian Timber Industry Board (MTIB). Documentation of the growth of LTCs is important for further crop improvement, extension services and introduction of such clones in plantations.
Methodology
Location of study
This survey on the growth of LTCs was conducted in June 2009. It was carried out at two rubber forest plantations, i.e. Tropical Position Sdn. Bhd. (TP) at Rawang, Selangor and Acacia Industries (Kel) Sdn. Bhd. (AI) at Gua Musang, Kelantan. Both plantations were established on forest land. TP has total plantation area of 1,150 ha and was established on 16th January 2007 through Perbadanan Kemajuan Perusahaan Selangor (PKPS) associated with State Forestry Department. The objective of this statutory body is to open new land for forest plantation development. AI, on the other hand, was established earlier on 4th December 2006 with total area of 3,950 ha. However, only about a quarter of the area was cleared and planted with LTCs. Subsequent clearing and planting of rubber trees were planned to be continuously carried out with the onset of rainy seasons.
ISBN 978-967-10840-0-7 Trans. Malaysian Soc. Plant Physiol. 19
First Published, 2011
3
Data collection
Data on the soil type, terrain condition, existence of water body, other vegetations, planting operation and husbandry practices were obtained from the management staff of both plantations. The rainfall data were obtained from the estate weather station or nearest weather station. LTCs of different clones and ages were identified, randomly sampled and measured for their growth performance. The trees in both plantations aged between 4 to 34-month old. A total of 200 to 250 trees were sampled for each clone of the same age at TP. Due to time constraint, only 100 to 150 trees were sampled for each clone of the same age at AI for measurement of growth performance as mentioned. Sampled trees were measured for height and girth at 1.3 m manually by using a clinometer or telescopic height pole and measuring tape respectively. Sturdiness quotient was calculated as ratio of height (m) to stem diameter (cm). Data analysis
The growth data were subjected to descriptive analysis. The central tendency and dispersion of the growth of the trees were presented. The correlation of height and diameter was also analysed.
Results and Discussion
TP
TP was an integrated plantation. Both latex rubber clones and LTCs were integrated with banana in this plantation. LTCs were planted in holes supplemented with CIRP. PB 350 and RRIM 2025 were planted at 8’ x 22’ on undulating land of 10 to 15˚ (Table 1). Other latex rubber clones planted in this plantation were RRIM 2003, RRIM 2005 and KT 39/35. Subsequent fertilization was carried out by using NPK Blue (12:12:17), NPK Green (15:15:15) and other mix-fertilizers at 3-month intervals. The trees of PB 350 aged 18 month-old in Block 2. A total of 567 ha were planted with this rubber clone in this block. These trees showed good growth performance with average height of 5.44 cm and average girth of 13.80 cm (Table 1). The sturdiness quotient of these trees was 1.26 (Table 1). The newly planted trees of PB 350 in Block 3 occupied an area of 445 ha. They aged only 4 month-old but demonstrated rapid growth (Table 1). The average height was 1.77 m and the average girth was 5.35 cm (Table 1). The average sturdiness quotient of 1.06 for these trees indicated that the young trees of this LTC were sturdier as compared to the older trees of 18 month-old with higher average sturdiness quotient (Table 1). Trees of RRIM 2025 were planted in Block 1 in early 2007. A total of 263 ha were planted with this RRIM clone (Table 1). They aged 30 month-old at measurement. The trees were tall with average height of 6.47 m and annual height increment of 2.59 m/yr (Table 1). The average girth of tree was 18.59 cm with annual girth increment of 7.44 cm/yr (Table 1). The girth growth was satisfactory as compared to that recorded by previous researchers. According to Mohd Nasaruddin (2005), the average girth of RRIM 2025 at two, three and four years after planting in Permatang Division, Kota Tinggi, Johor, was 14.40 cm, 23.50 cm and 34.0 cm, respectively. The girth increment was 9.3 cm/yr (two to three years) and 10.5 cm/yr (three to four years) in his trial. In another trial of RRIM 2025 in Lakai, Negeri Sembilan, the average girth increment at two, three and four years after planting was found as 14.70 cm, 24.70 cm and 34.10 cm respectively and the average girth increment per year was 8.50 cm. Ramli et al. (2005) also illustrated that average girth of RRIM 2025 at Large Scale Clones Trials (LSCT) at two to five years after planting was 13.20 cm, 23.6 cm, 34.5 cm and 43.3 cm respectively and the average girth increment was 10.10 cm/yr (two to three years), 10.90 cm/yr (three to four years), 8.80 cm/yr (four to five years) and 9.90 cm/yr (two to five years). However, higher
ISBN 978-967-10840-0-7 Trans. Malaysian Soc. Plant Physiol. 19
First Published, 2011
4
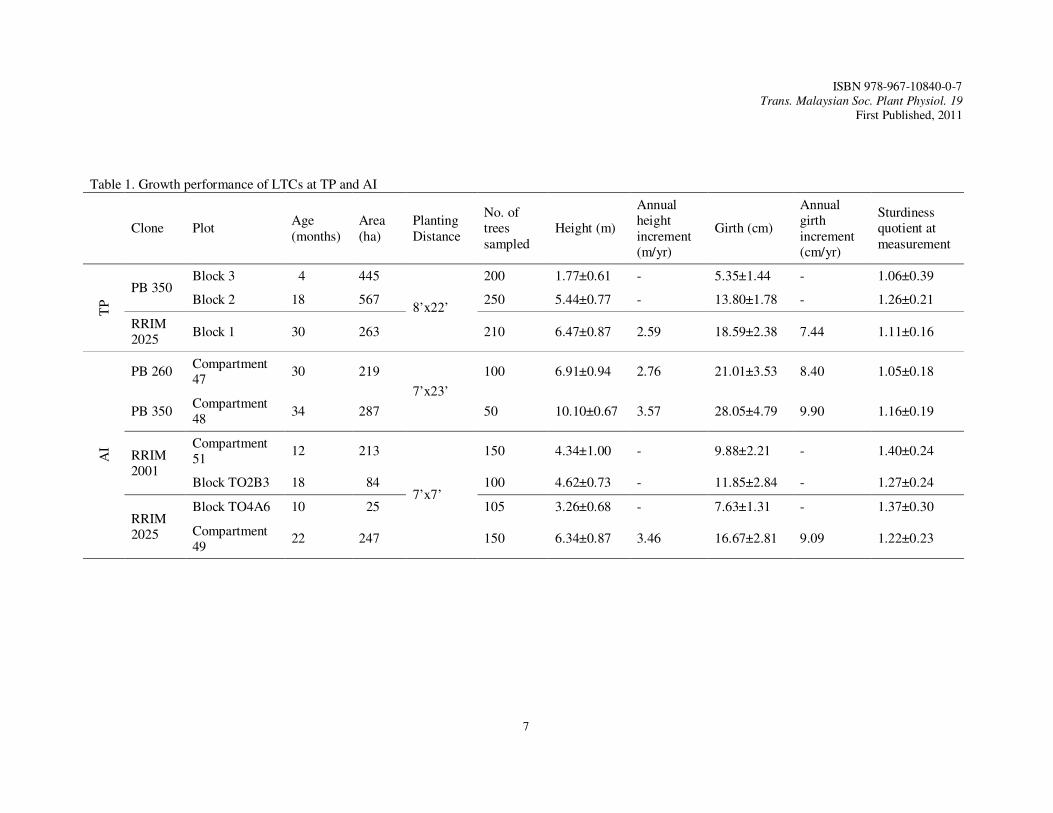
average growth of girth of this clone was reported at Monitored Development Project (MDP); i.e. 17.20 cm, 27.60 cm, 35.20 cm and 43.40 cm at two to five years after planting respectively and the average girth increment was 10.40 cm/yr (two to three years), 7.60 cm/yr (three to four years), 8.30 cm/yr (four to five years) and 8.70 cm/yr (two to five years). Chan (2005) also stated that RRIM 2025 showed good girth growth in large plantation trials; the trees achieved girth of 50.90 cm after five years planting. The sturdiness quotient of RRIM2025 trees in Block I, TP, was 1.1 (Table 1). LTCs in this plantation showed significant positive correlation of height to stem diameter at 0.1% significance level (Table 2). The correlation coefficients, however, varied and did not show consistent trend according to clone or age. The coefficients ranged from 0.272 to 0.693. At TP, termite occurrence and white root diseases were rare; only occasional incidents were reported. Dieback and stunted growth were the negative effects caused by these pest and disease problems. Relevant chemicals were applied at regular intervals to prevent pests and diseases of the rubber trees. The good early growth performance of LTCs at TP was also probably attributed to good rainfall throughout the year (Figure 1). Lower rainfall was only observed in the months of May to July. A swamp found at TP may play a role in regulating the microclimate of the plantation. The land with marginal soil of Serdang Series (sandy loam) was presumed not a limiting factor for growth of such LTCs when there was annual rainfall of more than 2000 mm. PB 350 was probably a better clone in terms in growth of height and girth as compared to RRIM 2025 in this plantation. AI
LTCs were also planted in holes supplemented with CIRP at AI. This plantation was planted with only rubber trees. LTCs planted in this plantation were RRIM 2025, RRIM 2001, PB 260 and PB 350 (Table 1). These trees aged 10 to 34 month-old (Table 1). The latex rubber clone grown in this plantation was KT 39/35. This plantation was divided into two estates; i.e. Estate A and Estate B. Estate A was planted with LTCs at the end of 2006 and the latest planting was carried out in July 2008. Planting started in year 2007 in Estate B and the latest planting was carried out in September 2008. Each planted area was called Compartment in Estate A and Block TO in Estate B. At AI, CCM 55 (15:15:6.4) and CCM 44 (12:6:22:3) were applied to the trees at 3-month intervals. Trees of PB 260 in Compartment 47 in Estate A were established at planting distance of 7’ x 23’, a rather similar planting distance practiced at TP (Table 1). This area was a rather flat terrain. A river was running across this area and frequently caused muddy condition in this low lying area during rainy season. The trees were 30 month-old with average height of only 6.91 m and a relatively lower annual height increment of 2.76 m/yr (Table 1). The average tree girth was only 21.01 cm and the annual girth increment was also relatively lower, i.e. 8.40 cm/yr as compared to that achieved by PB 350 in TP (Table 1). Nonetheless, the growth performance of PB 260 in this estate was better than that reported by Ramli et al. (2005). The researchers reported that the average girth of PB 260 at two to five years planting was 13.20 cm, 23.20 cm, 34.40 cm and 43.00 cm respectively. It was also better than that reported in MDP where the average girth for PB 260 at two to five years after planting was 15.50 cm, 24.60 cm, 33.00 cm and 40.20 cm, and the annual girth increment was 9.20 cm/yr (two to three years), 8.30 cm/yr (three to four years), 7.20 cm/yr (four to five years) and 8.20 cm (two to five years). In the study carried out by Mohd Nasaruddin (2005), the average girth increment of PB 260 grown at RRIMINIS, Niah, Sarawak over ten years was even lower, i.e. 6.00 cm/yr at 60 cm from ground and 4.60 cm/yr at 150 cm from ground. In his study, the average girth measurements at eight, nine and ten years at 60 cm from ground level were 53.20 cm, 57.10 cm and 59.5 cm respectively and 42.60 cm, 43.40 cm and 45.70 cm respectively when measured at 150 cm from ground level. Mohd Noor (2005) who studied the similar clone at Bukit Pilah Estate also reported rather similar growth performance of PB 260. The sturdiness quotient of the trees of PB 260 at AI was 1.05 at the age of 30 month-old (Table 1).
ISBN 978-967-10840-0-7 Trans. Malaysian Soc. Plant Physiol. 19
First Published, 2011
5
Compartment 48 in Estate A was also a flat terrain. It was the first area planted with LTC. PB 350 was planted here at the same planting distance of 7’ x 23’. The trees aged 34 month-old when measurement was carried out (Table 1). The average height of these trees was 10.10 m, with the annual height increment of 3.57 m/yr (Table 1). The average girth of trees was 28.05 cm and the annual girth increment was 9.90 cm/yr (Table 1). The sturdiness quotient was slightly higher, i.e. 1.16, as compared to that achieved by PB 260 (Table 1).
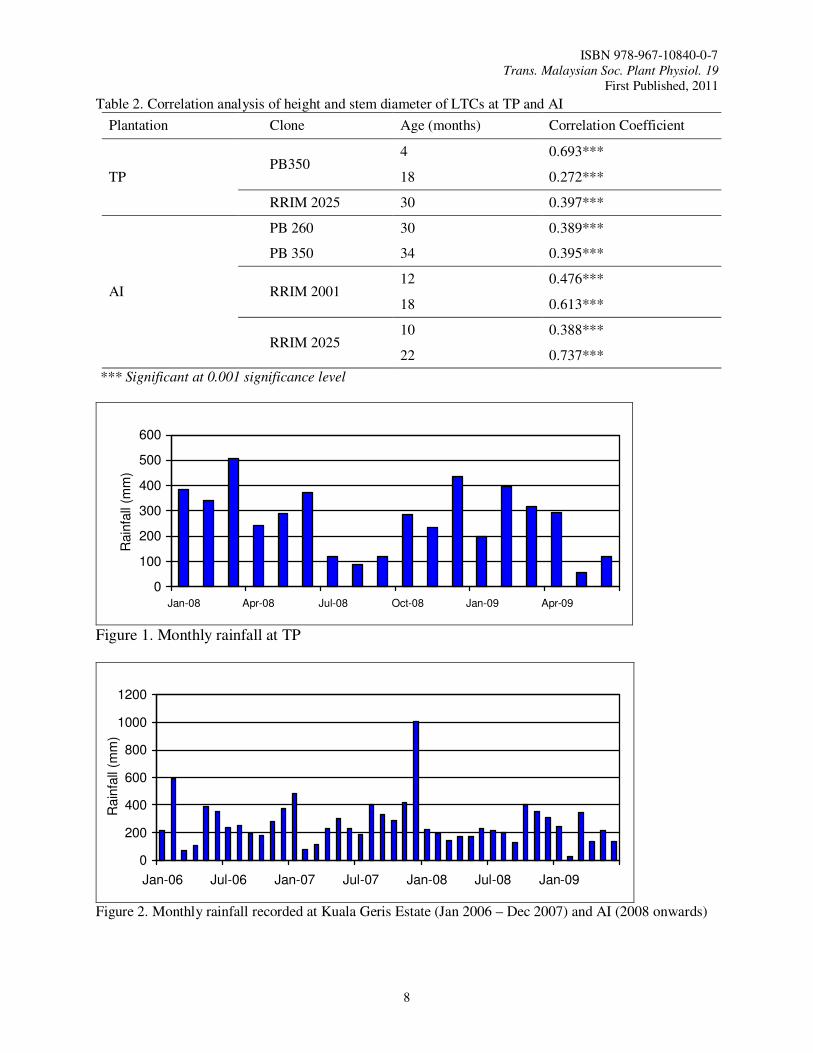
Compartment 51 and Block TO2B3 were on slopes of 25˚ to 30˚ and were planted with RRIM 2001 at high density of 7’ x 7’ (Table 1). The trees aged 12 and 18 month-old respectively resulted from two different planting operations (Table 1). The acreage of Compartment 51 was 213 ha and that of Block TO2B3 was 84 ha. Soil erosion happened occasionally following downpours. This problem was reduced once leguminous cover crops (LCCs) or grasses were established. Soil erosion was also believed to be further reduced when the rubber trees were more than two year-old. RRIM2001 trees in Compartment 51 had average height and girth of 4.34 m and 9.88 cm respectively (Table 1). In Block TO2B3, the average height was rather similar to that of Compartment 51, i.e. 4.62 m but these older trees had greater girth of 11.85 cm (Table 1). The growth of girth of RRIM 2001 at AI was also satisfactory. Ramli et al. (2005) reported that the average girth of RRIM 2001 at two to five years after planting was 13.50 cm, 22.50 cm, 32.80 cm and 41.10 cm, with average girth increment of 9.00 cm/yr (two to three years), 10.30 cm/yr (three to four years), 8.30 cm/yr (four to five years) and 9.20 cm/yr (two to five years) in their LSCT. However, the average girth growth of RRIM 2001 at MDP from two to five years after planting was even higher, i.e. 15.80 cm, 25.60 cm, 35.50 cm and 42.10 cm and the average girth increment was 9.80 cm/yr (two to three years), 7.80 cm/yr (three to four years), 8.60 cm/yr (four to five years) and 8.80 cm/yr (two to five years). With such growth of height and diameter of RRIM 2001 at AI, the sturdiness quotients for trees planted in Compartment 51 was 1.40 and that for TO2B3 was 1.27 (Table 1). This LTC was less sturdy as compared to PB 260 and PB 350. RRIM 2025 was recently planted in Block TO4A6 in Estate B (Table 1). This area was also situated on slope of 25˚ to 30˚ and the trees were also planted at distance of 7’ x 7’. The trees only aged 10 month-old at measurement (Table 1). This LTC occupied a smaller planting area of only 25 ha (Table 1). The average height and the average girth of RRIM2025 trees there were 3.26 m and 7.63 cm respectively (Table 1). With the current height and diameter growth of these RRIM 2025 trees, the trees were also less sturdy as compared to that of PB 260 and PB 350. Such trees had sturdiness quotient of 1.37 (Table 1). RRIM2025 was also planted at Compartment 49 in Estate A on slope of 25˚ to 30˚ (Table 1). The trees were also planted at distance of 7’ x 7’. The trees aged 22 month-old (Table 1). The average height of the trees was 6.34 m and the annual height increment was 3.46 m/yr (Table 1). The average girth was 16.67 cm with annual girth increment of 9.09 cm/yr (Table 1). This brought to the sturdiness quotient of 1.22 for these trees (Table 1). The sturdiness quotient of the trees in Compartment 51 was lower than that of the trees in Block TO4A6 as girth increment was greater as they became older. The girth growth of RRIM 2025 planted at AI was less satisfactory as compared to that recorded by Mohd Nasaruddin (2005). The height of the LTCs at AI was also positively correlated to stem diameter with correlation coefficients that ranged from 0.388 to 0.737 (Table 2). The correlation coefficients were also highly significant at 0.1% level. Good soil was again seemed to be less important for the establishment of LTCs when there was annual rainfall of more than 2000 mm (Figure 2). AI was established on marginal land of Kuala Krai Series. High rainfall was generally found in early, middle and end of the year in this area. PB 350 was also found a better clone in terms of growth of height and girth as compared to RRIM in this plantation.
ISBN 978-967-10840-0-7 Trans. Malaysian Soc. Plant Physiol. 19
First Published, 2011
6
At AI, there were several pests and diseases affecting the growth of the rubber trees. Damages caused by wild boars, elephants, termites and scale insects were recorded as the problems of this plantation. The damage caused by wild boars was the major problem but was overcome by installing barbed wire or wire mesh, shooting and trapping these animals. This LTC stand was also affected by white root disease, Oidium leaf disease and bird’s eye spot leaf disease. Diseases that caused leaf defoliation also retarded the growth of trees in this plantation.
Conclusions
Annual height increment of LTCs was more than 2.50 m/yr at both plantations surveyed. Younger trees showed higher height growth rate than the older trees. Annual girth growth of these LTCs was generally rather close to that reported by MRB, i.e. 9.00 to 10.00 cm/yr. At younger age, the height growth rate of trees was greater than the increment of girth resulted in higher sturdiness quotient. These younger trees may be less resistant to wind damage as compared to older trees that generally had lower sturdiness quotient. Height was significantly correlated to stem diameter for the under study LTCs. Differences in terms of soil type, planting distance according to terrain condition, distribution of rainfall, existence of water body and other vegetation (integrated cultivation with banana at TP) and agronomic practices (fertilizer types applied to trees) between these two plantations did not seem to affect the growth of LTCs greatly. It probably indicated that LTCs are able to grow satisfactory when the minimum requirements are fulfilled.
Acknowledgements The authors would like to thank Mr. Mohammad Saifuddin Abdullah from MTIB, Mr. Lim Yu Sing from TP, Mr. Liew Choo Yong, Mr. Lee Kiong Keh and Mr. Abd Samad Shaari from AI for all information about LTCs in their plantations.
References Chan, W.H. 2005. New perspective for rubber planting in a large plantation group. Proceedings
Rubber Planter’s Conference 2005. MRB. Malaysian Rubber Export Promotion Council. 2010. The industry. Retrieved 1 October 2010 from
http://www.mrepc.com. Mohd Nasaruddin, M.A. 2005. Rubber forest plantation: clones and planting systems. Proceedings
Rubber Planter’s Conference 2005. MRB. Mohd Noor, A.G. 2005. Performance of PB 400 series clones and clonal seedlings. Proceedings
Rubber Planter’s Conference 2005. MRB. MRB, 2009. Rubber Plantation and Processing Technologies; Kuala Lumpur. 1-42. PROSEA, 1995. Hevea. In: Plant Resources of South East Asia 5: (2) Timber Trees: Minor Commercial Timbers. PROSEA. Pp. 260-266. Ramli, O., Masahuling, B., Md Zain, A.A., Zarawi, A.G., Mohd Nasaruddin, M.A., Adam Malik, A.Z.
and Ong, C.W. 2005. Performance of RRIM 2000 series clones in large scale clone trials and monitored development projects. Proceedings Rubber Planter’s Conference 2005. MRB.
Webster, C.C. and Paardekooper, E.C. 1989. The botany of the rubber tree. In: Webster, C.C. and Baulkwill, W. J. (Eds.) Rubber. Longman, New York. Pp. 57-84.
ISBN 978-967-10840-0-7 Trans. Malaysian Soc. Plant Physiol. 19
First Published, 2011
7
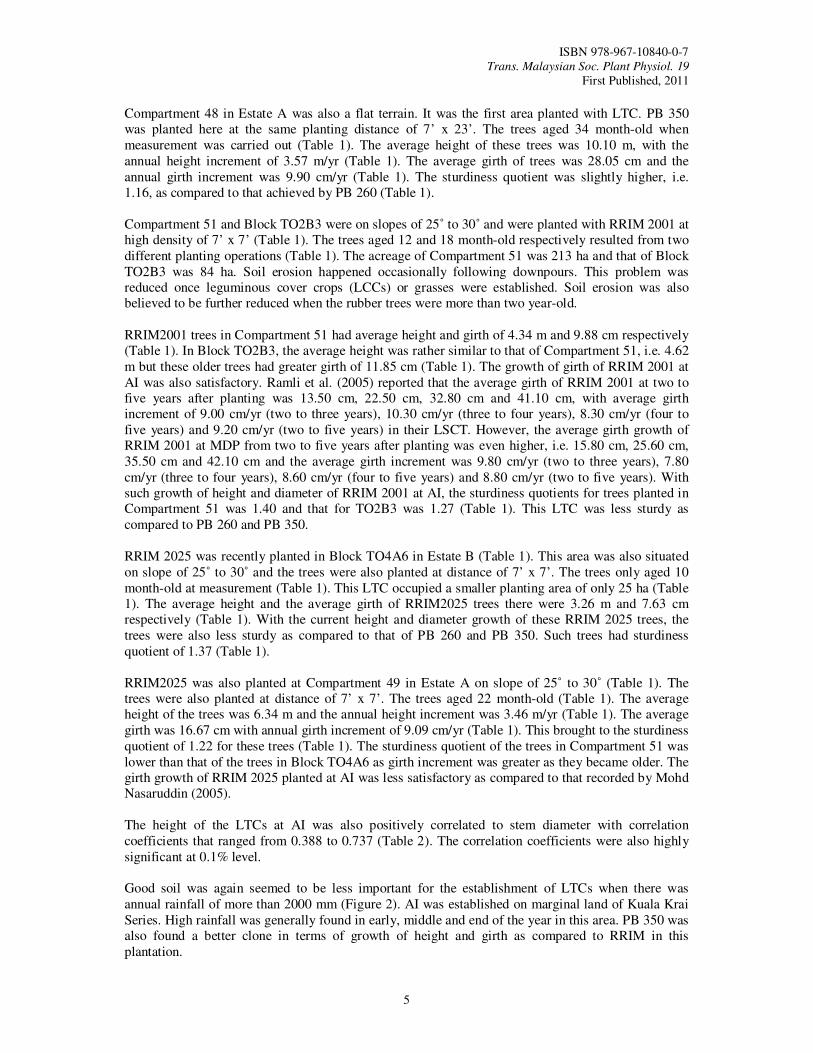
Table 1. Growth performance of LTCs at TP and AI
Clone Plot Age (months)
Area (ha)
Planting Distance
No. of trees sampled
Height (m)
Annual height increment (m/yr)
Girth (cm)
Annual girth increment (cm/yr)
Sturdiness quotient at measurement
TP
PB 350 Block 3 4 445
8’x22’
200 1.77±0.61 - 5.35±1.44 - 1.06±0.39
Block 2 18 567 250 5.44±0.77 - 13.80±1.78 - 1.26±0.21
RRIM 2025
Block 1 30 263 210 6.47±0.87 2.59 18.59±2.38 7.44 1.11±0.16
AI
PB 260 Compartment 47
30 219
7’x23’
100 6.91±0.94 2.76 21.01±3.53 8.40 1.05±0.18
PB 350 Compartment 48
34 287 50 10.10±0.67 3.57 28.05±4.79 9.90 1.16±0.19
RRIM 2001
Compartment 51
12 213
7’x7’
150 4.34±1.00 - 9.88±2.21 - 1.40±0.24
Block TO2B3 18 84 100 4.62±0.73 - 11.85±2.84 - 1.27±0.24
RRIM 2025
Block TO4A6 10 25 105 3.26±0.68 - 7.63±1.31 - 1.37±0.30
Compartment 49
22 247 150 6.34±0.87 3.46 16.67±2.81 9.09 1.22±0.23
ISBN 978-967-10840-0-7 Trans. Malaysian Soc. Plant Physiol. 19
First Published, 2011
8
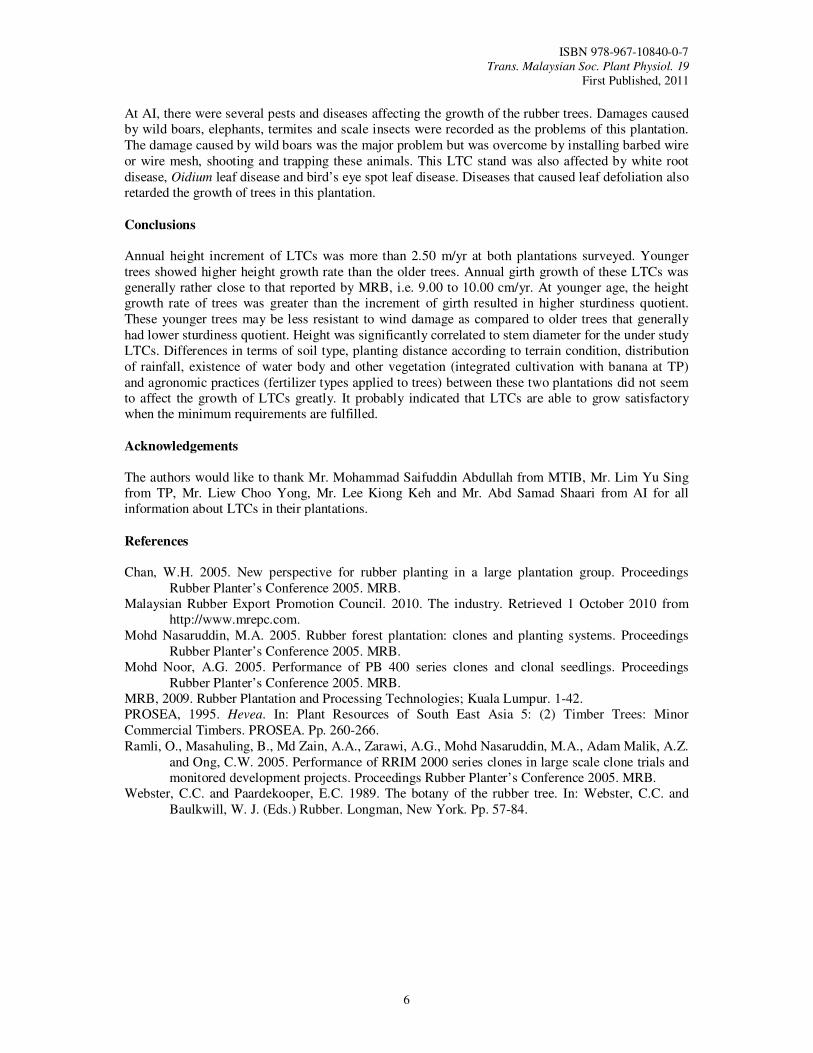
Table 2. Correlation analysis of height and stem diameter of LTCs at TP and AI
Plantation Clone Age (months) Correlation Coefficient
TP PB350
4 0.693***
18 0.272***
RRIM 2025 30 0.397***
AI
PB 260 30 0.389***
PB 350 34 0.395***
RRIM 2001 12 0.476***
18 0.613***
RRIM 2025 10 0.388***
22 0.737***
*** Significant at 0.001 significance level
0
100
200
300
400
500
600
Jan-08 Apr-08 Jul-08 Oct-08 Jan-09 Apr-09
Rain
fall
(mm
)
Figure 1. Monthly rainfall at TP
0
200
400
600
800
1000
1200
Jan-06 Jul-06 Jan-07 Jul-07 Jan-08 Jul-08 Jan-09
Rain
fall
(mm
)
Figure 2. Monthly rainfall recorded at Kuala Geris Estate (Jan 2006 – Dec 2007) and AI (2008 onwards)
ISBN 978-967-10840-0-7 Trans. Malaysian Soc. Plant Physiol. 19
First Published, 2011
9
Effects of Harvesting Techniques on Growth Performance of Gigantochloa
scortechinii (Buluh Semantan)
Abd Razak, O.*, Hashim, M.N., Rosdi, K. and Ahmad Zuhaidi, Y. Forest Research Institute Malaysia (FRIM), 52109 Kepong, Selangor, Malaysia. *E-mail: [email protected]
Introduction Gigantochloa scortechinii is one of the most commonly used bamboo species, endemic to the Peninsular Malaysia. It occurs extensively in logged-over forests, particularly in the state of Kedah, Perak, Kelantan, Selangor and Pahang. The species thrives best in sites with well-drained sandy to clay loam soils with slight acidic condition (soil pH of 5.0-6.5). Like other commercial species of bamboo, G. scortechinii stands have been very much depleted and the supply continues to decline due to unregulated exploitation. Furthermore, these bamboos grow wild, scattered and are practically unmanaged. Many of the problems faced by the harvesters are related to the natural characteristics of the bamboo stand itself. The high quality culms that are straight and mature, are commonly located at the centre of the clumps, but are difficult to harvest. At present, there are no proper management measures being practised to sustain the production of this raw material from natural forests. There is no information on suitable harvesting technique that is essential to support in managing bamboo stands in Malaysia. Most of the harvesting activities of the resource are unsystematic and haphazard in nature (Azmy et al., 1997). Due to lack of a systematic management, this valuable resource is harvested without thought given to its intended usage. Thus, harvesting technique is an integral part in the management regime of natural bamboo stands for improving production and sustainability. In view of current problems, a study was conducted to determine the best harvesting techniques for natural stands of G. scortechinii.
Materials and Methods Description of study sites
The study was conducted in logged over areas in Betau, Kuala Lipis in Pahang. The study area has a flat and undulating topography. The mean annual rainfall, temperature and humidity of the study site are 1500
mm, 30 °C and 89% respectively. Natural stand of G. scortechinii dominated the areas with a scattered distribution. The clump density was between 204-250 bamboo clumps per hectare. Clump density and harvesting techniques
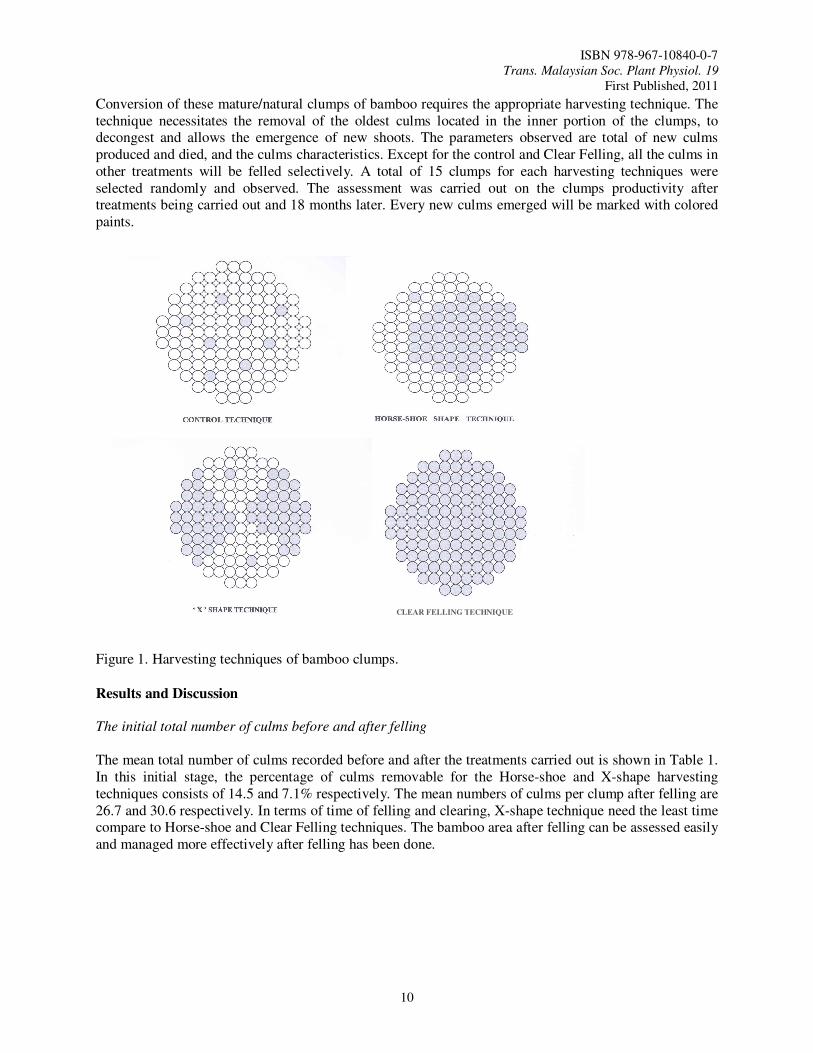
Three clump density of G. scortechinii natural stands were classified; consisting of 10-25, 26-40 and >40 culms per clump respectively. Three harvesting techniques were employed to extract the bamboo culms. The first technique is the Horse-shoe shape, the second technique is X-shape and the third technique is the Clear Felling (Figure 1). The no felling of culms is made the control. The Horse-shoe and X-shape technique is applied by harvesting the mature culms of 3 years old and above within the clump, that are mostly found in the inner zone of the clump. The distribution of the remaining culms will be formed into a Horse-shoe and X-shape like clump. The third technique will be Clear Felling of all the standing culms. The harvesting techniques used in this study were based on the various harvesting techniques and clump management that have been practiced in India (Lakshmana, 1988).
ISBN 978-967-10840-0-7 Trans. Malaysian Soc. Plant Physiol. 19
First Published, 2011
10
Conversion of these mature/natural clumps of bamboo requires the appropriate harvesting technique. The technique necessitates the removal of the oldest culms located in the inner portion of the clumps, to decongest and allows the emergence of new shoots. The parameters observed are total of new culms produced and died, and the culms characteristics. Except for the control and Clear Felling, all the culms in other treatments will be felled selectively. A total of 15 clumps for each harvesting techniques were selected randomly and observed. The assessment was carried out on the clumps productivity after treatments being carried out and 18 months later. Every new culms emerged will be marked with colored paints. Figure 1. Harvesting techniques of bamboo clumps.
Results and Discussion
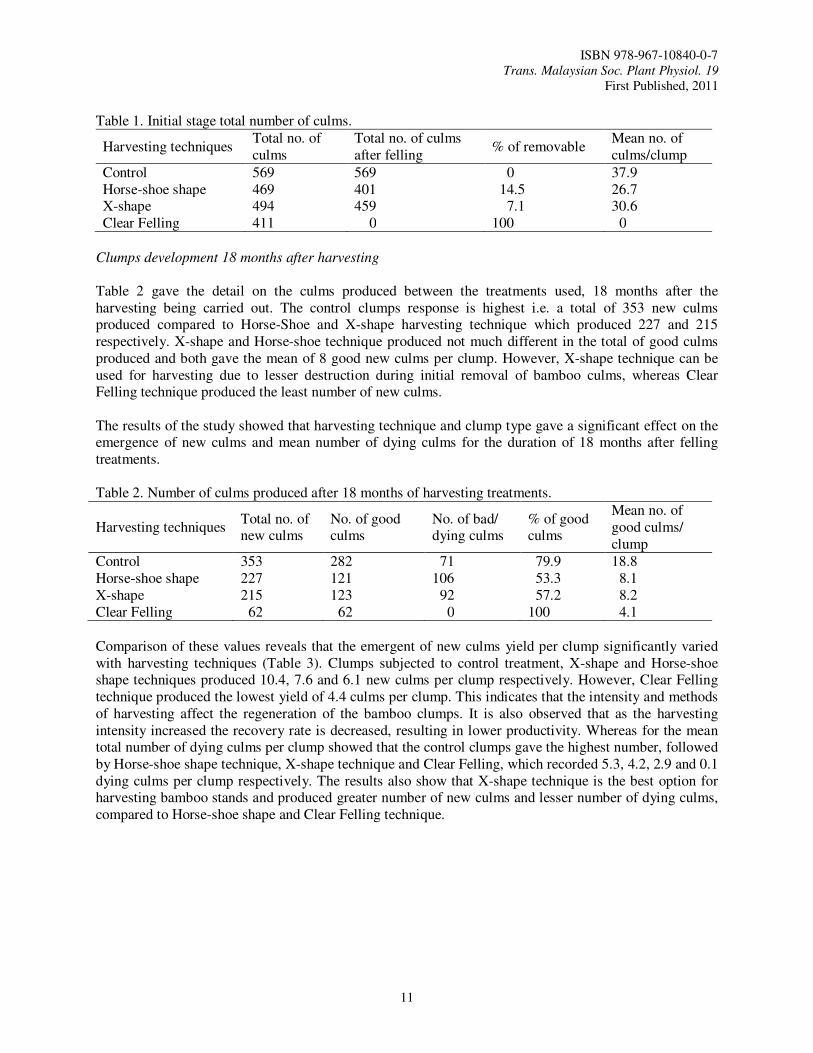
The initial total number of culms before and after felling
The mean total number of culms recorded before and after the treatments carried out is shown in Table 1. In this initial stage, the percentage of culms removable for the Horse-shoe and X-shape harvesting techniques consists of 14.5 and 7.1% respectively. The mean numbers of culms per clump after felling are 26.7 and 30.6 respectively. In terms of time of felling and clearing, X-shape technique need the least time compare to Horse-shoe and Clear Felling techniques. The bamboo area after felling can be assessed easily and managed more effectively after felling has been done.
CLEAR FELLING TECHNIQUE
ISBN 978-967-10840-0-7 Trans. Malaysian Soc. Plant Physiol. 19
First Published, 2011
11
Table 1. Initial stage total number of culms.
Harvesting techniques Total no. of culms
Total no. of culms after felling
% of removable Mean no. of culms/clump
Control 569 569 0 37.9 Horse-shoe shape 469 401 14.5 26.7 X-shape 494 459 7.1 30.6 Clear Felling 411 0 100 0
Clumps development 18 months after harvesting
Table 2 gave the detail on the culms produced between the treatments used, 18 months after the harvesting being carried out. The control clumps response is highest i.e. a total of 353 new culms produced compared to Horse-Shoe and X-shape harvesting technique which produced 227 and 215 respectively. X-shape and Horse-shoe technique produced not much different in the total of good culms produced and both gave the mean of 8 good new culms per clump. However, X-shape technique can be used for harvesting due to lesser destruction during initial removal of bamboo culms, whereas Clear Felling technique produced the least number of new culms. The results of the study showed that harvesting technique and clump type gave a significant effect on the emergence of new culms and mean number of dying culms for the duration of 18 months after felling treatments. Table 2. Number of culms produced after 18 months of harvesting treatments.
Harvesting techniques Total no. of new culms
No. of good culms
No. of bad/ dying culms
% of good culms
Mean no. of good culms/ clump
Control 353 282 71 79.9 18.8 Horse-shoe shape 227 121 106 53.3 8.1 X-shape 215 123 92 57.2 8.2 Clear Felling 62 62 0 100 4.1
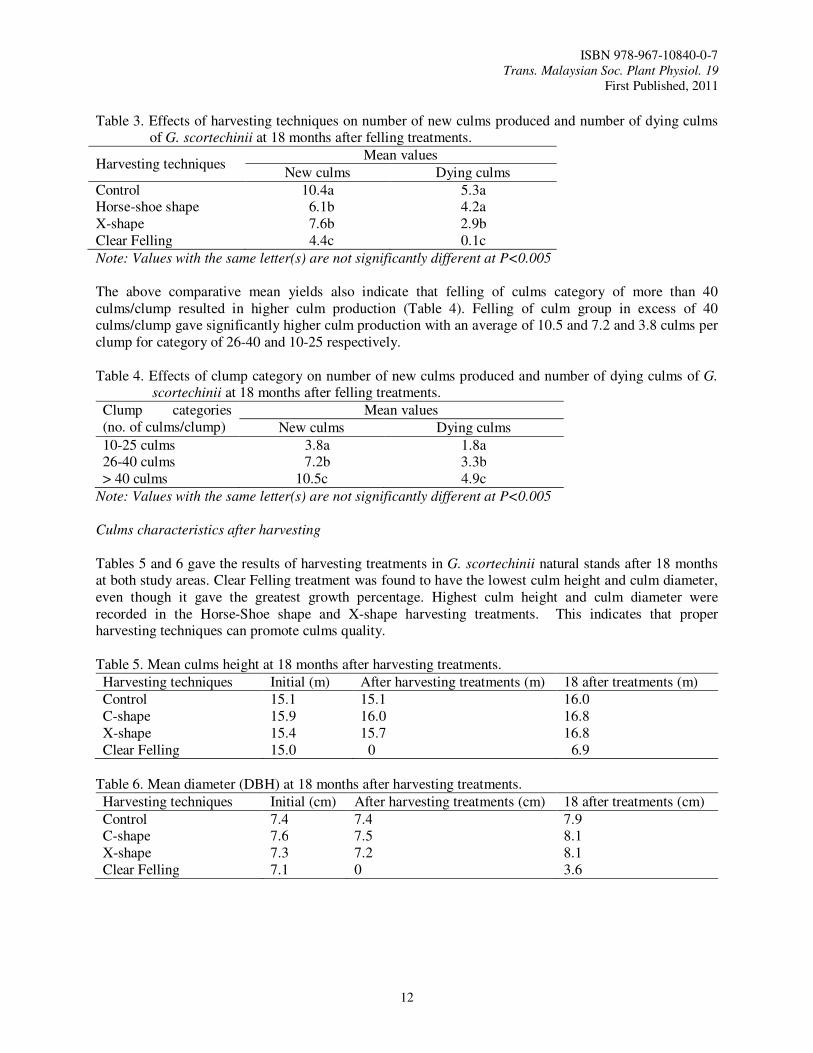
Comparison of these values reveals that the emergent of new culms yield per clump significantly varied with harvesting techniques (Table 3). Clumps subjected to control treatment, X-shape and Horse-shoe shape techniques produced 10.4, 7.6 and 6.1 new culms per clump respectively. However, Clear Felling technique produced the lowest yield of 4.4 culms per clump. This indicates that the intensity and methods of harvesting affect the regeneration of the bamboo clumps. It is also observed that as the harvesting intensity increased the recovery rate is decreased, resulting in lower productivity. Whereas for the mean total number of dying culms per clump showed that the control clumps gave the highest number, followed by Horse-shoe shape technique, X-shape technique and Clear Felling, which recorded 5.3, 4.2, 2.9 and 0.1 dying culms per clump respectively. The results also show that X-shape technique is the best option for harvesting bamboo stands and produced greater number of new culms and lesser number of dying culms, compared to Horse-shoe shape and Clear Felling technique.
ISBN 978-967-10840-0-7 Trans. Malaysian Soc. Plant Physiol. 19
First Published, 2011
12
Table 3. Effects of harvesting techniques on number of new culms produced and number of dying culms
of G. scortechinii at 18 months after felling treatments.
Harvesting techniques Mean values
New culms Dying culms
Control 10.4a 5.3a Horse-shoe shape 6.1b 4.2a X-shape 7.6b 2.9b Clear Felling 4.4c 0.1c
Note: Values with the same letter(s) are not significantly different at P<0.005
The above comparative mean yields also indicate that felling of culms category of more than 40 culms/clump resulted in higher culm production (Table 4). Felling of culm group in excess of 40 culms/clump gave significantly higher culm production with an average of 10.5 and 7.2 and 3.8 culms per clump for category of 26-40 and 10-25 respectively. Table 4. Effects of clump category on number of new culms produced and number of dying culms of G.
scortechinii at 18 months after felling treatments.
Clump categories (no. of culms/clump)
Mean values
New culms Dying culms
10-25 culms 3.8a 1.8a 26-40 culms 7.2b 3.3b > 40 culms 10.5c 4.9c
Note: Values with the same letter(s) are not significantly different at P<0.005
Culms characteristics after harvesting
Tables 5 and 6 gave the results of harvesting treatments in G. scortechinii natural stands after 18 months at both study areas. Clear Felling treatment was found to have the lowest culm height and culm diameter, even though it gave the greatest growth percentage. Highest culm height and culm diameter were recorded in the Horse-Shoe shape and X-shape harvesting treatments. This indicates that proper harvesting techniques can promote culms quality. Table 5. Mean culms height at 18 months after harvesting treatments.
Harvesting techniques Initial (m) After harvesting treatments (m) 18 after treatments (m)
Control 15.1 15.1 16.0 C-shape 15.9 16.0 16.8 X-shape 15.4 15.7 16.8 Clear Felling 15.0 0 6.9
Table 6. Mean diameter (DBH) at 18 months after harvesting treatments.
Harvesting techniques Initial (cm) After harvesting treatments (cm) 18 after treatments (cm)
Control 7.4 7.4 7.9 C-shape 7.6 7.5 8.1 X-shape 7.3 7.2 8.1 Clear Felling 7.1 0 3.6
ISBN 978-967-10840-0-7 Trans. Malaysian Soc. Plant Physiol. 19
First Published, 2011
13
The importance of harvesting
Harvesting technique should therefore be done to make the bamboo clump more open, allowing available growing space for better development of quality culms inside the clumps. Over-cutting, however, is not recommended as it could reduce future growing stock and stand quality. Rapid and profuse regeneration of new culms results in a tight and close development of culms, making the clump becomes very dense. The shoots which developed inside a dense clump are normally crooked and small. Furthermore, felling of mature culms inside the dense clump is difficult and wastes a large proportion of culm stumps. To sustain the yield and productivity of bamboo stands, suitable culm selection system for harvesting need to be adopted. Over-mature, defective and a few mature culms should be harvested. Results of the present and past studies (Azmy et al., 1997) suggest that the most suitable cutting/harvesting regime is to leave in the clump at least 2-3 fully grown one-to-two-year old culms for every young and developing shoot.
Conclusions and Recommendations
Based on the results of harvesting study, the initial felling and conversion of natural G. scortechinii stands, the following conclusions could be drawn with the corresponding recommendations: • The harvesting techniques and clump condition gave the highly significant effect on the production of the new culms and over-mature culms.
• X-shape harvesting technique is recommended due to lower damage and injury of the residual culms and lower initial removal of bamboo culms (7.1%). It produced higher number of new good culms (7.6) and lower death of new culms (2.9) as compared with horse-shoe shape harvesting technique.
• It is recommended that only bamboo clumps having higher than 25 culms/clump to be harvested using the X-shape technique. Selective harvesting technique is recommended for the clumps having lower number of culms until they reach the specified clump size.
• Clear Felling method is not recommended for the harvesting of natural stand bamboos due to slow recovery and low quality of culms.
References Azmy, M., Norini, H. and Wan Razali, W.M. 1997. Management Guidelines and Economics of Natural
Bamboo Stands. FRIM Technical Information handbook No.15, 40pp. Lakshmana, A.C. 1988. A new approach of the management of bamboo stands. In: Ramanuja Rao, I.V.,
Ganaharan, R. and Sastry, C.B. (Eds.) Proceedings of the International Bamboo Workshop. 14-18 November 1988. Cochin, India. Pp. 128-132.
ISBN 978-967-10840-0-7 Trans. Malaysian Soc. Plant Physiol. 19
First Published, 2011
14
Effects of Night Break on Stevia rebaudiana
Armizatul, S.A.H.*, Mohd Aziz, R., Wira, A.B. and Azhar, K. Environment & Agro-Industry Management Programme, Strategic Resources Research Centre MARDI, PO Box 12301, 50774 Kuala Lumpur, Malaysia. *E-mail: [email protected]
Introduction Stevia (Stevia rebaudiana) is an herbaceous perennial shrub from Compositae family and it is native to Paraguay. It has been used as a sweetener in medicinal teas for treating conditions such as obesity, high blood pressure, heartburn and diabetes. Recently, Stevia has received greater intention with the rise in demand for low-carbohydrate, low-sugar food and beverages additives. Leaves of this plant produce a zero-calorie, non-nutritive and high potency sweetener that is 300 times sweeter than sucrose (Soejarto et al., 1983). For centuries, the leaves of stevia plant have been effectively used to naturally sweeten tea by the Guarani Indians. Today, it is widely used in the world to sweeten food and beverages and also served as dietary supplement. It is considered safe for consumption with no major contradictions, warning and side effects reported. Stevia is an obligate short day plant (Lester, 1999) with a critical day length of about 13 hours. It can initiate flowering after a minimum of four true leaves have been produced (Carneiro, 1990). Day length in Malaysia which is less than 13 hours causes Stevia to flower readily, resulting in low leaf yield per harvest and a lower percentage of sweetener content. Metivier and Viana (1979) reported that Stevia vegetative growth was influenced by day length variation. The vegetative growth is reduced when the day length is less than 13 hours. Thus, Stevia vegetative growth and sugar contents level can be increased either by extending day length to 14-16 hours (Metivier and Viana, 1979; Ramesh et al., 2006) or using ‘light break’ technique (Carr, 1952; Nanda and Hamner, 1962). Light break or light perturbation can be defined as light exposure to any various times during the long dark period or night in certain duration. The light break effect with red light (400 – 700 nm) cause inhibition of flowering in short day plants such as cocklebur and Biloxi soybean (Carr, 1952; Nanda and Hamner, 1962). A light break during the night interrupts the flowering response, but a dark period during the day has little effect on flowering. Carr (1952) observed that for plants with a critical night length, a short flash of light in the middle of the night would make the plant behave as if it had been exposed to a long day. It has been determined experimentally that a short day plant (long night) will not flower if a flash of phytochrome activating light is used on the plant during the night (Carr, 1952; Wareing, 1954; Nanda and Hamner, 1962). Thus, this study was conducted to examine the effect of night break to Stevia vegetative growth that is plant height, leaf numbers, leaf area, leaf drymass and days after pruning to flower bloom.
Materials and Methods The study was conducted under a rain shelter in MARDI Serdang. A total of 120 plants aged one month were planted in pots (2 plants in a pot of 20 cm diameter x 28 cm height) containing subsoil, sand and coco peat at the ratio of 7:3:2. All plants were pruned and left only 2 pair leaves in each plant. Each pot was watered for 1000mL everyday and fertilize with 1.4% N: 0.3% P: 2.4% K every two weeks.

ISBN 978-967-10840-0-7 Trans. Malaysian Soc. Plant Physiol. 19
First Published, 2011
15
There were six light treatments including control (no light); night break of 1 minute, 5 minutes, 10 minutes, 20 minutes and 40 minutes. Every treatment contained 10 pots arranged in line with 3 saving energy lights (18 watts with irradiance of 430 µMol/m-2s-1) were put 1.3 meter height from plants. For all treatments light were started at 12 midnight everyday. Plant height of new shoots, total leaf numbers, plant biomass (leaf, stem and root) and days after pruning to full bloom were recorded. All data were analyzed statistically by ANOVA, using SAS version 9.1.
Results and Discussion
The results of plant height, leaf numbers, total leaf area, stem and leaves dry weight and days to full bloom are shown as below:
Table 1. Plant height and leaf numbers of stevia at 6 and 8 weeks
Duration of night break (minutes)
At 6 weeks At 8 weeks
Plant height Leaf numbers Plant height Leaf numbers
0 35.9a 20c Nil Nil 1 34.5ab 23b 50 c 29b 5 35.9a 26ab 60.6ab 28bc 10 36.3a 27a 65a 25cd 20 31.7bc 25ab 58.3b 35a
40 28.9c 24ab 57.3b 24d
Means followed by the same letters are not significantly different at P<0.05
0
50
100
150
200
250
300
350
0min 1min 5min 10min 20min 40min
Duration of night break
To
tal
lea
f a
rea
Figure 1. Total leaf area at final harvest
ISBN 978-967-10840-0-7 Trans. Malaysian Soc. Plant Physiol. 19
First Published, 2011
16
0
0.5
1
1.5
2
2.5
3
0min 1min 5min 10min 20min 40min
Duration of night break
Dry
weig
ht/
g
stem
leaves
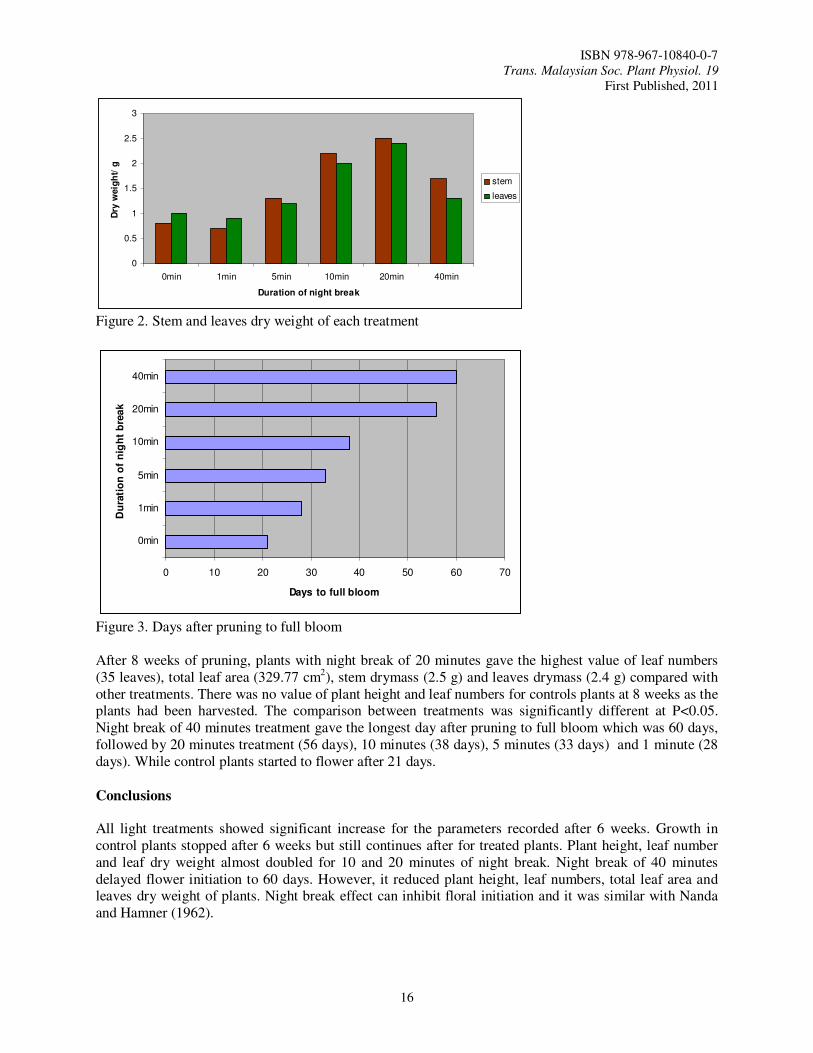
Figure 2. Stem and leaves dry weight of each treatment
0 10 20 30 40 50 60 70
0min
1min
5min
10min
20min
40min
Du
rati
on
of
nig
ht
bre
ak
Days to full bloom
Figure 3. Days after pruning to full bloom After 8 weeks of pruning, plants with night break of 20 minutes gave the highest value of leaf numbers (35 leaves), total leaf area (329.77 cm2), stem drymass (2.5 g) and leaves drymass (2.4 g) compared with other treatments. There was no value of plant height and leaf numbers for controls plants at 8 weeks as the plants had been harvested. The comparison between treatments was significantly different at P<0.05. Night break of 40 minutes treatment gave the longest day after pruning to full bloom which was 60 days, followed by 20 minutes treatment (56 days), 10 minutes (38 days), 5 minutes (33 days) and 1 minute (28 days). While control plants started to flower after 21 days.
Conclusions
All light treatments showed significant increase for the parameters recorded after 6 weeks. Growth in control plants stopped after 6 weeks but still continues after for treated plants. Plant height, leaf number and leaf dry weight almost doubled for 10 and 20 minutes of night break. Night break of 40 minutes delayed flower initiation to 60 days. However, it reduced plant height, leaf numbers, total leaf area and leaves dry weight of plants. Night break effect can inhibit floral initiation and it was similar with Nanda and Hamner (1962).
ISBN 978-967-10840-0-7 Trans. Malaysian Soc. Plant Physiol. 19
First Published, 2011
17
References Carneiro, J.W.P. 1990. Stevia rebaudiana (Bert.) Bertoni, production of seed. M.Sc Thesis, State
University of Maringa, Brazil. Carr, D.J. 1952. The photoperiodic behaviour of short day plants. Physiology Plantarium 5: 70-84. Lester, T.1999. Stevia rebaudiana. Sweet leaf. The Australian New Crops Newsletter 11: 1. Metivier, J. and Viana, A.M. 1979. The effect of long and short day length upon the growth of whole
plants and the level of soluble proteins, sugars and stevioside in leaves of Stevia rebaudiana. Journal of Experimental Botany 30: 1211-1222.
Nanda, K.K. and Hamner, K.C. 1962. Investigation on the effect of ’light break’ on the nature of the endogenous rhytm in the flowering response of Biloxi soybean (Glycine, Max, L.Merr). Physiology Plantarium 58: 164 -174.
Ramesh, K., Singh, V. and Megeji, N.W. 2006. Cultivation of Stevia (Stevia rebaudiana (Bert.) Bertoni): A comprehensive review. Advances in Agronomy 89: 137-177.
Soejarto, D.D., Compadre, C.M., Medon, P.J., Kameth, S.K. and Kinghorn, A.D. 1983. Potential sweetening agents of plant origin. II. Field search for sweet tasting Stevia species. Economic Botany 37: 71-79.
Wareing, P.F. 1954. Experiments on the ‘light break’ effect in short day plants. Physiology Plantarium 7: 157-172.
ISBN 978-967-10840-0-7 Trans. Malaysian Soc. Plant Physiol. 19
First Published, 2011
18
Changes in Tannin Concentration of Rastali Banana (Musa AAB Rastali)
During Growth and Development
Tee, Y.K. and Ding, P.* Department of Crop Science, Faculty of Agriculture, Universiti Putra Malaysia, 43400 UPM Serdang, Selangor, Malaysia. *E-mail: [email protected]
Introduction
Tannins are phytochemicals with a heterogenous group of polyphenolic substances which give astringency taste to bananas, grapes and green tea (Abou Aziz et al., 1976). Tannin can be found in many different parts of a plant such as leaf, seed, fruit, root and stem tissues (Kuster, 1956). There were two different types of tannins found in fruits which serve as natural mechanism defense against enemies by having the condensed tannins that will combine with consumed plant proteins and make difficulty for animals to digest (Van Soest, 1982) while the hydrolyzed tannins prevent the abnormal cellular division. On the other hand, the tannin with the astringency may prevent the invasions of parasitic organisms by immobilizing the extracellular enzymes (Ayres et al., 1997). In fruits, tannins are served as chemical barriers which protect the internal fruit parts such as ovary and seeds from biotic stress (Agrios, 1997). Thus, the understanding of tannin concentration changes in Rastali banana during fruit growth and development may serve as basis information for expanding the utilization of bananas at different stages of fruit maturity. The objective of this study was to determine tannin concentration of Rastali banana during fruit growth and development.
Materials and Methods
Fruit bunches of Rastali banana were obtained from the university experimental field where fruit development stages were dated from the 1st until 12th week after first hand emergence (basal fruit at top that first emerged from the pseudostem). Fruit bunches were harvested at 2 weeks intervals after first hand emergence. Hands were numbered from the top of bunch to the bottom (hand 1: basal fruit at the top; hand 6: distal hand at the bottom) and only six hands of bananas were used. Three fingers from either upper or lower whorls of each hand were selected randomly for analysis. For tannin concentration, 10 g of banana pulp taken from the fingers of each hand was weighed and chopped. Banana pulp was blended by adding 90 ml of distilled water. The mixture was then filtered and 5 ml of Folin-Denis reagent and 10 ml of sodium carbonate solution were added into the filtrate. The mixture was then mixed well and diluted to 100 ml with water. Tannin content was analyzed at 760 nm of absorbance after 30 min by using a S1200 Diode Array Spectrophotometer (Biochrom, Cambridge, England). The experimental design was a randomized complete block design with three replications. Each replicate consisted of 6 hands with 3 fingers per hand. Data was analyzed using ANOVA (SAS, V9) and means separation was carried out using Duncan’s Multiple Range Test (DMRT).
Results and Discussion
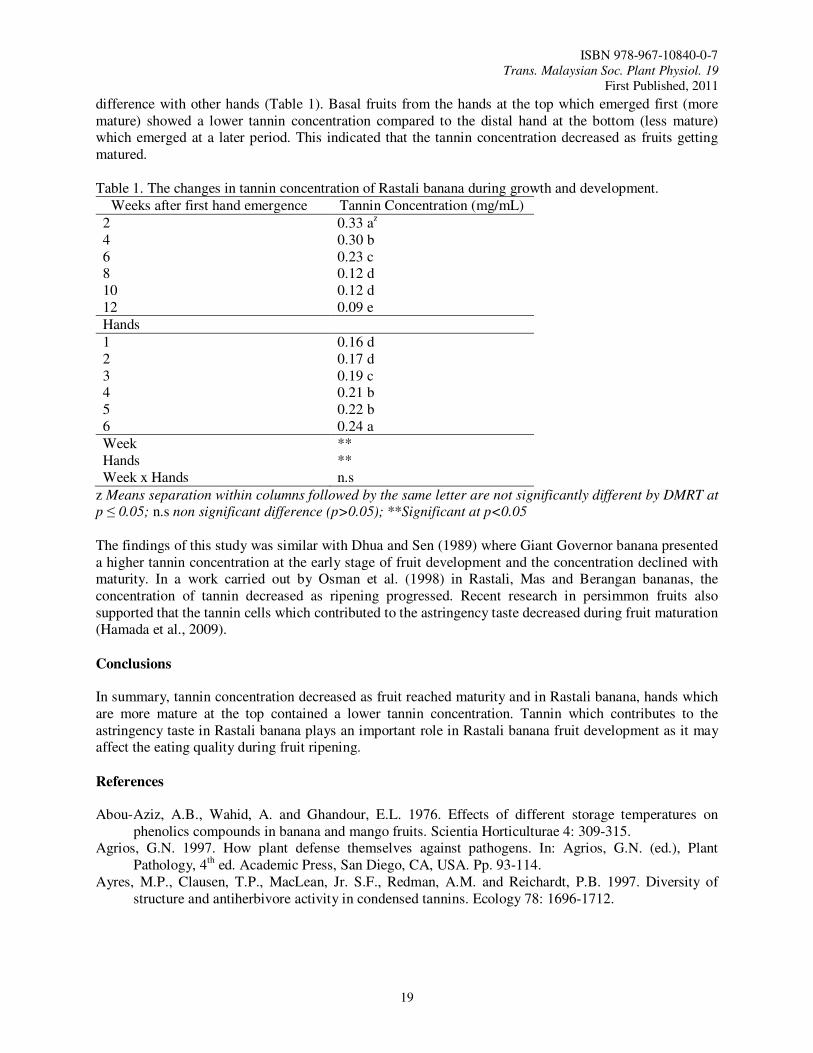
There was a highly significant difference in tannin concentration of Rastali banana during fruit growth (week 2, 4, 6, 10, and 12 after first hand emergence). Similarly, the tannin concentration with in hands also showed significant differences among 6 hands (Table 1). Rastali banana fruits contained the highest tannin concentration during early stage of fruit growth and the tannin concentration decreased by 72.73% as fruit achieved maturation at week 12. During fruit growth and development, hand 6 contained the highest tannin concentration as compared to other hands (Table 1). In this study, hand 1 and 2, hand 4 and 5 did not show significant difference in tannin concentration while hand 3 and 6 showed significant
ISBN 978-967-10840-0-7 Trans. Malaysian Soc. Plant Physiol. 19
First Published, 2011
19
difference with other hands (Table 1). Basal fruits from the hands at the top which emerged first (more mature) showed a lower tannin concentration compared to the distal hand at the bottom (less mature) which emerged at a later period. This indicated that the tannin concentration decreased as fruits getting matured. Table 1. The changes in tannin concentration of Rastali banana during growth and development.
Weeks after first hand emergence Tannin Concentration (mg/mL)
2 0.33 az 4 0.30 b 6 0.23 c 8 0.12 d 10 0.12 d 12 0.09 e
Hands
1 0.16 d 2 0.17 d 3 0.19 c 4 0.21 b 5 0.22 b 6 0.24 a
Week ** Hands ** Week x Hands n.s
z Means separation within columns followed by the same letter are not significantly different by DMRT at
p ≤ 0.05; n.s non significant difference (p>0.05); **Significant at p<0.05 The findings of this study was similar with Dhua and Sen (1989) where Giant Governor banana presented a higher tannin concentration at the early stage of fruit development and the concentration declined with maturity. In a work carried out by Osman et al. (1998) in Rastali, Mas and Berangan bananas, the concentration of tannin decreased as ripening progressed. Recent research in persimmon fruits also supported that the tannin cells which contributed to the astringency taste decreased during fruit maturation (Hamada et al., 2009).
Conclusions In summary, tannin concentration decreased as fruit reached maturity and in Rastali banana, hands which are more mature at the top contained a lower tannin concentration. Tannin which contributes to the astringency taste in Rastali banana plays an important role in Rastali banana fruit development as it may affect the eating quality during fruit ripening.
References
Abou-Aziz, A.B., Wahid, A. and Ghandour, E.L. 1976. Effects of different storage temperatures on
phenolics compounds in banana and mango fruits. Scientia Horticulturae 4: 309-315. Agrios, G.N. 1997. How plant defense themselves against pathogens. In: Agrios, G.N. (ed.), Plant
Pathology, 4th ed. Academic Press, San Diego, CA, USA. Pp. 93-114. Ayres, M.P., Clausen, T.P., MacLean, Jr. S.F., Redman, A.M. and Reichardt, P.B. 1997. Diversity of
structure and antiherbivore activity in condensed tannins. Ecology 78: 1696-1712.
ISBN 978-967-10840-0-7 Trans. Malaysian Soc. Plant Physiol. 19
First Published, 2011
20
Dhua, R.S. and Sen, S.K. 1989. Seasonal changes in active tannin content in pulp and peel of the Giant Governor banana during fruit growth and maturity. Plant Physiology and Biochemistry 66(3): 284-285.
Hamada, K., Hasegawa, K. and Ogata, T. 2009. The growth of tannin cells from before flowering to fruit maturity and astringency in Japanese persimmons. Journal of Horticultural Science and Biotechnology
84(1): 72–76. Kuster, E. 1956. Oxalatkristalle. In: Kuster, E. (ed.), Die Pflanzenzelle. Guscav Fischer Verlag, Jena. Pp.
492-506. Osman, A., Nik Saad, N.S. and Mohamed, S. 1998. Comparing the physicochemical characteristics of
Mas, Rastali and Berangan bananas at 3 stages of maturity. In Proceedings of the 1st National Banana Seminar. Awana Genting Golf and Resort. 23-25 November 1998.
Van Soest, P.J. 1982. Nutritional ecology of the ruminant: ruminant metabolism, nutritional strategies, the cellulolytic fermentation, and the chemistry of forages and plant fibers. In: Van Soest, P.J. (ed.), Nutritional ecology of the ruminant, 2nd ed. Cornell University Press, New York, pp. 374.
ISBN 978-967-10840-0-7 Trans. Malaysian Soc. Plant Physiol. 19
First Published, 2011
21
Effect of K-fertigation Levels on Tomato Sap and Plant Performance
Wira, A.B.*, Abd Jamil, Z. and Armizatul, S.A.H. Malaysian Agricultural Research and Development Institute, P.O. Box 12301, General Post Office, 50774 Kuala Lumpur, Malaysia. *E-mail: [email protected]
Introduction
Balanced fertilization management is crucial to ensure healthy plant growth and development. Since many crops require optimal nutrient doses to obtain high yield, plant sap analysis is used to analyze the mineral nutrition status of plant for fertilizer recommendation. Results on the plant sap analysis have proved to be related to fertilizer nutrient solution in identifying trends of development in the crop and to anticipate potential imbalance situation (Smith, 1988). In tomato, plant sap analysis is typically done on petioles because they are easily identifiable succulent organs and yield usable volumes of sap (Hochmuth et al., 2008). Plant sap analysis is an easy and quick method as compared to foliar and soil analysis. Foliar analysis indicates the current nutrient status within a plant before the plant shows any visible symptoms but will not determine why that nutrient is deficient (Atland, 2008) and the analysis is costly and time consuming. Meanwhile, soil analysis cannot indicate whether plants growing in the soil are able to take up a nutrient and the results are often contradictory with the plant behaviour (Lucena, 1997) because nutrient reserved in the soil does not mean nutrient uptake by the plant. Potassium is a major nutrient element that plays an important role in several metabolic processes (Marschner, 1995). Potassium is absorbed in largest amount as compared to other nutrient where 600-1000 kg K2O/ha for greenhouse crop yielding of over 100 t/ha (IFA, 1992). Potassium enhances storage and extends shelf lives of tomatoes (Mengel, 1997). Red colour development in fruits is due to carotenoid pigments, particularly lycopene, which is synthesized more at adequate K levels (Usherwood, 1985). This experiment was done to determine plant sap characteristic of different plant parts as affected by different K treatment levels to highlight the optimum level for plant growth and yield.
Materials and Methods
Seeds of tomato (Lycopersicon esculentum var baccarat) were germinated in cocopeat. After 25 days, the seedlings were transplanted to polybags of size of 16 cm x 16 cm containing a mixture medium of cocopeat, husk rice charcoal and perlite in a ratio 7:3:3. The planting bags were arranged in a double row system, a distant of 0.5 m within rows and 1.3 m between rows. Five potassium fertigation levels were used as treatments which are 150 ppm -T1, 180 ppm -T2, 210 ppm -T3, 240 ppm -T4 and 270 ppm -T5. A Randomized Complete Block Design was used with five replications and each replication per treatment consisted of two plants. Plants were fertilized six times daily (1500 mL/plant/day) using drip irrigation. Sap samples were collected from four weeks old leaf petiole and leaf lamina. The sap samples were taken at three production stages from all plants in each treatment, which were at 60 days, 90 days and 120 days after transplanting. Leaf petioles and leaf lamina were squeezed using garlic press and their sap nitrate, potassium and sodium reading was determined using Cardy meter. The Cardy meter calibration was done before and after each determination.
ISBN 978-967-10840-0-7 Trans. Malaysian Soc. Plant Physiol. 19
First Published, 2011
22
Results and Discussion
Petioles sap nitrate, potassium and natrium
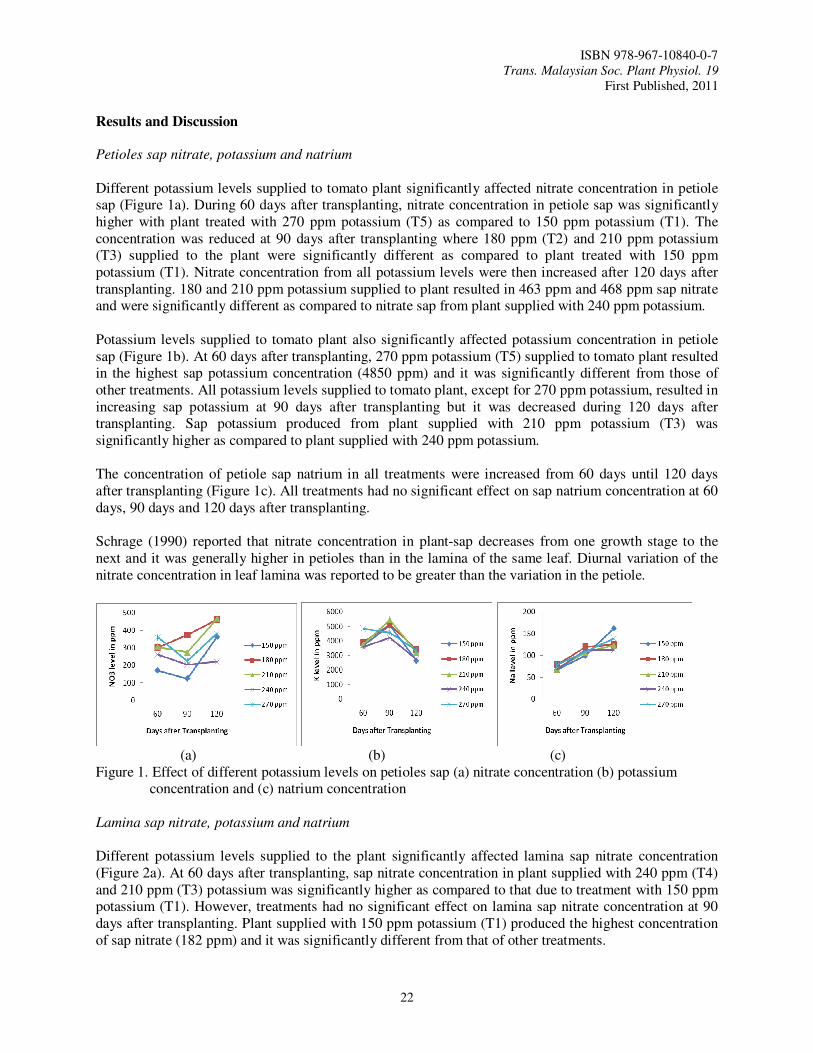
Different potassium levels supplied to tomato plant significantly affected nitrate concentration in petiole sap (Figure 1a). During 60 days after transplanting, nitrate concentration in petiole sap was significantly higher with plant treated with 270 ppm potassium (T5) as compared to 150 ppm potassium (T1). The concentration was reduced at 90 days after transplanting where 180 ppm (T2) and 210 ppm potassium (T3) supplied to the plant were significantly different as compared to plant treated with 150 ppm potassium (T1). Nitrate concentration from all potassium levels were then increased after 120 days after transplanting. 180 and 210 ppm potassium supplied to plant resulted in 463 ppm and 468 ppm sap nitrate and were significantly different as compared to nitrate sap from plant supplied with 240 ppm potassium.
Potassium levels supplied to tomato plant also significantly affected potassium concentration in petiole sap (Figure 1b). At 60 days after transplanting, 270 ppm potassium (T5) supplied to tomato plant resulted in the highest sap potassium concentration (4850 ppm) and it was significantly different from those of other treatments. All potassium levels supplied to tomato plant, except for 270 ppm potassium, resulted in increasing sap potassium at 90 days after transplanting but it was decreased during 120 days after transplanting. Sap potassium produced from plant supplied with 210 ppm potassium (T3) was significantly higher as compared to plant supplied with 240 ppm potassium. The concentration of petiole sap natrium in all treatments were increased from 60 days until 120 days after transplanting (Figure 1c). All treatments had no significant effect on sap natrium concentration at 60 days, 90 days and 120 days after transplanting.
Schrage (1990) reported that nitrate concentration in plant-sap decreases from one growth stage to the next and it was generally higher in petioles than in the lamina of the same leaf. Diurnal variation of the nitrate concentration in leaf lamina was reported to be greater than the variation in the petiole.
(a) (b) (c) Figure 1. Effect of different potassium levels on petioles sap (a) nitrate concentration (b) potassium
concentration and (c) natrium concentration
Lamina sap nitrate, potassium and natrium
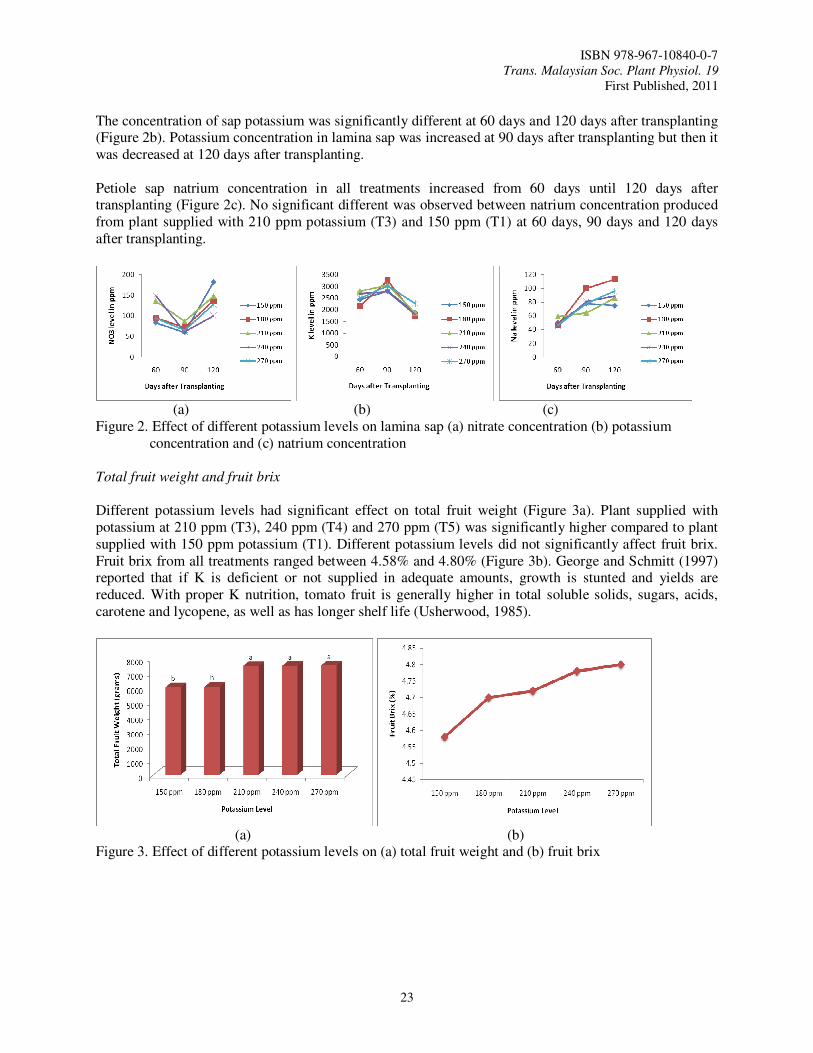
Different potassium levels supplied to the plant significantly affected lamina sap nitrate concentration (Figure 2a). At 60 days after transplanting, sap nitrate concentration in plant supplied with 240 ppm (T4) and 210 ppm (T3) potassium was significantly higher as compared to that due to treatment with 150 ppm potassium (T1). However, treatments had no significant effect on lamina sap nitrate concentration at 90 days after transplanting. Plant supplied with 150 ppm potassium (T1) produced the highest concentration of sap nitrate (182 ppm) and it was significantly different from that of other treatments.
ISBN 978-967-10840-0-7 Trans. Malaysian Soc. Plant Physiol. 19
First Published, 2011
23
The concentration of sap potassium was significantly different at 60 days and 120 days after transplanting (Figure 2b). Potassium concentration in lamina sap was increased at 90 days after transplanting but then it was decreased at 120 days after transplanting. Petiole sap natrium concentration in all treatments increased from 60 days until 120 days after transplanting (Figure 2c). No significant different was observed between natrium concentration produced from plant supplied with 210 ppm potassium (T3) and 150 ppm (T1) at 60 days, 90 days and 120 days after transplanting.
(a) (b) (c) Figure 2. Effect of different potassium levels on lamina sap (a) nitrate concentration (b) potassium
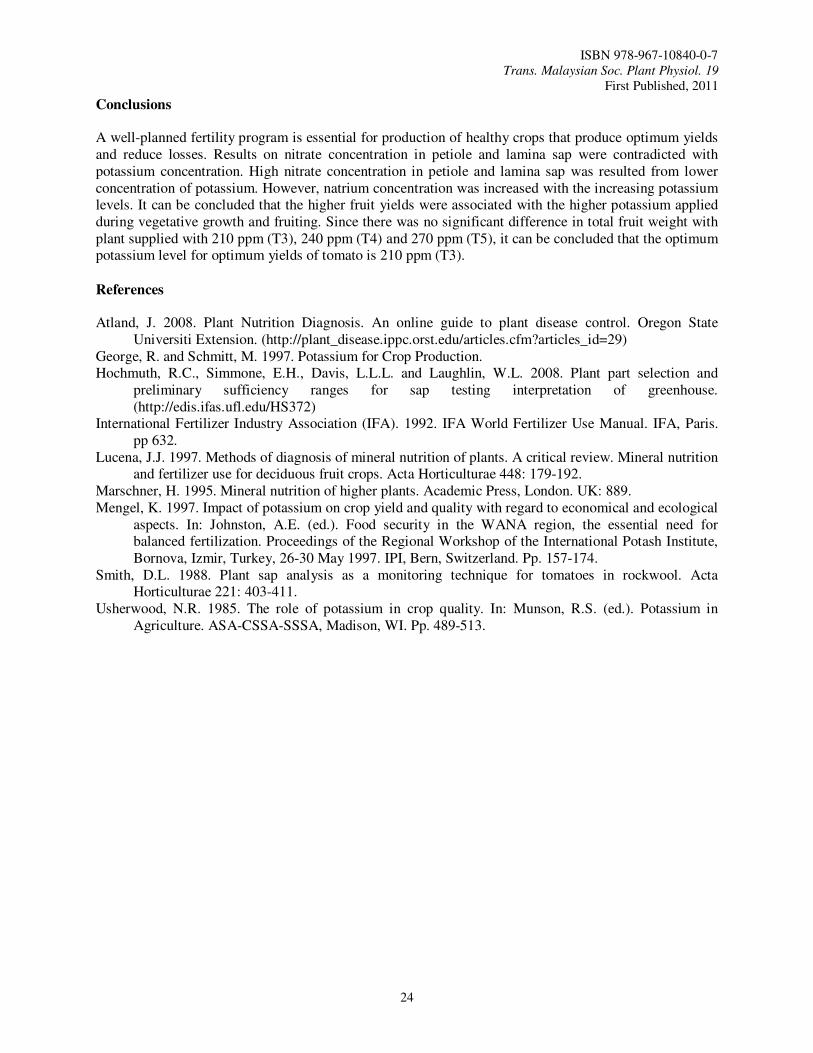
concentration and (c) natrium concentration Total fruit weight and fruit brix
Different potassium levels had significant effect on total fruit weight (Figure 3a). Plant supplied with potassium at 210 ppm (T3), 240 ppm (T4) and 270 ppm (T5) was significantly higher compared to plant supplied with 150 ppm potassium (T1). Different potassium levels did not significantly affect fruit brix. Fruit brix from all treatments ranged between 4.58% and 4.80% (Figure 3b). George and Schmitt (1997) reported that if K is deficient or not supplied in adequate amounts, growth is stunted and yields are reduced. With proper K nutrition, tomato fruit is generally higher in total soluble solids, sugars, acids, carotene and lycopene, as well as has longer shelf life (Usherwood, 1985).
(a) (b) Figure 3. Effect of different potassium levels on (a) total fruit weight and (b) fruit brix
ISBN 978-967-10840-0-7 Trans. Malaysian Soc. Plant Physiol. 19
First Published, 2011
24
Conclusions
A well-planned fertility program is essential for production of healthy crops that produce optimum yields and reduce losses. Results on nitrate concentration in petiole and lamina sap were contradicted with potassium concentration. High nitrate concentration in petiole and lamina sap was resulted from lower concentration of potassium. However, natrium concentration was increased with the increasing potassium levels. It can be concluded that the higher fruit yields were associated with the higher potassium applied during vegetative growth and fruiting. Since there was no significant difference in total fruit weight with plant supplied with 210 ppm (T3), 240 ppm (T4) and 270 ppm (T5), it can be concluded that the optimum potassium level for optimum yields of tomato is 210 ppm (T3).
References
Atland, J. 2008. Plant Nutrition Diagnosis. An online guide to plant disease control. Oregon State
Universiti Extension. (http://plant_disease.ippc.orst.edu/articles.cfm?articles_id=29) George, R. and Schmitt, M. 1997. Potassium for Crop Production. Hochmuth, R.C., Simmone, E.H., Davis, L.L.L. and Laughlin, W.L. 2008. Plant part selection and
preliminary sufficiency ranges for sap testing interpretation of greenhouse. (http://edis.ifas.ufl.edu/HS372)
International Fertilizer Industry Association (IFA). 1992. IFA World Fertilizer Use Manual. IFA, Paris. pp 632.
Lucena, J.J. 1997. Methods of diagnosis of mineral nutrition of plants. A critical review. Mineral nutrition and fertilizer use for deciduous fruit crops. Acta Horticulturae 448: 179-192.
Marschner, H. 1995. Mineral nutrition of higher plants. Academic Press, London. UK: 889. Mengel, K. 1997. Impact of potassium on crop yield and quality with regard to economical and ecological
aspects. In: Johnston, A.E. (ed.). Food security in the WANA region, the essential need for balanced fertilization. Proceedings of the Regional Workshop of the International Potash Institute, Bornova, Izmir, Turkey, 26-30 May 1997. IPI, Bern, Switzerland. Pp. 157-174.
Smith, D.L. 1988. Plant sap analysis as a monitoring technique for tomatoes in rockwool. Acta Horticulturae 221: 403-411.
Usherwood, N.R. 1985. The role of potassium in crop quality. In: Munson, R.S. (ed.). Potassium in Agriculture. ASA-CSSA-SSSA, Madison, WI. Pp. 489-513.
ISBN 978-967-10840-0-7 Trans. Malaysian Soc. Plant Physiol. 19
First Published, 2011
25
Effects on Growth Performance of 13 Years Old Aquilaria malaccensis
(Karas) Interplanted with Azadirachta excelsa (Sentang)
Lok, E.H.* and Ahmad Zuhaidi, Y.
Forest Plantation Program, Division of Biotechnology, Forest Research Institute of Malaysia (FRIM) 52109 Kepong, Selangor, Malaysia. *E-mail: [email protected]
Introduction
Karas or Aquilaria/Gyrinops tree produces one of the most after sought and valued fragrant non-wood product-so called gaharu or agarwood (Lim et al., 2008). Currently, these species generate a lot of interests and a significant development in the establishment of relatively large ex-situ cultivation of Aquilaria (Karas tree) as a forest plantation or farm crop (Lok and Ahmad Zuhaidi, 2009). Due to indiscriminate felling and illegal collection of gaharu or agarwood, all Aquilaria/Gyrinops species are now classified in Appendix II which are endangered under Convention on International Trade of Threatened, Endangered Species of Wild Fauna and Flora (CITES) (Oldfield et al., 1998). Concurrently, the strong global demand has also supported the planting of Aquilaria/Gyrinops, as this had been recognised as an integral part of sustainable forest management, conservation and complementary to natural forest protection. At present, over 1,500 hectares of Aquilaria plantation have been established throughout Malaysia, all aiming towards the production of agarwood, oil and other high value added products for healthcare, pharmaceutical and cosmetic purposes (Burkill, 1966; Dawend et al., 2005; Lok and Ahmad Zuhaidi, 2010). The expected rotation cycle would be between 4 to 8 years old depending on the species management, growth, site suitability and effective inducement technique applications. In Malaysia, the main gaharu producing species of Aquilaria comprises of A. malaccensis, A. hirta, A.
beccariana, A microcarpa and A. rostrata. (Barden et al., 2000; Burkill, 1966). These trees description and timber uses are as described by Wyatt-Smith (1952), Ng and Tang (1974), Corner (1988) and Noraini (1997).
Reports on successful cultivation techniques and management on Aquilaria are scarce and there is an urgent need for intensive research, particularly related to A. malaccensis (Karas). This species is fast growing and easily adaptable to various environment and soil conditions. Due to economic reasons, some other tree crops are also recommended such as in the form of agro-forestry practices, whereby inter-planting are applied to promote maximisation of land use and optimal growth and to enhance sustainable production and supply of agarwood. Hence, this paper aims to determine and provide some considerations on the effects of inter-planting with other potential tree crops.
Materials and Methods
A field trial F 44D (1 ha) was established in May 1997, located at about 3o 14’ N and 101o 38’ E. The mean daily temperature ranges from 27 to 30 oC and has an annual rainfall between 2000 to 2900 mm. Karas or A. malaccensis was alternately line-interplanted with Azadirachta excelsa (Sentang) at a distance of 3 m x 3 m. A total of about 1100 trees/ha was used. They are located at the lower slope of the lower ridge of Bukit Hari, Selangor at an altitude of 200-220 m above sea-level. The soil is of Rengam Series with heavy clay loam of granitic origin, reddish brown and with average pH of 4.5. Weeding and fertilizer application using NPK 15:15:15 at 200 g/plant was given twice yearly. Data collected were average survival rates, diameter, height increment and number of stems for both the species at the site. Variations in growth performance between the species were based on the observations of the stands and the physiology capability of the trees to compete between species.
ISBN 978-967-10840-0-7 Trans. Malaysian Soc. Plant Physiol. 19
First Published, 2011
26
Results and Discussion
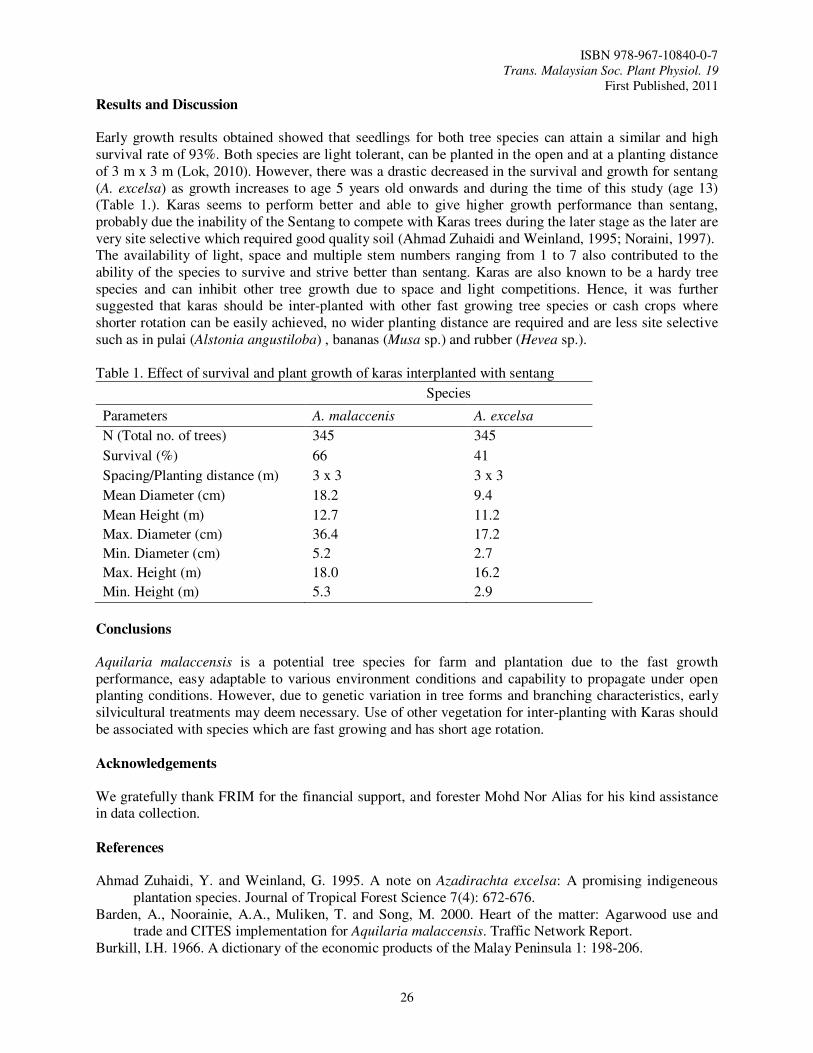
Early growth results obtained showed that seedlings for both tree species can attain a similar and high survival rate of 93%. Both species are light tolerant, can be planted in the open and at a planting distance of 3 m x 3 m (Lok, 2010). However, there was a drastic decreased in the survival and growth for sentang (A. excelsa) as growth increases to age 5 years old onwards and during the time of this study (age 13) (Table 1.). Karas seems to perform better and able to give higher growth performance than sentang, probably due the inability of the Sentang to compete with Karas trees during the later stage as the later are very site selective which required good quality soil (Ahmad Zuhaidi and Weinland, 1995; Noraini, 1997). The availability of light, space and multiple stem numbers ranging from 1 to 7 also contributed to the ability of the species to survive and strive better than sentang. Karas are also known to be a hardy tree species and can inhibit other tree growth due to space and light competitions. Hence, it was further suggested that karas should be inter-planted with other fast growing tree species or cash crops where shorter rotation can be easily achieved, no wider planting distance are required and are less site selective such as in pulai (Alstonia angustiloba) , bananas (Musa sp.) and rubber (Hevea sp.). Table 1. Effect of survival and plant growth of karas interplanted with sentang
Species
Parameters A. malaccenis A. excelsa
N (Total no. of trees) 345 345
Survival (%) 66 41
Spacing/Planting distance (m) 3 x 3 3 x 3
Mean Diameter (cm) 18.2 9.4
Mean Height (m) 12.7 11.2
Max. Diameter (cm) 36.4 17.2
Min. Diameter (cm) 5.2 2.7
Max. Height (m) 18.0 16.2
Min. Height (m) 5.3 2.9
Conclusions
Aquilaria malaccensis is a potential tree species for farm and plantation due to the fast growth performance, easy adaptable to various environment conditions and capability to propagate under open planting conditions. However, due to genetic variation in tree forms and branching characteristics, early silvicultural treatments may deem necessary. Use of other vegetation for inter-planting with Karas should be associated with species which are fast growing and has short age rotation.
Acknowledgements
We gratefully thank FRIM for the financial support, and forester Mohd Nor Alias for his kind assistance in data collection.
References
Ahmad Zuhaidi, Y. and Weinland, G. 1995. A note on Azadirachta excelsa: A promising indigeneous
plantation species. Journal of Tropical Forest Science 7(4): 672-676. Barden, A., Noorainie, A.A., Muliken, T. and Song, M. 2000. Heart of the matter: Agarwood use and
trade and CITES implementation for Aquilaria malaccensis. Traffic Network Report. Burkill, I.H. 1966. A dictionary of the economic products of the Malay Peninsula 1: 198-206.
ISBN 978-967-10840-0-7 Trans. Malaysian Soc. Plant Physiol. 19
First Published, 2011
27
Corner, E.J.H. 1988. Wayside Trees of Malaya. Malayan Nature Society. United Selangor Press, Kuala Lumpur, Malaysia. Pp. 503-504.
Dawend, J., Make, J., Philip, L., Tan, S. and Franklin, R.K. 2005. System approach on sustainable gaharu conservation in Sarawak: An overview. Paper submitted for presentation at the International Seminar on Synergistic Approach to Appropriate Forestry Technology for Sustaining Rainforest Ecosystems, 7-9 March 2005, Universiti Putra Malaysia, Bintulu campus, Sarawak, Malaysia.
Lim, H.F., Mohd Parid, M. and Chang, Y.S. 2008. Local gaharu trade and its contribution to household economy of harvesting. FRIM Report No. 88.
Lok, E.H. 2010. Sistem penanaman pokok Aquilaria dan agronominya. FRIM Report. No. 93. Pp. 17-18. Lok, E.H. and Ahmad Zuhaidi, Y. 2010. Tree farming for Karas. FRIM in Focus. September, 2010 Issue:
6-7. Lok, E.H. and Ahmad Zuhaidi, Y. 2009. Ex-situ cultivation of Aquilaria malaccensis (Karas) as a
potential forest plantation species and its economic importance. Proceedings of the National Conference on New Crops and Bio-Resources, The Royale Bintang Resort & Spa, Seremban, Negeri Sembilan, 15-17 December 2009. Pp. 170-172.
Ng, F.S.P. and Tang, H.T. 1974. Comparative growth rates of Malaysian trees. Malaysian Forester 37(1): 2-23.
Noraini, A. 1997. Azadirachta excelsa. In: Noraini, A. (ed.) A Monograph Research Pamphlet No. 120. Forest Research Institute Malaysia. Pp. 1-16.
Oldfield, S., Lusty, C. and MacKinven, A. 1998. The world list of threatened trees. In: Barden, A., Noorainie, A.A., Mulliken, T. and Song, M. (eds.). Heart of the matter: Agarwood use and trade and CITES implementation for Aquilaria malaccensis. TRAFFIC International.
Wyatt-Smith, J. 1952. Pocket checklist of timber trees. Malayan Forest Records No.17. 251 pp.
ISBN 978-967-10840-0-7 Trans. Malaysian Soc. Plant Physiol. 19
First Published, 2011
28
Physical and Cellular Structure Changes of Rastali Banana (Musa AAB
Rastali) During Growth and Development
Tee, Y.K.1, Ding, P.
1*, Nor Aini, A.R.
2
1Department of Crop Science and 2 Department of Biochemistry, Universiti Putra Malaysia, 43400 UPM Serdang, Selangor, Malaysia. *E-mail: [email protected]
Introduction
In Malaysia, Rastali banana is one of the favorite dessert bananas that have a good potential for export. Rastali banana has a special and unique taste usually consumed as dessert. Rastali banana has slight astringency taste as compared to other variety of banana which makes it the trademark for Rastali banana (Osman et al., 1998). Rastali banana is priced high in all parts of India where it is cultivated (Radha and Matthew, 2007). So, this variety has a bright future in the local and world market as premium dessert variety like Cavendish banana. In order to obtain the best final quality of fruit and have sufficient shelf life for marketing, it is necessary to be precise in determining the harvest maturity (Kader, 2003) during fruit growth and development so that we can know the best time to harvest.
Materials and Methods
Fruit bunches of Rastali bananas were obtained from university experimental field. Observations started once the inflorescence emerged from banana plant. Fruits were tagged and bagged with a blue plastic bag once the first hand (basal fruit at the top) emerged and was considered as day 1 (D1). Fruit development stages were dated at weekly intervals, beginning from the first until 12th weeks after the first hand emergence. Hands were numbered from the top of bunch to the bottom (hand 1: basal fruit at the top; hand 6: distal hand at the bottom) and only six hands of bananas were used in this study. Fruit fingers were measured for their length, diameter and fresh weight. Fruit length was measured from the stem end to the proximal end using a measuring tape. Fruit diameter was measured using a digital caliper (MO 34260001, 1-125 mm, Vernier, Japan) while fruit fresh weight was measured using an electronic balance (BP 2100, Sartorius, Germany). Flesh firmness was evaluated using a penetrometer (model FT 327, Bishop, Italy). Fruit tissues of 0.5 cm x 0.5 cm x 0.5 cm were fixed in formaldehyde-alcohol-acetic acid and processed for light microscopy (LM) according to Sass (1958) method. The experimental design was a randomized complete block design with three replications. Each individual tree including 6 hands with 3 fingers per hand was considered as a replication. Data was analyzed using ANOVA (SAS, V9) and means separation was carried out using Duncan’s Multiple Range Test. Regression analysis was carried out to describe the relationship between physical characteristics as fruit matured.
Results and Discussion
Rastali banana exhibited a significant (P≤ 0.05) sigmoid type of growth pattern as measured by fruit fresh weight (R2 = 0.88) and morphological characters such as length and diameter (R2 = 0.86) (Figures 1 and 2) during fruit development.
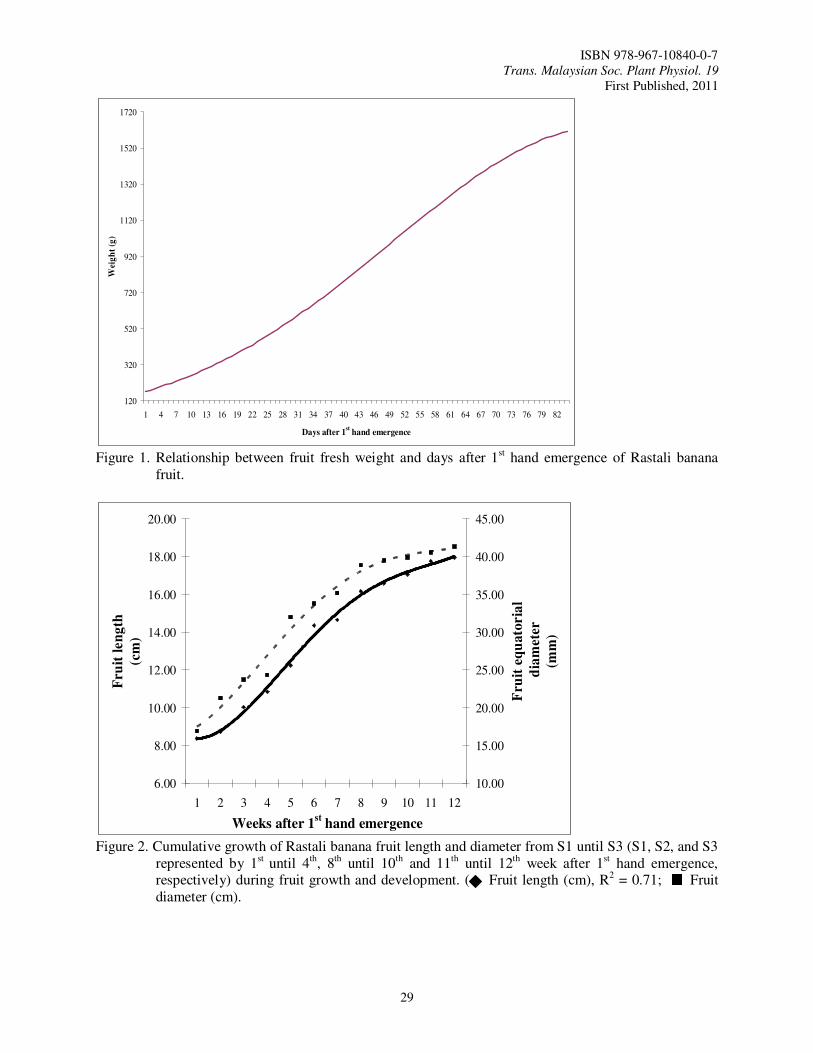
ISBN 978-967-10840-0-7 Trans. Malaysian Soc. Plant Physiol. 19
First Published, 2011
29
120
320
520
720
920
1120
1320
1520
1720
1 4 7 10 13 16 19 22 25 28 31 34 37 40 43 46 49 52 55 58 61 64 67 70 73 76 79 82
Days after 1st hand emergence
Wei
gh
t (g
)
Figure 1. Relationship between fruit fresh weight and days after 1st hand emergence of Rastali banana
fruit.
6.00
8.00
10.00
12.00
14.00
16.00
18.00
20.00
1 2 3 4 5 6 7 8 9 10 11 12
Weeks after 1st hand emergence
Fru
it l
en
gth
(cm
)
10.00
15.00
20.00
25.00
30.00
35.00
40.00
45.00F
ruit
eq
ua
toria
l
dia
met
er
(mm
)
Figure 2. Cumulative growth of Rastali banana fruit length and diameter from S1 until S3 (S1, S2, and S3
represented by 1st until 4th, 8th until 10th and 11th until 12th week after 1st hand emergence, respectively) during fruit growth and development. ( Fruit length (cm), R2 = 0.71; Fruit diameter (cm).
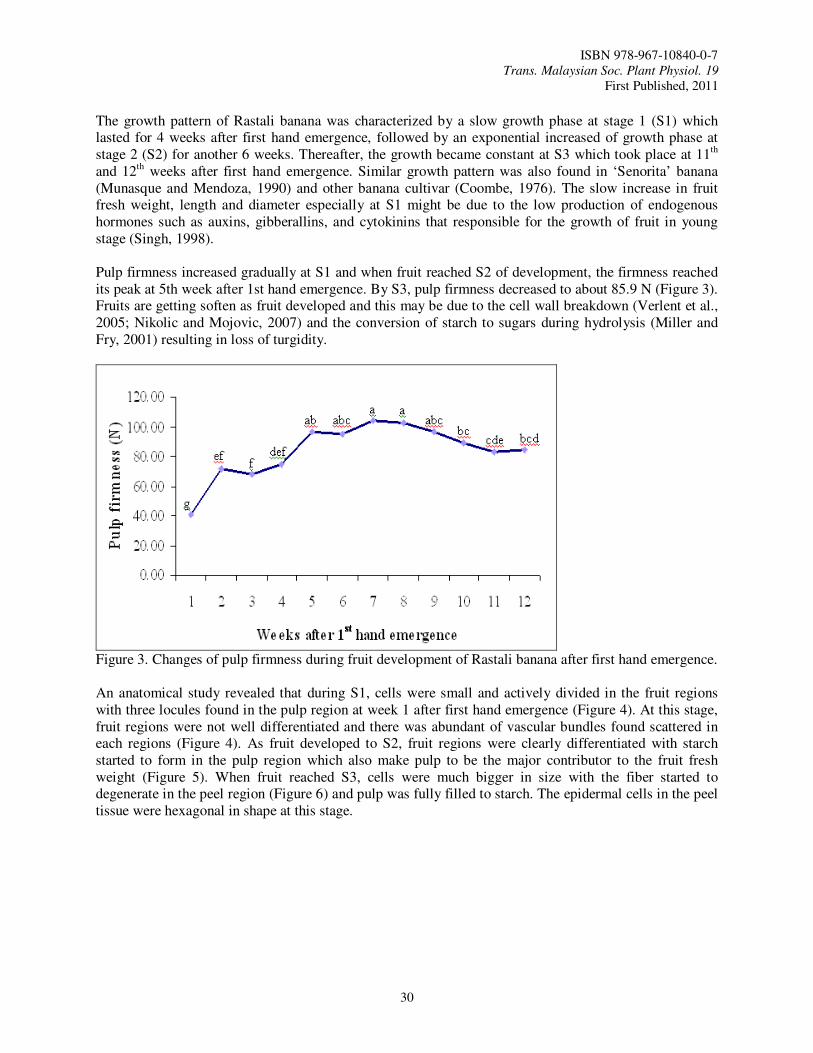
ISBN 978-967-10840-0-7 Trans. Malaysian Soc. Plant Physiol. 19
First Published, 2011
30
The growth pattern of Rastali banana was characterized by a slow growth phase at stage 1 (S1) which lasted for 4 weeks after first hand emergence, followed by an exponential increased of growth phase at stage 2 (S2) for another 6 weeks. Thereafter, the growth became constant at S3 which took place at 11th and 12th weeks after first hand emergence. Similar growth pattern was also found in ‘Senorita’ banana (Munasque and Mendoza, 1990) and other banana cultivar (Coombe, 1976). The slow increase in fruit fresh weight, length and diameter especially at S1 might be due to the low production of endogenous hormones such as auxins, gibberallins, and cytokinins that responsible for the growth of fruit in young stage (Singh, 1998).
Pulp firmness increased gradually at S1 and when fruit reached S2 of development, the firmness reached its peak at 5th week after 1st hand emergence. By S3, pulp firmness decreased to about 85.9 N (Figure 3). Fruits are getting soften as fruit developed and this may be due to the cell wall breakdown (Verlent et al., 2005; Nikolic and Mojovic, 2007) and the conversion of starch to sugars during hydrolysis (Miller and Fry, 2001) resulting in loss of turgidity.
Figure 3. Changes of pulp firmness during fruit development of Rastali banana after first hand emergence.
An anatomical study revealed that during S1, cells were small and actively divided in the fruit regions with three locules found in the pulp region at week 1 after first hand emergence (Figure 4). At this stage, fruit regions were not well differentiated and there was abundant of vascular bundles found scattered in each regions (Figure 4). As fruit developed to S2, fruit regions were clearly differentiated with starch started to form in the pulp region which also make pulp to be the major contributor to the fruit fresh weight (Figure 5). When fruit reached S3, cells were much bigger in size with the fiber started to degenerate in the peel region (Figure 6) and pulp was fully filled to starch. The epidermal cells in the peel tissue were hexagonal in shape at this stage.
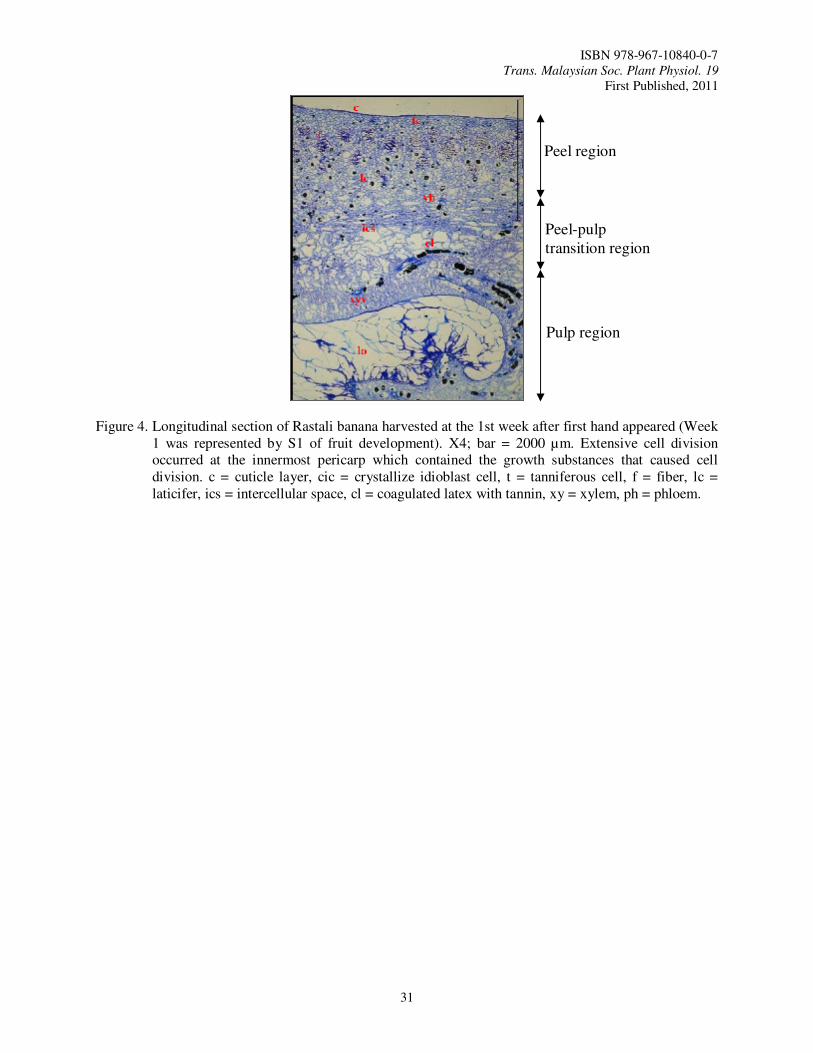
ISBN 978-967-10840-0-7 Trans. Malaysian Soc. Plant Physiol. 19
First Published, 2011
31
Figure 4. Longitudinal section of Rastali banana harvested at the 1st week after first hand appeared (Week 1 was represented by S1 of fruit development). X4; bar = 2000 µm. Extensive cell division occurred at the innermost pericarp which contained the growth substances that caused cell division. c = cuticle layer, cic = crystallize idioblast cell, t = tanniferous cell, f = fiber, lc = laticifer, ics = intercellular space, cl = coagulated latex with tannin, xy = xylem, ph = phloem.
Peel region
Peel-pulp
transition region
Pulp region
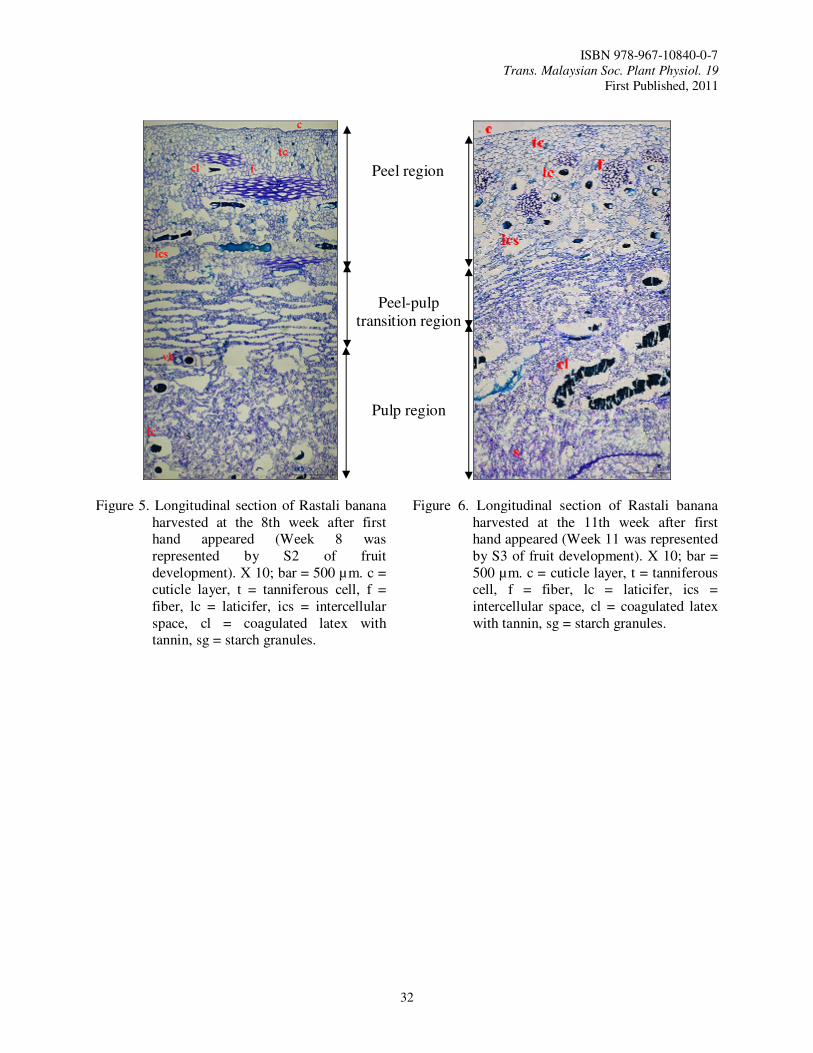
ISBN 978-967-10840-0-7 Trans. Malaysian Soc. Plant Physiol. 19
First Published, 2011
32
Figure 5. Longitudinal section of Rastali banana harvested at the 8th week after first hand appeared (Week 8 was represented by S2 of fruit development). X 10; bar = 500 µm. c = cuticle layer, t = tanniferous cell, f = fiber, lc = laticifer, ics = intercellular space, cl = coagulated latex with tannin, sg = starch granules.
Figure 6. Longitudinal section of Rastali banana harvested at the 11th week after first hand appeared (Week 11 was represented by S3 of fruit development). X 10; bar = 500 µm. c = cuticle layer, t = tanniferous cell, f = fiber, lc = laticifer, ics = intercellular space, cl = coagulated latex with tannin, sg = starch granules.
Peel region
Peel-pulp transition region
Pulp region
ISBN 978-967-10840-0-7 Trans. Malaysian Soc. Plant Physiol. 19
First Published, 2011
33
Conclusions In summary, changes of Rastali banana in quality traits were in general similar to those reported for other banana cultivars. Fresh weight of Rastali banana and other morphological traits such as fruit length and diameter exhibited sigmoidal growth pattern during fruit growth and development. The study of Rastali banana fruit development and quality traits changes provides a great deal of information for further research work within these areas of study.
References Coombe, B.G. 1976. The development of fleshy fruits. Annual Review of Plant Physiology 27: 507-
528. Kader, A.A. 2003. Quality parameters of fresh cut final fruit and vegetable products, In: Lamikanra,
O. (Ed.), Fresh Cut Fruits and Vegetables: Science, Technology, and Market, CRC Press, Boca Raton, USA, pp. 11.
Miller, J.G. and Fry, S.C. 2001. Characteristics of xyloglucan after attack by hydroxyl radicals. Carbohydrate Research 332: 389-403.
Munasque, V.S. and Mendoza, D.B. Jr. 1990. Developmental physiology and ripening behavior of ‘Senorita’ banana (Musa sp. L.) fruits. ASEAN Food Journal 5(4): 152-157.
Nikolic, M.V. and Mojovic, L. 2007. Hydrolysis of apple pectin by the coordinated activity of pectic enzymes. Food Chemistry 101: 1-9.
Osman, A., Nik Saad, N.S., and Mohamed, S. 1998. Comparing the physicochemical characteristics of Mas, Rastali and Berangan bananas at 3 stages of maturity. Proceeding of the 1st National Banana Seminar, Awana Genting Golf and Resort. 23-25 November 1998.
Radha, T. and Matthew, L. 2007. Fruit Crops. Horticultural Science Series Vol. 3. New India Publishing Agency. India, pp. 34-35.
Sass, J.E. 1985. Botanical microtechnique. Iowa State U.P., United States. Singh, R. 1998. Fruits, National Book Trust of India. Green Park, New Delhi. Verlent, I., Smout, C., Duvetter, T., Hendrickx, M.E. and van Loey, A. 2005. Effect of temperature
and pressure on the activity of purified tomato polygalacturonase in the presence of pectins with different patterns of methyl esterification. Innovative Food Science & Emerging Technologies 6: 293-303.
ISBN 978-967-10840-0-7 Trans. Malaysian Soc. Plant Physiol. 19
First Published, 2011
34
CHAPTER 2
POSTHARVEST TECHNOLOGY
AND QUALITY CONTROL
ISBN 978-967-10840-0-7 Trans. Malaysian Soc. Plant Physiol. 19
First Published, 2011
35
Growth Performance and Nutrient Concentration of ‘Hijau’ Lemongrass
(Cymbopogon citratus) as Affected by Maturity Stages at Harvest
Tajidin, N.E.1,*
, Ahmad, S.H.1, Rosenani, A.B.
2 and Munirah, M.
1 1Department of Crop Science and 2Department of Land Management, Faculty of Agriculture, Universiti Putra Malaysia, 43400 UPM, Serdang, Selangor, Malaysia. *E-mail: [email protected]
Introduction
Cymbopogon citratus, or lemongrass belongs to the Graminae family. In Asia, stalk of lemongrass is used as food flavoring. In 2006, Malaysia exported 12 tons ‘Hijau’ lemongrass to Europe (Azlina, 2008). It is highly demanded due to its thick diameter and long stalk-length after trimming the upper leaves at harvest. However, farmers find it difficult to produce consistent stalk diameter and length due to lack of information on growth performance, nutrient requirement and harvest time of the lemongrass. Plant growth is the process by which a plant increases in the number and size of leaves and stems (Quiala et al., 2006) and it is influenced by temperature, light intensity, soil moisture, fertilizer and maturity stage (Miyazaki, 1965). Plant growth and development are also controlled by internal regulators that are modified according to environmental conditions (Manske, 2004). Agronomic practices such as optimum harvesting stage of lemongrass for maximum growth performance have not been studied in Malaysia. The objective of this study was to determine the growth performance and nutrient concentration of lemongrass as affected by maturity stages at harvest.
Materials and Methods
‘Hijau’ lemongrass was planted at the Universiti Agricultural Park, UPM, using a randomized complete block design on plots of 4 m x 4 m each with 16 planting points on each plot. Each point was planted with 4 planting stalks at a plant distance of 100 cm x 100 cm. Fertilizer at the rate of 300 kg N/ha, 100 kg P2O5/ha and 50 kg K2O/ha was applied around each clump at 1.5, 2.5, and 3.5 months after planting. The lemongrass was harvested at 5.5, 6.5, and 7.5 months after planting. The fresh weight of each clump was obtained and number of tillers was counted. Then, the tillers were separated into marketable (> 12 mm), medium (8-12 mm) and small (< 8mm) tillers. Tiller diameter was determined based on measurement at mid-point of leaf-stalk. Total dry weight was determined after drying the tillers at 70oC for 48 hours. Dried samples were ground to <1mm size to determine total N using Kjeldhal method. Total K, P, Ca and Mg were each determined using an Auto Analyzer.
Results and Discussion
Effects of maturity stages on plant fresh and dry weight and yield of tillers
There were no significant differences (P≤0.05) in plant fresh and dry weight when lemongrass was harvested at 5.5, 6.5 and 7.5 months after planting (Table 1). These indicated that maturity stages at harvest did not affect fresh and dry weights of lemongrass. Weight of total tillers of lemongrass harvested at 7.5 months was higher compared to tillers harvested at 6.5 and 5.5 months after planting (Table 2). Number of tillers per clump was also not significantly different at the different maturity stages. When harvested at 7.5 months, there was, however, significantly higher yield of marketable tillers compared to those harvested at 6.5 and 5.5 months (Table 2). There was a significant positive (P≤0.05) quadratic relationship between % marketable tillers and maturity stages of lemongrass at harvest, but there were negative (P≤0.05) quadratic relationships between % medium or small tillers and maturity stage (Figure 1A). In lemongrass, the fresh weight of the plant is dominated by the leaves that are produced in the form of tillers. Increase in rate of tillering as the plant becomes mature will definitely increase the leaf production and directly increase the plant fresh weight. Tillering increases in a sigmoidal-shaped curve until the maximum tiller number is reached where the main
ISBN 978-967-10840-0-7 Trans. Malaysian Soc. Plant Physiol. 19
First Published, 2011
36
culms may be difficult to be distinguished from the tillers. When the maximum tillering has occurred, no more effective tillers are produced and the late tillers will generally die due to competition effects (Moldenhauer and Slaton, 2006). Taiz and Zeiger (1998) also stated that reduction in leaf production rate of a plant was a kind of senescence which occurred as the plant reached a certain age. Table 1. Effects of maturity stages at harvest on fresh and dry weight, and leaf-sheath and stalk of
lemongrass (MOPz = Months of planting)
Maturity at harvest (MOPz) Plant fresh weight (tonne/ha) Plant dry weight (tonne/ha)
5.5 38.13a 9.72a 6.5 45.56a 8.57a 7.5 40.69a 7.60a
Means with the same letter are not significantly different at 5% level of significance.
Table 2. Effects of maturity stages at harvest on weight and number of total tillers and yield of
marketable tillers of lemongrass. (MOPz = Months of planting)
Maturity at harvest (MOPz)
Total tillers Yield of marketable tillers (tonne/ha)
Weight (tone/ha)
Number of tillers /clump
5.5 12.71b 99.69a 3.80c
6.5 16.53b 99.38a 7.64b 7.5 22.90a 114.63a 12.58a
Means with the same letter are not significantly different at 5% level of significance.
Effects of maturity stages on plant height, leaf sheath and stalk length
There was a significant (P≤0.05) positive quadratic relationship between plant height of lemongrass and maturity stages at harvest (Figure 1B). Plant height was increased with the increase in maturity stages. There were significant (P≤0.05) differences between leaf sheath and stalk length of lemongrass when harvested at different maturity stages. Leaf sheath was longer when lemongrass was harvested at 7.5 months compared to 5.5 and 6.5 months. However, leaf stalk length was higher when plants were harvested at 6.5 and 7.5 months compared harvesting at 5.5 months. The plants became taller due to longitudinal growth of tillers resulting from the elongation of the cells. In this study, both lemongrass plant height and leaf-sheath length increased as maturity stages increased. The increase in length of leaf- sheath and stalk contributed to the increase in plant height. The increase in plant height was also reported to be influenced by rate of nutrients applied to the plants. Plant height of patchouli increased by 84% due to application of nitrogen at the rate of 200 kg/ha compared to 0 and 100 kg N/ha (Singh and Rao, 2009).
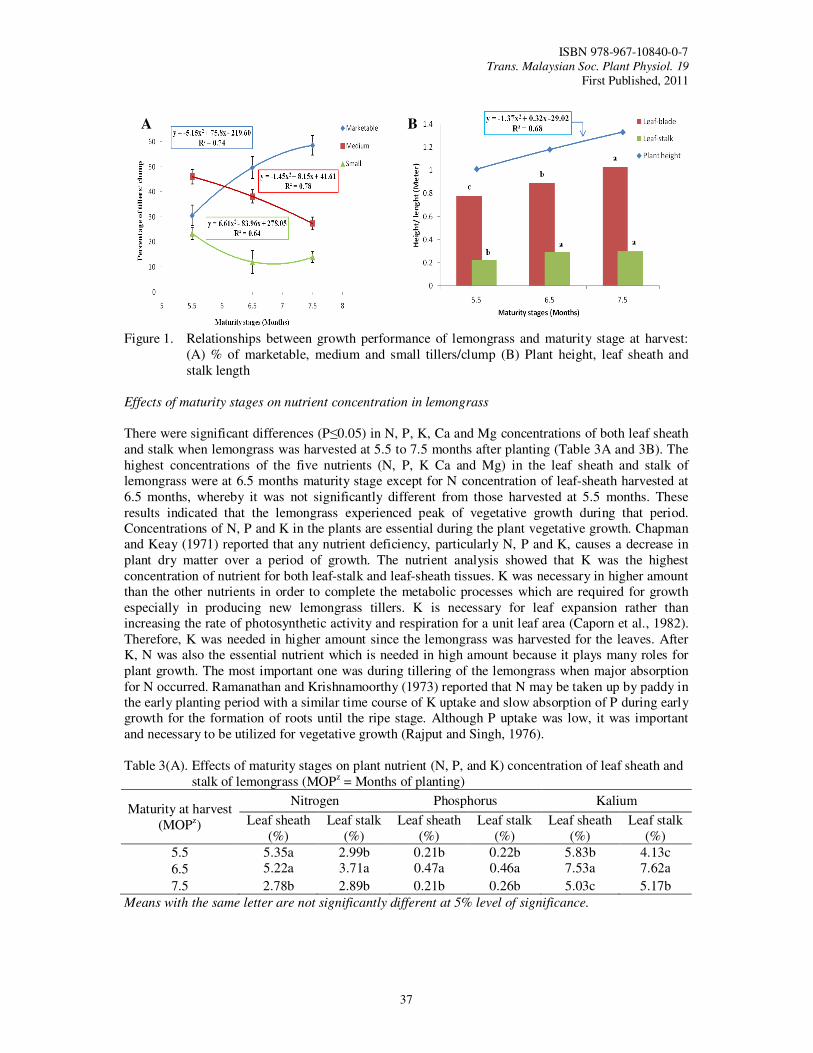
ISBN 978-967-10840-0-7 Trans. Malaysian Soc. Plant Physiol. 19
First Published, 2011
37
Figure 1. Relationships between growth performance of lemongrass and maturity stage at harvest:
(A) % of marketable, medium and small tillers/clump (B) Plant height, leaf sheath and stalk length
Effects of maturity stages on nutrient concentration in lemongrass
There were significant differences (P≤0.05) in N, P, K, Ca and Mg concentrations of both leaf sheath and stalk when lemongrass was harvested at 5.5 to 7.5 months after planting (Table 3A and 3B). The highest concentrations of the five nutrients (N, P, K Ca and Mg) in the leaf sheath and stalk of lemongrass were at 6.5 months maturity stage except for N concentration of leaf-sheath harvested at 6.5 months, whereby it was not significantly different from those harvested at 5.5 months. These results indicated that the lemongrass experienced peak of vegetative growth during that period. Concentrations of N, P and K in the plants are essential during the plant vegetative growth. Chapman and Keay (1971) reported that any nutrient deficiency, particularly N, P and K, causes a decrease in plant dry matter over a period of growth. The nutrient analysis showed that K was the highest concentration of nutrient for both leaf-stalk and leaf-sheath tissues. K was necessary in higher amount than the other nutrients in order to complete the metabolic processes which are required for growth especially in producing new lemongrass tillers. K is necessary for leaf expansion rather than increasing the rate of photosynthetic activity and respiration for a unit leaf area (Caporn et al., 1982). Therefore, K was needed in higher amount since the lemongrass was harvested for the leaves. After K, N was also the essential nutrient which is needed in high amount because it plays many roles for plant growth. The most important one was during tillering of the lemongrass when major absorption for N occurred. Ramanathan and Krishnamoorthy (1973) reported that N may be taken up by paddy in the early planting period with a similar time course of K uptake and slow absorption of P during early growth for the formation of roots until the ripe stage. Although P uptake was low, it was important and necessary to be utilized for vegetative growth (Rajput and Singh, 1976).
Table 3(A). Effects of maturity stages on plant nutrient (N, P, and K) concentration of leaf sheath and
stalk of lemongrass (MOPz = Months of planting)
Maturity at harvest (MOPz)
Nitrogen Phosphorus Kalium
Leaf sheath (%)
Leaf stalk (%)
Leaf sheath (%)
Leaf stalk (%)
Leaf sheath (%)
Leaf stalk (%)
5.5 5.35a 2.99b 0.21b 0.22b 5.83b 4.13c
6.5 5.22a 3.71a 0.47a 0.46a 7.53a 7.62a
7.5 2.78b 2.89b 0.21b 0.26b 5.03c 5.17b
Means with the same letter are not significantly different at 5% level of significance.
B A
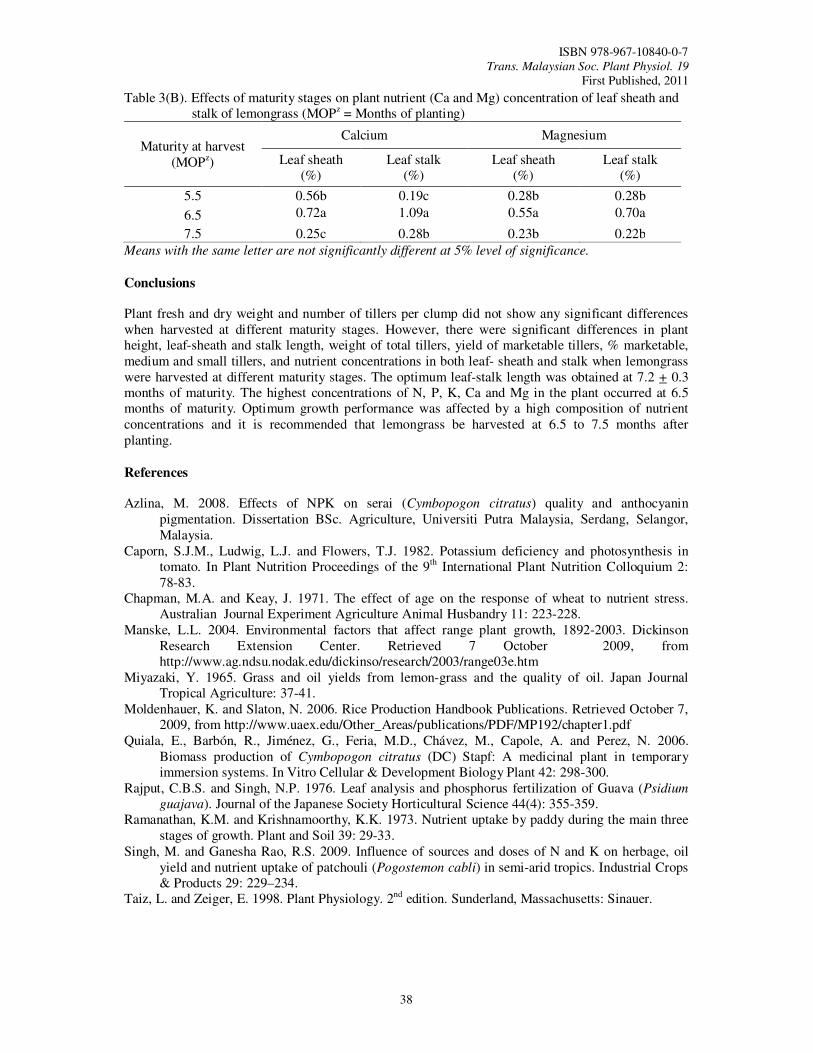
ISBN 978-967-10840-0-7 Trans. Malaysian Soc. Plant Physiol. 19
First Published, 2011
38
Table 3(B). Effects of maturity stages on plant nutrient (Ca and Mg) concentration of leaf sheath and stalk of lemongrass (MOPz = Months of planting)
Maturity at harvest (MOPz)
Calcium Magnesium
Leaf sheath (%)
Leaf stalk (%)
Leaf sheath (%)
Leaf stalk (%)
5.5 0.56b 0.19c 0.28b 0.28b
6.5 0.72a 1.09a 0.55a 0.70a
7.5 0.25c 0.28b 0.23b 0.22b
Means with the same letter are not significantly different at 5% level of significance.
Conclusions Plant fresh and dry weight and number of tillers per clump did not show any significant differences when harvested at different maturity stages. However, there were significant differences in plant height, leaf-sheath and stalk length, weight of total tillers, yield of marketable tillers, % marketable, medium and small tillers, and nutrient concentrations in both leaf- sheath and stalk when lemongrass were harvested at different maturity stages. The optimum leaf-stalk length was obtained at 7.2 + 0.3 months of maturity. The highest concentrations of N, P, K, Ca and Mg in the plant occurred at 6.5 months of maturity. Optimum growth performance was affected by a high composition of nutrient concentrations and it is recommended that lemongrass be harvested at 6.5 to 7.5 months after planting.
References
Azlina, M. 2008. Effects of NPK on serai (Cymbopogon citratus) quality and anthocyanin
pigmentation. Dissertation BSc. Agriculture, Universiti Putra Malaysia, Serdang, Selangor, Malaysia.
Caporn, S.J.M., Ludwig, L.J. and Flowers, T.J. 1982. Potassium deficiency and photosynthesis in tomato. In Plant Nutrition Proceedings of the 9th International Plant Nutrition Colloquium 2: 78-83.
Chapman, M.A. and Keay, J. 1971. The effect of age on the response of wheat to nutrient stress. Australian Journal Experiment Agriculture Animal Husbandry 11: 223-228.
Manske, L.L. 2004. Environmental factors that affect range plant growth, 1892-2003. Dickinson Research Extension Center. Retrieved 7 October 2009, from http://www.ag.ndsu.nodak.edu/dickinso/research/2003/range03e.htm
Miyazaki, Y. 1965. Grass and oil yields from lemon-grass and the quality of oil. Japan Journal Tropical Agriculture: 37-41.
Moldenhauer, K. and Slaton, N. 2006. Rice Production Handbook Publications. Retrieved October 7, 2009, from http://www.uaex.edu/Other_Areas/publications/PDF/MP192/chapter1.pdf
Quiala, E., Barbón, R., Jiménez, G., Feria, M.D., Chávez, M., Capole, A. and Perez, N. 2006. Biomass production of Cymbopogon citratus (DC) Stapf: A medicinal plant in temporary immersion systems. In Vitro Cellular & Development Biology Plant 42: 298-300.
Rajput, C.B.S. and Singh, N.P. 1976. Leaf analysis and phosphorus fertilization of Guava (Psidium
guajava). Journal of the Japanese Society Horticultural Science 44(4): 355-359. Ramanathan, K.M. and Krishnamoorthy, K.K. 1973. Nutrient uptake by paddy during the main three
stages of growth. Plant and Soil 39: 29-33. Singh, M. and Ganesha Rao, R.S. 2009. Influence of sources and doses of N and K on herbage, oil
yield and nutrient uptake of patchouli (Pogostemon cabli) in semi-arid tropics. Industrial Crops & Products 29: 229–234.
Taiz, L. and Zeiger, E. 1998. Plant Physiology. 2nd edition. Sunderland, Massachusetts: Sinauer.
ISBN 978-967-10840-0-7 Trans. Malaysian Soc. Plant Physiol. 19
First Published, 2011
39
Determination of Optimum Harvest Maturity and Postharvest Quality of
Rastali Banana (Musa AAB Rastali) During Fruit Ripening
Tee, Y.K. and Ding, P.* Department of Crop Science, Faculty of Agriculture, Universiti Putra Malaysia, 43400 UPM Serdang, Selangor, Malaysia. *E-mail: [email protected]
Introduction Banana (Musa sp.) belongs to the Musaceae family which is one of the popular tropical fruit grown in the world and it is the 4th most important food crop after rice, wheat and maize (FAO, 2008). In Malaysia, there is a wide variety of banana with local names of Rastali (Musa AAB), Berangan (Musa
AAA), Abu (Musa ABB), Awak (Musa ABB), Mas (Musa AA), and many more. Bananas are also one of the important fruit crops with cultivation area increased by 66.2% from 1985 to 1994 and 40% from 2000 to 2007 (Dept. of Agriculture, 2008). In order to obtain the best final quality of fruits and have sufficient shelf life for marketing, it is necessary to be precise in determining the harvest maturity. Thus, maturity at harvest is an important factor in determining the fruit shelf life. Rastali banana is known for astringency taste which cause by tannin concentration. Tannin concentration decreases as fruit achieve harvesting stage (Tee and Ding, unpublished data). However, other physicochemical changes during harvesting period may affect eating quality of ripe banana. Thus, the objectives of this study were to determine the optimum harvest period for Rastali banana using 11 and 12 weeks after first hand emergence fruits after ripening initiation.
Materials and Methods
Fruit bunches of Rastali bananas were obtained from the university experimental field. Fruits were tagged and bagged with a blue plastic bag once the first hand (basal fruit at the top) emerged and was considered as day 1 (D1). Fruit development stages were dated at weekly intervals, beginning from the 1st until 12th weeks after the first hand emergence. Hands were numbered from the top to the bottom (hand 1: basal fruit at the top; hand 6: distal hand at the bottom) and only six hands of bananas were used in this study. Banana fruits were harvested at week 11 and 12 after first hand emergence. After harvest, fruits were transported to the laboratory. Six hands of Rastali banana were dehanded and cleaned. Fruits were ripened at 25 ± 1°C using 100 mL/L of ethylene at 65% relative humidity. After 24 h, the ripening gas was released and fruits were allowed to ripen in respective condition as ripening initiation. The fruits were analyzed for peel and pulp color, pulp firmness, pH, peel and pulp moisture content, respiration rate and ethylene production on day 0, 1, 3 and 5. The peel and pulp colors were measured using a chroma meter (model CR-300, Minolta Corp., Japan) with the measurements expressed as lightness (L*), chroma (C*) and hue (h°). Flesh firmness was evaluated using a penetrometer (model FT 327, Bishop, Italy) while pH of the fruit juice was determined using a pH meter (model Micro pH 2000, Crison Instruments, Spain). Dry weights of the peel and pulp were measured using an electronic balance (BP 2100, Sartorius, Germany) and moisture content of the peel and pulp can be derived. Ethylene and CO2 productions were determined using a gas chromatography (Clarus 500, Pekin Elmer, Shelton, USA). The experiment was conducted using a randomized completely block design (RCBD) with factorial arrangement of treatments and the data were analyzed using ANOVA (SAS, V9) and means separation was carried out using Duncan’s Multiple Range Test.
Results and Discussion There were significant differences (P ≤ 0.05) observed between the interaction of 2 harvesting weeks and days after ripening (DAR) in peel color (h° values), pulp colors (L*, C* and h° values), pulp firmness, pulp moisture content, and ethylene production (Table 1).
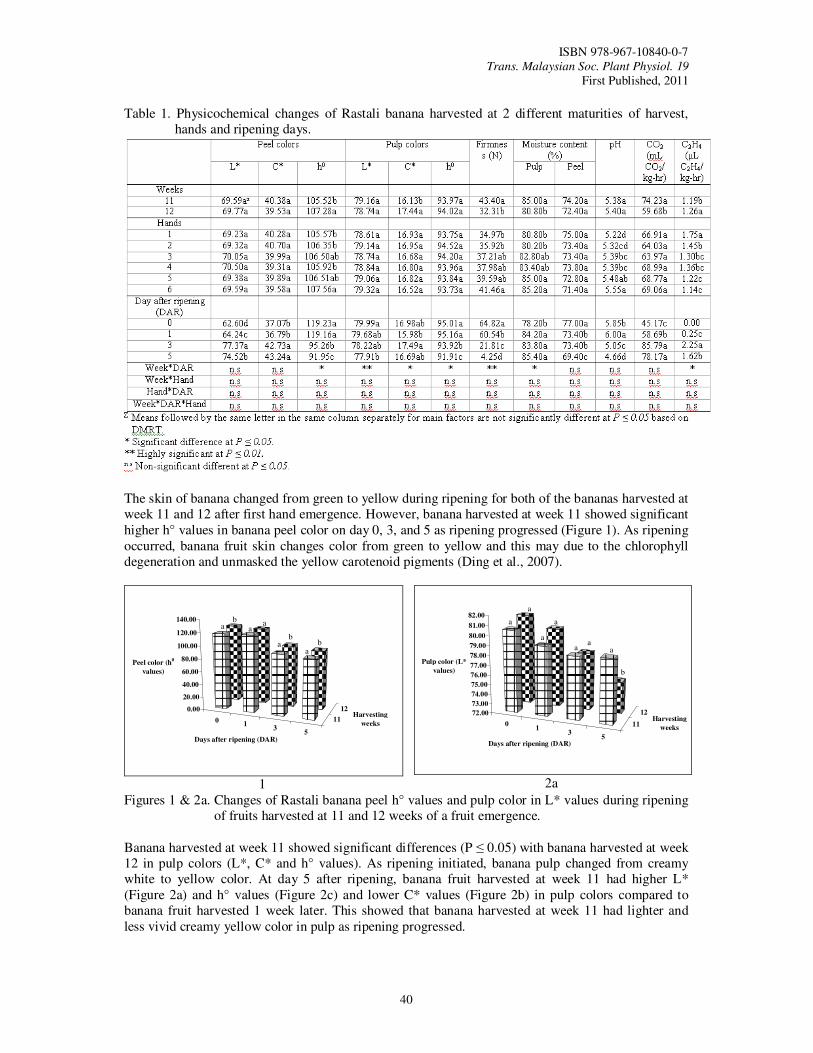
ISBN 978-967-10840-0-7 Trans. Malaysian Soc. Plant Physiol. 19
First Published, 2011
40
Table 1. Physicochemical changes of Rastali banana harvested at 2 different maturities of harvest,
hands and ripening days.
The skin of banana changed from green to yellow during ripening for both of the bananas harvested at week 11 and 12 after first hand emergence. However, banana harvested at week 11 showed significant higher h° values in banana peel color on day 0, 3, and 5 as ripening progressed (Figure 1). As ripening occurred, banana fruit skin changes color from green to yellow and this may due to the chlorophyll degeneration and unmasked the yellow carotenoid pigments (Ding et al., 2007).
01
35
11
120.00
20.00
40.00
60.00
80.00
100.00
120.00
140.00
Peel color (h0
values)
Days after ripening (DAR)
Harvesting
weeks
a a
ba
ba
ab
1
01
35
11
1272.00
73.00
74.00
75.00
76.00
77.00
78.00
79.00
80.00
81.00
82.00
Pulp color (L*
values)
Days after ripening (DAR)
Harvesting
weeks
a
b
aa
a
a
a
a
2a
Figures 1 & 2a. Changes of Rastali banana peel h° values and pulp color in L* values during ripening of fruits harvested at 11 and 12 weeks of a fruit emergence.
Banana harvested at week 11 showed significant differences (P ≤ 0.05) with banana harvested at week 12 in pulp colors (L*, C* and h° values). As ripening initiated, banana pulp changed from creamy white to yellow color. At day 5 after ripening, banana fruit harvested at week 11 had higher L* (Figure 2a) and h° values (Figure 2c) and lower C* values (Figure 2b) in pulp colors compared to banana fruit harvested 1 week later. This showed that banana harvested at week 11 had lighter and less vivid creamy yellow color in pulp as ripening progressed.
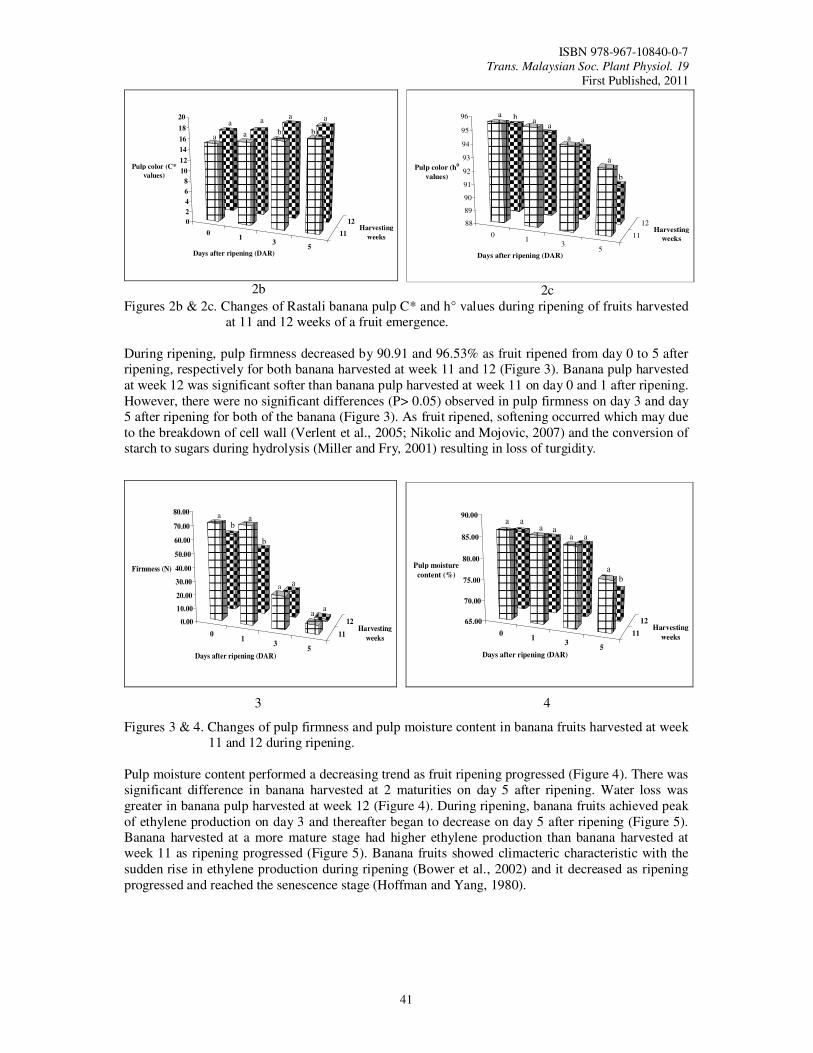
ISBN 978-967-10840-0-7 Trans. Malaysian Soc. Plant Physiol. 19
First Published, 2011
41
01
35
11
120
2
4
6
8
10
12
14
16
18
20
Pulp color (C*
values)
Days after ripening (DAR)
Harvesting
weeks
a
a
b
a
b
a
a
a
2b
01
35
11
1288
89
90
91
92
93
94
95
96
Pulp color (h0
values)
Days after ripening (DAR)
Harvesting
weeks
a
b
a
aa
aa
b
2c
Figures 2b & 2c. Changes of Rastali banana pulp C* and h° values during ripening of fruits harvested at 11 and 12 weeks of a fruit emergence.
During ripening, pulp firmness decreased by 90.91 and 96.53% as fruit ripened from day 0 to 5 after ripening, respectively for both banana harvested at week 11 and 12 (Figure 3). Banana pulp harvested at week 12 was significant softer than banana pulp harvested at week 11 on day 0 and 1 after ripening. However, there were no significant differences (P> 0.05) observed in pulp firmness on day 3 and day 5 after ripening for both of the banana (Figure 3). As fruit ripened, softening occurred which may due to the breakdown of cell wall (Verlent et al., 2005; Nikolic and Mojovic, 2007) and the conversion of starch to sugars during hydrolysis (Miller and Fry, 2001) resulting in loss of turgidity.
01
35
11
120.00
10.00
20.00
30.00
40.00
50.00
60.00
70.00
80.00
Firmness (N)
Days after ripening (DAR)
Harvesting
weeks
a
aa
aa
b
ab
3
01
35
11
1265.00
70.00
75.00
80.00
85.00
90.00
Pulp moisture
content (%)
Days after ripening (DAR)
Harvesting
weeks
a
ba
aaaa
a
4
Figures 3 & 4. Changes of pulp firmness and pulp moisture content in banana fruits harvested at week 11 and 12 during ripening.
Pulp moisture content performed a decreasing trend as fruit ripening progressed (Figure 4). There was significant difference in banana harvested at 2 maturities on day 5 after ripening. Water loss was greater in banana pulp harvested at week 12 (Figure 4). During ripening, banana fruits achieved peak of ethylene production on day 3 and thereafter began to decrease on day 5 after ripening (Figure 5). Banana harvested at a more mature stage had higher ethylene production than banana harvested at week 11 as ripening progressed (Figure 5). Banana fruits showed climacteric characteristic with the sudden rise in ethylene production during ripening (Bower et al., 2002) and it decreased as ripening progressed and reached the senescence stage (Hoffman and Yang, 1980).
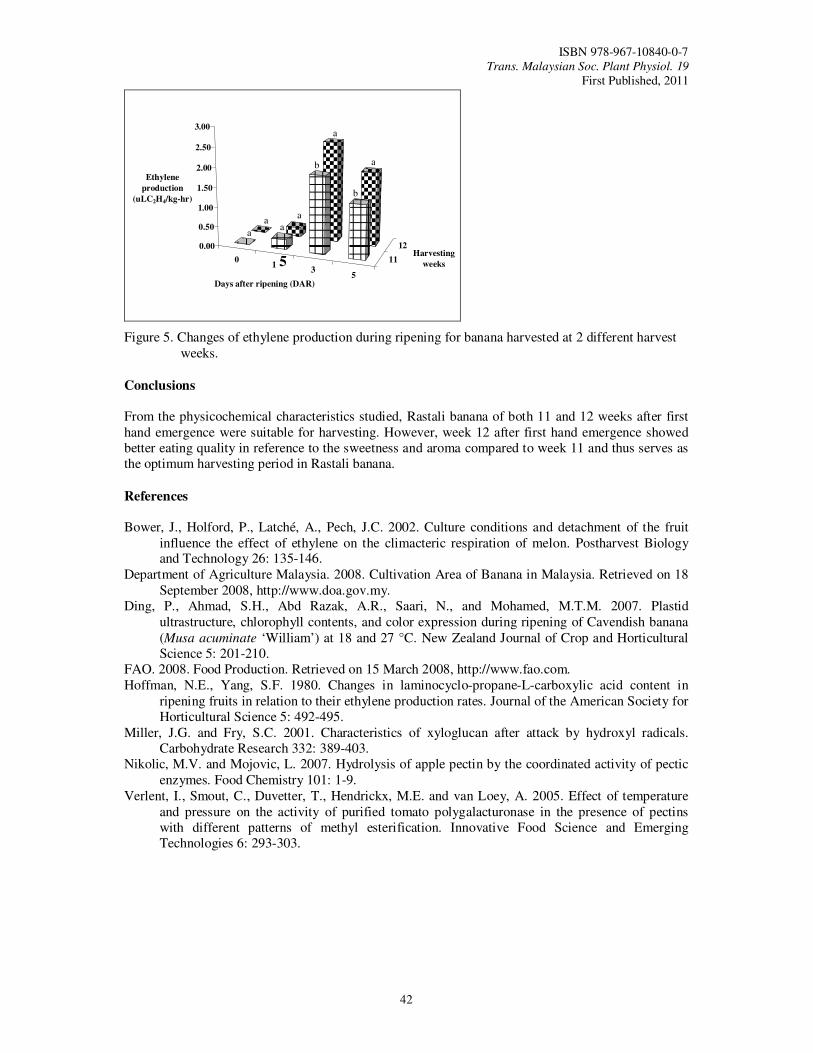
ISBN 978-967-10840-0-7 Trans. Malaysian Soc. Plant Physiol. 19
First Published, 2011
42
01
35
11
120.00
0.50
1.00
1.50
2.00
2.50
3.00
Ethylene
production
(uLC2H4/kg-hr)
Days after ripening (DAR)
Harvesting
weeks
a
b
b a
a
a
aa
Figure 5. Changes of ethylene production during ripening for banana harvested at 2 different harvest weeks.
Conclusions From the physicochemical characteristics studied, Rastali banana of both 11 and 12 weeks after first hand emergence were suitable for harvesting. However, week 12 after first hand emergence showed better eating quality in reference to the sweetness and aroma compared to week 11 and thus serves as the optimum harvesting period in Rastali banana.
References
Bower, J., Holford, P., Latché, A., Pech, J.C. 2002. Culture conditions and detachment of the fruit
influence the effect of ethylene on the climacteric respiration of melon. Postharvest Biology and Technology 26: 135-146.
Department of Agriculture Malaysia. 2008. Cultivation Area of Banana in Malaysia. Retrieved on 18 September 2008, http://www.doa.gov.my.
Ding, P., Ahmad, S.H., Abd Razak, A.R., Saari, N., and Mohamed, M.T.M. 2007. Plastid ultrastructure, chlorophyll contents, and color expression during ripening of Cavendish banana (Musa acuminate ‘William’) at 18 and 27 °C. New Zealand Journal of Crop and Horticultural Science 5: 201-210.
FAO. 2008. Food Production. Retrieved on 15 March 2008, http://www.fao.com. Hoffman, N.E., Yang, S.F. 1980. Changes in laminocyclo-propane-L-carboxylic acid content in
ripening fruits in relation to their ethylene production rates. Journal of the American Society for Horticultural Science 5: 492-495.
Miller, J.G. and Fry, S.C. 2001. Characteristics of xyloglucan after attack by hydroxyl radicals. Carbohydrate Research 332: 389-403.
Nikolic, M.V. and Mojovic, L. 2007. Hydrolysis of apple pectin by the coordinated activity of pectic enzymes. Food Chemistry 101: 1-9.
Verlent, I., Smout, C., Duvetter, T., Hendrickx, M.E. and van Loey, A. 2005. Effect of temperature and pressure on the activity of purified tomato polygalacturonase in the presence of pectins with different patterns of methyl esterification. Innovative Food Science and Emerging Technologies 6: 293-303.
5
ISBN 978-967-10840-0-7 Trans. Malaysian Soc. Plant Physiol. 19
First Published, 2011
43
Evaluation of Hot Water Dip Treatment on Postharvest Anthracnose
Control of Banana
Amin, M.¹, Ding, P.¹,*, Jugah, K.² and Parviz, A.¹ ¹Department of Crop Science and ²Department of Plant Protection, Universiti Putra Malaysia, 43400 Serdang, Selangor, Malaysia. *E-mail: [email protected]
Introduction Banana (Musa spp.) with world production of 90.7 million tonnes per year (FAO, 2010) is a widely grown fruit crop in tropical and subtropical countries. In Malaysia, banana is the second largest cultivated fruit crop. It has a high consumer demand and fetches a good price all over the world. The susceptibility of fresh harvested produce to postharvest diseases increases during prolonged storage, as a result of physiological changes and senescence which enable pathogens to develop in the fruit (Eckert and Ogawa, 1988). Banana, being a highly perishable fruit, suffers severe postharvest losses both in terms of quality and quantity (De Costa and Erabadupitiya, 2005). Anthracnose is the main disease affecting the quality of banana fruits during export and marketing. The causal pathogenic fungus of this postharvest disease is Colletotrichum musae. The fungal spores quickly germinate and form appressoria and then infect immature banana in the field. Symptoms appear at the ripening stage when appressoria germinate and form infected hyphae, leading to the development of quiescent anthracnose. It has seriously damage when develops during container transport, and is markedly diminishing the quality of bananas before they are located in ripening rooms (Chillet et al., 2007). Although agrochemicals are widespread because of their efficacy and feasibility, they are becoming increasingly unpopular as a result of increasing awareness among consumers about fungicide toxic residues problem. Fungicides are used in the late growing season or after harvest to minimize the development of pathogens on the fruits during postharvest phase and remain on the fruits as chemical residues. So, there is an urgent need to develop effective, non-damaging physical treatments to control disease in fresh horticultural products ((Lurie, 1998). Heat treatments as a beneficial method for control of postharvest problems, especially diseases on various horticultural produce, have been reported (Aborisade and Ojo, 2002; Fallik, 2004). Hot water treatments of fruit following harvest have been demonstrated to protect against postharvest decay. Another way to minimize the use of fungicide to control postharvest decay of horticultural produces has been supplied by using combination of heat treatment and agrochemicals (Schirra et al., 2000). Universally effective temperatures and exposure times to all postharvest pathogens are not available (Barkai-Golan, 1991). Therefore, optimum temperature, exposure time and their adverse effects on anthracnose development when treated with hot water alone or with fungicide have to be determined for Berangan dessert banana variety.
Materials and Methods
Plant material
Mature green banana (Musa AAA var. Berangan) was bought from local market. After dehanding, fruit hands were selected in similar size, colour and maturity. Banana fingers were washed and surface sterilized, then used for disease development assessment.
Isolation and identification of the causal pathogen
The causal fungous of anthracnose was isolated from diseased banana fruits of the variety Berangan collected from local market, Serdang, Malaysia. Diseased fruits were washed and surface sterilized with 1% sodium hypochlorite solution for two min, washed twice with sterilized distilled water, then left to air-dry under laminar air flow. Some pieces of lesion were cut and transferred to sterilized Petri dishes containing potato dextrose agar (PDA) medium. They were incubated at 26 ºC and observed
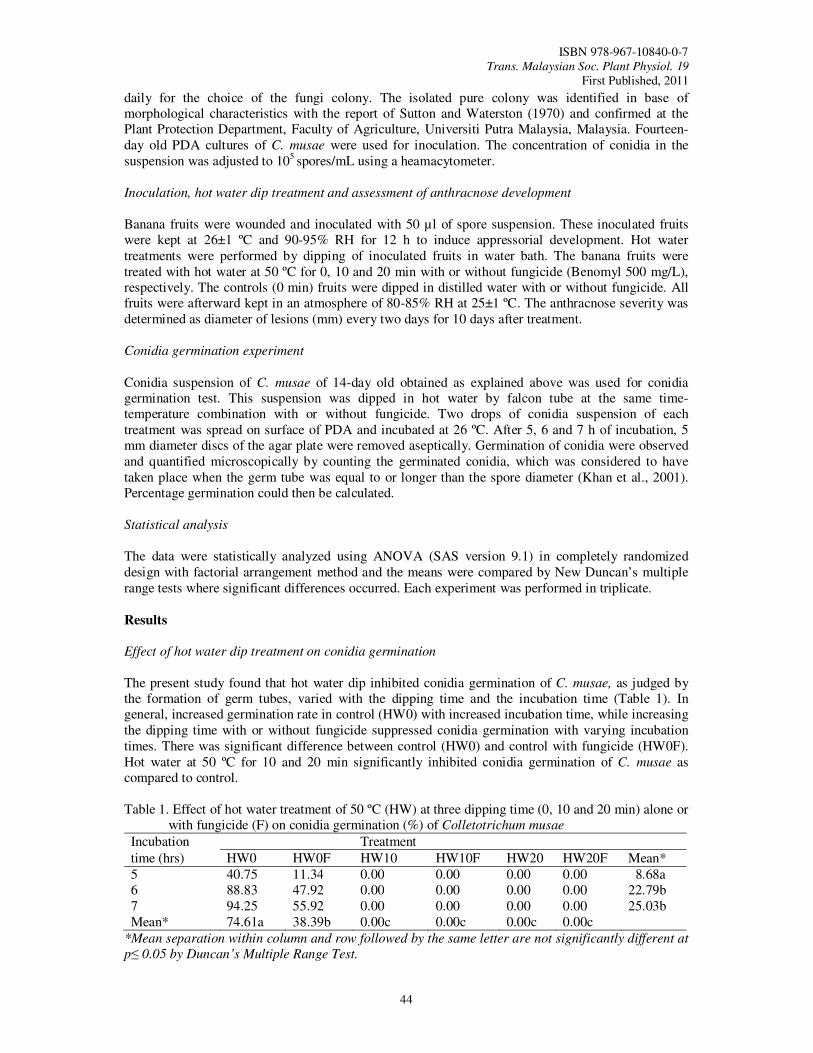
ISBN 978-967-10840-0-7 Trans. Malaysian Soc. Plant Physiol. 19
First Published, 2011
44
daily for the choice of the fungi colony. The isolated pure colony was identified in base of morphological characteristics with the report of Sutton and Waterston (1970) and confirmed at the Plant Protection Department, Faculty of Agriculture, Universiti Putra Malaysia, Malaysia. Fourteen-day old PDA cultures of C. musae were used for inoculation. The concentration of conidia in the suspension was adjusted to 105 spores/mL using a heamacytometer. Inoculation, hot water dip treatment and assessment of anthracnose development
Banana fruits were wounded and inoculated with 50 µl of spore suspension. These inoculated fruits were kept at 26±1 ºC and 90-95% RH for 12 h to induce appressorial development. Hot water treatments were performed by dipping of inoculated fruits in water bath. The banana fruits were treated with hot water at 50 ºC for 0, 10 and 20 min with or without fungicide (Benomyl 500 mg/L), respectively. The controls (0 min) fruits were dipped in distilled water with or without fungicide. All fruits were afterward kept in an atmosphere of 80-85% RH at 25±1 ºC. The anthracnose severity was determined as diameter of lesions (mm) every two days for 10 days after treatment.
Conidia germination experiment
Conidia suspension of C. musae of 14-day old obtained as explained above was used for conidia germination test. This suspension was dipped in hot water by falcon tube at the same time-temperature combination with or without fungicide. Two drops of conidia suspension of each treatment was spread on surface of PDA and incubated at 26 ºC. After 5, 6 and 7 h of incubation, 5 mm diameter discs of the agar plate were removed aseptically. Germination of conidia were observed and quantified microscopically by counting the germinated conidia, which was considered to have taken place when the germ tube was equal to or longer than the spore diameter (Khan et al., 2001). Percentage germination could then be calculated.
Statistical analysis
The data were statistically analyzed using ANOVA (SAS version 9.1) in completely randomized design with factorial arrangement method and the means were compared by New Duncan’s multiple range tests where significant differences occurred. Each experiment was performed in triplicate.
Results
Effect of hot water dip treatment on conidia germination
The present study found that hot water dip inhibited conidia germination of C. musae, as judged by the formation of germ tubes, varied with the dipping time and the incubation time (Table 1). In general, increased germination rate in control (HW0) with increased incubation time, while increasing the dipping time with or without fungicide suppressed conidia germination with varying incubation times. There was significant difference between control (HW0) and control with fungicide (HW0F). Hot water at 50 ºC for 10 and 20 min significantly inhibited conidia germination of C. musae as compared to control.
Table 1. Effect of hot water treatment of 50 ºC (HW) at three dipping time (0, 10 and 20 min) alone or
with fungicide (F) on conidia germination (%) of Colletotrichum musae
Incubation Treatment
time (hrs) HW0 HW0F HW10 HW10F HW20 HW20F Mean*
5 40.75 11.34 0.00 0.00 0.00 0.00 8.68a 6 88.83 47.92 0.00 0.00 0.00 0.00 22.79b 7 94.25 55.92 0.00 0.00 0.00 0.00 25.03b Mean* 74.61a 38.39b 0.00c 0.00c 0.00c 0.00c
*Mean separation within column and row followed by the same letter are not significantly different at
p≤ 0.05 by Duncan’s Multiple Range Test.
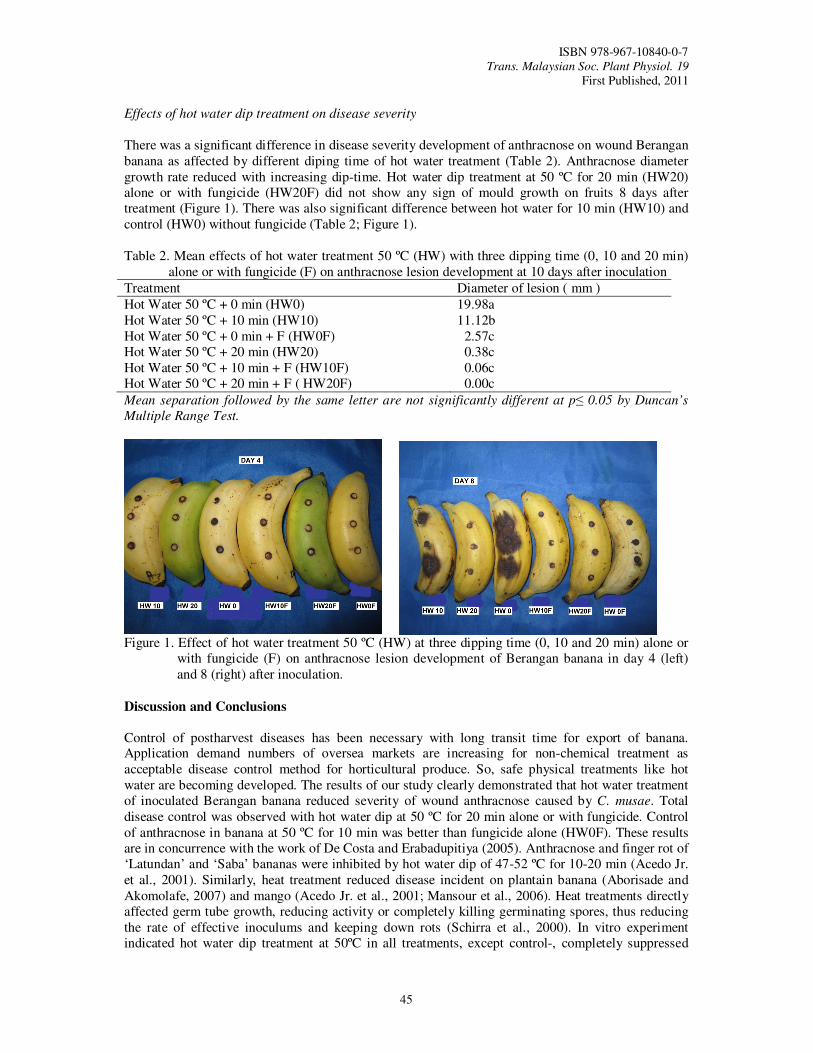
ISBN 978-967-10840-0-7 Trans. Malaysian Soc. Plant Physiol. 19
First Published, 2011
45
Effects of hot water dip treatment on disease severity
There was a significant difference in disease severity development of anthracnose on wound Berangan banana as affected by different diping time of hot water treatment (Table 2). Anthracnose diameter growth rate reduced with increasing dip-time. Hot water dip treatment at 50 ºC for 20 min (HW20) alone or with fungicide (HW20F) did not show any sign of mould growth on fruits 8 days after treatment (Figure 1). There was also significant difference between hot water for 10 min (HW10) and control (HW0) without fungicide (Table 2; Figure 1). Table 2. Mean effects of hot water treatment 50 ºC (HW) with three dipping time (0, 10 and 20 min)
alone or with fungicide (F) on anthracnose lesion development at 10 days after inoculation
Treatment Diameter of lesion ( mm )
Hot Water 50 ºC + 0 min (HW0) 19.98a Hot Water 50 ºC + 10 min (HW10) 11.12b Hot Water 50 ºC + 0 min + F (HW0F) 2.57c Hot Water 50 ºC + 20 min (HW20) 0.38c Hot Water 50 ºC + 10 min + F (HW10F) 0.06c Hot Water 50 ºC + 20 min + F ( HW20F) 0.00c
Mean separation followed by the same letter are not significantly different at p≤ 0.05 by Duncan’s
Multiple Range Test.
Figure 1. Effect of hot water treatment 50 ºC (HW) at three dipping time (0, 10 and 20 min) alone or
with fungicide (F) on anthracnose lesion development of Berangan banana in day 4 (left) and 8 (right) after inoculation.
Discussion and Conclusions Control of postharvest diseases has been necessary with long transit time for export of banana. Application demand numbers of oversea markets are increasing for non-chemical treatment as acceptable disease control method for horticultural produce. So, safe physical treatments like hot water are becoming developed. The results of our study clearly demonstrated that hot water treatment of inoculated Berangan banana reduced severity of wound anthracnose caused by C. musae. Total disease control was observed with hot water dip at 50 ºC for 20 min alone or with fungicide. Control of anthracnose in banana at 50 ºC for 10 min was better than fungicide alone (HW0F). These results are in concurrence with the work of De Costa and Erabadupitiya (2005). Anthracnose and finger rot of ‘Latundan’ and ‘Saba’ bananas were inhibited by hot water dip of 47-52 ºC for 10-20 min (Acedo Jr. et al., 2001). Similarly, heat treatment reduced disease incident on plantain banana (Aborisade and Akomolafe, 2007) and mango (Acedo Jr. et al., 2001; Mansour et al., 2006). Heat treatments directly affected germ tube growth, reducing activity or completely killing germinating spores, thus reducing the rate of effective inoculums and keeping down rots (Schirra et al., 2000). In vitro experiment indicated hot water dip treatment at 50ºC in all treatments, except control-, completely suppressed
ISBN 978-967-10840-0-7 Trans. Malaysian Soc. Plant Physiol. 19
First Published, 2011
46
spore germination of C. musae. The findings of these experiments supported by Lopez-Cabrera and Marrero-Dominguez (1998), who described the effect of hot water dip on pathogen growth of crown rot disease in banana. Much longer dipping time of hot water was required to achieve a reduction in fungal growth in the fruit tissues than on agar. This suggests that the effective hot water temperature or dipping time to which the fungus is controlled is much lower than that for the fruit surface. The effect of hot water on anthracnose is basically resulted from suppression in the viability of fungi spores. Heat may also reduce pathogen growth by inducing resistance mechanisms in the outer layers of epicarp (Ben-Yehoshua et al., 1997). Anthracnose lesions caused by C. musae may not appear on green mature bananas before fruit ripening. It can be explained as the mechanism of fruit resistance. The association of preformed fungitoxic polyphenolic compounds in the pathogen defense system of bananas has already been suggested (Abdel-Saatar and Nawwar, 1986). In conclusion, it is suggested that hot water dip treatment at 50 ºC for 20 min could be useful to control postharvest anthracnose of banana. The combination of hot water dip at 50 ºC for 10 min with fungicide is recommended for minimizing agrochemical treatment in banana.
References
Abdel-Saatar, M. and Nawwar, M. 1986. 3,4-dimethoxybenzaldehyde, a fungistatic substance in peel
of green banana in relation to resistance at different degrees of maturity. HortScience 21(3): 812.
Aborisade, A.T. and Akomolafe, A.M. 2007. Effect of heat treatment of plantain (Musa paradisiaca ) fruits and peel characteristics and control of decay Fusarium verticillioides. Asian Journal of Plant Sciences 6(3): 523-527.
Aborisade, A.T. and Ojo, F.H. 2002. Effect of postharvest hot air treatment of tomatoes (Lycopersicon
esculentum Mill) on storage life and decay caused by Rhizopus stolonifer. Zeitschrift für Pflanzenkrankheiten und Pflanzenschutz 109(6): 639-645.
Acedo, Jr. A.L., Benetiz, M.M. and Millan, L.A. 2001. Heat treatment effects on ripening and disease infection of philippine bananas and mangoes. Acta Horticulturae ISHS 553.
Barkai-Golan, R. and Phillips, D.J. 1991. Postharvest heat treatments of fresh fruits and vegetables for decay control. Plant Disease 75: 1085-1089.
Ben-Yehoshua, S., Rodov, V. and Peretz, J. 1997. The constitutive and induced resistance of citrus fruit against pathogens. In: Johnson, G.I., Highly, E. and Joyce, D.C. (Eds). Disease Resistance in Fruit ACIAR Proc Canberra, Australia 80: 78-92.
Chillet, M., Hubert, O. and de Lapeyre, de Bellaire L. 2007. Relationship between physiological age, ripening and susceptibility of banana to wound anthracnose. Crop Protection 26(7):1078-1082.
De Costa, D.M. and Erabadupitiya, H.R.U.T. 2005. An integrated method to control postharvest diseases of banana using a member of the Burkholderia cepacia complex. Postharvest Biology and Technology 36(1): 31-39.
Eckert, J.W. and Ogawa, J.M. 1988. The chemical control of postharvest diseases: deciduous fruit, berries, vegetables and root/tuber crops. Annual Review of Phytopathology 26:433-469.
Fallik, E. 2004. Prestorage hot water treatments (immersion, rinsing and brushing). Postharvest Biology and Technology 32(2): 125-134.
Khan, S.H., Aked, J. and Magan, N. 2001. Control of the anthracnose pathogen of banana (Colletotrichum musae) using antioxidants alone and in combination with thiabendazole or imazalil. Plant Pathology 50(5): 601-608.
Lurie, S. 1998. Postharvest heat treatments. Postharvest Biology and Technology 14(3): 257-269. Mansour, F.S., Abd-El-Aziz, S.A. and Helal, G.A. 2006. Effect of fruit heat treatment in three mango
varieties on incidence of postharvest fungal disease. Journal of Plant Pathology 88(2): 141-148. Schirra, M., D'Hallewin, G., Ben-Yehoshua, S. and Fallik, E. 2000. Host-pathogen interactions
modulated by heat treatment. Postharvest Biology and Technology 21(1): 71-85. Sutton, B.C. and Waterston, J.M. 1970. Colletotrichum musae. CMI Description of pathogenic fungi
and bacteria. CMI 222.
ISBN 978-967-10840-0-7 Trans. Malaysian Soc. Plant Physiol. 19
First Published, 2011
47
Estimation of Postharvest Losses at Various Stages of the Supply Chain for
Tomato (Lycopersicum esculentum) and Cabbage (Brassica oleracea var.
Capitata)
Humam, M.*, Mahmud, T.M.M., Ahmad, S.H. and Selamat, A. Department of Crop Science, Faculty of Agriculture, Universiti Putra Malaysia, 43400 UPM, Serdang, Selangor, Malaysia. *E-mail: [email protected]
Introduction
Postharvest losses of tropical fruits and vegetables vary between 10 to 80% in both developed and developing countries (Paull, 2001). Losses occur all along a supply chain, beginning from harvest to cleaning, packing, storage, transportation, retailing and consumption of produce. Good quality products easily deteriorate because of careless actions of one factor in the supply chain. In most developing countries, losses are mainly due to the combination of poor infrastructures and logistics, poor cultural practices, lack of postharvest handling knowledge and a convoluted marketing system. Most of the discussions on postharvest dealt with the magnitude of losses but seldom touch on how this magnitude is distributed along the stages of the supply chain. A study on this aspect warrants serious consideration since without this postharvest mapping, prioritizing the critical points of losses becomes difficult. Some work has been done to give estimation on losses at each step during postharvest handling (Amezquita and La Gra, 1979) and MARDI (1988). Studies on vegetables should be given due consideration since it is more vulnerable to losses. The objective of this study was to determine the postharvest quantitative losses of tomato and cabbage.
Materials and Methods
The estimation of postharvest losses of tomato and cabbage was carried out on the basis of observation and interview approaches. Tomato (Solanum lycopersicom) and cabbage (Brassica
oleracea var. capitata grown in Cameron Highlands were used. Five tomato and six cabbage farms in Cameron Highlands were selected for this study. Tomatoes and cabbages were examined for postharvest losses at different stages (field, collection centre, wholesale and retail) of the supply chain. Produces were handled as described below under postharvest practices for tomato and cabbage in Cameron Highlands. Quantitative postharvest losses were determined by counting the unmarketable produce from each box (with 4 replications) collected randomly from each stage of the supply chain. Total weight of unmarketable tomatoes and cabbages were considered as losses and calculated in percentage. Unmarketable tomatoes were identified virtually by dividing into three groups: stage of ripeness (unripe and overripe), physiological disorders (growth cracks, green shoulders, catface, sunscald, blemishes and misshapen) and mechanical injuries (bruises, cuts and crushes). Losses for cabbage were identified and categorized into insect and disease damages, mechanical injuries and wilting.
Results and Discussion
In this experiment, percentage losses for tomato were highest at the retail stage (8.1%) followed by wholesale (7.5%), collection centre (5.4%) and field (4.7%) (Table 1). However for cabbage, percentage losses were highest at the wholesale stage (15.6%) followed by retail (14.9%), field (3.5%) and collection centre (3.4%) (Table 2). Results showed that activities at the wholesale and retail were the critical stages where losses were higher than in the field and collection centre stages. Tomato losses were mainly caused by mechanical injuries (4.7%) and physiological disorders (4.7%) at both wholesale and retail stages. As for cabbage, the losses were mainly due to diseases (10.6%) and mechanical injuries (3.3%).
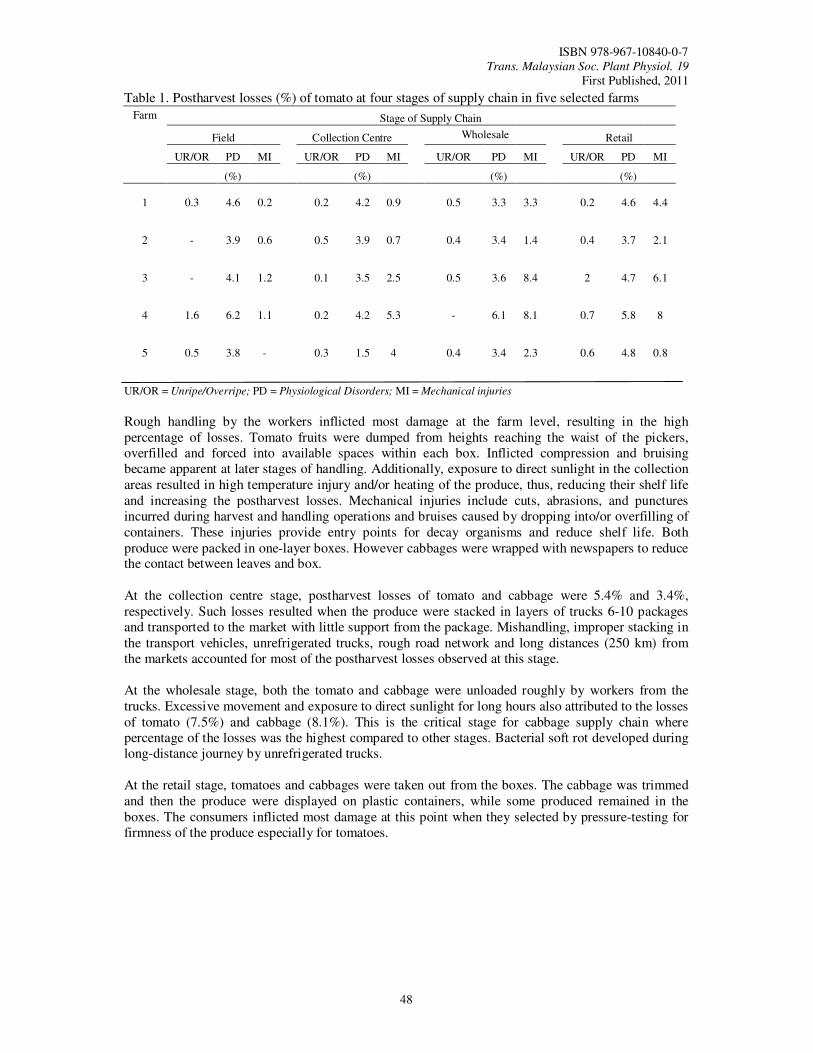
ISBN 978-967-10840-0-7 Trans. Malaysian Soc. Plant Physiol. 19
First Published, 2011
48
Table 1. Postharvest losses (%) of tomato at four stages of supply chain in five selected farms
Farm Stage of Supply Chain
Field Collection Centre Wholesale Retail
UR/OR PD MI UR/OR PD MI UR/OR PD MI UR/OR PD MI
(%) (%) (%) (%)
1 0.3 4.6 0.2
0.2 4.2 0.9
0.5 3.3 3.3
0.2 4.6 4.4
2 - 3.9 0.6
0.5 3.9 0.7
0.4 3.4 1.4
0.4 3.7 2.1
3 - 4.1 1.2
0.1 3.5 2.5
0.5 3.6 8.4
2 4.7 6.1
4 1.6 6.2 1.1
0.2 4.2 5.3
- 6.1 8.1
0.7 5.8 8
5 0.5 3.8 -
0.3 1.5 4
0.4 3.4 2.3
0.6 4.8 0.8
UR/OR = Unripe/Overripe; PD = Physiological Disorders; MI = Mechanical injuries
Rough handling by the workers inflicted most damage at the farm level, resulting in the high percentage of losses. Tomato fruits were dumped from heights reaching the waist of the pickers, overfilled and forced into available spaces within each box. Inflicted compression and bruising became apparent at later stages of handling. Additionally, exposure to direct sunlight in the collection areas resulted in high temperature injury and/or heating of the produce, thus, reducing their shelf life and increasing the postharvest losses. Mechanical injuries include cuts, abrasions, and punctures incurred during harvest and handling operations and bruises caused by dropping into/or overfilling of containers. These injuries provide entry points for decay organisms and reduce shelf life. Both produce were packed in one-layer boxes. However cabbages were wrapped with newspapers to reduce the contact between leaves and box. At the collection centre stage, postharvest losses of tomato and cabbage were 5.4% and 3.4%, respectively. Such losses resulted when the produce were stacked in layers of trucks 6-10 packages and transported to the market with little support from the package. Mishandling, improper stacking in the transport vehicles, unrefrigerated trucks, rough road network and long distances (250 km) from the markets accounted for most of the postharvest losses observed at this stage. At the wholesale stage, both the tomato and cabbage were unloaded roughly by workers from the trucks. Excessive movement and exposure to direct sunlight for long hours also attributed to the losses of tomato (7.5%) and cabbage (8.1%). This is the critical stage for cabbage supply chain where percentage of the losses was the highest compared to other stages. Bacterial soft rot developed during long-distance journey by unrefrigerated trucks. At the retail stage, tomatoes and cabbages were taken out from the boxes. The cabbage was trimmed and then the produce were displayed on plastic containers, while some produced remained in the boxes. The consumers inflicted most damage at this point when they selected by pressure-testing for firmness of the produce especially for tomatoes.
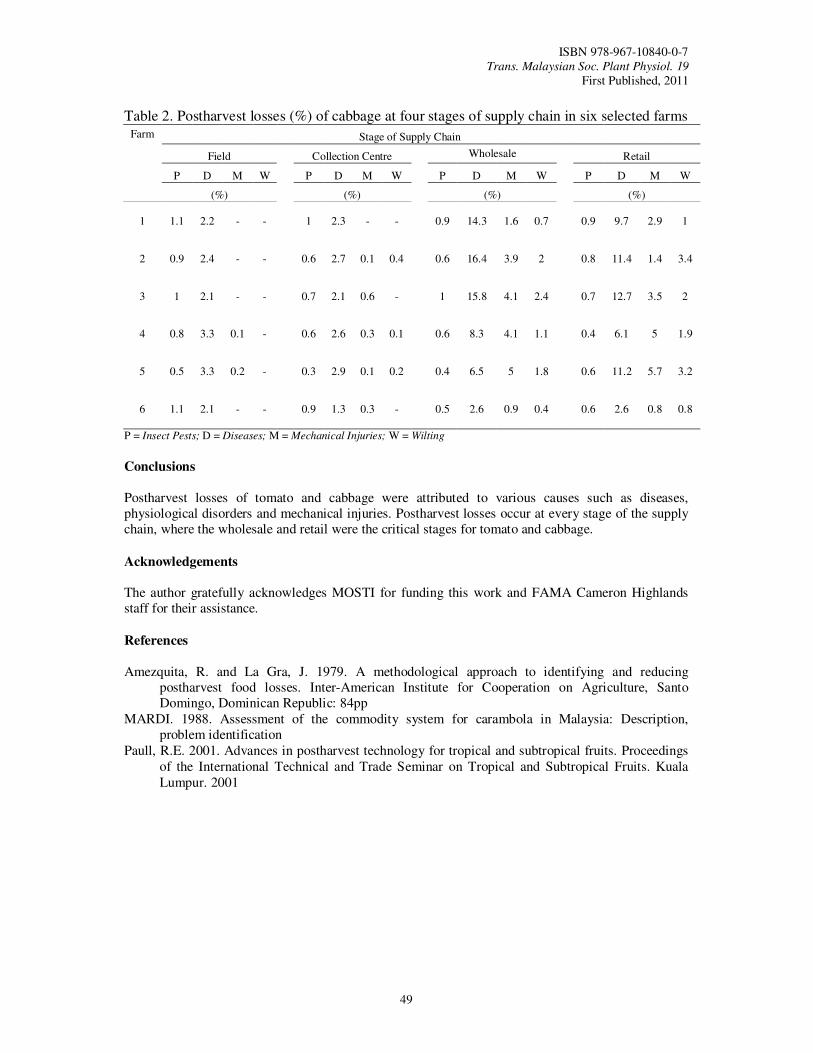
ISBN 978-967-10840-0-7 Trans. Malaysian Soc. Plant Physiol. 19
First Published, 2011
49
Table 2. Postharvest losses (%) of cabbage at four stages of supply chain in six selected farms
Farm Stage of Supply Chain
Field Collection Centre Wholesale Retail
P D M W P D M W P D M W P D M W
(%) (%) (%) (%)
1 1.1 2.2 - -
1 2.3 - -
0.9 14.3 1.6 0.7
0.9 9.7 2.9 1
2 0.9 2.4 - -
0.6 2.7 0.1 0.4
0.6 16.4 3.9 2
0.8 11.4 1.4 3.4
3 1 2.1 - -
0.7 2.1 0.6 -
1 15.8 4.1 2.4
0.7 12.7 3.5 2
4 0.8 3.3 0.1 -
0.6 2.6 0.3 0.1
0.6 8.3 4.1 1.1
0.4 6.1 5 1.9
5 0.5 3.3 0.2 -
0.3 2.9 0.1 0.2
0.4 6.5 5 1.8
0.6 11.2 5.7 3.2
6 1.1 2.1 - -
0.9 1.3 0.3 -
0.5 2.6 0.9 0.4
0.6 2.6 0.8 0.8
P = Insect Pests; D = Diseases; M = Mechanical Injuries; W = Wilting
Conclusions Postharvest losses of tomato and cabbage were attributed to various causes such as diseases, physiological disorders and mechanical injuries. Postharvest losses occur at every stage of the supply chain, where the wholesale and retail were the critical stages for tomato and cabbage.
Acknowledgements
The author gratefully acknowledges MOSTI for funding this work and FAMA Cameron Highlands staff for their assistance.
References Amezquita, R. and La Gra, J. 1979. A methodological approach to identifying and reducing
postharvest food losses. Inter-American Institute for Cooperation on Agriculture, Santo Domingo, Dominican Republic: 84pp
MARDI. 1988. Assessment of the commodity system for carambola in Malaysia: Description, problem identification
Paull, R.E. 2001. Advances in postharvest technology for tropical and subtropical fruits. Proceedings of the International Technical and Trade Seminar on Tropical and Subtropical Fruits. Kuala Lumpur. 2001
ISBN 978-967-10840-0-7 Trans. Malaysian Soc. Plant Physiol. 19
First Published, 2011
50
Removal of Astringency in Rastali Banana Using Ethanol
Ding, P.* and Mohamad Ikram, M.S. Department of Crop Science, Faculty of Agriculture, Universiti Putra Malaysia, 43400 UPM, Serdang, Selangor, Malaysia. *E-mail: [email protected]
Introduction Banana maturity is categorized by maturity index. At maturity index 4 and 5, banana is less ripe but palatable for most of banana cultivar but this does not happen to Rastali banana due to its astringent taste that caused by phenolic compound or tannin content found in the pulp of Rastali banana. Azizah et al. (1998) reported that when Rastali banana in half ripe and even in fully ripe stage, the tannin content is highest compared to other banana cultivar like Mas and Berangan. The tannins denature the salivary proteins causing a rough “sandpapery” sensation in the mouth. Therefore, Rastali banana is only palatable when it reaches fully ripen stage at maturity index 6. Unfortunately, this fruit encounter finger drop when reaching fully ripen stage. This causes unpleasant condition for consumer. As a result, the eating life of Rastali banana is very short and limits its marketability period. As early as 1930, Kakeshita (1930) stored persimmon in warm water to remove astringency by producing acetaldehyde which then react with tannin to form an insoluble gel. Matsuo and Ito (1982) demonstrated in vitro that acetaldehyde is reactive compound that polymerized the tannins. Awad (2007) has proved that ethanol is still the best method to remove the astringency while maintaining postharvest quality in dates by dipping in 50% ethanol. This study was carried out to determine the effect of ethanol in removing Rastali banana astringency.
Materials and Methods
Four concentrations of ethanol 0, 25, 50, and 75%, were used to dip mature green Rastali banana for 30 min. Then, fruits were air-dried before sealed in plastic bags for 24 h. Control fruit (0%) was initiated to ripening using 10 mg/L ethylene gas for 24 h. After 24 h, the fruits were removed from plastic bags and allowed to ripen at 27 oC.
Skin colour of Rastali banana was determined using a chroma meter (model CR-300, Minolta Corp., Japan) and results were expressed as lightness (L*), chroma (C*) and hue (ho). The flesh firmness of fruits was evaluated using a penetrometer (FT 327Bishop, Italy) with 11 mm cylindrical probe. The SSC of fruits were determined using a hand refractometer (Model N1, Atago) to obtain the reading of %SSC. The titratable acidity (TA) of the fruit was determined by slicing out 10 g of the fruit. Then, 40 mL of distilled water was added to the 10 g of fruit and then blended in a high speed blender (National model MX V2N) for 1 min. The macerate was filtered with cotton into conical flask. After that, 5 mL of filtrate was titrated with 0.1 mol/L NaOH and three drops of phenolphthalein indicator. The indicator added filtrate was titrated until it turns pink color. The remaining juice from the TA determination was used to measure the pH of the juice by using the glass electrode pH meter model Crison Micro pH 2000. The pH meter was calibrated with buffer at pH 4.0 and 7.0 before being used. Vitamin C determination was carried out using dye, 2,6-dichlorophenol-indophenol method (Ranggana, 1977). Tannin content was measured using Folin-Denis reagent according to Ranggana (1977) and expressed as % tannic acid.
Statistical analysis
The experiment was conducted using a completely randomized design (CRD) with 2 factors (4 ethanol concentrations x 4 ripening days). Data was analyzed using analysis of variance (SAS Institute, Cary, NC) and means were separated by Duncan’s multiple range test.
ISBN 978-967-10840-0-7 Trans. Malaysian Soc. Plant Physiol. 19
First Published, 2011
51
Results and Discussion
The L* and C* values of Rastali banana peel were not affected by ethanol treatment (Table 1). The ho values of control banana and treated with 75% ethanol has significant lower values than other treatments. As ripening day progressed the peel colour changed from green to yellow indicating Rastali banana underwent normal ripening with ethanol treatment. The firmness of Rastali banana treated with 25 and 50% ethanol was significantly higher than control (Table 1). The flesh firmness of Rastali banana decreased as ripening day progressed. The SSC of Rastali banana treated with 25 and 50% ethanol was significantly lower than control and 75% ethanol (Table 1). Contrast to flesh firmness, the SSC increased significantly with ripening. There was no trend in TA of Rastali banana as affected by ethanol treatment (Table 1). However, as ripening progressed the TA increased. The pH of Rastali banana followed opposite trend of SSC where pH of fruit treated with 25 and 50% ethanol showed significant higher than control and 75% ethanol. As ripening progressed, the pH of Rastali banana decreased significantly. Ascorbic acid of Rastali banana was not affected by ethanol treatment (Table 1). However, ascorbic acid increased significantly once ripening was initiated at ripening day 1. Tannin content of Rastali banana was not affected by ethanol treatment (Table 1). This indicated ethanol cannot be used to remove astringency in Rastali banana. Most probably the ethanol did not penetrate into flesh. Ethanol polymerized tannin compounds and consequently reduced the astringency taste of fruit (Matsuo and Ito, 1982). Tannin content of Rastali banana decreased as ripening day increased. Similar result was also reported by Azizah et al. (1998) where tannin content decreased gradually as fruit ripened. Ripening process that occurs in climacteric fruit like banana polymerizes the tannins result in the loss of astringency (Chang et al., 1990). Lakshminarayana et al. (1970) and Selvaraj and Kumar (1989) also obtained the same result in mango where the phenolic compounds of mango is higher at early growth stage but reduced when fruits ripened and the loss of astringency in mango is also associated with the loss of phenolic compounds.
Conclusions When Rastali banana treated with different levels of ethanol, there was no significant difference among the treatment. However, as ripening progressed the tannin content reduce tremendously which indicate ripening reduce tannin content and cause loss of astringency. In other words, ethanol treatment could not be used to remove astringency in Rastali banana. This could probably due to thick peel of Rastali banana which has hindered ethanol from being penetrating into flesh tissue to polymerize the tannin compounds.
References Awad, M.A. 2007. Increasing the rate of ripening of date palm fruit (Phoenix dactylifera L.) cv.
Helali by preharvest and postharvest treatments. Postharvest Biology and Technology 43: 121-127.
Azizah, O., Nik Syafirin, N.S. and Suhaila, M. 1998. Comparing the physico-chemical characteristics of Mas, Rastali, and Berangan bananas at three stages of maturity. In: Wahab, Z. (ed.), Proceedings of the First National Banana Seminar, 23-25 November 1998, Genting Highlands, Pahang, Malaysia. Pp. 100-104.
Chang, W.H., Hwang, Y.J. and Wei, T.C. 1990. Chemical composition and enzyme activity of Taiwan Northern banana fruit of different maturity and harvested in different seasons. Acta Horticulturae 275: 621-629.
Kakeshita, K. 1930. The change of the amount of acetaldehyde and ethanol in flesh during ripening and storage in Japanese persimmon. Agriculture and Horticulture 5: 1151-1161.
Lakshminarayana, S., Subhadra, N.V. and Subramanyam, H. 1970. Some expects of developmental physiology of mango fruit. Journal of Horticultural Science 45: 133-142.
Matsuo, T. and Ito, S. 1982. A model experiment for deastringency of persimmon fruit with the high cabon dioxide treatment: in vitro gelation of kaki-tannin by reacting with acetaldehyde. Journal of Agricultural and Biological Chemistry 46: 683-689.

ISBN 978-967-10840-0-7 Trans. Malaysian Soc. Plant Physiol. 19
First Published, 2011
52
Ranganna, S. 1977. Manual of Analysis of Fruit and Vegetable Products. Tata McGraw Hill Publishing Co. Ltd., New Delhi.
Selvaraj, Y. and Kumar, R. 1989. Studies on fruit softening enzyme and polyphenoloxidase activity in ripening mango (Mangifera indica L.) fruit. Journal of Food Science and Technology 26: 218-222.
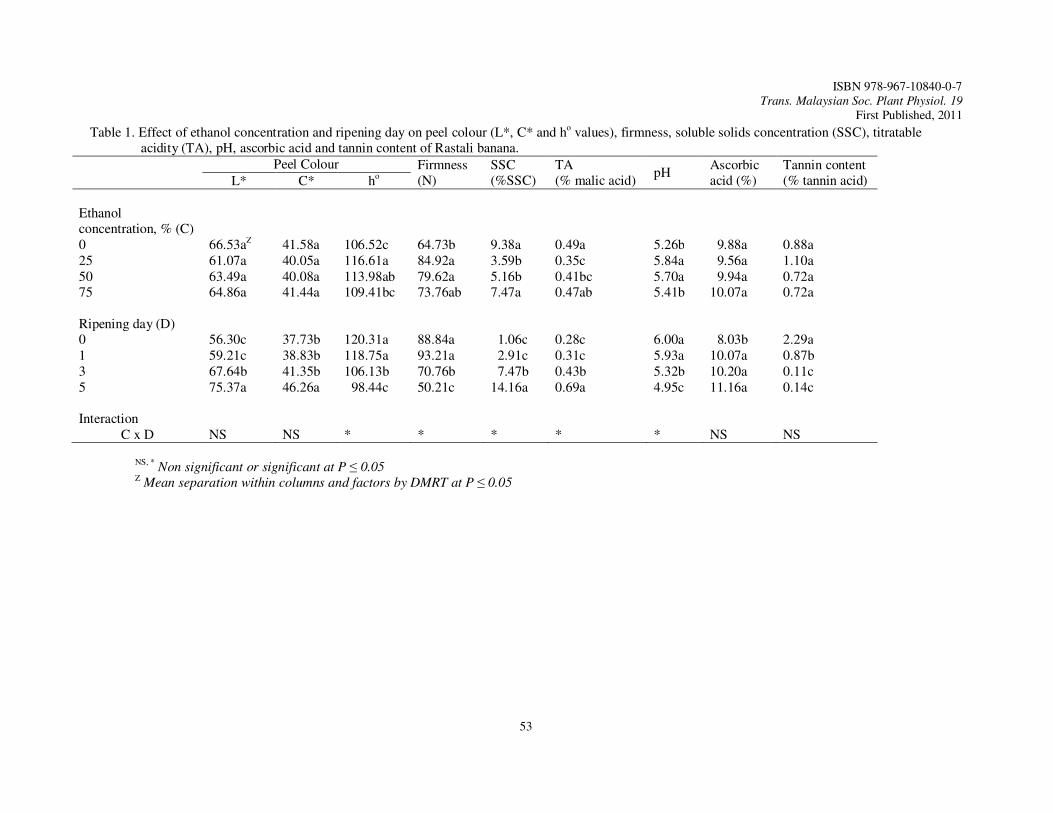
ISBN 978-967-10840-0-7 Trans. Malaysian Soc. Plant Physiol. 19
First Published, 2011
53
Table 1. Effect of ethanol concentration and ripening day on peel colour (L*, C* and ho values), firmness, soluble solids concentration (SSC), titratable acidity (TA), pH, ascorbic acid and tannin content of Rastali banana.
Peel Colour Firmness (N)
SSC (%SSC)
TA (% malic acid)
pH Ascorbic acid (%)
Tannin content (% tannin acid) L* C* ho
Ethanol concentration, % (C)
0 66.53aZ 41.58a 106.52c 64.73b 9.38a 0.49a 5.26b 9.88a 0.88a 25 61.07a 40.05a 116.61a 84.92a 3.59b 0.35c 5.84a 9.56a 1.10a 50 63.49a 40.08a 113.98ab 79.62a 5.16b 0.41bc 5.70a 9.94a 0.72a 75 64.86a 41.44a 109.41bc 73.76ab 7.47a 0.47ab 5.41b 10.07a 0.72a Ripening day (D) 0 56.30c 37.73b 120.31a 88.84a 1.06c 0.28c 6.00a 8.03b 2.29a 1 59.21c 38.83b 118.75a 93.21a 2.91c 0.31c 5.93a 10.07a 0.87b 3 67.64b 41.35b 106.13b 70.76b 7.47b 0.43b 5.32b 10.20a 0.11c 5 75.37a 46.26a 98.44c 50.21c 14.16a 0.69a 4.95c 11.16a 0.14c
Interaction
C x D NS NS * * * * * NS NS
NS, * Non significant or significant at P ≤ 0.05 Z Mean separation within columns and factors by DMRT at P ≤ 0.05

ISBN 978-967-10840-0-7 Trans. Malaysian Soc. Plant Physiol. 19
First Published, 2011
54
CHAPTER 3
ECOPHYSIOLOGY
AND STRESS BIOLOGY
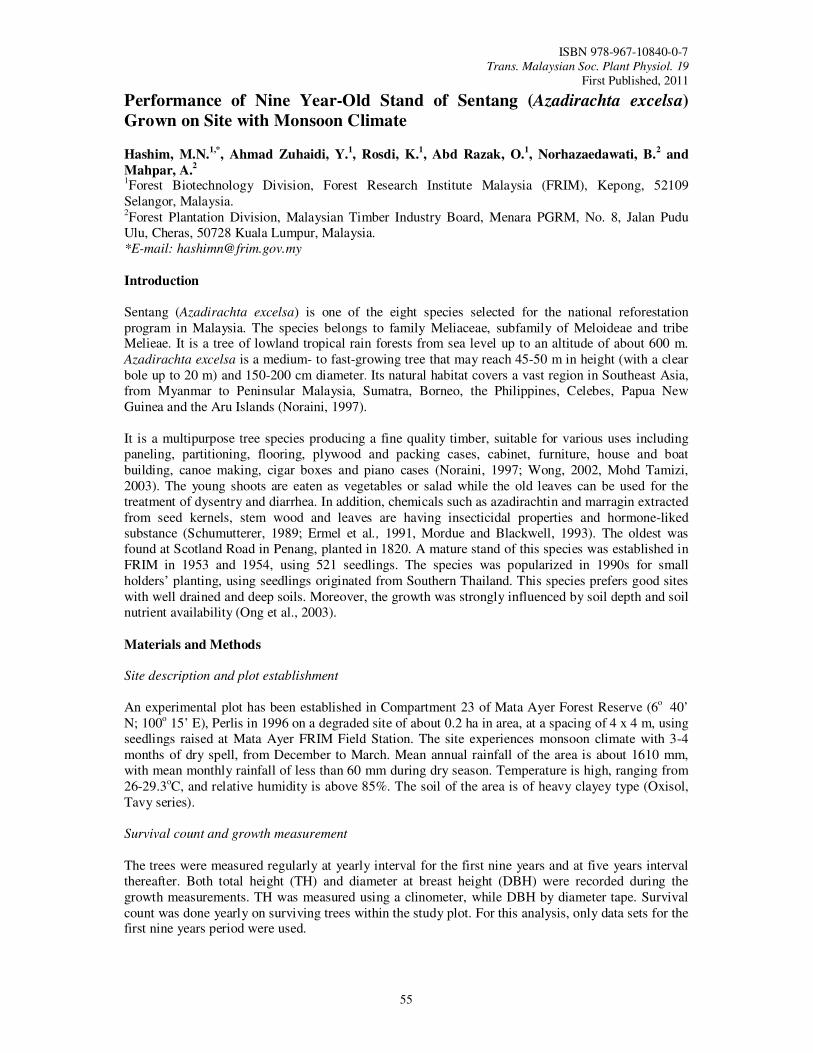
ISBN 978-967-10840-0-7 Trans. Malaysian Soc. Plant Physiol. 19
First Published, 2011
55
Performance of Nine Year-Old Stand of Sentang (Azadirachta excelsa)
Grown on Site with Monsoon Climate
Hashim, M.N.1,*
, Ahmad Zuhaidi, Y.1, Rosdi, K.
1, Abd Razak, O.
1, Norhazaedawati, B.
2 and
Mahpar, A.2
1Forest Biotechnology Division, Forest Research Institute Malaysia (FRIM), Kepong, 52109 Selangor, Malaysia. 2Forest Plantation Division, Malaysian Timber Industry Board, Menara PGRM, No. 8, Jalan Pudu Ulu, Cheras, 50728 Kuala Lumpur, Malaysia. *E-mail: [email protected]
Introduction Sentang (Azadirachta excelsa) is one of the eight species selected for the national reforestation program in Malaysia. The species belongs to family Meliaceae, subfamily of Meloideae and tribe Melieae. It is a tree of lowland tropical rain forests from sea level up to an altitude of about 600 m. Azadirachta excelsa is a medium- to fast-growing tree that may reach 45-50 m in height (with a clear bole up to 20 m) and 150-200 cm diameter. Its natural habitat covers a vast region in Southeast Asia, from Myanmar to Peninsular Malaysia, Sumatra, Borneo, the Philippines, Celebes, Papua New Guinea and the Aru Islands (Noraini, 1997). It is a multipurpose tree species producing a fine quality timber, suitable for various uses including paneling, partitioning, flooring, plywood and packing cases, cabinet, furniture, house and boat building, canoe making, cigar boxes and piano cases (Noraini, 1997; Wong, 2002, Mohd Tamizi, 2003). The young shoots are eaten as vegetables or salad while the old leaves can be used for the treatment of dysentry and diarrhea. In addition, chemicals such as azadirachtin and marragin extracted from seed kernels, stem wood and leaves are having insecticidal properties and hormone-liked substance (Schumutterer, 1989; Ermel et al., 1991, Mordue and Blackwell, 1993). The oldest was found at Scotland Road in Penang, planted in 1820. A mature stand of this species was established in FRIM in 1953 and 1954, using 521 seedlings. The species was popularized in 1990s for small holders’ planting, using seedlings originated from Southern Thailand. This species prefers good sites with well drained and deep soils. Moreover, the growth was strongly influenced by soil depth and soil nutrient availability (Ong et al., 2003).
Materials and Methods
Site description and plot establishment
An experimental plot has been established in Compartment 23 of Mata Ayer Forest Reserve (6o 40’ N; 100o 15’ E), Perlis in 1996 on a degraded site of about 0.2 ha in area, at a spacing of 4 x 4 m, using seedlings raised at Mata Ayer FRIM Field Station. The site experiences monsoon climate with 3-4 months of dry spell, from December to March. Mean annual rainfall of the area is about 1610 mm, with mean monthly rainfall of less than 60 mm during dry season. Temperature is high, ranging from 26-29.3oC, and relative humidity is above 85%. The soil of the area is of heavy clayey type (Oxisol, Tavy series). Survival count and growth measurement
The trees were measured regularly at yearly interval for the first nine years and at five years interval thereafter. Both total height (TH) and diameter at breast height (DBH) were recorded during the growth measurements. TH was measured using a clinometer, while DBH by diameter tape. Survival count was done yearly on surviving trees within the study plot. For this analysis, only data sets for the first nine years period were used.
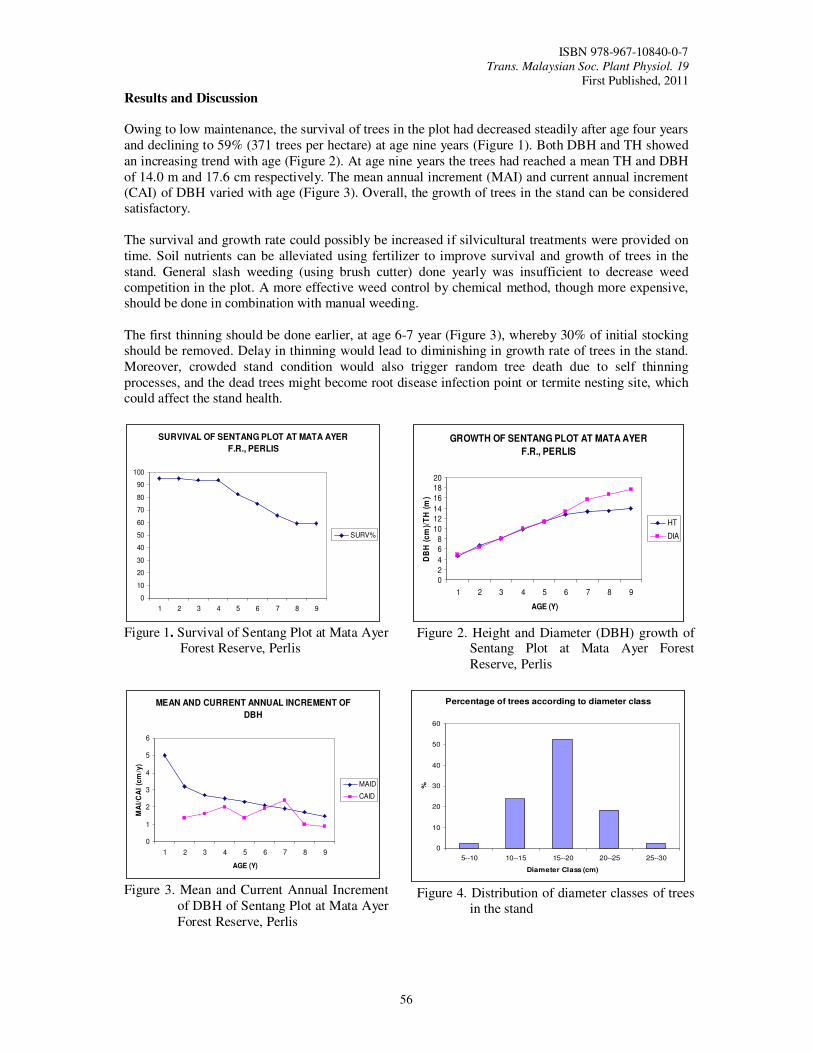
ISBN 978-967-10840-0-7 Trans. Malaysian Soc. Plant Physiol. 19
First Published, 2011
56
Results and Discussion Owing to low maintenance, the survival of trees in the plot had decreased steadily after age four years and declining to 59% (371 trees per hectare) at age nine years (Figure 1). Both DBH and TH showed an increasing trend with age (Figure 2). At age nine years the trees had reached a mean TH and DBH of 14.0 m and 17.6 cm respectively. The mean annual increment (MAI) and current annual increment (CAI) of DBH varied with age (Figure 3). Overall, the growth of trees in the stand can be considered satisfactory. The survival and growth rate could possibly be increased if silvicultural treatments were provided on time. Soil nutrients can be alleviated using fertilizer to improve survival and growth of trees in the stand. General slash weeding (using brush cutter) done yearly was insufficient to decrease weed competition in the plot. A more effective weed control by chemical method, though more expensive, should be done in combination with manual weeding. The first thinning should be done earlier, at age 6-7 year (Figure 3), whereby 30% of initial stocking should be removed. Delay in thinning would lead to diminishing in growth rate of trees in the stand. Moreover, crowded stand condition would also trigger random tree death due to self thinning processes, and the dead trees might become root disease infection point or termite nesting site, which could affect the stand health.
SURVIVAL OF SENTANG PLOT AT MATA AYER
F.R., PERLIS
0
10
20
30
40
50
60
70
80
90
100
1 2 3 4 5 6 7 8 9
SURV%
Figure 1. Survival of Sentang Plot at Mata Ayer
Forest Reserve, Perlis
GROWTH OF SENTANG PLOT AT MATA AYER
F.R., PERLIS
0
2
4
6
8
10
12
14
16
18
20
1 2 3 4 5 6 7 8 9
AGE (Y)
DB
H (
cm
)/T
H (
m)
HT
DIA
Figure 2. Height and Diameter (DBH) growth of
Sentang Plot at Mata Ayer Forest Reserve, Perlis
MEAN AND CURRENT ANNUAL INCREMENT OF
DBH
0
1
2
3
4
5
6
1 2 3 4 5 6 7 8 9
AGE (Y)
MA
I/C
AI
(cm
/y)
MAID
CAID
Figure 3. Mean and Current Annual Increment
of DBH of Sentang Plot at Mata Ayer Forest Reserve, Perlis
Percentage of trees according to diameter class
0
10
20
30
40
50
60
5--10 10--15 15--20 20--25 25--30
Diameter Class (cm)
%
Figure 4. Distribution of diameter classes of trees
in the stand
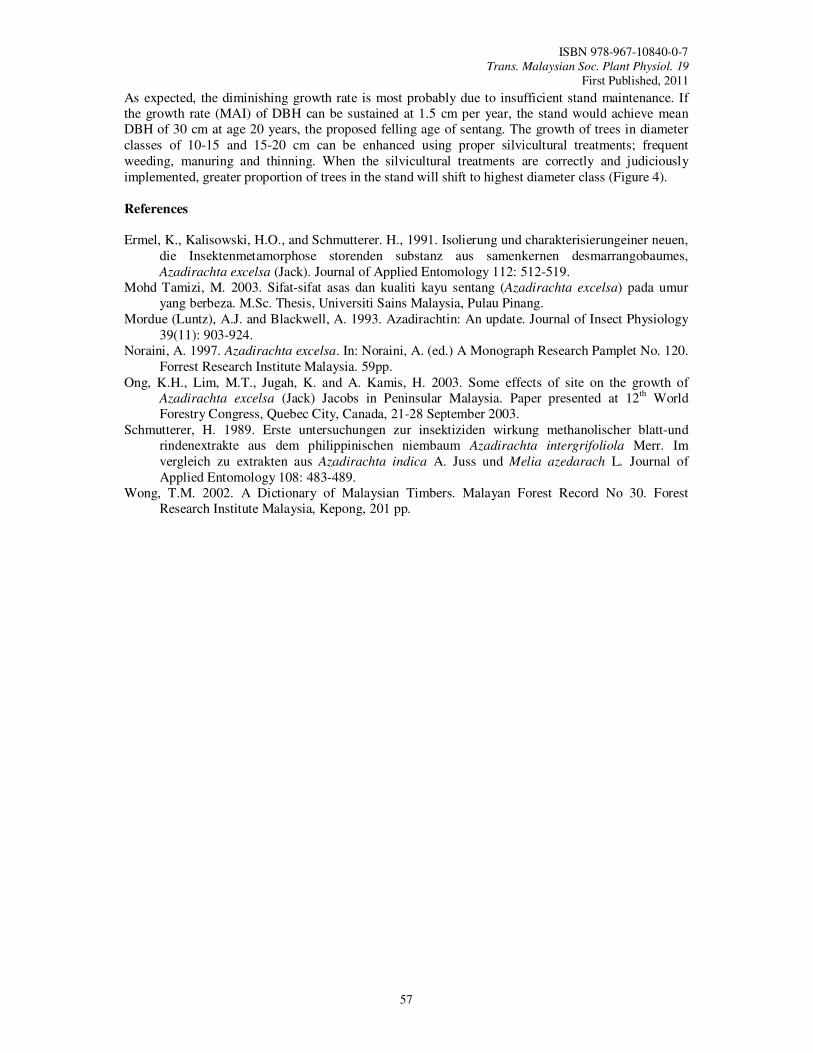
ISBN 978-967-10840-0-7 Trans. Malaysian Soc. Plant Physiol. 19
First Published, 2011
57
As expected, the diminishing growth rate is most probably due to insufficient stand maintenance. If the growth rate (MAI) of DBH can be sustained at 1.5 cm per year, the stand would achieve mean DBH of 30 cm at age 20 years, the proposed felling age of sentang. The growth of trees in diameter classes of 10-15 and 15-20 cm can be enhanced using proper silvicultural treatments; frequent weeding, manuring and thinning. When the silvicultural treatments are correctly and judiciously implemented, greater proportion of trees in the stand will shift to highest diameter class (Figure 4).
References Ermel, K., Kalisowski, H.O., and Schmutterer. H., 1991. Isolierung und charakterisierungeiner neuen,
die Insektenmetamorphose storenden substanz aus samenkernen desmarrangobaumes, Azadirachta excelsa (Jack). Journal of Applied Entomology 112: 512-519.
Mohd Tamizi, M. 2003. Sifat-sifat asas dan kualiti kayu sentang (Azadirachta excelsa) pada umur yang berbeza. M.Sc. Thesis, Universiti Sains Malaysia, Pulau Pinang.
Mordue (Luntz), A.J. and Blackwell, A. 1993. Azadirachtin: An update. Journal of Insect Physiology
39(11): 903-924. Noraini, A. 1997. Azadirachta excelsa. In: Noraini, A. (ed.) A Monograph Research Pamplet No. 120.
Forrest Research Institute Malaysia. 59pp. Ong, K.H., Lim, M.T., Jugah, K. and A. Kamis, H. 2003. Some effects of site on the growth of
Azadirachta excelsa (Jack) Jacobs in Peninsular Malaysia. Paper presented at 12th World Forestry Congress, Quebec City, Canada, 21-28 September 2003.
Schmutterer, H. 1989. Erste untersuchungen zur insektiziden wirkung methanolischer blatt-und rindenextrakte aus dem philippinischen niembaum Azadirachta intergrifoliola Merr. Im vergleich zu extrakten aus Azadirachta indica A. Juss und Melia azedarach L. Journal of Applied Entomology 108: 483-489.
Wong, T.M. 2002. A Dictionary of Malaysian Timbers. Malayan Forest Record No 30. Forest Research Institute Malaysia, Kepong, 201 pp.
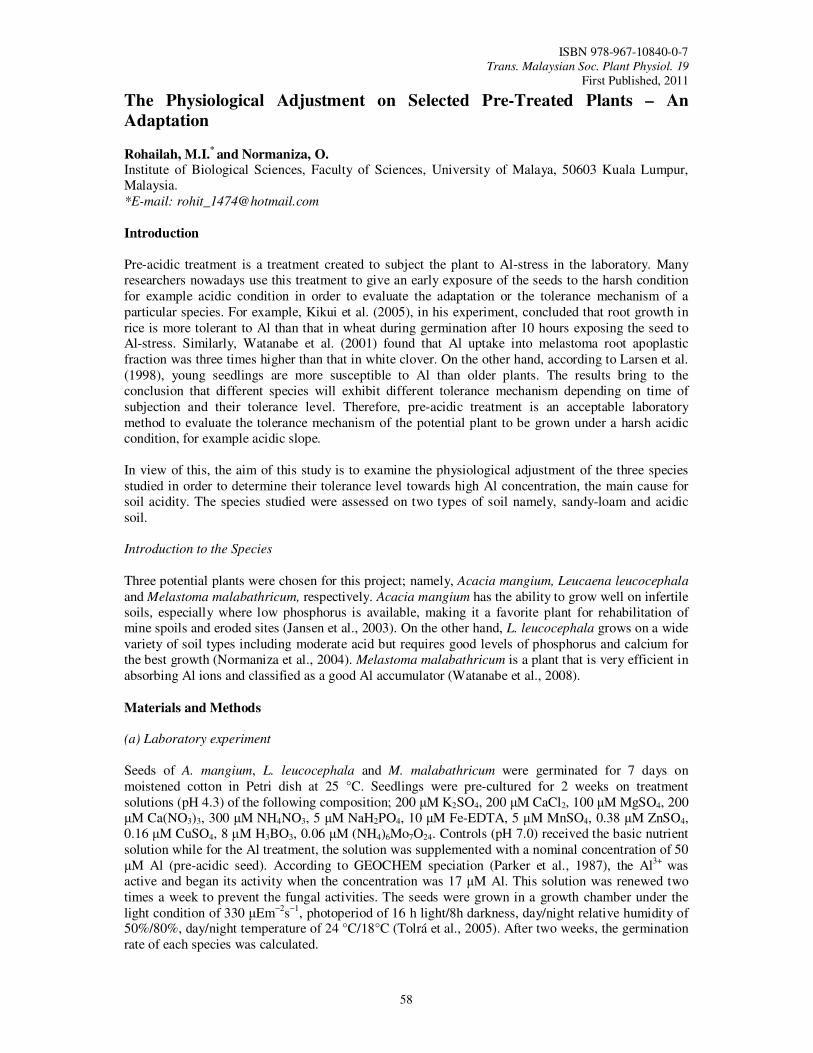
ISBN 978-967-10840-0-7 Trans. Malaysian Soc. Plant Physiol. 19
First Published, 2011
58
The Physiological Adjustment on Selected Pre-Treated Plants – An
Adaptation
Rohailah, M.I.* and Normaniza, O.
Institute of Biological Sciences, Faculty of Sciences, University of Malaya, 50603 Kuala Lumpur, Malaysia. *E-mail: [email protected]
Introduction Pre-acidic treatment is a treatment created to subject the plant to Al-stress in the laboratory. Many researchers nowadays use this treatment to give an early exposure of the seeds to the harsh condition for example acidic condition in order to evaluate the adaptation or the tolerance mechanism of a particular species. For example, Kikui et al. (2005), in his experiment, concluded that root growth in rice is more tolerant to Al than that in wheat during germination after 10 hours exposing the seed to Al-stress. Similarly, Watanabe et al. (2001) found that Al uptake into melastoma root apoplastic fraction was three times higher than that in white clover. On the other hand, according to Larsen et al. (1998), young seedlings are more susceptible to Al than older plants. The results bring to the conclusion that different species will exhibit different tolerance mechanism depending on time of subjection and their tolerance level. Therefore, pre-acidic treatment is an acceptable laboratory method to evaluate the tolerance mechanism of the potential plant to be grown under a harsh acidic condition, for example acidic slope. In view of this, the aim of this study is to examine the physiological adjustment of the three species studied in order to determine their tolerance level towards high Al concentration, the main cause for soil acidity. The species studied were assessed on two types of soil namely, sandy-loam and acidic soil. Introduction to the Species
Three potential plants were chosen for this project; namely, Acacia mangium, Leucaena leucocephala
and Melastoma malabathricum, respectively. Acacia mangium has the ability to grow well on infertile soils, especially where low phosphorus is available, making it a favorite plant for rehabilitation of mine spoils and eroded sites (Jansen et al., 2003). On the other hand, L. leucocephala grows on a wide variety of soil types including moderate acid but requires good levels of phosphorus and calcium for the best growth (Normaniza et al., 2004). Melastoma malabathricum is a plant that is very efficient in absorbing Al ions and classified as a good Al accumulator (Watanabe et al., 2008).
Materials and Methods
(a) Laboratory experiment
Seeds of A. mangium, L. leucocephala and M. malabathricum were germinated for 7 days on moistened cotton in Petri dish at 25 °C. Seedlings were pre-cultured for 2 weeks on treatment solutions (pH 4.3) of the following composition; 200 µM K2SO4, 200 µM CaCl2, 100 µM MgSO4, 200 µM Ca(NO3)3, 300 µM NH4NO3, 5 µM NaH2PO4, 10 µM Fe-EDTA, 5 µM MnSO4, 0.38 µM ZnSO4, 0.16 µM CuSO4, 8 µM H3BO3, 0.06 µM (NH4)6Mo7O24. Controls (pH 7.0) received the basic nutrient solution while for the Al treatment, the solution was supplemented with a nominal concentration of 50 µM Al (pre-acidic seed). According to GEOCHEM speciation (Parker et al., 1987), the Al3+ was active and began its activity when the concentration was 17 µM Al. This solution was renewed two times a week to prevent the fungal activities. The seeds were grown in a growth chamber under the light condition of 330 µEm−2s−1, photoperiod of 16 h light/8h darkness, day/night relative humidity of 50%/80%, day/night temperature of 24 °C/18°C (Tolrá et al., 2005). After two weeks, the germination rate of each species was calculated.
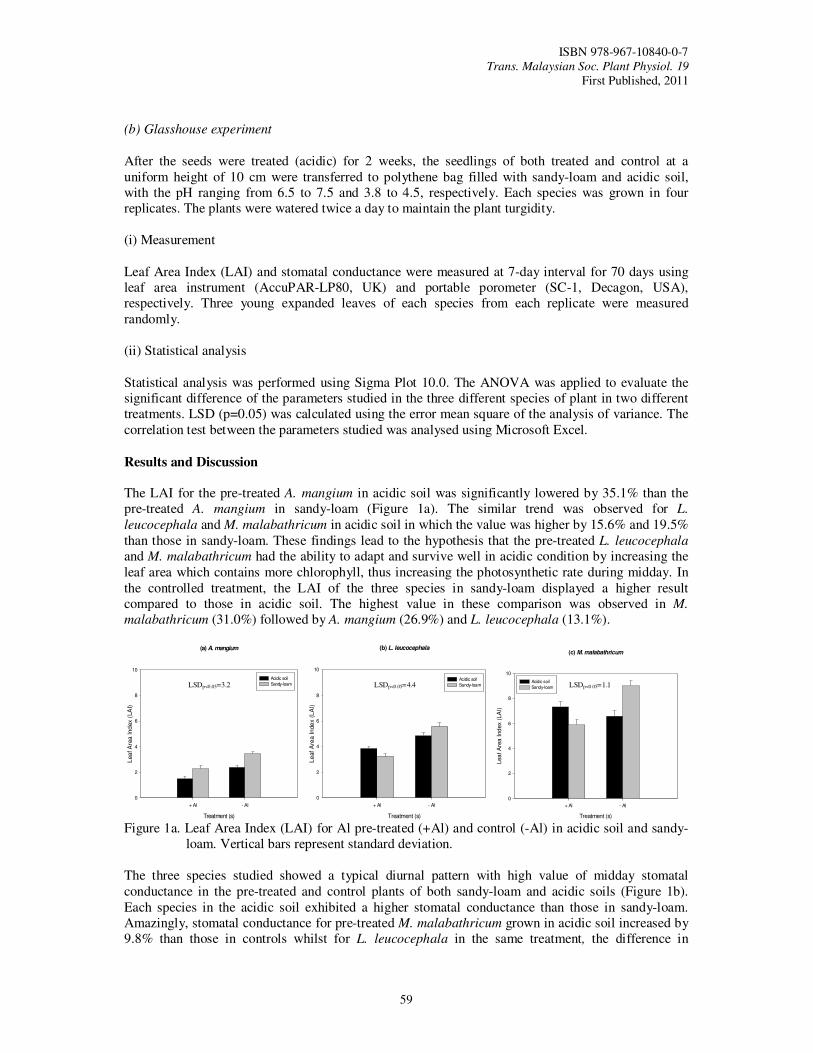
ISBN 978-967-10840-0-7 Trans. Malaysian Soc. Plant Physiol. 19
First Published, 2011
59
(b) Glasshouse experiment
After the seeds were treated (acidic) for 2 weeks, the seedlings of both treated and control at a uniform height of 10 cm were transferred to polythene bag filled with sandy-loam and acidic soil, with the pH ranging from 6.5 to 7.5 and 3.8 to 4.5, respectively. Each species was grown in four replicates. The plants were watered twice a day to maintain the plant turgidity.
(i) Measurement
Leaf Area Index (LAI) and stomatal conductance were measured at 7-day interval for 70 days using leaf area instrument (AccuPAR-LP80, UK) and portable porometer (SC-1, Decagon, USA), respectively. Three young expanded leaves of each species from each replicate were measured randomly. (ii) Statistical analysis
Statistical analysis was performed using Sigma Plot 10.0. The ANOVA was applied to evaluate the significant difference of the parameters studied in the three different species of plant in two different treatments. LSD (p=0.05) was calculated using the error mean square of the analysis of variance. The correlation test between the parameters studied was analysed using Microsoft Excel.
Results and Discussion The LAI for the pre-treated A. mangium in acidic soil was significantly lowered by 35.1% than the pre-treated A. mangium in sandy-loam (Figure 1a). The similar trend was observed for L.
leucocephala and M. malabathricum in acidic soil in which the value was higher by 15.6% and 19.5% than those in sandy-loam. These findings lead to the hypothesis that the pre-treated L. leucocephala and M. malabathricum had the ability to adapt and survive well in acidic condition by increasing the leaf area which contains more chlorophyll, thus increasing the photosynthetic rate during midday. In the controlled treatment, the LAI of the three species in sandy-loam displayed a higher result compared to those in acidic soil. The highest value in these comparison was observed in M.
malabathricum (31.0%) followed by A. mangium (26.9%) and L. leucocephala (13.1%).
(a) A. mangium
Treatment (s)
+ Al - Al
Lea
f A
rea
In
dex (
LA
I)
0
2
4
6
8
10
Acidic soil
Sandy-loam
(b) L. leucocephala
Treatment (s)
+ Al - Al
Le
af
Are
a I
nde
x (L
AI)
0
2
4
6
8
10
Acidic soil
Sandy-loam
(c) M. malabathricum
Treatment (s)
+ Al - Al
Lea
f A
rea
Ind
ex (
LA
I)
0
2
4
6
8
10
Acidic soil
Sandy-loam
Figure 1a. Leaf Area Index (LAI) for Al pre-treated (+Al) and control (-Al) in acidic soil and sandy-
loam. Vertical bars represent standard deviation. The three species studied showed a typical diurnal pattern with high value of midday stomatal conductance in the pre-treated and control plants of both sandy-loam and acidic soils (Figure 1b). Each species in the acidic soil exhibited a higher stomatal conductance than those in sandy-loam. Amazingly, stomatal conductance for pre-treated M. malabathricum grown in acidic soil increased by 9.8% than those in controls whilst for L. leucocephala in the same treatment, the difference in
LSDp<0.05=3.2 LSDp<0.05=4.4 LSDp<0.05=1.1
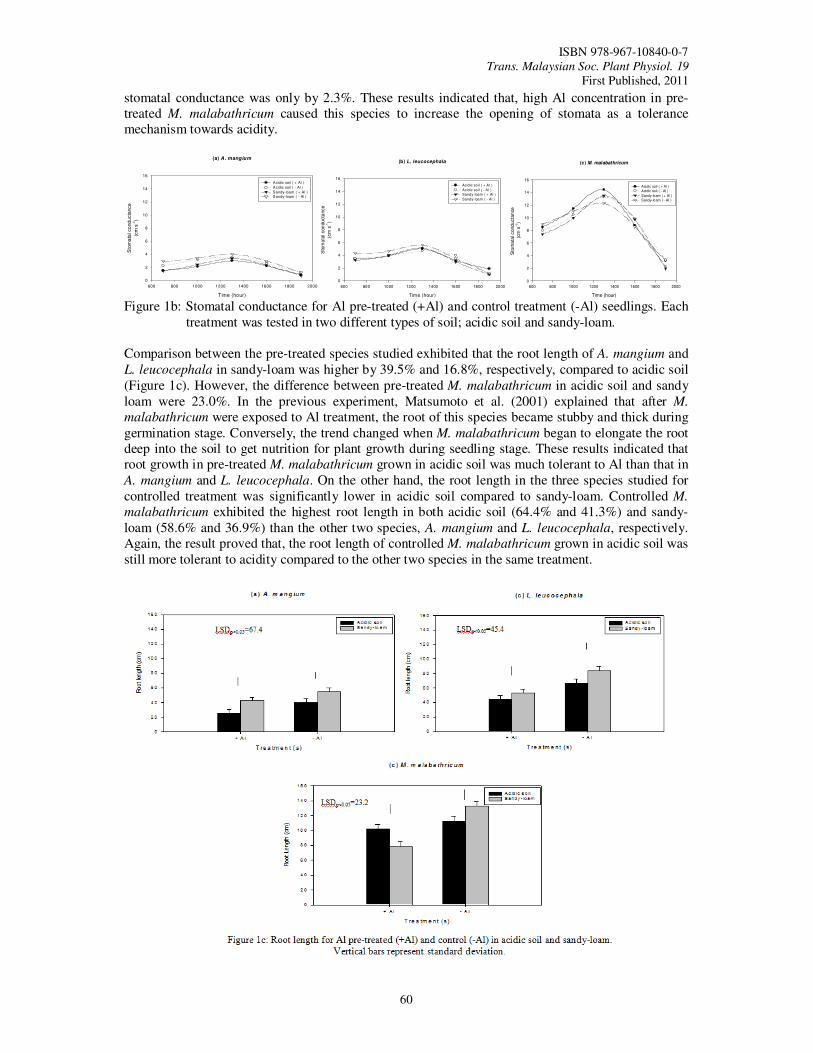
ISBN 978-967-10840-0-7 Trans. Malaysian Soc. Plant Physiol. 19
First Published, 2011
60
stomatal conductance was only by 2.3%. These results indicated that, high Al concentration in pre-treated M. malabathricum caused this species to increase the opening of stomata as a tolerance mechanism towards acidity.
(a) A. mangium
Time (hour)
600 800 1000 1200 1400 1600 1800 2000
Sto
ma
tal co
nd
ucta
nce
(cm
s-1
)
0
2
4
6
8
10
12
14
16
Acidic soil ( + Al )
Acidic soil ( - Al )
Sandy-loam ( + Al )Sandy-loam ( - Al )
(b) L. leucocephala
Time (hour)
600 800 1000 1200 1400 1600 1800 2000
Sto
ma
tal con
du
cta
nce
(cm
s-1
)
0
2
4
6
8
10
12
14
16
Acidic soil ( + Al )
Acidic soil ( - Al )
Sandy-loam ( + Al )
Sandy-loam ( - Al )
(c) M. malabathricum
Time (hour)
600 800 1000 1200 1400 1600 1800 2000
Sto
ma
tal cond
ucta
nce
(cm
s-1
)
0
2
4
6
8
10
12
14
16
Acidic soil ( + Al )
Acidic soil ( - Al )
Sandy-loam ( + Al )
Sandy-loam ( - Al )
Figure 1b: Stomatal conductance for Al pre-treated (+Al) and control treatment (-Al) seedlings. Each
treatment was tested in two different types of soil; acidic soil and sandy-loam.
Comparison between the pre-treated species studied exhibited that the root length of A. mangium and L. leucocephala in sandy-loam was higher by 39.5% and 16.8%, respectively, compared to acidic soil (Figure 1c). However, the difference between pre-treated M. malabathricum in acidic soil and sandy loam were 23.0%. In the previous experiment, Matsumoto et al. (2001) explained that after M.
malabathricum were exposed to Al treatment, the root of this species became stubby and thick during germination stage. Conversely, the trend changed when M. malabathricum began to elongate the root deep into the soil to get nutrition for plant growth during seedling stage. These results indicated that root growth in pre-treated M. malabathricum grown in acidic soil was much tolerant to Al than that in A. mangium and L. leucocephala. On the other hand, the root length in the three species studied for controlled treatment was significantly lower in acidic soil compared to sandy-loam. Controlled M.
malabathricum exhibited the highest root length in both acidic soil (64.4% and 41.3%) and sandy-loam (58.6% and 36.9%) than the other two species, A. mangium and L. leucocephala, respectively. Again, the result proved that, the root length of controlled M. malabathricum grown in acidic soil was still more tolerant to acidity compared to the other two species in the same treatment.

ISBN 978-967-10840-0-7 Trans. Malaysian Soc. Plant Physiol. 19
First Published, 2011
61
Conclusions The pre-treated M. malabathricum in acidic soil shows the best physiological adjustment among the species studied. This potential acid-tolerant plant displayed a higher LAI, stomatal conductance and a long and widespread root profile in the acidic soil compared to other pre-treated plants. This was an essential criterion to survive under acidic condition, for example, on acidic slope.
Acknowledgements This project is supported by University of Malaya (PS336/2009A).
References Jansen, S., Watanabe, T., Dessein, S., Smets, E. and Robbrecht, A. 2003. A comparative study of
metal levels in leaves of some Al-accumulating Rubiaceae. Annals of Botany 91: 657-663. Kikui, S., Sasaki, T., Maekawa, M., Miyao, A., Hirochika, H., Matsumoto, H. and Yamamoto, Y.
2005. Physiological and genetic analyses of aluminium tolerance in rice, focusing in root growth during germination. Journal of Inorganic Biochemistry 99: 1837-1844.
Larsen, P.B., Degenhardt, J., Tai, C.Y., Stenzler, L.M., Howell, S.H. and Kochian, L.V. 1998. Aluminium-resistant Arabidopsis mutant that exhibit altered patterns of aluminium accumulation and organic acid release from roots. Plant Physiology 117: 9-18.
Matsumoto, H., Yamamoto, Y. and Rama Devi, S. 2001. Aluminium toxicity in acid soils-Plant response to aluminium. Metals in Environment: Analysis by Biodiversity. New York. Basel: Marcel Dekker Inc. pp. 289-319.
Normaniza, O. 2004. The contribution of Leucaena leucocephala (Lam.) de Wit to slope stability. Department of Botany, University of Malaya. PhD. Thesis (unpublished).
Parker, D.R., Zelazny, L.W. and Kinraide, T.B. 1987. Improvement to the program GEOCHEM. Soil Science Society of America Journal 51: 488-491.
Tolrà, R.P., Poschenrieder, C., Luppi, B. and Barcelò, J. 2005. Aluminium-induced changes in the profiles of both organic acids and phenolic substances underlie Al tolerance in Rumex acetosa L. Environmental and Experimental Botany 54: 231-238.
Watanabe, T., Misawa, S., Hiradate, S. and Osaki, M. 2008. Root mucilage enhances aluminium accumulation in Melastoma malabathricum, an aluminium accumulator. Plant Signaling and Behavior 3(8): 603-605.
Watanabe, T., Osaki, M. and Tadano, T. 2001. Al uptake kinetics in roots of Melastoma
malabathricum L. – an Al accumulator plant. Plant and Soil 231: 283-291.
ISBN 978-967-10840-0-7 Trans. Malaysian Soc. Plant Physiol. 19
First Published, 2011
62
Effects of Root Zone Cooling Using Water Chilling System on Plant
Physiological Responses and Fruit Yield of Tomato var. Baccarat under
Greenhouse Condition
Mohd Aziz, R.*, Abd Jamil, Z., Armizatul, S.A.H., Md. Noh, I. Hafiz, H. and Norahshekin, A.R. Strategic Resources Research Centre, MARDI, P. O. Box 12301, General Post Office, 50774 Kuala Lumpur, Malaysia. *E-mail: [email protected]
Introduction
In tropical lowlands, both air temperature and relative humidity (RH) exceed the optima for tomato (Solanum lycopersicum L.) almost throughout the year. Mean daily temperature in the range of 21-27 oC (Abdul-Baki and Stommel, 1995; Sato et al., 2000) and around 60% RH (Peet et al., 2003) have been reported to be optimal for tomatoes. Besides heavy rain, insect pests and diseases, a major constraint for the production of vegetables in the tropics is heat stress, particularly in combination with high levels of RH (Peet et al., 2003). In general, greenhouses facilitate the control of environmental conditions and provide protection against heavy rain and excess irradiation. Therefore, in tropical areas, high-value vegetables are increasingly produced under protected cultivation. It is becoming a common practice to cover ventilation openings with insect-proof screens, thus enabling growers to reduce the frequency of pesticide application (Moller et al., 2004). However, this also decreases wind velocities and air exchange (Harmanto et al., 2006) and cause in-house temperature build up. Therefore, in the tropics, the microclimatic conditions inside greenhouses may temporarily be less favourable as compared to unprotected cultivation (Harmanto et al., 2006). Heat stress is known to adversely affect vegetative and generative growth of tomato plants. Excessive temperature induces stomata closing leading to reduced transpiration and photosynthesis, whereas respiratory processes are enhanced (Morales et al., 2003). Consequently, biomass production decreases (Adams and Ho, 1993) possibly entailing reduced yield and/or fruit quality. Moreover high day and night temperature drastically delay tomato flowering, reduce pollination and fruit set (Peet et al., 1997). Likewise, RH beyond plant growth optima has been reported to inhibit transpiration (Dorais et al., 2004), pollination and fruit set (Peet et al., 2003) and is suspected to affect tomato fruit quality (Banuelos et al., 1985). Lessening of the adverse effects of heat stress on tomato yield and fruit quality is a requirement for sustainable tomato production in tropical areas. In addition to cultural practices aiming at reducing heat stress, certain technical solutions appear to be particularly promising such as natural ventilation, forced ventilation (exhaust fans), shading, NIR reflective cladding materials or shading paints (Mutwiwa et al., 2007). In this study, a technique to reduce heat stress by cooling the root zone of tomato has been applied. The main objective of this study was to investigate the effects root zone cooling using water chilling system on plant physiological responses, fruit set and fruit yield of tomato under greenhouse condition in the humid tropical climate in Malaysia.
Materials and Methods The study was carried out under greenhouse condition at MARDI Station Serdang, Selangor from December 2009 to May 2010. Seeds of tomato var Baccarat were sown in a plug tray for a month. The seedlings were transplanted to a growing media mixture of coco peat, burnt paddy husk and perlite at 7:3:1. As the plant grew, all lateral shoots were removed manually, and the resulting single stem was trained up a string according to the high wire system. The oldest leaves (i.e. those at the bottom of the stem) were periodically removed. Assisted pollination using vibrator was done at 2 days
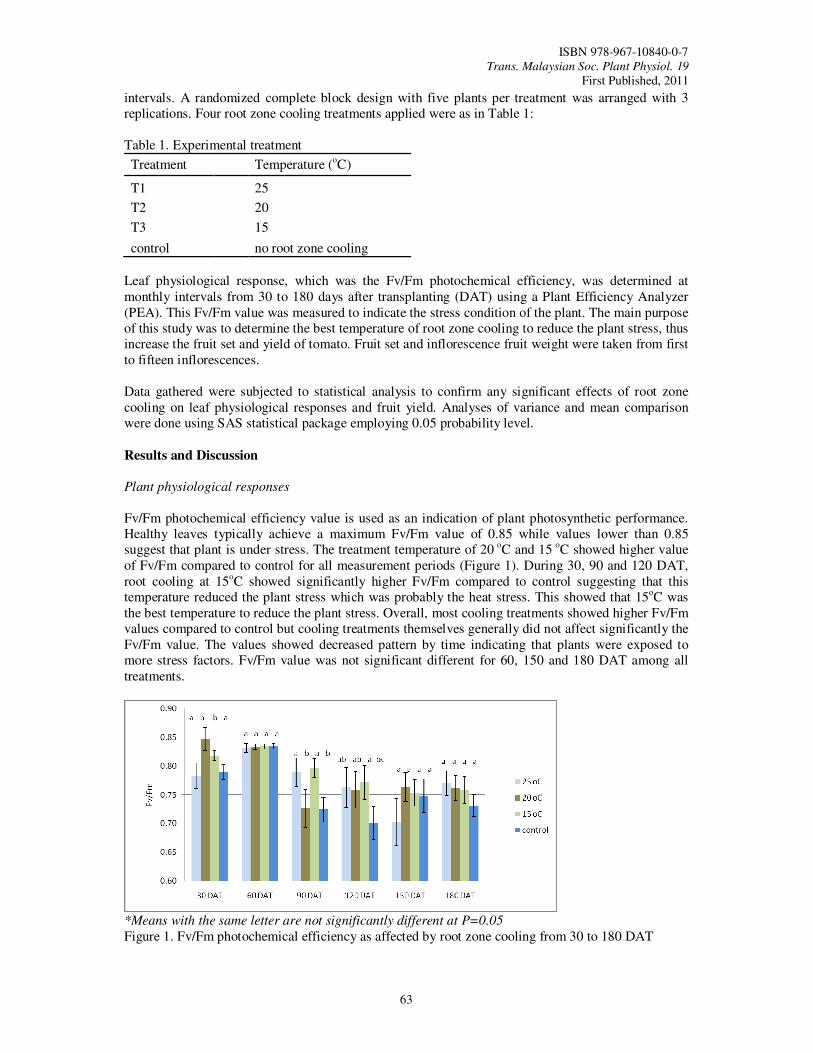
ISBN 978-967-10840-0-7 Trans. Malaysian Soc. Plant Physiol. 19
First Published, 2011
63
intervals. A randomized complete block design with five plants per treatment was arranged with 3 replications. Four root zone cooling treatments applied were as in Table 1: Table 1. Experimental treatment
Treatment Temperature (oC)
T1 25
T2 20
T3 15
control no root zone cooling
Leaf physiological response, which was the Fv/Fm photochemical efficiency, was determined at monthly intervals from 30 to 180 days after transplanting (DAT) using a Plant Efficiency Analyzer (PEA). This Fv/Fm value was measured to indicate the stress condition of the plant. The main purpose of this study was to determine the best temperature of root zone cooling to reduce the plant stress, thus increase the fruit set and yield of tomato. Fruit set and inflorescence fruit weight were taken from first to fifteen inflorescences. Data gathered were subjected to statistical analysis to confirm any significant effects of root zone cooling on leaf physiological responses and fruit yield. Analyses of variance and mean comparison were done using SAS statistical package employing 0.05 probability level.
Results and Discussion
Plant physiological responses
Fv/Fm photochemical efficiency value is used as an indication of plant photosynthetic performance. Healthy leaves typically achieve a maximum Fv/Fm value of 0.85 while values lower than 0.85 suggest that plant is under stress. The treatment temperature of 20 oC and 15 oC showed higher value of Fv/Fm compared to control for all measurement periods (Figure 1). During 30, 90 and 120 DAT, root cooling at 15oC showed significantly higher Fv/Fm compared to control suggesting that this temperature reduced the plant stress which was probably the heat stress. This showed that 15oC was the best temperature to reduce the plant stress. Overall, most cooling treatments showed higher Fv/Fm values compared to control but cooling treatments themselves generally did not affect significantly the Fv/Fm value. The values showed decreased pattern by time indicating that plants were exposed to more stress factors. Fv/Fm value was not significant different for 60, 150 and 180 DAT among all treatments.
*Means with the same letter are not significantly different at P=0.05
Figure 1. Fv/Fm photochemical efficiency as affected by root zone cooling from 30 to 180 DAT
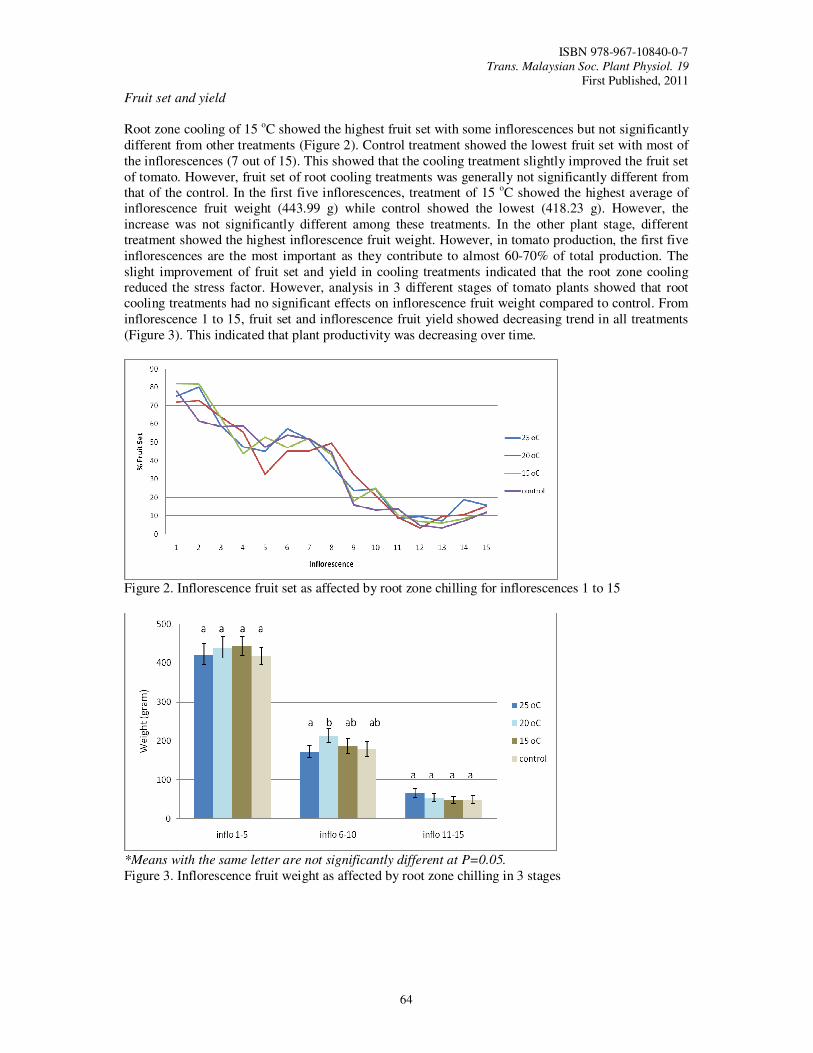
ISBN 978-967-10840-0-7 Trans. Malaysian Soc. Plant Physiol. 19
First Published, 2011
64
Fruit set and yield
Root zone cooling of 15 oC showed the highest fruit set with some inflorescences but not significantly different from other treatments (Figure 2). Control treatment showed the lowest fruit set with most of the inflorescences (7 out of 15). This showed that the cooling treatment slightly improved the fruit set of tomato. However, fruit set of root cooling treatments was generally not significantly different from that of the control. In the first five inflorescences, treatment of 15 oC showed the highest average of inflorescence fruit weight (443.99 g) while control showed the lowest (418.23 g). However, the increase was not significantly different among these treatments. In the other plant stage, different treatment showed the highest inflorescence fruit weight. However, in tomato production, the first five inflorescences are the most important as they contribute to almost 60-70% of total production. The slight improvement of fruit set and yield in cooling treatments indicated that the root zone cooling reduced the stress factor. However, analysis in 3 different stages of tomato plants showed that root cooling treatments had no significant effects on inflorescence fruit weight compared to control. From inflorescence 1 to 15, fruit set and inflorescence fruit yield showed decreasing trend in all treatments (Figure 3). This indicated that plant productivity was decreasing over time.
Figure 2. Inflorescence fruit set as affected by root zone chilling for inflorescences 1 to 15
*Means with the same letter are not significantly different at P=0.05.
Figure 3. Inflorescence fruit weight as affected by root zone chilling in 3 stages
ISBN 978-967-10840-0-7 Trans. Malaysian Soc. Plant Physiol. 19
First Published, 2011
65
Conclusions
The root zone cooling treatment of 15 oC showed significantly higher Fv/Fm photochemical efficiency value for some measurement periods compared to other cooling treatments and control. This showed that 15 oC was the best temperature to reduce the plant stress. This indicated that the lower the root cooling, the better it reduces the plant stress. The 15 oC treatment also showed the highest fruit set and fruit weight in some inflorescences especially during early plant stage. This root zone cooling has the potential and is a promising technique to reduce heat stress. The improvement of the technique in future research will help to achieve the objective to reduce the adverse effects of heat stress in plant production.
Acknowledgements
The authors would like to thank MARDI for permission granted to present these findings. Thanks are also due to all supporting staff in the Physiology Laboratory, Strategic Resource and Mechanization and Automation Research Centre for their help and support. The research was funded by IRPA grant (RM217710 IP).
References
Abdul-Baki, A.A. and Stommel, J.R. 1995. Pollen viability and fruit set of tomato genotypes under
optimum- and high-temperature regimes. HortScience 30: 115-117. Adams, P. and Ho, L.C. 1993. Effects of environment on the uptake and distribution of calcium in
tomato and on the incidence of blossom-end rot. Plant and Soil 154: 127- 132. Banuelos, G.S., Offermann, G.P. and Seim, E.C. 1985. High relative humidity promotes blossom-end
rot on growing tomato fruit. HortScience 205: 894–895. Dorais, M., Demers, D.A., Papadopoulos, A.P. and Van Ieperen, W. 2004. Greenhouse tomato fruit
cuticle cracking. Horticultural Reviews 30: 163-184. Harmanto, Tantau, H.J. and Salokhe, V.M. 2006. Microclimate and air exchange rates in greenhouses
covered with different nets in the humid tropics. Biosystems Engineering 94: 239-253. Moller, M., Tanny, J., Li, Y. and Cohen, S. 2004. Measuring and predicting evapotranspiration in an
insect-proof screenhouse. Agricultural and Forest Meteorology 127: 35-51. Morales, D., Rodriguez, P., Dell’Amico, J., Nicolas, E., Torrecillas, A. and Sanchez-Blanco, M.J.
2003. High-temperature preconditioning and thermal shock imposition affects water relations, gas exchange and root hydraulic conductivity in tomato. Biologia Plantarium 47: 6-12.
Mutwiwa, U.N., von Elsner, B., Max, J.F.J. and Tantau, H.J. 2007. Cooling naturally ventilated greenhouses in the tropics by near-infra red reflection. Acta Horticulturae 801: 259-266.
Peet, M., Sato, S., Cle´mente, C. and Pressman, E. 2003. Heat stress increases sensitivity of pollen, fruit and seed production in tomatoes (Lycopersicon esculentum Mill.) tonon-optimal vapor pressure deficits. Acta Horticulturae 618: 209-215.
Peet, M.M., Willits, D.H. and Gardner, R. 1997. Response of ovule development and post-pollen production processes in male-sterile tomatoes to chronic, sub acute high temperature stress. Journal of Experimental Botany 48: 101-111.
Sato, S., Peet, M.M. and Thomas, J.F. 2000. Physiological factors limit fruit set of tomato (Lycopersicon esculentum Mill.) under chronic, mild heat stress. Plant Cell & Environment 23: 719-726.

ISBN 978-967-10840-0-7 Trans. Malaysian Soc. Plant Physiol. 19
First Published, 2011
66
CHAPTER 4
PEST AND DISEASE
MANAGEMENT
ISBN 978-967-10840-0-7 Trans. Malaysian Soc. Plant Physiol. 19
First Published, 2011
67
Screening and In vitro Biocontrol Activities of Bacillus subtilis Against
Anthracnose of Papaya (Carica papaya var. Frangi)
Hasan, M.F.
1,*, Mahmud, T.M.M.
1, Kadir, J.
2, Ding, P
1 and Zaidul, I.S.M.
3
1Department of Crop Science, Faculty of Agriculture 2Department of Plant Protection, Faculty of Agriculture 3Department of Food Science, Faculty of Food Science and Technology, University Putra Malaysia, 43400 Serdang, Selangor, Malaysia. *E-mail: [email protected]
Introduction
Papaya (Carica papaya L.) is considered one of the most important fruit crops due to its worldwide demand. In 2006, Malaysia occupied the second position for papaya export after Mexico (USDA, 2009). At present, Frangi is considered as a leading cultivar of papaya especially for export. However, being a highly perishable fruit, papaya suffers from different postharvest diseases. Anthracnose disease, caused by Colletotrichum gloeosporioides, is the major postharvest disease of papaya in Malaysia (Rahman et al., 2007). Anthracnose of papaya can be controlled by using propiconazole or prochloraz (Sepiah, 1993), hot-water-dip treatment (Couey et al., 1984). However, the ripening process of papaya is affected by hot-water dip treatment (Paull, 1990). Although chemical control is comparatively suitable option to control postharvest diseases, environmental and health risks are high (Mari and Guizzardi,1998; Janisiewicz and Korsten, 2002). Due to this reason, consumer demand is increasing for fruit which has been treated non-chemically for postharvest pathogen. It is therefore necessary to develop alternatives to synthetic fungicide to reduce environmental risks and raise consumer confidence. Biological control using antagonistic microorganisms can be an attractive alternative to synthetic fungicides due to their ability to antagonize the pathogen by different modes of action (Janisiewicz and Jeffers, 1997; Zhou et al., 2001). While a number of Gram negative bacteria, e.g., Pseudomonas, Erwinia have received considerable attention as potential biocontrol agent (Braun-Kiewnick et al., 2000; Costa et al., 2001); the bacilli are getting attention mainly due to their ability to produce different types of antibiotics (bacilysin, iturin, mycosubtilin), UV light resistant spores, and able to induce growth and defense response in the host plant (Shoda 2000; Raaijmakers et al., 2002). In the present study, an efficient strain of Bacillus subtilis B34, isolated from papaya fruit surface has been characterized with special reference to its biological control abilities of anthracnose disease in papaya fruits caused by Colletotrichum gloeosporioides.
Materials and Methods
Colletotrichum gloeosporioides the causal organism of anthracnose of papaya was taken from naturally infected papaya fruits and maintained on PDA. The potential bacterial antagonists were isolated from healthy part of papaya fruits cv. Eksotica II of MARDI, Selangor, Malaysia by dilution method. Four days old 6 mm diameter C. gloeosporioides plugs were placed on the centre of a 9 cm diameter petri dishes containing PDA. A loop full bacterial isolate from 24 h culture was then streaked on PDA 1.5 cm from the edge of plate and incubated at 28 ± 2 °C for 7 days. Then percent inhibition of radial growth (PIRG) was recorded according to Sivakumar et al. (2002). The antagonists were then identified by using BIOLOG Omnilog Gen III microbial identification system. Strain B34, B60 and B71 were subcultured on nutrient agar and incubated for 24 h at 28 ± 2 °C. A single colony of each isolate was taken from the nutrient agar and spread on Biolog universal growth medium (BUGM) and plates were incubated at 28 ± 2 °C for 24 h. Grown on BUG medium were identified according to manufacturer’s instructions.
ISBN 978-967-10840-0-7 Trans. Malaysian Soc. Plant Physiol. 19
First Published, 2011
68
Hundred µL of 108 CFU mL-1 cell suspension of each bacteria and spore suspension of the test fungus were placed into a sterile test tube and incubated for 30 min at 28 ± 2 ºC. Then 100 µL of mixed suspension was spread over the PDA plates and incubated for 24 h at room temperature (28 ± 2 ºC). Spores were examined under a microscope for germination. Sandwich plates were prepared consisting of two different layers of agar media. Firstly, 10 ml of PDA was poured into 9 cm diameter of Petri dishes as a basal medium and a layer of sterilized filter paper (Whatman filter paper no. 1) was then placed on the top of the solid layer of PDA and 15 ml of molten NA was poured on it. A 100 µL of each antagonistic bacterial suspension (108 CFU mL-1) was then inoculated in the center of the petri dishes contained sandwich media. After incubation for three days at 28 ± 2 ºC, the NA media with the grown bacterial isolates and filter paper layers were removed, and the plates were inoculated with a 6 mm mycelial disk of a 4 day old culture of C.
gloeosporioides. Plates were then incubated at 28 ± 2 ºC for further 7 days and the radial growth of the fungus was measured. Sterile distilled water were used instead of bacteria in control plate, and further inoculated with C. gloeosporioides (Montealegre et al., 2003). A four day old 6 mm diameter mycelial plug of C. gloeosporioides was transferred to the center of a petri dish, containing 15 mL of PDB and incubated at 28 ± 2 °C for two days then 1 mL of each bacterial suspension (108 CFU mL-1) was transferred to the plate, and the culture was further incubated at 28 ± 2 °C for another three days then hyphal strands were examined under a microscope for abnormalities (Sariah, 1994). The experiment was arranged in a Completely Randomized Design with 12 replications and repeated once.
Results and Discussions
Isolation and selection of antagonistic bacteria by dual culture method
Eighty one bacteria were isolated from the surface of papaya. Among them 16 were inhibitory towards C. gloeosporioides on PDA. Out of 16, B34 had a significantly (P≤0.05) higher PIRG (84.58 %) followed by B71 (80.55%) and B60 (79.25%) than the others, after seven days of incubation (Table 1). These three strains strongly inhibited the mycelial growth of C. gloeosporioides on PDA medium (Figure 1). In addition, when PDA plugs from interaction zone were re-cultured on fresh PDA plates, no mycelial growth was observed after four days of incubation. Findings of this study are in agreement with Shoda (2000) who reported that Bacillus species was detected as antibiotic producer and inhabitant of Phyllosphere. Identification of antagonists used in this study
The antagonistic isolates were identified by using BIOLOG Omnilog Gen III microbial identification system, isolate B34, B60 and B71 were identified as Bacillus subtilis. All of the strains were rod shape and Gram positive. Among the strains, B34 was 94.8%similarity with Bacillus subtilis (Table 2). Production of diffusible antifungal substances
The strains B. subtilis B34, B60 and B71 were found to produce diffusible antibiotics, which showed significant difference with control (P≤0.05) in respect of mycelial growth inhibition (Table 2). Mycelial growth of C. gloeosporioides was completely inhibited by diffusible antibiotics produced by the strains.
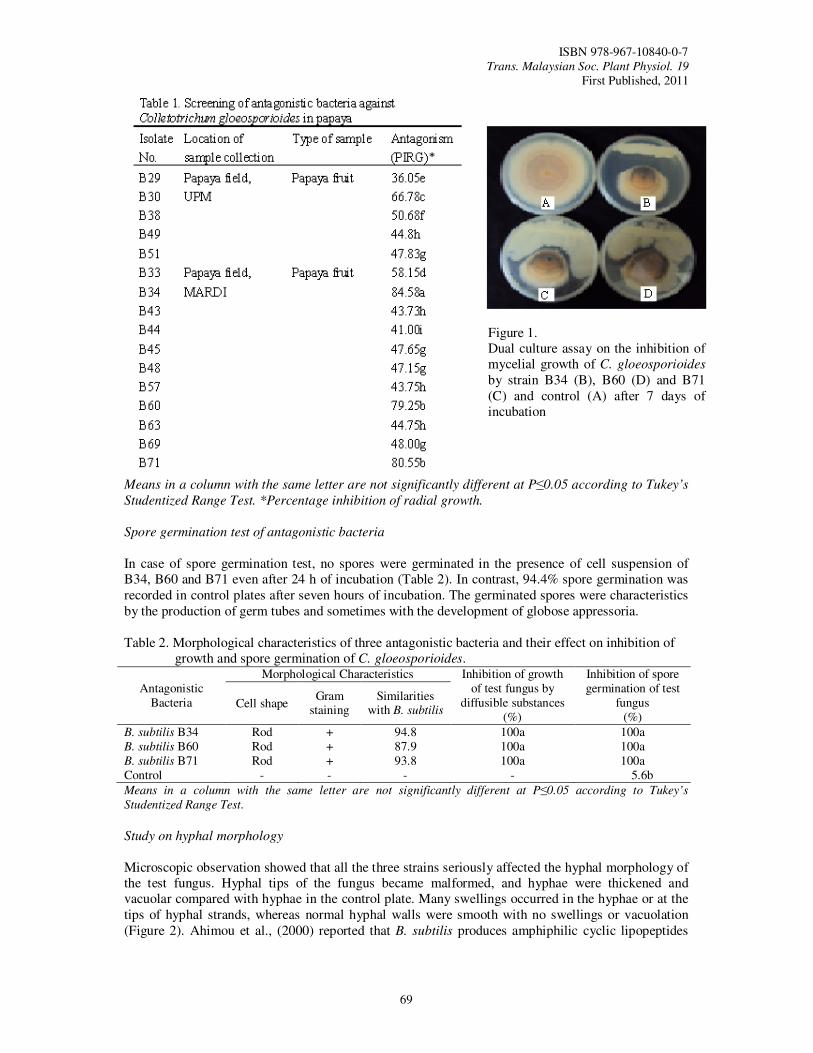
ISBN 978-967-10840-0-7 Trans. Malaysian Soc. Plant Physiol. 19
First Published, 2011
69
Means in a column with the same letter are not significantly different at P≤0.05 according to Tukey’s
Studentized Range Test. *Percentage inhibition of radial growth.
Spore germination test of antagonistic bacteria
In case of spore germination test, no spores were germinated in the presence of cell suspension of B34, B60 and B71 even after 24 h of incubation (Table 2). In contrast, 94.4% spore germination was recorded in control plates after seven hours of incubation. The germinated spores were characteristics by the production of germ tubes and sometimes with the development of globose appressoria. Table 2. Morphological characteristics of three antagonistic bacteria and their effect on inhibition of
growth and spore germination of C. gloeosporioides.
Antagonistic Bacteria
Morphological Characteristics Inhibition of growth of test fungus by
diffusible substances (%)
Inhibition of spore germination of test
fungus (%)
Cell shape Gram
staining Similarities
with B. subtilis
B. subtilis B34 Rod + 94.8 100a 100a B. subtilis B60 Rod + 87.9 100a 100a B. subtilis B71 Rod + 93.8 100a 100a Control - - - - 5.6b
Means in a column with the same letter are not significantly different at P≤0.05 according to Tukey’s
Studentized Range Test.
Study on hyphal morphology
Microscopic observation showed that all the three strains seriously affected the hyphal morphology of the test fungus. Hyphal tips of the fungus became malformed, and hyphae were thickened and vacuolar compared with hyphae in the control plate. Many swellings occurred in the hyphae or at the tips of hyphal strands, whereas normal hyphal walls were smooth with no swellings or vacuolation (Figure 2). Ahimou et al., (2000) reported that B. subtilis produces amphiphilic cyclic lipopeptides
Figure 1. Dual culture assay on the inhibition of mycelial growth of C. gloeosporioides
by strain B34 (B), B60 (D) and B71 (C) and control (A) after 7 days of incubation
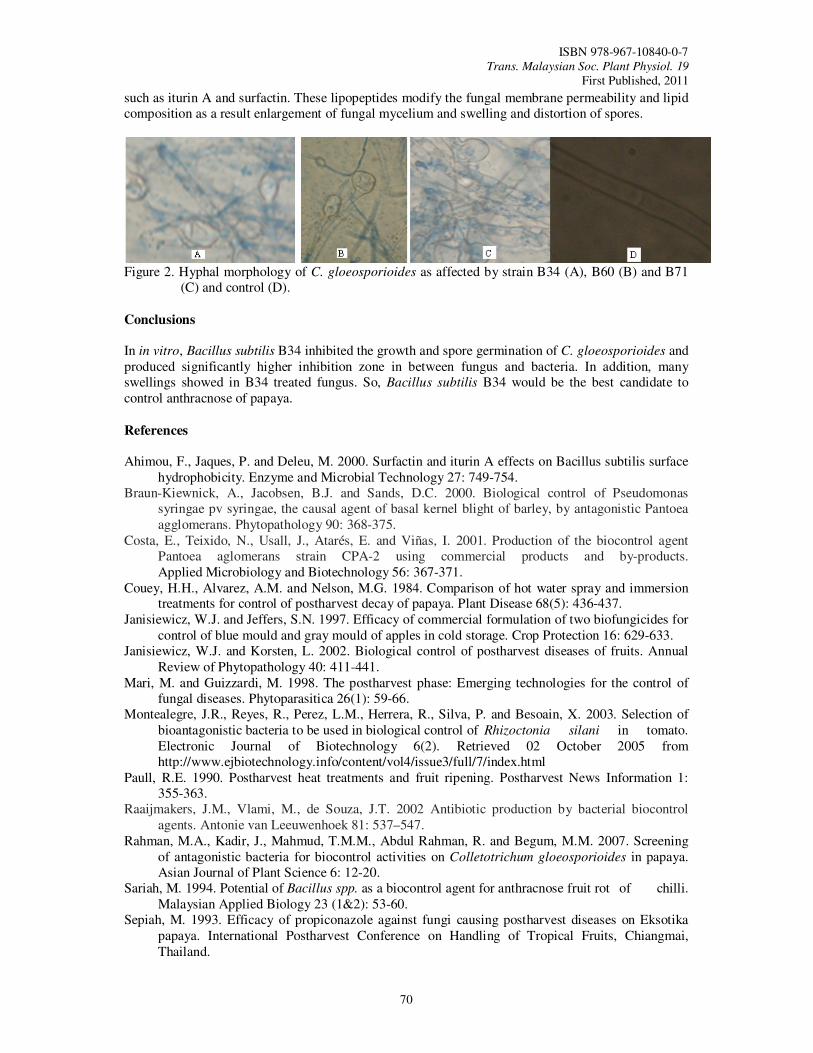
ISBN 978-967-10840-0-7 Trans. Malaysian Soc. Plant Physiol. 19
First Published, 2011
70
such as iturin A and surfactin. These lipopeptides modify the fungal membrane permeability and lipid composition as a result enlargement of fungal mycelium and swelling and distortion of spores.
Figure 2. Hyphal morphology of C. gloeosporioides as affected by strain B34 (A), B60 (B) and B71
(C) and control (D).
Conclusions
In in vitro, Bacillus subtilis B34 inhibited the growth and spore germination of C. gloeosporioides and produced significantly higher inhibition zone in between fungus and bacteria. In addition, many swellings showed in B34 treated fungus. So, Bacillus subtilis B34 would be the best candidate to control anthracnose of papaya.
References
Ahimou, F., Jaques, P. and Deleu, M. 2000. Surfactin and iturin A effects on Bacillus subtilis surface
hydrophobicity. Enzyme and Microbial Technology 27: 749-754. Braun-Kiewnick, A., Jacobsen, B.J. and Sands, D.C. 2000. Biological control of Pseudomonas
syringae pv syringae, the causal agent of basal kernel blight of barley, by antagonistic Pantoea agglomerans. Phytopathology 90: 368-375.
Costa, E., Teixido, N., Usall, J., Atarés, E. and Viñas, I. 2001. Production of the biocontrol agent Pantoea aglomerans strain CPA-2 using commercial products and by-products. Applied Microbiology and Biotechnology 56: 367-371.
Couey, H.H., Alvarez, A.M. and Nelson, M.G. 1984. Comparison of hot water spray and immersion treatments for control of postharvest decay of papaya. Plant Disease 68(5): 436-437.
Janisiewicz, W.J. and Jeffers, S.N. 1997. Efficacy of commercial formulation of two biofungicides for control of blue mould and gray mould of apples in cold storage. Crop Protection 16: 629-633.
Janisiewicz, W.J. and Korsten, L. 2002. Biological control of postharvest diseases of fruits. Annual Review of Phytopathology 40: 411-441.
Mari, M. and Guizzardi, M. 1998. The postharvest phase: Emerging technologies for the control of fungal diseases. Phytoparasitica 26(1): 59-66.
Montealegre, J.R., Reyes, R., Perez, L.M., Herrera, R., Silva, P. and Besoain, X. 2003. Selection of bioantagonistic bacteria to be used in biological control of Rhizoctonia silani in tomato. Electronic Journal of Biotechnology 6(2). Retrieved 02 October 2005 from http://www.ejbiotechnology.info/content/vol4/issue3/full/7/index.html
Paull, R.E. 1990. Postharvest heat treatments and fruit ripening. Postharvest News Information 1: 355-363.
Raaijmakers, J.M., Vlami, M., de Souza, J.T. 2002 Antibiotic production by bacterial biocontrol agents. Antonie van Leeuwenhoek 81: 537–547.
Rahman, M.A., Kadir, J., Mahmud, T.M.M., Abdul Rahman, R. and Begum, M.M. 2007. Screening of antagonistic bacteria for biocontrol activities on Colletotrichum gloeosporioides in papaya. Asian Journal of Plant Science 6: 12-20.
Sariah, M. 1994. Potential of Bacillus spp. as a biocontrol agent for anthracnose fruit rot of chilli. Malaysian Applied Biology 23 (1&2): 53-60.
Sepiah, M. 1993. Efficacy of propiconazole against fungi causing postharvest diseases on Eksotika papaya. International Postharvest Conference on Handling of Tropical Fruits, Chiangmai, Thailand.

ISBN 978-967-10840-0-7 Trans. Malaysian Soc. Plant Physiol. 19
First Published, 2011
71
Shoda, M. 2000. Bacterial control of plant diseases. Journal of Bioscience and Bioengineering 89:515–521.
Sivakumar, D., Hewarathgamagae, N.K., Wilson Wijeratnam, R.S. and Wijesundera, R.L.C. 2002. Effect of ammonium carbonate and sodium bicarbonate on anthracnose of papaya. Phytoparasitica 30 (5): 486-492.
USDA, 2009. Animal and Plant Health Inspection Service, Fresh Fruit and Vegetable Import Manual, http://www.aphis.usda.gov/import_export/plants/manuals/ports/
Zhou, T., Chu, C.L., Liu, W.T. and Schaneider, K.E. 2001. Postharvest control of blue mould and gray mould on apples using isolates of Pseudomonas syringae. Canadian Journal of Plant Pathology 23: 246-252.
ISBN 978-967-10840-0-7 Trans. Malaysian Soc. Plant Physiol. 19
First Published, 2011
72
Spray Drift Effect in Control Plot of a Supervised Residue Trial of
Fungicide in a Carambola Plot
Ngan, C.K.*, Khairatul, A.M., Mohammad Shahid, S. Jamiah, J. and Lim, K.P. Strategic Resource Research Centre, Malaysian Agricultural Research and Development Institute (MARDI), P.O.Box 12301, 50774 Kuala Lumpur, Malaysia. *E-mail: [email protected]
Intorduction Submission of pesticide residue data on edible crop is part of the requirements of the most regulatory authorities throughout the world, which is imposed to the registrant of pesticide product. Usually such residue data is generated from implementation of supervised residue trial of pesticide application on crop plant or crop itself. It is recommended that application of pesticide in such trial follows critical Good Agriculture Practice (GAP) (FAO 1997) in which all aspect of pesticide application within the scope of GAP that could lead to the likelihood of maximum concentration of pesticide residue found in tested crop, is adopted. Among these aspects are maximum permitted dosage of pesticide formulation, maximum number of application of pesticide per season, and shortest permitted Pre-Harvest Interval (PHI). One general feature of residue trial design is the existence of untreated plot of same plot size and similar number of trees to the treated plot. Such plot is known as control plot. Allocation of control plot is part of scientific method to ensure that the whole experimentation is conducted in systematic manner in which negative result in control sample is construed as an interpretation of the experimental design that manage to isolate certain effect so that certain effect attributed to certain factor can be identified. Existence of positive result in control sample is an indication of cross-contamination or other influencing factors which are not clearly identified during the experimental design and conduct. Such positive result in control sample could lead to rejection of the whole set of residue data by the authority on ground of invalid experimental set up. Such rejection will be a loss for the pesticide registrant in term of resources spent in generating residue data. Carambola is subjected to attack from a wide range of insects and fungi thus necessitating the use of pesticides. One of the widely used fungicides in carambola is azoxystrobin under the trademark of AMISTAR, which was introduced in Malaysian market for use on carambola in 2006. Azoxystrobin is a strobilurin fungicide used to control phyllosphere fungi (Bertelsen et al., 2001). In the study, a supervised residue trial of azoxystrobin application on carambola farm was conducted with the aim of obtaining residue data for the purpose of Maximum Residue Limit, MRL setting. Materials and Methods
Study plot, treatment and sampling
Supervised residue trial was conducted at carambola plot in MARDI Research Station, Jelebu, Negeri Sembilan. The trial was conducted according to the FAO guideline on supervised residue trial in which treated and untreated plot were set up within the test site and the two plots were separated by 3-4 rows of tree, which act as buffer zone. The treated plot were treated with AMISTAR (active ingredient: azoxystrobin) at the manufacturer recommended rate (0.1147 kg a.i./ha). The fungicide was applied two times (maximum permitted application per season) on carambola with a motorized sprayer. The first application of fungicide was timed about one week before fruit harvest, whereas the second (last) application was timed one day before harvest date. Carambola samples (2 kg) were randomly collected from the plots at -1, 0, 1 and 2 days after the last spray.
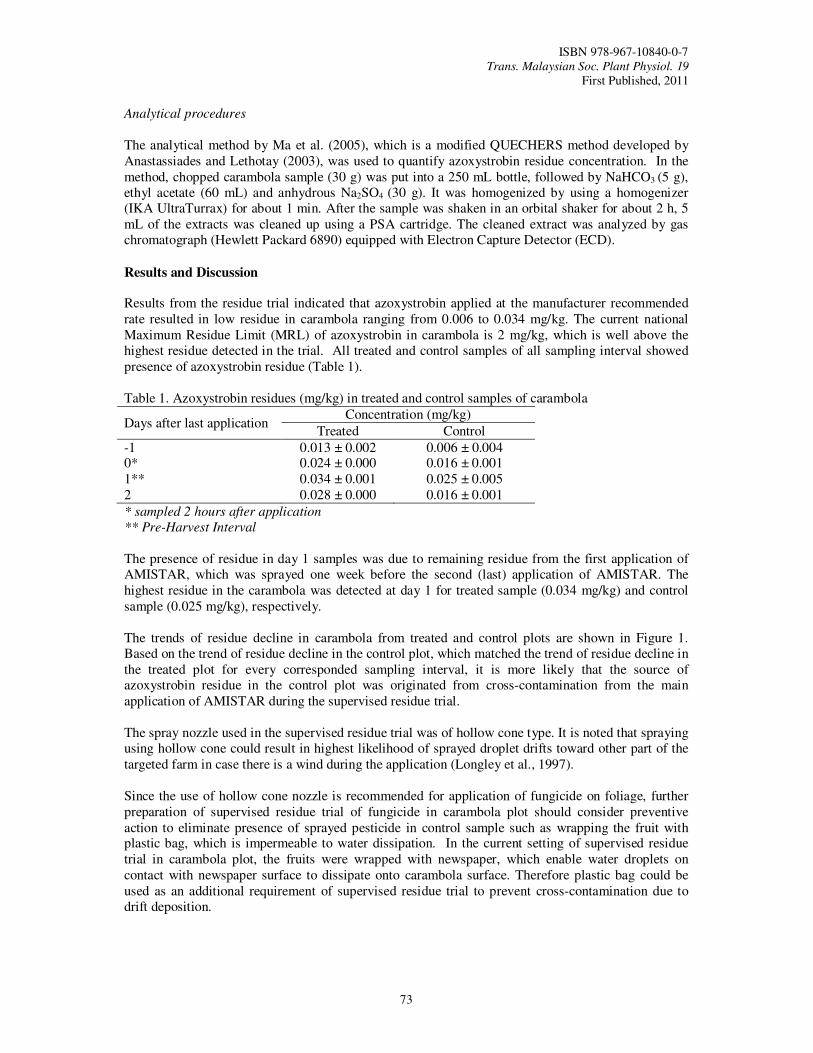
ISBN 978-967-10840-0-7 Trans. Malaysian Soc. Plant Physiol. 19
First Published, 2011
73
Analytical procedures
The analytical method by Ma et al. (2005), which is a modified QUECHERS method developed by
Anastassiades and Lethotay (2003), was used to quantify azoxystrobin residue concentration. In the method, chopped carambola sample (30 g) was put into a 250 mL bottle, followed by NaHCO3 (5 g), ethyl acetate (60 mL) and anhydrous Na2SO4 (30 g). It was homogenized by using a homogenizer (IKA UltraTurrax) for about 1 min. After the sample was shaken in an orbital shaker for about 2 h, 5 mL of the extracts was cleaned up using a PSA cartridge. The cleaned extract was analyzed by gas chromatograph (Hewlett Packard 6890) equipped with Electron Capture Detector (ECD).
Results and Discussion Results from the residue trial indicated that azoxystrobin applied at the manufacturer recommended rate resulted in low residue in carambola ranging from 0.006 to 0.034 mg/kg. The current national Maximum Residue Limit (MRL) of azoxystrobin in carambola is 2 mg/kg, which is well above the highest residue detected in the trial. All treated and control samples of all sampling interval showed presence of azoxystrobin residue (Table 1). Table 1. Azoxystrobin residues (mg/kg) in treated and control samples of carambola
Days after last application Concentration (mg/kg)
Treated Control
-1 0.013 ± 0.002 0.006 ± 0.004 0* 0.024 ± 0.000 0.016 ± 0.001 1** 0.034 ± 0.001 0.025 ± 0.005 2 0.028 ± 0.000 0.016 ± 0.001
* sampled 2 hours after application
** Pre-Harvest Interval
The presence of residue in day 1 samples was due to remaining residue from the first application of AMISTAR, which was sprayed one week before the second (last) application of AMISTAR. The highest residue in the carambola was detected at day 1 for treated sample (0.034 mg/kg) and control sample (0.025 mg/kg), respectively. The trends of residue decline in carambola from treated and control plots are shown in Figure 1. Based on the trend of residue decline in the control plot, which matched the trend of residue decline in the treated plot for every corresponded sampling interval, it is more likely that the source of azoxystrobin residue in the control plot was originated from cross-contamination from the main application of AMISTAR during the supervised residue trial. The spray nozzle used in the supervised residue trial was of hollow cone type. It is noted that spraying using hollow cone could result in highest likelihood of sprayed droplet drifts toward other part of the targeted farm in case there is a wind during the application (Longley et al., 1997). Since the use of hollow cone nozzle is recommended for application of fungicide on foliage, further preparation of supervised residue trial of fungicide in carambola plot should consider preventive action to eliminate presence of sprayed pesticide in control sample such as wrapping the fruit with plastic bag, which is impermeable to water dissipation. In the current setting of supervised residue trial in carambola plot, the fruits were wrapped with newspaper, which enable water droplets on contact with newspaper surface to dissipate onto carambola surface. Therefore plastic bag could be used as an additional requirement of supervised residue trial to prevent cross-contamination due to drift deposition.
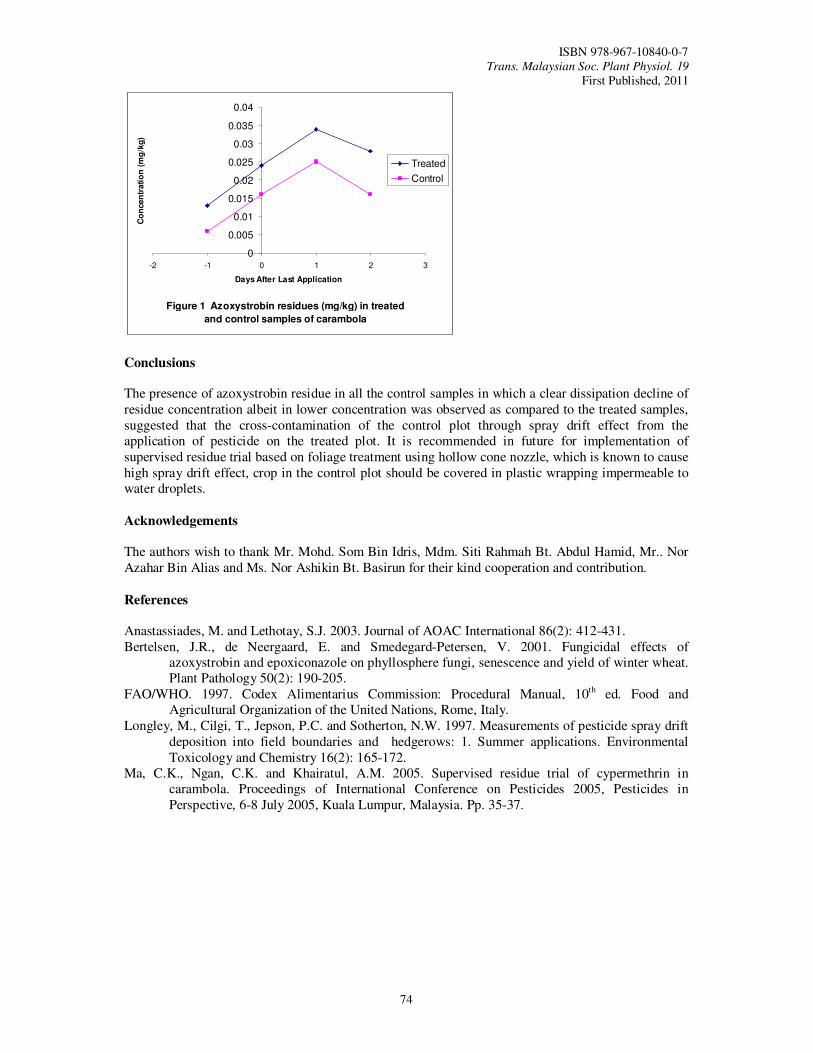
ISBN 978-967-10840-0-7 Trans. Malaysian Soc. Plant Physiol. 19
First Published, 2011
74
Figure 1 Azoxystrobin residues (mg/kg) in treated
and control samples of carambola
0
0.005
0.01
0.015
0.02
0.025
0.03
0.035
0.04
-2 -1 0 1 2 3
Days After Last Application
Co
ncen
trati
on
(m
g/k
g)
Treated
Control
Conclusions The presence of azoxystrobin residue in all the control samples in which a clear dissipation decline of residue concentration albeit in lower concentration was observed as compared to the treated samples, suggested that the cross-contamination of the control plot through spray drift effect from the application of pesticide on the treated plot. It is recommended in future for implementation of supervised residue trial based on foliage treatment using hollow cone nozzle, which is known to cause high spray drift effect, crop in the control plot should be covered in plastic wrapping impermeable to water droplets.
Acknowledgements The authors wish to thank Mr. Mohd. Som Bin Idris, Mdm. Siti Rahmah Bt. Abdul Hamid, Mr.. Nor Azahar Bin Alias and Ms. Nor Ashikin Bt. Basirun for their kind cooperation and contribution.
References Anastassiades, M. and Lethotay, S.J. 2003. Journal of AOAC International 86(2): 412-431. Bertelsen, J.R., de Neergaard, E. and Smedegard-Petersen, V. 2001. Fungicidal effects of
azoxystrobin and epoxiconazole on phyllosphere fungi, senescence and yield of winter wheat. Plant Pathology 50(2): 190-205.
FAO/WHO. 1997. Codex Alimentarius Commission: Procedural Manual, 10th ed. Food and Agricultural Organization of the United Nations, Rome, Italy.
Longley, M., Cilgi, T., Jepson, P.C. and Sotherton, N.W. 1997. Measurements of pesticide spray drift deposition into field boundaries and hedgerows: 1. Summer applications. Environmental Toxicology and Chemistry 16(2): 165-172.
Ma, C.K., Ngan, C.K. and Khairatul, A.M. 2005. Supervised residue trial of cypermethrin in carambola. Proceedings of International Conference on Pesticides 2005, Pesticides in Perspective, 6-8 July 2005, Kuala Lumpur, Malaysia. Pp. 35-37.

ISBN 978-967-10840-0-7 Trans. Malaysian Soc. Plant Physiol. 19
First Published, 2011
75
CHAPTER 5
BEST PRACTICES AND
CURRENT TECHNIQUES
ISBN 978-967-10840-0-7 Trans. Malaysian Soc. Plant Physiol. 19
First Published, 2011
76
Extraction of Jatropha curcas Fruits for Antifungal Activity
Rahman, M.M.1 Ahmad, S.H.1,* Mahmud, T.M.M.1 and Rahman, M.Z.A.2 1Department of Crop Science, Faculty of Agriculture, 2Department of Chemistry, Faculty of Science, Universiti Putra Malaysia, 43400 UPM Serdang, Selangor, Malaysia. *E-mail: [email protected]
Introduction
Fungal diseases are most common among the postharvest pathogens which cause decay and postharvest losses. To reduce postharvest diseases of fruits and vegetables, many alternatives to chemical control have been investigated which include the use of biocontrol agents (Janisiewicz and Korsten, 2002), irradiation and other physical treatments (Nigro et al., 2002), natural antimicrobial substances (Ippolito and Nigro, 2003), and organic and inorganic compounds (Palou et al., 2002). A vital alternative to fungicides that is promising for managing postharvest diseases of fruits in a wide range of crops is plant extracts. According to Thangavelu et al., (2004), the mycelial growth of Colletotrichum musae was inhibited by the Jutropha curcas extracts which are able to control the anthracnose disease in bananas. Sepiah (1993) and Couey et al., (1984) reported that anthracnose of papaya could be controlled by application of fungicides, hot water dip treatment (HWT), or HWT in combination with fungicides at postharvest stage. However, hot water dip treatment affects the ripening process in papaya and heat treatment leads to enhanced softening of fruit. Currently, there is a growing public concern on the possible risks of the use of synthetic fungicides on food commodities to human health (Wilson and Wisniewski, 1994). According to Conway et al., (2004) the use of commonly used fungicides leads to development of resistance within the populations of postharvest pathogens. In many subtropical and semi-arid regions, traditionally, jatropha is used for its medicinal properties and its seeds contain semi-dry oil which has been found useful for medicinal purposes. Seed and leaf extracts of J. curcas, have shown molluscicidal, insecticidal and fungicidal properties (Rug and Ruppel 2000). Studies by Daouk et al., (1995) and Kishore et al., (1993) found that the essential oils have antifungal activities. Their studies focused on the antifungal activities of essential oils against soil borne pathogens and food storage fungi. However, information on the use of extracts of J. curcas as an agent against anthracnose (Colletotrichum gloeosporioides) is still scarce. Therefore, this study was carried out to investigate the natural antifungal properties of J. curcas fruit extracts against fungal phytopathogen.
Materials and Methods Extraction of plant material
Jatropha fruits, pulp and seeds were collected from LADANG 2, Fakulti Pertanian, Universiti Putra Malaysia. The samples were air-dried at ambient temperature for 3 days, then oven-dried at 50 oC for 5 - 7 days to remove the residual moisture. Equivalent amounts (20 g) of crushed samples of jatropha fruits, pulp and seeds were soaked in 120 mL methanol and sealed with aluminium foil and parafilm to prevent evaporation. The suspended solutions were left to stand for 7 days and then were filtered and evaporated. The extracted components were used as an antifungal agent against Colletotrichum
gloeosporioides by using the potato dextrose agar (PDA) method. (Okoh et al., 2009; Obafemi et al., 2006).
Collection and culture of Colletotrichum gloeosporioides
In this study, the antifungal activity of jatropha extract was studied against the Colletotrichum
gloeosporioides collected from diseased papaya fruits. Fresh culture was obtained by transferring a
ISBN 978-967-10840-0-7 Trans. Malaysian Soc. Plant Physiol. 19
First Published, 2011
77
loopful of culture onto PDA and then incubated at 28 ± 2°C for 7 days. The microbiological medium was prepared according to standard instructions provided by the Dickinson and Company, (Sparks, MD 21152 USA). The medium used for antifungal activity was PDA which was prepared and sterilized at 121°C at 15 psi for 15 minutes in an autoclave. Twenty-five mL of pre autoclaved PDA was poured into a 90 mm diameter pre sterilized Petri- dishes and allowed to solidify at room temperature. Anti fungal activity of jatropha fruits (well-diffusion method)
After the PDA had solidified, 7 day-old C. gloeosporioides was plated out. A well of 6 mm diameter was made in the center of each petriplate with the help of a cork borer. 10 mg ml-1 of J. curcas plant extract, as used by Igbinosa et al. (2009), was spread the PDA medium using an L-shaped sterilized glass rod under an aseptic condition of a laminar air flow. The Petri-dishes were incubated for 72 hours at 37 °C in the incubator. After incubation, the diameter of the clear zone of inhibition around the disc was measured.
Results and Discussion
Results showed that jatropha seeds and pulp extracts have higher antifungal quality than whole fruit extract (Table 1). The Petri-dishes were incubated at 25 ± 2 °C. Percentage inhibition was calculated after 7 days using the formula of Vincent (1947). C - T I = -------- x 100 C Where,
I = Percent inhibition C = Radial growth in control set (mm) T = Radial growth in control treated (mm)
The extracts of jatropha seeds significantly showed antifungal activities with radial growth inhibition zone of 5.6 mm or equivalent to 78.87% followed by pulp with zone of 7.4 mm or equivalent to 72.07% and whole fruits with zone of 14.2 mm or equivalent to 46.42% as compared to the control with zone of 26.5 mm or equivalent to 100% (Figure 1). Extracts from various parts of jatropha species have been reported to show antifungal and antimicrobial activities. Extracts from roots of J.
podagrica has been found to have moderate antifungal activity against Candida albicans (Aiyelaagbe et al., 2000). Our result is in agreement with the study of Ogbebor et al., (2007) who reported that the J. curcas leaf extracts inhibited the mycelial growth of C. gloeosporioides. Jatropha extracts caused complete inhibition of mycelia growth of C. gloeosporiodes, which is responsible for anthracnose, dieback, root rot, leaf spot, blossom rot, and seedling blight of tropical fruit crops.
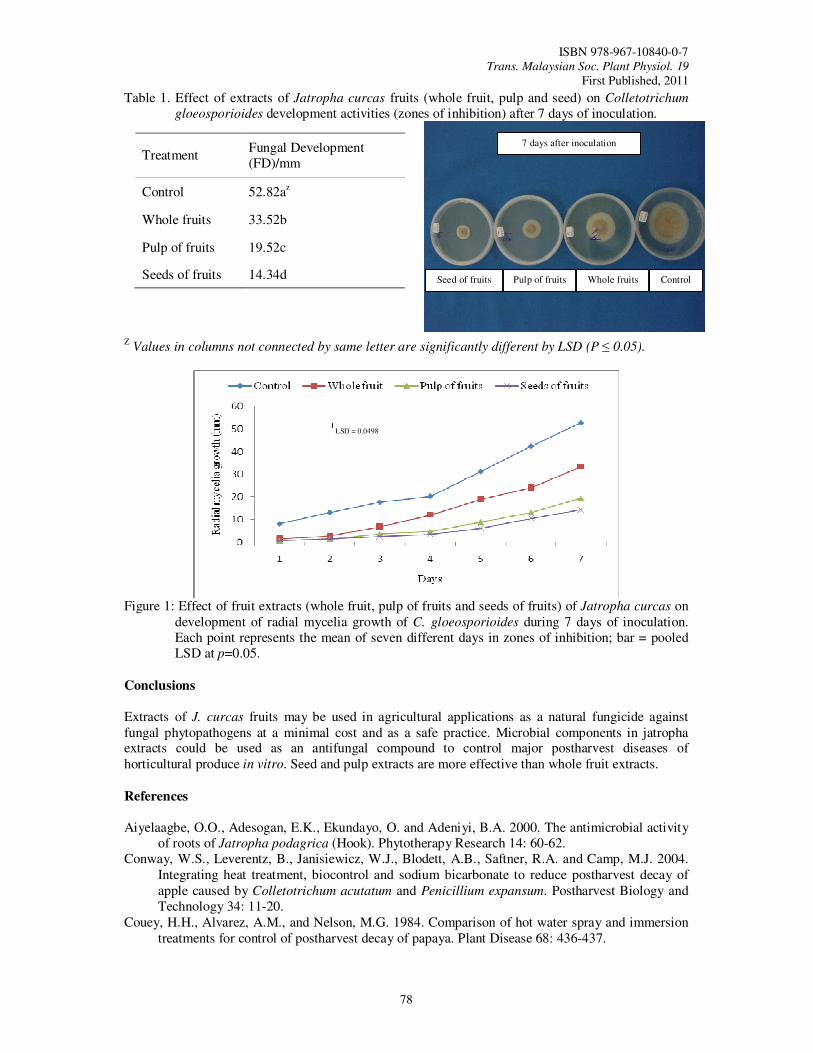
ISBN 978-967-10840-0-7 Trans. Malaysian Soc. Plant Physiol. 19
First Published, 2011
78
Table 1. Effect of extracts of Jatropha curcas fruits (whole fruit, pulp and seed) on Colletotrichum
gloeosporioides development activities (zones of inhibition) after 7 days of inoculation.
Treatment Fungal Development (FD)/mm
Control 52.82az
Whole fruits 33.52b
Pulp of fruits 19.52c
Seeds of fruits 14.34d
Z Values in columns not connected by same letter are significantly different by LSD (P ≤ 0.05).
Figure 1: Effect of fruit extracts (whole fruit, pulp of fruits and seeds of fruits) of Jatropha curcas on
development of radial mycelia growth of C. gloeosporioides during 7 days of inoculation. Each point represents the mean of seven different days in zones of inhibition; bar = pooled LSD at p=0.05.
Conclusions
Extracts of J. curcas fruits may be used in agricultural applications as a natural fungicide against fungal phytopathogens at a minimal cost and as a safe practice. Microbial components in jatropha extracts could be used as an antifungal compound to control major postharvest diseases of horticultural produce in vitro. Seed and pulp extracts are more effective than whole fruit extracts.
References
Aiyelaagbe, O.O., Adesogan, E.K., Ekundayo, O. and Adeniyi, B.A. 2000. The antimicrobial activity
of roots of Jatropha podagrica (Hook). Phytotherapy Research 14: 60-62. Conway, W.S., Leverentz, B., Janisiewicz, W.J., Blodett, A.B., Saftner, R.A. and Camp, M.J. 2004.
Integrating heat treatment, biocontrol and sodium bicarbonate to reduce postharvest decay of apple caused by Colletotrichum acutatum and Penicillium expansum. Postharvest Biology and Technology 34: 11-20.
Couey, H.H., Alvarez, A.M., and Nelson, M.G. 1984. Comparison of hot water spray and immersion treatments for control of postharvest decay of papaya. Plant Disease 68: 436-437.
LSD = 0.0498
7 days after inoculation
Seed of fruits Pulp of fruits Whole fruits Control
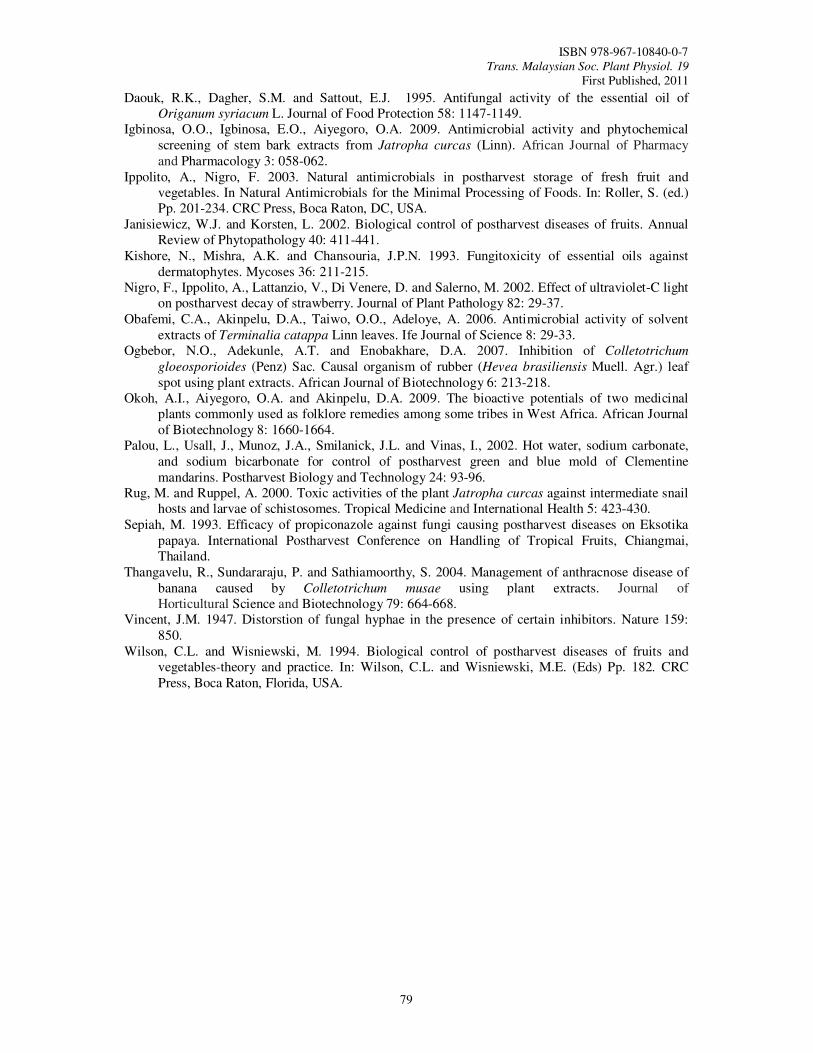
ISBN 978-967-10840-0-7 Trans. Malaysian Soc. Plant Physiol. 19
First Published, 2011
79
Daouk, R.K., Dagher, S.M. and Sattout, E.J. 1995. Antifungal activity of the essential oil of Origanum syriacum L. Journal of Food Protection 58: 1147-1149.
Igbinosa, O.O., Igbinosa, E.O., Aiyegoro, O.A. 2009. Antimicrobial activity and phytochemical screening of stem bark extracts from Jatropha curcas (Linn). African Journal of Pharmacy and Pharmacology 3: 058-062.
Ippolito, A., Nigro, F. 2003. Natural antimicrobials in postharvest storage of fresh fruit and vegetables. In Natural Antimicrobials for the Minimal Processing of Foods. In: Roller, S. (ed.) Pp. 201-234. CRC Press, Boca Raton, DC, USA.
Janisiewicz, W.J. and Korsten, L. 2002. Biological control of postharvest diseases of fruits. Annual Review of Phytopathology 40: 411-441.
Kishore, N., Mishra, A.K. and Chansouria, J.P.N. 1993. Fungitoxicity of essential oils against dermatophytes. Mycoses 36: 211-215.
Nigro, F., Ippolito, A., Lattanzio, V., Di Venere, D. and Salerno, M. 2002. Effect of ultraviolet-C light on postharvest decay of strawberry. Journal of Plant Pathology 82: 29-37.
Obafemi, C.A., Akinpelu, D.A., Taiwo, O.O., Adeloye, A. 2006. Antimicrobial activity of solvent extracts of Terminalia catappa Linn leaves. Ife Journal of Science 8: 29-33.
Ogbebor, N.O., Adekunle, A.T. and Enobakhare, D.A. 2007. Inhibition of Colletotrichum
gloeosporioides (Penz) Sac. Causal organism of rubber (Hevea brasiliensis Muell. Agr.) leaf spot using plant extracts. African Journal of Biotechnology 6: 213-218.
Okoh, A.I., Aiyegoro, O.A. and Akinpelu, D.A. 2009. The bioactive potentials of two medicinal plants commonly used as folklore remedies among some tribes in West Africa. African Journal of Biotechnology 8: 1660-1664.
Palou, L., Usall, J., Munoz, J.A., Smilanick, J.L. and Vinas, I., 2002. Hot water, sodium carbonate, and sodium bicarbonate for control of postharvest green and blue mold of Clementine mandarins. Postharvest Biology and Technology 24: 93-96.
Rug, M. and Ruppel, A. 2000. Toxic activities of the plant Jatropha curcas against intermediate snail hosts and larvae of schistosomes. Tropical Medicine and International Health 5: 423-430.
Sepiah, M. 1993. Efficacy of propiconazole against fungi causing postharvest diseases on Eksotika papaya. International Postharvest Conference on Handling of Tropical Fruits, Chiangmai, Thailand.
Thangavelu, R., Sundararaju, P. and Sathiamoorthy, S. 2004. Management of anthracnose disease of banana caused by Colletotrichum musae using plant extracts. Journal of Horticultural Science and Biotechnology 79: 664-668.
Vincent, J.M. 1947. Distorstion of fungal hyphae in the presence of certain inhibitors. Nature 159: 850.
Wilson, C.L. and Wisniewski, M. 1994. Biological control of postharvest diseases of fruits and vegetables-theory and practice. In: Wilson, C.L. and Wisniewski, M.E. (Eds) Pp. 182. CRC Press, Boca Raton, Florida, USA.
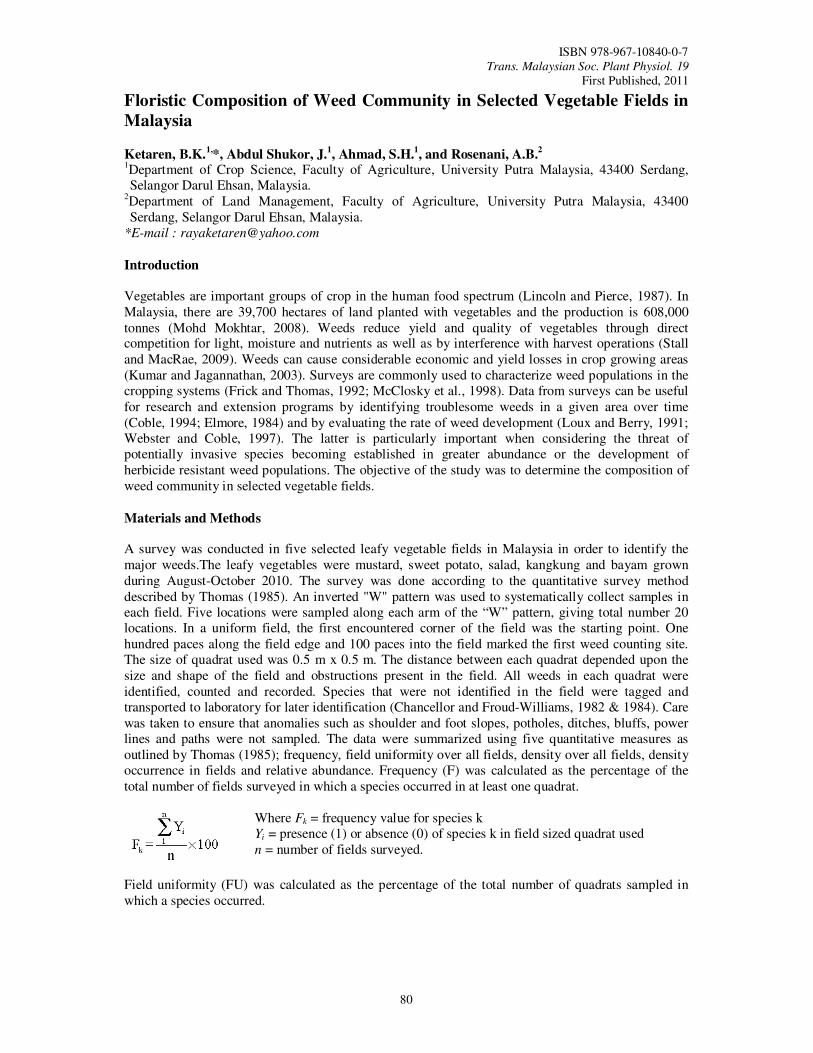
ISBN 978-967-10840-0-7 Trans. Malaysian Soc. Plant Physiol. 19
First Published, 2011
80
Floristic Composition of Weed Community in Selected Vegetable Fields in
Malaysia
Ketaren, B.K.1,*, Abdul Shukor, J.
1, Ahmad, S.H.
1, and Rosenani, A.B.
2
1Department of Crop Science, Faculty of Agriculture, University Putra Malaysia, 43400 Serdang, Selangor Darul Ehsan, Malaysia.
2Department of Land Management, Faculty of Agriculture, University Putra Malaysia, 43400 Serdang, Selangor Darul Ehsan, Malaysia.
*E-mail : [email protected]
Introduction
Vegetables are important groups of crop in the human food spectrum (Lincoln and Pierce, 1987). In Malaysia, there are 39,700 hectares of land planted with vegetables and the production is 608,000 tonnes (Mohd Mokhtar, 2008). Weeds reduce yield and quality of vegetables through direct competition for light, moisture and nutrients as well as by interference with harvest operations (Stall and MacRae, 2009). Weeds can cause considerable economic and yield losses in crop growing areas (Kumar and Jagannathan, 2003). Surveys are commonly used to characterize weed populations in the cropping systems (Frick and Thomas, 1992; McClosky et al., 1998). Data from surveys can be useful for research and extension programs by identifying troublesome weeds in a given area over time (Coble, 1994; Elmore, 1984) and by evaluating the rate of weed development (Loux and Berry, 1991; Webster and Coble, 1997). The latter is particularly important when considering the threat of potentially invasive species becoming established in greater abundance or the development of herbicide resistant weed populations. The objective of the study was to determine the composition of weed community in selected vegetable fields.
Materials and Methods
A survey was conducted in five selected leafy vegetable fields in Malaysia in order to identify the major weeds.The leafy vegetables were mustard, sweet potato, salad, kangkung and bayam grown during August-October 2010. The survey was done according to the quantitative survey method described by Thomas (1985). An inverted "W" pattern was used to systematically collect samples in each field. Five locations were sampled along each arm of the “W” pattern, giving total number 20 locations. In a uniform field, the first encountered corner of the field was the starting point. One hundred paces along the field edge and 100 paces into the field marked the first weed counting site. The size of quadrat used was 0.5 m x 0.5 m. The distance between each quadrat depended upon the size and shape of the field and obstructions present in the field. All weeds in each quadrat were identified, counted and recorded. Species that were not identified in the field were tagged and transported to laboratory for later identification (Chancellor and Froud-Williams, 1982 & 1984). Care was taken to ensure that anomalies such as shoulder and foot slopes, potholes, ditches, bluffs, power lines and paths were not sampled. The data were summarized using five quantitative measures as outlined by Thomas (1985); frequency, field uniformity over all fields, density over all fields, density occurrence in fields and relative abundance. Frequency (F) was calculated as the percentage of the total number of fields surveyed in which a species occurred in at least one quadrat.
Where Fk = frequency value for species k Yi = presence (1) or absence (0) of species k in field sized quadrat used n = number of fields surveyed.
Field uniformity (FU) was calculated as the percentage of the total number of quadrats sampled in which a species occurred.
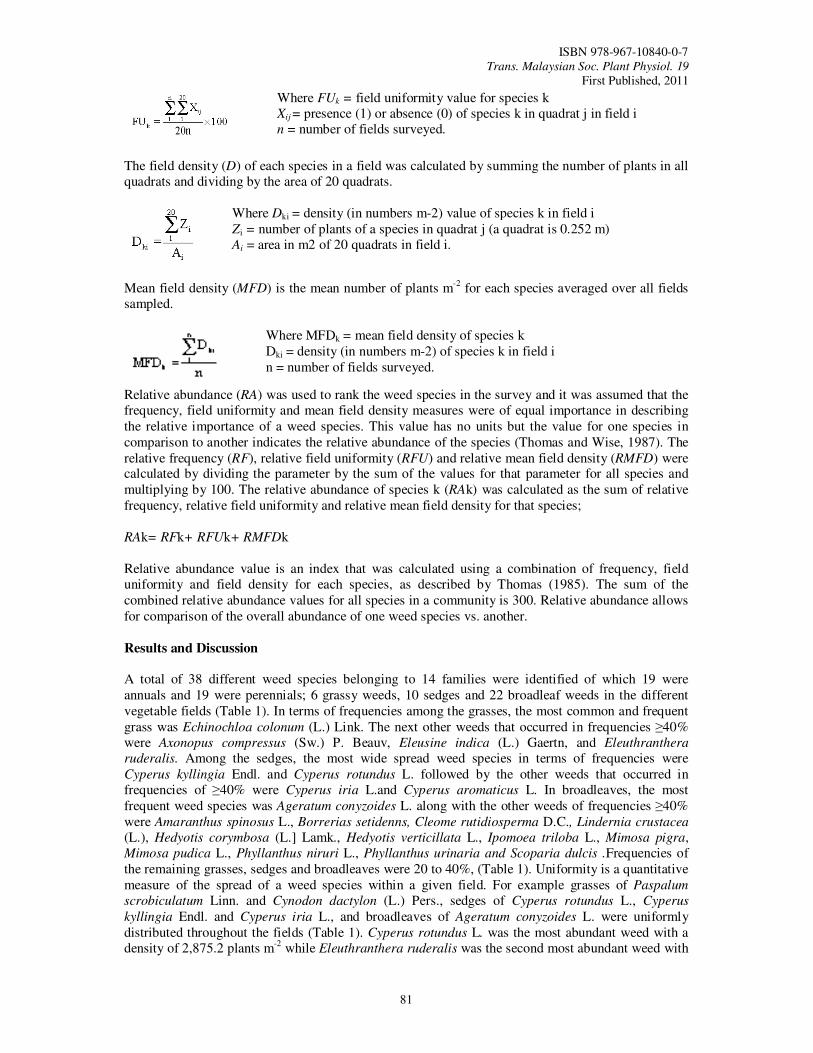
ISBN 978-967-10840-0-7 Trans. Malaysian Soc. Plant Physiol. 19
First Published, 2011
81
Where FUk = field uniformity value for species k Xij = presence (1) or absence (0) of species k in quadrat j in field i n = number of fields surveyed.
The field density (D) of each species in a field was calculated by summing the number of plants in all quadrats and dividing by the area of 20 quadrats.
Where Dki = density (in numbers m-2) value of species k in field i Zi = number of plants of a species in quadrat j (a quadrat is 0.252 m) Ai = area in m2 of 20 quadrats in field i.
Mean field density (MFD) is the mean number of plants m-2 for each species averaged over all fields sampled.
Where MFDk = mean field density of species k Dki = density (in numbers m-2) of species k in field i n = number of fields surveyed.
Relative abundance (RA) was used to rank the weed species in the survey and it was assumed that the frequency, field uniformity and mean field density measures were of equal importance in describing the relative importance of a weed species. This value has no units but the value for one species in comparison to another indicates the relative abundance of the species (Thomas and Wise, 1987). The relative frequency (RF), relative field uniformity (RFU) and relative mean field density (RMFD) were calculated by dividing the parameter by the sum of the values for that parameter for all species and multiplying by 100. The relative abundance of species k (RAk) was calculated as the sum of relative frequency, relative field uniformity and relative mean field density for that species; RAk= RFk+ RFUk+ RMFDk Relative abundance value is an index that was calculated using a combination of frequency, field uniformity and field density for each species, as described by Thomas (1985). The sum of the combined relative abundance values for all species in a community is 300. Relative abundance allows for comparison of the overall abundance of one weed species vs. another.
Results and Discussion
A total of 38 different weed species belonging to 14 families were identified of which 19 were annuals and 19 were perennials; 6 grassy weeds, 10 sedges and 22 broadleaf weeds in the different vegetable fields (Table 1). In terms of frequencies among the grasses, the most common and frequent grass was Echinochloa colonum (L.) Link. The next other weeds that occurred in frequencies ≥40% were Axonopus compressus (Sw.) P. Beauv, Eleusine indica (L.) Gaertn, and Eleuthranthera
ruderalis. Among the sedges, the most wide spread weed species in terms of frequencies were Cyperus kyllingia Endl. and Cyperus rotundus L. followed by the other weeds that occurred in frequencies of ≥40% were Cyperus iria L.and Cyperus aromaticus L. In broadleaves, the most frequent weed species was Ageratum conyzoides L. along with the other weeds of frequencies ≥40% were Amaranthus spinosus L., Borrerias setidenns, Cleome rutidiosperma D.C., Lindernia crustacea
(L.), Hedyotis corymbosa (L.] Lamk., Hedyotis verticillata L., Ipomoea triloba L., Mimosa pigra, Mimosa pudica L., Phyllanthus niruri L., Phyllanthus urinaria and Scoparia dulcis .Frequencies of the remaining grasses, sedges and broadleaves were 20 to 40%, (Table 1). Uniformity is a quantitative measure of the spread of a weed species within a given field. For example grasses of Paspalum
scrobiculatum Linn. and Cynodon dactylon (L.) Pers., sedges of Cyperus rotundus L., Cyperus
kyllingia Endl. and Cyperus iria L., and broadleaves of Ageratum conyzoides L. were uniformly
distributed throughout the fields (Table 1). Cyperus rotundus L. was the most abundant weed with a
density of 2,875.2 plants m-2 while Eleuthranthera ruderalis was the second most abundant weed with
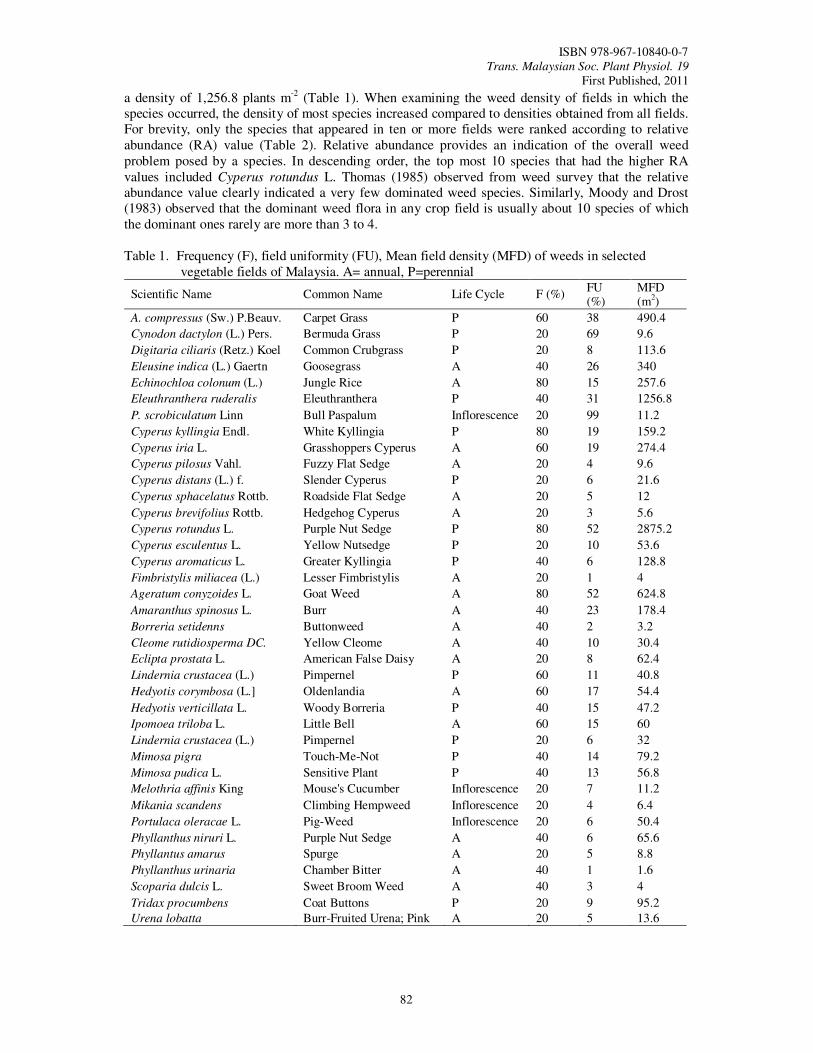
ISBN 978-967-10840-0-7 Trans. Malaysian Soc. Plant Physiol. 19
First Published, 2011
82
a density of 1,256.8 plants m-2 (Table 1). When examining the weed density of fields in which the
species occurred, the density of most species increased compared to densities obtained from all fields. For brevity, only the species that appeared in ten or more fields were ranked according to relative abundance (RA) value (Table 2). Relative abundance provides an indication of the overall weed problem posed by a species. In descending order, the top most 10 species that had the higher RA values included Cyperus rotundus L. Thomas (1985) observed from weed survey that the relative abundance value clearly indicated a very few dominated weed species. Similarly, Moody and Drost (1983) observed that the dominant weed flora in any crop field is usually about 10 species of which
the dominant ones rarely are more than 3 to 4. Table 1. Frequency (F), field uniformity (FU), Mean field density (MFD) of weeds in selected
vegetable fields of Malaysia. A= annual, P=perennial
Scientific Name Common Name Life Cycle F (%) FU (%)
MFD (m2)
A. compressus (Sw.) P.Beauv. Carpet Grass P 60 38 490.4
Cynodon dactylon (L.) Pers. Bermuda Grass P 20 69 9.6
Digitaria ciliaris (Retz.) Koel Common Crubgrass P 20 8 113.6
Eleusine indica (L.) Gaertn Goosegrass A 40 26 340
Echinochloa colonum (L.) Jungle Rice A 80 15 257.6
Eleuthranthera ruderalis Eleuthranthera P 40 31 1256.8
P. scrobiculatum Linn Bull Paspalum Inflorescence 20 99 11.2
Cyperus kyllingia Endl. White Kyllingia P 80 19 159.2
Cyperus iria L. Grasshoppers Cyperus A 60 19 274.4
Cyperus pilosus Vahl. Fuzzy Flat Sedge A 20 4 9.6
Cyperus distans (L.) f. Slender Cyperus P 20 6 21.6
Cyperus sphacelatus Rottb. Roadside Flat Sedge A 20 5 12
Cyperus brevifolius Rottb. Hedgehog Cyperus A 20 3 5.6
Cyperus rotundus L. Purple Nut Sedge P 80 52 2875.2
Cyperus esculentus L. Yellow Nutsedge P 20 10 53.6
Cyperus aromaticus L. Greater Kyllingia P 40 6 128.8
Fimbristylis miliacea (L.) Lesser Fimbristylis A 20 1 4
Ageratum conyzoides L. Goat Weed A 80 52 624.8
Amaranthus spinosus L. Burr A 40 23 178.4
Borreria setidenns Buttonweed A 40 2 3.2
Cleome rutidiosperma DC. Yellow Cleome A 40 10 30.4
Eclipta prostata L. American False Daisy A 20 8 62.4
Lindernia crustacea (L.) Pimpernel P 60 11 40.8
Hedyotis corymbosa (L.] Oldenlandia A 60 17 54.4
Hedyotis verticillata L. Woody Borreria P 40 15 47.2
Ipomoea triloba L. Little Bell A 60 15 60
Lindernia crustacea (L.) Pimpernel P 20 6 32
Mimosa pigra Touch-Me-Not P 40 14 79.2
Mimosa pudica L. Sensitive Plant P 40 13 56.8
Melothria affinis King Mouse's Cucumber Inflorescence 20 7 11.2
Mikania scandens Climbing Hempweed Inflorescence 20 4 6.4
Portulaca oleracae L. Pig-Weed Inflorescence 20 6 50.4
Phyllanthus niruri L. Purple Nut Sedge A 40 6 65.6
Phyllantus amarus Spurge A 20 5 8.8
Phyllanthus urinaria Chamber Bitter A 40 1 1.6
Scoparia dulcis L. Sweet Broom Weed A 40 3 4
Tridax procumbens Coat Buttons P 20 9 95.2
Urena lobatta Burr-Fruited Urena; Pink A 20 5 13.6
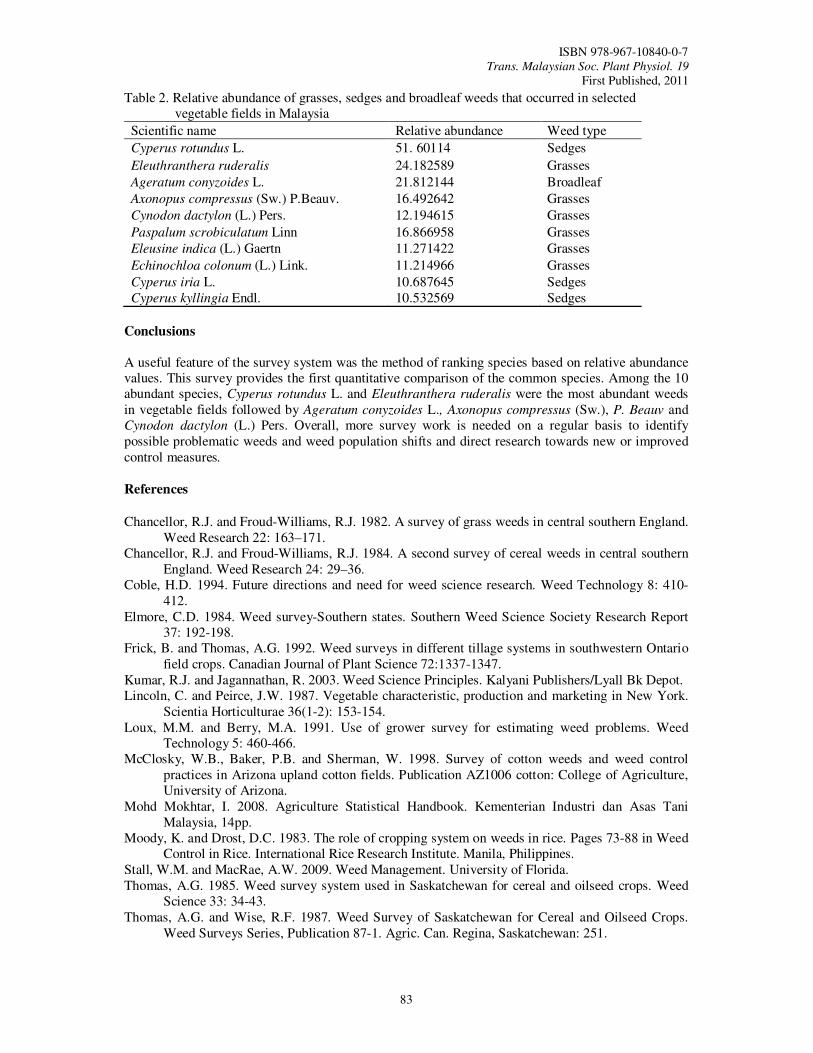
ISBN 978-967-10840-0-7 Trans. Malaysian Soc. Plant Physiol. 19
First Published, 2011
83
Table 2. Relative abundance of grasses, sedges and broadleaf weeds that occurred in selected vegetable fields in Malaysia
Scientific name Relative abundance Weed type
Cyperus rotundus L. 51. 60114 Sedges
Eleuthranthera ruderalis 24.182589 Grasses
Ageratum conyzoides L. 21.812144 Broadleaf
Axonopus compressus (Sw.) P.Beauv. 16.492642 Grasses
Cynodon dactylon (L.) Pers. 12.194615 Grasses
Paspalum scrobiculatum Linn 16.866958 Grasses
Eleusine indica (L.) Gaertn 11.271422 Grasses
Echinochloa colonum (L.) Link. 11.214966 Grasses
Cyperus iria L. 10.687645 Sedges Cyperus kyllingia Endl. 10.532569 Sedges
Conclusions
A useful feature of the survey system was the method of ranking species based on relative abundance values. This survey provides the first quantitative comparison of the common species. Among the 10 abundant species, Cyperus rotundus L. and Eleuthranthera ruderalis were the most abundant weeds in vegetable fields followed by Ageratum conyzoides L., Axonopus compressus (Sw.), P. Beauv and Cynodon dactylon (L.) Pers. Overall, more survey work is needed on a regular basis to identify possible problematic weeds and weed population shifts and direct research towards new or improved control measures. References
Chancellor, R.J. and Froud-Williams, R.J. 1982. A survey of grass weeds in central southern England.
Weed Research 22: 163–171. Chancellor, R.J. and Froud-Williams, R.J. 1984. A second survey of cereal weeds in central southern
England. Weed Research 24: 29–36. Coble, H.D. 1994. Future directions and need for weed science research. Weed Technology 8: 410-
412. Elmore, C.D. 1984. Weed survey-Southern states. Southern Weed Science Society Research Report
37: 192-198. Frick, B. and Thomas, A.G. 1992. Weed surveys in different tillage systems in southwestern Ontario
field crops. Canadian Journal of Plant Science 72:1337-1347. Kumar, R.J. and Jagannathan, R. 2003. Weed Science Principles. Kalyani Publishers/Lyall Bk Depot. Lincoln, C. and Peirce, J.W. 1987. Vegetable characteristic, production and marketing in New York.
Scientia Horticulturae 36(1-2): 153-154. Loux, M.M. and Berry, M.A. 1991. Use of grower survey for estimating weed problems. Weed
Technology 5: 460-466. McClosky, W.B., Baker, P.B. and Sherman, W. 1998. Survey of cotton weeds and weed control
practices in Arizona upland cotton fields. Publication AZ1006 cotton: College of Agriculture, University of Arizona.
Mohd Mokhtar, I. 2008. Agriculture Statistical Handbook. Kementerian Industri dan Asas Tani Malaysia, 14pp.
Moody, K. and Drost, D.C. 1983. The role of cropping system on weeds in rice. Pages 73-88 in Weed Control in Rice. International Rice Research Institute. Manila, Philippines.
Stall, W.M. and MacRae, A.W. 2009. Weed Management. University of Florida. Thomas, A.G. 1985. Weed survey system used in Saskatchewan for cereal and oilseed crops. Weed
Science 33: 34-43. Thomas, A.G. and Wise, R.F. 1987. Weed Survey of Saskatchewan for Cereal and Oilseed Crops.
Weed Surveys Series, Publication 87-1. Agric. Can. Regina, Saskatchewan: 251.

ISBN 978-967-10840-0-7 Trans. Malaysian Soc. Plant Physiol. 19
First Published, 2011
84
Webster, T.M. and Coble, H.D. 1997. Changes in the weed species composition of the southern United States: 1974 to 1995. Weed Technology 11: 308-317.
ISBN 978-967-10840-0-7 Trans. Malaysian Soc. Plant Physiol. 19
First Published, 2011
85
Phenolic Compound in Some Urban Trees
Rohana, M.A.1, Ahmad Nazarudin, M.R.2 and Tsan, F.Y.1,* 1Faculty of Plantation and Agrotechnology, Universiti Teknologi MARA (UiTM), 40450 Shah Alam, Selangor, Malaysia. 2Forest Research Institute Malaysia (FRIM), 52109 Kepong, Selangor, Malaysia. *E-mail: [email protected]
Introduction Bioindicators are species used to monitor the health of an environment or ecosystem. They are any biological species or group of species whose function, population, or status can be used to determine the ecosystem or environmental integrity. Bioindicators can be classified into three types which are plant indicators, animal indicators and microbial indicators. Atmospheric pollutants alter photosynthetic, metabolic and gaseous exchange functions and damages on tissues in plants, even at low concentrations. This high sensitivity to some pollutants makes a great variety of plants to be used as bioindicators of pollution, as a versatile and inexpensive method that can assist decision-makers on the subject of health and environmental protection against potentially hazardous elements. Since study on the local urban plants as bioindicator of pollution is quite rare, research on this aspect is needed. Besides, it provides the early recognition of pollutant damage to plants as well as toxic dangers to humans at relatively low cost as compared to technical measuring methods. Tingey (1989) reported that there is no better indicator of the status of a species or a system than a species or the system itself. Air pollution will give changes to chemical compounds in plants. Robles et al. (2003) concluded that changes in concentrations of total phenols, total flavonoids, and simple flavonols in needles of Pinus
halepensis were related to the changes in concentrations of air pollutants. The changes in chemical compounds in the plants were used as indicators of air pollution for early diagnosis of stress or as a marker for physiological damage to trees prior to the onset of visible injury symptoms (Tripathi and Gautam, 2007). Hamid and Jawaid (2009) reported that, there were adverse effects on physiological, biochemical functions and intermediary metabolism of Glycine max that was exposed to sulfur dioxide, SO2 and nitrogen dioxide, NO2. Carbohydrate, chlorophyll, and protein contents in the leaves decreased when exposed to SO2 and NO2 while the total phenolic compounds increased. The aim of this study was to determine the potential trees species as bioindicator of air pollution by assessing the total phenols in their leaves. The selected trees were Samanea saman, Lagerstroemia
floribunda, Peltophorum pterocarpum and Tabebuia pentaphylla. From this study, information on the potential of the under study species to be used as bioindicator is available.
Materials and Methods
Species selection
A total of four urban tree species as mentioned were selected from Petaling Jaya area, Selangor. This area was chosen as it is one of the rather polluted areas in Peninsular Malaysia. The trees chosen were all about fifteen year-old to avoid age related variation (Pasqualini et al., 2003). Leaves samples were obtained from five randomly selected trees of each species for total phenols analysis. Samples were collected from the trees within the radius distance of five kilometres from the data logger of SO2 and NO2 in Petaling Jaya. The data of SO2 and NO2 of this area was obtained from the Department of Meteorology of Malaysia.
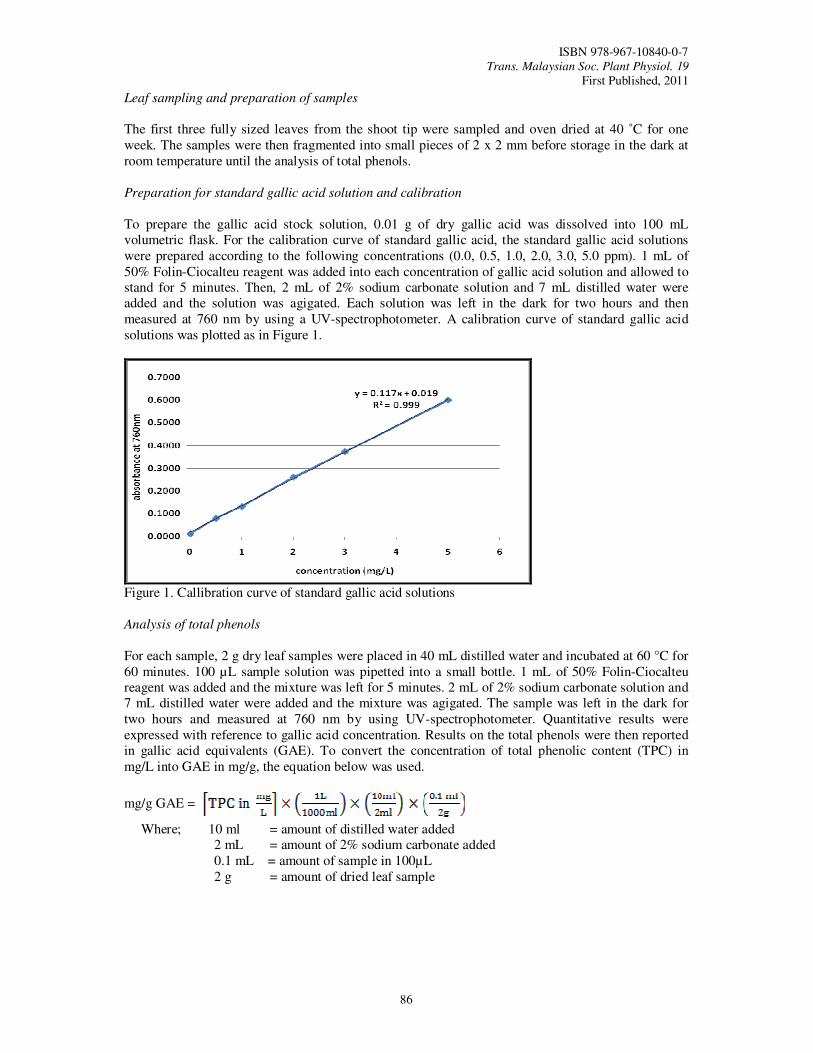
ISBN 978-967-10840-0-7 Trans. Malaysian Soc. Plant Physiol. 19
First Published, 2011
86
Leaf sampling and preparation of samples
The first three fully sized leaves from the shoot tip were sampled and oven dried at 40 ˚C for one week. The samples were then fragmented into small pieces of 2 x 2 mm before storage in the dark at room temperature until the analysis of total phenols. Preparation for standard gallic acid solution and calibration
To prepare the gallic acid stock solution, 0.01 g of dry gallic acid was dissolved into 100 mL volumetric flask. For the calibration curve of standard gallic acid, the standard gallic acid solutions were prepared according to the following concentrations (0.0, 0.5, 1.0, 2.0, 3.0, 5.0 ppm). 1 mL of 50% Folin-Ciocalteu reagent was added into each concentration of gallic acid solution and allowed to stand for 5 minutes. Then, 2 mL of 2% sodium carbonate solution and 7 mL distilled water were added and the solution was agigated. Each solution was left in the dark for two hours and then measured at 760 nm by using a UV-spectrophotometer. A calibration curve of standard gallic acid solutions was plotted as in Figure 1.
Figure 1. Callibration curve of standard gallic acid solutions
Analysis of total phenols
For each sample, 2 g dry leaf samples were placed in 40 mL distilled water and incubated at 60 °C for 60 minutes. 100 µL sample solution was pipetted into a small bottle. 1 mL of 50% Folin-Ciocalteu reagent was added and the mixture was left for 5 minutes. 2 mL of 2% sodium carbonate solution and 7 mL distilled water were added and the mixture was agigated. The sample was left in the dark for two hours and measured at 760 nm by using UV-spectrophotometer. Quantitative results were expressed with reference to gallic acid concentration. Results on the total phenols were then reported in gallic acid equivalents (GAE). To convert the concentration of total phenolic content (TPC) in mg/L into GAE in mg/g, the equation below was used.
mg/g GAE =
Where; 10 ml = amount of distilled water added 2 mL = amount of 2% sodium carbonate added 0.1 mL = amount of sample in 100µL 2 g = amount of dried leaf sample
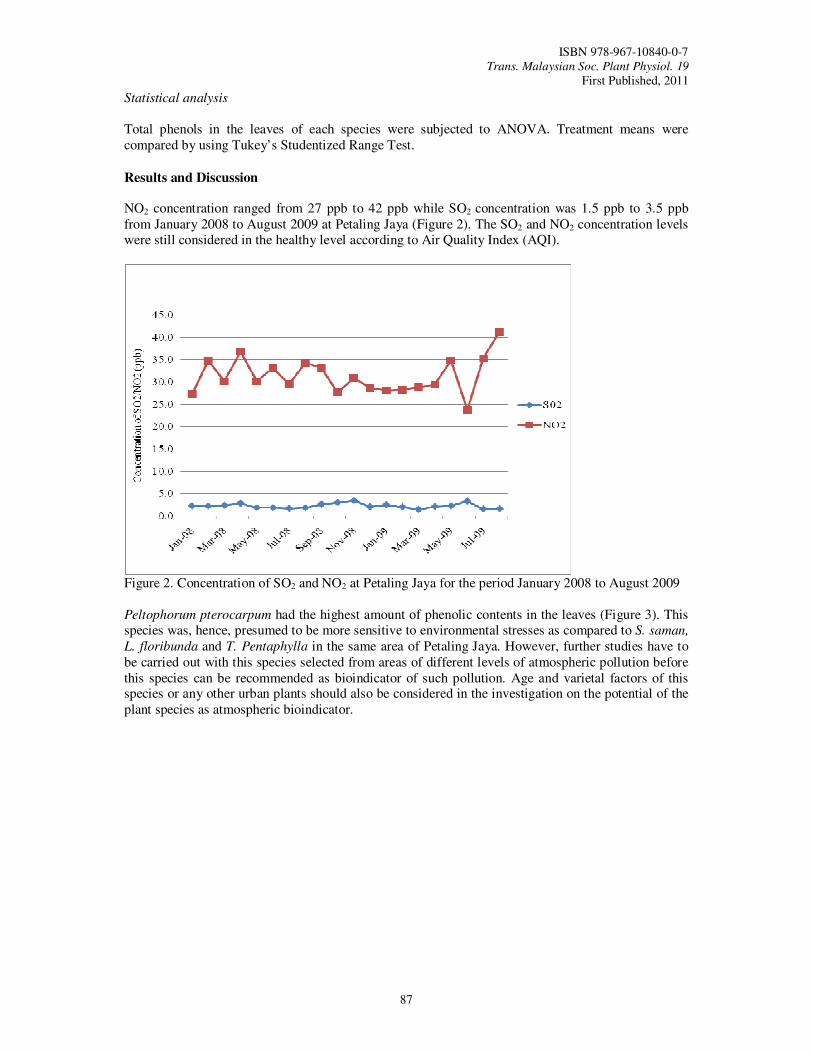
ISBN 978-967-10840-0-7 Trans. Malaysian Soc. Plant Physiol. 19
First Published, 2011
87
Statistical analysis
Total phenols in the leaves of each species were subjected to ANOVA. Treatment means were compared by using Tukey’s Studentized Range Test.
Results and Discussion
NO2 concentration ranged from 27 ppb to 42 ppb while SO2 concentration was 1.5 ppb to 3.5 ppb from January 2008 to August 2009 at Petaling Jaya (Figure 2). The SO2 and NO2 concentration levels were still considered in the healthy level according to Air Quality Index (AQI).
Figure 2. Concentration of SO2 and NO2 at Petaling Jaya for the period January 2008 to August 2009
Peltophorum pterocarpum had the highest amount of phenolic contents in the leaves (Figure 3). This species was, hence, presumed to be more sensitive to environmental stresses as compared to S. saman,
L. floribunda and T. Pentaphylla in the same area of Petaling Jaya. However, further studies have to be carried out with this species selected from areas of different levels of atmospheric pollution before this species can be recommended as bioindicator of such pollution. Age and varietal factors of this species or any other urban plants should also be considered in the investigation on the potential of the plant species as atmospheric bioindicator.
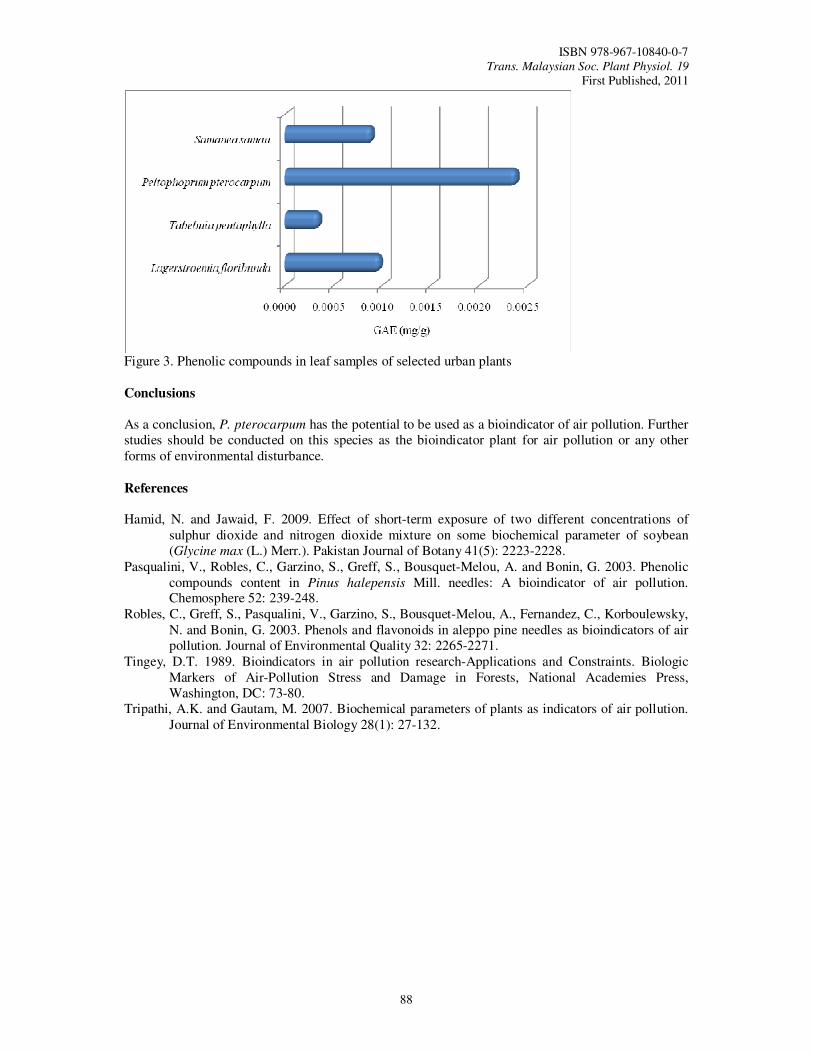
ISBN 978-967-10840-0-7 Trans. Malaysian Soc. Plant Physiol. 19
First Published, 2011
88
Figure 3. Phenolic compounds in leaf samples of selected urban plants Conclusions
As a conclusion, P. pterocarpum has the potential to be used as a bioindicator of air pollution. Further studies should be conducted on this species as the bioindicator plant for air pollution or any other forms of environmental disturbance.
References Hamid, N. and Jawaid, F. 2009. Effect of short-term exposure of two different concentrations of
sulphur dioxide and nitrogen dioxide mixture on some biochemical parameter of soybean (Glycine max (L.) Merr.). Pakistan Journal of Botany 41(5): 2223-2228.
Pasqualini, V., Robles, C., Garzino, S., Greff, S., Bousquet-Melou, A. and Bonin, G. 2003. Phenolic compounds content in Pinus halepensis Mill. needles: A bioindicator of air pollution. Chemosphere 52: 239-248.
Robles, C., Greff, S., Pasqualini, V., Garzino, S., Bousquet-Melou, A., Fernandez, C., Korboulewsky, N. and Bonin, G. 2003. Phenols and flavonoids in aleppo pine needles as bioindicators of air pollution. Journal of Environmental Quality 32: 2265-2271.
Tingey, D.T. 1989. Bioindicators in air pollution research-Applications and Constraints. Biologic Markers of Air-Pollution Stress and Damage in Forests, National Academies Press, Washington, DC: 73-80.
Tripathi, A.K. and Gautam, M. 2007. Biochemical parameters of plants as indicators of air pollution. Journal of Environmental Biology 28(1): 27-132.
ISBN 978-967-10840-0-7 Trans. Malaysian Soc. Plant Physiol. 19
First Published, 2011
89
CHAPTER 6
BIOTECHNOLOGY
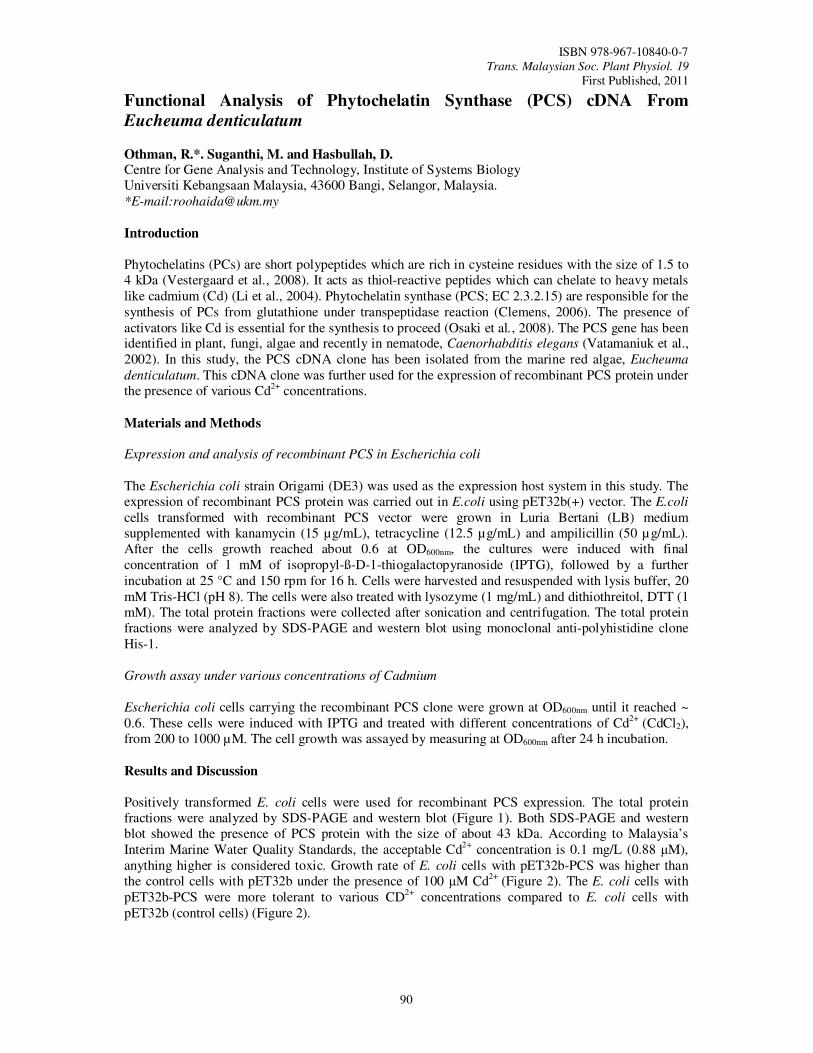
ISBN 978-967-10840-0-7 Trans. Malaysian Soc. Plant Physiol. 19
First Published, 2011
90
Functional Analysis of Phytochelatin Synthase (PCS) cDNA From
Eucheuma denticulatum
Othman, R.*. Suganthi, M. and Hasbullah, D. Centre for Gene Analysis and Technology, Institute of Systems Biology Universiti Kebangsaan Malaysia, 43600 Bangi, Selangor, Malaysia. *E-mail:[email protected]
Introduction
Phytochelatins (PCs) are short polypeptides which are rich in cysteine residues with the size of 1.5 to 4 kDa (Vestergaard et al., 2008). It acts as thiol-reactive peptides which can chelate to heavy metals like cadmium (Cd) (Li et al., 2004). Phytochelatin synthase (PCS; EC 2.3.2.15) are responsible for the synthesis of PCs from glutathione under transpeptidase reaction (Clemens, 2006). The presence of activators like Cd is essential for the synthesis to proceed (Osaki et al., 2008). The PCS gene has been identified in plant, fungi, algae and recently in nematode, Caenorhabditis elegans (Vatamaniuk et al., 2002). In this study, the PCS cDNA clone has been isolated from the marine red algae, Eucheuma
denticulatum. This cDNA clone was further used for the expression of recombinant PCS protein under the presence of various Cd2+ concentrations.
Materials and Methods
Expression and analysis of recombinant PCS in Escherichia coli
The Escherichia coli strain Origami (DE3) was used as the expression host system in this study. The expression of recombinant PCS protein was carried out in E.coli using pET32b(+) vector. The E.coli
cells transformed with recombinant PCS vector were grown in Luria Bertani (LB) medium supplemented with kanamycin (15 µg/mL), tetracycline (12.5 µg/mL) and ampilicillin (50 µg/mL). After the cells growth reached about 0.6 at OD600nm, the cultures were induced with final concentration of 1 mM of isopropyl-ß-D-1-thiogalactopyranoside (IPTG), followed by a further incubation at 25 °C and 150 rpm for 16 h. Cells were harvested and resuspended with lysis buffer, 20 mM Tris-HCl (pH 8). The cells were also treated with lysozyme (1 mg/mL) and dithiothreitol, DTT (1 mM). The total protein fractions were collected after sonication and centrifugation. The total protein fractions were analyzed by SDS-PAGE and western blot using monoclonal anti-polyhistidine clone His-1.
Growth assay under various concentrations of Cadmium
Escherichia coli cells carrying the recombinant PCS clone were grown at OD600nm until it reached ~ 0.6. These cells were induced with IPTG and treated with different concentrations of Cd2+ (CdCl2), from 200 to 1000 µM. The cell growth was assayed by measuring at OD600nm after 24 h incubation.
Results and Discussion
Positively transformed E. coli cells were used for recombinant PCS expression. The total protein fractions were analyzed by SDS-PAGE and western blot (Figure 1). Both SDS-PAGE and western blot showed the presence of PCS protein with the size of about 43 kDa. According to Malaysia’s Interim Marine Water Quality Standards, the acceptable Cd2+ concentration is 0.1 mg/L (0.88 µM), anything higher is considered toxic. Growth rate of E. coli cells with pET32b-PCS was higher than the control cells with pET32b under the presence of 100 µM Cd2+ (Figure 2). The E. coli cells with pET32b-PCS were more tolerant to various CD2+ concentrations compared to E. coli cells with pET32b (control cells) (Figure 2).
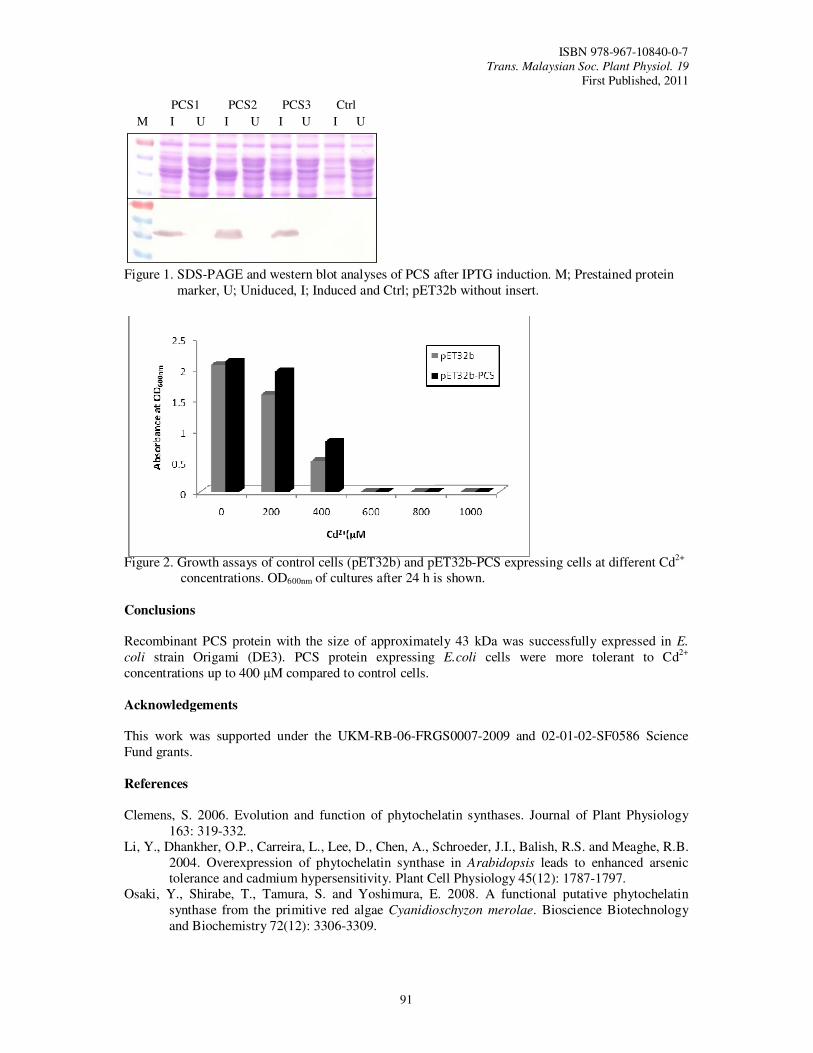
ISBN 978-967-10840-0-7 Trans. Malaysian Soc. Plant Physiol. 19
First Published, 2011
91
Figure 1. SDS-PAGE and western blot analyses of PCS after IPTG induction. M; Prestained protein
marker, U; Uniduced, I; Induced and Ctrl; pET32b without insert.
Figure 2. Growth assays of control cells (pET32b) and pET32b-PCS expressing cells at different Cd2+
concentrations. OD600nm of cultures after 24 h is shown.
Conclusions
Recombinant PCS protein with the size of approximately 43 kDa was successfully expressed in E.
coli strain Origami (DE3). PCS protein expressing E.coli cells were more tolerant to Cd2+ concentrations up to 400 µM compared to control cells.
Acknowledgements This work was supported under the UKM-RB-06-FRGS0007-2009 and 02-01-02-SF0586 Science Fund grants. References
Clemens, S. 2006. Evolution and function of phytochelatin synthases. Journal of Plant Physiology
163: 319-332. Li, Y., Dhankher, O.P., Carreira, L., Lee, D., Chen, A., Schroeder, J.I., Balish, R.S. and Meaghe, R.B.
2004. Overexpression of phytochelatin synthase in Arabidopsis leads to enhanced arsenic tolerance and cadmium hypersensitivity. Plant Cell Physiology 45(12): 1787-1797.
Osaki, Y., Shirabe, T., Tamura, S. and Yoshimura, E. 2008. A functional putative phytochelatin synthase from the primitive red algae Cyanidioschyzon merolae. Bioscience Biotechnology and Biochemistry 72(12): 3306-3309.
PCS1 PCS2 PCS3 Ctrl
M I U I U I U I U

ISBN 978-967-10840-0-7 Trans. Malaysian Soc. Plant Physiol. 19
First Published, 2011
92
Vatamaniuk, O.K., Bucher, E.A., Ward, J.T. and Rea, P.T. 2002. Worms take the ‘phyto’ out of ‘phytochelatins’. Trends in Biotechnology 20(2): 61-64.
Vestergaard, M., Matsumoto, S., Nishikori, S., Shikari, K., Hirata, K. and Takagi, M. 2008. Chelation of cadmium ions by phytochelatin synthase: Role of the cystein-rich C-terminal. Analytical Sciences 24: 277-281.
ISBN 978-967-10840-0-7 Trans. Malaysian Soc. Plant Physiol. 19
First Published, 2011
93
Genetic Transformation of Rice Subspecies Japonica (Oryza sativa) with
Isopentenyl Transferase (ipt) Gene and Glutenin Promoter Using the
Biolistic Method
Nur Natasya Elya, K.1,*
, Ismanizan, I.1 and Alina, W.
2
1School of Biosciences and Biotechnology, Faculty of Science and Technology, Universiti Kebangsaan Malaysia, 43600 Bangi, Selangor, Malaysia. 2Department of Biology, Faculty of Science, UTM Skudai, 81310, Johor Bahru, Johor, Malaysia. *E-mail: [email protected]
Introduction
Rice is the most important crops in the world. According to Klush (1997), majority world population depends on rice as their staple food. As we know, world population increases yearly. Therefore, we need to work on rice biotechnology to meet the demand of the growing world population. In a stalk of rice, only 60% contain full seeds whereas the balance were only half or empty seeds. Several researches have been carried out for better grain filling in rice (Zhang et al., 2010; Yamakawa et al., 2007). In this research, rice plants were transformed with ipt gen involved in cytokinin biosynthesis and endosperm specific promoter for better grain filling. Cytokinins were discovered since 1950s and have been shown to involve in many plant processes such as cell division, shoot and root morphogenesis and regulate axillary bud growth as well as affect apical dominance (Chawla, 2002). The Agrobacterium tumefaciens gene encoding isopentenyl transferase (ipt) is a cytokinin biosynthetic gene which catalyses the first step in cytokinin biosynthesis (Ma et al., 1998). Wheat glutenin promoter is a promoter specific fpr expression in endosperm (Perret et al., 2003). Glutenin promoter was fused with ipt gene to produce more cytokinin in endosperm to promote better grain filling. The objective of this research was to produce transgenic rice using biolistic method with ipt gene driven by glutenin promoter and analysis of transgenic rice.
Materials and Methods
Plant materials, callus induction and suspension cell cultures generated
Callus was initiated from mature seeds of japonica var. Taipei 309 and Nipponbare. They were cultured on the solid LS media (Linsmaier and Skoog, 1965) containing 30 g/L sucrose, 2.5 mg/L 2,4-D (2,4-dichlorophenoxyacetic acid), 0.5 g/L L-proline, 0.5 g/L L-glutamine, 0.5 g/L casein hydrolysate, 0.1 g/L Myo-inositol, 4.0 g gelrite (pH 5.7) and incubated at 26 oC under dark condition for four weeks. The plates were subcultured every two weeks in fresh media. Suspension cell cultures were generated from four weeks old callus in N6 liquid medium (Chu et al., 1975) containing 30 g/L sucrose, 2.5 mg/L 2,4-D, 0.5 g/L L-proline, 0.5 g/L L-glutamine, 0.5 g/L casein hydrolysate, 0.1 g/L Myo-inositol (pH 5.8) with shaking in incubator shaker at 125 rpm and 26 oC for a month. The suspension cell cultures were subcultured weekly. DNA/microprojectile preparation and bombardment conditions
Suspension cell cultures were placed in the centre of Petri dishes containing N6 solid medium with 30 g/L sucrose, 2.5 mg/L 2,4-D, 0.5 g/L L-proline, 0.5 g/L L-glutamine, 0.5 g/L casein hydrolysate, 0.1 g/L Myo-inositol, 9 g/L sorbitol, 9 g/L mannitol, 4.0 g gelrite (pH 5.8). The cultures were incubated for 16 hours at 26 oC under dark condition. Plasmid containing ipt gene driven by glutenin promoter (pCAMBIA:gtn:ipt) and CaMV 35S promoter (pCAMBIA:CaMV:ipt) and NOS terminator were used. The plasmid also contained gusA and hpt gene,
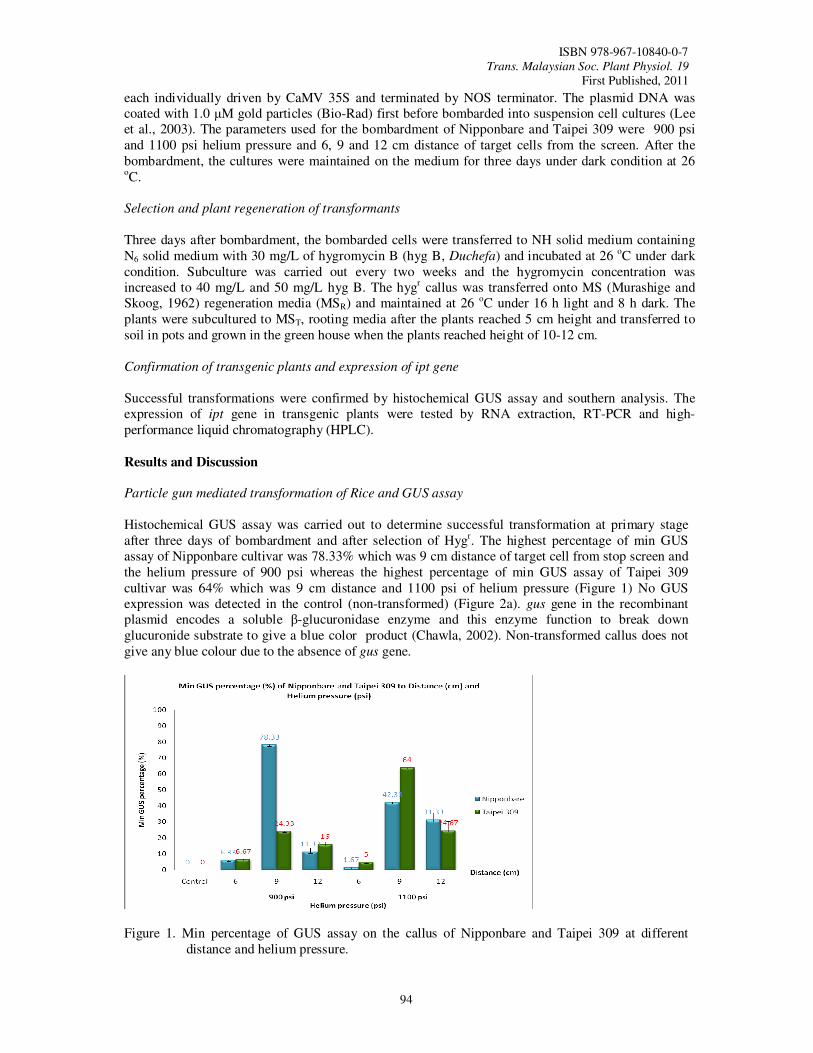
ISBN 978-967-10840-0-7 Trans. Malaysian Soc. Plant Physiol. 19
First Published, 2011
94
each individually driven by CaMV 35S and terminated by NOS terminator. The plasmid DNA was coated with 1.0 µM gold particles (Bio-Rad) first before bombarded into suspension cell cultures (Lee et al., 2003). The parameters used for the bombardment of Nipponbare and Taipei 309 were 900 psi and 1100 psi helium pressure and 6, 9 and 12 cm distance of target cells from the screen. After the bombardment, the cultures were maintained on the medium for three days under dark condition at 26 oC. Selection and plant regeneration of transformants
Three days after bombardment, the bombarded cells were transferred to NH solid medium containing N6 solid medium with 30 mg/L of hygromycin B (hyg B, Duchefa) and incubated at 26 oC under dark condition. Subculture was carried out every two weeks and the hygromycin concentration was increased to 40 mg/L and 50 mg/L hyg B. The hygr callus was transferred onto MS (Murashige and Skoog, 1962) regeneration media (MSR) and maintained at 26 oC under 16 h light and 8 h dark. The plants were subcultured to MST, rooting media after the plants reached 5 cm height and transferred to soil in pots and grown in the green house when the plants reached height of 10-12 cm. Confirmation of transgenic plants and expression of ipt gene
Successful transformations were confirmed by histochemical GUS assay and southern analysis. The expression of ipt gene in transgenic plants were tested by RNA extraction, RT-PCR and high-performance liquid chromatography (HPLC).
Results and Discussion
Particle gun mediated transformation of Rice and GUS assay
Histochemical GUS assay was carried out to determine successful transformation at primary stage after three days of bombardment and after selection of Hygr. The highest percentage of min GUS assay of Nipponbare cultivar was 78.33% which was 9 cm distance of target cell from stop screen and the helium pressure of 900 psi whereas the highest percentage of min GUS assay of Taipei 309 cultivar was 64% which was 9 cm distance and 1100 psi of helium pressure (Figure 1) No GUS expression was detected in the control (non-transformed) (Figure 2a). gus gene in the recombinant plasmid encodes a soluble β-glucuronidase enzyme and this enzyme function to break down glucuronide substrate to give a blue color product (Chawla, 2002). Non-transformed callus does not give any blue colour due to the absence of gus gene.
Figure 1. Min percentage of GUS assay on the callus of Nipponbare and Taipei 309 at different
distance and helium pressure.
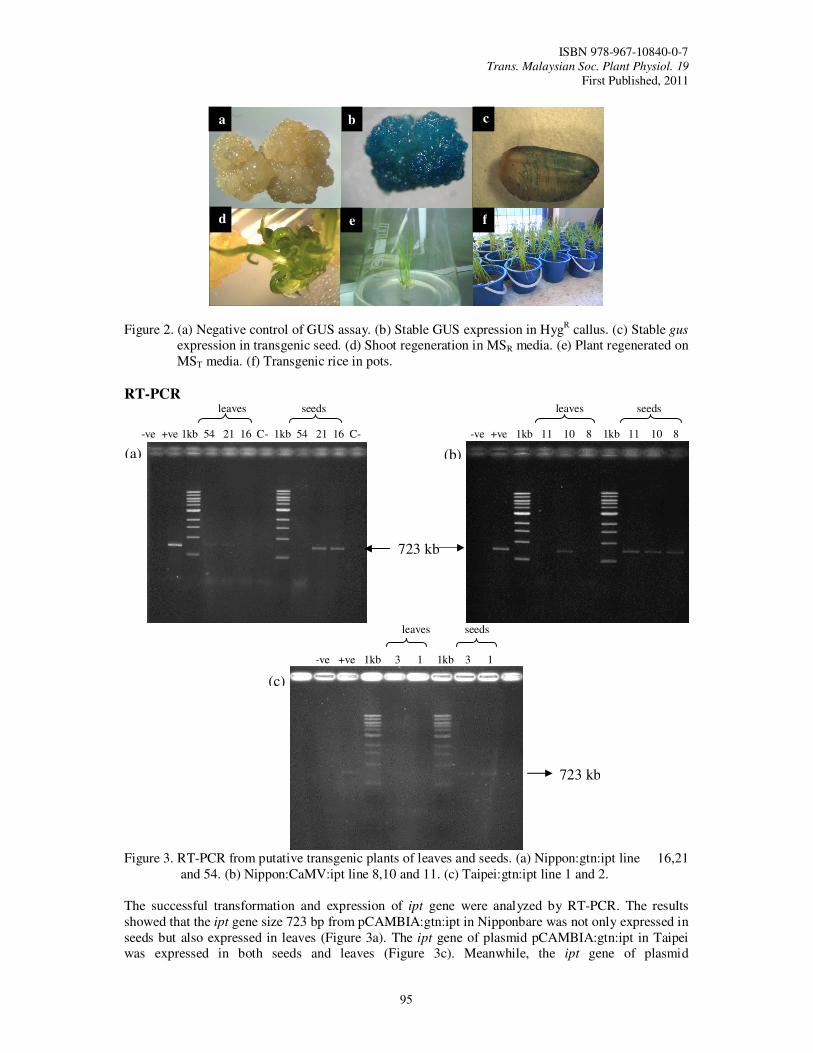
ISBN 978-967-10840-0-7 Trans. Malaysian Soc. Plant Physiol. 19
First Published, 2011
95
Figure 2. (a) Negative control of GUS assay. (b) Stable GUS expression in HygR callus. (c) Stable gus
expression in transgenic seed. (d) Shoot regeneration in MSR media. (e) Plant regenerated on MST media. (f) Transgenic rice in pots.
RT-PCR leaves seeds leaves seeds -ve +ve 1kb 54 21 16 C- 1kb 54 21 16 C- -ve +ve 1kb 11 10 8 1kb 11 10 8
leaves seeds
-ve +ve 1kb 3 1 1kb 3 1
Figure 3. RT-PCR from putative transgenic plants of leaves and seeds. (a) Nippon:gtn:ipt line 16,21
and 54. (b) Nippon:CaMV:ipt line 8,10 and 11. (c) Taipei:gtn:ipt line 1 and 2. The successful transformation and expression of ipt gene were analyzed by RT-PCR. The results showed that the ipt gene size 723 bp from pCAMBIA:gtn:ipt in Nipponbare was not only expressed in seeds but also expressed in leaves (Figure 3a). The ipt gene of plasmid pCAMBIA:gtn:ipt in Taipei was expressed in both seeds and leaves (Figure 3c). Meanwhile, the ipt gene of plasmid
(a) (b)
(c)
723 kb
723 kb
a
f e d
c b
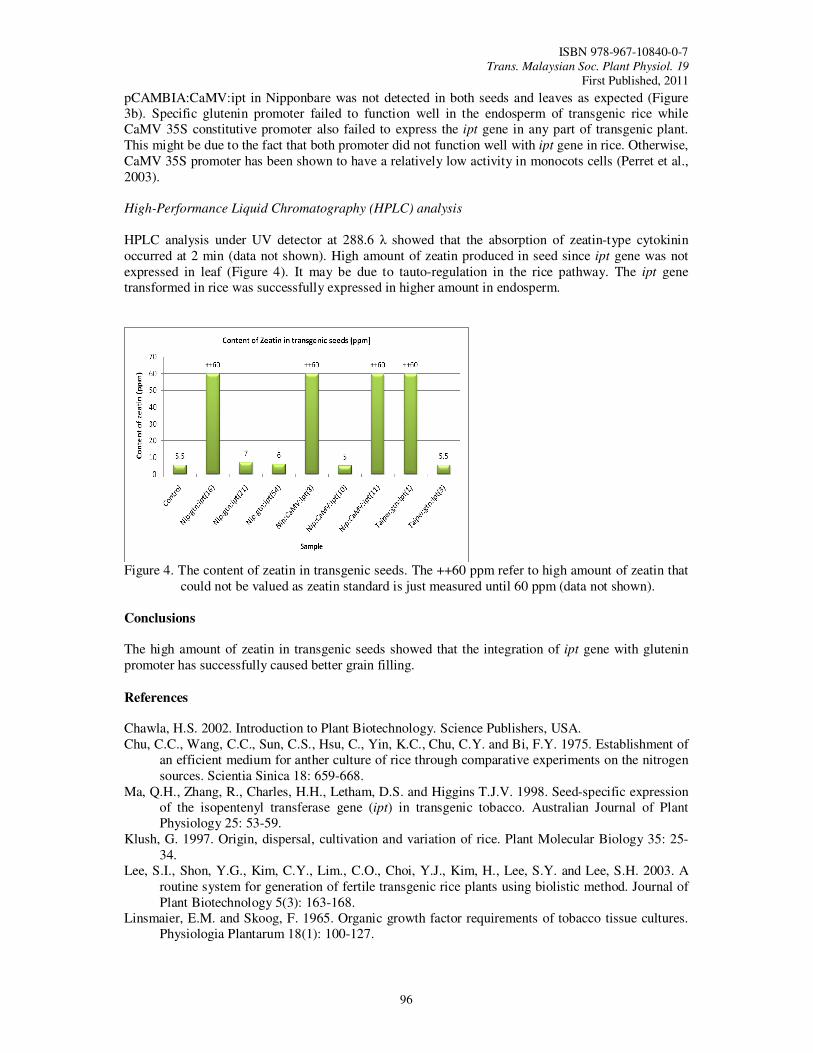
ISBN 978-967-10840-0-7 Trans. Malaysian Soc. Plant Physiol. 19
First Published, 2011
96
pCAMBIA:CaMV:ipt in Nipponbare was not detected in both seeds and leaves as expected (Figure 3b). Specific glutenin promoter failed to function well in the endosperm of transgenic rice while CaMV 35S constitutive promoter also failed to express the ipt gene in any part of transgenic plant. This might be due to the fact that both promoter did not function well with ipt gene in rice. Otherwise, CaMV 35S promoter has been shown to have a relatively low activity in monocots cells (Perret et al., 2003). High-Performance Liquid Chromatography (HPLC) analysis
HPLC analysis under UV detector at 288.6 λ showed that the absorption of zeatin-type cytokinin occurred at 2 min (data not shown). High amount of zeatin produced in seed since ipt gene was not expressed in leaf (Figure 4). It may be due to tauto-regulation in the rice pathway. The ipt gene transformed in rice was successfully expressed in higher amount in endosperm.
Figure 4. The content of zeatin in transgenic seeds. The ++60 ppm refer to high amount of zeatin that
could not be valued as zeatin standard is just measured until 60 ppm (data not shown).
Conclusions
The high amount of zeatin in transgenic seeds showed that the integration of ipt gene with glutenin promoter has successfully caused better grain filling.
References
Chawla, H.S. 2002. Introduction to Plant Biotechnology. Science Publishers, USA. Chu, C.C., Wang, C.C., Sun, C.S., Hsu, C., Yin, K.C., Chu, C.Y. and Bi, F.Y. 1975. Establishment of
an efficient medium for anther culture of rice through comparative experiments on the nitrogen sources. Scientia Sinica 18: 659-668.
Ma, Q.H., Zhang, R., Charles, H.H., Letham, D.S. and Higgins T.J.V. 1998. Seed-specific expression of the isopentenyl transferase gene (ipt) in transgenic tobacco. Australian Journal of Plant Physiology 25: 53-59.
Klush, G. 1997. Origin, dispersal, cultivation and variation of rice. Plant Molecular Biology 35: 25-34.
Lee, S.I., Shon, Y.G., Kim, C.Y., Lim., C.O., Choi, Y.J., Kim, H., Lee, S.Y. and Lee, S.H. 2003. A routine system for generation of fertile transgenic rice plants using biolistic method. Journal of Plant Biotechnology 5(3): 163-168.
Linsmaier, E.M. and Skoog, F. 1965. Organic growth factor requirements of tobacco tissue cultures. Physiologia Plantarum 18(1): 100-127.

ISBN 978-967-10840-0-7 Trans. Malaysian Soc. Plant Physiol. 19
First Published, 2011
97
Murashige, T.K. and Skoog, F. 1962. A revised medium growth and bioassays with tobacco tissue culture. Plant Physiology 15: 473-497.
Perret, S.J., Valentine, J., Leggett, J.M. and Morris, P. 2003. Integration, expression and inheritance of transgenes in hexaploid oat. Journal of Plant Physiology 160: 931-943.
Yamakawa, H., Hirose, T., Kuroda, M. and Yamaguchi, T. 2007. Comprehensive expression profiling of rice grain filling-related genes under high temperature using DNA microarray. Plant Physiology 144: 258-277.
Zhang, H., Chen, T., Wang, Z., Yang, J. and Zhang, J. 2010. Involvement of cytokinins in the grain filling of rice under alternate wetting and drying irrigation. Journal of Environmental Botany 61(13): 3719-3733.
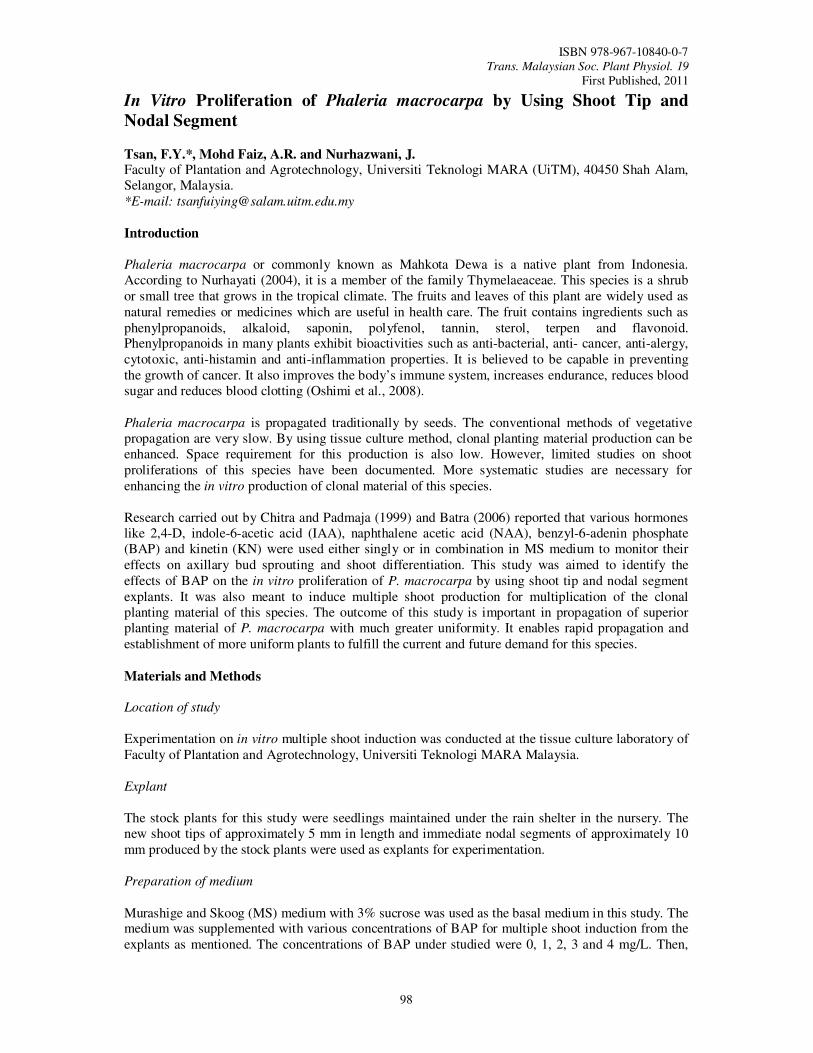
ISBN 978-967-10840-0-7 Trans. Malaysian Soc. Plant Physiol. 19
First Published, 2011
98
In Vitro Proliferation of Phaleria macrocarpa by Using Shoot Tip and
Nodal Segment
Tsan, F.Y.*, Mohd Faiz, A.R. and Nurhazwani, J. Faculty of Plantation and Agrotechnology, Universiti Teknologi MARA (UiTM), 40450 Shah Alam, Selangor, Malaysia. *E-mail: [email protected]
Introduction
Phaleria macrocarpa or commonly known as Mahkota Dewa is a native plant from Indonesia. According to Nurhayati (2004), it is a member of the family Thymelaeaceae. This species is a shrub or small tree that grows in the tropical climate. The fruits and leaves of this plant are widely used as natural remedies or medicines which are useful in health care. The fruit contains ingredients such as phenylpropanoids, alkaloid, saponin, polyfenol, tannin, sterol, terpen and flavonoid. Phenylpropanoids in many plants exhibit bioactivities such as anti-bacterial, anti- cancer, anti-alergy, cytotoxic, anti-histamin and anti-inflammation properties. It is believed to be capable in preventing the growth of cancer. It also improves the body’s immune system, increases endurance, reduces blood sugar and reduces blood clotting (Oshimi et al., 2008). Phaleria macrocarpa is propagated traditionally by seeds. The conventional methods of vegetative propagation are very slow. By using tissue culture method, clonal planting material production can be enhanced. Space requirement for this production is also low. However, limited studies on shoot proliferations of this species have been documented. More systematic studies are necessary for enhancing the in vitro production of clonal material of this species. Research carried out by Chitra and Padmaja (1999) and Batra (2006) reported that various hormones like 2,4-D, indole-6-acetic acid (IAA), naphthalene acetic acid (NAA), benzyl-6-adenin phosphate (BAP) and kinetin (KN) were used either singly or in combination in MS medium to monitor their effects on axillary bud sprouting and shoot differentiation. This study was aimed to identify the effects of BAP on the in vitro proliferation of P. macrocarpa by using shoot tip and nodal segment explants. It was also meant to induce multiple shoot production for multiplication of the clonal planting material of this species. The outcome of this study is important in propagation of superior planting material of P. macrocarpa with much greater uniformity. It enables rapid propagation and establishment of more uniform plants to fulfill the current and future demand for this species.
Materials and Methods
Location of study
Experimentation on in vitro multiple shoot induction was conducted at the tissue culture laboratory of Faculty of Plantation and Agrotechnology, Universiti Teknologi MARA Malaysia. Explant
The stock plants for this study were seedlings maintained under the rain shelter in the nursery. The new shoot tips of approximately 5 mm in length and immediate nodal segments of approximately 10 mm produced by the stock plants were used as explants for experimentation.
Preparation of medium
Murashige and Skoog (MS) medium with 3% sucrose was used as the basal medium in this study. The medium was supplemented with various concentrations of BAP for multiple shoot induction from the explants as mentioned. The concentrations of BAP under studied were 0, 1, 2, 3 and 4 mg/L. Then,
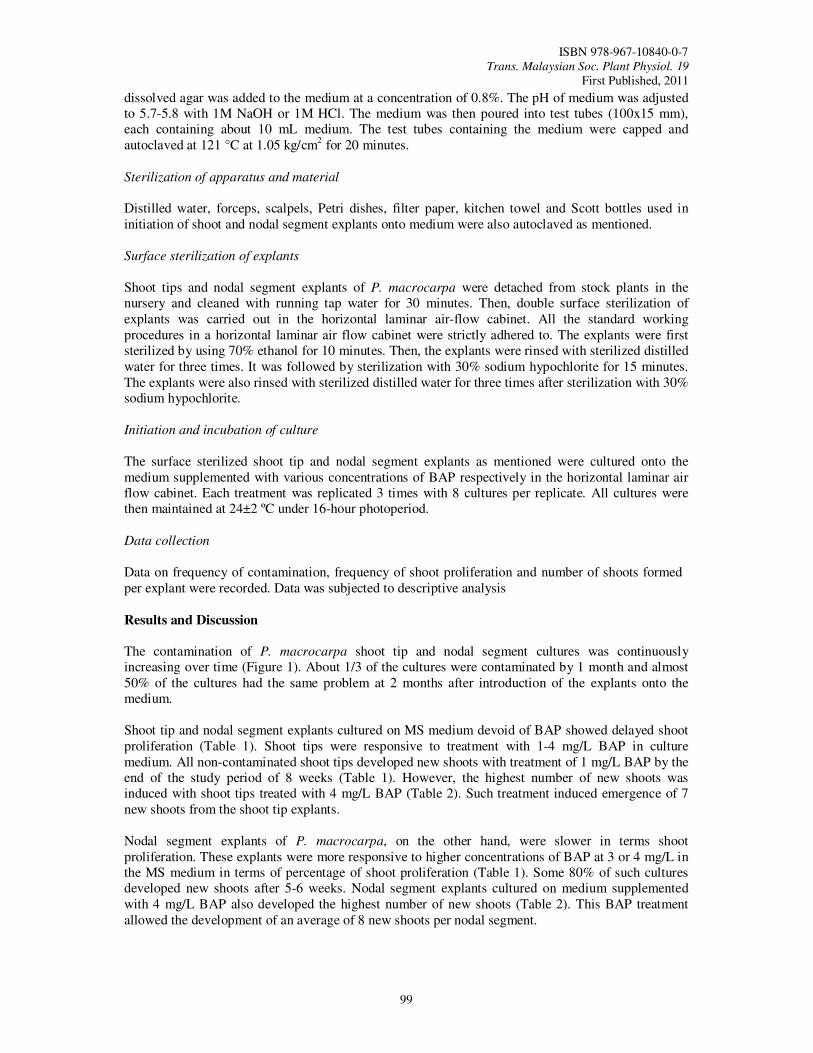
ISBN 978-967-10840-0-7 Trans. Malaysian Soc. Plant Physiol. 19
First Published, 2011
99
dissolved agar was added to the medium at a concentration of 0.8%. The pH of medium was adjusted to 5.7-5.8 with 1M NaOH or 1M HCl. The medium was then poured into test tubes (100x15 mm), each containing about 10 mL medium. The test tubes containing the medium were capped and autoclaved at 121 °C at 1.05 kg/cm2 for 20 minutes. Sterilization of apparatus and material
Distilled water, forceps, scalpels, Petri dishes, filter paper, kitchen towel and Scott bottles used in initiation of shoot and nodal segment explants onto medium were also autoclaved as mentioned. Surface sterilization of explants
Shoot tips and nodal segment explants of P. macrocarpa were detached from stock plants in the nursery and cleaned with running tap water for 30 minutes. Then, double surface sterilization of explants was carried out in the horizontal laminar air-flow cabinet. All the standard working procedures in a horizontal laminar air flow cabinet were strictly adhered to. The explants were first sterilized by using 70% ethanol for 10 minutes. Then, the explants were rinsed with sterilized distilled water for three times. It was followed by sterilization with 30% sodium hypochlorite for 15 minutes. The explants were also rinsed with sterilized distilled water for three times after sterilization with 30% sodium hypochlorite. Initiation and incubation of culture
The surface sterilized shoot tip and nodal segment explants as mentioned were cultured onto the medium supplemented with various concentrations of BAP respectively in the horizontal laminar air flow cabinet. Each treatment was replicated 3 times with 8 cultures per replicate. All cultures were then maintained at 24±2 ºC under 16-hour photoperiod. Data collection
Data on frequency of contamination, frequency of shoot proliferation and number of shoots formed per explant were recorded. Data was subjected to descriptive analysis
Results and Discussion
The contamination of P. macrocarpa shoot tip and nodal segment cultures was continuously increasing over time (Figure 1). About 1/3 of the cultures were contaminated by 1 month and almost 50% of the cultures had the same problem at 2 months after introduction of the explants onto the medium.
Shoot tip and nodal segment explants cultured on MS medium devoid of BAP showed delayed shoot proliferation (Table 1). Shoot tips were responsive to treatment with 1-4 mg/L BAP in culture medium. All non-contaminated shoot tips developed new shoots with treatment of 1 mg/L BAP by the end of the study period of 8 weeks (Table 1). However, the highest number of new shoots was induced with shoot tips treated with 4 mg/L BAP (Table 2). Such treatment induced emergence of 7 new shoots from the shoot tip explants. Nodal segment explants of P. macrocarpa, on the other hand, were slower in terms shoot proliferation. These explants were more responsive to higher concentrations of BAP at 3 or 4 mg/L in the MS medium in terms of percentage of shoot proliferation (Table 1). Some 80% of such cultures developed new shoots after 5-6 weeks. Nodal segment explants cultured on medium supplemented with 4 mg/L BAP also developed the highest number of new shoots (Table 2). This BAP treatment allowed the development of an average of 8 new shoots per nodal segment.
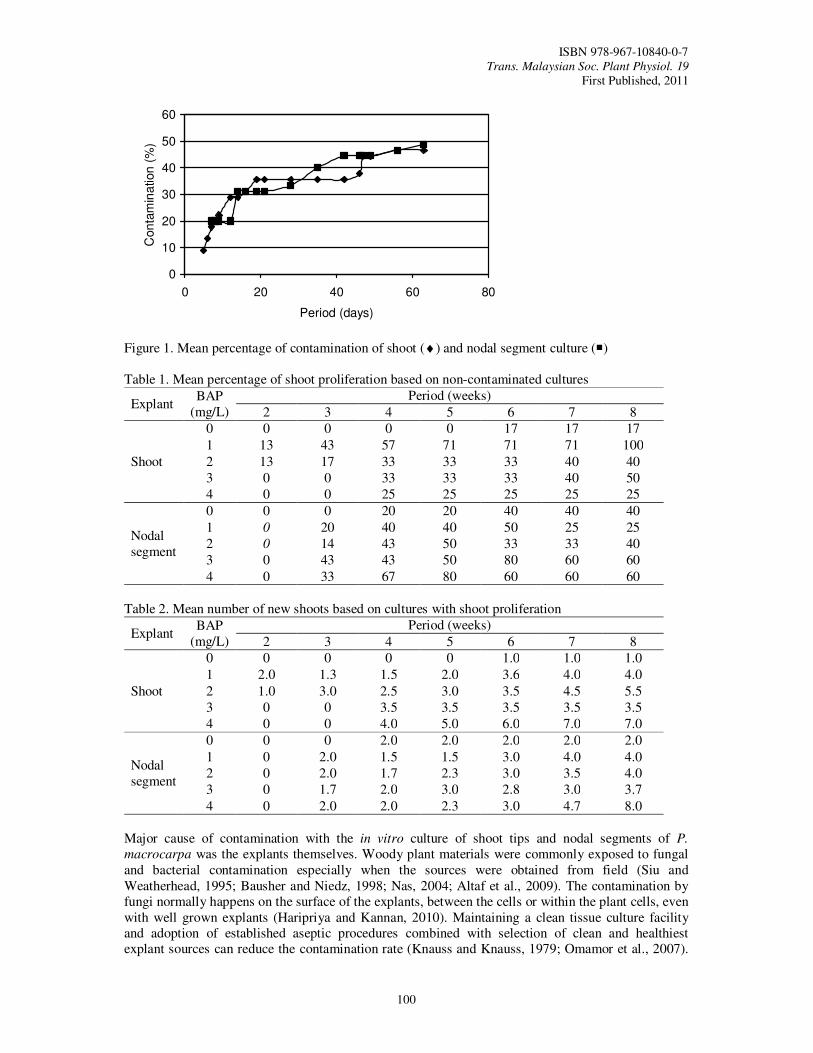
ISBN 978-967-10840-0-7 Trans. Malaysian Soc. Plant Physiol. 19
First Published, 2011
100
0
10
20
30
40
50
60
0 20 40 60 80
Period (days)
Con
tam
ina
tion
(%
)
Figure 1. Mean percentage of contamination of shoot (♦) and nodal segment culture (�) Table 1. Mean percentage of shoot proliferation based on non-contaminated cultures
Explant BAP
(mg/L)
Period (weeks)
2 3 4 5 6 7 8
Shoot
0 0 0 0 0 17 17 17
1 13 43 57 71 71 71 100
2 13 17 33 33 33 40 40
3 0 0 33 33 33 40 50
4 0 0 25 25 25 25 25
Nodal segment
0 0 0 20 20 40 40 40
1 0 20 40 40 50 25 25
2 0 14 43 50 33 33 40
3 0 43 43 50 80 60 60
4 0 33 67 80 60 60 60
Table 2. Mean number of new shoots based on cultures with shoot proliferation
Explant BAP
(mg/L)
Period (weeks)
2 3 4 5 6 7 8
Shoot
0 0 0 0 0 1.0 1.0 1.0
1 2.0 1.3 1.5 2.0 3.6 4.0 4.0
2 1.0 3.0 2.5 3.0 3.5 4.5 5.5
3 0 0 3.5 3.5 3.5 3.5 3.5
4 0 0 4.0 5.0 6.0 7.0 7.0
Nodal segment
0 0 0 2.0 2.0 2.0 2.0 2.0
1 0 2.0 1.5 1.5 3.0 4.0 4.0
2 0 2.0 1.7 2.3 3.0 3.5 4.0
3 0 1.7 2.0 3.0 2.8 3.0 3.7
4 0 2.0 2.0 2.3 3.0 4.7 8.0
Major cause of contamination with the in vitro culture of shoot tips and nodal segments of P.
macrocarpa was the explants themselves. Woody plant materials were commonly exposed to fungal and bacterial contamination especially when the sources were obtained from field (Siu and Weatherhead, 1995; Bausher and Niedz, 1998; Nas, 2004; Altaf et al., 2009). The contamination by fungi normally happens on the surface of the explants, between the cells or within the plant cells, even with well grown explants (Haripriya and Kannan, 2010). Maintaining a clean tissue culture facility and adoption of established aseptic procedures combined with selection of clean and healthiest explant sources can reduce the contamination rate (Knauss and Knauss, 1979; Omamor et al., 2007).

ISBN 978-967-10840-0-7 Trans. Malaysian Soc. Plant Physiol. 19
First Published, 2011
101
Spraying the donor plants with fungicide(s) may also be undertaken several weeks to a few days prior to taking explant materials depending on the severity of fungal contamination, type of fungicide(s) and concentration(s) used (Bunn and Tan, 2002). Shoot tips and nodal segments of P. macrocarpa responded to BAP when cultured in vitro on MS medium. Number of shoots developed on explants was increasing with increasing level of BAP in the medium. A high level of BAP (4.0 mg/L) was advantageous for in vitro sprouting of axillary buds from shoot tips and nodal segments of P. macrocarpa. It was agreeable with Chitra and Padmaja (1999) who reported multiple shoot emergence with Morus indica L.. Kane (2005) also indicated that the application of higher cytokinin level in the growth medium enhanced the formation of axillary shoots. High concentration of cytokinin causes release of shoot apical dominance, thereby stimulating growth of lateral buds and resulting in multiple shoot formation (Gaba, 2005). Addition of BAP in medium can, hence, be manipulated for multiple shoot induction and clonal multiplication purposes of this species in future. The smaller percentage of failure of P. marcocarpa shoot tip and nodal segment explants in shoot proliferation may be due to the physiology of the explants themselves. They may also be affected by the rather stringent sterilization procedures applied in this study.
Conclusions
Based on the results of this study, the most cost effective concentration of BAP for promoting shoot growth with the shoot tips and nodal segments of P. macrocarpa may be 1 mg/L BAP. However, the best in vitro shoot proliferation of P. macrocarpa shoot tips and nodal segments can be achieved with MS medium supplemented with 4.0 mg/L BAP.
References
Altaf, N., Khan, A.R., Ali, L. and Bhatti, I.A. 2009. Tissue culture of Gerbera. Pakistan Journal of
Botany 41(1): 7-10. Batra, A. 2006. Fundamental of Plant Biotechnology (Second Edition). Capital Publishing Company,
New Delhi. Pp. 16-43. Bausher, M.G. and Niedz, R.P. 1998. A discussion of in vitro contamination control of explants from
greenhouse and field ground trees. Proceedings of the Florida State Horticultural Society 111: 260-263.
Bunn, E. and Tan, B. 2002. Microbial contaminants in plant tissue culture propagation. In: Sivasithamparam, K., Dixon, K.W. and Barrett, R.L. (Eds.). Microorganisms in Plant Conservation and Biodiversity. Kluwer Academic Publishers. Pp. 307-335.
Chitra, V.D.S. and Padmaja, G. 1999. Clonal propagation of mulberry (Morus indica L. Cultivar M-5) through in vitro culture of nodal explants. Scientia Horticulturae 80: 289-298.
Gaba, V.P. 2005. Plant growth regulators in plant tissue culture and development. In: Trigiano, R.N. and Gray, D.J. (Eds.). Plant Development and Biotechnology. CRC Press LLC, United State of America. Pp. 89-93.
Haripriya, S. and Kannan, M. 2010. Standardization of explant surface sterilization technique for micropropagation in Andrographis paniculata Nees. Horticultural College and Research Institute, Tamil Nadu Agricultural University.
Kane, M.E. 2005. Shoot Culture Procedure. CRC Press LLC, United State of America. Pp. 145-157. Knauss, J.F. and Knauss, M.E. 1979. Contamination in plant tissue cultures. Proceedings of the
Florida State Horticultural Society 92: 341-343. Nas, M.N. (2004). Inclusion of polymines in the medium improves shoot elongation in hazelnut
(Corylus avellana L.) micropropagation. Turkey Journal Agriculture 28: 189-194. Nurhayati, I. 2004. Conservation of Asian- Native Medicinal Plants on the University Campus.
Unpublished Pp. 1-5.

ISBN 978-967-10840-0-7 Trans. Malaysian Soc. Plant Physiol. 19
First Published, 2011
102
Omamor, I.B., Asemota, A.O., Eke, C.R. and Eziashi, E.I. 2007. Fungal contaminants of oil palm tissue culture in Nigerian Institute for Oil Palm Research (NIFOR). African Journal of Agricultural Research 2(10): 534-537.
Oshimi, S., Zaima, K., Matsuno, Y., Hirasawa, Y., Lizuka, T., Studiawan, H., Indrayanto, G., Zaini, N.C., Morita, H. 2008. Studies on the constituents from the fruits of Phaleria microcarpa. Journal of Natural Medicines 62: 207-210.
Siu, L.P. and Weatherhead, M.A. 1995. Tissue culture of the Camellias of Hong Kong. Botanic Gardens Micropropagation News 2(1).
ISBN 978-967-10840-0-7 Trans. Malaysian Soc. Plant Physiol. 19
First Published, 2011
103
Biosensor for Detection of Malachite Green-Anti Fungal Agent Used in
Aquaculture Industry
Zamri, I.1, Faridah, S.
1, Nur Azura, M.S.
1, Noor Azlina, M.
1, Gayah, A.R.
1 and Othman, M.
2
1Biotechnology Research Centre, MARDI, GPO. Box 12301, 50774, Kuala Lumpur, Malaysia. 2Fishery Research Institute, Batu Maung, Pulau Pinang, Malaysia. *E-mail: [email protected]
Introduction
The fisheries industry in Malaysia produces approximately 980,000 tonnes of fish annually of which 7% (65,000 tonnes with the value of RM52 million) of the total landings is from aquaculture. The fisheries sector is important since it provides about 60% of the animal protein intake of the country. Chemicals are often used in freshwater aquaculture and Malachite Green (MG) which served as fungicide and parasiticide is listed as one of the 5 main chemicals used in inland aquaculture in Malaysia (Hanafi et al., 1995). The use of chemicals may lead to the emergence of more bacterial resistance to certain antibiotics. The dose rate permitted for MG in fish in Malaysia is 0.01 ppm and is restricted to ornamental fishes only. The usage of chemical inputs in aquaculture which are hazardous to human health and the environment is against the Code of Conduct for Responsible Fisheries (CCRF) as outlined by Food and Agriculture Organization (FAO). This Code sets out principles stated that the harvesting, handling, processing and distribution of fish and fishery products should be carried out in a manner which will maintain the nutritional value, quality and safety of the products. Nevertheless, the use of MG in the aquaculture practice in Malaysia has not been regulated. MG is not listed as a scheduled substance either under the Malaysia’s Food Act 1983 or Food Regulations 1985. Failure to adhere and comply to use MG within its permitted level (as there is no stringent regulation implemented in Malaysia yet) has resulted in the dumping of our aquaculture consignments in 2005 which has caused RM1.14 million in losses. One out of the seven consignments contained Malachite Green (Utusan Malaysia, 2005). Within the same year, the Director General of Fisheries had reprimanded fish breeders to stop using MG (Bernama.com, 2005). The residue of MG may take up to eight months to be completely removed from the time of the fungicide treatment and although it is used as a fungicide in the hatchery, it still can be traced in fish brought to the market. In conjunction with this, to ensure that our aquaculture products are well accepted to penetrate international markets, it is a requisite to regulate their quality as well as safety. Furthermore, Singapore and EU countries are very rigid when it comes to the safety regulation aspects. Currently, the method of detecting MG and Leuco-Malachite Green (LMG) in fishery industry mainly depends on instrumentation method namely LC or HPLC with various modes of detector (visible, MS, fluorescence detector). However, the parent compound of MG has λmax at 620 nm, whereas the leuco form has λmax at 265 nm, which makes it difficult to determine MG and LMG using the same condition (Mitrowska et al., 2005). The other drawbacks of these instrumentation methods include dealing with hazardous solvents and chemicals, and the high cost of the instrumentation. Fishery Department of Malaysia was reported to spend in the vicinity of RM6.4 million in 2005 to buy 5 units of LCMS-MS wherein the cost for each sample tested was RM385 excluding the service cost (Utusan Malaysia, 2005). Under these circumstances, it is an urge to develop a cheaper, more affordable as well as rapid detection method for MG and LMG in aquaculture industry. Biosensor technology lends itself well in this study as it offers more practical and rapid approach. This paper describes the use of Butyrylcholinesterase (BChE) enzyme as a sensing layer in biosensor platform for MG detection. The enzyme inhibition mechanism upon reaction with MG and LMG was measured electrochemically using electrochemical analyzer. This enzyme biosensor was fabricated on the carbon screen printed electrode by immobilizing the BChE enzyme using covalent immobilization via conductive polymer (poly-pyrole) on the surface of the carbon working electrode. Electrochemical detection was conducted using chronoamperometry at -300 mV vs. onboard screen-printed Ag-AgCl pseudo-
ISBN 978-967-10840-0-7 Trans. Malaysian Soc. Plant Physiol. 19
First Published, 2011
104
reference electrode. Malachite Green and Leuco-Malachite detection of 0.2-10 ppb were achieved respectively for enzyme immobilization with this polymer. The sensor showed good selectivity for Malachite Green in the presence of other substrate tested. The sensor format also shows a promising technology for simple and sensitive detection system for Malachite Green and Leuco-Malachite Green contamination. This biosensor format with electrochemical approach in detecting fish production and quality control also has been successfully demonstrated by Yi (2008) and it was more practical and superior in comparison with immuno-biosensor which utilizes polyclonal antibody. For future use, this biosensor probe is very useful for regulatory bodies to monitor both the quality and safety of our aquaculture products before exportation.
Materials and Methods
BuChE (EC 3.1.1.8) from horse serum with code C1057 (221 U mg-1), C4290 (99 U mg-1), C20777 (7.54 U mg-1), from human serum, code B4186 (908µg/117U) and Malachite green (MG-free zinc) were used in this study. All the Butyryl cholinesterase (BuChE) was diluted into a serial dilution of 1 U mg-1, 2 U mg-1, 3 U mg-1and 5 U mg-1in 0.02M PBS, pH 7 and malachite green (MG) was diluted into a serial dilution of 0.2 ppb, 1.0 ppb, 1.5 ppb, 2.0 ppb, 4.0 ppb, 8.0 ppb and 10.0 ppb from the stock solution of 100,000 ppb in degas distilled water. Carbon screen printed electrode (SPE) was pre-treated using amperometry analysis of 0.1 M NaOH with a scan rate of 0.1 Vs-1 and the potential was set at 0.0 V for 400 s to remove any particles from the electrode surface. All measurements were performed at room temperature by dipping the three electrode system in an open vessel filled with 0.01 M Phosphate buffer solution at pH 7. Cyclic voltametry analysis was set at 5 cycles from -0.1 to +0.8 V relative to Ag/AgCl reference electrode at different scan rates (10-150 mVs-1) were conducted for all enzyme concentration (1-5 U mg-1).
Results and Discussion
Since, MG are widely used in fishery industry especially in Oreochromis niloticus, salmon, fingerling fish, rainbow, sea bass, channel catfish and eels, therefore detection of MG is needed for monitoring the MG residues in fish tissue. In designing electrochemical biosensors based on inhibition of BuChE for the determination of MG either potentiometric or amperometric signal transducers have been utilized. Generally, although the potentiometric detection is a wide-range signal versus analyte concentration but it showed less sensitive response compared to amperometric detectors. Most of biosensors for MG detection are based on BuChE inhibitions which were developed with amperometric detection. In amperometric biosensors, the enzymatic activity is monitored by a direct butyrlcholine oxidation produced during the enzymatic hydrolysis of the substrate Butyrlthiocholine: Butyrlthiocholine + H
2O Thiocholine + Butyrl acid
And at the electrode:
2 Thiocholine Dithio-bis-choline + 2 H+
+ 2e-
The introduction of malachite green (MG) has shown to be the inhibitor to Butyryl cholinesterase, therefore the reduction current produces from the butyrlthiocholine oxidation was decreased due to enzyme inhibition (Figure 1). In the initial study, four different codes of BuChE from Sigma with different Unit activities per mg protein were tested with different MG concentration (0.2-10 ppb). All the experiments were conducted with the exposure of MG to the Butyryl cholinesterase (2.0 U mg-1) in 0.01M phosphate buffer, pH 7 and cyclic voltametry measurement was recorded when the substrate (BuCh) was added to the mixture. The results from Figure 2 showed that significant inhibition pattern of MG (0.2-10 ppb) was shown by BuChE from code C1057 when compared with other codes. The enzyme inhibition increased with increased MG concentration and MG at 2 ppb showed maximum inhibition (70%). Thus for future use, this enzyme code with 2.0 U mg-1 will be used for the construction of enzyme biosensor.
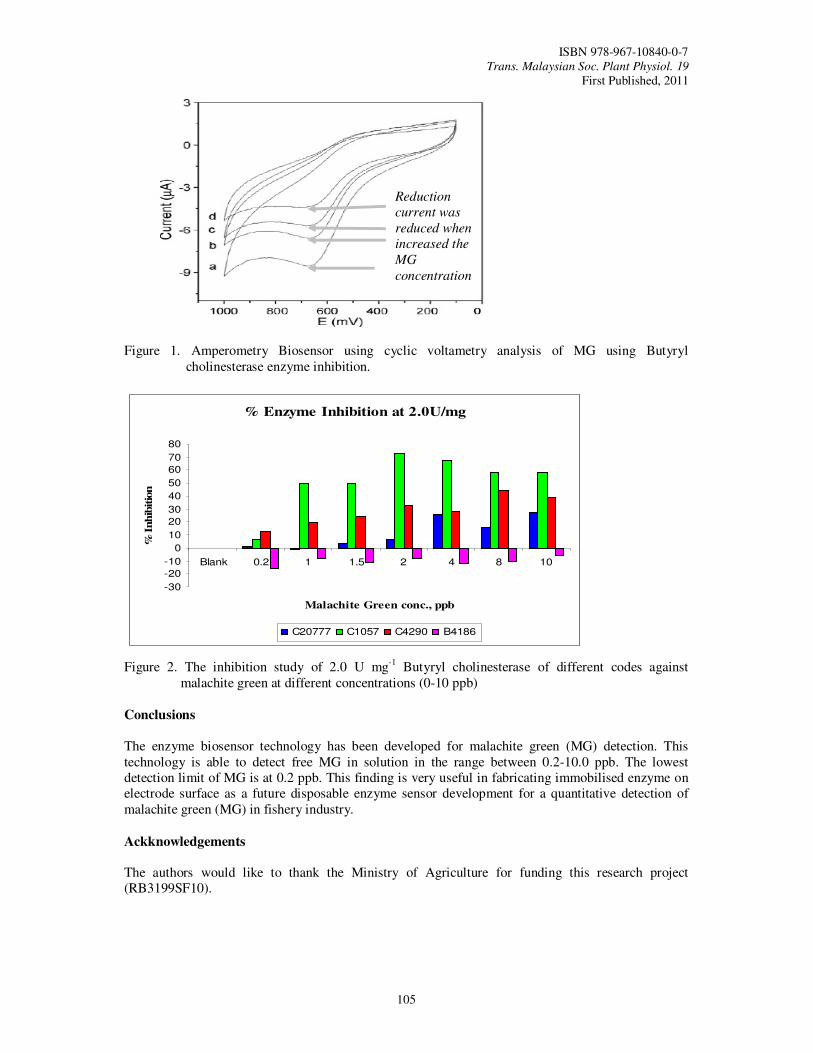
ISBN 978-967-10840-0-7 Trans. Malaysian Soc. Plant Physiol. 19
First Published, 2011
105
Figure 1. Amperometry Biosensor using cyclic voltametry analysis of MG using Butyryl
cholinesterase enzyme inhibition. Figure 2. The inhibition study of 2.0 U mg-1 Butyryl cholinesterase of different codes against
malachite green at different concentrations (0-10 ppb)
Conclusions
The enzyme biosensor technology has been developed for malachite green (MG) detection. This technology is able to detect free MG in solution in the range between 0.2-10.0 ppb. The lowest detection limit of MG is at 0.2 ppb. This finding is very useful in fabricating immobilised enzyme on electrode surface as a future disposable enzyme sensor development for a quantitative detection of malachite green (MG) in fishery industry.
Ackknowledgements
The authors would like to thank the Ministry of Agriculture for funding this research project (RB3199SF10).
Reduction
current was
reduced when
increased the
MG
concentration
% Enzyme Inhibition at 2.0U/mg
-30
-20
-10
0
10
20
30
40
50
60
70
80
Blank 0.2 1 1.5 2 4 8 10
Malachite Green conc., ppb
% I
nh
ibit
ion
C20777 C1057 C4290 B4186
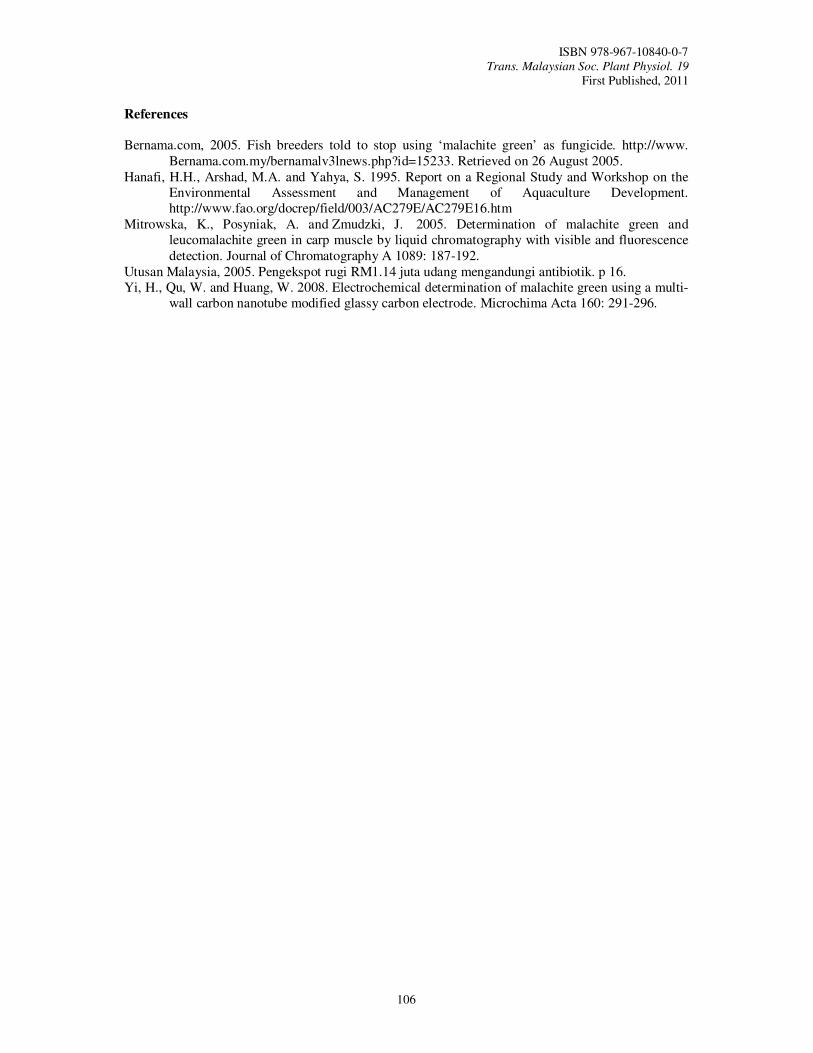
ISBN 978-967-10840-0-7 Trans. Malaysian Soc. Plant Physiol. 19
First Published, 2011
106
References
Bernama.com, 2005. Fish breeders told to stop using ‘malachite green’ as fungicide. http://www.
Bernama.com.my/bernamalv3lnews.php?id=15233. Retrieved on 26 August 2005. Hanafi, H.H., Arshad, M.A. and Yahya, S. 1995. Report on a Regional Study and Workshop on the
Environmental Assessment and Management of Aquaculture Development. http://www.fao.org/docrep/field/003/AC279E/AC279E16.htm
Mitrowska, K., Posyniak, A. and Zmudzki, J. 2005. Determination of malachite green and leucomalachite green in carp muscle by liquid chromatography with visible and fluorescence detection. Journal of Chromatography A 1089: 187-192.
Utusan Malaysia, 2005. Pengekspot rugi RM1.14 juta udang mengandungi antibiotik. p 16. Yi, H., Qu, W. and Huang, W. 2008. Electrochemical determination of malachite green using a multi-
wall carbon nanotube modified glassy carbon electrode. Microchima Acta 160: 291-296.

ISBN 978-967-10840-0-7 Trans. Malaysian Soc. Plant Physiol. 19
First Published, 2011
107
CHAPTER 7
CLIMATE CHANGE, MODELING
AND SIMULATION

ISBN 978-967-10840-0-7 Trans. Malaysian Soc. Plant Physiol. 19
First Published, 2011
108
Impacts of Climate Change on Biodiversity and the Adaptation Measures
Philip, E.* and Abdul Rahim, N. Forest Research Institute Malaysia (FRIM), 52 109 Kepong, Selangor, Malaysia. *E-mail: [email protected]; [email protected]
Introduction The anticipated impacts of climate change due to greenhouse gas emissions already in the atmosphere are much greater than the ability of the ecosystems to absorb at natural or historic pace. Climate variability is predicted, with increased precipitation in some areas and extreme dry and hot periods in other regions. For Malaysia, observed climate change has been reported as follows (MNRE, 2011):
a. The rate of mean surface temperature increase based on 40 years record (1969 -2009) ranges
from 0.6 ⁰C to 1.2 ⁰C per 50 years,
b. Rainfall intensity between 2000 to 2007 at the DID Rainfall Station, Ampang exceeded the amount observed between 1971 to 1980, which was also the highest recorded previously.
c. Sea level rise data over 20 years period (1986-2006) from Tg. Piai, Johor, indicated a rate of increase of 1.3 mm/year.
While, the projected climate change up to 2050 based on the PRECIS model indicates:
a. Medium range emissions scenario indicates a 1.5 ⁰C to 2.0 ⁰C increase in surface temperature by 2050.
b. The frequency of extreme weather patterns is also projected to increase, although the annual dry and wet cycles may not change significantly.
Details of these report is reflected in the Second National Communication to the UNFCCC (MNRE, 2011). Based on these observed and projected changes in climate, it is anticipated that:
a. Changes in carbon stocks
Based on long-term ecological plots assessments in Pasoh and Lambir Forest Reserves in Malaysia, Chave et al. (2005), reported that a significant increase in carbon stocks between 1990 and 1995, followed by decreases between 1995 and 2000 (Figure 1). The decrease was due to a strong El Nino and regional droughts. In addition, the growth was reported to occur amongst the slow growing species rather than the fast growing species. The study suggest that the forest may simultaneously recovering from past disturbances and affected by changes in resource availability. Philip and Abdul Rahim (2008) also reported that fast growing species has lower water use efficiency as compared with slower growing Dipterocarpus species.
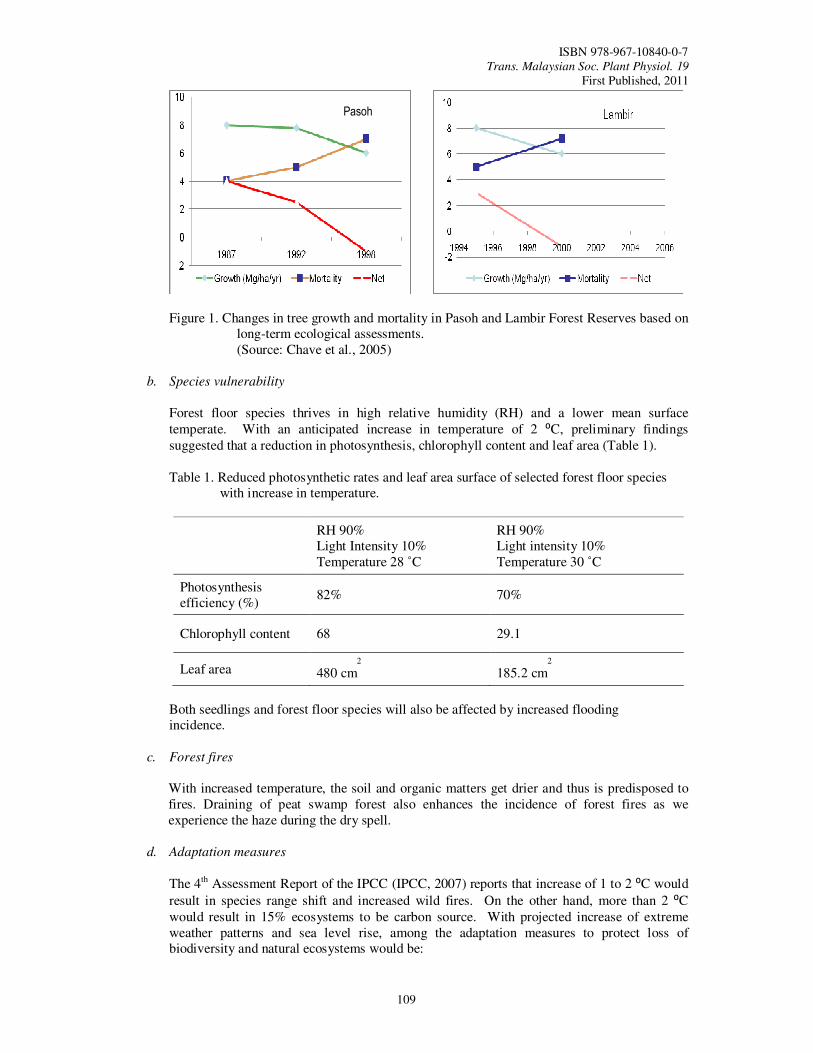
ISBN 978-967-10840-0-7 Trans. Malaysian Soc. Plant Physiol. 19
First Published, 2011
109
Figure 1. Changes in tree growth and mortality in Pasoh and Lambir Forest Reserves based on
long-term ecological assessments. (Source: Chave et al., 2005)
b. Species vulnerability
Forest floor species thrives in high relative humidity (RH) and a lower mean surface
temperate. With an anticipated increase in temperature of 2 ⁰C, preliminary findings
suggested that a reduction in photosynthesis, chlorophyll content and leaf area (Table 1). Table 1. Reduced photosynthetic rates and leaf area surface of selected forest floor species
with increase in temperature.
RH 90% Light Intensity 10% Temperature 28 ˚C
RH 90% Light intensity 10% Temperature 30 ˚C
Photosynthesis efficiency (%)
82% 70%
Chlorophyll content 68 29.1
Leaf area 480 cm2
185.2 cm2
Both seedlings and forest floor species will also be affected by increased flooding incidence.
c. Forest fires
With increased temperature, the soil and organic matters get drier and thus is predisposed to fires. Draining of peat swamp forest also enhances the incidence of forest fires as we experience the haze during the dry spell.
d. Adaptation measures
The 4th Assessment Report of the IPCC (IPCC, 2007) reports that increase of 1 to 2 ⁰C would
result in species range shift and increased wild fires. On the other hand, more than 2 ⁰C
would result in 15% ecosystems to be carbon source. With projected increase of extreme weather patterns and sea level rise, among the adaptation measures to protect loss of biodiversity and natural ecosystems would be:
Pasoh

ISBN 978-967-10840-0-7 Trans. Malaysian Soc. Plant Physiol. 19
First Published, 2011
110
a. Demarcation of dry/wet zones and re-alignment of species distribution. Plants
susceptible to drought should be shifted to wet zones. As a first step to plan adaptation measures to reduce the loss of biodiversity, the water resource and availability maps for the country would be to be updated. Re-calibration of crop distribution may be needed in order to maintain the yield and ecosystem functions.
b. Size and connectivity between forest will determine whether a sufficiently large pool of diverse genes and species is available and therefore the ecological processes can continue to thrive
c. New varieties need to be developed to tolerant to the extreme weather patterns.
Alternatively, the yield of crops needs to be enhanced to during growing seasons in order to compensate for loss in yield during extreme weather patterns.
d. Ex situ and In situ conservation need to be further enhanced
e. Improved or modified management of natural forest may be needed to ensure the continued services provided by the natural ecosystems.
f. Surveillance on sea level rise and salt water intrusion needs to be enhanced especially when we have long coastlines.
Conclusions
Based on the limited research findings and projected climate change in the next 50 years, the productivity and services provided by the natural ecosystems may be affected. The forest floor species are considered to be vulnerable to extreme weather patterns and the peatlands especially the unmanaged areas may be predisposed to forest fires.
References Chave, J., Condit, R., Muller-Landau, H.C., Thomas, S.C., Ashton, P.S., Bunyavejchewin, S., Co,
L.L., Dattaraja, H.S., Davies, S.J., Esufali, S. 2005. Assessing evidence for a pervasive alteration in tropical tree communities. PLoS Biology 6:3:e45
Ministry of Natural Resources and Environment Malaysia. 2011. Second National Communication to the UNFCCC. 116 pp.
Philip, E., Abd. Rahim, N. and Mohd Rizal, M.K. 2008. Preliminary observations of elevated CO2 and temperatures on the photochemistry of selected species. Transactions of the Malaysian Society of Plant Physiology 16: 22-26.
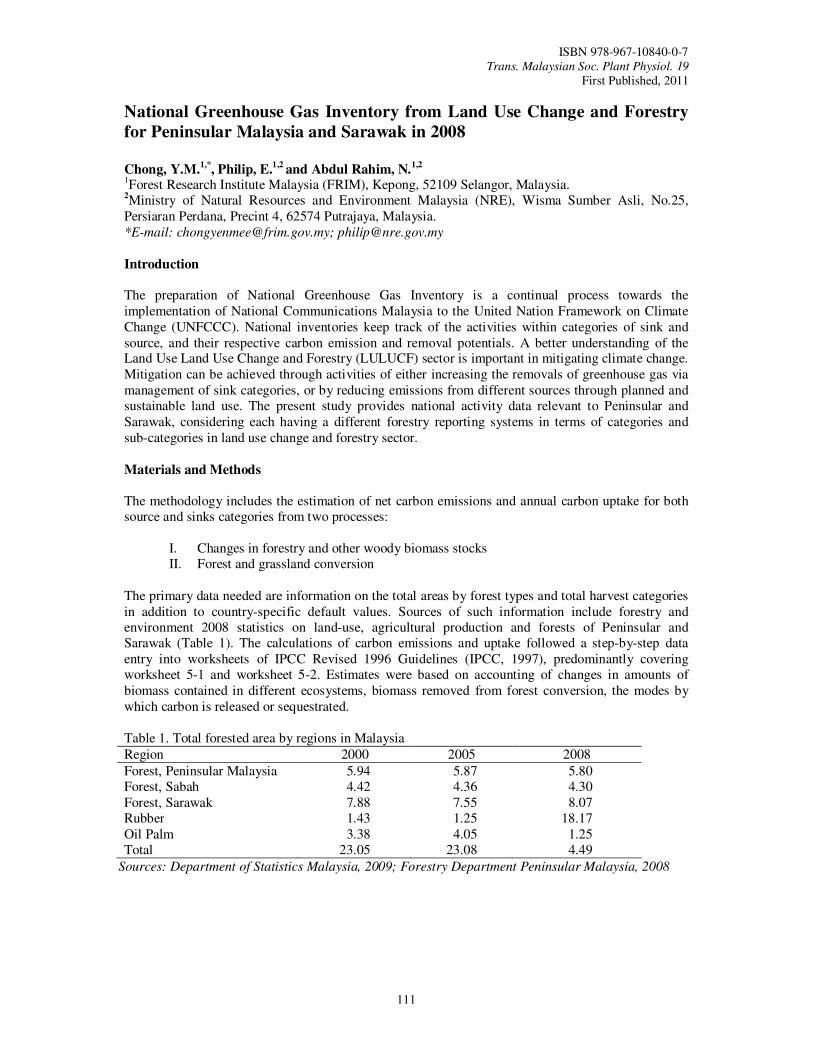
ISBN 978-967-10840-0-7 Trans. Malaysian Soc. Plant Physiol. 19
First Published, 2011
111
National Greenhouse Gas Inventory from Land Use Change and Forestry
for Peninsular Malaysia and Sarawak in 2008
Chong, Y.M.1,*
, Philip, E.1,2
and Abdul Rahim, N.1,2
1Forest Research Institute Malaysia (FRIM), Kepong, 52109 Selangor, Malaysia. 2Ministry of Natural Resources and Environment Malaysia (NRE), Wisma Sumber Asli, No.25, Persiaran Perdana, Precint 4, 62574 Putrajaya, Malaysia. *E-mail: [email protected]; [email protected]
Introduction The preparation of National Greenhouse Gas Inventory is a continual process towards the implementation of National Communications Malaysia to the United Nation Framework on Climate Change (UNFCCC). National inventories keep track of the activities within categories of sink and source, and their respective carbon emission and removal potentials. A better understanding of the Land Use Land Use Change and Forestry (LULUCF) sector is important in mitigating climate change. Mitigation can be achieved through activities of either increasing the removals of greenhouse gas via management of sink categories, or by reducing emissions from different sources through planned and sustainable land use. The present study provides national activity data relevant to Peninsular and Sarawak, considering each having a different forestry reporting systems in terms of categories and sub-categories in land use change and forestry sector.
Materials and Methods The methodology includes the estimation of net carbon emissions and annual carbon uptake for both source and sinks categories from two processes:
I. Changes in forestry and other woody biomass stocks II. Forest and grassland conversion
The primary data needed are information on the total areas by forest types and total harvest categories in addition to country-specific default values. Sources of such information include forestry and environment 2008 statistics on land-use, agricultural production and forests of Peninsular and Sarawak (Table 1). The calculations of carbon emissions and uptake followed a step-by-step data entry into worksheets of IPCC Revised 1996 Guidelines (IPCC, 1997), predominantly covering worksheet 5-1 and worksheet 5-2. Estimates were based on accounting of changes in amounts of biomass contained in different ecosystems, biomass removed from forest conversion, the modes by which carbon is released or sequestrated. Table 1. Total forested area by regions in Malaysia
Region 2000 2005 2008
Forest, Peninsular Malaysia 5.94 5.87 5.80 Forest, Sabah 4.42 4.36 4.30 Forest, Sarawak 7.88 7.55 8.07 Rubber 1.43 1.25 18.17 Oil Palm 3.38 4.05 1.25 Total 23.05 23.08 4.49
Sources: Department of Statistics Malaysia, 2009; Forestry Department Peninsular Malaysia, 2008
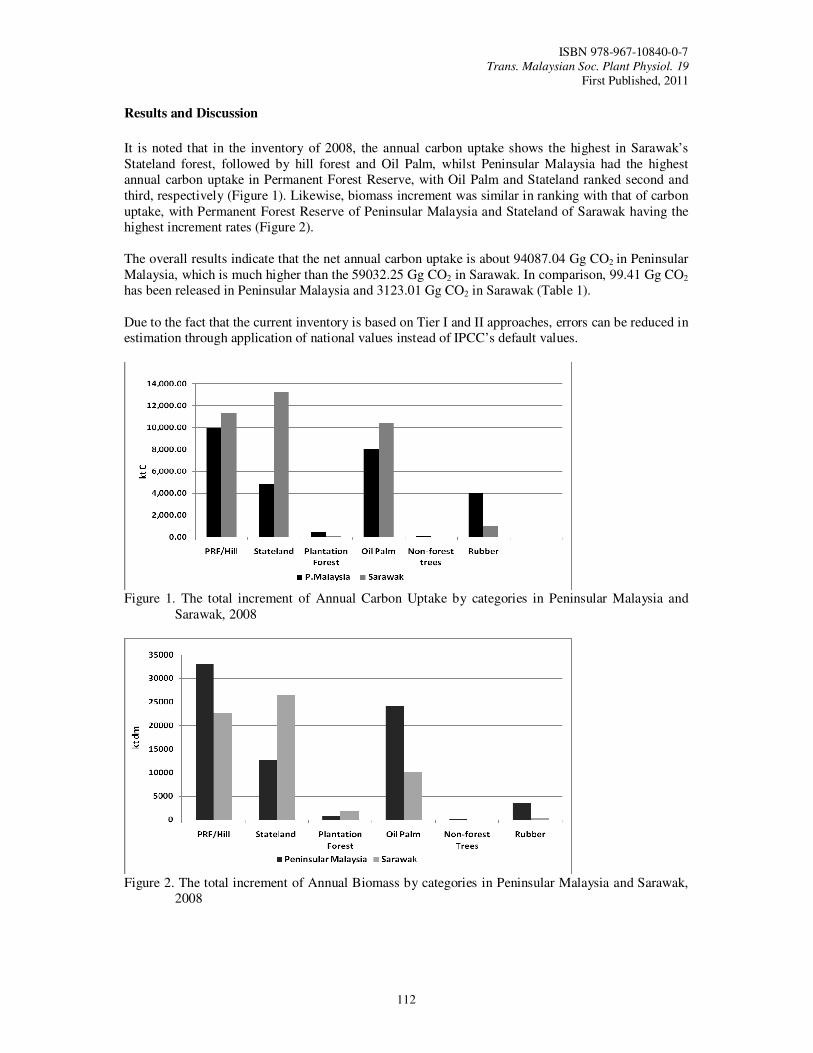
ISBN 978-967-10840-0-7 Trans. Malaysian Soc. Plant Physiol. 19
First Published, 2011
112
Results and Discussion
It is noted that in the inventory of 2008, the annual carbon uptake shows the highest in Sarawak’s Stateland forest, followed by hill forest and Oil Palm, whilst Peninsular Malaysia had the highest annual carbon uptake in Permanent Forest Reserve, with Oil Palm and Stateland ranked second and third, respectively (Figure 1). Likewise, biomass increment was similar in ranking with that of carbon uptake, with Permanent Forest Reserve of Peninsular Malaysia and Stateland of Sarawak having the highest increment rates (Figure 2). The overall results indicate that the net annual carbon uptake is about 94087.04 Gg CO2 in Peninsular Malaysia, which is much higher than the 59032.25 Gg CO2 in Sarawak. In comparison, 99.41 Gg CO2 has been released in Peninsular Malaysia and 3123.01 Gg CO2 in Sarawak (Table 1). Due to the fact that the current inventory is based on Tier I and II approaches, errors can be reduced in estimation through application of national values instead of IPCC’s default values.
Figure 1. The total increment of Annual Carbon Uptake by categories in Peninsular Malaysia and
Sarawak, 2008
Figure 2. The total increment of Annual Biomass by categories in Peninsular Malaysia and Sarawak,
2008
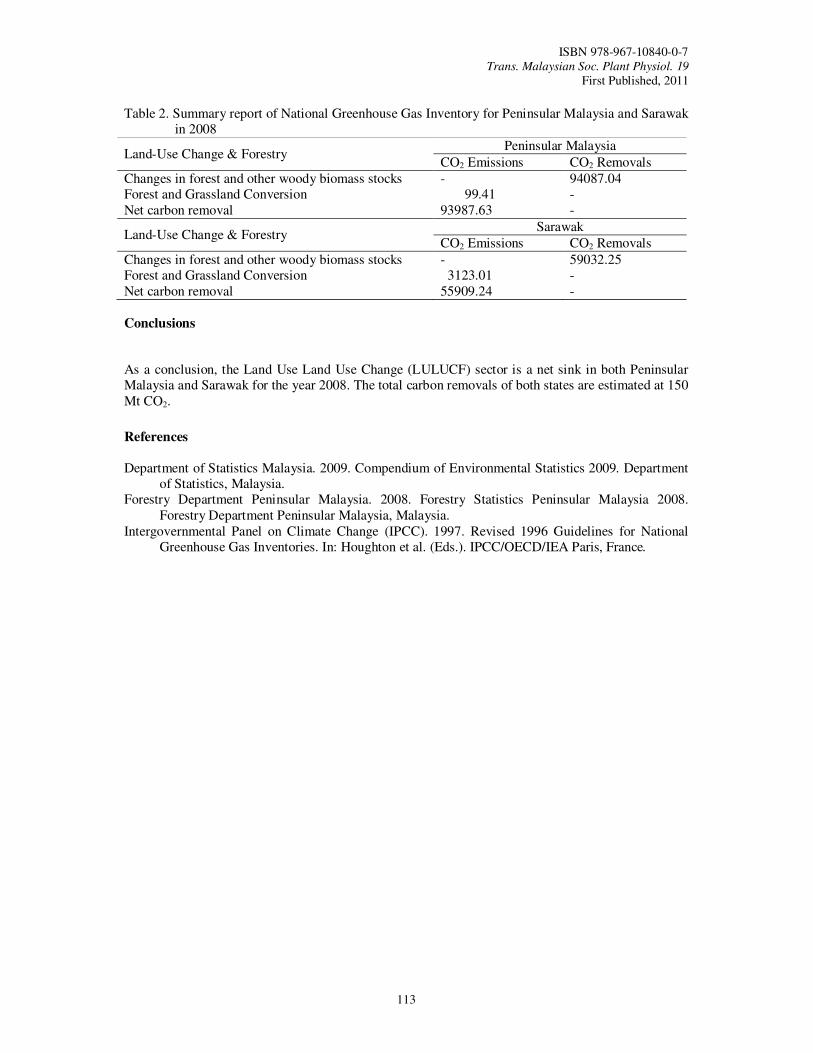
ISBN 978-967-10840-0-7 Trans. Malaysian Soc. Plant Physiol. 19
First Published, 2011
113
Table 2. Summary report of National Greenhouse Gas Inventory for Peninsular Malaysia and Sarawak
in 2008
Land-Use Change & Forestry Peninsular Malaysia
CO2 Emissions CO2 Removals
Changes in forest and other woody biomass stocks - 94087.04 Forest and Grassland Conversion 99.41 - Net carbon removal 93987.63 -
Land-Use Change & Forestry Sarawak
CO2 Emissions CO2 Removals
Changes in forest and other woody biomass stocks - 59032.25 Forest and Grassland Conversion 3123.01 - Net carbon removal 55909.24 -
Conclusions
As a conclusion, the Land Use Land Use Change (LULUCF) sector is a net sink in both Peninsular Malaysia and Sarawak for the year 2008. The total carbon removals of both states are estimated at 150 Mt CO2.
References Department of Statistics Malaysia. 2009. Compendium of Environmental Statistics 2009. Department
of Statistics, Malaysia. Forestry Department Peninsular Malaysia. 2008. Forestry Statistics Peninsular Malaysia 2008.
Forestry Department Peninsular Malaysia, Malaysia. Intergovernmental Panel on Climate Change (IPCC). 1997. Revised 1996 Guidelines for National
Greenhouse Gas Inventories. In: Houghton et al. (Eds.). IPCC/OECD/IEA Paris, France.
ISBN 978-967-10840-0-7 Trans. Malaysian Soc. Plant Physiol. 19
First Published, 2011
114
Topographic Effects on Stand Structure in the Logged-Over Lowland
Dipterocarp Forest
Mohd Razman, S.*, Tan, S.A., Khali, A.H. and Abd Rahman, K.
Forestry and Environment Division, Forest Research Institute Malaysia (FRIM), Kepong, 52109 Selangor, Malaysia *E-mail: [email protected]
Introduction Topography is one of the main factors effecting stand structure in tropical rainforests. The natural topography condition that develops flat and slope areas may provide a unique forest structure through resource competition between inter and intra trees species. The efforts to comprehend the complex tropical rain forest structure include the development of bivariate model. Besides representing the typical tropical tree distribution, the model is also important to understand the correlation of measurable parameter and the changes of the forest structure based on condition of topography and forest type. To date, model of tropical rain forest structure has been widely used and this makes forest modeling a practical application in understanding the interaction of trees in the specific forest area. Besides getting the proper sampling design, we are also interested to find out whether topography gives an effect on stand structure in the logged-over lowland dipterocarp forest. In this study, we describe forest structure simply by the relationship between total tree height, crown diameter and DBH size.
Materials and Methods
Study area
The study was conducted in the logged-over forest of Compartment 360-A, Berkelah Forest Reserve, Maran, Pahang, Malaysia that is situated in the South East Asia (Figure 1). The forest reserve is a mixed lowland dipterocarp forest which belongs to Pahang State Forestry Department. Size of the study area is about 114 ha and falls between 30 44’ 18” to 30 45’ 10” latitude and 1020 57’ 8” to 1020 58’ 6” longitude. The demography of the study site is generally flat with slope only ranging from 40-140 m above sea level.
Sampling method
Plot establishment and field inventory took about four months from May to August 2010 to complete. The data were collected from eighteen sample plots of 40 x 40 m established by stratified random sampling method. This sampling method was chosen to reduce cost and time allocation in field inventory activities. We had stratified the forest area into two categories which were; (a) Elevation : i) 40-80 m, ii) 80-100 m, and iii) 100-140 m (b) Topography : i) flat, and ii) slope area
A total of 18 plots were established in this study site where 9 plots were established at flat area and the other 9 plots at slope area. We avoided establishing a study plot in the disturbance and protected areas such as riverine, secondary road and skid trail. Vegetation of the study area
More than 3000 individual stems of 351 species in 2.88 ha were encountered during the sampling. Euphorbiaceae, Dipterocarpaceae, Burseraceae and Annonacea families have dominated this logged-over forest. Archidendron bubalinum, Syzygium densiflora, Hopea mengarawan and Elateriospermum tapos were the most abundant species in the Berkelah FR. The tropical forest of Berkelah is rich with
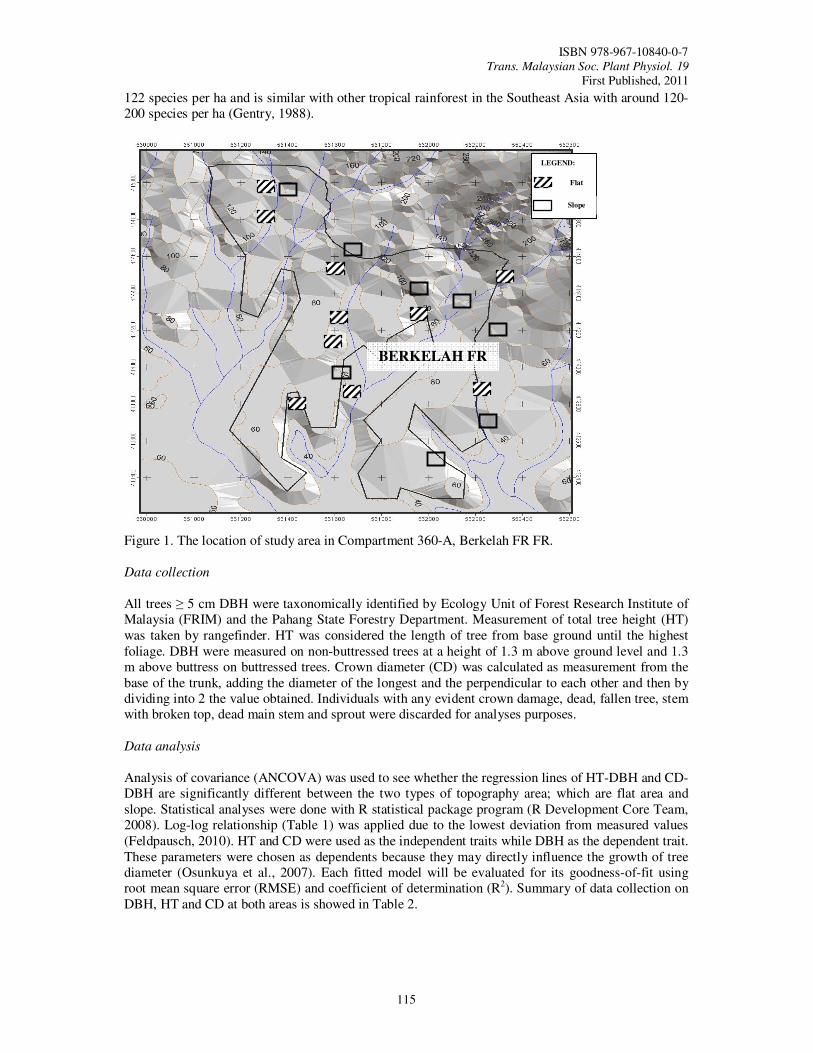
ISBN 978-967-10840-0-7 Trans. Malaysian Soc. Plant Physiol. 19
First Published, 2011
115
122 species per ha and is similar with other tropical rainforest in the Southeast Asia with around 120-200 species per ha (Gentry, 1988).
Figure 1. The location of study area in Compartment 360-A, Berkelah FR FR.
Data collection
All trees ≥ 5 cm DBH were taxonomically identified by Ecology Unit of Forest Research Institute of Malaysia (FRIM) and the Pahang State Forestry Department. Measurement of total tree height (HT) was taken by rangefinder. HT was considered the length of tree from base ground until the highest foliage. DBH were measured on non-buttressed trees at a height of 1.3 m above ground level and 1.3 m above buttress on buttressed trees. Crown diameter (CD) was calculated as measurement from the base of the trunk, adding the diameter of the longest and the perpendicular to each other and then by dividing into 2 the value obtained. Individuals with any evident crown damage, dead, fallen tree, stem with broken top, dead main stem and sprout were discarded for analyses purposes. Data analysis Analysis of covariance (ANCOVA) was used to see whether the regression lines of HT-DBH and CD-DBH are significantly different between the two types of topography area; which are flat area and slope. Statistical analyses were done with R statistical package program (R Development Core Team, 2008). Log-log relationship (Table 1) was applied due to the lowest deviation from measured values (Feldpausch, 2010). HT and CD were used as the independent traits while DBH as the dependent trait. These parameters were chosen as dependents because they may directly influence the growth of tree diameter (Osunkuya et al., 2007). Each fitted model will be evaluated for its goodness-of-fit using root mean square error (RMSE) and coefficient of determination (R2). Summary of data collection on DBH, HT and CD at both areas is showed in Table 2.
LEGEND:
Flat
Slope
BERKELAH FR
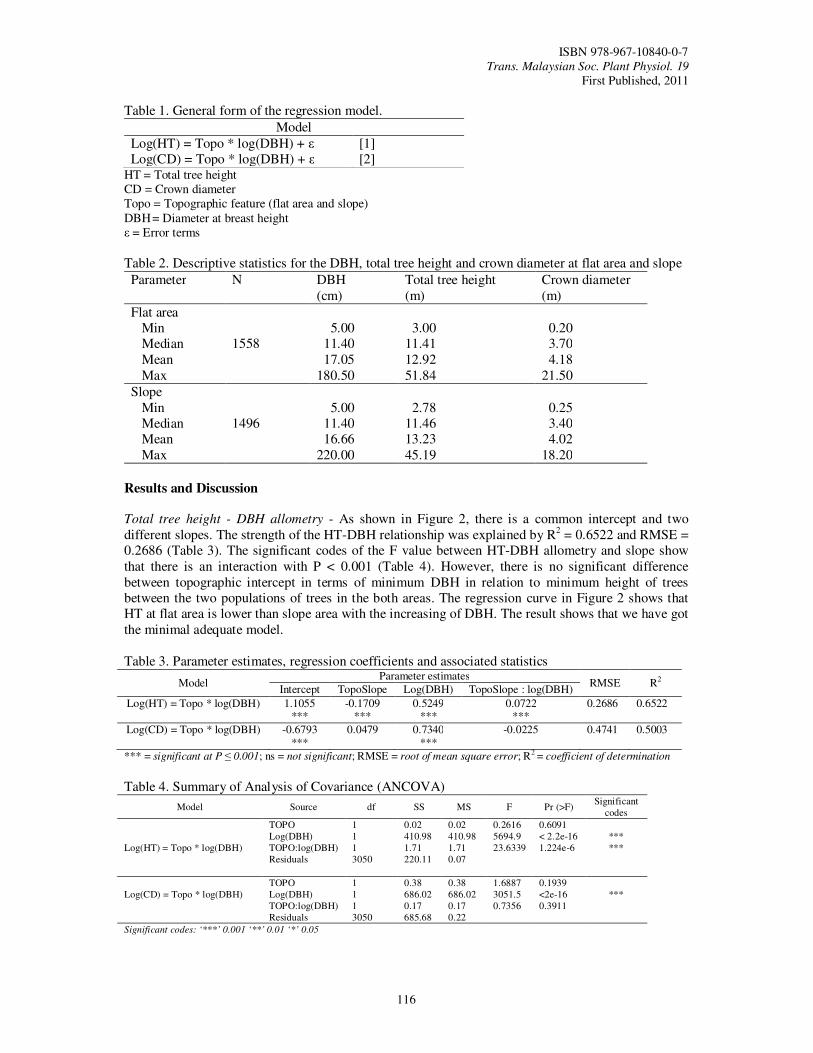
ISBN 978-967-10840-0-7 Trans. Malaysian Soc. Plant Physiol. 19
First Published, 2011
116
Table 1. General form of the regression model.
Model
Log(HT) = Topo * log(DBH) + ε [1] Log(CD) = Topo * log(DBH) + ε [2]
HT = Total tree height CD = Crown diameter Topo = Topographic feature (flat area and slope)
DBH = Diameter at breast height ε = Error terms
Table 2. Descriptive statistics for the DBH, total tree height and crown diameter at flat area and slope
Parameter N DBH (cm)
Total tree height (m)
Crown diameter (m)
Flat area Min
1558
5.00 3.00 0.20 Median 11.40 11.41 3.70 Mean 17.05 12.92 4.18 Max 180.50 51.84 21.50
Slope Min
1496
5.00 2.78 0.25 Median 11.40 11.46 3.40 Mean 16.66 13.23 4.02 Max 220.00 45.19 18.20
Results and Discussion Total tree height - DBH allometry - As shown in Figure 2, there is a common intercept and two different slopes. The strength of the HT-DBH relationship was explained by R2 = 0.6522 and RMSE = 0.2686 (Table 3). The significant codes of the F value between HT-DBH allometry and slope show that there is an interaction with P < 0.001 (Table 4). However, there is no significant difference between topographic intercept in terms of minimum DBH in relation to minimum height of trees between the two populations of trees in the both areas. The regression curve in Figure 2 shows that HT at flat area is lower than slope area with the increasing of DBH. The result shows that we have got the minimal adequate model. Table 3. Parameter estimates, regression coefficients and associated statistics
Model Parameter estimates
RMSE R2 Intercept TopoSlope Log(DBH) TopoSlope : log(DBH)
Log(HT) = Topo * log(DBH) 1.1055 ***
-0.1709 ***
0.5249 ***
0.0722 ***
0.2686 0.6522
Log(CD) = Topo * log(DBH) -0.6793 ***
0.0479 0.7340 ***
-0.0225
0.4741 0.5003
*** = significant at P ≤ 0.001; ns = not significant; RMSE = root of mean square error; R2 = coefficient of determination
Table 4. Summary of Analysis of Covariance (ANCOVA)
Model Source df SS MS F Pr (>F) Significant
codes
Log(HT) = Topo * log(DBH)
TOPO 1 0.02 0.02 0.2616 0.6091 Log(DBH) 1 410.98 410.98 5694.9 < 2.2e-16 *** TOPO:log(DBH) 1 1.71 1.71 23.6339 1.224e-6 *** Residuals 3050 220.11 0.07
Log(CD) = Topo * log(DBH)
TOPO 1 0.38 0.38 1.6887 0.1939 Log(DBH) 1 686.02 686.02 3051.5 <2e-16 *** TOPO:log(DBH) 1 0.17 0.17 0.7356 0.3911 Residuals 3050 685.68 0.22
Significant codes: ‘***’ 0.001 ‘**’ 0.01 ‘*’ 0.05
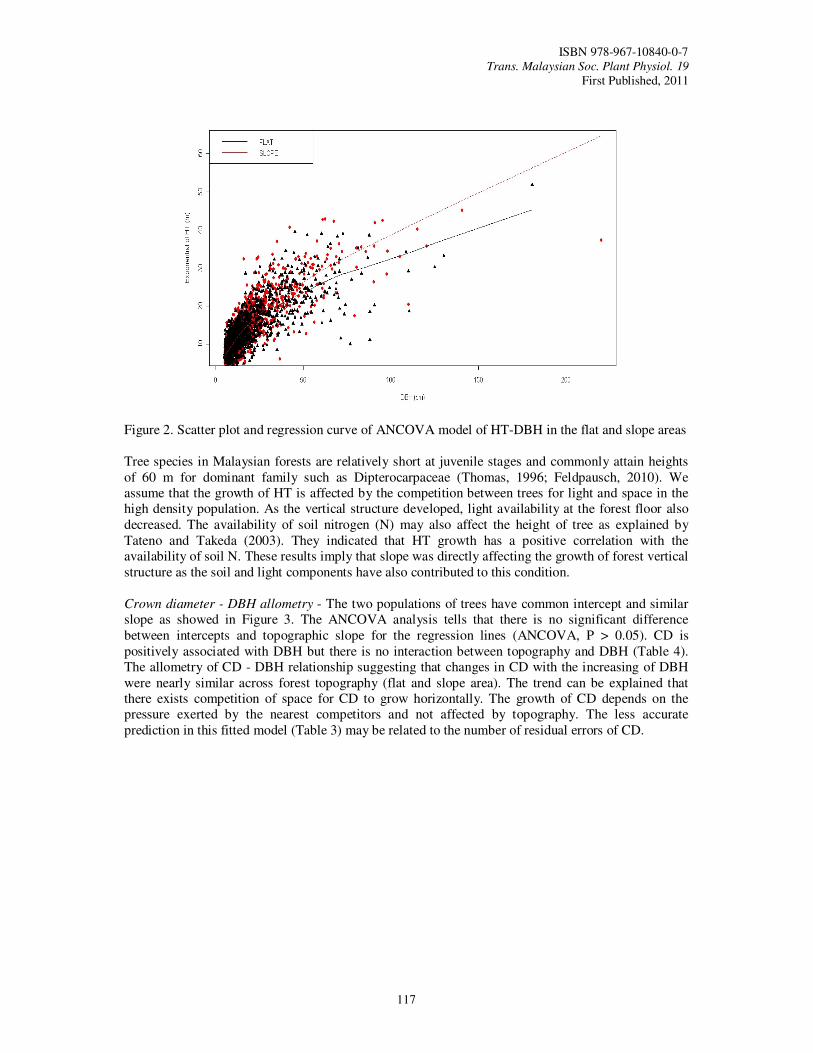
ISBN 978-967-10840-0-7 Trans. Malaysian Soc. Plant Physiol. 19
First Published, 2011
117
Figure 2. Scatter plot and regression curve of ANCOVA model of HT-DBH in the flat and slope areas Tree species in Malaysian forests are relatively short at juvenile stages and commonly attain heights of 60 m for dominant family such as Dipterocarpaceae (Thomas, 1996; Feldpausch, 2010). We assume that the growth of HT is affected by the competition between trees for light and space in the high density population. As the vertical structure developed, light availability at the forest floor also decreased. The availability of soil nitrogen (N) may also affect the height of tree as explained by Tateno and Takeda (2003). They indicated that HT growth has a positive correlation with the availability of soil N. These results imply that slope was directly affecting the growth of forest vertical structure as the soil and light components have also contributed to this condition. Crown diameter - DBH allometry - The two populations of trees have common intercept and similar slope as showed in Figure 3. The ANCOVA analysis tells that there is no significant difference between intercepts and topographic slope for the regression lines (ANCOVA, P > 0.05). CD is positively associated with DBH but there is no interaction between topography and DBH (Table 4). The allometry of CD - DBH relationship suggesting that changes in CD with the increasing of DBH were nearly similar across forest topography (flat and slope area). The trend can be explained that there exists competition of space for CD to grow horizontally. The growth of CD depends on the pressure exerted by the nearest competitors and not affected by topography. The less accurate prediction in this fitted model (Table 3) may be related to the number of residual errors of CD.
ISBN 978-967-10840-0-7 Trans. Malaysian Soc. Plant Physiol. 19
First Published, 2011
118
Figure 3. Scatter plot and regression curve of ANCOVA model of CD-DBH in the flat and slope areas
Conclusions
We found that slope in the logged-over lowland dipterocarp forest has affected the HT-DBH relationship (ANCOVA, P < 0.001). However, growth of CD in both areas was not affected by topography factors. HT-DBH and CD-DBH relationships have a good potential to provide reliable indicators of site quality and forest structure of logged-over forests. In particular, site form appears to be a useful indicator of site productivity (e.g., basal area) for secondary rainforest stands. The HT-DBH and CD-DBH equations presented here can be used to obtained tree height and crown diameter estimates. The results suggest that site quality affects the production of timber, and therefore it is necessary to take into consideration the site productivity by taking soil factors as an additional parameter to see the relationships between changes of vertical and horizontal attributes of trees and soil type.
References Feldpausch, T.R. 2010. Height-diameter allometry of tropical forest trees. Biogeosciences Discuss 7:
7727-7793. Gentry, A.H, 1988. Tree species richness of upper Amazonian forests. Proceedings of the National
Academy of Sciences, USA. 85: 156-159. Osunkoya, O.O., Kharunnisa, O., Norratna, A., Dayan, J., Dayanawati, S.D. and Sheng, T.K. 2007.
Comparative height-crown allometry and mechanical design in 22 tree species of Kuala Belalalong rainforest, Brunei, Borneo.
R Development Core Team. 2008. R: A Language and Environment for Statistical Computing. R Foundation for Statistical Computing, Vienna, Austria.
Tateno, R. and Takeda, H. 2003. Forest structure and tree species distribution in relation to topography-mediated heterogeneity of soil nitrogen and light at the forest floor. Ecological Research 18: 559-571.
Thomas, S.C. 1996. Asymptotic height as a predictor of growth and allometry characteristics in Malaysian rain forest trees. American Journal of Botany 83: 556-566.