Embed Size (px)
Citation preview

Living StandardsMeasurement StudyWorking Paper No. 115
Changing Pafterns of Illiteracy in Morocco
Assessment Methods Compared
Pub
lic D
iscl
osur
e A
utho
rized
Pub
lic D
iscl
osur
e A
utho
rized
Pub
lic D
iscl
osur
e A
utho
rized
Pub
lic D
iscl
osur
e A
utho
rized
Pub
lic D
iscl
osur
e A
utho
rized
Pub
lic D
iscl
osur
e A
utho
rized
Pub
lic D
iscl
osur
e A
utho
rized
Pub
lic D
iscl
osur
e A
utho
rized

LSMS Working Papers
No. 45 Gertler and van der Gaag, Measuring the Willingness to Pay for Social Services in DevelopingCountries
No. 46 Vijverberg, Nonagricultural Family Enterprises in C6te d'lvoire: A Descriptive Analysis
No. 47 Glewwe and de Tray, The Poor during Adjustment: A Case Study of Cate d'lvoire
No. 48 Glewwe and van der Gaag, Confronting Poverty in Developing Countries: Definitions, Information,and Policies
No. 49 Scott and Amenuvegbe, Sample Designs for the Living Standards Surveys in Ghana andMauritania/Plans de sondage pour les enquetes sur le niveau de vie au Ghana et en Mauritanie
No. 50 Laraki, Food Subsidies: A Case Study of Price Reform in Morocco (also in French, 50F)
No. 51 Strauss and Mehra, Child Anthropometry in Cate d'lvoire: Estimatesfrom Two Surveys, 1985and 1986
No. 52 van der Gaag, Stelcner, and Vijverberg, Public-Private Sector Wage Comparisons andMoonlighting in Developing Countries: Evidencefrom C6te d'lvoire and Peru
No. 53 Ainsworth, Socioeconomic Determinants of Fertility in C6te d'Ivoire
No. 54 Gertler and Glewwe, The Willingness to Payfor Education in Developing Countries: EvidencetovmRural Peru
No. 55 Levy and Newman, Rigidite des salaires: Donnees microeconomiques et macroeconomiques surl'ajustement du marche du travail dans le secteur moderne (in French only)
No. 56 Glewwe and de Tray, The Poor in Latin America during Adjustment: A Case Study of Peru
No. 57 Alderman and Gertler, The Substitutability of Public and Private Health Carefor theTreatment of Children in Pakistan
No. 58 Rosenhouse, Identifying the Poor: Is 'Headship" a Useful Concept?
No. 59 Vijverberg, Labor Market Performanice as a Determinant of Migration
No. 60 Jimenez and Cox, The Relative Effectiveness of Private and Public Schools: Evidencefrom TwoDeveloping Countries
No. 61 Kakwani, Large Sample Distribution of Several Inequality Measures: With Application to C6ted'Ivoire
No. 62 Kakwani, Testing for Significance of Poverty Differences: With Application to Cdte d'lvoire
No. 63 Kakwani, Poverty and Economic Growth: With Application to Cote d'lvoire
No. 64 Moock, Musgrove, and Stelcner, Education and Earnings in Peru's Informal Nonfarm FamilyEnterprises
No. 65 Alderman and Kozel, Formal and Informal Sector Wage Determination in Urban Low-IncomeNeighborhoods in Pakistan
No. 66 Vijverberg and van der Gaag, Testingfor Labor Market Duality: The Private Wage Sector inC6te d'Ivoire
No. 67 King, Does Education Pay in the Labor Market? The Labor Force Participation, Occupation,and Earnings of Peruvian Women
No. 68 Kozel, The Composition and Distribution of Income in C6te d'lvoire
No. 69 Deaton, Price Elasticitiesfrom Survey Data: Extensions and Indonesian Results
No. 70 Glewwe, Efficient Allocation of Transfers to the Poor: The Problem of Unobserved Household Income
No. 71 Glewwe, Investigating the Determinants of Household Welfare in Cate d'Ivoire
No. 72 Pitt and Rosenzweig, The Selectivity of Fertility and the Determinants of Human CapitalInvestments: Parametric and Semiparametric Estimates
No. 73 Jacoby, Shadow Wages and Peasant Family Labor Supply: An Econometric Application to the PeruvianSierra
No. 74 Behrman, The Action of Human Resources and Poverty on One Another: What We Have Yet toLearn
No. 75 Glewwe and Twum-Baah, The Distribution of Welfare in Ghana, 1987-88
No. 76 Glewwe, Schooling, Skills, and the Returns to Government Investment in Education: AnExploration Using Datafrom Ghana
No. 77 Newman, Jorgensen, and Pradhan, Workers' Benefitsfrom Bolivia's Emergency Social Fund
No. 78 Vijverberg, Dual Selection Criteria with Multiple Alternatives: Migration, Work Status, and Wages
(List continues on the inside back cover)

Changing Pattems of Illiteracy in Morocco
Assessment Methods Compared
The Living Standards Measurement Study
The Living Standards Measurement Study (LSMS) was established by the WorldBank in 1980 to explore ways of improving the type and quality of household datacollected by statistical offices in developing countries. Its goal is to foster increaseduse of household data as a basis for policy decision making. Specifically, the LSMSis working to develop new methods to monitor progress in raising levels of living,to identify the consequences for households of past and proposed governmentpolicies, and to improve communications between survey statisticians, analysts,and policymakers.
The LSMS Working Paper series was started to disseminate intermediate prod-ucts from the LSMS. Publications in the series include critical surveys covering dif-ferent aspects of the LSMS data collection program and reports on improvedmethodologies for using Living Standards Survey (LSS) data. More recent publica-tions recommend specific survey, questionnaire, and data processing designs anddemonstrate the breadth of policy analysis that can be carried out using LSS data.

LSMS Working PaperNumber 115
Changing Patterns of Illiteracy in Morocco
Assessment Methods Compared
Victor Lavy, Jennifer Spratt, and Nathalie Leboucher
The World BankWashington, D.C.

Copyright © 1995The International Bank for Reconstructionand Development/THE WORLD BANK
1818 H Street, N.W.Washington, D.C. 20433, U.S.A.
All rights reservedManufactured in the United States of AmericaFirst printing April 1995
To present the results of the Living Standards Measurement Study with the least possible delay, thetypescript of this paper has not been prepared in accordance with the procedures appropriate to formalprinted texts, and the World Bank accepts no responsibility for errors. Some sources cited in this paper maybe informal documents that are not readily available.
The findings, interpretations, and conclusions expressed in this paper are entirely those of the author(s) andshould not be attributed in any manner to the World Bank, to its affiliated organizations, or to members of itsBoard of Executive Directors or the countries they represent. The World Bank does not guarantee the accuracy ofthe data included in this publication and accepts no responsibility whatsoever for any consequence of their use.The boundaries, colors, denominations, and other information shown on any map in this volume do not implyon the part of the World Bank Group any judgment on the legal status of any territory or the endorsement oracceptance of such boundaries.
The material in this publication is copyrighted. Requests for permission to reproduce portions of it shouldbe sent to the Office of the Publisher at the address shown in the copyright notice above. The World Bankencourages dissemination of its work and will normally give permission promptly and, when the reproduc-tion is for noncommercial purposes, without asking a fee. Permission to copy portions for classroom use isgranted through the Copyright Clearance Center, Inc., Suite 910, 222 Rosewood Drive, Danvers,Massachusetts 01923, U.S.A.
The complete backlist of publications from the World Bank is shown in the annual Index of Publications,which contains an alphabetical title list (with full ordering information) and indexes of subjects, authors, andcountries and regions. The latest edition is available free of charge from the Distribution Unit, Office of thePublisher, The World Bank, 1818 H Street, N.W., Washington, D.C. 20433, U.S.A., or from Publications,The World Bank, 66, avenue d'1ena, 75116 Paris, France.
ISSN: 0253-4517
Victor Lavy is a professor in the Department of Economics at the Hebrew University of Jerusalem. JenniferSpratt is an economist at the Research Triangle Institute in North Carolina. Nathalie Leboucher is a consultant inthe Policy and Research Department of the World Bank.
Library of Congress Cataloging-in-Publication Data
Lavy, Victor.Changing patterns of illiteracy in Morocco: assessment methods
compared / Victor Lavy, Jennifer Spratt, and Nathalie Leboucher.p. cm. - (LSMS working paper, ISSN 0253-4517; no. 115)
Includes bibliographical references. (p. ).ISBN 0-8213-3192-21. Literacy-Morocco-Statistics. 2. Functional literacy-
Morocco-Statistics. 3 Educational surveys-Morocco. I. Spratt,Jennifer E. II. Leboucher, Nathalie, 1966- . III. Title.IV. Series.LC158.M8L38 1995302.2'244'0964021-dc2O 95-12294
CIP

Contents
Foreword ....................................... vii
Abstract . .ix
Acknowledgments ....................................... xi
I. Introduction ........................................ 1
II. Method.3. . ............................... 3Instrument design ..................................... . 3Sample.4. . ................................ 4Construction of indices ................................... . 4
III. Patterns in the Incidence of Illiteracy, by Self-Report and Direct Testing Methods . . 6Literacy levels by gender and environment .............. ... .. ... . . 8Literacy and illiteracy by geographic region .............. ... .. ... . . 9Change in literacy levels across age cohorts ....................... . 11Literacy and education ................................ 13
IV. Literacy, Illiteracy, and Economic Status .......................... . 17
V. Family Patterns of Literacy and Illiteracy .......................... . 20Literacy levels of husband and wife ............................ . 20Literacy levels of parent and child ............................ . 22Mother's literacy and child's school attendance ..................... . 22
VI. An Analysis of Literacy Determinants ............................ . 25
VII. Summary, Conclusions, and Policy Implications ..................... . 28
Appendix: Survey Design and Field Work ............................ . 31
References ...................................... 38
v

Tables
Table 1. Description of the Sample ......... . . .. . . . . .. . . . . .. . . . .. . 5Table 2. Direct Literacy Assessments: Description of Scoring Levels ..... . . . . . . 5Table 3. Comparison of Self-Reported and Directly Assessed Global Literacy .... . 7Table 4. Direct and Self-Reported Literacy by Gender and Urban or Rural
Environment (in percent of population group) ...... . . . . . . . . . . . . . 8Table 5. Direct and Self-Reported Literacy by Geographic Region (in percent of each
region) .......................................... . 10Table 6. Direct and Self-Reported Literacy by Age Cohort (in percent of each
cohort) .......................................... . 12Table 7. Direct and Self-Reported Literacy by Educational Level (in percent of each
educational subgroup) ................................. . 14Table 8. Direct Literacy Assessment Levels by Household Expenditure Quintiles (in
percent of each quintile) ............................... . 18Table 9. Direct Literacy Assessment Levels by Activity Status, Gender, and
Environment (persons aged 15-69, in percent of each quintile) ..... . . . . 19Table 10. Family Literacy: Literacy Levels of Husband and Wife (in percent of each
population group) ................................... . 21Table IOa. Comparison of Literacy Levels of Husband and Wife .21Table 11. Intergenerational Literacy Change: Comparing Parents' with Children's
Literacy Levels (in percent of each population group) .23Table 1 la. Comparison of Literacy Levels of Parents and Child .23Table 12. Children's School Enrollment by Mother's Literacy (Children aged 7 to 21
years; percentage of each group in school) .24Table 13. Determinants of Literacy Level .26
Annex Table and Figures
Table Al. List of Direct Literacy Assessments, with Psychometric Properties (PsychometricTest Results Based on First Month Survey, 1991) .34
Figure Al. Direct Literacy Assessment Levels by Activity Status, Males .36Figure A2. Direct Literacy Assessment Levels by Activity Status, Females .37
vi

Foreword
Improving the quality of information on literacy and our understanding of its relationshipto important social and economic behaviors and outcomes is essential for the design of policiesand programs aimed at reducing illiteracy. While formal education remains a major source forthe acquisition of literacy and related sklfls, government investments in education are shuinkingin many countries, and the absolute number of persons believed to be illiterate is not declining.More detailed, accurate, and valid information on the incidence and characteristics of illiteacyis needed to help identify where the need for intervention is greatest, and to develop bettermethods for evaluating program effectiveness. This study is a step in this direction in the contextof Morocco, where the incidence of illiteracy is still very high and the government is determinedto adopt policy measures to reduce the illiteracy rate.
Lyn SquireDirector
Policy Research Department
vii


Abstract
This study estimates the incidence, characteristics, and patterns of change over time ofilliteracy in Morocco. The study compare the results from direct literacy assessment to theconventional methods of self-reported literacy. This effort has provided more detailed, objectiveinformation with which patterns of literacy skills in the country may be determined, and theirrelationship to other important social and economic behaviors and outcomes analyzed. It alsoprovides an opportunity to examine more closely the reliability and validity of common proxyindicators used to estimate literacy rates and skill levels. The results have implications both formethods of measuring literacy and for formulating policy to increase literacy. Furthermore,these implications are relevant for any country attempting to measure and improve literacy.
ix

I

Acknowledgments
This study was carried out with financial support from the MN1PHR and PRDPHdivisions in the World Bank. Fieldwork for the study was conducted by Morocco's Directionde la Statistique, Ministere du Plan under the direction of Mr. Mohammed Abzahd, to whomwe are indebted for his collaboration, help and insights throughout the fieldwork and analysis.We have also benefitted from reviews by the MN1PHR division in the Bank, in particularMourad Ezzine who provided detailed written comments, and from the early collaboration ofDaniel A. Wagner, University of Pennsylvania, and analyst Phillippe de Vreyer, formerly of theWorld Bank. The findings, interpretations, and conclusions expressed in this paper are entirelythose of the authors and should not be attributed in any manner to the World Bank.
xi


I. Introduction
A country's adult literacy rate - the proportion of the adult population who can read andwrite - is a statistic that has been gathered from censuses and reported in collections of"development indicators" for decades. Viewed as an indicator of societal development and thehuman resources available in a country, it has been used to compare human resourcedevelopment trends and levels across countries. At both national and international levels, it hasbeen used as an explanatory variable in models of social and economic development, and as anoutput indicator of the quality and effectiveness of school systems.
And yet, existing national literacy statistics are acknowledged to be of dubious accuracyand comparability, and contain serious problems of definition, measurement, and interpretation.They reduce the concept of literacy to a dichotomous quality, despite the great range of skillsand definitions that have been offered as constituting "literacy." They typically depend on anumber of rather questionable implicit assumptions. For example, those who have attendedschool for a given number of years are assumed to be literate and to have experienced noattrition of skills in the years since leaving school, while those who have not been to school aregenerally assumed to be illiterate. Census-based statistics also tend to depend heavily on theassumption that household heads are capable of judging the literacy capabilities of otherhousehold members, even if they themselves are not literate.
Improving the quality of information on literacy and our understanding of its relationshipto important social and economic behaviors and outcomes is essential for the design of policiesand programs aimed at reducing illiteracy. While formal education remains a major source forthe acquisition of literacy and related skills, government investments in education are shrinkingin many countries, and the absolute number of persons believed to be illiterate is not declining.More detailed, accurate, and valid information on the incidence and characteristics of illiteracyis needed to help identify where the need for intervention is greatest, and to develop bettermethods for evaluating program effectiveness.
In response to this perceived need, and in contrast with conventional methods, the lastdecade has seen a push for the development of sample-based methods involving the directmeasurement or assessment of skills of individual persons. Direct literacy assessments generallycontain a series of tasks representing a range of reading, writing, and other skills, oftenincorporating items found in everyday activities. The individual's performance on each task isscored and a summary score, or a number of sub-scores, is calculated. This summary score orset of sub-scores may then be used in raw or standardized form, or evaluated against functionalcriteria for classification into discrete skill levels, as an alternative to conventional indicators ofliteracy. Examples of surveys of literacy and other skills employing direct literacy assessmentsinclude the National Assessment of Educational Progress (Kirsch and Jungeblut, 1986), therecent Canadian Survey of Literacy Skills Used in Daily Activities (Statistic Canada, 1991), andUnited Nations' Measuring Literacy Through Household Surveys (United Nations, 1989). Aconcise detailed presentation of direct assessment methods for survey use is available in Wagner(1990).

2
In Morocco, a direct literacy assessment module was designed and integrated into theNational Survey on Household Living Standards (Ministry of Planning) in 1991-1992. Themodule, the Morocco Literacy Survey, was designed to collect information on literacy and otherskills and knowledge of household members that are independent of common proxies for literacycompetency such as self-report and educational attainment. This effort has provided moredetailed, objective information with which patterns of literacy skills in the country may bedetermined, and their relationship to other important social and economic behaviors andoutcomes analyzed. It also provides an opportunity to examine more closely the reliability andvalidity of common proxy indicators commonly used to estimate literacy rates and skill levels.
The methodology of data collection and construction of performance indices are discussedin Section II. In the descriptive analysis of survey results (Section III), we compare thedistribution of illiteracy as based on conventional indicators against results using the direct skillmeasures provided in the literacy survey, across a number of population subgroups (gender,urban or rural residence, geographic region of residence, age cohort, and educational level). Wealso examine more closely the patterns of individuals' directly-assessed literacy skill levels acrossthese stratifications. Section IV turns to an examination of the distribution of skills accordingto individuals' economic situation, as represented by household expenditure quintile and currentemployment status. Patterns of literacy skill levels and clues to the transmission of literacywithin families are the subject of Section V, while Section VI presents a series of multivariateanalyses of the determinants of illiteracy. Section VII offers a summary and discussion of thestudy findings.

II. Method
Instrument design'
The principal objectives of the Morocco Literacy Survey were (1) to examine in greaterdetail the range and variability of literacy skills and knowledge among individuals at the "lowend" of the formal educational distribution in Morocco and (2) to provide independent indicatorsof basic education outcomes. Given these objectives, the assessments were designed to measurebasic and intermediate literacy and numeracy skills. For this reason, we caution that they mayprovide little response variability at higher levels.
The Morocco Literacy Survey was designed to be suitable for administration to householdmembers across the ages 9 to 69. Information collected includes self-reported mother tongue,educational experience, self-judgments on language-specific reading and writing abilities and onmath abilities, reading and writing practice at home and at the work place, and availability ofnewspapers in the community. Those with formal educational experience ranging from none toa maximum of senior secondary schooling or the equivalent also received direct assessmentmeasures of document familiarity, basic reading and writing skills in Arabic and French (whensome French ability is reported), and mental and written math.2 In addition, household headsand other adults age 20 to 50 received questions on basic health behaviors and services. Theresults of the direct assessments were used to produce separate scores for each skill orknowledge area.
The first draft of the survey, built upon prior literacy assessments created and used bythe five-year Morocco Literacy Project (University of Pennsylvania and Universite MohammedV; Daniel A. Wagner, P.I.), was prepared for pretesting in early August, 1990. All Arabic- andFrench-language materials, and the translation of all instructions to the respondent into Moroccancolloquial Arabic, were completed with locally hired assistants experienced in literacy surveywork.
The full literacy survey consisted of the following nine sections: (1) general self-reportquestions on literacy skills and behaviors; (2) questions concerning basic health care behaviors(addressed to heads of households and their spouses, and other persons aged 20 to 50 only); (3)assessment of information location skills, using common literacy artifacts; (4) mental arithmeticassessment (two levels); (5) Arabic reading assessment (two levels), including word decoding,word-picture matching (level 1), and text comprehension (level 2); (6) Arabic writing assessment(two levels), including signature and word dictation (level 1) and sentence dictation (level 2);(7) French reading assessment (two levels, equivalent to Arabic reading assessment); (8) Frenchwriting assessment (two levels; equivalent to Arabic writing assessment); and (9) writtennumeracy assessments (two levels), including number recognition and writing (level 1) andsolving of written equations (level 2).
1. See the appendix for more details.
2. Results on the mathematics assessments will be discussed in a subsequent paper.

4
Words used in Arabic and French level-i reading and writing tasks were selected fromprimary school textbooks currently in use in Morocco. Texts used in text-comprehension taskswere adapted from primary, secondary, and adult literacy textbooks and from local Moroccannewspaper articles. The information location task samples knowledge of literacy artifacts (letterenvelope, newspaper, electricity bill, medicine label, national identity card) commonly found inMoroccan homes. Math problems, both oral and written, sample the basic arithmetic functionsand concepts of measurement, percents, fractions, decimals, and plane geometry. Within eachtask, efforts were made to order items by increasing level of difficulty (for those tasks usingschool text content, according to their point of introduction in the curriculum); these orders wereadjusted on the basis of piloting results.
Sample
The sample receiving the literacy module comprised a two-thirds sub-sample from theMorocco Living Standards Measurement Survey conducted in 1990-1991. The larger sample,stratified across the seven economic regions of Morocco, contained within each region 20primary clusters of 24 households, with each primary cluster further divided into 3 secondaryclusters of 8 households each. From this sample, 2 of the 3 secondary clusters in each primarycluster were targeted for inclusion in the literacy module sample, for a total expected sample sizeof 16 households (and all eligible household members) per primary cluster, or 2240 householdsnationally. When a target household or a majority of eligible individuals within a householdcould not be surveyed for any reason, a replacement household of similar size from the thirdsecondary cluster in a given primary cluster was selected and surveyed. Table 1 presents thefinal sample of 2240 households and 8050 persons according to geographic region, gender, andurban or rural environment. Greater detail on overall sample structure and representativity isprovided in documentation of the Morocco Living Standards Measurement Survey (1990-1991).
Construction of indices
The preparation of data for analysis required the construction of global indices of eachcompetence domain, which combine the results of multiple levels of a given module into a morereadily interpretable 3- or 4-point scale of competence levels. The indices may be interpretedas shown in Table 2. From these, overall indices of Arabic literacy (combining reading, writing,and document knowledge subscores), French literacy (combining reading and writing subscores),and math (combining mental and written math subscores) were also produced. The presentpaper, reporting on overall literacy abilities, makes use of a "global literacy" score, representingthe respondent's highest demonstrated level of literacy (as defined by our indices) in eitherArabic or French language.

5
Table 1. Description of the Sample
Individuals TestedHouseholds
Region Sampled Totar Percent Male Percent Urban
North-West 320 1150 50.3% 56.0%
Central 320 1150 46.9% 62.1%
North-Central 320 1150 45.9% 35.8%
South-Central 320 1150 46.0% 47.8%
East 320 1150 46.6% 49.0%
South 320 1150 40.2% 31.9%
Tensift 320 1150 45.6% 35.5%
Total 2240 8050 47.2% 48.7%
Note. a. In absence of exact numbers of individuals tested, the average number of persons tested per household in eachregion is assumed to be 3.6 persons, roughly the national sample average of persons tested.
Table 2. Direct Literacy Assessments: Description of Scoring Levels
Test/Scoring Level Description of Level
A. Tests of Reading (Arabic and French)
Level 0 NO COMPETENCE DEMONSTRATED. The individual is unable todemonstrate ability to decode or comprehend simple written words
Level 1 RUDIMENTARY ABILITY. The individual demonstrates decoding andcomprehension of single words, but has difficulty reading sentences orconnected text with comprehension.
Level 2 MINIMAL COMPETENCE. The individual demonstrates ability tocomprehend simple texts, although with some errors.
Level 3 COMPLETE FUNDAMENTAL COMPETENCE. The individual demonstratesability to comprehend a variety of texts, including a newspaper article, withouterror.
B. Tests of Writing (Arabic and French)
Level 0 NO COMPETENCE DEMONSTRATED. The individual is unable todemonstrate ability to write correctly a simple dictated word.
Level 1 RUDIMENTARY MINIMAL COMPETENCE. The individual demonstratesability to write single words without difficulty, and complete sentences but withsome errors.
Level 2 COMPLETE FUNDAMENTAL COMPETENCE. The individual demonstratesability to write complete sentences without difficulty.
M. Patterns in the Incidence of Illiteracy,by Self-Report and Direct Testing Methods
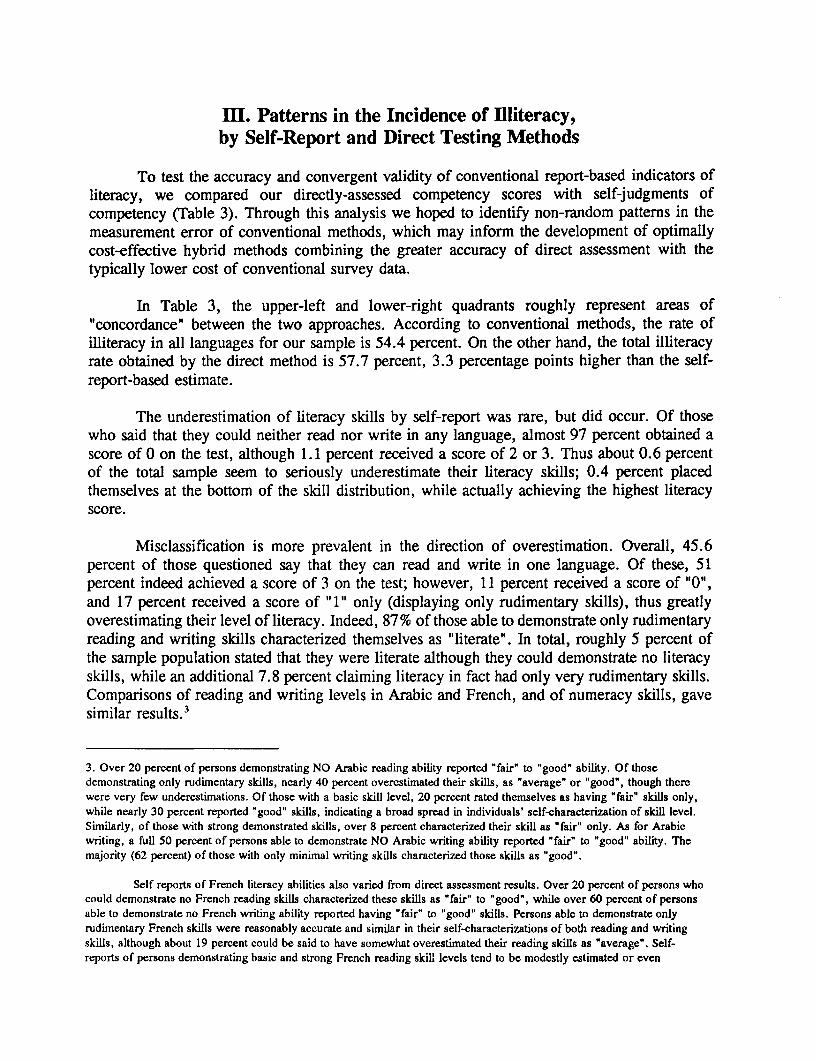
To test the accuracy and convergent validity of conventional report-based indicators ofliteracy, we compared our directly-assessed competency scores with self-judgments ofcompetency (Table 3). Through this analysis we hoped to identify non-random patterns in themeasurement error of conventional methods, which may inform the development of optimallycost-effective hybrid methods combining the greater accuracy of direct assessment with thetypically lower cost of conventional survey data.
In Table 3, the upper-left and lower-right quadrants roughly represent areas of"concordance" between the two approaches. According to conventional methods, the rate ofilliteracy in all languages for our sample is 54.4 percent. On the other hand, the total illiteracyrate obtained by the direct method is 57.7 percent, 3.3 percentage points higher than the self-report-based estimate.
The underestimation of literacy skills by self-report was rare, but did occur. Of thosewho said that they could neither read nor write in any language, almost 97 percent obtained ascore of 0 on the test, although 1.1 percent received a score of 2 or 3. Thus about 0.6 percentof the total sample seem to seriously underestimate their literacy skills; 0.4 percent placedthemselves at the bottom of the skill distribution, while actually achieving the highest literacyscore.
Misclassification is more prevalent in the direction of overestimation. Overall, 45.6percent of those questioned say that they can read and write in one language. Of these, 51percent indeed achieved a score of 3 on the test; however, 11 percent received a score of "0",and 17 percent received a score of "1" only (displaying only rudimentary skills), thus greatlyoverestimating their level of literacy. Indeed, 87% of those able to demonstrate only rudimentaryreading and writing skills characterized themselves as "literate". In total, roughly 5 percent ofthe sample population stated that they were literate although they could demonstrate no literacyskills, while an additional 7.8 percent claiming literacy in fact had only very rudimentary skills.Comparisons of reading and writing levels in Arabic and French, and of numeracy skills, gavesimilar results.3
3. Over 20 percent of persons demonstrating NO Arabic reading ability reported "fair" to "good" ability. Of thosedemonstrating only rudimentary skills, nearly 40 percent overestimated their skills, as "average" or "good", though therewere very few underestimations. Of those with a basic skill level, 20 percent rated themselves as having "fair" skills only,while nearly 30 percent reported "good" skills, indicating a broad spread in individuals' self-characterization of skill level.Similarly, of those with strong demonstrated skills, over 8 percent characterized their skill as "fair" only. As for Arabicwriting, a full 50 percent of persons able to demonstrate NO Arabic writing ability reported "fair" to "good" ability. Themajority (62 percent) of those with only minimal writing skills characterized those skills as "good".
Self reports of French literacy abilities also varied from direct assessment results. Over 20 percent of persons whocould demonstrate no French reading skills characterized these skills as "fair" to "good", while over 60 percent of personsable to demonstrate no French writing ability reported having "fair" to "good" skills. Persons able to demonstrate onlyrudimentary French skills were reasonably accurate and similar in their self-characterizations of both reading and writingskills, although about 19 percent could be said to have somewhat overestimated their reading skills as "average". Self-reports of persons demonstrating basic and strong French reading skill levels tend to be modestly estimated or even

7
Table 3. Comparison of Self-Reported and Directly Assessed Global Literacy
Direct Assessment Global Literacy ScoreSelf-Reported 123ToaGlobal Literacy 0 1 2 3 Total
"ILLITERATE" 4238 92 16 32 4378
Row Percents 96.8% :2.1% 0.4% 0.7% 100.0%
Column Percents 91.2% 12.S% 2.1% 1.7% 54.4%
'LITERATE' 411 628 736 1887 3661
Row Percents 11.2% 17.2% 20u1% 51.5% 100.0%
Column Percents 8.8% 87.2% 97.9% 98.3%: 45.5%
TOTAL 4648 720 752 1919 8050
Row Percents 57.7% 8.9% 9.3% 23.8% 100%
Column Percents 100% 100% 100% 100%
The data presented in Table 3 also compel us to ask how closely self-reports of being"literate" match common interpretations of the literacy rate. By the direct assessment methodused here, a score of 1 indicates only the most rudimentary abilities, generally at the single wordlevel. Such a low level of skill (which characterizes nearly 9 percent of the present sample, andover 17 percent of those who considered themselves literate) seriously stretches most definitionsof "literate" as intended or assumed by promoters of literacy rate statistics. In other words,apparently healthy "literacy rates" (as opposed to illiteracy rates) may in fact contain a highproportion of persons with very minimal literacy skills.
As we have seen, a substantial proportion of individuals sampled - roughly 13.5 percent- may be said to considerably over- or under-estimate their literacy skills. A closer analysis ofthe data permits us to determine whether these distortions appear across the population as awhole, or whether certain sub-groups are particularly susceptible to them. The informationpresented in Tables 4 though 7 begins to answer these questions across several dimensions ofthe population. Each table presents literacy statistics as estimated by both self-report and by thedirect literacy assessment global score. The final column of each table, "Difference in IlliteracyRates", shows the difference between the rate as calculated from individual self-reports of"illiteracy" (in both Arabic and French), and the proportion of the sample with directly-assessed
underestimated, with over half of persons in each category responding in this manner.
Overestimation of arithmetic skills is even more pronounced. Sixty-four percent of those questioned claimed thatthey knew arithmetic. Of these 64 percent, only 32 percent achieved the maximum score of 2, while 39 percent received ascore of 0. Worse, some 3.58 percent of those who gave a high rating to their arithmetic skills, failed to reveal even aminimal level of such skills. A full 50 percent of persons able to demonstrate no mental or writcn arithmetic skills reported'fair" to 'good' ability. On the other hand, persons with some demonstrated arithmetic skills tended to be reasonablyaccurate in their self-characterizations.

8
skill level "0". A negative score indicates an under-estimation of the illiteracy rate when basedon self-report relative to direct assessment, while a positive score indicates over-estimation ofthe rate by self-report.
Literacy levels by gender and environment
Self-reported and direct-assessment literacy estimates suggest significant differences bygender and urban or rural milieu (see Table 4). By self-report, the male illiteracy rate wouldappear to be 39 percent, while it reaches at least 44 percent by the direct assessment method,indicating an overestimation of 5 percent in conventional statistics. The distortion is less amongfemales, with apparent literacy rates of 68.2 percent and 70 percent based on self-report anddirect assessment respectively. In terms of the often-cited gender gap, the greater overestimationby males results in a gender gap that is 3 percentage points higher when based on self-report(29.2 points) than when based on direct assessment (26.0 points).
By both self-report and direct assessment, the difference in literacy levels between urban(35.6 to 37.5 percent) and rural (72.3 to 76.9 percent) environments is also very pronounced.According to self-report measures, the difference is about 37 percentage points between the twoenvironments, while it is 39.4 percentage points by direct assessment. Both environmentscontribute to this discrepancy between the two methods, although self-report underestimation ofilliteracy appears to be greater in the rural area.
Table 4. Direct and Self-Reported Literacy by Gender and Urban or Rural Environrent(in percent of population group)
Direa Literacy Assessment Level(Highest of Arabic or French)
Self-Report 2 3P"opulation Group 'llIiterate
Total 54.4 57.7 8.9 9.4 23.8
Men 39.0 44.0 12.5 11.1 32.2
Women 68.2 70.0 5.7 7.9 16.3
Urban 35.6 37.5 8.7 12.7 40.9
Men 23.6 25.6 9.9 12.0 52.4
Women 46.7 48.5 7.7 13.3 30.3
Rural 72.3 76.9 9.1 6.3 7.5
Men 54.1 62.0 15.2 10.2 12.4
Women 88.2 89.9 3.8 2.9 3.3

9
Crossing gender with urban or rural milieu reveals a phenomenon with importantmethodological implications. Rural men, on the whole, appear to overestimate their literacy levelsubstantially more than other groups. In our study, the illiteracy rate for rural men as estimatedby self-report is nearly 8 points lower than by direct assessment, while all other groups showdiscrepancies of only 2 points or less. In summary, data which rely solely on self-assessmentsmay overstate the rural gender gap, and understate the urban-rural gap.4
Examining patterns of literacy level within environments on the basis of direct assessmentmeasures, we find illiteracy levels of 25.6 percent among urban males, 48.5 percent amongurban females, 62 percent among rural males, and nearly 90 percent among rural females. Atthe other end of the literacy assessment scale, over 52 percent of urban males were found tohave solid fundamental competence, followed by 30.3 percent of urban females. As would beexpected, this level of skill is much less prevalent in rural areas, where it was obtained by 12.4percent of males and only 3.3 percent of females.
Literacy and illiteracy by geographic region
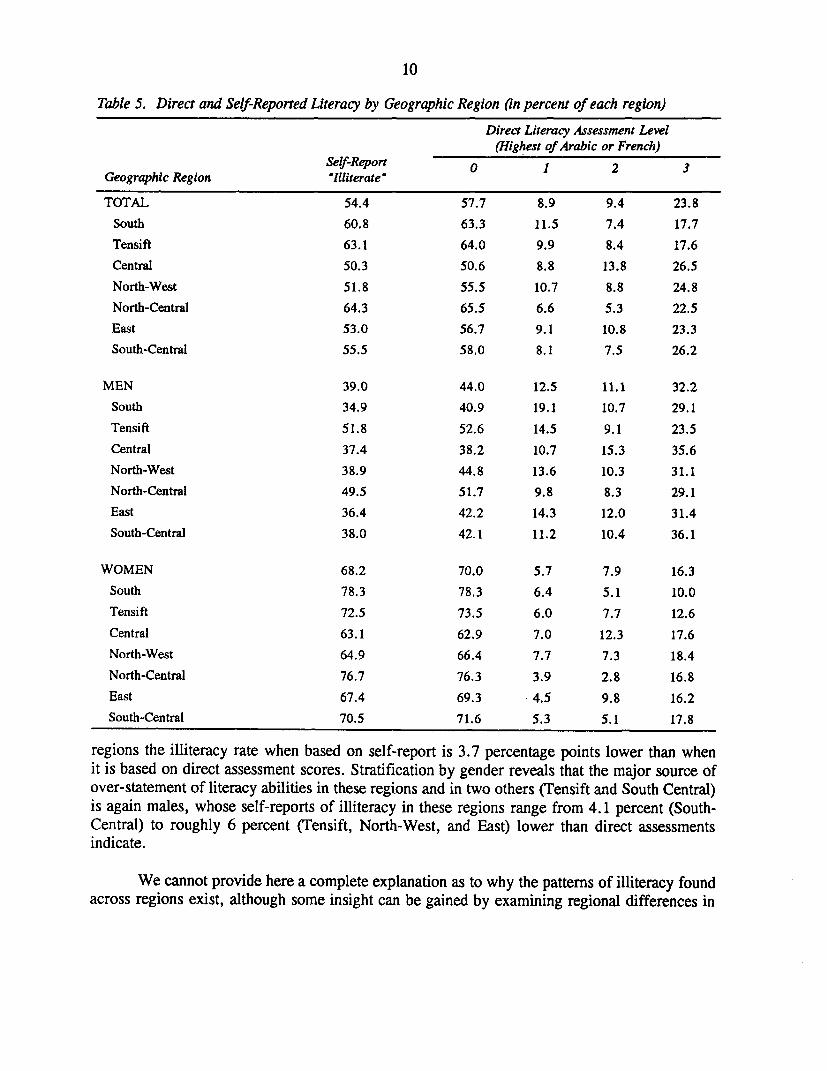
Apart from the dramatic rural/urban differential discussed above, the geographicaldistribution of illiteracy in Morocco suggests relatively minor regional disparities (Table 5). Thedisparities in literacy across regions are most pronounced when evaluated using direct assessmentmeasures. The gap between the highest- and lowest-ranking regions is 15 percentage points,compared to a gap of 13 percentage points using the self-reported literacy measure. The regionswith the lowest rates of illiteracy are the Central region (51 percent), the North-West region (56percent), the East region (57 percent) and the South-Central region (58 percent). The highestrates of illiteracy are found in the North Central (65.5 percent), Tensift (64.0 percent), andSouth (63.3 percent).
The illiteracy gender gap shows greater variability across regions. According to directassessment, it is highest in the South (37.4 points), and lowest in the Tensift (20.9 points) andNorth-West (21.6 points) regions.
The ranking of regions by illiteracy rates according to self-report is identical to rankingby direct assessment-based rates, although the percentages are somewhat different. North-Westand East regions display the highest propensity for over-estimation of literacy ability; for both
4. This funding may be to some extent the result of selective rural-to-urban migration. If the flow is intensive in skilled andtrained male workers, it will lead to a higher rural illiteracy rate and to a smaller gender gap. To address this question weexamined the skill composition of migrants, using data from the migration section of the Morocco LSMS survey. Almost30% of the urban sample are migrants from rural areas, about half of them migrated at age 14 or older. The samplesuggests very little migration from urban to rural areas, with just 2.5% of the rural sample being migrants from urban areas.Rural to urban migrants are also slightly more literate than the rural population as a whole: the self-reported illitcracy rateamong these migrants was 65% compared to 72% in the rural sample. These results suggest that the literacy gap foundbetween urban and rural areas is indeed at least partially due to the selective rural-to-urban migration of more literate adults.Migration paUerns also appear to narrow the observed literacy gap between men and women in rural areas, due to thehigher proportion of migration by men than by women.
10
Table 5. Direct and Self-Reported Literacy by Geographic Region (in percent of each region)
Direct Literacy Assessment Level(Highest of Arabic or French)
Self-Report 0 1 2 3Geographic Region Illiterate'
TOTAL 54.4 57.7 8.9 9.4 23.8
South 60.8 63.3 11.5 7.4 17.7
Tensift 63.1 64.0 9.9 8.4 17.6
Central 50.3 50.6 8.8 13.8 26.5
North-West 51.8 55.5 10.7 8.8 24.8
North-Central 64.3 65.5 6.6 5.3 22.5
East 53.0 56.7 9.1 10.8 23.3
South-Central 55.5 58.0 8.1 7.5 26.2
MEN 39.0 44.0 12.5 11.1 32.2
South 34.9 40.9 19.1 10.7 29.1
Tensift 51.8 52.6 14.5 9.1 23.5
Central 37.4 38.2 10.7 15.3 35.6
North-West 38.9 44.8 13.6 10.3 31.1
North-Central 49.5 51.7 9.8 8.3 29.1
East 36.4 42.2 14.3 12.0 31.4
South-Central 38.0 42.1 11.2 10.4 36.1
WOMEN 68.2 70.0 5.7 7.9 16.3
South 78.3 78.3 6.4 5.1 10.0
Tensift 72.5 73.5 6.0 7.7 12.6
Central 63.1 62.9 7.0 12.3 17.6
North-West 64.9 66.4 7.7 7.3 18.4
North-Central 76.7 76.3 3.9 2.8 16.8
East 67.4 69.3 4.5 9.8 16.2
South-Central 70.5 71.6 5.3 5.1 17.8
regions the illiteracy rate when based on self-report is 3.7 percentage points lower than whenit is based on direct assessment scores. Stratification by gender reveals that the major source ofover-statement of literacy abilities in these regions and in two others (Tensift and South Central)is again males, whose self-reports of illiteracy in these regions range from 4.1 percent (South-Central) to roughly 6 percent (Tensift, North-West, and East) lower than direct assessmentsindicate.
We cannot provide here a complete explanation as to why the patterns of illiteracy foundacross regions exist, although some insight can be gained by examining regional differences in

11
income levels, schooling, and age structures. The regional distribution of mean per capitaexpenditure ranks the North-West and Central regions as the richest in the country, whichaccords with their national ranking in terms of literacy. These two regions also lead the othersin terms of mean years of schooling among their adult population (4.9 and 4.7 years for the tworegions, respectively, a co-factor which has a high positive correlation with literacy).
At the other extreme, the East region is nearly the poorest in the country, although itsliteracy rate is almost as high as that of the North-West region (where per capita expenditure ishigher by more than 40 percent). Nonetheless, the East region's primary school enrollment ratesare among the highest in the country (second only to the Central region), and its mean years ofschooling among the 9-21 age group (5.2 years) is higher than the national average. Second, theregion has the third highest share of urban residents in its population, a characteristic which isalso highly correlated with literacy. Finally, the East region has the highest share of the 15-24age cohort, which has the lowest illiteracy rate.
Change in literacy levels across age cohorts
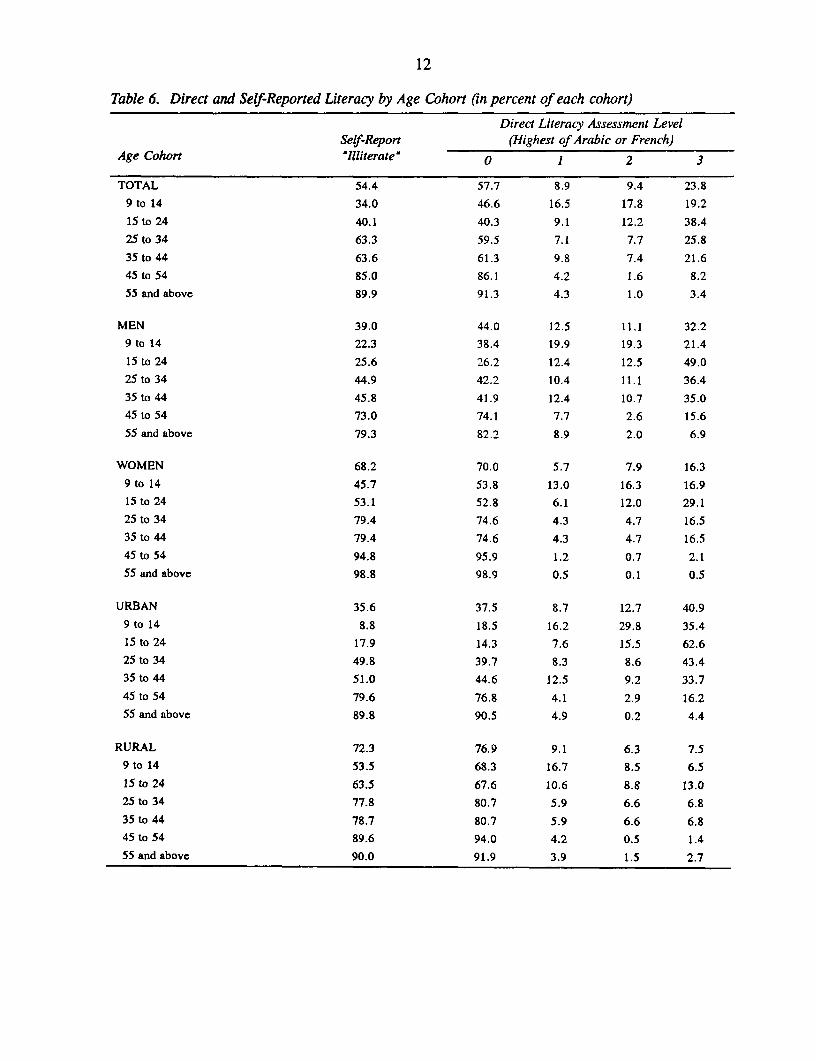
Table 6 provides a snapshot of literacy skill levels by age cohorts. The relationshipbetween age and illiteracy has a U shape: the age-specific illiteracy rate displays a decline untilage 24 and then increases. The distribution by age of the 'best' group (score=3) has an inverseshape, increasing until age 24 and then declining. It is clear that the 15-24 age cohort has thebest literacy skills: it has the lowest illiteracy rate (40 percent), while the 55+ age group hasthe highest rate, at 91 percent. The 15-24 age group also has the highest rate of individuals withthe highest score of 3.
Comparing the first two columns of Table 6 reveals that self-report data provided by 9-to-14 year old is most likely to result in serious under-estimation of illiteracy. For this group, self-report data results in an illiteracy rate well over 12 percentage points lower than when the rateis estimated using direct assessment. The discrepancy is especially large for men (16 percentagepoints) and in rural areas (15 percentage points). Given that this age group is not included inmost countries' definition of the adult population, a similar pattern of under-estimation by thisgroup elsewhere would be unlikely to critically affect reported illiteracy rates. It should be notedhowever that Morocco, along with Somalia and some other countries has traditionally includedpersons aged 10 to 15 among their "adult" population in statistical reports. Conversely, thoughless markedly, illiteracy rates in older cohorts may be over-estimated when self-report is used,especially among women and urban dwellers. For these groups, over-estimations reaching nearly5 points (females aged 25-34), over 6 points (urban dwellers aged 35-44) and as much as 10points (urban dwellers aged 25-34) are observed.
The age-cohort results may be used to draw some tentative conclusions regardinghistorical trends in literacy in Morocco. Excluding the youngest cohort (aged 9-14), most ofwhom are still in primary school and likely to be still developing basic literacy skills, the datashow a sharp reduction in illiteracy rates from older to younger cohorts. The total sampleilliteracy rate based on direct assessment drops 51 percentage points, from 91.3 percent among
12
Table 6. Direa and Self-Reported Literacy by Age Cohort (in percent of each cohort)
Direct Literacy Assessment LevelSelf-Report (Highest of Arabic or French)
Age Cohort 'Illiterate' 0 1 2 3
TOTAL 54.4 57.7 8.9 9.4 23.8
9 to 14 34.0 46.6 16.5 17.8 19.2
15 to 24 40.1 40.3 9.1 12.2 38.4
25 to 34 63.3 59.5 7.1 7.7 25.8
35 to 44 63.6 61.3 9.8 7.4 21.6
45 to 54 85.0 86.1 4.2 1.6 8.2
55 and above 89.9 91.3 4.3 1.0 3.4
MEN 39.0 44.0 12.5 11.1 32.2
9 to 14 22.3 38.4 19.9 19.3 21.4
15 to 24 25.6 26.2 12.4 12.5 49.0
25 to 34 44.9 42.2 10.4 11.1 36.4
35 to 44 45.8 41.9 12.4 10.7 35.0
45 to 54 73.0 74.1 7.7 2.6 15.6
55 and above 79.3 82.2 8.9 2.0 6.9
WOMEN 68.2 70.0 5.7 7.9 16.3
9 to 14 45.7 53.8 13.0 16.3 16.9
15 to 24 53.1 52.8 6.1 12.0 29.1
25 to 34 79.4 74.6 4.3 4.7 16.5
35 to 44 79.4 74.6 4.3 4.7 16.5
45 to 54 94.8 95.9 1.2 0.7 2.1
55 and above 98.8 98.9 0.5 0.1 0.5
URBAN 35.6 37.5 8.7 12.7 40.9
9 to 14 8.8 18.5 16.2 29.8 35.4
15 to 24 17.9 14.3 7.6 15.5 62.6
25 to 34 49.8 39.7 8.3 8.6 43.4
35 to 44 51.0 44.6 12.5 9.2 33.7
45 to 54 79.6 76.8 4.1 2.9 16.2
55 and above 89.8 90.5 4.9 0.2 4.4
RURAL 72.3 76.9 9.1 6.3 7.5
9 to 14 53.5 68.3 16.7 8.5 6.5
15 to 24 63.5 67.6 10.6 8.8 13.0
25 to 34 77.8 80.7 5.9 6.6 6.8
35 to 44 78.7 80.7 5.9 6.6 6.845 to 54 89.6 94.0 4.2 0.5 1.4
55 and above 90.0 91.9 3.9 1.5 2.7

13
persons age 55 and above, to 40.3 percent of persons 15 to 24. Conversely, at the other end ofthe skill distribution, one observes higher frequencies for the younger cohorts. These patternsindicate a large improvement in average skill endowments among the Moroccan population inrecent decades.
The drop in illiteracy rates from the oldest cohort to the age 15-24 cohort is considerablymore dramatic among males (56 percentage points) than among females (46.1 points). Thispattern suggests a disturbing increase in the gender gap in illiteracy over time: althoughimportant reductions in illiteracy have been made in both male and female cohorts, the rate ofimprovement has been higher among men.
We also notice from Table 6 that the pattern of reduction of the illiteracy rate is evenmore skewed toward the urban population. In urban areas, the rate of illiterates drops from 90.5percent of the oldest cohort (age 55 and above) to only 14.3 percent of persons in the 15-24 agegroup, representing a phenomenal improvement of over 76 percentage points. In rural areas,however, the improvement between the two cohorts is only modest, with illiteracy dropping from91.9 percent to 67.6 percent, a difference of only 24.3 points. In other words, the improvementin the urban sector has been roughly three times greater than in the rural sector. The possiblerole of increasing rural-to-urban migration in this phenomenon requires examination. In anycase, the rapidly widening rural/urban gap in illiteracy rates may be taken as an alarming signof relative neglect of development in rural Morocco, or more moderately, as a sign of a relativelack of currency for literacy skills in that environment.
Literacy and education
The use of educational attainment and years of schooling as proxy measures forestimating literacy is a cornerstone of various statistical comparisons and indicators generatedby UN agencies. Broadly speaking, for many developing countries any substantial gain ineducation attainment is seen as a major step toward reducing the incidence of illiteracy. Thequestion to be examined here is the association between schooling attainment and the subjectiveand objective assessment of literacy in Morocco.
Morocco's official education system is composed of primary (6 grades), junior secondary(3 grades), senior secondary (3 grades), and university and other tertiary levels. TheBaccalaureate examination is taken at the conclusion of secondary schooling, and is aprerequisite for all tertiary education. A parallel system of Quranic education, historicallycovering literacy and religious studies through the university level, has now been absorbedwithin the official system, in the form of higher-level specializations. Quranic preschools,however, still represent the principal form of pre-school education in Morocco.
Forty-eight percent of the sample have had no schooling (see Table 7). Of this group,more than two-thirds are women. An additional 37.6 percent have a level lower than or equalto complete primary schooling; only 3.4 percent have completed secondary schooling. Just oversix percent of the sample have attended Quranic school (11 percent of men and 1.4 percent of

14
Table 7. Direct and Self-Reported Literacy by Educational Level (in percent of each educationalsubgroup)
Direct Literacy Assessment Level DifferencePercent (Highest of Arabic or French) in
of Sample Self-Report 'Illiteracy'
Group 'Illiterate' 0 1 2 3 Rates
TOTAL 100.0 54.4 57.7 8.9 9.4 23.8 -3.3no schooling 47.9 98.4 98.7 0.8 0.0 0.0 -0.3some primary 23.0 9.8 26.5 31.3 25.7 16.1 -16.7complete primary 14.6 0.3 0.0 4.1 21.9 74.0 0.3complete prep 5.0 0.0 0.0 2.0 2.0 96.0 0.0Baccalaureate or equiv.' 3.4 _ - - _ (100.0)QS I to 2 years 3.6 74.6 87.5 9.7 1.4 0.0 -12.9QS 3 years or more' 2.5 56.2 40.0 36.0 12.0 12.0 16.2
MALES 100.0 39.0 44.0 12.5 11.1 32.2 -5.0no schooling 29.9 96.5 97.3 2.3 0.0 0.0 -0.8some primary 28.3 9.0 26.9 31.1 24.4 17.3 -17.9complete primary 19.3 0.3 0.0 4.1 19.2 76.2 0.3complete prep 6.7 0.0 0.0 0.0 4.5 95.5 0.0Baccalaureate or equiv.' 4.4 _ _ (100.0)QS I to 2 years 5.9 70.5 89.0 8.5 2.5 0.0 -18.5QS 3 years or more' 5.1 56.0 47.1 35.3 7.8 9.8 8.9
FEMALES 100.0 68.2 70.0 5.7 7.9 16.3 -1.8no schooling 63.9 99.2 99.5 0.2 0.2 0.0 -0.3some primary 18.3 10.9 26.5 31.1 28.4 13.9 -15.6complete primary 10.3 0.3 0.0 3.9 25.2 70.9 0.3complete prep 3.5 0.0 0.0 0.0 2.9 97.1 0.0Baccalaureate or equiv.' 2.5 - _ - (100.0)QS I to 2 years 1.4 89.5 92.9 7.1 0.0 0.0 -3.4QS 3 years or more' 0.0
URBAN 100.0 35.6 37.5 8.7 12.7 40.9 -1.9no schooling 30.0 96.6 97.7 1.7 0.3 0.0 -1.1some primary 26.5 7.6 20.0 28.3 30.9 20.4 -12.4complete primary 23.5 0.2 0.0 2.6 18.3 78.7 0.2complete prep 9.8 0.0 0.0 6.1 3.1 90.8 0.0Baccalaureate or equiv.' 6.6 _ - (100.0)QS 1 to 2 years 2.3 78.0 87.0 8.7 4.3 0.0 -9.0QS 3 years or more' 1.3 76.3 30.8 23.1 46.2 0.0 45.5
RURAL 100.0 72.3 76.9 9.1 6.3 7.5 -4.6no schooling 64.8 99.2 99.2 0.5 0.0 0.0 0.0some primary 19.6 12.5 35.2 34.7 19.4 10.7 -22.7complete primary 6.0 0.7 0.0 8.3 35.0 56.7 0.7complete prep 0.9 0.0 0.0 0.0 11.1 88.9 0.0Baccalaureate or equiv.' 0.3 (100.0)QS I to 2 years 4.6 72.8 91.3 6.5 2.2 0.0 -18.5QS 3 years or more' 3.3 47.5 45.5 39.4 6.1 9.1 2.0
Note: a. Persons holding the Baccalaureate, equivalent diploma, or 11 + years of Quranic education were assumed to beliterate at the highest level, and did not receive the direct literacy assessment.

15
women). Disparities between urban and rural environments are very pronounced, with nearly65 percent of rural residents reporting no schooling as against 30 percent of urban residents.Nearly 40 percent of urban residents have completed primary school or higher, as compared to7.2 percent of rural dwellers; 7 percent of urban residents have completed senior secondary,versus only 0.3 percent of rural residents. Stratification by gender further accentuates thedisparities between milieux: 18 percent of urban men have had no schooling, as against 85percent of rural women. Likewise, 8 percent of urban men have completed secondary education,as opposed to barely 0.01 percent of rural women.
The level of schooling also varies widely according to age group (not shown). Schoolingparticipation has been growing steadily, with 33 percent of the 15-24 year old cohort reportingno schooling, in contrast with 87 percent of the 55 + age group. Eight percent of persons aged25 to 34 reported passing the Baccalaureate, versus only 0.25 percent of the oldest age cohort.Dramatic changes can also be observed in the distribution or relative importance of secularversus religious schooling in Morocco. Although the small number of persons with Quraniceducation in the sample calls for caution in interpretation, the data also suggest that the shareof individuals with Quranic schooling is declining continuously, from 10 percent among the oldercohort to only 4 percent of the younger cohort. The decline in the urban sector is most dramatic,from 8.9 percent in the 55 + age group to 0.7 percent in the youngest cohort, with the sharpestdrop occurring between the 25-34 age group (5.3 percent) and the 15-24 age group (1 percent).The decline in the rural sector is much more moderate, from 11.5 percent to 7.6 percent.
Turning to an examination of the relationship of literacy assessments to type and levelof schooling, illiteracy rates of persons with incomplete primary or under 3 years of Quranicschooling would appear to be most at risk of under-estimation if self-report is used. For bothof these groups, underestimations of over 12 percentage points are observed in the sample as awhole, and reach 18 percent or more among men and in the rural sample. Under-estimation ofliteracy skills (and therefore over-estimation of the illiteracy rate) is most prevalent amongurban-dwelling persons with several years of schooling in the Islamic system. Of this group,76.3 percent claimed no literacy skills, although only 52.9 percent obtained a score of "0" or"1" on the direct assessment measures.
When we consider educational level as a proxy for estimating literacy and illiteracy rates,there would appear to be little risk in the assumption that persons reporting no schooling havevery little or no reading or writing ability. Fewer than 1 percent of persons with no schoolingwere able to demonstrate literacy skills at any level.
Among those with schooling, conversely, persons reporting at least complete primaryeducation were able to demonstrate some level of literacy competence. No individuals in thiscategory or higher received a score of "0" by direct assessment. Whether only rudimentary skills(level "1") should be considered "literacy" may be disputed, however; it should be noted that3.5 percent of persons with complete primary education but no further schooling fell into thiscategory. A more serious problem is the common assumption of illiteracy, and a resulting over-estimation of the illiteracy rate, among persons with incomplete primary education. Of such

16
persons in the current sample, over 42 percent were able to achieve direct assessment scoresindicating a basic (level "2") to strong (level "3") command of literacy skills.
Regarding potential effects of the type of schooling attended, the data suggest that forpersons with equal numbers of completed years of schooling, those who have studied in secularschools have a lower incidence of illiteracy than those who have studied for the same length oftime at a Quranic school.5 Among those with 3 to 5 years of schooling, illiteracy rates were 18percent for secular-schooled persons, versus 56 percent for those who had attended Quranicschools (not shown). The gap in illiteracy rates between students of secular and Quranic schools,conditioned on completed years of schooling, decreases with the level of education. Further,multivariate regression analysis (see section VI below) reveals that even after controlling forother factors such as age, gender, and environment, type of schooling continues to have asignificant effect on literacy scores obtained.
5. Because few people attend Quranic schools, the sample contains relatively few observations from this group.Interpretations and conclusions drawn from analyses of this group must therefore be made with caution.

IV. Literacy, Illiteracy, and Economic Status
Literacy levels obtained by the direct assessment method correlate highly with the quintileof per capita household expenditux. (Table 8). The overall illiteracy rate is as high as 77 percentfor the poorest quintile, in contrast with only 34 percent for the richest quintile. The differenceis greatest between the fourth and last quintiles, by nearly 18 percentage points.6 The disparityacross quintiles is most pronounced in the urban sector. Here the difference in illiteracy ratesbetween the lowest and highest quintiles is 28 points, versus a difference of only 18 points inrural areas. Nonetheless, even the richest rural quintile has a higher illiteracy rate than thepoorest urban quintile.7
Convergent results from many studies conducted in both developing and developedcountries indicate positive relationships between various measures of human capital and laborforce participation. Among the 15-69 year age cohorts in our sample, the mean labor forceparticipation rate is 57.9 percent (82.6 percent for males, 36 percent for females, 47.5 percentin urban areas, and 68.0 percent in the rural sector). Of labor force participants, 94 percent (54percent of total) were employed at the time of the survey while 6 percent were unemployed (3.2percent of total).
Overall illiteracy rates for labor market participants and for the non-active population arealmost identical, about 61 percent, but these rates vary significantly by gender and milieu ofresidence (see Table 9). For men the illiteracy rate among labor market participants is higher(roughly 50 percent) than that of the non-active (22 percent). More disturbing are the findingsrelated to skill differences between active employed and unemployed groups. Within the laborforce, it is the unemployed who are endowed with more skills. Their illiteracy rate is under 14percent, while among the employed it is almost five times that rate, at 62 percent. Similarly,mean years of schooling among the unemployed reaches 11.3 years, much higher than that ofthe employed, at 3.7 years. These differences are most striking for men, both in urban and inrural areas. It is of interest to note the similarity among unemployed men in rural and urbanareas: in both areas these their literacy rate is very low (6.9 percent in rural and 2.8 percent inurban) and their mean years of schooling very high (12.4 and 13.4, respectively).
6. When distinction is made between Arabic and French (not shown), differences in literacy between the quintiles are morepronounced in French than in Arabic literacy.
7. If illiteracy rates are compared according to level of education and economic status (as represented by per capitahousehold expenditure quintile), we find a far greater variability by education level than by expenditure level. Multivariateanalyses presented in section VI indeed show a suppressed contribution of expenditure quintile when years of schooling isincluded in the model. Economic position may thus constitute a secondary determining factor in relation to the educationlevel. However this assertion cannot be categorical, since education level itself also increases significantly with expenditurelevels.

18
Table 8. Direct Literacy Assessment Levels by Household Expenditure Quintiles rin percent of eachquintile)
Direct Literacy Assessment LevelHousehold (Highest of Arabic or French)
Expenditure 2 3 TotalQuintile
TOTAL 57.7 8.9 9.4 23.8 100
Quintile 1 (lowest) 77.0 8.9 6.5 7.4 100
Quintile 2 73.2 9.0 6.9 10.7 100
Quintile 3 64.2 9.7 9.4 16.5 100
Quintile 4 51.2 9.4 12.1 27.1 100
Quintile5 (highest) 33.5 9.6 11.6 45.1 100
URBAN 37.5 8.7 12.7 40.9 100
Quintile 1 (lowest) 54.3 11.7 15.8 18.0 100
Quintile 2 55.6 8.5 11.4 24.3 100
Quintile 3 45.2 10.2 13.7 30.7 100
Quintile 4 38.3 9.1 14.3 38.1 100
QuintileS (highest) 25.5 9.1 12.0 53.2 100
RURAL 76.9 9.1 6.3 7.5 100
Quintile 1 (lowest) 84.8 8.0 3.3 3.7 100
Quintile 2 78.7 9.1 5.5 6.5 100
Quintile 3 76.4 9.4 6.6 7.4 100
Quintile 4 70.8 9.9 8.7 10.4 100
Quintile S (highest) 66.7 11.7 9.7 11.7 100

19
Table 9. Direct Literacy Assessment Levels by Activity Status, Gender, and Environment(persons aged 15-69, in percent of each quintile)
Distribution by Direc Literacy Assessment LevelHousehold (Highest of Arabic or French; each row sums to 100 percent)Expenditure Proportion of 1 2 3Quintile Sub-Group °
TOTAL 100.0 59.9 7.5 7.6 24.8
Active employed 54.5 61.7 8.9 7.8 21.4
Active unemployed 3.2 13.7 7.6 22.6 55.9
Inactive 42.2 61.2 5.7 6.1 26.8
MEN 100.0 44.8 11.0 9.2 34.8
Active employed 79.2 51.2 11.9 9.7 27.1
Active unemployed 3.4 13.0 7.2 17.3 62.3
Inactive 17.3 22.0 7.5 5.4 64.9
WOMEN 100.0 73.1 4.5 6.1 16.0
Active employed 33.0 83.7 2.7 3.9 9.6
Active unemployed 3.0 14.4 8.0 27.9 49.5
Inactive 64.0 70.4 5.3 6.3 17.8
URBAN 100.0 40.6 8.0 9.5 41.7
Active employed 42.3 35.2 10.0 10.4 44.1
Active unemployed 5.2 11.6 7.7 21.2 59.3
Inactive 52.4 47.8 4.7 7.7 38.1
RURAL 100.0 79.5 7.1 5.6 7.6
Active employed 66.8 78.5 8.3 6.1 6.9
Active unemployed 1.1 23.4 7.0 29.1 40.2
Inactive 31.9 83.5 4.7 3.6 8.0

V. Family Patterns of Literacy and Illiteracy
In most cases, the unit of analysis underlying the calculation of literacy and illiteracyrates is the individual. In other words, literacy is implicitly viewed as an individual resourcewhich, if it is not directly possessed by an individual, is not otherwise readily available to himor her. Departing from that view, the development of methods to characterize literacy skills atthe household level has been advocated as an efficient and potentially more valid way to evaluatethe functional distribution of literacy in societies in which the family unit, rather than theindividual, is the principal functional unit, wherein the skills and resources of each member arepooled and available to all members. This general approach has gained further impetus with thedevelopment of household-survey methodologies applied to the domain of literacy, since thepractical as well as statistical interdependencies of individuals within households are fundamentalto the household survey approach. Here we present some preliminary analyses to demonstratehow patterns of literacy at the family level can be examined using household survey data.
Literacy levels of husband and wife
Table 10 presents a series of matrices which show the convergence of direct-assessmentliteracy levels of the head of household and spouse, for the total sample and for urban and ruralsectors. In the country as a whole, there is a perfect match between skill levels of householdhead and spouse in 71 percent of households (the sum of the diagonal elements of Table 10). Inthe rural sector, both husband and wife are illiterate in almost four-fifths of households,suggesting that in the rural sector illiteracy could be referred to as a household-level problem.It is much less so in the urban sector, where the absolute lack of skills for both parents isobserved in only 46 percent of households. Overall, there is greater inequality of skilldistribution within urban households, relative to the almost perfect matching of parental skillsin rural households.
Another interesting feature of Table 10 is revealed by the off-diagonal elements of thematrices. It is much more frequent to observe wives with more literate husbands (26.1 percent)than the opposite (3.2 percent); over 40 percent of the most literate husbands have an illiteratewife. In contrast, only a small fraction (less than 5 percent) of the most literate wives have anilliterate husband. Again, urban and rural households reveal somewhat different patterns. Sixpercent of urban wives are more literate than their partner, compared to fewer than 1 percentin the rural sector. We will return to the implications of these patterns in the discussion of inter-generational transmission of literacy.
If we adopt the assumption that illiteracy of both parents indicates an illiterate household,then the incidence of illiterate households is 63 percent in the whole country, 78 percent amongrural households and 46 percent among urban households. These rates are very close to thoseobtained from the individual-level skill distribution, 77 percent and 38 percent for the twosectors, respectively. Can we therefore estimate adult illiteracy accurately by simply identifyingilliterate households? This of course may be appropriate if inter-generational illiteracy rates arealso highly positively correlated, a point to which we now turn.

21
Table 10. Family Literacy: Literacy Levels of Husband and Wife (in percent of each population group)
Direct Literacy Direct Literacy Assessment Level of HusbandAssessment (Highest of Arabic or French)Level of Wife 0 1 2 3 Total
TOTAL SAMPLE
0 63.2 9.5 5.3 7.5 85.5
1 1.8 0.6 0.4 2.3 5.1
2 0.5 0.3 0.2 1.1 2.1
3 0.3 0.1 0.2 6.7 7.3
TOTAL 65.8 10.5 6.1 17.6 100.0
URBAN SAMPLE
0 45.4 9.8 6.9 8.6 70.7
1 3.5 0.8 0.4 5.0 9.7
2 0.9 0.6 0.2 2.1 3.8
3 0.6 0.3 0.3 14.6 15.8
TOTAL 50.4 11.5 7.8 30.3 100.0
RURAL SAMPLE
0 78.1 9.3 4.0 6.7 98.1
1 0.4 0.3 0.4 0.0 1.1
2 0.2 0.1 0.1 0.2 0.6
3 0.0 0.0 0.1 0.1 0.2
TOTAL 78.7 9.7 4.6 7.0 100.0
Table lOa. Comparison of Literacy Levels of Husband and Wife
Percent of Couples Which: Total Sample Urban Rural
Husband and Wife Have Equivalent 70.7 61.0 78.6Literacy Levels
Husband Has Higher Literacy Level Than 26.1 32.8 20.6Wife
Wife Has Higher Literacy Level Than 3.2 6.2 0.8Husband

22
Literacy levels of parent and child
A comparison between the literacy levels of children (aged 9 to 21) in a given householdwith that of their parents is presented in Table 11. Overall, the percentage of illiterate personsis higher in the older generation. Nearly 5 out of 10 children (46.9 percent) whose parents areilliterate are also illiterate, compared to fewer than 2 out of 10 illiterate children (19.6 percent)in families in which both parents have some degree of literacy. In addition, nearly nine-tenths(88.0 percent) of all illiterate children come from households in which both parents are illiterate.Overcoming the reproduction of illiteracy in "illiterate" households may be an importantdimension in the design and targeting of literacy programs.
Conversely, of the 11 percent of parents who obtained a maximum score of 3, two-thirds(66.4 percent) of their children have the same literacy rating. The off-diagonal elements of thematrix in Table I I indicate that 47 percent of children have a higher literacy score than theirparents, while only 9 percent of children have a lower skill level than their parents. The net gainof 38 percent from one generation to the next is positive and large.8
Table 11 also permits us to examine how this gain is distributed between urban and ruralsectors. Urban literacy has dramatically improved from one generation to the next: the illiteracyrate has fallen from 65.2 percent to 13.2 percent. At the other extreme, 57 percent of urbanchildren achieved the highest literacy score, compared to only 18 percent of the parents. Barelyone-sixth (16 percent) of the urban children of illiterate parents are illiterate, while nearly 59percent of these children attain the highest literacy score. Nonetheless, 22 percent of all urbanilliterate children are the product of parents with some degree of literacy.
The situation is different in the rural milieu. Here we observe a much smaller decline inthe illiteracy rate, from 86 percent to 67 percent from one generation to the next. Nearly 70percent of rural children of illiterate parents are also illiterate; fewer than 9 percent obtained thehighest literacy level. Ninety percent of all illiterate rural children have illiterate parents, andeven in families in which one or both parents have some degree of literacy, over 47 percent ofrural children are illiterate.
Mother's literacy and child's school attendance
Parental illiteracy can also affect the next generation through an influence on schoolparticipation. Two "school attendance" rates are examined: the rate of children aged 7 to 21 whohave ever attended school, and the percentage of these same children who are at presentattending school (see Table 12).
8. Comparisons between boys and girls give very similar results, although the illiteracy rate among girls has declined lessthan among boys when compared to their parents' rate of illiteracy. Boys display higher literacy levels than their parents in51.4 percent of cases, while this is true for girls in only 41.0 percent of cases. Girls in rural areas were found to have anespecially low pattern of change, showing almost no gains over their parents in terms of literacy skills.

23
Table 11. Intergenerational Literacy Change: Comparing Parents' with Children 's Literacy Levels (inpercent of each population group)
Highest Direct Highest Direct Literacy Assessment Level of ChildLiteracy (Highest of Arabic or French)AssessmentLevel of Parent 0 1 2 3 Total
TOTAL SAMPLE
0 35.4 8.4 10.3 21.4 75.5
1 2.3 2.1 2.1 2.8 9.3
2 0.8 0.8 0.8 1.8 4.2
3 1.7 0.9 1.1 7.3 11.0
TOTAL 40.2 12.2 14.3 33.3 100.0
URBAN SAMPLE
0 10.3 6.3 12.8 35.8 65.2
1 1.3 2.1 3.1 4.1 10.6
2 0.4 1.4 0.9 3.3 6.0
3 1.2 1.0 2.1 13.9 18.2
TOTAL 13.2 10.8 18.9 57.1 100.0
RURAL SAMPLE
0 59.8 10.5 7.7 7.5 85.5
1 3.4 1.9 1.3 1.2 7.8
2 1.1 0.4 0.6 0.5 2.6
3 2.3 0.7 0.3 0.7 4.0
TOTAL 66.6 13.5 9.9 9.9 99.9
Table Ha. Comparison of Literacy Levels of Parents and Child
Total Male FemalePercent of Families in Which: Sample Urban Rural Child Child
Parent and Child Have Equivalent 45.6 27.2 63.0 41.4 50.0Literacy Levels
Parent Has Higher Literacy Level Than 7.6 7.4 8.2 6.9 8.7Child
Child Has Higher Literacy Level Than 46.8 65.4 28.7 51.7 41.2Parent

24
Seventy-four percent of the children aged between 7 and 21 years have attended school,while only 50 percent are presently attending school; these two percentages vary considerablyaccording to the mother's literacy level. Ninety-six percent of the children of literate mothershave ever attended school, compared to only 72 percent of the children of illiterate mothers.Likewise, 89 percent of the children of literate mothers are presently attending school,compared to only 45 percent of the children of illiterate mothers.
When the results are differentiated according to age groups, we find that 100 percent ofthe 7- to 9-year-old whose mothers are literate have attended school, and all are currentlyattending school. In addition, over 90 percent of children aged 10 to 15 with literate mothers arecurrently attending school, 87 percent of children 16 to 18 years of age, and 61 percent ofchildren aged 19 to 21. In contrast, the rate of current school attendance among children ofilliterate mothers drops from 66 percent for 7 to 9 year-old to 37 percent for children aged 16to 18 years, and to only 23 percent for 19 to 21 year-old.9
Table 12. Children 's School Enrollment by Mother's Literacy (Children aged 7 to 21 years;percentage of each group in school)
Mother's Direct Assessment Score(Highest of Arabic or French Literacy)
Child's Enrollment Percent of All 0 1-2-3and Age Group Children in Age Group
Children Who HaveEver Attended School 74.2 71.5 96.4
Age 7 to 9 years 70.0 68.2 100.0
Age 10 to 12 years 75.2 73.1 91.9
Age 13 to 15 years 73.7 70.2 97.9
Age 16 to 18 years 75.6 72.3 98.8
Age l9 to 21 years 72.8 71.1 96.1
Children Currentlyin School 50.1 45.4 89.1Age 7 to 9 years 68.0 66.1 100.0
Age 10 to 12 years 65.0 61.7 91.9
Age 13 to 15 years 52.6 46.3 97.0
Age 16 to 18 years 42.8 36.5 86.9
Age 19 to 21 years 25.4 22.6 61.4
9. Parental reasons for not sending their children to school are revealed in a survey question on this topic. The mostfrequent reply (24 percent of all replies; 27 percent of urban and 23 percent of rural) cited disagreement with the methods ofthe school (e.g., coeducation) or with values transmitted by the school. The second most frequent reply (21 percent) citedhousehold budgetary constraints, while the third most frequent reply (17.3 percent) raised the problem of accessibility: "nolocal school". Parents in the rural milieu were much more likely to refer to opportunity costs of the child's time and labor(10 percent of rural replies, versus 4 percent of replies in the urban milieu). On the other hand, urban parents were morelikely to cite a lack of interest or perceived utility in schooling (15 percent of urban replies; versus 6 percent of ruralreplies). No parents surveyed indicated that their children were not accepted by a school due to lack of room or poorexamination results.

VI. An Analysis of Literacy Determinants
The high degree of multi-collinearity among the various correlates of literacy indicatesthat we should move beyond looking at the bivariate correlations to a multivariate analysis. Wepresent here a summary of regression analyses modeling the relationship between literacy anda set of co-factors (see Table 13). The basic regression equation has the following simple form:
Y = a + bl.X1 + b2.X2 + b3.X3 + b4.X4 + b5.X5 + e
where Y is the dependent variable (global literacy index), a is a constant, Xl...X5 are theexplanatory variables, bl.. .b5 are the parameters associated with the explanatory variables, ande the error. The potential explanatory variables considered in the models include age, gender,milieu, parents' literacy levels, quintile of household per capita expenditures, years and type ofschooling, and some interaction terms. Since father's and mother's literacy are included asindependent regressors, the sample analyzed includes only those individuals for whom validliteracy indices are available for both themselves and their parents. As a result of this restrictionthe sample excludes the older cohorts. All regressors are assumed to be exogenous.
The results shown in Table 13, Model 1 suggest that all regressors are significantlypartially correlated with literacy. Age is negatively associated with both literacy and numeracy,confirming our earlier finding that illiteracy in Morocco has been declining. We have re-estimated the regressions of Table 13 stratifying the sample by urban and rural milieux. The agecoefficients in the rural regressions are much lower than in urban regressions, again confirmingour findings from Section IV that the trend of declining illiteracy rates in Morocco is muchlower in rural areas.
Female gender is also negatively associated with literacy. Urban milieu appears to havea strong positive influence on the literacy level (t statistics over 20), as does parental literacy.The father's and mother's literacy have almost identical positive coefficients, and an F test couldnot reject the hypothesis that they are equal.'° Finally, the quintile of expenditure is alsostrongly positively associated with literacy (the quintiles are coded from 1 to 5, from thepoorest to the richest). All the estimated partial correlations reported in Table 13 confirm thefindings reported in previous sections regarding the simple correlations between the variousliteracy indices and their correlates.
In a second set of regression equations (Table 13, Models 2 to 4), we added the level andtype of education received as regressors. Education level was measured by total completed yearsof schooling. A dichotomous variable for education type, was coded " 1 " for the secular studiesand "0" for Quranic studies. The fit of all the regressions improved significantly compared tothe regressions reported in Model 1, by about 50 percent. The relative magnitude of resultsobtained previously for the effect of demographic and income variables was unchanged.However, the size of these coefficients was reduced significantly since years of schooling and
10. We also estimated a model with one variable for the literacy of the parents, calculated as the best score obtained by thefather or the mother, for both literacy and numeracy. The results were not very different from those reported in Table 20.

26Table 13. Determinants of Literacy Level
Model I Model 2 Model 3 Model 4
Predictor Beta t-test Beta t-test Beta 1-test Beta t-test
Constant 2.77 38.7 0.45 7.2 0.6 11.3 0.41 2.2
Age -0.02 25.6 -0.07 14.5 -0.006 12.8 0.001 2.0
Female gender -0.55 21.9 -0.14 8.6 -0.14 8.3 -0.13 8.4
Urban milieu 0.59 20.7 0.19 10.2 0.17 9.1 0.13 7.0
Father's literacy 0.28 20.9 0.09 10.8 0.10 10.8 0.12 14.3
Mother's 0.27 14.6 0.04 3.7 0.03 2.5 0.06 5.2literacy
Expenditure 0.08 7.9 0.01 1.4 0.005 0.8 0.004 0.6quintile
Years of 0.21 91.7 0.15 24.8 0.29 64.6schooling
Secular 0.23 6.1 0.11 3.0schooling
Years of 0.07 11.5schooling xsecular school
Years of -0.002 20.3schooling x age
R-square 0.46 0.79 0.79 0.80
F 759.8 2462.8 2518.1 2402.1
Number of 5402 5392 5392 5392observations
type of schooling are highly correlated with the demographic and economic variables. Thecoefficient of mother's literacy declined more than that of father's literacy, indicating thatmother's literacy is highly correlated with child schooling, more so than father's literacy."However as a determinant of literacy level, conditioned on schooling, paternal literacy wouldappear overall to be the more important factor. More evidence on this question is revealed inregressions conducted separately for male and female subsamples (not shown). In both urban andrural areas, father's literacy is a significant determinant of the literacy level of sons but not ofdaughters. On the other hand, mother's literacy is significant for both boys and girls, althoughwith larger and more significant coefficients in regressions on girls' literacy.
11. See Khandker, Lavy and Filmer (1993) for more evidence and discussion on the relationship between mother and fathereducation and child schooling in Morocco.

27
The coefficient of expenditure declines drastically once years of schooling and type ofeducation are included as determinants (Model 2), and its t value becomes nonsignificant. Thisfinding suggests that available household resources affect literacy totally through schoolingattainment and type of education.
Own years of schooling has a strong positive effect on literacy level, with a very highpartial t value. The size of the coefficient (0.21) indicates that completing five years of schooling(equivalent to graduating from primary school before the 1990 change in the schooling system)leads to an increase in the literacy index of one level, for example from 0 to 1. To illustrate theimpact of schooling on literacy levels, the model in Table 21 predicts that an eleven year old girlliving in a rural household with illiterate parents and per capital expenditure at the lowestquintile, will score 1 in the literacy index if she has completed four years of secular schooling.To achieve level 3, the highest score in the literacy index, the same individual would need tocomplete almost 14 years of secular schooling. The policy implication of this result is that ifcompulsory schooling up to the completion of primary schooling were to be enforcednationwide, especially in rural ares, Morocco would move significant progress towards acomplete eradication of illiteracy.
Secular schooling also contributes to higher literacy scores. More precisely, the impactof studying in a secular school rather than a Quranic school is to increase the predicted literacyindex by 0.23, roughly equivalent to a full year of schooling. More detailed analyses (notshown) suggest that this effect is only relevant for males and is more pronounced in rural areas.
In Model 3 we present estimates that allow for the impact of the type of schooling actingthrough the effect of years of schooling. In order to achieve this we added an interaction termbetween years of schooling and the literacy index to the regression. The coefficients suggest thatthe effect of one year of secular schooling (0.22) is greater by almost 50 percent than that of ayear of Quranic schooling (0.15). Using the previous example of the rural girl, only 3.3 yearsof secular studies is required to achieve level 1 in the literacy index, compared to 5 years ofQuranic schooling. It follows from these results that the down-trend in the proportion of childrenenrolled in Quranic schools explains to some extent the decline in illiteracy in Morocco,especially in urban areas.
The positive effect of schooling on literacy should decline with age for at least tworeasons: first, depreciation in the retention of skills acquired in school; second, and moreimportantly, a possible increase in the quality of schooling. In Model 4 we present the resultsof adding an interaction term between schooling and age to our basic regression. The coefficientof this term is indeed negative (with a very high t value), suggesting that the impact of schoolingon literacy is sharply reduced with age. For example, the marginal contribution of one moreyear of schooling to the literacy score is 0.26 at age 20, but drops to 0.18 at age 60. We cannotidentify however how much of this effect is accounted for by the increase in quality of schoolingin Morocco.

VII. Summary, Conclusions, and Policy Implications
The results of the Morocco literacy module have implications both for methods ofmeasuring literacy and for formulating policy to increase literacy. Furthermore, theseimplications are relevant for any country attempting to measure and improve literacy.
The most impressive result in the study was that Morocco has been able to halve itsilliteracy rate during the last three decades. The current 15-24 age cohort has an illiteracy rateless than half of that of the 45-54 year old cohort. The trend is one of continuing improvement,since the evidence suggests that the 9-14 age cohort will have better skill endowment than thenext older cohort.
The record of success is somewhat mixed however. On the basis of results from directassessment methods, it would appear that the "gender gap", and the urban and rural disparitiesin literacy attainment in Morocco are much more critical than the gaps between regions. Thegender "gap" in the illiteracy rate is still large, with a national average of 26 percent; worsestill, it has been increasing over time. The gender literacy gap among the current youngergeneration is much larger than that of their grand-parents or even parents. The urban-ruraldisparity in literacy, is characterized by a similar trend. Indeed, cohort analysis suggests thaturban-rural disparities in literacy have been widening over time, with urban areas showing amarked improvement, while rural areas have lagged far behind. Whether the phenomenon is dueto selective out-migration of literate individuals from the countryside to towns, or to a crisis ineducational access and quality in rural areas in particular, is a question with profound policyimplications, and requires further examination.
Patterns of household-level literacy may hold some clue to the rural illiteracy problem.The vast majority of rural households are headed by parents both of whom are illiterate, whileover 50 percent of urban households have at least one parent with some degree of literacy.Urban men are also more likely than rural men to marry a wife with a higher literacy level.Breaking down resistance to this pattern in rural areas may be one way to improve theproportion of households where at least one parent is literate. As it is, completely-illiterateparent are by far more likely to raise illiterate children.
On the whole, Moroccan secular education has improved the rates of literacy andnumeracy skills in the population. Nonetheless, our study suggests that there are other routes toliteracy in Morocco that are worth exploring. For example, 7 percent of those with no schoolingin our sample demonstrated moderate literacy skills. At the other extreme, a small portion,though not negligible, of the "schooled" population would appear to have been poorly served byMorocco's educational system. Further studies to explain such counter-intuitive phenomena arewarranted for identifying alternative and better targeted policy initiatives.
There are serious reservations concerning the literacy skills acquired in the Quraniceducation system. The low level of measured ability even in Arabic literacy casts serious doubton the effectiveness of this education system in modern Morocco.

29
The strong positive causal effect of schooling on literacy estimated in this report suggeststhat increasing school enrollments and lowering dropout rates in rural areas are effectiveattractive policy options for reducing illiteracy rates of school age children. Our simulationssuggest that the completion of primary schooling can guarantee rudimentary to minimalcompetence in writing and reading Arabic, as well as minimal ability to perform simple writtencalculations. The threshold of 5 to 6 years of schooling suggests that the government shouldenforce compulsory schooling at least up to the completion of primary schooling. The patternof current school enrollment rates by region and gender in Morocco suggest that a policy priorityshould be the improvement of access to and quality of schooling in rural areas, with a specialemphasis on girls.
The fact that literacy, while associated with higher household income and expenditurequintiles, was also associated with unemployment, is a sobering reminder of the challenge stillfacing Morocco and many developing countries to more fully mobilize the skills and potentialof its increasingly literate and educated labor force. Literacy and education are for many aticket to nowhere. The longer this phenomenon persists, the more likely a growingdisillusionment with such skills will set in, with undoubtedly drastic long-term results.
However, at the same time, the evidence presented above suggests that the recentilliteracy campaign is not targeted at the most illiterate groups in the population. The governmentshould refocus its literacy campaign and target the population in rural areas, particularly womenin the North-West and North-Central regions.
With regard to the assessment and measurement of literacy, our results have suggestedthe presence of potential, though not always significant, patterns of bias in conventional methodsof self-assessment. For Morocco, systematic patterns of over- and underestimation of literacywould appear to upwardly bias the literacy gap across genders, to mask or understate moreserious disparities between urban and rural milieux and geographic regions and to account forlower-than-reported literacy levels among young people still in school. In short, the studyrevealed that about 7 percent of the population may be seriously misclassified (either as "literate"or "illiterate") when classification is based on self-assessment or educational level. Thesemisclassifications may to some extent be systematic and it would not be sound to formulatepolicy based on them.
In summary, we believe that studies of the type represented by the Morocco LiteracySurvey can contribute to more accurate and better-informed policy prioritization and developmentin the adult literacy field. The findings reported here for example, have highlighted patterns inthe distribution of literacy in Morocco that depart from conventionally accepted figures, in somecases quite radically.


Appendix: Survey Design and Field Work
The battery of direct assessments included assessments of Arabic reading, Arabic writing,and an Arabic-language "Information Search" on a series of common documents; Frenchreading, French writing; and mental and written arithmetic. Table Al presents a summary ofthe structural and psychometric characteristics of these tests on the first month of data collection.
All test administration was individual, by data collectors specifically trained on theseinstruments. The assessments within any given category were designed with incremental skilllevels. Administration of a particular assessment was governed by a series of criteria determining(a) at which level to begin a section of tests, given the individual's educational level or, in thecase of French, self-report of ability, and (b) whether to proceed to a higher or lower level, onthe basis of the individual's performance on the starting level. These "screens" were introducedto minimize time and maximize efficiency of administration; the average time required for asingle administration was about 20 minutes.
The survey draft was subjected to pretesting, revision, full pilot testing, and a secondrevision prior to full-scale application in the field. Pretesting of the literacy survey wasundertaken as a means of testing the adequacy of interviewer training and the efficiency ofsurvey format and administration procedures. As such, it was intended to provide qualitativeinformation for the finalization of methodology, rather than to allow detailed psychometricanalyses (carried out in the later piloting phase).
Full-scale survey administration training took place over the course of two and one-halfdays in March 1991. In total 18 individuals participated, most of them seasoned survey-takersemployed with the Statistics Direction of the Ministry of Planning. From this group twoAdjoints-Technique and 8 survey-takers were selected.
Upon the completion of training, two teams of four survey-takers, one controller, andone supervisor each were deployed for survey piloting. The pilot study sample comprised threefull primary clusters from the LSMS sample, each with 3 secondary clusters of 8 householdsapiece, for a total of 72 households. Analyses of data quality of the literacy survey pilot data filewere also conducted, focusing on consistency checks across a selection of related variables.These included examinations of consistency across codings of the result of each interview andacross educational level and last grade completed, and the consistency with which survey takersfollowed rules of exclusion, starting levels, passing to the higher level of a given submodule,and returning to the lower level.
Psychometric analyses of all assessment modules were performed, to examine the internalconsistency of the modules, the reliability and difficulty level of individual items, and theequivalence of the two forms of each module.
With regard to internal consistency, coefficient alpha and split-half correlations wereexamined. With the exception of Module 2, "Connaissances de Base" and the French languagemodules (Modules 7 and 8, which had too few complete cases for reliable analyses), all testswere found to have acceptable internal consistency, with split-half correlations ranging from .7

32
to .9 and coefficient alphas in the .8 to .9 range. The low internal consistency of Module 2suggests that this module samples discrete areas of familiarity or knowledge which may beanalyzed, though with caution, at the individual item level.
Item reliability and difficulty indicators, in addition, were used to delete and re-orderitems. Modules revised in this way included Module 3, "Recherche-information," Module 4,"Calcul mental," and Module 9, "Calcul ecrit."
Form equivalency of Arabic and French reading and writing tests was examined usingindependent samples t-tests grouped by Form. Group means on all tests were found to havesmall and nonsignificant differences, with the exception of CTA (t=2.06, d.f. = 113), for whichForm B appears to be significantly less difficult than Form A. In subsequent ANCOVA analysiswhich controlled for age and grade level reached, Form was no longer significant on this taskeither (F(1,109) = 2.43).
Two teams of four trained interviewers and a supervisor were mobilized for this purposefor a period of 1.5 months each trimester, based on an estimated average of 4 household visitsper interviewer per day, or 12 to 15 individual assessments per interviewer per day.
Because of the necessity to interview individually all household members between theages of 10 and 69, survey teams tended to work on an afternoon-evening schedule, from about2 pm to 10 pm each day in the field, making first contacts and interviewing all presenthousehold members in the afternoon, and making second (and when necessary third) visits toeach household in the evening to interview school-goers and employed persons who were absentat the first visit.
Field teams were visited about twice each month by Direction Survey supervisors, andon four occasions by Professor Lavy or Dr. Spratt during the course of fieldwork. Interviewerswere observed conducting surveys; and surveys previously completed by each interviewer wererandomly selected and examined for procedural errors. While few significant departures fromcorrect procedure were found, a group meeting with the team at the end of each visit was anoccasion to review the rules of administration and timing of individual test sections.
The literacy survey was presented in a single sitting to each household memberconcemed. The self-report section (Module 1, "Questions Generales") was asked of everyhousehold member age 10 or older, providing some self-report information on literacy andnumeracy abilities even for those individuals with higher levels of education who were excludedfrom the direct assessment portions of the survey. All heads of household, their spouses, andother household members between the ages of 20 and 50 inclusive and with less thanBaccalaureate-level education, also receives Module 2, "Connaissances de Base," on knowledgeof health behaviors and services.
Upon completion of the first month of fieldwork, data quality was again examined. Of1304 individual cases available on computer, 1097 were found to constitute surveyed individuals.

33
On these cases, tests were run to identify out-of-range values, check the success of merging,check for data anomalies across logically related variables, and identify errors in testadministration detectible by computer. Very few out-of-range values were detected, for the mostpart easily explained and corrected (e.g., inclusion of "signature" score in total of word-writingtask; coding of "no" response by "0" rather than "2").
Psychometric analyses of instrument reliability was also conducted with the 1st monthsample. The internal consistency and item analysis results indicated that the individual testsappear to be reasonably coherent, with most split-half correlations in the .85 to .95 range. Mathtest results were the least strong, but correlations were still reasonably high. T-test calculationsof Form equivalence showed that for most assessments the two forms do not differ significantly.Three exceptions to this general finding include LOMA (word-decoding, Arabic), LOMF (word-decoding, French), and CMIF (word-picture matching, French). Given these tentative signs ofnon-equivalence, all tests were again evaluated for form equivalence upon the completion of datacollection for the full sample, so that any persistent form differences could be statisticallycorrected postfacto if necessary. With the full sample, significant differences across forms wereno longer evident.

Table Al. List of Direct Literacy Assessments, with Psychometric Properties (Psychometric Test Results Based on First Month Survey, 1991)
INTERNAL CONSISTENCY TESTS
FORMsPLI r SPEAIMAN MINIMUM EOIJIVAI ENCE
RESPONSE HALF BROWN COEFF ITEMtTOTALTEST FORM N ITEMS MEAN S. D. RANGE CORR COEFF ALP11A CORR I value p
A. TESTS OF ARABIC READING
INFORMATION SEARCH 1030 12 4.644 4.904 0- 12 0.953 0.976 0.966 0.818 - --
ORAL WORO READING A 376 8 2.189 3.234 0-8 0.950 0.974 0.970 0.881 1.99 0.05B 382 8 2.673 3.451 0 - 8 0.946 0.972 0.973 0.843
WORD-PICTURE A 376 8 1.830 2.552 0-8 0.884 0.935 0.946 0.801 1.39 n.s.MATCHING B 379 8 2.127 2.914 0- 8 0.867 0.929 0.934 0.796
PARAGRAPH A 215 12 9.324 3.211 0-12 0.808 0.894 0.886 0.611 0.19 n.s.COMPREHENSION B 205 12 9.332 3.615 0-12 0.882 0.937 0.922 0.556
B. TESTS OF ARABIC WRITING
ARABIC WORD-WRITING A 366 6 1.369 2.201 0-6 0.889 0.941 0.943 0.869 1.36 n.s.(dictation) B 376 6 1.620 2.316 0- 6 0.913 0.954 0.942 0.837
ARABiC SENTENCE- A 201 3 5.453 1.131 0- 6 too lew items for consistency analysis 0.89 n.s.WRITING (dictation) B. 193 3 5.352 1.104 0- 6 * too few Items far consistency analysis ^

Table Al. (contnued)
INTERNAL CONSISTENCY TESTSFORM
SPLIT SPEARMAN MINIMULM EOLQVALENCERESPONSE HAlF BROWN COEFF ITEMfTOTAL
TEST FORM N ITEMS MEAN S.D. flANGE CORlR COEFF ALPI IA CORlR I value p
C. TESTS OF FRENCH READING
ORALWORDREADING A 165 8 5.345 3.078 0-8 0.906 0.951 0.934 0.816 2.45 0.02a 182 8 4.527 3.130 0-8 0.892 0.943 0.927 0.704
WORD-PICTURE A 166 8 4.988 2.902 0-8 0.837 0.911 0.901 0.724 3.14 0.01MATCHING P 180 8 3.983 3.029 0 - 6 0.831 0.907 0.908 0.677
PARAGRAPli A 147 12 7.517 3.539 0-12 0.857 0.923 0.U90 0.603 0.96 n.s.
COMPREHENSION B 120 12 7.950 3.732 0- 12 0.892 0.943 0.904 0.539 l.
D. TESTS OF FRENCH WRITING
FRENCH WORD-WRITING A 146 6 2.390 2.124 0 - 6 0.811 0.895 0.885 0.474 0.30 n.s.(dlciauon) a 158 a 2.335 1.944 0-6 0.812 0.806 0.853 0.446
FRENCH SENTENCE- A 92 3 4.467 1.579 0-6 .. too law Items lor consislency analysis ... 1.09 n.s.WRITING (dIltation) a 85 3 4.718 1.477 0 -6 * Ioo low Itams lor consislency analysis *16

36
Flgure Al. Direct Literacy Assessment Lewls by Activity Status, Males
0~,70%-
_ 50%
o 40%-
9 1 2 3 0 1 2 3Urban - LITERACY LEVEL - Rural
1° Active employed _ Active unemployed E Inactive

37
Figure A2. Direct Literacy Assessment Levels by Activity Status, Females
100%-
0
a.,
C:a)
10%-i0%
9 1 2 3 0 1 2 3Urban - LITERACY LEVEL - Rural
I Active employed Active unemployed E Inactive

References
Bhola, H.S. 1984. Campaigning for Literacy: Eight National Experiences of the TwentiethCentury, with a Memorandum to Decision-makers. Paris: UNESCO.
Gillette, A. 1987. "The Experimental World Literacy Programme: A Unique International EffortRevisited," in R.F. Arnove and H.J. Graff, eds., National Literacy Campaigns:Historical and Comparative Perspectives. New York: Plenum.
Hartley, M.J. and E.V. Swanson. 1986. Retention of Basic Skills among Dropouts fromEgyptian Primary Schools. Report No. DRD171. World Bank, Washington, D.C.
Khandker S., V. Lavy, and D. Filmer. 1994. Can The Government Improve Schooling Outcomesin Morocco. World Bank Discussion Paper No. 264. Education and Social PolicyDepartment. World Bank, Washington, D.C.
Kirsch, I.S, and A. Jungeblut. 1986. Literacy: Profiles of America's Young Adults. Final reportof the National Assessment for Educational Progress. Princeton, NJ: Educational TestingService.
Lind, A., and A. Johnston. 1986. Adult Literacy in the Third World: A Review of Objectives andStrategies. Educational Division Documents No. 32. Swedish International DevelopmentAuthority, Stockholm.
Neice, D., and M. Adsett. 1991. "Direct Versus Proxy Measures of Adult Functional Literacy:A Preliminary Re-examination and Modeling". Working Paper. Department of theSecretary of State, Canada.
Stedman, L., and C. Kaestle. 1987. "Literacy and Reading Performance in the United States,From 1880 to the Present." Reading Research Quarterly, Winter 1987.
UNESCO. 1978. Revised Recommendation Concerning the International Standardization ofEducational Statistics. Paris. Republished in 1983 as Revised Recommendations, Statisticsof Educational Attainment and Literacy. Paris.
and United Nations Development Program. 1976. The Experimental World LiteracyProgram: A Critical Assessment. Paris.
Wagner, D.A., ed. 1987. The Future of Literacy in a Changing World. London: Pergamon.
. 1988. "'Appropriate Education' and Literacy in the Third World," in P.R. Dasen, J.W.Berry, and N. Sartorious, eds., Healthy Human Development: Applications from Cross-Cultural Psychology. Beverly Hills, California: Sage.

39
1989. "Literacy Campaigns: Past, Present, and Future." Comparative Education Review,33(2):256-60.
1990. "Literacy Assessment in the Third World: An Overview and Proposed Schema forSurvey Use." Comparative Education Review, 34(1): 112-38.
B.M. Messick, and J. Spratt. 1986. "Studying Literacy in Morocco," in B.B. Schieffelinand P. Gilmore, eds., The Acquisition of Literacy: Ethnographic Perspectives. Norwood,N.J.: Ablex.
J.E. Spratt, and A. Ezzaki. 1989. "Does Learning to Read in a Second Language AlwaysPut the Child at a Disadvantage? Some Counter-evidence from Morocco." AppliedPsycholinguistics, 10:31-48.
J.E. Spratt, and G. Klein. 1989. "The Myth of Literacy Relapse: Literacy Retentionamong Moroccan Primary School Dropouts." International Journal of EducationalDevelopment.
and J.E. Spratt. Forthcoming. "Arabic Orthography and Reading Acquisition in Morocco"in I. Taylor and D. Olson, eds., Scripts and Reading: East and West. New York: KluwerAcademic.

Distributors of World Bank PublicationsARGENTINA The Middle East Observer KOREA, REPUBLIC OF SOUTH AFRICA, BOTSWANACados Hirsch, SRL 41, Sherif Street Pan Korea Book Corporation For single titfes
Galeria Guemes Cairno P.O. Box 101, Kwangwhamun Oxford University PressFlorida 165,4th Floor-Ofc. 453/465 Seoul Southern Africa1333 Buenos Aires FINLAND P.O. Box 1141
Akateeminen Kirjakauppa Korean Stock Book Centre Cape Town 8000
Oficina del Libro Internacional P.O Box 128 P.O. Box 34Alberti 40 SF-00101 Helsinki 10 Yeoeido For subscripton orders:1082 Buenos Aires Seoul International Subscription Service
FRANCE P.O. Box 41095
AUSTRALIA, PAPUA NEW GUINEA, World Bank Publications MALAYSIA CraighaDFIJL SOLOMON ISLANDS, 66, avenue d'Idna University of Malaya Cooperative Johannesburg 2024VANUATU, AND WESTERN SAMOA 75116 Paris Bookshop, LimitedD-A. Information Services P.O. Box 1127, Jalan Pantai Baru SPAIN648 Whitehorse Road GERMANY 59700 Kuala Lumpur Mundi-Prensa ibros, SA.Mitcham3132 UNO-Verlag Castello 37Victoria Poppelsdorfer AUee 55 MEXICO 28001 Madrid
53115 Bonn INFOTECAUSTRIA Apartado Postal 22-860 LibrerHa Internacional AEDOSGerold and Co. GHANA 14060 Tlalpan, Mexico D.F. Consell de Cent, 391Graben 31 Greenwich Mag. and Books 08009 BarcelonaA-1011 Wien Rivera Beach Hotle NETHERLANDS
PO Box 01198 De Lindeboom/InOr-Publikaties SRI LANKA AND THE MALDIVES
BANGLADESH Osu-Accra P.O. Box 202 Lake House BookshopMicro Industries Development 7480 AE Haaksbergen P.O. Box 244
Assistance Society (MIDAS) GREECE 100, Sir Chittampalam A.
House 5, Road 16 Papasotiuiou S.A. NEW ZEALAND Gardiner MawathaDhanmondi R/Area 35, Stournara Str. EBSCO NZ Ltd. Colombo 2Dhaka 1209 106 82 Athens Private Mail Bag 99914
New Market SWEDENBELGIUM HONG KONG, MACAO Auckland Fritzes FackboksforetagetJean De Lannoy Asia 2000 Ltd. Regeringpgatan 12, Box 16356Av. du Roi 202 46-48 Wyndham Street NIGERIA 5-10647Stockholm1060 Brussels Winning Centre University Press Limited
7th Floor Three Crowns Building Jericho Wennergren-Williams ABBRAZIL Central Hong Kong Private Mail Bag 5095 P.O. Box 1305Publicacoes Tecnicas Internadonais Ltda. Ibadan S-171 25 SolnaRua Peixoto Gomide, 209 HUNGARY01409 Sao Paulo, SP Foundation for Market Economy NORWAY SWITZERLAND
Dombovad Ut 17-19 Narvesen Information Center Librairie PayotCANADA H-11 17 Budapest Book Department Casepostale3212La Diffuseur P.O. Box 6125 Etterstad CH 1002 Lausanne151A Boul de Mortagne INDIA N-0602 Oslo 6Boucherville, Quebec Alied Publishers Private Ltd. Van Dierman Editions Techniques - ADECO
J4B SE6 751 Mount Road PAKISTAN P.O. Box 465Madras - 600 002 Mlrza Book Agency CH 1211 Geneva 16
Renouf Publishing Co. 65, Shahrah-e-Quaid-e-Azam1294 Algoma Road INDONESIA P.O. Box No. 729 TANZANIAOttawa, Ontario Pt. Indira Limited Lahore 54000 Oxford University PressKIB 3W8 Jalan Borobudur 20 Maktaba Street
P.ZO Box 181 PERU P.O. Box 5299
CHINA Jakarta 10320 Editorial Desarrollo SA Dar es SalaamChina Finandal & Economic Apartado 3824
Publishing House IRAN Lina 1 THAILAND8, Da Fo Si Dong Jie Kowkab Publishers Central Department StoreBeijing P.O. Box 19575-511 PHILIPPINES 306 Silom Road
Tehran International Book Center Bangkok
COLOMBIA Suite 1703, Cityland 10Infoenlace Ltda. IRELAND Condominium Tower 1 TRINIDAD & TOBAGOApartado Aereo 34270 Government Supplies Agency Ayala Avenue, H.V. dela Svstematics Studies UnitBogota D.E 4-5 Harcourt Road Costa Extension #09 Watts Street
Dublin 2 Makati, Metro Manila CurepeCOTE D'IVOIRE Trinidad, West IndiesCentre d'Edition et de Diffusion ISRAEL POLAND
Africaines (CEDA) Yozmot Literature Ltd. International Publishing Service UGANDA04 B.P. 541 P.O. Box 56055 U.l Piekna 31/37 Gustro Ltd.Abidjan 04 Plateau Tel Aviv 61560 00-677 Warszawa Ist Floor, Room 4, Geogiadis Chambers
P.O. Box 9997CYPRUS R.O.Y Lnternational PORTUGAL Plot (69) KampalaCenter of Applied Research P.OB. 13056 Livraria PortugalCyprus Cotlege Tel Aviv 61130 Rua Do Carmo 70-74 UNITED KINGDOM6, Diogenn Street, Engoni 1200 Lisbon Microinfo Ltd.P.O. Box 2006 ITALY P.O. Box 3Nicosia Licosa Comnmissionaria Sansoni SPA SAUDI ARABIA, QATAR Alton, Hampshire GU34 2PG
Via Duca Di Calabria, 1/1 Jadrr Book Store EnglandCZECH REPUBUC Casella Postale 552 P.O. Box 3196National information Center 50125 Firenze Riyadh 11471 ZAMBIAP.O. Box 668 University of Zambia BookshopCS-1 1357 Prague I JAMAICA SLOVAK REPUBLIC Great East Road Campus
Ian Randle Publishers Ltd. Slovart G.TG Ltd. P.O. Box 32379DENMARK 206 Old Hope Road Krupinska 4 LusakaSamfundrLitteratur Kingston 6 P.O. Box 152Rosenoerns Al 11 852 99 Bratislava 5 ZIMBABWEDK-1970 Frederiksberg C JAPAN Longman Zimbabwe (Pvt.) Ltd.
Eastern Book Service SINGAPORE TAIWAN, Tourle Road, Ardbennie
DOMINICAN REPUBLIC Hongo 3-Chome, Bunkyo-ku 113 MYANMAR,BRUNEI P.O. Box ST 125Editors Taller, C. por A. Tokyo Gownr Asia Pacific Pte Ltd. SouthertonRestauraci5n e Isabel la Catolica 309 Golden Wheel Building HarareApartado de Correos 2190 Z-1 KENYA 41, Kallang Pudding, #04.03Santo Domingo Africa Book Service (E.A.) Ltd. Singapore 1334
Quaran House, Mfangano StreetEGYPT, ARAB REPUBLIC OF P.O. Box 45245Al Ahram NairobiAl Galaa StreetCairo

LSMS Working Papers (continued)
No. 79 Thomas, Gender Differences in Household Resource Allocations
No. 80 Grosh, The Household Survey as a Toolfor Policy Change: Lessonsfrom the Jamaican Surveyof Living Conditions
No. 81 Deaton and Paxson, Patterns of Aging in Thailand and C6te d'lvoire
No. 82 Ravallion, Does Undernutrition Respond to Incomes and Prices? Dominance Tests for Indonesia
No. 83 Ravallion and Datt, Growth and Redistribution Components of Changes in Poverty Measure: ADecomposition with Applications to Brazil and India in the 1980s
No. 84 Vijverberg, Measuring Incomefrom Family Enterprises with Household Surveys
No. 85 Deaton and Grimard, Demand Analysis and Tax Reform in Pakistan
No. 86 Glewwe and Hall, Poverty and Inequality during Unorthodox Adjustment: The Case of Peru,1985-90
No. 87 Newman and Gertler, Family Productivity, Labor Supply, and Welfare in a Low-Income Country
No. 88 Ravallion, Poverty Comparisons: A Guide to Concepts and Methods
No. 89 Thomas, Lavy, and Strauss, Public Policy and Anthropometric Outcomes in Cote d'Ivoire
No. 90 Ainsworth and others, Measuring the Impact of Fatal Adult Illness in Sub-Saharan Africa: AnAnnotated Household Questionnaire
No. 91 Glewwe and Jacoby, Estimating the Determinants of Cognitive Achievement in Low-IncomeCountries: The Case of Ghana
No. 92 Ainsworth, Economic Aspects of Child Fostering in Cate d'Ivoire
No. 93 Lavy, Investment in Human Capital: Schooling Supply Constraints in Rural Ghana
No. 94 Lavy and Quigley, Willingness to Payfor the Quality and Intensity of Medical Care:Low-Income Households in Ghana
No. 95 Schultz and Tansel, Measurement of Returns to Adult Health: Morbidity Effects on Wage Ratesin Cote d'lvoire and Ghana
No. % Louat, Grosh, and van der Gaag, Welfare Implications of Female Headship in Jamaican Households
No. 97 Coulombe and Demery, Household Size in Cote d'lvoire: Sampling Bias in the CILSS
No. 98 Glewwe and Jacoby, Delayed Primary School Enrollment and Childhood Malnutrition inGhana: An Economic Analysis
No. 99 Baker and Grosh, Poverty Reduction through Geographic Targeting: How Well Does It Work?
No. 100 Datt and Ravallion, Income Gainsfor the Poorfrom Public Works Employment: EvidencefromTwo Indian Villages
No. 101 Kostermans, Assessing the Quality of Anthropometric Data: Background and IllustratedGuidelinesfor Survey Managers
No. 102 van de Walle, Ravallion, and Gautam, How Well Does the Social Safety Net Work? TheIncidence of Cash Benefits in Hungary, 1987-89
No. 103 Benefo and Schultz, Determinants of Fertility and Child Mortality in Cote d'lvoire and Ghana
No. 104 Behrman and Lavy, Children's Health and Achievement in School
No. 105 Lavy and Germain, Quality and Cost in Health Care Choice in Developing Countries
No. 106 Lavy, Strauss, Thomas, and De Vreyer, The Impact of the Quality of Health Care on Children'sNutrition and Survival in Ghana
No. 107 Hanushek and Lavy, School Quality, Achievement Bias, and Dropout Behavior in Egypt
No. 108 Feyisetan and Ainsworth, Contraceptive Use and the Quality, Price, and Availability ofFamily Planning in Nigeria
No. 109 Thomas and Maluccio, Contraceptive Choice, Fertility, and Public Policy in Zimbabwe
No. 110 Ainsworth, Beegle, and Nyamete, The Impact of Female Schooling on Fertility andContraceptive Use: A Study of Fourteen Sub-Saharan Countries
No. 111 Oliver, Contraceptive Use in Ghana: The Role of Service Availability, Quality, and Price
No. 112 Montgomery, Kouame, and Oliver, The Tradeoff between Number of Children and Child Schooling:Evidence from Cote d'lvoire and Ghana
No. 113 Menno Pradhan, Sector Participation Decisions in Labor Supply Models
No. 114 Kathleen Beegle, The Quality and Availability of Family Planning Services and Contraceptive Use inTanzania

THE WORLD BANKA partner in strengthening economiesand expanding marketsto improve the quality of lifefor people everywhere,especially the poorest
0~
EDC 1
ac~~~~~ - q~~~~~~(2O2)~~3 392 eIex~~~~~~~~~~ 64145~~~AGIGPAT
w~~~~~~~~~~~~~ 0


![[Demographic analysis of illiteracy in Iran] L'analyse demographique de l'analphabetisme en Iran](https://img.pdfslide.net/doc/110x75/6331f4db8d2c463a5800a317/demographic-analysis-of-illiteracy-in-iran-lanalyse-demographique-de-lanalphabetisme.jpg)


