Embed Size (px)
Citation preview
Chapter 13
Petrogenesis of the Campanian Ignimbrite: implications forcrystal-melt separation and open-system processes from majorand trace elements and Th isotopic data
Wendy A. Bohrsona,∗, Frank J. Sperab, Sarah J. Fowlerc, Harvey E. Belkind,Benedetto De Vivoe and Giuseppe Rolandie
aDepartment of Geological Sciences, Central Washington University, Ellensburg, WA, 98926, USAbDepartment of Earth Science and Institute for Crustal Studies, University of California, Santa Barbara,93106, USAcDepartment of Earth Sciences, University of California, Santa Barbara, 93106, USAd956 National Center, U.S. Geological Survey, Reston, VA 20192, USAeDipartimento di Scienze della Terra, Università di Napoli Federico II, 80134 Napoli, Italy
Abstract
The Campanian Ignimbrite is a large-volume trachytic to phonolitic ignimbrite that was deposited at ~39.3 ka andrepresents one of a number of highly explosive volcanic events that have occurred in the region near Naples, Italy.Thermodynamic modeling using the MELTS algorithm reveals that major element variations are dominated bycrystal–liquid separation at 0.15 GPa. Initial dissolved H2O content in the parental melt is ~3 wt.% and the mag-matic system fugacity of oxygen was buffered along QFM�1. Significantly, MELTS results also indicate that theliquid line of descent is marked by a large change in the proportion of melt (from 0.46 to 0.09) at ~884°C, whichleads to a discontinuity in melt composition (i.e., a compositional gap) and different thermodynamic and transportproperties of melt and magma across the gap. Crystallization of alkali feldspar and plagioclase dominates the phaseassemblage at this pseudo-invariant point temperature of ~884°C. Evaluation of the variations in the trace elementsZr, Nb, Th, U, Rb, Sm, and Sr using a mass balance equation that accounts for changing bulk mineral–melt parti-tion coefficients as crystallization occurs indicates that crystal–liquid separation and open-system processes wereimportant. Th isotope data yield an apparent isochron that is ~20 kyr younger than the age of the deposit, and age-corrected Th isotope data indicate that the magma body was an open system at the time of eruption. Because open-system behavior can profoundly change isotopic and elemental characteristics of a magma body, these Th resultsillustrate that it is critical to understand the contribution that open-system processes make to magmatic systemsprior to assigning relevance to age or timescale information derived from such systems. Fluid–magma interactionhas been proposed as a mechanism to change isotopic and elemental characteristics of magma bodies, but an eval-uation of the mass and thermal constraints on such a process suggests large-scale interaction is unlikely. In the caseof the magma body associated with the Campanian Ignimbrite, the most likely source of the open-system signa-tures is assimilation of partial melts of compositionally heterogeneous basement composed of cumulates and intru-sive equivalents of volcanic activity that has characterized the Campanian region for over 300 kyr.
1. Introduction
The recognition that chemical and physical gradients preserved in ignimbrites yield insightinto pre-eruptive magma dynamics (e.g., Hildreth, 1979; Smith, 1979) has profoundly
Volcanism in the Campania Plain:Vesuvius, Campi Flegrei and Ignimbritesedited by B. De Vivo© 2006 Elsevier B.V. All rights reserved. 249
∗Corresponding author. E-mail address: [email protected] (W.A. Bohrson).
Else_DV-DEVIVO_ch013.qxd 4/17/2006 5:55 PM Page 249
influenced the understanding of crustal magmatism. Studies during the last 25 years haverevealed that, while the concept of reconstructing magma bodies from information aboutdeposits is of fundamental value, significant challenges of interpretation are introduced bythe dynamics of eruption (e.g., Spera, 1984; Wilson and Hildreth, 1997) as well as thepanoply of mechanisms by which melt, exsolved volatile bubbles and crystals form, mixand unmix (e.g., Smith and Bailey, 1966; Hildreth, 1981; Worner and Schmincke, 1984a,b;Bacon and Druitt, 1988). Accurate reconstruction of the pre-eruptive structure of the mag-matic plumbing system depends upon integration of field data, multi-scale petrological andgeochemical studies of the full range of erupted products, and theoretical modeling. Also,a comprehensive understanding of the processes responsible for generating the physical andchemical gradients requires an approach that blends descriptive and quantitative constraints.
Although significant progress has been made toward a holistic understanding of howlarge-volume, intermediate to silicic composition crustal reservoirs form, two fundamen-tal questions remain especially controversial: What processes quantitatively contribute tothe major and trace element and isotopic heterogeneity of volcanic products of these largevolume eruptions? And over what timescales do the associated magma bodies form and/orcoalesce? The answers to these questions are different for different systems, but a detailedanalysis that incorporates thermal, chemical, and mass constraints for each system is pre-requisite for making generalized observations about the behavior of magmatic systems.
In this contribution, we highlight the impact that crystal–liquid separation has on meltcompositional evolution and particularly focus on trace element and Th isotope evidencefor open-system processes in the magma body associated with the Campanian Ignimbrite(CI), a large-volume pyroclastic deposit that outcrops in the vicinity of the densely popu-lated city of Naples, Italy. This ~39.3 ka eruption is one of a number of explosive eruptionsdocumented in the Campanian magmatic province, with the oldest dated at �300 ka (De Vivo et al., 2001). Thus, understanding the dynamics of the magma body associatedwith the CI, which is the largest identified eruption in the Mediterranean in the last 200kyr (Barberi et al., 1978), will lend perspective to a much longer history of violent,destructive eruptions that have occurred over timescales of at least 3 � 105 years. Ourinterpretations, which build on previous contributions (e.g., Fisher et al., 1993; Orsi et al.,1996; Civetta et al., 1997; Signorelli et al., 1999; De Vivo et al., 2001; Pappalardo et al.,2002; Rolandi et al., 2003), utilize thermodynamic and quantitative mass balance model-ing of major and trace element data and semi-quantitative limits on Th and Sr isotopes toevaluate the role of crystal-melt separation, magma-fluid interaction, and assimilation ofwall rock on the geochemical evolution of the CI. We find that the major element trendsin the CI are dominated by crystal-melt separation. Based on results of detailed MELTScalculations (Ghiorso and Sack, 1995), we provide strong evidence for a dramatic episodeof multi-phase crystallization, in which, over a very small temperature interval centeredaround 884°C, the proportion of residual melt in the system changes from ~0.46 to 0.09.The behavior of trace elements in the system is quantitatively evaluated using the majorelement results. One of the significant conclusions that emerges is that dramatic changesin phase assemblage that occur during isobaric fractionation yield large variations in bulkmineral–melt partition coefficients (bulk Ksm) over very small temperature intervals.Quantitative assessment of trace element concentrations using a mass balance equationthat properly accounts for changing bulk Ksm demonstrates the profound control solid-meltpartitioning can have on trace element evolution as well as the challenges of interpretation
250 W.A. Bohrson et al.
Else_DV-DEVIVO_ch013.qxd 4/17/2006 5:55 PM Page 250
(e.g., whether trace elements have been impacted by open-system processes or not) thatemerge because, in some cases, published trace element mineral–melt partition coeffi-cients (mineral–melt Ksm) vary significantly within a small compositional range. New Thisotope data, coupled with an evaluation of published Sr isotope data (Civetta et al., 1997),reveal evidence for open-system processes that most likely involve complex interactionbetween magma and intrusive equivalents of Campanian volcanics and/or cumulatesformed in association with Campanian magmatism.
2. Previous work
2.1. Regional geology
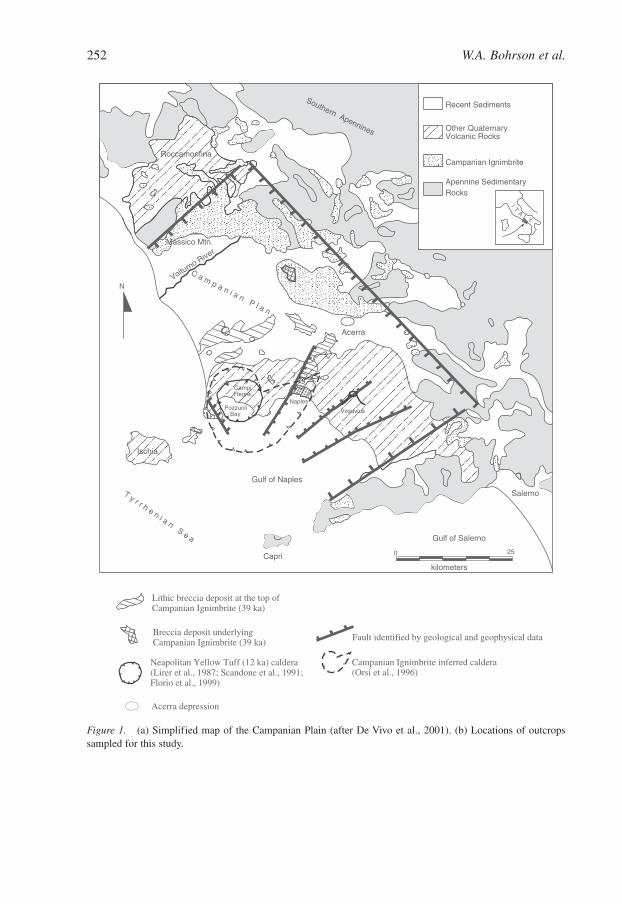
The Campanian Plain is a region of southern Italy that encompasses the Phlegrean Fields(Campi Flegrei – burning fields), which is located west of Naples (Fig. 1a). The plain isstructurally located within a graben formed in Mesozoic carbonate of the southern ApennineMountains, which border the plain on the east and north. The graben formed during thePliocene as a consequence of extension that occurred along the western margin of theApennine chain, resulting in subsidence along the Tyrrhenian coast (Rosi and Sbrana, 1987;Scandone et al., 1991). The Phlegrean Fields are characterized by a long history of magma-tism dating back to at least 300 ka, based on Ar/Ar ages of xenocrystic sanidine identified inpyroclastic material sampled in the Campanian Plain (De Vivo et al., 2001). This region ofsouthern Italy is famous not only for eruptions in the Phlegrean Fields, including the mostrecent eruption of Monte Nuovo in 1538 AD, but also for the famed 79 AD eruption ofVesuvius that destroyed the villages of Pompeii and Herculaneum. Vesuvius most recentlyerupted in 1944 AD. The volcanology of the Naples area has been of interest for centuries,particularly because of the vivid descriptions of the 79 AD eruption of Vesuvius by Pliny theYounger. Continued scrutiny of the volcanology and petrology of this area is warranted bythe potentially lethal combination of eruption from either the Phlegrean Fields or Vesuvius,coupled with the densely populated, highly urbanized areas in and around Naples; this com-bination presents significant challenges for volcanic hazard mitigation.
2.2. Volcanology and geochronology of the Campanian Ignimbrite
The Campanian Ignimbrite, a large-volume (~150 km3, Civetta et al., 1997, to ~200 km3
DRE, Rolandi et al., 2003) trachytic-phonolitic ignimbrite, was originally distributed over~30,000 km2 in and around Naples, Italy (Fisher et al., 1993). While previous ages for theCI have been reported at ~37 ka (e.g., Deino et al., 1992, 1994), more recently, the deposithas been precisely dated at 39.28�0.11 ka by incremental heating and total fusion 40Ar/39Argeochronology (De Vivo et al., 2001). This age represents the weighted mean of results from18 alkali feldspar separates derived from representative units within the CI from a varietyof geographic locations. Based on the detailed work of De Vivo et al. (2001), the CI is com-posed of up to five physically distinct units. The gray tuff unit of the CI grades upward intoa yellow tuff, the color of which reflects secondary mineralization by zeolites. In severalsections throughout the Campanian Plain, the gray tuff is overlain by a lithic breccia thatgrades upward into either a weakly stratified yellow tuff and/or an incoherent pyroclastic
Petrogenesis of the Campanian Ignimbrite 251
Else_DV-DEVIVO_ch013.qxd 4/17/2006 5:55 PM Page 251
252 W.A. Bohrson et al.
Lithic breccia deposit at the top of Campanian Ignimbrite (39 ka)
Breccia deposit underlyingCampanian Ignimbrite (39 ka) Fault identified by geological and geophysical data
Acerra depression
0 25
kilometers
IT
AL Y
Recent Sediments
Other QuaternaryVolcanic Rocks
Campanian Ignimbrite
Apennine SedimentaryRocks
seninnepAnrehtuoS
Roccamonfina
Ischia
Gulf of Naples
Capri
T y r r h e n i a n S e a Gulf of Salerno
Salerno
Naples
Vesuvius
N
78
reviRonrutloV
Massico Mtn.
CampiFlegrei
Acerra
Neapolitan Yellow Tuff (12 ka) caldera(Lirer et al., 1987; Scandone et al., 1991; Florio et al., 1999)
PozzuoliBay
Campanian Ignimbrite inferred caldera(Orsi et al., 1996)
C a m p a n i a n P l a n
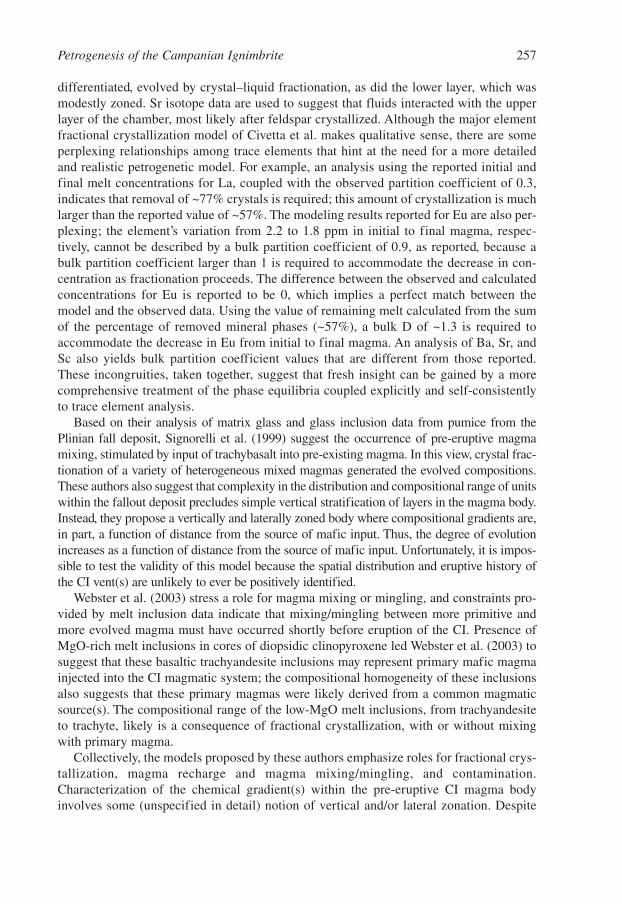
Figure 1. (a) Simplified map of the Campanian Plain (after De Vivo et al., 2001). (b) Locations of outcropssampled for this study.
Else_DV-DEVIVO_ch013.qxd 4/17/2006 5:55 PM Page 252
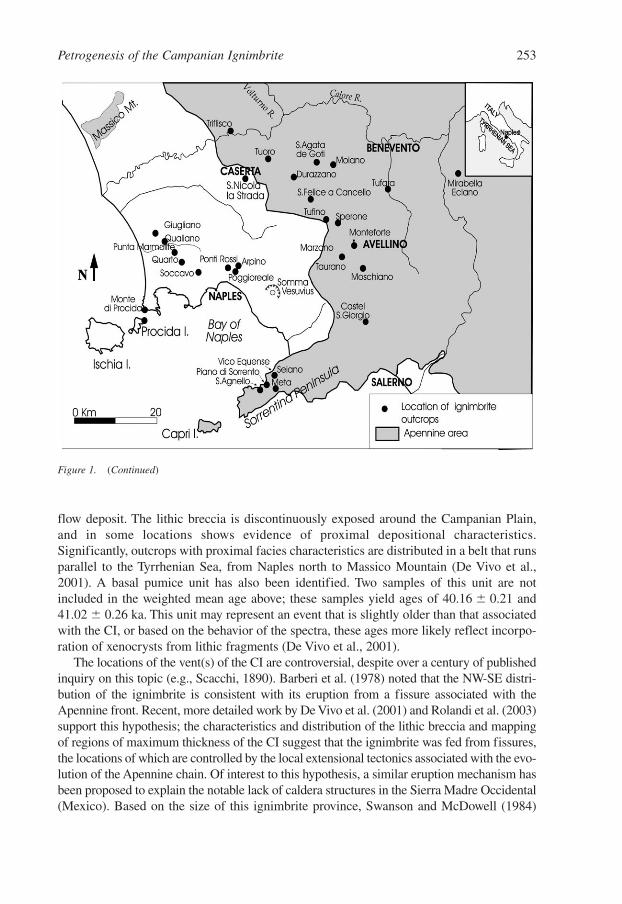
flow deposit. The lithic breccia is discontinuously exposed around the Campanian Plain,and in some locations shows evidence of proximal depositional characteristics.Significantly, outcrops with proximal facies characteristics are distributed in a belt that runsparallel to the Tyrrhenian Sea, from Naples north to Massico Mountain (De Vivo et al.,2001). A basal pumice unit has also been identified. Two samples of this unit are notincluded in the weighted mean age above; these samples yield ages of 40.16 � 0.21 and41.02 � 0.26 ka. This unit may represent an event that is slightly older than that associatedwith the CI, or based on the behavior of the spectra, these ages more likely reflect incorpo-ration of xenocrysts from lithic fragments (De Vivo et al., 2001).
The locations of the vent(s) of the CI are controversial, despite over a century of publishedinquiry on this topic (e.g., Scacchi, 1890). Barberi et al. (1978) noted that the NW-SE distri-bution of the ignimbrite is consistent with its eruption from a fissure associated with theApennine front. Recent, more detailed work by De Vivo et al. (2001) and Rolandi et al. (2003)support this hypothesis; the characteristics and distribution of the lithic breccia and mappingof regions of maximum thickness of the CI suggest that the ignimbrite was fed from fissures,the locations of which are controlled by the local extensional tectonics associated with the evo-lution of the Apennine chain. Of interest to this hypothesis, a similar eruption mechanism hasbeen proposed to explain the notable lack of caldera structures in the Sierra Madre Occidental(Mexico). Based on the size of this ignimbrite province, Swanson and McDowell (1984)
Petrogenesis of the Campanian Ignimbrite 253
Figure 1. (Continued)
Else_DV-DEVIVO_ch013.qxd 4/17/2006 5:55 PM Page 253
estimate that 350 calderas equivalent in size to those found in the San Juan volcanic fieldwould be required to accommodate the volume of erupted material, and yet, analysis byAguirre-Díaz and Labarthe-Hernández (2003) indicates that fewer than 15 calderas have beenidentified. Aguirre-Díaz and Labarthe-Hernández (2003) propose that faults associated withBasin and Range extension acted as conduits through which large volumes of magma wereexplosively erupted. As part of the evidence cited in support of this hypothesis, the authorsidentify elongate patterns of co-ignimbrite lithic-lag breccia exposed adjacent to Basin andRange faults; such features are not unlike those in the Campanian region alluded to above.
An alternative hypothesis for the source of the CI is the Campi Flegrei caldera. Citingthe distribution of the Breccia Museo, a lithic breccia interpreted to be associated witheruption of the CI, on opposite sides of a 12 km caldera, and evidence from drilling data,Rosi et al. (1983) suggest that eruption of the CI was associated with formation of acaldera. Later work by Rosi et al. (1996) used the distribution of proximal deposits of theCI to infer the location of the caldera, including specific locations for fault scarps formedupon collapse. Reconstruction of the size of the hypothesized caldera, coupled with anestimate of 700 m for average down drop, yields a collapse volume of 160 km3, whichaccords well with the estimate of 150 km3 for the CI by Civetta et al. (1997) and 200 km3
by Rolandi et al. (2003), but is much larger than an earlier estimate of 80 km3 (Rosi et al.,1983; De Natale et al., 1991). Fisher et al. (1993) report anisotropy of magnetic suscepti-bility (AMS) measurements for samples from the CI that suggest the pyroclastic currentflowed radially outward from the Phlegrean Fields area. Although this contribution doesnot explicitly address the source of the CI, these data have been cited as support for asource within the Campi Flegrei area (e.g., Civetta et al., 1997). Further AMS work (Ortet al., 1999) suggest that eruptions of Piperno Tuff were fed by a central vent north ofPozzuoli (Fig. 1a), and tuffs that underlie the Breccia Museo may be related to eruptionsfrom ring vents located on the northern and southern caldera margins. Rosi et al. (1996)note that all post-CI vents are located within the hypothesized caldera, but De Vivo et al.(2001) identify a unit located at Giugliano, 13 km outside of the identified caldera, withan age of 18.05�0.43 ka. Gravity and magnetic data provide supporting evidence for aring structure in the Campi Flegrei area (Lirer et al., 1987; Scandone et al., 1991; Florioet al., 1999), but the associated eruptive event is still controversial; some attribute thestructure to collapse associated with eruption of the Neapolitan Yellow Tuff (~12 ka, Lireret al., 1987), whereas others attribute the caldera to eruption of the CI (Rosi et al., 1983).Another interpretation is that the depression is a nested caldera structure that formed inresponse to both eruptions (e.g., Orsi et al., 1996).
The Campanian Plain and Phlegrean Fields regions reflect a complex, integrated his-tory of tectonic activity coupled with over 300 kyr of volcanism. Challenges presented bythis complexity are exacerbated by exposure; many areas that may be critical to the inter-pretation of source are either covered by younger deposits and/or masked by intense urban-ization. Resolution of the source controversy will require continued integratedvolcanological, petrological, and geophysical studies.
2.3. Petrology and geochemistry of the Campanian Ignimbrite
The CI is a heterogeneous unit dominated by the compositional range phonolite to trachyte.Previously published ranges of major elements of single and composite pumice and glass
254 W.A. Bohrson et al.
Else_DV-DEVIVO_ch013.qxd 4/17/2006 5:55 PM Page 254
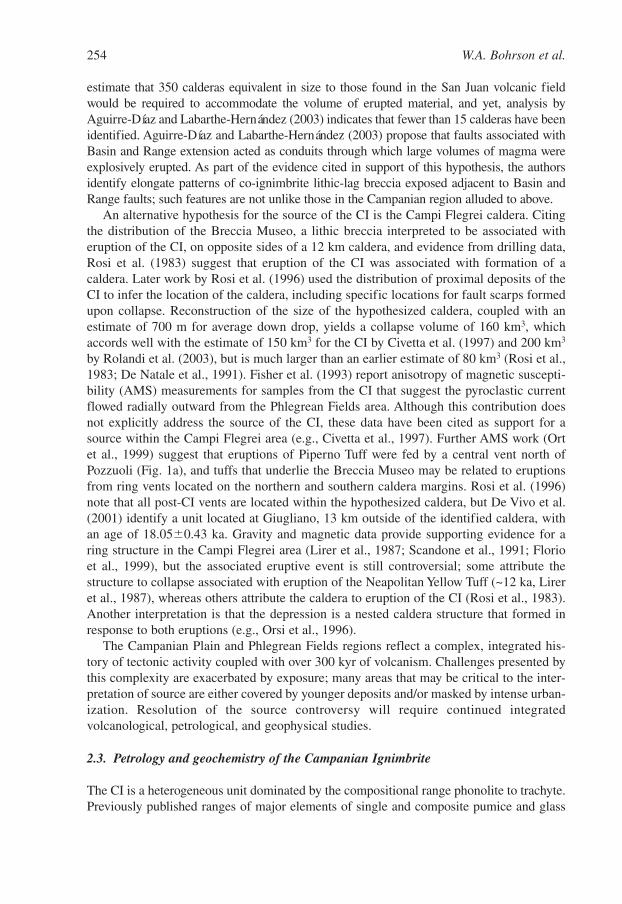
from the ignimbrite include SiO2 from 55.3 to 62.0 wt.% and MgO from 0.3 to 1.5 wt.%(Civetta et al., 1997; Pappalardo et al., 2002). A smaller number of samples of basal pumice,which is interpreted to represent Plinian fallout, has slightly higher SiO2 concentrations, upto 62.4% (Signorelli et al., 1999). Matrix glass and glass inclusions from the basal pumicehave SiO2 and MgO (Signorelli et al., 1999) within the ranges cited above for pumice andglass from the ignimbrite. Average compositions of melt inclusions in clinopyroxenes froma subset of samples presented in this study, analyzed by Webster et al. (2003), extend therange of SiO2 and MgO; those denoted as low-MgO melt inclusions have average SiO2 andMgO of 57.8 and 2.9 wt.%, respectively, whereas high-MgO melt inclusions have 51.0 and7.6 wt.%. Associated total alkalies for these melt inclusions extend the compositional rangeof melts of the CI event to basaltic trachyandesite (Fig. 2a). The highly alkaline nature ofpumice and glass of the CI is further illustrated by K2O and Na2O concentrations of 5.2 to9.9 and 2.0 to 6.6 wt.%, respectively, among pumice, glass inclusions, and matrix glass(Civetta et al., 1997; Signorelli et al., 1999; Pappalardo et al., 2002; Webster et al., 2003).
Trace elements display a range of concentrations within the CI and its associated fall-out deposit. For example, Sr varies from 17 to 777 ppm and Ba from 17 to 1111 ppm, andboth show negative correlation with SiO2. In contrast, elements such as Zr, Rb, and Sm,are positively correlated with SiO2, and also display marked ranges in concentration(Civetta et al., 1997; Pappalardo et al., 2002).
Analysis of pumice, glass, and feldspar separates yield distinct Sr isotope values(Civetta et al., 1997; Pappalardo et al., 2002). 87Sr/86Sr of pumice ranges from 0.70728 to0.70746, with the isotopic ratio of associated glass typically within �0.00002 of pumice.In contrast, most feldspar 87Sr/86Sr are less radiogenic than pumice and are characterizedby a relatively narrow Sr isotope range from 0.70730 to 0.70734 (Civetta et al., 1997).Exceptions to this range include one feldspar that has 87Sr/86Sr of 0.70741 and is less radi-ogenic than its host pumice/glass, and one feldspar that has 87Sr/86Sr of 0.70748 and ismore radiogenic than its associated pumice.
The phenocryst assemblage of the CI is dominated by sanidine and includes clinopy-roxene, plagioclase, biotite, apatite, and spinel. Sanidine compositions range from Or58 toOr87, and no zoning was detected within individual crystals (Civetta et al., 1997;Pappalardo et al., 2002). Plagioclase compositions vary widely, from An90 to An25, and likesanidine, most crystals are compositionally homogeneous from core to rim (Civetta et al.,1997; Pappalardo et al., 2002). Clinopyroxene ranges from diopside to salite (Civetta et al.,1997; Webster et al., 2003), and detailed work by Webster et al. (2003) demonstrates thatmost clinopyroxene crystals are zoned, with higher MgO in the core. These authors notethat the transition from higher to lower MgO is abrupt. Civetta et al. (1997) note that diop-side is relatively rare in the clinopyroxene they analyzed, and the rims tend to be corroded.
Based on a variety of data, including those cited above, Civetta et al. (1997), Signorelliet al. (1999), Pappalardo et al. (2002), and Webster et al. (2003) propose models for thestructure and petrogenetic evolution of the CI magma chamber. In this section, we brieflyhighlight ideas relevant to our study. Civetta et al. (1997) and Signorelli et al. (1999)hypothesize that the magma body was composed of two compositionally distinct layers ofmagma, separated by a compositional gap. Both contributions cite eruption dynamics andvariable timing and extent of mixing between these two distinct layers to explain the geo-chemistry, petrology, and spatial and temporal distribution of compositionally distinctunits. The upper layer, which is regarded as compositionally homogeneous and more
Petrogenesis of the Campanian Ignimbrite 255
Else_DV-DEVIVO_ch013.qxd 4/17/2006 5:55 PM Page 255
256 W.A. Bohrson et al.
Figure 2. (a) Alkali–silica diagram using classification scheme of Le Maitre et al. (1989). Symbols are shown inlegend. High-MgO melt inclusions of Webster et al. (2003) are dominantly basaltic trachyandesite and low-MgO meltinclusions are mostly trachyandesite to trachyte. Samples containing the clinopyroxene-hosted melt inclusions fromthe Webster et al. (2003) study are a subset of samples presented in this work. Most samples of the CI are trachyte tophonolite. Some samples, denoted as the yellow tuff unit, show depletions in alkalies. In addition to data from thisstudy, also included are glass and pumice data from Civetta et al. (1997), and melt inclusion and glass data fromSignorelli et al. (1999). (b) Alkalies–silica diagram with result of the best-fit MELTS model shown for comparison.Best-fit MELTS calculation was run in increments of 0.5°C, and therefore each black square represents a tempera-ture decrease of 0.5°C. The MELTS curve is annotated with temperatures, including the MELTS-predicted composi-tional gap between 884 and 883°C. Note that MI data from Signorelli et al. (1999) and Webster et al. (2003) are notexpected to lie on the predicted liquid line of descent due to post-entrapment crystallization. See text for discussion.
Else_DV-DEVIVO_ch013.qxd 4/17/2006 5:55 PM Page 256
differentiated, evolved by crystal–liquid fractionation, as did the lower layer, which wasmodestly zoned. Sr isotope data are used to suggest that fluids interacted with the upperlayer of the chamber, most likely after feldspar crystallized. Although the major elementfractional crystallization model of Civetta et al. makes qualitative sense, there are someperplexing relationships among trace elements that hint at the need for a more detailedand realistic petrogenetic model. For example, an analysis using the reported initial andfinal melt concentrations for La, coupled with the observed partition coefficient of 0.3,indicates that removal of ~77% crystals is required; this amount of crystallization is muchlarger than the reported value of ~57%. The modeling results reported for Eu are also per-plexing; the element’s variation from 2.2 to 1.8 ppm in initial to final magma, respec-tively, cannot be described by a bulk partition coefficient of 0.9, as reported, because abulk partition coefficient larger than 1 is required to accommodate the decrease in con-centration as fractionation proceeds. The difference between the observed and calculatedconcentrations for Eu is reported to be 0, which implies a perfect match between themodel and the observed data. Using the value of remaining melt calculated from the sumof the percentage of removed mineral phases (~57%), a bulk D of ~1.3 is required toaccommodate the decrease in Eu from initial to final magma. An analysis of Ba, Sr, andSc also yields bulk partition coefficient values that are different from those reported.These incongruities, taken together, suggest that fresh insight can be gained by a morecomprehensive treatment of the phase equilibria coupled explicitly and self-consistentlyto trace element analysis.
Based on their analysis of matrix glass and glass inclusion data from pumice from thePlinian fall deposit, Signorelli et al. (1999) suggest the occurrence of pre-eruptive magmamixing, stimulated by input of trachybasalt into pre-existing magma. In this view, crystal frac-tionation of a variety of heterogeneous mixed magmas generated the evolved compositions.These authors also suggest that complexity in the distribution and compositional range of unitswithin the fallout deposit precludes simple vertical stratification of layers in the magma body.Instead, they propose a vertically and laterally zoned body where compositional gradients are,in part, a function of distance from the source of mafic input. Thus, the degree of evolutionincreases as a function of distance from the source of mafic input. Unfortunately, it is impos-sible to test the validity of this model because the spatial distribution and eruptive history ofthe CI vent(s) are unlikely to ever be positively identified.
Webster et al. (2003) stress a role for magma mixing or mingling, and constraints pro-vided by melt inclusion data indicate that mixing/mingling between more primitive andmore evolved magma must have occurred shortly before eruption of the CI. Presence ofMgO-rich melt inclusions in cores of diopsidic clinopyroxene led Webster et al. (2003) tosuggest that these basaltic trachyandesite inclusions may represent primary mafic magmainjected into the CI magmatic system; the compositional homogeneity of these inclusionsalso suggests that these primary magmas were likely derived from a common magmaticsource(s). The compositional range of the low-MgO melt inclusions, from trachyandesiteto trachyte, likely is a consequence of fractional crystallization, with or without mixingwith primary magma.
Collectively, the models proposed by these authors emphasize roles for fractional crys-tallization, magma recharge and magma mixing/mingling, and contamination.Characterization of the chemical gradient(s) within the pre-eruptive CI magma bodyinvolves some (unspecified in detail) notion of vertical and/or lateral zonation. Despite
Petrogenesis of the Campanian Ignimbrite 257
Else_DV-DEVIVO_ch013.qxd 4/17/2006 5:55 PM Page 257
these commonalities, central questions emerge from the earlier studies. These includequantitative analysis of the roles that crystal-melt separation, magma recharge andmagma mixing/mingling, and crustal assimilation have in the evolution of the CI magmabody, the relative timing of these processes as the magma body evolves, and the pre-erup-tive structure of the magma plumbing system. The goal of our work is to quantify theaforementioned processes to the extent possible based on current descriptive knowledgeof the products of the CI eruption. The current study is a preliminary examination of theseissues; further details are presented elsewhere (Bohrson et al., in preparation; Fowler et al., submitted to Journal of Petrology).
3. Methods
One hundred and twenty-five samples of the CI were obtained from approximately 30localities throughout the Campanian Plain (Fig. 1b). Based on the work of De Vivo et al.(2001), each sample was recovered from one of the five distinct units (gray tuff, yellowtuff, incoherent unit, lithic breccia, and basal pumice) of the CI sensu lato. Sample typesinclude bulk pumice or bulk rock (which includes pumice plus matrix or matrix alone).
3.1. Analytical methods for major and trace element data
Major, minor, and trace elements were determined either by the U.S. Geological SurveyLaboratories (Reston, VA and Denver, CO) or by Activation Laboratories (Ancaster, Ontario,CA). Before grinding, bulk tuff and pumice samples were examined and any alteration wasremoved; the sample was then washed in deionized water. Grinding and powdering weredone with either mild steel or alumina disks. Major element oxides were determined in rep-resentative aliquots by WD-XRF after fusion with lithium metaborate/tetraborate. Trace ele-ments were determined by three methods. (1) Inductively coupled plasma-mass spectrometry(ICP-MS) and inductively coupled plasma-atomic emission spectrometry (ICP-AES) weredone on solutions using a lithium metaborate/tetraborate fusion procedure before sampledissolution with multiple acids; (2) pressed power pellets were exposed to the appropriateX-rays necessary to fluoresce the element of interest using EDXRF, and (3) standard instru-mental neutron activation analysis (INAA) technique after irradiation in the USGS “TRIGA”reactor. FeO was determined by titration, total sulfur reported as SO3 was determined bycombustion/infrared spectroscopy, Cl by selective ion electrode or INAA, F by selectiveion electrode, LOI and H2O�/� by gravimetric techniques, and CO2 by infrared or col-orimetric titration.
3.2. Calculation of parental melt composition and major element phase equilibria modeling
The motivation for applying detailed major element phase equilibria models is to have theability to compare observed abundances with predictions based on closed-system crystal-melt separation. Differences between predictions and observations then shed light on issuesincluding not only the role of crystal-melt separation, but also the role of assimilation of
258 W.A. Bohrson et al.
Else_DV-DEVIVO_ch013.qxd 4/17/2006 5:55 PM Page 258
hydrothermally altered wall rock, lower crustal xenoliths, and/or meteoric fluids, the role ofmagma addition and mixing during recharge, as well the influence of mixing during highReynolds number magma withdrawal. Below, the methods used to reconstruct the parentalmelt composition, and an overview of the phase equilibria model (i.e., the MELTS algo-rithm) are described.
3.2.1. Selection of parental melt composition
Basaltic rocks that may correspond to CI parental compositions have not been identifiedin the Campanian Plain region; however, Webster et al. (2003) identified glass inclusionsentrapped within host clinopyroxene phenocrysts, which are hereafter referred to asWebster Melt Inclusions (WMI). WMI VE1#3 from the high-MgO MI group is represen-tative of the least-evolved MI from this group and was therefore used as the basis for theparental melt composition. This sample was chosen, in part, because its incompatible traceelement concentrations are lower than those of other high-MgO WMI from minimally deu-terically altered CI units (i.e., gray tuff, lithic breccia, and incoherent tuff). In particular,the concentrations of incompatible trace elements such as Ce, Th, and U are generallylower in sample VE1#3 than in other high-MgO WMI. While we recognize that the high-MgO inclusions have a range of compositions, we note that using a different WMI sampleas the basis for the parental melt composition does not alter the main conclusions of thepetrologic interpretations presented in later sections of the paper.
As noted by Watson (1976), reaction between trapped melt inclusions and their hostcrystals is generally expected. Because the high-MgO WMI are found within clinopyrox-ene phenocrysts, the effects of post-entrapment crystallization on the composition ofsample VE1#3 were accounted for by addition of clinopyroxene. Reconstruction of themajor element composition of the parental melt (RPM) is based on the mass balance rela-tion y P�i � (1�y) MIi� � RPMi�� , using the major element compositions of WMI sampleVE1#3 (MIi� ) and host pyroxene composition (PP�i) that corresponds to that of the WMI hostcrystal in sample VE1 (Webster et al., 2003; Table 1). The value of y, which is the extentof post-entrapment crystallization, was set to 0.2. We also used the method proposed byKress and Ghiorso (2004) and found a similar result. Major element data for WMI VE1#3and its clinopyroxene host, as well as the (hydrous) reconstructed parental CI melt (RPM)used as the initial condition in the MELTS isobaric simulations are given in Table 1. Alsoprovided are the anhydrous reconstructed parental melt composition and the recon-structed concentrations for the trace elements, which are based on the measured abun-dances in MI VE1#3.
Petrogenesis of the Campanian Ignimbrite 259
Table 1a. Major element data for melt inclusion and host clinopyroxene used in reconstruction ofparental melt.
Oxide wt.% SiO2 TiO2 Al2O3 FeO MgO MnO CaO K2O Na2O P2O5
VE1 52.49 0.37 2.13 3.96 16.48 0.12 24.28 0 0.17 0Host cpxVE1#3 52.78 1.03 14.53 5.82 7.82 0.07 9.88 5.16 2.07 0.84MI
Else_DV-DEVIVO_ch013.qxd 4/17/2006 5:55 PM Page 259
3.2.2. MELTS modeling
To calculate phase relations and major element variation diagrams, we used the MELTSalgorithm (Ghiorso and Sack, 1995), which is a self-consistent, thermodynamic model ofcrystal-melt equilibria in which the system undergoes perfect separation of crystals fromliquid. At specified pressure, temperature, and parental melt major element composition,the identity, composition, and proportion of phases in the multicomponent-multiphasesystem are computed in response to the extraction of enthalpy, both sensible and latent,from parental melt.
To carry out the MELTS calculations, constraints on the system’s oxygen fugacity,pressure, and initial (dissolved) parental melt H2O content are needed. In order to deter-mine the best-fit parameters for the CI magmatic system, over 100 MELTS simulationswere carried out over a grid of oxygen fugacity, pressure, and water content. The qualityof the MELTS results was evaluated by comparison between the predicted liquid line ofdescent, phase compositions, and observed data. MELTS also predicts phase proportions,but we have not used these as a criterion because differential physical separation effectsimpact observed modal abundances. The density of fractionating phases varies widely,and both pre-eruptive and eruptive physical separation of crystals is expected and diffi-cult to account for.
3.3. Trace element modeling
Based on the results of the phase equilibria calculations, it is possible to forward model theconcentration of trace elements during the course of isobaric fractional crystallization.Deviations between calculated and observed compositions afford the possibility to betterunderstand petrological processes controlling the magmatic evolution of the Campanian sys-tem. The starting point of a trace element assessment is the differential expression governingthe concentration of a trace element in the melt as a function of the melt fraction during per-fect crystal–liquid separation. For the moment, we ignore possible fractionation of trace ele-ments into coexisting supercritical fluid. Although this assumption is implicitly made inmany trace element studies, it may not always be tenable. The critical parameters governingthe distribution of a trace element between solid-melt and supercritical fluid are the distribu-tion ratio’s Ksm and Ksf (solid-melt and solid-fluid partition coefficients, respectively), and the
260 W.A. Bohrson et al.
Table 1b. Reconstructed parental melt composition used in best-fit MELTS model.
Oxide wt.% SiO2 TiO2 Al2O3 FeO MgO MnO CaO K2O Na2O P2O5 H2O
Anhydrous 52.72 0.9 12.05 5.45 9.55 0.08 12.76 4.13 1.69 0.67 –Hydrous 51.13 0.87 11.69 5.29 9.26 0.08 12.38 4.01 1.64 0.65 3
Trace element (ppm) U Th Rb Sr Zr Nb Sm1.5 3.7 191 363 60 13.4 3
Note: Compositions used in MELTS modeling based on sample VE1#3 (Webster et al., 2003). RecalculatedVE1#3 composition for X � 0.2. See text for discussion.
Else_DV-DEVIVO_ch013.qxd 4/17/2006 5:55 PM Page 260
rate of change of the mass fraction of fluid with respect to the mass fraction of melt duringfractional crystallization. In fact, the distribution of Rb, one of the trace elements used in thisstudy, may be particularly sensitive to the existence of a fluid phase predicted to develop atT ~ 1127°C during isobaric fractional crystallization at 0.15 GPa.
Ignoring the presence of a fluid phase, the well-known Rayleigh distillation mass bal-ance relation in differential form is
� (Ksm�1) (1)
which can be integrated
�Cm
Com
� �fm
1
dfm (2)
Because of the large differences in the instantaneous composition of solids being removedduring fractional crystallization, the assumption that bulk solid-melt partition coefficient(Ksm) is constant is unacceptable. For example, KSr
sm as a function of fraction of melt ( fm (T))calculated using mineral–melt partition coefficients (Table 2) and the proportion of phasesreturned from the MELTS simulation (Fig. 4) is shown in Figure 3. Across the crystalliza-tion interval, bulk K Sr
sm varies by ~100 from the liquidus, where olivine first saturates, downto the near solidus, where plagioclase is present. As another example, bulk Ksm of Th variesby a factor of ~30 over the crystallization interval. Our approach is to determine a priori
(Ksm�1)�
fm
dCm�Cm
Cm�fm
dCm�dfm
Petrogenesis of the Campanian Ignimbrite 261
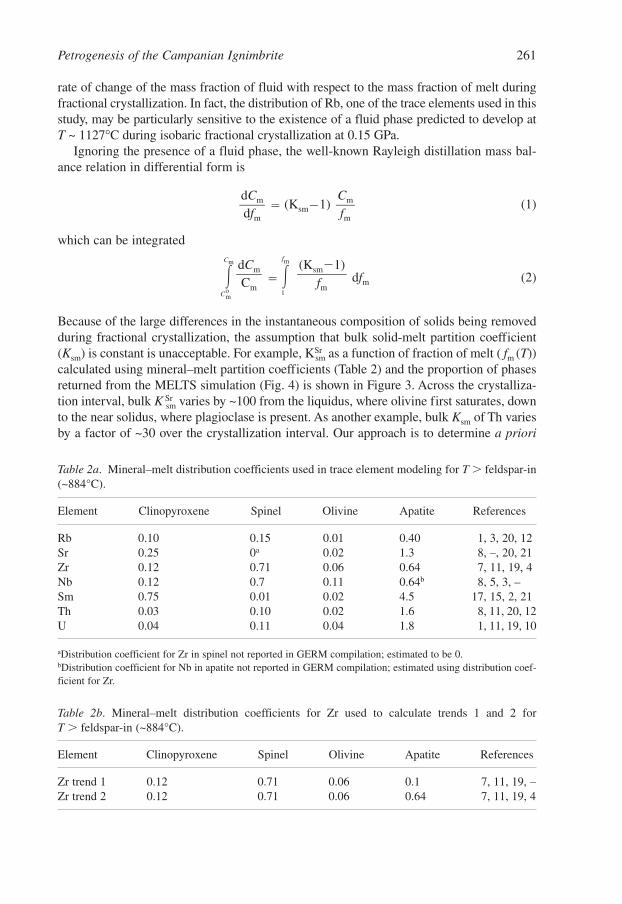
Table 2a. Mineral–melt distribution coefficients used in trace element modeling for T � feldspar-in(~884°C).
Element Clinopyroxene Spinel Olivine Apatite References
Rb 0.10 0.15 0.01 0.40 1, 3, 20, 12Sr 0.25 0a 0.02 1.3 8, –, 20, 21Zr 0.12 0.71 0.06 0.64 7, 11, 19, 4Nb 0.12 0.7 0.11 0.64b 8, 5, 3, –Sm 0.75 0.01 0.02 4.5 17, 15, 2, 21Th 0.03 0.10 0.02 1.6 8, 11, 20, 12U 0.04 0.11 0.04 1.8 1, 11, 19, 10
aDistribution coefficient for Zr in spinel not reported in GERM compilation; estimated to be 0. bDistribution coefficient for Nb in apatite not reported in GERM compilation; estimated using distribution coef-ficient for Zr.
Table 2b. Mineral–melt distribution coefficients for Zr used to calculate trends 1 and 2 for T � feldspar-in (~884°C).
Element Clinopyroxene Spinel Olivine Apatite References
Zr trend 1 0.12 0.71 0.06 0.1 7, 11, 19, – Zr trend 2 0.12 0.71 0.06 0.64 7, 11, 19, 4
Else_DV-DEVIVO_ch013.qxd 4/17/2006 5:55 PM Page 261
262 W.A. Bohrson et al.
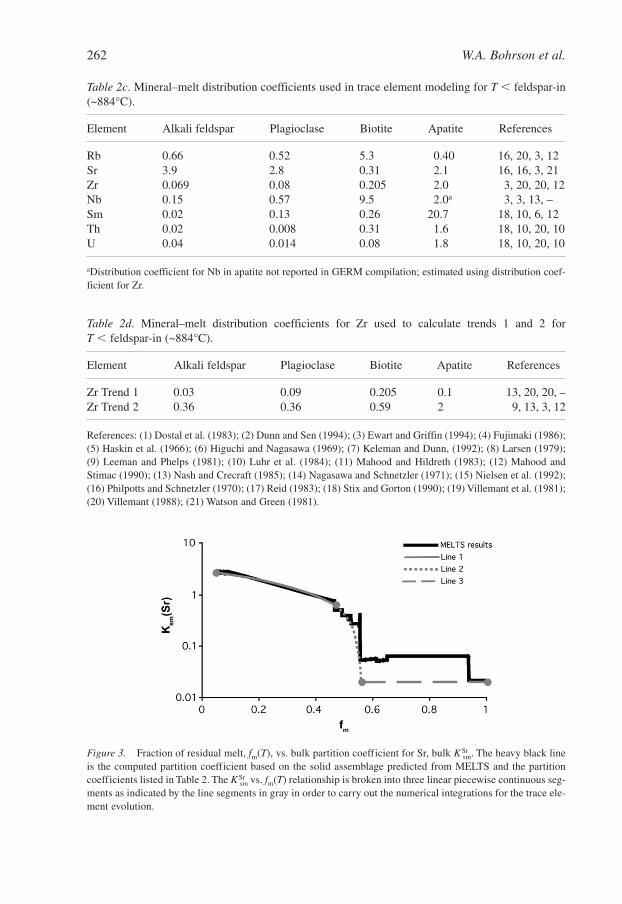
Table 2c. Mineral–melt distribution coefficients used in trace element modeling for T � feldspar-in(~884°C).
Element Alkali feldspar Plagioclase Biotite Apatite References
Rb 0.66 0.52 5.3 0.40 16, 20, 3, 12Sr 3.9 2.8 0.31 2.1 16, 16, 3, 21Zr 0.069 0.08 0.205 2.0 3, 20, 20, 12Nb 0.15 0.57 9.5 2.0a 3, 3, 13, –Sm 0.02 0.13 0.26 20.7 18, 10, 6, 12Th 0.02 0.008 0.31 1.6 18, 10, 20, 10U 0.04 0.014 0.08 1.8 18, 10, 20, 10
aDistribution coefficient for Nb in apatite not reported in GERM compilation; estimated using distribution coef-ficient for Zr.
Table 2d. Mineral–melt distribution coefficients for Zr used to calculate trends 1 and 2 for T � feldspar-in (~884°C).
Element Alkali feldspar Plagioclase Biotite Apatite References
Zr Trend 1 0.03 0.09 0.205 0.1 13, 20, 20, –Zr Trend 2 0.36 0.36 0.59 2 9, 13, 3, 12
References: (1) Dostal et al. (1983); (2) Dunn and Sen (1994); (3) Ewart and Griffin (1994); (4) Fujimaki (1986);(5) Haskin et al. (1966); (6) Higuchi and Nagasawa (1969); (7) Keleman and Dunn, (1992); (8) Larsen (1979);(9) Leeman and Phelps (1981); (10) Luhr et al. (1984); (11) Mahood and Hildreth (1983); (12) Mahood andStimac (1990); (13) Nash and Crecraft (1985); (14) Nagasawa and Schnetzler (1971); (15) Nielsen et al. (1992);(16) Philpotts and Schnetzler (1970); (17) Reid (1983); (18) Stix and Gorton (1990); (19) Villemant et al. (1981);(20) Villemant (1988); (21) Watson and Green (1981).
Figure 3. Fraction of residual melt, fm(T), vs. bulk partition coefficient for Sr, bulk K Srsm. The heavy black line
is the computed partition coefficient based on the solid assemblage predicted from MELTS and the partitioncoefficients listed in Table 2. The K Sr
sm vs. fm(T) relationship is broken into three linear piecewise continuous seg-ments as indicated by the line segments in gray in order to carry out the numerical integrations for the trace ele-ment evolution.
Else_DV-DEVIVO_ch013.qxd 4/17/2006 5:55 PM Page 262
from MELTS the variation of bulk Ksm for each trace element as a function of T or, equiv-alently, fm(T) and then to numerically integrate Equation (2) using a sequence of linear seg-mental parameterizations for Ksm as a function of fm(T) (Fig. 3). For a linear relationshipbetween Ksm and fm(T), Equation (2) can be integrated analytically; in practice, it is fasterand just as accurate to perform the integration numerically using a fourth-order Runge-Kutta scheme (e.g., Spera and Bohrson, 2001).
In summary, trace element concentrations were calculated from the liquidus temperaturewhere fm(T) � 1 down to fm(T) ~ 0.05 using the numerically integrated form of Equation (2),taking explicit account of the variation in bulk Ksm for each trace element as a function of thefraction of remaining melt after removal of solids predicted from the MELTS simulation. Theconcentration of a trace element is then calculated using the initial concentration values(Co
m,i) for the ith trace element listed in Table 1 and the numerically determined ratio Cm/Com.
As noted above, we neglect fractionation of an element into coexisting supercritical fluidphase in the results presented here, although for certain elements, specifically the alkalies(e.g., Rb; see Beswick, 1973) and for elements that strongly complex with halogens such asCl, this assumption is suspect.
Petrogenesis of the Campanian Ignimbrite 263
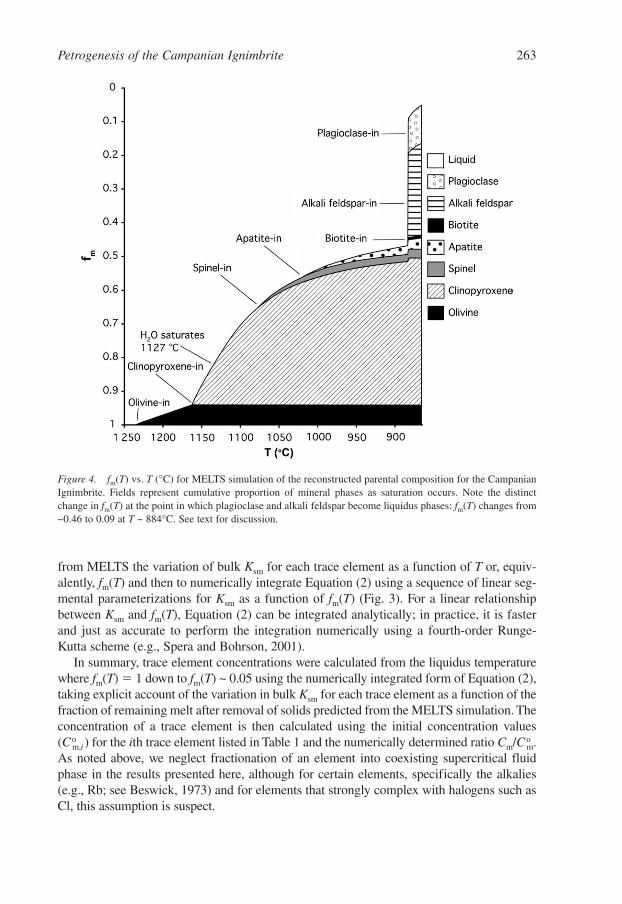
Figure 4. fm(T) vs. T (°C) for MELTS simulation of the reconstructed parental composition for the CampanianIgnimbrite. Fields represent cumulative proportion of mineral phases as saturation occurs. Note the distinctchange in fm(T) at the point in which plagioclase and alkali feldspar become liquidus phases: fm(T) changes from~0.46 to 0.09 at T ~ 884°C. See text for discussion.
Else_DV-DEVIVO_ch013.qxd 4/17/2006 5:55 PM Page 263
3.4. Analytical methods for Th isotope data
Th isotopic analyses of 12 samples of the CI were performed at the University ofCalifornia, Los Angeles (UCLA), using a VG sector mass spectrometer equipped with a 30 cm electrostatic filter and a static collector array composed of a Faraday cup and an ioncounting photomultiplier system. Thorium and uranium were run as metals. Abundancesensitivity on this instrument during data collection was �0.4 ppm at 1 amu. 232Th/230
Th � 2σ obtained on a standard solution and international reference samples are (1)University of California, Santa Cruz Th standard: 170,587 � 0.26% (n � 35), (cf. valuesof 17.03 � 9 � 104 and 17.05 � 104 reported in Reid, 1995); (2) AGV1 199,040�0.20% (n � 5); (3) JB1 332,302 � 0.96% (n � 5) (cf. values of 20.06 � 104 and 33.54 � 104,respectively, reported in Reid, 1995). U and Th concentrations were measured by isotopedilution using a 229Th- and 233U-enriched spike. Elemental purification was achieved usinganion exchange resin and 7N HNO3.
4. Description of data
4.1. Major and trace elements
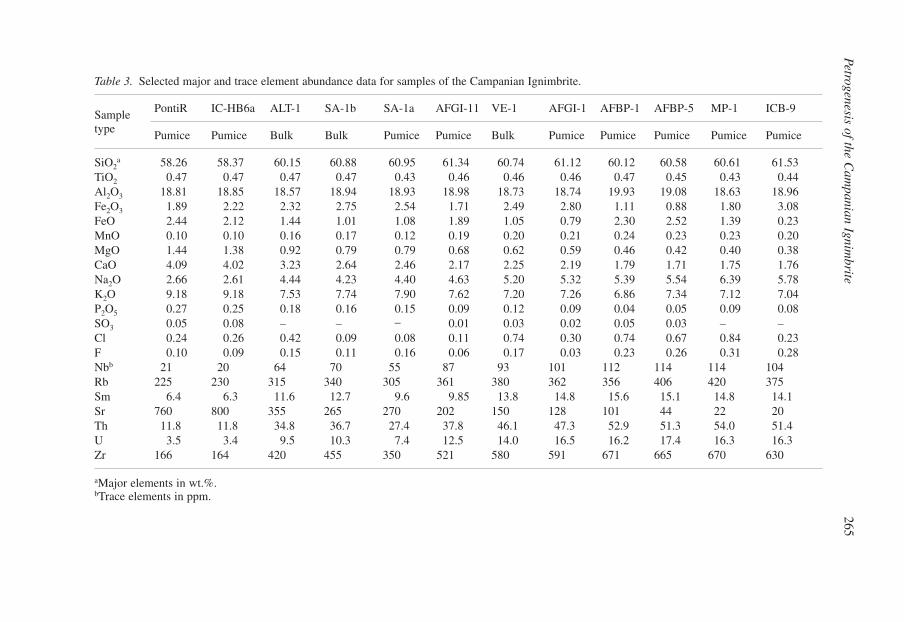
Representative major element data are presented in Table 3. Consistent with numerousprevious studies on the CI, pumice and bulk/matrix samples analyzed in this study aretrachytic to phonolitic (Fig. 2a). The typical phenocryst assemblage in pumice includesalkali feldspar, with lesser plagioclase and sparse to trace clinopyroxene, spinel,apatite, and biotite. Most samples are sparsely phyric; the maximum crystal content is~10%, and thus, although our samples (and some of those of Civetta et al. (1997)) arepumice, major and trace element signatures are dominated by melt compositions. As aconsequence of zeolitization, samples of the yellow tuff have compositions distinctfrom the pumice and bulk/matrix samples and will not be plotted or discussed furtherin this contribution. Portrayed in Figure 2a are data for the high-MgO and low-MgOmelt inclusions of Webster et al. (2003), pumice and glass (by ICP) from Civetta et al.(1997) and matrix glass and clinopyroxene-hosted glass inclusions (by electron micro-probe) from Signorelli et al. (1999). The Signorelli study focused on the Plinian phaseof the eruption and therefore includes only data from the fall deposit (earliest part ofthe CI eruption).
Selected major oxide trends are illustrated in Figure 5a–d; all oxides are reported inwt.%. For most oxides, pumice and bulk samples are characterized by relatively coherentoxide–oxide trends. For example, SiO2, Na2O, and MnO vs. MgO form relatively tightnegatively correlated arrays. CaO, P2O5, FeO, and K2O are positively correlated arrays,although two pumice samples have distinctly lower K2O compared to other samples withequivalent MgO. Fe2O3 and Al2O3 vs. MgO trends are more scattered.
A subset of the trace elements analyzed for these samples was chosen for detailed dis-cussion in this study: Zr, Nb, Th, U, Rb, Sr, and Sm. Selected MgO (wt.%) vs. elementtrends are illustrated in Figure 6a–g; all trace elements are reported in ppm. These elementsrepresent the range of element behavior in the CI. WMI trends for Zr, Nb, Th, and U showscattered changes in concentration at decreasing MgO. For these elements, a subset of the
264 W.A. Bohrson et al.
Else_DV-DEVIVO_ch013.qxd 4/17/2006 5:55 PM Page 264
Petrogenesis of the Cam
panian Ignimbrite
265
Table 3. Selected major and trace element abundance data for samples of the Campanian Ignimbrite.
Sample PontiR IC-HB6a ALT-1 SA-1b SA-1a AFGI-11 VE-1 AFGI-1 AFBP-1 AFBP-5 MP-1 ICB-9
type Pumice Pumice Bulk Bulk Pumice Pumice Bulk Pumice Pumice Pumice Pumice Pumice
SiO2a 58.26 58.37 60.15 60.88 60.95 61.34 60.74 61.12 60.12 60.58 60.61 61.53
TiO2 0.47 0.47 0.47 0.47 0.43 0.46 0.46 0.46 0.47 0.45 0.43 0.44 Al2O3 18.81 18.85 18.57 18.94 18.93 18.98 18.73 18.74 19.93 19.08 18.63 18.96 Fe2O3 1.89 2.22 2.32 2.75 2.54 1.71 2.49 2.80 1.11 0.88 1.80 3.08 FeO 2.44 2.12 1.44 1.01 1.08 1.89 1.05 0.79 2.30 2.52 1.39 0.23 MnO 0.10 0.10 0.16 0.17 0.12 0.19 0.20 0.21 0.24 0.23 0.23 0.20 MgO 1.44 1.38 0.92 0.79 0.79 0.68 0.62 0.59 0.46 0.42 0.40 0.38 CaO 4.09 4.02 3.23 2.64 2.46 2.17 2.25 2.19 1.79 1.71 1.75 1.76 Na2O 2.66 2.61 4.44 4.23 4.40 4.63 5.20 5.32 5.39 5.54 6.39 5.78 K2O 9.18 9.18 7.53 7.74 7.90 7.62 7.20 7.26 6.86 7.34 7.12 7.04 P2O5 0.27 0.25 0.18 0.16 0.15 0.09 0.12 0.09 0.04 0.05 0.09 0.08 SO3 0.05 0.08 – – – 0.01 0.03 0.02 0.05 0.03 – –Cl 0.24 0.26 0.42 0.09 0.08 0.11 0.74 0.30 0.74 0.67 0.84 0.23 F 0.10 0.09 0.15 0.11 0.16 0.06 0.17 0.03 0.23 0.26 0.31 0.28 Nbb 21 20 64 70 55 87 93 101 112 114 114 104Rb 225 230 315 340 305 361 380 362 356 406 420 375Sm 6.4 6.3 11.6 12.7 9.6 9.85 13.8 14.8 15.6 15.1 14.8 14.1Sr 760 800 355 265 270 202 150 128 101 44 22 20Th 11.8 11.8 34.8 36.7 27.4 37.8 46.1 47.3 52.9 51.3 54.0 51.4U 3.5 3.4 9.5 10.3 7.4 12.5 14.0 16.5 16.2 17.4 16.3 16.3Zr 166 164 420 455 350 521 580 591 671 665 670 630
aMajor elements in wt.%.bTrace elements in ppm.
Else_DV-DEVIVO_ch013.qxd 4/17/2006 5:55 PM Page 265
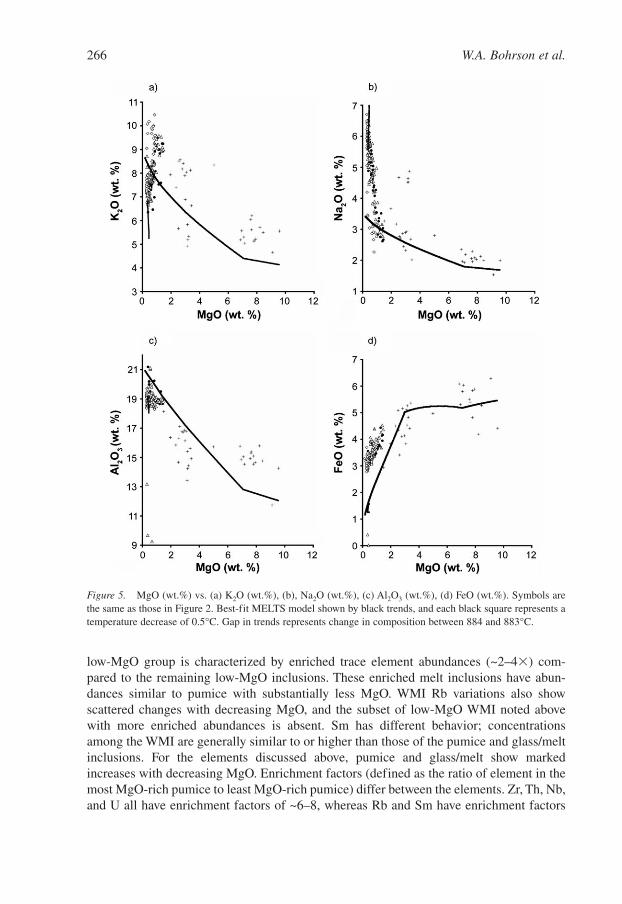
low-MgO group is characterized by enriched trace element abundances (~2–4�) com-pared to the remaining low-MgO inclusions. These enriched melt inclusions have abun-dances similar to pumice with substantially less MgO. WMI Rb variations also showscattered changes with decreasing MgO, and the subset of low-MgO WMI noted abovewith more enriched abundances is absent. Sm has different behavior; concentrationsamong the WMI are generally similar to or higher than those of the pumice and glass/meltinclusions. For the elements discussed above, pumice and glass/melt show markedincreases with decreasing MgO. Enrichment factors (defined as the ratio of element in themost MgO-rich pumice to least MgO-rich pumice) differ between the elements. Zr, Th, Nb,and U all have enrichment factors of ~6–8, whereas Rb and Sm have enrichment factors
266 W.A. Bohrson et al.
Figure 5. MgO (wt.%) vs. (a) K2O (wt.%), (b), Na2O (wt.%), (c) Al2O3 (wt.%), (d) FeO (wt.%). Symbols arethe same as those in Figure 2. Best-fit MELTS model shown by black trends, and each black square represents atemperature decrease of 0.5°C. Gap in trends represents change in composition between 884 and 883°C.
Else_DV-DEVIVO_ch013.qxd 4/17/2006 5:55 PM Page 266
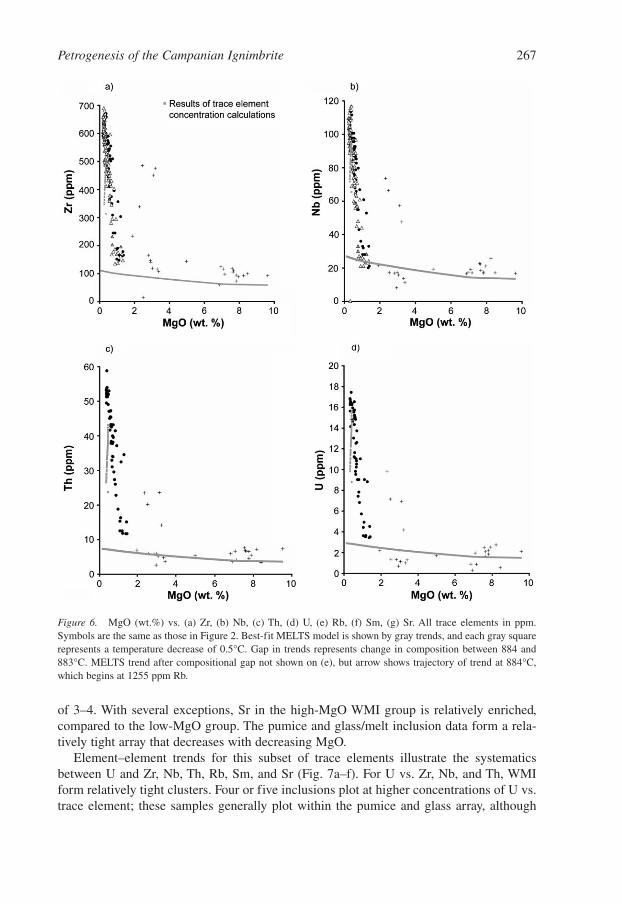
of 3–4. With several exceptions, Sr in the high-MgO WMI group is relatively enriched,compared to the low-MgO group. The pumice and glass/melt inclusion data form a rela-tively tight array that decreases with decreasing MgO.
Element–element trends for this subset of trace elements illustrate the systematicsbetween U and Zr, Nb, Th, Rb, Sm, and Sr (Fig. 7a–f). For U vs. Zr, Nb, and Th, WMIform relatively tight clusters. Four or five inclusions plot at higher concentrations of U vs.trace element; these samples generally plot within the pumice and glass array, although
Petrogenesis of the Campanian Ignimbrite 267
Figure 6. MgO (wt.%) vs. (a) Zr, (b) Nb, (c) Th, (d) U, (e) Rb, (f) Sm, (g) Sr. All trace elements in ppm.Symbols are the same as those in Figure 2. Best-fit MELTS model is shown by gray trends, and each gray squarerepresents a temperature decrease of 0.5°C. Gap in trends represents change in composition between 884 and883°C. MELTS trend after compositional gap not shown on (e), but arrow shows trajectory of trend at 884°C,which begins at 1255 ppm Rb.
Else_DV-DEVIVO_ch013.qxd 4/17/2006 5:55 PM Page 267
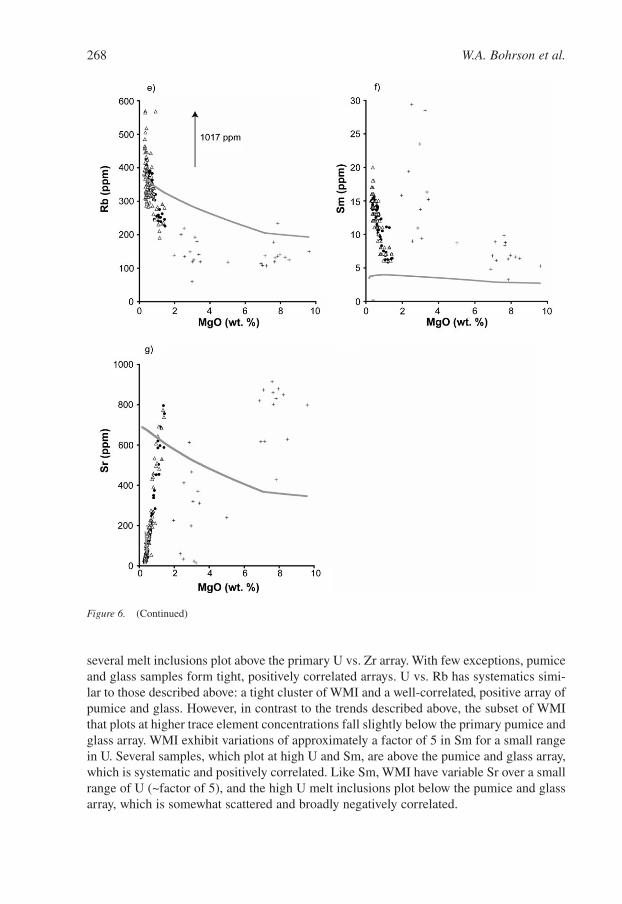
several melt inclusions plot above the primary U vs. Zr array. With few exceptions, pumiceand glass samples form tight, positively correlated arrays. U vs. Rb has systematics simi-lar to those described above: a tight cluster of WMI and a well-correlated, positive array ofpumice and glass. However, in contrast to the trends described above, the subset of WMIthat plots at higher trace element concentrations fall slightly below the primary pumice andglass array. WMI exhibit variations of approximately a factor of 5 in Sm for a small rangein U. Several samples, which plot at high U and Sm, are above the pumice and glass array,which is systematic and positively correlated. Like Sm, WMI have variable Sr over a smallrange of U (~factor of 5), and the high U melt inclusions plot below the pumice and glassarray, which is somewhat scattered and broadly negatively correlated.
268 W.A. Bohrson et al.
Figure 6. (Continued)
Else_DV-DEVIVO_ch013.qxd 4/17/2006 5:55 PM Page 268
4.2. Th isotopes
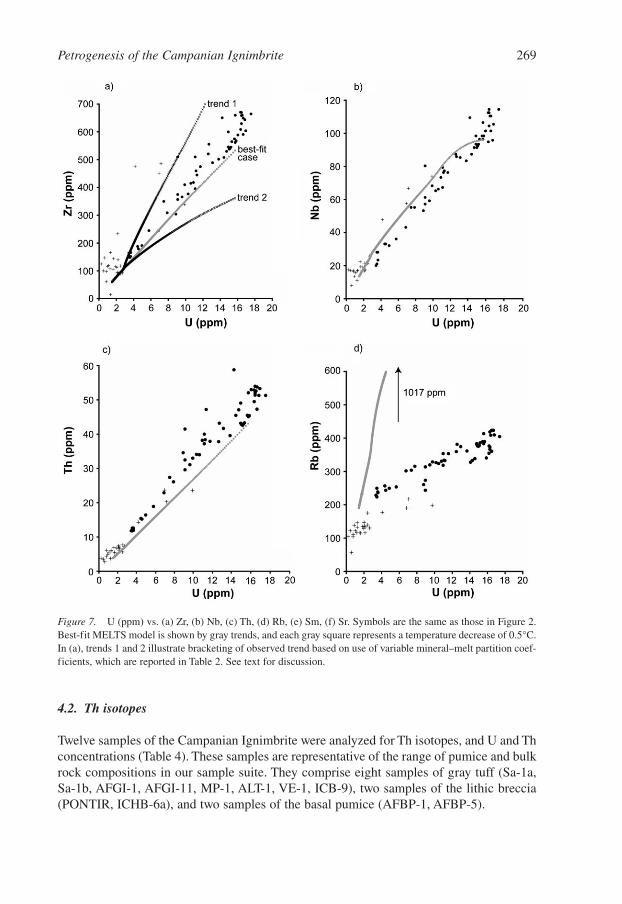
Twelve samples of the Campanian Ignimbrite were analyzed for Th isotopes, and U and Thconcentrations (Table 4). These samples are representative of the range of pumice and bulkrock compositions in our sample suite. They comprise eight samples of gray tuff (Sa-1a,Sa-1b, AFGI-1, AFGI-11, MP-1, ALT-1, VE-1, ICB-9), two samples of the lithic breccia(PONTIR, ICHB-6a), and two samples of the basal pumice (AFBP-1, AFBP-5).
Petrogenesis of the Campanian Ignimbrite 269
Figure 7. U (ppm) vs. (a) Zr, (b) Nb, (c) Th, (d) Rb, (e) Sm, (f) Sr. Symbols are the same as those in Figure 2.Best-fit MELTS model is shown by gray trends, and each gray square represents a temperature decrease of 0.5°C.In (a), trends 1 and 2 illustrate bracketing of observed trend based on use of variable mineral–melt partition coef-ficients, which are reported in Table 2. See text for discussion.
Else_DV-DEVIVO_ch013.qxd 4/17/2006 5:55 PM Page 269
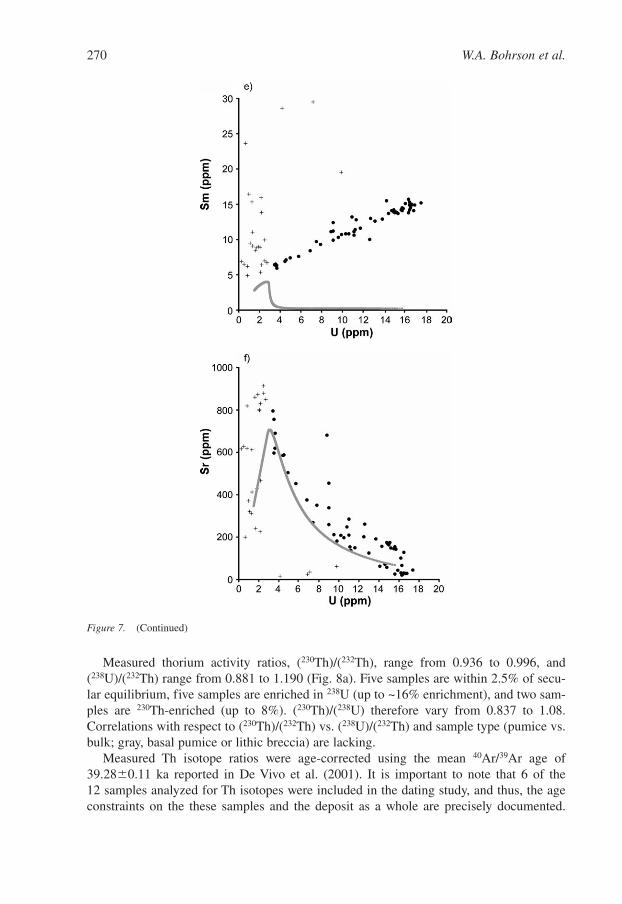
Measured thorium activity ratios, (230Th)/(232Th), range from 0.936 to 0.996, and(238U)/(232Th) range from 0.881 to 1.190 (Fig. 8a). Five samples are within 2.5% of secu-lar equilibrium, five samples are enriched in 238U (up to ~16% enrichment), and two sam-ples are 230Th-enriched (up to 8%). (230Th)/(238U) therefore vary from 0.837 to 1.08.Correlations with respect to (230Th)/(232Th) vs. (238U)/(232Th) and sample type (pumice vs.bulk; gray, basal pumice or lithic breccia) are lacking.
Measured Th isotope ratios were age-corrected using the mean 40Ar/39Ar age of39.28�0.11 ka reported in De Vivo et al. (2001). It is important to note that 6 of the 12 samples analyzed for Th isotopes were included in the dating study, and thus, the ageconstraints on the these samples and the deposit as a whole are precisely documented.
270 W.A. Bohrson et al.
Figure 7. (Continued)
Else_DV-DEVIVO_ch013.qxd 4/17/2006 5:55 PM Page 270
Petrogenesis of the Cam
panian Ignimbrite
271
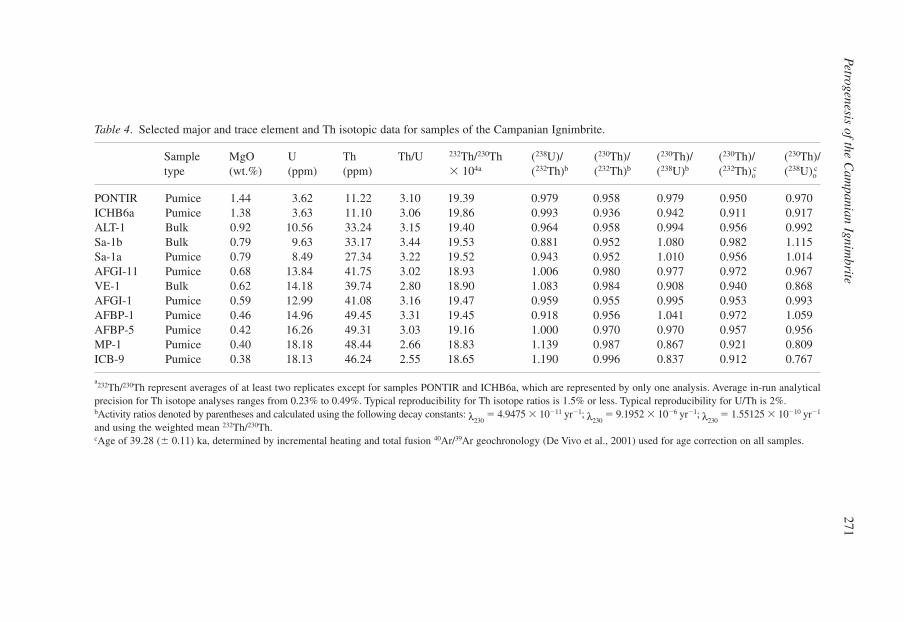
Table 4. Selected major and trace element and Th isotopic data for samples of the Campanian Ignimbrite.
Sample MgO U Th Th/U 232Th/230Th (238U)/ (230Th)/ (230Th)/ (230Th)/ (230Th)/type (wt.%) (ppm) (ppm) � 104a (232Th)b (232Th)b (238U)b (232Th)o
c (238U)oc
PONTIR Pumice 1.44 3.62 11.22 3.10 19.39 0.979 0.958 0.979 0.950 0.970ICHB6a Pumice 1.38 3.63 11.10 3.06 19.86 0.993 0.936 0.942 0.911 0.917ALT-1 Bulk 0.92 10.56 33.24 3.15 19.40 0.964 0.958 0.994 0.956 0.992Sa-1b Bulk 0.79 9.63 33.17 3.44 19.53 0.881 0.952 1.080 0.982 1.115Sa-1a Pumice 0.79 8.49 27.34 3.22 19.52 0.943 0.952 1.010 0.956 1.014AFGI-11 Pumice 0.68 13.84 41.75 3.02 18.93 1.006 0.980 0.977 0.972 0.967VE-1 Bulk 0.62 14.18 39.74 2.80 18.90 1.083 0.984 0.908 0.940 0.868AFGI-1 Pumice 0.59 12.99 41.08 3.16 19.47 0.959 0.955 0.995 0.953 0.993AFBP-1 Pumice 0.46 14.96 49.45 3.31 19.45 0.918 0.956 1.041 0.972 1.059AFBP-5 Pumice 0.42 16.26 49.31 3.03 19.16 1.000 0.970 0.970 0.957 0.956MP-1 Pumice 0.40 18.18 48.44 2.66 18.83 1.139 0.987 0.867 0.921 0.809ICB-9 Pumice 0.38 18.13 46.24 2.55 18.65 1.190 0.996 0.837 0.912 0.767
a232Th/230Th represent averages of at least two replicates except for samples PONTIR and ICHB6a, which are represented by only one analysis. Average in-run analytical
precision for Th isotope analyses ranges from 0.23% to 0.49%. Typical reproducibility for Th isotope ratios is 1.5% or less. Typical reproducibility for U/Th is 2%. bActivity ratios denoted by parentheses and calculated using the following decay constants: λ230
� 4.9475 � 10�11 yr�1; λ230� 9.1952 � 10�6 yr�1; λ230
� 1.55125 � 10�10 yr�1
and using the weighted mean 232Th/230Th. cAge of 39.28 (� 0.11) ka, determined by incremental heating and total fusion 40Ar/39Ar geochronology (De Vivo et al., 2001) used for age correction on all samples.
Else_DV-DEVIVO_ch013.qxd 4/17/2006 5:55 PM Page 271
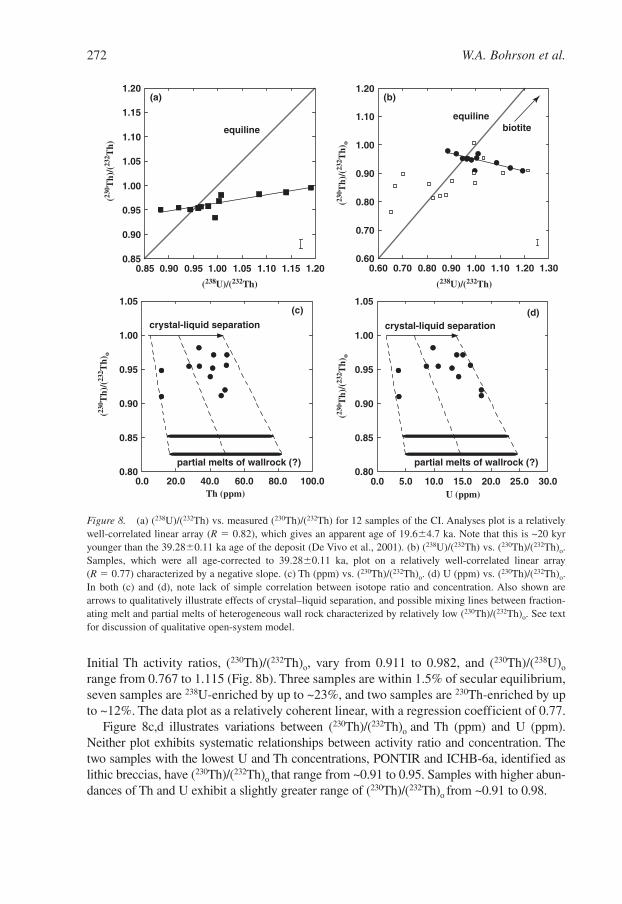
Initial Th activity ratios, (230Th)/(232Th)o, vary from 0.911 to 0.982, and (230Th)/(238U)o
range from 0.767 to 1.115 (Fig. 8b). Three samples are within 1.5% of secular equilibrium,seven samples are 238U-enriched by up to ~23%, and two samples are 230Th-enriched by upto ~12%. The data plot as a relatively coherent linear, with a regression coefficient of 0.77.
Figure 8c,d illustrates variations between (230Th)/(232Th)o and Th (ppm) and U (ppm).Neither plot exhibits systematic relationships between activity ratio and concentration. Thetwo samples with the lowest U and Th concentrations, PONTIR and ICHB-6a, identified aslithic breccias, have (230Th)/(232Th)o that range from ~0.91 to 0.95. Samples with higher abun-dances of Th and U exhibit a slightly greater range of (230Th)/(232Th)o from ~0.91 to 0.98.
272 W.A. Bohrson et al.
0.85
0.90
0.95
1.00
1.05
1.10
1.15
1.20
0.85 0.90 0.95 1.00 1.05 1.10 1.15 1.20
equiline
(a)(23
0 Th)
/(23
2 Th)
(238U)/(232Th)
(230 T
h)/(
232 T
h)o
U (ppm)
0.80
0.85
0.90
0.95
1.00
1.05
0.0 5.0 10.0 15.0 20.0 25.0 30.0
(d)
partial melts of wallrock (?)
crystal-liquid separation
(230 T
h)/(
232 T
h)o
Th (ppm)
0.80
0.85
0.90
0.95
1.00
1.05
0.0 20.0 40.0 60.0 80.0 100.0
(c)
partial melts of wallrock (?)
crystal-liquid separation
(238U)/(232Th)
0.60
0.70
0.80
0.90
1.00
1.10
1.20
0.60 0.70 0.80 0.90 1.00 1.10 1.20 1.30
equiline
(b)
(230 T
h)/(
232 T
h)o
biotite
Figure 8. (a) (238U)/(232Th) vs. measured (230Th)/(232Th) for 12 samples of the CI. Analyses plot is a relativelywell-correlated linear array (R � 0.82), which gives an apparent age of 19.6�4.7 ka. Note that this is ~20 kyryounger than the 39.28�0.11 ka age of the deposit (De Vivo et al., 2001). (b) (238U)/(232Th) vs. (230Th)/(232Th)o.Samples, which were all age-corrected to 39.28�0.11 ka, plot on a relatively well-correlated linear array (R � 0.77) characterized by a negative slope. (c) Th (ppm) vs. (230Th)/(232Th)o. (d) U (ppm) vs. (230Th)/(232Th)o.In both (c) and (d), note lack of simple correlation between isotope ratio and concentration. Also shown arearrows to qualitatively illustrate effects of crystal–liquid separation, and possible mixing lines between fraction-ating melt and partial melts of heterogeneous wall rock characterized by relatively low (230Th)/(232Th)o. See textfor discussion of qualitative open-system model.
Else_DV-DEVIVO_ch013.qxd 4/17/2006 5:55 PM Page 272
5. Discussion
5.1. Magma chamber processes
Ignimbrites have been interpreted as deposits that represent rapid evacuation of a magmachamber (e.g., Smith, 1979; Hildreth, 1981), and thus, the primary compositional and isotopic heterogeneity observed in the deposit reflects the range of magmas that were inthe magma chamber just prior to evacuation. Such magmas form by processes that occuras melt forms and as melt � crystals � vapor ascend through and are stored in the crust.For our data set, comparison of the observed data with the MELTS model reveals thatcrystal–liquid separation played an important if not dominant role in developing theobserved major element compositional heterogeneity. Detailed reconstructions ofselected trace element trends highlights the critical control that phase assemblage andmineral–mineral partition coefficients (Ksm) have on melt trace element abundances.Imprecise knowledge of Ksm, in some cases, makes it difficult to ascertain the contribu-tion from crystal–liquid separation, compared to other processes such as crustal assimi-lation, but several elements provide strong evidence for open-system processes. Thdisequilibria data and published Sr isotope data (Civetta et al., 1997) support this sug-gestion by providing definitive evidence of open-system processes in the Campanianmagma plumbing system.
5.1.1. Crystal–liquid equilibria: major element discussion
The results of isobaric fractional crystallization starting from RPM composition listed inTable 1 are summarized in Figures 2b, 4, and 5a–d. Best-fit MELTS parameters includepressure � 0.15 GPa, crystallization along the QFM�1 oxygen buffer, and initial dis-solved water content of the RPM of 3 wt.%, which is within the range of water contentsmeasured on melt inclusions reported by Webster et al. (2003). The temperature intervalused to compute the liquid line of descent is 0.5°C. Figure 2b shows the calculated trend(anhydrous basis) on an alkali–silica diagram. Upon fractional crystallization of parentaltrachyandesite, the melt evolves to higher total alkali (K2O plus Na2O) and higher silica.The most striking feature of this diagram is the presence of a compositional gap begin-ning at T ≈ 884°C. This temperature defines a pseudo-invariant point in thermodynamicspace that behaves practically like a eutectic point in a simple binary component system.That is, as heat (enthalpy) is isobarically extracted from the system, the fraction of meltchanges from ~0.46 to ~0.09 essentially isothermally (T ≈ 884°C), and melt simultane-ously saturates in alkali feldspar, plagioclase, and biotite. At this temperature, the meltcomposition and properties change rather abruptly. The difference in composition of thetwo distinct liquids across the gap is ~2 wt.% for Na2O and Al2O3, ~1.5 wt.% for K2O, 1 wt.% for SiO2 and CaO (Fig. 5), and ~0.5 wt.% for H2O (Table 5). In fact, across thegap, both the composition of the melt and the bulk magma (melt plus supercritical fluid)change rather significantly.
Figure 4 shows the abundance of the crystalline phases removed as a function of fm(T).In addition to the rapid change in fraction of melt at the pseudo-invariant temperature, theother important features of Figure 4 are the following: (1) olivine is the liquidus phase; (2)
Petrogenesis of the Campanian Ignimbrite 273
Else_DV-DEVIVO_ch013.qxd 4/17/2006 5:55 PM Page 273
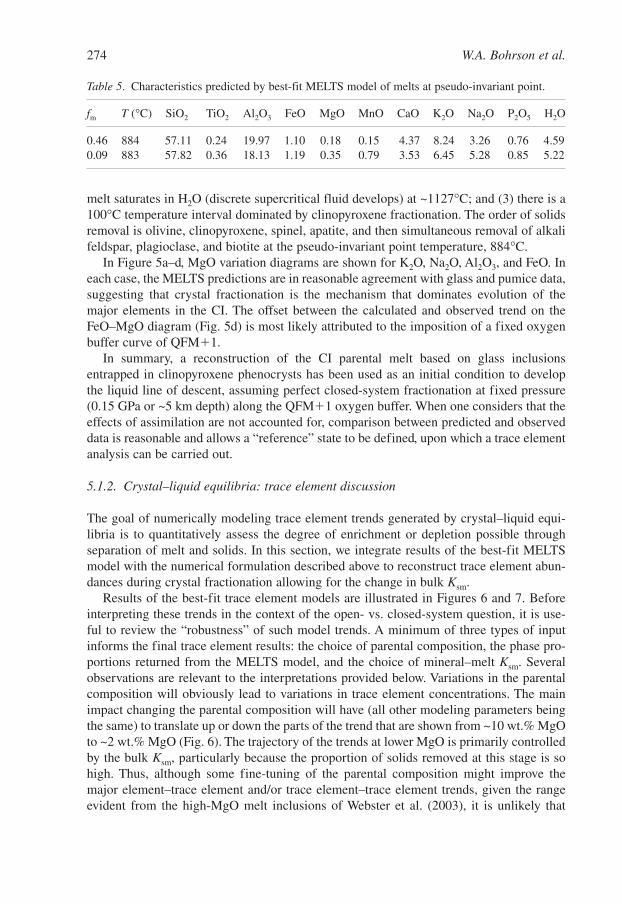
melt saturates in H2O (discrete supercritical fluid develops) at ~1127°C; and (3) there is a100°C temperature interval dominated by clinopyroxene fractionation. The order of solidsremoval is olivine, clinopyroxene, spinel, apatite, and then simultaneous removal of alkalifeldspar, plagioclase, and biotite at the pseudo-invariant point temperature, 884°C.
In Figure 5a–d, MgO variation diagrams are shown for K2O, Na2O, Al2O3, and FeO. Ineach case, the MELTS predictions are in reasonable agreement with glass and pumice data,suggesting that crystal fractionation is the mechanism that dominates evolution of themajor elements in the CI. The offset between the calculated and observed trend on theFeO–MgO diagram (Fig. 5d) is most likely attributed to the imposition of a fixed oxygenbuffer curve of QFM�1.
In summary, a reconstruction of the CI parental melt based on glass inclusionsentrapped in clinopyroxene phenocrysts has been used as an initial condition to developthe liquid line of descent, assuming perfect closed-system fractionation at fixed pressure(0.15 GPa or ~5 km depth) along the QFM�1 oxygen buffer. When one considers that theeffects of assimilation are not accounted for, comparison between predicted and observeddata is reasonable and allows a “reference” state to be defined, upon which a trace elementanalysis can be carried out.
5.1.2. Crystal–liquid equilibria: trace element discussion
The goal of numerically modeling trace element trends generated by crystal–liquid equi-libria is to quantitatively assess the degree of enrichment or depletion possible throughseparation of melt and solids. In this section, we integrate results of the best-fit MELTSmodel with the numerical formulation described above to reconstruct trace element abun-dances during crystal fractionation allowing for the change in bulk Ksm.
Results of the best-fit trace element models are illustrated in Figures 6 and 7. Beforeinterpreting these trends in the context of the open- vs. closed-system question, it is use-ful to review the “robustness” of such model trends. A minimum of three types of inputinforms the final trace element results: the choice of parental composition, the phase pro-portions returned from the MELTS model, and the choice of mineral–melt Ksm. Severalobservations are relevant to the interpretations provided below. Variations in the parentalcomposition will obviously lead to variations in trace element concentrations. The mainimpact changing the parental composition will have (all other modeling parameters beingthe same) to translate up or down the parts of the trend that are shown from ~10 wt.% MgOto ~2 wt.% MgO (Fig. 6). The trajectory of the trends at lower MgO is primarily controlledby the bulk Ksm, particularly because the proportion of solids removed at this stage is sohigh. Thus, although some fine-tuning of the parental composition might improve themajor element–trace element and/or trace element–trace element trends, given the rangeevident from the high-MgO melt inclusions of Webster et al. (2003), it is unlikely that
274 W.A. Bohrson et al.
Table 5. Characteristics predicted by best-fit MELTS model of melts at pseudo-invariant point.
fm T (°C) SiO2 TiO2 Al2O3 FeO MgO MnO CaO K2O Na2O P2O5 H2O
0.46 884 57.11 0.24 19.97 1.10 0.18 0.15 4.37 8.24 3.26 0.76 4.590.09 883 57.82 0.36 18.13 1.19 0.35 0.79 3.53 6.45 5.28 0.85 5.22
Else_DV-DEVIVO_ch013.qxd 4/17/2006 5:55 PM Page 274
reasonable variations in the parental composition will drastically change the interpreta-tions of trace element behavior. As noted above, the best-fit MELTS model is the result ofapproximately 100 simulations, which differ in detail but fundamentally return the sameresults: olivine and clinopyroxene at high temperatures (liquidus and subliquidus), fol-lowed by onset of apatite and spinel crystallization. At ~884°C, a large mass of crystals,dominated by alkali feldspar and plagioclase, form. Crystallization at this pseudo-invari-ant point is a feature of all of the MELTS results, as is onset of apatite formation. Thus,although the details of the MELTS model might change with further examination, the best-fit model, which is subject to the assumptions relevant to describing a magmatic systemusing the MELTS approach, are robust. The final variable in the trace element modeling,which is the one that is perhaps the most problematic in producing robust results, is thechoice of mineral–melt Ksm. In this study, mineral–melt Ksm were chosen based on assess-ment of the range of values available in the Geochemical Earth Reference Model (GERM)Partition Coefficient compilation (http://earthref.org/) (All values in the GERM compila-tion are referenced, and references relevant to this study are included in Table 2).Inspection of the compilation for a particular phase and element, even within a restrictedcompositional range (e.g., silicic or basaltic), in most cases, reveals large differences inmineral–melt Ksm (e.g., Rb in basaltic plagioclase ranges from 0.016 to 0.3; Sr basalticclinopyroxene ranges from 0.04 to 0.449; Th in apatite ranges from 1.6 to 41). In manycases, when applying partition coefficients to model a particular suite of rocks, it is diffi-cult to develop independent criteria that allow a rational choice to be made among the val-ues. The approach we adopted was to apply different Ksm from the compilation until theobserved trends were suitably bracketed, and then final Ksm were chosen and the best-fitcase was calculated. These best-fit cases are summarized in Figure 7. An example ofbracketing is shown in Figure 7a (U vs. Zr). One model trend (trend 1) plots above theobserved trend, whereas the other model trend (trend 2) plots below. The critical pointabout these model trends is they have very different implications for understanding traceelement variations. In the case of trend 2, the implication is that crystal–liquid separationcannot produce enrichments that are sufficient to describe the data. This implies the sys-tem was open, and therefore another process, such as crustal assimilation, was important.However, permissible changes in Ksm (based on available data) yield a trend (trend 1) thatplots above the observed data. Trend 1 implies that crystal–liquid separation can produceconcentrations that are more enriched than those observed. In this case, elements may havebeen scavenged from the magma, and such scavenging might be caused by transport of theelement into a vapor phase, in the case of a vapor-saturated magma. In several cases (e.g.,Th, Sm, Rb), application of the most extreme mineral–melt Ksm listed in the compilationthat were relevant to the broad magma compositional range failed to yield model trendsthat reproduced or bracketed the data. In these cases, the model case shown is that whichemploys the most extreme, allowable Ksm.
Figures 7a, b and f illustrate results for U vs. Zr, Nb, and Sr. For these elements,observed and model trends show similar systematics. This suggests, to a first order, thatthe observed enrichments may be attributed to crystal–liquid separation. U, Zr, and Nb allbehave incompatibly, increasing in abundance with decreasing MgO (Fig. 6a,b,d). At ~1.5wt.% MgO, the marked increase in observed and model abundances of these elements isinterpreted to result from the large change in crystallinity associated with invariant pointcrystallization at ~884°C. Because fm(T) changes dramatically over a small temperature
Petrogenesis of the Campanian Ignimbrite 275
Else_DV-DEVIVO_ch013.qxd 4/17/2006 5:55 PM Page 275
interval, the consequences on trace element abundances are profound. Sr is initially incom-patible (i.e., increases in abundance with decreasing MgO, Fig. 6g), and then, for T �884°C, Sr becomes compatible because plagioclase and alkali feldspar crystallize (Fig. 7f).
Figures 7c and e illustrate model vs. observed results from U vs. Th and Sm. These ele-ments provide an interesting window into the behavior of elements typically consideredincompatible. In the case in which apatite is an important crystallizing phase, because theKsm for Th and Sm can be very high (e.g., order 2–90; e.g., Nagasawa, 1970; Mahood andStimac, 1990), these elements will be very efficiently removed from the melt at ≈884°C.In the case of Th, the best-fit trace element trend uses the apatite–melt Ksm that is leastcompatible of those reported (e.g., 1.6 of the range 1.6 to 41; Mahood and Stimac, 1990;Bea et al., 1994). The U-Th trend is positively correlated, indicating that Th is enrichedduring crystal–liquid separation, but the model trend is not as Th-enriched as the observedtrend. Even with an apatite–melt Th partition coefficient of 1 (results not shown), Th is stillnot as enriched in the model as observed. Assuming the MELTS model is robust withrespect to phase proportions, this result implies either that Th is not compatible in apatite,a result not supported by the partition coefficient database, or that Th may be impacted byopen-system processes. (Because the MELTS and trace element modeling assume perfectfractional crystallization, it is possible that apatite did not effectively separate from its hostmelt. However, this explanation seems unlikely because P2O5 decreases with decreasingMgO, and Th increases as P2O5 decreases, suggesting apatite was fractionated.) The caseof Sm is more extreme because, compared to Th, it has much higher apatite–melt Ksm. The best-fit case illustrated in Figures 6f and 7e employed the lowest mineral–melt Ksm in theGERM compilation (Table 2), and yet, the model trend grossly underestimates the observed Sm abundance; in fact, the model predicts that the melt will have almost noSm. Although the detailed modeling is not yet complete, the LREE and other MREE in theCI behave similarly to Sm. Because these elements tend to be compatible (to varyingdegrees) in apatite, equivalent model systematics may emerge. Again, the model vs.observed results indicate either that the Sm apatite–melt partition coefficient is highlyinaccurate, or that most of the Sm is related to some open-system contribution.
Figure 7d shows the U vs. Rb results. The illustrated model trend employs mineral–meltKsm from the GERM compilation that are the most compatible for each phase; despite this,the model Rb trend grossly overestimates the observed abundances of Rb. This suggeststhat the GERM Ksm are not relevant, that there is some yet unidentified trace phase thatremoved Rb, and/or that a separate process, such as interaction with a vapor, has removedRb from the melt. The critical parameters governing the distribution of a trace elementbetween solid, melt, and supercritical fluid are the solid-melt (Ksm) and fluid-melt (Kfm)partition coefficients and the rate of change of the mass fraction of fluid (ff) with respectto fm(T) during isobaric fractional crystallization. If the bulk partition coefficient for Rbbetween melt and vapor exceeds ~3, as it may based on laboratory experiments on sani-dine and biotite (Beswick, 1973), then the discrepancy between the calculated trendassuming Rb is totally insoluble in the supercritical fluid and the observed trend can berationalized. The role of melt-vapor fractionation is easily estimated. For insoluble behav-ior with K Rb
fm � 0 and K Rbsm � 0 the situation is identical to standard solid-melt Rayleigh
fractionation and enrichment in residual melt is expected CRbm /CRb
m,o � ~ 2. If however Kfm � 5 (i.e., Rb is decidedly soluble in fluid relative to melt), then the melt will bedepleted in Rb such that CRb
m /CRbm,o � ~ 0.1. If this hypothesis of supercritical fluid
276 W.A. Bohrson et al.
Else_DV-DEVIVO_ch013.qxd 4/17/2006 5:55 PM Page 276
fractionation is valid for Rb, one expects other geochemically similar elements will exhibitsimilar behavior. The study by Bohrson et al. (in preparation) addresses this issue further.
A final comment about all of the model trends is relevant to understanding magmachamber processes. The trace element mass balance model presented here representsperfect fractional crystallization and evaluates compositional changes in very smallincrements of fraction of melt. Pumice likely represents some integration of parcels ofmelt with distinct histories, and thus, some of the discrepancy between model andobserved trends may be the result of magma and eruption dynamics that mix discretemasses of distinct-composition melt. An interesting test of this hypothesis would be tocollect small spatial resolution data of glass in the pumice. Signorelli et al. (1999) rep-resents just such a study because their glass data is the result of microprobe analyses,and thus, are small-spatial resolution samplings of the major element chemistry of theCampanian melt. In some cases, the MELTS model reproduces parts of the glass datatrends. No trace element data are provided in the Signorelli et al. (1999) study, but theprediction would be that the in situ trace element data would fall close to or on the modeltrends, thus implying that the pumice analyses reflect mixing of melts that occurs in thechamber and/or upon eruption.
In summary, results of numerical trace element modeling indicate that Sm and Th areover-enriched compared to model values, suggesting these elements have been affected byprocesses other than simple equilibrium crystal–liquid separation. General trends for U vs.Nb, Zr, and Sr indicate that the abundances of these elements may be dominantly con-trolled by crystal-melt separation, but the range of Ksm available in the literature does notpreclude some contribution from other sources (i.e., open system). Finally, the model pre-dicts Rb should be more abundant in the Campanian samples, indicating that Rb may havebeen scavenged by vapor that was in equilibrium with melt.
5.1.3. Open-system processes: Th and Sr isotopes
Radiogenic isotopes are effective in identifying and quantifying open-system processesbecause isotopes of the same element are not fractionated by (high-temperature) equilib-rium crystal–liquid separation. Thus, for the closed-system case, 87Sr/86Sr and(230Th)/(232Th) of melts will be the same as those of newly formed crystals. Likewise, inthe case of a zoned magma body, all of the compositionally distinct masses of magma willshare a common initial isotope ratio. The closed-system description assumes that thetimescale of crystallization is short compared to the half-life of the parent isotope, and thusno (or insignificant) radiogenic in-growth occurs during the process. In the case of Rb,which has a half-life of ~4.9 � 1010 yr, this assumption is robust for magmatic processes,except in rare cases in which Rb/Sr is extremely high. The half-life of 230Th is relativelyshort (~7.5 � 104 yr), and thus Th disequilibria have been studied in an attempt to under-stand crystal and magma residence, and fractionation times.
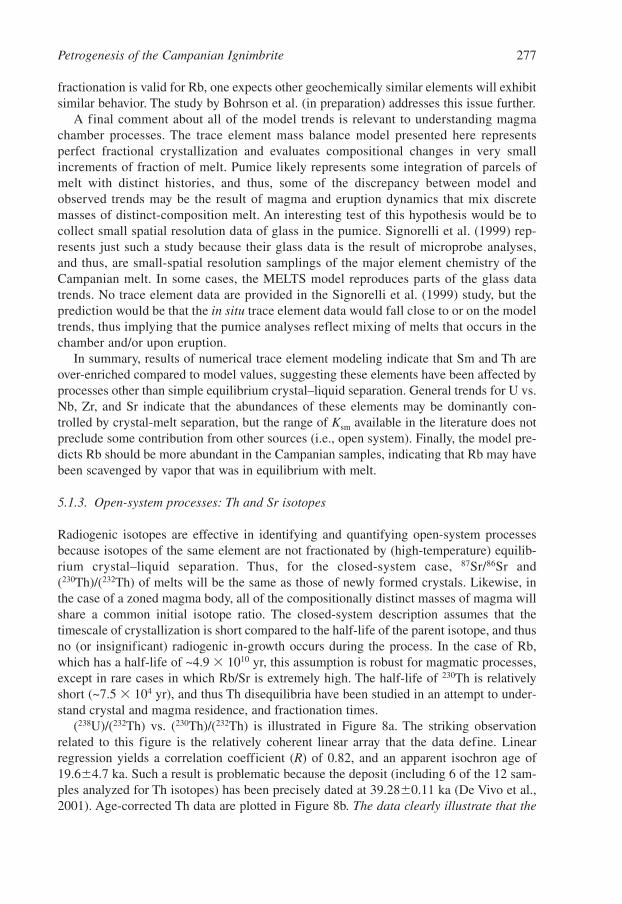
(238U)/(232Th) vs. (230Th)/(232Th) is illustrated in Figure 8a. The striking observationrelated to this figure is the relatively coherent linear array that the data define. Linearregression yields a correlation coefficient (R) of 0.82, and an apparent isochron age of19.6�4.7 ka. Such a result is problematic because the deposit (including 6 of the 12 sam-ples analyzed for Th isotopes) has been precisely dated at 39.28�0.11 ka (De Vivo et al.,2001). Age-corrected Th data are plotted in Figure 8b. The data clearly illustrate that the
Petrogenesis of the Campanian Ignimbrite 277
Else_DV-DEVIVO_ch013.qxd 4/17/2006 5:55 PM Page 277
melts represented by pumice of the CI were not in Th isotopic equilibrium upon eruption.The negative slope of the array also suggests that the system was open with respect to Thisotopes. The slope of the array is important because a positively correlated array might beinterpreted to reflect a magma residence time; in contrast, a negative array (in the absenceof an open system) would indicate timescales less than 0.
One of the interesting aspects of the Th isotope data is the relatively well-correlatedtrend in (238U)/(232Th) vs. (230Th)/(232Th)o. Despite this, simple correlations between age-corrected Th isotope ratio and concentration of U or Th are lacking (Fig. 8c,d), as are cor-relations with other elements/oxides (not shown; e.g., MgO, Na2O, Zr, Nb). A goodexample of the lack of simple systematics is the observation that samples with very simi-lar, high Th concentrations (AFBP-1, AFBP-5, MP-1, and ICB-9) have (230Th)/(232Th)o
from ~0.91 to 0.97. Similarly, samples with low Th concentrations (PONTIR and ICHB-6a) have (230Th)/(232Th)o of ~0.95 and 0.91, respectively. These observations collectivelypreclude simple two-component mixing as the explanation for the Th isotopic signatures.
The interpretation of the open-system history of Th in the magma body is further com-plicated by the following observations: (1) there are no systematic correlations betweenelements or oxides and the degree of disequilibrium, (230Th)/(238U)o. This, taken togetherwith the range of U, Th. vs. (230Th)/(232Th)o noted above, means it is difficult to reliablyidentify the least contaminated sample or establish the systematics of U-Th fractionationduring differentiation. (2) Examination of the (238U)/(232Th) of the high-MgO WMI indi-cates they are heterogeneous (0.45 to 1.36) and have a range that encompasses and exceedsthose of the CI samples. If this range represents potential fractionation that has affectedless-differentiated melts of the Campanian system, then it is difficult to systematicallydefine characteristics of U-Th fractionation in more differentiated melts. That is, it isunclear if the range (238U)/(232Th) in the pumice was inherited from heterogeneous parentalmagmas, was due to differentiation processes, or both. (3) Although the number of sam-ples analyzed for Th is somewhat restricted, there does not appear to be any correlationbetween (230Th)/(238U)o or (230Th)/(238U)o and sample locality.
Sr isotope data for Campanian samples published by Civetta et al. (1997) include acid-leached data for pumice, glass, and feldspar. Figure 9 illustrates the systematics of 87Sr/86Srvs. Sr concentration (by ICP) in the pumice. Note that no Sr concentration data are avail-able for the glass and feldspar data, so Figure 9 is intended to illustrate pumice Sr isotope-concentration systematics and provide a visual comparison of 87Sr/86Sr for pumice, glass,and feldspar from the same sample. Observations and interpretations relevant to this dis-cussion from Civetta et al. (1997) include (1) samples were acid-leached, and residue andleachate (with only a few exceptions) yielded similar 87Sr/86Sr; thus the authors conclude itis unlikely that the range in pumice 87Sr/86Sr is the result of post-eruptive alteration. (2)Pumice 87Sr/86Sr are broadly correlated with Sr concentration; the least Sr-rich samples arethose with the most radiogenic 87Sr/86Sr. (3) Feldspars exhibit isotopic disequilibrium withpumice. For most feldspar, 87Sr/86Sr range is small, and feldspar signatures are less radi-ogenic than pumice or glass. Exceptions include two samples that have relatively radiogenic87Sr/86Sr; these are associated with pumice that has relatively low Sr concentration (Fig. 9).
The hypothesis that was favored by Civetta et al. (1997) to explain the disequilibria andthe change in 87Sr/86Sr among the pumice (including the systematic relationship with Srconcentration) was contamination after feldspar formation. They call on a model thatpotentially involves interaction between hydrothermal fluids and magma prior to eruption.
278 W.A. Bohrson et al.
Else_DV-DEVIVO_ch013.qxd 4/17/2006 5:55 PM Page 278
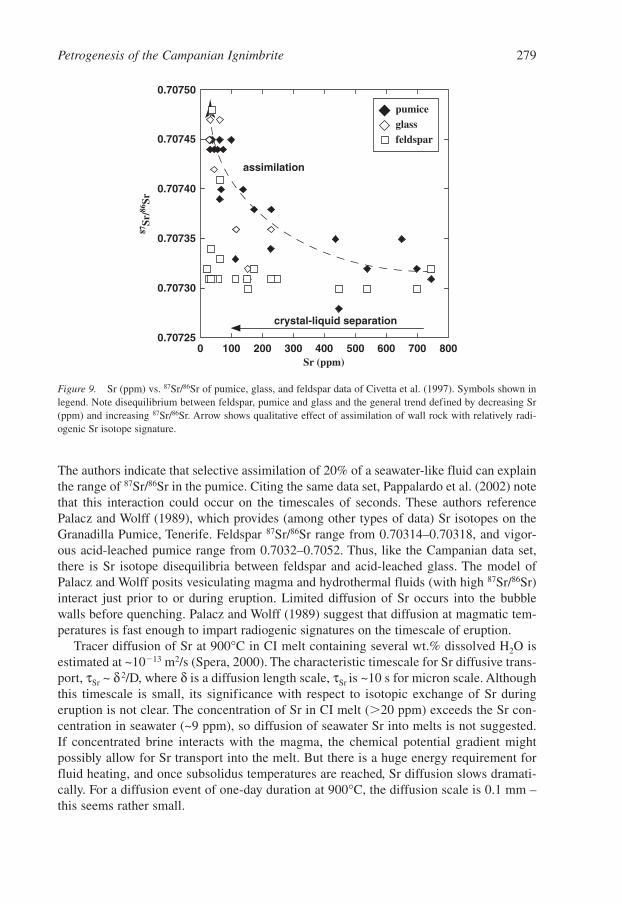
The authors indicate that selective assimilation of 20% of a seawater-like fluid can explainthe range of 87Sr/86Sr in the pumice. Citing the same data set, Pappalardo et al. (2002) notethat this interaction could occur on the timescales of seconds. These authors referencePalacz and Wolff (1989), which provides (among other types of data) Sr isotopes on theGranadilla Pumice, Tenerife. Feldspar 87Sr/86Sr range from 0.70314–0.70318, and vigor-ous acid-leached pumice range from 0.7032–0.7052. Thus, like the Campanian data set,there is Sr isotope disequilibria between feldspar and acid-leached glass. The model ofPalacz and Wolff posits vesiculating magma and hydrothermal fluids (with high 87Sr/86Sr)interact just prior to or during eruption. Limited diffusion of Sr occurs into the bubblewalls before quenching. Palacz and Wolff (1989) suggest that diffusion at magmatic tem-peratures is fast enough to impart radiogenic signatures on the timescale of eruption.
Tracer diffusion of Sr at 900°C in CI melt containing several wt.% dissolved H2O isestimated at ~10�13 m2/s (Spera, 2000). The characteristic timescale for Sr diffusive trans-port, τSr ~ δ 2/D, where δ is a diffusion length scale, τSr is ~10 s for micron scale. Althoughthis timescale is small, its significance with respect to isotopic exchange of Sr duringeruption is not clear. The concentration of Sr in CI melt (�20 ppm) exceeds the Sr con-centration in seawater (~9 ppm), so diffusion of seawater Sr into melts is not suggested.If concentrated brine interacts with the magma, the chemical potential gradient mightpossibly allow for Sr transport into the melt. But there is a huge energy requirement forfluid heating, and once subsolidus temperatures are reached, Sr diffusion slows dramati-cally. For a diffusion event of one-day duration at 900°C, the diffusion scale is 0.1 mm –this seems rather small.
Petrogenesis of the Campanian Ignimbrite 279
87Sr
/86Sr
Sr (ppm)
0.70725
0.70730
0.70735
0.70740
0.70745
0.70750
0 100 200 300 400 500 600 700 800
pumiceglassfeldspar
crystal-liquid separation
assimilation
Figure 9. Sr (ppm) vs. 87Sr/86Sr of pumice, glass, and feldspar data of Civetta et al. (1997). Symbols shown inlegend. Note disequilibrium between feldspar, pumice and glass and the general trend defined by decreasing Sr(ppm) and increasing 87Sr/86Sr. Arrow shows qualitative effect of assimilation of wall rock with relatively radi-ogenic Sr isotope signature.
Else_DV-DEVIVO_ch013.qxd 4/17/2006 5:55 PM Page 279
Magma–fluid interaction has been provided as an explanation for open-system signa-tures in Phlegrean Fields as well as other locations (e.g., Hildreth et al., 1984; Clocchiattiet al., 1988; Villemant, 1988; Michaud, 1995; Villemant et al., 1996). Several observations,some of which are noted in papers referenced above, are relevant to this hypothesis. First,any proposal that invokes addition of fluid to a magma body must grapple with the fluidconditions therein. It is unlikely that fluid will flow into a fluid-saturated magma becauseof lack of a H2O chemical potential gradient (e.g., Taylor, 1974, 1977, 1980, 1986).Second, fluids need to come to total or partial thermal equilibrium with magma at tem-peratures of ~900–1100°C and must therefore be heated considerably from shallow mete-oric values of ~100–200°C. For fluids at crustal temperatures, such heating requiresenthalpy delivered from the magma body. A simple calculation of energy balance placesreasonable limits on the mass of fluid that can be involved in such an interaction. For a sin-gle mass of magma (i.e., no recharge), the maximum energy available to heat crustal fluidis the sum of the sensible and latent heat. For a magma similar in composition and prop-erties to the Campanian (Tliquidus � 1236°C; Tsolidus � 866°C, ∆H � 396 kJ kg�1, Cpm �1484 J kg�1 K�1) and heat capacity of supercritical H2O of 4 kJ kg�1 K�1, the maximumfluid to magma ratio is ~0.3. We note that this is an extreme case because the calculationassumes all of the thermal potential of the magma body is used for heating of initial coolfluid and the chamber must crystallize fully, thus rendering an eruption impossible.However, if we neglect these extreme limitations for purposes of illustration, a third con-straint, one of mass balance, can be constructed for magma–fluid interaction. In this case,we use the Sr isotope characteristics of the Campanian samples of Civetta et al. (1997).Using a nominal feldspar 87Sr/86Sr value of 0.70731 as an initial value and the range of Srconcentration and 87Sr/86Sr from the pumice, the required fluid to magma ratios to invokethe observed isotopic shift range from ~0.3 to ~0.9. To decrease the high water to magmaratio to ~0.3 (the approximate limit from thermal balance), the concentration of Sr in ahydrothermal fluid would have to be three times that in seawater, assuming seawater-like87Sr/86Sr of ~0.709.
Although it is unlikely that the Th isotopes characteristics of the Campanian samplesare due to magma–fluid interaction, particularly because the best-fit MELTS model indi-cates the Campanian magmatic system was vapor-saturated in the compositional rangerepresented by the ignimbrite samples included in this study, it is instructive to examinethe mass balance arguments because the concentration of Th in seawater is orders of mag-nitude less than that found in typical igneous rocks. Seawater has a variable but high toextremely high (230Th)/(232Th) (4-300, Roy-Barman et al., 1996). Despite this, large water-to-magma ratios are typically required to produce isotopic changes in magmas because ofthe very low (pg/g) concentration of Th in typical seawater. For example, for an average(230Th)/(232Th) of 100 and a Th concentration of ~0.008 ppb (the highest reported for eitherseawater or mid-ocean ridge hydrothermal fluids (Chen et al., 1986; Chen, 1987) water-to-magma ratios required to produce a (230Th)/(232Th) range from ~0.91 to 0.98, assuming themagma has ~11 ppm Th, are on the order of tens to hundreds. Clearly such interactions arenot possible based on thermal constraints noted above, and even if such interaction couldoccur, these high water-to-magma ratios would predict seawater-like Sr isotopes (~0.709)in CI pumice, which is not observed.
In summary, hypotheses that invoke fluid–magma interaction must be evaluated in thecontext of chemical potential gradients for fluid, and allowable thermal (energy) and
280 W.A. Bohrson et al.
Else_DV-DEVIVO_ch013.qxd 4/17/2006 5:55 PM Page 280
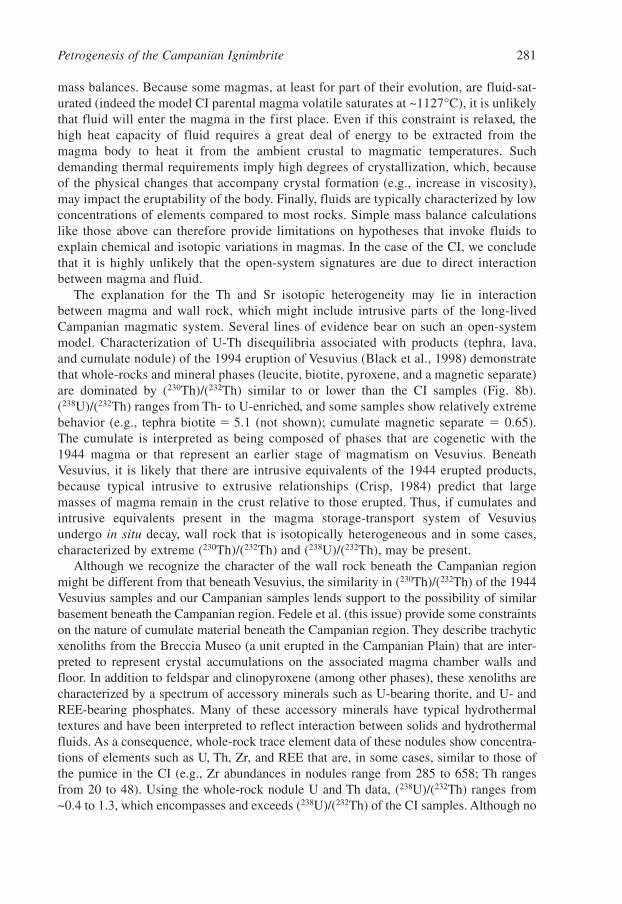
mass balances. Because some magmas, at least for part of their evolution, are fluid-sat-urated (indeed the model CI parental magma volatile saturates at ~1127°C), it is unlikelythat fluid will enter the magma in the first place. Even if this constraint is relaxed, thehigh heat capacity of fluid requires a great deal of energy to be extracted from themagma body to heat it from the ambient crustal to magmatic temperatures. Suchdemanding thermal requirements imply high degrees of crystallization, which, becauseof the physical changes that accompany crystal formation (e.g., increase in viscosity),may impact the eruptability of the body. Finally, fluids are typically characterized by lowconcentrations of elements compared to most rocks. Simple mass balance calculationslike those above can therefore provide limitations on hypotheses that invoke fluids toexplain chemical and isotopic variations in magmas. In the case of the CI, we concludethat it is highly unlikely that the open-system signatures are due to direct interactionbetween magma and fluid.
The explanation for the Th and Sr isotopic heterogeneity may lie in interactionbetween magma and wall rock, which might include intrusive parts of the long-livedCampanian magmatic system. Several lines of evidence bear on such an open-systemmodel. Characterization of U-Th disequilibria associated with products (tephra, lava,and cumulate nodule) of the 1994 eruption of Vesuvius (Black et al., 1998) demonstratethat whole-rocks and mineral phases (leucite, biotite, pyroxene, and a magnetic separate)are dominated by (230Th)/(232Th) similar to or lower than the CI samples (Fig. 8b).(238U)/(232Th) ranges from Th- to U-enriched, and some samples show relatively extremebehavior (e.g., tephra biotite � 5.1 (not shown); cumulate magnetic separate � 0.65).The cumulate is interpreted as being composed of phases that are cogenetic with the1944 magma or that represent an earlier stage of magmatism on Vesuvius. BeneathVesuvius, it is likely that there are intrusive equivalents of the 1944 erupted products,because typical intrusive to extrusive relationships (Crisp, 1984) predict that largemasses of magma remain in the crust relative to those erupted. Thus, if cumulates andintrusive equivalents present in the magma storage-transport system of Vesuviusundergo in situ decay, wall rock that is isotopically heterogeneous and in some cases,characterized by extreme (230Th)/(232Th) and (238U)/(232Th), may be present.
Although we recognize the character of the wall rock beneath the Campanian regionmight be different from that beneath Vesuvius, the similarity in (230Th)/(232Th) of the 1944Vesuvius samples and our Campanian samples lends support to the possibility of similarbasement beneath the Campanian region. Fedele et al. (this issue) provide some constraintson the nature of cumulate material beneath the Campanian region. They describe trachyticxenoliths from the Breccia Museo (a unit erupted in the Campanian Plain) that are inter-preted to represent crystal accumulations on the associated magma chamber walls andfloor. In addition to feldspar and clinopyroxene (among other phases), these xenoliths arecharacterized by a spectrum of accessory minerals such as U-bearing thorite, and U- andREE-bearing phosphates. Many of these accessory minerals have typical hydrothermaltextures and have been interpreted to reflect interaction between solids and hydrothermalfluids. As a consequence, whole-rock trace element data of these nodules show concentra-tions of elements such as U, Th, Zr, and REE that are, in some cases, similar to those ofthe pumice in the CI (e.g., Zr abundances in nodules range from 285 to 658; Th rangesfrom 20 to 48). Using the whole-rock nodule U and Th data, (238U)/(232Th) ranges from~0.4 to 1.3, which encompasses and exceeds (238U)/(232Th) of the CI samples. Although no
Petrogenesis of the Campanian Ignimbrite 281
Else_DV-DEVIVO_ch013.qxd 4/17/2006 5:55 PM Page 281
(230Th)/(232Th) are available for these samples, if the range is similar to those in this studyand the Vesuvius study, then aging of such material will provide basement that is isotopi-cally heterogeneous. In addition, the nodules may provide a source of trace elements andif extensive hydrothermal interaction has affected basement rocks, then their Sr isotopesignatures would be displaced toward the value of modern seawater, ~0.709.
A reasonable hypothesis regarding the open-system signatures of the CI system is thatmagmas interacted with heterogeneous wall rock composed of cumulates and intrusiveequivalents of the volcanic products exposed in the Campanian region. Sr isotope disequi-libria between feldspar and pumice/glass suggest that assimilation occurred largely duringfeldspar growth, particularly because of the two feldspar samples that have relatively high87Sr/86Sr; assuming these signatures are primary, these feldspars would not have such ele-vated signatures if assimilation occurred strictly after feldspar growth. Figures 8c,d mayprovide additional evidence that assimilation occurred as the magma body was undergoingcrystal–liquid separation. These figures illustrate that, despite the relatively systematic rela-tionship shown on the age-corrected isochron diagram (Fig. 8b), there is no simple correla-tion between Th, U concentration and isotope ratio. This precludes two-component mixing,and our attempts to model such data arrays with energy-constrained assimilation-fractionalcrystallization (EC-AFC, Spera and Bohrson, 2001; Bohrson and Spera, 2001) failed toreproduce the isotope-concentration relationships. The EC-AFC formulation does notmodel zoning in magma bodies, and therefore, the failure of the model to reproduce theobserved trends may be tied to the compositional heterogeneity that is produced as themagma body evolves. The Th, U vs. isotope array may reflect assimilation in a magma bodythat is undergoing compositional zonation. Thus, as feldspar (and other phases) form, theresidual liquid becomes compositionally zoned. At the same time, heterogeneous basementthat has been heated to its solidus or above can partially melt and be incorporated into thisevolving magma body (Fig. 8c,d). Thus, magmas with distinct Th and U concentrationsinteract with partial melts of heterogeneous basement to yield this compositionally complexsuite of samples.
The idea that assimilation is occurring as the magma body is zoning may also be sup-ported by the Sr concentration-isotope data of Civetta et al. (1997). Examination of Figure9 (and other element vs. 87Sr/86Sr trends not shown) shows that there are pumice samplesthat range in Sr concentration from ~650 to 100 ppm. 87Sr/86Sr of these vary from 0.70733to 0.70735, which is likely to be close to reproducibility. Thus, this implies that magmaswith very different Sr concentrations have similar 87Sr/86Sr. Likewise, pumice with ~100 ppm Sr range in 87Sr/86Sr from 0.70733 to 0.70745. We do note the general trend ofincreasing 87Sr/86Sr with decreasing Sr concentration; such a trend is consistent with gen-eral mass balance constraints for assimilation affecting low-Sr magmas. However, theranges cited above highlight potential complexity of such a process. Like U, Th vs.(230Th)/(232Th), there seem to be complex relationships between isotopic and elemental sig-natures. This may provide support for the idea that assimilation occurred as magma cham-ber zoning and crystal growth occurred.
The hypothesis that partial melts of cumulates and intrusive equivalents of magmas thathave erupted on the Campanian Plain represent a potential assimilant may also be consis-tent with the trace element data. Trace element numerical model results provide poor fitsfor Sm and Th, which strongly implicates open-system processes. Some open-system con-tribution to Nb, Zr, and U are permissible, based on the modeling results. Partial melting
282 W.A. Bohrson et al.
Else_DV-DEVIVO_ch013.qxd 4/17/2006 5:55 PM Page 282
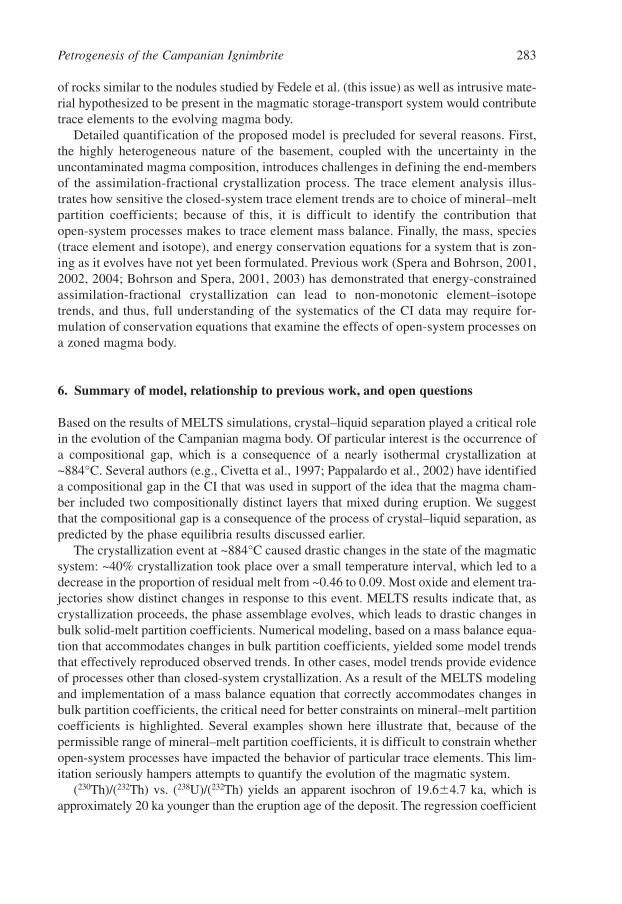
of rocks similar to the nodules studied by Fedele et al. (this issue) as well as intrusive mate-rial hypothesized to be present in the magmatic storage-transport system would contributetrace elements to the evolving magma body.
Detailed quantification of the proposed model is precluded for several reasons. First,the highly heterogeneous nature of the basement, coupled with the uncertainty in theuncontaminated magma composition, introduces challenges in defining the end-membersof the assimilation-fractional crystallization process. The trace element analysis illus-trates how sensitive the closed-system trace element trends are to choice of mineral–meltpartition coefficients; because of this, it is difficult to identify the contribution thatopen-system processes makes to trace element mass balance. Finally, the mass, species(trace element and isotope), and energy conservation equations for a system that is zon-ing as it evolves have not yet been formulated. Previous work (Spera and Bohrson, 2001,2002, 2004; Bohrson and Spera, 2001, 2003) has demonstrated that energy-constrainedassimilation-fractional crystallization can lead to non-monotonic element–isotopetrends, and thus, full understanding of the systematics of the CI data may require for-mulation of conservation equations that examine the effects of open-system processes ona zoned magma body.
6. Summary of model, relationship to previous work, and open questions
Based on the results of MELTS simulations, crystal–liquid separation played a critical rolein the evolution of the Campanian magma body. Of particular interest is the occurrence ofa compositional gap, which is a consequence of a nearly isothermal crystallization at~884°C. Several authors (e.g., Civetta et al., 1997; Pappalardo et al., 2002) have identifieda compositional gap in the CI that was used in support of the idea that the magma cham-ber included two compositionally distinct layers that mixed during eruption. We suggestthat the compositional gap is a consequence of the process of crystal–liquid separation, aspredicted by the phase equilibria results discussed earlier.
The crystallization event at ~884°C caused drastic changes in the state of the magmaticsystem: ~40% crystallization took place over a small temperature interval, which led to adecrease in the proportion of residual melt from ~0.46 to 0.09. Most oxide and element tra-jectories show distinct changes in response to this event. MELTS results indicate that, ascrystallization proceeds, the phase assemblage evolves, which leads to drastic changes inbulk solid-melt partition coefficients. Numerical modeling, based on a mass balance equa-tion that accommodates changes in bulk partition coefficients, yielded some model trendsthat effectively reproduced observed trends. In other cases, model trends provide evidenceof processes other than closed-system crystallization. As a result of the MELTS modelingand implementation of a mass balance equation that correctly accommodates changes inbulk partition coefficients, the critical need for better constraints on mineral–melt partitioncoefficients is highlighted. Several examples shown here illustrate that, because of thepermissible range of mineral–melt partition coefficients, it is difficult to constrain whetheropen-system processes have impacted the behavior of particular trace elements. This lim-itation seriously hampers attempts to quantify the evolution of the magmatic system.
(230Th)/(232Th) vs. (238U)/(232Th) yields an apparent isochron of 19.6�4.7 ka, which isapproximately 20 ka younger than the eruption age of the deposit. The regression coefficient
Petrogenesis of the Campanian Ignimbrite 283
Else_DV-DEVIVO_ch013.qxd 4/17/2006 5:55 PM Page 283
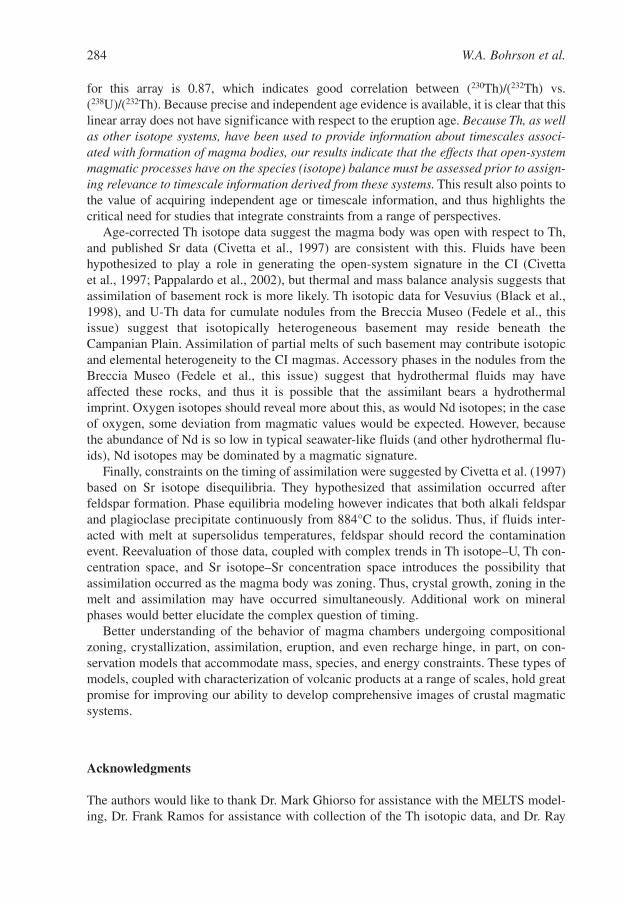
for this array is 0.87, which indicates good correlation between (230Th)/(232Th) vs.(238U)/(232Th). Because precise and independent age evidence is available, it is clear that thislinear array does not have significance with respect to the eruption age. Because Th, as wellas other isotope systems, have been used to provide information about timescales associ-ated with formation of magma bodies, our results indicate that the effects that open-systemmagmatic processes have on the species (isotope) balance must be assessed prior to assign-ing relevance to timescale information derived from these systems. This result also points tothe value of acquiring independent age or timescale information, and thus highlights thecritical need for studies that integrate constraints from a range of perspectives.
Age-corrected Th isotope data suggest the magma body was open with respect to Th,and published Sr data (Civetta et al., 1997) are consistent with this. Fluids have beenhypothesized to play a role in generating the open-system signature in the CI (Civetta et al., 1997; Pappalardo et al., 2002), but thermal and mass balance analysis suggests thatassimilation of basement rock is more likely. Th isotopic data for Vesuvius (Black et al.,1998), and U-Th data for cumulate nodules from the Breccia Museo (Fedele et al., thisissue) suggest that isotopically heterogeneous basement may reside beneath theCampanian Plain. Assimilation of partial melts of such basement may contribute isotopicand elemental heterogeneity to the CI magmas. Accessory phases in the nodules from theBreccia Museo (Fedele et al., this issue) suggest that hydrothermal fluids may haveaffected these rocks, and thus it is possible that the assimilant bears a hydrothermalimprint. Oxygen isotopes should reveal more about this, as would Nd isotopes; in the caseof oxygen, some deviation from magmatic values would be expected. However, becausethe abundance of Nd is so low in typical seawater-like fluids (and other hydrothermal flu-ids), Nd isotopes may be dominated by a magmatic signature.
Finally, constraints on the timing of assimilation were suggested by Civetta et al. (1997)based on Sr isotope disequilibria. They hypothesized that assimilation occurred afterfeldspar formation. Phase equilibria modeling however indicates that both alkali feldsparand plagioclase precipitate continuously from 884°C to the solidus. Thus, if fluids inter-acted with melt at supersolidus temperatures, feldspar should record the contaminationevent. Reevaluation of those data, coupled with complex trends in Th isotope–U, Th con-centration space, and Sr isotope–Sr concentration space introduces the possibility thatassimilation occurred as the magma body was zoning. Thus, crystal growth, zoning in themelt and assimilation may have occurred simultaneously. Additional work on mineralphases would better elucidate the complex question of timing.
Better understanding of the behavior of magma chambers undergoing compositionalzoning, crystallization, assimilation, eruption, and even recharge hinge, in part, on con-servation models that accommodate mass, species, and energy constraints. These types ofmodels, coupled with characterization of volcanic products at a range of scales, hold greatpromise for improving our ability to develop comprehensive images of crustal magmaticsystems.
Acknowledgments
The authors would like to thank Dr. Mark Ghiorso for assistance with the MELTS model-ing, Dr. Frank Ramos for assistance with collection of the Th isotopic data, and Dr. Ray
284 W.A. Bohrson et al.
Else_DV-DEVIVO_ch013.qxd 4/17/2006 5:55 PM Page 284
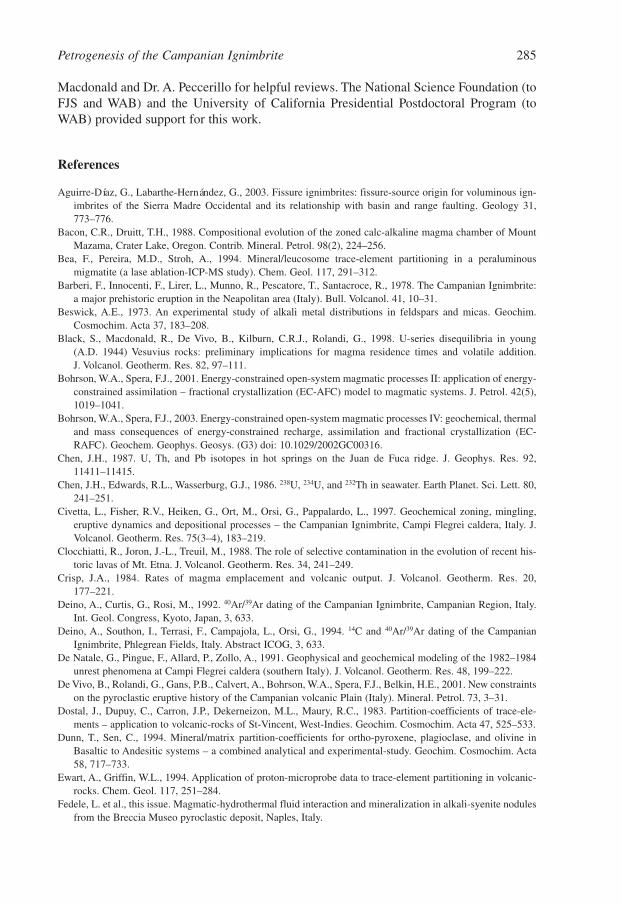
Macdonald and Dr. A. Peccerillo for helpful reviews. The National Science Foundation (toFJS and WAB) and the University of California Presidential Postdoctoral Program (toWAB) provided support for this work.
References
Aguirre-Díaz, G., Labarthe-Hernández, G., 2003. Fissure ignimbrites: fissure-source origin for voluminous ign-imbrites of the Sierra Madre Occidental and its relationship with basin and range faulting. Geology 31,773–776.
Bacon, C.R., Druitt, T.H., 1988. Compositional evolution of the zoned calc-alkaline magma chamber of MountMazama, Crater Lake, Oregon. Contrib. Mineral. Petrol. 98(2), 224–256.
Bea, F., Pereira, M.D., Stroh, A., 1994. Mineral/leucosome trace-element partitioning in a peraluminousmigmatite (a lase ablation-ICP-MS study). Chem. Geol. 117, 291–312.
Barberi, F., Innocenti, F., Lirer, L., Munno, R., Pescatore, T., Santacroce, R., 1978. The Campanian Ignimbrite:a major prehistoric eruption in the Neapolitan area (Italy). Bull. Volcanol. 41, 10–31.
Beswick, A.E., 1973. An experimental study of alkali metal distributions in feldspars and micas. Geochim.Cosmochim. Acta 37, 183–208.
Black, S., Macdonald, R., De Vivo, B., Kilburn, C.R.J., Rolandi, G., 1998. U-series disequilibria in young (A.D. 1944) Vesuvius rocks: preliminary implications for magma residence times and volatile addition. J. Volcanol. Geotherm. Res. 82, 97–111.
Bohrson, W.A., Spera, F.J., 2001. Energy-constrained open-system magmatic processes II: application of energy-constrained assimilation – fractional crystallization (EC-AFC) model to magmatic systems. J. Petrol. 42(5),1019–1041.
Bohrson, W.A., Spera, F.J., 2003. Energy-constrained open-system magmatic processes IV: geochemical, thermaland mass consequences of energy-constrained recharge, assimilation and fractional crystallization (EC-RAFC). Geochem. Geophys. Geosys. (G3) doi: 10.1029/2002GC00316.
Chen, J.H., 1987. U, Th, and Pb isotopes in hot springs on the Juan de Fuca ridge. J. Geophys. Res. 92,11411–11415.
Chen, J.H., Edwards, R.L., Wasserburg, G.J., 1986. 238U, 234U, and 232Th in seawater. Earth Planet. Sci. Lett. 80,241–251.
Civetta, L., Fisher, R.V., Heiken, G., Ort, M., Orsi, G., Pappalardo, L., 1997. Geochemical zoning, mingling,eruptive dynamics and depositional processes – the Campanian Ignimbrite, Campi Flegrei caldera, Italy. J.Volcanol. Geotherm. Res. 75(3–4), 183–219.
Clocchiatti, R., Joron, J.-L., Treuil, M., 1988. The role of selective contamination in the evolution of recent his-toric lavas of Mt. Etna. J. Volcanol. Geotherm. Res. 34, 241–249.
Crisp, J.A., 1984. Rates of magma emplacement and volcanic output. J. Volcanol. Geotherm. Res. 20,177–221.
Deino, A., Curtis, G., Rosi, M., 1992. 40Ar/39Ar dating of the Campanian Ignimbrite, Campanian Region, Italy.Int. Geol. Congress, Kyoto, Japan, 3, 633.
Deino, A., Southon, I., Terrasi, F., Campajola, L., Orsi, G., 1994. 14C and 40Ar/39Ar dating of the CampanianIgnimbrite, Phlegrean Fields, Italy. Abstract ICOG, 3, 633.
De Natale, G., Pingue, F., Allard, P., Zollo, A., 1991. Geophysical and geochemical modeling of the 1982–1984unrest phenomena at Campi Flegrei caldera (southern Italy). J. Volcanol. Geotherm. Res. 48, 199–222.
De Vivo, B., Rolandi, G., Gans, P.B., Calvert, A., Bohrson, W.A., Spera, F.J., Belkin, H.E., 2001. New constraintson the pyroclastic eruptive history of the Campanian volcanic Plain (Italy). Mineral. Petrol. 73, 3–31.
Dostal, J., Dupuy, C., Carron, J.P., Dekerneizon, M.L., Maury, R.C., 1983. Partition-coefficients of trace-ele-ments – application to volcanic-rocks of St-Vincent, West-Indies. Geochim. Cosmochim. Acta 47, 525–533.
Dunn, T., Sen, C., 1994. Mineral/matrix partition-coefficients for ortho-pyroxene, plagioclase, and olivine inBasaltic to Andesitic systems – a combined analytical and experimental-study. Geochim. Cosmochim. Acta58, 717–733.
Ewart, A., Griffin, W.L., 1994. Application of proton-microprobe data to trace-element partitioning in volcanic-rocks. Chem. Geol. 117, 251–284.
Fedele, L. et al., this issue. Magmatic-hydrothermal fluid interaction and mineralization in alkali-syenite nodulesfrom the Breccia Museo pyroclastic deposit, Naples, Italy.
Petrogenesis of the Campanian Ignimbrite 285
Else_DV-DEVIVO_ch013.qxd 4/17/2006 5:55 PM Page 285
Fisher, R.V., Orsi, G., Ort, M., Heiken, G., 1993. Mobility of a large-volume pyroclastic flow – emplacement ofthe Campanian ignimbrite, Italy. J. Volcanol. Geotherm. Res. 56(3), 205–220.
Florio, G., Fedi, M., Cella, F., Rapolla, A., 1999. The Campanian Plain and Phlegrean Fields: structural settingfrom potential field data. J. Volcanol. Geotherm. Res. 91, 361–379.
Fujimaki, H., 1986. Partition-coefficients of Hf, Zr, and REE between zircon, apatite, and liquid. Contrib.Mineral. Petrol. 94, 42–45.
Ghiorso, M.S., Sack, R.O., 1995. Chemical mass transfer in magmatic processes IV. A revised and internally con-sistent thermodynamic model for the interpolation and extrapolation of liquid-solid equilibria in magmaticsystems at elevated temperatures and pressures. Contrib. Mineral. Petrol. 119, 197–212.
Haskin, L.A., Frey, F.A., Schmitt, R.A., Smith, R.H., 1966. Meteoritic, solar and terrestrial rare-earth distributions.Phys. Chem. Earth 7, 167–321.
Higuchi, H., Nagasawa, H., 1969. Partition of trace elements between rock-forming minerals and the host volcanicrocks. Earth Planet. Sci. Lett. 7, 281–287.
Hildreth, W., 1979. The Bishop Tuff: evidence for the origin of compositional zonation in silicic magma cham-bers. Geol. Soc. Am. Special Paper, 180, 43–75.
Hildreth, W., 1981. Gradients in silicic magma chambers: implications for lithospheric magmatism. J. Geophys.Res. 86(B11), 10153–10192.
Hildreth, W., Christiansen, R.L., O’Neil, J.R., 1984. Catastrophic isotopic modification of rhyolitic magma attimes of caldera subsidence, Yellowstone Plateau volcanic field. J. Geophys. Res. 89(B10), 8339–8369.
Keleman, P.B., Dunn, J.T., 1992. Depletion of Nb relative to other highly incompatible elements by melt/rockreaction in the upper mantle. EOS 73, 656–657.
Kress, V.C., Ghiorso, M.S., 2004. Thermodynamic modeling of post-entrapment crystallization in igneous phase.J. Volcanol. Geotherm. Res. 137, 247–260.
Larsen, L.M., 1979. Distribution of REE and other trace-elements between phenocrysts and peralkaline undersatu-rated magmas, exemplified by rocks from the Gardar Igneous Province, South Greenland. Lithos. 12, 303–315.
Leeman, W., Phelps, D., 1981. Partitioning of rare earths and other trace elements between sanidine and coexist-ing volcanic glass. J. Geophys. Res. 86, 10193–10199.
Le Maitre, R.W., Bateman, P., Dudek, A., Keller, J., Lameyre, J., Le Bas, M.J., Sabine, P.A., Schmid, R.,Sorensen, H., Streckeisen, A., Woolley, A.R., Zanettin, B., 1989. A Classification of Igneous Rocks andGlossary of Terms: Recommendations of the International Union of Geological Sciences Subcommission onthe Systematics of Igneous Rocks. Blackwell Scientific Publications, Oxford, UK.
Lirer, L., Luongo, G., Scandone, R., 1987. On the volcanological evolution of Campi Flegrei. EOS Trans. Am.Geophys. Union 68, 226–234.
Luhr, J.F., Carmichael, I.S.E., Varekamp, J.C., 1984. The 1982 eruptions of El Chichon volcano, Chiapas, Mexico:mineralogy and petrology of the anhydrite-bearing pumices. J. Volcanol. Geotherm. Res. 23, 69–108.
Mahood, G.A., Hildreth, E.W., 1983. Large partition coefficients for trace elements in high-silica rhyolites.Geochim. Cosmochim. Acta 47, 11–30.
Mahood, G.A., Stimac, J.A., 1990. Trace-element partitioning in pantellerites and trachytes. Geochim.Cosmochim. Acta 54, 2257–2276.
Michaud, V., 1995. Crustal xenoliths in recent hawaiites from Mount Etna, Italy: evidence for alkali exchangesduring magma-wall rock interaction. Chem. Geol. 122(1–4), 21–42.
Nash, W.P., Crecraft, H.R., 1985. Partition coefficients for trace elements in silicic magmas. Geochim.Cosmochim. Acta 49, 2309–2322.
Nagasawa, H., 1970. Rare earth concentrations in zircon and apatite and their host dacite and granites. EarthPlanet. Sci. Lett. 9, 359–364.
Nagasawa, H., Schnetzler, C.C., 1971. Partitioning of rare earth, alkali, and alkaline earth elements between phe-nocrysts and acidic igneous magmas. Geochim. Cosmochim. Acta 35, 953–968.
Nielsen, R.L., Gallahan, W.E., Newberger, F., 1992. Experimentally determined mineral-melt partition coeffi-cients for Sc, Y and REE for olivine, orthopyroxene, pigeonite, magnetite and ilmenite. Contrib. Mineral.Petrol. 110, 488–499.
Orsi, G., De Vita, S., Di Vito, M., 1996. The restless, resurgent Campi Flegrei nested caldera (Italy): constraintson its evolution and configuration. J. Volcanol. Geotherm. Res. 74(3–4), 179–214.
Ort, M.H., Rosi, M., Anderson, C.D., 1999. Correlation of deposits and vent locations of the proximal CampanianIgnimbrite deposits, Campi Flegrei, Italy, based on natural remnant magnetization and anisotropy of magneticsusceptibility characteristics. J. Volcanol. Geotherm. Res. 91(2–4), 167–178.
286 W.A. Bohrson et al.
Else_DV-DEVIVO_ch013.qxd 4/17/2006 5:55 PM Page 286
Palacz, Z.A., Wolff, J.A., 1989. Strontium, neodymium and lead isotope characteristics of the Granadilla Pumice, Tenerife: a study of the causes of strontium isotope disequilibrium in felsic pyroclastic deposits. In: A.D. Saunders (Ed.), Magmatism in the Ocean Basins. Geological Society Special Publication, 42,pp. 147–159.
Pappalardo, L., DiVitro, M., Orsi, G., Carandente, A., Fisher, R.V., Civetta, L., deVita, S., 2002. Timing ofmagma extraction during the Campanian Ignimbrite eruption (Campi Flegrei Caldera). J. Volcanol.Geotherm. Res. 114(3–4), 479–497.
Philpotts, J.A., Schnetzler, C.C., 1970. Phenocryst-matrix partition coefficients for K, Rb, Sr and Ba, with appli-cations to anorthosite and basalt genesis. Geochim. Cosmochim. Acta 34, 307–322.
Reid, F., 1983. Origin of the rhyolitic rocks of the Taupo Volcanic Zone, New Zealand. J. Volcanol. Geotherm.Res. 15, 315–338.
Reid, M.R., 1995. Processes of mantle enrichment and magmatic differentiation in the eastern Snake River plain.Th isotope evidence. Earth Planet. Sci. Lett. 131, 239–254.
Rolandi, G., Belluci, F., Heizler, M.T., Belkin, H.E., De Vivo, B., 2003. Tectonic controls on the genesis ofIgnimbrites from the Campanian Volcanic Zone, southern Italy. Mineral. Petrol. 79, 3–31.
Rosi, M., Sbrana, A. (Eds), 1987. Phlegrean Fields, 114. Consiglio Nazionale Delle Ricerche, Rome, 175 pp.Rosi, M., Sbrana, A., Principe, C., 1983. The Phlegrean Fields: structural evolution, volcanic history, and erup-
tive mechanisms. J. Volcanol. Geotherm. Res. 17, 273–288.Rosi, M., Vezzoli, L., Aleotti, P., Censi, M.D., 1996. Interaction between caldera collapse and eruptive dynamics
during the Campanian Ignimbrite eruption, Phlegrean Fields, Italy. Bull. Volcanol. 57, 541–554.Roy-Barman, M., Chen, J.H., Wasserburg, G.J., 1996. 230Th-232Th systematics in the central Pacific Ocean: the
sources and the fates of thorium. Earth Planet. Sci. Lett. 139, 351–363.Scacchi, A., 1890. La regione vulcanica fluorifera della Campanian (II Edition). Mem. Regio. Comm. Geol. It., 4.Scandone, R., Bellucci, F., Lirer, L., Rolandi, G., 1991. The structure of the Campanian Plain and the activity of
the Neapolitan volcanoes (Italy). J. Volcanol. Geotherm. Res. 48, 1–31.Signorelli, S., Rosi, M., Vaggelli, G., Francalanci, L., 1999. Origin of magmas feeding the Plinian phase of the
Campanian Ignimbrite eruption, Phlegrean Fields (Italy): constraints based on matrix-glass and glass-inclusioncompositions. J. Volcanol. Geotherm. Res. 91(2–4), 199–220.
Smith, R.L., 1979. Ash-flow magmatism. Geol. Soc. Am. Special Paper 180, 5–27.Smith, R.L., Bailey, R.A., 1966. The Bandelier Tuff – a study of ash-flow eruption cycles from zoned magma
chambers. Bull. Volcanol. 29, 83–104.Spera, F.J., 1984. Some numerical experiments on the withdrawal of magma from crustal reservoirs. J. Geophys.
Res. 89(B10), 8222–8236.Spera, F.J., 2000. Physical properties of magmas. In: H. Sigurdsson (Ed.), Encyclopedia of Volcanoes. Academic
Press, San Francisco, pp. 171–190.Spera, F.J., Bohrson, W.A., 2001. Energy-constrained open-system magmatic processes I: general model
and energy-constrained assimilation and fractional crystallization (EC-AFC) formulation. J. Petrol. 42(5),999–1018.
Spera, F.J., Bohrson, W.A., 2002. Energy-constrained open-system magmatic processes III: energy-constrainedrecharge, assimilation and fractional crystallization (EC-RAFC). Geochem. Geophys. Geosyst. (G3) doi:10.1029/2002GC00315.
Spera, F.J., Bohrson, W.A., 2004. Open-system magma chamber evolution: an energy-constrained geochemicalmodel incorporating the effects of concurrent eruption, recharge, variable assimilation and fractional crystal-lization (EC’RAχFC). J. Petrol. 45(12), 2459–2480.
Stix, J., Gorton, M.P., 1990. Variations in trace-element partition-coefficients in Sanidine in the Cerro ToledoRhyolite, Jemez Mountains, New-Mexico – effects of composition, temperature, and volatiles. Geochim.Cosmochim. Acta 54, 2697–2708.
Swanson, E.R., McDowell, F.W., 1984. Calderas of the Sierra Madre Occidental volcanic field western Mexico.J. Geophys. Res. 89, 8787–8799.
Taylor, H.P., Jr., 1974. The application of oxygen and hydrogen isotope studies to problems of hydrothermal alter-ation and ore deposition. Econ. Geol. 69, 843–883.
Taylor, H.P., Jr., 1977. Water/rock interactions and the origin of H2O in granitic batholiths. J. Geol. Soc. Lond.133, 509–558.
Taylor, H.P., Jr., 1980. The effects of assimilation of country rock by magmas on 18O/16O and 87Sr/86Sr systemat-ics in igneous rocks. Earth Planet. Sci. Lett. 47, 243–254.
Petrogenesis of the Campanian Ignimbrite 287
Else_DV-DEVIVO_ch013.qxd 4/17/2006 5:55 PM Page 287
Taylor, H.P., Jr., 1986. Igneous rocks: II. Isotopic case studies of CircumPacific magmatism. In: Valley, J.W.,Taylor, J.H.P, O’Neil, J.R. (Eds), Reviews in Mineralogy, Vol. 16, Stable Isotopes in High TemperatureGeological Processes, Mineral Society of America, pp. 273–316.
Villemant, B., 1988. Trace element evolution in the Phlegrean Fields (Central Italy): fractional crystallization andselective enrichment. Contrib. Mineral. Petrol. 98, 169–183.
Villemant, B., Boudon, G., Komorowski, J.-C., 1996. U-series disequilibria in arc magmas induced by water-magma interaction. Earth Planet. Sci. Lett. 140, 259–267.
Villemant, B., Jaffrezic, H., Joron, J.L., Treuil, M., 1981. Distribution coefficients of major and trace-elements –fractional crystallization in the alkali basalt series of Chaine-Des-Puys (Massif Central, France). Geochim.Cosmochim. Acta 45, 1997–2016.
Watson, E.B., 1976. Glass inclusions as samples of early magmatic liquid: determinative method and applicationto a South Atlantic basalt. J. Volcanol. Geotherm. Res. 1, 73–84.
Watson, E.B., Green, T.H., 1981. Apatite/liquid partition coefficients for the rare earth elements and strontium.Earth Planet. Sci. Lett. 56, 405–421.
Webster, J.D., Raia, R., Tappen, C., De Vivo, B., 2003. Pre-eruptive geochemistry of the ignimbrite-forming mag-mas of the Campanian Volcanic Zone, Southern Italy, determined from silicate melt inclusions. Mineral.Petrol. 79, 99–125.
Wilson, C.J.N., Hildreth, W., 1997. The Bishop Tuff: new insights from eruptive stratigraphy. J. Geol. 105(4),407–439.
Worner, G., Schmincke, H.U., 1984a. Mineralogical and chemical zonation of the Laacher See tephra sequence(east Eifel, W. Germany). J. Petrol. 25(4), 805–835.
Worner, G., Schmincke, H.U., 1984b. Petrogenesis of the zoned Laacher See tephra. J. Petrol. 25(4), 836–851.
288 W.A. Bohrson et al.
Else_DV-DEVIVO_ch013.qxd 4/17/2006 5:55 PM Page 288


