Embed Size (px)
Citation preview

Evaluation of San Joaquin River Flow and Southern Delta Water Quality Objectives and Implementation
13-1 September 2016
ICF 00427.11
Chapter 13 Service Providers
13.1 Introduction This chapter describes the environmental setting for service providers and the regulatory
background associated with service providers. This chapter also evaluates the environmental
impacts on service providers that could result from the Lower San Joaquin River (LSJR) and
southern Delta water quality (SDWQ) alternatives, and, if applicable, offers mitigation measures that
would reduce or avoid any significant impacts.
This chapter describes the potential impacts of the LSJR and SDWQ alternatives associated with
service providers within the area of potential effects, which includes: the plan area, as described in
Chapter 1, Introduction; the Eastern San Joaquin, Modesto, Turlock, and Merced1 Subbasins; and
other areas outside the plan area with service providers that are affected by the alternatives. Service
providers discussed in this chapter are public providers of water supply for municipal, industrial,
and agricultural uses, and providers of wastewater treatment. Private wells that provide domestic
water supply are also included in this chapter.
The extended plan area, also described in Chapter 1, Introduction, generally includes the area
upstream of the rim dams.2 The area of potential effects for this area would be service providers in
this area relying on surface water diversions from the Stanislaus, Tuolumne, and Merced Rivers.
Unless otherwise noted, all discussion in this chapter refers to the area of potential effects below the
rim dams. Where appropriate, the extended plan area is specifically identified.
In Appendix B, State Water Board’s Environmental Checklist, the State Water Resources Control
Board (State Water Board) evaluated whether the plan amendments3 would cause any adverse
impact on resources in each of the listed environmental categories and provided a brief explanation
for its determinations. It determined that impacts on public services (e.g., fire protection, police
protection, schools, parks) and some impacts associated with utilities and service systems (e.g.,
stormwater drainage facilities, landfills) were either less than significant or had no impact. Impacts
in the checklist that are identified as “Potentially Significant Impacts” under utilities and service
systems or hydrology and water quality are discussed in detail in this chapter.
The State Water Board focuses the impact analysis in this chapter on specific issues associated with
the LSJR and SDWQ alternatives that are related to potentially significant impacts identified in
Appendix B (i.e., XVII b and IX a). The impacts listed below in Table 13-1 are specific to the LSJR and
SDWQ alternatives; they are modified, as appropriate, from the impacts listed in Appendix B to be
more relevant to effects that may occur in association with the alternatives. Particularly, they are
1 As described in Chapter 9, Groundwater Resources, the Merced Subbasin was extended for the analysis to include a part of the Chowchilla Subbasin, creating the Extended Merced Subbasin. 2 In this document, the term rim dams is used when referencing the three major dams and reservoirs on each of the eastside tributaries: New Melones Dam and Reservoir on the Stanislaus River; New Don Pedro Dam and Reservoir on the Tuolumne River; and New Exchequer Dam and Lake McClure on the Merced River. 3 These plan amendments are the project as defined in State CEQA Guidelines, Section 15378.

State Water Resources Control Board California Environmental Protection Agency
Service Providers
Evaluation of San Joaquin River Flow and Southern Delta Water Quality Objectives and Implementation
13-2 September 2016
ICF 00427.11
modified to address effects associated with potential reductions in surface water supply to service
providers. Accordingly this chapter evaluates whether the LSJR and SDWQ alternatives would: (1)
require or result in the construction of new water supply facilities or wastewater treatment facilities
or expansion of existing facilities, the construction of which could cause significant environmental
effects, and (2) violate any water quality standards such that drinking water quality from (a) public
water systems and (b) domestic wells would be affected.4 Additionally, this chapter evaluates if the
LSJR alternative would result in substantial changes to San Joaquin River (SJR) inflows to the Delta
such that insufficient water supplies would be available to service providers relying on Central
Valley Project (CVP)/State Water Project (SWP) exports. This is because changes to SJR inflow into
the southern Delta resulting from the LSJR alternatives could change exports to service providers in
the export service areas (i.e., CVP and SWP contractors) since some the inflow from the LSJR is
exported at the CVP and SWP pumps to the export service areas. Section 13.4, Impact Analysis,
describes the significance thresholds for determining whether a potential impact associated with
service providers is significant.
A summary of the potential impacts of the LSJR and SDWQ alternatives on service providers is
provided in Table 13-1. As described in Chapter 3, Alternatives Description, LSJR Alternatives 2, 3,
and 4 each include four methods of adaptive implementation. This recirculated substitute
environmental document (SED) provides an analysis with and without adaptive implementation
because the frequency, duration, and extent to which each adaptive implementation method would
be used, if at all, within a year or between years under each LSJR alternative is unknown. The
analysis, therefore, discloses the full range of impacts that could occur under an LSJR alternative,
from no adaptive implementation to full adaptive implementation. As such, Table 13-1 summarizes
impact determinations with and without adaptive implementation.
Impacts related to the No Project Alternative (LSJR/SDWQ Alternative 1) are presented in
Chapter 15, No Project Alternative (LSJR Alternative 1 and SDWQ Alternative 1), and the supporting
technical analysis is presented in Appendix D, Evaluation of the No Project Alternative (LSJR
Alternative 1 and SDWQ Alternative 1). More information and analysis regarding the environmental
impacts associated with the construction and/or operation of water treatment facilities or water
supply infrastructure or other actions that may be taken by service providers in response to
implementation of the plan amendments are discussed in Chapter 16, Evaluation of Other Indirect
and Additional Actions.
4 As stated in Appendix B, State Water Board’s Environmental Checklist, the LSJR Alternatives would change the volume of water in existing reservoirs and rivers and would not result in a violation of waste discharge requirements (WDRs). The SDWQ Alternatives 2 and 3 would articulate the water quality objective (i.e., standard) for salinity, from which requirements in WDRs would be derived; therefore, they would not violate WDRs. Thus, this chapter does not further discuss violations of WDRs.

State Water Resources Control Board California Environmental Protection Agency
Service Providers
Evaluation of San Joaquin River Flow and Southern Delta Water Quality Objectives and Implementation
13-3 September 2016
ICF 00427.11
Table 13-1. Summary of Service Provider Impact Determinations
Alternative Summary of Impact(s)
Impact Determination without Adaptive Implementation
Impact Determination with Adaptive Implementationa
Impact SP-1: Require or result in the construction of new water supply facilities or wastewater treatment facilities or expansion of existing facilities, the construction of which could cause significant environmental effects
No Project Alternative (LSJR/SDWQ Alternative 1)
See note.b Significant NA
LSJR Alternative 2
Average surface water diversions on the Stanislaus, Tuolumne, and Merced Rivers would be reduced by 2 percent, 2 percent, and 6 percent, respectively, compared to baseline conditions. Further, there would not be a substantial depletion of groundwater supplies; therefore, it is not expected that service providers or public water suppliers would need to construct or operate new water supply or wastewater treatment facilities or expand existing facilities. However, if adaptive implementation method 1 were implemented on a long-term basis (an increase in the February–June percent of unimpaired flow from 20 percent up to 30 percent), it is expected that there would be a substantial reduction of surface water on the Merced and Tuolumne Rivers and a substantial depletion of groundwater supplies in the Extended Merced Subbasin. These reductions would potentially require service providers to construct new and expanded water supply or wastewater treatment facilities, the construction of which could result in significant environmental effects.
Less than significant Significant and unavoidablec
LSJR Alternative 3 Surface water diversion reductions on the Stanislaus, Tuolumne, and Merced Rivers are expected to be approximately 12 percent, 14 percent and 16 percent, respectively. Further, as a result of the substantial reduction of surface water supply on the rivers, it is expected that there would be a substantial depletion of groundwater supplies in the Modesto, Turlock, and Extended Merced Subbasins. These reductions would potentially require service providers to construct new and expanded water supply or wastewater treatment facilities, the construction of which could result in significant environmental effects.
Significant and unavoidable
Significant and unavoidable

State Water Resources Control Board California Environmental Protection Agency
Service Providers
Evaluation of San Joaquin River Flow and Southern Delta Water Quality Objectives and Implementation
13-4 September 2016
ICF 00427.11
Alternative Summary of Impact(s)
Impact Determination without Adaptive Implementation
Impact Determination with Adaptive Implementationa
LSJR Alternative 4 Surface water diversion reductions on the Stanislaus, Tuolumne, and Merced Rivers are expected to be approximately 32 percent, 35 percent, and 32 percent, respectively. Further, as a result of the substantial reduction of surface water supply on the rivers, it is expected that there would be a substantial depletion of groundwater supplies in the Eastern San Joaquin, Modesto, Turlock, and Extended Merced Subbasins. These reductions would potentially require service providers to construct new and expanded water supply or wastewater treatment facilities, the construction of which could result in significant environmental effects.
Significant and unavoidable
Significant and unavoidable
SDWQ Alternative 2 The Cities of Stockton and Tracy, and Mountain House CSD, may need to construct new wastewater treatment facilities or expand existing facilities to comply with potential changes to NPDES effluent limitation implementing a 1.0 dS/m salinity objective, the construction of which could result in significant environmental effects.
Significant and unavoidable
NA
SDWQ Alternative 3 The construction of new wastewater treatment facilities is not expected in order to comply with changes to NPDES effluent limitations implementing a 1.4 dS/m objective for salinity. As such, construction would not occur and would not result in significant environmental effects.
Less than significant NA

State Water Resources Control Board California Environmental Protection Agency
Service Providers
Evaluation of San Joaquin River Flow and Southern Delta Water Quality Objectives and Implementation
13-5 September 2016
ICF 00427.11
Alternative Summary of Impact(s)
Impact Determination without Adaptive Implementation
Impact Determination with Adaptive Implementationa
Impact SP-2a: Violate any water quality standards such that drinking water quality from public water systems would be affected
No Project Alternative (LSJR/SDWQ Alternative 1)
See note. b Less than significant NA
LSJR Alternative 2 Because service providers and irrigation districts relying primarily on surface water would not need to supplement their supply with groundwater under LSJR Alternative 2, there would likely be no degradation of groundwater quality. If an increase in the February–June percent of unimpaired flow from 20 percent up to 30 percent were implemented on a long-term basis, increased groundwater pumping and reductions in groundwater levels in the Extended Merced Subbasin could affect groundwater quality.
However, a substantial increase in groundwater pumping would not necessarily result in violation of water quality standards for drinking water because recent data do not indicate increased water quality standard violations in public water systems despite greatly increased groundwater pumping, and if a drinking water quality problem is detected, action would be taken (as covered under Impact SP-1) to improve water quality. Therefore, impacts would be less than significant.
During some months, salinity in the SJR at Vernalis and in the southern Delta channels may increase slightly, but on average, salinity is expected to be reduced; therefore, a substantial degradation of water quality affecting service providers diverting drinking water from the southern Delta would not occur, and impacts would be less than significant.
Less than significant Less than significant
LSJR Alternatives 3 and 4
As a result of increased groundwater pumping, reductions in groundwater levels in the Modesto, Turlock, and Extended Merced Subbasins under LSJR Alternative 3, and also in the Eastern San Joaquin Subbasin under LSJR Alternative 4 with adaptive implementation method 1 could affect groundwater quality. However, a substantial increase in groundwater pumping would not necessarily result in an increase in violation of water quality standards for drinking water because recent data do not indicate increased water quality standard violations in public water systems despite greatly increased
Less than significant Less than significant

State Water Resources Control Board California Environmental Protection Agency
Service Providers
Evaluation of San Joaquin River Flow and Southern Delta Water Quality Objectives and Implementation
13-6 September 2016
ICF 00427.11
Alternative Summary of Impact(s)
Impact Determination without Adaptive Implementation
Impact Determination with Adaptive Implementationa
groundwater pumping, and if a drinking water quality problem is detected, action would be taken (as covered under Impact SP-1) to improve water quality.
Salinity in the SJR at Vernalis and in the southern Delta channels is expected to be reduced; therefore, a substantial degradation of water quality affecting service providers diverting drinking water from the southern Delta would not occur. Therefore, impacts would be less than significant.
SDWQ Alternatives 2 and 3
The USBR water rights permits will continue to include requirements to meet the current 0.7 EC April–August Vernalis salinity standard, as contained in the program of implementation. This would maintain the historical range of salinity in the southern Delta. Therefore, a substantial degradation of water quality affecting service providers diverting drinking water from the southern Delta would not occur.
Less than significant NA
Impact SP-2b: Violate any water quality standards such that drinking water quality from domestic wells would be affectedc
No Project Alternative (LSJR/SDWQ Alternative 1)
See note. b Less than significant NA
LSJR Alternative 2 Because service providers and irrigation districts relying primarily on surface water would not need to supplement their supply with groundwater under LSJR Alternative 2, there would likely be no degradation of groundwater quality. If an increase in the February–June percent of unimpaired flow from 20 percent up to 30 percent were implemented on a long-term basis, increased groundwater pumping and reductions in groundwater levels in the Extended Merced Subbasin could affect groundwater quality.
Domestic well users are largely unregulated and are under no state requirements to monitor, test, and treat their water to meet the state and federal Safe Drinking Water Act. There is no required mechanism to prevent private domestic wells from using groundwater that may exceed MCLs.
Therefore, impacts would be significant under LSJR Alternative 2, with adaptive implementation.
Less than significant Significant and unavoidable

State Water Resources Control Board California Environmental Protection Agency
Service Providers
Evaluation of San Joaquin River Flow and Southern Delta Water Quality Objectives and Implementation
13-7 September 2016
ICF 00427.11
Alternative Summary of Impact(s)
Impact Determination without Adaptive Implementation
Impact Determination with Adaptive Implementationa
LSJR Alternatives 3 and 4
As a result of increased groundwater pumping, reductions in groundwater levels in the Modesto, Turlock, and Extended Merced Subbasins under LSJR Alternative 3, and also in the Eastern San Joaquin Subbasin under LSJR Alternative 4 with adaptive implementation method 1 could affect groundwater quality. Domestic well users are largely unregulated and are under no state requirements to monitor, test, and treat their water to meet the state and federal Safe Drinking Water Act. There is no required mechanism to prevent private domestic wells from using groundwater that may exceed MCLs.
Therefore, impacts would be significant.
Significant and unavoidable
Significant and unavoidable
Impact SP-3: Result in substantial changes to SJR inflows to the Delta such that insufficient water supplies would be available to service providers relying on Central Valley Project (CVP)/State Water Project (SWP) exports
No Project Alternative (LSJR/SDWQ Alternative 1)
See note. b Less than significant NA
LSJR Alternative 2 Inflows would generally remain similar to baseline, which would result in an estimated average increase in exports of 18 TAF/y to the CVP and SWP export service areas. Therefore, insufficient water supplies to service providers relying on exports would not occur and would not require or result in the construction of new water supply facilities or wastewater treatment facilities or the expansion of existing facilities.
Less than significant Less than significant
LSJR Alternative 3 Inflows would generally increase relative to baseline, which would result in an estimated average increase in exports of 76 TAF/y to the CVP and SWP export service areas. Therefore, insufficient water supplies to service providers relying on exports would not occur and would not require or result in the construction of new water supply facilities or wastewater treatment facilities or the expansion of existing facilities.
Less than significant Less than significant

State Water Resources Control Board California Environmental Protection Agency
Service Providers
Evaluation of San Joaquin River Flow and Southern Delta Water Quality Objectives and Implementation
13-8 September 2016
ICF 00427.11
Alternative Summary of Impact(s)
Impact Determination without Adaptive Implementation
Impact Determination with Adaptive Implementationa
LSJR Alternative 4 Inflows would generally increase relative to baseline, which would result in an estimated average increase in exports of 194 TAF/y to the CVP and SWP export service areas. Therefore, insufficient water supplies to service providers relying on exports would not occur and would not require or result in the construction of new water supply facilities or wastewater treatment facilities or the expansion of existing facilities.
Less than significant Less than significant
CVP = Central Valley Project
DDW = Division of Drinking Water
dS/m = deciSiemens per meter (1 dS/m = 1000 µS/cm)
MCLs = maximum contaminant levels
NA = not applicable
NPDES = National Pollution Discharge Elimination System
SWP = State Water Project
TAF/y = thousand acre-feet per year
USBR = U.S. Bureau of Reclamation a Four adaptive implementation methods could occur under the LSJR alternatives, as described in Chapter 3, Alternatives Description, and summarized in Section
13.4.2, Methods and Approach, of this chapter. b The No Project Alternative (LSJR/SDWQ Alternative 1) would result in implementation of flow objectives and salinity objectives identified in the 2006 Bay-Delta
Plan. See Chapter 15, No Project Alternative (LSJR Alternative 1 and SDWQ Alternative 1), for the No Project Alternative impact discussion and Appendix D,
Evaluation of the No Project Alternative (LSJR Alternative 1 and SDWQ Alternative 1), for the No Project Alternative technical analysis. c Salinity in the SJR at Vernalis and in the southern Delta is not relevant to groundwater and drinking water quality from domestic wells and, therefore, there would
be no impact from the changes in salinity in these surface waters. This topic is not discussed further in Impact SP-2b.

State Water Resources Control Board California Environmental Protection Agency
Service Providers
Evaluation of San Joaquin River Flow and Southern Delta Water Quality Objectives and Implementation
13-9 September 2016
ICF 00427.11
13.2 Environmental Setting This section characterizes the area of potential effects considered for the service providers impact
analysis, which includes the plan area, the four groundwater subbasins as described in Chapter 9,
Groundwater Resources, and those areas that receive water from the surface waters. This section
provides information regarding the different service providers and the services provided by the
water bodies in the area of potential effects. Numerous service providers rely on the water bodies in
the area of potential effects for beneficial uses, such as irrigation and municipal and industrial
supply. Services providers also use the water bodies as receiving waters in which to discharge
treated wastewater effluent generated by residential, municipal, and industrial (i.e., domestic) uses
in service districts in the area of potential effects.
13.2.1 Lower San Joaquin River and Tributaries
Service providers in the area of potential effects obtain their water supplies by either diverting
surface water from the three eastside tributaries5 or pumping groundwater from aquifers. These
different sources of water and the service providers that rely on them are discussed below.
Surface Water and Service Providers
Five irrigation districts receive surface water from the Stanislaus, Tuolumne, and Merced Rivers and
primarily supply agricultural uses with irrigation (Table 13-2). Descriptions and characteristics of
the irrigation districts are provided in Chapter 2, Water Resources (Sections 2.3, 2.4, and 2.5).
Some of the irrigation districts have contracts or agreements with other water users, such as water
districts or conservation districts. The other water users provide water supply for both agricultural
uses and municipal uses. These irrigation districts and the other water users are listed in Table 13-2.
Irrigation districts obtain the majority of their water supply from surface water diversions. The
other water users primarily rely on groundwater or a combination of groundwater and surface
water as their sources of water. Figure 13-1a identifies the location of the service providers that rely
primarily or partially on surface water.
Groundwater and Service Providers
Groundwater is a vital resource in California. Typically, groundwater supplies approximately
30 percent of California’s urban and agricultural uses. In dry years, groundwater use increases to
approximately 40 percent statewide and 60 percent or more in some regions (DWR 2003).
Drought conditions typically result in an increase of groundwater well activity and pumping to
compensate for surface water supply shortages (DWR 2014). As a result of increased pumping in the
recent drought, groundwater levels have decreased in many basins throughout the state since spring
2010. Basins with notable decreases in groundwater levels are in the Sacramento River, SJR, Tulare
Lake, San Francisco Bay, Central Coast, and South Coast Hydrologic Regions (DWR 2014).
5 In this document, the term three eastside tributaries refers to the Stanislaus, Tuolumne, and Merced Rivers.

State Water Resources Control Board California Environmental Protection Agency
Service Providers
Evaluation of San Joaquin River Flow and Southern Delta Water Quality Objectives and Implementation
13-10 September 2016
ICF 00427.11
Table 13-2. Primary Surface Water Diverters and Other Water Users
Tributary River Primary Surface Water Diverters Other Water Users
Stanislausa OID, SSJIDb SEWD,c CSJWCD,d Tracy, Manteca, Lathrop, Ripon, Escalon
Tuolumne MID, TIDe Modesto, CCSFf
Merced Merced IDg LeGrand Athlone Water District,h El Nido Irrigation District,h Stevinson Water District, Eastside Water District,I Lake Don Pedro CSDj
OID = Oakdale Irrigation District
SSJID = South San Joaquin Irrigation District
SEWD = Stockton East Water District
CSJWCD = Central San Joaquin Water Conservation District
MID = Modesto Irrigation District TID = Turlock Irrigation District
CCSF = City and County of San Francisco
Merced ID = Merced Irrigation District
CSD = Community Services District a U.S. Bureau of Reclamation (USBR) is contracted to provide surface water to SEWD and CSJWCD. b SSJID and OID jointly hold contract rights with USBR to divert 600 thousand acre-feet (TAF). The primary use of the
surface water diversions in the SSJID and OID service areas is agriculture; however, there are some water districts that are contracted with SSJID to provide water to municipal users.
c SEWD provides water to CalWater Services Company and Stockton Municipal Utilities District. The County of San Joaquin receives less than 2,000 acre-feet per year (AF/y) from SEWD.
d Although CSJWCD receives surface water from USBR, its primary water source is groundwater (San Joaquin County Department of Public Works 2004.)
e TID and MID customers primarily use water for agricultural irrigation, although some treated surface water is delivered to the City of Modesto.
f CCSF has agreements with MID and TID to provide carryover storage in New Don Pedro Reservoir. CCSF does not divert water directly from New Don Pedro Reservoir but owns the right to store up to 740 TAF of water in the reservoir. The 740-TAF water right is senior to TID and MID water rights. The current CCSF demand for water is approximately 290 TAF.
g Merced ID is the primary water diverter on the Merced River. Merced ID uses the surface water from the Merced River primarily for agricultural irrigation.
h LeGrand Athlone Water District and El Nido Irrigation District are within the sphere of influence of Merced ID, and El Nido Irrigation District was incorporated into Merced ID service area prior to 2008 (AMEC 2008).
i Eastside Water District receives limited amounts of surface water from Merced ID only during wet years (TGBA 2008).
j Lake Don Pedro Community Services District can withdraw up to approximately 5,000 AF/y from Lake McClure (Merced ID 2013).
As described in Chapter 9, Groundwater Resources, Section 9.2.2, Subbasin Groundwater Use, there
are four main groundwater subbasins in the area of potential effects—the Eastern San Joaquin,
Modesto, Turlock, and Extended Merced. Approximately 1,248,000 people live in areas overlying
these four subbasins (U.S. Census Bureau 2010), and of this population, approximately
1,115,000 people, or 89 percent, receive some portion of their water supply from a public water
supplier (California Environmental Health Tracking Program 2016). The remaining 11 percent,
equivalent to approximately 133,000 people in the four main groundwater subbasins, rely solely on
domestic6 (i.e., private) wells for their water supply (Johnson and Belitz 2015). However, given the
6 For the purposes of this chapter, municipal wells refer to wells owned by public water suppliers, and domestic wells are private wells owned by individuals/households.

!(
!(
!(
!(
!(
!(
!(
Merced RiverSta
nislaus River
TuolumneRiver
San Joaquin River
Solano County
Calaveras County
Tuolumne County
San Joaquin CountyContra Costa County
Stanislaus County
Alameda County Mariposa County
Madera CountyMerced County
Santa Clara County
¬«108
¬«120
¬«49
¬«108
¬«140
¬«140
¬«120
¬«49
UV160
UV85
UV4
UV120
UV99
§̈¦580
§̈¦5
Vernalis
Tracy
Manteca
Modesto
Turlock
Merced
Stockton
Figure 13-1aVicinity Map of Service Providers Relying on Surface Water
K:\Pr
ojects
_2\SW
RCB\0
0427
_11_
SJ_R
iver\m
apdo
c\Fig_
13_1
a_Vic
inity_
2016
0329
.mxd
Date
: 9/12
/2016
Time
: 11:5
4:46 A
M 19
393
LegendService Provider
City of Escalon WSACity of Lathrop WDCity of Manteca WSAEastside WDLake Don Pedro CSDLe Grand-Athlone WDMerced IDModesto IDOakdale IDSouth San Joaquin IDTurlock IDStevinson Water DistrictStockton-East WDCentral San Joaquin WCDCity and County ofSan Francisco
0 105Miles´
!
!
!
!
!
!
!
!
!
!
!
!(S.F. Bay
UV237
UV24
UV87
UV92
UV13
UV85
UV84
UV1§̈¦380
§̈¦80
§̈¦580
§̈¦280
§̈¦680
Alameda County
San Mateo County
Santa Clara County

State Water Resources Control Board California Environmental Protection Agency
Service Providers
Evaluation of San Joaquin River Flow and Southern Delta Water Quality Objectives and Implementation
13-11 September 2016
ICF 00427.11
incomplete records for private wells, it is difficult determine the actual number of people currently
relying on private wells.
As shown in Table 13-3a (at the end of this chapter), 93 public water suppliers are identified within
the four groundwater subbasins. Many of these water suppliers rely heavily or primarily on
groundwater for municipal use. Table 13-3b identifies a subset of those public water suppliers listed
in Table 13-3a. These are generally representative of the public water suppliers listed in Table 13-3a
and well depth information could be obtained through the State Water Board’s Division of Drinking
Water (DDW) for this subset. Table 13-3b includes information regarding the size of the population
served the water suppliers in 2014, the number of active wells owned by the suppliers in 2014, the
percentage of groundwater supply reliance, the range of depths of the wells, and the range of depths
to groundwater7 at the wells. Figure 13-1b shows those service providers identified in Table 13-3b
that rely solely on groundwater. Although information on private wells is limited, 66 domestic wells
with well depth information were identified within the four groundwater subbasins based on
information extract from the California Statewide Groundwater Elevation Monitoring (CASGEM)
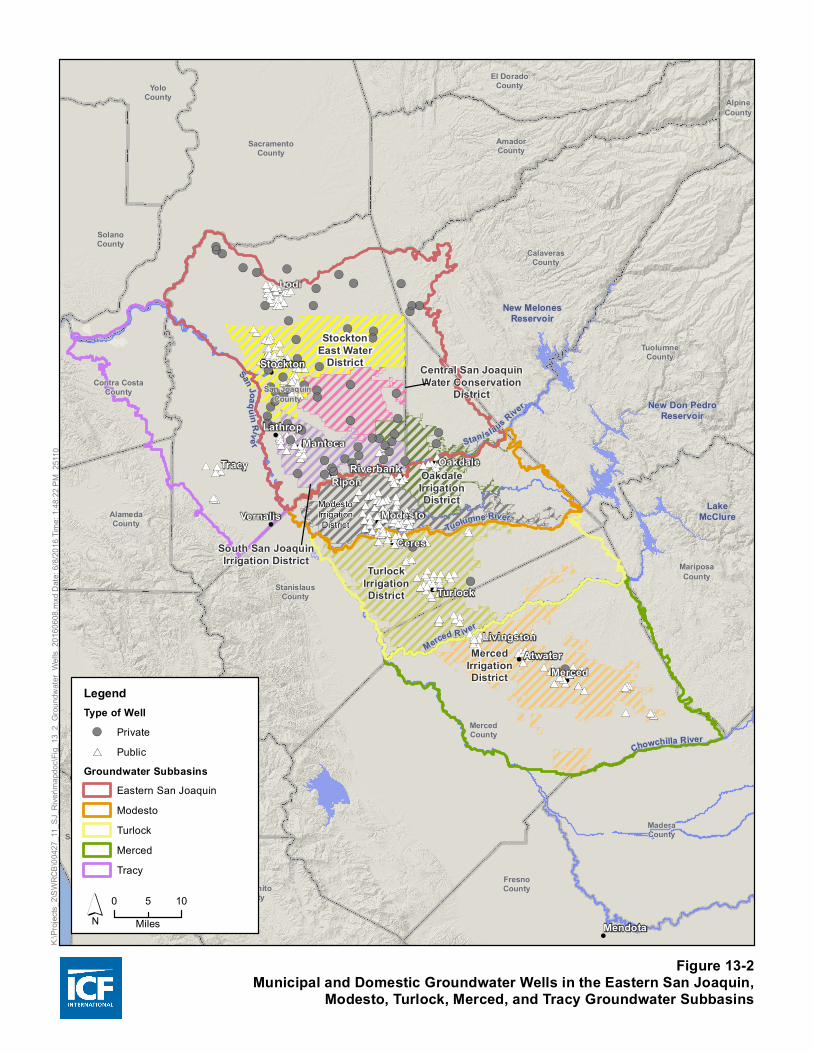
program (DWR 2015). The depth for these 66 wells ranges from 48 to 580 feet. Figure 13-2 shows
the location of municipal and domestic wells relative to the groundwater subbasins and the
irrigation districts in the area of potential effects.
Surface Water Quality
As discussed in Chapter 5, Surface Hydrology and Water Quality, the water quality of the Stanislaus,
Tuolumne, and Merced Rivers is primarily dictated by reservoir operations and agricultural return
flow. Electrical conductivity8 (EC) generally increases as water moves downstream in all three rivers
because of the relatively high EC in agricultural drainage and groundwater discharge to the river.
Chloride, bromide, sulfate, and boron are specific ions that contribute to overall salinity and are
constituents of concern. However, of these constituents of concern in the area of potential effects,
only boron is included on California’s statewide list of impaired waterbodies (the 303[d] lists).
Table 5-4 shows the constituents identified in the Section 303(d)9 list for impaired waters in the
plan area and other areas. The Tuolumne River, for example, is identified on the 303(d) list for
constituents associated with agricultural uses, such as pesticides (chlorpyrifos, diazinon, DDT), and
temperature (State Water Board 2011). Salinity can affect multiple beneficial uses, including the
yield of crops that are sensitive to these constituents. Additionally, high EC values in source water
may limit the ability to utilize recycled water. The presence of bromide in municipal water sources is
also a concern because bromide is the precursor to the formation of harmful byproducts of the
water disinfection process. However there are no 303(d) listings for bromide.
7 The depth to groundwater refers to depth to the top of the aquifer. 8 In this document, EC is electrical conductivity, which is generally expressed in deciSiemens per meter (dS/m). Measurement of EC is a widely accepted indirect method to determine the salinity of water, which is the concentration of dissolved salts (often expressed in parts per thousand or parts per million). EC and salinity are therefore used interchangeably in this document. 9 Clean Water Act section 303(d) requires states, territories, and authorized tribes to develop a ranked list of water quality limited segments of rivers that do not meet water quality standards.

State Water Resources Control Board California Environmental Protection Agency
Service Providers
Evaluation of San Joaquin River Flow and Southern Delta Water Quality Objectives and Implementation
13-12 September 2016
ICF 00427.11
Table 13-3b. Groundwater Reliance and Summary of Well Information for Selected Public Water Suppliers in the Eastern San Joaquin, Modesto, Turlock, and Extended Merced Subbasins
Public Water System Population
Served # of Active
Wells in 2014
Groundwater Reliance in 2014
(%)
Range of Well Depths
(feet)
Range of Depths to Groundwatera
(feet)
Range of Differenceb,c
(feet)
Eastern San Joaquin Subbasin
Cal Water, Stockton 185,346 26 26 400–857 34–83 340–515
Escalon 7,137 4 100 535–600 71–81 464–519
Lathrop 12,427 5 88 280–430 17–17 263–288
Lodi 63,395 28 73 315–600 58–137 213–481
Manteca 66,451 15 42 240–425 20–41 244–398
Ripon 14,915 7 100 158–462 39–46 118–423
SEWD 50d 0e 396–700 87–100 456–463
Stockton 169,963 21 23 232–590 35–72 194–526
Modesto Subbasin
Modesto 212,000 68 61 110–500 49–79 52–436
Oakdale 19,250 8 100 380–604 82–116 264–501
Riverbank 22,201 10 100 260–830 81–87 179–525
Turlock Subbasin
Ceres 42,666 15 100 240–450 63–74 190–367
Delhi CWD 5,640 4 100 355–608 90–97 265–516
Denair CSD 3,225 4 100 460–620 91–98 366–528
Hickman 565 2 100 284–332 116–117 167–216
Hilmar CWD 4,850 2 100 300–400 73–75 227–325
Hughson 6,082 3 100 260–445 85–85 265–360
Keyes CSD 4,575 4 100 335–425 65–70 269–355
Turlock 64,215 24 100 265–610 67–86 184–535

!
!
!
! !
! !!
!
!
!
!
!
!
!
!.
11
1615
1
7
6
8
2 34
5
1314
1210
9
1718
New MelonesReservoir
New Don PedroReservoir
LakeMcClure
LowerSanJoaqu in Riv er
Chowchilla River
Tuolumne River
Merced R iver
Stani slaus River
YoloCounty
SacramentoCounty
AmadorCounty
SolanoCounty
CalaverasCounty
TuolumneCounty
San JoaquinCountyContra Costa
County
StanislausCounty
AlamedaCounty
MariposaCounty
MaderaCounty
MercedCounty
FresnoCounty
Santa ClaraCounty
Santa CruzCounty
San BenitoCounty
MontereyCounty
Stockton
LathropManteca
Tracy Ripon
Vernalis ModestoHickman
Ceres
Turlock
LivingstonAtwater
Merced
Mendota
Figure 13-1b Vicinity Map of Selected Service Providers Relying Solely on Groundwater
K:\Pr
ojects
_2\SW
RCB\0
0427
_11_
SJ_R
iver\m
apdo
c\Fig_
13_1
b_Pr
ovide
rs_Re
lying_
Grou
nd_W
ater_2
0160
608.m
xd D
ate: 6
/8/20
16 Ti
me: 1
2:37:0
6 PM
2511
0
Legend!. Plainsburg Elementary School
Service Providers
Groundwater SubbasinsEastern San JoaquinModestoTurlockMerced
0 105Miles´
Primary Groundwater
Subbasins
San Joaquin ValleyGroundwater Basin
Number Service Provider Number Service Provider1 City of Escalon 10 Delhi CWD2 City of Ripon 11 Hilmar County WD3 City of Oakdale 12 City of Livingston4 City of Riverbank 13 Winton WSD5 City of Ceres 14 City of Atwater6 City of Hughson 15 City of Merced7 Keyes CSD 16 Planada CSD8 Denair CSD 17 Le Grand CSD9 City of Turlock 18 Plainsburg Elementary School
Service area boundaries for Black Rascal Water Company,Meadowbrook Water Company and Hickman were not available.
!
!
!
!
! !
!
!
!
!!
!
!
!
!
!
!
*#*#*#*#*#
*#
*#*#*#
*#*#
*#
*#*#*#
*#
*#*#*#
*#
*#
*#*#*#
*#*#
*#
*# *#
*#*#*#
*#*#*#*#*#
*#*#*#
*#*#*#
*#*#*#*#
*#*#
*#*#
*#*#*#*#*#*# *#
*#
*#*#*#
*#*#*#*#
*#
*#*#*#*#
*#*#
*#*#*#*#*#
*#*#*#*#
*#*#*#*#
*#*#
*#*# *#*#*#
*#*#*#
*# *#
*#
*#
*#*#
*#*#*#*#
*#*#
*#*#*#*#
*#*#*#*#
*#*#
*#*#
*#
*#
*#
*#*#
*# *#
*#*#*#
*#
*#
*#*#
*#
*#*#
*#
*#*# *#*#*#*#
*#*#*#*#*#*#*#*#*#
*#*#*#
*#*#
*#
*#
*#*#*#*#
*#
*#*#*#*#*#*#*#
*#
*#
*#*#*#*#*#*# *#
*#*#*#*#*#*#*#
*#*# *#*#*#*#*#*#
*#
*#*#*#
*# *#
*#*#*#*#
*# *#*#*#*#*#
*#*#*#*#*#*#*#*#*#
*#
*#
*#
*#*#*#*#*#*#*#
*#*#*#*#*#*#*#
*#*#*#*#
*#*#*#*#*#
*#*#*# *#*#*#*#*#*#*#
*#*#*#
*#*#
*#
*#
*# *#*#
*#*#*#
*#*#*#
! !
!
!
!
!
!
!
!
!
!!
!
!
!
!
!
!
!
!
!
!
!
!
!
!!
!!!
!
!
!
!
!
!!
! !
!
!!
!
!
!
!
!
!
!
!!
!
! !
!
!
!
!
!!!!
!
!
!
!
( (
(
(
(
(
(
(
(
(
((
(
(
(
(
(
(
(
(
(
(
(
(
(
((
(((
(
(
(
(
(
((
( (
(
((
(
(
(
(
(
(
(
((
(
( (
(
(
(
(
((((
(
(
(
(
New MelonesReservoir
New Don PedroReservoir
LakeMcClure
StocktonEast Water
District Central San JoaquinWater Conservation
District
OakdaleIrrigationDistrict
TurlockIrrigationDistrict
MercedIrrigationDistrict
South San JoaquinIrrigation District
Chowchilla River
Tuolumne River
Merced R iver
San Joaqui n R ive r Stani slaus River
ModestoIrrigationDistrict
El DoradoCountyYolo
County AlpineCounty
SacramentoCounty
AmadorCounty
SolanoCounty
CalaverasCounty
TuolumneCounty
San JoaquinCounty
Contra CostaCounty
StanislausCounty
AlamedaCounty
MariposaCounty
MaderaCounty
MercedCounty
FresnoCounty
Santa ClaraCounty
Santa CruzCounty
San BenitoCountyMonterey
County
Lodi
Stockton
LathropManteca
TracyRipon
Vernalis
OakdaleRiverbank
Modesto
Ceres
Turlock
LivingstonAtwater
Merced
Mendota
Figure 13-2Municipal and Domestic Groundwater Wells in the Eastern San Joaquin,
Modesto, Turlock, Merced, and Tracy Groundwater Subbasins
K:\Pr
ojects
_2\SW
RCB\0
0427
_11_
SJ_R
iver\m
apdo
c\Fig_
13_2
_Grou
ndwa
ter_W
ells_
2016
0608
.mxd
Date
: 6/8/
2016
Time
: 1:48
:22 PM
251
10
LegendType of Well!( Private#* Public
Groundwater SubbasinsEastern San JoaquinModestoTurlockMercedTracy
0 105Miles´

State Water Resources Control Board California Environmental Protection Agency
Service Providers
Evaluation of San Joaquin River Flow and Southern Delta Water Quality Objectives and Implementation
13-13 September 2016
ICF 00427.11
Public Water System Population
Served # of Active
Wells in 2014
Groundwater Reliance in 2014
(%)
Range of Well Depths
(feet)
Range of Depths to Groundwatera
(feet)
Range of Differenceb,c
(feet)
Extended Merced Subbasinf
Atwater 28,100 8 100 300–992 91–104 202–616
Black Rascal Water Company 393 2 100 NA 81–98 NA
Le Grand CSD 1,700 3 100 340–780 244–263 91–536
Livingston 13,940 8 100 284–518 73–90 204–430
Meadowbrook Water Company
6,309 3 100 371–528 88–95 276–440
Merced 80,095 22 100 152–800 87–107 55–713
Plainsburg Elementary School 150 1 100 600–600 142–142 458–458
Planada CSD 4,500 6 100 250–500 123–124 206–377
Winton WSD 8,500 3 100 395–965 121–121g 829–829g
Tracy Subbasin
Tracyh 82,000 9 3 894–1216 186–202 788–826
Source: State Water Resources Control Board Division of Drinking Water 2016.
CSD = Community Services District
SEWD = Stockton East Water District
WD = Water District
WSD = Water and Sanitary District a Range of depths to groundwater at the locations of the active wells owned by the public water supplier. b Range of difference between well depths and depths to groundwater. c Gray-shaded cells indicate that the difference between the depth of a well owned by the supplier and depth to groundwater at that well is less than 100 feet,
which indicates that the well is potentially at a higher risk of running dry in the future. d SEWD does not supply water to individual customers. SEWD sells water wholesale to different agencies. The 50 people that the water district serves are the
employees working in its water treatment plant. e SEWD had been relying solely on surface water between 2010 and 2014. In 2015, for the second consecutive year, SEWD did not receive their contracted water
supply allocation from USBR due to lack of available CVP supplies resulting from severe drought conditions (Association of California Water Agencies 2015;
SEWD 2016). Accordingly, SEWD reactivated the district’s two inactive wells, built a new well and converted two old irrigation wells into drinking water wells
(Sahota pers. comm.). The number of active wells in 2015 was five. f As described in Chapter 9, Groundwater Resources, the Extended Merced Subbasin includes a portion of the Chowchilla Subbasin. g Depth to groundwater data available only for one of three groundwater wells. h Although the City of Tracy is not located in the four subbasins, it is within the area of potential effects because it receives water from SSJID and can be affected by
the LSJR alternatives. Therefore, it is included in this table.

State Water Resources Control Board California Environmental Protection Agency
Service Providers
Evaluation of San Joaquin River Flow and Southern Delta Water Quality Objectives and Implementation
13-14 September 2016
ICF 00427.11
Groundwater Quality
As discussed in Chapter 9, Groundwater Resources, groundwater quality varies substantially
throughout the San Joaquin Valley Groundwater Basin. In general, groundwater throughout the SJR
region is suitable for most urban and agricultural uses. Groundwater in shallower aquifers generally
contains higher concentrations of anthropogenic contaminants, such as nitrates and pesticides, than
in deeper aquifers (DWR 2013). In addition to agricultural and industrial sources, trace elements
(such as arsenic, manganese, vanadium and uranium) that are naturally occurring in rocks and soils
can come in contact with the water and present water quality problems.
The Priority Basin Project of the Groundwater Ambient Monitoring and Assessment Program
(GAMA) (Section 13.3.2, State [Regulatory Background]) provides a comprehensive assessment of
the state’s groundwater quality. Two study units of the Priority Basin Project include the four
groundwater subbasins that are subject to the LSJR alternatives: the Northern San Joaquin Valley
(NSJ) study unit that includes the Eastern San Joaquin Subbasin and the Central Eastside study unit,
which includes the Modesto, Turlock, and Extended Merced Subbasins10.
In the NSJ study unit, one or more inorganic constituents (i.e., trace elements and nutrients, such as
nitrate and nitrite) were detected at high concentrations in approximately 13 percent of the primary
aquifers and at moderate concentrations in approximately 29 percent. The rest of the primary
aquifers (58 percent) had low or no detections of inorganic constituents. Common sources of
nutrients include fertilizers used in farming, seepage from septic systems, and human and animal
waste. In the NSJ study unit, nutrients were present at high and moderate concentrations in
approximately 2 and 9 percent of the primary aquifers, respectively (USGS and State Water Board
2010a). One or more organic constituents (i.e. volatile organic compounds [VOCs] and pesticides)
were detected at high concentrations in approximately 3 percent of the primary aquifers and at
moderate concentrations in approximately 7 percent. The remaining primary aquifers (90 percent)
had low or no detections of organic constituents (USGS and State Water Board 2010a). VOCs are
present in many household, commercial, industrial, and agricultural products, and are characterized
by their tendency to volatilize into the air. Pesticides (herbicides, insecticides, and fumigants) are
applied to crops, gardens, lawns, around buildings, and along roads to help control weeds, insects,
fungi, and other pests. In the NSJ study unit, fumigants were detected at high concentrations in
approximately 3 percent of the primary aquifers, and at moderate concentrations in approximately
3 percent. Herbicides and insecticides were detected at low concentrations in the primary aquifer
(USGS and State Water Board 2010a).
In the Central Eastside study unit, one or more inorganic constituents were detected at high
concentrations in 18 percent of the primary aquifer and at moderate concentrations in 44 percent.
The rest of the primary aquifers (38 percent) had low or no detections of inorganic constituents
(USGS and State Water Board 2010b). Nitrate was detected at high concentrations in approximately
2 percent of the primary aquifers and at moderate concentrations in approximately 15 percent of
the primary aquifer. Concentrations of nitrate were low in the rest of the primary aquifers
(83 percent) in the Central Eastside study unit. One or more organic constituents were detected at
high concentrations in 1 percent of the primary aquifer and at moderate concentrations in
10 As described in Chapter 9, Groundwater Resources, the Merced Subbasin was extended for the analysis to include a part of the Chowchilla Subbasin.

State Water Resources Control Board California Environmental Protection Agency
Service Providers
Evaluation of San Joaquin River Flow and Southern Delta Water Quality Objectives and Implementation
13-15 September 2016
ICF 00427.11
14 percent. The rest of the primary aquifers (85 percent) had low or no detections of organic
constituents (USGS and State Water Board 2010b). In the Central Eastside, the fumigant
dibromochloropropane (DBCP)11 was detected at high concentrations in approximately 1 percent of
the primary aquifers, at moderate concentrations in approximately 8 percent of the primary aquifer,
and at low or not detected in approximately 91 percent (USGS and State Water Board 2010b).
Salinity, measured as total dissolved solids (TDS) or EC, in the four subbasins is relatively low, while
elevated salinity levels are common in San Joaquin Valley groundwater (DWR 2003a). Salinity is
generally lower on the eastern side of the San Joaquin Valley Groundwater Basin than on the
western side, and is generally higher in the shallow aquifer than the deep aquifer. The relatively low
groundwater salinity on the eastern side can be attributed to the low salinity of Sierra Nevada runoff
and application of surface water as a major irrigation source in the subbasins. However, there are
some localized issues. For example, increased levels in groundwater salinity have been detected in
the Stockton area due to a lateral saline front to the west (NSJCGBA 2004). In the Merced
Groundwater Basin, high TDS concentrations are principally the result of the migration of a deep
saline water body that originates in regionally deposited marine sedimentary rocks that underlie the
San Joaquin Valley. Under natural pressure, the saline groundwater body is migrating upward. But
pumping by deep wells in the western and southern parts of the Extended Merced Subbasin may be
causing these saline brines to upwell and mix with fresh water aquifers more rapidly than under
natural conditions (MAGPI 2008).
Quality of Groundwater as a Source of Drinking Water
It is estimated that 85 percent of California’s community public water systems,12 supplying more
than 30 million residents, rely on groundwater for at least part of their drinking water supply
(State Water Board 2013a). In addition, approximately 2 million Californians rely on groundwater
from either private domestic wells or other groundwater-reliant systems not regulated by the state.
Due to California’s reliance on groundwater, and because many community water systems are
entirely reliant on groundwater for their drinking water supply, contamination of this resource can
have far-reaching consequences. Pursuant to the requirements of AB 2222 (Caballero, Chapter 670,
Statutes of 2008), in 2013 State Water Board submitted a report to the legislature that identified:
(1) communities in California that rely on contaminated groundwater as a primary source of
drinking water, (2) the principal contaminants and other constituents of concern, and (3) potential
solutions and funding sources to clean up or treat groundwater in community public water systems
or provide alternative water supplies.
The report identifies that approximately one-fifth of California’s groundwater-reliant community
water systems, prior to any treatment, used a contaminated groundwater source between 2002 and
2010. During this period, of the 510 active wells (serving 148 community water systems) within the
four subbasins, 134 active wells (serving 54 community water systems) had two or more MCL
exceedances (State Water Board 2013a). It is important to note that these findings reflect raw,
untreated groundwater quality and not necessarily the quality of the water that is eventually served
to the public. Community water systems that rely on contaminated groundwater typically treat their
well water before it is delivered and consumed. However, in some cases, when a community cannot
11 Use of DBCP as a soil fumigant was discontinued in California in 1977. 12 A community public water system (community water system) serves at least 15 service connections used by yearlong residents or regularly serves at least 25 yearlong residents. Community water systems are regulated by the state.

State Water Resources Control Board California Environmental Protection Agency
Service Providers
Evaluation of San Joaquin River Flow and Southern Delta Water Quality Objectives and Implementation
13-16 September 2016
ICF 00427.11
afford treatment or alternative sources of water are not available, contaminated water is served to
the public until a solution is implemented. Over 98 percent of Californians on a public water supply
are served safe drinking water (State Water Board 2013a).
The report also identifies 31 principal contaminants13 in the community water systems that rely
on a contaminated groundwater source. The 10 most frequently detected principal contaminants,
summarized in Table 13-4, were found in over 90 percent of the contaminated groundwater wells
prior to treatment. Twenty-one of the 31 principal contaminants detected in community water
system wells are anthropogenic in origin. Some principal contaminants were more frequently
detected within certain regions of the state, while other principal contaminants were found
statewide. In general, naturally occurring contaminants are detected statewide, while
anthropogenic contaminants tend to be detected in particular regions of the state. For example,
arsenic (naturally occurring) is detected in a wide distribution of community water system wells
across the state. In contrast, nitrate (anthropogenic) is predominantly detected above the MCL in
areas of the state with current or historical agricultural activity, including the southern San
Joaquin Valley, the Salinas Valley, and in the Southern California Inland Empire (State Water
Board 2013a).
Table 13-4. Ten Most Frequently Detected Principal Contaminants Identified in State Water Board 2013a
Principal Contaminant Number of Wellsa Type of Contaminantb
Arsenic 587 Naturally occurring
Nitrate 451 Anthropogenic nutrient
Gross alpha activity 333 Naturally occurring
Perchlorate 179 Industrial/Military use
Tetrachloroethylene (PCE) 168 Solvent
Trichloroethylene (TCE) 159 Solvent
Uranium 157 Naturally occurring
1,2-dibromo-3-chlropropane (DBCP) 118 Legacy pesticide
Fluoride 79 Naturally occurring
Carbon tetrachloride 52 Solvent
Source: State Water Board 2013a. a This is the number of wells in which the contaminant was detected, b Also can be naturally occurring, but typically at levels below the MCL
As shown in Table 13-4, nitrate is the second most frequently detected principal contaminant in
groundwater, and at concentrations above its drinking water standard MCL of 45 milligrams per
liter (mg/L), it is considered anthropogenic, making it the most frequently detected anthropogenic
chemical above an MCL in drinking water sources. Agricultural fertilizers and animal wastes applied
to cropland are major sources of nitrate in groundwater. Hence, nitrate is often used as an indicator
of agricultural impact on groundwater quality. Nitrate is one of California’s most prevalent
groundwater contaminants, and can pose significant health risks at concentrations above the MCL
(State Water Board 2013b). Harter et al. (2012) found that travel times of nitrate from source to
wells range from a few years to decades in domestic wells, and from years to many decades and
13 A principal contaminant is a chemical detected in a groundwater source sample above a primary MCL on two or more occasions during the most recent CDPH compliance cycle (2002–2010).

State Water Resources Control Board California Environmental Protection Agency
Service Providers
Evaluation of San Joaquin River Flow and Southern Delta Water Quality Objectives and Implementation
13-17 September 2016
ICF 00427.11
even centuries in deeper production wells. This means that elevated nitrate concentration in
groundwater will remain high for a long time even if nitrate application is reduced today, and that
reduction efforts are essential for any long-term improvement of drinking water sources.
Groundwater Quality and Over-Pumping
As discussed above, over pumping of groundwater has been depleting the groundwater resources in
the San Joaquin Valley. One impact of over-drafting groundwater is degradation of groundwater
quality. Prior to any development, natural recharge to, and discharge from, the groundwater system
was in a dynamic steady state, and the groundwater table was stable. When a well is built and water
is pumped from the aquifer, a cone of depression will be created at the well and the water table will
be lowered. When pumping is stopped, subsequent recharge will allow the water level to rise, and
the groundwater table is restored. If pumping continues, the groundwater level will decline and
continue to do so until it stabilizes at a new, lower level. If pumping is persistently greater than
recharge, the aquifer will eventually be dewatered. Lowering the groundwater table will alter the
direction and rate of the groundwater flow and create a hydraulic gradient between the well and
surrounding saturated zone. This can affect groundwater quality in the following ways.
1. Migration of surface contaminants to the well. Contaminants introduced at the land surface that
infiltrate into the water table can flow towards the well. Contaminated shallow groundwater
will also move downward within the aquifer and, eventually, into the zone of drinking water
wells. Sources of chemicals introduced to ground water in this way include fertilizers, manure,
and pesticides applied to agricultural lands; landfills; industrial-discharge lagoons; leaking
gasoline storage tanks; cesspools and septic tanks; and domestically used chemicals. The slow
movement of water from the surface through the unsaturated zone to deep aquifers means that
it may be many years after a persistent chemical has entered the ground before it affects the
quality of groundwater supplies (Morris et al. 2003; Harter et al. 2012). For example, while the
San Joaquin Valley is not characterized by high concentrations of nitrates at the depth zone used
for public supply, application of fertilizers and animal manure to agricultural land has caused
downward movement of nitrates into the soil. As groundwater pumping continues and as
irrigation water containing elevated concentrations of nitrate moves toward and through
deeper parts of the aquifer, high concentrations of nitrates in the public water supply could be a
concern in the future (Belitz et al. 2015).
2. Saline water intrusion. Under natural conditions the boundary between the freshwater and
saltwater tends to be relatively stable, but pumping can cause saltwater to migrate inland and
upward, resulting in saltwater contamination of the aquifer. Saltwater intrusion is an important
consideration for aquifers adjacent to the coast or other saline bodies. The mobility of such saline
waters depends upon the hydraulic gradients, permeability of the aquifer and the presence or
absence of hydraulic barriers (Morris et al. 2003). Serious saline intrusion is confined to relatively
few hydrogeological settings, but these are not necessarily coastal as paleo-saline waters may
occur in inland aquifers at depth (Morris et al. 2003).
3. Mobilization of naturally-occurring trace elements such as uranium, arsenic, and radium.
Pumping-induced mobilization of those elements has been studied around the world.
Although the occurrence of trace elements (e.g., arsenic and uranium) is not anthropogenic,
these elements can leach into groundwater and be mobilized by human activities (Smedley
and Kinniburgh 2002; Barringer and Reilly 2013). For example, the downward infiltration of
irrigation water with elevated bicarbonates caused movement of uranium in an area of the
eastern San Joaquin Valley (Belitz et al. 2015).
State Water Resources Control Board California Environmental Protection Agency
Service Providers
Evaluation of San Joaquin River Flow and Southern Delta Water Quality Objectives and Implementation
13-18 September 2016
ICF 00427.11
The processes discussed above can be influenced by many factors, including location and depth of
the well, the amount and frequency of groundwater pumping, number and proximity of nearby
wells, aquifer characteristics (e.g., consolidated clays with low permeability or unconsolidated sands
with high permeability), distance between the well(s) and the contaminant(s), contaminant
characteristics (e.g., highly mobile in water or adhering primarily to soil), and land use near the well.
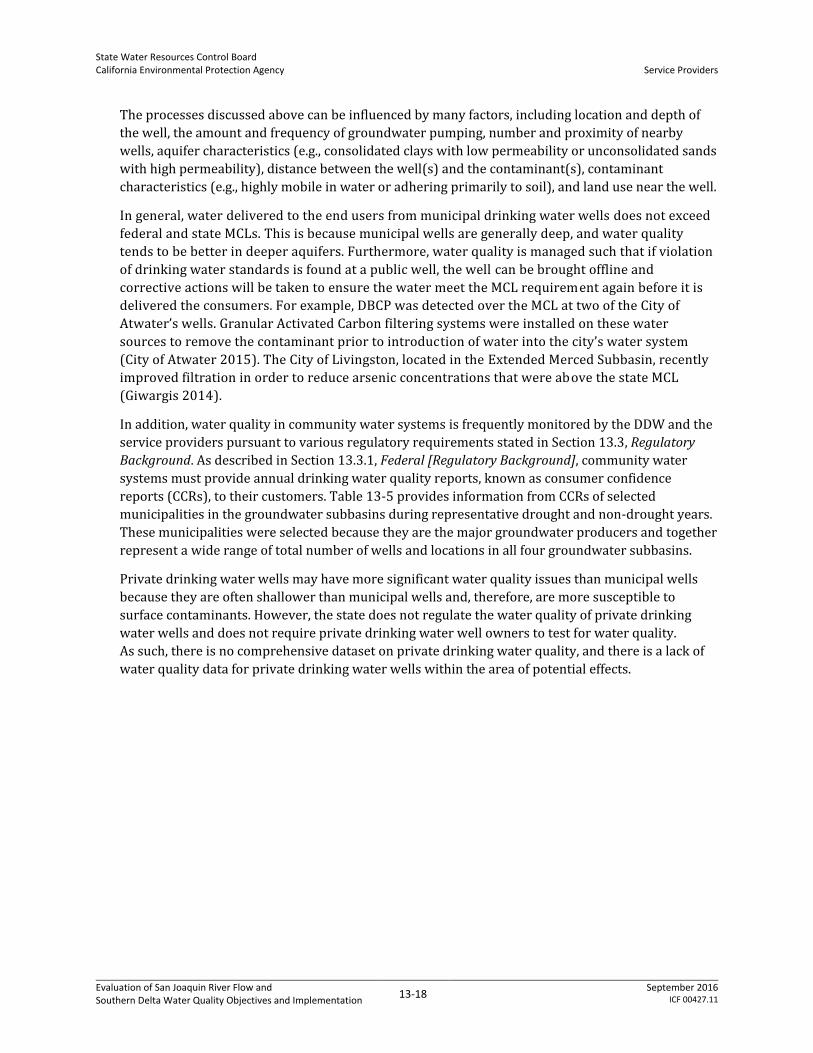
In general, water delivered to the end users from municipal drinking water wells does not exceed
federal and state MCLs. This is because municipal wells are generally deep, and water quality
tends to be better in deeper aquifers. Furthermore, water quality is managed such that if violation
of drinking water standards is found at a public well, the well can be brought offline and
corrective actions will be taken to ensure the water meet the MCL requirement again before it is
delivered the consumers. For example, DBCP was detected over the MCL at two of the City of
Atwater’s wells. Granular Activated Carbon filtering systems were installed on these water
sources to remove the contaminant prior to introduction of water into the city’s water system
(City of Atwater 2015). The City of Livingston, located in the Extended Merced Subbasin, recently
improved filtration in order to reduce arsenic concentrations that were above the state MCL
(Giwargis 2014).
In addition, water quality in community water systems is frequently monitored by the DDW and the
service providers pursuant to various regulatory requirements stated in Section 13.3, Regulatory
Background. As described in Section 13.3.1, Federal [Regulatory Background], community water
systems must provide annual drinking water quality reports, known as consumer confidence
reports (CCRs), to their customers. Table 13-5 provides information from CCRs of selected
municipalities in the groundwater subbasins during representative drought and non-drought years.
These municipalities were selected because they are the major groundwater producers and together
represent a wide range of total number of wells and locations in all four groundwater subbasins.
Private drinking water wells may have more significant water quality issues than municipal wells
because they are often shallower than municipal wells and, therefore, are more susceptible to
surface contaminants. However, the state does not regulate the water quality of private drinking
water wells and does not require private drinking water well owners to test for water quality.
As such, there is no comprehensive dataset on private drinking water quality, and there is a lack of
water quality data for private drinking water wells within the area of potential effects.

State Water Resources Control Board California Environmental Protection Agency
Service Providers
Evaluation of San Joaquin River Flow and Southern Delta Water Quality Objectives and Implementation
13-19 September 2016
ICF 00427.11
Table 13-5. Primary Detected Contaminants in Exceedance of Maximum Contamination Level in Drinking Water for Selected Water Suppliers during Representative Non-Drought and Drought Years
Public Water Supplier Source of Water
Non-Drought Year (2011) Drought Year (2014)
Violation? (Y/N) Primary Detected Contaminant Corrective Action
Violation? (Y/N)
Primary Detected Contaminant
Corrective Action
Atwater groundwater N NA NA N NA NA
Manteca groundwater and surface water
Y Arsenic in exceedance of the MCL (10 ppb) was detected in groundwater.a
Filters were installed to remove arsenic from wells where MCL was exceeded. Maximized water production from sources with low arsenic levels.
N NA NA
Merced groundwater N NA N NA NA
Modesto groundwater and surface water
N NA NA N NA NA
Riverbank groundwater Y Total coliform bacteria Drinking water system was disinfected, flushed, and contamination was resolved.
N NA NA
Stockton groundwater and surface water
N NA N NA NA
Turlock groundwater Y Arsenica Two wells with arsenic in exceedance of the MCL (10 ppb) were immediately removed from service.
N NA NA
SEWD surface water N NA NA N NA NA
Source: City of Manteca 2012a and 2014; City of Merced 2011 and 2015; City of Modesto 2011 and 2014; City of Stockton 2011a and 2014; City of Turlock 2011 and 2014; City of
Atwater 2011 and 2015; City of Riverbank 2011 and 2014; SEWD 2014.
SEWD = Stockton East Water District
MCL = maximum contaminant level
ppb = parts per billion
ppm = parts per million
NA = not applicable a The U.S. Environmental Protection Agency reduced the MCL for arsenic from 50 ppb down to 10 ppb in 2001. This new MCL (10 ppb) became enforceable in January 2006. Water
systems that are in violation of this MCL must include a health effects statement in their consumer confidence reports covering calendar year 2006 and beyond.

State Water Resources Control Board California Environmental Protection Agency
Service Providers
Evaluation of San Joaquin River Flow and Southern Delta Water Quality Objectives and Implementation
13-20 September 2016
ICF 00427.11
13.2.2 Extended Plan Area
There are 55 public water suppliers identified in the extended plan area (State Water Board
2016a; State Water Board 2016b; CEHTP 2016). Of these 55, 44 suppliers rely completely on
groundwater and three have pre-1914 or riparian rights (State Water Board 2016a) and, as such,
are not expected to be affected by water supply bypasses in the extended plan area. Twelve
(identified in Table 13-6) of these 55 service providers have post-1914 water rights and rely on
surface water diversions (State Water Board 2016a). The total annual water production by the 55
service providers in 2014 was 9.85 TAF, of which 7.61 TAF was produced by the 12 service
providers listed in Table 13-6.
Table 13-6. Annual Water Use of Service Providers in the Extended Plan Area with Post-1914 Water Rights
Service Providers Water Production in 2014
(TAF)
Calaveras County Water District (Copper Cove) 1.25
Calaveras County Water District (Ebbetts Pass) 1.50
City of Angels Camp 0.99
Del Oro Water Company (Strawberry District) 0.04
Groveland CSD 0.38
Lake Alpine Water Company 0.04
Tuolumne Utilities District (Columbia Water System) 0.48
Tuolumne Utilities District (Sonora/Jamestown Water System) 1.84
Tuolumne Utilities District (Cedar Ridge Water System) 0.12
Twain Harte CSD 0.22
Union Public Utility District 0.70
Yosemite National Park (Wawona) 0.05
Total 7.61
Source: State Water Resources Control Board, Division of Drinking Water 2016.
TAF = thousand acre-feet
CSD = Community Services District
13.2.3 Southern Delta
Many factors influence southern Delta water quality, such as the amount and salinity concentration
of SJR flow entering the southern Delta at Vernalis; daily tidal action; CVP and SWP pumping
operations; agricultural return flows; municipal wastewater discharges; and other influences.
Chapter 2, Water Resources (Section 2.7, Southern Delta) and Chapter 5, Surface Hydrology and
Water Quality (Section 5.2.8, Southern Delta) also provide additional information regarding southern
Delta hydrodynamics. The sections below summarize the information found in these two chapters
and provide additional information that describes the southern Delta’s water quality (salinity)
objectives, the factors that affect its existing salinity, the wastewater treatment plants (WWTPs) that
discharge into the southern Delta and their effluent limitations, and the water suppliers that use the
southern Delta as a source for drinking water.

State Water Resources Control Board California Environmental Protection Agency
Service Providers
Evaluation of San Joaquin River Flow and Southern Delta Water Quality Objectives and Implementation
13-21 September 2016
ICF 00427.11
Water Quality Objectives
The 2006 Water Quality Control Plan for the San Francisco Bay/Sacramento-San Joaquin Delta
Estuary (2006 Bay-Delta Plan) identifies specific water quality objectives for EC, a primary indicator
of salinity, for the southern Delta, for the protection of agricultural beneficial uses. The 2006 Bay-
Delta Plan and the objectives are fully described in Section 13.3.2, State [Regulatory Background], of
this chapter. The numeric objectives for the southern Delta are as follows and are monitored at four
compliance stations (SJR at Vernalis [C-10], SJR at Brandt Bridge [C-6], Old River near Middle River
[C-8], and Old River at Tracy Boulevard Bridge [P-12]).
0.7 dS/m during the summer irrigation season (April–August).
1.0 dS/m during the winter season (September–March).
Water quality standards for drinking water are discussed below.
Existing Salinity
Salinity levels in the southern Delta are affected by complex hydrodynamics, including: inflow from
the SJR at Vernalis; land use activities (e.g., agriculture) and discharges in the southern Delta; the
seasons, tidal action, the placement of temporary barriers to reduce the effects of tidal action; the
position of the Delta cross channel gates; and CVP and SWP exports.
The LSJR delivers water of relatively poor quality to the Delta, with agricultural drainage to the river
being a major source of salts. Flow at Vernalis is typical of the inflow that the SJR contributes to the
southern Delta. There is a strong relationship between the salinity concentrations at Vernalis and the
salinity concentrations at Brandt Bridge and Old River at Middle River under most conditions
(Appendix F.2, Evaluation of Historical Flow and Salinity Measurements of the Lower San Joaquin River
and Southern Delta). The salinity concentrations in the southern Delta typically increase slightly from
agricultural drainage and treated effluent discharges to the southern Delta downstream of Vernalis.
Salinity also varies greatly in the southern Delta with the seasons and the tides. Winter salinity is
mostly influenced by runoff from agricultural fields, while fall salinities tend to be influenced by
seawater intrusion. The tides also influence the salinity by enhancing mixing. Generally, when
temporary barriers are installed, tidal exchange is reduced. The temporary rock barriers (Old River
Barrier near Delta-Mendota Canal, Middle River Barrier, and Grant Line Canal Barrier) are generally
installed during the spring and removed in the fall (late September–November). Salinity in the
southern Delta during lower flow periods can increase as a result of other sources (e.g., discharge of
agricultural drainage, discharge of WWTPs).
An additional barrier, the Head of Old River Barrier (HORB), is occasionally installed during the
spring to block passage of migrating fish into Old River. When installed, it reduces the normal
diversion of SJR flow into Old River and the majority of the LSJR flows north to the Stockton Deep
Water Ship Channel. However, some of the LSJR flow is drawn through Turner Cut and Middle River
and Victoria Canal toward the CVP and SWP pumping facilities. The volume of water exported at the
CVP and SWP can modify salinity concentrations in the southern Delta by affecting the partitioning
of net flow through the various Delta channels.
Despite the variable hydrodynamics described above, the measured EC values throughout the
southern Delta indicate the monthly patterns of EC are generally below the existing salinity
objectives (i.e., 0.7 dS/m during the summer irrigation season [April–August] and 1.0 dS/m during

State Water Resources Control Board California Environmental Protection Agency
Service Providers
Evaluation of San Joaquin River Flow and Southern Delta Water Quality Objectives and Implementation
13-22 September 2016
ICF 00427.11
the winter irrigation season [September–March]). The monthly increases in downstream salinity are
greatest when the LSJR flow is low because dilution of agricultural drainage and municipal discharge
will be less when the LSJR flow is low. Appendix F.2 describes the historical EC values at Vernalis
and the interior compliance stations. There have been periodic exceedances in recent dry years at
one or more of these southern Delta monitoring stations, but high salinity is not the general pattern.
Based on the historical data, the salinity in the southern Delta is generally increased by a maximum
of 0.2 dS/m above the Vernalis salinity, although the increment is sometimes higher in Old River at
Tracy Boulevard. The existing salinity in the southern Delta generally ranges between 0.2 dS/m and
1.2 dS/m across all months of the year. Compliance with salinity objectives at Vernalis has been
consistently achieved over the past 15 years. On average, salinity increases by 0.050 dS/m between
Vernalis and Brandt Bridge (Chapter 5, Surface Hydrology and Water Quality, and Appendix F.2).
The historical salinity increase between Vernalis and Old River at Tracy Boulevard is greater,
averaging approximately 0.150 dS/m, with several monthly increases of more than 0.200 dS/m.
Thus, when salinity at Vernalis is at the Vernalis EC objective, the salinity in the southern Delta is
generally maintained between 0.7 dS/m and 1.2 dS/m (based on the historical monthly EC record).
Wastewater Dischargers
Existing WWTPs discharge treated wastewater effluent into the southern Delta and are considered
point sources under the Clean Water Act (CWA). (33 U.S.C., § 1362, subd. (14).) Because treated
wastewater effluent is a source of salt, these dischargers influence southern Delta salinity. There are
six WWTPs that discharge into or are in the vicinity of the southern Delta, all of which are required
to comply with effluent limitations established by National Pollution Discharge Elimination System
(NPDES) permits (see Section 13.3.1, Federal [Regulatory Background]). These WWTPs, their
receiving water bodies, and their total permitted discharge rates are listed in Table 13-7.
Figure 2-12 shows the locations of WWTPs, compliance station locations, and nearby drinking water
supply intakes.
Table 13-7. Wastewater Treatment Plants with Discharges in the Southern Delta
WWTP Facility Current NPDES Permit Order Number Receiving Water
Permitted Discharge (mgd)
Tracy a R5-2012-0115 Old River (upstream of Doughty Cut)
16
Deuel R5-2014-0014-01 Paradise Cut and Old River 0.62 Manteca b R5-2015-0026 San Joaquin River 17.5 Stockton R5-2014-0070 San Joaquin River 55 Mountain House CSD c R5-2013-0004 Old River 5.4 Discovery Bay CSD R5-2014-0073 Old River 2.1 WWTP = wastewater treatment plant mgd = million gallons per day NPDES = National Pollutant Discharge Elimination System CSD = Community Services District a In accordance with City of Tracy v. State Water Board, the existing southern Delta salinity objectives are not applied
to Tracy and other municipal dischargers pending reconsideration of the southern Delta salinity objectives under Water Code §13241 and adoption of a proper program of implementation under Water Code §13242. Current capacity of Tracy’s WWTP is 10.8 mgd, but there are plans to expand to 16.0 mgd within the permit term.
b Amended by Order R5-2015-0044. The Manteca Wastewater Quality Control Facility is currently designed for a discharge of 9.87 mgd but plans to expand to 17.5 mgd.
c The Mountain House CSD is currently designed for a discharge rate of 3 mgd but plans to expand to 5.4 mgd within the permit term.

State Water Resources Control Board California Environmental Protection Agency
Service Providers
Evaluation of San Joaquin River Flow and Southern Delta Water Quality Objectives and Implementation
13-23 September 2016
ICF 00427.11
Overall, the WWTPs have only a small effect on southern Delta salinity (Appendix C, Technical
Report on the Scientific Basis for Alternative San Joaquin River Flow and Southern Delta Salinity
Objectives, and Appendix F.2, Evaluation of Historical Flow and Salinity Measurements of the Lower
San Joaquin River and Southern Delta). For example, Tracy’s discharge has limited effects on the
overall salinity in the southern Delta compared to other sources of salinity in the area (e.g., water
from agricultural activities and groundwater accretions). The permitted maximum salinity loads
from the Tracy, Deuel, and Mountain House Community Services District (CSD) entering at the Head
of Old River indicates that the salt load from point sources in this part of the southern Delta is a
small percentage of the salt load entering from upstream. The salinity from wastewater discharges
is generally exported at the CVP Jones Pumping Plant and SWP Banks Pumping Plant.
These WWTPs have effluent limitations that are established through the NPDES permits and waste
discharge requirements (WDRs) issued by the Central Valley Regional Water Quality Control Board
(Central Valley Water Board) (see Section 13.3.1, Federal [Regulatory Background]). These effluent
limitations are set by discharge permits for a wide variety of constituents including salt, and
regulate the quality of the treated effluent discharged from the WWTPs. Except for Deuel,14 the EC
effluent limits for the WWTPs are currently based on facility performance to ensure salinity levels
do not increase. Except for Deuel, at all of these WWTPs the existing NPDES requirements allow
salinity of the discharge to be greater than the existing salinity objectives for the southern Delta as a
result of litigation in City of Tracy v. State Water Board, under which the State Water Board was
enjoined from applying the Delta salinity water quality objectives to the City of Tracy and other
municipal discharger pending reconsideration and implementation of the objectives in accordance
with Water Code Sections 13241 and 13242. Generally, the WWTPs of the southern Delta are in
compliance with the current EC effluent limitations. The discharge permits also require the
preparation of a salinity management plan (Harder pers. comm.; Martin pers. comm.). Table 13-8
identifies annual average EC of each WWTP for 2011–2014. Table 13-9 identifies the average April–
August EC and the remainder of the year. Table 13-10 is a summary of southern Delta WWTPs’
compliance with NPDES salinity requirements and salinity management plans.
Some service providers (i.e., WWTPs) are currently planning to modify existing facilities to reduce
salinity loads. Of the six WWTPs discussed herein, two have made efforts or are working toward
reducing salinity concentrations in their source water supplies, four are implementing pretreatment
programs to reduce water softener use among water users, and three are either proposing to
construct or are already operating a reverse osmosis (RO) treatment system. Table 13-11
summarizes the salinity reduction efforts of the various WWTPs.
14 The EC effluent limits for Deuel are based on the 2006 Bay-Delta Plan water quality objectives for salinity, not on facility performance.

State Water Resources Control Board California Environmental Protection Agency
Service Providers
Evaluation of San Joaquin River Flow and Southern Delta Water Quality Objectives and Implementation
13-24 September 2016
ICF 00427.11
Table 13-8. Southern Delta Wastewater Treatment Plant Salinity (EC) Effluent Data (dS/m [μmhos/cm])a
Facility
2011 Annual Average EC
Effluent
2012 Annual Average EC
Effluent
2013 Annual Average EC
Effluent
2014 Annual Average EC
Effluent
2015 Annual Average EC
Effluent
Tracyb 1.2 [1,1171] 1.2 [1,229] 1.2 [1,250] 1.3 [1,342] 1.2 [1,246]
Deuel 2.4 [2,415]c 1.4 [1,410]d 1.3 [1,280] 1.3 [1,275] 2.2 [2,254]
Manteca 0.8 [781] 0.8 [778] 0.7 [750] 0.7 [745]b 0.8 [800]
Stocktonb 1.0 [1,032] 1.0 [958] 1.0 [973] 1.0 [982] 1.1 [1,127]
Mountain House CSD
0.7 [693] 0.9 [908] 1.0 [990] 1.0 [991] 1.0 [1,029]
Discovery Bay CSDe
2.2 [2,167] 2.2 [2,173] 2.0 [2,006]f 2.0 [2,054] 2.0 [2,058]
Sources: CIWQS 2011, 2012, 2013, 2014, 2015.
EC = electrical conductivity (salinity)
μmhos/cm = micromhos per centimeter
dS/m = deciSiemens per meter (1 dS/m = 1000 µS/cm). Numbers presented in dS/m were rounded.
CIWQS = California Integrated Water Quality System Project
CSD = Community Services District a Based on monthly samples (January–December) unless otherwise noted. b Based on weekly samples (January–December). c No data on CIWQS, so the comparison to potential effluent limitations is based on recent ACLC R5-2011-0575, which
reported an average monthly EC value of 2,260 μmhos/cm on January 31, 2011 and 2,570 μmhos/cm on February
28, 2011. d Based on monthly samples (February–December). e Based on biweekly samples (January–December) f Based on biweekly samples (January–June and August – December)

State Water Resources Control Board California Environmental Protection Agency
Service Providers
Evaluation of San Joaquin River Flow and Southern Delta Water Quality Objectives and Implementation
13-25 September 2016
ICF 00427.11
Table 13-9. Southern Delta Wastewater Treatment Plant Salinity (EC) Effluent Data April–August and Remainder of the Year (dS/m [μmhos/cm])a
2011 April–
August
2011 Jan– Mar, Sept–
Dec 2012 April–
August 2012 Jan– Mar,
Sept–Dec 2013 April–
August 2013 Jan– Mar,
Sept–Dec 2014 April–
August 2014 Jan– Mar,
Sept–Dec 2015 April–
August 2015 Jan– Mar,
Sept–Dec
Facility Average EC
Effluent Average EC
Effluent Average EC
Effluent Average EC
Effluent Average EC
Effluent Average EC
Effluent Average EC
Effluent Average EC
Effluent Average EC
Effluent Average EC
Effluent
Tracy b 1.2 [1,201] 1.2 [1,171] 1.2 [1,228] 1.2 [1,229] 1.3 [1,269] 1.2 [1,236] 1.3 [1,295] 1.4 [1,374] 1.3 [1,307] 1.2 [1,206]
Deuel — c 2.6 [2,570]c 2.2 [2,193] 0.8 [759]d 0.8 [823] 1.6 [1,606] 0.7 [712] 1.7 [1,676] 1.7 [1,674] 2.7 [2,668]
Manteca 0.8 [793] 0.8 [774] 0.8 [786] 0.8 [774] 0.7 [739] 0.8 [759] 0.8 [770]e 0.7 [728]b 0.8 [842] 0.7 [768]
Stockton b 1.0 [1,054] 1.0 [1,015] 1.0 [996] 0.9 [930] 1.0 [965] 1.0 [978] 1.0 [1,005] 1.0 [965] 1.2 [1,173] 1.1 [1,093]
Mountain House CSD
0.7 [660] 0.7 [722] 0.9 [908] 0.8 [817] 1.0 [966] 1.0 [1011] 1.0 [1,009] 1.0 [979] 1.0 [1,038] 1.0 [1,022]
Discovery Bay CSD e
2.2 [2,180] 2.2 [2,125] 2.2 [2,153] 2.2 [2,187] 2.2 [2,186] f 1.9 [1,894] 2.1 [2,104] 2.0 [2,009] 2 [2,052] 2.1 [2,061]
Sources: CIWQS 2011, 2012, 2013, 2014, 2015.
CIWQS = California Integrated Water Quality System Project
CSD = Community Services District
dS/m = deciSiemens per meter (1 dS/m = 1000 µS/cm). Conversion is 1 dS/m = 1000 μmhos/cm. Numbers presented in dS/m were rounded.
EC = electrical conductivity (salinity)
μmhos/cm = micromhos per centimeter a Based on monthly samples unless otherwise noted. b Based on weekly samples. c No data in CIWQS, so the comparison to potential effluent limitations is based on recent ACLC R5-2011-0575, which reported an average monthly EC value of 2.600 dS/m (2,570
μmhos/cm) on February 28, 2011. d No data in CIWQS for January. e Based on biweekly samples. f No data in CIWQS for July 2013. Therefore, this value represents the EC effluent average for April–June, and August.

State Water Resources Control Board California Environmental Protection Agency
Service Providers
Evaluation of San Joaquin River Flow and Southern Delta Water Quality Objectives and Implementation
13-26 September 2016
ICF 00427.11
Table 13-10. Current Southern Delta Wastewater Treatment Plant Compliance Status with National Pollutant Discharge Elimination System Permit Special Provisions for Salinity Requirements
Facility Requirements Deadline Compliance Status
Tracy Salinity Reduction Plan, which includes a PPP
March 1, annually Submitted Salinity PPP Report on March 1, 2015
Deuel PPP for Salinity December 1, annually Submitted PPP for salinity on January 13, 2015
Manteca PPP for Electrical Conductivity
December 1, annually Submitted PPP on October 20, 2014
Stockton PPP for Salinity, progress reports
June 1, annually, beginning 2015
Submitted PPP for salinity on May 26, 2015
Mountain House CSD Salinity Reduction Plan, which includes a PPP
June 1, annually Submitted Salinity Reduction Progress Report on May 19, 2015
Discovery Bay CSD PPP for Salinity January 30, annually Submitted PPP for salinity on January 12, 2015
Note: Table updated in 2015.
PPP = Pollution Prevention Plan
CSD = Community Services District
WW = Wastewater

State Water Resources Control Board California Environmental Protection Agency
Service Providers
Evaluation of San Joaquin River Flow and Southern Delta Water Quality Objectives and Implementation
13-27 September 2016
ICF 00427.11
Table 13-11. Salinity Reduction Efforts of Southern Delta Wastewater Treatment Plant Dischargers
WWTP Facility
Salinity Reduction Efforts
Source Water Pretreatment Program WWTP Desalination
Tracy Addition of freshwater from New Melones Reservoir to groundwater supplies
Construction of an Aquifer Storage and Recovery (ASR) well pilot project; permanent ASR is anticipated based on pilot project
Reduction in water softeners
Currently proposing a desalination plant (RO treatment); released public initial study/mitigated negative declaration (IS/MND) for the Tracy Desalination and Green Energy Project in April 2012
Deuel No plans for changes to groundwater supplies
No pretreatment program, and none required
Constructed an RO groundwater treatment system with brine concentrator in 2010
Manteca No plans for changes to 50 percent surface water from SSJID and 50 percent groundwater
Reduction in water softeners
No plans for desalination at WWTP
Stockton Implementing Delta Water Supply Project for conjunctive use planned for 2012
Reduction in water softeners and TDS from industries
No plans for desalination at WWTP, but proposes to replace alum with polymer, submit inflow and infiltration study to identify salinity sources and loads, and implement Capital Improvement Energy Plan to meet salinity limitations
Mountain House CSD
No plans for changes to surface water from Clifton Court Forebay
Reduction in water softeners
No plans for desalination at WWTP
Discovery Bay CSD
— — Evaluated feasibility of constructing RO treatment system in 2010 Wastewater Master Plan
Note: The past and current violations at Deuel are potentially attributed to a malfunction of the RO and brine
conversion systems used by the facility to reduce the salinity of the groundwater supply.
WWTP = wastewater treatment plant
RO = reverse osmosis
SSJID = South San Joaquin Irrigation District
TDS = total dissolved solids
CSD = community service district

State Water Resources Control Board California Environmental Protection Agency
Service Providers
Evaluation of San Joaquin River Flow and Southern Delta Water Quality Objectives and Implementation
13-28 September 2016
ICF 00427.11
Each of the current dischargers to the southern Delta is described below, including characteristics of
the WWTP, salinity requirements, recorded violations in 2011, and currently implemented salinity
control measures.
City of Tracy
Tracy discharges tertiary treated wastewater into Old River, which is a side branch of the SJR and
contributes water to Clifton Court Forebay, a drinking water source for Southern California. The
current NPDES discharge permit (Order No. R5-2012-0115) covers the main domestic wastewater
treatment facility and an industrial pretreatment facility, including pretreated wastewater from the
Leprino Foods Company (Leprino), a local cheese manufacturer (Central Valley Water Board 2012).
All wastewater is discharged from Discharge Point 001 to Old River, located 3.5 miles north of the
WWTP upstream of Paradise Cut (Figure 2-12). The nearest compliance monitoring station is station
P-12 (Old River at Tracy Boulevard Bridge), approximately 4 miles west (downstream) of the
discharge point (Central Valley Water Board 2007a). The nearest drinking water intakes are the CVP
and SWP, which are approximately 10 miles downstream of the discharge (Central Valley Water
Board 2007a).
Tracy’s treated wastewater effluent is high in salt partly due to the municipal water supply and from
significant salt loading from Leprino. Although Leprino provides preliminary treatment of its
wastewater to reduce the high organic loading typical of food processing waste, no specific
pretreatment is provided to reduce the high salt loading.
Tracy does not currently have EC effluent limitations; however, it still monitors for EC, as required
by its NPDES permit, and has initiated salinity reduction efforts. The average EC of Tracy’s
wastewater effluent has not changed substantially over the past few years, although it did
experience a slight increase in 2014 (Tables 13-7 and 13-8). Tracy submitted a salinity reduction
plan in 2008 that describes the approach to identify, evaluate, and implement measures to reduce
salinity in the effluent discharge and meet the interim salinity goal. Tracy also submitted a salinity
best practicable treatment or control evaluation and salinity pollution prevention plan (PPP) in
compliance with NPDES permit requirements.
Salinity Reduction Efforts
Source Water Supplies
Historically, the largest source of salinity in Tracy's wastewater effluent was the groundwater used
as a potable water supply for the community. Tracy has obtained surface water potable supplies to
replace the use of groundwater. Groundwater usage was reduced from 7,176 acre-feet (AF) in 2004
to 1,327 AF in 2009. As a result, there has been a reduction of approximately 5,000 tons of salt per
year (Bayley pers. comm.). Additionally, Tracy is contracted with SSJID to receive water from New
Melones Reservoir, and this additional water contributes to the reduction of salinity in the effluent
(Tracy Press 2011). Additionally, Tracy completed construction of an Aquifer Storage and Recovery
(ASR) well pilot project in 2012. The Central Valley Water Board must approve pilot tests on
injection of drinking water into the groundwater basin. The permanent ASR project is planned for
2013 upon completion of environmental review. Tracy successfully commenced a pilot project to
store surplus surface water supplies in the Semitropic Water Storage District in Kern County
(Marshall pers. comm. 2012a).

State Water Resources Control Board California Environmental Protection Agency
Service Providers
Evaluation of San Joaquin River Flow and Southern Delta Water Quality Objectives and Implementation
13-29 September 2016
ICF 00427.11
Salinity Pretreatment Program
Replacing some groundwater with surface water for source water supplies has reduced the need for
salt-based, self-regenerating water softeners, which contribute additional salinity to wastewater.
These water softeners contribute to salinity because as they reduce hardness ions (e.g., calcium and
magnesium), they produce a byproduct of a concentrated solution of the hardness ions and chloride
that is discharged to the WWTP. This discharge increases the salinity of the wastewater entering the
WWTP and the overall salinity of the treated effluent discharged from the WWTP. According to Tracy,
there has been an observable significant decrease in the salinity of the wastewater effluent due to a
reduction in the use of water softeners (City of Tracy 2008).
Desalination at the WWTP
Tracy is upgrading the WWTP to improve treatment and expand capacity. The treatment system
capacity will be expanded from 10.8 million gallons per day (mgd) to 16 mgd through a four-phase
expansion. In order to increase discharge capacity, Tracy is planning to construct a second outfall,
Discharge Point 002, approximately 800 feet downstream of Discharge Point 001. Tracy is currently
proposing to build a desalination plant (Verma pers. comm.). Tracy released a public draft of the initial
study/mitigated negative declaration (IS/MND) for the Tracy Desalination and Green Energy Project
in December 2011 and final document in April 2012 (State Clearinghouse Number 2011122004).
Deuel Vocational Institution
The California Department of Corrections and Rehabilitation’s (CDCR) current NPDES permit (Order
No. R5-2014-0014) authorizes treated effluent discharges from the Deuel Vocational Institution.
Deuel has general population housing of more than 3,700 inmates. Treated effluent is discharged
into the Deuel Drain, which is tributary to Paradise Cut and Old River (Central Valley Water Board
2014a). The western end of Paradise Cut discharges to Old River.
Table 13-12 summarizes the WWTP NPDES permit enforcement orders showing violations of EC
effluent limitations occurring during the existing NPDES permit term. Deuel has had 16 violations of
its daily and monthly average EC effluent limitations since the existing NPDES permit was issued.15
These violations are potentially attributed to a malfunction of the RO and Brine Concentrator
systems used by the facility to reduce the salinity of the groundwater supply. The RO system has
only operated for 16 months of the 48 months since it has been permitted to operate (i.e., it has
operated 33percent of the time) (Central Valley Water Board 2015a).
Salinity Reduction Efforts
Source Water Supplies
Source water for Deuel comes from four on-site groundwater wells. The groundwater is treated
prior to use via a RO system. Approximately 8,000 gallons per day of brine solution are removed and
deposited to four evaporation ponds. Despite efforts to reduce salinity using this system, the facility
continues to violate its effluent limitations; therefore, modifications to this facility are likely needed.
15 ACLC R5-2014-0518 and ACLC 2014-0550 were issued in 2014 and cover violations that occurred March 1, 2011 through December 31, 2013, and January 1, 2014 through March 31, 2014, respectively. However, EC was not one of the constituent standards that was in violation (Central Valley Water Board 2014a).

State Water Resources Control Board California Environmental Protection Agency
Service Providers
Evaluation of San Joaquin River Flow and Southern Delta Water Quality Objectives and Implementation
13-30 September 2016
ICF 00427.11
Salinity Pretreatment Program
Deuel does not have a pretreatment program because the only source of wastewater is the prison,
and it does not treat industrial wastewater.
Table 13-12. Recent Wastewater Treatment Plant National Pollution Discharge Elimination System Permit Enforcement Orders for the Deuel Vocational Institution
Enforcement Order for EC Violation Dates of Noncompliance Description
Cease and Desist (R5-2008-0165-01) as amended by Administrative Civil Liability Complaint (ACLC) (R5-2010-0010)
NA Established new interim daily EC limit of 3.000 dS/m (3,000 μmhos/cm) effective until Dec 31, 2010
ACLC (R5-2009-0571) April 30, 2009 1 violation of daily EC limit of 3.000 dS/m (3,000 μmhos/cm)
ACLC (R5-2010-0526) Aug 31, 2009–Feb 28, 2010
1 violation of monthly EC limit of 0.700 dS/m (700 μmhos/cm); 3 violations of monthly EC limit of 0.700 dS/m (700 μmhos/cm)
ACLC (R5-2010-0549) April 30, 2010–Aug 31, 2010
5 violations of monthly EC limit of 0.700 dS/m (700 μmhos/cm)
ACLC (R5-2011-0575) Sept 30, 2010–Feb 28, 2011
6 violations of monthly EC limit of 1.000 dS/m (1,000 μmhos/cm)
NA = not applicable
EC = electrical conductivity (salinity)
dS/m = deciSiemens per meter
μmhos/cm = micromhos per centimeter. Conversion is 1 dS/m = 1000 μmhos/cm.
City of Manteca
Manteca’s current NPDES permit (Order No. R5-2015-0026) regulates tertiary treated effluent
discharges from Manteca and surrounding areas and a portion of Lathrop. Manteca discharges part
of its treated effluent to irrigated fields. The remaining treated effluent is discharged to the SJR just
upstream of the Mossdale EC monitoring station and SJR at Brandt Bridge (C-6) (Central Valley
Water Board 2015b). The discharge is approximately 20 miles from the nearest drinking water
intake (Central Valley Water Board 2009). Manteca receives municipal wastewater and wastewater
from a produce washing and processing facility (Eckert Cold Storage). However, the food processing
wastewater is only discharged to land and enters the facility through a separate collection system.
After the issuance of Manteca’s former (2004) NPDES permit (Order No. R5-2004-0028), which
included seasonal effluent limits for EC of 1.0 dS/m (September–March) and 0.7 dS/m (April–
August), Manteca petitioned the State Water Board to amend the 0.7 dS/m effluent limit. On
March 16, 2005, the State Water Board adopted Water Quality Order (WQO) 2005-005, which
removed the 0.7 dS/m EC effluent limit. In October 2009, the Central Valley Water Board adopted
Manteca’s last NPDES permit (Order No. R5-2009-0095) that again included seasonal effluent limits

State Water Resources Control Board California Environmental Protection Agency
Service Providers
Evaluation of San Joaquin River Flow and Southern Delta Water Quality Objectives and Implementation
13-31 September 2016
ICF 00427.11
for EC of 1.0 dS/m (September–March) and 0.7 dS/m (April–August)16. Since Manteca could not
consistently comply with the 0.7 dS/m limitation, the Central Valley Water Board also adopted a
time schedule order (No. R5-2009-0096), allowing Manteca until October 2014 to achieve
compliance with the seasonal 0.7 dS/m effluent limitation. The time schedule order also required
Manteca to update its salinity PPP, initially developed in 2005. Manteca submitted a revised PPP in
April 2010. Under Order No. R5-2015-0026, effluent limitations based on the Delta salinity
objectives were not imposed due to the City of Tracy v. State Water Resources Control Board
litigation. Instead, a salinity effluent limitation based on current performance was imposed
(calendar year annual average for EC is not to exceed 1.0 dS/m), as well as a continuing requirement
to implement its PPP. The average EC of Manteca’s wastewater effluent has not changed
substantially over the past few years (Tables 13-7 and 13-8).
Salinity Reduction Efforts
Source Water Supplies
Manteca’s groundwater supplies, and, consequently, their wastewater and treated effluent, have a
high salt content. A portion of Manteca’s water supply is pumped from groundwater wells with an
EC level range of 0.3 dS/m to 0.6 dS/m. Starting in 2005, Manteca substituted a portion of its
groundwater supply with surface water from the SSJID such that Manteca’s water supplies are
currently comprised of 50 percent surface water. Manteca is currently evaluating the possibility of
installing salinity-removal technologies at some or all of its groundwater wells (City of Manteca
2010).
Salinity Pretreatment Program
A source of wastewater salinity is self-regenerating water softeners (City of Manteca 2010). In
recent years, Manteca’s water supply has reduced its water hardness by obtaining different source
water (e.g., surface water), but the use of water softeners has not decreased significantly because
most water softener systems were installed in homes prior to the water hardness reduction. In the
2010 PPP, Manteca proposed to launch an education campaign to encourage residents to switch
from standard self-regenerating water softeners to high-efficiency water softeners or an exchange
tank system.
Several Manteca commercial and industrial wastewater generators participate in the current
wastewater pretreatment processes and have undertaken efforts to reduce salinity. For example, the
wastewater from Eckert Cold Storage has been separated into two streams, one for the food-
processing and one for all other wastewater, thus reducing salinity discharged into the SJR.
Desalination at the WWTP
Manteca has not proposed to modify its facilities for salt removal.
16 Although the State Water Board removed the 0.7 dS/m EC limit in Manteca’s 2004 NPDES permit, the Central Valley Water Board implemented the 0.7 dS/m EC limit again due to a subsequent State Water Board Order for the City of Tracy Wastewater Treatment Plant (WQO 2009-003).

State Water Resources Control Board California Environmental Protection Agency
Service Providers
Evaluation of San Joaquin River Flow and Southern Delta Water Quality Objectives and Implementation
13-32 September 2016
ICF 00427.11
City of Stockton
Stockton’s current NPDES permit (Order No. R5-2014-0070) regulates tertiary treated effluent
discharges from Stockton, the Port of Stockton, and surrounding urbanized San Joaquin County
areas. The treated effluent is discharged to the SJR approximately 8 miles downstream from the SJR
at Brandt Bridge compliance station (C-6) (Central Valley Water Board 2014b). There are no known
drinking water intakes in the vicinity of the discharge (Central Valley Water Board 2014b). The
average EC of Stockton’s wastewater effluent has not changed substantially over the past few years
(Tables 13-7 and 13-8). Stockton submitted a PPP to the Central Valley Water Board in 2005 and a
draft salinity plan in June 2009. The average annual effluent is approximately 1.1 dS/m as stated in
the 2011 salinity plan progress report based on effluent data collected from January to October
2010. These effluent data demonstrate compliance with the average annual salinity effluent
limitation of 1.3 dS/m.
Salinity Reduction Efforts
Source Water Supplies
Stockton’s existing water supply originates from groundwater wells, groundwater delivered by the
California Water Service Company, and surface water delivered by SEWD from the Stanislaus and
Calaveras Rivers. The average EC of the groundwater sources is approximately 0.5 dS/m (city wells)
and approximately 0.4 dS/m (California Water Service wells), compared to 0.1 dS/m for surface
water sources (City of Stockton 2009). The Delta Water Supply Project (DWSP) was completed in
June 2012 and provides a new supplemental surface water supply from the SJR and includes a
30-mgd water treatment plant (City of Stockton 2011b).
Salinity Pretreatment Program
The extent of water softener use by Stockton residences is unknown (City of Stockton 2009).
Stockton works with industrial dischargers within its service area to reduce TDS concentrations as
part of its standard pretreatment program (City of Stockton 2009).
Desalination at the WWTP
Stockton is in the process of modifying the treatment plant to reduce salinity generated by alum (a
chemical used to consolidate, and hence aid in the removal of, salt during the wastewater treatment
process). It also will submit an inflow and infiltration study to the Central Valley Water Board as
part of the capital improvement program to identify specific methods of reducing EC and TDS loads
(City of Stockton 2011b).
Mountain House Community Services District
The Mountain House CSD’s NPDES permit (Order No. R5-2013-0004) covers the discharge of
tertiary treated effluent from the community of Mountain House in San Joaquin County into Old
River (Central Valley Water Board 2013). The Jones Pumping Plant is located 4.5 miles west
(downstream) of the discharge. The average EC of Mountain House CSD’s wastewater effluent has
not changed substantially over the past few years; however, it has slightly increased (Tables 13-7
and 13-8).

State Water Resources Control Board California Environmental Protection Agency
Service Providers
Evaluation of San Joaquin River Flow and Southern Delta Water Quality Objectives and Implementation
13-33 September 2016
ICF 00427.11
Salinity Reduction Efforts
Source Water Supplies
Mountain House CSD’s source water is surface water from the Clifton Court Forebay, which has an
EC of less than 0.3 dS/m (Central Valley Water Board 2007b).
Salinity Pretreatment Program
Mountain House CSD is required to implement a pretreatment program as specified in the current
NDPES permit. Mountain House CSD continues to discourage the use of water softeners within its
service area as part of its pretreatment program.
Desalination at the WWTP
Mountain House CSD currently neither operates a desalination system at the WWTP, nor does it plan
to construct one.
Discovery Bay CSD
Discovery Bay CSD’s NPDES permit (Order No. R5-2014-0073) regulates secondary treated
discharges from the town of Discovery Bay to Old River (Central Valley Water Board 2014c). The
Town of Discovery Bay owns the Discovery Bay WWTP, which serves approximately 16,000 people.
Discovery Bay CSD’s nearest compliance monitoring station is Clifton Court Forebay (2006 Bay-
Delta Plan Station C-9). Bay-Delta Station C-9 is one of the four southern Delta salinity compliance
stations and very little, if any, discharge from Discovery Bay CSD reaches the southern Delta
(Marshall pers. comm. 2012b). However, because it is located within the southern Delta, it is
included here as part of baseline conditions. The nearest drinking water intake is CCWD’s Old River
Intake for Los Vaqueros Reservoir. The average EC of Discovery Bay CSD’s wastewater effluent has
not changed substantially over the past few years; however, it has slightly decreased (Tables 13-7
and 13-8).
Salinity Reduction Efforts
Source Water Supplies
Discovery Bay CSD currently does not have any plans to change the source of its water supplies.
Salinity Pretreatment Program
Discovery Bay CSD currently does not have any plans to implement a salinity pretreatment program.
Desalination at the WWTP
According to the Discovery Bay Wastewater Treatment Master Plan (Discovery Bay CSD 2012), an
RO treatment facility would be constructed to meet an effluent EC goal of 1.0 dS/m. However,
because of the estimated high costs, high energy usage, and associated environmental impacts, the
Discovery Bay CSD concluded in the master plan that RO treatment would only be constructed and
used if mandated by the State (Discovery Bay CSD 2012).

State Water Resources Control Board California Environmental Protection Agency
Service Providers
Evaluation of San Joaquin River Flow and Southern Delta Water Quality Objectives and Implementation
13-34 September 2016
ICF 00427.11
Water Suppliers
Drinking water supply intakes are located in the southern Delta. These include the Jones and Banks
pumping plants of the CVP and SWP, respectively, and the intakes for CCWD.
Central Valley Project and State Water Project
As described in Chapter 2, Water Resources (Section 2.6.2), and Chapter 5, Surface Hydrology and
Water Quality (Sections 5.2.8 and 5.3.2), CVP and SWP export pumping is subject to 2006 Bay-Delta
Plan objectives, which are implemented through the State Water Board’s Water Right Decision 1641
(D-1641). Both the CVP and the SWP have maximum permitted pumping rates but are limited by
water availability depending on precipitation, snowpack, and senior water rights holders’ needs. Delta
outflow requirements may also limit export pumping if the combined Delta inflow is not enough to
satisfy both the in-Delta agricultural diversions and CVP and SWP pumping. The 1986 Coordinated
Operations Agreement (COA) between the federal and state governments sets the rules by which the
CVP and SWP jointly operate their water storage and conveyance facilities in order meet regulatory
obligations, maximize their contractual water deliveries, including Delta export pumping, and not
adversely affect each other’s water rights or the rights of others.
Contra Costa Water District
The CCWD diverts water from the southern and central Delta for drinking water supplies to eastern
and central Contra Costa County. As described in Chapter 2, Water Resources, CCWD has four surface
water intakes: Mallard Slough Intake, Rock Slough Pumping Plant #1, Old River Intake near State
Route (SR) 4, and the Victoria Canal Intake. Old River and Victoria Canal Intakes are located
immediately north–northwest of the SDWA boundary (Figure 2-12). The Mallard Slough Intake and
Rock Slough Intake are located further west and closer to the ocean. The Old River Intake is the
largest intake operated and accounts for the majority of surface water diverted to CCWD (CCWD and
USBR 2008.)
CCWD’s rights to divert water from the Delta integrate CCWD’s operations with the coordinated
operations of the CVP and SWP. CCWD has a contract with USBR for the delivery of 195,000 acre-
feet per year (AF/y) of CVP water for municipal and industrial uses and agricultural users in the
CCWD service area. The water delivered under the contract may be diverted at the Rock Slough and
Old River intakes at any time of the year. CCWD also has a water right for the Los Vaqueros Project
that allows water to be diverted from Old River to Los Vaqueros Reservoir November–June during
excess conditions in the Delta as defined in D-1629. CCWD also has a license and permit for
diversions at Mallard Slough for up to 26,780 AF/y. Therefore, when CCWD operates within the
terms of its CVP contract and water rights permits, it does so in conjunction with all other water
supply interests (CCWD and USBR 2008).
CCWD’s intakes are located in the western Delta where the effects of seawater intrusion are more
pronounced. Generally, CCWD’s intakes experience relatively fresh conditions in the late winter
and early spring, and salinity increases in summer and fall as conditions become drier and
regulatory standards governing Delta operations shift. This pattern can vary depending on
hydrology (CCWD and USBR 2008). Use of the Mallard Slough Intake is generally restricted due to
salinity concentrations because it experiences more tidal fluctuations as a result of its location.
Water quality conditions have restricted diversions from Mallard Slough (an average of 3,100
AF/y) with no diversions available in dry years. When Mallard Slough supplies are used, CVP

State Water Resources Control Board California Environmental Protection Agency
Service Providers
Evaluation of San Joaquin River Flow and Southern Delta Water Quality Objectives and Implementation
13-35 September 2016
ICF 00427.11
diversions at Rock Slough are reduced by an equivalent amount. The Victoria Canal Intake allows
CCWD the flexibility to divert water with lower salinity and allows seasonal operations shifts
between diversions. The seasonal variation in salinity between Old River/Rock Slough and
Victoria Canal allows CCWD to divert predominantly in winter and spring from Old River. In the
late summer, as salinity begins to rise, Victoria Canal salinity is generally lower than Old River
salinity and remains lower until Delta outflow increases and Delta salinity improves (usually in
December). Thus, CCWD typically diverts water in the summer and fall from Victoria Canal (CCWD
and USBR 2008).
13.3 Regulatory Background
13.3.1 Federal
Relevant federal programs, policies, plans, or regulations related to service providers are described
below.
Safe Drinking Water Act
The Safe Drinking Water Act (42 U.S.C., § 300f et seq.), originally passed by Congress in 1974 and
amended in 1986 and 1996, was established to protect public health by regulating the nation's
public drinking water supply. In addition to drinking water itself, the act requires the protection of
its sources, such as rivers, lakes, reservoirs, springs, and groundwater wells. The act authorizes the
U.S. Environmental Protection Agency (USEPA) to set national health-based standards for drinking
water, such as MCLs, to protect against contaminants that may adversely affect public health. In
California, as of July 1, 2014, the State Water Board’s DDW implements the Safe Drinking Water Act.
Included under the regulatory portion of the DDW program are: (1) issuance of permits for public
water systems and their sources and treatment to ensure compliance with drinking water
standards, (2) inspection of water systems, (3) tracking of monitoring requirements of water
systems to determine compliance, and (4) enforcement actions.
The Safe Drinking Water Act mandates that all community water systems, regardless of water
source (i.e., groundwater versus surface water) prepare and distribute an annual water quality
report, or CCR. The CCR must summarize information on system source water, detected regulated
contaminants in the drinking water, compliance to restore safe drinking water, and educational
information, particularly regarding nitrate, arsenic, or lead in areas where these naturally occurring
contaminants may be of concern. CCRs must be distributed to community water system customers
by July 1 each year and the reports provide information on water quality for the preceding calendar
year.
Clean Water Act
The federal CWA (33 U.S.C., § 1251 et seq.) places primary responsibility for developing water
quality standards on the states. The CWA established the basic structure for regulating point and
nonpoint discharges of pollutants into the waters of the United States and gave USEPA the authority
to implement pollution control programs, such as setting wastewater standards for industry. The
statute employs a variety of regulatory and non-regulatory tools to reduce pollutant discharges into

State Water Resources Control Board California Environmental Protection Agency
Service Providers
Evaluation of San Joaquin River Flow and Southern Delta Water Quality Objectives and Implementation
13-36 September 2016
ICF 00427.11
waters of the United States, finance municipal wastewater treatment facilities, and manage polluted
runoff.
Clean Water Act Section 402
Section 402 of the CWA regulates point-source discharges to surface waters through the NPDES
program, which is administered by USEPA. In states with approved programs, like California, the
State Water Board and the regional water boards have the primary responsibility to apply and
enforce the requirements of the CWA as a substitute for direct regulation by USEPA (33 U.S.C.
§§ 1342, subs. (b), (c); see related discussion of the Porter-Cologne Water Quality Control Act in
Section 13.3.2, State [Regulatory Background]). The NPDES program provides for both general
permits (those that cover a number of similar or related activities) and individual permits. Typically,
NPDES permits are reissued every 5 years (see Table 13-7 for recent permit information of WWTPs
within the area of potential effects). WWTPs are required to obtain NPDES permits that contain
specific requirements limiting discharge pollutants for the discharge of treated wastewater. NPDES
permits also require dischargers to monitor their wastewater to ensure treated effluent meets all
permitted requirements. The Central Valley Water Board generally issues WWTP NPDES permits for
wastewater discharges within the area of potential effects.
13.3.2 State
Relevant state programs, policies, plans, or regulations related to service providers are described
below.
California Code of Regulations, Title 23
Title 23 of the California Code of Regulations contains the State Water Board’s regulations. Section
106 identifies the policy of the state that the use of water for domestic purposes is the highest use,
with irrigation being the next highest use. Section 106.3 identifies that every human being has the
right to safe, clean, affordable, and accessible water adequate for human consumption, cooking, and
sanitary purposes (also known as the “Human Right to Water”). Relevant state agencies, including
the State Water Board, need to consider the human right to water when revising, adopting, or
establishing policies and regulations relevant to domestic water use.
Porter-Cologne Water Quality Control Act
The Porter-Cologne Water Quality Control Act (Porter-Cologne Act) (Wat. Code, § 13000 et seq.)
establishes a comprehensive program for the protection of water quality. It addresses both point
and non-point discharges to surface and ground waters. It provides for a statewide program for
water quality control administered regionally, within a framework of statewide coordination and
policy. (Wat. Code, § 13000.) The nine regional water boards have primary responsibility for
permitting through waste discharge requirements, inspection and enforcement actions. (See
Wat. Code, §§ 13260 et seq. and 13300 et seq.) The Porter-Cologne Act provides for the adoption of
water quality control plans. (Wat. Code, §§ 13170, 13240 et seq.) The State Water Board and the
regional water boards administer the CWA’s NPDES permit program, with oversight from USEPA.
(See Wat. Code, §§ 13370 et seq.) The State Water Board is updating the 2006 Bay-Delta Plan in
accordance with the CWA and the Porter-Cologne Act.

State Water Resources Control Board California Environmental Protection Agency
Service Providers
Evaluation of San Joaquin River Flow and Southern Delta Water Quality Objectives and Implementation
13-37 September 2016
ICF 00427.11
Given the authority under the Porter-Cologne Act to protect water quality, the State Water Board
can take various actions to respond to areas with water quality concerns. For example, in
enforcement actions, it can order parties responsible for nitrate contamination to provide
replacement water to impacted communities, as appropriate. Since 2014, the State Water Board has
assisted regional water boards with negotiating replacement water orders, including bottled water
and reverse-osmosis treatment, for nitrate-impacted drinking water.
San Francisco Bay/Sacramento–San Joaquin Delta Estuary Water Quality Control Plan
The 2006 Bay-Delta Plan was adopted by the State Water Board in December of 2006 following a
review of the 1995 Bay-Delta Plan. The 2006 Bay-Delta Plan identifies beneficial uses of the
Bay-Delta, water quality objectives (i.e., flow and salinity) for the reasonable protection of those
beneficial uses, and a program of implementation for achieving the water quality objectives.
The numeric objectives for EC in the 2006 Bay-Delta Plan for the southern Delta are based on the
protection of agricultural beneficial uses, which is 100 percent protection of salt-sensitive bean and
alfalfa crops (Appendix E, Salt Tolerance of Crops in the Southern Sacramento–San Joaquin Delta).
The numeric objectives are 0.7 dS/m during the summer irrigation season (April–August) and 1.0
dS/m during the winter season (September–March). Compliance with these objectives is currently
monitored at four compliance locations: SJR at Vernalis (C-10), SJR at Brandt Bridge (C-6), Old River
near Middle River (C-8), and Old River at Tracy Boulevard Bridge (P-12). The numeric objectives are
not just applicable at the compliance monitoring locations, but they also apply to the receiving
waters of WWTP discharge: “unless otherwise indicated, water quality objectives cited for a general
area, such as for the southern Delta, are applicable for all locations in that general area, and
compliance locations will be used to determine compliance with the cited objectives” (State Water
Board 2006).
D-1641 contains the current water right requirements, applicable to the California Department of
Water Resources’ (DWR’s) and the U.S. Bureau of Reclamation’s (USBR’s) operations of the SWP and
CVP facilities, to implement the Bay-Delta water quality objectives. It requires that USBR release
flows from New Melones Reservoir to maintain EC at Vernalis. The salinity objectives are the
maximum 30-day running average (monthly average) of mean daily EC (0.700 dS/m April–August
and 1.0 dS/m September–March for all water year types) (State Water Board 2006).
The existing objective for chloride concentration (related to salinity) is a year-round maximum
mean daily chloride concentration of 250 mg/L measured at five Delta intake facilities, of which
CCWD’s Pumping Plant No. 1 is one, for the reasonable protection of municipal beneficial uses. This
is consistent with USEPA’s secondary MCL for chloride. Additionally, a maximum daily chloride
concentration of 150 mg/L (measured either at Pumping Plant No. 1 or the SJR at the Antioch Water
Works Intake) is included in the 2006 Bay-Delta Plan for the reasonable protection of industrial
uses. A water quality goal for bromides (related to salinity) is set at 0.15 mg/L.
Sacramento River and San Joaquin River Basins Water Quality Control Plan
The Central Valley Water Board’s Water Quality Control Plan for the Sacramento and San Joaquin
River Basins identifies the beneficial uses to be reasonably protected in the Sacramento and SJR
Basin water bodies, water quality objectives, implementation programs, and surveillance and
monitoring programs. It includes wasteload allocations for salt and boron discharges into the LSJR.
The waste load allocations are the concentration limits set equal to the EC water quality objectives

State Water Resources Control Board California Environmental Protection Agency
Service Providers
Evaluation of San Joaquin River Flow and Southern Delta Water Quality Objectives and Implementation
13-38 September 2016
ICF 00427.11
for the SJR at the Airport Way Bridge near Vernalis. The Central Valley Water Board implements the
plan by issuing WDR or NPDES permits for wastewater discharges. Southern Delta dischargers have
been issued NPDES permits for treated discharges and are listed in Table 13-7.
The plan incorporates, by reference, the State Water Board’s DDW’s (formerly part of the California
Department of Public Health (DPH) numerical drinking water maximum contaminant levels (MCLs).
The incorporation of the MCLs, which apply to treated drinking water systems regulated by the
DDW, makes the MCLs also applicable to ambient receiving water with respect to the regulatory
programs administered by the regional water boards.
The Central Valley Water Board also adopted, and the State Water Board approved, plan
amendments to add policies for variances from surface water quality standards for point source
dischargers, a variance program for salinity, and exception from implementation of water quality
objectives for salinity.17 The amendments are pending approval by USEPA before they become
effective. Under the variance policy, the Central Valley Water Board would be allowed the authority
to grant variances from meeting water quality-based effluent limitations for non-priority pollutants
to dischargers subject to NPDES permits. Under the salinity variance program, domestic and
municipal wastewater permittees subject to NPDES permits may apply to the Central Valley Water
Board for a variance from meeting water quality-based effluent limitations for salinity constituents
(i.e., EC, total dissolved solids, chloride, sulfate and sodium). The Central Valley Water Board may
approve the permittee’s salinity variance request for a period not exceeding ten years after finding,
among other things, that the attainment of water-quality based effluent limitations for salinity is not
feasible, the permittee has implemented or will implement feasible salinity reduction/elimination
measures and permittee continues to participate in the Central Valley Salinity Alternatives for
Long-Term Sustainability (CV-SALTS) effort, a stakeholder effort working to develop comprehensive
salt and nitrate management plans. Under the salinity exception program, dischargers that are
subject to WDRs that are not also NPDES permits and conditional waivers may obtain a limited-term
exception to discharge requirements from the implementation of water quality objectives for
salinity. SDWQ Alternatives 2 and 3 are subject to the variance policy, salinity variance program and
salinity exception program adopted by the Central Valley Water Board under Resolution No. R5-
2014-0074.
California Drinking Water Standards
The California drinking water standards are based on federal standards, which are listed in Title 22
of the California Code of Regulations and administered by the State Water Board’s DDW. California
MCLs, components of drinking water standards, are found in Title 22, Chapter 15, Division 4. Salinity
can affect the taste, corrosivity, and other non-health-related characteristics of drinking water
supplies. Drinking water has a recommended secondary MCL for specific conductance (i.e., salinity)
of 0.900 dS/m. The upper secondary MCL is 1.600 dS/m and a short-term secondary MCL is 2.200
dS/m. No fixed consumer acceptance contaminant level has been established for conductance.
Specific conductance concentrations lower than the recommended secondary MCL are desirable for
a higher degree of consumer acceptance. The secondary MCL can be exceeded and is deemed
acceptable to approach the upper MCL if it is neither reasonable nor feasible to provide more
17 See Central Valley Regional Water Quality Control Board Resolution No. R5-2014-0074 and State Water Board Resolution No. 2015-010.

State Water Resources Control Board California Environmental Protection Agency
Service Providers
Evaluation of San Joaquin River Flow and Southern Delta Water Quality Objectives and Implementation
13-39 September 2016
ICF 00427.11
suitable waters. In addition, concentrations ranging up to the short-term MCL are acceptable only
for existing community water systems on a temporary basis.
California Safe Drinking Water Act
The California Health and Safety Code (Part 12, Chapter 4) defines public water systems as a system
for the provision of water for human consumption through pipes or other constructed conveyance
that has 15 or more service connections or regularly serves at least 25 individuals daily at least
60 days out of the year. A public water system includes the following.
Any collection, treatment, storage, and distribution facilities under control of the operator of the
system that are used primarily in connection with the system.
Any collection or pretreatment storage facilities not under the control of the operator that are
used primarily in connection with the system.
Any water system that treats water on behalf of one or more public water systems for the
purpose of rendering it safe for human consumption.
The Safe Drinking Water Act (at Health and Safety Code Section 116270 et seq.) includes the
following summarized provisions regarding the controls to prevent contaminated water from
getting to the end user of a public water system.
Section 116287—DDW must place requirements on public water systems and water districts
that are consistent with both the state and federal SDWA.
Sections 116325 and 116350—DDW is responsible for ensuring that all public water systems
are operated in compliance with the act and its regulations to protect public health.
Section 116365—DDW must adopt primary drinking water standards for contaminants in
drinking water that are not less stringent than the federal Safe Drinking Water Act.
Section 116385—public water systems have to provide water analysis to DDW.
Section 116395—DDW must assist local health officer in the evaluation of small public water
systems for potential organic chemical contamination.
Section 116400—if DDW determines a public water system is subject to potential
contamination, it may require quarterly water analysis.
Section 116425—DDW may exempt public water systems from any MCL or treatment
requirements under certain compelling factors and other criteria, but only if it will not result in
an unreasonable risk to health. Exemptions are granted for 12 months, but can be extended be
up to 3 years if specific criteria are met.
Section 116450—when primary drinking water standards are exceeded the public system
operator has to notify DDW and users.
Section 116470—public water systems are required to prepare and deliver consumer
confidence reports; systems serving 10,000 service connections must disclose detections of
contaminants and best available technologies to address the contamination.
Section 116525 and 116540—operators of a public water system may not operate without a
DDW permit. DDW may impose permit conditions, requirements for system improvements, and
time schedule to ensure a reliable and adequate supply of water that is at all times pure,
wholesome, potable, and does not endanger the health of consumers.

State Water Resources Control Board California Environmental Protection Agency
Service Providers
Evaluation of San Joaquin River Flow and Southern Delta Water Quality Objectives and Implementation
13-40 September 2016
ICF 00427.11
Section 116550—public water systems may not change its source of supply or method of
treatment without an amended permit.
Section 116555—public water systems must comply with primary and secondary drinking
water standards and provide pure, wholesome, healthful and potable water, among other
requirements.
Section 116655—DDW may issue compliance orders, which can include without limitation
requiring treatment/purification, change in source water, or system repairs.
Detailed requirements for regular water quality monitoring are set forth in DDW’s regulations at Cal.
Code. Regs., tit. 22, Section 64400 et seq.
State Water Board Sources of Drinking Water Policy (Resolution No. 88-63)
The Sources of Drinking Water Policy (Resolution No. 88-63) established state policy that regional
water boards must consider all surface water and groundwater, with certain exceptions, as suitable
or potentially suitable for municipal or domestic supply. The policy defines the following three
categories of waters potentially eligible for an exception from the designation and protection of a
water source for municipal or domestic supply.
Water bodies with high salinity (defined as TDS >3,000 mg/L), that either have naturally high
contaminant levels that cannot reasonably be treated using either best management practices
(BMPs) or best economically achievable treatment practices, or produce too low yield (<200
gallons per day).
Waters designed or modified to treat wastewaters (domestic or industrial wastewater, process
water, stormwater, mining discharges, or agricultural drainage), provided that such systems are
monitored to ensure compliance with all relevant water quality objectives.
Groundwater aquifers regulated as geothermal energy-producing sources or aquifers that have
been exempted administratively by federal regulations for the purpose of underground injection
of fluids associated with the production of hydrocarbon or geothermal energy.
Groundwater Ambient Monitoring and Assessment Program
GAMA is a comprehensive groundwater quality monitoring program based on interagency
collaboration between the State Water Board, regional water boards, DWR, Department of Pesticide
Regulations, U.S. Geological Survey, and Lawrence Livermore National Laboratory (LLNL), and
cooperation with local water agencies and well owners. Developed by the State Water Board in
2000, GAMA was expanded by the passage of the Groundwater Quality Monitoring Act of 2001, and
includes the following four projects to meet the statutory requirements of the act.
The Priority Basin Project—currently assesses the water quality of shallow aquifers typically
used for domestic supplies prioritizing areas with the greatest household densities relying on
domestic wells.
GeoTracker GAMA—a groundwater information system that provides water quality data from
multiple sources on an interactive Google-based map.
Domestic Well Project—samples private wells on a county level for well owners who volunteer
when the project is active in their county. Results are used by GAMA to evaluate water quality of
domestic wells.
State Water Resources Control Board California Environmental Protection Agency
Service Providers
Evaluation of San Joaquin River Flow and Southern Delta Water Quality Objectives and Implementation
13-41 September 2016
ICF 00427.11
Special Studies Project—focuses on groundwater studies conducted by LLNL, which cover
nitrate, wastewater and groundwater recharge.
Groundwater Quality Monitoring Act of 2001
The Groundwater Quality Monitoring Act of 2001 was established to improve statewide
comprehensive groundwater monitoring and to provide the public with readily available
information about groundwater quality in California. The Groundwater Quality Monitoring Act
requires that the State Water Board integrate existing monitoring programs and, as necessary,
establish new program elements in order to create a comprehensive groundwater monitoring
program for assessing the quality of all priority groundwater basin in the state that account for over
90 percent of groundwater used in California.
The Sustainable Groundwater Management Act
It is California state policy (Water Code § 113) that “groundwater resources be managed sustainably
for long-term reliability and multiple economic, social, and environmental benefits for current and
future beneficial uses” and that sustainable groundwater management “is best achieved locally
through the development, implementation, and updating of plans and programs based on the best
available science.”
The Sustainable Groundwater Management Act (SGMA) (Wat. Code, § 10720 et seq.) provides the
framework to implement this policy by requiring that local agencies in high- and medium-priority
basins (DWR 2014) form groundwater sustainability agencies (GSAs) by June 30, 2017 that will
develop, and commence implementation of, groundwater sustainability plans (GSPs) by either 2020
or 202218 that will achieve sustainable groundwater management within 20 years. SGMA defines
sustainable groundwater management as “the management and use of groundwater in a manner
that can be maintained during the [50 year] planning and implementation horizon without causing
undesirable results.” SGMA’s definition of undesirable results includes such effects as chronic
lowering of groundwater levels, significant and unreasonable reductions in groundwater storage,
degradations of water quality, and land subsidence that interferes with surface land uses. (Wat.
Code, § 10721, subd. (x).)
SGMA recognizes regional differences and provides flexibility to local agencies to tailor plans that
meet their needs, improves coordination between land use and groundwater planning, prioritizes
basins with the greatest problems and protects water rights. The legislation provides two key
management principles: It ensures that local and regional agencies have the resources they need to
sustainably manage groundwater, including the necessary authority, better technical information,
and financial resources; and, when local agencies cannot or will not manage their groundwater
sustainably, the legislation provides for State Water Board intervention until local agencies develop
and implement sustainable groundwater management plans.19 SGMA is described in greater detail in
Chapter 9, Groundwater Resources.
18 SGMA requires critically overdrafted high and medium priority basins (as determined by DWR), to adopt GSPs by January 31, 2020. In the plan area this includes the Eastern San Joaquin, Merced and Chowchilla Subbasins. All other high and medium priority basins, such as the Modesto and Turlock Subbasins, must develop GSPs by January 31, 2022. 19 The State Water Board can only intervene in a local area and develop an interim plan in limited circumstances: when no agency is willing to serve as a GSA (by 2017); when a GSA does not compete a GSP (by 2020); and when

State Water Resources Control Board California Environmental Protection Agency
Service Providers
Evaluation of San Joaquin River Flow and Southern Delta Water Quality Objectives and Implementation
13-42 September 2016
ICF 00427.11
13.3.3 Regional or Local
Relevant regional or local programs, policies, plans, or regulations related to service providers are
described below. Although local policies, plans, or regulations are not binding on the state of
California, below is a description of relevant ones.
Agricultural Water Management Plans
Several of the irrigation districts have prepared agricultural water management plans (AWMPs), in
which they have identified methods for dealing with water supply shortages. Table 13-13 describes
methods that are common throughout all of the irrigation district AWMPs for addressing surface
water shortages.
Table 13-13. Irrigation District Methods for Addressing Surface Water Shortages
Irrigation District
Conjunctive Use
Reduction in Surface Water
Allotments
Allowable Internal
Transfers
Groundwater Used for
Permanent Crops
Holds Carryover
Surface Water for
Crops
All Shortages Managed
with Groundwater
Fair and Equitable
Distribution
USBR Responsible
for Shortages
SSJID X X X NA NA NA X X
OID X X X X NA NA X X
SEWD X X NA NA NA NA NA X
TID X X X X X NA NA NA
MID X X NA X X NA NA NA
Merced ID X X NA X X NA X NA
Sources: SSJID 2011, 2012; SEWD 2014; City of Stockton 2011c; OID 2012; TID 2012; MID 2012; Merced ID 2013; City of
Merced 2001.
NA = not applicable
Urban Water Management Plans
The California Urban Water Management Planning Act requires urban water suppliers20 to initiate
planning strategies to ensure the appropriate level of reliability in their water service sufficient to
meet the needs of the various categories of customers during normal, dry, and multiple dry water
years. To do this, they must prepare an urban water management plan (UWMP) every 5 years.
The intent of the UWMP is to present information about water supply, water usage, recycled water,
and water use efficiency programs in a contracting water district’s service area. The UWMP also
serves as a resource for planners and policy makers over a 25-year planning time frame. Below is a
brief summary of information contained in the UWMPs that are available for SSJID and MID and for
entities that receive surface water from the irrigation districts.
both the GSP is inadequate or not implemented to achieve sustainability, and there is a condition of long-term overdraft or significant depletion of interconnected surface waters. 20 Urban water suppliers are defined as suppliers that have 3,000 or more water connections or provide over 3,000 acre-feet of water annually.

State Water Resources Control Board California Environmental Protection Agency
Service Providers
Evaluation of San Joaquin River Flow and Southern Delta Water Quality Objectives and Implementation
13-43 September 2016
ICF 00427.11
South San Joaquin Irrigation District (SSJID)
SSJID is contracted to provide surface water to SEWD and the Cities of Tracy, Manteca, Lathrop, Ripon,
and Escalon. In 2005, these cities, with the exception of Ripon, partnered with SSJID to construct a
water treatment plant and pipeline to deliver treated water from the Woodward Reservoir to these
participating cities as part of the South County Water Supply Project. The Cities of Manteca and
Lathrop will receive 18,500 AF/y and 11,791 AF/y of treated potable water, respectively, once Phase II
of the South County Water Supply Project is implemented (City of Lathrop 2009; City of Manteca
2012b).
SSJID’s water comes from three sources: the Stanislaus River, groundwater pumping by SSJID and
private land owners, and irrigation return flows from neighboring districts. The primary water
supply is surface water diversions from the Stanislaus River. The majority of water users in the
service area are agricultural, but the cities contracted with SSJID do serve municipal and urban
users. SSJID projects it will have adequate supplies to meet water demands in normal years through
2030 (dependent upon the certainty of the available water supply, which is dependent upon each
year’s hydrology and regulatory uncertainty). SSJID would experience water shortages under single
dry year conditions through 2030 that could not be compensated by conservation and only minimal
shortages under multiple dry year conditions through 2030 that could likely be compensated by
conservation (SSJID 2011).
Stockton East Water District (SEWD)
SEWD serves both urban and agricultural water users. SEWD’s receives surface water from both the
Stanislaus River (within the plan area) and Calaveras River (outside of the plan area). SEWD
typically receives 75,000 AF/y from New Melones Reservoir on the Stanislaus River and under the
OID/SSJID water transfer agreement, 8,000 to 30,000 AF/y21. SEWD typically receives
approximately 56.5 percent of its water supply from New Hogan Reservoir on the Calaveras River.
As such, based on total surface water supplies received in 2010 (118,216 AF): 51,540 AF
(approximately 44 percent of the total) came from New Melones Reservoir for agricultural use;
26,900 AF (approximately 23 percent of the total) came from the OID/SSJID water transfer
agreement; and the New Hogan Reservoir provided 39, 776 AF of water (approximately 34 percent
of the total) for urban use (SEWD 2014). SEWD maintains two groundwater wells that are only
pumped to supplement demand during dry years. Saline intrusion and contamination from
agricultural chemicals limit the use of groundwater. The Stockton East Water District Water
Management Plan (SEWD 2014) includes the existing and projected water demands associated with
these water users. SEWD’s Water Management Plan identifies that deficiencies in water supply
would occur under normal, single dry, and multiple dry years and would be offset by additional
groundwater pumping from urban retailers and the DWSP (SEWD 2014).
City of Tracy
Tracy obtains water from both surface and groundwater sources. The amount of water that Tracy uses
from each source varies year to year based on contractual agreements, annual precipitation, and city
policy (City of Tracy 2011a). Currently, Tracy’s existing water supplies include 17,500 AF/y through
21 This agreement is based on New Melones Reservoir storage and inflow as of April 1 of each year. This contract ended in 2009, with a potential 10-year renewal, pending studies. A one-year temporary water transfer agreement for the water year 2009–2010 allowed for a sale of up to 15,000 AF/y from both OID and SSJID.
State Water Resources Control Board California Environmental Protection Agency
Service Providers
Evaluation of San Joaquin River Flow and Southern Delta Water Quality Objectives and Implementation
13-44 September 2016
ICF 00427.11
the USBR CVP Interim Renewal Contract; 2,500 AF/y via USBR WSID Option; and 11,120 AF/y from
the South County Water Supply Project (City of Tracy 2014). Tracy Hills, once built out, will receive
2,430 AF/y from Byron Bethany Irrigation District (City of Tracy 2014). The City of Tracy is planning
to decrease groundwater use to 2,500 AF/y by 2015; however, up to 9,000 AF/y of groundwater is
available to the City of Tracy to make up for shortfalls in the event of a severe drought or other water
shortage (City of Tracy 2014). Tracy anticipates that it has sufficient water supply to meet the water
demand through 2035 during normal years, single dry and multiple dry years.
City of Ripon
Ripon last prepared an UWMP in 2003 and updated it in 2011 to meet new state standards. Ripon
has an agreement with SSJID to receive 2,000 AF/y, with a gradual increase to 6,000 AF/y by 2030
(SSJID 2011).
City of Modesto and Modesto Irrigation District (MID)
Modesto relies on a conjunctive water use strategy with two primary sources: groundwater and
surface water from the Tuolumne River purchased from MID. During normal water years, MID
delivers approximately 33,600 AF/y of treated surface water to the City of Modesto. This amount is
projected to increase to approximately 67,000 AF/y by 2035. Groundwater use is expected to be
reduced in the future with the introduction of additional surface water supplies from the Modesto
Regional Water Treatment Plant (MRWTP), and this supply source will become Modesto’s primary
water supply, with groundwater supplementing the available surface water supplies to meet
demand (City of Modesto and MID 2011). The Phase Two expansion of MRWTP will double the
capacity of MID’s water treatment plant, and an additional 33,602 AF/y of demand will be met with
surface water supplies upon the completion of this expansion.
The surface water supplied by the MRWTP is provided through agreements with MID, and if it
becomes necessary to reduce deliveries to its landowners, there would be proportional reductions
to the City of Modesto. The City of Modesto and MID project that water demand will be met 100
percent of the time with the water supply in normal, single dry, and multiple dry years, through
2035. In general, projected demand is expected to be met through additional groundwater pumping
(City of Modesto and MID 2011).
City and County of San Francisco (CCSF)
The CCSF regional water system obtains approximately 85 percent of its water from the Upper
Tuolumne River Watershed, which is collected in Hetch Hetchy Reservoir. The remaining 15 percent
of CCSF’s water supply is obtained from surface water sources in the Alameda and San Francisco
Peninsula Watersheds (SFPUC 2013). In 2015, CCSF provided approximately 196 mgd of surface
water to approximately 1,800,897 wholesale and 847,370 retail customers, and an additional 2 mgd
of groundwater and recycled water was also delivered to retail customers (SFPUC 2016). The
amount of water available to CCSF varies from year-to-year depending on meteorological conditions,
water rights, and statutory and contractual obligations (City and County of San Francisco 2008).
Currently, groundwater use is generally limited to irrigation in Golden Gate Park and at the San
Francisco Zoo (City and County of San Francisco 2008). However, ongoing groundwater storage
projects including the Regional Groundwater Storage and Recovery Project (as part of the WSIP,
discussed below) and the San Francisco Groundwater Supply Project, would increase water supply
reliability and diversify CCSF’s water supply (SFPUC 2015).

State Water Resources Control Board California Environmental Protection Agency
Service Providers
Evaluation of San Joaquin River Flow and Southern Delta Water Quality Objectives and Implementation
13-45 September 2016
ICF 00427.11
In normal water years water demand is met 100 percent of the time. At current delivery levels, CCSF
expects to experience up to a 25 percent water supply shortage 15–20 percent of the time during
multiple-year droughts. To enhance the ability of CCSF to meet service goals for water supply, as
well as water delivery reliability, water quality, and seismic reliability, SFPUC is implementing the
Water System Improvement Program (WSIP). The WSIP is, in part, a water supply program that will
be implemented in phases to meet projected water purchases through 2030 in drought and normal
water years. The WSIP establishes a mid-term planning milestone for 2018 at which point SFPUC
would reevaluate water demand projections through 2030 in the context of information, analysis
and available water resources in 2018. The WSIP includes the following water supply elements.
Water supply delivery to regional water system customers through 2018 of 265 mgd average
annual target delivery, which includes 184 mgd for wholesale customers and 81 mgd for retail
customers;
Water supply sources would include 265 mgd average annual from Tuolumne River, San
Francisco Peninsula, and Alameda Creek Watersheds, and 20 mgd (divided evenly between
retail and wholesale customers) of water conservation, recycled water and local groundwater
developed within the SFPUC’s service area; and
Water supply projects to meet dry-year demands with no greater than 20 percent system-wide
rationing in any one year, which would include restoring the capacity of Calaveras and Crystal
Springs reservoirs; groundwater conjunctive use; and water transfers with MID and TID during
dry years (average 2 mgd) (CCSF 2008).
Delta Regional Monitoring Program
Since 2012, the Delta Regional Monitoring Program (Delta RMP), initiated by the Central Valley
Water Board, has had the main goal of tracking and documenting the effectiveness of beneficial use
protection on restoration efforts through comprehensive monitoring of water quality constituents in
the Delta. The Delta RMP is stakeholder-directed with a steering committee consisting of publicly-
owned WWTPs, municipal stormwater dischargers, the Central Valley Water Board, the USEPA,
California Natural Resources Agency, State and Federal Contractors Water Agency, and Interagency
Ecological Program. The Delta RMP is still under development.
Order R5-2014-0122 considers the amendment of NPDES permits of several Sacramento–San
Joaquin Delta-area dischargers in accordance with 40 CFR 122.62(a)(2), including the City of
Stockton Regional Wastewater Control Facility; the City of Tracy WWTP; Mountain House CSD;
Discovery Bay CSD; and Deuel Vocational Institution to allow for the participation in the Delta RMP
in lieu of conducting their current individual monitoring efforts, when feasible and appropriate.
General Plans
City and county general plans can contain policies governing service providers, specifically with
respect to water supply and wastewater. The goals and policies governing service providers within
the area of potential effects are addressed in the applicable county general plans. Although local
general plans are not binding on the state of California, relevant provisions of these county general
plans are outlined below.

State Water Resources Control Board California Environmental Protection Agency
Service Providers
Evaluation of San Joaquin River Flow and Southern Delta Water Quality Objectives and Implementation
13-46 September 2016
ICF 00427.11
Stanislaus County
Goals and policies addressing water services and groundwater resources are presented in the
Stanislaus County General Plan Conservation and Open Space Element (Stanislaus County 1995).
These include: monitoring groundwater quality, preventing reduction of groundwater levels, and
incorporating water conservation strategies into new development.
Merced County
Goals and policies addressing water services are presented in the Public Facilities Element and the
Water Element of the 2030 Merced County General Plan (Merced County 2013). The policies support
the adequate provision of utilities to the residents of Merced County and ensure a reliable water
supply sufficient to meet the existing and future needs of the county by implementing groundwater
recharge projects, demonstrating sufficient water supply for new development, and investing in
additional surface water storage opportunities.
San Joaquin County
Objectives and policies addressing water services and groundwater resources are presented in the
Resources Element of San Joaquin County’s general plan (San Joaquin County 1992). The objectives
include obtaining sufficient supplemental water supplies to meet all municipal and agricultural needs;
protecting groundwater resources from overdraft; and preventing water supply contamination. The
policies discuss maintaining water quality and managing water resources such that conjunctive use
and other groundwater and surface water management practices are undertaken.
Contra Costa County
Goals and policies addressing water services are presented in the Contra Costa County General Plan
Public Facilities/Service Element section on water services (Contra Costa County 2005). These
policies include assurance of meeting regulatory standards for water delivery, water storage, and
emergency water supplies to residents. The general plan identifies goals of ensuring potable water
availability in quantities sufficient to serve existing and future residents and ensuring that new
development pays the costs related to the need for future increased water system capacity.
City of Tracy
The Tracy General Plan Public Facilities and Services Element contains policies stating that the
approval of a new development is conditioned on the availability of sufficient wastewater collection
and treatment capacity to service the proposed development. In addition, new development shall
fully fund the cost of wastewater treatment and disposal facilities. Tracy’s general plan contains
objectives and policies generally stating that the City shall meet the demands of future development
with adequate water supply and infrastructure. Policies also state that the City shall establish water
demand reduction standards for new development (City of Tracy 2011c).
City of Stockton
The 2035 Stockton General Plan contains policies that discuss the need for proper facility sizing to
meet long-term needs, wastewater reuse, and protection of critical infrastructure. It also contains
policies that reflect the City’s need for facilities able to meet long-term demands (City of Stockton
2007).

State Water Resources Control Board California Environmental Protection Agency
Service Providers
Evaluation of San Joaquin River Flow and Southern Delta Water Quality Objectives and Implementation
13-47 September 2016
ICF 00427.11
City of Manteca
Goals and policies addressing water services and wastewater services are presented in the City of
Manteca’s General Plan Public Facilities and Service Element (City of Manteca 2003). Goals include
maintaining existing target level of services for water delivery to residents and meeting the needs of
existing and projected development. Policies to support the goals include principally relying on
groundwater resources in the near term, developing new water sources as necessary to serve new
development, ensuring water quality and preventing contamination, and developing and
implementing water conservation measures.
City of Lathrop
Section D of the Comprehensive General Plan for the City of Lathrop provides guidance for the
elimination of deficiencies in existing utility services and obstacles to the expansion of utility
services to adequately serve existing and future development (City of Lathrop 2004). This guidance
includes: developing and maintaining existing groundwater resources within city limits,
participating in the South County Surface Water Supply Project, converting agricultural water
entitlements, and obtaining rights to other water sources in the region.
City of Escalon
Goals and policies identified in the City of Escalon’s general plan are meant to address the
community need for public service and facilities (City of Escalon 2005). These goals and policies are
meant to develop services and facilities, such as those for water supply, as the city grows and to plan
for the future increase in demand for such services.
City of Ripon
Goals and policies identified in the City of Ripon’s General Plan Land Use and Growth Accommodations
Element are meant to address groundwater resources and water conservation as they relate to
water supply (City of Ripon 2006). These include monitoring the existing groundwater conditions
and supply, identifying and securing available sources of supplemental surface water for
replacement or recharge of groundwater, and promoting water conservation.
13.4 Impact Analysis This section identifies the thresholds or significance criteria used to evaluate the potential impacts
on service providers. It further describes the methods of analysis used to determine significance.
Measures to mitigate (i.e., avoid, minimize, rectify, reduce, eliminate, or compensate for) significant
impacts accompany the impact discussion, if any significant impacts are identified.
13.4.1 Thresholds of Significance
The thresholds for determining the significance of impacts for this analysis are based on the State
Water Board’s Environmental Checklist in Appendix A of the board’s California Environmental
Quality Act (CEQA) regulations. (Cal. Code Regs., tit. 23, §§ 3720–3781.) The thresholds derived from
the checklist have been modified, as appropriate, to meet the circumstances of the alternatives. (Cal.
Code Regs., tit. 23, § 3777, subd. (a)(2).) Impacts resulting from actions by service providers were

State Water Resources Control Board California Environmental Protection Agency
Service Providers
Evaluation of San Joaquin River Flow and Southern Delta Water Quality Objectives and Implementation
13-48 September 2016
ICF 00427.11
identified as potentially significant in the State Water Board’s Environmental Checklist (see
Appendix B, State Water Board’s Environmental Checklist) and, therefore, are discussed in this
analysis as to whether the alternatives could result in the following.
Require or result in the construction of new water supply facilities or wastewater treatment
facilities or expansion of existing facilities, the construction of which could cause significant
environmental effects.
Violate any water quality standards such that drinking water quality in (a) public water systems
and (b) domestic wells would be affected.
Result in substantial changes to SJR inflows to the Delta such that insufficient water supplies
would be available to service providers relying on CVP/SWP exports.
Where appropriate, specific quantitative or qualitative criteria are described in Section 13.4.2,
Methods and Approach, for evaluating these thresholds.
As described Appendix B, State Water Board’s Environmental Checklist, the LSJR and SDWQ
alternatives would result in either no impact or less-than-significant impacts on the following
related to service providers and, therefore, are not discussed further within this chapter.
Exceed wastewater treatment requirements of the applicable regional water quality control board.
Have sufficient water supplies available to serve the project from existing entitlements and
resources, or are new or expanded entitlements needed.
Require or result in the construction of new storm water drainage facilities or expansion of
existing facilities, the construction of which could cause significant environmental effects.
Result in a determination by the wastewater treatment provider, which serves or may serve the
project, that it has adequate capacity to serve the project’s projected demand in addition to the
provider’s existing commitments.
Be served by a landfill with sufficient permitted capacity to accommodate the project’s solid
waste disposal needs.
Comply with federal, state, and local statutes and regulations related to solid waste.
13.4.2 Methods and Approach
LSJR Alternatives
This chapter evaluates the potential service provider impacts associated with the LSJR alternatives.
Each LSJR alternative includes a specific unimpaired flow22 requirement (i.e., 20, 40 or 60 percent)
from February–June and different methods for adaptive implementation to reasonably protect fish
and wildlife beneficial uses, as described in Chapter 3, Alternatives Description. Impacts could occur
through a change in either surface water supply or groundwater supply or a change in surface or
groundwater water quality under the LSJR alternatives. The methods for evaluating these changes
and the potential impacts are detailed in the following sections.
22 Unimpaired flow represents the water production of a river basin, unaltered by upstream diversions, storage, or by export or import of water to or from other watersheds. It differs from natural flow because unimpaired flow is the flow that occurs at a specific location under the current configuration of channels, levees, floodplain, wetlands, deforestation and urbanization.
State Water Resources Control Board California Environmental Protection Agency
Service Providers
Evaluation of San Joaquin River Flow and Southern Delta Water Quality Objectives and Implementation
13-49 September 2016
ICF 00427.11
Surface Water Supply
Results from the Water Supply Effects (WSE) model were used to estimate the potential surface
water diversion reductions on each of the three eastside tributaries (Impact SP-1). Table 13-14
shows the changes in the cumulative distribution of the diversions that are expected to occur as a
result of the LSJR alternatives as simulated by the WSE model.
While substantially reducing existing surface water supplies of service providers can be considered
an impact, the extent to which service providers are affected is a function of their ability to use
existing alternative supplies (e.g., groundwater) or develop alternative water supplies. Therefore,
surface water diversion reductions are then compared to service providers’ reliance on surface
water as characterized in Tables 13-3a and 13-3b. The reductions are considered within the general
context of water supply agreements and contracts to qualitatively determine whether service
providers may need new and expanded water supply treatment facilities or water supply
infrastructure.
This chapter provides a programmatic-level analysis of the impacts on service providers and refers
to Chapter 16, Evaluation of Other Indirect and Additional Actions (Section 16.2), with respect to
environmental impacts caused by service provider actions associated with various potential
responses to the alternative. Potential impacts that result from service provider actions associated
with the LSJR alternatives depend upon the specific actions selected by the service providers
responsible for implementing site-specific projects, most of which are public agencies subject to
their own CEQA obligations. Service providers may choose any approach described in Chapter 16,
or a combination of approaches, or they may identify another as-yet unknown approach to meet its
own unique needs. Potential new water supply facilities or infrastructure are described in Chapter
16 and include but are not limited to substitution of surface water with groundwater, aquifer
storage and recovery, and recycled water sources (Sections 16.2.2, 16.2.3, and 16.2.4, respectively).
Changes to SJR inflow into the southern Delta at Vernalis resulting from the LSJR alternatives could
change exports to service providers in the export service areas (i.e., CVP and SWP contractors). This
is because some of the inflow is exported at the CVP and SWP pumps to the export service areas. The
methodology used to estimate exports is fully described in Chapter 5, Surface Hydrology and Water
Quality and Appendix F.1, Hydrologic and Water Quality Modeling (Section F.1.7) and results are
presented in Tables F.1.7-2 through F.1.7-5 and summarized in Table 5-21. These changes are used
in this chapter to qualitatively discuss whether there would be sufficient water supplies to service
providers relying on CVP/SWP exports (Impact SP-3). To estimate the possible effects on exports,
analysis related to exports and outflow assumes the State Water Board will not change the export
constraints to protect any increased flows downstream of Vernalis because the LSJR alternatives as
described in Chapter 3, Alternatives Description, would not affect export regulations.

State Water Resources Control Board California Environmental Protection Agency
Service Providers
Evaluation of San Joaquin River Flow and Southern Delta Water Quality Objectives and Implementation
13-50 September 2016
ICF 00427.11
Table 13-14. Distribution of Annual Baseline Water Supply and Differences from Baseline (Changes in Diversions) in the Eastside Tributaries for the LSJR Alternatives for 1922–2003
Percentile Baseline (TAF)
LSJR Alternative 2 LSJR Alternative 3 LSJR Alternative 4
20% Unimpaired Flow 30% Unimpaired Flow
Change (TAF)
Percent Change
Change (TAF)
Percent Change
Change (TAF)
Percent Change
Change (TAF)
Percent Change
A. Annual Diversions from the Stanislaus River
Minimum 252 -24 -9 -24 -9 -24 -9 -87 -35
10 538 -86 -16 -218 -41 -273 -51 -337 -63
20 583 -13 -2 -75 -13 -180 -31 -362 -62
30 605 20 3 11 2 -140 -23 -344 -57
40 630 27 4 10 2 -46 -7 -308 -49
50 661 12 2 3 0 -21 -3 -262 -40
60 676 10 2 5 1 -14 -2 -166 -25
70 694 7 1 3 0 -15 -2 -93 -13
80 708 1 0 1 0 -13 -2 -47 -7
90 723 1 0 1 0 -11 -1 -33 -4
Maximum 772 0 0 0 0 -13 -2 -13 -2
Average 637 -12 -2 -33 -5 -79 -12 -206 -32
B. Annual Diversions from the Tuolumne River
Minimum 557 -186 -33 -186 -33 -216 -39 -343 -62
10 685 -33 -5 -142 -21 -277 -40 -456 -67
20 796 -15 -2 -81 -10 -234 -29 -510 -64
30 828 -6 -1 -51 -6 -188 -23 -450 -54
40 855 -3 0 -32 -4 -92 -11 -395 -46
50 878 -9 -1 -27 -3 -76 -9 -340 -39
60 891 -2 0 -20 -2 -63 -7 -218 -24
70 915 -5 -1 -25 -3 -56 -6 -153 -17
80 932 -2 0 -21 -2 -45 -5 -112 -12
90 960 -3 0 -22 -2 -52 -5 -107 -11

State Water Resources Control Board California Environmental Protection Agency
Service Providers
Evaluation of San Joaquin River Flow and Southern Delta Water Quality Objectives and Implementation
13-51 September 2016
ICF 00427.11
Percentile Baseline (TAF)
LSJR Alternative 2 LSJR Alternative 3 LSJR Alternative 4
20% Unimpaired Flow 30% Unimpaired Flow
Change (TAF)
Percent Change
Change (TAF)
Percent Change
Change (TAF)
Percent Change
Change (TAF)
Percent Change
Maximum 1034 0 0 -30 -3 -30 -3 -127 -12
Average 851 -20 -2 -56 -7 -119 -14 -298 -35
C. Annual Diversions from the Merced River
Minimum 136 67 49 67 49 67 49 66 48
10 441 -60 -14 -133 -30 -181 -41 -221 -50
20 558 -85 -15 -151 -27 -204 -37 -314 -56
30 578 -27 -5 -83 -14 -170 -29 -294 -51
40 602 -37 -6 -65 -11 -135 -22 -279 -46
50 617 -29 -5 -57 -9 -65 -11 -236 -38
60 630 -27 -4 -48 -8 -66 -10 -188 -30
70 643 -24 -4 -32 -5 -60 -9 -149 -23
80 653 -22 -3 -27 -4 -46 -7 -96 -15
90 669 -11 -2 -27 -4 -37 -6 -90 -13
Maximum 680 -7 -1 -7 -1 -7 -1 -32 -5
Average 580 -33 -6 -60 -10 -95 -16 -185 -32
TAF = thousand acre-feet

State Water Resources Control Board California Environmental Protection Agency
Service Providers
Evaluation of San Joaquin River Flow and Southern Delta Water Quality Objectives and Implementation
13-52 September 2016
ICF 00427.11
Groundwater Supply
Results from the WSE model, information from Tables 13-3a and 13-3b, and general information
regarding municipal and potable wells were used to estimate the potential impact on groundwater
supply for service providers (Impact SP-1). Specifically, the impact analysis draws from the
following.
Chapter 9, Groundwater Resources, assessment of Impact GW-1 (if reduction in surface water
diversion would substantially deplete groundwater supplies or interfere with recharge).
Public water suppliers’ reliance on groundwater.
Number of active groundwater wells operated by individual public water suppliers.
Size of population served by the public water suppliers.
Depths of selected wells shown in Table 13-3b and depths to groundwater at those wells.
In Chapter 9, it is determined that impacts on groundwater resources would be significant and
unavoidable in the Extended Merced Subbasin under LSJR Alternative 2 with adaptive
implementation; in the Modesto, Turlock, and Extended Merced Subbasins under LSJR Alternative 3;
and in all four subbasins under LSJR Alternative 4. The public water suppliers located in the
impacted subbasins (see Tables 13-3a and 13-3b) are more likely to be affected by a reduction in
groundwater supply.
Municipal groundwater well depths in the four groundwater subbasins range from 110–1,216 feet
(Table 13-3b), whereas domestic well depths range from 48–580 feet (State Water Board 2016b). In
general, public wells are deeper than private wells because private entities generally do not have the
resources to drill deep. Accordingly, private wells can run dry before public wells do during drought.
The difference between well depth and depth to groundwater, as shown in Table 13-3b, is a rough
indicator of the potential for a well to run dry in the future—the smaller the difference, the more
likely that a particular well may go dry. This is a general indicator given that the depth to water in a
well may be different from the depth to groundwater depending on the site-specific hydrogeologic
characteristics of the aquifer and well depth. The depth to groundwater (Table 13-3b) refers to
depth to the top of the aquifer; yet municipal drinking water wells can draw water from deeper
confined aquifers, which can cause water level in a well to be different from the top of the aquifer.
However, when the depth to groundwater approaches the well depth, there is more certainty that a
well is close to running dry. A difference of 100 feet or less was selected to identify wells considered
potentially at risk of running dry sooner relative to other wells (identified in the gray-shaded cells in
Table 13-3b). If significant groundwater impacts are allowed to continue for multiple years,
especially in combination with drought, these wells may be at greater risk of running dry.
As discussed for surface water supply, this chapter provides a programmatic-level analysis of the
impacts on service providers and refers to Chapter 16, Evaluation of Other Indirect and Additional
Actions (Sections 16.2 and 16.3), with respect to environmental impacts caused by service provider
actions associated with various potential responses to the alternative. Potential new water supply
facilities or infrastructure are described in Chapter 16 and include substitution of surface water
with groundwater, aquifer storage and recovery, and recycled water sources (Sections 16.2.2, 16.2.3,
and 16.2.4, respectively). With respect to CCSF, potential new water supply facilities or
infrastructure may include in-Delta diversions and water supply desalination (Sections 16.2.5 and
16.2.6, respectively).

State Water Resources Control Board California Environmental Protection Agency
Service Providers
Evaluation of San Joaquin River Flow and Southern Delta Water Quality Objectives and Implementation
13-53 September 2016
ICF 00427.11
Surface Water Quality
The potential impacts of the LSJR alternatives on existing drinking water sources in the southern
Delta are evaluated quantitatively using the expected change in inflow from the LSJR predicted by
the WSE model and the simulated effects on salinity values in the southern Delta (Impact SP-2a).
EC in the southern Delta is largely controlled by EC at Vernalis. Table 13-15 presents baseline EC at
Vernalis. The effect of LSJR Alternatives 2, 3, and 4 on these EC values is presented in Tables 13-16,
13-17, and 13-18. These tables show effects of the LSJR alternatives over a range of year types with
the wetter, high flow years being represented by the salinity values at the lower ranges of the
cumulative distribution and the drier, low flow years being represented by the salinity values at the
higher ranges of the cumulative distribution. Further information about Delta salinity and changes
in salinity within the southern Delta is presented in detail in Chapter 5, Surface Hydrology and Water
Quality, in Appendix F.1, Hydrologic and Water Quality Modeling (which presents salinity changes
under each of the LSJR alternatives) and Appendix F.2, Evaluation of Historical Flow and Salinity
Measurements of the Lower San Joaquin River and Southern Delta (which presents historic salinity
data).
Table 13-15. Cumulative Distribution of Baseline EC (µmhos/cm) at Vernalis
Percentile Oct Nov Dec Jan Feb Mar Apr May Jun Jul Aug Sep Annual
Minimum 193 155 222 218 186 193 180 144 205 222 163 227 216
10 440 507 606 386 296 264 245 192 334 451 420 448 422
20 468 542 749 568 344 306 305 299 406 544 442 481 456
30 484 584 784 672 466 337 347 341 432 573 497 495 486
40 489 596 807 752 600 458 374 362 467 586 528 510 517
50 496 612 813 769 684 631 413 375 528 597 547 521 576
60 506 629 824 785 780 658 442 421 564 610 569 539 609
70 515 645 831 798 870 791 517 461 588 629 590 552 633
80 529 664 844 824 936 859 594 567 628 643 613 567 673
90 547 686 867 838 1,000 1,000 676 644 682 660 655 590 730
Maximum 589 759 926 882 1,000 1,000 700 700 700 700 700 669 747
Average 492 598 770 697 655 592 435 407 508 577 535 518 565
Note: 1 dS/m (deciSiemens per meter) = 1,000 µmhos/cm (micromhos per centimeter)

State Water Resources Control Board California Environmental Protection Agency
Service Providers
Evaluation of San Joaquin River Flow and Southern Delta Water Quality Objectives and Implementation
13-54 September 2016
ICF 00427.11
Table 13-16. Change in Cumulative Distribution of EC (µmhos/cm) at Vernalis Associated with LSJR Alternative 2
Percentile Oct Nov Dec Jan Feb Mar Apr May Jun Jul Aug Sep Annual
Minimum 0 0 0 0 0 0 0 -2 0 0 0 0 0
10 -3 -6 17 -6 -15 -1 -2 -5 -57 0 -8 -21 0
20 -1 -6 6 -23 -9 -5 -5 -30 -89 7 -2 -3 7
30 -4 -4 10 24 24 -7 10 -34 -87 8 1 1 1
40 -2 0 2 2 -27 15 22 -36 -92 1 6 -3 3
50 -4 0 5 8 -32 0 17 -32 -109 4 0 -2 -1
60 -1 0 1 4 73 45 23 -48 -122 9 -1 -3 -14
70 -1 0 1 8 42 46 -20 -54 -124 2 -10 -3 -5
80 0 0 4 1 41 110 -58 -129 -104 6 -6 0 -11
90 -3 0 0 10 0 0 -80 -141 -98 4 0 -5 -45
Maximum 0 0 0 0 0 0 0 0 0 0 0 0 -9
Average -2 -2 8 3 11 16 -9 -52 -85 4 -4 -6 -10
Note: 1 dS/m (deciSiemens per meter) = 1,000 µmhos/cm (micromhos per centimeter)
Table 13-17. Change in Cumulative Distribution of EC (µmhos/cm) at Vernalis Associated with LSJR Alternative 3
Percentile Oct Nov Dec Jan Feb Mar Apr May Jun Jul Aug Sep Annual
Minimum 12 0 0 0 0 0 -5 -8 -64 25 0 0 3
10 -85 -99 144 29 -14 23 -29 -24 -150 -24 -3 -87 -9
20 -100 -118 43 106 35 7 -53 -112 -196 -38 -6 -98 -9
30 -80 -74 24 86 -17 37 -61 -139 -190 -2 14 -59 -10
40 -45 -6 6 24 -102 -20 -62 -145 -194 -1 -3 -9 -12
50 -29 0 11 16 30 -90 -74 -140 -229 -9 8 3 -44
60 -32 2 5 14 17 -48 -86 -174 -225 -3 5 2 -55
70 -36 1 10 19 -6 -119 -127 -189 -216 -2 3 -1 -58
80 -41 0 15 9 9 -97 -180 -275 -210 -1 4 0 -72
90 -32 2 27 17 -12 -75 -214 -327 -192 4 0 -5 -111
Maximum -49 0 74 55 0 0 0 -143 -27 0 0 0 -36
Average -49 -30 36 36 -6 -38 -94 -163 -185 -8 3 -25 -43
Note: 1 dS/m (deciSiemens per meter) = 1,000 µmhos/cm (micromhos per centimeter)

State Water Resources Control Board California Environmental Protection Agency
Service Providers
Evaluation of San Joaquin River Flow and Southern Delta Water Quality Objectives and Implementation
13-55 September 2016
ICF 00427.11
Table 13-18. Change in Cumulative Distribution of EC (µmhos/cm) at Vernalis Associated with LSJR Alternative 4
Percentile Oct Nov Dec Jan Feb Mar Apr May Jun Jul Aug Sep Annual
Minimum 12 0 0 17 0 -32 -42 -31 -109 65 45 0 18
10 -93 -106 154 96 -31 2 -71 -62 -206 31 0 -87 -13
20 -103 -129 49 144 -10 -10 -104 -161 -260 23 55 -98 -22
30 -81 -74 24 95 -88 -7 -124 -192 -255 16 12 -59 -22
40 -45 -6 8 28 -185 -77 -138 -207 -262 19 5 -3 -37
50 -27 0 11 22 -109 -200 -156 -209 -305 16 17 5 -72
60 -32 2 7 24 -142 -186 -154 -245 -309 19 8 4 -89
70 -36 1 10 31 -78 -239 -216 -268 -305 9 4 0 -93
80 -41 0 15 24 -100 -250 -263 -364 -325 17 7 -2 -115
90 -27 2 27 34 -50 -243 -306 -411 -336 40 0 -1 -156
Maximum -49 0 74 118 0 0 -150 -262 -53 0 0 0 -67
Average -50 -32 41 51 -75 -121 -163 -229 -265 20 12 -22 -69
Note: 1 dS/m (deciSiemens per meter) = 1,000 µmhos/cm (micromhos per centimeter)
The magnitude of the effects of the alternatives at other locations within the southern Delta (e.g., Old
River at Tracy Boulevard and SJR at Brandt Bridge) is expected to be slightly larger than the effects at
Vernalis. This is because the Vernalis flow, which affects EC at Vernalis, also affects the change in EC
between Vernalis and locations within the southern Delta. As a result, if an alternative is expected to
cause a reduction in EC at Vernalis, it would be expected to cause a slightly greater reduction farther
downstream. Similarly, if an alternative is expected to cause an increase in EC at Vernalis, it would be
expected to cause a slightly greater increase farther downstream. This information is used to identify
whether the salinity in the southern Delta would result in a substantial degradation to water quality
such that municipal drinking water sources could be affected.
Groundwater Quality
The potential impact of the LSJR alternatives on groundwater quality in municipal drinking water
wells in the Eastern San Joaquin, Modesto, Turlock, and Extended Merced Subbasins is evaluated
qualitatively. The analysis is based, in part, on the discussion of potential indirect impacts on
groundwater quality due to increased pumping and subsequent reduction of groundwater level as
discussed in Section 13.2.1, Lower San Joaquin River and Tributaries. The analysis also considers MCL
exceedance information for primary detected contaminants in groundwater wells of selected
municipalities in the area of potential effects during a representative non-drought year and drought
year (Table 13-5), when groundwater reliance increased. To determine whether drinking water
sources could be significantly impacted, these variables are considered together within the context of
the California Health and Safety Code provisions of the Safe Drinking Water Act to prevent
contaminated water from getting to the end user of a public water system (Impacts SP-2a and SP-2b).
Adaptive Implementation
Each LSJR alternative includes a February–June unimpaired flow requirement (i.e., 20, 40, or 60
percent) and methods for adaptive implementation to reasonably protect fish and wildlife beneficial
uses, as described in Chapter 3, Alternatives Description. In addition, a minimum base flow is

State Water Resources Control Board California Environmental Protection Agency
Service Providers
Evaluation of San Joaquin River Flow and Southern Delta Water Quality Objectives and Implementation
13-56 September 2016
ICF 00427.11
required at Vernalis at all times during this period. The base flow may be adaptively implemented as
described below and in Chapter 3. State Water Board approval is required before any method can be
implemented, as described in Appendix K, Revised Water Quality Control Plan. All methods may be
implemented individually or in combination with other methods, may be applied differently to each
tributary, and could be in effect for varying lengths of time.
The Stanislaus, Tuolumne, and Merced Working Group (STM Working Group) will assist with
implementation, monitoring, and assessment activities for the flow objectives and with developing
biological goals to help evaluate the effectiveness of the flow requirements and adaptive
implementation actions. The STM Working Group may recommend adjusting the flow requirements
through adaptive implementation if scientific information supports such changes to reasonably
protect fish and wildlife beneficial uses. Scientific research may also be conducted within the adaptive
range to improve scientific understanding of measures needed to protect fish and wildlife and reduce
scientific uncertainty through monitoring and evaluation. Further details describing the methods, the
STM Working Group, and the approval process are included in Chapter 3 and Appendix K.
Without adaptive implementation, flow must be managed such that it tracks the daily unimpaired
flow percentage based on a running average of 7 days. The four methods of adaptive
implementation are described briefly below.
1. Based on best available scientific information indicating that more flow is needed or less flow is
adequate to reasonably protect fish and wildlife beneficial uses, the specified annual February–
June minimum unimpaired flow requirement may be increased or decreased to a percentage
within the ranges listed below. For LSJR Alternative 2 (20 percent unimpaired flow), the percent of
unimpaired flow may be increased to a maximum of 30 percent. For LSJR Alternative 3 (40 percent
unimpaired flow), the percent of unimpaired flow may be decreased to a minimum of 30 percent
or increased to a maximum of 50 percent. For LSJR Alternative 4 (60 percent unimpaired flow),
the percent of unimpaired flow may be decreased to a minimum of 50 percent.
2. Based on best available scientific information indicating a flow pattern different from that which
would occur by tracking the unimpaired flow percentage would better protect fish and wildlife
beneficial uses, water may be released at varying rates during February–June. The total volume
of water released under this adaptive method must be at least equal to the volume of water that
would be released by tracking the unimpaired flow percentage from February–June.
3. Based on best available scientific information, release of a portion of the February–June
unimpaired flow may be delayed until after June to prevent adverse effects to fisheries,
including temperature, which would otherwise result from implementation of the February–
June flow requirements. The ability to delay release of flow until after June is only allowed when
the unimpaired flow requirement is greater than 30 percent. If the requirement is greater than
30 percent but less than 40 percent, the amount of flow that may be released after June is
limited to the portion of the unimpaired flow requirement over 30 percent. For example, if the
flow requirement is 35 percent, 5 percent may be released after June. If the requirement is
40 percent or greater, then 25 percent of the total volume of the flow requirement may be
released after June. As an example, if the requirement is 50 percent, at least 37.5 percent
unimpaired flow must be released in February–June and up to 12.5 percent unimpaired flow
may be released after June. If after June the STM Working Group determines that conditions
have changed such that water held for release after June should not be released by the fall of
that year, the water may be held until the following year. See Chapter 3 and Appendix K for
further details.

State Water Resources Control Board California Environmental Protection Agency
Service Providers
Evaluation of San Joaquin River Flow and Southern Delta Water Quality Objectives and Implementation
13-57 September 2016
ICF 00427.11
4. Based on best available scientific information indicating that more flow is needed or less flow is
adequate to reasonably protect fish and wildlife beneficial uses, the February–June Vernalis base
flow requirement of 1,000 cubic feet per second (cfs) may be modified to a rate between 800
and 1,200 cfs.
The operational changes made using the adaptive implementation methods above may be approved
if the best available scientific information indicates that the changes will be sufficient to support and
maintain the natural production of viable native SJR Watershed fish populations migrating through
the Delta and meet any biological goals. The changes may take place on either a short-term
(e.g., monthly or annually) or longer-term basis. Adaptive implementation is intended to foster
coordinated and adaptive management of flows based on best available scientific information in
order to protect fish and wildlife beneficial uses. Adaptive implementation could also optimize flows
to achieve the objective, while allowing for consideration of other beneficial uses, provided that
these other considerations do not reduce intended benefits to fish and wildlife. While the measures
and processes used to decide upon adaptive implementation actions must achieve the narrative
objective for the reasonable protection of fish and wildlife beneficial uses, adaptive implementation
could result in flows that would benefit or reduce impacts on other beneficial uses that rely on
water.
The quantitative results included in the figures, tables, and text of this chapter present WSE modeling
of the specified unimpaired flow requirement for each LSJR alternative (i.e., 20, 40, or 60 percent).
However, the modeling does allow some inflows to be retained in the reservoirs after June, as could
occur under adaptive implementation method 3, to prevent adverse temperature effects and this is
included in the results presented in this chapter. If the percent of unimpaired flow is not specified in
this chapter, these are the percentages of unimpaired flow evaluated in the impact analysis. However,
as part of adaptive implementation method 1, the required percent of unimpaired flow could change
by up to 10 percent if the STM Working Group agrees to adjust it. The highest possible percent of
unimpaired flow associated with an LSJR alternative is also evaluated in the impact analysis if
long-term implementation of method 1 has the potential to affect a determination of significance.
For example, if the determination for LSJR Alternative 2 at 20 percent unimpaired flow is less than
significant, but the determination for LSJR Alternative 3 at 40 percent unimpaired flow is significant,
then LSJR Alternative 2 is also evaluated at the 30 percent unimpaired flow. This use of modeling
provides information to support the analysis and evaluation of the effects of the alternatives and
adaptive implementation. For more information regarding the modeling methodology and quantitative
flow and temperature modeling results, see Appendix F.1, Hydrologic and Water Quality Modeling.
Extended Plan Area
The analysis of the extended plan area generally identifies how the impacts may be similar to or
different from the impacts in the plan area (i.e., downstream of the rim dams) depending on the
similarity of the impact mechanism (e.g., changes in reservoir levels, reduced water diversions, and
additional flow in the rivers) or location of potential impacts in the extended plan area. Where
appropriate, the program of implementation is discussed to help contextualize the potential impacts
in the extended plan area.
SDWQ Alternatives
The potential impacts of the SDWQ alternatives on existing drinking water sources in the southern
Delta are evaluated qualitatively. The general range of historical salinity levels in the southern Delta

State Water Resources Control Board California Environmental Protection Agency
Service Providers
Evaluation of San Joaquin River Flow and Southern Delta Water Quality Objectives and Implementation
13-58 September 2016
ICF 00427.11
are presented in Chapter 5, Surface Hydrology and Water Quality (Tables 5-15a-d), Appendix F.2,
Evaluation of Historical Flow and Salinity Measurements of the Lower San Joaquin River and Southern
Delta, and Section 13.2.3, Southern Delta.
The SDWQ alternatives would amend the southern Delta salinity objectives identified in the 2006
Bay-Delta Plan. The 2006 Bay-Delta Plan established salinity objectives to protect agricultural
beneficial uses in the southern Delta. Under the CWA, the Central Valley Water Board is required
to impose permit effluent limitations to achieve water quality objectives in the Bay-Delta Plan for
point-source dischargers where there is a reasonable potential for the discharge to cause or
contribute to an excursion above a water quality objective. (40 C.F.R., § 122.44, subd. (d).)
The average annual effluent EC data, existing regulatory effluent limitations, and evaluation of
enforcement orders are used to qualitatively discuss whether service providers could meet the
objectives of the SDWQ alternatives. For this assessment, it is assumed that under basel ine
conditions, WWTP effluent limitations would be based on the current limitations. With the
exception of Deuel, these are less stringent than the southern Delta salinity objectives specified in
the 2006 Bay-Delta Plan. If the salinity objectives are changed according to SDWQ Alternatives 2
and 3, WWTP effluent limitations for salinity would have be modified and set equal to the new
objectives. The potential impacts of the SDWQ alternatives on WWTPs are evaluated qualitatively
(Impact SP-1).
The Central Valley Water Board has determined the discharge from Discovery Bay CSD does not
have reasonable potential to cause or contribute to an exceedance of the 2006 Bay-Delta Plan water
quality objectives in Old River or the southern Delta (Marshall pers. comm. 2012a). This is because
of the large dilution in Old River and the good quality of water in Old River coming down from the
Sacramento River (Marshall pers. comm. 2012a). Thus, Discovery Bay CSD can comply with the
water quality objectives and does not need effluent limits based on the 2006 Bay-Delta Plan water
quality objectives (Marshall pers. comm. 2012a). Since SDWQ Alternatives 2 and 3 are higher than
the existing salinity water quality objectives, Discovery Bay CSD would likely continue to not have a
reasonable potential to cause or contribute to exceedance of the proposed salinity water quality
objectives such that effluent limitations would not be required. Therefore, Discovery Bay CSD is not
included in the analysis in Section 13.4.3, Impacts and Mitigation Measures.
This chapter provides a programmatic-level analysis of the impacts on service providers and refers
to Chapter 16, Evaluation of Other Indirect and Additional Actions (Section 16.4), with respect to
environmental impacts caused by service provider actions associated with various methods of
compliance. Service providers may choose any method of compliance described in Chapter 16, or a
combination of methods, or they may identify another as-yet unknown method of compliance to
comply with requirements from the revised objectives. Potential new water supply facilities or
infrastructure are described in Chapter 16 and include the following: new source water supplies
including new and expanded infrastructure to support such supplies; salinity pretreatment
programs; desalination, including new and expanded salinity removal facilities at existing WWTPs;
and the real-time management of agricultural return flow, including the use of detention ponds
(Sections 16.4.2, 16.4.3, 16.4.4, respectively).23
23 The City of Tracy finalized and adopted the Initial Study/Mitigated Negative Declaration for the Tracy Desalinization and Green Energy Project in April of 2012 (City of Tracy 2011b, 2012). Impact determinations from this document are incorporated herein. This document identified available and feasible mitigation necessary to reduce potentially significant environmental effects on aesthetics, agriculture, air quality, biological resources,

State Water Resources Control Board California Environmental Protection Agency
Service Providers
Evaluation of San Joaquin River Flow and Southern Delta Water Quality Objectives and Implementation
13-59 September 2016
ICF 00427.11
As noted in Chapter 9, Groundwater Resources, and discussed in Appendix B, State Water Board’s Environmental Checklist, the SDWQ alternatives would not result in a change in the minimal
groundwater pumping that currently takes place in the southern Delta; therefore, with regard to
groundwater supply, and associated effects on drinking water supply, the SDWQ alternatives are not addressed in this chapter.
13.4.3 Impacts and Mitigation Measures
Impact SP-1: Require or result in the construction of new water supply facilities or wastewater
treatment facilities or expansion of existing facilities, the construction of which could cause
significant environmental effects
No Project Alternative (LSJR/SDWQ Alternative 1)
The No Project Alternative would result in implementation of flow objectives identified in the
2006 Bay-Delta Plan. See Chapter 15, No Project Alternative (LSJR Alternative 1 and SDWQ
Alternative 1), for the No Project Alternative impact discussion and Appendix D, Evaluation of the
No Project Alternative (LSJR Alternative 1 and SDWQ Alternative 1), for the No Project Alternative
technical analysis.
LSJR Alternatives
LSJR Alternative 2 (Less than significant/Significant and unavoidable with adaptive implementation)
Surface Water Supply
Results of the WSE model indicate that service providers diverting surface water from the
Stanislaus, Tuolumne, and Merced Rivers would generally be able to divert similar surface water
amounts at similar times under LSJR Alternative 2 when compared to baseline (Table 5-19). For
LSJR Alternative 2, the average percent reduction in water supply on the Stanislaus, Tuolumne, and
Merced Rivers was estimated to be 2 percent, 2 percent, and 6 percent, respectively (Table 13-14).
Service providers relying on surface water diversions are expected to receive similar surface water
supplies relative to baseline conditions. Because it is expected these service providers would have
sufficient sources of surface water, it is not expected they would need to construct new or expanded
water treatment facilities or water supply infrastructure.
Groundwater Supply
As described in Chapter 9, Groundwater Resources, the slight reduction in recharge compared to
baseline, due to small changes to average surface water diversions under LSJR Alternative 2, would
not likely result in a substantial reduction in groundwater levels. As such, those service providers
(Tables 13-3a and 13-3b) and private users that rely primarily on groundwater would have
sufficient sources for municipal and domestic uses under LSJR Alternative 2 and, therefore, it is not
cultural resources, geology and soils, hydrology and water quality, hazards and hazardous materials, and land use and planning. With the implementation of mitigation measures, impacts on these resources were determined by the City to be reduced to a less-than-significant level.

State Water Resources Control Board California Environmental Protection Agency
Service Providers
Evaluation of San Joaquin River Flow and Southern Delta Water Quality Objectives and Implementation
13-60 September 2016
ICF 00427.11
expected they would need to construct new or expand existing water treatment facilities or water
supply infrastructure. Impacts would be less than significant.
Adaptive Implementation
Based on best available scientific information indicating that a change in the percent of unimpaired
flow is needed to reasonably protect fish and wildlife, adaptive implementation method 1 would
allow an increase of up to 10 percent over the 20-percent February–June unimpaired flow
requirement (to a maximum of 30 percent of unimpaired flow). A change to the percent of
unimpaired flow would take place based on required evaluation of current scientific information
and would need to be approved as described in Appendix K, Revised Water Quality Control Plan.
Accordingly, the frequency and duration of any use of this adaptive implementation method cannot
be determined at this time. However, an increase of up to 30 percent of unimpaired flow would
potentially result in different effects as compared to 20-percent unimpaired flow, depending upon
flow conditions and frequency of the adjustment. While the total volume of water released
February–June would be the same as LSJR Alternative 2 without adaptive implementation, the rate
could vary from the actual (7-day running average) unimpaired flow rate.
Based on best available scientific information indicating that a change in the timing or rate of
unimpaired flow is needed to reasonably protect fish and wildlife, adaptive implementation method
2 would allow changing the timing of the release of the volume of water within the February–June
time frame. While the total volume of water released February–June would be the same as LSJR
Alternative 2 without adaptive implementation, the rate could vary from the actual (7-day running
average) unimpaired flow rate. Method 2 would not authorize a reduction in flows required by other
agencies or through other processes, which are incorporated in the modeling of baseline conditions.
Method 3 would not be authorized under LSJR Alternative 2 since the unimpaired flow percentage
would not exceed 30 percent.
Adaptive implementation method 4 would allow an adjustment of the Vernalis February–June flow
requirement. WSE model results show that under LSJR Alternative 2 the 1,200-cfs February–June
base flow requirement at Vernalis would require a flow augmentation in the three eastside
tributaries and LSJR only 2.7 percent of the time in the 82-year record analyzed. Similarly, flow
augmentation would be required 0.7 percent of the time to meet a 1,000 cfs requirement and 0.5
percent of the time for an 800 cfs Vernalis base flow requirement. These results indicate that
changes due to method 4 under this alternative would rarely alter the flows in the three eastside
tributaries or the LSJR.
Surface Water Supply
At 30 percent unimpaired flow under LSJR Alternative 2 with adaptive implementation method 1,
the average percent reduction in water supply on the Stanislaus, Tuolumne, and Merced Rivers was
estimated to be 5 percent, 7 percent, and 10 percent, respectively. Thus, surface water supply
reductions would be greater at the 30 percent unimpaired flow level compared to 20 percent
unimpaired flow. Reductions would be greatest for service providers receiving Merced River
diversions (i.e., Merced ID), but would also be substantial for Tuolumne River service providers
(i.e., TID, MID, and CCSF).
The extent to which service providers’ surface water supplies would actually be reduced is a
function of the mechanisms by which they receive the water (e.g., water rights or contracts), existing
policies, regulations, and the type of water use they supply. Some water supply contracts have

State Water Resources Control Board California Environmental Protection Agency
Service Providers
Evaluation of San Joaquin River Flow and Southern Delta Water Quality Objectives and Implementation
13-61 September 2016
ICF 00427.11
provisions that dictate when and how much surface water other water users receive from irrigation
districts. For example, contracts could require the irrigation district to supply the full contracted
amount of surface water to the other water user at all times, including during drought or water
restricted periods. Some irrigation districts have policies in place that may require curtailment of
water supplies during periods of surface water reduction (Table 13-13). Although California
recognizes water for domestic purposes as the most important use of water and irrigation as the
next most important use (Cal. Code Regs., tit. 23, § 106), this does not necessarily mean that the
water supply for domestic uses cannot be modified. Furthermore, if other water districts that supply
domestic uses are receiving water through contracts with irrigation districts, then these uses would
not necessarily be protected. For example, if MID experiences water shortages, its deliveries to
service providers serving urban uses (e.g., City of Modesto) could be cut back proportionally, as
described in MID’s various plans and policy documents.
The extent to which service providers that primarily rely on surface water are affected by a
reduction in surface water diversions is a function of their ability to develop alternative water
supplies or rely on their current existing alternative supplies (e.g., groundwater). Service providers
that rely heavily or primarily on surface water diversions to supply water to their service areas
could experience significant reductions in water supply, depending on the various factors described
above (i.e., mechanism by which they receive the water, existing policies, regulations, and the type of
water use they supply). Thus, the extent of the effect under LSJR Alternative 2 with adaptive
implementation method 1 would be great when compared to baseline. MID, TID, and Merced ID
currently rely on surface water diversions from the Tuolumne and Merced Rivers as their primary
water supply. The City of Modesto currently relies on surface water diversions to meet nearly
40 percent of its water demand (Table 13-3b). If surface water diversions were reduced on the
Tuolumne and Merced Rivers, (depending on the mechanism by which they receive the water,
existing policies, regulations, and the type of water use they supply) these service providers would
likely be greatly affected. The LSJR Alternative 2 program of implementation states that the State
Water Board will take actions as necessary to ensure implementation of flow objectives does not
impact supplies of water for minimum health and safety needs, particularly during drought periods.
Actions may include assistance with funding and development of water conservation efforts and
regional water supply reliability projects and regulating public drinking water systems and water
rights. These actions would be aimed at those service providers supplying water to municipal users
and may offset water supply reduction impacts on providers. However, it is expected service
providers may need to construct or expand new water treatment facilities or water supply
infrastructure to try to accommodate reductions in surface water supplies. Additionally, as a result
of reduced water supply, LSJR Alternative 2 with adaptive implementation method 1 may
necessitate WWTPs and related infrastructure to be modified to allow or augment water recycling
or meet pretreatment or NPDES permit requirements.
As discussed in Appendix L, City and County of San Francisco Analyses, some portion of the
increased release flows from New Don Pedro Reservoir on the Tuolumne River could be shared by
CCSF (especially during a prolonged drought), thus potentially reducing water supply. This would
depend on a number of factors, including the assignment of responsibility to CCSF or the irrigation
districts to meet the flow requirements through a proceeding amending water rights or through
FERC relicensing, the interpretation of the Fourth Agreement, whether CCSF pays the irrigation
districts to release water to meet the flow requirement, and any future agreement between the
irrigation districts and CCSF. If a prolonged drought occurred, and CCSF was required to share in
the release of flows, thus potentially reducing water supply, it may need to construct new and

State Water Resources Control Board California Environmental Protection Agency
Service Providers
Evaluation of San Joaquin River Flow and Southern Delta Water Quality Objectives and Implementation
13-62 September 2016
ICF 00427.11
expanded water treatment supply infrastructure for in-Delta diversion and desalination to
accommodate reductions in surface water supplies, as identified in Chapter 16, Evaluation of Other
Indirect and Additional Actions, Sections 16.2.5 and 16.2.6, respectively.
Identifying the exact nature of the new and expanded facilities potentially needed by those irrigation
districts and other water suppliers to replace potentially reduced surface water supplies is
speculative (as discussed in Chapter 16, Evaluation of Other Indirect and Additional Actions).
However, it is reasonably foreseeable that new and expanded facilities could include the following.
New and expanded infrastructure, if needed, to convey water obtained through water transfers
or sales from other entities or watershed.24
New and expanded groundwater well(s) and distribution infrastructure (e.g., underground
pipes) and infrastructure to treat groundwater, if needed.
New and expanded conjunctive groundwater use program(s), which could use available capacity
in unlined canals and agricultural fields that are not in production to recharge groundwater
basins during high flow events.
New and expanded facilities at existing WWTPs and distribution infrastructure (e.g.,
underground pipes) to increase the supply of recycled water as a possible source of water.
New surface water reservoir and distribution infrastructure.
Depending on the location and particular construction and operational requirements, construction of
the new and modified facilities described above could result in physical environmental impacts on
resources such as those listed below (Chapter 16, Section 16.2.1, Section 16.2.2 and Table 16-7;
Section 16.2.3 and Table 16-9; Section 16.2.4 and Table 16-10; and Section 16.2.7 and Table 16-11b).
Air quality and greenhouse gases, as a result of emissions generated by construction equipment
and construction trips.
Biological resources, as a result of potential dust, noise, or possible removal of special-status
species and habitat.
Cultural resources, as a result of excavation, grading, and other soil-disturbing activities, if
construction takes place in an area moderately or highly sensitive for cultural resources.
Geology, as a result of potential erosion or construction on unstable soils.
Water quality, as a result of runoff associated with dust control or other construction activities,
or as a result of potential construction material spills, such as of lubricants or fuel.
Hazards, as a result of handling, use, and disposal of hazardous materials during construction.
Mineral resources, as a result of potentially inhibiting access to known mineral resources.
24 One of the options that the service providers have to compensate for the reduction of surface
water and groundwater availability due to the LSJR alternatives is water purchase or transfer from
other entities. As discussed in Chapter 16, Evaluation of Other Indirect and Additional Actions,
Section 16.2.1, it is not expected that additional infrastructure would be needed. If new and
expanded infrastructure is needed, the physical environmental impacts of the construction would be
similar to those discussed in Chapter 16, Section 16.2.2 and Table 16-7; Section 16.2.3 and Table 16-
9; and Section 16.2.4 and Table 16-10).

State Water Resources Control Board California Environmental Protection Agency
Service Providers
Evaluation of San Joaquin River Flow and Southern Delta Water Quality Objectives and Implementation
13-63 September 2016
ICF 00427.11
Noise, as a result of the use of construction equipment within proximity to potential sensitive
receptors (e.g., residences).
Traffic, as a result of the use of construction equipment and commuting of construction workers.
Depending on the location and particular construction and operational requirements, operation of
new and modified facilities could result in physical environmental impacts on resources such as
those listed below (Chapter 16, Section 16.2.1, Section 16.2.2, and Table 16-7; Section 16.2.3 and
Table 16-9; Section 16.2.4 and Table 16-10; and Section 16.2.7 and Table 16-11b).
Aesthetics, as a result of operational lighting or blocking of views if views are designated and
present and sensitive receptors are present.
Air quality and greenhouse gases, as a result of increased energy demand.
Biological resources, as a result of potential water quality impacts related to treating new water
source(s).
Water quality, as a result of the need to treat new water source(s).
Hazards, as a result of handling materials (e.g., chlorine) potentially needed to treat new water
source(s).
Mineral resources, as a result of potentially inhibiting access to known mineral resources.
Noise, as a result of new equipment operating within proximity to potential sensitive receptors
(e.g., residences).
Should service providers need to construct new and expanded water treatment facilities or water
supply infrastructure as a result of implementation of method 1 under LSJR Alternative 2, the
activities involved therein are anticipated to either be discretionary actions and/or meet the
definition of a project for CEQA. (State CEQA Guidelines, §§ 15377–15378.) If the activities are not
discretionary actions and/or do not meet the definition of a project under CEQA (e.g., private well
construction or modification), then it is presumed there would be very limited environmental
impacts such that they would not rise to the level of causing potentially significant environmental
impacts necessitating environmental documentation (e.g., mitigated negative declaration,
environmental impact report). The decision-making body of the lead agency (e.g., public water
supplier or local agency) would approve discretionary action(s) associated with any new or
modified facilities or infrastructure. The approval of new or modified facilities would require the
preparation and approval of a CEQA document identifying project-specific details and specific
resource analyses of potentially significant impacts. The CEQA document would disclose any
project-specific, potentially significant environmental impacts resulting from new or modified
facilities. As part of this process, the decision-making body would be responsible (not the State
Water Board) for imposing mitigation measures or BMPs if project-specific environmental impacts
deemed potentially significant.
Although the exact scope and scale of environmental impacts cannot be determined because
identifying the exact nature of the new and expanded facilities is speculative, Table 16-38 in Chapter
16 lists possible mitigation measures that would likely reduce potentially significant impacts on
environmental resources as a result of construction and operation of new or modified facilities or
infrastructure. For example, potentially significant environmental impacts due to construction may
be mitigated through design, timing, and construction BMPs. Infrastructure could be designed to
have minimal impact on the surrounding environment (e.g., pipelines could be buried under existing
roads). Construction-timing mitigation measures may include scheduling such that work in surface

State Water Resources Control Board California Environmental Protection Agency
Service Providers
Evaluation of San Joaquin River Flow and Southern Delta Water Quality Objectives and Implementation
13-64 September 2016
ICF 00427.11
waters, if needed, takes place after aquatic species have migrated out of the area. BMPs for
construction activities could include the use of erosion prevention practices near surface waters,
for example.
An SED must identify feasible mitigation measures for each significant environmental impact
identified in the SED. (Cal. Code Regs., tit. 23, § 3777, subd. (b)(3).) CEQA does not grant agencies
new, discretionary powers independent of the powers granted to the agencies by other laws. (Pub.
Resources Code, § 21004; Cal. Code Regs., tit. 14, § 15040.) Accordingly, a mitigation measure may
be legally infeasible if the lead agency does not have the authority to require or implement it. (Pub.
Resources Code, § 21004; Cal. Code Regs., tit. 14, § 15040.) Since the State Water Board would not be
responsible for or have discretionary authority to approve the construction of any new or modified
facilities or infrastructure, it is not feasible for the State Water Board to impose the possible
mitigation measures listed in Table 16-38. Moreover, the State Water Boards lacks authority to
impose mitigation measures related to impacts on certain resources (e.g., air, noise or traffic).
Agencies responsible for approving the project-specific new or modified facilities can and should
impose the applicable mitigation measures in Table 16-38. The storage capacities for the reservoirs
are fixed. Accordingly, there is no possibility of increasing the total water supply to provide more
water for surface water diversions as mitigation under LSJR Alternative 2. More water released to
the rivers would leave less water for surface water diversions. Therefore, there is no feasible
mitigation the State Water Board can implement to reduce environmental impacts resulting from
the need for new or modified facilities or infrastructure. Impacts would be significant and
unavoidable.
Groundwater Supply
MID, TID and Merced ID may need to supplement their surface water supplies with groundwater to
meet their needs, under adaptive implementation method 1, as described above and in Chapter 9,
Groundwater Resources. Impacts on groundwater would increase relative to the 20 percent
unimpaired flow level in the Extended Merced Subbasin depending on the use by Merced ID. As
described in Chapter 9, LSJR Alternative 2 adaptive implementation method 1 would result in a
substantial depletion of groundwater supplies in the Extended Merced Subbasin if implemented on a
long-term basis. Were that to occur, service providers and private users relying heavily or primarily
on groundwater sources for municipal and domestic use could experience significant reductions in
water supply over the long term. The magnitude or severity of the effect would depend on additional
factors such as the size of the population being served and the number of active municipal wells in
their service area, and the range of differences between well depths and depths to groundwater
(Table 13-3b), and other factors (e.g., physical condition of wells). For example, Le Grand CSD serves
a population of 1,700 with three active wells (Table 13-3b), and the range of difference between
well depths and depths to groundwater for those three wells is 91–536 feet. In light of these three
factors, the demand for municipal and domestic water supply in the service area of Le Grand CSD
with implementation of LSJR Alternative 2 with adaptive implementation method 1 could likely be
met in the short term. But the district’s wells are aging, and two have experienced age-related
failures recently (Chauhan pers. comm.). If groundwater reductions were to continue for multiple
years, especially in combination with drought conditions, these wells may be at risk of running dry.
Similar to the above discussion related to surface water supply, over the long term, service
providers in the Extended Merced Subbasin may need to construct new and expanded water
treatment facilities or water supply infrastructure (e.g., additional wells) to meet demands.
Additionally, as a result of reduced water supply, implementation of LSJR Alternative 2 with

State Water Resources Control Board California Environmental Protection Agency
Service Providers
Evaluation of San Joaquin River Flow and Southern Delta Water Quality Objectives and Implementation
13-65 September 2016
ICF 00427.11
adaptive implementation method 1 may necessitate WWTPs and related infrastructure to be
modified to allow or augment water recycling or meet pretreatment or NPDES permit requirements.
Therefore, impacts would be significant. Drinking water sourced from domestic wells would be
affected similarly, and it is assumed that those affected would need to find an alternative drinking
water supply such as bottled water or drill additional groundwater wells, and impacts would be
significant.
Similar to the reductions in surface water supply, the reduction in groundwater supply to service
providers in the Extended Merced Subbasin identified in Table 13-3a would likely require these
entities to construct new and expanded water treatment facilities or water supply infrastructure
(e.g., additional wells) to replace groundwater supplies. Identifying the exact nature of the new and
expanded facilities needed to replace potentially reduced surface water diversions and groundwater
supplies is speculative (as discussed in Chapter 16, Evaluation of Other Indirect and Additional
Actions). However, it is reasonably foreseeable that the facilities could include the following.
New and expanded infrastructure, if needed, to convey water obtained through water transfers
or sales from other entities.
New and expanded groundwater well(s) and distribution infrastructure (e.g., underground
pipes) and infrastructure to treat groundwater, if needed.
New and expanded conjunctive groundwater use program(s), which could use available capacity
in unlined canals and agricultural fields that are not in production to recharge groundwater
basins during high flow events.
New and expanded facilities at existing WWTPs and distribution infrastructure (e.g.,
underground pipes) to increase the supply of recycled water as a possible source of water.
Similar to the above discussion related to surface water supply, identifying the exact nature of the
new and expanded facilities potentially needed to replace potentially reduced groundwater supplies
is speculative (as discussed in Chapter 16). Depending on the location and particular construction
and operational requirements, construction of the new or modified facilities, as described above,
could result in significant physical environmental impacts on resources (Chapter 16 Section 16.2.1;
Section 16.2.2 and Table 16-7; Section 16.2.3 and Table 16-9; and Section 16.2.4 and Table 16-10).
Although the exact scope and scale of environmental impacts cannot be determined because
identifying the exact nature of the new and expanded facilities is speculative, Table 16-38 in Chapter
16 lists possible mitigation measures that would likely reduce potentially significant impacts on
environmental resources as a result of construction and operation of new or modified facilities or
infrastructure. Because the State Water Board would not be responsible for or have discretionary
authority to approve the construction of any new or modified facilities or infrastructure, it is not
feasible for the State Water Board to implement the possible mitigation measures listed in Table 16-
38. Moreover, the State Water Board lacks authority to impose mitigation measures related to
impacts such as air and noise. Agencies responsible for approving the project-specific new or
modified facilities can and should impose the mitigation measures. The storage capacities for the
reservoirs are fixed. Accordingly, there is no possibility of increasing the total water supply to
provide more water for surface water diversions as mitigation under LSJR Alternative 2 with
adaptive implementation method 1. More water released to the Merced River would leave less water
for surface water diversions. Therefore, there is no feasible mitigation the State Water Board can
implement to reduce environmental impacts on service providers and domestic groundwater users
resulting from the need for new or modified facilities or infrastructure. Impacts would be significant
and unavoidable.

State Water Resources Control Board California Environmental Protection Agency
Service Providers
Evaluation of San Joaquin River Flow and Southern Delta Water Quality Objectives and Implementation
13-66 September 2016
ICF 00427.11
LSJR Alternative 3 (Significant and unavoidable/Significant and unavoidable with adaptive implementation)
Surface Water Supply
As a result of LSJR Alternative 3, WSE model results predict surface water diversions would be
generally reduced when compared to baseline conditions on the Stanislaus, Tuolumne, and
Merced Rivers (Table 5-19). The average percent reduction in water supply on the Stanislaus,
Tuolumne, and Merced Rivers was estimated to be 12 percent, 14 percent, and 16 percent,
respectively, for LSJR Alternative 3 (Table 13-14). The impacts of LSJR Alternative 3 would be
similar to those described above for LSJR Alternative 2 with adaptive implementation method 1;
however, more irrigation districts and other water suppliers would likely be impacted as surface
water supplies would be significantly reduced on the Stanislaus, Tuolumne, and Merced Rivers.
Those irrigation districts and other water suppliers on the Tuolumne and Merced Rivers would be
affected as described above for LSJR Alternative 2 with adaptive implementation method 1
(i.e., MID, TID, and Merced ID, City of Modesto and CCSF25). Additionally, it is expected that SSJID,
OID, the City of Tracy, and SEWD may also be affected under LSJR Alternative 3, given the
predicted reductions in surface water supplies and because they rely heavily or primarily on
surface water to meet demand.
The reductions in surface water supply to service providers would likely require these entities to
construct new and expanded water treatment facilities or water supply infrastructure to replace
reduced surface water supplies. Identifying the exact nature of the new and expanded facilities
needed to replace potentially reduced surface water diversions is speculative (as discussed in
Chapter 16, Evaluation of Other Indirect and Additional Actions). Because the surface water
diversions on the Stanislaus, Tuolumne, and Merced Rivers would be reduced, potentially requiring
the construction of new and expanded water treatment facilities or water supply infrastructure,
impacts would be significant.
Similar to the discussion of surface water supply impacts under LSJR Alternative 2 with adaptive
implementation method 1, identifying the exact nature of the new and expanded facilities
potentially needed by service providers and domestic groundwater users to replace potentially
reduced groundwater supplies is speculative (as discussed in Chapter 16). Depending on location
and particular construction and operational requirements, construction of the new or modified
facilities, as described above, could result in significant physical environmental impacts on
environmental resources (Chapter 16, Section 16.2.2 and Table 16-7; Section 16.2.3 and Table 16-9;
and Section 16.2.4 and Table 16-10). Although the exact scope and scale of environmental impacts
cannot be determined because identifying the exact nature of the new and expanded facilities is
speculative, Table 16-38 in Chapter 16 lists possible mitigation measures that would likely reduce
potentially significant impacts on environmental resources as a result of construction and operation
25 With respect to CCSF and similar to the discussion under LSJR Alternative 2, with adaptive implementation method 1, and as discussed in Appendix L, City and County of San Francisco Analyses, a potential reduction in water supply during a prolonged drought would depend on a number of factors, including the assignment of responsibility to CCSF or the irrigation districts to meet the flow requirements through a proceeding amending water rights or through FERC relicensing, the interpretation of the Fourth Agreement, whether CCSF pays the irrigation districts to release water to meet the flow requirement, and any future agreement between the irrigation districts and CCSF. If a prolonged drought occurred, and CCSF was required to share in the release of flows, thus potentially reducing water supply, it may need to construct new and expanded water treatment supply infrastructure to accommodate reductions in surface water supplies.

State Water Resources Control Board California Environmental Protection Agency
Service Providers
Evaluation of San Joaquin River Flow and Southern Delta Water Quality Objectives and Implementation
13-67 September 2016
ICF 00427.11
of new or modified facilities or infrastructure. Because the State Water Board would not be
responsible for or have discretionary authority to approve the construction of any new or modified
facilities or infrastructure, it is not feasible for the State Water Board to impose the possible
mitigation measures listed in Table 16-38. Moreover, the State Water Board lacks authority to
impose mitigation measures related to impacts such as air and noise. Agencies responsible for
approving the project-specific new or modified facilities can and should impose the applicable
mitigation measures in Table 16-38. The storage capacities for the reservoirs are fixed. Accordingly,
there is no possibility of increasing the total water supply to provide more water for surface water
diversions as mitigation under LSJR Alternative 3. More water released to the river would leave less
water for surface water diversions. Therefore, there is no feasible mitigation the State Water Board
can implement to reduce environmental impacts resulting from the need for new or modified
facilities or infrastructure. Impacts would be significant and unavoidable.
Groundwater Supply
The average annual groundwater balance is expected to be substantially reduced in the Modesto,
Turlock, and Extended Merced Subbasins under LSJR Alternative 3, which would eventually produce
a measureable decrease in groundwater elevations (Chapter 9, Groundwater Resources). This effect
would be more severe in dry years and in areas farther from the LSJR, the valley low point toward
which groundwater moves. These substantial reductions in groundwater supplies would, in turn,
impact service providers (Tables 13-3a and 13-3b) and private groundwater users in these
subbasins who are relying heavily or primarily on groundwater sources for municipal and domestic
uses. These entities would likely experience significant reductions in their groundwater supply,
particularly over the long term and in dry years. As discussed under LSJR Alternative 2 with
adaptive implementation method 1, the magnitude or severity of the effect would depend on
additional factors, such as the size of the population being served, the number of active municipal
wells in their service area, the range of differences between well depths and depths to groundwater
(Table 13-3b), and other factors (e.g., physical condition of wells). Service providers at particular
risk include those that have a higher potential for a well to run dry in the future. For example,
Hickman, Hilmar CWD, Hughson, and Keys CSD in the Turlock Subbasin; Le Grand CSD and the City
of Merced in the Extended Merced Subbasin; and the City of Modesto in the Modesto Subbasin
(Table 13-3b). This is because these service providers have relatively few active wells relative to the
size of the population served and/or the range of difference between well depths and depths to
groundwater is less than 100 feet (Table 13-3b). Private groundwater users are also at risk because
domestic wells are typically more shallow and older than public municipal wells. Impacts would be
significant and unavoidable.
Adaptive Implementation
As discussed under LSJR Alternative 2, adaptive implementation methods 2 and 4 are not
expected to result in impacts on surface water diversions or groundwater supplies. Adaptive
implementation method 3 would result in a shift in the volume of February–June water available
to other parts of the year and would be unlikely to affect surface water diversions or groundwater
supplies because the total amount of water available for diversion would be unaffected. Adaptive
implementation method 1 would allow an increase or decrease of up to 10 percent in the
February–June, 40 percent minimum unimpaired flow requirement (with a minimum of
30 percent and maximum of 50 percent) to optimize implementation measures to meet the
narrative objective, while considering other beneficial uses, provided that these other
considerations do not reduce intended benefits to fish and wildlife. Adaptive implementation must

State Water Resources Control Board California Environmental Protection Agency
Service Providers
Evaluation of San Joaquin River Flow and Southern Delta Water Quality Objectives and Implementation
13-68 September 2016
ICF 00427.11
be approved using the process described in Appendix K, Revised Water Quality Control Plan.
Accordingly, the frequency and duration of any use of this adaptive implementation method
cannot be determined at this time. If the specified percent of unimpaired flow were changed from
40 percent to 30 percent or 40 percent to 50 percent on a long-term basis, the conditions and
impacts could become more similar to LSJR Alternative 2 with adaptive implementation method 1
or LSJR Alternative 4 with adaptive implementation method 1, respectively. Reducing the
unimpaired flow percentage from 40 percent to 30 percent would reduce impacts on several
service providers, and effects may be limited to MID, TID, CCSF, and Merced ID, and those service
providers (Tables 13-3a and 13-3b) and private groundwater users that rely solely on the
Extended Merced Subbasin for water supply. However, increasing the unimpaired flow percentage
from 40 percent to 50 percent would increase the magnitude and severity of the impacts on those
service providers at 40 percent unimpaired flow because there would be less surface water
available at 50 percent unimpaired flow. In addition, the Eastern San Joaquin Basin could be
affected. As such, impacts would be significant. As discussed under LSJR Alternative 2 with
adaptive implementation method 1, there is no feasible State Water Board mitigation to reduce
these impacts, and impacts would be significant and unavoidable. Agencies responsible for
approving the project-specific new or modified facilities can and should impose the applicable
mitigation measures in Table 16-38.
LSJR Alternative 4 (Significant and unavoidable/Significant and unavoidable with adaptive implementation)
Surface Water Supply
As a result of LSJR Alternative 4, WSE model results predict surface water diversions would be
greatly reduced when compared to baseline conditions on all three eastside tributaries. The average
percent reduction in water supply on the Stanislaus, Tuolumne, and Merced Rivers was estimated to
be 32 percent, 35 percent, and 32 percent, respectively, for LSJR Alternative 4 (Table 13-14).
As discussed above under LSJR Alternative 3, the extent to which service providers’ surface water
supplies could be reduced is a function of the mechanism by which they receive the water
(e.g., water rights, contracts), existing policies and regulations, and the type of water use they
supply. The extent to which service providers are affected by a reduction in surface water diversions
is a function of their abilities to use existing alternative supplies (e.g., groundwater) or develop
alternative water supplies. Service providers that currently use surface water as a significant source
of water supply could experience reductions in surface water supplies (e.g., irrigation districts,
Tracy, SEWD, Modesto, CCSF26) similar to impacts described above for LSJR Alternative 3 with and
without adaptive implementation. LSJR Alternative 4 program of implementation describes actions
to assure that implementation does not impact supplies of water for minimum health and safety
26 With respect to CCSF, and similar to the discussion under LSJR Alternative 2 with adaptive implementation method 1, and as discussed in Appendix L, City and County of San Francisco Analyses, a potential reduction in water supply during a prolonged drought would depend on a number of factors, including the assignment of responsibility to CCSF or the irrigation districts to meet the flow requirements through a proceeding amending water rights or through FERC relicensing, the interpretation of the Fourth Agreement, whether CCSF pays the irrigation districts to release water to meet the flow requirement, and any future agreement between the irrigation districts and CCSF. If a prolonged drought occurred, and CCSF was required to share in the release of flows, thus potentially reducing water supply, it may need to construct new and expanded water treatment supply infrastructure to accommodate reductions in surface water supplies.

State Water Resources Control Board California Environmental Protection Agency
Service Providers
Evaluation of San Joaquin River Flow and Southern Delta Water Quality Objectives and Implementation
13-69 September 2016
ICF 00427.11
needs, and these actions may offset water supply reduction impacts on service providers for
municipal uses. However, impacts would be significant.
The reductions in surface water supply to service providers would likely require these providers to
construct new and expanded water treatment facilities or water supply infrastructure to replace
reduced surface water supplies. Additionally, as a result of reduced water supply, LSJR Alternative 4
may necessitate WWTPs and related infrastructure to be modified to allow or augment water
recycling or meet pretreatment or NPDES permit requirements. Identifying the exact nature of the
new and expanded facilities needed to replace potentially reduced surface water diversions is
speculative (as discussed in Chapter 16, Evaluation of Other Indirect and Additional Actions).
Because the surface water diversions on the Stanislaus, Tuolumne, and Merced Rivers would be
reduced, potentially requiring the construction of new and expanded water treatment facilities or
water supply infrastructure, impacts would be significant.
Similar to the discussion of surface water supply impacts under LSJR Alternative 2, with adaptive
implementation method 1, identifying the exact nature of the new and expanded facilities
potentially needed by public and private water suppliers to replace potentially reduced municipal
groundwater supplies is speculative (as discussed in Chapter 16). Depending on the location and the
particular construction and operational requirements, construction of the new or modified facilities,
as described above, could result in significant physical environmental impacts on environmental
resources (Chapter 16, Section 16.2.2 and Table 16-7; Section 16.2.3 and Table 16-9; and Section
16.2.4 and Table 16-10). Although the exact scope and scale of environmental impacts cannot be
determined because identifying the exact nature of the new and expanded facilities is speculative,
Table 16-38 in Chapter 16 lists possible mitigation measures that would likely reduce potentially
significant impacts on environmental resources as a result of construction and operation of new or
modified facilities or infrastructure. Because the State Water Board would not be responsible for or
have discretionary authority to approve the construction of any new or modified facilities or
infrastructure, it is not feasible for the State Water Board to impose the possible mitigation
measures listed in Table 16-38. Moreover, the State Water Boards lacks authority to impose
mitigation measures related to impacts such as air and noise. Agencies responsible for approving the
project-specific new or modified facilities can and should impose the applicable mitigation measures
in Table 16-38. The current storage capacities for the reservoirs are fixed. Accordingly, there is no
possibility of increasing the total water supply to provide more water for surface water diversions
as a means of mitigation under LSJR Alternative 4 with adaptive implementation. More water
released to the river would leave less water for surface water diversions. Therefore, there is no
feasible mitigation the State Water Board can implement to reduce environmental impacts resulting
from the need for new or modified facilities or infrastructure. Therefore, impacts under LSJR
Alternative 4, with adaptive implementation, would be significant and unavoidable.
Groundwater Supply
The average annual groundwater balance is expected to be substantially reduced under LSJR
Alternative 4, with or without adaptive implementation, in the Eastern San Joaquin, Modesto,
Turlock, and Extended Merced Subbasins (Chapter 9, Groundwater Resources). This would
eventually produce a measureable decrease in groundwater elevations. This affect would be more
severe in dry years and in areas farther from the SJR, the valley low point toward which
groundwater moves. These substantial reductions in groundwater supplies would in turn impact
service providers (Tables 13-3a and 13-3b) and private groundwater users in these subbasins that
are relying heavily or primarily on groundwater sources for municipal and domestic needs. These
State Water Resources Control Board California Environmental Protection Agency
Service Providers
Evaluation of San Joaquin River Flow and Southern Delta Water Quality Objectives and Implementation
13-70 September 2016
ICF 00427.11
entities would likely experience significant reductions in groundwater supply, particularly over the
long term and in dry years. As discussed under LSJR Alternative 2, with adaptive implementation
method 1, the magnitude or severity of the effect would depend on additional factors such as the
size of the population being served, the number of active municipal wells in their service area, the
range of differences between well depths and depths to groundwater (Table 13-3b), and other
factors (e.g., physical condition of wells). Service providers and private groundwater users at
particular risk include those that have a higher potential for a well to run dry in the future, including
those identified under LSJR Alternative 3, with adaptive implementation. In addition, service
providers in the Eastern San Joaquin Subbasin that may be more likely to be affected include Escalon
and Lathrop (Table 13-3b). This is because these service providers have relatively few active wells
relative to the size of the population served and/or the range of difference between well depths and
depths to groundwater is less than 100 feet (Table 13-3b). Impacts would be significant and
unavoidable.
SDWQ Alternative 2 (Significant and unavoidable)
The historical range of salinity in the southern Delta would be maintained under SDWQ Alternative
2 (Section 13.2.3, Southern Delta, and Impact SP-2a). Therefore, it is not anticipated that service
providers supplying drinking water from the southern Delta would need to construct or modify
water treatment facilities or water supply infrastructure because of increased salinity.
Under SDWQ Alternative 2, the Vernalis and southern Delta salinity objectives would be changed to
a year-round value of 1.0 dS/m. However, EC at Vernalis would be maintained at or below 0.7 dS/m
April–August and 1.0 dS/m September–March through requirements in USBR’s water rights permits
as provided for in the program of implementation. This would provide some assimilative capacity
downstream of Vernalis and protect beneficial agricultural uses. Of the six WWTPs discussed herein,
two have made efforts or are working toward reducing salinity concentrations in their source water
supplies, four are implementing pretreatment programs to reduce water softener use among water
users, and three are either proposing to construct or are already operating a RO treatment system.
Table 13-11 summarizes the salinity reduction efforts of the various WWTPs. These activities would
be expected to reduce the salinity in the treated effluent discharged into the southern Delta by the
service providers. Fixing existing RO systems or upgrading existing facilities would be expected to
reduce salts more, when compared to other efforts such as educational programs or salt
pretreatment programs. However, the total effect of these various projects to the southern Delta
water quality depends on many variables, such as the type of activity, salt content of the source
water, and operating efficiency of the activity.
The average annual EC values for WWTPs in the past few years were generally very close to or just
over 1.0 dS/m. Table 13-19 identifies the average EC for each WWTP and their potential ability to
comply with a potential 1.0 dS/m effluent limitation based on the violations documented to date and
annual average EC data.
Manteca would be expected to comply with a 1.0 dS/m effluent limitation because their average
annual EC values are currently near or below 1.0 dS/m, and they have not had any violations in the
past. Because it is anticipated that this WWTP would not exceed wastewater treatment
requirements, it is not likely to need additional facilities. Impacts would be less than significant.

State Water Resources Control Board California Environmental Protection Agency
Service Providers
Evaluation of San Joaquin River Flow and Southern Delta Water Quality Objectives and Implementation
13-71 September 2016
ICF 00427.11
Table 13-19. Southern Delta Wastewater Treatment Plant 2011-2014 Annual Average EC Effluent Data and Potential to Comply with an Effluent Limitation set to the SDWQ Alternative 2 EC Objective (dS/m [μmhos/cm])
WWTP Facility
2011 Annual Average EC
Effluent
2012 Annual Average EC
Effluent
2013Annual Average EC
Effluent
2014 Annual Average EC
Effluent
2015 Annual Average EC
Effluent
Potential to Comply with an Effluent
Limitation Set to the SDWQ Alternative 2 (1 dS/m) Objective?
(Y/N)
Tracy 1.2 [1,171] 1.2 [1,229] 1.2 [1,250] 1.3 [1,342] 1.2 [1,246] N
Deuel 2.4 [2,415]a 1.4 [1,410] 1.3 [1,280] 1.3 [1,275] 2.2 [2,254] N
Manteca 0.8 [781] 0.8 [778] 0.7 [750] 0.7 [745] 0.8 [800] Y
Stockton 1.0 [1,032] 1.0 [958] 1.0 [973] 1.0 [982] 1.1 [1,127] N
Mountain House CSD 0.7 [693] 0.9 [908] 1.0 [990] 1.0 [991] 1.0 [1,029] N
Sources: See Table 13-8 for sources and additional information.
EC = electrical conductivity (salinity)
WWTP = Wastewater treatment plant
dS/m = deciSiemens per meter. Conversion is 1 dS/m = 1000 μmhos/cm. Numbers presented in dS/m were rounded.
μmhos/cm =micromhos per centimeter
CIWQS = California Integrated Water Quality System
CSD = Community Services District a No data on CIWQS, so the comparison to potential effluent limitations is based on recent ACLC R5-2011-0575, which reported an average monthly EC value of 2,260
μmhos/cm on January 31, 2011 and 2,570 μmhos/cm on February 28, 2011.

State Water Resources Control Board California Environmental Protection Agency
Service Providers
Evaluation of San Joaquin River Flow and Southern Delta Water Quality Objectives and Implementation
13-72 September 2016
ICF 00427.11
Deuel currently has an NPDES permit with an EC standard based on the 2006 Bay-Delta plan EC
objective. It has previously violated the permit standards. The past and current violations are
potentially attributed to a malfunction of the RO and brine concentrator systems used by the facility
to reduce the salinity of the groundwater supply. SDWQ Alternative 2 would not change the permit
standards for Deuel and thus would not increase the number of existing violations, increase the
salinity of the discharge at Deuel, or change the existing RO and brine concentrator facilities.
Therefore, Deuel could potentially continue to have exceedances of the permit requirements and
continue to violate their permit under SDWQ Alternative 2. Therefore, a change in baseline
conditions is not expected with respect to Deuel. Impacts would be less than significant.
Mountain House CSD, Stockton, and Tracy currently have annual EC averages equal to or greater
than 1.0 dS/m; therefore, they could have some exceedances of the wastewater treatment
requirements if an effluent limitation is set at 1.0 dS/m. However, these exceedances would only
potentially result in an exceedance of the salinity objective (i.e., 1.0 dS/m) for the southern Delta
for half of the year (between the months of September and March), when salinity at Vernalis may
be as high as 1.0 dS/m, which would provide no assimilative capacity. Mountain House CSD,
Stockton, and Tracy may exceed an effluent limitation set at the water quality objective proposed
under SDWQ Alternative 2 and this could require modifications to their wastewater treatment
plants. For Tracy, these modifications could exceed those expected under their Desalinization and
Green Energy Project. The Mountain House CSD and the Cities of Stockton and Tracy may apply
for a variance under the Central Valley Water Board’s Variance Policy discussed above once it is
approved by USEPA. Under the policy, Mountain House CSD and Stockton and Tracy could be
granted a variance from meeting the water quality-based effluent limitations for salinity
constituents for a period of up to ten years. If the variance is not authorized, or if it is and after the
expiration of the variance, Mountain House CSD and Stockton and Tracy still cannot meet the
effluent limitations for salinity based on SDWQ 2, it is reasonably foreseeable that modifications to
their facilities could occur. It is anticipated modifications could include the following (Chapter 16,
Evaluation of Other Indirect and Additional Actions, Section 16.4.1, 16.4.2 and 16.4.3).
New and expanded infrastructure to support new source water supplies, which could include
canals, underground pipelines, and obtaining water transfers from one location to another to
supply the new source water.
New and expanded salinity pretreatment programs relying on industrial facility pretreatment or
residential program(s), which could include modifications to existing industrial facilities such
that waste is treated prior to discharge in the sewer system or a residential program educating
people to remove water softeners.
New and expanded salinity removal facilities at existing WWTPs (e.g., RO), which could include
modifications to existing wastewater treatment plants such that salinity is removed from the
treated effluent prior to discharge.
Depending on the type of facility, location, and particular operational requirements, construction of
the facilities described above could result in physical environmental impacts on resources such as
those listed below (Chapter 16, Section 16.4.1 and Table 16-25; Section 16.4.2 and Table 16-28; and
Section 16.4.3 and Table 16-30).
Air quality and greenhouse gases, as a result of construction equipment emissions and
construction trips.

State Water Resources Control Board California Environmental Protection Agency
Service Providers
Evaluation of San Joaquin River Flow and Southern Delta Water Quality Objectives and Implementation
13-73 September 2016
ICF 00427.11
Biological resources, as a result of dust, noise, or possible removal of sensitive biological species
if present.
Cultural resources, as a result of excavation, grading, and other soil disturbing activities,
if construction takes place in a moderately or highly sensitive area for cultural resources.
Geologic resources, as a result of erosion or constructing in unstable soils.
Hazards, as a result of handling hazardous material during construction such as lubricants
or diesel.
Water quality, as a result of potentially generating runoff associated with dust control or other
construction activities.
Noise, as a result of the use of construction equipment if sensitive receptors (e.g., residences)
are located within close proximity of the WWTP.
Traffic, as a result of the use of construction equipment and commuting construction workers.
Depending on the type of facility, location, and particular operational requirements, operation of
new or modified facilities could result in physical environmental impacts on resources such as those
listed below (Chapter 16, Section 16.4.1 and Table 16-25; Section 16.4.2 and Table 16-28; and
Section 16.4.3 and Table 16-30).
Aesthetics, as a result of operational lighting.
Air quality and greenhouse gases, as a result of operational emissions associated with salt
removal techniques.
Hazardous materials, as a result of an increase in hazardous materials on site associated with
salt removal techniques.
Noise, as a result of new equipment operating within proximity to sensitive receptors
(e.g., residences).
Traffic, as a result of an increase in employees to operate the new equipment or equipment
modifications.
Therefore, since WWTPs may not be able to meet a new NPDES effluent limitation based on SDWQ
Alternative 2, the construction and operation of new or modified wastewater treatment facilities or
infrastructure is expected and impacts would be significant.
New or modified wastewater treatment facilities or infrastructure would be under the jurisdiction of
the service providers performing the action or the jurisdiction of the local agency in which the new
or modified facility or infrastructure is proposed. The activities described above (e.g., new and
expanded facilities at WWTPs) are anticipated to either be discretionary actions and/or meet the
definition of a project for CEQA. (State CEQA Guidelines, §§ 15377–15378.) If they are not
discretionary actions and/or do not meet the definition of a project under CEQA, then it is presumed
there would be very limited environmental impacts such that they would not rise to the level of
causing potentially significant environmental impacts necessitating environmental documentation
(e.g., mitigated negative declaration, environmental impact report). As part of this process, the
decision-making body (e.g., board of the service provider or municipality) would impose mitigation
measures or BMPs if project-specific environmental impacts were deemed potentially significant.
Although the exact scope and scale, and extent of potentially significant environmental impacts
cannot be determined, Table 16-38 in Chapter 16 identifies mitigation measures that would likely

State Water Resources Control Board California Environmental Protection Agency
Service Providers
Evaluation of San Joaquin River Flow and Southern Delta Water Quality Objectives and Implementation
13-74 September 2016
ICF 00427.11
reduce potentially significant impacts on environmental resources as a result of construction and
operation of new or modified facilities or infrastructure. For example, potentially significant
environmental impacts due to construction may be mitigated through design, timing, and
construction BMPs. Facilities could be designed to have minimal impact on the surrounding
environment (e.g., pipelines could be buried under existing roads). Construction-timing mitigation
measures may include scheduling such that work in surface waters, if needed, would take place after
aquatic species have migrated out of the area. BMPs for construction activities could include the use
of straw bales to prevent erosion near surface waters.
The State Water Board does not have the authority to approve the construction of any of the new or
modified facilities or infrastructure. Accordingly, it is not feasible for the State Water Board to
impose mitigation measures related to the construction of new and modified facilities to reduce
potentially significant environmental impacts. Moreover, the State Water Board lacks authority to
impose mitigation measures related to impacts on certain resources (e.g., air, noise, or traffic). Lead
agencies can and should impose the mitigation measures in Table 16-38 when approving
construction of these facilities. Until and unless that occurs, impacts would remain significant and
unavoidable.
With respect to the operation of any new or modified facility or infrastructure, the Central Valley
Water Board issues NPDES permits for the WWTPs that impose discharge requirements to
implement requirements of the Clean Water Act and applicable water quality control plans. None of
the mitigation measures in Table 16-38 for the operation of any new or modified facility or
infrastructure is a measure the Central Valley Water Board has authority to impose in NPDES
permits. Lead agencies can and should impose the mitigation measures in Table 16-38 when
approving the operation of these facilities. Until and unless that occurs, impacts would remain
significant and unavoidable.
SDWQ Alternative 3 (Less than significant)
The historical range of salinity in the southern Delta would be maintained under SDWQ Alternative
3 (Section 13.2.3, Southern Delta, and Impact SP-2a). Therefore, it is not anticipated that service
providers supplying drinking water from the southern Delta would need to construct or modify
water treatment facilities or water supply infrastructure because of increases in salinity.
Table 13-20 identifies the average EC for each WWTP and each one’s potential ability to comply with
SDWQ Alternative 3 without new or modified facilities, based on past violation information and
2011–2014 EC data.
All of the service providers would be expected to be able to comply with SDWQ Alternative 3
without new or modified facilities based on annual average EC data and previous EC violations.
Deuel currently has EC averages that are below the SDWQ Alternative 3 objectives, but has had past
EC violations. As discussed above under SDWQ Alternative 2, the past violations are potentially
attributed to a malfunction of the RO and brine concentrator systems used by the facility to reduce
the salinity of the groundwater supply. Because no additional service providers are expected to
require modifications or new facilities, impacts would be less than significant.

State Water Resources Control Board California Environmental Protection Agency
Service Providers
Evaluation of San Joaquin River Flow and Southern Delta Water Quality Objectives and Implementation
13-75 September 2016
ICF 00427.11
Table 13-20. Current Southern Delta Wastewater Treatment Plant 2011–2014 Annual Average EC Effluent Data and Potential to Comply with an Effluent Limitation set to the SDWQ Alternative 3 EC Objective (dS/m [μmhos/cm])
WWTP Facility
2011 Annual Average EC
Effluent
2012 Annual Average EC
Effluent
2013 Annual Average EC
Effluent
2014 Annual Average EC
Effluent
2015 Annual Average EC
Effluent
Potential to Comply with an Effluent
Limitation Set to the SDWQ Alternative 3
(1.4 dS/m) Objective? (Y/N)
Tracy 1.2 [1,1171] 1.2 [1,229] 1.2 [1,250] 1.3 [1,342] 1.2 [1,246] Y
Deuel 2.4 [2,415]a 1.4 [1,410] 1.3 [1,280] 1.3 [1,275] 2.2 [2,254] N
Manteca 0.8 [781] 0.8 [778] 0.7 [750] 0.7 [745] 0.8 [800] Y
Stockton 1.0 [1,032] 1.0 [958] 1.0 [973] 1.0 [982] 1.1 [1,127] Y
Mountain House CSD 0.7 [693] 0.9 [908 1.0 [990] 1.0 [991] 1.0 [1,029] Y
See Table 13-8 for sources and additional information.
EC = electrical conductivity (salinity)
WWTP = Wastewater treatment plant
dS/m = deciSiemens per meter. Conversion is 1 dS/m = 1000 μmhos/cm. Numbers presented in dS/m were rounded.
μmhos/cm = micromhos per centimeter
CIWQS = California Integrated Water Quality System
CSD = Community Services District a No data on CIWQS, so the comparison to potential effluent limitations is based on recent ACLC R5-2011-0575, which reported an average monthly EC value of 2,260
μmhos/cm on January 31, 2011 and 2,570 μmhos/cm on February 28, 2011.

State Water Resources Control Board California Environmental Protection Agency
Service Providers
Evaluation of San Joaquin River Flow and Southern Delta Water Quality Objectives and Implementation
13-76 September 2016
ICF 00427.11
Impact SP-2a: Violate any water quality standards such that drinking water quality from public
water systems would be affected
No Project Alternative (LSJR/SDWQ Alternative 1)
The No Project Alternative would result in implementation of flow objectives identified in the 2006
Bay-Delta Plan. See Chapter 15, No Project Alternative (LSJR Alternative 1 and SDWQ Alternative 1), for
the No Project Alternative impact discussion and Appendix D, Evaluation of the No Project Alternative
(LSJR Alternative 1 and SDWQ Alternative 1), for the No Project Alternative technical analysis.
LSJR Alternatives
LSJR Alternative 2 (Less than significant/Less than significant with adaptive implementation)
Groundwater Subbasins
There would likely be no degradation of groundwater quality under LSJR Alternative 2 because
substantial additional pumping is not expected and, thus, the direction of groundwater flow would
not change such that any localized groundwater contamination that exists in the subbasins would be
affected (as described in Chapter 9, Groundwater Resources). Accordingly, LSJR Alternative 2 would
have a less-than-significant impact on the quality of water for public water systems.
Southern Delta
Salinity is a concern for service providers (e.g., CCWD) diverting drinking water from the southern
Delta. Because drinking water effects associated with salinity are considered to be related to taste
and not harmful to human health, secondary drinking water MCLs are established for EC as
summarized in Section 13.2.3, Southern Delta. As discussed in Chapter 5, Surface Hydrology and
Water Quality, the WSE model predicts that average inflows from the LSJR would generally increase
(Tables 5-16 and 5-17d), which is expected to lead to a slight decrease in average salinity in the
southern Delta (Table 13-16). At Vernalis, any increases in EC would generally be very small and
occur during July and December–March. Relatively large decreases in EC are predicted to occur
during May and June. Overall, under LSJR Alternative 2, salinity in the southern Delta is not expected
to differ much from baseline salinity and would decrease on average. In addition, generally a large
portion of drinking water originates from the Sacramento River due to the locations of some
drinking water intakes in the Delta (e.g., western Delta); as such, changes in SJR flow are unlikely to
modify flows on the Sacramento River such that exceedances in drinking water standards would
result. Therefore, LSJR Alternative 2 is not expected to substantially degrade water quality,
specifically with respect to salinity, and service providers diverting water for domestic purposes
would not be affected by the quality of water in the southern Delta under this alternative. Impacts
would be less than significant.
Higher Delta inflow from the LSJR helps improve other water quality constituents besides salinity.
For example, higher inflow (and outflow) helps to limit seawater intrusion, which brings salinity and
bromide into the Delta, and it helps dilute water quality components that are generated within the
Delta, such as organic carbon. Organic carbon also enters the Delta in the tributary water. Rainfall
runoff events would continue to bring organic carbon from the tributaries into the Delta under the
LSJR Alternative 2 in a manner similar to baseline conditions. However, releases from large

State Water Resources Control Board California Environmental Protection Agency
Service Providers
Evaluation of San Joaquin River Flow and Southern Delta Water Quality Objectives and Implementation
13-77 September 2016
ICF 00427.11
reservoirs tend to have relatively low organic carbon, so higher releases from New Melones
Reservoir, New Don Pedro Reservoir, and Lake McClure would not cause an increase in organic
carbon. Releases from the eastside reservoirs and inflow to the southern Delta would generally be
similar to baseline conditions (although slightly higher on average) under LSJR Alternative 2;
therefore, the effect of the alternative on water quality constituents besides salinity would also be
less than significant.
Adaptive Implementation
Groundwater
As discussed under Impact SP-1, LSJR Alternative 2 with adaptive implementation could result in
substantial groundwater depletions from increased pumping within the Extended Merced Subbasin.
This could affect the direction of groundwater flow, and localized groundwater contamination could
move in undesirable directions as explained in Section 13.2.1, Lower San Joaquin River and
Tributaries, potentially affecting groundwater as a source of drinking water. The change in
groundwater flow is dependent on the location of pumping, the amount of groundwater pumped
and the frequency at which pumping occurs, and hydrogeological characteristics of the aquifer (e.g.,
consolidated clays with low permeability or unconsolidated sands with high permeability). As
discussed previously, the impact of groundwater pumping on groundwater quality also depends on
a number of different variables, including location and depth of the well, the amount and frequency
of groundwater pumping, number and proximity of nearby wells, hydrogeological characteristics of
the aquifer, distance between the well(s) and the contaminant(s), contaminant characteristics (e.g.,
highly mobile in water or adhering primarily to soil), and land use near the well. In addition, it is not
possible to predict how the affected parties would respond to the reduction of surface water due to
the LSJR alternatives. They may deepen existing wells or build new wells. If they build new wells, it
is impossible to determine the number of new wells and their location. Thus, while groundwater
pumping can affect groundwater flow and quality, for all of the foregoing reasons, it is speculative to
specifically determine what that change in groundwater flow, and its impact on groundwater
quality, would be from increased groundwater pumping.
If LSJR Alternative 2, with adaptive implementation, is implemented frequently and long term, it is
expected that service providers relying on surface water supplies may need to find alternative
supplies (e.g., groundwater), especially those service providers relying on the Merced and Tuolumne
Rivers for surface water supplies (i.e., MID, TID and Merced ID, City of Modesto [Table 13-2]).
Furthermore, those service providers (Tables 13-3a and 13-3b) relying on the Extended Merced
Subbasin for groundwater supply to meet their water needs potentially could be affected by changes
in groundwater quality from the migration of contaminants. However, a substantial increase in
groundwater pumping would not necessarily result in the use of drinking water that violates water
quality standards for several reasons, as described below.
1. During the recent drought, the amount of groundwater pumped for drinking purposes and the
service providers’ reliance on groundwater greatly increased, and yet there was not a greater
number of MCL violations as compared to a wet year based on the CCRs prepared by the service
providers (Table 13-5).
2. While drinking water quality standard exceedances have been detected at the wellhead in
different locations in the area of potential effects, these exceedances reflect raw, untreated
groundwater quality. Service providers are required take actions to ensure that the water is in
compliance with relevant drinking water standards before it is served to the public. Such actions

State Water Resources Control Board California Environmental Protection Agency
Service Providers
Evaluation of San Joaquin River Flow and Southern Delta Water Quality Objectives and Implementation
13-78 September 2016
ICF 00427.11
include monitoring groundwater quality regularly, and if any exceedances are detected, bringing
the well offline until the problem is rectified (see Section 13.3.2, State [Regulatory Background]).
Treatment options include blending, large-scale treatment systems, wellhead treatment
systems, or Point-of-Use (POU)/Point-of-Entry (POE) systems used in homes or residences.
These types of treatment options are currently used by service providers if and when a water
quality concern is identified. Potential environmental impacts resulting from these types of new
and expanded facilities are addressed under Impact SP-1.
3. While increased groundwater pumping may expedite the migration of contaminants introduced
at the land surface, such as nitrate from fertilizer application on crop lands, into the water table
and flow towards the well, the effect would be localized (i.e., at the well; see Section 13.2.1,
Lower San Joaquin River and Tributaries). Hence, it would be unlikely that such contamination
would spread to other parts of the aquifer.
Therefore, under LSJR Alternative 2, with adaptive implementation, it is not expected that the
quality of groundwater used in public water systems would be affected such that violations of water
quality standards would occur. Accordingly, impacts would be less than significant.
While mitigation is not required for less-than-significant impacts, local agencies can and should
nevertheless exercise their authorities under SGMA to prevent and/or mitigate any degradation of
groundwater quality from the migration of contaminants. As explained in Section 9.3.2 of Chapter 9,
Groundwater Resources, under SGMA,27 local agencies in high- and medium-priority basins are
required to form groundwater sustainability agencies by June 30, 2017, that will develop and
implement GSPs that achieve sustainable groundwater management within 20 years. Sustainable
groundwater management includes not causing chronic lowering of groundwater levels and
significant and unreasonable degradation of water quality, including the migration of contaminant
plumes that impair water supplies. GSPs must be adopted by January 31, 2020, for the Extended
Merced Subbasin (as well as the Eastern San Joaquin and Chowchilla Subbasins). GSPs for the
Modesto and Turlock Subbasins must be adopted by January 31, 2022). Upon GSP adoption, SGMA
grants the local GSA specific authorities to manage and protect its groundwater basin including, but
not limited to, the ability to require reporting of groundwater withdrawals and to control
groundwater extractions by regulating, limiting, or suspending extractions from wells. If a local
agency is unwilling or unable to manage its groundwater resources to prevent undesirable results as
defined under the SGMA, which include chronic lowering of groundwater levels or migration of
contamination, then SGMA empowers the state to provide interim management until local agencies
are able to assume management. Thus, under SGMA, local agencies can and should manage
groundwater subbasins both in terms of over-pumping and groundwater quality degradation from
migrating contaminants.
Southern Delta
LSJR Alternative 2, with adaptive implementation method 1, would result in overall higher flows
into the southern Delta. Higher Delta inflow from the LSJR helps improve water quality constituents,
including salinity. For example, higher inflow (and outflow) helps to limit seawater intrusion, which
brings salinity and bromide into the Delta, and it helps dilute water quality components that are
generated within the Delta, such as organic carbon. Adaptive implementation method 2 would not
27 The State Water Board is required to consider the policies of SGMA when revising or adopting policies, regulations, or criteria. (Wat. Code, § 10720.9.)

State Water Resources Control Board California Environmental Protection Agency
Service Providers
Evaluation of San Joaquin River Flow and Southern Delta Water Quality Objectives and Implementation
13-79 September 2016
ICF 00427.11
authorize a reduction in flows required by other agencies or through other processes, which are
incorporated in the modeling of baseline conditions. Adaptive implementation method 3 would not
be authorized under LSJR Alternative 2 since the unimpaired flow percentage would not exceed
30 percent. Adaptive implementation method 4 would allow an adjustment of the Vernalis
February–June minimum flow requirement. WSE model results indicate that changes due to method
4 under this alternative would rarely alter the flows in the three eastside tributaries or the LSJR. As
such, releases from the eastside reservoirs and inflow to the southern Delta would generally be
higher on average under LSJR Alternative 2, with adaptive implementation methods 1, 2, and 4;
therefore, the effect of the alternative on surface water quality constituents including salinity is
expected to be less than significant.
LSJR Alternatives 3 and 4 (Less than significant/Less than significant with adaptive implementation)
Groundwater Subbasins
Reductions in groundwater levels in the Modesto, Turlock, and Extended Merced Subbasins and also
the Eastern San Joaquin Subbasin under LSJR Alternatives 3 and 4with or without adaptive
implementation, could occur as a result of increased pumping. This could affect the direction of
groundwater flow, and localized groundwater contamination could move in undesirable directions
as explained in Section 13.2.1, Lower San Joaquin River and Tributaries, potentially affecting
groundwater as a source of drinking water. As discussed previously, the impact of groundwater
pumping on groundwater quality depends on a number of different variables, including location and
depth of the well, the amount and frequency of groundwater pumping, number and proximity of
nearby wells, hydrogeological characteristics of the aquifer (e.g., consolidated clays with low
permeability or unconsolidated sands with high permeability), distance between the well(s) and the
contaminant(s), contaminant characteristics (e.g., highly mobile in water or adhering primarily to
soil), and land use near the well. In addition, it is not possible to predict how the affected parties
would respond to the reduction of surface water due to the LSJR alternatives. The affected parties
may deepen existing wells or build new wells. If they build new wells, it is impossible to determine
the number of wells and their location. Thus while groundwater pumping can affect groundwater
flow and quality, for all of the foregoing reasons, it is speculative to specifically determine what that
change in groundwater flow and its impact on groundwater quality would be from to increased
groundwater pumping.
If LSJR Alternatives 3 or 4, with or without adaptive implementation, is implemented, it is expected
that service providers relying on surface water supplies may need to find alternative supplies
(e.g., groundwater). Furthermore, those service providers relying on the Modesto, Turlock, and
Extended Merced Subbasins for groundwater supply under LSJR Alternatives 3 and 4 (in addition
the Eastern San Joaquin Subbasin under LSJR Alternative 4) to meet their water needs (Table
13-3a), potentially could be affected by changes in groundwater quality from the migration of
contaminants. The potential reduction in groundwater quality under Alternatives 3 and 4, with or
without adaptive implementation, could degrade drinking water quality for those service providers
relying entirely, or in large part, on groundwater for municipal supply (see Tables 13-3a and 3-3b).
However, as described for LSJR Alternative 2, a substantial increase in groundwater pumping would
not necessarily result in the use of drinking water that violates water quality standards for several
reasons as described below.

State Water Resources Control Board California Environmental Protection Agency
Service Providers
Evaluation of San Joaquin River Flow and Southern Delta Water Quality Objectives and Implementation
13-80 September 2016
ICF 00427.11
1. During the recent drought, the amount of groundwater pumped for drinking purpose and the
service providers’ reliance on groundwater greatly increased and yet there was not a greater
number of MCL violations as compared to a wet year based on the CCRs prepared by the service
providers (Table 13-5).
2. While drinking water quality standard exceedances have been detected at the wellhead in
different locations in the area of potential effects, these exceedances reflect raw, untreated
groundwater quality. Service providers are required take actions to ensure that the water is in
compliance with relevant drinking water standards before it is served to the public. Such actions
include monitoring groundwater quality regularly, and if any exceedances are detected, bringing
the well offline until the problem is rectified (see Section 13.3.2, State [Regulatory Background].
Treatment options include blending, large-scale treatment systems, wellhead treatment
systems, or POU/POE systems used in homes or residences. These types of treatment options
are currently used by service providers if and when a water quality concern is identified.
Potential environmental impacts resulting from these types of new and expanded facilities are
addressed under Impact SP-1.
3. While increased groundwater pumping may expedite the migration of contaminants introduced
at the land surface, such as nitrate from fertilizer application on crop lands, into the water table
and flow towards the well, the effect would be localized, i.e., at the well (see Section 13.2.1,
Lower San Joaquin River and Tributaries). Hence, it would be unlikely that such contamination
would spread to other parts of the aquifer.
Therefore, under LSJR Alternatives 3 and 4, with or without adaptive implementation, it is not
expected that the quality of groundwater used for public water systems would be affected such that
violations of water quality standards would occur. Accordingly, impacts would be less than
significant.
While mitigation measures are not required for less-than-significant impacts, local agencies can and
should nevertheless exercise their authorities under SGMA to prevent and/or mitigate any
degradation of groundwater quality from the migration of contaminants. As explained in Section
9.3.2 of Chapter 9, Groundwater Resources, under SGMA, local agencies in high- and medium-priority
basins are required to form groundwater sustainability agencies by June 30, 2017, that will develop
and implement GSPs that achieve sustainable groundwater management within 20 years.
Sustainable groundwater management includes not causing chronic lowering of groundwater levels
and significant and unreasonable degradation of water quality, including the migration of
contaminant plumes that impair water supplies. GSPs must be adopted by January 31, 2020, for
Eastern San Joaquin, Merced and Chowchilla Subbasins. GSPs for Modesto and Turlock Subbasins
must be adopted by January 31, 2022. Upon GSP adoption, SGMA grants the local GSA specific
authorities to manage and protect its groundwater basin including, but not limited to, the ability to
require reporting of groundwater withdrawals and to control groundwater extractions by
regulating, limiting, or suspending extractions from wells. If a local agency is unwilling or unable to
manage its groundwater resources to prevent undesirable results as defined under the SGMA, which
include but are not limited to chronic lowering of groundwater levels or migration of contamination,
then SGMA empowers the state to provide interim management until local agencies are able to
assume management. Thus, under SGMA, local agencies can and should manage their groundwater
subbasins both in terms of over-pumping and groundwater quality degradation from migrating
contaminants.

State Water Resources Control Board California Environmental Protection Agency
Service Providers
Evaluation of San Joaquin River Flow and Southern Delta Water Quality Objectives and Implementation
13-81 September 2016
ICF 00427.11
Southern Delta
Inflows from the LSJR to the southern Delta are expected to generally increase February–June and
have relatively small changes the rest of the year. Additional water into the southern Delta under
LSJR Alternative 3 or LSJR Alternative 4, is not expected to substantially degrade the existing water
quality of the southern Delta. Some months may experience small increases in salinity, but these
increases would be the most noticeable during periods of high flow when Vernalis EC is relative low
and would not cause drinking water problems (primarily within the minimum to 40th percentile of
the cumulative distribution for December, January, July, and August [Tables 13-16 and 13-17]).
In general, southern Delta salinity would be expected to decrease with LSJR Alternatives 3 and 4,
particularly during March through June for both alternatives, as well as during February for LSJR
Alternative 4 (Tables 13-16 and 13-17).
Similar to LSJR Alternative 2, LSJR Alternatives 3 and 4 with adaptive implementation methods 1
and 2 would result in overall higher flows into the southern Delta. Higher Delta inflow from the LSJR
helps improve other water quality constituents, including salinity. For example, higher inflow (and
outflow) helps to limit seawater intrusion, which brings salinity and bromide into the Delta, and it
helps dilute water quality components that are generated within the Delta, such as organic carbon.
In addition, adaptive implementation method 3 would not authorize a reduction in flows required
by other agencies or through other processes, which are incorporated in the modeling of baseline
conditions. Adaptive implementation method 4 would allow an adjustment of the Vernalis
February–June minimum flow requirement. WSE model results indicate that changes due to
adaptive implementation method 4 under LSJR Alternatives 3 and 4 would rarely alter the flows in
the three eastside tributaries or the LSJR. As such, releases from the eastside reservoirs and inflow
to the southern Delta would generally be higher on average under LSJR Alternatives 3 and 4, with
adaptive implementation methods 1, 2, 3, and 4, when compared to baseline.
Additional inflow would provide additional assimilative capacity to receiving waters for
constituents (e.g., salinity) and in general reduce the salinity and other water quality constituents
in the southern Delta (Chapter 5, Surface Hydrology and Water Quality, Tables 5-29a–c). Therefore,
LSJR Alternatives 3 and 4 with or without adaptive implementation are not expected to substantially
degrade water quality, and service providers diverting water for municipal purposes from the
southern Delta would not be impacted by the quality of water in the southern Delta. Impacts would
be less than significant.
SDWQ Alternative 2 (Less than significant)
Salinity is a concern for service providers diverting drinking water from the southern Delta. Because
drinking water effects associated with salinity are considered to be related to taste and not harmful
to human health, secondary drinking water MCLs are established for EC as summarized in Section
13.3.2. As identified in Section 13.2.3, Southern Delta, baseline salinity in the southern Delta is
between 0.2 dS/m and 1.2 dS/m during all months of the year, and the salinity at Vernalis has a
strong relationship with the salinity of the southern Delta. Under SDWQ 2, the program of
implementation would maintain EC at Vernalis at or below 0.7 dS/m April-August and 1.0 dS/m
September-March, similar to current conditions, through actions undertaken by USBR in accordance
with its water rights. Thus, it is expected the southern Delta would experience salinity levels similar
to or better than (see Chapter 5, Surface Hydrology and Water Quality, which shows EC exceedances
declining under the alternatives) baseline conditions (i.e., 0.2 dS/m–1.2 dS/m). Salinity in the
southern Delta would remain below the upper limit for the secondary drinking water MCL (1.6
State Water Resources Control Board California Environmental Protection Agency
Service Providers
Evaluation of San Joaquin River Flow and Southern Delta Water Quality Objectives and Implementation
13-82 September 2016
ICF 00427.11
dS/m) and would still occasionally be above the recommended lower limit for the secondary
drinking water MCL (0.9 dS/m). Therefore, SDWQ Alternative 2 is not expected to degrade water
quality, and service providers diverting water for domestic purposes would not be impacted by the
quality of water in the southern Delta under this alternative. Impacts would be less than significant.
SDWQ Alternative 3 (Less than significant)
Impacts would generally be the same as those discussed under SDWQ Alternative 2. Under SDWQ 3,
the program of implementation would maintain EC at Vernalis at or below 0.7 dS/m April–August
and 1.0 dS/m September–March, similar to current conditions, through actions undertaken by USBR
in accordance with its water rights. This would maintain the historical range of salinity in the
southern Delta (i.e., 0.2 dS/m–1.2 dS/m). Salinity in the southern Delta would remain below the
upper limit for the secondary drinking water MCL (1.6 dS/m) and would still occasionally be above
the recommended lower limit for the secondary drinking water MCL (0.9 dS/m). Salinity levels
would not exceed the short term MCL (2.2 dS/m). Therefore, SDWQ Alternative 3 is not expected to
degrade water quality and violate standards, and service providers diverting water for domestic
purposes would not be impacted by the quality of water in the southern Delta under this alternative.
Impacts would be less than significant.
Impact SP-2b: Violate any water quality standards such that drinking water quality from
domestic wells would be affected
No Project Alternative (LSJR/SDWQ Alternative 1)
The No Project Alternative would result in implementation of flow objectives identified in the
2006 Bay-Delta Plan. See Chapter 15, No Project Alternative (LSJR Alternative 1 and SDWQ
Alternative 1), for the No Project Alternative impact discussion and Appendix D, Evaluation of the
No Project Alternative (LSJR Alternative 1 and SDWQ Alternative 1), for the No Project Alternative
technical analysis.
LSJR Alternatives
LSJR Alternative 2 (Less than significant/ Significant and unavoidable with adaptive implementation)
Groundwater Subbasins
As discussed in SP-2a, there would likely be no degradation of groundwater quality under LSJR
Alternative 2 because substantial additional pumping is not expected to occur in the subbasins (as
described in Chapter 9, Groundwater Resources). Accordingly, LSJR Alternative 2 would have a less-
than-significant impact on the quality of water in domestic wells.
Southern Delta
LSJR Alternative 2, would result in overall higher flows into the southern Delta. Higher Delta inflow
from the LSJR helps improve water quality constituents, including salinity. Therefore, the effect of
the alternative on surface water quality constituents, including salinity, is expected to be less than
significant.

State Water Resources Control Board California Environmental Protection Agency
Service Providers
Evaluation of San Joaquin River Flow and Southern Delta Water Quality Objectives and Implementation
13-83 September 2016
ICF 00427.11
Adaptive Implementation
Groundwater
As discussed under Impact SP-1, LSJR Alternative 2 with adaptive implementation could result in
substantial groundwater depletions from increased pumping within the Extended Merced Subbasin.
This could affect the direction of groundwater flow, and localized groundwater contamination could
move in undesirable directions as explained in Section 13.2.1, Lower San Joaquin River and
Tributaries, potentially affecting groundwater as a source for drinking water. The change in
groundwater flow is dependent on the location of pumping, the amount of groundwater pumped
and the frequency at which pumping occurs, and hydrogeological characteristics of the aquifer (e.g.,
consolidated clays with low permeability or unconsolidated sands with high permeability). As
discussed previously, the impact of groundwater pumping on groundwater quality also depends on
a number of different variables including, but not limited to, location and depth of the well, the
amount and frequency of groundwater pumping, number and proximity of nearby wells,
hydrogeological characteristics of the aquifer, distance between the well(s) and the contaminant(s),
contaminant characteristics (e.g., highly mobile in water or adhering primarily to soil), and land use
near the well. In addition, it is not possible to predict how the affected parties would respond to the
reduction of surface water due to the LSJR alternatives. They may deepen existing wells or build
new wells. If they build new wells, it is impossible to determine the number of new wells and their
location. Thus while groundwater pumping can affect groundwater flow and quality, for all of the
foregoing reasons, it is speculative to specifically determine what that change in groundwater flow
and its impact on groundwater quality would be from the increased groundwater pumping.
If LSJR Alternative 2, with adaptive implementation, is implemented frequently and long term, it is
expected that service providers relying on surface water supplies may need to find alternative
supplies (e.g., groundwater), especially those service providers relying on the Merced and Tuolumne
Rivers for surface water supplies (i.e., MID, TID and Merced ID, City of Modesto [Table 13-2]).
Furthermore, those service providers relying on the Extended Merced Subbasin for groundwater
supply to meet their water needs (Tables 13-3a and 13 3b) potentially could be affected by changes
in groundwater quality from the migration of contaminants.
In contrast to drinking water served by public water systems, a substantial increase in groundwater
pumping may result in the use of drinking water by private domestic wells that does not meet water
quality standards due to the potential for changes to groundwater quality from the migration of
contaminants in the Extended Merced Subbasin. While it is true that pumping greatly increased
during the drought and yet there was not a greater number of MCL violations as compared to a wet
year as reported by service providers, there is a lack of information to support that this was also the
case for private domestic wells. Importantly, private domestic well users are largely unregulated
and are under no state requirements to monitor, test, and treat their water to meet the state and
federal Safe Drinking Water Act. Therefore, there is no required mechanism to prevent private
domestic wells from using groundwater that may exceed MCLs.
Therefore, under LSJR Alternative 2 with adaptive implementation there is a potential for the quality
of groundwater used in private domestic wells to be affected such that violations of water quality
standards would occur. Accordingly, impacts would be significant.
The State Water Board does not have authority to require implementation of mitigation that could
reduce this impact to a less-than-significant level, because it does not regulate private domestic
wells. It can and does assist in identifying water quality threats through the GAMA Program, which is

State Water Resources Control Board California Environmental Protection Agency
Service Providers
Evaluation of San Joaquin River Flow and Southern Delta Water Quality Objectives and Implementation
13-84 September 2016
ICF 00427.11
the State Water Board’s comprehensive groundwater quality monitoring program for California, and
GeoTracker GAMA, which provides water quality data in California via the internet. Using the data
collected in GAMA since year 2000, DDW also provides an online, map-based, tool called “Is My
Property Near a Nitrate-Impacted Water Well?” for the domestic owners to evaluate the risk of their
well to nitrate contamination. The map-based tool displays well locations of recent nitrate
contamination above the MCL within a 2,000 feet radius of an address that the user provides.
The tool can be accessed at
http://www.waterboards.ca.gov/water_issues/programs/nitrate_project/nitrate_tool/.
Possible mitigation measures owners and operators of private domestic wells should undertake to
avoid or reduce potential drinking water impacts at private domestic wells include the following.
Having a licensed contractor construct wells in accordance with well construction standards.
Choosing a location for a well to make sure it is free of potential sources of contamination.
Testing well water at certified drinking water laboratories to ensure its quality.
If necessary, installing a water treatment system tailored to the overall water chemistry and
constituents that need to be removed. Example systems include activated alumina filters,
activated charcoal filters, air stripping, anion exchange, and ultraviolet radiation.
If necessary, drilling a new well that taps into a cleaner aquifer or finding an alternative water
source.
Properly destroying unused and abandoned wells to prevent contamination.
In addition, local agencies can and should exercise their police powers and groundwater
management authority under SGMA, described above, to address groundwater contamination so as
to prevent and/or mitigate drinking water impacts on private domestic wells. Specifically, under
SGMA, local agencies in high- and medium-priority basins are to form GSAs by June 30, 2017, which
will develop and implement GSPs that achieve sustainable groundwater management within
20 years. Sustainable groundwater management is defined as “the management and use of
groundwater in a manner that can be maintained during the [50 year] planning and implementation
horizon without causing undesirable results.” (Wat. Code, § 10721, subd. (v).) “Undesirable results”
includes “significant and unreasonable degraded water quality, including the migration of
contaminant plums that impair water supplies.” (Wat. Code, § 10721, subd. (x)(4).) GSPs must be
developed for critically overdrafted high- and medium-priority basins by January 31, 2020 (DWR
2016). In the area of potential effects, this deadline applies to the Eastern San Joaquin, Merced, and
Chowchilla Subbasins. All other high- or medium-priority basins must adopt GSPs by January 31,
2022. In the study area, this includes Modesto and Turlock Subbasins.
Each GSP must also include measureable objectives as well as milestones in increments of 5 years, to
achieve the sustainability goal in the basin within 20 years of the implementation of the plan. (Wat.
Code, § 10727.2.)
If local agencies are unwilling or unable to manage their groundwater resources, SGMA authorizes
the State Water Board to step in to protect a groundwater basin in limited circumstances: (1) if no
agency has opted by the June 30, 2017 to serve as a GSA for a basin, (2) when a GSA does not
complete a GSP by the relevant deadline (2020 or 2022), or (3) when the GSP is inadequate or the
GSP is not being implemented in a manner that is likely to achieve the plan’s sustainability goal(s),
and the basin is either in a condition of long-term overdraft or, after January 31, 2025, the State

State Water Resources Control Board California Environmental Protection Agency
Service Providers
Evaluation of San Joaquin River Flow and Southern Delta Water Quality Objectives and Implementation
13-85 September 2016
ICF 00427.11
Water Board determines that the basin is in a condition where groundwater extractions result in
significant depletions of interconnected surface waters.
Thus, at this time, local agencies are vested with the mandatory duty to achieve sustainable
groundwater management, which includes preventing significant and unreasonable degradation to
water quality. These agencies, therefore, can and should exercise their full authorities to address
degradation of groundwater quality, both under SGMA and their police powers. Doing so would
prevent and/or mitigate private domestic well drinking water supply impacts. Due to inherent
uncertainty in the degree to which this mitigation and those listed above may be implemented by
local agencies and owners and operators of private domestic wells, drinking water impacts on
private domestic wells would remain significant and unavoidable.
Southern Delta
As discussed in Impact SP-2a, LSJR Alternative 2, with adaptive implementation (including method
1), would result in overall higher flows into the southern Delta. Higher Delta inflow from the LSJR
helps improve water quality constituents, including salinity. Therefore, the effect of the alternative
on surface water quality constituents including salinity is expected to be less than significant.
LSJR Alternatives 3 and 4 (Significant and unavoidable/Significant and unavoidable with adaptive implementation)
Groundwater Subbasins
Reductions in groundwater levels in the Modesto, Turlock, and Extended Merced Subbasins and also
the Eastern San Joaquin Subbasin under LSJR Alternatives 3 and 4 with or without adaptive
implementation could occur as a result of increased pumping. This could affect the direction of
groundwater flow, and localized groundwater contamination could move in undesirable directions
as explained in Section 13.2.1, Lower San Joaquin River and Tributaries, potentially affecting
groundwater as a source for drinking water. The change in groundwater flow is dependent on the
location of pumping, the amount of groundwater pumped and the frequency at which pumping
occurs, and hydrogeological characteristics of the aquifer (e.g., consolidated clays with low
permeability or unconsolidated sands with high permeability). As discussed previously, the impact
of groundwater pumping on groundwater quality also depends on a number of different variables,
including location and depth of the well, the amount and frequency of groundwater pumping,
number and proximity of nearby wells, hydrogeological characteristics of the aquifer, distance
between the well(s) and the contaminant(s), contaminant characteristics (e.g., highly mobile in
water or adhering primarily to soil), and land use near the well. In addition, it is not possible to
predict how the affected parties would respond to the reduction of surface water due to the LSJR
alternatives. They may deepen existing wells or build new wells. If they build new wells, it is
impossible to determine the number of new wells and their location. Thus while groundwater
pumping can affect groundwater flow and quality, for all of the foregoing reasons, it is speculative to
specifically determine what that change in groundwater flow and its impact on groundwater quality
would be from the increased groundwater pumping.
In contrast to drinking water served by public water systems, a substantial increase in groundwater
pumping may result in the use of drinking water by private domestic wells that does not meet water
quality standards due to the potential for changes in groundwater quality from the migration of
contaminants in the Modesto, Turlock and Extended Merced Subbasins and also the Eastern San
Joaquin Subbasin under LSJR Alternatives 3 and 4 with or without adaptive implementation. While it

State Water Resources Control Board California Environmental Protection Agency
Service Providers
Evaluation of San Joaquin River Flow and Southern Delta Water Quality Objectives and Implementation
13-86 September 2016
ICF 00427.11
is true that pumping greatly increased during the drought and yet there was not a greater number of
MCL violations as compared to a wet year as reported by service providers, there is a lack of
information to support that this was also the case for private domestic wells. Importantly, private
domestic well users are largely unregulated and are under no state requirements to monitor, test,
and treat their water to meet the state and federal Safe Drinking Water Act. Therefore, there is no
required mechanism to prevent private domestic wells from using groundwater that may exceed
MCLs.
Therefore, under LSJR Alternatives 3 and 4, with or without adaptive implementation, there is a
potential for the quality of groundwater used in private domestic wells to be affected such that
violations of water quality standards would occur. Accordingly, impacts would be significant.
The State Water Board does not have authority to impose mitigation that could reduce this impact to
a less-than-significant level, because it does not regulate private domestic wells. It can and does
assist in identifying water quality threats through the GAMA Program and GeoTracker GAMA. Using
the data collected in GAMA since year 2000, DDW also provides the online, map-based, tool called “Is
My Property Near a Nitrate-Impacted Water Well?” for the domestic owners to evaluate the risk of
their well to nitrate contamination, described previously under Impact SP-2b, LSJR Alternative 2.
Possible mitigation measures owners and operators of private domestic wells should undertake to
avoid or reduce potential drinking water impacts at private domestic wells include the following.
Having a licensed contractor construct wells in accordance with well construction standards.
Choosing a location for a well to make sure it is free of potential sources of contamination.
Testing well water at certified drinking water laboratories to ensure its quality.
If necessary, installing a water treatment system tailored to the overall water chemistry and
constituents that need to be removed. Example systems include activated alumina filters,
activated charcoal filters, air stripping, anion exchange, and ultraviolet radiation.
If necessary, drilling a new well that taps into a cleaner aquifer or finding an alternative water
source.
Properly destroying unused and abandoned wells to prevent contamination.
In addition, local agencies can and should exercise their police powers and groundwater
management authority under SGMA, described above, to address groundwater contamination so as
to prevent and/or mitigate drinking water impacts on private domestic wells. Specifically, under
SGMA, local agencies in high- and medium-priority basins are to form GSAs by June 30, 2017, which
will develop and implement GSPs that achieve sustainable groundwater management within
20 years. Sustainable groundwater management is defined as “the management and use of
groundwater in a manner that can be maintained during the [50 year] planning and implementation
horizon without causing undesirable results.” (Wat. Code, § 10721, subd. (v).) “Undesirable results”
includes “significant and unreasonable degraded water quality, including the migration of
contaminant plums that impair water supplies.” (Wat. Code, § 10721, subd. (x)(4).) GSPs must be
developed for critically overdrafted high- and medium-priority basins by January 31, 2020 (DWR
2016). This deadline applies to the Eastern San Joaquin, Merced, and Chowchilla Subbasins. All other
high- or medium-priority basins must adopt GSPs by January 31, 2022. This includes Modesto and
Turlock Subbasins.

State Water Resources Control Board California Environmental Protection Agency
Service Providers
Evaluation of San Joaquin River Flow and Southern Delta Water Quality Objectives and Implementation
13-87 September 2016
ICF 00427.11
Each GSP must also include measureable objectives as well as milestones in increments of 5 years, to
achieve the sustainability goal in the basin within 20 years of the implementation of the plan. (Wat.
Code, § 10727.2.)
If local agencies are unwilling or unable to manage their groundwater resources, SGMA authorizes
the State Water Board to step in to protect a groundwater basin in limited circumstances: (1) if no
agency has opted by the June 30, 2017 to serve as a GSA for a basin, (2) when a GSA does not
complete a GSP by the relevant deadline (2020 or 2022), or (3) when the GSP is inadequate or the
GSP is not being implemented in a manner that is likely to achieve the plan’s sustainability goal(s),
and the basin is either in a condition of long-term overdraft or, after January 31, 2025, the State
Water Board determines that the basin is in a condition where groundwater extractions result in
significant depletions of interconnected surface waters.
Thus, at this time, local agencies are vested with the mandatory duty to achieve sustainable
groundwater management, which includes preventing significant and unreasonable degradation to
water quality. These agencies, therefore, can and should exercise their full authorities to address
degradation of groundwater quality, both under SGMA and their police powers. Doing so would
prevent and/or mitigate private domestic well drinking water supply impacts. Due to inherent
uncertainty in the degree to which this mitigation and those listed above may be implemented by
local agencies and owners and operators of private domestic wells, drinking water impacts on
private domestic wells under LSJR Alternatives 3 and 4 would remain significant and unavoidable.
Impact SP-3: Result in substantial changes to SJR inflows to the Delta such that insufficient water
supplies would be available to service providers relying on CVP/SWP exports
No Project Alternative (LSJR/SDWQ Alternative 1)
The No Project Alternative would result in implementation of flow objectives identified in the
2006 Bay-Delta Plan. See Chapter 15, No Project Alternative (LSJR Alternative 1 and SDWQ
Alternative 1), for the No Project Alternative impact discussion and Appendix D, Evaluation of the
No Project Alternative (LSJR Alternative 1 and SDWQ Alternative 1), for the No Project Alternative
technical analysis.
LSJR Alternatives
LSJR Alternative 2 (Less than significant/Less than significant with adaptive implementation)
There would be no reduction in annual average CVP/SWP exports under LSJR Alternative 2
(Section 13.4.2, Methods and Approach, and detailed in Chapter 5, Surface Hydrology and Water
Quality). Modeling results of LSJR Alternative 2 indicate a slight increase in average inflow into the
southern Delta from the LSJR. This slight increase in Delta inflow results in an estimated average
increase in exports of 18 thousand acre-feet per year (TAF/y). This increase is minimal compared to
the historic average annual export of 5,185 TAF/y. As such, under LSJR Alternative 2, the change in
exports would be 0 percent of historic average annual exports. Because this change would not
reduce the average volume of exported water, it is not expected that service providers relying on
exports would experience insufficient water supplies. LSJR Alternative 2, with adaptive
implementation method 1, would allow an increase of up to 10 percent over the 20 percent
February–June unimpaired flow requirement and, thus, would not reduce the average inflow into

State Water Resources Control Board California Environmental Protection Agency
Service Providers
Evaluation of San Joaquin River Flow and Southern Delta Water Quality Objectives and Implementation
13-88 September 2016
ICF 00427.11
the southern Delta from the LSJR. Accordingly, this would not result in a reduction in available water
supplies to service providers relying on CVP/SWP exports. As part of LSJR Alternative 2, with
adaptive implementation method 2, timing of the release of water within the February–June period
would change. By shifting the release time, the shifted release would be affected by different Delta
regulations, but the associated change in exports would be relatively small compared to total
exports, and the average would not decrease relative to baseline, as a result of overall higher SJR
inflow to the Delta. Adaptive implementation method 3 would not be authorized under LSJR
Alternative 2 since the unimpaired flow percentage would not exceed 30 percent. LSJR Alternative 2,
with adaptive implementation method 4, would allow an adjustment of the Vernalis February–June
flow requirement. However, as described under Impact SP-1, changes due to adaptive
implementation method 4 under this alternative would rarely alter the flow in the LSJR and, thus,
average inflow to the southern Delta would not be changed such that export would be reduced.
Impacts would be less than significant.
LSJR Alternative 3 (Less than significant/Less than significant with adaptive implementation)
There would be no reduction in annual average CVP/SWP exports under LSJR Alternative 3
(Section 13.4.2, Methods and Approach, and detailed in Chapter 5, Surface Hydrology and Water
Quality). Modeling results of LSJR Alternative 3 indicate a slight increase in average inflow into the
southern Delta from the LSJR. This slight increase in Delta inflow would result in an estimated
average increase in exports of 76 TAF/y. This small increase is approximately 1 percent of the
historic average annual export of 5,185 TAF/y. Because this change would not reduce the average
volume of exported water, it is not expected that service providers relying on exports would
experience insufficient water supplies. LSJR Alternative 3, with adaptive implementation method 1,
would allow an increase or decrease of up to 10 percent in the February–June. Effects with a 10
percent decrease would be similar to those described for LSJR Alternative 2, with adaptive
implementation method 1. As such, service providers would not be impacted. Adaptive
implementation methods 2, 3 and 4 are not expected to result in substantial changes to CVP/SWP
exports such that service providers relying on these exports are significantly impacted. LSJR
Alternative 3, with adaptive implementation methods 2 or 3, could result in a change to the timing of
the release of water within the February–June period. By shifting the release time, the shifted
release would be affected by different Delta regulations, but the associated change in exports would
be relatively small compared to total exports, and the average volume of exported water would not
decrease relative to baseline. Changes in CVP/SWP exports and associated effects on service
providers receiving those exports under LSJR Alternative 3 with adaptive implementation method 4
would be similar to LSJR Alternative 2 with adaptive implementation method 4 and as such, service
providers would not be significantly impacted. Impacts would be less than significant.
LSJR Alternative 4 (Less than significant/Less than significant with adaptive implementation)
There would be no reduction in annual average CVP/SWP exports under LSJR Alternative 4
(Section 13.4.2, Methods and Approach, and detailed in Chapter 5, Surface Hydrology and Water
Quality). Modeling results of LSJR Alternative 4 indicate an average increase in inflow into the
southern Delta from the LSJR. This increase in Delta inflow results in an estimated average increase
in exports of 194 TAF/y. This small increase is approximately 4 percent of the historic average
annual export of 5,185 TAF/y. Because this change would not reduce the average volume of

State Water Resources Control Board California Environmental Protection Agency
Service Providers
Evaluation of San Joaquin River Flow and Southern Delta Water Quality Objectives and Implementation
13-89 September 2016
ICF 00427.11
exported water, it is not expected that service providers relying on exports would experience
insufficient water supplies. LSJR Alternative 4, with adaptive implementation method 1, would allow
for a decrease of unimpaired flow to a minimum of 50 percent and would result in an increase in
exports; therefore, service providers relying on these exports would not be affected. As part of LSJR
Alternative 4 with adaptive implementation methods 2 or 3, timing of the release of water within
the February–June period would change. By shifting the release time, the shifted release would be
affected by different Delta regulations, but the associated change in exports would be relatively
small compared to total exports, and the average volume of exported water would not decrease
relative to baseline. Changes in CVP/SWP exports and associated effects on service providers
receiving those exports with LSJR Alternative 4 with adaptive implementation method 4 would be
similar to LSJR Alternative 2 with adaptive implementation method 4. Impacts would be less than
significant.
13.4.4 Impacts and Mitigation Measures: Extended Plan Area
Bypass flows, as described in Chapter 5, Surface Hydrology and Water Quality, could be required
much more frequently and be larger than under baseline conditions, resulting in potentially less
surface water to the 12 service providers identified in the extended plan area in Table 13-6. As such,
a small fraction of the water supply effect in the plan area to those service providers relying wholly
or in part on surface water to meet water supply needs could be shifted to junior water rights
holders in the extended plan area. To the extent that this water supply effect is shifted from
agriculture uses downstream in the plan area to consumptive domestic and municipal uses
upstream in the extended plan area, the effects on service providers would increase slightly in the
extended plan area from that described for the plan area. The service providers identified in Table
13-6 have the potential to have their water supply affected to the extent that their water rights are
junior to the senior downstream water right holders.
Under LSJR Alternative 2 without adaptive implementation water supply of downstream senior
rights holders would generally be similar to baseline. Therefore, the impacts of LSJR Alternative 2
without adaptive implementation on service providers in the extended plan area would be less than
significant.
Similar to the plan area, the extent to which service providers that primarily rely on surface water
are affected by a reduction in surface water diversions is a function of their ability to develop
alternative water supplies, including water purchases from senior water right holders, or rely on
their current existing alternative supplies (e.g., groundwater) under LSJR Alternative 2 with
adaptive implementation and LSJR Alternatives 3 and 4 with or without adaptive implementation.
The program of implementation states that the State Water Board will take actions as necessary to
ensure implementation of flow objectives does not impact supplies of drinking water for minimum
health and safety needs, particularly during drought periods. Actions may include assistance with
funding and development of water conservation efforts and regional water supply reliability
projects and regulating public drinking water systems and water rights. These actions would be
aimed at those service providers supplying water to municipal users and may offset water supply
reduction impacts on providers. However, similar to those service providers in the plan area, it is
expected that service providers in the extended plan area may need to construct or expand new
water treatment facilities or water supply infrastructure to try to accommodate reductions in
surface water supplies.

State Water Resources Control Board California Environmental Protection Agency
Service Providers
Evaluation of San Joaquin River Flow and Southern Delta Water Quality Objectives and Implementation
13-90 September 2016
ICF 00427.11
Some of these service providers would be able to implement groundwater pumping to replace some
of the bypassed surface water. However, groundwater basins with sufficient quantity to replace the
volume required are limited. Some individuals who rely on these service providers may put in their
own groundwater wells to supplement that water. Similar to the plan area, significant
environmental impacts could occur during construction or operation of new and expanded water
facilities and lead agencies can and should implement mitigation measures (listed in Table 16-38).
CEQA does not grant agencies new, discretionary powers independent of the powers granted to the
agencies by other laws. (Pub. Resources Code, § 21004; Cal. Code Regs., tit. 14, § 15040.)
Accordingly, a mitigation measure may be legally infeasible if the lead agency does not have the
discretionary authority to impose or implement it. (Pub. Resources Code, § 21004; Cal. Code Regs.,
tit. 14, § 15040.) Since the State Water Board would not be responsible for or have discretionary
authority to approve the construction of any new or modified facilities or infrastructure, it is not
feasible for the State Water Board to impose possible mitigation measures listed in Table 16-38.
Moreover, the State Water Boards lacks authority to impose mitigation measures related to impacts
such as traffic and noise. Agencies responsible for approving the project-specific new or modified
facilities can and should impose the applicable mitigation measures in Table 16-38. Therefore, there
is no feasible mitigation the State Water Board can impose to reduce environmental impacts
resulting from the need for new or modified facilities or infrastructure. Impacts would be significant
and unavoidable. Consequently, under LSJR Alternative 2, with adaptive implementation, and LSJR
Alternatives 3 and 4, with or without adaptive implementation, the impacts would be significant and
unavoidable for Impact SP-1 in the extended plan area.
The groundwater source area28 underlying the extended plan area is primarily fractured bedrocks.
There is only one DWR Bulletin 118-designated groundwater basin, the Yosemite Valley Basin in
Yosemite National Park in Mariposa County, in the extended plan area; the rest of the area is
primarily fractured bedrocks. These fracture systems produce relatively small, localized, and
isolated groundwater areas. If surface water available to the service providers in the extended plan
area is reduced due to implementation of the LSJR alternatives, there could be more groundwater
pumping over time in the extended plan area. However, the impact of such an increase in pumping
on groundwater quality would be minimal for the following reasons.
The increase in pumping would be small based on the relatively small amount of total municipal
use that occurs in the extended plan area (Section 13.2.2, Extended Plan Area).
The groundwater in the fractured rocks are localized and isolated; hence, the influence of
increased pumping on the migration of any contaminants would be minimal.
Thus, impacts on groundwater quality (Impacts SP-2a and SP-2b) would be less than significant in
the extended plan area. As discussed in Chapter 5, Surface Hydrology and Water Quality, changes on
flow upstream of the major rim dams in the Stanislaus, Tuolumne, and Merced Rivers would be
small and would not change flows downstream of the rim dams. SJR inflows to the Delta would not
be affected even if the extended plan area is taken into consideration. Therefore, impact of the LSJR
alternatives with or without adaptive implementation to the service providers relying on CVP/SWP
exports (Impact SP-3) would be less than significant.
28 Although alluvial aquifers are most common in California, other groundwater development occurs in fractured crystalline rocks, fractured volcanics, and limestones. These nonalluvial areas that provide groundwater are referred to as groundwater source areas, while the alluvial aquifers are called groundwater basins in DWR Bulletin 118 (DWR 2003a). It is generally referring to areas of fractured bedrock in foothill and mountainous terrain.

State Water Resources Control Board California Environmental Protection Agency
Service Providers
Evaluation of San Joaquin River Flow and Southern Delta Water Quality Objectives and Implementation
13-91 September 2016
ICF 00427.11
13.5 Cumulative Impacts For the cumulative impact analysis, refer to Chapter 17, Cumulative Impacts, Growth-Inducing Effects,
and Irreversible Commitment of Resources.

State Water Resources Control Board California Environmental Protection Agency
Service Providers
Evaluation of San Joaquin River Flow and Southern Delta Water Quality Objectives and Implementation
13-92 September 2016
ICF 00427.11
Table 13-3a. Public Water Suppliers in the Eastern San Joaquin, Merced, Modesto, and Turlock Subbasins
Note: This table is first referenced in this chapter in Section 13.2.1, Lower San Joaquin River and Tributaries.
Public Water System Population Served
County Served
Groundwater Subbasin
Groundwater Reliance (%) in 2014
4N Mobile Home Park 165 Stanislaus Eastern San Joaquin 100
A V Thomas Produce, Inc. 200 Merced Merced 100
Almond Park Water System 60 San Joaquin Eastern San Joaquin 100
Atwater 28,100 Merced Merced 100
Ballico CSD 309 Merced Turlock 100
Bel Air Mobile Estate 150 San Joaquin Eastern San Joaquin 100
Black Rascal Water Company 393 Merced Merced 100
Burson Full Gospel Church 80 Calaveras Eastern San Joaquin 100
Cal Water, Stockton 185,346 San Joaquin Eastern San Joaquin 26
Calaveras CWD - Wallace 340 Calaveras Eastern San Joaquin 100
Castle Airport 2091 Merced Merced 100
Ceres 42,666 Stanislaus Turlock 100
Ceres West Mobile Home Park 161 Stanislaus Turlock 100
City of Modesto 212,000 Stanislaus Turlock 61
City of Modesto, Central Turlockb 116 Stanislaus Turlock 100
City of Modesto, De #6, So. Turlock 1,279 Stanislaus Turlock 100
City of Modesto, De Grayson 1,219 Stanislaus Turlock 100
City of Modesto, De Hayes 200 Stanislaus Turlock 100
City of Modesto, De Hickman 565 Stanislaus Turlock 100
City of Modesto, De Hillcrest 1,322 Stanislaus Modesto 100
City of Modesto, De Walnut Manor 216 Stanislaus Turlock 100
City of Modesto, De Waterford 7,897 Stanislaus Modesto 100
City of Modesto, Salida 24,440 Stanislaus Modesto 100
Clements Water Works #43 120 San Joaquin Eastern San Joaquin 100
Country Club County WD 85 Merced Turlock 100
Country Manor Mobile Home Park 75 San Joaquin Eastern San Joaquin 100

State Water Resources Control Board California Environmental Protection Agency
Service Providers
Evaluation of San Joaquin River Flow and Southern Delta Water Quality Objectives and Implementation
13-93 September 2016
ICF 00427.11
Public Water System Population Served
County Served
Groundwater Subbasin
Groundwater Reliance (%) in 2014
Country Villa Apartments 30 Stanislaus Turlock 100
Country Western Mobile Home Park 120 Stanislaus Turlock 100
Countryside Mobile Home Estates 60 Stanislaus Turlock 100
Defense Distribution. Depot, Sharpe Site 1,650 San Joaquin Eastern San Joaquin 100
Delhi CWD 5,640 Merced Turlock 100
Denair CSD 3,225 Stanislaus Turlock 100
El Nido Elementary School 210 Merced Merced 100
El Nido Mobile Home Park 125 Merced Extended Merced 100
El Torero Restaurant 225 Calaveras Eastern San Joaquin 100
Elkhorn Estates Water System 200 San Joaquin Eastern San Joaquin 100
Escalon 7,137 San Joaquin Eastern San Joaquin 100
Faith Home Teen Ranch 50 Stanislaus Turlock 100
Farmington Water Company 270 San Joaquin Eastern San Joaquin 100
Finnlees Trailer Park 55 San Joaquin Eastern San Joaquin 100
Foster Farms #5 26 Stanislaus Turlock 100
Gayla Manor PWS 146 San Joaquin Eastern San Joaquin 100
Glenwood Mobile Home Park 100 San Joaquin Eastern San Joaquin 100
Green Run Mobile Estates 100 Stanislaus Turlock 100
Hickman 565 Stanislaus Turlock 100
Hilmar County WD 4,850 Merced Turlock 100
Hughson 6,082 Stanislaus Turlock 100
Islander Marina 150 San Joaquin Eastern San Joaquin 100
Keyes CSD 4,575 Stanislaus Turlock 100
Lathrop 12,427 San Joaquin Eastern San Joaquin 88
Le Grand CSD 1,700 Merced Merced 100
Linden CWD 1,450 San Joaquin Eastern San Joaquin 100
Livingston 13,940 Merced Merced 100
Lockeford CSD 2,500 San Joaquin Eastern San Joaquin 100
Lodi 63,395 San Joaquin Eastern San Joaquin 73

State Water Resources Control Board California Environmental Protection Agency
Service Providers
Evaluation of San Joaquin River Flow and Southern Delta Water Quality Objectives and Implementation
13-94 September 2016
ICF 00427.11
Public Water System Population Served
County Served
Groundwater Subbasin
Groundwater Reliance (%) in 2014
Manteca 66,451 San Joaquin Eastern San Joaquin 42
Meadowbrook Water Company 6,309 Merced Merced 100
Merced 80,095 Merced Merced 100
MID 16 Stanislaus Turlock 0
Mobile Plaza Park 125 Stanislaus Turlock 100
Morada Acres Water System 105 San Joaquin Eastern San Joaquin 100
Morada Estates N PWS #46 180 San Joaquin Eastern San Joaquin 100
Morada Estates PWS 158 San Joaquin Eastern San Joaquin 100
Morada Manor Water System 109 San Joaquin Eastern San Joaquin 85
Oakdale 19,250 Stanislaus Modesto 100
Oakdale Golf & Country Club (EH) 25 Stanislaus Modesto 100
Oakwood Lake Water District-Subdivision 43 San Joaquin Eastern San Joaquin 100
Plainsburg Elementary School 150 Merced Merced 100
Planada CSD 4,500 Merced Merced 100
Rancho Marina 75 Sacramento Eastern San Joaquin 100
Rancho San Joaquin Water Sys 141 San Joaquin Eastern San Joaquin 100
Ripon 14,915 San Joaquin Modesto 100
Riverbank 22,201 Stanislaus Modesto 100
Roberts Ferry School Cafeteria 100 Stanislaus Modesto 100
San Joaquin County–Colonial Heights 1,851 San Joaquin Eastern San Joaquin 0
San Joaquin County–Lincoln Village 5,865 San Joaquin Eastern San Joaquin 0
San Joaquin County-Mokelumne Acres 3,640 San Joaquin Eastern San Joaquin 100
San Joaquin County-Raymus Village 1,086 San Joaquin Eastern San Joaquin 100
San Joaquin County–Thornton 957 San Joaquin Eastern San Joaquin 100
San Joaquin County–Wilkinson Manor 861 San Joaquin Eastern San Joaquin 100
Sandy Mush Detention Center 800 Merced Merced 100
SEWD 50 San Joaquin Eastern San Joaquin 0
Shaded Terrace PWS 161 San Joaquin Eastern San Joaquin 100
South San Joaquin ID 50 Stanislaus Modesto 0

State Water Resources Control Board California Environmental Protection Agency
Service Providers
Evaluation of San Joaquin River Flow and Southern Delta Water Quality Objectives and Implementation
13-95 September 2016
ICF 00427.11
Public Water System Population Served
County Served
Groundwater Subbasin
Groundwater Reliance (%) in 2014
Spring Creek Estates PWS 90 San Joaquin Eastern San Joaquin 100
Stockton 169,963 San Joaquin Eastern San Joaquin 23
TID/ La Grange Water System 195 Stanislaus Turlock 0
Tracya 82,000 San Joaquin Tracy 3
Turlock 64,215 Stanislaus Turlock 100
Valley Springs PUD 900 Calaveras Eastern San Joaquin 100
Walnut Acres 100 San Joaquin Eastern San Joaquin 100
West Lane Mobile Home Park 160 San Joaquin Eastern San Joaquin 100
Willow Berm Marina 150 Sacramento Eastern San Joaquin 100
Winton WSD 8,500 Merced Merced 100
Total 1,197,140
Sources: California Environmental Health Tracking Program (CEHTP) Drinking Water Systems Geographic Reporting Tool 2016; State Water Resources Control
Board, Division of Drinking Water 2016.
Note: Gray-shaded rows indicate those public water suppliers shown in Table 13-3b.
CSD = Community Services District
CWD = County Water District
ID = Irrigation District
MID = Modesto Irrigation District
PWS = Public Water System
PUD = Public Utilities District
SEWD = Stockton East Water District
WD = Water District a Although the City of Tracy is not located in the Eastern San Joaquin, Modesto, Turlock, or Extended Merced Subbasin, it is within the area of potential effects
because it receives water from SSJID and can be affected by the LSJR alternatives. Therefore, it is included in this table. b The City of Modesto, Central Turlock has no groundwater wells, but purchases groundwater from Turlock.

State Water Resources Control Board California Environmental Protection Agency
Service Providers
Evaluation of San Joaquin River Flow and Southern Delta Water Quality Objectives and Implementation
13-96 September 2016
ICF 00427.11
13.6 References Cited
13.6.1 Printed References
AMEC. 2008. Merced Groundwater Basin Groundwater Management Plan Updated. July 29. Merced
County, CA. Prepared by AMEC Geomatrix, Inc., Fresno CA. Prepared for Merced Area
Groundwater Pool Interests, Merced, CA.
Association of California Water Agencies. 2015. Reclamation Announces Initial Zero Water Allocation
for Many Ag Users North and South of Delta. February 27. Available: http://www.acwa.com/
news/water-supply-challenges/reclamation-announces-initial-zero-water-allocation-ag-users-
north-and-. Accessed: March 6, 2016.
Belitz, K., M. S. Fram, and T. D. Johnson. 2015. Metrics for assessing the quality of groundwater used
for public supply, CA, USA: equivalent-population and area. Environmental Science & Technology
49:8330–8338.
California Department of Water Resources (DWR). 2003. California’s Groundwater Bulletin 118,
Update 2003. Last revised: 2006. Sacramento, CA.
———. 2013. California Water Plan. Chapter 9 - Conjunctive Management and Groundwater Storage.
Available: http://www.water.ca.gov/waterplan/docs/cwpu2013/Final/Vol3_Ch09_ConjMgmt-
GW-Storage.pdf. Accessed: July 3, 2016.
———. 2014. Public Update for Drought Response: Groundwater Basins with Potential Water
Shortages, Gaps in Groundwater Monitoring, Monitoring of Land Subsidence, and Agricultural
Land Fallowing. Sacramento, CA.
———. 2015. California Statewide Groundwater Elevation Monitoring (CASGEM) Online System.
Available: http://www.water.ca.gov/groundwater/casgem/online_system.cfm. Accessed:
December 4.
———. 2016. Critically Overdrafted Basins. Final List of Critically Overdrafted Basins. January.
Available: http://www.water.ca.gov/groundwater/sgm/cod.cfm. Accessed: March.
California Environmental Health Tracking Program (CEHTP). 2016. Drinking Water Systems
Geographic Reporting Tool. Available: http://cehtp.org/page/water/main. Accessed: January 5.
California Integrated Water Quality System (CIWQS). 2011. Effluent data for Deuel, Discovery Bay,
Manteca, Mountain House, Stockton, and Tracy. January—December, annual average. Available:
http://www.waterboards.ca.gov/ciwqs/. Accessed: May 2015.
———. 2012. Effluent data for Deuel, Discovery Bay, Manteca, Mountain House, Stockton, and Tracy.
January—December, annual average. Available: http://www.waterboards.ca.gov/ciwqs/.
Accessed: May 2015.
———. 2013. Effluent data for Deuel, Discovery Bay, Manteca, Mountain House, Stockton, and Tracy.
January—December, annual average. Available: http://www.waterboards.ca.gov/ciwqs/.
Accessed: May 2015.

State Water Resources Control Board California Environmental Protection Agency
Service Providers
Evaluation of San Joaquin River Flow and Southern Delta Water Quality Objectives and Implementation
13-97 September 2016
ICF 00427.11
———. 2014. Effluent data for Deuel, Discovery Bay, Manteca, Mountain House, Stockton, and Tracy.
January—December, annual average. Available: http://www.waterboards.ca.gov/ciwqs/.
Accessed: May 2015.
California Integrated Water Quality System (CIWQS). 2015. Effluent data for Deuel, Discovery Bay,
Manteca, Mountain House, Stockton, and Tracy. January—December, annual average. Available:
http://www.waterboards.ca.gov/ciwqs/. Accessed: May.
Central Valley Regional Water Quality Control Board (Central Valley Water Board). 2007a. Waste
Discharge Requirements for City of Tracy. Tracy Wastewater Treatment Plant, San Joaquin
County. Order No. CA0079154. Tracy, CA.
———. 2007b. Waste Discharge Requirements for Mountain House Community Services District
Wastewater Treatment Facility for the Mountain House Community Services District. Mountain
House Wastewater Treatment Plant, San Joaquin County. Order No. R5-2007-0039. Mountain
House, CA.
———. 2009. City of Manteca and Dutra Farms, Inc. – City of Manteca Wastewater Control Facility
NPDES Permit (CVRWQCB Order R5- 2009-0095). October 8.
———. 2012. City of Tracy Wastewater Treatment Plant NPDES Permit (CVRWQCB Order R5- 2012-
0115).
———. 2013. Mountain House Community Services District Mountain House Wastewater Treatment
Plant NPDES Permit (Order R5-2013-004).
———. 2014a. Deuel Vocational Institution NPDES Permit (CVRWQCB Order R5-2014-0014).
———. 2014b. City of Stockton Regional Wastewater Control Facility NPDES Permit (Order R5 2014-
0070).
———. 2014c. Discovery Bay Community Services District Discovery Bay Wastewater Treatment Plant
NPDES Permit (Order R5-2014-0073).
———. 2015a. Cleanup and Abatement Order R5-2015-0704 for California Department of Corrections
and Rehabilitation for Operation of Wastewater Treatment Facility Deuel Vocational Institution,
San Joaquin County. Available: http://www.waterboards.ca.gov/rwqcb5/board_decisions/
adopted_orders/san_joaquin/r5-2015-0704_cao.pdf. Accessed: June 9.
———. 2015b. City of Manteca and Dutra Farms, Inc. NPDES Permit (Order R5-2015-0026).
City and County of San Francisco. 2008. Final Program Environmental Impact Report for the San
Francisco Public Utilities Commission’s Water System Improvement Program. San Francisco
Planning Department File No. 2005.0159E. State Clearinghouse No. 2005092026.
City of Atwater. 2011. 2011 City of Atwater Drinking Water Quality Report. June.
———. 2015. City of Atwater Drinking Water Quality Report. July.
City of Escalon. 2005. City of Escalon General Plan. Available: http://cityofescalon.org/
e-documents/developmentservices/planning/General%20Plan%20Elements%20-
%20Updated%20October%202010.pdf. Accessed: July 20, 2012.

State Water Resources Control Board California Environmental Protection Agency
Service Providers
Evaluation of San Joaquin River Flow and Southern Delta Water Quality Objectives and Implementation
13-98 September 2016
ICF 00427.11
City of Lathrop. 2004. Comprehensive General Plan for the City of Lathrop, California. Last revised:
November 2004. Available: http://www.ci.lathrop.ca.us/cdd/documents/pdf/03-02-2011_16-
59-23-758_758.pdf. Accessed: July 20, 2012.
———. 2009. City of Lathrop 2005 Urban Water Management Plan. October 2009. Prepared by Nolte.
Available: http://www.ci.lathrop.ca.us/pwed/programs/pdf/205UWMP.pdf. Accessed: June 3,
2015.
City of Manteca. 2003. City of Manteca General Plan 2023 Policy Document. October 6. Available:
http://www.ci.manteca.ca.us/planning/gp_full_100603.pdf. Accessed: July 20, 2012.
———. 2010. Electrical Conductivity Pollution Prevention Plan for the City of Manteca Wastewater
Quality Control Facility. April. Prepared by Larry Walker Associates.
———. 2012a. City of Manteca Report to Consumers on 2011 Water Quality. May.
———. 2012b. Stanislaus River Water for Manteca Website. Available:
http://www.ci.manteca.ca.us/pwt/engdiv/weng/surfacewater.asp. Accessed: April 15.
———. 2014. City of Manteca 2014 Water Quality Report to Consumers. June.
City of Merced. 2001. Merced Water Supply Plan Update. September. Final Status Report. Prepared by
CH2Mhill, Sacramento, CA.
———. 2011. Annual Water Quality Report for 2010. PWS ID: 2410009.
———. 2015. City of Merced Annual Water Quality Report for Reporting Year 2014. April.
City of Modesto. 2011. 2011 Annual Drinking Water Quality Report. Modesto #5010010. Modesto, CA.
———. 2014. Modesto 2014 Annual Water Quality Report.
City of Modesto and Modesto Irrigation District (MID). 2011. Joint 2010 Urban Water Management
Plan. May. Prepared by West Yost Associates. Available: http://www.mid.org/water/uwmp/
2010_final_modesto-MID_UWMP.pdf. Accessed: July 30, 2014.
City of Ripon. 2006. City of Ripon General Plan 2040. Available: http://www.cityofripon.org/
government/GeneralPlan2040/GeneralPlan2040.html. Accessed: July 20, 2012.
City of Riverbank. 2011. 2011 Consumer Confidence Report for City of Riverbank Water System.
———. 2014. 2014 Consumer Confidence Report for the City of Riverbank Water System.
City of Stockton. 2007. General Plan. Available: http://www.stocktongov.com/government/
departments/communityDevelop/cdPlanGen.html. Accessed: June 2012.
———. 2009. City of Stockton Regional Wastewater Control Facility Salinity Plan. June. Draft.
Prepared by Robertson-Bryan, Inc.
———. 2011a. City of Stockton Drinking Water Quality Report (January – December 2011).
———. 2011b. Salinity Reduction Goal Annual Progress Report for the City of Stockton Regional
Wastewater Control Facility Order No. R5-2008-0154. November 16.
———. 2011c. 2010 City of Stockton Urban Water Management Plan. May 26.

State Water Resources Control Board California Environmental Protection Agency
Service Providers
Evaluation of San Joaquin River Flow and Southern Delta Water Quality Objectives and Implementation
13-99 September 2016
ICF 00427.11
———. 2014. City of Stockton Drinking Water Quality Report (January 2014 – December 2014).
City of Tracy. 2008. City of Tracy WWTP Salinity Reduction Plan. June. Prepared by CH2MHILL.
———. 2011a. 2010 Urban Water Management Plan. May. Prepared by EKI. Prepared for the City of
Tracy.
———. 2011b. Initial Study and Mitigated Negative Declaration of Tracy Desalinization and Green
Energy Project. Available: http://ci.tracy.ca.us/documents/
20111201_Tracy_Desal_Mitigated_Neg.pdf. Accessed: May 13, 2012.
———. 2011c. General Plan. Available: http://www.ci.tracy.ca.us/
?navid=562http://www.cityofwaterford.org/departments/planning/general-plan/. Accessed:
June 2012.
———. 2012. Tracy Desalination and Green Energy Project. SCH Number 2011122004. Prepared by
the City of Tracy. Available: http://www.ceqanet.ca.gov/NODdescription.asp?DocPK=660800.
Accessed: December 21.
———. 2014. Tracy Hills Specific Plan SB610/SB221 Water Supply Assessment. December. Final
Report. Prepared by West Yost Associates. Available: http://www.ci.tracy.ca.us/
documents/Water_Supply_Assessment.pdf. Accessed: May 30, 2015.
City of Turlock. 2011. City of Turlock Water Quality—2011 Annual Report.
———. 2014. City of Turlock Water Quality—2014 Annual Report.
Contra Costa County. 2005. Contra Costa County General Plan. Available: http://www.co.contra-
costa.ca.us/depart/cd/current/advance/GeneralPlan.htm. Accessed: September 2012.
Contra Costa Water District (CCWD) and U.S. Bureau of Reclamation (USBR). 2008. Alternative
Intake Project Environmental Impact Report/Environmental Impact Statement. Available:
http://www.usbr.gov/mp/nepa/nepa_projdetails.cfm?Project_ID=1818. Accessed: June 13,
2012.
Discovery Bay Community Services District (Discovery Bay CSD). 2012. The Town of Discovery Bay
Community Services District Final Wastewater Treatment Plant Master Plan. February. Available:
http://todb.ca.gov/sites/main/files/file-attachments/
final_wastewater_master_plan_-_february_2012.pdf. Accessed: June 2, 2016.
Giwargis, R. 2014. Emergency State Funding Issued to Repair Le Grand Wells. June 20. Merced Sun-
Star. Available: http://www.mercedsunstar.com/news/local/article3291519.html. Accessed:
November 30, 2015.
Harter, T., J. R. Lund, J. Darby, G. E. Fogg, R. Howitt, K. K. Jessoe, G. S. Pettygrove, J. F. Quinn, J. H. Viers,
D. B. Boyle, H. E. Canada, N. DeLaMora, K. N. Dzurella, A. Fryjoff-Hung, A. D. Hollander, K. L.
Honeycutt, M. W. Jenkins, V. B. Jensen, A. M. King, G. Kourakos, D. Liptzin, E. M. Lopez, M. M.
Mayzelle, A. McNally, J. Medellin-Azuara, and T. S. Rosenstock. 2012. Addressing Nitrate in
California's Drinking Water with a Focus on Tulare Lake Basin and Salinas Valley Groundwater.
Report for the State Water Resources Control Board Report to the Legislature. Center for
Watershed Sciences, University of California, Davis, CA. 78 pp. Available:
http://groundwaternitrate.ucdavis.edu.

State Water Resources Control Board California Environmental Protection Agency
Service Providers
Evaluation of San Joaquin River Flow and Southern Delta Water Quality Objectives and Implementation
13-100 September 2016
ICF 00427.11
Johnson, T. D., and K. Belitz. 2015. Identifying the location and population served by domestic wells
in California. Journal of Hydrology: Regional Studies 3(2015):31–86.
Merced Area Groundwater Pool Interests (MAGPI). 2008. Merced Groundwater Basin Groundwater
Management Plan Update. July 29. Prepared by AMEC Geomatrix, Inc.
Merced County. 2013. 2030 Merced County General Plan. Available:
http://www.co.merced.ca.us/DocumentCenter/Home/View/6766. Accessed: May 11, 2015.
Merced Irrigation District (Merced ID). 2013. Merced Irrigation District Agricultural Water
Management Plan. September 3. Prepared for the California Department of Water Resources.
Available: http://www.mercedid.com/index.cfm/water/ag-water-management-plan/.
Accessed: July 10, 2015.
Modesto Irrigation District (MID). 2012. Modesto Irrigation District Agricultural Water Management
Plan for 2012. Available: http://www.mid.org/water/irrigation/
WaterManagementPlan_2012.pdf. Accessed: July 30, 2014.
Morris, B. L., A. R. L. Lawrence, P. J. C. Chilton, B. Adams, R. C. Calow, and B. A. Klinck. 2003.
Groundwater and its Susceptibility to Degradation: A Global Assessment of the Problem and
Options for Management. Early Warning and Assessment Report Series, RS. 03-3. United Nations
Environment Programme, Nairobi, Kenya.
Northeastern San Joaquin County Groundwater Banking Authority (NSJCGBA). 2004. Eastern San
Joaquin Groundwater Basin Groundwater Management Plan. September. Prepared for
Northeastern San Joaquin County Groundwater Banking Authority. Available:
http://www.water.ca.gov/ groundwater/docs/GWMP/SJ-
10_EasternSanJoaquinGWB_GWMP_2004.pdf. Accessed: November 2012.
Oakdale Irrigation District (OID). 2012. Oakdale Irrigation District Agricultural Water Management.
December. Prepared by Davids Engineering, Inc. Available:
http://www.oakdaleirrigation.com/files/OID%202012%20AWMP%20-
%20OID%20Web%20Version.pdf. Accessed: July 10, 2015.
San Francisco Public Utilities Commission (SFPUC). 2013. Comprehensive Annual Financial Report for
the Fiscal Year Ending June 30, 2013. San Francisco, CA. Available:
http://www.sfwater.org/index.aspx?page-346. Accessed: March 19, 2014.
———. 2015. Groundwater. San Francisco Water Power Sewer, Services of the San Francisco Public
Utilities Commission. Available: http://sfwater.org/index.aspx?page=184. Accessed: December
1.
———. 2016. 2015 Urban Water Management Plan for the City and County of San Francisco Public
Review Draft. Available: http://sfwater.org/
modules/showdocument.aspx?documentid=1055. Accessed: June 2.
San Joaquin County. 1992. General Plan. Available: http://www.sjgov.org/commdev/cgi-bin/
cdyn.exe/handouts-planning_GP-V1-VI?grp=handouts-planning&obj=GP-V1-VI. Accessed: July
20, 2012.
San Joaquin County Department of Public Works. 2004. Eastern San Joaquin Groundwater Basin
Groundwater Management Plan. September. Prepared for Northeastern San Joaquin County

State Water Resources Control Board California Environmental Protection Agency
Service Providers
Evaluation of San Joaquin River Flow and Southern Delta Water Quality Objectives and Implementation
13-101 September 2016
ICF 00427.11
Groundwater Banking Authority. Available: http://www.gbawater.org/_pdf/
Groundwater%20Management%20Plan%20Final.pdf. Accessed: November 2012.
Smedley, P. L., and D. G. Kinniburgh. 2002. A review of the source, behavior and distribution of
arsenic in natural waters. Applied Geochemistry 17(5):517–568.
South San Joaquin Irrigation District (SSJID). 2011. South San Joaquin Irrigation District Urban Water
Management Plan. August. Prepared by Provost & Prichard Consulting Group and South San
Joaquin Irrigation District. Prepared for South San Joaquin Irrigation District.
———. 2012. 2012 Agricultural Water Management Plan. Prepared by Davids Engineering, Inc.
December 2012. Available: http://www.ssjid.com/
assets/pdf/2012-Ag-Water-Management-Plan.pdf. Accessed: July 10, 2015.
Stanislaus County. 1995. The 1994 Stanislaus County General Plan. Chapter 1, Land Use Element.
Available: http://www.stancounty.com/planning/pl/gp/gp-chapter1.pdf. Accessed: July 20,
2012.
State Water Resources Control Board (State Water Board). 2006. Water Quality Control Plan for the San Francisco Bay/Sacramento San Joaquin Delta Estuary. Available: http://www.waterboards.ca.gov/waterrights/water_issues/programs/bay_delta/wq_control_plans/2006wqcp/docs/2006_plan_final.pdf. Accessed: July 7, 2009.
———. 2011. 2010 Integrated Report (Clean Water Act Section 303(d) List/305(b) Report). Available:
http://www.waterboards.ca.gov/water_issues/programs/tmdl/integrated2010.shtml.
Accessed: May 20, 2015.
———. 2013a. Communities that Rely on a Contaminated Groundwater Source for Drinking Water,
Report to the Legislature. January. Available:
http://www.waterboards.ca.gov/gama/ab2222/docs/ab2222.pdf. Accessed: June 5, 2016.
———. 2013b. Recommendations Addressing Nitrate in Groundwater, Report to the Legislature.
February. Available:
http://www.waterboards.ca.gov/water_issues/programs/nitrate_project/docs/nitrate_rpt.pdf.
Accessed: June 5, 2016.
———. 2016a. Electronic Water Rights Information Management System (eWRIMS). Available:
https://ciwqs.waterboards.ca.gov/ciwqs/ewrims/EWPublicTerms.jsp. Accessed: April 25.
———. 2016b. Electronic Annual Reporting. Division of Drinking Water. Available:
http://drinc.ca.gov/dnn/Applications/DWPRepository.aspx. Accessed: August 2016.
Stockton East Water District. 2014. Stockton East Water District Water Management Plan. January.
Available: http://www.water.ca.gov/wateruseefficiency/sb7/docs/2014/plans/
Stockton-Eeast_WD_WMP-Final_012014.pdf. Accessed: May 16, 2015.
———. 2016. Stockton East Water District Ag-Water Report for Fall/Winter 2015/2016. Available:
http://www.sewd.net/news.htm. Accessed: March 6.
Tracy Press. 2011. Working toward cleaner water. December 23. Newspaper article written by J.
Danoy.

State Water Resources Control Board California Environmental Protection Agency
Service Providers
Evaluation of San Joaquin River Flow and Southern Delta Water Quality Objectives and Implementation
13-102 September 2016
ICF 00427.11
Turlock Groundwater Basin Association (TGBA). 2008. Turlock Groundwater Basin Draft
Groundwater Management Plan. January 17. Prepared by Turlock Groundwater Basin
Association. Prepared for City of Modesto.
Turlock Irrigation District (TID). 2012. Turlock Irrigation District 2012 Agricultural Water
Management Plan. Available: http://www.tid.org/sites/default/files/documents/
tidweb_content/Final-TID-AWMP.pdf. Accessed: July 30, 2014.
U.S. Census Bureau. 2010. 2010 Census dataset (SF1). Available: http://factfinder.census.gov.
Accessed: January 8, 2016.
U.S. Geologic Survey (USGS) and State Water Resources Control Board (State Water Board). 2010a.
Groundwater Quality in the Northern San Joaquin Valley, California. Available:
http://pubs.usgs.gov/fs/2010/3079/pdf/fs20103079.pdf. Accessed: June 2016.
———. 2010b. Groundwater Quality in the Central Eastside San Joaquin Valley, California. Available:
http://pubs.usgs.gov/fs/2010/3001/pdf/fs20103001.pdf. Accessed: June 2016.
13.6.2 Personal Communications
Bayley, Steve. Deputy Director. City of Tracy Department of Public Works, Tracy, CA. July 22, 2010—
email correspondence with Gayleen Perreira, NPDES case handler at the Central Valley Water
Board.
Chauhan, Kassy. Merced District Engineer. State Water Resources Control Board, Division of
Drinking Water, Merced, CA. December 7, 2015 —email re: municipal groundwater well
information.
Harder, Kathleen. Water Resource Control Engineer. Central Valley Regional Water Quality Control
Board (Central Valley Water Board), Rancho Cordova, CA. December 28, 2011—email re:
Salinity Requirements for NPDES Dischargers.
Marshall, Jim. Senior Water Resources Control Engineer. Central Valley Regional Water Quality
Control Board (Central Valley Water Board), CA. August 15, 2012a—comments re: draft of
Chapter 13 Service Providers.
Marshall, Jim. Senior Water Resources Control Engineer. Central Valley Regional Water Quality
Control Board (Central Valley Water Board), CA. January 4, 2012b—call re: Salinity
Requirements for NPDES Dischargers.
Martin, Jim. Central Valley Regional Water Quality Control Board (Central Valley Water Board),
Rancho Cordova, CA. December 29, 2011—email re: Salinity Requirements for NPDES
Dischargers.
Sahota, Bhupinder S. Stockton District Engineer. State Water Resources Control Board, Division of
Drinking Water, Stockton, CA. December 18, 2015 —email re: information request on active
groundwater well information for SEWD.
Verma, Paul. Senior Civil Engineer. City of Tracy Department of Public Works, Engineering
Department. Tracy, CA. June 11, 2015—phone call re: status of Tracy WWTP desalination plant.

State Water Resources Control Board California Environmental Protection Agency
Service Providers
Evaluation of San Joaquin River Flow and Southern Delta Water Quality Objectives and Implementation
13-103 September 2016
ICF 00427.11