Embed Size (px)
Citation preview

Ann. N.Y. Acad. Sci. ISSN 0077-8923
ANNALS OF THE NEW YORK ACADEMY OF SCIENCESIssue: New York City Panel on Climate Change 2010 Report
Chapter 3: Climate observations and projections
Lead authorsRadley Horton,1 Vivien Gornitz,1 and Malcolm Bowman2
1Columbia University Center for Climate Systems Research, New York, New York. 2School of Marine and AtmosphericSciences, Stony Brook University, Stony Brook, New York
Contributing authorReginald Blake3
3Physics Department, New York City College of Technology, Brooklyn, New York
Address for correspondence: Radley Horton, Associate Research Scientist, NASA Goddard Institute for Space Studies, 2880Broadway, New York, NY 10025. Voice: 212-678-5640. [email protected]
3.1 The climate system and the impact of humanactivities3.2 Observed climate3.3 Future projections3.4 Conclusions and recommendations
Introduction
Climate change is extremely likely (see Fig. 3.1 fordefinitions of uncertainty terms and Box 3.1 for ad-ditional definitions) to bring warmer temperaturesto New York City and the surrounding region (seeCRI, Appendix A, for further information on allthe material presented in this chapter). Heat wavesare very likely to become more frequent, intense,and longer in duration. Total annual precipitationwill more likely than not increase, and brief, intenserainstorms are also likely to increase, with concomi-tant flooding. Toward the end of the 21st century,it is more likely than not that droughts will becomemore severe. Additionally, rising sea levels are ex-tremely likely, and are very likely to lead to morefrequent and damaging flooding related to coastalstorm events in the future.
The treatment of likelihood related to the NewYork City Panel on Climate Change (NPCC) cli-mate change projections is similar to that developedby the Intergovernmental Panel on Climate ChangeFourth Assessment Report (IPCC AR4, 2007), withsix likelihood categories. The assignment of climate
hazards to these categories is based on global cli-mate simulations, published literature, and expertjudgment.
3.1 The climate system and the impactof human activities
This section describes the climate system and howhuman activities are leading to climate change.Terminology used throughout the chapter is alsodefined.
The global climate system is comprised of the at-mosphere, biosphere, hydrosphere, cryosphere, andlithosphere as shown in Figure 3.2. The componentsof the climate system interact over a wide range ofspatial and temporal scales.
The earth’s climate is inextricably linked to theenergy received from the sun. This incoming so-lar radiation is partly absorbed, partly scattered,and partly reflected by gases in the atmosphere, byaerosols, and by clouds. The oceans, lithosphere, andbiosphere absorb most of the radiation that reachesthe surface.1 Some of the absorbed energy is used toheat the earth. The earth re-emits some of the energyit receives from the sun in the form of “longwave,”or infrared radiation.
Under equilibrium conditions, there is an en-ergy balance between the outgoing terrestrial, long-wave radiation and the incoming solar radia-tion. Without the presence of naturally occurring
Ann. N.Y. Acad. Sci. 1196 (2010) 41–62 c© 2010 New York Academy of Sciences. 41

Climate change adaptation in New York City Ch 3. Climate observations and projections
Figure 3.1. Probability of occurrence.Source: IPCC WG1 2007.
greenhouse gases (GHGs) in the atmosphere (i.e.,mostly water vapor, but some carbon dioxide), thisbalance would be achieved at temperatures of ap-proximately −33◦F (−18◦C). An atmosphere con-taining GHGs, however, is relatively transparentto solar radiation, but relatively opaque to terres-trial radiation. Such a planet achieves radiative bal-ance at a higher surface and lower atmospherictemperature than a planet totally without GHGs.The increase in GHG concentrations due to hu-man activities, such as fossil fuel combustion, ce-ment making, deforestation, and land-use changes,
has led to a radiative imbalance and rising surfacetemperature.
In its 2007 Fourth Assessment Report, the IPCCdocumented a range of observed climate trends.Global surface temperature has increased about1.3◦F (0.7◦C) over the past century. During thattime, both hemispheres have experienced decreasesin net snow and ice cover, and global sea levelhas risen by approximately 0.7 inches (1.8 cm) perdecade over the past century. More recently, theglobal sea level rise rate has accelerated to approxi-mately 1.2 inches (3.1 cm) per decade. In terms ofextreme events, droughts have grown more frequentand longer in duration, and over most land areas in-tense precipitation events have become more com-mon. Hot days and heat waves have become morefrequent and intense, and cold events have decreasedin frequency.
The IPCC AR4 states that there is a greaterthan 90% chance that warming temperatures areprimarily due to human activities. Atmosphericconcentrations of the major GHG carbon dioxide(CO2) are now more than one-third higher than inpre-industrial times. Concentrations of other im-portant GHGs, including methane (CH4) andnitrous oxide (N2O), have increased by more than
Figure 3.2. The global climate system. Adapted from IPCC WG1 2007.
42 Ann. N.Y. Acad. Sci. 1196 (2010) 41–62 c© 2010 New York Academy of Sciences.

Ch 3. Climate observations and projections Climate change adaptation in New York City
Figure 3.3. 20th century observations and GCM results. Adapted from IPCC WG1 2007 and United States GlobalChange Research Program.
100% and close to 20%, respectively, since pre-industrial times. The warming that occurred overthe 20th century cannot be reproduced by globalclimate models (GCMs) unless human contribu-tions to historical GHG concentrations are takeninto account (Fig. 3.3). Further increases in GHGconcentrations are extremely likely to lead to accel-erated temperature increases.
According to the IPCC, global average tempera-ture over the 21st century is expected to increase bybetween 3.2 and 7.2◦F (1.8–4.0◦C). The large rangeis due to uncertainties both in future GHG con-centrations and the sensitivity2 of the climate sys-tem to GHG emissions. Globally averaged tempera-
Figure 3.4. Observed CO2 concentrations through 2003,and future CO2 concentrations in the A2, A1B, and B1scenarios (2004–2100). Adapted from IPCC AR4.
ture projections mask a range of regional variations.The greatest warming is expected over land and inthe high latitudes of the northern hemisphere wherelocal warming may exceed 15◦F (8.3◦C). In these re-gions, winter warming is expected to be greatest.Precipitation, mostly as rain, is expected to increasein the high latitudes and decrease in the subtropi-cal latitudes in both hemispheres. Hot extremes arevery likely to increase, and cold extremes are verylikely to decrease. Snow cover and sea ice extent arevery likely to decrease this century. As CO2 con-tinues to be absorbed by the oceans, both seawaterpH and availability of carbonate ions will be furtherreduced.
Box 3.1 Definitions and terms
The NPCC uses observed local climate and cli-mate model simulations to develop regional cli-mate change projections for the New York Cityregion. Definitions and basic descriptions are pro-vided below.
ScenariosClimate change scenarios provide coherent and
plausible descriptions of possible future conditions(Parson et al., 2007). The IPCC Special Reporton Emissions Scenarios (SRES) (IPCC, 2000) pro-vides multiple future “storylines,” each with differ-ent assumptions about population and economicgrowth, and technological and land-use changes,
Ann. N.Y. Acad. Sci. 1196 (2010) 41–62 c© 2010 New York Academy of Sciences. 43

Climate change adaptation in New York City Ch 3. Climate observations and projections
that lead to GHG emissions and atmospheric con-centration trajectories. These GHG profiles arethen used as input drivers in climate model simu-lations.
Three GHG emissions scenarios that were usedas drivers for many GCMs and available from theWorld Climate Research Program (WCRP) and theProgram for Climate Model Diagnosis and Inter-comparison (PCMDI) (see section 3.3 for furtherdescription) were selected for use by the NPCC(Fig. 3.4). The A2, A1B, and B1 emissions scenar-ios provide GHG concentrations determined byparticular developmental storylines. While it is un-likely than any single emissions scenario or GCMprojection will occur exactly as described, a suiteof GCM simulations and GHG emissions profilesprovides a range of possible climate outcomes thatreflects the current level of expert knowledge. Thisapproach to climate change scenarios was devel-oped by the IPCC and provided the basis for its2007 Assessment.
Local climate change informationOn the basis of a selection of these three scena-
rios of GHG emissions and 16 (seven for sea levelrise) GCM simulations, local climate change infor-mation is developed for the key climate variables—temperature, precipitation, and sea level and as-sociated extreme events. These results and projec-tions reflect a range of potential outcomes for NewYork City and the surrounding region.
The NPCC uses this approach to make regionaltemperature, precipitation, and sea level projec-tions. For some variables, climate models do notprovide results, the model results are too uncer-tain, or there is not a long enough history of modelvariable evaluation to justify a quantitative model-based projection. For these variables, a qualitativeprojection of the likely direction of change is pro-vided on the basis of expert judgment. Both thequantitative and qualitative approaches follow themethods used in the IPCC AR4 report.
Climate risk factorsClimate risk factors are the subset of climate haz-
ards that are of most consequence for New YorkCity’s infrastructure. They are selected on the basisof interactions with stakeholders who are respon-sible for managing the critical infrastructure of theregion and expert judgment using the quantitativeand qualitative climate-hazard information. Theclimate risk factors are then used by the stakehold-
ers to follow the Adaptation Assessment Guide-book (AAG) to develop climate change AdaptationPlans (see AAG, Appendix B).
The “risk factors” identified in this report are notcomplete statements of “risk,” traditionally definedas “magnitude of consequence times likelihood”(Chapter 2). Rather, the risk factors are generalizedclimate variables prioritized by considerations oftheir potential importance for the region’s infras-tructure. Qualitative statements of the likelihoodof occurrence of these tailored climate risk factorsare presented as well as potential impacts and con-sequences of the climate risk factors. Figure 3.5summarizes the process of translating global cli-mate information into localized risk factors.
Sources of uncertaintyClimate change projections are characterized by
large uncertainties. At the global scale, these uncer-tainties can be divided into two main categories:
• Uncertainties in future GHG concentrationsand other climate drivers that alter the globalenergy balance, such as aerosols and land-use changes. These are uncertain because theydepend on future population and economicgrowth, as well as technological innovationand technology sharing; and
• Uncertainties in how sensitive the climate sys-tem will be to changes in GHG concentrationsand other climate drivers, and how rapidly theclimate will respond.
When planning adaptations for local and re-gional scales, uncertainties are further increasedfor two additional reasons:
• Climate variability (which is mostly unpre-dictable in the midlatitudes) can be especiallylarge over small regions, partially maskingmore uniform effects of climate change; and
• Local physical processes that operate at finescales, such as land/sea breezes and urban heatisland effects, are not captured by the GCMsused to make projections.
By providing projections for the region that spana range of GCMs and GHG emissions scenarios,these uncertainties may be reduced, but they arenot eliminated. Presenting climate projections asaverage changes over 30-year time slices, ratherthan absolute climate values, reduces the local- andregional-scale uncertainties, although it does notaddress the possibility that local climate processesmay change with time.
44 Ann. N.Y. Acad. Sci. 1196 (2010) 41–62 c© 2010 New York Academy of Sciences.

Ch 3. Climate observations and projections Climate change adaptation in New York City
Figure 3.5. Framework for translating global information into local climate risk factors.
3.2 Observed climate
This section describes the New York City regionalclimate, including historical trends and variabilityof key climate variables.
Temperature
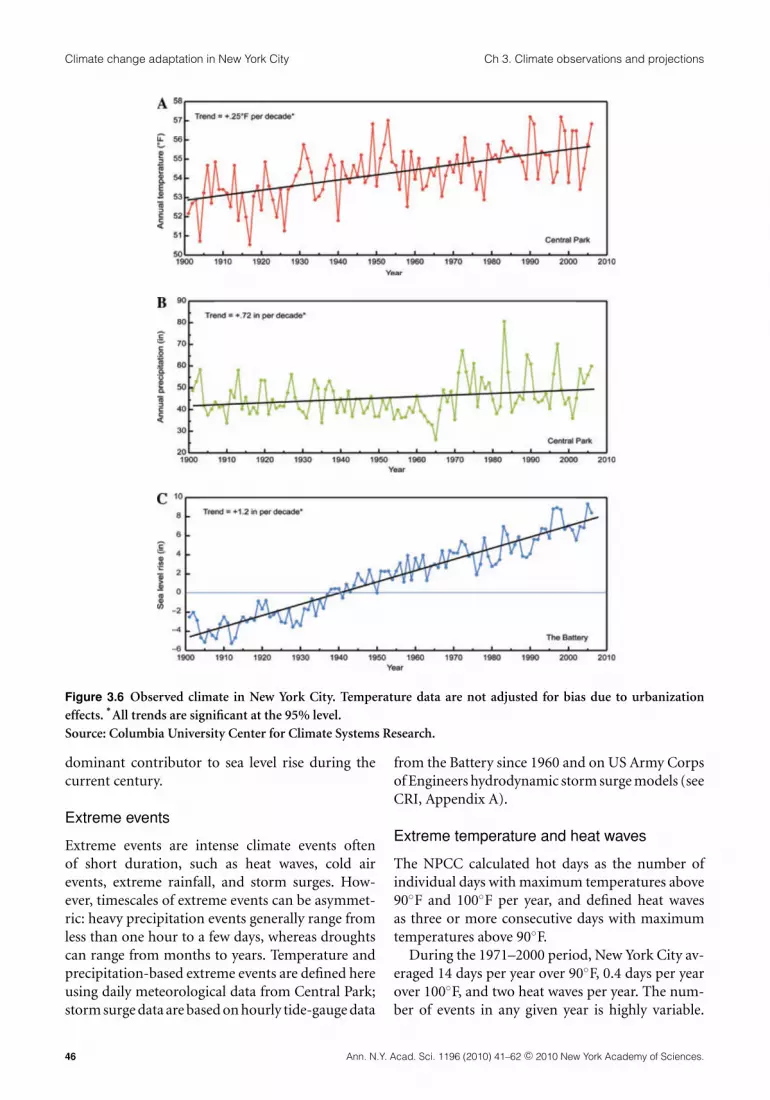
New York City has a temperate, continental climate,with hot and humid summers and cold winters.Records show an annual average air temperaturefrom 1971–2000 of approximately 55◦F (12.8 ◦C).The annual mean temperature in New York City hasrisen 2.5◦F (1.4 ◦C) since 1900 (Fig. 3.6A), althoughthe rate has varied substantially. For example, thefirst and last 30-year periods were characterized bywarming, while the middle segment, from 1930 tothe late 1970s, was not. The absence of a warmingtrend during the middle of the 20th century mayhave been due in part to the cooling effects of largeregional emissions of sulfate aerosols associated withindustrial activity. However, natural variability canalso explain local temperature variations at multi-decadal timescales.
The temperature trends in the New York Cityregion over the past century are broadly similarto trends in the northeast United States. In par-ticular, most of the Northeast has experienced atrend toward higher temperatures, especially in re-cent decades.
Precipitation
The city’s climate is characterized by substantial pre-cipitation in all months of the year. Thirty-year an-nual average precipitation from 1971–2000 rangedbetween 43 and 50 inches (1090–1270 mm) de-pending on the location within the City. As meanannual precipitation levels have increased over thecourse of the past century, inter-annual variabilityof precipitation has also become more pronounced
(Fig. 3.6B). For the 20th century, the rate of increasefor precipitation in the New York City area was0.72 in (18 mm) per decade.
Precipitation in the Northeast also increasedin the 20th century, although the trend reversedslightly in the last decades of the 20th century.
Sea level rise
Prior to the Industrial Revolution’s onset in the 18thcentury, sea level had been rising along the EastCoast of the United States at rates of 0.34–0.43 inches(0.86–1.1 cm) per decade, mostly due to land sub-sidence. The land subsidence in the New York Cityarea is primarily the result of ongoing adjustmentsof the earth’s crust to the removal of the ice sheets, aprocess that began around 20,000 years ago. Whileareas once under ice sheets to the north and westof the New York metropolitan region continue torise in response to the removal of the weight ofthe ice sheets, New York City and the surroundingregion is sinking because it resides in a peripheralzone to the south and east. Within the past 100 to150 years, as global temperatures have increased, re-gional sea level has been rising more rapidly thanover the last thousand years (Gehrels et al., 2005;Donnelly et al., 2004; Holgate and Woodworth,2004).
Currently, rates of sea level rise in New York Cityrange between 0.86 and 1.5 inches (2.2–3.8 cm) perdecade as measured by tide gauges, with a long-term rate since 19003 averaging 1.2 inches (3.0 cm)per decade, as seen in Figure 3.6C. The sea levelrise rates shown in Figure 3.6C include both theeffects of recent global warming and the residualcrustal adjustments to the removal of the ice sheets.Most of the observed current climate-related rise insea level over the past century can be attributed tothe thermal expansion of the oceans as they warm,although melting of land-based ice may become the
Ann. N.Y. Acad. Sci. 1196 (2010) 41–62 c© 2010 New York Academy of Sciences. 45
Climate change adaptation in New York City Ch 3. Climate observations and projections
Figure 3.6 Observed climate in New York City. Temperature data are not adjusted for bias due to urbanizationeffects.
∗All trends are significant at the 95% level.
Source: Columbia University Center for Climate Systems Research.
dominant contributor to sea level rise during thecurrent century.
Extreme events
Extreme events are intense climate events oftenof short duration, such as heat waves, cold airevents, extreme rainfall, and storm surges. How-ever, timescales of extreme events can be asymmet-ric: heavy precipitation events generally range fromless than one hour to a few days, whereas droughtscan range from months to years. Temperature andprecipitation-based extreme events are defined hereusing daily meteorological data from Central Park;storm surge data are based on hourly tide-gauge data
from the Battery since 1960 and on US Army Corpsof Engineers hydrodynamic storm surge models (seeCRI, Appendix A).
Extreme temperature and heat waves
The NPCC calculated hot days as the number ofindividual days with maximum temperatures above90◦F and 100◦F per year, and defined heat wavesas three or more consecutive days with maximumtemperatures above 90◦F.
During the 1971–2000 period, New York City av-eraged 14 days per year over 90◦F, 0.4 days per yearover 100◦F, and two heat waves per year. The num-ber of events in any given year is highly variable.
46 Ann. N.Y. Acad. Sci. 1196 (2010) 41–62 c© 2010 New York Academy of Sciences.

Ch 3. Climate observations and projections Climate change adaptation in New York City
For example, in 2002 New York City experiencedtemperatures above 90◦F on 33 different days. In2004, temperatures above 90◦F occurred only twice.Although the post-1900 trends for these heat eventscannot be distinguished statistically from randomvariability, 7 of the 10 years with the most days over90 degrees in the 107-year record have occurredsince 1980.
Extreme precipitation
Between 1971 and 2000, New York City averaged13 days per year with over 1 inch of rain, 3 daysper year with over 2 inches of rain, and 0.3 daysper year with more than 4 inches of rain. As withextreme temperatures, extreme precipitation eventsvary widely from year to year. Since extreme precip-itation events tend to occur relatively infrequently,long time series are needed to identify trends; thusthere is a relatively large “burden of proof” requiredto distinguish a meaningful trend from randomvariability. The 3 years with the most occurrencesof days per year with greater than 2 inches of rain-fall in the region have all occurred during the lastthree decades, roughly coinciding with the periodof increased inter-annual variability.
Coastal storms and storm surge
The two types of storms with the largest influenceon the region are hurricanes and nor’easters. Hur-ricanes strike New York City and the surroundingregion infrequently, but can produce large stormsurges and wind damage. They generally occur be-tween July and October, and are usually of shortduration, as they tend to move rapidly by the timethey reach midlatitude locations, such as New York.
Nor’easters, in contrast, occur more frequentlythan hurricanes in the region and tend to take placeduring cooler parts of the year. While nor’eastersgenerally produce smaller surges and weaker windsthan hurricanes, their impacts can nevertheless belarge. They often remain in the region for multipledays, bringing an extended period of high winds andhigh water that often coincides with high tides.
While sea level rise is a gradual process, stormsurges are short-term, high-water events superim-posed onto mean sea height. In New York City andthe surrounding region, both nor’easters and hurri-canes cause storm surges. The surges are primarilydue to wind-induced piling up of water along the
shore. The strong winds associated with nor’eastersand hurricanes can also generate large waves thatexacerbate coastal flooding.
A significant fraction of New York City and thesurrounding region lies less than 10 feet (3 meters)above mean sea level, and infrastructure in theseareas is vulnerable to flooding during major stormevents, both from coastal storm surges and inland(rainfall-induced) flooding. The current 1-in-100year coastal flood, the storm with approximately a1% chance of occurring in a given year, producesapproximately an 8.6-foot (2.6 meters) surge at theBattery in lower Manhattan.4
Documenting historical coastal flood events ischallenging. More complete and accurate documen-tation of recent events may make it appear that dam-aging storms are increasing, even though they maynot be (CRI, Appendix A). Although no trend in ob-served storms is evident in the region, characterizinghistorical storms is a critical step in understandingfuture storms and their impacts. The CRI workbook(Appendix A) presents a description of key hurri-cane events in the New York City region over thepast two centuries.
3.3 Future projections
Building on historical climate information, this sec-tion presents climate projection methods and pro-jections for the 21st century for New York Cityand the surrounding region. Climate model-basedquantitative projections are given for temperature,precipitation, sea level rise, and extreme events.This section also describes the potential for changesin other variables in a more qualitative way, be-cause quantitative projections are either unavail-able or considered less reliable. These variables in-clude heat indices, frozen precipitation (snow), in-tense precipitation of short duration, lightning, andstorms (hurricanes, nor’easters, and associated windevents).
Creating regional projections from globalclimate models
The projected changes in temperature and preci-pitation through time (for example, three degreesof warming by the 2050s) are New York City regionspecific. The regional projections are based on GCMoutput from the single land-based model gridboxcovering New York City and its surrounding area,
Ann. N.Y. Acad. Sci. 1196 (2010) 41–62 c© 2010 New York Academy of Sciences. 47

Climate change adaptation in New York City Ch 3. Climate observations and projections
Figure 3.7 Annual temperature changes in the 2080s,relative to the 1971–2000 base period. Source: ColumbiaUniversity Center for Climate Systems Research.
which are then applied to observed data from theregion. The precise coordinates of the gridbox differsince each GCM has a different spatial resolution.The resolutions range from as fine as ∼75 × ∼100miles to as coarse as ∼250 ×∼275 miles, with an av-erage resolution of approximately 160 × 190 miles.
In general, the projections apply roughly out to∼100 miles from New York City. The applicabil-ity of the projections decreases with distance fromNew York City, and this decrease in applicability ismore pronounced for extreme events than for meanannual changes.5
Comparisons to results from nearby land-basedgrid boxes reveal similar climate changes for neigh-boring areas, as shown in Figures 3.7 and 3.8 (seeBox 3.2 for discussion). By applying the projectedchanges from the relevant gridbox to observed data,the projections become location specific. For exam-
Figure 3.8 Annual precipitation changes in the 2080s,relative to the 1971–2000 base period. Source: ColumbiaUniversity Center for Climate Systems Research.
ple, although Poughkeepsie’s projected change intemperature through time is similar to New YorkCity’s, the number of current and projected daysper year with temperatures above 90◦F is lower be-cause it is cooler in the present climate. The spatialvariation in baseline climate is much larger than thespatial variation of projected climate changes.
Box 3.2 New York City temperatureand precipitation projections in abroader geographical context
The maps in Figures 3.7 and 3.8 reveal that themean changes described for New York City are con-sistent over the entire northeastern United States.They place the mean temperature and precipita-tion projections for the New York City region in
48 Ann. N.Y. Acad. Sci. 1196 (2010) 41–62 c© 2010 New York Academy of Sciences.

Ch 3. Climate observations and projections Climate change adaptation in New York City
a broader geographical perspective. Shown are themean changes in temperature and precipitation forthe A1B scenario in the 2080s relative to 1971–2000averaged across 16 GCMs. The spatial pattern issimilar for the two other emissions scenarios. Thespatial consistency of the projected changes overthe broader area lends support to the New YorkCity results.
While the overall patterns are consistent acrossthe northeastern United States, there are differ-ences. Ocean regions are expected to warm less thaninterior regions. Since New York is a coastal city,it may experience slightly less warming (∼0.5◦F)than more inland regions by the 2080s. Gener-ally speaking, more southerly latitudes than NewYork City’s are expected to experience less warm-ing, while more northerly latitudes are expected toexperience more warming.
Precipitation projections are very consistentspatially across the northeastern United States.Near the Canadian border, precipitation is pro-jected to increase somewhat more than in theNortheast as a whole. There is also an ocean regionof projected slight decrease in precipitation ap-proximately 200 miles to the southeast. The prox-imity of this region to New York City indicates thatthe possibility of slightly decreased mean precipi-tation for New York City, although less likely thannot, cannot be ruled out.
Time slices
Although it is not possible to predict the tempera-ture, precipitation, or sea level for a particular day,month, or even specific year because of fundamentaluncertainties and natural variability in the chang-ing climate system, GCMs are a valuable tool forprojecting the likely range of changes over decadalto multidecadal time periods (see Box 3.3 for a de-scription of GCMs). These projections, known astime slices, are expressed relative to the baseline pe-riod, 1971–2000 (2000–04 for sea level rise). Thetime slices are centered around a given decade, forexample, the 2050s time slice refers to the periodfrom 2040–69.6 Thirty-year time slices (10-year forsea level rise) are used to provide an indication of theclimate “normals” for those decades; by averagingover this period, much of the random year-to-yearvariability, or “noise,” is cancelled out, while thelong-term influence of increasing greenhouse gases,or “signal,” remains. Thirty-year averaging is a stan-
dard used by meteorological and climate scientists(Guttman, 1989; WMO, 1989). This method can beused to estimate the climate change signal on bothmean annual values and the frequency and intensityof extreme events.
Box 3.3 Global climate models
GCMs are mathematical representations of cli-mate system interactions through time. Because theearth is a complicated system, fluxes of heat, mo-mentum, and moisture, as well as feedbacks amongthe land, ocean, and atmosphere and other compo-nents of the earth system must be considered. Theseprocesses are simulated by means of detailed com-puter programs that solve sets of coupled partialdifferential equations based on the general prin-ciples of conservation of mass, momentum, andenergy.
As shown in the Figure 3.9, GCMs divide theearth’s surface into a series of gridboxes. For a pointwithin each gridbox, equations are solved to cal-culate elements of the climate system, for example,the motion of the air, heat transfer, radiation, mois-ture content, and surface hydrology (precipitation,evaporation, snow melt, and runoff).
Climate models are sophisticated enough tohandle the interactions of the ocean, the atmo-sphere, the land, hydrologic and cryospheric pro-cesses, terrestrial and oceanic carbon cycles, andatmospheric chemistry. Clouds and water vaporare included as well. While the mathematical rep-resentation of climate processes still need refine-ment and improvement, these model simulationsnow skillfully capture many aspects of the currentclimate and its variability.
For example, recent integrated climate modelsimulations, conducted for the IPCC Fourth As-sessment Report (2007), were run at higher spa-tial resolution than earlier models and, due toimproved physical understanding, incorporatedmore accurately complex physical processes, suchas cloud formation and destruction. These modelsare also able to reproduce some of the key climatecharacteristics of paleoclimates that were far differ-ent than today’s climate, such as the relatively warmmid-Holocene (approximately 6000 years ago) andthe relatively cool last glacial maximum (approx-imately 21,000 years ago). Skillful simulation of arange of past climate periods helps to build confi-dence in the general realism of future simulations.
Ann. N.Y. Acad. Sci. 1196 (2010) 41–62 c© 2010 New York Academy of Sciences. 49

Climate change adaptation in New York City Ch 3. Climate observations and projections
Figure 3.9. GCM processes and gridboxes. Adapted from NOAA.
The large number of available GCMs makes pos-sible model-based probabilistic assessment of fu-ture climate projections across a range of climatesensitivities (defined as the mean equilibrium tem-perature response of a GCM to doubling carbondioxide (CO2), relative to pre-industrial levels).
Although GCMs are the primary tool used forlong-range climate prediction, they have limita-tions. They simplify some complex physical pro-cesses, such as convective rainfall. In addition, thespatial and temporal scales of some climate pro-cesses, such as thunderstorms, are finer than theresolutions of GCMs. Further, they do not fully in-clude other relevant local climate forcings, includ-ing black carbon, land-cover changes and urbanheat island effects, and solar variability. For theseand other reasons, it is possible that the regionalclimate of New York City may change in ways notcaptured by the models, leading to temperature,precipitation, and sea level rise changes outside themodel-based range presented.7
Model-based probability
The NPCC used IPCC-based methods (IPCC AR4)to generate model-based probabilities for temper-
ature, precipitation, and sea level rise from GCMsimulations based on three GHG emission scenar-ios (A2, A1B, and B1; see Fig. 3.4, and CRI for a de-scription of each scenario). Simulation results from16 GCMs have been used for the temperature andprecipitation projections, and results based on sevenGCMs are used to project sea level rise.
The combination of 16 GCMs and three emis-sions scenarios produces a 48 (16 × 3)-membermatrix of outputs for temperature and precipita-tion. For each scenario time period and variable,the results constitute a “model-based” probabilityfunction. The results for the future time periods arecompared to the model results for the 1971–20008
baseline period. Mean temperature change projec-tions are calculated as the difference between eachmodel’s future simulation and the same model’sbaseline simulation, whereas mean precipitation isbased on the ratio of a given model’s future precip-itation to the same model’s baseline precipitation(expressed as a percentage change). Sea level risemethods are more complex, since sea level rise isnot a direct output of most GCMs.
The model-based frequency distributions rep-resent subsets of the possible future range of the
50 Ann. N.Y. Acad. Sci. 1196 (2010) 41–62 c© 2010 New York Academy of Sciences.

Ch 3. Climate observations and projections Climate change adaptation in New York City
climate variables. Neither the global climate modelsnor the emissions scenarios fully sample the rangeof possible climate change outcomes. Actual resultscould fall outside the range simulated by the mod-els. This approach is based on the assumption, usedby the IPCC, that each GCM and emission scenariois equally valid; this may not be true. Despite thesecaveats, the model-based quantitative approach pro-vides valuable information for many projected cli-mate variables by providing the range and centraltendency of possible outcomes based on the leadingglobal climate models and a set of emissions sce-narios, both developed by the worldwide scientificcommunity.
Sea level rise methods
For sea level rise, the NPCC produced two sets ofprojections using a combination of approaches. Thefirst is similar to the IPCC model-based methodused for temperature and precipitation describedabove, with seven GCMs contributing available re-sults. The projections include both global and localcomponents. The global components include ther-mal expansion and meltwater from glaciers, ice caps,and ice sheets; and the local components include lo-cal land subsidence and local water surface elevation(CRI, Appendix A).
The IPCC estimates may be too low in largepart because they do not fully consider the po-tential for land-based ice sheets to melt owing todynamic (motion-related) processes (Horton et al.,2008). Therefore, the NPCC also developed an al-ternative “rapid ice-melt” approach for regionalsea level rise projections because of extensive dis-cussion within the scientific community of the pos-sibility that the GCMs used in the IPCC AR4 sealevel rise projections may underestimate the rangeof possible increases. The NPCC “rapid ice-melt”scenarios, therefore, are based on observed trendsin melting of the West Antarctic (Velicogna andWahr, 2006) and Greenland ice sheets (Rignot andKanagaratnam, 2006) and paleoclimate studies ofice-melt rates during the most recent postglacialperiod (Fairbanks, 1989). Starting around 20,000years ago, global sea level rose 394 feet (120 me-ters) and reached near present-day levels around7000–8000 years ago. Paleoclimate data show thatthe average rate of sea level rise during this periodof about 10,000–12,000 years was on the order of
3.9–4.7 in (9.9–11.9 cm) per decade. This informa-tion is incorporated into the rapid ice-melt scenarioprojections. More information on the rapid ice-melt scenario and its integration with GCM-basedprojections, can be found in the CRI workbook(Appendix A).
Extreme events methods
Extremes of temperature and precipitation (withthe exception of drought) tend to have their largestimpacts at daily rather than monthly timescales. Be-cause monthly output from climate models is con-sidered more reliable than daily output, the NPCCused a hybrid technique to project how extremeevents may change in the future because of increas-ing greenhouse gas emissions. Simulated changes inmonthly temperature and precipitation were calcu-lated on the basis of the same methods describedfor the annual data; monthly changes through timefrom each of the 16 GCMs and three emissions sce-narios were then applied to the observed daily Cen-tral Park record from 1971–2000 to generate 48 timeseries of daily data.9 This is a simplified approach toprojections of extreme events, since it does not allowfor possible changes in the patterns of climate vari-ability through time. However, because changes invariability for most climate hazards are consideredhighly uncertain, the approach provides an initialevaluation of how extreme events may change inthe future. This level of information with appro-priate caveats can assist long-term planners as theybegin to prepare adaptation strategies to cope withfuture extreme events.
Projections for the New York City region
Future climate change for the New York City re-gion is projected for mean annual temperature andprecipitation, heat waves, intense downpours anddroughts, sea level rise, and coastal flooding events.
Mean annual changes
Regional projections show that higher temperaturesand sea level rise are extremely likely to occur in thecoming decades. For temperature and sea level rise,all simulations project continuing increases over thecentury, with the central range (defined as the val-ues occurring in 67% of the simulations) projectingmore rapid temperature and sea level rise than oc-curred over the 20th century.
Ann. N.Y. Acad. Sci. 1196 (2010) 41–62 c© 2010 New York Academy of Sciences. 51

Climate change adaptation in New York City Ch 3. Climate observations and projections
Figure 3.10. Combined observed (black line) and pro-jected temperature, precipitation and sea level rise. Pro-jected model changes through time are applied to the ob-served historical data. The three thick lines (green, red,and blue) show the average for each emissions scenarioacross the 16 GCMs (7 in the case of sea level). Shad-
Precipitation projections are less certain thantemperature projections, in part owing to large mul-tidecadal variability. Although most projections forthe region indicate at least small increases in pre-cipitation, some do not. Further, projections laterin the century relative to earlier in the century arecharacterized by larger uncertainty (i.e., the rangesof outcomes become larger through time), becauseof uncertainties in the climate system and the pos-sible pathways of the greenhouse gas emission sce-narios. This increasing uncertainty through time isnot unique to precipitation; it applies to all climatevariables.
Figure 3.10 presents observed data from 1900 tothe present and projected changes up to 2100 fortemperature, precipitation, and sea level rise. Thesegraphs provide context on how projected changesin the region compare to historical trends and long-term variability; the black line on the left-hand sideof the figures shows the historic values, and theright-hand side of the graphs shows the range ofprojections across the GCMs over the course of the21st century.
Table 3.1 shows the baseline climate and projectedchanges in temperature, precipitation, and sea levelrise relative to the baseline for the 2020s, 2050s, and2080s. In order to highlight where the various GCMand emissions scenario projections agree, the valuesin rows two through four indicate the central 67%range of the projected model-based changes; thehighest and lowest 16.7% of values are not shownon the table. The maximum and minimum valuesof the projections, as well as the entire distributions,are shown in CRI (Appendix A).
Future temperature
The projected future temperature changes shownin Figure 3.10A and Table 3.1 indicate that by the
←−−−−−−−−−−−−−−−−−−−−−−−−−−−−−−−−−−−−−−−ing shows the central range. The bottom and top lines,respectively, show each year’s minimum and maximumprojections across the suite of simulations. A ten-yearfilter has been applied to the observed data and modeloutput. The dotted area between 2003 and 2015 (2002–2015 for sea level rise) represents the period that is notcovered due to the smoothing procedure.Source: Center for Climate Systems Research, ColumbiaUniversity.
52 Ann. N.Y. Acad. Sci. 1196 (2010) 41–62 c© 2010 New York Academy of Sciences.

Ch 3. Climate observations and projections Climate change adaptation in New York City
Table 3.1. Baseline climate and mean annual changesa
Baseline
1971–2000 2020s 2050s 2080s
Air temperatureCentral rangeb 55◦ F + 1.5 to 3.0◦ F + 3.0 to 5.0◦ F + 4.0 to 7.5◦ F
PrecipitationCentral rangeb 46.5 in3 + 0 to 5% + 0 to 10% + 5 to 10%
Sea level risec
Central rangeb NA + 2 to 5 in + 7 to 12 in + 12 to 23 in
Rapid ice-melt scenariod NA ∼ 5 to 10 in ∼ 19 to 29 in ∼ 41 to 55 in
Source: Columbia University Center for Climate Systems Research.aBased on 16 GCMs (7 GCMs for sea level rise) and 3 emissions scenarios. Baseline is 1971–2000 for temperature andprecipitation and 2000–04 for sea level rise. Data from National Weather Service (NWS) and National Oceanic andAtmospheric Administration (NOAA). Temperature data are from Central Park; precipitation data are the mean of theCentral Park and La Guardia Airport values; and sea level data are from the Battery at the southern tip of Manhattan(the only location in New York City for which comprehensive historic sea level rise data are available).bCentral range = middle 67% of values from model-based probabilities; temperatures ranges are rounded to thenearest half-degree, precipitation to the nearest 5%, and sea level rise to the nearest inch.cThe model-based, sea level rise projections may represent the range of possible outcomes less completely than thetemperature and precipitation projections.d“Rapid ice-melt scenario” is based on acceleration of recent rates of ice melt in the Greenland and West Antarctic icesheets and paleoclimate studies.
2080s, New York City’s mean temperatures through-out a “typical” year may bear similarities to acity like Raleigh, North Carolina, or Norfolk, Vir-ginia, today, increasing by 1.5–3◦F by the 2020s,3–5◦F by the 2050s, and 4–7.5◦F by the 2080s. Thegrowing season could lengthen by approximately amonth, with summers becoming hotter and win-ters more mild. The climate model simulations sug-gest that the amount of warming may be relativelyconsistent for each of the four seasons. Because year-to-year temperature variability is larger in winterthan in summer, the summer changes may producerelatively larger deviations from what has been ex-perienced historically during individual years.
The three emissions scenarios project similartemperature in the near-term decades. Only begin-ning around the 2030s do the three emissions sce-narios produce temperature patterns that are dis-tinguishable from each other. This is due to both(1) the large inertia of the climate system—it takescenturies to millennia for the full climate effects ofgreenhouse gas emissions to be felt—and, (2) thefact that it takes time for the different emissions sce-narios to produce large differences in greenhousegas concentrations.
Future precipitation
Table 3.1 indicates that regional precipitation is pro-jected to increase by approximately 0–5 % by the2020s, 0–10 % by the 2050s, and 5–10 % by the2080s. While seasonal projections are less certainthan annual results, the climate models tend to dis-tribute much of this additional precipitation duringthe winter months. During the autumn months ofSeptember and October, in contrast, total precip-itation for the region is slightly reduced in manyclimate models. Monthly and seasonal breakdownsof both temperature and precipitation projectionsare included in CRI (Appendix A).
Figure 3.10B shows that precipitation is char-acterized by large historical variability, even with10-year smoothing. The GCMs project similar levelsof increased precipitation through the 2030s. Onlyfrom the 2040s on does the lower-concentration B1scenario produce smaller increases in precipitationthan the A1B and A2 scenarios. Even after the 2040s,there are occasional periods where B1 precipitationexceeds A2. At no point in the coming century arethe A2 and A1B scenario-based precipitation pro-jections consistently distinguishable.
Ann. N.Y. Acad. Sci. 1196 (2010) 41–62 c© 2010 New York Academy of Sciences. 53

Climate change adaptation in New York City Ch 3. Climate observations and projections
Future sea level rise
The GCM-based sea level rise projections inFigure 3.10C and Table 3.1 indicate that sea levelmay rise by 2–5 inches in the 2020s, 7–12 inches inthe 2050s, and 12–23 inches in the 2080s. Sea levelprojections for the three emissions scenarios agreethrough the 2040s. Figure 3.10C shows that the B1scenario produces smaller increases in sea level thanthe A1B and A2 scenarios beginning in the 2050s,and only around 2080 does the A2 scenario producelarger values than A1B. The separation of A2 fromA1B occurs approximately 10 years earlier for tem-perature than for sea level rise, in part reflecting thelarge inertia of the ocean and ice sheets relative tothe atmosphere.
Sea level rise projections for the New York City re-gion are higher than global sea level rise projections(by approximately 6 inches for 21st century projec-tions) (IPCC, 2007). One reason is that New YorkCity and the surrounding region are subsiding byapproximately 3–4 inches per century. The climatemodels also have a tendency to produce acceleratedsea level rise along the northeast U.S. coast, associ-ated in large part with a projected weakening of theGulf Stream (Yin et al., 2009).
The model-based sea level rise projections shownin Figure 3.10 and Table 3.1 are characterized bygreater uncertainty than the temperature projec-tions, due to the possibility that dynamic processesin polar ice sheets not captured by the GCMs mayaccelerate melting beyond currently projected lev-els. This uncertainty is weighted toward the upperbound of the GCM projections: that is, the proba-bility of future sea level rise being lower than thatdescribed in the third row of Table 3.1 is very low,and the probability of sea level rise exceeding theGCM projections is relatively high.
The rapid ice melt sea level rise scenario shownin the fourth row of Table 3.1 addresses this possi-bility. It is based on extrapolation of recent acceler-ating rates of ice melt from the Greenland and WestAntarctic ice sheets and on paleoclimate studies thatsuggest sea level rise on the order of ∼3.9–4.7 inches(9.9–11.9 cm) per decade may be possible. The po-tential for rapid ice melt needs to be included inthe regional projections for New York City becauseof the large magnitude of consequence should it oc-cur. (As described in Chapter 2 on risk management,rapid ice melt leading to accelerated sea level rise isthe kind of catastrophe of which the consequences
may be so severe that policy makers need to take itinto consideration, despite uncertainties.) More in-formation on the development of the rapid ice-meltscenario can be found in the CRI (Appendix A). Toassess the risk of accelerated sea level rise and cli-mate change for the New York City region over thecoming years, climate experts need to monitor ratesof polar ice melt, as well as other key indicators ofglobal and regional climate change.
Future extreme events
Despite their brief duration, extreme events canhave large impacts on infrastructure and people,so they are a critical component of climate changeimpact assessment. Table 3.2 indicates how the fre-quency of heat waves, cold events, intense precipi-tation, drought, and coastal flooding in New YorkCity and the surrounding region are projected tochange in the coming decades. The average numberof extreme events per year for the baseline periodis shown, along with the central 67% of the rangeof the model-based projections. The full range ofresults can be found in CRI (Appendix A). Uncer-tainties associated with extreme events are discussedin Box 3.4.
a. Future heat waves and cold eventsThe total number of hot days, defined by the NPCCas days with a maximum temperature over 90 or100◦F, is expected to increase as the 21st century pro-gresses. The frequency and duration of heat waves,defined as three or more consecutive days with max-imum temperatures above 90◦F, are also expected toincrease. In contrast, extreme cold events, definedas the number of days per year with minimum tem-perature at or below 32◦F, are expected to becomerarer. The extreme event temperature projectionsshown in Table 3.2 are based on observed data fromthe weather station located in Central Park. Becausesome parts of New York City, including the southshore of Brooklyn and Queens, currently experiencesignificantly fewer extreme heat days, they will prob-ably experience fewer heat events than those shownin the corresponding column of the table for CentralPark in the future as well.
b. Future intense precipitation and droughtsAlthough the percentage increase in annual precip-itation is expected to be relatively small, larger per-centage increases are expected in the frequency of
54 Ann. N.Y. Acad. Sci. 1196 (2010) 41–62 c© 2010 New York Academy of Sciences.

Ch 3. Climate observations and projections Climate change adaptation in New York City
Table 3.2. Quantitative changes in extreme events
Extreme event
Baseline
(1971–2000) 2020s 2050s 2080s
Heat waves and
cold events
# of days/year with
maximum temperature
exceeding:
90◦F 14 23 to 29 29 to 45 37 to 64
100◦F 0.4a 0.6 to 1 1 to 4 2 to 9
# of heat waves/yearb 2 3 to 4 4 to 6 5 to 8
Average duration (in days) 4 4 to 5 5 5 to 7
# of days/year with
minimum temperature
at or below 32◦F
72 53 to 61 45 to 54 36 to 49
Intense
precipitation
and droughts
# of days per year with
rainfall exceeding:
1 inch 13 13 to 14 13 to 15 14 to 16
2 inches 3 3 to 4 3 to 4 4
4 inches 0.3 0.2 to 0.4 0.3 to 0.4 0.3 to 0.5
Drought to occur, on
averagec
∼once every
100 yrs
∼once every
100 yrs
∼once every
50 to 100 yrs
∼once every 8
to 100 yrs
Coastal floods
and stormsd
1-in-10 yr flood to recur,
on average
∼once every
10 yrs
∼once every 8
to 10 yrs
∼once every 3
to 6 yrs
∼once every 1
to 3 yrs
Flood heights (in ft)
associated with 1-in-
10 yr flood
6.3 6.5 to 6.8 7.0 to 7.3 7.4 to 8.2
1-in-100 yr flood to recur,
on average
∼once every
100 yrs
∼once every
65 to 80 yrs
∼once every
35 to 55 yrs
∼once every
15 to 35 yrs
Flood heights (in ft)
associated with
1-in-100 yr flood
8.6 8.8 to 9.0 9.2 to 9.6 9.6 to 10.5
1-in-500 yr flood to recur,
on average
∼once every
500 yrs
∼once every
380 to 450
yrs
∼once every
250 to 330
yrs
∼once every
120 to 250
yrs
Flood heights (in ft)
associated with
1-in-500 yr flood
10.7 10.9 to 11.2 11.4 to 11.7 11.8 to 12.6
Source: Columbia University Center for Climate Systems Research.Note: Extreme events are characterized by higher uncertainty than mean annual changes. The central range (middle67% of values from model-based probabilities) across the GCMs and GHG emissions scenarios is shown.aDecimal places shown for values less than 1 (and for all flood heights), although this does not indicate higheraccuracy/certainty. More generally, the high precision and narrow range shown here are due to the fact that theseresults are model based. Owing to multiple uncertainties, actual values and range are not known to the level ofprecision shown in this table.bDefined as three or more consecutive days with maximum temperature exceeding 90◦F.cBased on minima of the Palmer Drought Severity Index (PDSI) over any 12 consecutive months. More informationon the PDSI and the drought methods can be found in the CRI.dDoes not include the rapid ice-melt scenario.
Ann. N.Y. Acad. Sci. 1196 (2010) 41–62 c© 2010 New York Academy of Sciences. 55

Climate change adaptation in New York City Ch 3. Climate observations and projections
extreme precipitation (defined as more than 1, 2,and 4 inches per day). This projection is consistentboth with physical climate theory that a warmer at-mosphere is expected to hold more moisture andthat precipitation tends to be concentrated in ex-treme events; the projection is also consistent withobserved trends nationally over the 20th century(Karl and Knight, 1998). Because some parts of NewYork City, including parts of coastal Brooklyn andQueens, currently experience significantly fewer ex-treme warm-season precipitation events than Cen-tral Park because of the cooling effect of the nearbyocean, they may experience fewer extreme warm-season precipitation days than Central Park in thefuture as well.
Twenty-first century drought projections reflectthe competing influences of greater total precipi-tation as well as greater evaporation due to highertemperatures. By the end of the 21st century theeffect of higher temperatures, especially during thewarm months, on evaporation is expected to out-weigh the increase in precipitation, leading to moredroughts, although the timing and levels of droughtprojections are marked by relatively large uncer-tainty. Changes in the distribution of precipita-tion throughout the year and timing of snowmeltcould potentially make drought more frequent aswell. According to the IPCC, snow season length isvery likely to decrease over North America (IPCC,2007).
Severe drought frequency, as defined by the12-month average Palmer Drought Severity Index(PDSI; Palmer, 1965) based on global climate modelresults, is essentially unchanged for the 2020s, butincreases thereafter. For the 2050s, the projectedfrequency of severe drought is approximately dou-bled, and by the 2080s the frequency is approx-imately five times greater. The rapid increase indrought risk through time is reflective of a non-linear response in the PDSI, because as tempera-ture increases in summer become large, potentialevaporation increases dramatically. See CRI (Ap-pendix A) for more information on the PDSI andits applicability. Because New York City and the sur-rounding region has experienced severe multiyeardroughts during the 20th century, most notablythe “drought of record” in the 1960s, any increasein drought frequency, intensity, or duration couldhave serious implications for water resources in theregion.
c. Future coastal floods and stormsAs sea level rises, coastal flooding associated withstorms will very likely increase in intensity, fre-quency, and duration. The changes in coastal floodsshown in Table 3.2 are solely due to the IPCC model-based projections of gradual changes in sea levelthrough time. Any increase in the frequency or in-tensity of storms themselves would result in evenmore frequent future flood occurrences. By the endof the 21st century, projections based on sea levelrise alone suggest that coastal flood levels that cur-rently occur on average once per decade may occuronce every 1-to-3 years.
The projections for flooding associated with moresevere storms (e.g., the 1-in-100 year storm) are lesswell characterized than those for less severe storms(e.g., the 1-in-10 year events). The historical recordis not sufficiently long to allow precise estimates ofthe flood level associated with the once-per-centurystorm. Furthermore, the storm risk may vary onmultidecadal to centennial ocean circulation-driventimescales that are currently not well understood.Keeping these uncertainties in mind, the NPCC es-timates that owing to sea level rise alone the 1-in-100year flood may occur approximately four times asoften by the 2080s. The current 1-in-500 year floodheight is even more uncertain than the 1–in-100year flood since the historical record is shorter than500 years. However, on the basis of the available in-formation, by the end of the century, the current1-in-500 year flood event may occur on the order ofonce every 200 years.
The flood heights shown in Table 3.2 are basedon the tide gauge located at the Battery in lowerManhattan and on surge models. Some parts ofNew York City, such as the northernmost pointswhere the Bronx Borough and the Hudson Rivermeet, experience lower flood heights than theBattery.
Qualitative extreme event projections
For some extreme climate events—such as heat in-dices, heavy downpours, and lightning—that havelarge impacts on infrastructure, future changes aretoo uncertain at local scales to allow quantitativeprojections. Therefore, qualitative information forsome of these factors is provided in Table 3.3.
By the end of the century, heat indices that com-bine temperature and humidity are very likely to
56 Ann. N.Y. Acad. Sci. 1196 (2010) 41–62 c© 2010 New York Academy of Sciences.

Ch 3. Climate observations and projections Climate change adaptation in New York City
Table 3.3. Qualitative changes in extreme eventsProbable direction of change over the 21st century, as well as likelihood associated with the qualitative projection.For these variables, which can have large impacts on infrastructure, quantitative projections are not possible becauseof insufficient information.
Probable direction
throughout 21st
Extreme event century Likelihooda
Heat indexb ⇑ Very likely
Ice storms/freezing rain ⇑ About as likely as not
Snowfall frequency and amount ⇓ Likely
Downpours (precipitation rate/hour) ⇑ Likely
Lightning Unknown
Intense hurricanes ⇑ More likely than not
Nor’easters Unknown
Extreme winds ⇑ More likely than not
Source: Columbia University Center for Climate Systems Research.aLikelihood definitions given in Figure 3.1. See CRI Appendix A for more information.bThe National Weather Service uses a heat index related to temperature and humidity to define the likelihood of harmafter “prolonged exposure or strenuous activity” (http://www.weather.gov/om/heat/index.shtml).
increase, both directly owing to higher temperaturesand because warmer air can hold more moistureand the resulting humidity exacerbates the effectsof heat. The combination of high temperatures andhigh humidity can produce severe additive effectsby restricting the human body’s ability to cool itself.The National Weather Service Heat Index definitionis based on the combination of these two climatefactors.
Ice storms can have large effects on infrastructure.Greater warming of the lower atmosphere than sur-face layer could potentially lead to more ice storms inthe near term by allowing snow to more frequentlymelt on descent and then refreeze near (or at) thesurface, but any such changes are highly uncertain.By the second half of the century, overall warm-ing may be large enough to reduce the threat of icestorms below current levels. Snowfall is likely to be-come less frequent in a warmer climate, with thesnow season decreasing in length. Possible changesin the intensity of snowfall per storm are highly un-certain.
Intense hurricanes and associated extreme windevents will more likely than not become more fre-quent due to expected warming of the upper oceanin the tropical cyclone genesis regions (IPCC AR4,2007). That is, once formed, the fraction of hurri-canes that become intense is expected to increase,along with the overall destructive power. However,
because future changes in other critical factors fortropical cyclones, including wind shear, the verticaltemperature gradient in the atmosphere, and pat-terns of variability including the El Nino-SouthernOscillation (ENSO) and the Atlantic MultidecadalOscillation (AMO)10 are not well known, it is un-clear whether the total number of tropical stormswill increase. There is the possibility that intensehurricanes and their extreme winds will not be-come more frequent or intense, should there be adecrease in the total number of tropical storms. Itis also unknown whether the most probable tracksor trajectories of hurricanes and intense hurricanesmay change in the future.
Regional downpours, defined as intense precip-itation at subdaily (often subhourly) timescales,are likely to increase in frequency and intensityin a warmer climate due to the greater capacity ofwarmer air to hold water vapor. Future changes innor’easters and lightning are currently too uncertainto support even qualitative statements.11
Box 3.4 Uncertainties related toextreme events
Because the climate processes affecting extremeevents, such as hurricanes and nor’easters, maychange in the future, prediction of future extremes
Ann. N.Y. Acad. Sci. 1196 (2010) 41–62 c© 2010 New York Academy of Sciences. 57

Climate change adaptation in New York City Ch 3. Climate observations and projections
is generally characterized by higher uncertaintythan the annual averages described in the previ-ous section. The NPCC projections are based onthe assumption that the distributions of the ex-treme events will remain unchanged while meantemperature, precipitation, and sea level rise shift.Changes in the distribution of extreme events couldhave large effects on the results shown here. Giventhe uncertainty, the direction and relative magni-tudes of changes, rather than the precise projec-tions, should be emphasized.
While Table 3.2 provides an estimate of howthe occurrence of extreme events may change forthe average future year, extreme events in indi-vidual years will continue to be characterized byhigh variability. In some cases, only when manyyears, or even decades, are averaged will the pat-tern of changes in extreme events become evident.For example, New York City’s drought of recordwas a multiyear event that occurred four decadesago in the 1960s; no drought since that time inNew York has approached it in severity. Droughtsusually affect entire regions; the 1960s droughtof record affected New York City’s entire water-shed and had implications for water sharing withother regional metropolises. Generally speaking,changes in variability are considered very uncer-tain, although there are exceptions. For example,precipitation at daily timescales is likely to increasein variability owing to the intensification of the hy-drological cycle that is associated with a warmingclimate.
Uncertainties, high-end scenarios, andlonger-term projections
Climate changes in New York City and the sur-rounding region in the 21st century may extendbeyond the ranges projected by global climate mod-els for several reasons. Actual greenhouse gas emis-sions may exceed the range encompassed by thescenarios used here. Indeed current emissions arebeyond the highest scenario used in these projec-tions. Ultimately, greenhouse gas emissions directlyrelated to human activities could be either higheror lower than the projected range. Changes in theearth’s carbon and methane cycles brought on by achanging climate could further modify greenhousegas concentrations and climate through feedbackeffects (IPCC, 2007).
Additionally, the climate system’s sensitivity toincreasing greenhouse gases may fall outside the
range of the 16 climate models used to producethe NPCC projections. Other possible types of cli-mate changes that could have large impacts on theregion also cannot be ruled out. These could includeshifts in the average latitudes and tracks of moisture-laden storms traversing eastern North America,and/or changes in ocean circulation in the NorthAtlantic.
High-end scenarios and rapid ice melt
The rapid ice-melt scenario was developed by theNPCC to address the possibility of more rapid sealevel rise in the region than the IPCC model-basedapproach projects (see Box 3.5 for more informa-tion). The motivation to consider sea level rise ex-ceeding IPCC-based estimates is due to several fac-tors, including:
• Recent accelerated ice melt in Greenland andWest Antarctica, which may indicate the po-tential for high sea level rise over multiple cen-turies;12
• Paleoclimatic evidence of rapid sea level rise;• Ice sheet dynamics not properly simulated by
global climate models; and• Potentially large implications for a coastal city
of more rapid sea level rise.
Additionally, recent well-documented decreasesin summer and fall Arctic sea ice area and vol-ume, although not a significant direct cause of sealevel rise, are also raising concern. Declines in seaice could indicate that polar climate sensitivity togreenhouse gases, and increasing temperatures ishigher than predicted by global climate models.The warming effect of decreasing sulfate aerosols,along with atmospheric and ocean circulation pat-terns may also be partially responsible for recentaccelerated melting. The sea ice declines could alsomodify atmospheric and oceanic conditions overthe high latitudes, with implications for Greenland’sice sheet. For example, since air over water is warmerthan air over ice, sea ice melting would generally re-sult in warmer air in polar regions. If this warmerair were transported out of the Arctic to Green-land, Greenland’s coastal and low-elevation glaciersmight receive more moisture in the form of rain,and less as snow, leading to accelerating melting ofthe land ice that does contribute directly to sea levelrise.
58 Ann. N.Y. Acad. Sci. 1196 (2010) 41–62 c© 2010 New York Academy of Sciences.

Ch 3. Climate observations and projections Climate change adaptation in New York City
Box 3.5 Sea level rise—past, present,and future
Starting around 20,000–21,000 years ago, globalsea level began to rise from a low of 394 feet (120meters) below present-day sea level, when water onthe planet was locked up in ice, to close to presentlevels by 7000–8000 years ago (Peltier and Fair-banks, 2006; Fairbanks, 1989). Most of the rise wasaccomplished in a 10,000- to 12,000-year period;the average rate of sea level rise over this periodranged between 3.9 and 4.7 inches (9.9–11.9 cm)per decade depending on length of period used tocalculate the average rate of rise.
In the course of this long period of melting,shorter periods of more rapid rise lasting severalcenturies, known as meltwater pulses, occurred inwhich maximum rates of sea level rise ranged be-tween 16 and 24 inches (40–60 cm) per decade. It ishighly unlikely that such high meltwater pulse sealevel rise rates will be matched during the 21st cen-tury, since they occurred after the ice sheets hadalready been weakened and undermined by cen-turies to millennia of prior warming. Furthermore,the meltwater pulses often occurred as abrupt in-tervals associated with catastrophic events (e.g., icedams breaking) at a time when total ice extent wasmuch greater than today. Vast ice sheets coveredmuch of North America, northern Europe and ad-jacent Russia, the British Isles, and high mountainranges at the peak of the last Ice Age. The ice onAntarctica was also much thicker than at present.
In the NPCC rapid ice-melt scenario, we as-sume that glaciers and ice sheets melt at a ratecomparable to that of the average rate during thelast deglaciation (i.e., total ice melt rises linearlyat 3.9–4.7 inches (9.9–11.9 cm) per decade un-til 2100). We use the average present-day ice rateof 0.4 inches (1.1 cm) per decade 2000–04 as abase period. This is the sum of observed mountainglacier melt (IPCC, 2007) and ice sheet melt (Shep-herd and Wingham, 2007) during this period. For2100, the total rise in sea level attributed to icemelt from all sources including mountain glaciersis estimated to be 39–47 inches (99–119 cm). Sincethe melting is likely to accelerate through time aswarming occurs, we then fit an exponential curveto three points: 2000, 2002 (the mid-point of 2000–04), and 2100. We then add the other three compo-nents from the IPCC-based sea level rise projectionapproach (thermal expansion, local ocean dynam-
ics, and subsidence) to this exponential meltwaterestimate for three time slices.
Longer-term projections
Climate change projections for the 22nd centuryare beyond most current infrastructure planninghorizons. However, planning for some long-livedinfrastructure, which hypothetically could include,for example, new aqueducts and subway lines, wouldjustify consideration of climate in the 22nd century.Furthermore, many types of infrastructure intendedonly to have a useful lifespan within the 21st centurymay remain operational beyond their planned life-time. Future projects aimed specifically at climatechange adaptation might benefit during their plan-ning stages from consideration of long-term climatechange.
Projections of 22nd century climate are highlyuncertain, largely because greenhouse gas emissionsand concentrations cannot be projected with anyconfidence that far into the future. Additionally,the possibility that geo-engineering techniques de-signed to cool the planet may be employed at mul-ticentury timescales cannot be ruled out. Despiteuncertainties, the large inertia of the climate systemsuggests that the current directional trends in twokey climate variables, sea level rise and tempera-ture, will probably continue into the 22nd century(Solomon et al., 2009).
The biggest climate uncertainties surround theissue of whether abrupt climate changes may oc-cur as the system moves further from pre-industrialconditions. Given the large inertia of the ice sheetson Greenland and West Antarctica, continuing ev-idence during the next decade of acceleration ofdynamically induced melting would greatly increasethe probability that these ice sheets would contributesignificantly to sea level rise in the 22nd century,even if greenhouse gas concentrations, and perhapseven global temperatures, were to stabilize in thecoming decades.
3.4 Conclusions and recommendations
State-of-the art global climate models now enableclimate change projections at scales relevant to de-cision makers creating initial adaptation plans inNew York City. Climate change is extremely likely
Ann. N.Y. Acad. Sci. 1196 (2010) 41–62 c© 2010 New York Academy of Sciences. 59

Climate change adaptation in New York City Ch 3. Climate observations and projections
to bring warmer temperatures to New York Cityand the surrounding region. Heat waves are verylikely to become more frequent, intense, and longerin duration. Total annual precipitation will morelikely than not increase, and brief, intense rain-storms are likely to increase as well. Toward theend of the 21st century, it is more likely than notthat droughts will become more severe. Addition-ally, rising sea levels are extremely likely and arevery likely to lead to more frequent and damag-ing flooding related to coastal storm events in thefuture.
New York City has the good fortune to in-clude within its boundaries some of the world’sleading practitioners of climate science. This localresource can be invaluable for city and state offi-cials as they grapple with climate change adaptation.Thus city and state officials should continue to workwith these scientists to maximize the value of thislocal knowledge base. At the same time, scientistscan learn a great deal about climate change adapta-tion on an empirical level by working closely withNew York City’s infrastructure workers, managers,and other professionals.
There is a need for enhanced regional model-ing capability to improve the skill and plausibilityof climate projections. The scientific community isworking on refining existing climate models, at bothglobal and regional scales, and this work should bemonitored for developments that can be appliedlocally.
While improved model resolution will dependin part on improvements in processing power, per-haps no less important are improved and extendedlocal and regional observational datasets to pro-vide indicators and monitoring (as discussed inChapter 7). Such data sets will help to improve un-derstanding and simulation of key climate changeand impact processes in the complex urban envi-ronment of New York City and its surrounding re-gion. Such data sets will also facilitate one of themajor climate initiatives of the next decade: theseamless integration of weather and climate predic-tion by bridging the weekly, seasonal, and decadaltimescales.
A key recommendation is the need to update cli-mate change projections on an ongoing and regularbasis. Updates are necessary because understandingof the climate system and climate models improvesthrough time, and New York City needs to have
an ongoing set of science-based climate scenariosto continue to develop effective Flexible AdaptationPathways.
Endnotes1The cryosphere (which includes ice sheets,
glaciers, sea ice, seasonal snow cover, and per-mafrost), in contrast, generally reflects far more ra-diation than it absorbs.
2Climate sensitivity is defined by the IPCC asthe equilibrium or final increase in global temper-ature associated with a doubling of CO2 from pre-industrial levels. More generally sensitivity refers tohow much climate change is associated with a givenclimate forcing agent, such as CO2.
3Records are available beginning in 1856; how-ever, the 19th century values are not included herebecause of large gaps in the record.
4Relative to NAVD88. The surge level may varyfrom one location to another.
5Projections of extreme events are conditioned onhistorical data (which has large spatial variation),whereas projections of mean annual changes areconditioned only on model changes through time(which have less spatial variation).
6For sea level rise, the multidecadal approachis not necessary owing to lower inter-annual vari-ability; the 2050s time slice for sea level (for ex-ample) therefore refers to the period from 2050–2059.
7Regional climate models, similiar to GCMs butrun at a higher resolution over a limited area, areincreasingly being used to address issues of spatialscale.
8For drought, the entire 20th century was used asa baseline, and 2000 to 2004 data were used for sealevel rise.
9Because they are rare, the coastal storm projec-tions were based on longer time periods. See CRIfor more information.
10ENSO and the AMO are coupled ocean-atmosphere phenomena centered in the tropical Pa-cific and Atlantic Oceans, respectively.
11Although some research does suggest that light-ning may become more frequent with warmer tem-peratures and more moisture in the atmosphere(Price and Rind, 1994).
12Neither the Greenland nor West Antarctic icesheet has yet to significantly contribute to global
60 Ann. N.Y. Acad. Sci. 1196 (2010) 41–62 c© 2010 New York Academy of Sciences.

Ch 3. Climate observations and projections Climate change adaptation in New York City
and regional sea level rise, but because potentialsea level rise would be large should current meltpatterns continue to accelerate, their statuses shouldbe monitored on a regular basis.
References and further reading
Alley, R.B., P.U. Clark, P. Huybrechts, and I. Joughin, 2005.
Ice-sheet and sea-level changes. Science, 310, 456–460.
Bard, E., B. Hamelin, and R.G. Fairbanks, 1990. U-Th ages
obtained by mass spectrometry in corals from Barbados:
sea level during the past 130,000 years. Nature, 346, 456–
458.
Bard, E., B. Hamelin, M. Arnold, L. Montaggioni, et al., 1996.
Deglacial sea-level record from Tahiti corals and the
timing of global meltwater discharge. Nature, 382, 241–
244.
Donnelly, J.P., P. Cleary, P. Newby, and R. Ettinger, 2004.
Coupling instrumental and geological records of sea-
level change: evidence from southern New England
of an increase in the rate of sea-level rise in the
late 19th century. Geophys. Res. Lett., 31, L05203, doi:
10.1029/2003GL018933.
Fairbanks, R.G., 1989. 17,000-year glacio-eustatic sea-level
record: influence of glacial melting rates on the Younger
Dryas event and deep-ocean circulation. Nature, 342,
637–642.
Gehrels, R.W., J.R. Kirby, A. Prokoph, et al., 2005. Onset of
recent rapid sea-level rise in the western Atlantic Ocean.
Quat. Sci. Rev., 24, 2083–2100.
Greater London Authority, London Climate Change Partner-
ship. Adapting to climate change: a checklist for develop-
ment , November 2005.
Gregory, J.M., P. Huybrechts, and S.C.B. Raper, 2004. Threat-
ened loss of the Greenland ice sheet. Nature, 428,
616.
Grinsted, A., J.C. Moore, and S. Jevrejeva, 2009. Reconstruct-
ing sea-level from paleo and projected temperatures 200
to 2100 AD. Climate Dynamics. In press.
Guttman, N.B., 1989. Statistical descriptors of climate. Bul-
letin of the American Meteorological Society, 70:6, 602–
607.
Halifax Regional Municipality. Climate change: developer’s
risk management guide, August 2007.
Hanebuth, T., K. Stattegger, and P.M. Grootes, 2000. Rapid
flooding of the Sunda Shelf: a late-glacial sea-level
record. Science, 288, 1033–1035.
Holgate, S.J. and P.L. Woodworth, 2004. Evidence for en-
hanced coastal sea-level rise during the 1990s. Geophys.
Res. Lett ., 31, L07305, doi: 10.1029/2004GL019626.
Horton, R., C. Herweijer, C. Rosenzweig, et al., “ Sea-level
rise projections for current generation CGCMs based
on the semi-empirical method.” Geophys. Res. Lett., 35,
L02715, doi:10.1029/2007GL032486, 2008.
Intergovernmental Panel on Climate Change. Climate change
2007: impacts, adaptation and vulnerability, contribu-
tion of work group II to the fourth assessment report of
the IPCC. Cambridge, UK: Cambridge University Press,
2007.
Intergovernmental Panel on Climate Change. Climate change
2000: special report on emissions scenarios. Geneva: IPCC,
2000.
Intergovernmental Panel on Climate Change. Climate change
2007: synthesis report . Geneva: IPCC, 2008.
Intergovernmental Panel on Climate Change. Climate change
2007: the physical science basis. Contribution of working
group I to the fourth assessment report: Cambridge
University Press, 2007.
Johnsen, S.J. et al., 2001. Oxygen isotope and palaeotempera-
ture records from six Greenland ice-core stations: Camp
Century, Dye-3, GRIP, GISP2, Renland, and NorthGRIP.
J. Quaternary Science, 16, 299–307.
Karl, T.R. and R.W. Knight, 1998. Secular trends of precip-
itation amount frequency and intensity in the United
States. Bull. Amer. Meteorol. Soc., 79, 231.
Kienast, M., T.J.J. Hanebuth, C. Pelejero, and S. Steinke, 2003.
Synchroneity of meltwater pulse 1a and the Bølling
warming: evidence from the South China Sea. Geology,
31, 67–70.
Liu, J.P. and J.D. Milliman, 2004. Reconsidering melt-water
pulses 1A and 1B: global impacts of rapid sea-level rise.
J. Ocean University of China, 3(2), 183–190.
Lowe, J.A., J.M. Gregory, J. Ridley, P. Huybrechts, et al.,
2006. The role of sea-level rise and the Greenland ice
sheet in dangerous climate change: implications for the
stabilisation of climate. In Avoiding dangerous climate
change, Schellnhuber, H.J., Cramer, W., Nakicenovic,
N., Wigley, T. and Yohe, G. (eds). Cambridge University
Press.
Metropolitan Transportation Authority. August 8, 2007 Storm
Report , September 20, 2007.
New York City Department of Environmental Protection,
Climate Change Program. Assessment and Action Plan,
May, 2008.
Palmer, W.C., 1965. Meteorological drought. Weather Bu-
reau Research Pap. No. 45, U. S. Dept. of Commerce,
Washington, DC, 58 pp.
Parson, E., V. Burkett, K. Fisher-Vanden, D. Keith, et al.,
2007. Global change scenarios: their development
and use. Subreport 2.1B of synthesis and assessment
Ann. N.Y. Acad. Sci. 1196 (2010) 41–62 c© 2010 New York Academy of Sciences. 61

Climate change adaptation in New York City Ch 3. Climate observations and projections
Product 2.1 by the U.S. Climate Change Science Program
and the Subcommittee on Global Change Research. De-
partment of Energy, Office of Biological & Environmen-
tal Research, Washington, DC, USA, 106 pp.
Peltier, W.R., 2001. “Global glacial isostatic adjustment
and modern instrumental records of relative sea-level
history,” in: Sea-level rise: history and consequences, B.C.
Douglas, M.S. Kearney, and S.P. Leatherman, eds., San
Diego, CA: Academic Press, pp. 65–95.
Peltier, W.R. and R.G. Fairbanks, 2006. Global glacial ice
volume and last glacial maximum duration from an
extended Barbados sea-level record. Quat. Sci. Rev., 25,
3322–3337.
Pfeffer, W.T., J.T. Harper, and S. O’Neel, 2008. Kinematic
constraints on glacier contributions to 21st-century sea-
level rise. Science, 321, 1340–1343.
Price, C. and D. Rind, 1994. Modeling global light-
ning distributions in a general circulation model.
M. Weather Rev., 122, 1930–1939, doi:10.1175/
15200493(1994)122<1930:MGLDIA>2.0.CO;2.
Rahmstorf, S., 2007. “A semi-empirical approach to project-
ing future sea-level rise,” Science 315: 368–370.
Rignot, E. and P. Kanagaratnam, 2006. Changes in the velocity
structure of the Greenland ice sheet. Science, 311, 986–
990.
Rohling, E.J., K. Grant, C. Hemleben, M. Siddall, et al., 2008.
High rates of sea-level rise during the last interglacial
period. Nature GeoScience, 1, 38–42.
Rosenzweig, C., D.C. Major, K. Demong, et al., “Manag-
ing climate change risks in New York City’s water sys-
tem: assessment and adaptation planning,” Mitigation
and Adaptation Strategies for Global Change, 2007, DOI
1007/s11027-006-9070-5.
Rosenzweig, C., R. Horton, D.C. Major, et al., Climate compo-
nent , in Metropolitan Transportation Authority, August
8, 2007 Storm Report , September 20, 2007.
Rosenzweig, C. and W. Solecki, eds. Climate change and a
global city: the potential consequences of climate variabil-
ity and change, Metro East Coast , Report for the U.S.
Global Change Research Program, Columbia Earth In-
stitute, 2001.
Shepherd, A. and D. Wingham, 2007. Recent sea-level con-
tributions of the Antarctic and Greenland ice sheets.
Science, 315, 1529–1532.
Solomon, S., G.K. Plattner, R. Knutti, and P. Friedlingstein,
2009. Irreversible climate change due to carbon diox-
ide emissions. Proceedings of the National Academy of
Sciences of the United States of America, 106, 1704–1709.
Stanford, J.D., E.J. Rohling, S.E. Hunter, et al., 2006. Timing of
meltwater pulse 1a and climate responses to melterwater
injections. Paleoceanography, 21, PA4103.
University of Washington Climate Impacts Group and Wash-
ington Department of Ecology. Sea-level rise in the
coastal waters of Washington State, January 2008.
Velicogna, I. and J. Wahr, 2006. Acceleration of Greenland ice
mass loss in spring 2004. Nature, 443, 329–331.
Walsh, J. E., V. Kattsov, D. Portis, V. Meleshko and partici-
pating AMIP modeling groups, 1998. Arctic precipita-
tion and evapotranspiration: model results and obser-
vational estimates. J. Climate, 11, 72–87.
World Meteorological Organization. 1989. Calculation of
Monthly and Annual 30-Year Standard Normals,
WCDP-No. 10, WMO-TD/No. 341, Geneva: World
Meteorological Organization.
Yin, J., M.E. Schlesinger, and R.J. Stouffer, 2009. Model pro-
jections of rapid sea-level rise on the northeast coast of
the United States. Nature Geoscience, 2, 262–266, doi:
1-.1038/NGEO462.
62 Ann. N.Y. Acad. Sci. 1196 (2010) 41–62 c© 2010 New York Academy of Sciences.


![Yeni Senaryolara Göre Türkiye Akarsu Havzalarında İklim Değişikliği Projeksiyonları [Climate Change Projections in Turkey’s river basin with new scenarios]](https://img.pdfslide.net/doc/110x75/63213710a1f1b3fad204c69f/yeni-senaryolara-goere-tuerkiye-akarsu-havzalarinda-iklim-degisikligi-projeksiyonlari.jpg)


