Embed Size (px)
Citation preview

Built cultural heritage in times of climate change
impactassessment
mitigation and adaptation strategies
Buildingsimulation
climatemodelling
stakeholder experiences
climate for culture Products

1
Brussels/holzkirchen, october 2014
Climate for Culture was the first large-scale European-funded research project in the field of preservation of cultural heritage. The findings from five years of multidisciplinary research on the impact of climate change on historic buildings were presented in 28 lectures at an international conference which took place 9 -10 July 2014 in the Munich “Residenz”. At this final meeting of the project around 160 experts (scientists, conservators, curators, administrators, journalists and politicians) from Europe, the United States, Egypt, Iran and Taiwan discussed with the Climate for Culture team the newly developed Climate for Culture methodology and its transfer into practice.In the closing speeches at the evening ceremony in the “Kaisersaal”, Director Dr Kurt Vandenberghe from the Directorate General Research and Innovation of the European Commission emphasized the responsibility of the European Union and its citizens to protect and sustain our cultural heritage and how important the role of research and innovation is in achieving these goals. He expressed his thanks to the multidisciplinary Climate for Culture team for the substantial contributions they had made. Dr Angelika Niebler, member of the european Parliament, recalled the support of the Parliament for the inclusion of cultural her-itage research in the european research framework programme horizon2020. in particular, she explained that the members of the Parliament are very pleased to be regularly informed about the progress in research on the preservation of cultural heritage in Europe. Dr Niebler explained that the Climate for Culture project had been exemplary in this respect.in addition to the articles in this brochure, more information can be found at www.climateforculture.eu
Johanna Leissner Ralf KilianCoordinator Scientific CoordinatorFraunhofer Gesellschaft Fraunhofer Institute for Building Physics IBP
EDIToRIAL

2 3
in historic buildings and its impact on cultural heritage items in Europe and Egypt. In addition, predictions for sea level rise up to 2100 produced from the climate models identifies the sites most at risk in Europe. By coupling of climate modelling with building simulation future indoor climates and energy demands can be calculated and thus suitable mitigation strategies devel-oped and tested. Valuable collections in historic buildings from different climate zones have been included in in situ investiga-tions of current and past problems and in making projections of future issues.
For the high resolution climate simulations within the Climate for Culture project two moderate scenarios are investigated, the A1B scenario and the very recent RCP4.5 scenario of the IPCC assessment report 5 (AR5). The mid-line A1B scenario assumes a greater Co2 emission increase until 2050 and a de-crease afterwards. In the recent past the global circulation model community launched the climate runs driven by the new AR5 IPCC emission scenarios which served for the second phase. RCP 4.5 stands for Representative Concentration Path-way and is a scenario based on long-term, global emissions of greenhouse gases, short-lived species, and land-use-land-cov-er which stabilizes radiative forcing at 4.5 Watts per square me-ter (W m-2, approximately 650 ppm Co2 equivalent) in the year 2100 without ever exceeding that value.
For the development of the whole building simulation tools, sets of climate indices were defined. The test datasets were prepared for the period of 1950 to 2100. Modelled climate data needed to be verified and processed to be suitable for building simulation. New methods and modules for the simulation tools had to be developed, implemented, tested and used. The suc-cessful application of suitable simulation tools allows compu-tational testing of active and passive adaptation and preserva-tion strategies. Several building simulation tools were tested and two - Hambase and WUFI Plus - proved to be suitable to model temperature and the change in relative humidity fluc-tuations due to moisture buffering. Software models for some case study buildings already exist, for instance in Germany, Linderhof castle, The Kings House on the Schachen, the church of Roggersdorf and in the Netherlands, Amerongen Castle.
Those case study building models were used to produce the first results, derive suggestions for software development and improvement as well as to apply different active and passive measures in the model.
The development of the building simulation tool is also based on real data from historic buildings collected as case studies. For this purpose a survey with a specially designed question-naire was performed to set up a range of case studies from all over Europe and Egypt. The survey covers up to now over 100 case studies in eleven countries. Parameters like type of build-ing, specific site-related factors, available indoor and outdoor climate data, observed damage and suitability for other work packages are reviewed and are transferred into a Climate for Culture database which has several categories of information. The list of case study buildings will be continuously updated and extended further.
Based on the climate data received from the high-resolution regional climate model a climate classification map over all of Europe and Northern Africa was produced. The climate map is derived from an overlay of temperature and humidity for the baseline climate 1960-1990 since temperature and humidity changes have a great influence on most degradation processes of materials. The climate zones were established to organize the collection of crucial data from various historic buildings: For each climate zone, a zone leader was appointed to be responsi-ble for harmonized data collection.
The case study buildings were used for the development of the whole building simulation tool including a generic building model and for assessing the effects of climate change. There-fore, in situ investigations of existing problems have been carried out to be used for the projection of future challenging issues using whole building simulation and different situ moni-toring technologies. The in situ measurements have been per-formed by laser speckle interferometry which was developed in the previous European project Laseract and by 3D microscopy. The two methods have already been successfully applied at the test site at Fraunhofer Institute for Buildings Physics in Holz-kirchen (Germany) and at several case study sites in Croatia and
Overview of Climate for Culture
Climate Change is one of the most critical global challenges of our time. For many decades nu-merous scientists from all over the world have been researching this topic and complex climate models suitable for making future climate projections have been developed. Climate change in itself is not the main concern; more important is its impact on the planet. But there is not so much information available on how the changing climate will affect mankind and its environ-ment. Although many studies have been conducted to explore the impact of climate change on economy, biodiversity and agriculture or on fresh water availability, only a little is known, to whether, and how, climate change influences our cultural heritage. Within the European fund-ed project Climate for Culture running from 2009 until 2014, a multidisciplinary research team consisting of 27 partners from the EU and Egypt, has conducted research in order to estimate the impact of climate change on the indoor environments of historic buildings in Europe and the Mediterranean region and on the vast collections they contain.
For this purpose, the CLIMATE FoR CULTURE project has coupled for the first time ever cli-mate modelling with whole building simulation tools: The high resolution climate change evo-lution scenarios provide the necessary climate indices for different periods in the past (1961-1990), near (2021-2050) and far (2071-2100) future. Here the regional climate model REMo with the high spatial resolution of approx. 10x10 km has been further developed over the whole of Europe and the Mediterranean. This set of climate indices is used in whole building simula-tion tools to assess future projections of outdoor climate changes on the indoor environments
INTRoDUCTIoN
EU project "Climate for Culture" Damage risk assessment, economic impact and mitigation strategies for sustainable preservation of cultural heritage in times of climate change Grant agreement No. 226973 (2009-2014)
Johanna Leissner, Ralf Kilian, Urban Kaiser, Uta Pollmer, Constanze Fuhrmann, Gabriele Maas-Diegeler, Sabrina Rota , Lola Kotova, Daniela Jacob, Uwe Mikolajewicz, Melanie Eibl, Vivi Tornari, Eirini Bernikola, Henk Schellen, Jos van Schijndel, Zara Huijbregts, Marco Martens, Florian Antretter, Stefan Bichlmair, Mathias Winkler, Sarah Kosmann, Jonathan Ashley-Smith, Kristina Holl, Dario Camuffo, Chiara Bertolin, Susana Mourato, Eleni Fimereli, Chris Gaskell, Tomáš Vyhlídal, Goran Simeunovic, Jiří Šolc, Mihael Mirtič, Gašper Stegnar, Marjana Šijanec Zavrl, Tor Broström, Aleš Sládek, Oto Sládek, Vlatka Rajčić, Roko Žarnić, Magdalena Rozanska, Jan Radon, Jan Holmberg, Robert Krah, Jochen Käferhaus, Nigel Blades, Katy Lithgow, Tina Naumovic, Klaus Häfner, Florence Bertin, Pavel Zítek

a)
b)
c)
d)
e)
g)
f)
g)
4 5
to adapt buildings to climate change. For the first time, a com-prehensive and in-depth analysis of the economic benefits as-sociated with reducing climate change damage to built heritage interiors in Europe was undertaken. This also included a study of the attitudes, preferences and ethical views held by the gen-eral public on the need to protect cultural assets from the im-pact of climate change. A questionnaire for the visitor surveys in the United Kingdom, Sweden, Germany, Romania and Italy was developed.
The Climate for Culture methodology
From the global climate model
to high resolution regional climate simulation (a)
to case study historic buildings (b)
to whole building simulation (c)
to indoor environments (d)
to individual cultural heritage items (e)
to indoor climate maps (f)
predictions for the far future (g)
Figure 1: The Climate for Culture methodology
Crete and show good complementarity. Further investigations by glass sensors from the previous European project AMECP (Assessment and monitoring the environment of cultural prop-erty) to assess the corrosivity impact of indoor and outdoor conditions at cultural heritage sites throughout Europe have also been carried out at case study sites in Crete and Croatia and Germany. These examinations allow a much more precise and integrated assessment of the real damage impact of cli-mate change on cultural heritage at regional scale. In terms of climate control in historic buildings a survey of the state of the art has been finalized and used to develop appropriate mitiga-tion/adaptation strategies. This means that active and passive measures were discussed and defined which resulted in the im-plementation of humidistat heating and equal sorption control as well as an absolute humidity control algorithm in the whole building simulation tool WUFI®Plus. In addition different exist-ing and new microclimate control approaches are considered in the tools Hambase and MATLAB/Simulink .
The main innovation in the whole project is the first ever use of a combination of climate modelling and building simulation tools to predict in a better way the influence of the changing outdoor climate on the indoor environment in historic build-ings up to 2100 and to calculate the future energy demand for environmental control in historic buildings. By using an auto-mated procedure an assessment of the damage potential in various climate zones has been performed. The project focus-es on gradual climate change and has not taken into account extreme events; this was explicitly excluded by the European Commission`s 2008 call for proposals. Since temperature and humidity are still recorded with analogue thermo-hygrographs in many museums, a software algorithm has been developed to convert analogue into digitised data. The software DigiChart can be downloaded for free at the Climate for Culture website. The project also examines a broad range of mitigation and ad-aptation measures: How to control indoor and microclimates energy efficiently and how revitalisation and enhancement of historical climate control (climatisation) systems can lead to sustainable solutions for historical buildings. The climate for culture methodology is integrated into a decision support software which provides building owners information on how
2100
Figure 1
6 7
CHAPTER 1 Climate modelling 9
CHAPTER 2 Building simulation 15
Hygrothermal building simulation to predict indoor climate conditions 16 Assessment of a historic church 17 Simulating and mapping future energy demands 20 Conservation of cultural heritage in the UK 24
CHAPTER 3 Mitigation and adaptation strategies 27
Energy efficient climate control in historic buildings 29 Indoor climate control for historic interiors and decision support 33 Revitalisation and enhancement of historic climatisation systems 37 Wall heating system (“Temperierung”) 41 Radiative heating experiments 44
CHAPTER 4 Impact assessment 47
Damage functions 49 Risk assessment 52 Experimental investigation of surface monitoring of materials in environmental conditions 55 The economic benefits of conserving built heritage interiors from climate change damage 60 in Europe Retrospective preservation surveys at Collections 64
CHAPTER 5 Stakeholder experiences 65
Cultural heritage in the times of climate change - the case study buildings 66 Stakeholder experiences - putting Climate for Culture in the context of 67 the National Trust Stakeholder experiences - the results of the Climate for Culture project 70 and their significance for future work
CHAPTER 6 Climate for Culture products 73
Climate for Culture database of case studies 75 The Climate for Culture Decision Making Support System 79 “DigiChart” software for digitising of thermo-hygrograph charts 81
CONCLUSIONS AND FUTURE PERSPECTIVES 84
ACKNOWLEDGEMENT 85
CLIMATE FOR CULTURE PARTNERS 86
ASSOCIATED PARTNERS 92
IMAGE RIGHTS 94

ChapTer 1 Climate modelling
88 9

10
Climate change is one of the most critical global challenges of our time. Scientific research shows that the preservation of the cultural heritage of Europe is particularly vulnerable to these factors.
The research team of the CLIMATE FoR CULTURE project aims to assess the damage potential of climate change on our cultural heritage sites, its socio-economic impact and possible mitigation strategies. For this purpose, climate evolution scenarios are provided in high spatial resolution covering all of Europe. These results are further applied as input in building simulation models to identify the most urgent risks for specific regions with the aim of developing mitigation strategies.
The state of knowledge on climate change is provided on a regular basis by the Assessment Reports of the Intergovernmental Panel on Climate Change (IPCC) [1]. The IPCC defines climate change as follows: “Climate change refers to a change in the state of the climate that can be identified [...] by changes in the mean and/or the variability of its properties and that persists for an extended period, typically decades or longer”. It refers to any change in climate over time, whether due to natural variability or as a result of human activity.
Most of the observed increases in global average temperatures since the mid-20th century are very likely due to the observed increase in anthropogenic greenhouse gas (GHG) concentrations.The time-dependent (of over centuries) climate response to changing concentrations of GHGs can be studied using global Earth System Models (ESMs).
ESMs have been developed as a mathematical representation of the Earth system, which are notonly coupled atmosphere-ocean general circulation models (GCMs), but also take into account different biogeochemical feedbacks.
Despite their success in simulating the Earth’s climate, GCMs only provide information at a relative coarse spatial scale, which is not sufficient for regional climate change assessment. The following two different principles transferring the information from a global model to the region of interest have therefore been developed: statistical and dynamical downscaling.
Statistical downscaling techniques connect the climate change signal provided by a GCM with observations from measurement stations in the region to achieve higher resolved climate change signals. Dynamical downscaling uses high resolution three-dimensional regional cli-mate models (RCM). This is a standard procedure for atmospheric variables. However, sea level rise (SLR) is also a potential threat to many coastal regions and their cultural heritage
11
sites. Several components contribute to SLR. The most impor-tant ones on a global scale are ocean thermal expansion and changes in the mass of the water stored on land, especially in ice sheets and glaciers, but also in reservoirs and groundwater. on a regional scale, this is further modified by changes in ocean circulation and by changes in the atmospheric pressure. Locally, the movement of the land relative to an equipotential surface also matters. Important components are the response of the solid earth to previous changes in load, such as to the decay of the ice sheets, which were present during the last glacial period 20,000 years ago as well as geotectonic movements.
In the project, we applied the regional atmosphere model REMo developed at the Max Planck Institute of Meteorology in its most recent hydrostatic version (REMo 2009) [2,3,4]. It was originally developed over Europe using the physical parameterisations of ECHAM4 [5] and the dynamical core of the former weather pre-diction model of the German Weather Service (DWD) [6].
The large-scale atmospheric flow fields to drive the REMo modelat the lateral boundaries were derived from a global coupled atmosphere-ocean model. The simulation set-up consists of a double nesting procedure. The global model data is used to drive REMo at ~50 km horizontal resolution. The results of this experi-ment are used to drive REMo on a horizontal grid of about 11 km. 27 levels are applied on the vertical grid.
A series of 30-year time-slice experiments was performed: in addition to the scenario simulations for the near (2021 to 2050) and far future (2071 to 2100) climate with projected GHG concen-trations, a control simulation for the recent past (1961 to 1990) forced with observed GHG concentration was calculated. A 30-year seasonal climatology was derived for each experiment.
A lot of effort has been made to provide quality control datasets. An assessment of robustness of climate change patterns pro-jected for Europe has been achieved across different studies, e.g. Jacob et al. [7,8], Vautard et al. [9], von Storch et al. [10].
In the project, we refer to different global and regional model combinations. While dynamical downscaling is done by the
regional climate model REMo, two global circulation models were applied as the driving force. The large-scale atmospheric flow fields to drive REMo at the lateral boundaries were derived from the global coupled atmosphere-ocean models ECHAM5-MPIoM [11] and MPI-ESM [12].
Furthermore, we have investigated the significance of the cli-mate change pattern. We focused on climate change signals between the three time slices mentioned above. These slices of 30 years are long enough to provide adequate estimates for climate change calculations. on the other hand, a substantial impact of natural variability on the estimated climate signal can be avoided within these time slices. The climate change sig-nal is derived from the monthly mean data which is calculated from 1h values. It expresses a relative change between the at-mosphere time-mean state in near/far future and present. By calculating the climate change signal, we applied a two-sided student t-test [13]. The climate signal is called statistically sig-nificant if the level of significance reaches 95 % or more.
In the project, we used two moderate emission scenarios de-veloped by IPCC. The emission scenarios were based on an extensive assessment of driving forces and emissions in the scenario literature, alternative modelling approaches and an “open process” that solicited wide participation and feedback. They represented different demographic, social, economic, technological and environmental developments, which may be viewed positively by some people and negatively by others.
The climate simulation is based on the IPCC AR4 A1B scenario [14] as it provides a good mid-line scenario for carbon dioxide output and economic growth. The A1B scenario is defined as not relying too heavily on one particular energy source, on the assumption that similar improvement rates apply to all energy sources and end-use technologies. Representative Concentra-tion Pathway (RCP) 4.5 is the scenario of the long-term, global emissions of greenhouse gases, short-lived species and land-use-land-cover which stabilises radiative forcing at 4.5 W/m2 (approximately 650 ppm Co2-equivalents) in the year 2100 without ever exceeding that value [15]. This scenario has been used in the AR5 report.
CHAPTER 1
Climate modellingLola Kotova, Uwe Mikolajewicz and Daniela Jacob

12 13
The contribution of ice sheet melting, glacier melting and chang-es of water storage on land is estimated to be approx. 31 cm. The spatial pattern resulting from these changes has been calculated using fixed patterns from Bamber and Riva [19]. Glacial isostatic adjustment, which describes the adjustment of the solid earth to the decay of the ice sheets after the last glacial period, is re-sponsible for a slow rising of the land in Scandinavia, Iceland and Scotland. Therefore, the expected sea level rise is relatively small (or even negative) in these regions (see Fig. 3). The coastal SLR is strongest in the southeastern part of the North Sea.
Figure 3: regional distribution of total relative sea level rise esti-mated for years 2070-2099 of scenario a1B relative to 1961-1990. The estimate includes ocean thermal expansion, changes in the mass of ice sheets and glaciers, global mean changes of the water stored in groundwater and reservoirs, changes in ocean circula-tion and atmospheric load and glacial isostatic adjustment. Other effects like tectonics are not included. The estimate of the global mean sea level rise for this period is 49 cm.
REFERENCES
1. IPCC. www.ipcc.ch
2. Jacob, D.; Podzun, R. Sensitivity studies with the regional climate
model REMo. Meteorol. Atmos. Phys. 1997, 63, 119-129
3. Jacob, D. A note to the simulation of the annual and inter-annual vari-
ability of the water budget over the Baltic Sea drainage basin. Mete-
orol. Atmos. Phys. 2001, 77, 61-73
4. Teichmann, C. et al. How does a regional climate model modify the
projected climate change signal of the driving GCM: A case study over
different CoRDEX regions using REMo. Atmosphere 2013, 4(2), 214-
236; doi:10.3390/atmos4020214
5. Roeckner, E.; Arpe, K.; Bengtsson, L.; Christoph, M.; Claussen, M.;
Dümenil, L.; Esch, M.; Giorgetta, M.; Schlese, U.; Schulzweida, U. The
atmospheric general circulation model ECHAM-4: Model description
and simulation of the present day climate; Report No. 218; Max Planck
Institute for Meteorology: Hamburg, Germany, 1996
6. Majewski, D. The Europa-Modell of the Deutscher Wetterdienst. In
Proceedings of the ECMWF Seminar on Numerical Methodsin Atmos-
pheric Models, Reading, UK, 9-13 September 1991; pp. 147-191
Figure 1 shows projected changes of the annual mean of near-surface air temperature (TEMP2) for the far future. The tem-perature increase is statistically significant, with regional differences for all of Europe for all simulations. While the tem-perature increases between 1 and 3 °C for RCP4.5, the A1B scenarios simulations showed projected future warming of 2 to 4.5 °C. The projected spatial patterns are very similar in all scenarios with stronger annual mean warming in Southern Eu-rope and in northeastern areas.
Figure 1: projected changes of annual mean of near-surface air temperature [K] for the period of 2071-2100 compared to 1961-1990 for different emission scenarios a1B (left panel) and rCp4.5 (right panel)
Whereas TEMP2 is rising, the REMo model does not simulate a clear signal in precipitation (TPREC) for all of Europe. The re-sults presented in Figure 2 show that the general tendency is enhanced precipitation for most regions in central and north-ern Europe and decreased precipitation in the Mediterranean region (up to 40 % over the Iberian Peninsula for A1B).
Figure 2: relative annual mean differences of total precipitation in % for 2071-2100 compared to 1961-1990 for different emis-sion scenarios a1B (left panel) and rCp4.5 (right panel). hatched areas indicate regions with statistically significant changes.
The change in mean relative sea level was calculated using the data from the regionally coupled atmosphere-ocean model REMo/MPIoM [17]. The model was forced with data from the scenario simulation with the global climate model ECHAM5/MPIoM [18]. From this simulation, the contributions due to glo-bal ocean thermal expansion, changes in ocean circulation and atmospheric load have been calculated. The change in climato-logical sea level for the period 2070 to 2099 relative to the near past (1961 to 1990) was calculated. The global mean contribu-tion due to ocean thermal expansion for this period is 18 cm.
Figure 1
Figure 3
Figure 2
A1 B
A1 B
RCP4.5
RCP4.5
30 °W 0 ° 30 °E 60 °E
30 °W 0 ° 30 °E 60 °E
30 °W 0 ° 30 °E 60 °E
30 °W 0 ° 30 °E 60 °E
50 °N
40 °N
30 °N
20 °N
50 °N
40 °N
30 °N
20 °N
50 °N
40 °N
30 °N
20 °N
50 °N
40 °N
30 °N
20 °N
-3.6 -3 -2.4 -1.8 -1.2 -0.6 0 0.6 1.2 1.8 2.4 3 3.6
-50 -30 -20 -10 -5 0 5 10 20 30 50
Near-surface air temperature, [K]
Total precipitation [%]
Copyright © CS2.0
60 °N
55 °N
50 °N
45 °N
40 °N
35 °N
30 °N
60 °N
55 °N
50 °N
45 °N
40 °N
35 °N
30 °N
Total relative sea level rise
5 °W 0 ° 5 °E 10 °E 15 °E 20 °E 25 °E 30 °E
-0.2 -0 0.2 0.3 0.35 0.4 0.45 0.5 0.55 0,6
-0.2 -0 0.2 0.3 0.35 0.4 0.45 0.5 0.55 0.6
A1B scenario, 2070-2099 relative to 1961-1990

ChapTer 2 Building simulation
14
7. Jacob, D. et al. 2013. EURo-CoRDEX: new high-resolution climate
change projections for European impact research. Reg Environ
Change; DoI 10.1007/s10113-013-0499-2
8. Jacob, D. et al. Assessing the Transferability of the Regional Climate
Model REMo to Different Coordinated Regional Climate Downscal-
ing EXperiment (CoRDEX) Regions. Atmosphere 2012, 3, 181-199;
doi:10.3390/atmos3010181
9. Robert Vautard et al. 2014. Environ. Res. Lett. 9 034006
doi:10.1088/1748-9326/9/3/034006
10. von Storch, H.; Zorita, E.; Cubasch, U., 1993. Downscaling of Global
Climate Change Estimates to Regional Scales: An Application to Ibe-
rian Rainfall in Wintertime. J. Climate, 6, 1161-1171. Jungclaus, J. H.;
Botzet, M.; Haak, H.; Keenlyside, N.; Luo, J.-J.; Latif, M.; Marotzke, J.;
Mikolajewicz, U. and Roeckner, E. (2006). ocean circulation and trop-
ical variability in the coupled model ECHAM5/MPI-oM. Journal of
Climate 19 (16): 3952-3972
11. Roeckner, E.; Bäuml, G.; Bonaventura, L.; Brokopf, R.; Esch, M.; Gior-
getta, M.; Hagemann, S.; Kirchner, I.; Kornblueh, L.; Manzini, E.; Rho-
din, A.; Schlese, U.; Schulzweida, U.; Tompkins, A. (2003): The atmos-
pheric general circulation model ECHAM 5. PART I: Model description.
MPI-Report No. 349
12. JAMES Special Issue: The Max Planck Institute for Meteorology Earth
System Model. 2013
13. Hans von Storch and Francis Zwiers. 2013. Testing ensembles of cli-
mate change scenarios for “statistical significance”. Climatic Change.
March 2013, Volume 117, Issue 1-2, pp. 1-9
14. Nakićenović, N., et al. Special Report on Emissions Scenarios: A Spe-
cial Report of Working Group III of the Intergovernmental Panel on
Climate Change (Cambridge Univ. Press, 2000)
15. van Vuuren, D. P.; Edmonds, J.; Kainuma, M.; Riahi, K.; Thomson, A.;
Hibbard, K.; Hurtt G. C.; Kram, T.; Krey, V.; Lamarque J.-F.; Matsui, T.;
Meinshausen, M.; Nakicenovic, N.; Smith, S. J.; Rose, S. K. (2011) Rep-
resentative concentration pathways: an overview. Climatic Change
109: 5-31: doi:10.1007/s10584-011-0148-z
16. Church, J. A.; Clark, P. U.; Cazenave, A.; Gregory, J. M.; Jevrejeva, S.;
Levermann, A.; Merrifield, M. A.; Milne, G. A.; Nerem, R. S.; Nunn, P.
D.; Payne, A. J.; Pfeffer, W. T.; Stammer, D. and Unnikrishnan, A. S;
2013: Sea Level Change. In: Climate Change 2013: The Physical Sci-
ence Basis. Contribution of Working Group I to the Fifth Assessment
Report of the Intergovernmental Panel on Climate Change [Stocker, T.
F.; Qin, D.; Plattner, G.-K.; Tignor, M.; Allen, S. K.; Boschung, J.; Nau-
els, A.; Xia, Y.; Bex, V. and Midgley, P.M.(eds.)]. Cambridge University
Press, Cambridge, United Kingdom and New York, NY, USA
17. Sein, D. V.; Mikolajewicz, U.; Gröger, M.; Fast, I.; Cabos, W.; Pinto, J.G.;
6,7; Hagemann, S.; Semmler, T. and Jacob, D. (2015). Regionally cou-
pled atmosphere – ocean – sea ice – marine biogeochemistry model
RoM. Part I: Description and validation., under revision at Journal of
Advances in Modeling Earth Systems
18. Jungclaus, J. H.; Botzet, M.; Haak, H.; Keenlyside, N.; Luo, J.-J.; La-
tif, M.; Marotzke, J.; Mikolajewicz, U. and Roeckner, E (2006). ocean
Circulation and tropical variability in the coupled model ECHAM5/
MPIoM. Journal of Climate 19 (16): 3952-397; Special Session: Climate
Models at the Max-Planck Institute for Meteorology (MPI-M). Jour-
nal of Climate. Volume 19, Issue 16 (August 2006). doi: http://dx.doi.
org/10.1175/JCLI9023.1
19. Bamber, J. and Riva, R., The sea level fingerprint of recent ice mass
fluxes (2010). The Cryosphere, 4, pp. 621-627, 2010 www.the-cryo-
sphere.net/4/621/2010/doi:10.5194/tc-4-621-2010
15

16
Hygrothermal whole building simulation allows for the prediction of indoor temperature and relative humidity in historic buildings. This makes climatic processes traceable. Consequences of measures with regards to risk and energy demand can thus be evaluated in advance. The in-teraction of room and enclosing building components as well as the building interior are taken into account to predict indoor temperature and relative humidity and its fluctuations as a result of outdoor conditions. This requires detailed modelling of heat and moisture exchange and transport on and in components.only a few software tools are capable of taking moisture diffusion and capillary transport in building materials into account. In the Climate for Culture project, HAMBase (only diffusion) and WUFI®Plus (diffusion and capillary transport) were used for holistic hygrothermal building simulation. Input data is the building geometry, used materials in the assemblies, building use and resulting inner loads as well as air exchange due to infiltration and ventilation. Available HVAC equipment can be modelled and coupled with various controls to maintain desired set-points. Special control strategies for historic buildings like conservation heating, controlled ventilation or “Temperierung” wall heating have also recently been implemented in the simula-tion software. WUFI® Plus provides an easy to use graphical user interface that supports error-free input.The results of whole building hygrothermal simulation cover the whole range of hourly energy demand for building conditioning for each zone, hourly indoor temperature and relative hu-midity for comfort and damage assessment as well as hygrothermal conditions on and in the envelope components to assess hygric issues like mould growth. Whole building hygrothermal simulation is the tool of choice for detailed building assessment. It allows the various building parameters and boundary conditions to change and the resulting changes in damage risk and energy demand to be assessed.All simulation models in the Climate for Culture project were calibrated with measured data to ensure the credibility of the simulation output. The calibrated model is then used to assess the effect of active and passive measures on damage potential and energy demand under the influence of a changing climate. A second simplified approach using state-space models as transfer functions was also applied for the prediction of indoor temperature and relative humidity. This method can only be ap-plied when all necessary measured values are available for the parameterisation of the model. But the simulation performance of this method is higher and therefore faster. This makes it possible to perform simulations for different building types on a fine grid over Europe for dif-ferent time periods to produce indoor climate and indoor climate risk maps.
17
Introduction Historic buildings have to adapt to the challenges accompanying climate change. With the example of the St. Margaretha church located in Roggersdorf (Germany) it is shown how hygrothermal building simulation with WUFI®Plus can be used to understand the performance of a historic building. As soon as a validated building model is created, it can be used to simulate the present and future indoor climate, which can be evaluated and possible risks for the building and its interior can be identified. The impact of different mitigation strategies on indoor climate can also be evaluated to develop retrofitting strategies for the future.
Building descriptionThe St. Margaretha church in Roggersdorf is located near the Fraunhofer Institute for Building Physics (IBP) in Holzkirchen in Southern Bavaria. The church was erected between 1696 and 1709 from tuff stone. It was consecrated in 1709. The tower and sacristy followed in 1764. The building was renovated funda-mentally from 2002 to 2004 . Shortly after the renovation the churchwarden again noticed moisture damage on the walls. Climate measurements in the St. Margaretha church have been carried out by Fraunhofer IBP for several years, starting at the beginning of 2005. The indoor climate parameters were first measured. Then the measurements were extended to more pa-rameters at different places inside and outside the building. A full data set of measurements with a time step of one hour has been available since 2012. Weather data was accessible from the Fraunhofer IBP outdoor testing facility, only 5 km away from Roggersdorf. Thanks to the measurements , the observed damage could be linked to condensation that occurs mainly in the transitional period during springtime.
Building simulationThe advanced hygrothermal building simulation tool WUFI®Plus is used to simulate the church [1]. This software couples whole building energy modelling with hygrothermal component mod-elling and allows the combined assessment of hygrothermal conditions of the building envelope, indoor climate and energy demand. The church in Roggersdorf is built in WUFI®Plus as a multi-zonal model, consisting of the sacristy, the main nave, the entrance, the attic and the tower. Figure 1 shows a picture of the church and its WUFI®Plus model. The northwest wall of the building is covered with wooden shingles to protect the building from heavy rain. The nave is built out of tuff stone walls with lime plaster only on the inside surface. The walls of the entrance and the sacristy are on both sides covered with lime plaster. The ceiling is insulated with mineral wool. The material data was taken from the database of WUFI®Plus.
Future assessments of the indoor climate focus on the main nave, as boundary conditions for this zone measured cli-mate data from outdoors and adjacent zones, and the sta-tistical climate data was used. Since no measurements for the ground climate were available, it was assumed that the soil temperature under the floor surface corresponds to the floor surface temperature and that the relative humidity has a constant value of 95 % RH. Due to the lack of data on air change, a constant infiltration air change rate of 0.4 h-1 was determined to be adequate in the validation process. As there is no regular service in the church, heat and moisture gains from people were not included. In some simulation-variants moisture gains from potted plants were included (40 g/h from April until August). Altogether 15 simulations were carried out using boundary conditions and loads at different accu-racy levels.
CHAPTER 2.1 CHAPTER 2.2
Hygrothermal building simulation to predict indoor climate conditions Florian Antretter
Assessment of a historic church Florian Antretter, Matthias Winkler, Jan Radon and Agnieszka Sadlowska

191818
Figure 1: picture and screenshot of the WUFI®plus model of the St. Margaretha church in roggersdorf, Germany
Model verificationThe measurements of indoor climate from the years 2005 and 2012 were used to validate the simulation output. Statistical parameters show a high correlation between measured and simulated data, with a correlation coefficient of 0.994 for the year 2005 and 0.991 for 2012. Relative humidity also shows good correlation coefficients of 0.840 for 2005 and 0.833 for 2012. By comparing the 2012 data, main differences for relative humidity can be found during winter, where the simulated relative humidity is systematically lower than in the measured data.
Furthermore, the accuracy of the simulation model was checked according to conservation demands by applying the criteria pro-posed by [2]. Temperature showed excellent accuracy between simulation results and measured data and an acceptable accu-racy in relative humidity, which is visualised in the quantile-quan-tile scatterplots in Figure 2. By combining both indoor climate parameters, an acceptable accuracy could be achieved for 95 % of the examined days.
Figure 2: Quantile-quantile scatterplots of measured and simulat-ed indoor temperature (left) and relative humidity (right) with ac-curacy measures as defined by [2].
Altogether, the WUFI®Plus model of the St. Margaretha church in Roggersdorf is able to produce reliable simulation results of the in-door climate conditions and can be used to predict future indoor climate and to develop mitigation strategies.
Future indoor climate predictionThe future indoor climate prediction is based on the two climat-ic scenarios A1B and RCP 4.5 from IPCC’s 4th and 5th reports. outdoor climate data was created specifically for the location of Roggersdorf through the regional downscaling model REMo from the Max Planck Institute for Meteorology, which uses the scenarios as input for modelling all climate parameters relevant for hygrothermal building simulations. Future outdoor climate was provided for the two time periods 2021-2050 and 2071-2100,
19
referred to as near future and far future respectively. This data is used for hygrothermal building simulations with the validated WUFI®Plus model of the church in Roggersdorf.
Simulations of scenario A1B predict increasing indoor temperaturesfor the mean, maximum and minimum statistical parameters of about 0.6-0.7 K between near and far future. At the same time, the parameters for indoor relative humidity increase by approximately 5 % RH. In addition to the statistical evaluation of indoor climate pa-rameters, an indoor damage and risk assessment was performed. During the Climate for Culture project, numerous damage functions were collected which describe climate-induced damage processes to support a risk assessment. These damage functions cover bio-logical, chemical and mechanical damages . They were applied on the simulated future indoor climates of the Roggersdorf church with the following results: a very small risk of mould growth can be ob-served, nevertheless the simulated indoor climate can still be con-sidered as safe. Possible damage could arise as indoor climate condi-tions are favourable for insect growth. Possible mechanical damage is predicted for panel paintings and wooden sculptures. Lacquered wooden furniture is considered as safe. No chemical damages of pa-per and silk objects were predicted. The results of the damage and risk assessment were almost identical for both climatic scenarios and also remained at the same level for both time periods.
Mitigation strategiesAs the church shows condensation-related moisture problems different mitigation strategies were discussed. A guided manual ventilation strategy led to significantly higher daily fluctuations above 15 % RH for more than 30 days, which is not acceptable, as it leads to mechanical damages in the interior. As a consequence, the installation of a controlled ventilation system, which adapts to indoor and outdoor climate conditions, was considered. To assess the possibilities and limitations of this system, hygro-thermal building simulation was used to predict the indoor cli-mate and compare it with the original free floating conditions in the church. From April to November, especially in the run-up to the critical spring period, relative and absolute humidity can be reduced through a ventilation system. No ventilation actions are performed from mid-November until the end of March, as the outdoor temperature falls below 0 °C. It was found that daily
fluctuations of temperature and relative humidity in the church are higher with mechanical ventilation systems than with no sys-tem at all. This could cause problems for valuable interior arti-facts that are sensitive to high RH fluctuations.
Another method for controlling indoor relative humidity is conservation heating. Here, an additional heating device with a maximum heating power of 10 kW is included in the building model to control relative humidity through indoor temperature. Whenever relative humidity would rise above a set-point, in this case 65 % RH, the nave is heated to reduce relative humidity. This method was able to limit maximum relative humidity throughout the whole year.
ConclusionsThe simulations of the St. Margaretha church in Roggersdorf show that hygrothermal building simulation is capable of producing re-liable indoor climate data which fulfils the high accuracy require-ments of conservators. The simulation results can be used for an in-depth assessment of historic buildings and their interior. Pre-dicted future climate can also be applied, which helps prepare historic buildings for the challenges of climate change. Possible mitigation strategies and their impact on the building as well as their energy demand can be evaluated to assess the effectivity of retrofitting strategies.
REFERENCES
1. Holm, A. H.; Künzel, H. M.; Sedlbauer, K. (2003): The hygrothermal
behaviour of rooms: combining thermal building simulation and hy-
grothermal envelope calculation. In: Eight International IBPSA Con-
ference, Eindhoven, The Netherlands, 11-14 Aug 2003: 499-505
2. Kilian R. (2013): Klimastabilität historischer Gebäude – Bewertung
hygrothermischer Simulationen im Kontext der Präventiven Kon-
servierung. Dissertation University Stuttgart
Figure 1
Figure 2
y
-10 -5 0 5 10 15 20 25 40 50 60 70 80 90 100
Calculation Calculation
Mea
sure
men
ts
25
20
15
10
0
-5
-10
100
90
80
70
60
50
40
Mea
sure
men
ts

20
1. INTRODUCTION
Due to the climate change debate, a lot of research and maps of external climate parameters are available. However, there is still a lack of maps of indoor climate performance parameters. This chapter presents a methodology for obtaining maps of performances of similar buildings that are virtually spread all over Europe. Figure 1: Visualisation of the proposed methodology
The produced maps are useful for analysing the regional climate influence on building performance indicators such as energy use and indoor climate. our approach is a new combination of three recent developments. Each development is introduced in a separate section: firstly, the simulation and mapping of building performance indicators based on European weather stations; secondly, a multi-zone energy model, representing a wide range of buildings; and thirdly, the availability of hourly based, EU wide, external future A1B climate files from the Cli-mate for Culture project.
1.1 The simulation and mapping of building performance in-dicators based on European weather stations [6]This paper presents a methodology and results for obtaining maps of performances of similar buildings that are virtually spread over the whole of Europe. The whole-building model used for the simulations originates from the thermal indoor climate model ELAN which was already published in 1987 [8]. The current hourly-based model HAMBase, is part of the Heat, Air and Moisture Laboratory [2], and is capable of simulating the indoor temperature, the indoor air humidity and energy use for heating and cooling a multi-zone building. The physics of this model is extensively described by [9]. An overview of the
validation results of the whole building model HAMBase are re-cently presented in [7].
1.2 A multi-zone indoor climate and energy model, repre-senting a wide range of museums [4] Marco Martens describes in his PhD thesis the input for the existing simulation model HAMBase that allows studying all 16 combinations of quality of envelope (QoE) and level of control (LoC) of a typical exhibition room layout. To be able to assess the influence of Quality of Envelope (QoE) and Level of Control (LoC), this room layout is put into the simu-lation model. The layout is based on common museum exhi-bition room specifications as encountered in several of the researched museums; this room is located in the corner of a building. The room consists of a single zone, 10 m long, 10 m wide and 3.5 m high. The ceiling, floor, north and east walls are adiabatic, which means that the zone is connected to other zones which are identical in behaviour but not part of thesimulation. The south and west walls are external walls and have a window of 5 m² each. Martens provides a full
21
description of the input for the model [4]. This single zone is put into the model 16 times; for each zone some parameters are changed according to the QoE and LoC. These parameters are displayed in Tables I and II .
Table I: Definition of Quality of Envelope (QoE) by different building parameters
Table II: Definition of Level of Control (LoC) by different systems’ parameters
The construction of the building depends on QoE: walls, glaz-ing and infiltration rate caused by leakages in the envelope, all change when improving the thermal quality of the envelope. Set-points depend on LoC. The available capacity for heat-ing, cooling, humidification and dehumidification is set to an unrealistically high value to make sure set-points are actually achieved; this is deliberately chosen to stress the influence on energy use. All 16 types were implemented into one single multi-zone HAMBase model, thus providing a very efficient way of simulating all variants simultaneously. A year with hourly based external climate values takes less than 10 seconds to run on a 4 GB/2.6 GHz computer.
1.3 Hourly based, EU-wide, external future A1B climate files [1]During the Climate for Culture project, external climate files were developed especially for building simulation purposes us-ing the REMo model [3].
2. METHODOLOGY
A multi-zone energy model, representing a wide range of museums and monumental buildings was implemented into HAMBase. The latter consists of 16 different building zone types made up of 4 levels of envelopes (LoE 1-4) and 4 levels of climate control (Lo C 1-4) from [4]. 7 performance indica-tors were used: (1) mean indoor temperature; (2) mean indoor relative humidity; (3) mean heating demand; (4) mean cool-ing demand; (5) mean humidification demand; (6) mean de-humidification demand; (7) total energy demand to produce EU maps for 16 building types and five 30-year time slices: recent past (1961-1990; RP), near future (2021-2050; NF), far future (2071-2100; FF), NF-RP and FF-RP. This gives a total of 560 maps. Interpretation of mean demand is the mean pow-er (W) over a period of 30 years (regardless of the seasons). 1 W (J/s) heat demand multiplied with 365 x 24 x 3600 s equals to annual heating energy of 31.536.000 J = 31.536 MJ. Please note that in all our models, the building volume is 350 m3. So 1W also represents 31.536 MJ/(year x 350 m3) = 90 kJ/(year x (m3 building volume)) = 2.2510-3 liter oil/(year x (m3 building volume)) (by us-ing caloric value of 106 J/litres for oil).
For example 100W and a building volume of 500 m3 equals about 100 litres/year.
Furthermore, for all power calculations related with the indoor climate, we assumed perfectly (100 % efficiency) air-conditioned HVAC system. The reader should note that in practical HVAC
CHAPTER 2.3
Simulating and mapping future energy demands Jos van Schijndel, Zara Huijbregts, Marco H. J. Martens and Henk L. Schellen
Figure 1
QoE 1 QoE 2 QoE 3 QoE 4
Exterior wall
Solid brick wall 400 mm, plastered
Solid brick wall 400 mm, plastered
Solid brick wall 400 mm, insulation on the inside 100 mm, plastered
Brick wall 100 mm, cavity, insulation 150 mm, brick 100 mm, plastered
Glazing Single Double Double low-e Double low-e
Infiltration rate
1 h-1 0.4 h-1 0.2 h-1 0.1 h-1
LoC 1 LoC 2 LoC 3 LoC 4
Temperature set point [°C] - 20 (heating) 20 (heating) 20 (heating);
22 (cooling)
Humidity set point [%] - - 40 (humidification);
60 (dehumidification)48 (humidification); 52 (dehumidification)
Buildingsimulation(HAMBase)
Museummodels
(Classification)

22
systems a lot more energy may be required for cooling and de-humidification. For example for dehumidification most systems cool first below dew point and afterwards heat the air to a cer-tain value. Therefore, it is clear, that a lot more energy may be required than just looking at the air-side part of the balance.
3. EXEMPLARY RESULTS
In this section, simulated results for recent past (RP), near future (NF) and far future (FF) energy demands for Euro-pean museums and monumental buildings are present-ed. As already discussed, we produced 560 maps. These maps will become publicly available on the Climate for Cul-ture website [1]. Figure 2 presents one of the main results
23
regarding the total energy use in far future (FF) minus the recent past (RP), i.e. FF-RP. Figure 2: The total energy use in far future (FF) minus the recent past (RP) using the corresponding Level of Control (LoC) and Level of Enve-lope (LoE). The colour blue represents less expected energy needed in the future, the colour red represents more expected energy needed in the future. The brighter the colour, the higher the value. It can be seen from Figure 2 that the first column is zero because LoC1 corresponds to a free floating building without any sys-tems. The second column LoC2 corresponds to heated build-ings systems. LoC4, QoE1 represents a poor insulated building with a high performance system. Here the highest differences between expected energy gains and losses can be observed. We refer to Tables I and II for the meaning of all different combi-nations of LoC and QoE.
4. CONCLUSIONS
A new method for simulating and mapping energy demands for European buildings for the recent past (RP), near future (NF) and far future (FF) is presented. It is a new combina-tion of three recent developments: firstly, the simulation and mapping of building performance indicators based on European weather stations; secondly, a multi-zone energy model, representing a wide range of buildings which consists of 16 different building zone types equal to all combinations of 4 levels of buildings construction and 4 levels of climate con-trol; and thirdly, the availability of hourly based, EU wide, ex-ternal future A1B climate files from the Climate for Culture project. 7 performance indicators were used: (1) mean indoor temperature; (2) mean indoor relative humidity; (3) mean heat-ing demand; (4) mean cooling demand; (5) mean humidifica-tion demand; (6) mean dehumidification demand; (7) total en-ergy demand to produce EU maps for 16 building types and five 30 year time periods: RP, NF, FF, NF-RP and FF-RP. This gives a total of total 560 maps. By using a classification of monumental buildings and museums, the influence of level of control and level of envelope on the performance indicators can be visualised.
REFERENCES
1. Climate for Culture (2014), http://www.climateforculture.eu
2. HAMLab (2014), http://archbps1.campus.tue.nl/bpswiki/index.
php/Hamlab
3. Jacob, D. and Podzun, R. (1997). Sensitivity studies with the Re-
gional Climate Model REMo. Meteorology and Atmospheric
Physics, 63, pp. 119-129
4. Martens, M.H.J. (2012), Climate risk assessment in museums, PhD
Dissertation, Eindhoven University of Technology
5. van Schijndel, A. W. M. (2007). Integrated Heat Air and Moisture
Modeling and Simulation, PhD Dissertation, Eindhoven University
of Technology
6. van Schijndel, A. W. M. & Schellen, H. L. (2013). The simulation and
Mapping of Building Performance Indicators based on European
Weather Stations. Frontiers of Architectural Research, 2, 121-133
7. van Schijndel, A. W. M. (2014). A review of the application of
SimuLink S-functions to multi domain modeling and building simu-
lation. Journal of Building Performance Simulation, 7(3), 165-178
8. de Wit, M. H.; Driessen, H. H. (1988). ELAN-A Computer Model for
Building Energy Design. Building and Environment 23, pp. 285-289
9. de Wit, M. H. (2006). HAMBase, Heat, Air and Moisture Model for
Building and Systems Evaluation, Bouwstenen 100, Eindhoven
University of Technology
Figure 2
0
0
0
0
500
400
300
200
100
0
-100
-200
-300
-400
-500
Type 2 FF-RP mean Total Energy [W]
Type 6 FF-RP mean Total Energy [W]
Type 10 FF-RP mean Total Energy [W]
500
400
300
200
100
0
-100
-200
-300
-400
-500
500
400
300
200
100
0
-100
-200
-300
-400
-500
70 °N
60 °N
50 °N
40 °N
10 °W0 ° 20 °E
30 °E
10 °E
500
400
300
200
100
0
-100
-200
-300
-400
-500
Type 10 FF-RP mean Total Energy [W]70 °N
60 °N
50 °N
40 °N
10 °W0 ° 20 °E
30 °E
10 °E
70 °N
60 °N
50 °N
40 °N
10 °W0 ° 20 °E
30 °E
10 °E
70 °N
60 °N
50 °N
40 °N
10 °W0 ° 20 °E
30 °E
10 °E
500
400
300
200
100
0
-100
-200
-300
-400
-500
Type 11 FF-RP mean Total Energy [W]70 °N
60 °N
50 °N
40 °N
10 °W0 ° 20 °E
30 °E
10 °E
500
400
300
200
100
0
-100
-200
-300
-400
-500
Type 12 FF-RP mean Total Energy [W]70 °N
60 °N
50 °N
40 °N
10 °W0 ° 20 °E
30 °E
10 °E
500
400
300
200
100
0
-100
-200
-300
-400
-500
Type 7 FF-RP mean Total Energy [W]70 °N
60 °N
50 °N
40 °N
10 °W0 ° 20 °E
30 °E
10 °E
500
400
300
200
100
0
-100
-200
-300
-400
-500
Type 8FF-RP mean Total Energy [W]70 °N
60 °N
50 °N
40 °N
10 °W0 ° 20 °E
30 °E
10 °E
500
400
300
200
100
0
-100
-200
-300
-400
-500
Type 3 FF-RP mean Total Energy [W]70 °N
60 °N
50 °N
40 °N
10 °W0 ° 20 °E
30 °E
10 °E
500
400
300
200
100
0
-100
-200
-300
-400
-500
Type 4 FF-RP mean Total Energy [W]70 °N
60 °N
50 °N
40 °N
10 °W0 ° 20 °E
30 °E
500
400
300
200
100
0
-100
-200
-300
-400
-500
Type 15 FF-RP mean Total Energy [W]70 °N
60 °N
50 °N
40 °N
10 °W0 ° 20 °E
30 °E
10 °E
500
400
300
200
100
0
-100
-200
-300
-400
-500
Type 16 FF-RP mean Total Energy [W]70 °N
60 °N
50 °N
40 °N
0 ° 20 °E30 °E
10 °E
QoE 4
QoE 3
QoE 2
QoE 1
LoC 1 LoC 2 LoC 3 LoC 4

24
Interest in the conservation of historic buildings is growing due to concern over the risk of damage to both the material integri-ty of the building construction and the items they house. Mois-ture is one of the most prevalent causes of damage in historic buildings, which can erode and rot aging building materials [1]. In tackling the issue of moisture in historic buildings, a prior-ity should be evaluating the use of prospective conservation strategies that could improve indoor moisture control, whilst at the same time recognising the sensitive state of the building materials, which have been subject to hygrothermal fluctua-tions over a period of centuries [2]. Adverse response to newly implemented approaches may lead to further moisture-related problems e.g. indoor humidification, which can induce mould growth on cold indoor surfaces or even interstitial condensa-tion in the construction [3]. An investigation was undertaken with the aim of assessing the hygrothermal performance of historic buildings. Numerical modelling was adopted to carry out this analysis and involved the use of the whole-building simulation tool WUFI®Plus [4], which allowed for a range of building parameters to be looked at as part of the hygrothermal assessment process. These included occu-pancy, ventilation and the introduction of building conservation strategies, including external wall insulation and conservation heating. The innovative methodology of correlating high resolu-tion climate change scenarios with building simulation models, a key component of the Climate for Culture (CfC) project, also enabled quantification of the buildings’ hygrothermal response with respect to changes in the external climate conditions dur-ing present and future climate change scenarios. An additional aspect of the work involved the risk assessment of potential damage to building materials induced through the hygrothermal conditions arising in the indoor environment.The buildings looked at during this study belong to the National Trust (NT) collection and are located in the South East and Northof England, respectively. The first is Knole House, a medieval
palace built in the 12th century and later transformed into a site resembling a stately home by the Archbishop of Canterbury in 1456. It is recognised as one of the most fragile properties in the National Trust collection and houses sculptures, historical portraits and fine Stuart furniture. Two unheated zones on the first floor of the East range of the building were modelled. The building structure itself is complex and designed around several courtyards. Its composition is a mixture of mass stone wall and timber framed construction, a walling practice widely employed in the early part of the 17th century when Knole House was be-ing extended; and single glazing is used throughout. The house is highly regarded as an outstanding example of Elizabethan design [5] and great emphasis has been placed on its continued preservation. A recent five-year programme was initiated focus-ing on building refurbishment and the repair of moisture-related damage recorded at the site. This damage has been observed in the form of cracked masonry, rotting of delicate materials such as silks and velvet furniture coverings, mould growth on paint-ings and uncomfortable indoor environmental quality.The second building investigated was the Greek-inspired Palladi-an-style chapel located on the Gibside estate. This was originally designed by James Paine during the Georgian era and finally completed in 1816 under the estate ownership of John Lyon. Its notable features include the central dome and a double portico carrying a pediment surmounted by a parapet with four urns [6]. A single zone was modelled where the main building construc-tion material is ashlar stone with a plaster applied to the interior wall and ceiling surfaces, timber clad walls in the seating areas and a combination of tiled and carpeted flooring. The site was sold to the National Trust in 1964 and has since been carefully re-assembled and refurbished after centuries of decline. The over-all building condition is of a reasonable quality and only minor work is required, indicating that there are no serious structural concerns. As is the case in Knole House, no permanent heating isapplied in the building.
25
The methodology used to conduct the investigation was divid-ed into four steps. The first step involved a process of model verification. This was done with the aim of developing a real-istic modelled representation of the indoor hygrothermal con-ditions measured in the two buildings studied. A sensitivity analysis of a range of building parameters was carried out to determine the level of correlation between the measured and predicted indoor hygrothermal conditions and which factors indicated the greatest influence on indoor hygrothermal con-ditions. Comparison was drawn between the two sets of data using a set of statistical criteria to assess the level of modelling accuracy achieved. Following this initial model verification pro-cedure, the accepted models were then simulated using future climate change scenarios. These were set in three different time periods labelled as the ‘near past’ (1961-1990), ‘near future’ (2021-2050) and ‘far future’ (2071-2100). The third stage of the methodology analysed the risk of moisture and temperature-related damage in the modelled buildings using an assessment tool developed during the course of the Climate for Culture project. Using the predicted indoor air temperature and rela-tive humidity produced for each of the climate change periods in the previous step, the risk of damage could be assessed. Fi-nally, the use of mitigation strategies to address concern over the hygrothermal conditions prevalent in the indoor building environment was modelled. There was particular interest in in-vestigating the use of a conservation heating system at Knole House. The use of conservation heating, and its development in National Trust properties, continues to grow in light of the recent commitment made to reducing the use of fossil fuels for heating purposes and electricity by 50 % by 2020 [7]. In addition to modelling this system, the installation of insulation in the ex-ternal walls, ceiling and flooring was also investigated.
Figure 1: Venetian ambassador’s bedroom at Knole,Sevenoaks, Kent
Figure 2: The palladian chapel, begun in 1760 to the design of Jamespaine, at Gibside, Newcastle Upon Tyne
CHAPTER 2.4
Conservation of cultural heritage in the UK Anastasios Markopoulos
Figure 1 (National Trust Images/andreas von einsiedel)
Figure 2 (National Trust Images/robert Morris)

ChapTer 3 Mitigation and adaptation strategies
2626
Results from the model verification procedure for each building produced acceptable and excellent levels of agreement between the measured and predicted indoor climate conditions for the majority of the statistical criteria specified as part of this project. These included the maximum and minimum values, median, to-tal range, correlation coefficient and 1st and 99th percentiles. Differences were, however, identified for the maximum and min-imum values for temperature (T) and relative humidity (RH) in Knole House, and only a mean correlation coefficient was calcu-lated for the predicted time series relative humidity data at Gib-side Chapel. Having carried out this initial verification process, it was found that the air change rate was the dominant factor driv-ing the indoor hygrothermal conditions, a result which has previ-ously been verified in other studies at Knole, due to air leakage through the building envelope fabric [8]. A set occupancy profile was derived from the annual visitor information and estimates provided by staff at the properties applied to each building, how-ever, this was found to have negligible impact on indoor climate conditions as absolute humidity was found to closely follow the outdoor profile. Initial indoor air and material hygrothermal con-ditions were calculated using the measured indoor climate data. In terms of the impact of future climate change scenarios, simu-lations indicated the most significant effect to be observed in the indoor environmental conditions would be in relation to tem-perature for both of the buildings. By using the 1961-1990 mod-elled climate data as the base case period, an average monthly temperature profile was calculated across the 30 years, which showed an increase of 1 to 3 ̊ C in the indoor climate. Based on the predicted indoor hygrothermal conditions, damage assessment indicated a rise in the number of events linked to insect growth, mechanical damage to timber and salt crystallisation, although it is emphasised that this is site-specific and relative to the model-ling assumptions made during the verification process. The pre-dicted increase of indoor air temperature also suggested a reduc-tion in the heating demand, which was of specific interest in the case of Knole House, where there is scope for the installation of a conservation heating (CH) system. A simulation study was con-ducted to assess the efficacy of such a system being installed and initial results highlighted its benefits by way of reducing the time indoor RH exceeding 65 % RH, the upper limit prescribed by the NT conservation strategy.
Three different cases were investigated, the first of which was the use of conservation heating on its own. The second was testing a conservation heating system combined with ceiling and external wall insulation. The third was adding insulation to the floor level. Having applied the RH and T setpoint guidelines provided by the NT i.e. an upper limit of 58 % RH and a deadband of 5 and 22 ˚C in the conservation heating system, increased thermal insulation in the building construction was shown to have a beneficial im-pact on energy consumption and also decreased the number of hours indoor RH was above 65 % RH in comparison to adopting conservation heating alone. With increased indoor temperatures predicted in future climate change scenarios, however, the ef-fectiveness of RH control supplied by the conser vation heating system may be reduced.
REFERENCES
1. Park, S. C. (2010) Moisture in Historic Buildings and Preservation
Guidance, Chapt. In: Moisture Control in Buildings: The Key Factor
in Mold Prevention, ASTM International
2. D’Agostino, D.; Congedo, P. M. (2014) CFD modelling and moisture
dynamics implications of ventilation scenarios in historical build-
ings, Building and Environment, 79: 181-193
3. Neuhaus, S.; Schellen, H. L. (2007) Conservation heating for a
museum environment in a monumental building, Proc. 10th Conf.
on the Thermal Performance of the Exterior Envelopes of Whole
Buildings, 2nd-7th December, Florida, USA
4. www.wufi.de/index_e.html
5. Knole, Kent; The House, Conservation and Management Plan, Vol-
ume [2]: Appendix 3 Gazetteer
6. Interim Policy Advice 17 (2006) Conservation Area Character State-
ments, Strategies and Policy Guidelines; Gateshead UDP: Re-de-
posit Draft Replacement Plan
7. National Trust, Energy – Grow your own (Swindon: National
Trust, 2010), http://www.nationaltrust.org.uk/main/w-energy-re-
port-2010.pdf
8. Tobit Curteis Associates LLP, Investigation and Control of the
Building Environment in the Reynold’s Room at Knole, Report for
the National Trust, December 2011 27
27

70 °N
60 °N
40 °N
10 °W0 ° 20 °E
30 °E
10 °E
70 °N
60 °N
50 °N
40 °N
10 °W0 ° 20 °E
30 °E
10 °E
70 °N
60 °N
40 °N
10 °W0 ° 20 °E
30 °E
10 °E
70 °N
60 °N
50 °N
40 °N
10 °W
0 ° 20 °E30 °E
10 °E
70 °N
60 °N
50 °N
40 °N
10 °W
0 ° 20 °E30 °E
10 °E
HeatingType 4 FF-RP mean Heating [W]
HumidificationType 4 FF-RP mean Humidification [W]
CoolingType 4 FF-RP mean Cooling [W]
TotalType 4 FF-RP mean Total Energy [W]
Dehumidification
500
400
300
200
100
0
-100
-200
-300
-400
-500
100
80
60
40
20
0
-20
-40
-60
-80
-100
100
80
60
40
20
0
-20
-40
-60
-80
-100
100
80
60
40
20
0
-20
-40
-60
-80
-100
500
400
300
200
100
0
-100
-200
-300
-400
-500
28
one of the key objectives of the Climate for Culture project was to perform an assessment of existing microclimate control strategies with respect to their energy consumption as well as their applicability to a wide spectrum of cultural heritage sites preserved in historic buildings of different structure, utilisation and climatic region in Europe. This was done with the help of building simulation models and is based on the analysis of an extensive number of project case studies spread over Europe. By coupling the building simulation models with results of high resolution climate change predictions, an outlook to the near (2021-2050) and to the far (2071-2100) future could be performed to assess energy demand predictions of selected con-trol strategies. Along with the sustainability objectives concerning the expected rise of energy needs and costs, a lot of attention was also paid to the applicability of renewable energies to historic buildings. The above mentioned aspects are addressed in more detail in section 3.2.The next key objective of the project was to develop indoor climate control strategies for the optimal control of relative humidity and temperature in typical historic buildings and exhibi-tions. In this research field, several new concepts have been proposed utilising the mathemati-cal models and damage functions. The key objective of the methods was to achieve a risk-free environment under minimised energy consumption. These methods, as well as classical ap-proaches have been implemented on a low cost controller, which can be applied to switching on and off the indoor climate control devices (dehumidifiers, humidifiers, heaters, coolers, ventila-tors), both portable and permanent. In addition to the classical building simulation softwares such as WUFI®Plus and HAMBase-Matlab, Fluent software has been used to model and analyse airflows in selected spacious historic interiors. The simulation based analysis was also supple-mented by the analysis of existing implementations of a wide range of control methods. The results are summed up in the implemented Decision Support System for indoor climate risk assessment and control. More detailed information on the topics mentioned here can be found in section 3.3.Section 3.4 deals with revitalisation and enhancement of historic climatisation systems. This part of research consisted of both the detailed analysis of existing solutions as well as of concept studies supported by the simulation tools. Altogether, twelve key case studies have been addressed in the project. Section 3.5 then deals with “Temperierung”, i.e. wall heat-ing systems, which mainly distribute heat via radiation from heating pipes inside or in front of the walls. on the one hand these systems have advantages in reducing cold wall effects and mould risk. on the other hand, in combination with reducing the infiltration rate of build-ings, they can be used to improve climate stability when used properly. A study on the Brezice castle “Temperierung” project in Slovenia and about the conservation heating control sys-tem to stabilise relative humidity at St. Renatus Chapel in Germany are presented. The last
29
section 3.6 presents further contributions to promoting the ra-diative heating in historic buildings. Following on from the re-search of earlier EU project Friendly Heating on designing opti-mal heating strategy in historic churches, a series of experiments have been performed to study the efficiency of various heating
elements regarding the heating source and the elements shape. Besides, energy efficiency and various environmental aspects of the friendly heating system have been studied by modelling the indoor climate of the church in Rocca Pietore in Italy.
An overarching goal of the Climate for Culture project is to pro-mote efficient energy use in historic buildings. We firstly as-sessed how indoor climate and energy demand is affected by climate change. We then developed new strategies and techni-cal solutions for energy-efficient climate control and compared them with state of the art solutions. Historic buildings without any climate control are vulnerable to climate change because in-door climate is strongly influenced by outdoor climate and the properties of the building envelope. In these buildings, however, climate change may require active climate control which causes a new energy demand. Normally the indoor climate of historic buildings with proper climate control will not be strongly affect-ed by climate change but the energy demand for climate control will be affected: it may either increase or decrease.
Energy demand for climate control can be due to • Temperature control: heating or cooling • Humidity control: humidification or dehumidification Figure 1: Change in average energy demand for heating, cooling, dehumidification and humidification for a case study building. The change is between the far future (2071-2100) and the recent past (1961-1990).
CHAPTER 3.1
Mitigation and adaptation strategies Tomás Vyhlídal and Tor Broström
CHAPTER 3.2
Energy efficient climate control in historic buildings Tor Broström, Jos van Schijndel, Magnus Wessberg, Poul Klenz Larsen et al.
Figure 1

30
Based on building simulations, the project has shown how the ener-gy demand for a type of building with a high level of climate control is affected by climate change (see Figure 1). We can see that energy demand for heating is expected to decrease all over Europe, howev-er the energy demand for cooling and dehumidification is expected to increase. The overall energy demand, shown in the map on the right, shows a distinct geographic pattern where overall energy demand is expected to increase in Northern Europe and decrease south of the Alps. This is only one example; the results will be differ-ent for other types of buildings.
3.2.1 Assessment of control strategiesHaving shown that climate change will have a rather complex effect on the energy demand for indoor climate control, we have investigated ways to control the indoor climate while mini-mising the energy demand. Passive strategies. The basic strategy for stabilising the indoor climate in a historic building should be to minimise the influ-ence from the outdoor climate through the passive function of the building envelope. Passive control is determined by the in-sulation, air tightness and hygrothermal buffering of the build-ing envelope. Case studies within the project and simulations show how the indoor climate can be stabilised by reducing the air exchange and by reducing solar heat gain from windows.Active strategies. If active climate control is needed, it should aim to control the indoor climate as energy-efficient as possi-ble regarding given climate requirements. We assessed these using building simulations based on the case study experience and have made a cross comparison of their energy consumption using the building simulation software [1] [3]. There was par-ticular focus on controlling relative humidity while only inter-mittent heating (ie. keeping temperature just above a set-point of 5-10 °C in the winter season) was considered.Humidity control. Humidity control is performed by releasing water vapour into the air. If the RH is too low, humidification is achieved by either injecting steam into the air or evaporat-ing water or water mist. If the RH is too high, dehumidification is achieved by removing water vapour from the air via either condensation or adsorption, see e.g. [2]. The applicability of dehumidification in historic buildings depends on whether the technical installations are acceptable with respect to both visu-
al and physical impact. Portable dehumidifiers allow for flexible and cost effective solutions but often the machinery is not well suited to a historic environment. A system of central dehumidi-fication can be better integrated but it requires air ducts. Un-less the building already has air ducts, the installation tends to be expensive and intrusive. Simulation experiments show that humidity control is a very energy-efficient mitigation measure. However, the overall energy consumption depends on the as-signed ranges of relative humidity. In addition to considering the fixed relative humidity set-point (possibly with seasonal adjustment), we studied the possibility of considering floating set-points to minimise energy consumption whilst still having risk-free indoor climate conditions. This will be addressed in section 3.3.Humidistatic heating. Humidistatic heating, or conserva-tion heating, is the concept of heating a building in order to keep the relative humidity below given limits. The tempera-ture is continuously adjusted and not controlled to a constant set-point. Humidistatic heating has been used for many years to maintain a moderate relative humidity in historic houses in winter [4]. A peculiar aspect of humidistatic heating is that it is sometimes required to heat in summer in order to keep the RH at an acceptable medium level. This may cause un-comfortably high temperatures and high energy consump-tion [5]. An increased temperature will generally increase the absolute humidity in the building causing an unwanted posi-tive feedback. Degradation of organic materials due to hy-drolysis will increase with rising temperature and RH. The en-ergy consumption for humidistatic heating is relatively high, due to poor thermal insulation and a high infiltration rate, as confirmed by a simulation-based comparison conducted by [3], where the overall energy consumption was several times higher compared to the direct humidity control method. Gen-erally, dehumidification is more energy-efficient unless heat pumps are used; an air-to-air heat pump will typically reduce energy demand by two thirds. For large buildings, humidistatic heating with heat pump technology seems to be the most ener-gy efficient measure, unless the thermal insulation is very poor. For small buildings dehumidification is more efficient unless the building is very leaky.
31
3.2.2 Renewable energyHaving addressed strategies and technical solutions, the final question is energy supply. one report of the project presents an assessment of the applicability of renewable energy sources, such as solar energy, heat pumps, wind power etc. in historic buildings. Renewable energy is becoming an increasingly im-portant consideration in all types of buildings whether historic or modern. In the context of the Climate for Culture project, the introduction of renewable energy can be both a preventive and mitigative measure. The introduction of renewable energy will obviously reduce greenhouse gas emissions. Furthermore, the results from the Climate for Culture project show how climate change will have an effect on the energy demand for climate con-trol in historic buildings and how they can be a sustainable and cost-effective solution for climate control aiming to mitigate the effects of climate change.
3.2.3 ConclusionsNo single strategy or solution exists that can be used to mitigate the effects of climate change on all buildings. It depends on the type and use of the building as well as geographic location. This part of the project has provided new knowledge that will allow end users to better select appropriate solutions for a specific building in a specific region.
A case study example. In the next 50 years the outdoor climate in most of Scandinavia is expected to be warmer and more humid. Timber buildings that so far have done well without any climate control will face new threats. Insects such as woodworm will mi-grate north. Unheated or intermittently heated stone buildings such as churches and castles will be exposed to higher risks of mould growth.
Figure 2: At Skokloster Castle in Sweden, different climate control strategies have been tested and compared.
Experimental setup for indoor climate control using adaptive ventilation at Skokloster Castle, Sweden
(Figure 2b)
Skokloster Castle from the frozen lake Mälaren(Figure 2a)

32
one of the primary case studies in the project has been Skok-loster Castle, located on a peninsula in Lake Mälaren north of Stockholm. It is a heavy stone and brick building, completed in 1767. After careful monitoring and assessment, as part of the Climate for Culture project, the National Property Board of Sweden has launched a three-year experiment to find the best climate control strategy for this castle and similar buildings. The results indicate that the following energy-efficient strategy can be used to prevent mould growth:
1. Improve passive control by reducing air exchange2. Use adaptive ventilation as primary active control as it has
the lowest energy demand. Existing flue pipes can be used to minimise visible installations.
3. Adaptive ventilation may not be sufficient in late summer and early autumn. Use a dehumidifier controlled with re-gards to the mould growth risk curve.
4. Conservation heating generally has the highest energy demand and should only be used if there also is a comfort requirement from staff in the building.
REFERENCES
1. Antretter, Florian; Kosmann, Sarah; Kilian, Ralf; Holm, Andreas;
Ritter, Fabian; Wehle, Barbara (2013) Controlled Ventilation of
Historic Buildings – Assessment of impact on the Indoor Envi-
ronment Via Hygrothermal Building Simulation. In: Freitas, V.
Peixoto (Ed.); Delgado, J. M. P. Q. (Ed.): Hygrothermal Behavior,
Building Pathology and Durability. Building Pathology and Reha-
bilitation, Vol. 1. Berlin [u.a.]: Springer, 2013, pp. 93-111.
2. Larsen, P. K.; Brostrom, T. (2011) Climate control in Cultural Her-
itage Buildings in Denmark. In Proc. Developments in Climate
Control of Historical Buildings. Edited by Kilian R., Vyhlidal T.,
Brostrom T., Fraunhofer IRB Verlag, ISBN 978-3-8167-8637-5, pp.
39-44
3. Broström, T.; Vyhlídal, T.; Simeunovic, G.; Larsen, P.-K. and Zítek,
P. (2012) Evaluation of different approaches of microclimate control
in cultural heritage buildings, Climate for Collections - Standards
and Uncertainties, Ashley-Smith, Jonathan; Burmester, Andreas;
Eibl, Melanie; (eds), Archetype Publications, London. pp. 105-115.
4. Staniforth, S.; Haves, B. and Bullock, L. (1994) Appropriate Tech-
nologies for Relative Humidity Control for Museum Collections
Housed in Historic Buildings. Preventive Humidistatic: Practice,
Theory and Research, Preprints of the contributions to the ot-
towa Congress. London, The International Institute for Humidis-
tatic of Historic and Artistic Works (IIC), pp. 123-128
5. Larsen, P. K. (2007) Climate control in Danish Churches. Museum Mi-
croclimates, Contributions to the conference in Copenhagen, 19-23
November 2007. The National Museum of Denmark, pp. 167-174
33
The issue of sustainable management of the indoor climate in historic buildings has received considerable attention in the last decade. The main motivation for this lies in the increase of en-ergy costs as well as the demand for improving the conditions in historic buildings where an invaluable part of cultural herit-age is stored. Even considerably increased demands for energy efficiency and sustainability in the cultural heritage sector can be expected in the future, considering both climate change im-pacts as well as expected further rising energy costs. In order to follow this trend, new concepts for controlling relative humid-ity and temperature in historic buildings have been proposed in the Climate for Culture project. Instead of following fixed limits on these indoor climate parameters as currently done in most museums and other types of historic buildings, the methods proposed in the project use mathematical models and dam-age functions to achieve risk-free indoor climate conditions for the collections and buildings themselves under minimal energy consumption. The following three methods have been particu-larly investigated within these activities of the Climate for Cul-ture project. 3.3.1 Concepts of optimised relative humidity controlHumidity control to avoid mechanical damage of wood.one of the main tasks of preventive conservation is to pro-tect moisture sensitive art materials from anisotropic swelling or shrinking caused by the changes of the absorbed moisture content. This objective has been targeted in the equal-sorption humidity control method proposed in [1]. The method takes into account the influence of temperature on the sorption iso-therms, which are usually neglected in common climate control. The first extension of the method proposed in the project takes into account moisture-strain-stress relations in wood, as also previously addressed in [2]. As a key result, allowable variations of relative humidity from its nominal set-point value have been determined. As presented in [3], only elastic deformations take
place in the layers of wooden material if the relative humidity is kept within the determined variation boundaries. Further ex-tension then takes into account dynamics of moisture sorption and the stress related to its gradient across the material layers. Including the model of sorption dynamics in the control algo-rithm, a further relaxation of the safe boundaries of relative humidity could be achieved. As illustrated by simulation mod-els following this approach, the overall energy consumption for dehumidification can be reduced by more than one third com-pared to the control with fixed relative humidity ranges.
Natural indoor climate fluctuations control. The second method for relative humidity control in historic buildings proposed in the project is based on the specifications of the European standard EN 15757. The approach follows the concept of acclimatising of the objects containing hygroscop-ic materials to the fluctuations of the historic environment, which in general should not change substantially if the control is introduced, for the motivation, see also [4]. only large fluc-tuations from the natural seasonal cycles of the indoor climate should be removed by the control system. Thus, the set-points for the dehumidifier and humidifier are not constant, but fol-low the natural (seasonal) cycles of the interior microclimate. In order to project the guidelines of the standard EN 15757 [5] to achieve safe relative humidity fluctuations into the real-time control method, several adjustments needed to be made to the key ideas. First, due to causality reasons, the central moving av-erage applied in the standard was replaced by the simple mov-ing average. Next, in order to keep the natural variability of the moving average throughout the yearly cycle, which is naturally reduced whenever the control is introduced , the moving aver-age filter adjustment criteria were applied. As demonstrated in [6] and [7] by using simulation experiments, energy consump-tion can be reduced significantly in comparison to conventional methods.
CHAPTER 3.3
Indoor climate control for historic interiors and decision support Tomáš Vyhlídal, Tor Broström, Goran Simeunovic, Oto Sládek, Ralf Kilian, Jochen Käferhaus, Pavel Zítek, et al.

34
Humidity control with respect to lowest Isopleth for mould. To assess risk of mould growth in a building, Krus et al. [8] have developed a predictive model. This model describes the hygro-thermal behaviour of mould spores allowing for the prediction of mould growth based on surface temperatures and RH. The growth conditions for mould are nutrients, temperature and humidity. They must exist simultaneously for a certain period of time. The growth conditions are described in so-called isop-leth diagrams. These diagrams describe the germination times or growth rates. The resulting lowest boundary lines of possi-ble fungus activity are called Lowest Isopleth for Mould. Taking into account the exponential function decrease of relative hu-midity with increasing temperature in the lowest isopleth, the maximum allowable relative humidity can be determined for a given temperature of the interior. In addition to the simulation base validation of this approach, the proposed control method has been implemented in the project case study - Skokloster Castle, Sweden.
3.3.2 Implementation of the methods on a low-cost control-lerThe algorithms described above have been implemented in a low-cost control system, which is based on the TECoMAT Fox-trot programmable controller. Various sub-modules can be add-ed to the system, including the measurement modules and the digital input/output modules for controlling the humidifiers and dehumidifiers and the heaters and coolers if needed. The con-trol system has been first validated and tuned by coupling the controller with a personal computer where a model of the his-toric building was implemented. Consequently, the controller has been tested in the case study of the project Trebon Castle Archive in Czech Republic.
3.3.3 Pilot projectsThe Climate for Culture project’s activities have also focused on the analysis of various control system installations. For example, different control techniques (conservation heating, controlled ventilation, dehumidification) were installed and cross-com-pared in Skokloster Castle and in occasionally used churches in Gotland (Sweden). The concept for controlled ventilation in the Great Tower of Karlštejn Castle (Czech Republic) and Linderhof Palace (Germany) were proposed and tested by building simula-tion software. The performance of a newly installed controlled ventilation system in St. Bartholomé Church (Germany) and the conservation heating control system in St. Renatus (Germany) were monitored within the project activities.
3.3.4 Application of Computational Fluid DynamicsIn addition to the building simulation software (WUFI®Plus and HAMBase-Matlab, used the most in the project), the computa-tional fluid dynamics software Fluent was applied to study and optimise the airflows in two spacious historic interiors.The first model was proposed and implemented for the Chapel of the Holy Cross in Karlstejn Castle with the particular objective to study environmental conditions close to the chapel’s thick walls where 129 valuable panel paintings are fixed. Using this tech-nique, the most risky zones in the chapel have been identified. The second model built for the Linderhof Palace’s bed chamber (see Fig. 1) was used to validate the concept of forced ventila-tion-based indoor climate control.
Figure 1: Results of computational fluid dynamic models. Left – relative humidity distribution on the wall surface of the holy Cross Chapel, Karlštejn Castle, Czech Republic; Right – Relative humid-ity distribution at 0.5 m height and in two vertical planes in the bed chamber in Linderhof Castle.
35
3.3.5 Expert Decision Support System (exDSS)As a contribution to the Climate for Culture decision support functionalities, a module for indoor climate risk assessment and control has been proposed and implemented within the exDSS SW application [9] developed for the purposes of the project. The decision support module is divided into the following three parts:
Part 1: Future outlook. This part indicates how the indoor cli-mate and risks related to the indoor climate might change in the near and far future for the building of interest. This is defined by key characteristics, such as thermal inertia of the walls, glassing area of windows and buffering capacity of the building interior. The information is derived from the Climate for Culture predic-tion maps, based on the given building characteristics and its location.
Part 2: Risk assessment. This part (see the decision tree in Fig. 2)investigates which climate-induced risks are relevant to the de-fined building and its collections stored inside. Risks related to mould growth, mechanical damage and insects are addressed in particular.
Part 3: Indoor climate control methods. This part investigates which indoor climate control methods are suitable for the de-fined building interior. For this purpose, the information received in the first two parts one and two is used.
In each of the parts of the expert system module, the end user goes through a series of questions structured in the form of a decision tree. After passing through all the available and appro-priate questions to the defined problem, the end user is given a set of recommendations and links to further information sources.
Figure 2: Illustration of decision tree of indoor climate risk as-sessment and control expert system module implemented in the exDSS software.
Figure 1
Figure 2
Constructiontype Location
Movableobjects
Historicalclimate
Insects
Mechanicaldamage
Susceptiblematerials
Local problem
Use simulations
from CfC
Mould
Buildingcomplexity:simple
Interior size:medium
Type:museum/exhibition area
Relevantrisks:Mould? Yes
Insects? Yes
Mechanical damage? Yes
Salts? No
Other? No
Mould info:Local problem? No
Movableobjects? Yes
Susceptiblematerials? No
Climate data:Max-min RH&TShort termfluctuationsAverage RH&T
Location:Visby, Sweden
Relevantrisks?
Oneyear data?
Yes
No

36
3.3.6 Concluding remarksIn the Climate for Culture project, an extensive analysis of vari-ous indoor climate control methods was performed using a wide scope of various modelling tools and by analysing a wide range of data collected in large numbers of the project case studies. In addition to the classical approaches, several new concepts have been proposed to control relative humidity in interiors of his-toric buildings. The information resulting from this extensive analysis was used as one of the cornerstones of the proposed decision support module for indoor climate risk assessment and control. The other cornerstones of the system are the expertise of the project team members, the results of climate prediction models and particularly the projections of the climate change to the extensive set of risk maps based on various damage func-tions.
REFERENCES
1. Zítek, P. - Vyhlídal, T. (2009) Model-based moisture sorption
stabilization in historical buildings. Building and Environment,
vol. 44, no. 6, p. 1181-1187
2. Jakiela, S.; Bratasz, L.; Kozlowski, R. (2008) Numerical modelling
of moisture movement and related stress field in lime wood sub-
jected to changing climate conditions. Wood Science and Tech-
nology, Vol. 42, pp. 21-37
3. Zitek, P.; Vyhlidal, T.; Sladek, o.; Sladek, A.; Simeunovic, G. (2011)
Equal-sorption microclimate control applied to the Holy Cross
Chapel at Karlstejn Castle. In Proc. Developments in Climate Con-
trol of Historic Buildings. Edited by Kilian, R.; Vyhlida,l T.; Brostrom,
T., Fraunhofer IRB Verlag, ISBN 978-3-8167-8637-5, pp. 57-65
4. Bratasz, L., Camuffo, D., Kozlowski, R. (2007) Target microcli-
mate for preservation derived from past indoor conditions, in Mu-
seum Microclimates, T. Padfield & K. Borchersen (eds.) National
Museum of Denmark, p. 129-134
5. EN15757 (2010) EURoPEAN STANDARD, Conservation of Cul-
tural Property - Specifications for temperature and relative hu-
midity to limit climate-induced mechanical damage in organic
hygroscopic materials
6. Broström, T.; Vyhlídal, T.; Simeunovic, G.; Larsen, P.-K. and Zítek,
P. (2012) Evaluation of different approaches of microclimate
control in cultural heritage buildings, Climate for Collections -
Standards and Uncertainties, Jonathan Ashley-Smith, Andreas
Burmester, Melanie Eibl (eds), Archetype Publications, London.
105-115
7. Vyhlídal, T.;Zítek, P.; Camuffo, D.; Simeunovič, G.; Sládek, o. et
al. (2013) Relative humidity control in historical buildings allow-
ing the safe natural indoor-climate fluctuations. In: Proceedings
of the 3rd European Workshop on Cultural Heritage Preservation.
Milano: Felix Verlag editrice, pp. 77-84
8. Krus, M.; Kilian, R.: Sedlbauer, K. (2007) Mould growth prediction
by computational simulation on historic buidlings, In Proc. Mu-
seum Microclimates, The National Museum of Denmark, Copen-
hagen, pp. 185-189
9. Šolc, J.; Vyhlidal, T.; Leijonhufvud, G.; Brostrom T. (2014) –
exDSS software for decision support with cultural heritage:
http://cfc.exdss.org/dss/riskcon.
37
Another key task of the Climate for Culture project was to ana-lyse and assess the potentials for revitalising historic air-con-ditioning systems. In discussions about the revitalisation and enhancement of historic housing systems in historic buildings, we have to differentiate between real housing services which in the past had a vital function in order to ventilate a building, to heat or to cool it and ‘housing systems’ as chimneys, ducts and shafts which were necessary to use heating and open fire places. We know from research in this field that there were very intelligent systems in past centuries – even thousands of years ago, such as radiative heating through warm walls used as the Roman hypocaust heating system or as natural ventilation and adiabatic cooling, developed by the Persians.old housing systems in historic buildings mostly concern natu-ral ventilation systems which use differences in temperature to transport air in shafts or chimneys. The physical process driv-ing movement is the fact that cold air is more dense than warm air and so warm air rises when in a room or building. Further-more, ventilation systems in historic buildings are warm air-to-air heat exchangers. These are mostly metal flues in a chamber next to a tile stove or oven through which cold air from outside is heated and sent through (metal or stone) ducts with or with-out mechanical ventilators to the rooms in which the warm air was needed. This system was used for example in Linderhof Palace in Bavaria, Germany.All these kinds of historic housing services have been found in historic buildings like in Hofburg, Vienna. Examples include shafts, chimneys, ‘calorifere’, ducts, double ceilings and flaps, moved by chains. often shafts or chimneys have been closed with bricks and mortar because they are no longer in use. Sometimes these old housing services have been reactivated to replicate their former results for fresh air, cooling as well as radiative heating – even if this is not produced in the same way as the Romans as these structures did not have their current double exterior walls and ceilings until after this period – by
only using driving forces known in buildings physics as shaft ef-fect, adiabatic cooling by radiative heating, which is nowadays perfectly ‘copied’ in ‘Temperierung’, a kind of wall heating sys-tem. The disadvantages of reactivating all these old systems, however, are the difficulties in complying with the latest rules of fire protection, since these rules were not as strict in the past.Three famous examples from the list of twelve case studies of this task of the Climate for Culture project illustrate how intel-ligent these techniques have been. Aside from the above-men-tioned housing systems of Hofburg in Vienna and Linderhof Palace in Bavaria with a concept of a new airing strategy and simulation of the expected indoor climate, the implementa-tion of natural ventilation in Schönbrunn Palace is addressed below. As well as these, the following case studies have been addressed in the project: ventilation by using existing histor-ic ventilation shafts in the Painting Gallery, Academy of Fine Arts, Vienna (Austria); new ventilation and dehumidifying system in existing historic shafts Läckö Palace (Sweden) to improve indoor microclimate stability; installation of control-led ventilation in historic shafts in Neuschwanstein Castle (Ba-varia); natural ventilation system in the Shaft Tomb of Iufaa, North Abusir (Egypt); revitalisation of the Monastery of Paular (Rascafría, Spain) with the integration of the passive natural ventilation system; analysis of hypocaust heating in Roman villa rustica, located in Mošnje at Podvin (Slovenia); revitalisa-tion of the heating system for conservation control in Pack-wood House (UK); revitalisation of the historic heating system through tiled stoves in the Museum of Český Krumlov Castle (Czech Republic).
CHAPTER 3.4
Revitalisation and enhancement of historic climatisation systems Jochen Kaeferhaus, Ralf Kilian, Tor Broström, Tomáš Vyhlídal et al.

38
3.4.1 Reactivation of the natural ventilation in ‘Corps de Logis’ in Hofburg, ViennaThis building built in the 1890s was originally planned as a guest-house for imperial guests. The plans were then changed and the building was turned into a museum. The building has two levels in the basement with a system of tunnels made of bricks where outside air is led through a system of vertical shafts in order to naturally vent rooms in the building. This type of natural venti-lation was state of the art at the end of the 1880s coming from England. Each corner of the building has two vertical shafts, one open at the bottom and closed on top, the other closed at the bottom and open on top. outside air is drawn through the rooms driven by stack effect due to difference in temperature. In summer when there is no difference in temperature, Ameri-can ventilators support the natural ventilation system when big metal flaps are opened in the attic. Figure 1: View of the floor plan of the basement, the huge air in-take and the shaft system
With this very simple, yet intelligent, system the whole buildingwas provided with fresh air: cooled air in summer and preheatedair in winter through tunnels in the basement. In addition, the outside walls of this building have vertical shafts which were open in the basement and ended in the attic under the roof. These shafts were closed in winter in order to improve the thermal quality of the outer walls. In summer these shafts were opened for natural cooling ef-fect to get rid of the outside heat from the walls. Monitoring has proven that this system works very well. only in winter it is not favourable to draw outside air into the showrooms. Gener-ally in winter, outside air is dry, and when this dry air has to be heated up for a minimum of comfort, the level of dryness drops even more. Therefore decentralised humidifiers were installed to keep the indoor climate within the ranges specified by the museum.
3.4.2 Schönbrunn PalaceWhen planning for the implementation of natural ventilation in Schönbrunn Palace, Vienna, a 300 m long underground tunnel of the time was found. This historic tunnel, about 1.70m high
39
and 0.7 m wide, was made of bricks which have been painted with lime, for disinfection. After extensive dynamic simulations of the tunnel in order to find out more about the tunnel’s thermal capacity, a heat power of about 46 kW and a cooling power in summer of about 48 kW was calculated. Later measurements confirmed the theoretical results. Air was sucked through the underground tunnel via a big air handling unit to provide showrooms in the western tract with fresh, pre-conditioned air from outside. This installation helped to overcome critical hot situations in summer in the castle and reduced the cooling load. Since the results of the historic tunnel were so good, the decision was made to also build a new underground tunnel on the eastern side of the castle to provide the eastern parts of the castle with outside pre-conditioned air.By using the existing historic shafts in the castle, mostly chim-neys, and their natural stack effect when difference in tem-perature inside and outside a sophisticated natural ventilation system in Schönbrunn Palace was planned similarly to the one in Hofburg. Through air displacement nozzles on the ground floor (there is almost no basement in the palace except in the middle of a small cellar), conditioned air was brought into the western showrooms. Through historic chimneys, opened in the ground floor to let room air into the shafts, exhaust air was transported either by stack effect or by small axial ventilators, horizontally mounted, with flaps against smoke and unwant-ed draft effects. Air exchange was controlled automatically using only just enough energy to provide proper ventilation. In the summer, the castle is pre-cooled during the night. This summer night cooling ventilation was controlled by compar-ing absolute humidity inside and outside the palace. When there is no risk to the inside climate in the showrooms the ven-tilation was activated. This ventilation system has eliminated the need for expensive cooling systems in Schönbrunn Palace.
3.4.3 Linderhof Palace, Bavaria, GermanyLinderhof Palace was built from 1868 to 1886 by the Bavar-ian King Ludwig II and is located in the Graswang valley, sur-rounded by the Bavarian Alps at about 940 m above sea level. A few weeks after the King’s death in 1886, the palace was opened to the public. Since then, the palace has remained
unheated. Today, there are at least 3,000 visitors per day in the summer with a considerable impact on the conditions for preserving the interior of the palace. The upper floor, where the showrooms are, is richly furnished. Figure 2a is a view of the king´s bed chamber. Almost every piece of the interior is a work of art. An analysis of the indoor environment showed that the relative humidity is elevated especially in the summer time from the additional moisture that visitors bring into the building [1]. Because there is no other possibility of ventilat-ing the building, the historic windows are opened by the tour guides. This again leads to increased fluctuations of the rela-tive humidity which can cause damage to the gilded surfaces and works of art. A concept was therefore developed in sev-eral international expert workshops for a new ventilation sys-tem using the historic ducts in the palace [2] [3]. Aside from the aim of improving the indoor climate conditions for pres-ervation, it is crucial to be able to install an HVAC system with low impact to the original building construction to the listed building Linderhof Palace with its extraordinary interior. An investigation made by the Bavarian Administration of State-owned Palaces, Gardens and Lakes showed possibilities of using the old air heating system and existing chimneys for air ducts. Figure 2b presents the concept for airing the main part of the upper floor. This system will address the parts of the palace with most problems in RH level. The new air inlet is planned to be installed in an open constructed chimney. The chimney was already historically used as an air inlet for warm air, heated by a wood-fired oven in the rooms below. Fortu-nately it is possible to install an HVAC system with a sorption dehumidifier and low level heating below the king´s bedroom in an unused cellar room. Since there are a lot of visitors in the palace during opening time, it is foreseen in this concept to use displacement ventilation. Figure 2b shows the air inlet in the king´s bedroom at the chimney on the right. To get air currents in both wings of the palace and finally outside, two additional chimneys will be used for the controlled air outlet. Fans are foreseen in both chimneys to control the air flow us-ing pressure difference.
Figure 1
VentilationHOFBURG
KG 1
KG 2
Burggar ten
Ring

40
Figure 2a: View of the Royal bedchamber of King Ludwig II’s royal bed chamber. Figure 2b: The new ventilation concept of Linder-hof Palace for the main part of the upper floor, using the historic air heating ducts and chimneys. Displacement ventilation will be used with an air inlet in the king’s bed chamber and controlled air outlets in the audience chamber and dining room.
REFERENCES
1. Bichlmair, Stefan and Kilian, Ralf (2011): Room Climate in Linder-
hof Palace: Impact of ambient climate and visitors on room climate
with a special focus on the bedchamber of King Ludwig II. In: Kil-
ian, Ralf; Vyhlídal, Tomáš; Broström, Tor: Developments in Climate
Control of Historic Buildings. Proceedings from the international
conference “Climatization of Historic Buildings - State of the Art”,
Schloss Linderhof, December 2nd 2010, Fraunhofer IRB, Stuttgart
2011, free download: www.climateforculture.eu
2. Bichlmair, Stefan; Kilian, Ralf; Krus, Martin und Sedlbauer, Klaus
(2012): Building simulation modelling of the historic building
Linderhof Palace taking account visitors. Proceedings of eSim
2012: The Canadian Conference on Building Simulation. Halifax,
Nova Scotia, May 1-4, 2012. Halifax 2012
3. Bichlmair, Stefan; Kilian, Ralf and Krus, Martin (2013): Con-
cept of a New Airing Strategy and Simulation of the Ex-
pected Indoor Climate in Linderhof Palace. CLIMA 2013, 11th
REHVA World Congress and the 8th International Confer-
ence on Indoor Air Quality, Ventilation and Energy Conserva-
tion in Buildings, Prague, Czech Republic, June 16-19, 2013
Conference and Workshops at Linderhof
International Conference “Climatization of Historic Buildings -
State of the Art”, Schloss Linderhof, December 2nd 2010
1st International Expert Workshop on “Revitalization of the his-
toric Linderhof climate control system”, December 3rd 2010 at
Linderhof Palace, Germany
2nd International Expert Workshop on “Revitalization of the his-
toric Linderhof climate control system, reuse of historic ventilation
systems, solutions for climate control in historic buildings, venti-
lation and dehumidification”, February 7th/8th 2013 at Nymphen-
burg Palace and Linderhof Palace, Germany
41
“Temperierung” basically refers to a minimal version of wall heating through pipes mounted in or on the inside of the walls. Since the times of the Romans who developed a kind of wall heating ( ‘hypocaustus’ ) by leading warm smoke through dou-ble outside walls, otherwise known as ‘tubili’, buildings were never again built with double outside walls for heating’s sake. It was a restorer from the Bavarian State Department of His-torical Monuments in Munich, Henning Grosseschmidt, who developed a low impact wall heating system in the 1980s, the so-called “Temperierung” which created similar warm walls as the Roman hypocaust system did. By using radiative heat, ‘Temperierung’ creates an improved indoor climate for human beings, art and building substance. For users of buildings as well as for art, radiation heating has certain advantages in how it transports heat in a building to create comfort for humans and art. Convective heating that is often used but not only in muse-ums creates more draft and distributes more dust. Humid walls and mould problems are not tackled effectively by convective heating when walls are cold. It is astonishing that radiation heat, with all its advantages for people, artefacts, furnishing and building and despite its easiest application possibilities, is so rarely understood, built and used. When designing the Tem-perierung wall heating system, i.e. installation of heating pipes in walls, certain baseline parameters must be carefully deter-mined because the resulting factors have strong mutual influ-ences. In buildings of monumental value, the main priority of implemented mitigation strategies is conservation of cultural heritage. However, certain aspects should not be overlooked, such as solving potential material damage that can arise after implementation and problems that might be linked to local heat transfer and other building physics characteristics of construc-tion materials. It is to be noted that microclimate conditions are subject to constant change and are strongly influenced by visitors, the infiltration of outdoor conditions and different uses of premises. The aspect of energy saving has to be considered
carefully and is case dependent when using the Temperierung wall heating system. Heating outside walls with a low thermal standard can lead to increased heat losses of the building and thus lower energy efficiency. In such a case, a Temperierung heating system can have advantages when used only for con-servation purposes and not for creating indoor comfort for users. The ‘Temperierung’ heating system also prevents cold wall effect and risk of surface condensation and mould growth. These risks are even more common when massive buildings are only occasionally used, unheated or intermittently heated, and where visitors produce significant amounts of moisture, e.g. in churches during the services, in halls during concerts, etc. At the same time, it also reduces impacts of higher moisture levels in walls above the ground, where problems might occur due to water capillary rise because of insufficient waterproofing of old structures.
3.5.1 “Temperierung” case studies in Vienna, AustriaAs shown by the refurbishment of Painting Gallery of Uni-versity of Fine Arts, Vienna, a museum and store room in the basement a Temperierung system cannot create only indoor climate stability. Also energy consumption, investment and maintenance (dust cleaning, etc.) are low in this example. A further interesting example of positive effects of radiation heat is the refurbishing of showroom IV in Museum of Fine Arts, Vienna. Because of bad thermal quality of outside walls in combination with convective heating the paintings had mould on the rear side. The solution was installing a Temper-ierung wall heating at the bottom of the outside wall to over-come humidity due to dew on the wall. After refurbishing the conventional convective heating, the convectors as well as old damp humidifiers in the middle of the room could be put out of order. The room was heated and conditioned solely by wall heating which created very stable and damage preventive in-door climate. Additionally energy consumption in this show-
Figure 2b
Figure 2a
CHAPTER 3.5
Wall heating system (“Temperierung”) Jochen Käferhaus, Ralf Kilian, Mihael Mirtič, Marjana Žijanec Zavrl et al.
Bedchamber
Vestibule
Hall of mirrors
LilasCabinet
Diningroom
Audienceroom
PinkCabinet

42
room was cut by half compared to the original system and control strategy, from about 140 kWh/m²/a to about 70 kWh/m²/a which was proven by a new energy counter mounted in the basement.
3.5.2 “Temperierung” case study in Brežice Castle, Sloveniaone of the case study buildings within the Climate for Culture project was Brežice Castle in Slovenia. At this site, a Temper-ierung wall heating system was installed in the Small Audito-rium, the southwest tower room of Brežice Castle, in order to study the expected benefits, possible side effects and to pro-vide basic design guidelines for stakeholders. This pilot case study allowed the Building and Civil Engineering Institute ZMRK (BCEI ZRMK) to make a comparison with reference rooms in other towers within the same site, where the wall heating sys-tem has not yet been installed, e.g. the armoury exhibition room located in the northeast tower. The conceptual solution of wall heating (“Temperierung”), apart from space heating as its main purpose, proved to have many benefits, for example reducing humidity level in walls and improving thermal comfort for visitors: higher surface temperatures of surrounding wall parts allow lower air temperatures to achieve same or better level of thermal comfort. These aspects make this mitigation strategy an option that is definitely worth considering for fu-ture implementations at similar sites.
3.5.3 “Temperierung” with conservation heating controlat St. Renatus Chapel, Germany St. Renatus Chapel, built in 1686, is situated in a pavilion of Lustheim Palace in Bavaria. Until the beginning of the new millennium, it was completely unheated. It had severe mois-ture damage to the lower parts of the walls from rising damp and summer condensation, and high relative humidity with a yearly average of above 70 % RH. The outer walls also have an additional moisture barrier at about 20 cm height that was installed in the 1970s and that did not prevent further damage or high relative humidity in the unheated church. In the course of a major restoration campaign in 2003, a Temperierung wall heating system was installed (Fig. 1).
By raising the temperature, the walls were dried out (see Fig. 2) and the indoor air relative humidity was lowered consid-erably, even to a level that was considered too low in winter. Especially with the altar pieces in the side niches that are now heated from behind by the ‘Temperierung’ system, new cli-mate-related damages were observed. over the course of the Climate for Culture project in cooperation between the Bavar-ian Administration of State-owned Palaces, Lake and Gardens, Fraunhofer IBP and Krah&Grote Measurements it was possible to install a new control system for the Temperierung that uses the Conservation Heating strategy. The set-point is now 60 ± 2 % RH. Above 62 % RH , the heating starts to lower the relative humidity; below 58 % RH the heating is turned off. This way, too high temperatures during winter time that lead to low rela-tive humidity are avoided and the indoor climate becomes more stable. By reducing the temperature during the winter, energy for heating is also saved. The first results from spring 2014 are showing improvements to the indoor environment with relative humidity in a range between 53 and 63 % RH in 90 % of the time. The indoor environment and state of the artworks will be moni-tored closely in the future.
43
Figure 1: The thermography of the renatus Chapel clearly showsthe wall heating of building components. above the heated zone, the temperature distribution is homogenous.
Figure 2: WUFI© 2D simulation of the development of moisture content in the walls due to Temperierung with a heat pipe below the plaster (on the left) showing the calculated moisture distri-bution after 1.5 years with wall heating.
REFERENCES
1. Bichlmair, Stefan; Raffler, Susanne; Kilian, Ralf: The Temperierung
heating systems as a retrofitting tool for the preventive conser-
vation of historic museums buildings and exhibits. Proceedings
from the AICARR Conference: Historical and existing buildings:
designing the retrofit. An overview from energy performances to
indoor air quality. Rome, 26th-27th-28th February 2014
2. Krus, Martin and Kilian, Ralf: Calculative Investigations on the
“Temperierung” Wall Heating System – Hygric and Thermal As-
pects. In: Kilian, Ralf; Vyhlídal, Tomáš; Broström, Tor: Develop-
ments in Climate Control of Historic Buildings. Proceedings from
the international conference “Climatization of Historic Build-
ings - State of the Art”, Schloss Linderhof, December 2nd 2010,
Fraunhofer IRB, Stuttgart 2011
Figure 1
Figure 2
15.8 °C
14
12
10
9.4
Watercontent [kg/m2]0 < = x < 25
25 < = x < 50
50 < = x < 75
75 < = x < 100
100 < = x < 125
125 < = x < 150
150 < = x < 175
175< = x < 200
200 < = x < 225
225< = x < 250
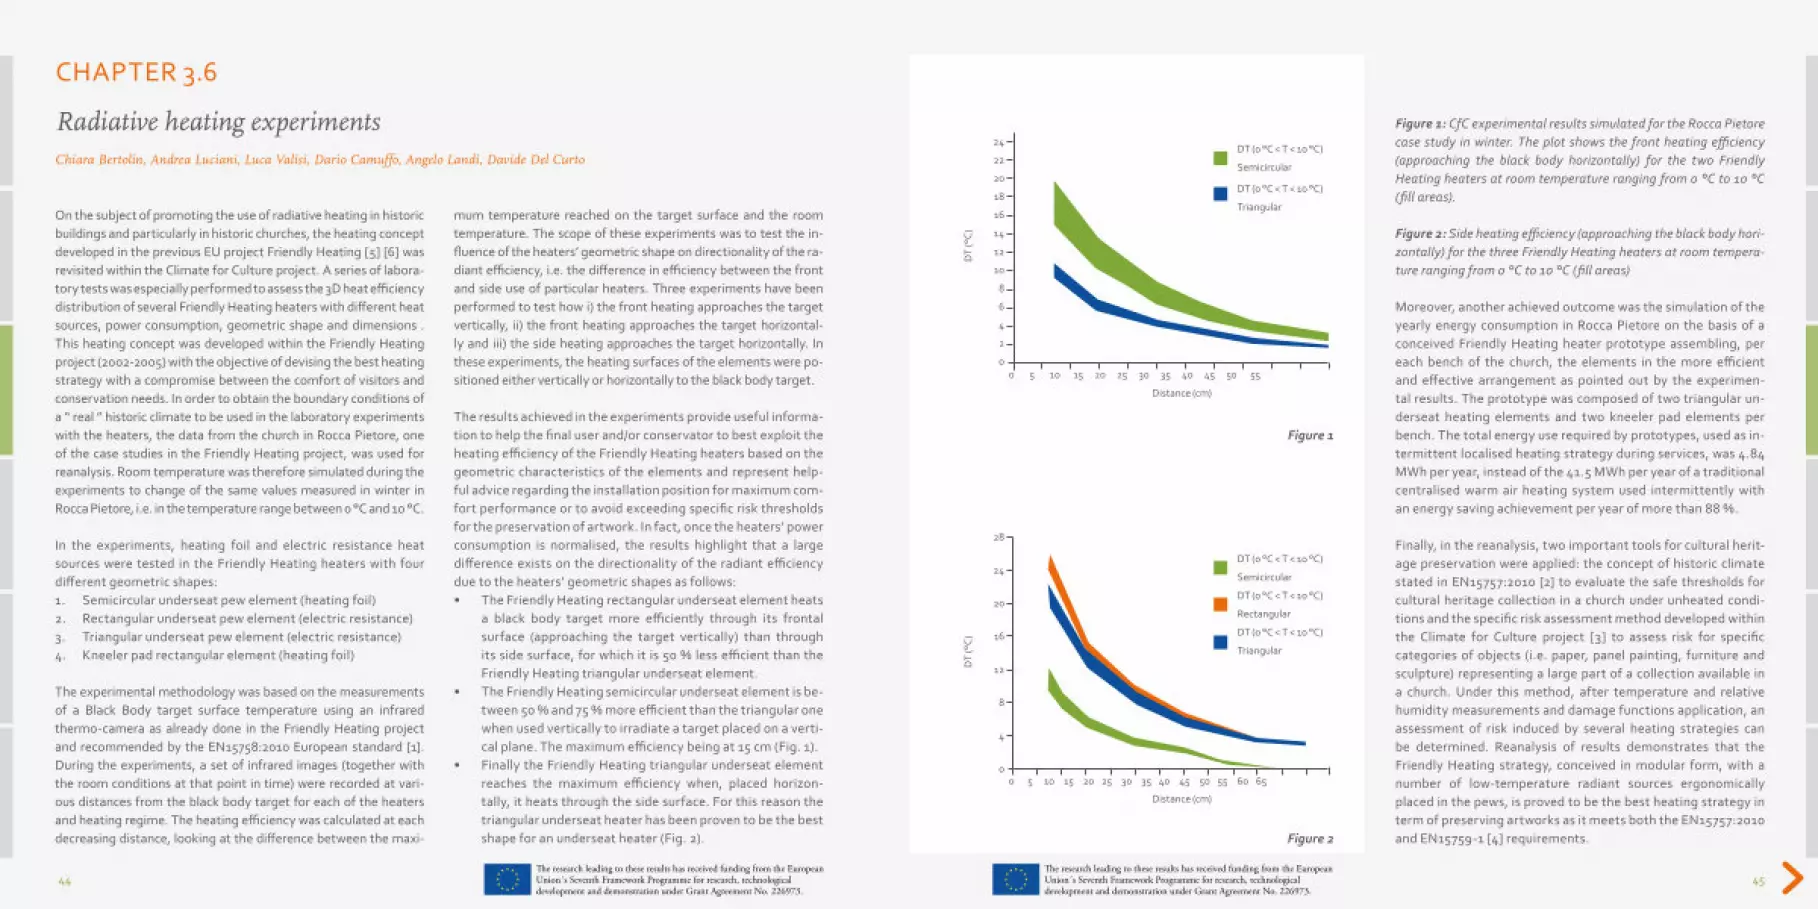
44
on the subject of promoting the use of radiative heating in historic buildings and particularly in historic churches, the heating concept developed in the previous EU project Friendly Heating [5] [6] was revisited within the Climate for Culture project. A series of labora-tory tests was especially performed to assess the 3D heat efficiency distribution of several Friendly Heating heaters with different heat sources, power consumption, geometric shape and dimensions . This heating concept was developed within the Friendly Heating project (2002-2005) with the objective of devising the best heating strategy with a compromise between the comfort of visitors and conservation needs. In order to obtain the boundary conditions of a “ real ” historic climate to be used in the laboratory experiments with the heaters, the data from the church in Rocca Pietore, one of the case studies in the Friendly Heating project, was used for reanalysis. Room temperature was therefore simulated during the experiments to change of the same values measured in winter in Rocca Pietore, i.e. in the temperature range between 0 °C and 10 °C.
In the experiments, heating foil and electric resistance heat sources were tested in the Friendly Heating heaters with four different geometric shapes: 1. Semicircular underseat pew element (heating foil) 2. Rectangular underseat pew element (electric resistance)3. Triangular underseat pew element (electric resistance)4. Kneeler pad rectangular element (heating foil)
The experimental methodology was based on the measurements of a Black Body target surface temperature using an infrared thermo-camera as already done in the Friendly Heating project and recommended by the EN15758:2010 European standard [1]. During the experiments, a set of infrared images (together with the room conditions at that point in time) were recorded at vari-ous distances from the black body target for each of the heaters and heating regime. The heating efficiency was calculated at each decreasing distance, looking at the difference between the maxi-
mum temperature reached on the target surface and the room temperature. The scope of these experiments was to test the in-fluence of the heaters’ geometric shape on directionality of the ra-diant efficiency, i.e. the difference in efficiency between the front and side use of particular heaters. Three experiments have been performed to test how i) the front heating approaches the target vertically, ii) the front heating approaches the target horizontal-ly and iii) the side heating approaches the target horizontally. In these experiments, the heating surfaces of the elements were po-sitioned either vertically or horizontally to the black body target.
The results achieved in the experiments provide useful informa-tion to help the final user and/or conservator to best exploit the heating efficiency of the Friendly Heating heaters based on the geometric characteristics of the elements and represent help-ful advice regarding the installation position for maximum com-fort performance or to avoid exceeding specific risk thresholds for the preservation of artwork. In fact, once the heaters’ power consumption is normalised, the results highlight that a large difference exists on the directionality of the radiant efficiency due to the heaters’ geometric shapes as follows:• The Friendly Heating rectangular underseat element heats
a black body target more efficiently through its frontal surface (approaching the target vertically) than through its side surface, for which it is 50 % less efficient than the Friendly Heating triangular underseat element.
• The Friendly Heating semicircular underseat element is be-tween 50 % and 75 % more efficient than the triangular one when used vertically to irradiate a target placed on a verti-cal plane. The maximum efficiency being at 15 cm (Fig. 1).
• Finally the Friendly Heating triangular underseat element reaches the maximum efficiency when, placed horizon-tally, it heats through the side surface. For this reason the triangular underseat heater has been proven to be the best shape for an underseat heater (Fig. 2).
45
Figure 1: CfC experimental results simulated for the rocca pietore case study in winter. The plot shows the front heating efficiency (approaching the black body horizontally) for the two Friendly heating heaters at room temperature ranging from 0 °C to 10 °C (fill areas).
Figure 2: Side heating efficiency (approaching the black body hori-zontally) for the three Friendly heating heaters at room tempera-ture ranging from 0 °C to 10 °C (fill areas)
Moreover, another achieved outcome was the simulation of the yearly energy consumption in Rocca Pietore on the basis of a conceived Friendly Heating heater prototype assembling, per each bench of the church, the elements in the more efficient and effective arrangement as pointed out by the experimen-tal results. The prototype was composed of two triangular un-derseat heating elements and two kneeler pad elements per bench. The total energy use required by prototypes, used as in-termittent localised heating strategy during services, was 4.84 MWh per year, instead of the 41.5 MWh per year of a traditional centralised warm air heating system used intermittently with an energy saving achievement per year of more than 88 %.
Finally, in the reanalysis, two important tools for cultural herit-age preservation were applied: the concept of historic climate stated in EN15757:2010 [2] to evaluate the safe thresholds for cultural heritage collection in a church under unheated condi-tions and the specific risk assessment method developed within the Climate for Culture project [3] to assess risk for specific categories of objects (i.e. paper, panel painting, furniture and sculpture) representing a large part of a collection available in a church. Under this method, after temperature and relative humidity measurements and damage functions application, an assessment of risk induced by several heating strategies can be determined. Reanalysis of results demonstrates that the Friendly Heating strategy, conceived in modular form, with a number of low-temperature radiant sources ergonomically placed in the pews, is proved to be the best heating strategy in term of preserving artworks as it meets both the EN15757:2010 and EN15759-1 [4] requirements.
CHAPTER 3.6
Radiative heating experiments Chiara Bertolin, Andrea Luciani, Luca Valisi, Dario Camuffo, Angelo Landi, Davide Del Curto
Figure 2
Figure 1
24
22
20
18
16
14
12
10
8
6
4
2
0
DT
(°C
)
0 5 10 15 20 25 30 35 40 45 50 55
Distance (cm)
28
24
20
16
12
8
4
0
DT
(°C
)
0 5 10 15 20 25 30 35 40 45 50 55 60 65
Distance (cm)
DT (0 °C < T < 10 °C)
Semicircular
DT (0 °C < T < 10 °C)
Rectangular
DT (0 °C < T < 10 °C)
Triangular
DT (0 °C < T < 10 °C)
Semicircular
DT (0 °C < T < 10 °C)
Triangular

ChapTer 4 Impact assessment
46
REFERENCES
1. EN 15758 Conservation of Cultural Property – Procedures and in-
struments for measuring temperatures of the air and the surfaces
of objects. European Committee for Standardization, Brussels,
2010
2. EN 15757 Conservation of Cultural Property – Specifications
for temperature and relative humidity to limit climate-induced
mechanical damage in organic hygroscopic materials. European
Committee for Standardization, Brussels, 2010.
3. Martens, M. H. J. 2012. Climate risk assessment in museums.
Technische Universiteit Eindhoven
4. EN 15759-1 Conservation of Cultural Property – Indoor climate -
Part 1: Guidelines for heating churches, chapels and other places
of worship. European Committee for Standardization, Brussels,
2011
5. Camuffo, D., Pagan, E., Rissanen, S., Bratasz, Ł., Kozłowski, R.,
Camuffo, M., della Valle, A. 2010: An advanced church heating
system favourable to artworks: a contribution to European stand-
ardisation Journal of Cultural Heritage 11, 205-219 Doi: 10.1016/j.
culturher.2009.02.008
6. Camuffo, D., 2013: Microclimate for Cultural Heritage - Conser-
vation, Restoration and Maintenance of Indoor and outdoor
Monuments. Second Edition. Elsevier, New York, 560 p. ISBN :
9780444632968
47

48
once the outdoor climate has been modelled and the building simulation has shown how the indoor climate will respond to the outdoor forcing, it is necessary to assess the potential impacts that the various climate-related factors will have on the building interior as well as the objects and collections kept inside. The impact will vary with the specific characteristics and vulnerability of the various materials and methods of construction. The impact assessment tools are mathemati-cal functions either known in the literature or determined with laboratory tests, model simulation and case studies performed within this project.
The project has followed a problem-oriented strategy calculating the inputs (predicted indoor/outdoor climate variables of conservation interest) and the outputs (potential impact and risk for each material or object type). The results concerning the main deterioration factors, threshold levels and critical frequencies have been mapped across Europe.
The results show the situation as it was in the recent past reference period (RP: 1961-1990), and how it will be in the near future (NF: 2021-2050) and in the far future (FF: 2071-2100). The predict-ed changes from the recent past to the near and far futures have been calculated. The outcome consists of 55,560 specific thematic maps over Europe, concerning the likely impacts and risks.
The way in which changes in environment may have an impact on the physical and chemical state of various materials has been studied using a variety of techniques, including Digital Holographic Speckle Pattern Interferometry (DHSPI) and 3D microscopy. These techniques have been ap-plied at various case study sites and in controlled laboratory environments. Parallel studies of environmental sensors such as the Glass Sensor have been carried out.
The predicted increases in damage to heritage items may have an economic impact as the costs of maintenance increase and the ability of the public to enjoy the experience of visiting a historic property decreases. The willingness of the public to pay for the additional conservation work needed to maintain collections at pre-climate-change levels has been assessed.
49
IntroductionIn the context of this project, damage is defined as unwanted ir-reversible change. A damage function is a quantitative expres-sion of the cause and effect relationship between environmental factors and material change. It may be in the form of an equation (or algorithm) that converts environmental data into a prediction of the rate of change or the risk of change.
The Climate for Culture project used damage functions in the calculation of several of its outputs. Real and simulated envi-ronmental data was used in the analysis and decision-support systems and in the creation of the risk maps.
one of the main aims of the Work Package Damage Assess-ment was to find suitable damage functions that could be used by other Work Packages. Four main methods were adopted:
• Looking at the literature and talking to researchers• Measuring changes in situ at historic sites• Looking at the present state of objects• Laboratory tests on token objects
The first approach was the most productive. The remaining three methods produced interesting results but not in time to be used within the project. These new results are described elsewhere in the project literature.
Functions used within the projectSome risk and damage functions can be expressed purely in terms of the measured climate: e.g. number of freeze-thaw cycles, time below zero degrees and time of wetness. others relate to the cor-respondence of environmental data to certain international stand-ards e.g. the ASHRAE specifications or EN 15757. However the majority of functions involve factors related to the chemical and physical properties of different types of heritage objects.
Within the project, functions have been used that describe:
• Mechanical damage to wood, painted wood, stone and plaster
• Chemical damage to paper, textiles and photographic ma-terial
• Biological damage caused by mould growth and insect at-tack
Some of these functions have been in use for a number of years, such as those derived by Stefan Michalski at the Canadian Con-servation Institute or Marion Mecklenburg at the Smithsonian in Washington. others were published after the 2009 start of the Climate for Culture project by, amongst others, Peter Brim-blecombe at the University of East Anglia (UEA), Matija Strlič at University College London (UCL) and the Polish group led by Roman Kozlowsi in Krakow. Three influential PhD theses were published during the course of the project by Anne Fenech (UCL), by Paul Lankester (UEA) and, within the CfC partnership, by Marco Martens at the Eindhoven Technical University (TUE).
Inputs and outputsThe inputs of hourly RH and T data from measurements or simu-lations have been converted into different outputs. For the nu-merically competent, graphs and data distribution histograms can be generated. More friendly pictorial climate maps show changes in properties such as temperature and humidity mixing ratio. Hazard ‘value’ maps show the distribution of numerical val-ues calculated using damage functions for different hazards such as mould growth. Where there are accepted thresholds that di-vide different levels of risk into categories such as high, medium and low, these are displayed as hazard ‘risk’ maps.
The following discussion records some of the intellectual consider-ations that are not apparent in the visible products of the project.
CHAPTER 4.1
Impact assessment Jonathan Ashley-Smith and Dario Camuffo
CHAPTER 4.2
Damage functionsJonathan Ashley-Smith
50
Between the inputs and outputs, there are several stages of data processing that require decisions e.g. whether to apply the damage function to yearly averaged values or take the average of values of functions calculated for every hourly set of data. The stages of risk assessment include estimation, evaluation and communication. The communication of risk involves deci-sions about the choice of thresholds and the appropriateness of ‘traffic lights’ to denote levels of risk. The choice of scale di-visions and colour ranges for the maps is an important stage in the risk communication strategy. At both the data process-ing stage and the risk communication stage it is essential to be aware of seasonal peaks that might be ignored when looking at annual trends.
Selecting damage functionsThe range of possible functions and the advantages and dis-advantages of different types are discussed in detail in the two deliverables: D 4.1 “Report on newly gathered knowledge on damage func-tions” and D 4.2 “Report on damage functions in relation to climate change and microclimatic response” (www.climate-forculture.eu).
The number of maps that could be produced had to be limited. Each function would have to be calculated for two climate sce-narios, three time slices and differences between past and future, 16 exemplary building types and 10 case studies. To keep the number of maps manageable it was necessary to make a small selection of damage functions from the large range possible.
Ideal criteria suggest that the damage function:
• should lead to information and advice useful to the stake-holder
• must represent (an eventual) decrease in fitness for pur-pose
• which must be apparent within a meaningful timeframe• must model the dominant mechanism of decay• must not generalise materials too much• cannot be too dependent on local variables
The last two criteria are important. For instance the material type ‘metal’ is too generalised; the chemical reactivity (envi-ronmental susceptibility) of iron is very different to that of gold.
A number of functions are very dependent on local variables. Pollution levels vary greatly between urban, rural and coastal environments. It would be inappropriate to create maps that were highly contingent on local conditions and required com-plex textual explanations to make them universally useful. With the indoor environment, levels of risks such as mould growth and insect attack are very dependent on local management. At-tempts to predict changes in risk on a Europe-wide basis would be subject to a large number of provisos.
While attempting to use the criteria listed, the Climate for Cul-ture project has not completely avoided the pitfalls discussed above.
UncertaintyThe project relies on a chain of information, relationships and decisions, from the choice of IPCC scenario through the conver-sion of predicted outdoor environments into predicted indoor environments to the integration of damage functions into the production of the final outputs. The propagation of uncertainties through this process is investigated in the paper ’Uncertainties in damage assessments of future indoor climates’ [1] which first appeared in the post-prints of the conference ‘Climate for Collec-tions: Standards and Uncertainties’ and can be found in modified form in deliverable D5.2. one way to become comfortable with uncertainty is to abandon the illusion of certainty suggested by the use of equations and graphs. The ‘equals’ symbol in a dose-response relationship does not have the universal validity associ-ated with its use in 2 + 2 = 4 or in a balanced chemical equation. At best it suggests that if you put the same numbers in on one side you will always get the same number out on the other, irrespec-tive of any relationship to the real world.
Some idea of the possible uncertainty is given in the interna-tional of standard on metal corrosion ISo 9223-2012. The un-certainty of using the published damage functions is estimated to be minus 33 % to plus 50 %.
51
Damage and valueMost damage functions predict changes in measureable chemi-cal or mechanical properties of heritage materials. It is rare to find functions that relate to changes in heritage values. one successful attempt by Anne Fenech [2] plots subjective re-sponses to the deterioration of colour photographs.
Keeping it realTo avoid the complexity of studying real changes in heritage objects, damage function has been derived using dosimeters that give a single type of measureable response. However, in re-lating a dosimeter-derived function to any real world changes, it should be remembered that the only thing that follows the dose-response relationship is the dosimeter. The dosimeter is not designed to mimic objects but to measure aspects of the environment.It looks at short-term changes to fresh materials. It does not explain progress over a period of years or decades.
one recent damage function derived by Matija Strlič attempts to deal with the oversimplification of defining a diverse material with a single word such as ‘paper’ and can also cope with changes that take place as the material ages [3].
ValidationAt the sometimes very low temperatures found in the uncondi-tioned building modelled in this project, the function predicts lifetimes far in excess of human experience of paper. So it is not possible to use real world experience to validate the function.
The functions used to predict more rapid and obvious risks such as an insect or mould attack might be validated if there were Europe-wide records stretching from the ‘recent past’ to the present day. one recent UK study of insect catches tends to support the postulated relationship between increasing temperatures and increasing insect risk [4]. However the study warns that “the abundance of insects is not driven by tempera-ture alone”. Factors such as the efficiency of local management may be equally important.
REFERENCES
1. Leijonhufvud, Gustaf; Kjellström, Erik; Broström, Tor; Ash-ley-Smith, Jonathan and Camuffo, Dario (2013). Uncertain-ties in damage assessments of future indoor climates.Cli-mate for Collections. p. 405; http://www.doernerinstitut.de/en/projekte/kuk2013/kuk_1.html
2. Fenech, Anne (2011): Lifetime of Colour Photographs in Mixed Archival Collections; PhD Thesis UCL
3. Matija Strlič: “Modelling Change and Damage”, Collections Demography Colloquium. https://www.youtube.com/watch?v=dCvbZTQljQEUCL 23 July 2013
4. Brimblecombe, Peter and Caroline (2014). Trends in insect catch in historic properties. Journal of Cultural Heritage.

52
outdoor and indoor impact/risk maps constitute a powerful tool for preventive conservation and policy makers. The assess-ment of impact and risk potentially caused by climate change has been evaluated for 19 environmental variables and various building types (i.e. 16 building types and 10 case studies) under two IPCC emission scenarios (i.e. A1B and RCP4.5).This contribution considers the most likely impact of indoor cli-mate change on cultural heritage materials for the 2021-2050 near future and the 2071-2100 far future in reference to the 1961-1990 recent past, highlighting the most critical changes that will likely occur across Europe. To this aim, the four main Köppen simplified Climate Regions in which Europe may be classified have been considered, i.e. (1) subarctic, (2) humid continental, (3) marine Western coast, (4) Mediterranean (Figure 1). The Köppen classification system, originally based on vegetation, has been preferred because it is based on temperature and precipitation that are also funda-mental for conservation too. In this simplification, however, so-vereign state borders prevail over small different climatic areas, neglecting local departures. Figure 1: The four Köppen simplified climate regions considered in the Climate for Culture project
The main deterioration mechanisms considered are: mechanical, chemical and biological, as follows.
Mechanical damagesMain forcing factors are heat and moisture changes, cycles and changes of phases. Key parameters are temperature (T) and re-lative humidity (RH).
In the recent past, RH has high value and quite low variability in Northern Europe, followed by Central Europe, Western Europe and Mediterranean where a wide range of RH is expected but
53
with generally lower values. In the far future, no remarkable RH changes are expected among buildings over different climate areas. T: higher variability, above all for small buildings, is expected in Northern Europe (from -2.5 °C to +12.5 °C) and in the Mediterra-nean (from 10 °C to 25 °C); then Western Europe with T ranging from 5 °C to 17.5 °C and finally Continental Europe from 7.5 °C to 17.5 °C. In the future higher changes are expected in Northern Europe (a change in temperature from +2 °C up to +6 °C) and in Southern Europe (from +3 °C up to +6 °C – small buildings), the less affected zone from climate change being Continental Euro-pe (from +2 °C to + 4 °C). The T change under the RCP4.5 scenario is lower than under A1B of about 1 °C in zone 2 and 3, lower of about 2 °C in zone 1 and of about 3 °C in zone 4.
In addition to T and RH, other variables are sensitive to mecha-nical risk depending on the cultural heritage materials:
Marble, stone and masonry, in building envelopes (BE) and objects (o). Mechanical damages related to objects are driven by freeze-thaw cycles (FTC). Similarly, NaCl salt crystallisation cycles (SCC) and Thenardite-Mirabilite cycles (TMC) have been considered. For all the above variables risk has been assessed by calculating the number of cycles per year.
Salt crystallisation cycles: The reference period shows that small buildings have greater variability in the number of SCC with regards to large buildings. Regions 2, 3 and 4 show a larger ran-ge of values. Higher number of SCC are simulated in region 3 for lightweight buildings. In the far future, a mean decrease in SCC is observed all over Europe above all in large buildings (up to -35 N°/yr), a little bit higher in Region 1. The RCP4.5 scenario shows a slower future cycles decrease compared to A1B.
Thenardite-Mirabilite cycles: There is a light difference in risk between Northern and Continental Europe (max 140 N°/yr) and Western Europe and the Mediterranean region (max 160 N°/yr). Larger buildings are at higher risk within these areas. In the future, zone 1 will increase TMC risk by an average of 10 N°/yr, instead the rest of Europe will benefit from climate change, de-
creasing TMC down to -30 N°/yr in Eastern and Southern Euro-pe regardless of the building type. The RCP4.5 scenario shows in the future a lighter decrease.
Freeze-thaw cycles: The behaviour is similar to the TMC with the difference that the maximum risk (60 N°/yr and 40 N°/yr) is reached by lightweight buildings with high Moisture Buffering Performance (MBP). Generally, in the far future, the risk will de-crease (-20/-30 N°/yr) except for the Atlantic Western Europe and the Mediterranean region (small buildings only) where no significant changes are expected. RCP4.5 shows smaller future changes.
Wood: Climate-induced risks on wood are due to RH cycles/changes. Specific damage functions have been used to evaluate the mechanical risk for objects sensitive to moisture fluctua-tions as wooden panel painting (risk on pictorial layer and base material), wooden sculpture and furniture. Risk is expressed by traffic light method in term of arbitrary units (AU) as follows:
Panel painting-base material: over the reference period, all four climate regions, irrespective of the building types, high-light an average situation (orange in the risk colour code) ran-ging between 0.9 to 1.1 arbitrary units (AU). In the far future, there is a scenario of a mixed situation with sub-areas safe or at risk within the Mediterranean belt (irrespective of building type) and Northern Europe for heavyweight buildings. An in-crease of up to +1 in AU is expected for Central and Western Europe and for lightweight buildings in Northern Europe. The RCP4.5 scenario shows different outcomes in Continental Euro-pe compared to A1B.
Panel painting-pictorial layer: Light risks for small buildings in Continental Europe (ranging from 0 to 1.4 AU), higher risks in some sub-areas in the Mediterranean (ranging from 0 to 2 AU), Northern and Western Europe being safer, in particular for large buildings. In the far future, a mixed situation is expected all over Europe except in Northern Europe where heavyweight buildings will experience a risk decrease (down to -1 AU). RCP4.5 highlights a non-homogeneous situation.Sculptures: over the reference period, similar situation as for
CHAPTER 4.3
Risk assessment Chiara Bertolin and Dario Camuffo
Figure 1
1
1
2
4
4
3

54
the panel painting-base material. In the future, the risk will increase slightly all over Europe in all buildings with certain va-riability for high MBP small buildings in Region 4.
Furniture: Low/medium risk is expected, irrespective of building types, in Continental and Mediterranean Europe; in the North, risk slightly increases for small buildings, while the safe region, in particular for lightweight buildings, is Western Europe. In the fu-ture a mixed change with spot areas where the risk can increase or decrease is expected in Western and Southern Europe and for large buildings in Northern Europe. Instead in Continental Euro-pe, however, the risk will decrease down to -1 AU.
Chemical degradationChemical deterioration is controlled by both T and RH. The risk on paper (both historic - pH 7 and modern - pH 5) and on silk can be expressed in terms of AU with the traffic light code or as expected lifetime in years, whereas the risk for colour photo-graphs is calculated as an overall colour change in terms of Red Green Blue (RGB) occurring in time.Historic paper: In the past, the lower risk for large building with low MBP in Northern Europe (lifetime of up to 200,000 years), Continental Europe and Mediterranean have a similar lifetime of up to 80,000 years and the higher risk was expected in Wes-tern Europe with 25,000 years In the far future, the risk will increase (due to the lifetime decrease) especially for Northern and Central Europe.
Modern paper: The risk is distributed spatially just like for his-toric paper but the quantitative values are a bit different. Silk: In the past, the minor risk was obtained for Northern Eu-rope, then followed by the Mediterranean region where only some risky areas were expected, Continental Europe and finally Western Europe that were the most at risk. In the far future, the risk will increase over the Mediterranean belt, although some spot safe areas will be still expected. Then the risk will increase in Western and Central Europe.
Biological deteriorationBiodeterioration of various material types (i.e. stone materials, wood, paper, silk and colour photographs) depend on the com-
bination of RH and T, as follows.
Mould (risk expressed in mm/yr of mould growth): over the past reference period, mould growth conditions are similar for all large buildings in Northern and Central Europe and the Me-diterranean (up to 150 mm/yr). Small buildings instead high-light lower growth conditions, especially in the Mediterranean belt. The most risky area is Western-Atlantic Europe (max up to 250 mm/yr - regardless of the building type).In the future, the mould growth risk will increase for larger buildings and above all in Northern Europe (zone 1 - up to +120 mm/yr; zones 2 and 3 - up to 80 mm/yr). The Mediterra-nean region does not highlight any change of risk. The RCP4.5 scenario shows half the risk of the A1B scenario in Regions 1 and 3 and a light increase in risk across the Mediterranean belt.
Insects (risk expressed in degree days per year): Area of gre-ater/lower risk is the same for insect T and RH dependent in the past as well as in the future, the changes only concern the quan-titative level.
RH (e.g. woodworm) and T dependent (e.g. clothes moth). In the past, lower risk is expected for large buildings in Northern Europe (up to 500 DD/yr), in Central and Wes-tern Europe the risk increases (up to 1500 DD/yr for small building and up to 1250 DD/yr for large ones). In the Medi-terranean, the risk variability increases up to 2500 DD/yr, a bit less for lightweight buildings.In the far future, the risk will increase, irrespective of building type in Northern and Central Europe, respectively up to 400 DD/yr and 600 DD/yr; in Western Europe the risk is higher for lightweight buildings (up to 800 DD/yr). In the Mediterranean belt there is a mixed scenario: it is higher for low MBP and hea-vyweight buildings while it is lower for lightweight building with small window area. RCP4.5 scenario is a bit lower than A1B.
55
IntroductionThe changing climate and especially changes in temperature and humidity have a long-term impact on the physical struc-tures of materials. It involves slow but steady changes of the dimensions of the physical system as a tendency to equilibrate with the surrounding environmental conditions. These spatial alterations provoke invisible structural deteriorations that re-main invisible as long as the materials consisting of the physi-cal body remain among the elasticity range. The deformation that occurs as response to the continuous effort for equilib-rium deteriorate the structural integrity. In the presented experimental research, an effort is made to visualise the invisible effects as they are witnessed by the di-mensional alterations caused by Relative Humidity (RH) which affects the moisture content (MC) for example in the mate-rial wood. The moisture of the wood strongly influences the a) wood density, b) mechanical properties, c) the electric and thermal coefficients, d) wood treatments or machining and e) wood resistance against mould and insect colonisation. Wood moisture under the fibre saturation point increases the wood durability and resistance. Wood density is the best indicator for the quality and mechanical durability and resistance of wood with higher density signifying better mechanical prop-erties and endurance.
Applied techniques to detect alterations in artistic materialsIn the Climate for Culture project complimentary types of in-strumentation were used for in situ measurements of objects of art: this combination allows precise and integrated measure-ment of the real damage impact of climate change on cultural heritage at regional scale. To measure the relative displace-ment due to dimensional changes caused by fluctuations of RH/T, a new prototype system based on interferometry prin-
ciples named digital holographic speckle-pattern interferom-etry (1) (DHSPI) was implemented. Conventional RH/T sensors (2) were used to record environmental conditions while a new range of experimental sensors were used as well: Glass dosim-eter sensors (3) (GS) to record the synergetic corrosive impact of the specific environment either at outdoor positions, in-door positions or the micro climate of an object (ΔΕ value) and Free Water sensors (4) (FWS) to record the free water inside natural cavities. A 3D video microscope (5) (3DM) was used to examine the cavities. The focus of this chapter is primarily on the results of the DHSPI system showing the deformation impact of fluctuating RH.
1. IESL-FoRTH (GR)
2. Krah&Grote (DE)
3. Fraunhofer Institute for Silicate Research (DE)
4. CNR-ISAC-Fondazione Maugeri (IT)
5. University of Ljubljana (SI)
CHAPTER 4.4
Experimental investigation of surface monitoring of materials in environmental conditions Vivi Tornari, Eirini Bernikola, Nota Tsigarida, Kostas Hatzigiannakis, Michalis Andrianakis, Violeta Bokan Bosiljkov and Johanna Leissner

56
Digital Holographic Speckle Pattern Interferometry (DHSPI)This laser interferometry portable system, shown in Figure 1, was developed through EU-funded projects Laseract and MultiEncode: it is capable of remotely recording optical dis-placements of endangered surfaces in the range of fractions of a micrometre.
Figure 1: portable DhSpI system in operation
Figure 2: Temperature and relative humidity recording at Brezice Castle: (a) small auditorium (heated) 17/02-18/02/2011, (b) chapel (unheated) 16/02-17/02/2011
The data traces in the form of interference fringe patterns the local and whole field displacement fields used in deformation measurements. As shown in Table 1, these can reveal:
Table 1
Glass Dosimeter SensorsThe glass dosimeter sensors were developed by Fraunhofer ISC in a previous EU project (AMECP 1993-1996) and have since been applied throughout Europe and beyond. The results from these glass sensor studies contain the ΔE values, which are di-rectly correlated with the environmental conditions (degree of
57
corrosivity) at the exposed location, and are listed in the cat-egories “stained glass windows”, “storage rooms and display show cases” and “outdoor measurements”. This database is necessary to be able to compare new measurements within Climate for Culture with “historic data”. Each set of glass dosim-eter sensors contains three single dosimeters. Two are dosim-eters with the glass composition M1.0 (extremely sensitive) and one with MI (less sensitive). Two sets of dosimeters are installed inside. Another set is installed outside. The ΔE-value from the outside is compared with the value of the dosimeter study from measurements previously performed. The ΔΕ-value from inside is correlated to the values of the RH/T as recorded from the con-ventional sensors and FWS. Another potential is the comparison of GS values to the interferometry deformation values
Free Water SensorsThis easy-to-read sensor provides information on the available water content of the air. Furthermore it facilitates the finding of suitable application sites for the conventional RH/T sensors and thus allows for faster access to environmental control.
Digital Video Microscope System Hirox (3DM) The Digital Video Microscope System Hirox allows measure-ments on specimens to study cracks and internal cavities which can be combined with the interferometry measurements. The results are encouraging for comparative studies using non-con-tact DHSPI interferometry: anomalous surface fringe pattern distributions indicate endangered areas of the examined art-work while the 3DM confirms the cause of the abnormality. The techniques can provide 4D maps of surfaces.
Results from the combination of sensors and DHSPI systemThe glass dosimeter sensor result shows no corrosive impact at all with a ΔE value of zero for the unheated room in the Chapel of Brezice Castle campaign in Slovenia whereas the heated room in the small auditorium has a slightly higher value, meaning a higher environmental impact on the art objects (see Table 2 and Figure 2). This is in line with the T and RH measurements which demonstrate that heating the room leads to a higher degree of RH/T fluctuation. Although the fluctuation is quite small, it pro-vokes corrosion in the glass dosimeter sensors also indicating
potential changes in the mechanical properties of other types of materials. The glass dosimeter sensors were exposed for 3 months in each location from 17 February-17 May 2011.
Table 2
The in situ examination of the wall painting from Brezice con-firm the findings: it was observed that the rate of deforma-tion in the heated auditorium was higher compared to the rate in the unheated chapel (see Table 3). The rate of displace-ment corresponds to the GS deformation of the examined surface in the heated room during the monitoring period. The DHSPI/3DM combination mapping is seen in Figure 3.
Table 3
Figure 1
Local field distribution
· Defect influence on surface and deterioration
1. Defect detection map – qualitative analysis
2. Risk priority map – quantitative analysis
Whole field distribution
1. Mechanical integration assessment
· Homogeneity/inhomogeneity of surface
2. Environmental effects
· Monitoring of surface reaction
Whole/local fields
1. Impact assessment
· Transportation/handling/interventions
Glass dosimeter No.
Glass dosimeterlocation E0 value E1 value ΔE value
110141CHAPEL (UNHEATED) 0.046 0.046 0.000
110161 SMALL AUDITo-RIUM (HEATED)
0.046 0.050 0.004
DHSPI (displacement) in the heated room: max. rate difference: 1.5 μm/min
DHSPI (displacement) in the unheated room: max. rate difference: 0.035 μm/minFigure 2a
Figure 2b
Temperature (°C)
Relative Humidity (%)
Temperature (°C)
Relative Humidity (%)
55
50
45
40
35
30
25
20
15200 400 600 800 1000
Monitoring duration (min)
10,09,59,08,58,07,57,06,56,05,55,04,54,03,53,02,52,01,51,00,50,0
0 100 200 300 400 500Monitoring duration (min)
Tem
pera
ture
(°C
)
Rela
tive
hum
idit
y (%
)

58 59
Figure 4a-e: The response of the examined sample in terms of relative displacement in relation to t=0 is presented in a, b. The circles in c-e show the graphical expression and the start of discontinuity.
REFERENCES
1. Tornari, v.; Bernikola, E.; Bellendorf, P.; Bertolini, C.; Camuffo,
D., Kotova, L; Jacob, D.; Leissner, J. “Surface monitoring meas-
urements of materials on environmental change conditions”
SPIE 8790, optics for Arts, Architecture, and Archaeology
IV, 87900C (2013); doi: 10.1117/12.2022521
2. Leissner, J.; Beuschlein, S.; Pilz, M.; Martin, G.; Blades, N. and
Redol, P. Assessment and Monitoring the Environment of Cultural
Property. Final Report. 1993-1996 in European Cultural Heritage
Newsletter on Research, Special Issue Volume 10 (1997), 5-50
Figure 3: (a) In situ examination of wall painting with DhSpI and 3DM. The wall painting is located in the unheated chapel. Com-parative study in a focused area with (b) 3DM (c) DhSpI results
Results from DHSPI systemA new experimental approach to defining deformation threshold values with direct full-field surface monitoring in an automatic, non contact and remote real-time mode has been realised. The results are consistent and repeatable. An indicative example of longer term RH climate-induced alterations in climate chamber experiments with direct surface monitoring is shown in Figure 4a-e. It is noticeable that the diagrams represent values and graphical expressions that are non-continuous. Specifically the intense alterations that take place during the 7th day and con-tinuing through the 8th day with considerably high values of relative displacement are highlighted by circles. The relative dis-placement at these points reaches 600-650 μm. The upcoming failure of the sample is seen in a well preventive period ahead of fracture. The "variability" of the reaction in frequency and ampli-tude over the safe zone (threshold value of Rate of Deformation) has been experimentally observed to be the sign of the climate-induced deterioration impact.
ConclusionsA new experimental approach to defining deformation threshold values with direct full-field surface monitoring in an automatic, contactless and remote real-time mode has been further devel-oped within Climate for Culture. The results are consistent and re-peatable through the experimental course from preliminary exper-iments to the advanced physical quantities correlation. This new methodology allows for visualising and quantifying the influence of changing climates directly on the artworks themselves in particular the impact of short term fluctuations, and will thus contribute to developing appropriate conservation strategies.
Figure 3a
Figure 4 (a-e)
Figure 3cFigure 3b
Displacement800
600
400
200
0
-200
-400
-600
-20 0 20 40 60 80 100 120 140 160 180Time (Hours)
Dis
plac
emen
t (µm
)
day 3
day 7
day 8
5.00 %
3.00 %
1.00 %
-1.00 %
-3.00 %
-5.00 %
-7.00 %
-9.00 %
-11.00 %1 2 3 4 5 6 7 8 9 10 11 12 13 14 15 16 17 18 19 20 21 22 23
200
100
0
-100
-200
-300
-400
-50045 50 55 60 65 70
Time (Hours)
Dis
plac
emen
t (µm
)
Day 3
800
600
400
200
0
-200
-400
-600160 165 170 175 180 185
Time (Hours)
Dis
plac
emen
t (µm
)
Day 8
600
400
200
0
-200
-400
135 140 145 150 155 160Time (Hours)
Dis
plac
emen
t (µm
)
Day 7

60
This study is the most comprehensive and in-depth analysis ever undertaken of the economic benefits of reducing climate change damages to cultural built heritage interiors (CBHI) in Europe. The focus is on non-iconic heritage and specifically the contents inside the heritage buildings (e.g. collections such as paintings, wooden objects or textiles). our contention is that these materials provide similar types of services (e.g. leisure and recreation, education and knowledge, spiritual benefits and sense of place and identity) which increase the scope for transferability of the estimated values and for subsequent use in project appraisal [1].Climate change is expected to lead to gradual changes in tem-perature and relative humidity over a period of 100 years (based on the A1B IPCC scenario from the 4th IPCC report). In the ab-sence of adequate conservation measures these changes are likely to give rise to gradual increases in deterioration rates in CBHI due to mould growth, cracking, infestation and reduced object life-time (Fig. 1). Most of the benefits of conservation in this case are non-market in nature i.e. they are not reflected in market price changes. In order to convert heritage benefits, i.e. increases in welfare after an improvement in a heritage asset, into a monetary figure, which enables different policies to be evaluated on a con-sistent basis, we elicit people's willingness to pay (WTP) for these welfare-enhancing outcomes using stated preference methods [2].
We selected five European case study countries (Fig. 3) – Germany, Italy, Romania, Sweden and United Kingdom – and ten case study sites within these countries – Ham House (Fig. 2), Knole and St. Joseph & the English Martyrs Church (UK), Gotland churches (Swe-den), Bronnbach Monastery, Linderhof Palace, Neuschwanstein Castle and Pergamon Museum (Germany), Black Church (Romania), and Ca' Rezzonico (Italy). The case studies sites include three differ-ent types of built heritage – palaces or manor houses, churches and museums. We surveyed over 4,000 people in the 5 countries, using
online general population surveys to value the conservation of each country’s built heritage interiors from climate change damages; in addition, we interviewed around 2,000 visitors in the 10 individual sites to value the conservation of the interiors of each site. We found evidence of considerable economic benefits for both visi-tors and general population, associated with the protection of CBHI from climate change damage across all countries and case study sites. We also find that heritage conservation values can be suc-cessfully be transferred [1] with moderate errors between sites, par-ticularly when populations and valuation methodologies are most similar.
Visitor survey findings• Case study site visitors actively visit other types of built herit-
age as well. In general, churches, chapels and cathedrals ap-pear to be the most frequently visited sites.
• In some cases, external features and architecture of a proper-ty were seen to be very important (Ham House, Knole, Neu-schwanstein, Bronnbach), while in others the interior features and collections had precedence (St Joseph Church, Gotland churches, Black Church, Pergamon, Ca’ Rezzonico). In the case of Linderhof Palace, both external and internal features seemed to be of similar importance.
• In all cases, the overwhelming majority of visitors would con-tinue to visit the case study sites even in the presence of cli-mate change damage. However, for about a third of respond-ents, the enjoyment of the visit could be affected.
• Results indicate very strong and positive attitudes to-wards heritage conservation from visitors. In all sites, the large majority of respondents agree that built heritage is vulnerable to climate change and also provides value to non-visitors. Romanian and Italian visitors have particularly strong views with some 90 % agreeing that built heritage is vulner-
61
able to climate change. Similarly, the overwhelming majority of visitors disagree with the assertion that the state of con-servation of built heritage in 100 years’ time does not matter.
• The majority of visitors in all case study sites were at least somewhat familiar with the climate change impacts de-scribed in the survey. Romanian, Italian and Swedish sites ap-pear to have the highest proportion of visitors familiar with climate change impacts (roughly 95 %), while UK sites have the lowest (about 75-80 %).
• The majority of visitors across all 10 sites were satisfied with the state of conservation of the site they were visit-ing. The highest levels of satisfaction were encountered in Ca' Rezzonico (95 %), Neuschwanstein (95 %) and Gotland churches (94 %). The proportion of those noticing signs of deterioration was higher in Bronnbach Monastery (55 %) and Knole House (46 %).
• Some 45 % of Romania’s Black Church and 53 % of Italy’s Ca’ Rezzonico’s visitors selected cultural heritage amongst their top three choices for public spending priorities, compared to only 20 % of visitors of the UK’s Knole House and 24 % visitors of Sweden’s Gotland churches.
• The proportion of visitors not willing to pay for the protection of the case study site interiors from climate change damages varies widely from 7 % in Bronnbach Monastery and St Joseph Church, to 32 % in Ca’ Rezzonico, Neuschwanstein Castle and Gotland churches (Table 1).
• For nine of the sites, the median WTP values per visit are remarkably similar, not just between the same country or the same type of heritage (palace, museum or church), but across all sites, varying from €1 for the Pergamon Mu-seum, Neuschwanstein, Black Church and Gotland church-es to €2 for the remaining sites. Visitors allocate between 52 % to 62 % of their total WTP to protect from gradual cli-mate change damage, with the remaining being allocated to protect from extreme weather events such as flooding.
• Rough conservative estimates of total annual visitor WTP to conserve the case study sites from gradual climate impacts vary between €10,000 for St Joseph Church and €28,000 for Bronnbach (the sites with fewer visitors), to €830,000 (Neuschwanstein) and €750,000 (Pergamon), using median WTP.
CHAPTER 4.5
The economic benefits of conserving built heritage interiors from climate change damage in Europe Susana Mourato, Eleni Fimereli, Davide Contu and Chris Gaskell
Woodworm damage (National Trust Images)
Figure 1
Ham HouseNational Trust for England, Wales and Northern Ireland
(National Trust Images/John Hammond)
Figure 2

62 63
• As expected, income is a positive determinant of WTP for conservation. Visiting heritage sites, being a member of an environmental organisation, being religious and having posi-tive attitudes towards heritage also have a positive effect on WTP.
• We also find that transferring values for heritage conserva-tion across countries can yield reliable results in many cases, particularly when populations and valuation methodologies are most similar. Excluding Romania, unit value transfer er-rors vary between 13 % and 53 %, which is within what is con-sidered to be an acceptable range, similar to those in previous studies involving international transfers.
Table 1: Visitor willingness to pay for the conservation of the case study sites’ interiors from climate change damages (€ per person, per visit)
*Annual payment
Figure 3: Visitor survey countries
Table 2: General population willingness to pay for the conservation of their country’s built heritage interiors from climate change dam-ages (€ per person, per year)
REFERENCES
1. Pearce, D., Atkinson, G. and Mourato, S. (2006) Cost Benefit Analy-
sis and the Environment: Recent Developments. oECD, Paris.
2. Bateman, I., Carson, R.T., Day, B., Hanemann, M., Hanley, N.,
Hett, T., Jones-Lee, M., Loomes, G., Mourato, S., ozdemiroglu, E.,
Pearce, D.W., Sugden, R., and Swanson, J. (2002) Economic Valua-
tion with Stated Preference Techniques: A Manual. Edward Elgar,
Cheltenham.
high priority for public spending in these countries (Table 2). The percentage of those not willing to pay for heritage con-servation in other countries was much lower (11 % to 15 %).
• overall, we found significant economic benefits associated with the protection of built heritage interiors from climate change damage across all countries. Median WTP per person per year is similar in the UK, Germany and Italy (around €10), highest in Sweden (€17) and lowest in Romania (€5), consist-ent with the fact that average income is highest in Sweden and lowest in Romania. Respondents allocated between 62 % and 76 % of their total WTP to the protection from gradual climate change damage, with the remaining being allocated to reducing the risk of damage from extreme weather.
• Rough conservative estimates of annual WTP for the conser-vation of all national built heritage interiors from gradual cli-mate impacts vary between €22 million for Romania to €290 million for Germany (using median WTP).
• As expected, income is a positive determinant of WTP for conservation. Visiting heritage sites, noticing signs of dete-rioration and having positive attitudes towards heritage also have a positive effect on WTP.
• our results also show that, when visitor populations and valu-ation methods are similar, low and moderate transfer errors can be found when transferring values between similar or dif-ferent types of heritage sites and between countries.
General population survey findings• There is a relatively high level of use of heritage sites
amongst the general population with most people, in most countries, having visited heritage sites in the last 12 months.Italian and Romanian respondents seem to visit religious buildings the most, with the UK and Sweden samples visiting the least.
• overall, the internal features of a property, closely followed by the recreation potential and the external characteristics seem to be the most valued features of heritage sites across all countries.
• We found very positive attitudes towards heritage conserva-tion from general population samples. The vast majority of respondents, across all countries, agree that built heritage is vulnerable to climate change, contribute to national identity and provide value for non-visitors as well as disagree with the assertion that the state of conservation of built heritage in 100 years’ time does not matter. Romanian and Italian re-spondents have particularly strong positive views.
• The majority of respondents in all countries were at least moderately familiar with the general and specific climate change impacts described in the survey. Level of concern with climate change impacts appears to be highest among Italian and lowest among British respondents.
• About a third of Romanians and almost half of Italians select cultural heritage amongst their top three choices for public spending priorities, compared to only 20 % of German, rough-ly 15 % of Swedish and fewer than 10 % of British people.
• Nearly a quarter of British and German respondents were not willing to pay anything towards the conservation of their country’s built heritage interiors from climate change dam-age, consistent with the fact that cultural heritage was not a
Zero WTP
Median Mean WTPMean WTP gradual
impacts (% total WTP)
Ham House 12.6 % €2.50 €3.60 €2.30 (62 %)
Knole 14.6 % €2.50 €4.80 €3.00 (62 %)
St. Joseph Church*
6.7 % €24.10 €34.10 €17.80 (52 %)
Gotland churches (last visited)*
31.6 % €1.20 €9.20 €5.40 (58 %)
Bronnbach Monastery
6.7 % €2.00 €3.00 €1.80 (61 %)
Linderhof Palace
22.7 % €2.00 €3.50 €2.10 (62 %)
Neuschwanstein Castle
31.6 % €1.00 €2.60 €1.60 (59 %)
Pergamon Museum
30.0 % €1.00 €2.40 €1.40 (60 %)
Black Church 19.4 % €1.10 €2.80 €1.60 (58 %)
Ca' Rezzonico 31.8 % €2.00 €2.60 €1.60 (62 %)
UK Germany Sweden Italy Romania
Zero WTP 23.5 % 23.7 % 14.5 % 14.0 % 11.0 %
Median WTP €12.00 €10.00 €16.50 €10.00 €4.50
Mean WTP €33.40 €28.40 €49.90 €43.50 €12.60
Mean WTP gradual impacts (% total WTP)
€25.40 (76 %)
€20.80(73 %)
€31.10(62 %)
€30.40(70 %)
€8.30(66 %)
Figure 3
Swed
en
UK
RomaniaItaly
Germany

ChapTer 5 Stakeholder experiences
64 65
CHAPTER 4.6
Retrospective preservation surveys of collections Ralf Kilian, Charlotta Bylund Melin, Kristina Holl, Andreas Weiss
• one of the innovative aspects of Climate for Culture is the retrospective investigation of the cause effect relationship between indoor climate conditions and preservation state of representative cultural heritage assets in the face of cli-mate change. This refers to movable and immovable her-itage with a broad range of technological constitution and climatic vulnerability, hosted in distinct types of buildings in different European climate regions.
• Risk assessment in preservation is usually based on estab-lished guidelines, standards or damage functions describ-ing the progress of certain damage phenomena. Frequently these rules have been derived from laboratory or exposition studies, partly combined with simulations to improve mod-els for degradation processes. Since this approach can never comprise the whole reality, conservators now have started assessing the representativeness of established guidelines like the ASHRAE standards for Museums and Archives with retrospective condition surveys of collections.
• The investigation focused exemplarily on painted wooden objects and canvas paintings. Surveys were performed on the historic furnishing in Linderhof Palace, in Gotland churches studying polychromic wooden pulpits and in Prus-sian palaces at hundreds of canvas and panel paintings. The gathered data will be assessed with statistical methods.
REFERENCES
1. Kristina Holl: Comparison of indoor climate analysis according to
current climate guidelines with the conservational investigation
using the example of Linderhof Palace. In: Jonathan Ashley-Smith,
Andreas Burmester and Melanie Eibl (Ed.): Climate for Collections
– Standards and Uncertainties, Postprints of the Munich Climate
Conference, p. 299-309, London 2013
2. Charlotta Bylund Melin and Mattias Legnér: Quantification, the
link to relate climate-induced damage to indoor environments in
historic buildings. Ibidem, p. 311-323
Crazing of the varnish caused by moisture infiltrating from the varnish craquelure.
Figure 1
Linderhof palace: losses of the gilded surfaces have not increased during the last 20 years.
Figure 2
The pulpit in Hörsne church, Gotland.
Figure 3

66
The over one hundred Climate for Culture case studies are various types of historic buildings ori-ginating from different times and construction periods, located in different climate zones and used in different ways. They were subject to in-depth studies providing knowledge on the state of preservation, interpretation of indoor climate conditions and requirements from a preventive conservation point of view together with an inventory of the different European/Mediterranean climatisation strategies. To enhance the knowledge about the complex interaction between use, indoor and outdoor cli-mate, technical features and the state of preservation of works of art, not only future scenarios were modelled but also indoor climate conditions were also assessed and examined. The stake-holder experiences have shown that it is important to balance the results from scientific labora-tory experiments against real-life practical observations in regard to the state of preservation of objects. only being aware of the history of cultural heritage allows for predicting future risks and developing mitigation and adaptation strategies. The state of preservation of a cultural heritage building or object depends on a number of factors such as relative humidity, temperature, light, pollutants which can be referred to as “agents of deterioration” that constitute the environmental history of an object. However, only few objects have a well-known history. To allow any prediction about its future, we therefore have to learn more about the climate history of cultural heritage items and sites. This knowledge is even more important in periods of dramatic climate change.Preventive conservation aims to provide acceptable conditions for the preservation of movable and immovable cultural heritage objects. These are often housed in historic buildings under legal protection. The Climate for Culture project aimed to develop mitigation and adaptation strate-gies for the preservation of the heritage sites and the works of art they house to counter the impact of climate change. Besides rising temperatures, the accumulation of extreme weather events (strong winds, heavy rain and snowfalls, flooding), the impact of growing tourism as well as decreasing economical resources contribute to its decay.
REFERENCES
1. Ashley-Smith, J.; Burmester, A. and Eibl, M. (2012): Climate for Collections – Standards and Uncertain-
ties. Postprints of the Munich Climate Conference, 07th to 09th November 2012, Munich 2013
67
With five mansions and three church buildings as case studies, and the regular involvement of two staff members, the National Trust has a significant stake in the Climate for Culture project. As a privately funded charity that is independent of the govern-ment, we depend on over 70,000 volunteers working with 5,000 members of staff to care for and open 350 properties to 4 mil-lion members and 20 million visitors a year. As Europe’s largest conservation charity, the breadth of the Trust’s interests and its conservation purpose mean we have taken climate change seriously for the past 20 years [1,2]. In this project we were con-cerned over its impacts on our historic house interiors and our control options.
The case studies represent a range of locations, environmentally induced damage and control.
• Ham House, Richmond, a remarkably complete seven-teenth century interior with an effective conservation heat-ing system whose Thameside location makes it vulnerable to climate induced fluvial flooding and tidal surges.
• Knole House, Kent, a medieval and Renaissance palace with outstanding Royal Stuart furniture currently undergoing major conservation. It lacks environmental control and suf-fers from mould and insect growth.
• Blickling Hall, Norfolk, a Jacobean mansion with a broadly zoned conservation heating system. It has suffered from re-peated flash flooding and water infiltration, causing mould and insect infestation.
• Lanhydrock House, Cornwall, a Jacobean and Victorian mansion whose fabulous Long Gallery shows good within room conditions due to its broadly zoned conservation heat-ing system but still has mould growth behind paintings and on books.
• Cragside, Northumberland, a nineteenth century Tudor-bethan mansion whose well-managed conservation heating system has been recently upgraded; the house has also re-cently suffered flash flooding.
Figure 1: The Long Gallery at Blickling Hall: one of the National Trust case study mansion properties in the Climate for Culture project.
None of the three church buildings are environmentally controlled: • Gibside Chapel, Northumberland, a Palladian building con-
taining spectacular plasterwork and architectural fittings. • The priory church of St Michael’s Mount on a tidal island off
the coast of Cornwall dating from the twelfth century.• Staunton Harold Church in the Midlands, built during the
Commonwealth features seventeenth century woodwork, metalwork, textiles and a painted wooden ceiling.
CHAPTER 5.1
Cultural heritage in times of climate change - the case study buildings Melanie Eibl and Andreas Burmester
CHAPTER 5.2
Stakeholder experiences - putting Climate for Culture in the context of the National Trust Katy Lithgow and Nigel Blades
Figure 1 (National Trust Images/Andreas von Einsiedel)

68
As the atmosphere of these houses depends on the open dis-play of mixed collections, the risk of higher humidities from warmer and wetter winters raises our concern that damage will increase from condensation, mould, insect pests and the ce-mentation of dust to historic surfaces, which will become more difficult to clean.
Results from our participation have included:• Peer review of reports produced for and by the Trust such
as the mapping of coastal risks;• Proving monitoring techniques such as Digital Holographic
Speckle Pattern Interferometry which shows that different wall finishes move at different rates as the relative humid-ity (RH) fluctuates;
• The willingness of our visitors to pay to protect our collec-tions from climate change-induced damage, revealed by London School of Economics questionnaires;
• Reasonably good correlation of damage functions and risk maps with our own experience;
• Confirming the effectiveness of current controls, but an-ticipating future loss of control as summer temperatures increase;
• Helping formulate key performance indicators to assess the control of physical damage, relative humidity and re-medial conservation progress;
• Showing that conservation heating consumes less than half the energy of comfort heating and thus contributes to the Trust’s target of reducing energy consumption by 20 % by 2020 (compared to 2008).
• Expressing our need for environmental control systems that are low in capital cost, energy consumption and tech-nical complexity, simple for non-specialist staff to operate and maintain and appropriate to local contexts such as us-ing the local estate to fuel biomass;
• Using building simulation to understand whether energy saving interventions such as increasing insulation cause undesirable consequences such as cold bridges and con-densation.
An example of how the National Trust has benefitted from being a stakeholder in Climate for Culture is the research the
project has enabled us to undertake on the impacts of climate change on conservation heating.Conservation heating is the main method the National Trust uses to control and stabilise relative humidity to care for the collec-tions in its historic houses [3]. This strategy allows the heating to be operated on demand, 24 hours a day, 365 days a year, depend-ing on the RH inside the building. In practice only a little heating is needed at any time and, as described above, this is far less than would be required for comfort heating to 21st century expecta-tions. Therefore, it is sufficient to maintain an indoor tempera-ture of between 9 and 15 °C in winter and perhaps 16 - 22 °C in the summer. For the comfort of visitors, the maximum heating temperature is limited to 22 °C, although there are times when a high temperature is needed to reduce the room RH to below 65 %, the upper limit of our target RH band.In the warmest south-east corner of the UK, the Trust has found that there are 6-12 days per year when this upper temperature limit on conservation heating prevents RH from being con-trolled below 65 %. We were interested in investigating if this would alter in the future due to climate change and also how the energy consumption of conservation heating would change in the future.It was possible to investigate these research questions using the climate datasets generated for the specific locations of our properties in the Climate for Culture project. By using the mod-elled air moisture content and external temperatures, the aver-age annual degree day totals for conservation heating energy demand were calculated for 31 year time slices of the modelled climate data: 1961-90 (near past), 2021-2050 (near future) and 2071-2100 (far future), following a methodology developed by the National Trust [4]. These totals were calculated with and without the upper temperature limit of 22 °C, so that the differ-ence between the two totals would indicate that the proportion of time conservation heating could not control RH due to the upper temperature limit.
Figure 2: Change in energy demand for comfort and conservation heating strategies in a1B Climate Scenario, for the location of Knole house, expresssed as degree days for comfort heating to 19 °C and conservation heating to 58 % rh. No upper heating tem-perature limit is applied for the conservation heating.
69
These calculations were done for three National Trust case study properties: Knole House, Ham House and Staunton Harold Church. All showed a similar pattern with the most noticeable ef-fect in the south-east properties.As might be expected the comfort heating demand fell signifi-cantly in the climate change simulation data (A1B scenario), in fact, by 27 % from the near past compared to the far future. However, the conservation heating demand showed only a 2 % decrease from the near past to the far future when calculated without the upper temperature heating limit of 22°C. This is be-cause the modelled absolute humidity of the air rises in parallel with the temperature, so that the same amount of heating will be required in the future, but from a higher base temperature.Introducing the 22 °C upper temperature limit to the conserva-tion heating demand calculation showed that the proportion of time in a year with unmet demand for RH control was 4 % in the near past, rising to 13 % by the far future. Clearly at some point in the future a decision will need to be taken as to whether it is feasible to increase this upper temperature limit or if alternative RH control strategies will need to be employed in the summer in the far future.
This research has enabled us to understand the likely impact of climate change on a key environmental control strategy. It would not have been possible without our participation in the Climate for Culture project and collaboration with the project researchers to generate data analysis for our case study sites.It has been great to see our buildings and data being used to de-velop researchers’ expertise and analytical and monitoring tech-niques. We look forward to their further application. We have observed that questions that seem simple to researchers, such as describing building fabric, floor areas and volumes in complex historic structures, may be difficult for stakeholders to answer. This has demonstrated how applied scientists help translate conservation problems into scientific questions and the results into conservation solutions. Thus stakeholders can also act as researchers. Collaborating in multidisciplinary projects on a European scale allows us to put our experience into a wider context. We look for-ward to future collaborations, applying the outputs of this project to the sustainable management of internal environments for the benefit of both people and collections and improving models by researching the real behaviour of historic materials under differ-ent environments.
REFERENCES
1. The National Trust (2007) Forecast Changeable. London:
National Trust 2014
2. The National Trust (2014) Shifting shores. London: National Trust
2014
3. Bullock, L. (2009) Environmental Control in National Trust Proper-
ties, Journal of Architectural Conservation 15, pp. 83-98
4. Blades, N. Poupard, S. and Barber L. (2011) Analysing the energy
consumption of conservation heating systems at the National
Trust, Journal of the Institute of Conservation, 34(1), pp. 16-27
Figure 2
2500
2000
1500
1000
500
0
Comfort heating Conservation heating
1960-1990
2020-2050
2070-2100
Ann
ual a
vera
ge d
egre
e da
ys

70
The Bavarian Administration of State-owned Palaces, Gardens and Lakes are committed to the preservation of historic buil-dings and their interiors. Periodic building maintenance and conservation measures mitigate the traces of time and use, in order to present to the public the Bavarian cultural heritage in good shape. Preventive measures to avoid further damage, such as light protection and climate conditioning, are becoming more and more important. Investigating environmental condi-tions within buildings neither undergoing conservation works nor showing evident damage are not easily justified when bud-gets are small. Future-orientated and visionary research which looks at the impact of global climate changes and which thinks in decades or even in centuries does not yet play a part in the state preservation mandate.Participating in the research project Climate for Culture gave the Bavarian Castle Administration the unique chance to exa-mine more closely the environmental conditions and building physics of some of its premises – the King’s House on the Scha-chen, Neuschwanstein Castle, Linderhof Castle and the chapels St. Bartholomew and St. Renatus. In most cases the findings led to immediate measures for improving the indoor climate.For the first time environmental monitoring was carried out in Neuschwanstein Castle and the St Bartholomew’s Church on the shore of Lake Königssee, both internationally known landmarks of Bavaria. The equipment was financed by
the Climate for Culture project and the data collected by mem-bers of the conservation centre of the Bavarian Castle Admi-nistration. The hygrothermal conditions of the throne hall in Neuschwanstein Castle were examined by using many surface sensors and heat flow meters, which fundamentally increased the knowledge of the structural-physical and environmental conditions in this ceremonial room. Neuschwanstein Castle will be undergoing major conservation works within the next few years. This enables the building owner to install a ventilation system to stabilise the indoor climate. All the knowledge and findings gained by the project will be incorporated into the de-velopment of a suitable, minimal invasive and cost-effective ventilation system.For many years St. Bartholomew’s Church suffered from an
71
immense mould infestation caused by high relative humidity levels. To minimise the relative humidity permanently, inex-pensively and at low maintenance the installation of a “Tem-perierung” system was favoured. However, after evaluating the collected climate data, it became clear that the high humi-dity levels occurred mainly in summer and were obviously also caused by the numerous visitors of around 350,000 per year. A “Temperierung” system would only be effective during the se-ven cold months of the year. After discussing the problem with various experts of the Climate for Culture project, the decision was made to install an electronically controlled air exchange system together with a mobile dehumidifier. This ventilation system uses two sensors measuring the outdoor and indoor humidity levels. The two readings are compared and windows are automatically opened or closed according to whether the outdoor climate is dry enough to lower the high relative humi-dity indoors. Additionally, air from outside is circulated into the church by an air vent.Due to the long duration of the project it was possible to compare and evaluate the situation before and after the introduction of the ventilation system. The effectivity of the ventilation system could thus be proved. Risk maps fore-casting global climate conditions predict more winter precipita-tion in the future. An additional “Temperierung” system might therefore be helpful to combat the more humid conditions and to improve the indoor environment of the church.The environmental conditions of Linderhof Palace were also examined in a previous project. The collected data showed that the relative humidity is generally too high in summer and subject to sudden rises and drops. Additionally, the air within the castle becomes very stale due to the many visitors. After assessing the data collected and the hygrothermal building si-mulation, it was decided that a computer-assisted ventilation system using pre-warmed air will be installed. The Bavarian Pa-lace Administration has granted a budget of 350,000 euros for this installation. The environmental monitoring equipment set up as part of the project will remain to evaluate the effectiven-ess of the new system. In the St Renatus Chapel near Schleißheim some lower parts of the walls suffered from being wet, therefore in 2002 a “Tem-perierung” system was installed in order to dry out the lower part of the walls. As part of the Climate for Culture project, the
effectiveness of the heating system was scrutinised. The exsic-cation of the wall worked very well. However, the high tempera-ture and low relative humidity inside during the winter months caused widespread damage to the polychrome altars. A conser-vation heating control has been installed within the Climate for Culture project which regulates the temperature according to the relative humidity levels.Within the work package on economic impact, a visitor survey was conducted in the castles of Neuschwanstein and Linderhof. The questionnaire – originally developed by the London School of Economics and geared towards the assessment of economic values – was extended to include questions about environmen-tal indoor conditions comfortable to visitors and about World Heritage Sites. The surprising outcome of the survey was that the majority of the more than 500 visitors questioned would accept uncomfortable environmental conditions when visiting a historic building if these conditions were conducive for the long-term preservation of this building.over the course of the Climate for Culture project several “tools” were developed which enable participants such as the Bavarian Castle Administration to quickly gain an overview of the environmental conditions of individual sites.“Glass sensors” developed in an earlier EU-funded project AMECP (1993-1996) are small glass chips that corrode very quickly under unfavourable environmental conditions and the-reby give a quick indication of the climatic situation and of po-tential damage to artworks [1]. These sensors were tried out in various Bavarian castles and proved to be very useful for iden-tifying environments which are harmful for these art objects.The software “Digichart” which was developed within the Cli-mate for Culture project by partner Jan Radon Software from Krakow, Poland has also turned out to be very useful. The soft-ware digitises the graphic recording of thermo-hygrographs. Analogue thermo-hygrographs are still widely used by the Ba-varian Palace Administration. The use of digital data loggers is not always possible or convenient. The digitised data can be fed into database and analysing programs and can be used in pre-sentations and reports.A valuable and viable outcome of the project is the Climate for Culture database and climate data analysing programme deve-loped by partner TU Eindhoven. Climate data collected during
CHAPTER 5.3
Stakeholder experiences - the results of the Climate for Culture project and their significance for future workTina Naumović
Figure 1
Figure 1: Neuschwanstein palace was chosen as one of the case studies. It is located in the alps at 850 m above sea level and therefore exposed to extreme outdoor climate. There is no hea-ting or other climate conditioning systems installed inside. (photo: Bayerische Schlösserverwaltung, Brandl)

ChapTer 6 Climate for Culture products
7272
the project was fed into the database and can now be used/interpreted in various ways. For example, by using the “gene-ral risk plot” the quality of the indoor climate can be plotted according to the ASHRAE index [2]. Environmental conditions can thus be assessed quickly. The necessity of actions to be taken to improve the environmental conditions can be clearly defined and justified. Additionally, the condition of buildings or even individual rooms can be compared. To give an example, the indoor climate of the bedroom in Neuschwanstein Castle is much better than that of the bedroom in Linderhof Palace. A further very useful tool is the “specific risk generator” which indicates the likelihood of mould growth on various materials or artworks. In Neuschwanstein for example the “specific risk generator” predicts mould growth in the throne hall and the drawing room and not, however, for the bedroom. This has un-fortunately been proven in reality: mould has been found in the bedroom. Mould growth in the cupola of the throne chamber is also suspected. Both tools can be combined with the “Climate Risk Maps”. This enables the user to assess the impact of glo-bal climate changes on historic buildings. The environmental conditions of individual rooms can be predicted up to the year 2100. This enables us to set the course for the future and choo-se the appropriate climate control. For example, whether the environmental benefits gained by installing a “Temperierung” system justify harming a historic wall.This project was especially remarkable because of the project partners’ willingness to be transparent. All data is available to all stakeholders and nobody hides the fact that their own collection is kept under less than the ideal climatic conditions. This open-ness on behalf of all project partners, the numerous dialogues with experts and researchers conducted internationally were of immeasurable value to the Bavarian Castle Administration. In the productive atmosphere of the meetings, many problems could be shared and sustainable solutions could be found together.The high level of media coverage of the Climate for Culture project let to widespread acceptance of preventive measures in times of global climate change. The project results were pre-sented to an international audience in July 2014 – this internati-onal two day conference took place in the Munich Residence in the presence of director Kurt Vandenberghe from the European Commission, DG Research and Innovation.
REFERENCES
1. Leissner, J. et al. (2011) The applicability of glass sensors to assess
the damage potential of climate change impacts In: EWCHP–2013
3rd European Workshop on Cultural Heritage Preservation Bozen/
Bolzano, Italy, September 16 to 18
2. http://www.academia.edu/741958/2007._The_ideal_climate_
risk _management_the_ ASHRAE_chapter_proofed_fluctua-
tions_and_towards_a_full_risk_analysis_model
3. Kilian, Ralf; Holl, Kristina; Bichlmair, Stefan and Naumović, Tina
(2012): Klimastabilität historischer Gebäude – Untersuchung der
klimatischen Funktionsweise historischer Gebäude am Beispiel
von Schloss Linderhof. In: Restauro. Zeitschrift für Restaurierung,
Denkmalpflege und Museumstechnik. Vol. 8, December 2012.
p. 34-38. Munich
73

74
one of the objectives of the project was the development of a general software tool for making the best decisions based on climate change projections, hygrothermal building simulation and climate data collected from different types of historic buildings. Therefore, a basic software module was set up integrating several modules in the Analysis and Decision Support System, the so-called CLIMATE for CULTURE software. The starting point was the already existing da-tabase of the Eindhoven University of Technology (www.monumenten.bwk.tue.nl) which was expanded and customized to the needs of the Climate for Culture project. It now serves as a web-based database for general data of more than 70 case studies and allows storage of mea-sured climate data. The software calculates certain risks for works of art based on object type, material and measured climate data. The graphical outputs consist of several types of plots: time plots, climate evaluation plots and risk plots.
A further module is the Decision Making Support System (DMSS) software for easy access to the climate risk maps that are using the damage functions, developed by the work package on damage assessment, embodying the latest research on climate effects on works of art. The most important part of the DMSS is the projection of the indoor climate change based on the simulation of the outdoor climate change. These predictions are provided in the form of risk maps for Europe for the selected case studies and for generic buildings with predefined pro-perties. This is one of the central outcomes of the Climate for Culture project as it provides the synergy of results from several work packages and puts them into use.
An integral part of the Decision Making Support System (DMSS) is an expert system (ExDSS) with built-in knowledge and methodology for best practice advice with regard to maintenance and mitigation strategies for a specific building type in a specific climate region in Europe and the Mediterranean region. An already by end users well accepted and tested product is a spe-cial accessory for digitising analogue data charts from thermo-hygrographs still in use in many museums, which can be freely downloaded at the Climate for Culture website.
75
For the Climate for Culture project, data from over 100 case study buildings from all over Europe were collected using a spe-cially designed questionnaire which comprises information re-garding the building and its history, outdoor and indoor climate recordings and observed damage related to climate change. The information is implemented in two types of databases: 1) a general database for all case studies that contains question-naire data about the building, use of the building, measurement setup, objects on display etc. and 2) an individual database for each case study which contains all data measured on-site.Both types of database are accessible on the website www.monumenten.bwk.tue.nl/CfC/Default.aspxone will be linked to this website automatically when navigat-ing www.climateforculture.eu. (Via Dashboard)The main page of the website is displayed in Figure 1. It is based on various levels of authorisation:
1. Unidentified users can only view the main page;2. Climate for Culture users can view every case study;3. Project owners can view and modify their own case study;
Climate for Culture users automatically become project owner as soon as they create a new case study;
4. Climate for Culture administrators can view and modify all case studies.
The main page displays 4 general buttons (top, green) to fre-quently asked questions, to an example project, for adding a case study and for multiple project results. Below that, every case study is displayed with a picture of the case study and by name and location (in the list on the left).
Figure 1: Main page of www.monumenten.bwk.tue.nl/CfC
The frequently asked questions are meant for all users. They ex-plain what you can do when you have access and who to contact to change the level of access. They also show the type of files that can be uploaded etc.The example project is similar to all case studies on this web-site, except that it is visible to all users. It provides a preview of what to expect when a user wants to start their own case study. It consists of general data, past indoor climate and future in-door climate (measurements) which are predictions of indoor climate based on inverse modelling in combination with REMo outdoor climate simulations.The measurement data allows graphs to be generated online.Four types of graphs can be made, e.g. a time plot. Users can specify the exact data they would like displayed and can also modify the appearance of the graph. Moreover, graphs can be saved to disk and be used in reports, among other things.
CHAPTER 6.1
Climate for Culture productsVlatka Rajčić
CHAPTER 6.2
Climate for Culture database of case studies Henk Schellen, Marco Martens, Jos van Schijndel and Zara Huijbregts
Figure 1

76
Figure 2: Climate evaluation Chart generator
Figure 2 displays a Climate Evaluation Chart, which is based on a psychrometric chart [2].
Figure 3 displays a general risk plot, which is basically a com-parison between the ASHRAE climate classes for museums and actual measurement data. The resulting percentage is a meas-urement of the amount of time the indoor climate is within each climate class [3].
Figure 3: General risk plot generator
Figure 4 shows the specific risk plot, in which common risks in-duced by the indoor climate are predicted for four well-defined objects: paper, panel paintings, furniture and wooden statues [3].
For the future indoor climate, inverse modelling using transfer functions is used [1]. This can only be done for case studies in which temperature, relative humidity and solar radiation have been measured for at least one year. A transfer function is com-piled; this function is used to calculate the indoor climate from the outdoor climate provided by the REMo database. Similar graphs to the four graphs mentioned above can be created. In-stead of measurements, the simulated indoor climate is used as input for the graphs.
Climate for Culture users can add new case studies by clicking on ‘add’ on the main page. Users automatically become owner of the projects they create so they are able to modify their projects. The measurement results of the individual case studies can be found under each case study, as explained before. But when multiple case studies need to be compared, the ‘Results’ button at the top of the main page can be used. Clicking this button leads to two options. The first option is clicking on the European map to view pre-calculated results. This consists of both measured and/or calculated results for 468 locations all over Europe. These results can consist of outdoor climate data (from REMo and measure-ments) or of indoor climate results (of simulations using generic buildings). This part is not explained here. The other option is to have a look at non pre-calculated results. Selecting these results
77
retrieves them from the databases. A maximum of four cases can be compared. Figure 6 shows the results for both the spe-cific and general risk assessment method [3]. Any case study in the database (measurements) or that has a transfer model for simulation can be selected. A period of a whole year can be selected; for the measurements this is mostly limited to 1 or 2 years in the very recent past.
For simulations, recent past (1961 to 1990), near future (2021 to 2050) and far future (2071 to 2100) can also be selected. Risks are calculated on the fly, so different selected projects can be compared. Note: in the case of a simulation, it might take a cou-ple of minutes to calculate the first results.
Figure 4: Specific risk plot generator
Figure 5: Transfer function for a case study (only available if T, rh and solar radiation were measured for at least one year)
A project owner or a Climate for Culture administrator has ac-cess to additional buttons which appear in the right margin of the main webpage of each case study. These buttons provide access to the questionnaire and allow you to upload or down-load data. It gives an overview of all data in the database (start date, end date, measurement positions and physical quantity (T, RH, Tsurface etc.)). By changing the period or by deselecting positions or quantities, the download can be modified. There are two download formats: text file and MatLab file.
Adding measurement data to the project can be done by up-loading text files that containing measurement data. Because of the multitude of measurement equipment available, the up-loaded text files have to have a preset format. These formats can be found in the frequently asked questions section. once a text file is uploaded, it might take a few days before the new data is added into the database.
Another important aspect is the exact measurement setup. This part of the site allows a PDF file containing floor plans with measurement positions indicated to be uploaded. A list off sen-sors used, including accuracy and calibration specifications, can
Figure 2 Figure 4
Figure 3 Figure 5

78
also be included.A picture showing the case study can also be uploaded for easy recognition. It would be best to upload a pic-ture of the outdoor view of the building or of a very case specific and well-known interior part.
In order to make the various case studies comparable to each other, a lot of data describing the case study is needed. For this purpose a questionnaire was set up. This questionnaire is in-cluded on the website and can be filled in online. Because of its length the questionnaire is split into 22 different pages. Click-ing on ‘Start’ takes you to the first page. You can also navigate directly to a specific page by clicking on one of the parts. It is recommended that you fill in the conclusions of your case stud-ies by clicking on ‘Analysis’.
The green fields in the questionnaire are compulsory fields; the white fields contain additional information that is not always known or needed. After filling in the fields, click on ‘save’ to save the data but stay on the page. Clicking ‘save and continue’ saves the data and automatically takes you to the next page of the questionnaire. The questionnaire does not need to be fully completed in one sitting; you can stop halfway through and no data is lost.
The main page of www.monumenten.bwk.tue.nl/CfC/Default.aspx also provides information for Climate for Culture adminis-trators. These administrators have access to an additional but-ton, namely one of the right labelled ‘overview’. This provides important information for package leaders. Clicking ‘overview’ allows you to choose a country. After selecting a country, all case studies in this specific country are shown. Moreover, it also shows whether the questionnaire is filled in or not (Q?) and whether a database is present (D?). If a database is present, a start and end date is shown, the number of measurement posi-tions for temperature (T), relative humidity (RH) and long wave-length solar radiation (LS). This can be used to check whether all partners did what they needed to do. For further information contact Henk Schellen: [email protected].
Figure 6: Comparison of case studies and of measurement and simulation
REFERENCES
1. Kramer, R. P. (2012) From castle to binary code, The application
of inverse modelling for the prediction and characterisation of in-
door climates and energy performances, Eindhoven University of
Technology,Msc report
2. Martens, M. H. J.; van Schijndel, A. W. M., Schellen, H. L. (2006)
Evaluation of indoor climates using the Climate Evaluation Chart,
Proceedings of the Lyon EPIC conference 2006, p 523-528, ISBN
2-86834-122-5
3. Martens, M. H. J. (2012) Climate risk assessment in museums:
degradation risks determined from temperature and relative hu-
midity data, Dissertation, Eindhoven University of Technology,
unit BPS, ISBN 978-90-6814-645-5
79
IntroductionDuring the five years of the Climate for Culture project, there were plenty of discussions to determine how to present the richdata output from all work packages to the public. For this pur-pose a concept for a Decision Making Support System (DMSS) was set up. It will be explained here in detail how it can be used and how it works.
Who are the users?The Climate for Culture project produced a full range of results from future climate projections indoors and outdoors through to climate risk assessment and best practice advice on mitiga-tion and climatisation strategies as well as on energy use in his-toric buildings. Not all these results can be presented in detail with only one application since the complexity of such a tool would be very high and would render the results difficult for everyone to understand. Therefore the consolidation of the re-sults from the various work packages in the DMSS is provided with partially generalised results.The initial question is “Who is the end user?” Partners within the project and people generally interested in the project could be divided into categories of stakeholders, practical conserva-tors, scientists and heritage managers. Each group is interested in specific areas of the results and therefore they would have different opinions on the scope of the DMSS. For the stake-holders, the most important part of the project would be to get an idea of how the projected climate change will influence the maintenance needs of their stakes and what will be necessary in the future to preserve the built cultural heritage and collections in the best condition possible. Conservators are interested in obtaining an application that would help them to find the opti-mal climate for specific objects and to help them with the risk assessment of these objects both in the present and the future. Managers of the cultural heritage would like to have general information on costs, on time scale and on possible technical
solutions and mitigation strategies related to climate change. At the start of the project we decided to involve all these user groups and therefore DMSS was built to bring valuable infor-mation to all of them.
What information can we provide to the users?As the project scope is to provide information on future indoor climate change, it is clear that we can work only with the best available computer simulations to provide estimates of what kind of changes we are likely to face in the future. As we can work only with estimates, it would be unscientific to provide a risk assessment with strict answers for selected case stud-ies except for the indoor climate conditions that are critical.Therefore what information can be available to the user? The intention is to make the users aware and cautious, if neces-sary, and to provide them with basic information on what can be expected in the future. Also the intention is to educate the end user and give hints for future work and in the case of in-terest provide the possibility of joining the project with a case study. To deliver such a task, it is necessary to provide relevant information for each step of the DMSS . In our case , it was de-cided to provide this information via the “Learn more” button at each stage of the DMSS. With regards to the risk assess-ment, users will obtain information on the methodology, on the limits of the selected method, on chosen parameters as well as relevant literature for further reference. A wide range of information, parameters of generic buildings and building types on the building structure have been prepared for calcu-lating future energy demand. The different parts of the Decision Making Support System (DMSS)The Decision Making Support System (DMSS) is composed of three main parts which are used to present the results to the end users:
Figure 6
CHAPTER 6.3
The Climate for Culture Decision Making Support System Aleš Sládek, Oto Sládek and Vlatka Rajčic

80
• Specification of the interests• Risk assessment and risk maps• Expert decision support system (exDSS)
In the first part the users specify the location of the building and the climate scenario they would like to investigate (A1B or RCP 4.5), the time period they are interested in and also the type of building. The second part is focused on the presentation of results. For the selected set of parameters the risk map for the indoor tem-perature and relative humidity is shown as these maps are eval-uated for all buildings types. As we would like to provide the option of showing all maps, custom map plots based on the end user specification are included.Based on the selected location, a risk assessment is provided for all the evaluated parameters. The risk is shown as numbers and in the cases where we have both the value and the risk. The traffic light colour scheme is used to highlight the level of risk. Based on the risk assessment, the expert decision support sys-tem (exDSS) provides information on the possibilities of what can be done to improve indoor climate conditions for preven-tive conservation. As generic, artificial buildings are used in thesimulation, end users cannot give more specifications here. The exDSS will provide general information on available technical solutions and what could be improved. The risk assessment in Climate for Culture comprises risks from mould, insects, me-chanical damage and salt crystallisation. The exDSS will pro-vide answers to these risk categories for measured data from a case study building or future projections for the generic build-ings.
Further outputs of Climate for CultureWithin the project, a climate measuring campaign was per-formed to give insight to the problems related to climate measurements and climate simulations: a database has there-fore been created by the Climate for Culture project to collect all information for each case study. This vast data is available through the website.
Eindhoven University of Technology provides an online analyti-cal tool for the purposes of the Climate for Culture project. The
measurement data and this analysing tool are available for the project partners that have provided measurement data for their case studies. Since parts of the analysis and fitting the param-eters have to be done manually or at least have to be supervised by experts to provide relevant outputs, the analysing tool will be made publically available only after further tests on func-tions and through user registration. This tool is focused on al-ready measured data and their analysis; it can be used as the base to classify relevant indoor climate parameters concerning the long-term preservation of works of art and thus is interest-ing for conservators and stakeholders with an in-depth knowl-edge in the field of heritage preservation.
The Expert Decision Support System (exDSS) has also been pre-pared to be used within the project and provides very valuable information on current problems faced by stakeholders. Based on the input from the end users through questions and answers, the exDSS can identify problems in specific areas such as mould growth, insects, salt crystallisation and can help find possible technical solutions. Conclusions are presented with the exam-ples and links to other relevant sources of information.
ConclusionsWith the different online tools, the Climate for Culture software and database, solutions were found to present the vast infor-mation that has been collected within the 5 years of the Climate for Culture project to the interested public.Each tool that has been prepared focuses on specific needs of the different kinds of end users. The Decision Making Support System provides general information and helps the stakehold-ers with a basic level of knowledge. Managers in cultural her-itage field will also benefit and better understand what they might expect in the future through the risk assessment meth-odology and possible technical solutions. For a more specific use, the Expert Decision Support System and an online analysis are provided, which supports stakeholders with expert knowl-edge in the preservation of cultural heritage from the scientific team of Climate for Culture.
81
IntroductionIn the cultural heritage sector the traditional use of thermo-hygrographs is still standard. The data charts are valuable for instantly inspecting the actual temperature and relative humid-ity, but cannot be easily evaluated for logistical reasons since the conservator has to check and collect the sheets on a daily or weekly or monthly basis. This action requires a huge personnel and time capacity, which many museums or cultural heritage owners simply cannot afford due to restricted budgets. Pre-cise evaluation of microclimate parameters is only possible if measured parameters are available in continuous, digital form. Against this background a computer program called DigiCh-art (Digitizing Chart) has been developed to convert analogue measurement results into numerical form in order to enhance the evaluation of existing and historic climate data and to ob-tain comparable data which represents the interior micro-cli-mate accurately.
Objective and conceptA thermo-hygrograph is a chart recorder that measures and records both temperature and humidity in an analogue form. To enhance evaluation of measurements archived on paper charts it is necessary to convert the results into digital form. So the task to be undertaken is recognising, digitising and stor-ing measured data in arrays (time-temperature, time-relative humidity). The concept is to load images of scanned charts into the computer and use sophisticated picture analysing tech-niques to get measured patterns digitised. Scanned images, so-called raster graphics, only include matrix of coloured points (pixels) without any functional connection. The software has to retrieve both pixels, which are part of drawn patterns, as well as location of grid (axis system) to be able to rescale the pixel posi-tion to real temperature and relative humidity. The developed software is built on the assumption that drawn lines are a differ-ent colour to the background and the grid.
Scanned pictures can be stored using a variety of bitmap for-mats. Most popular are:
• JPEG (Joint Photographic Experts Group),• TIFF (Tagged Image File Format), • GIF (Graphics Interchange Format), • BMP (MS Windows© bitmap).
A bitmap stores a picture as a collection of pixels. The most common way to store colours is by using Red, Green, Blue cod-ing (RGB). Particular colours can be stored using a different number of bits. If 8 bits are used (1 byte, range 0-255), a num-ber of different colours which can be coded is: 256*256*256 = 16,777,216 (more than 16 million).
The second parameter needed for picture analysis is the resolu-tion, which is called DPI (Dots Per Inch). Real physical size (in inches or cm) can be obtained using this parameter.
The sof tware uses both information (colour-coding and resolu-tion) to recognise temperature and relative humidity pattern. Using similar techniques, the program also recognises the grid. The bitmap’s coding format does not matter, since the program internally makes a matrix of RGB of every pixel.
The best format supported by the scanner should be used, pro-vided that RGB colour coding and DPI information is included. A good quality picture should be obtained by using possible low resolution. Higher resolution requires more computational time.
Even sharp colour differences alone do not guarantee clear dif-ferentiation between pattern, grid and background. often grid-line crossings or inhomogeneous background (dust, descrip-tions) are interpreted as a drawn pattern.So it is necessary to
CHAPTER 6.4
“DigiChart” software for digitising of thermo-hygrograph charts Jan Radon

82
apply some statistical and vector analysis to exclude irregulari-ties (e.g. sudden value jumps unlikely to occur in reality).
The concept includes also automatically positioning the grid against the chart background. The software first creates a vir-tual grid in the memory based on information about the chart type and DPI of scanned images. Then the virtual grid is com-pared with the image’s pixel-patterns at different positions. The most fitting location is then chosen.
SoftwareGreat development effort was made to make digitising the charts as simple as possible. The Windows© program is highly intuitive with short training time. As the software tries to do most of the work automatically, only a few mouse clicks are needed to digitise if charts are of good quality.
Depending on the producer and kind of thermo-hygrograph device, a number of different stripe-types are applied in muse-ums. To enable automatic recognition, the information about chart types must be stored in the software database. The type collection can be updated and supplemented at any time when needed. Figure 1 shows required dataset input needed to define a stripe-type. The data set may look excessively dimensioned. Nevertheless it covers the minimum information, even by vari-able distances between vertical axis values. The input has to be made once and used many times when a particular chart type is digitised. Figure 1: Input data required for particular chart type
The program already includes a few typical stripe-types which were also used by some project partners.
Figure 2: Main parts of DigiChart software
The digitising procedure starts with scanning the charts. Since most of charts do not exceed A4 format, an ordinary scanner can be used. To save memory a compressed picture format (mostly *.jpeg) should be used. The resolution should be as low as possible. First experiences showed that a resolution of 150-
83
250 DPI is sufficient. In case of bad picture quality, increasing the DPI can help. DPI should be adjusted experimentally to the type and quality of charts.The next step is choosing the proper stripe type using the com-bo box in the toolbar at the top of the main window (Fig. 2). If the appropriate type is not available it must be first added to the database. After the picture is loaded and chart type de-fined, the program tries to locate the axis and chart grid auto-matically. If the automatical procedure fails, the locating can be done manually. This can be done by first clicking the but-ton “Set grid / Working area” in the toolbar, then right-clicking on the displayed grid and moving it to the proper position. The working area should be made as small as possible by moving boundary lines of the surrounding grid. If the working area is small, the program needs less time to analyse charts.
The program chooses the most different pixel colours as pat-tern of the measured value. There are two track bars at the top main window (Fig. 2) which should be moved by the user ac-cordingly since the best match of found pixels with the chart is established. Sometimes unwanted pixels (descriptions, dust etc.) are also caught. To mark areas which should be excluded from searching, the “Exclude rectangles” button in the toolbar should be activated and then the mouse should be used to mark the areas.
If there is little difference between background, grid and pat-tern or the picture is monochrome (only two colours) the pro-gram finds too few (if any) points. The user can put their own points using the “Set points” button in the toolbar. These own points and excluding rectangles can also be removed by right-clicking on the right object.
After satisfactorily covering temperature and relative humid-ity, the results can be obtained. To switch to the results, click on the “Results” tab. In the results dialog, some additional infor-mation can be set, such as the date, time and span of measured data, time step of digitised data, averaging algorithm etc. The diagram of retrieved patterns is drawn. Digitised data can be exported to text file or directly to MS Excel© (if available on the computer).
Almost 100 users have tested the software so far. Based on useful feedback, DigiChart software has been updated to version 2.2. It can be downloaded from www.climateforculture.eu, installed and used for free.
Figure 1
Figure 2
menu and toolbarmain windowresults dialogExcell© export

84 85
This brochure is based on the scientific results obtained during the Climate for Culture project. This project has received funding from the European Union’s Seventh Framework Programme for Research, Technological Development and Demonstration under grant agreement No 226973 and contributed to the implementation of the sub-programme "Protection, conservation and enhancement of cultural heritage including human habitat".Duration: 60 months (01/11/2009-31/10/2014).
The Climate for Culture team would therefore like to thank particularly the European Com-mission, DG Research and Innovation, Directorate I "Climate Services and Resource Efficien-cy". Special thanks are due to the members of DG Research and Innovation who have always given their strong support to the project: Kurt Vandenberghe (Director), Michel Chapuis, Astridt Brandt-Grau, Ekaterini Hambouri, Giulio Pattanaro and Attilio Gambardella.
We would also like to express our gratitude to Dr Angelika Niebler, Member of the European Parliament, to Eberhard Sinner, former Bavarian Minister for European Affairs as well as to Professor Alexander Bradshaw, Max Planck Society for their ongoing support and assistance. We would also like to thank the two referees, Professor Koenraad van Balen (KU Leuven, Belgium) and Dr Erik Kjellström (SMHI, Sweden) for their helpful and constructive comments during the midterm evaluation.
Furthermore, the team is very grateful to the National Trust of England, the Bavarian Adminis-tration of State Palaces, Gardens and Lakes, the National Institute of Cultural Heritage, France and the Bavarian State Paintings Collections for hosting the symposia, workshops, kick-off meeting and final closing ceremony.
The editors of the brochure also acknowledge the contributions from the partners of the Climate for Culture project who have produced many highly significant results in a truly multidisciplinary research area. They have continually shown great enthusiasm and expertise, overcoming many obstacles on the way. Working together in an EU-funded research project is a small, but impor-tant contribution to our common European future, in which cultural heritage and its preservation are likely to play an even more important role in the future.
The Climate for Culture project has made substantial contributions to the field of cultural herita-ge, to the building sector in general, and in the development of research methodologies. The Climate for Culture project has brought together individuals from different fields such as che-mistry, building physics, meteorology, economics, mathematics, engineering, conservation sci-ence and cultural heritage management. The multidisciplinary approach was a challenge, but at the same a necessity, due to the cross-disciplinary nature of the project. By reserving more time for face-to-face meetings, supported by a special training seminar, the team members improved their skills in working in such environments. For the first time ever a completely new approach of coupling climate modelling and whole building simulation was used. This methodology includes a database of more than 120 historic buildings and provides an automatic way of predicting how outdoor environmental changes influence the climatic functioning of historic buildings, their in-door environments and the future energy demand for local climate control. It can also be applied to the entire building sector, for example to assess future energy demands of different building typologies or the performance of new building products and technology. With this approach Cli-mate for Culture also promotes the use of modelling and simulation, techniques that are urgently needed in the cultural heritage field. The involvement of conservators for surveys on the state of preservation of collections in the form of population studies will support the validation of the models and provide new information for the ongoing discussion about the right climate values for museums and collections. Additionally, sustainable and energy-efficient mitigation and adaptation solutions based on the Climate for Culture methodology also involving mathematical models of object responses to in-door-climate variations were tested and further developed. The research findings are presented in 55,650 thematic maps which address future outdoor and indoor climates until the year 2100, risks to cultural heritage objects like mould growth or insect pests, and future energy demand for climate control in historic buildings. Many of the results obtained are integrated into the decisi-on support systems DMSS and ExDSS, offering useful information for heritage owners and the interested public. By constantly enlarging the database and employing Big Data software algo-rithms, it will become possible for those responsible for cultural heritage to plan operational acti-vities more efficiently, thus saving time and money. In addressing the socio-economics of cultural heritage preservation in times of climate change for the first time, an in-depth study revealed a widespread ‘Willingness to Pay’ in particular for the prevention of possible damage from climate change, even when this damage is slow and cumulative rather than quick and noticeable. The benefits of cultural heritage to the European economy and the tourism sector, as well as its role in improving the feeling of identity of citizens in an increasingly globalized world, have to be pre-sented in a wider context. Finally, the findings of Climate for Culture will contribute significantly to the education of future cultural heritage experts and will assist policy and decision-making in sustaining our cultural legacy for future generations.
Acknowledgement Johanna Leissner, Jonathan Ashley-Smith, Tomáš Vyhlídal and Ralf Kilian
BUILT CULTURAL HERITAGE IN TIMES oF CLIMATE CHANGECoNCLUSIoNS AND FUTURE PERSPECTIVES

86
Fraunhofer-Gesellschaft zur Förderung der angewandten Forschung e.V.Fraunhofer BrusselsJohanna Leissner (Project Coordinator and Lead Work Package 9), Constanze Fuhrmann, Viktoria Piehl, Sybil Klein
Fraunhofer Institute for Building Physics IBPGermanyRalf Kilian (Scientific Coordinator), Florian Antretter (Lead Work Package 3), Max Bagus, Stefan Bichlmair, Hans Brandl, Flora Charmeau, David erhard, Johann Gottschling, Kristina holl, Isabelle Kandler, Sarah Kosmann, Martin Krus, Laura Lun, Matthias pazold, Sebastian paulus, Judith riedler, Fabian ritter, Doris rösler, Stefan Schweiger, Klaus-peter Sedlbauer, Barbara Wehle, Ulrich Wellisch (FH Rosenheim), Matthias Winkler
Fraunhofer Center for Central and Eastern Europe MOEZGermanyUrban Kaiser (Financial and adminstrative Coordinator), Uta pollmer (Financial and adminstrative Coordinator), Susanne Füller
Fraunhofer Institute for Silicate Research ISCGermanySabrina rota, paul Bellendorf, Gabriele Maas-Diegeler, Julia Wittke, Katrin Wittstadt
Czech Technical University in PragueCzech RepublicTomás Vyhlídal (Lead Work Package 7.1), Martin Dvořák, Jaromír Fišer, Ivana Oswaldová, Goran Simeunovic, Jiří Šolc, Pavel Zítek
Italian National Research Council - Institute of Atmospheric Sciences and ClimateItalyDario Camuffo (Lead Work Package 5), Chiara Bertolin
University of ZagrebCroatiaVlatka Rajčić (Lead Work Package 8), Jure Barbalic, Domagoj Damjanovic, Ivan Duvnjak, Ana Skender, Mislav Stepinac
Foundation for Research and Technology - Institute of Electronic Structure & LaserGreeceVivi Tornari (Lead Work Package 2.2), Mihalis Andriannakis, Eirini Bernikola, Kostas Hatzigiannakis, Nota Tsigarida, elsa Tsiranidou
Max Planck Institute for MeteorologyGermanyDaniela Jacob (Lead Work Package 1), Lola Kotova, Uwe Mikolajewicz
Technische Universität MünchenGermanyerwin emmerling, Simone Miller, andreas Weiß
87
CLIMATE FoR CULTURE PARTNERS
ISAC

88 89
Eindhoven University of TechnologyThe NetherlandsHenk Schellen (Lead Work Package 2.3), Zara Huijbregts, Rick Kramer, Marco Martens, Jos van Schijndel
University of LjubljanaSloveniaRoko Žarnić (Lead Work Package 10), Violeta Bokan Bosiljkov, Franci Čepon, Petra Štukovnik, Barbara Vodopivec
Gradbeni Institut ZRMK - Centre for Indoor Environment, Building Physics and EnergySloveniaMarjana Šijanec‐Zavrl, Henrik Gjerkeš, Mihael Mirtič, Miha Praznik, Andraž Rakušček, Gašper Stegnar, Miha Tomšič
Uppsala University - Campus GotlandSwedenTor Broström (Scientific Coordinator and Lead Work Package 7.2), Maria Brunskog, Poul Klenz Larsen, Gustaf Leijonhufvud, Magnus Wessberg
Andreas Weiß - Freelance conservator-restorer GermanyAndreas Weiß (Scientific Coordinator)
Engineering Consulting & Software DevelopmentPolandJan Radon, Agnieszka Sadlowska‐Salega
Krah&Grote Measurement SolutionsGermanyrobert Krah
TB Käferhaus GmbHAustriaJochen Käferhaus, Stefanie huber, Wieland Moser
Haftcourt Ltd.SwedenJan Holmberg, Monika Fjaestad, Lisa Nilsen
ACCIONA InfrastructureSpainMagdalena Rozanska, Jesus Garcia Domínguez
EC&SDENGINEERING CONSULTING
& SOFTWARE DEVELOPMENT

90 91
Bavarian Administration of State Palaces, Gardens and LakesGermanyKatrin Janis, Martin Bosch, Wolfgang eichner, Klaus häfner, Tina Naumovic, Sigrid Stache
Bavarian State Painting Collections - Doerner Institut GermanyAndreas Burmester, Melanie Eibl (Lead Work Package 2.1),Christian Nippert
National Trust for England, Wales and Northern IrelandUnited KingdomKaty Lithgow, Robert Abernethy, Siobhan Barratt, Nigel Blades, Victoria Bradley, Jan Brookes, Chris Calnan, Catherine Harris, Paul Hawkins, Paul Holden, Nigel Jackson, Yanni Simpson, Sarah Staniforth, Gwen Thomas, Cara Wallace, Mick Wilkes
Kybertec Ltd.Czech RepublicOto Sládek, Aleš Sládek
Glasgow Caledonian UniversityUnited KingdomPaul Baker, Anastasios Markopoulos, Philip Smit
Center for Documentation of Cultural & Natural Heritage EgyptYasser El Shayeb, Niveen Eid, Mostafa El Sayed, Amr Fangary, Mo-hamed Farouk, Hind Mostafa, Samaa Moustafa, Mohamed Nabil, ebtehal Salaheldin, hania Salem
Jonathan Ashley-Smith - Consultant for Conservation Risk AssessmentUnited KingdomJonathan Ashley‐Smith (Scientific Coordinator and Lead Work Package 4)
The National Institute of Cultural HeritageFranceFlorence Bertin, Sigrid Mirabaud, Marie-Christine papillon,roch payet
The London School of Economics and Political ScienceUnited KingdomSusana Mourato (Lead Work Package 6), Eleni Fimereli, Chris Gaskell, Davide Contu
Foundation Salvatore MaugeriItalyClaudio Cocheo

92 93
The Evangelical Church of Augustan Confession in RomaniaRomaniaagnes Balint, richard Sterner
University of Gothenburg, Department of ConservationSwedenCharlotta Bylund Melin, Jonny Bjurman
The Royal Institute of TechnologySwedenTorun Widström
Prussian Palaces and Gardens Foundation Berlin-BrandenburgGermanyWulf Eckermann
Dublin Institute of TechnologyIrelandCathy Daly
ASSoCIATED PARTNERS
The Climate for Culture team at the final conference in the Munich Residence

94 95
Chapter 3.1
Figure 1 Eindhoven University of Technology, A.W.M. van Schijndel
Figure 2a LSH/Skokloster Castle
Chapter 3.3
Figure 1 Jochen Käferhaus
Figure 2a Bayerische Schlösserverwaltung, www.schloesser.bayern.de, Rainer Herrmann, Maria Scherf, Ulrich Pfeuf-fer, Schloss Linderhof, Schlafzimmer
Figure 2b Fraunhofer IBP
Chapter 3.4
Figure 1; Figure 2 Fraunhofer IBP
Chapter 4.4
Figure 1; Figure 2a, b; Figure 3a, b, c; Figure 4a-e Foundation for Research and Technology Hellas – Institute of Electronic Structure and Lasers
Chapter 4.5
Figure 1 National Trust Images
Figure 2 National Trust Images/John Hammond
Chapter 4.6
Figure 1 Andreas Weiss
Figure 2 Kristina Holl, BSV
Figure 3 Charlotta Bylund Melin
Chapter 5.2
Figure 1 National Trust Images/Andreas von Einsiedel
Chapter 5.3
Figure 1 Bayerische Schlösserverwaltung, www.schloesser.bayern.de, A.J. Brandl, Schloss Neuschwanstein
Chapter 6.2
Figure 1-Figure 6 Eindhoven University of Technology
Cover Page
Linderhof Palace, Germany Bayerische Schlösserverwaltung, www.schloesser.bayern.de, Andrea Gruber, Rainer Herrmann, Maria Scherf u.a., Schloss Linderhof, Hauptfassade mit Bassin und Floraspringbrunnen
Blickling Hall, UK National Trust Images/Andrew Butler
Granträsk Chapel, Sweden Anders Nordström, Historiska hus AB, Umea, Sweden
Church of St. Phanouriosin Valsamonero, Greece Foundation for Research and Technology Hellas – Institute of Electronic Structure and Lasers
Simulation „Church in Storm“ Fraunhofer IBP
Chapter Images
Chapter 1: King's House on the Schachen, Germany Bayerische Schlösserverwaltung, www.schloesser.bayern.de, Andrea Gruber, Rainer Herrmann, Maria Scherf u.a., Königshaus am Schachen, Außenansicht
Chapter 2: St. Bartholomä am Königssee, Germany Bayerische Schlösserverwaltung, www.schloesser.bayern.de, Andrea Gruber, Rainer Herrmann, Maria Scherf u.a., St. Bartholomä am Königssee
Chapter 3: Karlstejn Castle, Czech Republic
Chapter 4: Rector‘s Palace Dubrovnik, Croatia Faculty of Civil Engineering Zagreb
Chapter 5: Knole House, UK National Trust Images/Robert Morris
Chapter 6: Amerongen Castle, The Netherlands Eindhoven University of Technology
Introduction
Figure 1 Scheme by Fraunhofer IBP; SMHI; Eindhoven University of Technology; Bayerische Schlösserverwaltung, www.schloesser.bayern.de, Andrea Gruber, Rainer Herrmann, Maria Scherf u.a., Königshaus am Schachen, Außenansicht
Chapter 1
Figure 1; Figure 2 MPG/Climate Service Centre
Figure 3 Max Planck Institute for Meteorology (MPG)
Chapter 2.3
Figure 1; Figure 2 Eindhoven University of Technology, A.W.M. van Schijndel
Chapter 2.4
Figure 1 National Trust Images/Andreas von Einsiedel
Figure 2 National Trust Images/Robert Morris
IMAGE RIGHTS

Published by:
Fraunhofer-Center for Central and Eastern Europe MoEZStädtisches Kaufhaus LeipzigNeumarkt 9-19, 04109 LeipzigPhone: +49 341 231039-0, Fax: +49 341 231039-190Email: [email protected]: www.moez.fraunhofer.de Editors:Johanna Leissner, Urban Kaiser, Ralf KilianEditorial deadline: october 2014 Picture credits:Title: © Germany Bayerische Schlösserverwaltung (Andrea Gruber, Rainer Herrmann, Maria Scherf inter alia); © National Trust Images/Andrew Butler; © Anders Nordström, Historiska hus AB, Umea, Sweden; © Foundation for Research and Technology Hellas – Institute of Electronic Structure and Lasers; © Fraunhofer IBP; Radical according to page 94 f. Design and typesetting:Pfefferkorn & Friends GmbHwww.pfefferkornundfriends.de Print:Weltbuch Verlag GmbHwww.weltbuch.com Edition:1,500 copies This brochure can be ordered from the publisher.
For more information about the project please visit www.climateforculture.eu
ISBN 978-3-00-048328-8
IMPRINT
9796

ISBN 978-3-00-048328-8
CLIMATE FoR CULTURE – THE „FLYING” CHURCH
A model building travelling through time and space


![Risk assessment [Chapter 9]](https://img.pdfslide.net/doc/110x75/635242847a164e65570ad200/risk-assessment-chapter-9.jpg)


