Embed Size (px)
Citation preview
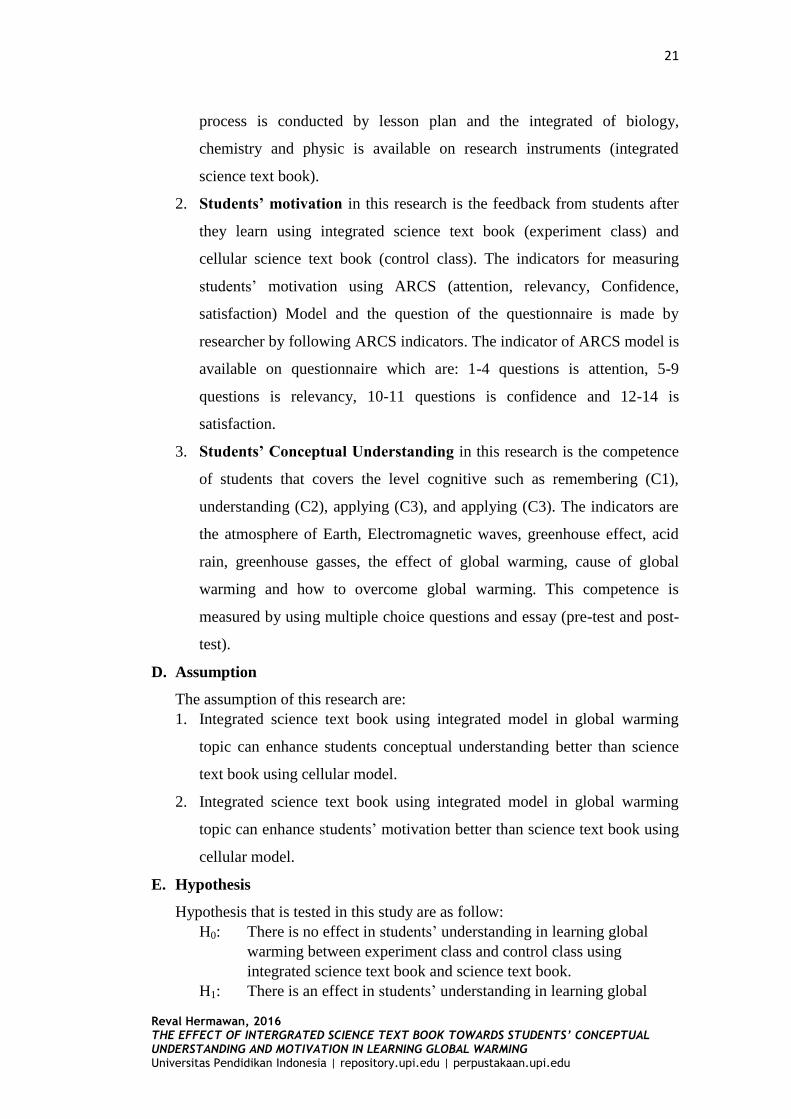
20
Reval Hermawan, 2016 THE EFFECT OF INTERGRATED SCIENCE TEXT BOOK TOWARDS STUDENTS’ CONCEPTUAL UNDERSTANDING AND MOTIVATION IN LEARNING GLOBAL WARMING Universitas Pendidikan Indonesia | repository.upi.edu | perpustakaan.upi.edu
CHAPTER III
RESEARCH METHODOLOGY
A. Research Method and Research Design
1. Research Method
The research method used for this research is quasi experiment.
Creswell (2012) stated that quasi experiments include assignment, but not
random assignment of participants to group. This is because the
experimenter cannot artificially create groups for the experiments. This
method is appropriate with the purpose of the research which is
investigating the effect of integrated science text book towards students’
conceptual understanding and students’ motivation in learning global
warming which are comparing the difference treatment on two difference
class.
2. Research Design
The design used in this research is pre-test and post-test design
(Creswell, 2012). The researcher assigns intact groups the experimental
and control treatments, administers a pre-test to both groups, conducts
experimental treatment activities with the experimental group only, and
then administers a post-test to assess the differences between the two
groups.
Table 3.1 Pre-test and Post-test Design
Select Control
Group
Pre-test Cellular text book Post-test
Select Experimental
Group
Pre-test Integrated text book Post-test
(Adapted from Creswell, 2012)
B. Research Location, Population and Sample
The location of this research is in one of the junior high school in Bandung
Regency. The population in this research is all 7th
grade students at one of the
school in Bandung Regency. The sample are 7th
grade students from two
different classes in one of the school in Bandung Regency. The sampling
technique that used is purposive sampling. This sampling technique based on a
certain consideration or purpose (Sugiyono, 2015).
C. Operational Definition
In order to avoid misconception about this research, some operational
definitions are explained in this research. Those terminologies are explained
as a follow:
1. Integrated Model is the model of learning materials which is one subject
with another subject in science are integrated or correlates each other. In
this research the subject is biology, chemistry and physic. Learning
21
Reval Hermawan, 2016 THE EFFECT OF INTERGRATED SCIENCE TEXT BOOK TOWARDS STUDENTS’ CONCEPTUAL UNDERSTANDING AND MOTIVATION IN LEARNING GLOBAL WARMING Universitas Pendidikan Indonesia | repository.upi.edu | perpustakaan.upi.edu
process is conducted by lesson plan and the integrated of biology,
chemistry and physic is available on research instruments (integrated
science text book).
2. Students’ motivation in this research is the feedback from students after
they learn using integrated science text book (experiment class) and
cellular science text book (control class). The indicators for measuring
students’ motivation using ARCS (attention, relevancy, Confidence,
satisfaction) Model and the question of the questionnaire is made by
researcher by following ARCS indicators. The indicator of ARCS model is
available on questionnaire which are: 1-4 questions is attention, 5-9
questions is relevancy, 10-11 questions is confidence and 12-14 is
satisfaction.
3. Students’ Conceptual Understanding in this research is the competence
of students that covers the level cognitive such as remembering (C1),
understanding (C2), applying (C3), and applying (C3). The indicators are
the atmosphere of Earth, Electromagnetic waves, greenhouse effect, acid
rain, greenhouse gasses, the effect of global warming, cause of global
warming and how to overcome global warming. This competence is
measured by using multiple choice questions and essay (pre-test and post-
test).
D. Assumption
The assumption of this research are:
1. Integrated science text book using integrated model in global warming
topic can enhance students conceptual understanding better than science
text book using cellular model.
2. Integrated science text book using integrated model in global warming
topic can enhance students’ motivation better than science text book using
cellular model.
E. Hypothesis
Hypothesis that is tested in this study are as follow:
H0: There is no effect in students’ understanding in learning global
warming between experiment class and control class using
integrated science text book and science text book.
H1: There is an effect in students’ understanding in learning global
22
Reval Hermawan, 2016 THE EFFECT OF INTERGRATED SCIENCE TEXT BOOK TOWARDS STUDENTS’ CONCEPTUAL UNDERSTANDING AND MOTIVATION IN LEARNING GLOBAL WARMING Universitas Pendidikan Indonesia | repository.upi.edu | perpustakaan.upi.edu
warming between experiment class and control class using
integrated science text book and science text book.
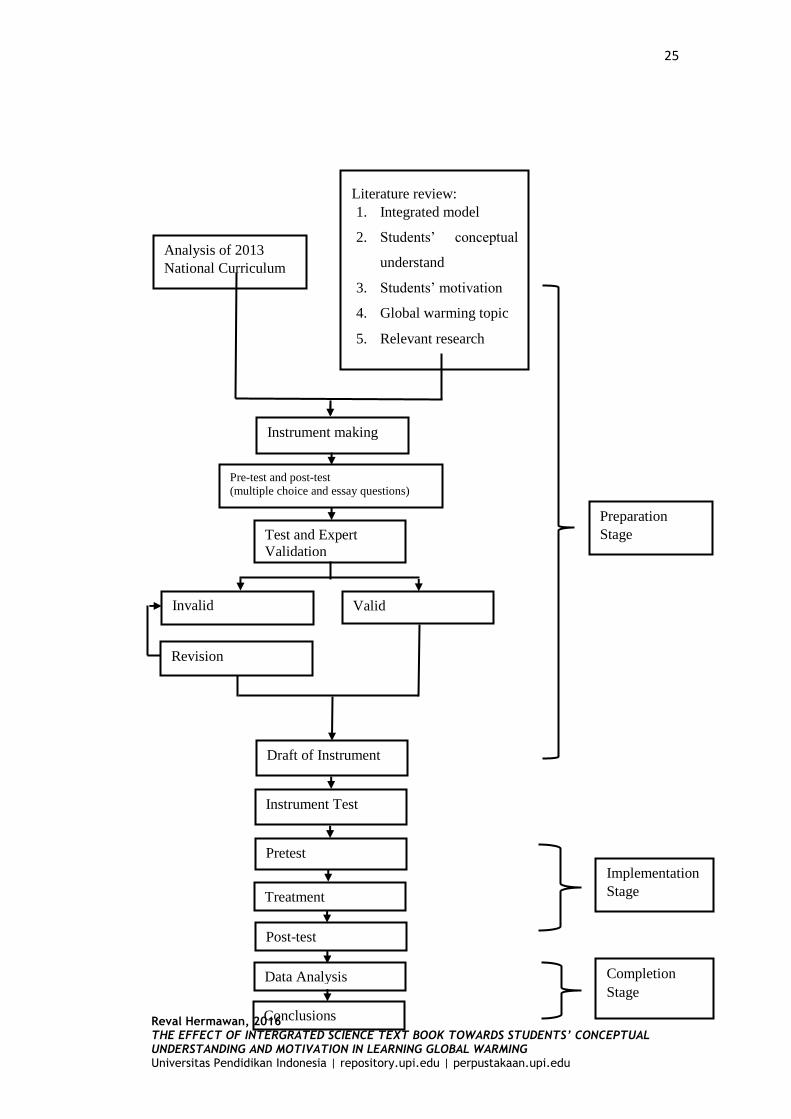
F. Research Procedures
Generally, the procedure in this research is divided into three stages which
are preparation stage, implementation stage and completion stage. Each stage
has its own activities which are conducted during the research.
1. Preparation Stage
The steps are including the preparation stage as follows:
a. Analyze the teaching and learning process using science conventional
model (cellular model) and science integrated model
b. Analyze the usage of both methods on Indonesian curriculum.
c. Determine the sample and populations of this research
d. Literature review was conducted in analyzing the information about:
1) Integrated model
2) Students understanding which is consist of multiple choice and
essay
3) Students’ motivation using ARCS model
4) Global warming topic
e. Research problem is identified and elaborate with several research
questions. To answer the research questions, research instrument is
need for gaining the data. Arrangement of research instrument include:
1) Multiple choices and essay to measure the students conceptual
understanding.
2) Questionnaire of ARCS model to measure the students’
motivation.
3) Observation sheet to describe the condition of teaching and
learning process for implementing learning material using
integrated model and cellular model.
4) The whole of research instrument was judged by expert.
5) Trial test for multiple choices and essay instrument was conducted
to identify the quality of the instrument.
6) The result of trial test was analyzed.
23
Reval Hermawan, 2016 THE EFFECT OF INTERGRATED SCIENCE TEXT BOOK TOWARDS STUDENTS’ CONCEPTUAL UNDERSTANDING AND MOTIVATION IN LEARNING GLOBAL WARMING Universitas Pendidikan Indonesia | repository.upi.edu | perpustakaan.upi.edu
7) The revision of instrument test was done based on the expert
judgment result and instrument test analysis.
8) Draft of instrument
2. Implementation Stage
The steps are including the implementation stage as follows:
a. Distribute the pre-test to the control group and experimental group to
know the students’ prior knowledge within learning global warming
b. Conduct the treatment of conventional method using conventional text
book in learning global warming to the control group which are
conducted in four meeting that explain as follows:
1) 1st
meeting is pretest and introduction of global warming using
text book constructed by curriculum 2006 book written by Sri
Sulastri et al. (2012)
2) 2nd
meeting learning about pelapukan di kulit Bumi using text book
constructed by curriculum 2006 book written by Sri Sulastri et al.
(2012)
3) 3rd
meeting learning about Pemanasan global include efek rumah
kaca, dampak pemanasan global, dan bagaimana cara
menanggulangi efek pemanasan global using text book constructed
by curriculum 2006 book written by Sulastri, S. et al. (2012)
4) 4th
meeting is posttest to know how far students understand the
topic. At the end of the lessons, students should fulfill the
questionnaire to measure their motivation.
c. Conduct the treatment of leaning material using integrated model in
learning global warming to the experimental group which are
conducted in four meeting that explain as follows:
1) 1st
meeting is pretest and introduction of global warming using
learning materials constructed by researcher using integrated
model
2) 2nd
meeting learning about apa itu pemanasan global dan
penyebab pemanasan global using learning materials constructed
by researcher using integrated model
24
Reval Hermawan, 2016 THE EFFECT OF INTERGRATED SCIENCE TEXT BOOK TOWARDS STUDENTS’ CONCEPTUAL UNDERSTANDING AND MOTIVATION IN LEARNING GLOBAL WARMING Universitas Pendidikan Indonesia | repository.upi.edu | perpustakaan.upi.edu
3) 3rd
meeting learning about dampak pemanasan global dan
menanggulangi pemanasan global using learning materials
constructed by researcher using integrated model
4) 4th
meeting is pretest to know how far students understand this
topic. At the end of the lessons, students should fulfill the
questionnaire to measure their motivation.
3. Completing Stage
The steps are including the implementation stage as follows:
a. The whole of data which is obtained in the both groups was calculated
b. The result of data calculation was analyzed.
c. Conclusions were obtained based on the result of experiment in both
groups.
25
Reval Hermawan, 2016 THE EFFECT OF INTERGRATED SCIENCE TEXT BOOK TOWARDS STUDENTS’ CONCEPTUAL UNDERSTANDING AND MOTIVATION IN LEARNING GLOBAL WARMING Universitas Pendidikan Indonesia | repository.upi.edu | perpustakaan.upi.edu
Literature review:
1. Integrated model
2. Students’ conceptual
understand
3. Students’ motivation
4. Global warming topic
5. Relevant research
Analysis of 2013
National Curriculum
Instrument making
Pre-test and post-test (multiple choice and essay questions)
Test and Expert
Validation
Invalid
Revision
Valid
Draft of Instrument
Pretest
Treatment
Instrument Test
Post-test
Data Analysis
Conclusions
Preparation
Stage
Implementation
Stage
Completion
Stage
26
Reval Hermawan, 2016 THE EFFECT OF INTERGRATED SCIENCE TEXT BOOK TOWARDS STUDENTS’ CONCEPTUAL UNDERSTANDING AND MOTIVATION IN LEARNING GLOBAL WARMING Universitas Pendidikan Indonesia | repository.upi.edu | perpustakaan.upi.edu
Figure 3.1 Flowchart of Research Procedures
G. Research Instruments
In order to make the data gain is arranged well, the research instrument is
necessary. There are four type of instrument that is used in this research which
is integrated science text book, objective test (multiple choice and essay for
pretest and posttest), observation sheet and questionnaire.
Table 3.2 List of Research Instruments
Instruments Used for
Integrated science text book The sources of learning
Objective test Test for pretest and posttest
Observation sheet Controlling/ checking the learning activity
Questionnaire Measuring students’ motivation (ARCS
Model)
Those instruments are described as follow:
1. Integrated Science text book
This research comparing the two book which have different
arrangement (cellular model and integrated model). The researcher made
the integrated science text book by following the standard criteria from
BSNP or Badan Standar Nasional Pendidikan and judged by some experts
for experiments group while cellular book is using science physic standar
isi KTSP 2006 by Sulastri et al. for control group.
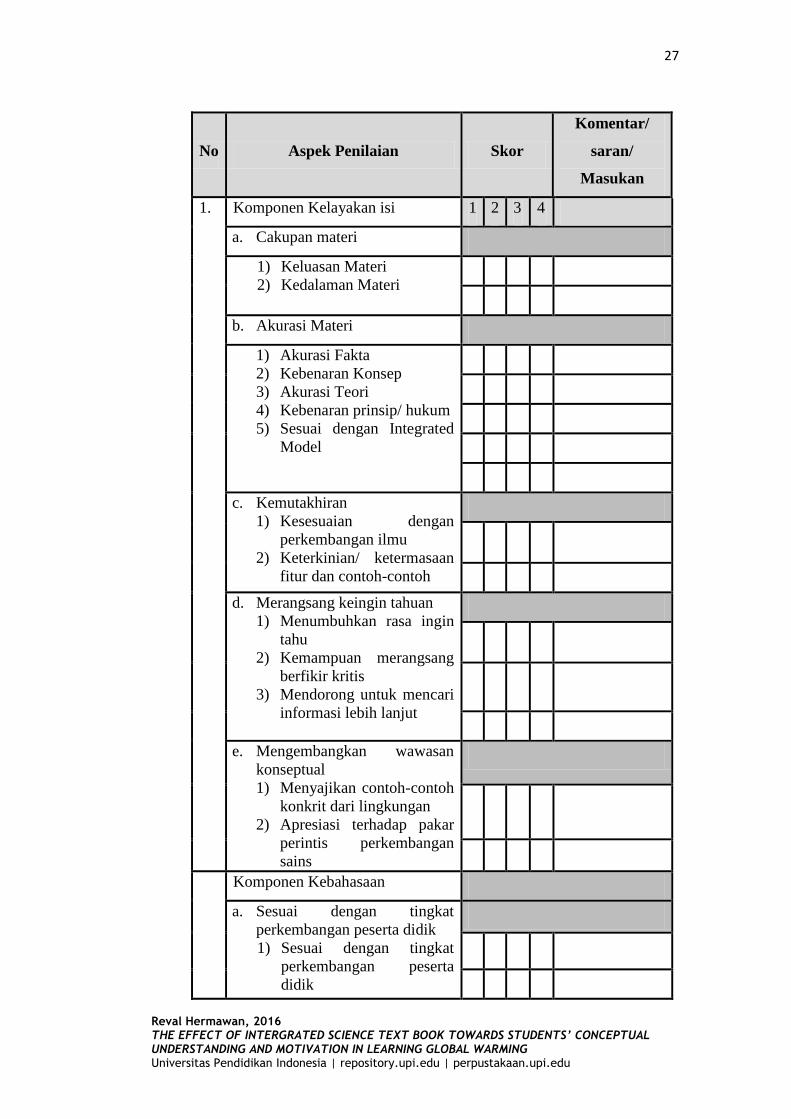
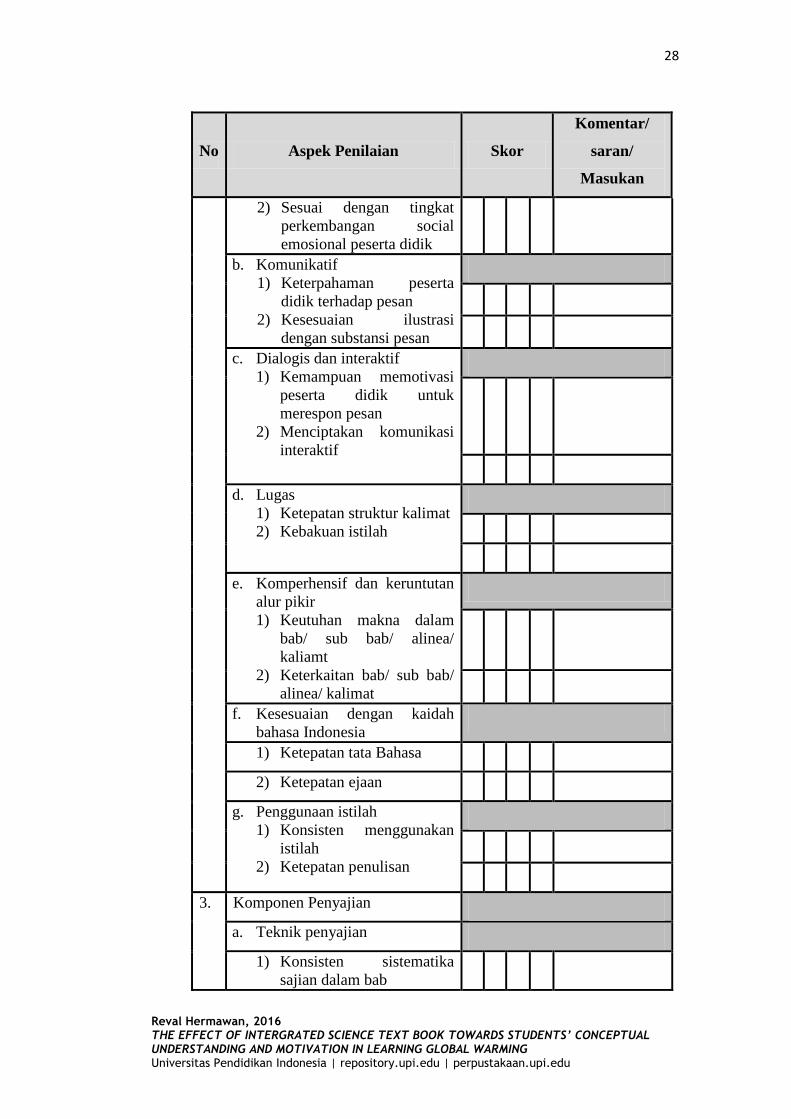
The judgement sheet of integrated science text book following by
Badan Standar Nasional Pendidikan (BSNP) have three big aspects that
judged by some expert such as appropriateness components of contents,
component of linguistics and component of displays. The judgements are
as follow:
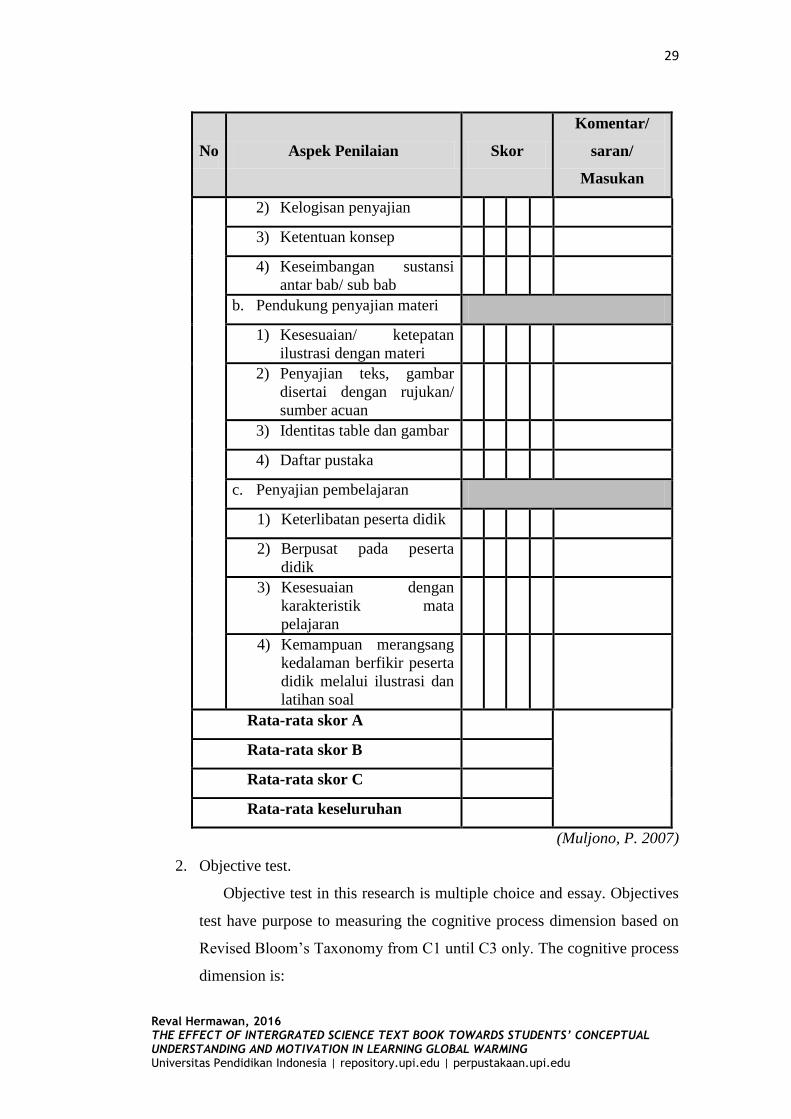
Table 3.3 Validity Sheet of Integrated Science Text Book
27
Reval Hermawan, 2016 THE EFFECT OF INTERGRATED SCIENCE TEXT BOOK TOWARDS STUDENTS’ CONCEPTUAL UNDERSTANDING AND MOTIVATION IN LEARNING GLOBAL WARMING Universitas Pendidikan Indonesia | repository.upi.edu | perpustakaan.upi.edu
No Aspek Penilaian Skor
Komentar/
saran/
Masukan
1. Komponen Kelayakan isi 1 2 3 4
a. Cakupan materi
1) Keluasan Materi
2) Kedalaman Materi
b. Akurasi Materi
1) Akurasi Fakta
2) Kebenaran Konsep
3) Akurasi Teori
4) Kebenaran prinsip/ hukum
5) Sesuai dengan Integrated
Model
c. Kemutakhiran
1) Kesesuaian dengan
perkembangan ilmu
2) Keterkinian/ ketermasaan
fitur dan contoh-contoh
d. Merangsang keingin tahuan
1) Menumbuhkan rasa ingin
tahu
2) Kemampuan merangsang
berfikir kritis
3) Mendorong untuk mencari
informasi lebih lanjut
e. Mengembangkan wawasan
konseptual
1) Menyajikan contoh-contoh
konkrit dari lingkungan
2) Apresiasi terhadap pakar
perintis perkembangan
sains
Komponen Kebahasaan
a. Sesuai dengan tingkat
perkembangan peserta didik
1) Sesuai dengan tingkat
perkembangan peserta
didik
28
Reval Hermawan, 2016 THE EFFECT OF INTERGRATED SCIENCE TEXT BOOK TOWARDS STUDENTS’ CONCEPTUAL UNDERSTANDING AND MOTIVATION IN LEARNING GLOBAL WARMING Universitas Pendidikan Indonesia | repository.upi.edu | perpustakaan.upi.edu
No Aspek Penilaian Skor
Komentar/
saran/
Masukan
2) Sesuai dengan tingkat
perkembangan social
emosional peserta didik
b. Komunikatif
1) Keterpahaman peserta
didik terhadap pesan
2) Kesesuaian ilustrasi
dengan substansi pesan
c. Dialogis dan interaktif
1) Kemampuan memotivasi
peserta didik untuk
merespon pesan
2) Menciptakan komunikasi
interaktif
d. Lugas
1) Ketepatan struktur kalimat
2) Kebakuan istilah
e. Komperhensif dan keruntutan
alur pikir
1) Keutuhan makna dalam
bab/ sub bab/ alinea/
kaliamt
2) Keterkaitan bab/ sub bab/
alinea/ kalimat
f. Kesesuaian dengan kaidah
bahasa Indonesia
1) Ketepatan tata Bahasa
2) Ketepatan ejaan
g. Penggunaan istilah
1) Konsisten menggunakan
istilah
2) Ketepatan penulisan
3. Komponen Penyajian
a. Teknik penyajian
1) Konsisten sistematika
sajian dalam bab
29
Reval Hermawan, 2016 THE EFFECT OF INTERGRATED SCIENCE TEXT BOOK TOWARDS STUDENTS’ CONCEPTUAL UNDERSTANDING AND MOTIVATION IN LEARNING GLOBAL WARMING Universitas Pendidikan Indonesia | repository.upi.edu | perpustakaan.upi.edu
No Aspek Penilaian Skor
Komentar/
saran/
Masukan
2) Kelogisan penyajian
3) Ketentuan konsep
4) Keseimbangan sustansi
antar bab/ sub bab
b. Pendukung penyajian materi
1) Kesesuaian/ ketepatan
ilustrasi dengan materi
2) Penyajian teks, gambar
disertai dengan rujukan/
sumber acuan
3) Identitas table dan gambar
4) Daftar pustaka
c. Penyajian pembelajaran
1) Keterlibatan peserta didik
2) Berpusat pada peserta
didik
3) Kesesuaian dengan
karakteristik mata
pelajaran
4) Kemampuan merangsang
kedalaman berfikir peserta
didik melalui ilustrasi dan
latihan soal
Rata-rata skor A
Rata-rata skor B
Rata-rata skor C
Rata-rata keseluruhan
(Muljono, P. 2007)
2. Objective test.
Objective test in this research is multiple choice and essay. Objectives
test have purpose to measuring the cognitive process dimension based on
Revised Bloom’s Taxonomy from C1 until C3 only. The cognitive process
dimension is:
30
Reval Hermawan, 2016 THE EFFECT OF INTERGRATED SCIENCE TEXT BOOK TOWARDS STUDENTS’ CONCEPTUAL UNDERSTANDING AND MOTIVATION IN LEARNING GLOBAL WARMING Universitas Pendidikan Indonesia | repository.upi.edu | perpustakaan.upi.edu
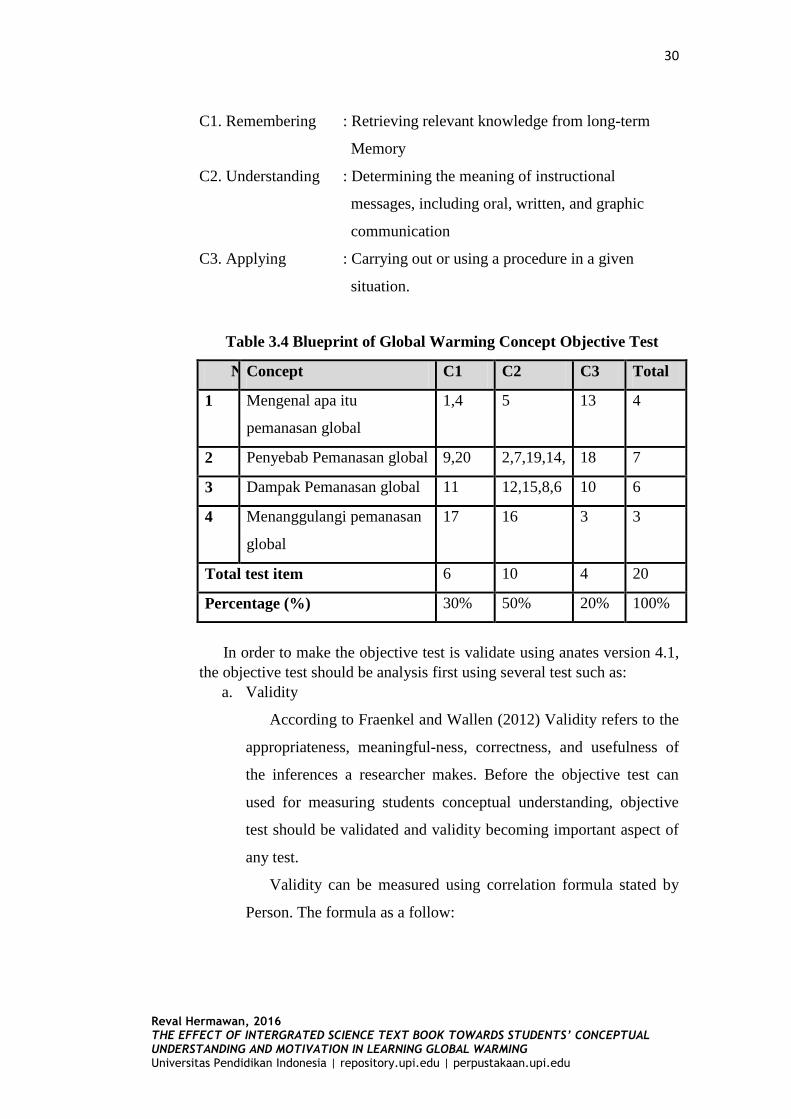
C1. Remembering : Retrieving relevant knowledge from long-term
Memory
C2. Understanding : Determining the meaning of instructional
messages, including oral, written, and graphic
communication
C3. Applying : Carrying out or using a procedure in a given
situation.
Table 3.4 Blueprint of Global Warming Concept Objective Test
No No Concept C1 C2 C3 Total
1 Mengenal apa itu
pemanasan global
1,4 5 13 4
2 Penyebab Pemanasan global 9,20 2,7,19,14, 18 7
3 Dampak Pemanasan global 11 12,15,8,6 10 6
4 Menanggulangi pemanasan
global
17 16 3 3
Total test item 6 10 4 20
Percentage (%) 30% 50% 20% 100%
In order to make the objective test is validate using anates version 4.1,
the objective test should be analysis first using several test such as:
a. Validity
According to Fraenkel and Wallen (2012) Validity refers to the
appropriateness, meaningfulness, correctness, and usefulness of
the inferences a researcher makes. Before the objective test can
used for measuring students conceptual understanding, objective
test should be validated and validity becoming important aspect of
any test.
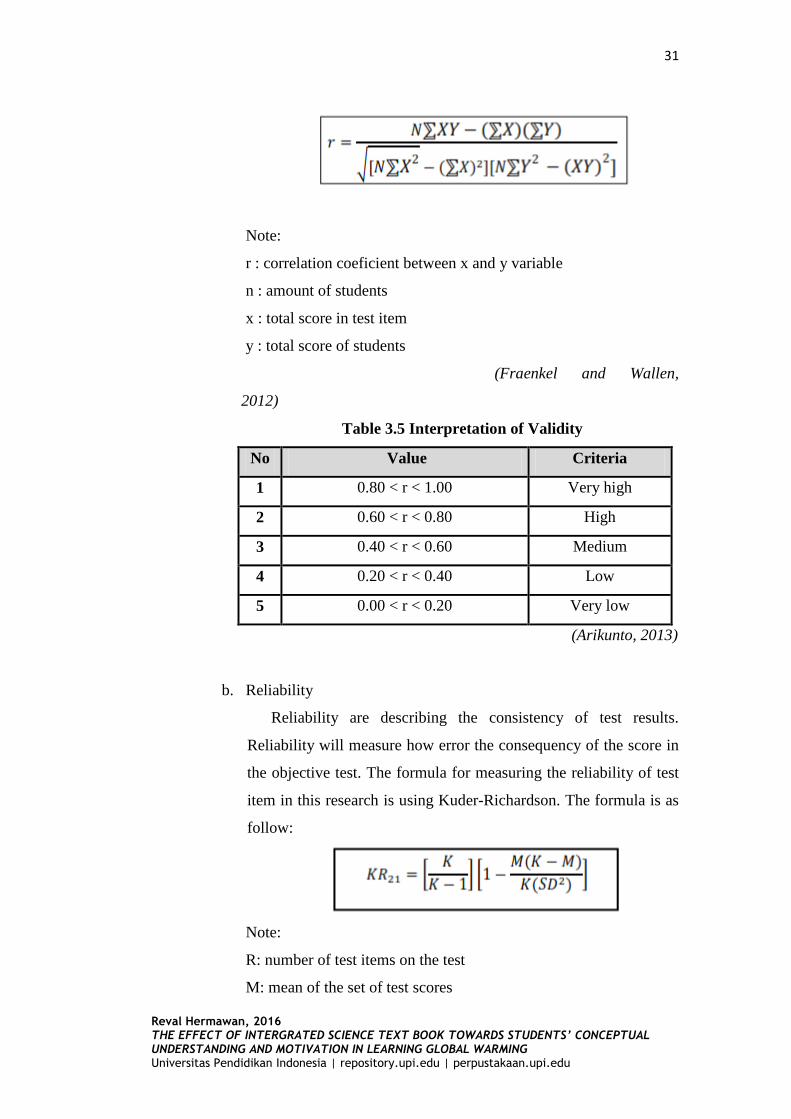
Validity can be measured using correlation formula stated by
Person. The formula as a follow:
31
Reval Hermawan, 2016 THE EFFECT OF INTERGRATED SCIENCE TEXT BOOK TOWARDS STUDENTS’ CONCEPTUAL UNDERSTANDING AND MOTIVATION IN LEARNING GLOBAL WARMING Universitas Pendidikan Indonesia | repository.upi.edu | perpustakaan.upi.edu
Note:
r : correlation coeficient between x and y variable
n : amount of students
x : total score in test item
y : total score of students
(Fraenkel and Wallen,
2012)
Table 3.5 Interpretation of Validity
No Value Criteria
1 0.80 < r < 1.00 Very high
2 0.60 < r < 0.80 High
3 0.40 < r < 0.60 Medium
4 0.20 < r < 0.40 Low
5 0.00 < r < 0.20 Very low
(Arikunto, 2013)
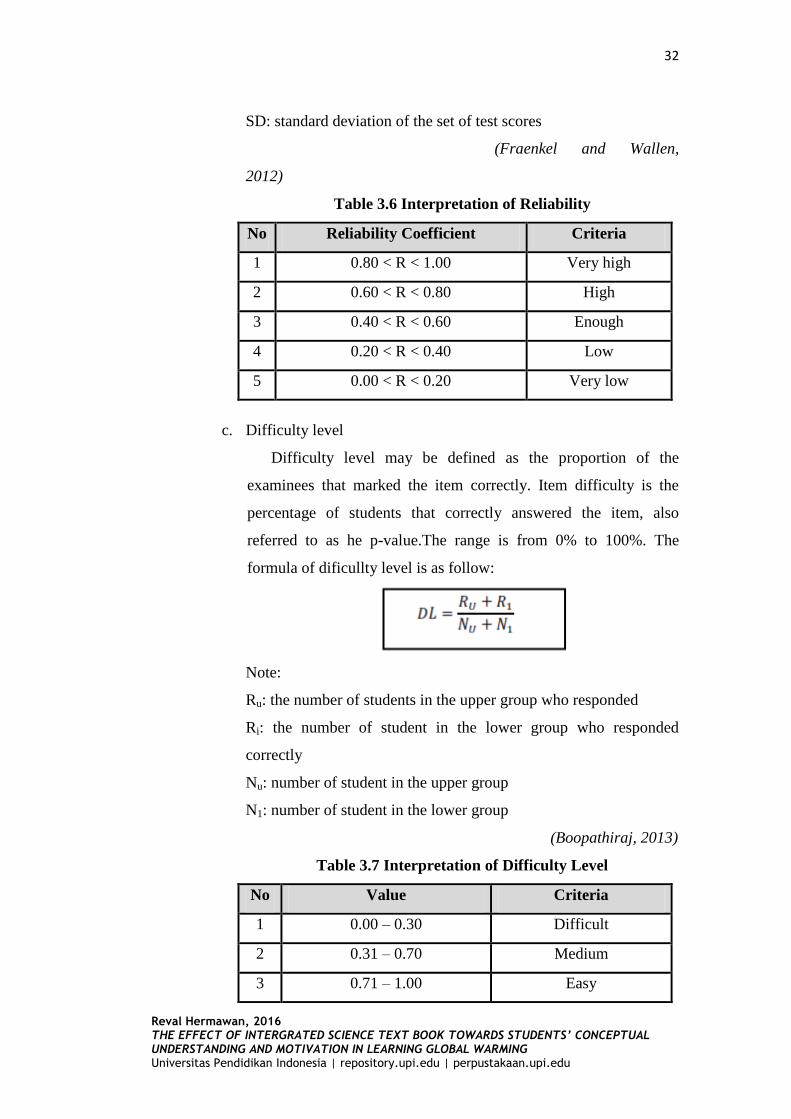
b. Reliability
Reliability are describing the consistency of test results.
Reliability will measure how error the consequency of the score in
the objective test. The formula for measuring the reliability of test
item in this research is using Kuder-Richardson. The formula is as
follow:
Note:
R: number of test items on the test
M: mean of the set of test scores
32
Reval Hermawan, 2016 THE EFFECT OF INTERGRATED SCIENCE TEXT BOOK TOWARDS STUDENTS’ CONCEPTUAL UNDERSTANDING AND MOTIVATION IN LEARNING GLOBAL WARMING Universitas Pendidikan Indonesia | repository.upi.edu | perpustakaan.upi.edu
SD: standard deviation of the set of test scores
(Fraenkel and Wallen,
2012)
Table 3.6 Interpretation of Reliability
No Reliability Coefficient Criteria
1 0.80 < R < 1.00 Very high
2 0.60 < R < 0.80 High
3 0.40 < R < 0.60 Enough
4 0.20 < R < 0.40 Low
5 0.00 < R < 0.20 Very low
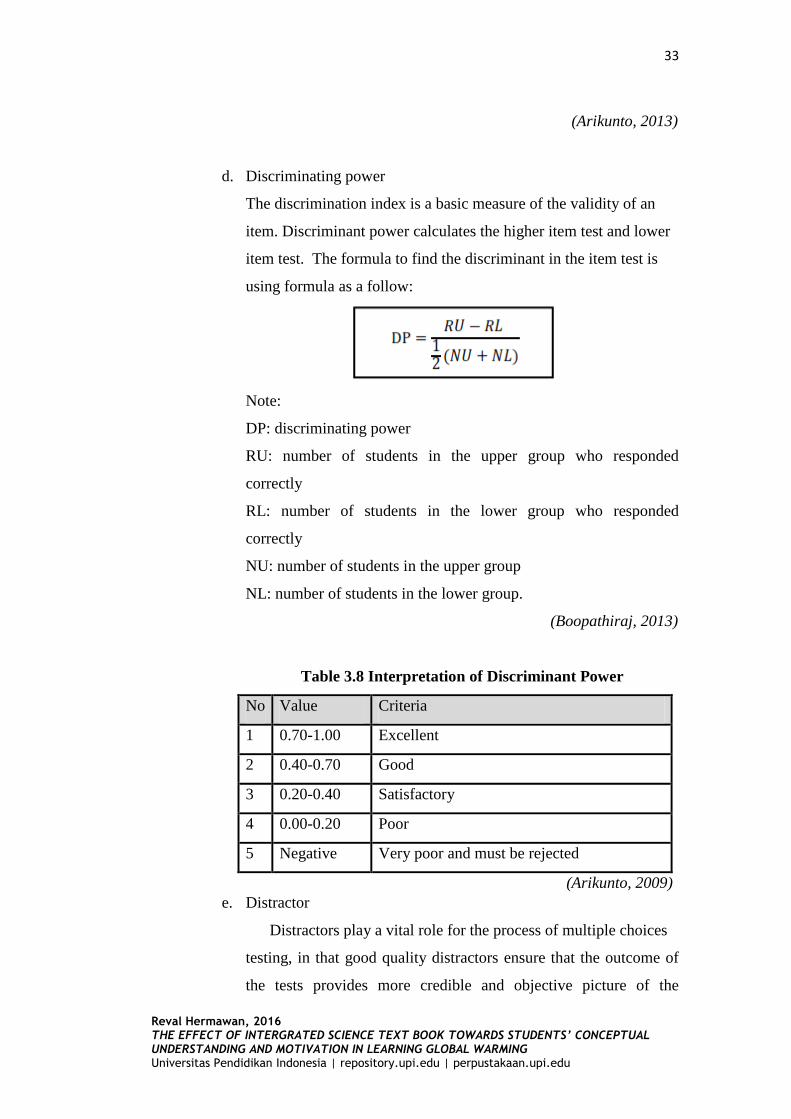
c. Difficulty level
Difficulty level may be defined as the proportion of the
examinees that marked the item correctly. Item difficulty is the
percentage of students that correctly answered the item, also
referred to as he p-value.The range is from 0% to 100%. The
formula of dificullty level is as follow:
Note:
Ru: the number of students in the upper group who responded
Ri: the number of student in the lower group who responded
correctly
Nu: number of student in the upper group
N1: number of student in the lower group
(Boopathiraj, 2013)
Table 3.7 Interpretation of Difficulty Level
No Value Criteria
1 0.00 – 0.30 Difficult
2 0.31 – 0.70 Medium
3 0.71 – 1.00 Easy
33
Reval Hermawan, 2016 THE EFFECT OF INTERGRATED SCIENCE TEXT BOOK TOWARDS STUDENTS’ CONCEPTUAL UNDERSTANDING AND MOTIVATION IN LEARNING GLOBAL WARMING Universitas Pendidikan Indonesia | repository.upi.edu | perpustakaan.upi.edu
(Arikunto, 2013)
d. Discriminating power
The discrimination index is a basic measure of the validity of an
item. Discriminant power calculates the higher item test and lower
item test. The formula to find the discriminant in the item test is
using formula as a follow:
Note:
DP: discriminating power
RU: number of students in the upper group who responded
correctly
RL: number of students in the lower group who responded
correctly
NU: number of students in the upper group
NL: number of students in the lower group.
(Boopathiraj, 2013)
Table 3.8 Interpretation of Discriminant Power
No Value Criteria
1 0.70-1.00 Excellent
2 0.40-0.70 Good
3 0.20-0.40 Satisfactory
4 0.00-0.20 Poor
5 Negative Very poor and must be rejected
(Arikunto, 2009)
e. Distractor
Distractors play a vital role for the process of multiple choices
testing, in that good quality distractors ensure that the outcome of
the tests provides more credible and objective picture of the
34
Reval Hermawan, 2016 THE EFFECT OF INTERGRATED SCIENCE TEXT BOOK TOWARDS STUDENTS’ CONCEPTUAL UNDERSTANDING AND MOTIVATION IN LEARNING GLOBAL WARMING Universitas Pendidikan Indonesia | repository.upi.edu | perpustakaan.upi.edu
knowledge of the testes involved (Mkrtchyan, 2011). In this
research, the wrong answer in the multiple choices are tested to
make sure that the test item for each have good distractors.
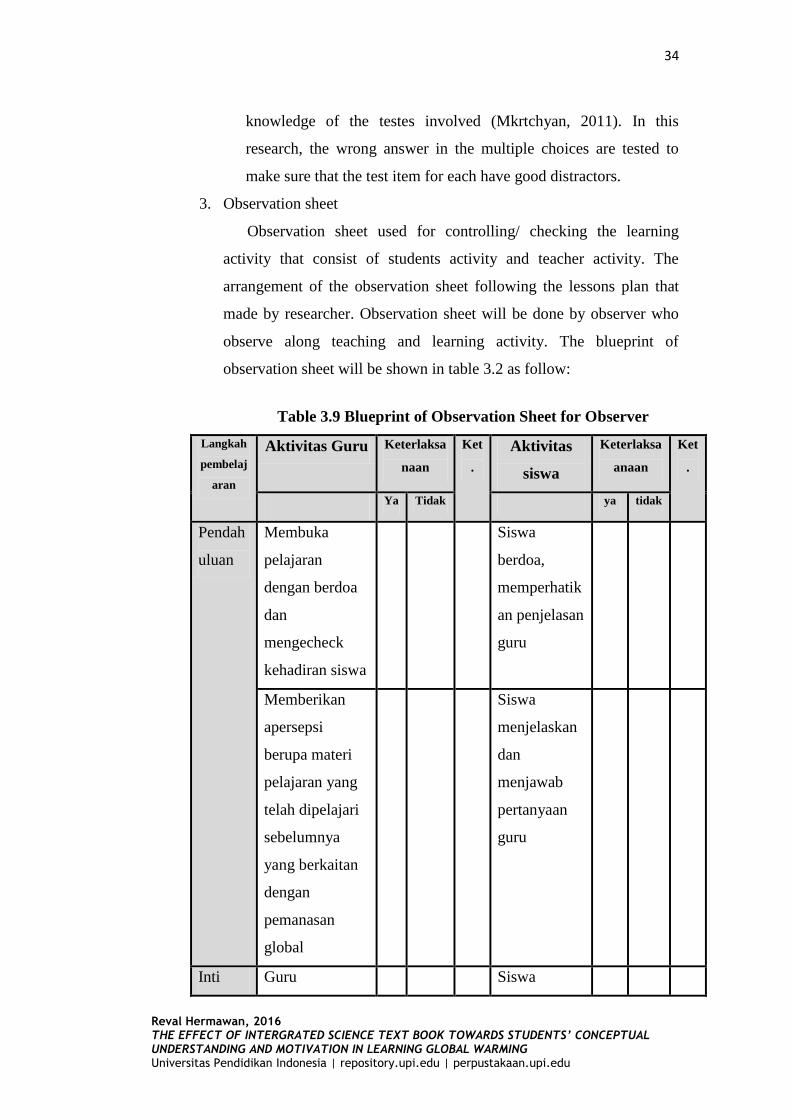
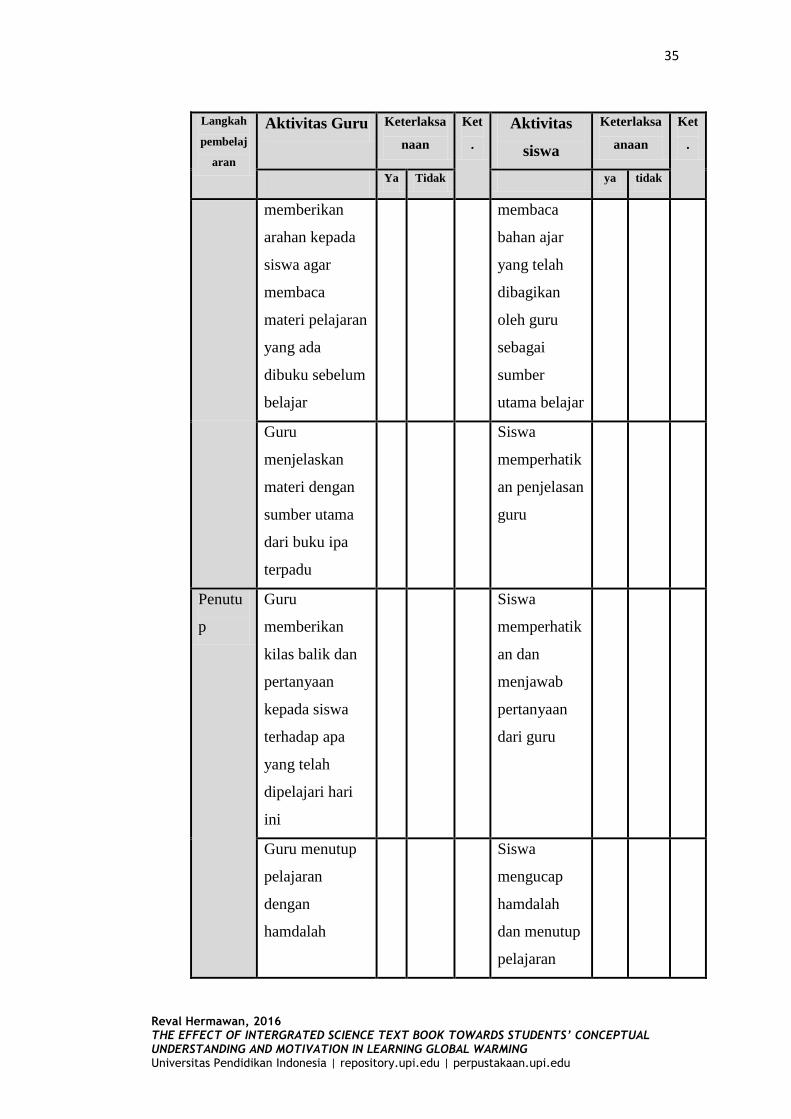
3. Observation sheet
Observation sheet used for controlling/ checking the learning
activity that consist of students activity and teacher activity. The
arrangement of the observation sheet following the lessons plan that
made by researcher. Observation sheet will be done by observer who
observe along teaching and learning activity. The blueprint of
observation sheet will be shown in table 3.2 as follow:
Table 3.9 Blueprint of Observation Sheet for Observer
Langkah
pembelaj
aran
Aktivitas Guru Keterlaksa
naan
Ket
.
Aktivitas
siswa
Keterlaksa
anaan
Ket
.
Ya Tidak ya tidak
Pendah
uluan
Membuka
pelajaran
dengan berdoa
dan
mengecheck
kehadiran siswa
Siswa
berdoa,
memperhatik
an penjelasan
guru
Memberikan
apersepsi
berupa materi
pelajaran yang
telah dipelajari
sebelumnya
yang berkaitan
dengan
pemanasan
global
Siswa
menjelaskan
dan
menjawab
pertanyaan
guru
Inti Guru Siswa
35
Reval Hermawan, 2016 THE EFFECT OF INTERGRATED SCIENCE TEXT BOOK TOWARDS STUDENTS’ CONCEPTUAL UNDERSTANDING AND MOTIVATION IN LEARNING GLOBAL WARMING Universitas Pendidikan Indonesia | repository.upi.edu | perpustakaan.upi.edu
Langkah
pembelaj
aran
Aktivitas Guru Keterlaksa
naan
Ket
.
Aktivitas
siswa
Keterlaksa
anaan
Ket
.
Ya Tidak ya tidak
memberikan
arahan kepada
siswa agar
membaca
materi pelajaran
yang ada
dibuku sebelum
belajar
membaca
bahan ajar
yang telah
dibagikan
oleh guru
sebagai
sumber
utama belajar
Guru
menjelaskan
materi dengan
sumber utama
dari buku ipa
terpadu
Siswa
memperhatik
an penjelasan
guru
Penutu
p
Guru
memberikan
kilas balik dan
pertanyaan
kepada siswa
terhadap apa
yang telah
dipelajari hari
ini
Siswa
memperhatik
an dan
menjawab
pertanyaan
dari guru
Guru menutup
pelajaran
dengan
hamdalah
Siswa
mengucap
hamdalah
dan menutup
pelajaran
36
Reval Hermawan, 2016 THE EFFECT OF INTERGRATED SCIENCE TEXT BOOK TOWARDS STUDENTS’ CONCEPTUAL UNDERSTANDING AND MOTIVATION IN LEARNING GLOBAL WARMING Universitas Pendidikan Indonesia | repository.upi.edu | perpustakaan.upi.edu
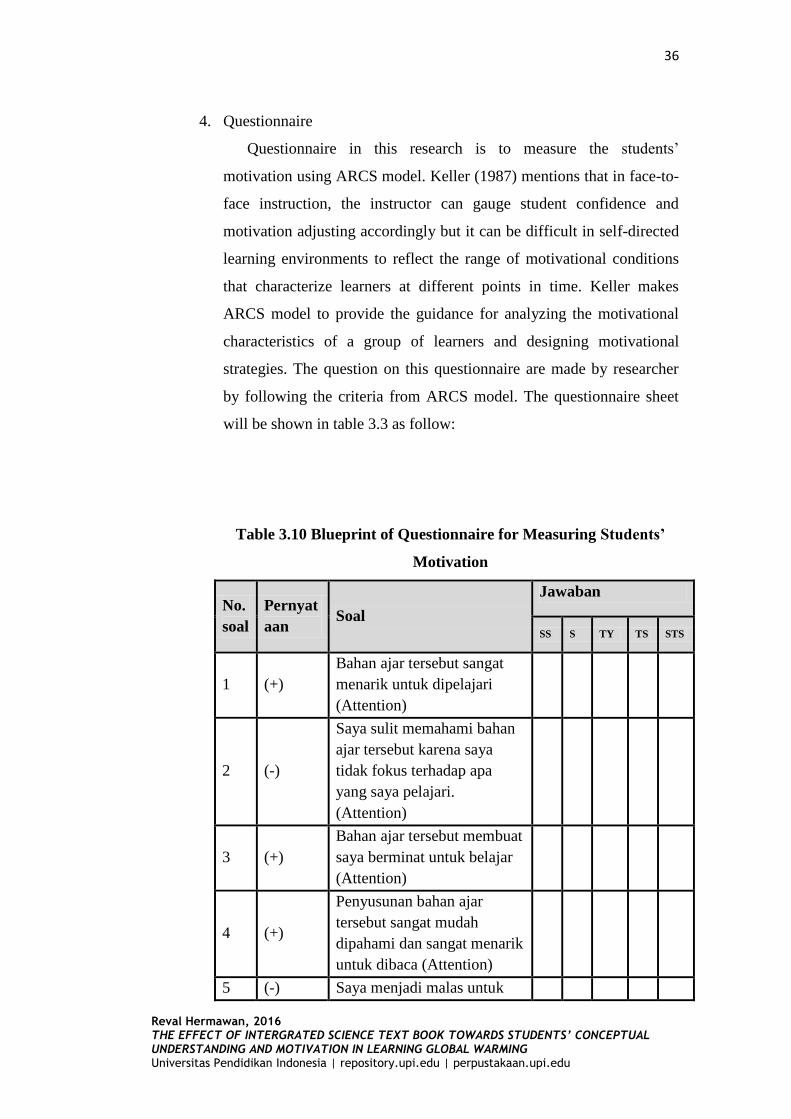
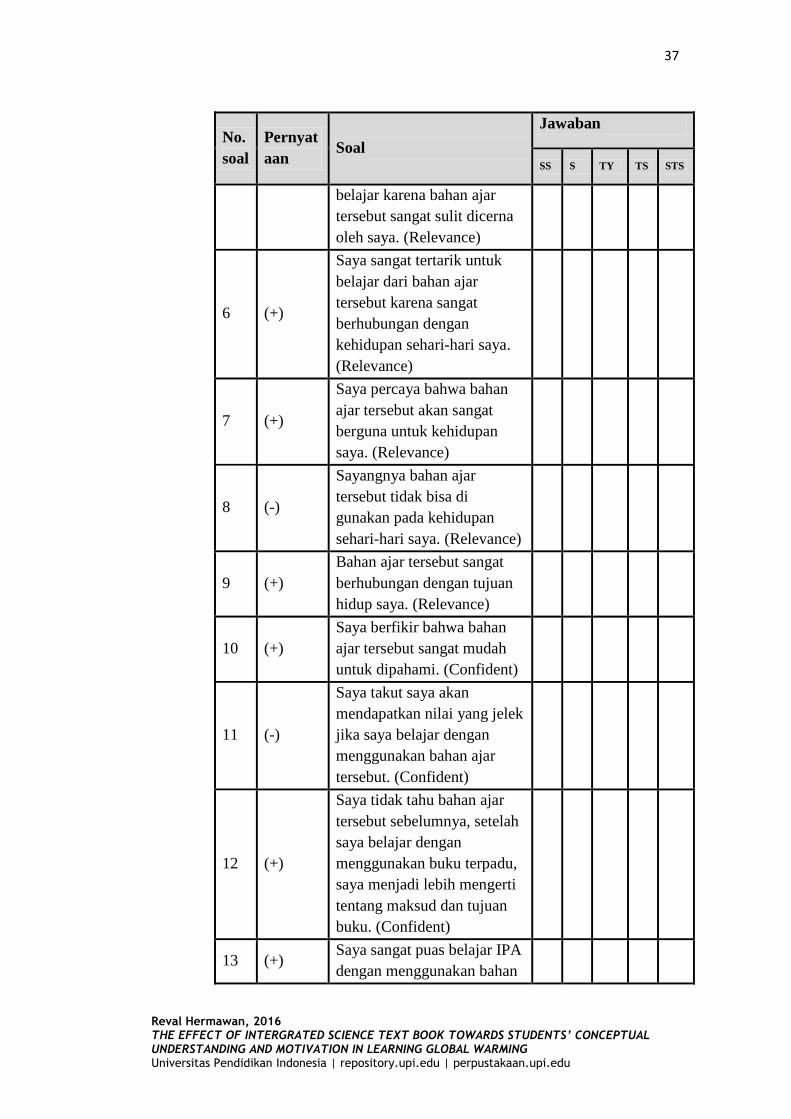
4. Questionnaire
Questionnaire in this research is to measure the students’
motivation using ARCS model. Keller (1987) mentions that in face-to-
face instruction, the instructor can gauge student confidence and
motivation adjusting accordingly but it can be difficult in self-directed
learning environments to reflect the range of motivational conditions
that characterize learners at different points in time. Keller makes
ARCS model to provide the guidance for analyzing the motivational
characteristics of a group of learners and designing motivational
strategies. The question on this questionnaire are made by researcher
by following the criteria from ARCS model. The questionnaire sheet
will be shown in table 3.3 as follow:
Table 3.10 Blueprint of Questionnaire for Measuring Students’
Motivation
No.
soal
Pernyat
aan Soal
Jawaban
SS S TY TS STS
1 (+)
Bahan ajar tersebut sangat
menarik untuk dipelajari
(Attention)
2 (-)
Saya sulit memahami bahan
ajar tersebut karena saya
tidak fokus terhadap apa
yang saya pelajari.
(Attention)
3 (+)
Bahan ajar tersebut membuat
saya berminat untuk belajar
(Attention)
4 (+)
Penyusunan bahan ajar
tersebut sangat mudah
dipahami dan sangat menarik
untuk dibaca (Attention)
5 (-) Saya menjadi malas untuk
37
Reval Hermawan, 2016 THE EFFECT OF INTERGRATED SCIENCE TEXT BOOK TOWARDS STUDENTS’ CONCEPTUAL UNDERSTANDING AND MOTIVATION IN LEARNING GLOBAL WARMING Universitas Pendidikan Indonesia | repository.upi.edu | perpustakaan.upi.edu
No.
soal
Pernyat
aan Soal
Jawaban
SS S TY TS STS
belajar karena bahan ajar
tersebut sangat sulit dicerna
oleh saya. (Relevance)
6 (+)
Saya sangat tertarik untuk
belajar dari bahan ajar
tersebut karena sangat
berhubungan dengan
kehidupan sehari-hari saya.
(Relevance)
7 (+)
Saya percaya bahwa bahan
ajar tersebut akan sangat
berguna untuk kehidupan
saya. (Relevance)
8 (-)
Sayangnya bahan ajar
tersebut tidak bisa di
gunakan pada kehidupan
sehari-hari saya. (Relevance)
9 (+)
Bahan ajar tersebut sangat
berhubungan dengan tujuan
hidup saya. (Relevance)
10 (+)
Saya berfikir bahwa bahan
ajar tersebut sangat mudah
untuk dipahami. (Confident)
11 (-)
Saya takut saya akan
mendapatkan nilai yang jelek
jika saya belajar dengan
menggunakan bahan ajar
tersebut. (Confident)
12 (+)
Saya tidak tahu bahan ajar
tersebut sebelumnya, setelah
saya belajar dengan
menggunakan buku terpadu,
saya menjadi lebih mengerti
tentang maksud dan tujuan
buku. (Confident)
13 (+) Saya sangat puas belajar IPA
dengan menggunakan bahan
38
Reval Hermawan, 2016 THE EFFECT OF INTERGRATED SCIENCE TEXT BOOK TOWARDS STUDENTS’ CONCEPTUAL UNDERSTANDING AND MOTIVATION IN LEARNING GLOBAL WARMING Universitas Pendidikan Indonesia | repository.upi.edu | perpustakaan.upi.edu
No.
soal
Pernyat
aan Soal
Jawaban
SS S TY TS STS
ajar tersebut. (Satisfaction)
14 (-)
Saya tidak ingin belajar IPA
lagi dengan bahan ajar
tersebut. (Satisfaction)
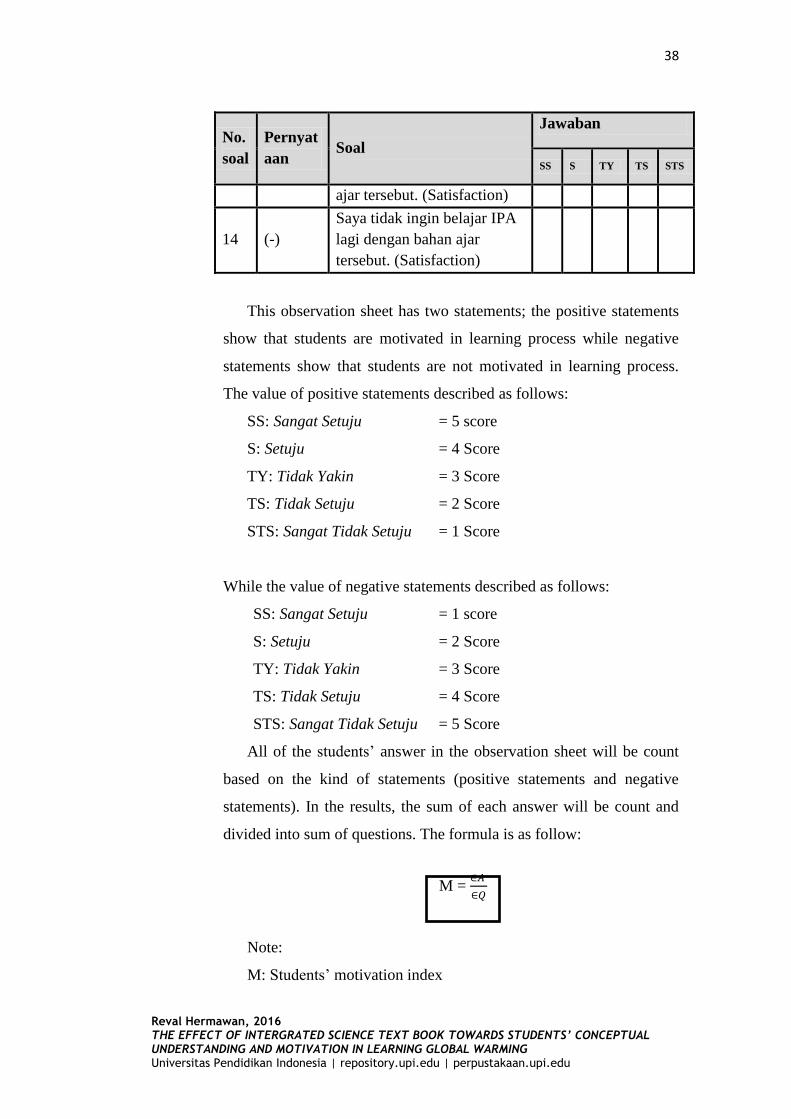
This observation sheet has two statements; the positive statements
show that students are motivated in learning process while negative
statements show that students are not motivated in learning process.
The value of positive statements described as follows:
SS: Sangat Setuju = 5 score
S: Setuju = 4 Score
TY: Tidak Yakin = 3 Score
TS: Tidak Setuju = 2 Score
STS: Sangat Tidak Setuju = 1 Score
While the value of negative statements described as follows:
SS: Sangat Setuju = 1 score
S: Setuju = 2 Score
TY: Tidak Yakin = 3 Score
TS: Tidak Setuju = 4 Score
STS: Sangat Tidak Setuju = 5 Score
All of the students’ answer in the observation sheet will be count
based on the kind of statements (positive statements and negative
statements). In the results, the sum of each answer will be count and
divided into sum of questions. The formula is as follow:
M =
Note:
M: Students’ motivation index
39
Reval Hermawan, 2016 THE EFFECT OF INTERGRATED SCIENCE TEXT BOOK TOWARDS STUDENTS’ CONCEPTUAL UNDERSTANDING AND MOTIVATION IN LEARNING GLOBAL WARMING Universitas Pendidikan Indonesia | repository.upi.edu | perpustakaan.upi.edu
: Sum of students’ answer
: Sum of questions
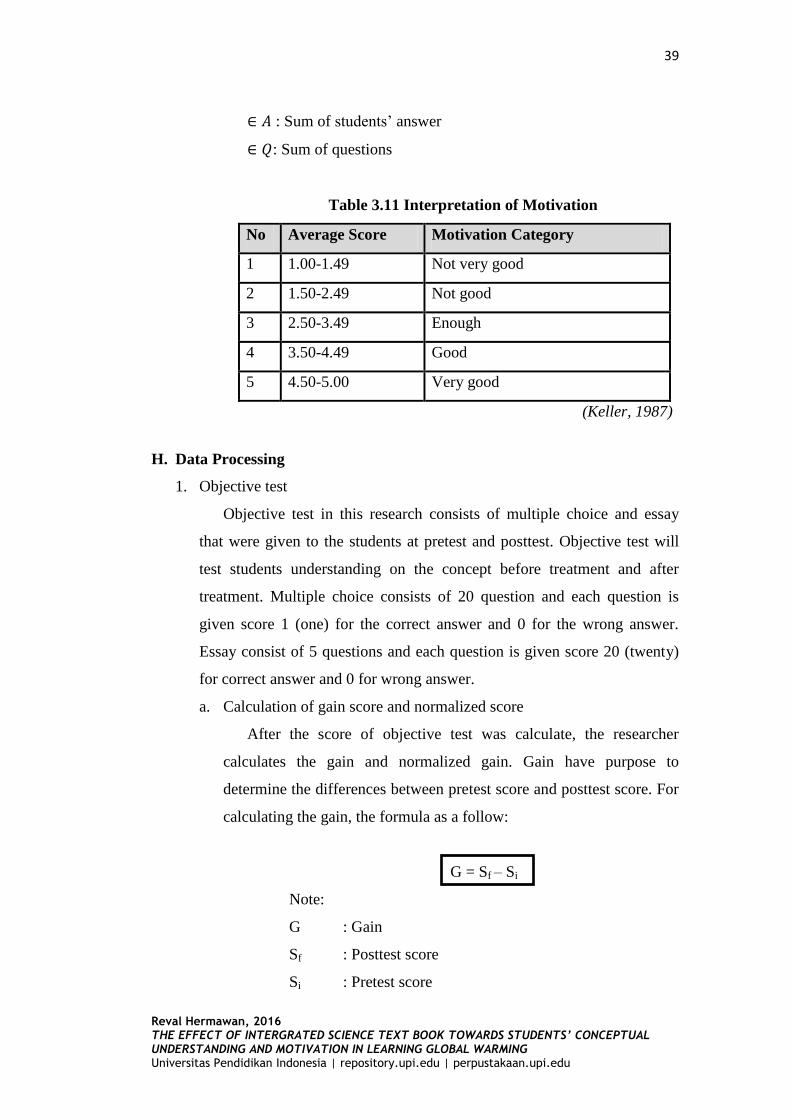
Table 3.11 Interpretation of Motivation
No Average Score Motivation Category
1 1.00-1.49 Not very good
2 1.50-2.49 Not good
3 2.50-3.49 Enough
4 3.50-4.49 Good
5 4.50-5.00 Very good
(Keller, 1987)
H. Data Processing
1. Objective test
Objective test in this research consists of multiple choice and essay
that were given to the students at pretest and posttest. Objective test will
test students understanding on the concept before treatment and after
treatment. Multiple choice consists of 20 question and each question is
given score 1 (one) for the correct answer and 0 for the wrong answer.
Essay consist of 5 questions and each question is given score 20 (twenty)
for correct answer and 0 for wrong answer.
a. Calculation of gain score and normalized score
After the score of objective test was calculate, the researcher
calculates the gain and normalized gain. Gain have purpose to
determine the differences between pretest score and posttest score. For
calculating the gain, the formula as a follow:
G = Sf – Si
Note:
G : Gain
Sf : Posttest score
Si : Pretest score
40
Reval Hermawan, 2016 THE EFFECT OF INTERGRATED SCIENCE TEXT BOOK TOWARDS STUDENTS’ CONCEPTUAL UNDERSTANDING AND MOTIVATION IN LEARNING GLOBAL WARMING Universitas Pendidikan Indonesia | repository.upi.edu | perpustakaan.upi.edu
(Hake, 1999)
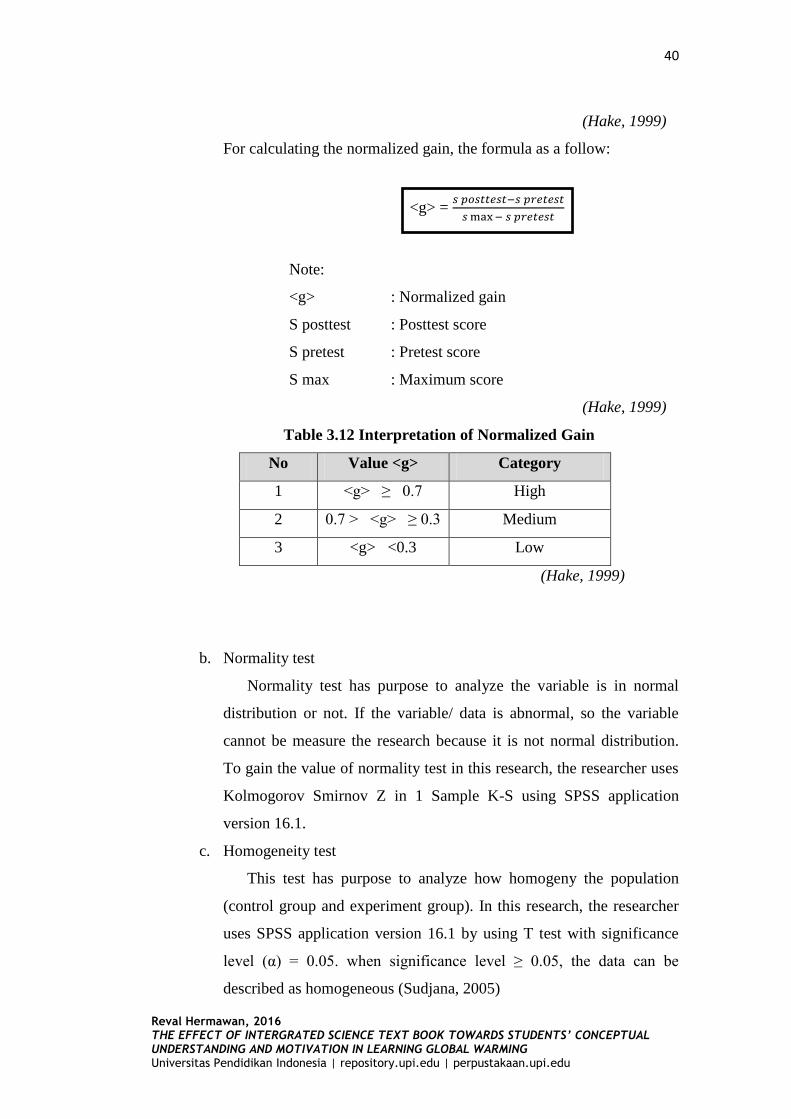
For calculating the normalized gain, the formula as a follow:
<g> =
Note:
<g> : Normalized gain
S posttest : Posttest score
S pretest : Pretest score
S max : Maximum score
(Hake, 1999)
Table 3.12 Interpretation of Normalized Gain
No Value <g> Category
1 <g> ≥ 0.7 High
2 0.7 > <g> ≥ 0.3 Medium
3 <g> <0.3 Low
(Hake, 1999)
b. Normality test
Normality test has purpose to analyze the variable is in normal
distribution or not. If the variable/ data is abnormal, so the variable
cannot be measure the research because it is not normal distribution.
To gain the value of normality test in this research, the researcher uses
Kolmogorov Smirnov Z in 1 Sample K-S using SPSS application
version 16.1.
c. Homogeneity test
This test has purpose to analyze how homogeny the population
(control group and experiment group). In this research, the researcher
uses SPSS application version 16.1 by using T test with significance
level (α) = 0.05. when significance level ≥ 0.05, the data can be
described as homogeneous (Sudjana, 2005)
41
Reval Hermawan, 2016 THE EFFECT OF INTERGRATED SCIENCE TEXT BOOK TOWARDS STUDENTS’ CONCEPTUAL UNDERSTANDING AND MOTIVATION IN LEARNING GLOBAL WARMING Universitas Pendidikan Indonesia | repository.upi.edu | perpustakaan.upi.edu
d. T-test related samples
Independent T-test is one of the method to proof whether the
hypothesis is true or not. This test using score of pretest and posttest
from both class (control group and experimental group). In this
research, the researcher SPSS application version 16.1 by using T-test.
Sudjana (2005) stated that if the significance level (sig) ≤ 0.05, H0 is
rejected while the significance level (sig) ≥ 0.05, the H0 is retained.
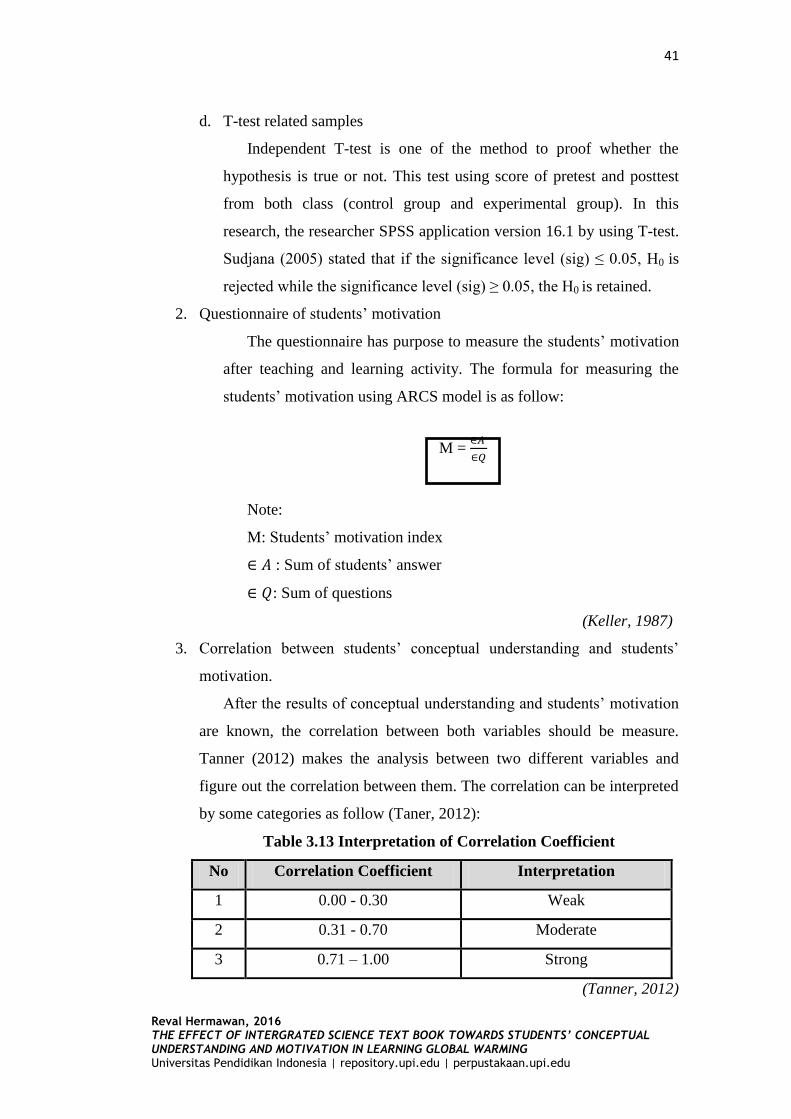
2. Questionnaire of students’ motivation
The questionnaire has purpose to measure the students’ motivation
after teaching and learning activity. The formula for measuring the
students’ motivation using ARCS model is as follow:
M =
Note:
M: Students’ motivation index
: Sum of students’ answer
: Sum of questions
(Keller, 1987)
3. Correlation between students’ conceptual understanding and students’
motivation.
After the results of conceptual understanding and students’ motivation
are known, the correlation between both variables should be measure.
Tanner (2012) makes the analysis between two different variables and
figure out the correlation between them. The correlation can be interpreted
by some categories as follow (Taner, 2012):
Table 3.13 Interpretation of Correlation Coefficient
No Correlation Coefficient Interpretation
1 0.00 - 0.30 Weak
2 0.31 - 0.70 Moderate
3 0.71 – 1.00 Strong
(Tanner, 2012)
42
Reval Hermawan, 2016 THE EFFECT OF INTERGRATED SCIENCE TEXT BOOK TOWARDS STUDENTS’ CONCEPTUAL UNDERSTANDING AND MOTIVATION IN LEARNING GLOBAL WARMING Universitas Pendidikan Indonesia | repository.upi.edu | perpustakaan.upi.edu
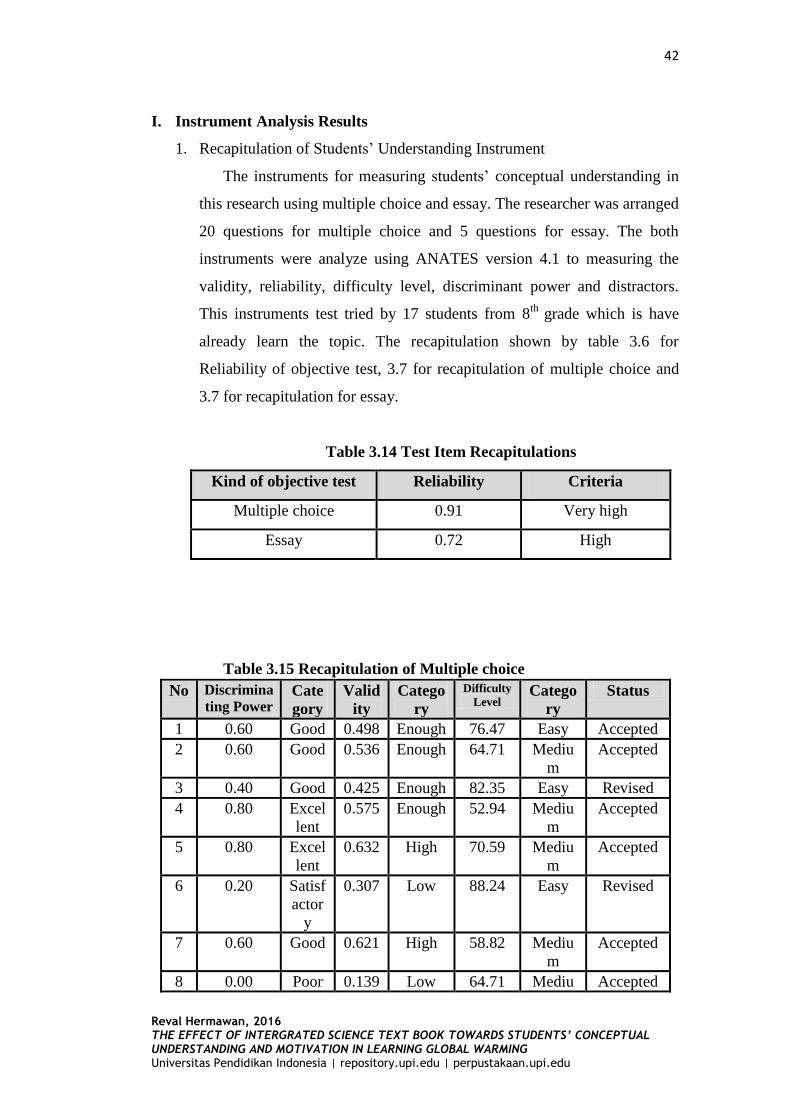
I. Instrument Analysis Results
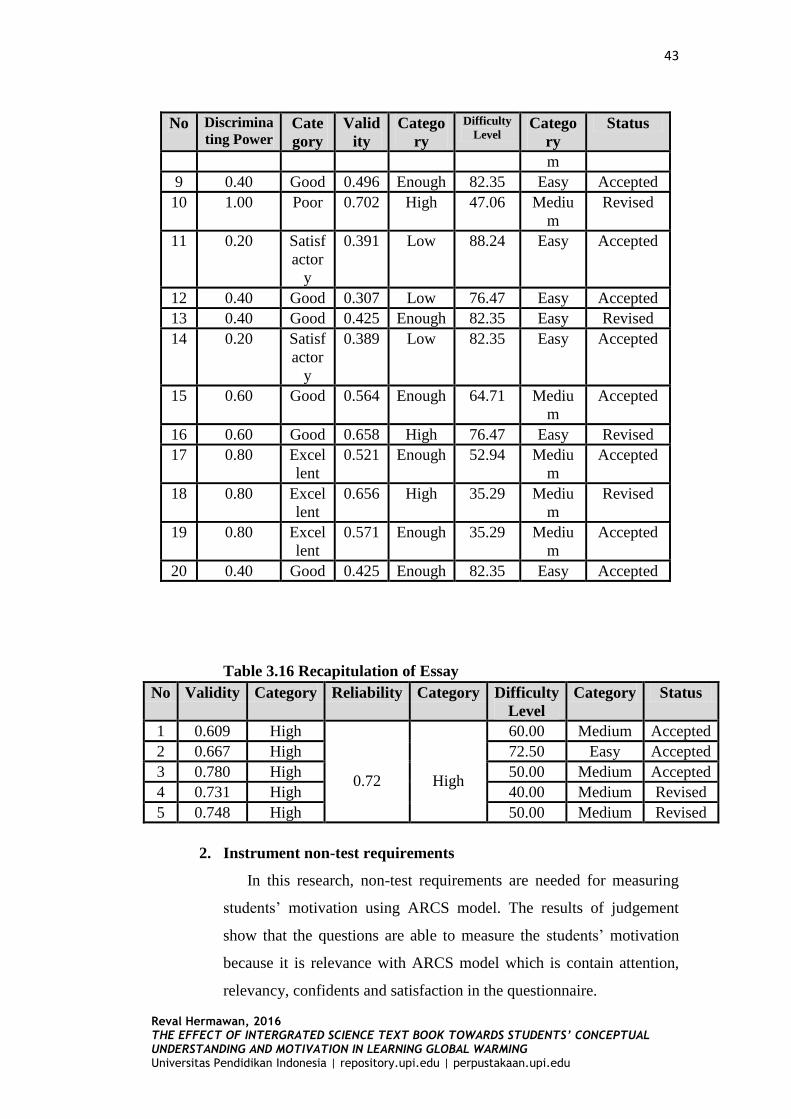
1. Recapitulation of Students’ Understanding Instrument
The instruments for measuring students’ conceptual understanding in
this research using multiple choice and essay. The researcher was arranged
20 questions for multiple choice and 5 questions for essay. The both
instruments were analyze using ANATES version 4.1 to measuring the
validity, reliability, difficulty level, discriminant power and distractors.
This instruments test tried by 17 students from 8th
grade which is have
already learn the topic. The recapitulation shown by table 3.6 for
Reliability of objective test, 3.7 for recapitulation of multiple choice and
3.7 for recapitulation for essay.
Table 3.14 Test Item Recapitulations
Kind of objective test Reliability Criteria
Multiple choice 0.91 Very high
Essay 0.72 High
Table 3.15 Recapitulation of Multiple choice
No Discrimina
ting Power Cate
gory
Valid
ity
Catego
ry
Difficulty
Level Catego
ry
Status
1 0.60 Good 0.498 Enough 76.47 Easy Accepted
2 0.60 Good 0.536 Enough 64.71 Mediu
m
Accepted
3 0.40 Good 0.425 Enough 82.35 Easy Revised
4 0.80 Excel
lent
0.575 Enough 52.94 Mediu
m
Accepted
5 0.80 Excel
lent
0.632 High 70.59 Mediu
m
Accepted
6 0.20 Satisf
actor
y
0.307 Low 88.24 Easy Revised
7 0.60 Good 0.621 High 58.82 Mediu
m
Accepted
8 0.00 Poor 0.139 Low 64.71 Mediu Accepted
43
Reval Hermawan, 2016 THE EFFECT OF INTERGRATED SCIENCE TEXT BOOK TOWARDS STUDENTS’ CONCEPTUAL UNDERSTANDING AND MOTIVATION IN LEARNING GLOBAL WARMING Universitas Pendidikan Indonesia | repository.upi.edu | perpustakaan.upi.edu
No Discrimina
ting Power Cate
gory
Valid
ity
Catego
ry
Difficulty
Level Catego
ry
Status
m
9 0.40 Good 0.496 Enough 82.35 Easy Accepted
10 1.00 Poor 0.702 High 47.06 Mediu
m
Revised
11 0.20 Satisf
actor
y
0.391 Low 88.24 Easy Accepted
12 0.40 Good 0.307 Low 76.47 Easy Accepted
13 0.40 Good 0.425 Enough 82.35 Easy Revised
14 0.20 Satisf
actor
y
0.389 Low 82.35 Easy Accepted
15 0.60 Good 0.564 Enough 64.71 Mediu
m
Accepted
16 0.60 Good 0.658 High 76.47 Easy Revised
17 0.80 Excel
lent
0.521 Enough 52.94 Mediu
m
Accepted
18 0.80 Excel
lent
0.656 High 35.29 Mediu
m
Revised
19 0.80 Excel
lent
0.571 Enough 35.29 Mediu
m
Accepted
20 0.40 Good 0.425 Enough 82.35 Easy Accepted
Table 3.16 Recapitulation of Essay
No Validity Category Reliability Category Difficulty
Level
Category Status
1 0.609 High
0.72
High
60.00 Medium Accepted
2 0.667 High 72.50 Easy Accepted
3 0.780 High 50.00 Medium Accepted
4 0.731 High 40.00 Medium Revised
5 0.748 High 50.00 Medium Revised
2. Instrument non-test requirements
In this research, non-test requirements are needed for measuring
students’ motivation using ARCS model. The results of judgement
show that the questions are able to measure the students’ motivation
because it is relevance with ARCS model which is contain attention,
relevancy, confidents and satisfaction in the questionnaire.
44
Reval Hermawan, 2016 THE EFFECT OF INTERGRATED SCIENCE TEXT BOOK TOWARDS STUDENTS’ CONCEPTUAL UNDERSTANDING AND MOTIVATION IN LEARNING GLOBAL WARMING Universitas Pendidikan Indonesia | repository.upi.edu | perpustakaan.upi.edu
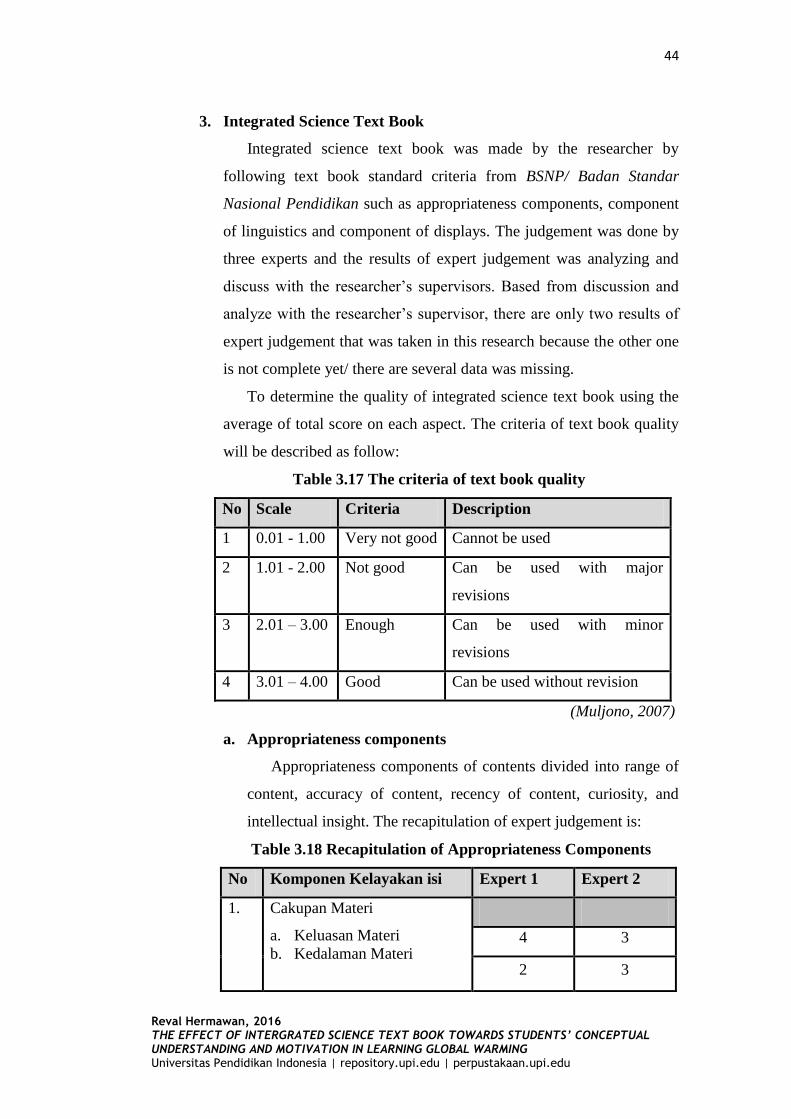
3. Integrated Science Text Book
Integrated science text book was made by the researcher by
following text book standard criteria from BSNP/ Badan Standar
Nasional Pendidikan such as appropriateness components, component
of linguistics and component of displays. The judgement was done by
three experts and the results of expert judgement was analyzing and
discuss with the researcher’s supervisors. Based from discussion and
analyze with the researcher’s supervisor, there are only two results of
expert judgement that was taken in this research because the other one
is not complete yet/ there are several data was missing.
To determine the quality of integrated science text book using the
average of total score on each aspect. The criteria of text book quality
will be described as follow:
Table 3.17 The criteria of text book quality
No Scale Criteria Description
1 0.01 - 1.00 Very not good Cannot be used
2 1.01 - 2.00 Not good Can be used with major
revisions
3 2.01 – 3.00 Enough Can be used with minor
revisions
4 3.01 – 4.00 Good Can be used without revision
(Muljono, 2007)
a. Appropriateness components
Appropriateness components of contents divided into range of
content, accuracy of content, recency of content, curiosity, and
intellectual insight. The recapitulation of expert judgement is:
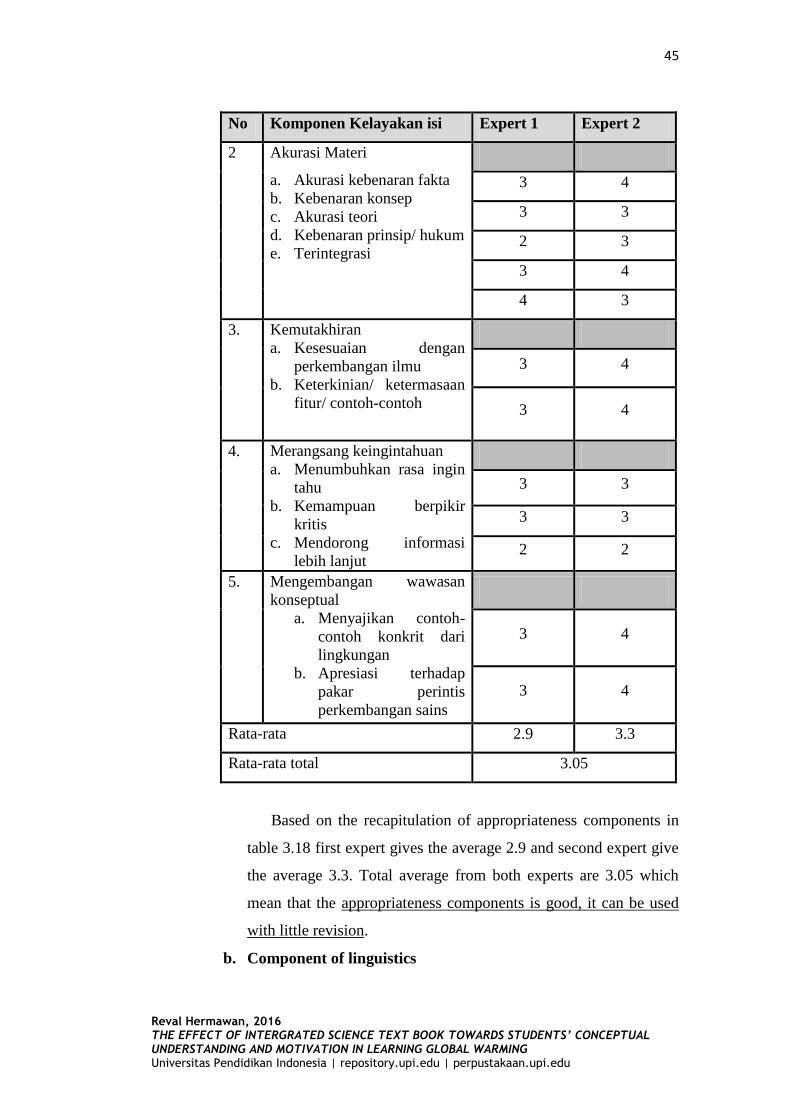
Table 3.18 Recapitulation of Appropriateness Components
No Komponen Kelayakan isi Expert 1 Expert 2
1. Cakupan Materi
a. Keluasan Materi
b. Kedalaman Materi
4 3
2 3
45
Reval Hermawan, 2016 THE EFFECT OF INTERGRATED SCIENCE TEXT BOOK TOWARDS STUDENTS’ CONCEPTUAL UNDERSTANDING AND MOTIVATION IN LEARNING GLOBAL WARMING Universitas Pendidikan Indonesia | repository.upi.edu | perpustakaan.upi.edu
No Komponen Kelayakan isi Expert 1 Expert 2
2 Akurasi Materi
a. Akurasi kebenaran fakta
b. Kebenaran konsep
c. Akurasi teori
d. Kebenaran prinsip/ hukum
e. Terintegrasi
3 4
3 3
2 3
3 4
4 3
3. Kemutakhiran
a. Kesesuaian dengan
perkembangan ilmu
b. Keterkinian/ ketermasaan
fitur/ contoh-contoh
3 4
3 4
4. Merangsang keingintahuan
a. Menumbuhkan rasa ingin
tahu
b. Kemampuan berpikir
kritis
c. Mendorong informasi
lebih lanjut
3 3
3 3
2 2
5. Mengembangan wawasan
konseptual
a. Menyajikan contoh-
contoh konkrit dari
lingkungan
b. Apresiasi terhadap
pakar perintis
perkembangan sains
3 4
3 4
Rata-rata 2.9 3.3
Rata-rata total 3.05
Based on the recapitulation of appropriateness components in
table 3.18 first expert gives the average 2.9 and second expert give
the average 3.3. Total average from both experts are 3.05 which
mean that the appropriateness components is good, it can be used
with little revision.
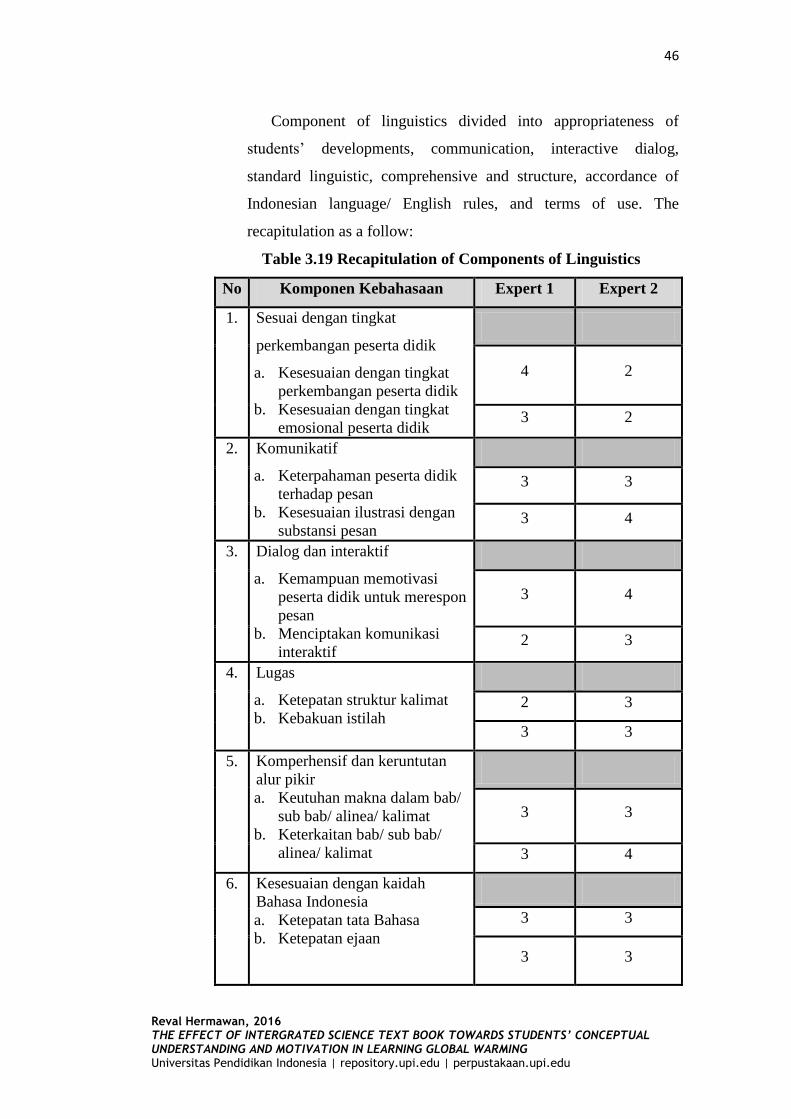
b. Component of linguistics
46
Reval Hermawan, 2016 THE EFFECT OF INTERGRATED SCIENCE TEXT BOOK TOWARDS STUDENTS’ CONCEPTUAL UNDERSTANDING AND MOTIVATION IN LEARNING GLOBAL WARMING Universitas Pendidikan Indonesia | repository.upi.edu | perpustakaan.upi.edu
Component of linguistics divided into appropriateness of
students’ developments, communication, interactive dialog,
standard linguistic, comprehensive and structure, accordance of
Indonesian language/ English rules, and terms of use. The
recapitulation as a follow:
Table 3.19 Recapitulation of Components of Linguistics
No Komponen Kebahasaan Expert 1 Expert 2
1. Sesuai dengan tingkat
perkembangan peserta didik
a. Kesesuaian dengan tingkat
perkembangan peserta didik
b. Kesesuaian dengan tingkat
emosional peserta didik
4 2
3 2
2. Komunikatif
a. Keterpahaman peserta didik
terhadap pesan
b. Kesesuaian ilustrasi dengan
substansi pesan
3 3
3 4
3. Dialog dan interaktif
a. Kemampuan memotivasi
peserta didik untuk merespon
pesan
b. Menciptakan komunikasi
interaktif
3 4
2 3
4. Lugas
a. Ketepatan struktur kalimat
b. Kebakuan istilah
2 3
3 3
5. Komperhensif dan keruntutan
alur pikir
a. Keutuhan makna dalam bab/
sub bab/ alinea/ kalimat
b. Keterkaitan bab/ sub bab/
alinea/ kalimat
3 3
3 4
6. Kesesuaian dengan kaidah
Bahasa Indonesia
a. Ketepatan tata Bahasa
b. Ketepatan ejaan
3 3
3 3
47
Reval Hermawan, 2016 THE EFFECT OF INTERGRATED SCIENCE TEXT BOOK TOWARDS STUDENTS’ CONCEPTUAL UNDERSTANDING AND MOTIVATION IN LEARNING GLOBAL WARMING Universitas Pendidikan Indonesia | repository.upi.edu | perpustakaan.upi.edu
No Komponen Kebahasaan Expert 1 Expert 2
7. Penggunaan istilah
a. Konsistensi menggunakan
istilah
b. Ketepatan penulisan nama
ilmiah/ asing
3 4
3 3
Rata-rata 42/ 14 = 3 44/ 14 = 3.14
Rata-rata total 3.05
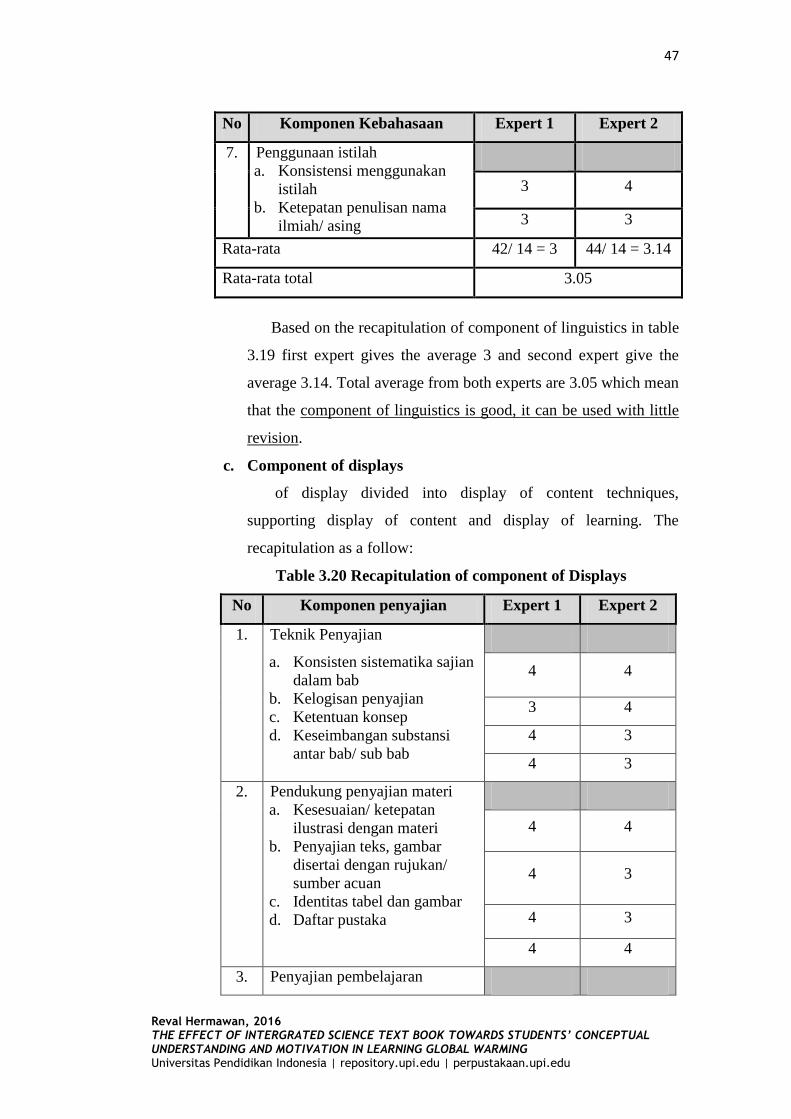
Based on the recapitulation of component of linguistics in table
3.19 first expert gives the average 3 and second expert give the
average 3.14. Total average from both experts are 3.05 which mean
that the component of linguistics is good, it can be used with little
revision.
c. Component of displays
of display divided into display of content techniques,
supporting display of content and display of learning. The
recapitulation as a follow:
Table 3.20 Recapitulation of component of Displays
No Komponen penyajian Expert 1 Expert 2
1. Teknik Penyajian
a. Konsisten sistematika sajian
dalam bab
b. Kelogisan penyajian
c. Ketentuan konsep
d. Keseimbangan substansi
antar bab/ sub bab
4 4
3 4
4 3
4 3
2. Pendukung penyajian materi
a. Kesesuaian/ ketepatan
ilustrasi dengan materi
b. Penyajian teks, gambar
disertai dengan rujukan/
sumber acuan
c. Identitas tabel dan gambar
d. Daftar pustaka
4 4
4 3
4 3
4 4
3. Penyajian pembelajaran
48
Reval Hermawan, 2016 THE EFFECT OF INTERGRATED SCIENCE TEXT BOOK TOWARDS STUDENTS’ CONCEPTUAL UNDERSTANDING AND MOTIVATION IN LEARNING GLOBAL WARMING Universitas Pendidikan Indonesia | repository.upi.edu | perpustakaan.upi.edu
No Komponen penyajian Expert 1 Expert 2
a. Keterlibatan peserta didik
b. Berpusat pada peserta didik
c. Kesesuaian dengan
karakteristik mata pelajaran
d. Kemampuan merangsang
kedalaman berfikir peserta
didik melalui ilustrasi dan
latihan soal
2 3
2 3
3 3
3 4
Rata-rata 41/ 12 =
3.41
41/ 12 =
3.41
Rata-rata total 3.41
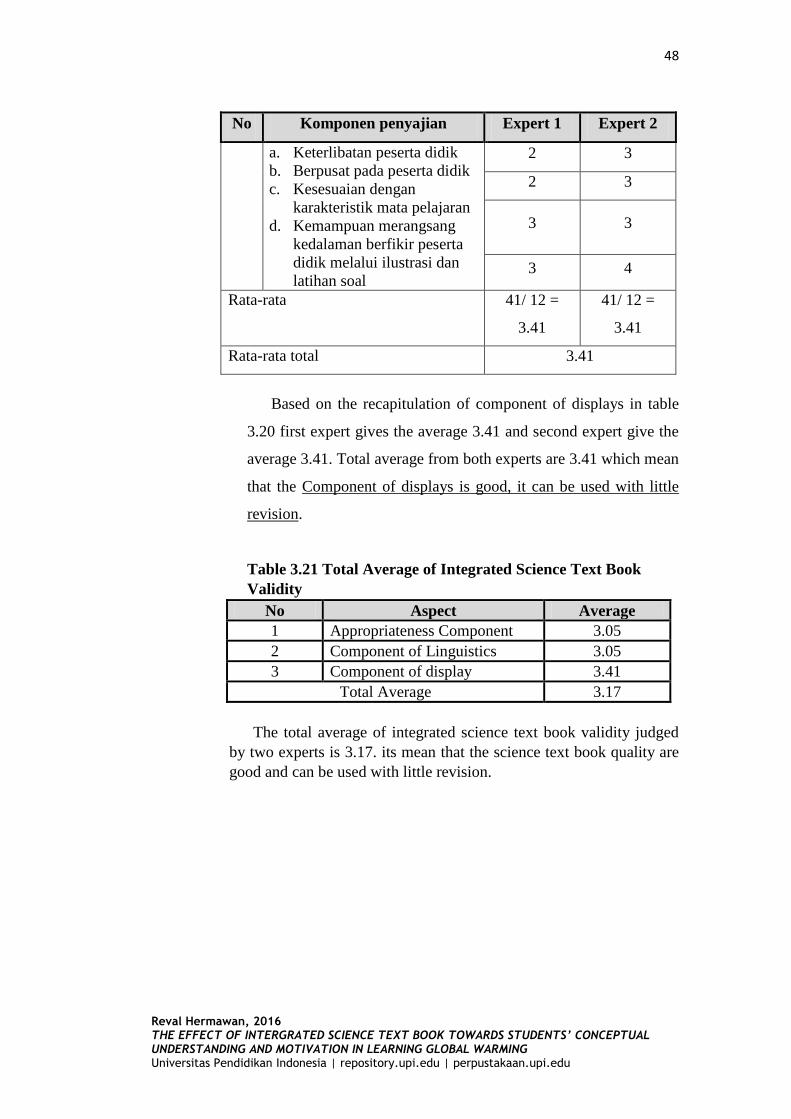
Based on the recapitulation of component of displays in table
3.20 first expert gives the average 3.41 and second expert give the
average 3.41. Total average from both experts are 3.41 which mean
that the Component of displays is good, it can be used with little
revision.
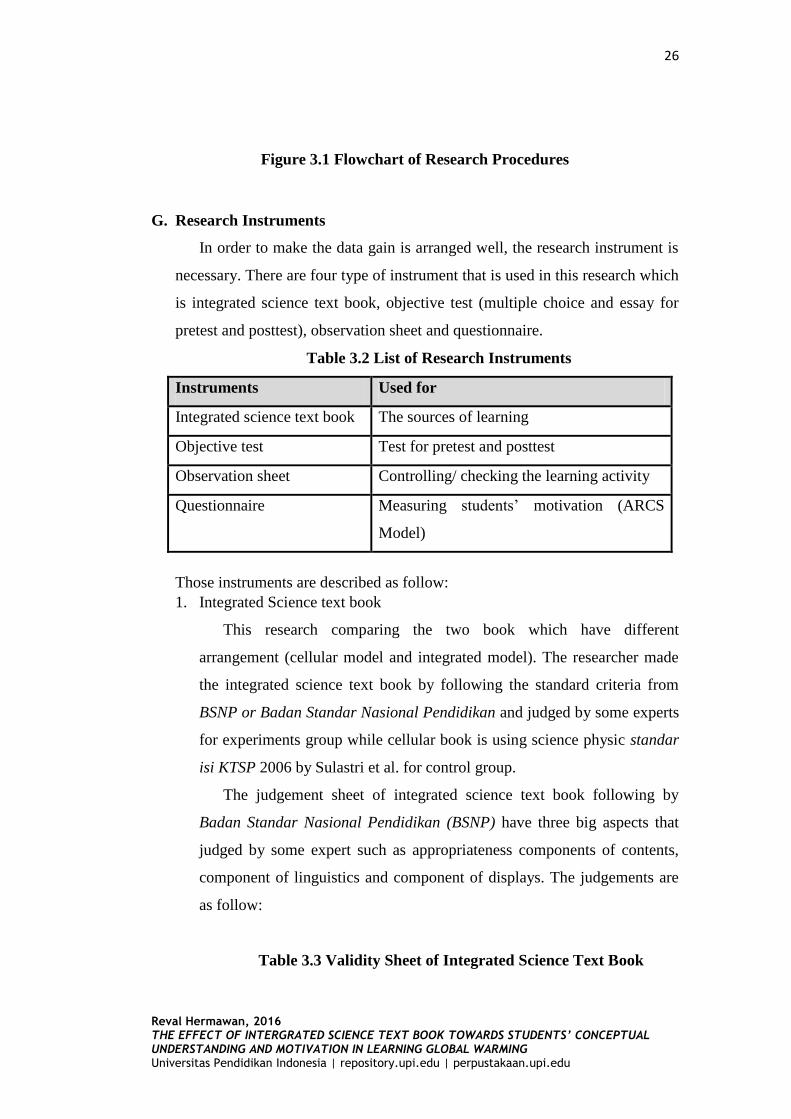
Table 3.21 Total Average of Integrated Science Text Book
Validity
No Aspect Average
1 Appropriateness Component 3.05
2 Component of Linguistics 3.05
3 Component of display 3.41
Total Average 3.17
The total average of integrated science text book validity judged
by two experts is 3.17. its mean that the science text book quality are
good and can be used with little revision.
49
Reval Hermawan, 2016 THE EFFECT OF INTERGRATED SCIENCE TEXT BOOK TOWARDS STUDENTS’ CONCEPTUAL UNDERSTANDING AND MOTIVATION IN LEARNING GLOBAL WARMING Universitas Pendidikan Indonesia | repository.upi.edu | perpustakaan.upi.edu
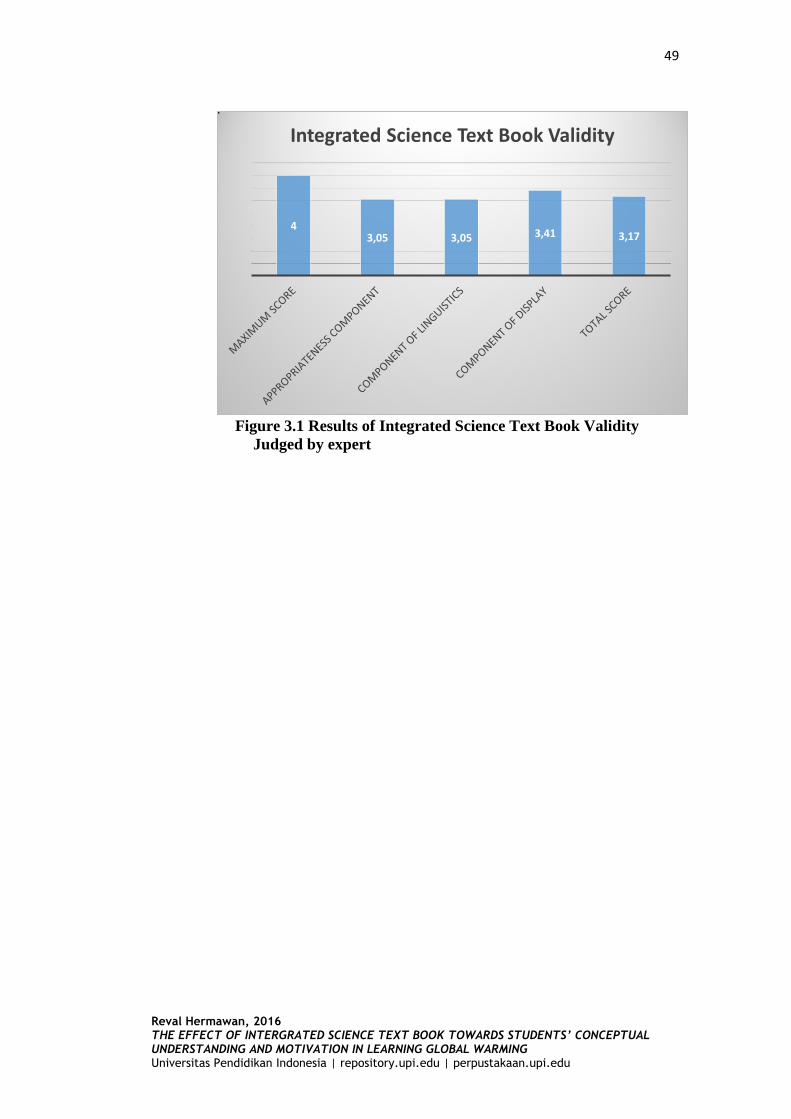
Figure 3.1 Results of Integrated Science Text Book Validity
Judged by expert
4 3,05 3,05 3,41 3,17
Integrated Science Text Book Validity