Embed Size (px)
Citation preview
ABSTRACT 484
Characterizing flotation recovery variability of copper ores
Cornelius F Vos* & Deirdre J Bradshaw
Julius Kruttschnitt Mineral Research Centre, Sustainable Minerals Institute, University of
Queensland, Brisbane, Australia
ABSTRACT
The detailed understanding of the variability in process performance parameters within an ore body
forms a key aspect of ensuring that proper decisions are made with regards to the economic viability
of that ore body. To gain this understanding, various tools have been developed over the years, of
which the batch flotation test is the most well-known and applied technique for investigating the
flotation separation of ores.
In this paper, the Julius Kruttschnitt Mineral Separability Indicator (JKMSI) is put forward as a small-
scale test, suitable for the characterization of the flotation separability of copper porphyry ores. It is
demonstrated that the JKMSI can be a complementary technique to the batch flotation test, with the
capability to further improve the knowledge of ore body variability.
The response from this test has been shown to be sensitive to particle size and modal mineralogy,
providing a critical link between flotation and upstream comminution activities. The trade-off
between the fineness of grind and the recovery target can thus be evaluated to determine the
minimum energy application required for optimal separation economics.
The test is designed to utilize small sample quantities of various sizes, providing an opportunity to
increase our understanding of ore variability through increased tests. This complements our ore body
knowledge and combining this with efforts in comminution (Powell, 2013) provides a platform for
extending the concept of flexible circuit design.
INTRODUCTION
In uncertain economic times new mineral projects are approached with greater rigor, by mining
companies and investors alike, to ensure a well-balanced risk-reward profile is maintained (Ernest and
Young, 2012). To quantify the risks associated with new projects a range of metallurgical tools are applied
to demonstrate the efficiency with which valuable minerals can be extracted from a particular ore.
For flotation, these efficiencies are typically based on laboratory or pilot-scale tests (Amelunxen &
Amelunxen, 2009a; 2009b; Bulled & Connolly, 2009; Dunham & Vann, 2007; Hay, 2005; Hay & Rule, 2003)
and the number of tests may be limited due to costs, project timeline constraints or sample availability.
Methods requiring larger composite samples, such as locked-cycle and pilot-scale tests, also produce
results for which the outcome represents an average response and may not necessarily indicate extremes.
The consequence is a lower confidence when extrapolating parameters within block models and this in
turn contributes to uncertainty during financial decision making (Dunham & Vann, 2007; Casteel, 2006).
To address uncertainty, large scale geometallurgical characterization of an ore body may be carried out.
This is done by collecting geometallurgical information on a much higher frequency than standard
metallurgical tests, and to develop the information into proxies to be linked with the appropriate process
performance indicators. In some cases head grade may be used as a proxy for recovery and grade on
untested drill core samples (Bulled & Connolly, 2009; Dunham & Vann, 2007; Bojcevski et al., 1998). Head
grade however can be a poor indicator as other factors such as modal mineralogy and liberation
characteristics also influence the separation process (Evans, 2010; Welsby, 2009; Vianna, 2004; Sutherland,
1989). Detailed scanning electron microscopy (SEM) investigations to determine modal mineralogy and
liberation characteristics on a large number of samples are however very costly and time consuming.
In addition to detailed SEM information, not all ores behave the same on a recovery by size basis. This is
valuable information for grinding and classification circuits as it contributes to establishing the energy
intensity needed to optimally extract the valuable minerals (Bazin et al., 1994; McIvor & Finch, 1991).
There thus exists a need to develop a flotation separability characterization technique that may be applied
to small sample masses, of which the results can be linked to process performance parameters.
In addition, the outcome of the small-scale test should also meet the following criteria:
It must be sensitive to variations in recoverability due to mineralogical differences
The outcomes must be comparable to traditional laboratory tests or plant data
The test must be able to identify the sensitivity of recovery with regards to particle size classes
The development of such a test and results on copper porphyry ore samples are discussed in the
subsequent sections.
METHODOLOGY
About the test
The Julius Kruttschnitt Mineral Separability Indicator (JKMSI) was developed based on the concept of
Wark (1938) and Wark & Wark (1935). The initial methodology was however very operator dependent
and this was later addressed by Chudacek (1990) and Chudacek & Fichera (1991) who reported a
consistent trend of the Test Tube Equilibrium Index (TTEI) with batch test rate parameters.
The JKMSI test is applied to small sample quantities of carefully sized feed material. The test
methodology followed in this paper is similar to that previously reported (Bradshaw & Vos, 2013).
Ore samples and analysis
Results from two sets of drill core samples from different operations, hereon referred to as “Ore-A” and
“Ore-B”, are discussed. These consist of 13 and 19 samples respectively; all tested using the 38-75 m, 75-
150 m and 150-212 m size fractions. Samples from Ore-A contained appreciable quantities of secondary
copper sulfides such as covellite and chalcocite (Bradshaw & Vos, 2013), with chalcopyrite being the
primary copper bearing mineral in the sample for Ore-B presented in figure 4. Duplicate tests were done
on each size fraction and products from these were combined and split into representative sub-samples
for chemical analysis. Mineralogical analysis (MLA) was done for selected feed samples for Ore-B.
Variability analysis
The raw experimental data are mass balanced and the outcomes evaluated with regards to mass recovery
(R), mineral enrichment ratio (Ei) and mineral recovery (Ri).
The enrichment ratio of a mineral is defined as its grade in the concentrate divided by its grade in the
feed. By definition of the recovery of a target mineral, Ri, the expression for Ei may be further simplified as
follow:
(
)
(
)
(1)
When results from a number of samples are plotted, it allows for the rapid assessment of differences
between all three parameters.
Comparison to batch test results
Batch flotation tests were also undertaken on the nineteen samples from Ore-B. The relative recovery and
grade values from the JKMSI tests are compared to the same parameters from the batch tests.
RESULTS AND DISCUSSION
Variability by size
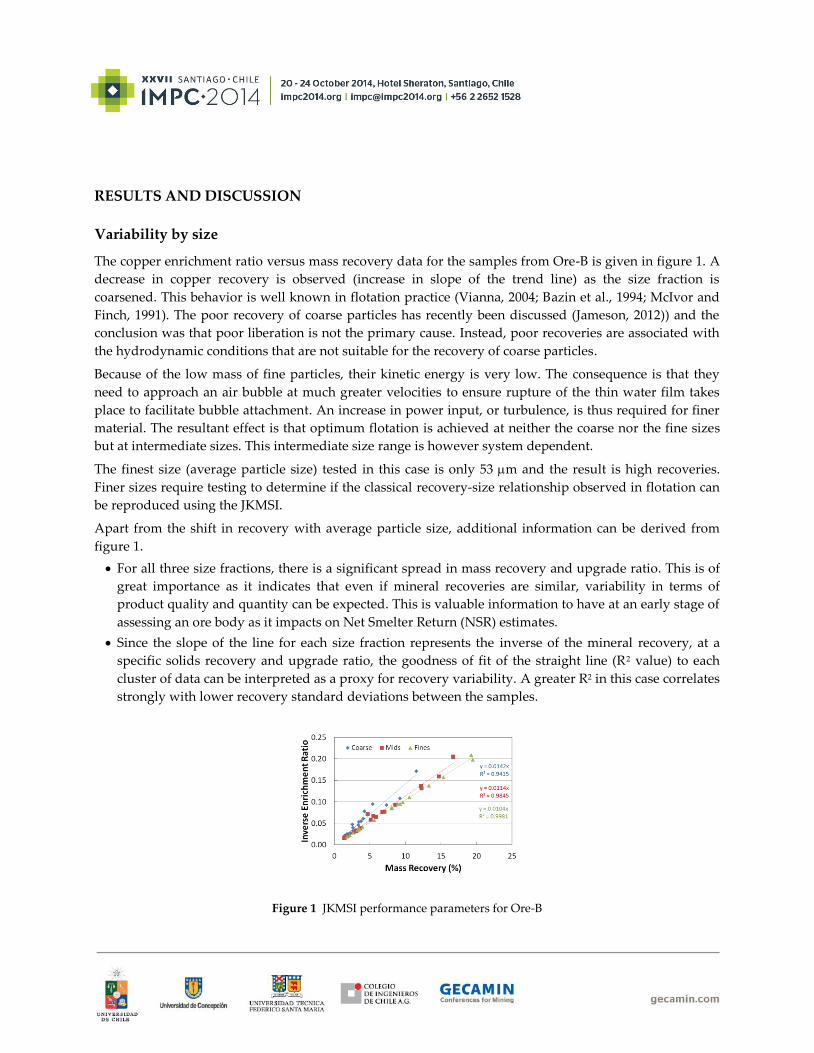
The copper enrichment ratio versus mass recovery data for the samples from Ore-B is given in figure 1. A
decrease in copper recovery is observed (increase in slope of the trend line) as the size fraction is
coarsened. This behavior is well known in flotation practice (Vianna, 2004; Bazin et al., 1994; McIvor and
Finch, 1991). The poor recovery of coarse particles has recently been discussed (Jameson, 2012)) and the
conclusion was that poor liberation is not the primary cause. Instead, poor recoveries are associated with
the hydrodynamic conditions that are not suitable for the recovery of coarse particles.
Because of the low mass of fine particles, their kinetic energy is very low. The consequence is that they
need to approach an air bubble at much greater velocities to ensure rupture of the thin water film takes
place to facilitate bubble attachment. An increase in power input, or turbulence, is thus required for finer
material. The resultant effect is that optimum flotation is achieved at neither the coarse nor the fine sizes
but at intermediate sizes. This intermediate size range is however system dependent.
The finest size (average particle size) tested in this case is only 53 m and the result is high recoveries.
Finer sizes require testing to determine if the classical recovery-size relationship observed in flotation can
be reproduced using the JKMSI.
Apart from the shift in recovery with average particle size, additional information can be derived from
figure 1.
For all three size fractions, there is a significant spread in mass recovery and upgrade ratio. This is of
great importance as it indicates that even if mineral recoveries are similar, variability in terms of
product quality and quantity can be expected. This is valuable information to have at an early stage of
assessing an ore body as it impacts on Net Smelter Return (NSR) estimates.
Since the slope of the line for each size fraction represents the inverse of the mineral recovery, at a
specific solids recovery and upgrade ratio, the goodness of fit of the straight line (R2 value) to each
cluster of data can be interpreted as a proxy for recovery variability. A greater R2 in this case correlates
strongly with lower recovery standard deviations between the samples.
Figure 1 JKMSI performance parameters for Ore-B
Using this knowledge, outliers can be identified in terms of the measured process attributes. Data points
deviating from that line indicate they potentially do not belong to the same separability class as the rest.
Further investigations (such as modal mineralogy) may assist in identifying the reasons for this. It may
have important implications for processing, particularly if the area of the ore body from which the
samples were taken forms a significant portion of the mill feed.
The data in this particular case demonstrates that grinding coarser than 150 m will result in significant
recovery variability and metal losses. At finer size fractions the variability in metal recovery is much less
between the samples tested.
Variability between various deposits
The previous discussion has highlighted how the outcomes of JKMSI tests may be used to determine
variability with regards to valuable mineral separability, on samples from a particular ore body.
In this section, the JKMSI separability data for the ores from two different deposits are compared and
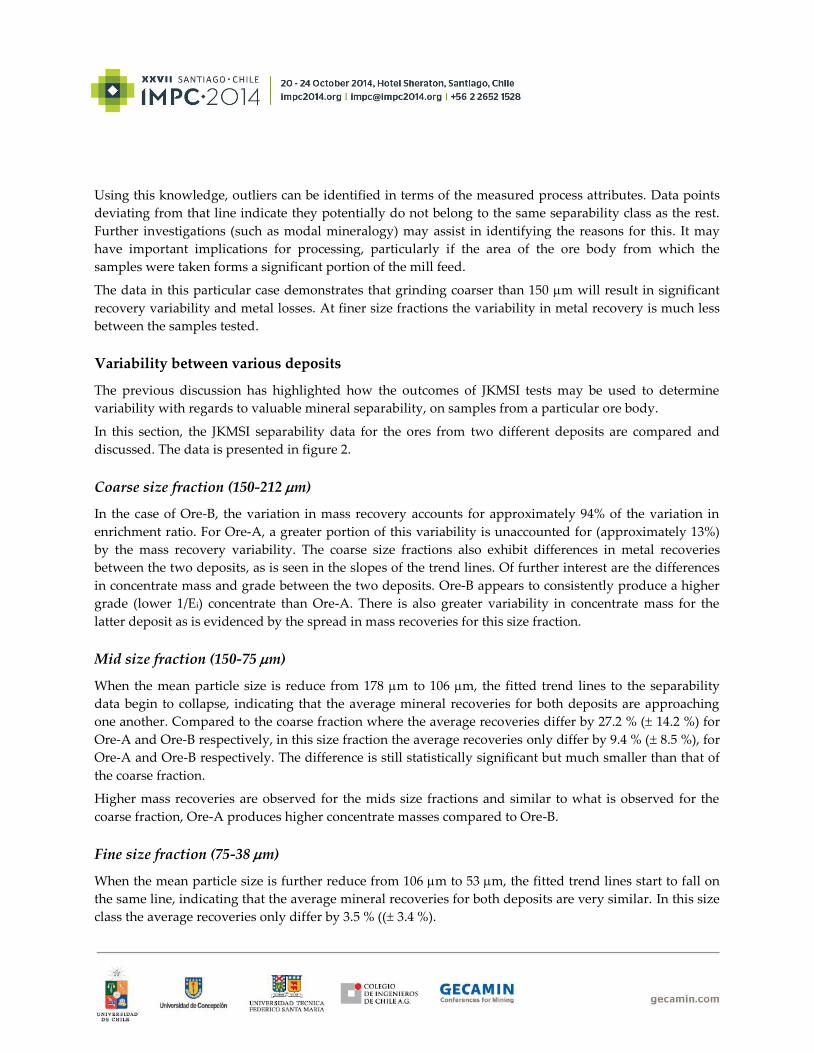
discussed. The data is presented in figure 2.
Coarse size fraction (150-212 m)
In the case of Ore-B, the variation in mass recovery accounts for approximately 94% of the variation in
enrichment ratio. For Ore-A, a greater portion of this variability is unaccounted for (approximately 13%)
by the mass recovery variability. The coarse size fractions also exhibit differences in metal recoveries
between the two deposits, as is seen in the slopes of the trend lines. Of further interest are the differences
in concentrate mass and grade between the two deposits. Ore-B appears to consistently produce a higher
grade (lower 1/Ei) concentrate than Ore-A. There is also greater variability in concentrate mass for the
latter deposit as is evidenced by the spread in mass recoveries for this size fraction.
Mid size fraction (150-75 m)
When the mean particle size is reduce from 178 m to 106 m, the fitted trend lines to the separability
data begin to collapse, indicating that the average mineral recoveries for both deposits are approaching
one another. Compared to the coarse fraction where the average recoveries differ by 27.2 % ( 14.2 %) for
Ore-A and Ore-B respectively, in this size fraction the average recoveries only differ by 9.4 % ( 8.5 %), for
Ore-A and Ore-B respectively. The difference is still statistically significant but much smaller than that of
the coarse fraction.
Higher mass recoveries are observed for the mids size fractions and similar to what is observed for the
coarse fraction, Ore-A produces higher concentrate masses compared to Ore-B.
Fine size fraction (75-38 m)
When the mean particle size is further reduce from 106 m to 53 m, the fitted trend lines start to fall on
the same line, indicating that the average mineral recoveries for both deposits are very similar. In this size
class the average recoveries only differ by 3.5 % (( 3.4 %).
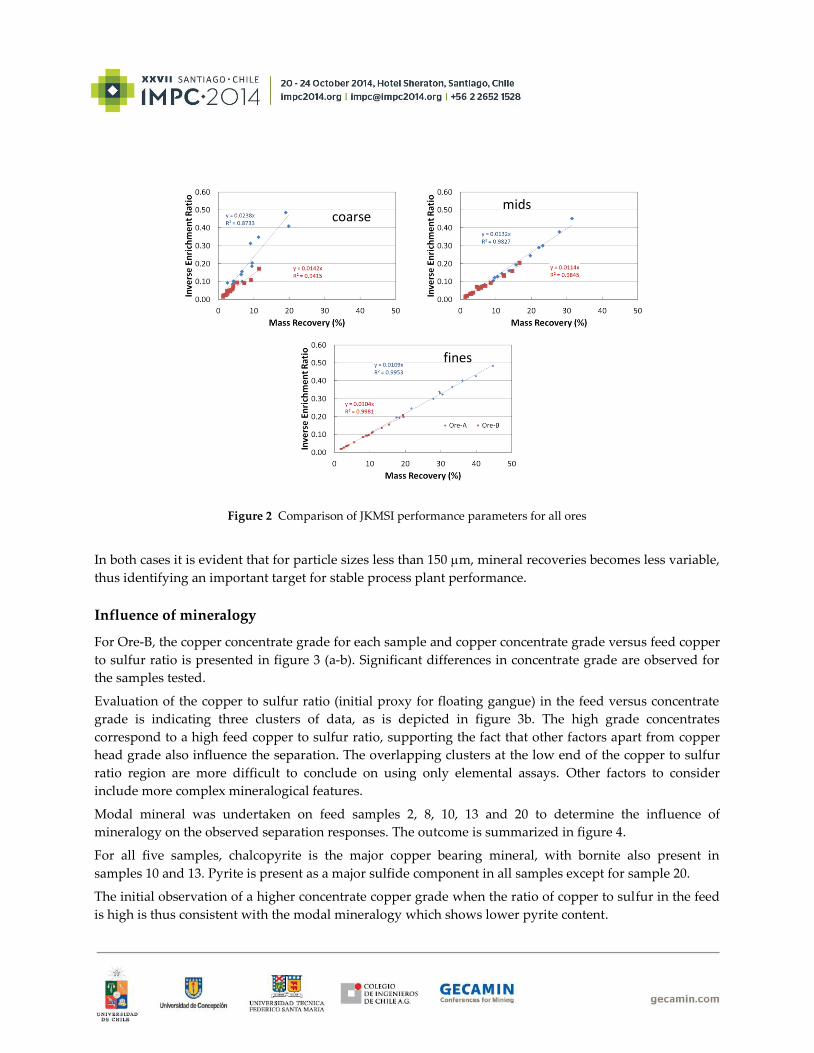
Figure 2 Comparison of JKMSI performance parameters for all ores
In both cases it is evident that for particle sizes less than 150 m, mineral recoveries becomes less variable,
thus identifying an important target for stable process plant performance.
Influence of mineralogy
For Ore-B, the copper concentrate grade for each sample and copper concentrate grade versus feed copper
to sulfur ratio is presented in figure 3 (a-b). Significant differences in concentrate grade are observed for
the samples tested.
Evaluation of the copper to sulfur ratio (initial proxy for floating gangue) in the feed versus concentrate
grade is indicating three clusters of data, as is depicted in figure 3b. The high grade concentrates
correspond to a high feed copper to sulfur ratio, supporting the fact that other factors apart from copper
head grade also influence the separation. The overlapping clusters at the low end of the copper to sulfur
ratio region are more difficult to conclude on using only elemental assays. Other factors to consider
include more complex mineralogical features.
Modal mineral was undertaken on feed samples 2, 8, 10, 13 and 20 to determine the influence of
mineralogy on the observed separation responses. The outcome is summarized in figure 4.
For all five samples, chalcopyrite is the major copper bearing mineral, with bornite also present in
samples 10 and 13. Pyrite is present as a major sulfide component in all samples except for sample 20.
The initial observation of a higher concentrate copper grade when the ratio of copper to sulfur in the feed
is high is thus consistent with the modal mineralogy which shows lower pyrite content.
coarse mids
fines
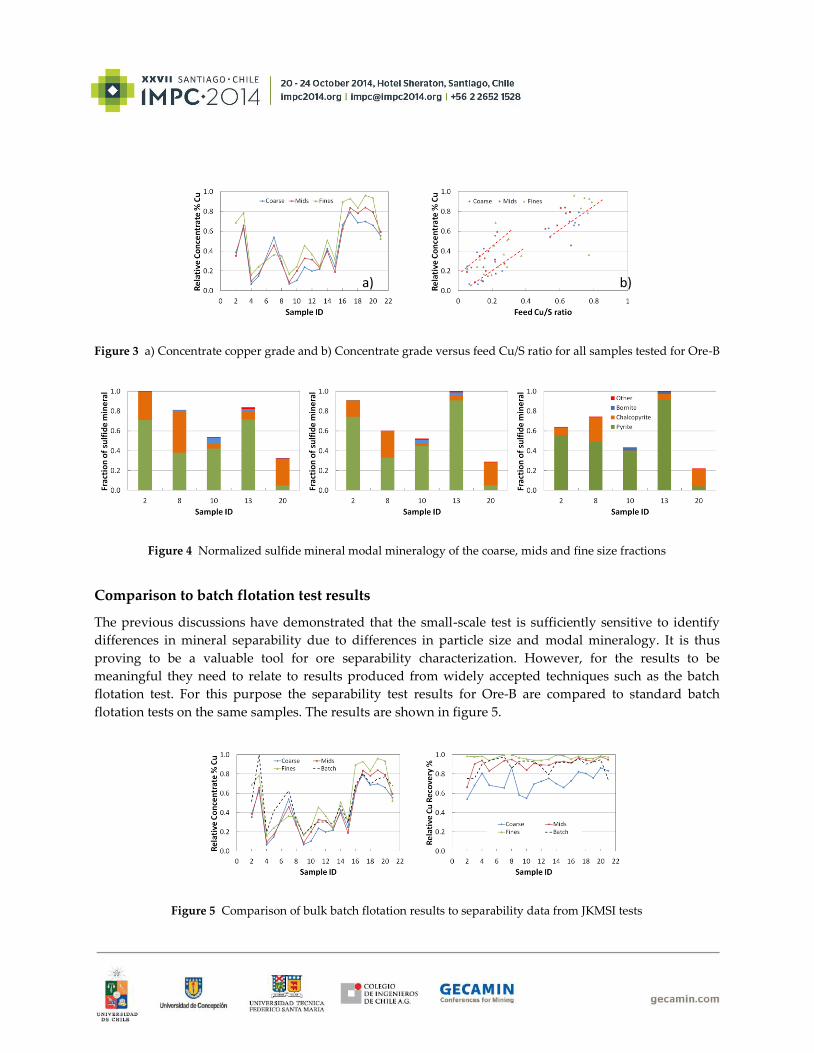
Figure 3 a) Concentrate copper grade and b) Concentrate grade versus feed Cu/S ratio for all samples tested for Ore-B
Figure 4 Normalized sulfide mineral modal mineralogy of the coarse, mids and fine size fractions
Comparison to batch flotation test results
The previous discussions have demonstrated that the small-scale test is sufficiently sensitive to identify
differences in mineral separability due to differences in particle size and modal mineralogy. It is thus
proving to be a valuable tool for ore separability characterization. However, for the results to be
meaningful they need to relate to results produced from widely accepted techniques such as the batch
flotation test. For this purpose the separability test results for Ore-B are compared to standard batch
flotation tests on the same samples. The results are shown in figure 5.
Figure 5 Comparison of bulk batch flotation results to separability data from JKMSI tests
a) b)
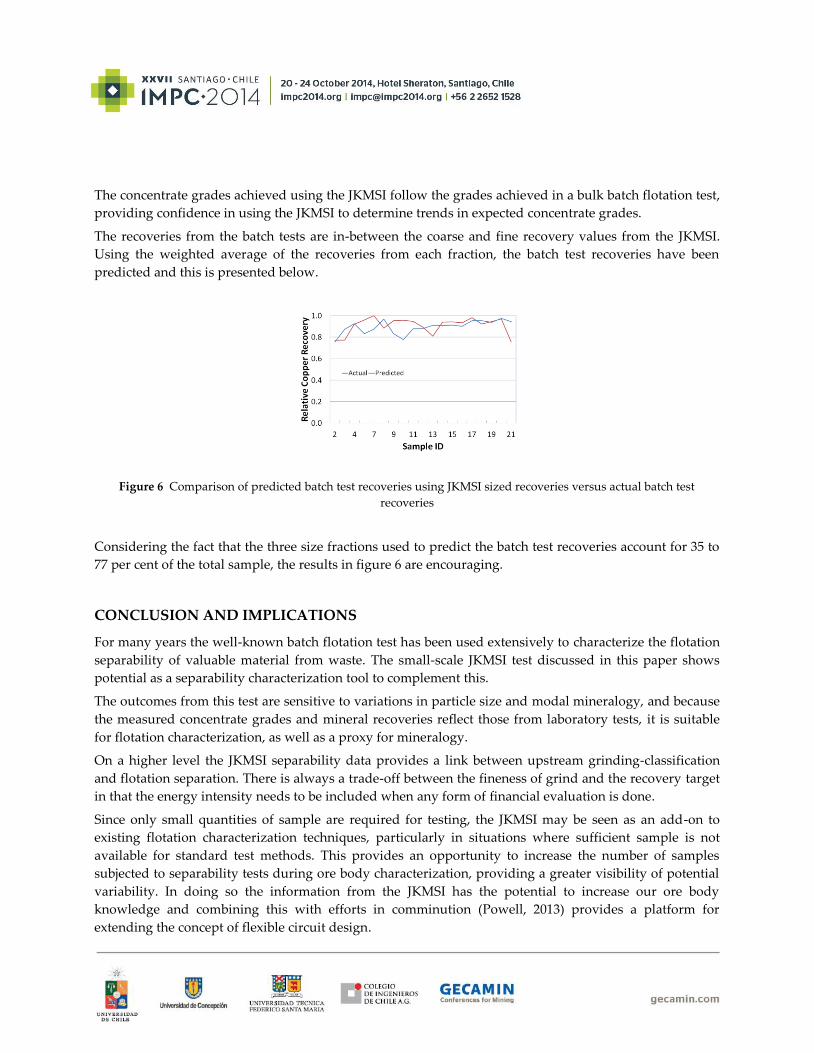
The concentrate grades achieved using the JKMSI follow the grades achieved in a bulk batch flotation test,
providing confidence in using the JKMSI to determine trends in expected concentrate grades.
The recoveries from the batch tests are in-between the coarse and fine recovery values from the JKMSI.
Using the weighted average of the recoveries from each fraction, the batch test recoveries have been
predicted and this is presented below.
Figure 6 Comparison of predicted batch test recoveries using JKMSI sized recoveries versus actual batch test
recoveries
Considering the fact that the three size fractions used to predict the batch test recoveries account for 35 to
77 per cent of the total sample, the results in figure 6 are encouraging.
CONCLUSION AND IMPLICATIONS
For many years the well-known batch flotation test has been used extensively to characterize the flotation
separability of valuable material from waste. The small-scale JKMSI test discussed in this paper shows
potential as a separability characterization tool to complement this.
The outcomes from this test are sensitive to variations in particle size and modal mineralogy, and because
the measured concentrate grades and mineral recoveries reflect those from laboratory tests, it is suitable
for flotation characterization, as well as a proxy for mineralogy.
On a higher level the JKMSI separability data provides a link between upstream grinding-classification
and flotation separation. There is always a trade-off between the fineness of grind and the recovery target
in that the energy intensity needs to be included when any form of financial evaluation is done.
Since only small quantities of sample are required for testing, the JKMSI may be seen as an add-on to
existing flotation characterization techniques, particularly in situations where sufficient sample is not
available for standard test methods. This provides an opportunity to increase the number of samples
subjected to separability tests during ore body characterization, providing a greater visibility of potential
variability. In doing so the information from the JKMSI has the potential to increase our ore body
knowledge and combining this with efforts in comminution (Powell, 2013) provides a platform for
extending the concept of flexible circuit design.
ACKNOWLEDGEMENTS
The authors would like to thank BHP Escondida and Rio Tinto Kennecott for their financial support and
approval to publish parts of this work. Kellie White, Mitchell Alexander and Wilfred Leong are
acknowledged for doing the experimental work. Elaine Wightman and her team, Esther Soden and Jessica
Gray for the MLA analysis.
REFERENCES
Amelunxen, P. & Amelunxen, R. (2009a) ‘Aminpro’s methodology for executing, interpreting and applying kinetic
flotation test in scale-up: Part 1’, Proceedings of the fifth International Mineral Processing Seminar – Procemin
2009, Santiago, Chile, pp. 347-355.
Amelunxen, P. & Amelunxen, R. (2009b) ‘Methodology for using laboratory kinetic flotation parameters for plant
design and optimization: Part 2’, Proceedings of the fifth International Mineral Processing Seminar – Procemin
2009, Santiago, Chile, pp. 357-365.
Bazin, C., Grant, R., Cooper, M. & Tessier, R. (1994) ‘A method of predicting metallurgical performance as a function
of fineness of grind’, Minerals Engineering, vol. 7, no. 10, pp. 1243-1251.
Bojcevski, D., Vink, L., Johnson, N.W., Landmark, V., Johnston, M., Mackenzie, J. & Young, M.F. (1998) ‘Metallurgical
characterisation of George Fisher ore textures and implications for ore processing’, Proceedings of the Mine to
Mill conference, Brisbane, Australia, pp. 29-41.
Bradshaw, D.J. & Vos, C.F. (2013) ‘The development of a small scale test for rapid characterization of flotation
response (JKMSI)’, Proceedings of the forty-fifth Annual Canadian Mineral Processors Operators Conference,
Ottawa, Canada, pp. 43-57.
Bulled, D. & Connolly, J. (2009) ‘A case study in the flotation characterization of an ore body and its use in circuit
design and risk assessment’. Proceedings of the SME Annual Meeting, Denver, Colorado, pp. 36-47.
Casteel, K. (2006) ‘Focus on flotation: Completing the circuit’, Engineering and Mining Journal, vol. 207, no. 4, pp. 34-41.
Chudacek, M.W. (1990) ‘A new quantitative test-tube flotability test’, Minerals Engineering, vol. 3, no. 5, pp. 461-472.
Chudacek, M.W. & Fichera, M.A. (1991) ‘The relationship between the test-tube flotability test and batch cell
flotation’, Minerals Engineering, vol. 4, no. 1, pp. 25-35.
Dunham, S. & Vann, J. (2007) ‘Geometallurgy, geostatistics and project value - Does your block model tell you what
you need to know?’ Proceedings of the Project Evaluation Conference, Melbourne, Australia, pp. 1-8.
Ernst & Young. (2012) The Ernest and Young business risk radar for mining and metals, viewed December 2013,
<http://www.ey.com/Publication/vwLUAssets/Business-risk-facing-mining-and-metals-2012-
2013/$FILE/Business-risk-facing-mining-and-metals-2012-2013.pdf>.
Evans, C.L. (2010) Development of a methodology to estimate flotation separability from ore microtexture. PhD Thesis, Julius
Kruttschnitt Mineral Research Centre, University of Queensland, Brisbane.
Hay, M.P. (2005) ‘Using the SUPASIM flotation model to diagnose and understand flotation behavior from laboratory
through to plant’, Minerals Engineering, vol. 18, pp. 762-771.
Hay, M.P. & Rule, C.M. (2003) ‘SUPASIM: a flotation plant design and analysis methodology’, Minerals Engineering,
vol. 16, pp. 1103-1109.
Jameson, G.J. (2012) ‘The effect of surface liberation and particle size on flotation rate constants’, Minerals Engineering,
vol. 36-38, pp. 132-137.
McIvor, R.E. & Finch, J.A. (1991) ‘A guide to interfacing of plant grinding and flotation operations’, Minerals
Engineering, vol. 4, pp. 9-23.
Powell, M.S. (2013) ‘Utilising orebody knowledge to improve comminutionn circuit design and energy utilisation
(Extended abstract)’. Proceedings of the second AusIMM International Geometallurgy Conference, Brisbane,
Australia, p. 27-35.
Sutherland, D.N. (1989) ‘Batch flotation behavior of composite particles’, Minerals Engineering, vol. 2, no. 3, p. 351-367.
Vianna, S.M. (2004) The effect pf particle size, collector coverage and liberation on the floatability of galena particles in an ore.
Ph.D Thesis, Julius Kruttschnitt Mineral Research Centre, University of Queensland, Brisbane.
Wark, E.E. & Wark, I.W. (1935) ‘The physical chemistry of flotation. VI. The adsorption of arnines by sulfide minerals’,
Journal of Physical Chemistry, vol. 39, no. 7, pp. 1021-1030.
Wark, I.W. (1938) ‘Experimental Methods, In Principles of flotation. Australasian Institute of Mining and Metallurgy,
Melbourne.
Welsby, S.D.D. (2009) On the interpretation of floatability using the bubble load. Ph.D Thesis, Julius Kruttschnitt Mineral
Research Centre, The University of Queensland, Brisbane.


