Embed Size (px)
Citation preview
1082
Characterization and photocatalytic study oftantalum oxide nanoparticles prepared by thehydrolysis of tantalum oxo-ethoxideTa8(μ3-O)2(μ-O)8(μ-OEt)6(OEt)14
Subia Ambreen1, N D Pandey1, Peter Mayer2 and Ashutosh Pandey*1
Full Research Paper Open Access
Address:1Department of Chemistry, Motilal Nehru National Institute ofTechnology, Allahabad, 211004, India and 2Department Chemie undBiochemie, Universität München, Butenandtstraße 5–13, 81377München, Germany
Email:Ashutosh Pandey* - [email protected]
* Corresponding author
Keywords:bandgap; tantalum-oxo-ethoxide; Tauc plot; tantalum pentoxide(Ta2O5)
Beilstein J. Nanotechnol. 2014, 5, 1082–1090.doi:10.3762/bjnano.5.121
Received: 07 January 2014Accepted: 25 June 2014Published: 18 July 2014
This article is part of the Thematic Series "Photocatalysis".
Guest Editor: R. Xu
© 2014 Ambreen et al; licensee Beilstein-Institut.License and terms: see end of document.
AbstractTa8(μ3-O)2(μ-O)8(μ-OEt)6(OEt)14 (1) was obtained by the controlled hydrolysis of tantalum ethoxide Ta(OEt)5 in the presence of
ammonia. Compound 1 is considered as the intermediate building block in the sol–gel polymerization of Ta(OEt)5. Further hydrol-
ysis of compound 1 yielded nanoparticles of Ta2O5, which were characterized by various techniques such as TGA-DTA-DSC,
UV–vis DRS, XRD, SEM, TEM, particle size analyzer (DLS) and the Brunauer–Emmett–Teller (BET) method. The band gap of
the particles was calculated by using the Tauc plot. The photocatalytic activity of Ta2O5 nanoparticles was tested by the degrad-
ation of the organic dye rhodamine B.
1082
IntroductionMetal alkoxides, being excellent precursors in the sol–gel
process for preparation of metal oxides have attained huge
attention of researchers. Several attempts have been made in
order to modify the highly moisture sensitive metal alkoxides
into less sensitive species [1-4] as precursors for metal oxides
with new and better properties. However, due to the fast
kinetics of the hydrolysis and condensation reactions in the
sol–gel route, relatively little information is available
concerning the progressive structural evolution in the transition
metal oxide system in general. But sometimes new species,
metal oxo-alkoxides [5-9], are obtained which have been known
to be the direct molecular precursors for oxide phases in sol–gel
technology. These oxo-species being treated as intermediates
between the metal alkoxides and the metal oxides are very
Beilstein J. Nanotechnol. 2014, 5, 1082–1090.
1083
significant as they clearly indicate the route for the formation of
oxides through hydrolysis. It is suggested that the hydrolysis of
a metal alkoxide starts with the formation of a hydroxo deriva-
tive, which then forms the oxo derivative in a condensation step
(Equation 1 and Equation 2).
(1)
(2)
The investigation of the hydrolysis of titanium alkoxides
showed that the reactions were very fast. Therefore the initial
hydroxo compounds were not isolated [10]. Similar results were
obtained for alkoxides of zirconium [11], tin(IV) [12], and
uranium(V) [12]. Condensation can also occur even before
hydrolysis via ether elimination between alkoxy groups leading
to the formation of oxo bridges. The smaller size of μ-oxo
ligands coupled with the tendency of metal centers for coordi-
nation expansion, favors the condensation via ether elimination.
Oxo-alkoxides, being less reactive toward hydrolysis and con-
densation, are more stable than the corresponding alkoxides.
They are generally observed for large and electropositive
metals. Oxo-alkoxides are normally made of edge sharing MO6
octahedra. Usually the physical properties of metal oxo-alkox-
ides are decided by the degree of hydrolysis and the nature of
the alkyl group. There is a tendency for lower volatility and
solubility with higher degrees of hydrolysis and, therefore,
oligomerization. Amongst the transition metal oxides, Ta2O5
has attracted growing interest due to its distinct properties such
as large ion diffusion coefficient and high electrochromic re-
versibility, high dielectric constant, high refractive index, high
chemical stability, large band gap [13-15] and photocatalytic
activity for overall water decomposition and organic pollutant
degradation [16-21].
The present work deals with the study of the controlled hydrol-
ysis of tantalum ethoxide in the presence of ammonia and to
prepare tantalum pentaoxide nanoparticles. In this process the
stable intermediate tantalum oxo-ethoxide with composition
Ta8(μ3-O)2(μ-O)8(μ-OEt)6(OEt)14 (1) was isolated. When 1
was subjected to further hydrolysis it yielded nanoparticles of
tantalum oxide after calcination at 750 °C for four hours. The
photocatalytic activity of Ta2O5 nanoparticles was studied over
the degradation of organic dye rhodamine B (RhB).
Results and DiscussionTantalum penta-ethoxide was dissolved in toluene and with the
aim to examine the effect of hydrolysis in basic medium, wet
ammonia gas was purged into it with continuous stirring. After
1 h at pH 8.0, a white solid was formed which was separated,
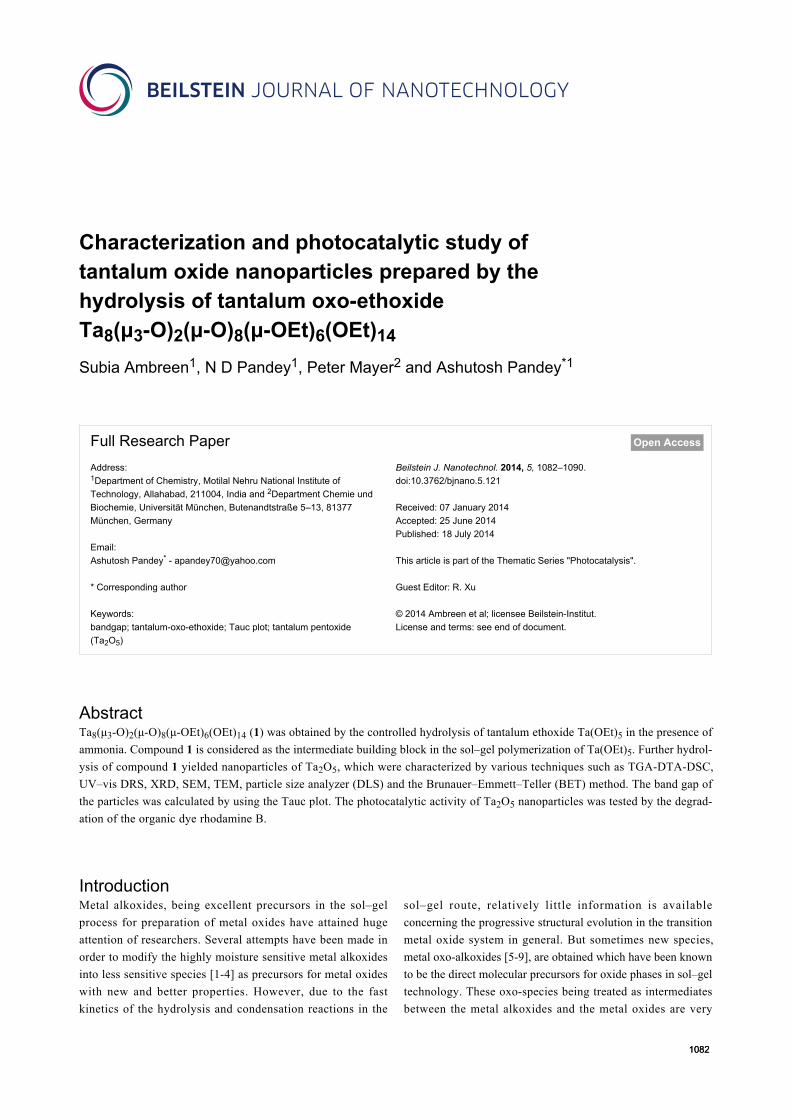
Figure 1: ORTEP representation of the molecular structure of 1 in thecrystal (hydrogen atoms are omitted for clarity).
re-dissolved in toluene and kept at low temperature for crystal-
lization to give compound 1 as white shiny crystals in two days.
The formation of tantalum oxo-alkoxide can be described as a
result of following reactions (Equation 3 and Equation 4).
(3)
(4)
1H NMR of compound 1 shows many sets for ethoxy groups
suggesting the presence of different types of ethoxy groups such
as cis pairs of terminal OEt ligands, single terminal OEt ligands
and μ-OEt groups.
Crystal structureCompound 1 was found in the monoclinic space group P21/n
with Z = 2. The molecular structure (Figure 1) consists of a
centrosymmetric unit of formula Ta8(μ3-O)2(μ-O)8(μ-
OEt)6(OEt)14 (1). Each molecule has two Ta3(μ3-O)-(μ-
OEt)3(OEt)5 units linked with two Ta(μ-O)4(OEt)2 moieties by
four μ-oxo ligands. All of the tantalum atoms display distorted
octahedral configurations. Six tantalum atoms are bonded to cis
pairs of terminal ethoxy ligands and the other two are bonded to
single ethoxy ligands. The terminal ligands are in trans position
to the μ3- and μ-oxo atoms. The ethoxy groups are of two types.
Out of the twenty ethoxy groups, fourteen are terminal while six
(O8, O9, O12 and O8*, O9*, O12*) bridge the tantalum atoms.
The tantalum atoms have two environments. Four tantalum
atoms are coordinated to two terminal ethoxy, two bridging eth-
oxy, one μ-O and one μ3-O ligands while two tantalum atoms
Beilstein J. Nanotechnol. 2014, 5, 1082–1090.
1084
are coordinated with two terminal ethoxy and four μ-O groups.
The TaO6 octahedra are distorted, resulting in O–Ta–O angles,
which differ from those for a regular octahedron. Some bond
lengths and bond angles are presented in Table 1 and Table 2
respectively. Ta–O bond lengths for the terminal ethoxy ligands
are shorter (av. 1.897 Å) than the bridging ethoxy ligands (av.
2.153 Å). The μ-oxo bridges are shorter than the μ3-O bond
lengths (approx. 2.0585 Å). The μ3-oxo atom, O1 is ligated in
pyramidal manner to three tantalum atoms with an average
bond angle of 108.87°. The bond dimensional data are in accor-
dance with previously reported values [5,9]. Full crystallo-
graphic details have been deposited to the Cambridge Crystallo-
graphic Data Centre. Copies of the data can be obtained free of
charge on request from the CCDC, 12 Union Road, Cambridge
CB2 1EZ, UK; fax: (+44) 1223-336-033; or e-mail:
[email protected] or http://www.ccdc.cam.ac.uk/conts/
retrieving.html quoting the deposition number CCDC 951412
for 1.
Table 1: Selected bond lengths.
bond length bond length
O1–Ta1 2.0629(1) O7–Ta1 1.8711O1–Ta2 2.0345(1) O8–Ta1 2.1061(1)O1–Ta4 2.0719(1) O8–Ta4 2.1556(1)O2–Ta2 1.8577 O9–Ta1 2.1533(1)O2–Ta3 1.9928 O9–Ta2 2.1319(1)O3–Ta3 2.0039(1) O10–Ta2 1.8928O3–Ta4 1.8544(1) O11–Ta2 1.8669O4–Ta3 2.0167(1) O12–Ta2 2.1149(1)O4–Ta1 1.8411 O12–Ta4 2.1725(1)O5–Ta3 2.0238(1) O13–Ta3 1.9083O5–Ta4 1.8455 O14–Ta3 1.8783(1)O6–Ta1 1.8927(1) O15–Ta4 1.8671
Upon further subjecting to hydrolysis (pH 9.0), compound 1
initially gave a homogeneous gel which was heated to 80 °C
before annealing at 750 °C to obtain Ta2O5 nanoparticles. The
morphology and composition of Ta2O5 nanoparticles are greatly
influenced by the pH value [22]. The agglomeration of nanopar-
ticles is enhanced at low pH due to the fast rate of hydrolysis
and acidic surface of Ta2O5 while at the pH values above 10,
instead of Ta2O5, tantalate salts are formed [22].
Particle size and distribution of Ta2O5nanoparticlesIn order to study the size and distribution of the nanoparticles
XRD, SEM, TEM and DLS measurements were carried out.
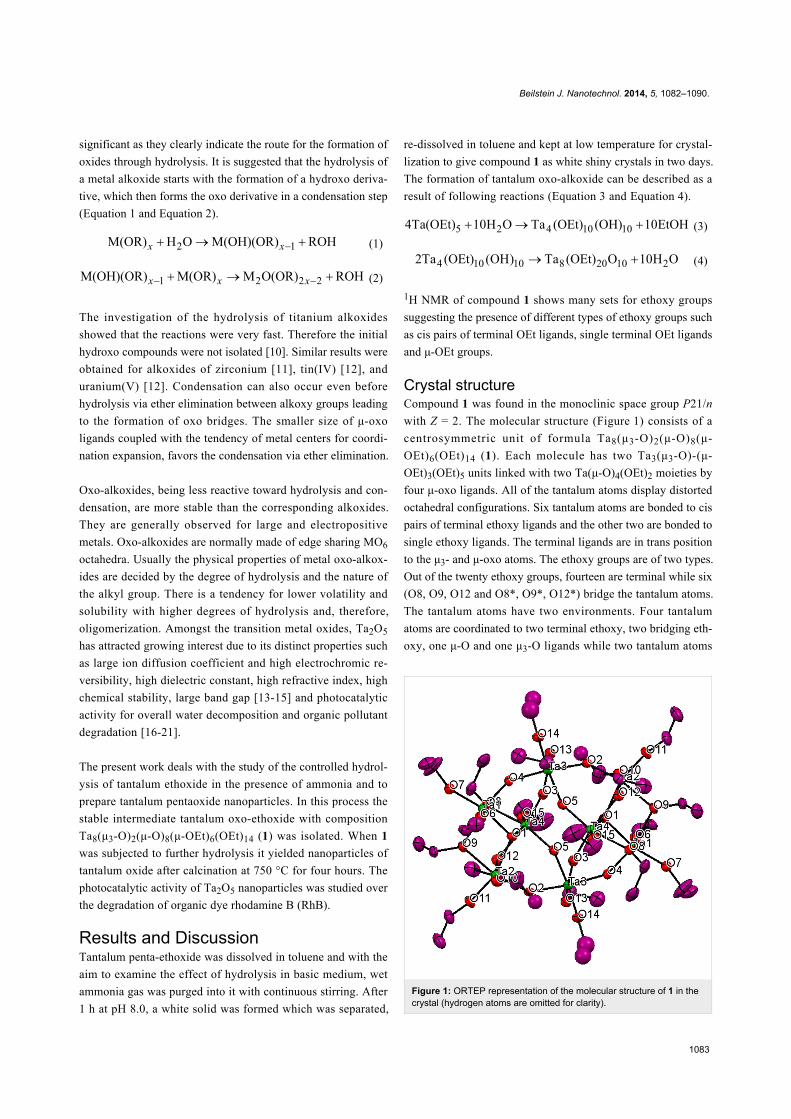
Figure 2 shows the XRD patterns of calcined Ta2O5 nanoparti-
cles. The peaks at 2θ values of 23.06, 28.62, 37.02, 46.94,
50.54, 55.72, 58.84, 64.18, and 71.30° revealed the Ta2O5
Table 2: Selected bond angles.
bond angle bond angle
Ta1–O1–Ta2 110.85 O9–Ta2–O11 89.83Ta1–O1–Ta4 107.48 O9–Ta2–O12 87.09Ta2–O1–Ta4 108.28 O10–Ta2–O11 100.04Ta2–O2–Ta3 144.86 O10–Ta2–O12 167.96Ta3–O3–Ta4 145.34 O11–Ta2–O12 91.4Ta3–O4–Ta1 144.33 O2–Ta3–O3 90.31Ta3–O5–Ta4 144.09 O2–Ta3–O4 173.29Ta1–O8–Ta4 102.94 O2–Ta3–O5 85.31Ta1–O9–Ta2 103.87 O2–Ta3–O13 96.48Ta2–O12–Ta4 101.83 O2–Ta3–O14 89.15O1–Ta1–O6 99.79 O3–Ta3–O4 83.84O1–Ta1–O7 154.81 O3–Ta3–O5 84.94O1–Ta1–O8 72.52 O3–Ta3–O13 168.36O1–Ta1–O9 71.58 O3–Ta3–O14 95.05O1–Ta1–O4 92.52 O4–Ta3–O5 90.89O6–Ta1–O7 97.78 O4–Ta3–O13 88.77O6–Ta1–O8 170.71 O4–Ta3–O14 94.62O6–Ta1–O9 87.55 O5–Ta3–O13 86.2O6–Ta1–O4 95.44 O5–Ta3–O14 174.46O7–Ta1–O8 88.03 O13–Ta3–O14 94.49O7–Ta1–O9 91.35 O3–Ta4–O15 101.71O7–Ta1–O4 103.66 O3–Ta4–O1 91.83O8–Ta1–O9 85.07 O3–Ta4–O5 101.59O8–Ta1–O4 90.18 O3–Ta4–O8 88.23O9–Ta1–O4 164.11 O3–Ta4–O12 161.79O1–Ta2–O2 93.37 O15–Ta4–O1 157.42O1–Ta2–O9 72.57 O15–Ta4–O5 101.66O1–Ta2–O10 94.28 O15–Ta4–O8 90.91O1–Ta2–O11 157.16 O15–Ta4–O12 91.7O1–Ta2–O12 73.68 O1–Ta4–O5 93.07O2–Ta2–O9 165.72 O1–Ta4–O8 71.34O2–Ta2–O10 94.45 O1–Ta4–O12 71.76O2–Ta2–O11 103.07 O5–Ta4–O8 161.98O2–Ta2–O12 86.52 O5–Ta4–O12 87.48O9–Ta2–O10 89.2 O8–Ta4–O12 79.2
phase with an orthorhombic structure. The average crystallite
size calculated from Scherrer formula was found to be 28 nm.
To reveal the morphology SEM image of the calcined Ta2O5
nanoparticles is shown in Figure 3. Evidently, Ta2O5 nanoparti-
cles are irregularly shaped, agglomerated and exhibit a moder-
ately uniform size distribution. The size distribution of the
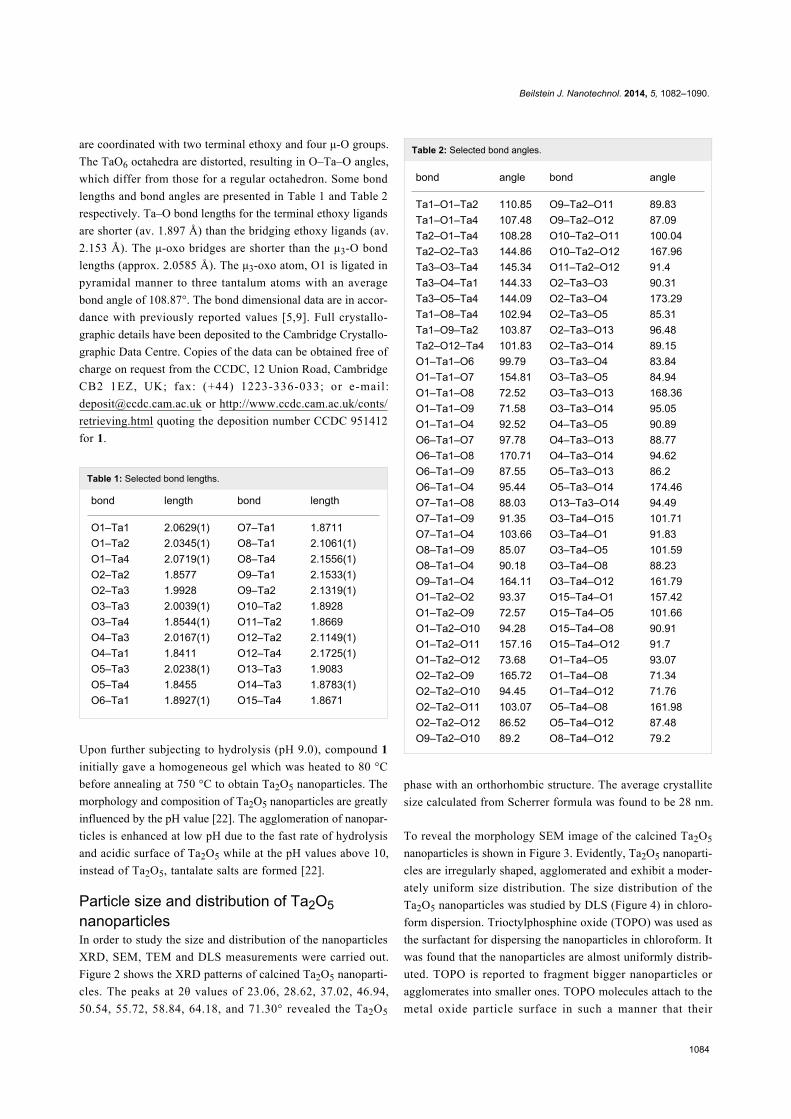
Ta2O5 nanoparticles was studied by DLS (Figure 4) in chloro-
form dispersion. Trioctylphosphine oxide (TOPO) was used as
the surfactant for dispersing the nanoparticles in chloroform. It
was found that the nanoparticles are almost uniformly distrib-
uted. TOPO is reported to fragment bigger nanoparticles or
agglomerates into smaller ones. TOPO molecules attach to the
metal oxide particle surface in such a manner that their
Beilstein J. Nanotechnol. 2014, 5, 1082–1090.
1085
Figure 2: XRD pattern of Ta2O5 nanoparticles calcined at 750 °C for4 h.
hydrophobic surfaces point toward the solvent and render
colloidal stability and uniformity of the particles in organic
solvents [23]. The TOPO coated particles suspended in chloro-
form were precipitated by adding excess methanol followed by
centrifuging at 2000 rpm and re-dispersed in chloroform. A
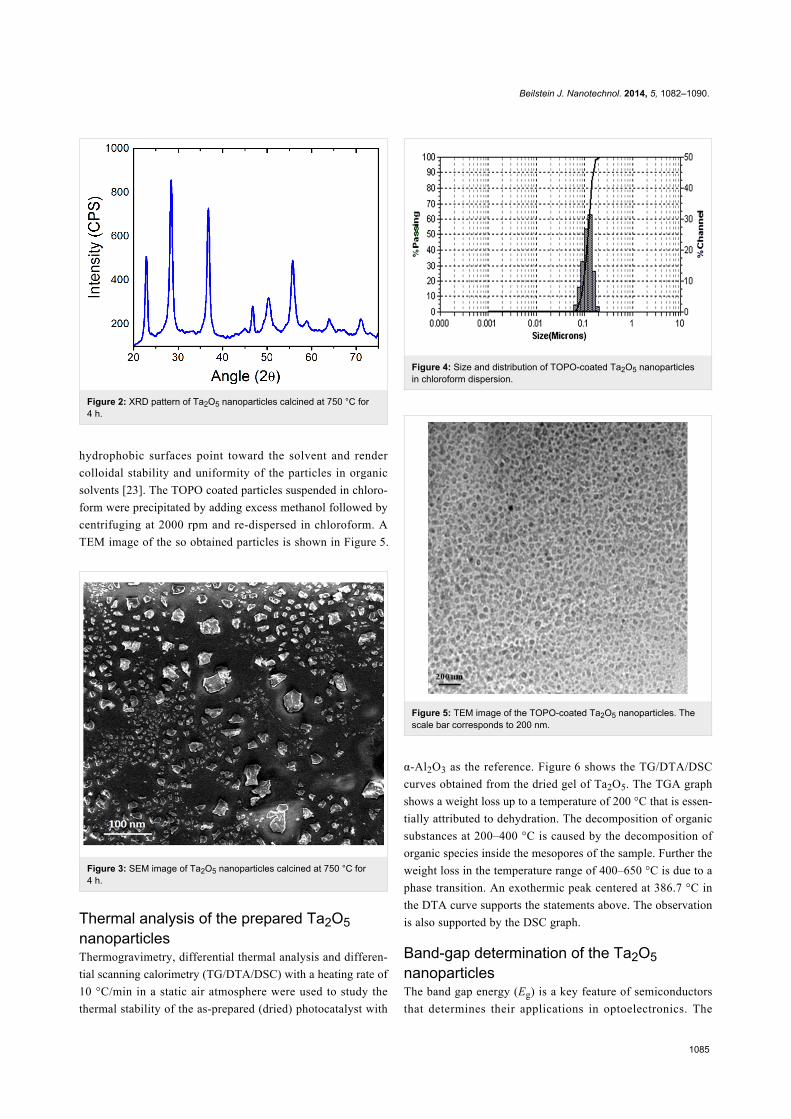
TEM image of the so obtained particles is shown in Figure 5.
Figure 3: SEM image of Ta2O5 nanoparticles calcined at 750 °C for4 h.
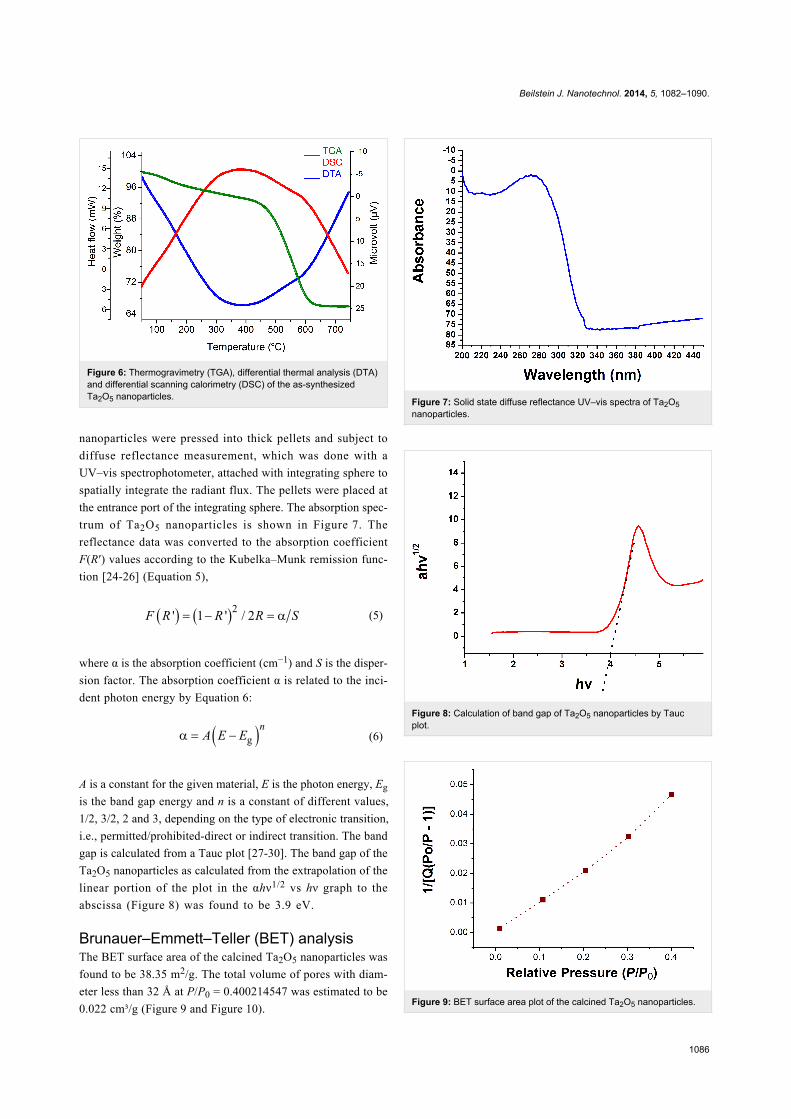
Thermal analysis of the prepared Ta2O5nanoparticlesThermogravimetry, differential thermal analysis and differen-
tial scanning calorimetry (TG/DTA/DSC) with a heating rate of
10 °C/min in a static air atmosphere were used to study the
thermal stability of the as-prepared (dried) photocatalyst with
Figure 4: Size and distribution of TOPO-coated Ta2O5 nanoparticlesin chloroform dispersion.
Figure 5: TEM image of the TOPO-coated Ta2O5 nanoparticles. Thescale bar corresponds to 200 nm.
α-Al2O3 as the reference. Figure 6 shows the TG/DTA/DSC
curves obtained from the dried gel of Ta2O5. The TGA graph
shows a weight loss up to a temperature of 200 °C that is essen-
tially attributed to dehydration. The decomposition of organic
substances at 200–400 °C is caused by the decomposition of
organic species inside the mesopores of the sample. Further the
weight loss in the temperature range of 400–650 °C is due to a
phase transition. An exothermic peak centered at 386.7 °C in
the DTA curve supports the statements above. The observation
is also supported by the DSC graph.
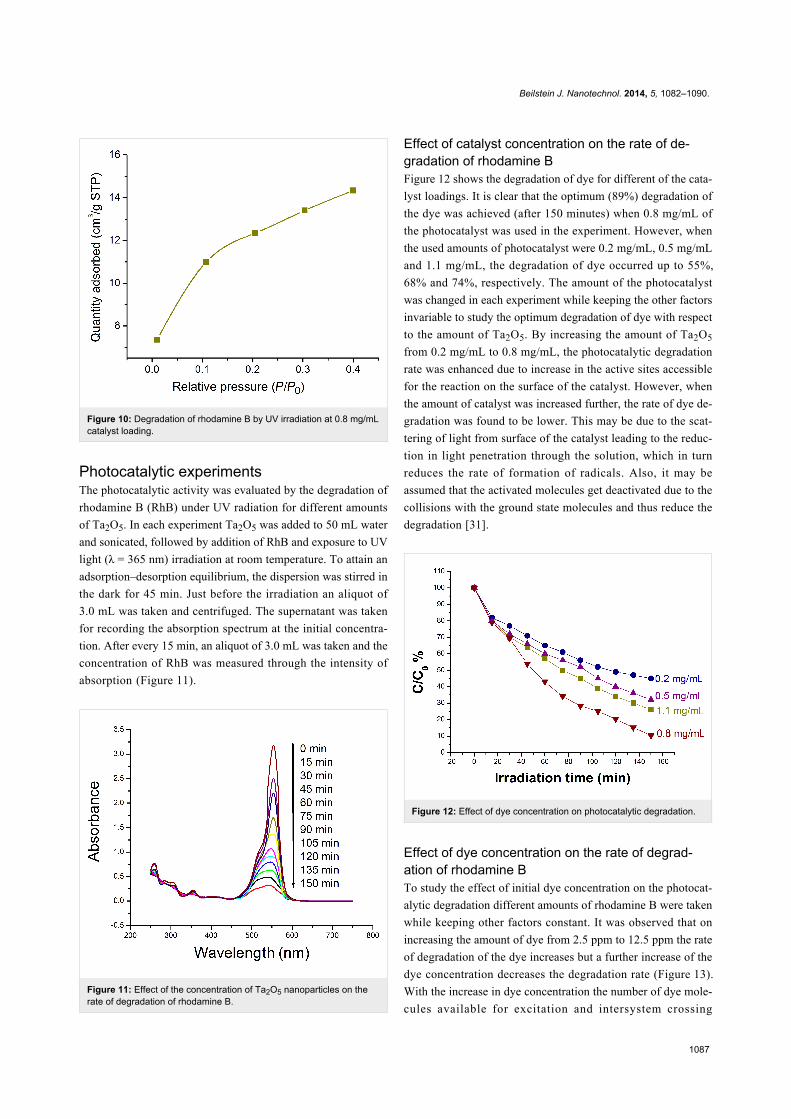
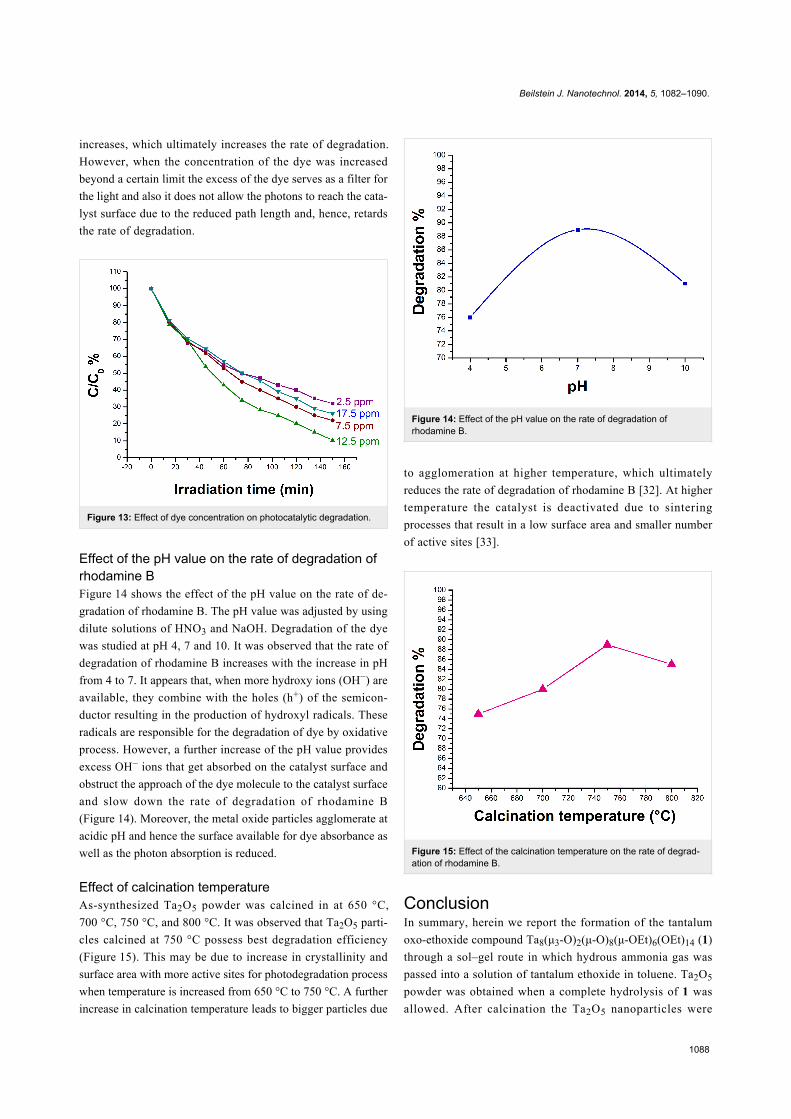
Band-gap determination of the Ta2O5nanoparticlesThe band gap energy (Eg) is a key feature of semiconductors
that determines their applications in optoelectronics. The
Beilstein J. Nanotechnol. 2014, 5, 1082–1090.
1086
Figure 6: Thermogravimetry (TGA), differential thermal analysis (DTA)and differential scanning calorimetry (DSC) of the as-synthesizedTa2O5 nanoparticles.
nanoparticles were pressed into thick pellets and subject to
diffuse reflectance measurement, which was done with a
UV–vis spectrophotometer, attached with integrating sphere to
spatially integrate the radiant flux. The pellets were placed at
the entrance port of the integrating sphere. The absorption spec-
trum of Ta2O5 nanoparticles is shown in Figure 7. The
reflectance data was converted to the absorption coefficient
F(R′) values according to the Kubelka–Munk remission func-
tion [24-26] (Equation 5),
(5)
where α is the absorption coefficient (cm−1) and S is the disper-
sion factor. The absorption coefficient α is related to the inci-
dent photon energy by Equation 6:
(6)
A is a constant for the given material, E is the photon energy, Eg
is the band gap energy and n is a constant of different values,
1/2, 3/2, 2 and 3, depending on the type of electronic transition,
i.e., permitted/prohibited-direct or indirect transition. The band
gap is calculated from a Tauc plot [27-30]. The band gap of the
Ta2O5 nanoparticles as calculated from the extrapolation of the
linear portion of the plot in the αhν1/2 vs hν graph to the
abscissa (Figure 8) was found to be 3.9 eV.
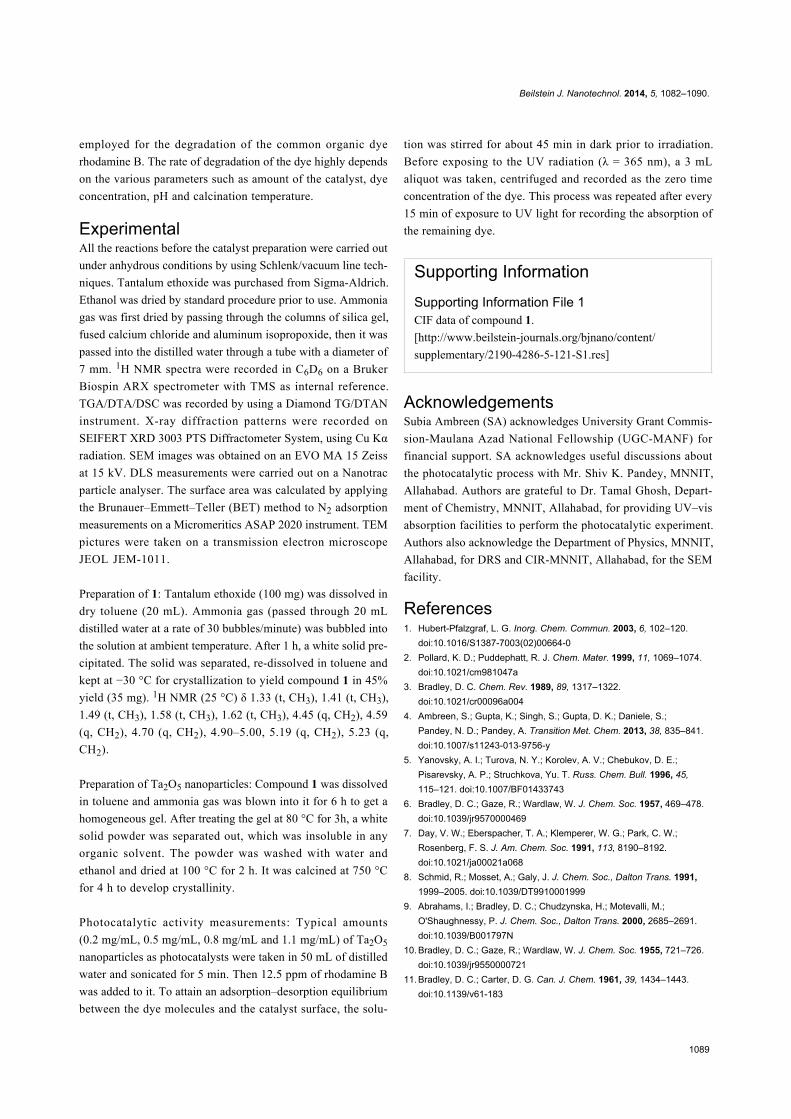
Brunauer–Emmett–Teller (BET) analysisThe BET surface area of the calcined Ta2O5 nanoparticles was
found to be 38.35 m2/g. The total volume of pores with diam-
eter less than 32 Å at P/P0 = 0.400214547 was estimated to be
0.022 cm³/g (Figure 9 and Figure 10).
Figure 7: Solid state diffuse reflectance UV–vis spectra of Ta2O5nanoparticles.
Figure 8: Calculation of band gap of Ta2O5 nanoparticles by Taucplot.
Figure 9: BET surface area plot of the calcined Ta2O5 nanoparticles.
Beilstein J. Nanotechnol. 2014, 5, 1082–1090.
1087
Figure 10: Degradation of rhodamine B by UV irradiation at 0.8 mg/mLcatalyst loading.
Photocatalytic experimentsThe photocatalytic activity was evaluated by the degradation of
rhodamine B (RhB) under UV radiation for different amounts
of Ta2O5. In each experiment Ta2O5 was added to 50 mL water
and sonicated, followed by addition of RhB and exposure to UV
light (λ = 365 nm) irradiation at room temperature. To attain an
adsorption–desorption equilibrium, the dispersion was stirred in
the dark for 45 min. Just before the irradiation an aliquot of
3.0 mL was taken and centrifuged. The supernatant was taken
for recording the absorption spectrum at the initial concentra-
tion. After every 15 min, an aliquot of 3.0 mL was taken and the
concentration of RhB was measured through the intensity of
absorption (Figure 11).
Figure 11: Effect of the concentration of Ta2O5 nanoparticles on therate of degradation of rhodamine B.
Effect of catalyst concentration on the rate of de-gradation of rhodamine BFigure 12 shows the degradation of dye for different of the cata-
lyst loadings. It is clear that the optimum (89%) degradation of
the dye was achieved (after 150 minutes) when 0.8 mg/mL of
the photocatalyst was used in the experiment. However, when
the used amounts of photocatalyst were 0.2 mg/mL, 0.5 mg/mL
and 1.1 mg/mL, the degradation of dye occurred up to 55%,
68% and 74%, respectively. The amount of the photocatalyst
was changed in each experiment while keeping the other factors
invariable to study the optimum degradation of dye with respect
to the amount of Ta2O5. By increasing the amount of Ta2O5
from 0.2 mg/mL to 0.8 mg/mL, the photocatalytic degradation
rate was enhanced due to increase in the active sites accessible
for the reaction on the surface of the catalyst. However, when
the amount of catalyst was increased further, the rate of dye de-
gradation was found to be lower. This may be due to the scat-
tering of light from surface of the catalyst leading to the reduc-
tion in light penetration through the solution, which in turn
reduces the rate of formation of radicals. Also, it may be
assumed that the activated molecules get deactivated due to the
collisions with the ground state molecules and thus reduce the
degradation [31].
Figure 12: Effect of dye concentration on photocatalytic degradation.
Effect of dye concentration on the rate of degrad-ation of rhodamine BTo study the effect of initial dye concentration on the photocat-
alytic degradation different amounts of rhodamine B were taken
while keeping other factors constant. It was observed that on
increasing the amount of dye from 2.5 ppm to 12.5 ppm the rate
of degradation of the dye increases but a further increase of the
dye concentration decreases the degradation rate (Figure 13).
With the increase in dye concentration the number of dye mole-
cules available for excitation and intersystem crossing
Beilstein J. Nanotechnol. 2014, 5, 1082–1090.
1088
increases, which ultimately increases the rate of degradation.
However, when the concentration of the dye was increased
beyond a certain limit the excess of the dye serves as a filter for
the light and also it does not allow the photons to reach the cata-
lyst surface due to the reduced path length and, hence, retards
the rate of degradation.
Figure 13: Effect of dye concentration on photocatalytic degradation.
Effect of the pH value on the rate of degradation ofrhodamine BFigure 14 shows the effect of the pH value on the rate of de-
gradation of rhodamine B. The pH value was adjusted by using
dilute solutions of HNO3 and NaOH. Degradation of the dye
was studied at pH 4, 7 and 10. It was observed that the rate of
degradation of rhodamine B increases with the increase in pH
from 4 to 7. It appears that, when more hydroxy ions (OH−) are
available, they combine with the holes (h+) of the semicon-
ductor resulting in the production of hydroxyl radicals. These
radicals are responsible for the degradation of dye by oxidative
process. However, a further increase of the pH value provides
excess OH− ions that get absorbed on the catalyst surface and
obstruct the approach of the dye molecule to the catalyst surface
and slow down the rate of degradation of rhodamine B
(Figure 14). Moreover, the metal oxide particles agglomerate at
acidic pH and hence the surface available for dye absorbance as
well as the photon absorption is reduced.
Effect of calcination temperatureAs-synthesized Ta2O5 powder was calcined in at 650 °C,
700 °C, 750 °C, and 800 °C. It was observed that Ta2O5 parti-
cles calcined at 750 °C possess best degradation efficiency
(Figure 15). This may be due to increase in crystallinity and
surface area with more active sites for photodegradation process
when temperature is increased from 650 °C to 750 °C. A further
increase in calcination temperature leads to bigger particles due
Figure 14: Effect of the pH value on the rate of degradation ofrhodamine B.
to agglomeration at higher temperature, which ultimately
reduces the rate of degradation of rhodamine B [32]. At higher
temperature the catalyst is deactivated due to sintering
processes that result in a low surface area and smaller number
of active sites [33].
Figure 15: Effect of the calcination temperature on the rate of degrad-ation of rhodamine B.
ConclusionIn summary, herein we report the formation of the tantalum
oxo-ethoxide compound Ta8(μ3-O)2(μ-O)8(μ-OEt)6(OEt)14 (1)
through a sol–gel route in which hydrous ammonia gas was
passed into a solution of tantalum ethoxide in toluene. Ta2O5
powder was obtained when a complete hydrolysis of 1 was
allowed. After calcination the Ta2O5 nanoparticles were
Beilstein J. Nanotechnol. 2014, 5, 1082–1090.
1089
employed for the degradation of the common organic dye
rhodamine B. The rate of degradation of the dye highly depends
on the various parameters such as amount of the catalyst, dye
concentration, pH and calcination temperature.
ExperimentalAll the reactions before the catalyst preparation were carried out
under anhydrous conditions by using Schlenk/vacuum line tech-
niques. Tantalum ethoxide was purchased from Sigma-Aldrich.
Ethanol was dried by standard procedure prior to use. Ammonia
gas was first dried by passing through the columns of silica gel,
fused calcium chloride and aluminum isopropoxide, then it was
passed into the distilled water through a tube with a diameter of
7 mm. 1H NMR spectra were recorded in C6D6 on a Bruker
Biospin ARX spectrometer with TMS as internal reference.
TGA/DTA/DSC was recorded by using a Diamond TG/DTAN
instrument. X-ray diffraction patterns were recorded on
SEIFERT XRD 3003 PTS Diffractometer System, using Cu Kα
radiation. SEM images was obtained on an EVO MA 15 Zeiss
at 15 kV. DLS measurements were carried out on a Nanotrac
particle analyser. The surface area was calculated by applying
the Brunauer–Emmett–Teller (BET) method to N2 adsorption
measurements on a Micromeritics ASAP 2020 instrument. TEM
pictures were taken on a transmission electron microscope
JEOL JEM-1011.
Preparation of 1: Tantalum ethoxide (100 mg) was dissolved in
dry toluene (20 mL). Ammonia gas (passed through 20 mL
distilled water at a rate of 30 bubbles/minute) was bubbled into
the solution at ambient temperature. After 1 h, a white solid pre-
cipitated. The solid was separated, re-dissolved in toluene and
kept at −30 °C for crystallization to yield compound 1 in 45%
yield (35 mg). 1H NMR (25 °C) δ 1.33 (t, CH3), 1.41 (t, CH3),
1.49 (t, CH3), 1.58 (t, CH3), 1.62 (t, CH3), 4.45 (q, CH2), 4.59
(q, CH2), 4.70 (q, CH2), 4.90–5.00, 5.19 (q, CH2), 5.23 (q,
CH2).
Preparation of Ta2O5 nanoparticles: Compound 1 was dissolved
in toluene and ammonia gas was blown into it for 6 h to get a
homogeneous gel. After treating the gel at 80 °C for 3h, a white
solid powder was separated out, which was insoluble in any
organic solvent. The powder was washed with water and
ethanol and dried at 100 °C for 2 h. It was calcined at 750 °C
for 4 h to develop crystallinity.
Photocatalytic activity measurements: Typical amounts
(0.2 mg/mL, 0.5 mg/mL, 0.8 mg/mL and 1.1 mg/mL) of Ta2O5
nanoparticles as photocatalysts were taken in 50 mL of distilled
water and sonicated for 5 min. Then 12.5 ppm of rhodamine B
was added to it. To attain an adsorption–desorption equilibrium
between the dye molecules and the catalyst surface, the solu-
tion was stirred for about 45 min in dark prior to irradiation.
Before exposing to the UV radiation (λ = 365 nm), a 3 mL
aliquot was taken, centrifuged and recorded as the zero time
concentration of the dye. This process was repeated after every
15 min of exposure to UV light for recording the absorption of
the remaining dye.
Supporting InformationSupporting Information File 1CIF data of compound 1.
[http://www.beilstein-journals.org/bjnano/content/
supplementary/2190-4286-5-121-S1.res]
AcknowledgementsSubia Ambreen (SA) acknowledges University Grant Commis-
sion-Maulana Azad National Fellowship (UGC-MANF) for
financial support. SA acknowledges useful discussions about
the photocatalytic process with Mr. Shiv K. Pandey, MNNIT,
Allahabad. Authors are grateful to Dr. Tamal Ghosh, Depart-
ment of Chemistry, MNNIT, Allahabad, for providing UV–vis
absorption facilities to perform the photocatalytic experiment.
Authors also acknowledge the Department of Physics, MNNIT,
Allahabad, for DRS and CIR-MNNIT, Allahabad, for the SEM
facility.
References1. Hubert-Pfalzgraf, L. G. Inorg. Chem. Commun. 2003, 6, 102–120.
doi:10.1016/S1387-7003(02)00664-02. Pollard, K. D.; Puddephatt, R. J. Chem. Mater. 1999, 11, 1069–1074.
doi:10.1021/cm981047a3. Bradley, D. C. Chem. Rev. 1989, 89, 1317–1322.
doi:10.1021/cr00096a0044. Ambreen, S.; Gupta, K.; Singh, S.; Gupta, D. K.; Daniele, S.;
Pandey, N. D.; Pandey, A. Transition Met. Chem. 2013, 38, 835–841.doi:10.1007/s11243-013-9756-y
5. Yanovsky, A. I.; Turova, N. Y.; Korolev, A. V.; Chebukov, D. E.;Pisarevsky, A. P.; Struchkova, Yu. T. Russ. Chem. Bull. 1996, 45,115–121. doi:10.1007/BF01433743
6. Bradley, D. C.; Gaze, R.; Wardlaw, W. J. Chem. Soc. 1957, 469–478.doi:10.1039/jr9570000469
7. Day, V. W.; Eberspacher, T. A.; Klemperer, W. G.; Park, C. W.;Rosenberg, F. S. J. Am. Chem. Soc. 1991, 113, 8190–8192.doi:10.1021/ja00021a068
8. Schmid, R.; Mosset, A.; Galy, J. J. Chem. Soc., Dalton Trans. 1991,1999–2005. doi:10.1039/DT9910001999
9. Abrahams, I.; Bradley, D. C.; Chudzynska, H.; Motevalli, M.;O'Shaughnessy, P. J. Chem. Soc., Dalton Trans. 2000, 2685–2691.doi:10.1039/B001797N
10. Bradley, D. C.; Gaze, R.; Wardlaw, W. J. Chem. Soc. 1955, 721–726.doi:10.1039/jr9550000721
11. Bradley, D. C.; Carter, D. G. Can. J. Chem. 1961, 39, 1434–1443.doi:10.1139/v61-183
Beilstein J. Nanotechnol. 2014, 5, 1082–1090.
1090
12. Bradley, D. C.; Holloway, H. Can. J. Chem. 1962, 40, 1176–1182.doi:10.1139/v62-179
13. Nashed, R.; Hassan, W. M. I.; Ismail, Y.; Allam, N. K.Phys. Chem. Chem. Phys. 2013, 15, 1352–1357.doi:10.1039/c2cp43492j
14. Ezhilvalavan, S.; Tseng, T. Y. J. Mater. Sci.: Mater. Electron. 1999, 10,9–31. doi:10.1023/A:1008970922635
15. Sayama, K.; Arakawa, H. J. Photochem. Photobiol., A: Chem. 1994,77, 243–247. doi:10.1016/1010-6030(94)80049-9
16. Zou, Z.; Ye, J.; Sayama, K.; Arakawa, H. Nature 2001, 414, 625–627.doi:10.1038/414625a
17. Takahara, Y.; Kondo, J. N.; Takata, T.; Lu, D.; Domen, K.Chem. Mater. 2001, 13, 1194–1199. doi:10.1021/cm000572i
18. Kominami, H.; Miyakawa, M.; Murakami, S.; Yasuda, T.; Kohno, M.;Onoue, S.; Kera, Y.; Ohtani, B. Phys. Chem. Chem. Phys. 2001, 3,2697–2703. doi:10.1039/b101313k
19. Murase, T.; Irie, H.; Hashimoto, K. J. Phys. Chem. B 2004, 108,15803–15807. doi:10.1021/jp047874i
20. Yang, X.; Xu, L.; Yu, X.; Li, W.; Li, K.; Huo, M.; Guo, Y.Colloids Surf., A 2008, 320, 61–67. doi:10.1016/j.colsurfa.2008.01.019
21. Sreethawong, T.; Ngamsinlapasathian, S.; Suzuki, Y.; Yoshikawa, S.J. Mol. Catal. A: Chem. 2005, 235, 1–11.doi:10.1016/j.molcata.2005.03.021
22. Gömpel, D.; Tahir, M. N.; Panthöfer, M.; Mugnaioli, E.;Brandscheid, R.; Kolb, U.; Tremel, W. J. Mater. Chem. A 2014, 2,8033–8040. doi:10.1039/C4TA00183D
23. Pandey, A.; Roy, M. K.; Pandey, A.; Zanella, M.; Sperling, R. A.;Parak, W. J.; Samaddar, A. B.; Verma, H. C. IEEE Trans. NanoBiosci.2009, 8, 43–50. doi:10.1109/TNB.2009.2017316
24. Malčić, V. D.; Mikočević, Z. B.; Itrić, K. Tech. Gaz. - Univ. Osijek 2011,18, 117–124.
25. Yang, L.; Kruse, B.; Miklavcic, S. J. J. Opt. Soc. Am. A 2004, 21,1942–1952. doi:10.1364/JOSAA.21.001942
26. Licht, S.; Khaselev, O.; Ramakrishnan, P. A.; Soga, T.; Umeno, M.J. Phys. Chem. B 1998, 102, 2546–2554. doi:10.1021/jp9800564
27. Tauc, J.; Grigorovici, R.; Vancu, A. Phys. Status Solidi 1966, 15,627–637. doi:10.1002/pssb.19660150224
28. Sánchez-Vergara, M. E.; Alonso-Huitron, J. C.; Rodriquez-Gómez, A.;Reider-Burstin, J. N. Molecules 2012, 17, 10000–10013.doi:10.3390/molecules170910000
29. Murphy, A. B. Sol. Energy Mater. Sol. Cells 2007, 91, 1326–1337.doi:10.1016/j.solmat.2007.05.005
30. Yakuphanoglu, F.; Ilican, S.; Caglar, M.; Caglar, Y.J. Optoelectron. Adv. Mater. 2007, 9, 2180–2185.
31. Byrappa, K.; Subramani, A. K.; Ananda, S.; Rai, K. M. L.; Dinesh, R.;Yoshimura, M. Bull. Mater. Sci. 2006, 29, 433–438.doi:10.1007/BF02914073
32. Zhu, Y.; Yu, F.; Man, Y.; Tian, Q.; He, Y.; Wu, N. J. Solid State Chem.2005, 178, 224–229. doi:10.1016/j.jssc.2004.11.015
33. Sehested, J. J. Catal. 2003, 217, 417–426.doi:10.1016/S0021-9517(03)00075-7
License and TermsThis is an Open Access article under the terms of the
Creative Commons Attribution License
(http://creativecommons.org/licenses/by/2.0), which
permits unrestricted use, distribution, and reproduction in
any medium, provided the original work is properly cited.
The license is subject to the Beilstein Journal of
Nanotechnology terms and conditions:
(http://www.beilstein-journals.org/bjnano)
The definitive version of this article is the electronic one
which can be found at:
doi:10.3762/bjnano.5.121

![Diplatinum complexes: Chemoselective reactions of the μ-orthometalated, metal–metal bonded complex [Pt2(μ-o-C6H4PPh2)(μ-PPh2)(PPh3)2] with acids. Crystal structures of [Pt2Cl(μ-PPh2)(PPh3)3],](https://img.pdfslide.net/doc/110x75/6351eff485f87b9f8602a913/diplatinum-complexes-chemoselective-reactions-of-the-m-orthometalated-metalmetal.jpg)
![catena -Poly[[μ 2 -aqua-diaquabis(μ 4 -pyridazine-3,6-dicarboxylato)tetralithium] monohydrate]](https://img.pdfslide.net/doc/110x75/6350dfa6d2282bdce30f6038/catena-polym-2-aqua-diaquabism-4-pyridazine-36-dicarboxylatotetralithium.jpg)


![Poly[[pentaaquabis(μ 3 -hydrogen squarato)barium] monohydrate]](https://img.pdfslide.net/doc/110x75/63559cbf922cbb7c550cb017/polypentaaquabism-3-hydrogen-squaratobarium-monohydrate.jpg)


![catena Poly[[diaquadipyridinezinc(II)]-μ-succinato](https://img.pdfslide.net/doc/110x75/631e9b7805964b686800e70f/catena-polydiaquadipyridinezincii-m-succinato.jpg)

![Poly[[di-μ-aqua-(μ-4-formyl-2-methoxyphenolato)disodium] 4-formyl-2-methoxyphenolate]](https://img.pdfslide.net/doc/110x75/634fd3352630aed50008a289/polydi-m-aqua-m-4-formyl-2-methoxyphenolatodisodium-4-formyl-2-methoxyphenolate.jpg)


![Poly[(μ 2 -nitrato-κ 2 O : O ′)(μ 2 -pyrimidinium-2-carboxylato-κ 2 O : O ′)lithium(I)]](https://img.pdfslide.net/doc/110x75/6350df6eae531ce86203b9aa/polym-2-nitrato-k-2-o-o-m-2-pyrimidinium-2-carboxylato-k-2-o-o.jpg)
