Embed Size (px)
Citation preview
RESEARCH ARTICLE
Characterization of molecular markers indicative
of cervical cancer progression
Hilal Arnouk1, Mark A. Merkley1, Robert H. Podolsky2, Hubert Stöppler1,3,Carlos Santos4, Manuel Álvarez4, Julio Mariategui4, Daron Ferris3,5,Jeffrey R. Lee1, 6 and William S. Dynan1
1 Institute of Molecular Medicine and Genetics, Medical College of Georgia, Augusta, GA, USA2 Center for Biotechnology and Genomic Medicine, Medical College of Georgia, Augusta, GA, USA3 Department of Obstetrics and Gynecology, Medical College of Georgia, Augusta, GA, USA4 Departamento de Ginecología, Instituto de Enfermedades Neoplásicas, Lima, Peru5 Department of Family Medicine, Medical College of Georgia, Augusta, GA, USA6 Department of Pathology, Medical College of Georgia, and Veterans Affairs Medical Center,
Augusta, GA, USA
Cervical cancer originates with human papillomavirus (HPV) infection and progresses via his-tologically defined premalignant stages. Here we compare normal cervical epithelium andpatient-matched high-grade squamous intraepithelial lesions (HSIL) with cervical carcinomatissue from the same patient population (n = 10 per group). Specimens were analyzed by com-bined laser capture microdissection and 2-D DIGE. Significant expression changes were seenwith 53 spots resulting in identification of 23 unique proteins at the molecular level. Theseinclude eight that uniquely distinguish normal epithelium and HSIL and four that uniquelydistinguish HSIL and carcinoma. In addition, one protein, cornulin, distinguishes all threestates. Other identified proteins included differentiation markers, oncogene DJ-1, serpins, stressand interferon-responsive proteins, detoxifying enzymes, and serum transporters. A literaturereview, performed for all identified proteins, allowed most changes to be assigned to one of threecauses: direct or indirect HPV oncoprotein interactions, growth selection during latency, orinteractions in the lesion microenvironment. Selected findings were confirmed by immunohis-tochemistry using either frozen sections from the same cohort or formalin fixed paraffinembedded samples from a tissue microarray. Novel markers described here have potentialapplications for increasing the predictive value of current screening methods.
Received: March 7, 2008Revised: September 29, 2008
Accepted: September 30, 2008
Keywords:
2-D DIGE / Cervical cancer / High-grade squamous intraepithelial lesion (HSIL) / Humanpapillomavirus / Laser capture microdissection
516 Proteomics Clin. Appl. 2009, 3, 516–527
1 Introduction
Cancer of the uterine cervix is a significant cause of mortality,responsible for about 200 000 deaths per year among womenworldwide [1]. Screening for early detection, using the Papa-nicolaou (Pap) test, has reduced mortality about fourfold indeveloped countries [2, 3]. Exfoliated cervical cells are eval-uated based on alterations in nuclear and cellular morphol-ogy using the Bethesda classification system [4].
Correspondence: Dr. William S. Dynan, Institute of MolecularMedicine and Genetics, CB-2803, Medical College of Georgia,1120 15th Street, Augusta, GA 30907, USAE-mail: [email protected]: 11-706-434-6440
Abbreviations: HPV, human papillomavirus; HSIL, high-gradesquamous intraepithelial lesion; LCM, laser capture microdissec-tion; SAM, significance analysis of microarray
DOI 10.1002/prca.200800068
© 2009 WILEY-VCH Verlag GmbH & Co. KGaA, Weinheim www.clinical.proteomics-journal.com

Proteomics Clin. Appl. 2009, 3, 516–527 517
Despite its success in reducing mortality, the Pap test hasshortcomings. Abnormal or ambiguous findings, whichoccur in about 3 million of the 55 million Pap smears per-formed annually in the US, necessitate costly and sometimesinvasive follow-up. The accuracy of the Pap test has beenstudied extensively, and meta-analysis indicates that highspecificity and sensitivity cannot be achieved concurrently[5]. Classification of both Pap smears and follow-up biopsiesis subject to high inter-observer variability, with agreementon grading of biopsy specimens only 40 to 80% more thanexpected by chance alone [6]. In addition, the natural historyof cervical premalignant lesions shows great individualvariability. Some 40-70% of low-grade lesions will regresswithout treatment, whereas smaller percentages will pro-gress to a higher-grade lesion or to invasive cancer [7]. Thedecision to surgically ablate low-grade lesions is particularlyproblematic, as only 1 to 2 women per 1000 progress to inva-sive carcinoma within 24 months, and the procedure itselfcarries risk [8, 9]. Molecular markers to distinguish indi-vidual patients with a high risk of progression wouldclearly be valuable. Such markers might also betherapeutic targets, expanding the options for non-surgicaltreatment.
One approach that has been explored for improving theaccuracy of cervical cancer screening is to test for the pres-ence of high-risk type human papillomavirus (HPV) DNAfollowing an ambiguous Pap test result. The rationale is thathigh-risk type HPV is the initiating agent in virtually all cer-vical carcinomas (reviewed in [10, 11]). In patients withambiguous Pap test results, HPV DNA assays have beenshown to be preferable to repeat cytology [12]. Surrogateprotein markers for HPV infection have also been used,including high-level expression of the cyclin-dependentkinase inhibitor, p16(Ink4a), and the expression of a markerof cell proliferation, Ki-67, in normally non-dividing cells ofthe upper layers of the epithelium [13–15]. A limitation inusing HPV or surrogate markers for diagnosis is that infec-tion with high-risk type HPV is relatively common (pointprevalence = 3.4% [16]) and many infections clear sponta-neously. It would be useful to have a test to detect the transi-tion from infected cells, which proliferate simply in responseto viral oncoprotein expression, and virally transformed cells,which have accumulated additional genetic and epigeneticchanges during a latency period. There are currently noclinically useful molecular markers for detecting this transi-tion. Such markers might be combined with existingscreening technologies to achieve a higher positive predictivevalue.
Proteomic methodologies provide a general route to bio-marker discovery. They have been used previously to com-pare cervical squamous cell carcinoma with normal cervicaltissue or cervical cell lines [17, 18]. There has also been oneproteomic study of the premalignant lesions that are the tar-get of population screening. This study reported a largenumber of differences in exfoliated cervical cells from nor-mal and abnormal liquid cytology-based Pap smears [19].
In the present work, we compared normal tissue, patient-matched high-grade squamous intraepithelial lesions(HSIL), and invasive carcinoma. HSIL is of particular inter-est as it is a high-risk premalignant condition where theprobabilities of progression versus spontaneous regressionare almost evenly balanced [7, 20]. Laser capture micro-dissection (LCM) and 2-D DIGE were used to obtain proteinprofiles from as little as 1 mg of total protein, a procedurevalidated previously where sample abundance was limiting[21–26]. Following quantification and statistical analysis, 53protein spots were identified as discriminatory betweensample groups, with 23 unique proteins identified to date atthe molecular level.
2 Materials and methods
2.1 Experimental design
There were three experimental groups: normal, patient-matched HSIL, and cancer (Fig. 1). Specimens wereobtained from the Instituto Nacional de Enfermedades Neo-plásicas (INEN, Lima, Peru). Patients who had positive Papsmears and were scheduled to undergo gynecologic surgerywere eligible. Following institutional review board guide-lines, subjects were asked to provide informed consent foruse of their tissue in research. Patients with a finding ofHSIL contributed both lesional tissue and normal tissuefrom elsewhere in the cervix. Patients with a finding of inva-sive cancer contributed lesional tissue only (typically, nonormal anatomy remained). Three comparisons were made:(i) cancer vs. normal (unpaired), (ii) HSIL vs. normal (paired),and (iii) cancer vs. HSIL (unpaired). Tissues were snap fro-zen, and epithelial or lesional tissue was later collected byLCM as described [23]. An invariant internal standard wasprepared as a mixture of normal cervical tissue from apatient who underwent transabdominal hysterectomy forsymptomatic leiomyomas and cervical squamous cell carci-noma from a different patient who underwent radical hys-terectomy. Samples and an internal standard were labeledwith different dyes, so the abundance of each spot could bequantified relative to the corresponding spot in the internalstandard [27]. Candidate biomarkers were ranked using theSignificance Analysis of Microarrays (SAM, version 3.0) add-in for Microsoft Excel (available at http://www.stat.stanford.edu/,tibs/SAM/). An FDR of 10% was used asa threshold cutoff for each spot. Details of the analyticalmethodology are given in Supporting Information.
2.2 Preparative gel and MS
Spots of interest were matched to a preparative gel, and pro-teins were identified by MS [23] (see also Supporting Infor-mation). Following trypsin digestion, extracted peptides werespotted onto a 192-well MALDI-TOF target plate for theApplied Biosystems Incorporated (ABI) 4700 Proteomics
© 2009 WILEY-VCH Verlag GmbH & Co. KGaA, Weinheim www.clinical.proteomics-journal.com

518 H. Arnouk et al. Proteomics Clin. Appl. 2009, 3, 516–527
Figure 1. Experimental design and analytical workflow. (A)Experimental design. Specimens were obtained as described inSection 2. Three experimental groups were analyzed. Normaland HSIL samples were patient-matched. Carcinoma samplescame from different patients from whom normal samples wereunavailable. The design permits paired comparison of speci-mens in normal and HSIL groups as indicated, and unpairedcomparison of specimens in the cancer group with specimens inthe other two groups. The order of analysis was randomized topreclude systematic bias. (B) Analytical workflow. Following LCMand 2-D DIGE, data analysis was performed and potential bio-markers were ranked in order of priority as described in the text.A separate preparative gel was run containing Cy3 labeledstandard proteins alone (500 mg), matched to the analytical gel,and candidate biomarkers were excised, digested with trypsin,and analyzed by MALDI TOF/TOF MS for protein identification.
Analyzer. Automated MALDI-TOF MS provided a PMF. Inaddition, for each analysis the 20 most prominent peptides(excluding trypsin peaks) were subjected to collision-induceddissociation to obtain sequence information. Spectra weresearched using the GPS Explorer (ABI) search tool andMASCOT algorithm (Matrix Biosciences) against theNCBInr protein database.
2.3 Immunohistochemistry
Immunohistochemistry was performed using 6-mm replicatefrozen sections from normal, patient-matched HSIL, andcarcinoma samples (n = 3 per group). Slides were air dried,fixed in 10% neutral buffered formalin for 5 min, and rinsedwith distilled water. Endogenous peroxidase was quenched byincubating twice in 0.3% H2O2 for 5 min., then washing twicein PBS for 5 min. Slides were blocked with normal donkeyserum for 20 min, then incubated with the following primary
antibodies for 30 min: 1:100 anti-cornulin (Alexis, San Diego,CA), 1:1000 anti-Hsp27 (HSPB1) (Assay Designs, Ann Arbor,MI), 1:1000 anti-Manganese Superoxide Dismutase 2(Abcam, Cambridge, UK), or 1:100 anti-PA28b (Abnova, Tai-pei, Taiwan). Slides were washed twice with PBS, then withHRP-conjugated goat anti-rabbit immunoglobulin (cornulinand superoxide dismutase), or goat anti-mouse immunoglo-bulin (PA28b and Hsp27) (Envision1 HRP kit, Dako, Car-pinteria, CA.). Slides were rinsed twice with PBS, and boundantibody was detected using diaminobenzidine. Slides werecounterstained with hematoxylin. Scoring was determined bya board-certified pathologist.
Commercial tissue microarrays containing histologicallyconfirmed cervical tissue from a variety of disease states werepurchased from Biomax (Rockville, MD). Each microarraycontained 30 carcinoma specimens, 10 CIN specimens, 10inflamed cervical tissue specimens, and 10 normal specimens.Slides were deparaffinized and run through graded alcohols todistilled water. Slides were pretreated with Target Retrieval So-lution PH 6.0, (Dako) using a steamer (Black and Decker ricesteamer) and rinsed in distilled water. Antibody staining anddevelopment were the same as for the frozen sections.
3 Results
3.1 Collection and analysis of proteomic data
Pilot sections for each specimen were stained with hematox-ylin and eosin to reveal morphological detail. Examples areshown in Fig. 2A. HSIL samples demonstrated .90% in-volvement of the epithelium with high-grade dysplastic cells
Figure 2. Representative histological sections. (A) Histopathol-ogy of HSIL and cancer specimens. Prior to performing LCM,pilot sections were stained with hematoxylin and eosin to screenfor lesional tissue (HSIL, 2006; cancer, 1006). (B) Typical LCMresults. Frozen sections of normal cervical epithelium, high-grade squamous intra-epithelial lesion (HSIL) and cervical squa-mous carcinoma (cancer) were stained with Nuclear Fast Red.Microscopic images before LCM and after LCM are shown alongwith the annealed tissue captured on the cap. Dark circles in thecaptured tissue represent sites of direct laser energy deposition,where the cap polymer annealed to the underlying tissue. Scalebar, 30 mm.
© 2009 WILEY-VCH Verlag GmbH & Co. KGaA, Weinheim www.clinical.proteomics-journal.com

Proteomics Clin. Appl. 2009, 3, 516–527 519
that had not invaded through the basement membrane. Cer-vical cancer samples demonstrated moderately differ-entiated, non-keratinizing squamous cell carcinomas. Allpreparative sections were stained with Nuclear Fast Red forLCM. Figure 2B shows representative sections before andafter LCM, as well as the captured tissue. The more intenselystained epithelial or lesional tissue was collected, leavingbehind the lighter-stained stroma.
We performed a pilot study to evaluate technical repro-ducibility of the combined LCM and 2-D DIGE procedureand enable a power analysis. We carried out independentLCM sampling of normal cervical tissue and cervical cancer,analyzed protein abundance by 2-D DIGE using an invariantinternal standard, and evaluated reproducibility based oncoefficients of variation (Supporting Information Fig. 1). Themedian coefficient of variation was 23% for both normalcervical tissue and cervical cancer. Because the analyticalmethodology is the same, we expect that the distribution ofcoefficients for the HSIL group is the same, although it wasnot possible to perform the same replicate sampling becauseof the small size and scarcity of the lesions.
To estimate statistical power for biomarker discovery, weconsidered a hypothetical marker with a between-group dif-ference of twofold and a CV of 30% for technical variation,both of which were within the observed range. We assumedthat within-group biological variation would be on the sameorder as technical variation and that tests would be con-ducted on the log-scale so that the CV roughly correspondsto the standard deviation of the log-transformed data. Astudy would require 10 subjects per group to obtain 80%power to identify such features using a two-sided alpha of0.05.
For the main analysis, proteins from the 30 samples (n= 10 per group) were extracted, labeled, and analyzed by 2-DDIGE. An average of 2257 spots was identified in each gel,of which an average of 1489 spots was matched to the mas-ter map. Of these, 135 spots were selected for further anal-ysis, based on manual inspection showing unequivocalalignment across spot maps generated from all 30 samples.To prioritize spots for analysis, protein abundance valueswere calculated as described in Section 2 and used as inputdata for Significance Analysis of Microarray (SAM). Foreach of the three comparisons (cancer versus normal, HSILversus normal, and cancer versus HSIL), SAM calculated arelative difference score, d(i), and a false discovery ratebased on analysis of permuted datasets. We applied athreshold value for d score based on a false discovery rate(FDR) of 10% or less and an additional filter to excludespots with an absolute change in expression level of ,two-fold. We reasoned that tissue biomarkers with changes of,twofold might be difficult to measure reliably in a clinicallaboratory (e.g. by immunohistochemistry) and thus wouldbe unlikely to be widely adopted. Application of a filterbased on fold change has been shown to further reduceFDR [28]. Based on these criteria, we identified 53 features(spots) as candidate biomarkers.
3.2 Proteomic patterns in normal, HSIL, and cancer
Based on the SAM analysis, there were 42 spots that dis-tinguished cancer from normal, 23 that distinguishedHSIL from normal, and 9 that distinguished cancer fromHSIL. Some spots were significant in two or more of thesepairwise comparisons (20/53) and one distinguished allthree sample groups. Individual data values for fourrepresentative markers are presented in Figs. 3A-D. Thevertical axis represents the “internal ratio” (IR) of expres-sion for each spot relative to the internal standard in thesame gel. Data are plotted as log2 IR, such that each uniton the vertical axis corresponds to a twofold change.Dashed lines, which connect paired normal and HSILspecimens from the same patient, illustrate how the avail-ability of paired samples reveal consistent expressiontrends that might not otherwise have been apparent. Simi-lar graphs for the other candidate biomarkers are shown inSupporting Information Fig. 2. Viewing group means, inaddition to the individual values, provides additionalinsight. Figure 3A shows an overview of results as a heatmap, with red indicating more expression and green indi-cating less. HSIL has its own, distinctive, pattern ofexpression, with some markers more cancer-like, and oth-ers more normal-like (see Section 4).
Figure 3. Differential expression analysis. (A-D) Graphical repre-sentations of four candidate biomarkers. Graphs display therelative abundance of four proteins differentially expressed be-tween normal, HSIL, and cancer samples. Relative abundancevalues (y-axis) is expressed on a logarithmic scale, with each unitincrement representing a twofold change. Each circle indicatesan individual tissue sample. Patient-matched samples are con-nected by the dashed lines. (E) Heat map. The mean of each of theexperimental groups was calculated and expressed as a heatmap. Green indicates lesser relative abundance, red indicatesgreater (see scale). Arrows denote the candidate biomarkersdetailed in preceding panels.
© 2009 WILEY-VCH Verlag GmbH & Co. KGaA, Weinheim www.clinical.proteomics-journal.com

520 H. Arnouk et al. Proteomics Clin. Appl. 2009, 3, 516–527
3.3 Match to preparative gel and MS analysis
To identify spots at the molecular level, we ran a separatepreparative gel with 500 mg of Cy3-labeled mixed internalstandard, matched the spot map to the master map from theanalytical gels, picked spots of interest, and obtained MSidentifications as described in Section 2. We picked 31 spots,including only those that could be unambiguously matchedbetween the preparative gel and the master map and thatwere well resolved from abundant neighboring spots, andobtained definite identifications for 29. Among these, therewere five instances where nearby, co-regulated spots provedto be the same protein, leaving the 23 unique proteins listedin Table 1. Many of the proteins are known by more than onename; when possible we have used systematic nomenclaturethat reflects identities of proteins as members of gene fami-lies, with synonyms listed only when they are widely used inthe literature. MASCOT scores from PMF and CID weregreater than 80 (60 is the threshold for significance), and allprotein identifications achieved a 100% protein score con-fidence interval. Supporting Information Fig. 3 shows themass spectrum for a candidate biomarker. MS coverage of30% and sequence information from 15 peptides unequi-vocally identified this protein as the differentiation marker,cornulin. Supporting Information Fig. 4 shows the 28 iden-tified spots projected onto an image of a representative 2-Dgel. With one exception noted in the Figure Legend, calcu-lated mass and pI values were consistent with migration.The identified proteins have a diverse set of mass and pIvalues, indicating that the selection criteria for potential bio-markers did not introduce any obvious bias with respect toprotein size or charge.
3.4 Literature review
As a first step in understanding the significance of the find-ings, we performed a literature review to identify relevantgenetic, structural, and biological data for each protein.Relevant citations are summarized in Supporting Informa-tion Table 1. Several of the cytokeratins, two of the detoxify-ing enzymes, HSPB1, and Serpin 3 (SCCA1), have all beenpreviously characterized in the context of cervical cancerdevelopment (see references in Supporting InformationTable 1). About half of the candidate markers, however, hadnot been previously associated with cervical cancer or HSIL.In many cases, biomarker increase and decrease can berationalized in terms of the known effects of HPV E6 and E7oncoproteins, selection for growth advantage during latency,or host-lesion interactions. We consider these general pat-terns in Section 4.
3.5 Validation by immunohistochemical staining
To increase confidence in the 2-D DIGE and MS findings, werandomly selected three specimens from each group in theoriginal cohort and performed immunohistochemistry. We
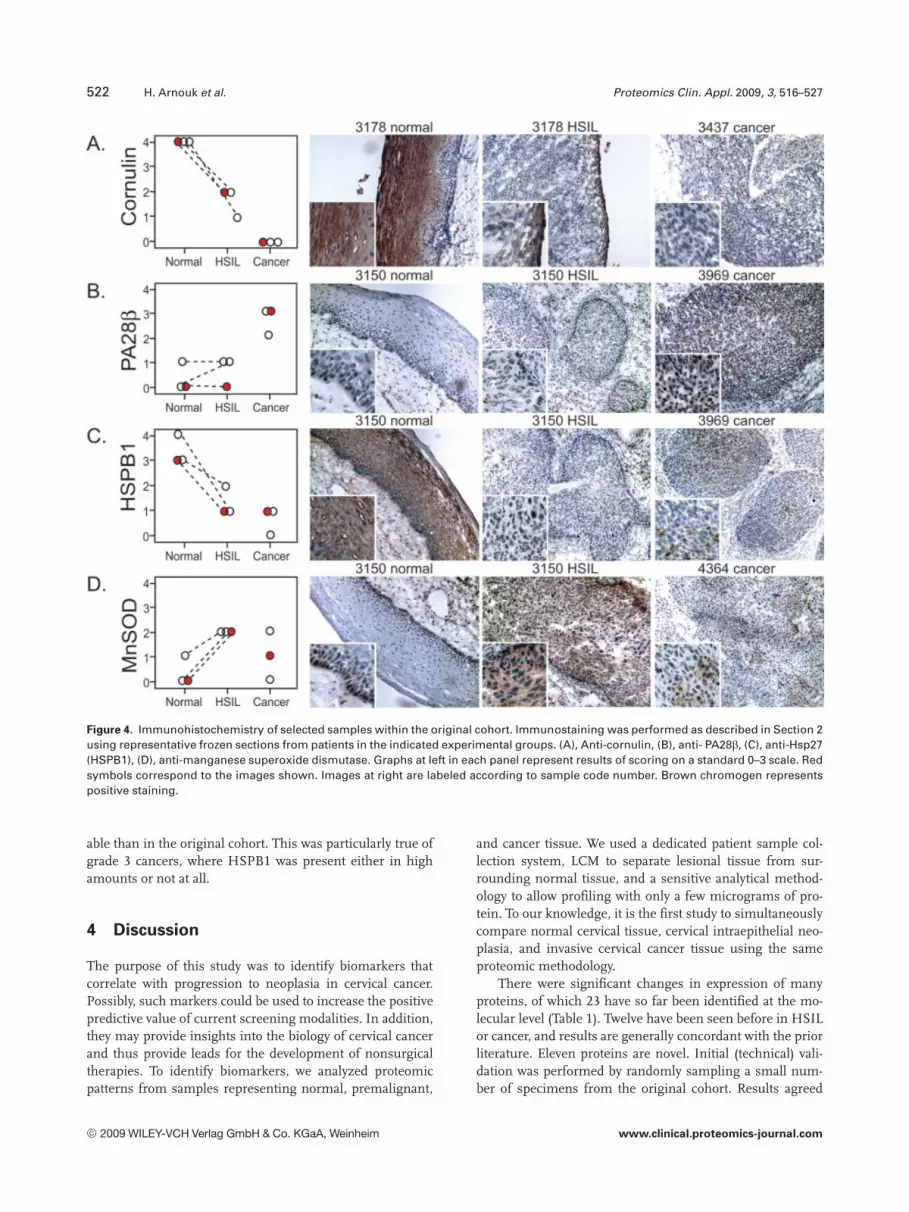
investigated four markers, chosen because of the commercialavailability of antibodies suitable for immunochemistry andbecause the markers were (i) novel in the context of cervicalcancer or (ii) there was a discrepancy between our data andprevious reports. We stained serial sections with antibodiesto cornulin, PA28b, HSPB1 and MnSOD and scored theslides on a standard scale of 0 to 3 based on intensity ofstaining (Fig. 4). Results showed generally good agreementwith the 2-D DIGE quantification (compare Fig. 4 withFig. 3). In panel A, prominent cornulin staining is evident inthe maturing squamous cells of the normal epithelium, inonly a thin rim of non-dysplastic cells representing the out-ermost layer of epithelium in HSIL, and not at all in aninvasive cancer sample. In Panel B, PA28b staining was evi-dent only in cancer, and not in normal or HSIL. In panel C,the pattern of HSPB1 staining was similar to cornulin, withintense staining in the normal epithelium, consistent withreports that this small heat shock protein is a cornificationchaperone [29, 30]. HSPB1 staining was also present, but at alower level in HSIL and cancer (panel C), consistent with aprior immunohistochemical study of HSPB1 expression incervical pre-cancerous lesions and cancer [31]. There wasHSPB1 staining in areas of necrosis in cancer samples (notshown) but necrotic areas were excluded in the LCM proce-dure and thus not represented in the 2-D DIGE sampling.Immunohistochemical staining of MnSOD showed expres-sion in a thin layer of cells along the basal layer of the normalsquamous epithelium, an increase in expression in HSIL,and somewhat of a decline in cancer, again consistent with 2-D DIGE.
To increase statistical power and extend the findings to adifferent cohort of patients, we performed additional immu-nohistochemistry experiments using formalin fixed paraffinembedded tissue microarrrays (Fig. 5). The microarraysinclude more patients (n = 60) and additional experimentalgroups (e.g. benign inflammation and lower grades of cervi-cal intraepithelial neoplasia (CIN)). Tissue microarrays werestained with anti-cornulin or anti- Hsp27 (HSPB1), Stainingintensity was scored on the same 0 to 3 scale. Statisticalanalysis was performed by one-way ANOVA. Differencescontributing to group variance were calculated in pair-wisecomparisons using the Tukey’s Honestly Significant Differ-ence Test.
Anti-cornulin staining (Figs. 5A and C) showed noapparent difference between normal and inflamed tissue,but a highly significant difference between these two groupsand cancer (p ,0.001). The CIN samples had a wide dis-tribution of values centered in between normal and cancer.We attribute the variance to the presence of multiple gradesof CIN in this cohort. Because of the within-group variance,comparisons of CIN to the other groups did not reveal a sta-tistically significant difference.
Anti-HSPB1 staining confirmed that expression of thismolecular chaperone is high in normal epithelium, inflamedtissue, and HSIL, consistent with results obtained with 2-DDIGE. Surprisingly, expression in cancer was far more vari-
© 2009 WILEY-VCH Verlag GmbH & Co. KGaA, Weinheim www.clinical.proteomics-journal.com

Proteomics Clin. Appl. 2009, 3, 516–527 521Ta
ble
1.
Iden
tifi
edp
rote
ins
ran
ked
by
dsc
ore
*
Spot
no.a)
Acce
ssio
nnu
mbe
rPr
otei
nna
me
Mas
s(k
Da)
pIPe
ptid
e(c
over
age)
b)M
asco
tsc
ore
c)Co
mpa
rison
(CN
)d)Ab
s(d
scor
e)e)
FDR
(%)f)
Com
paris
on2
(HN
)Ab
s.(d
scor
e)FD
R(%
)Co
mpa
rison
3(C
H)Ab
s.(d
scor
e)FD
R(%
)
667
Q9UB
G3Co
rnul
in53
5.73
15(3
3%)
143
(7.8
)4.
0-
(3.9
)4.
1-
(2.0
)1.
64.
716
08Q9
UL46
PA28
b27
5.44
8(4
0%)
382
3.6
3.3
-1.
82.
03.
02.
01.
97.
519
26Q9
9497
DJ-1
prot
ein
206.
335
(30%
)83
2.1
2.7
-1.
72.
7-
1.3
2.0
3110
94P6
3261
Actin
405.
5512
(37%
)31
72.
52.
8-
1.4
1.8
3.0
1.8
1.9
7.5
2234
P027
66Tr
anst
hyre
tin13
5.57
9(8
0%)
361
(3.0
)2.
8-
(2.0
)2.
1-
(1.5
)1.
17.
518
09P0
4792
HSPB
122
7.83
9(4
6%)
289
(2.8
)2.
7-
(1.3
)1.
212
(2.2
)2.
00
1586
Q5SR
T3Cl
-in
trace
llula
rch
anne
l126
4.95
7(2
9%)
179
2.3
2.6
-1.
62.
4-
1.4
1.1
20
830
P057
87Cy
toke
ratin
853
5.52
14(3
2%)
141
3.6
2.4
-3.
22.
52-
1.1
0.22
4945
5P0
2787
Tran
sfer
rin55
6.00
7(2
1%)
106
(2.8
)2.
3-
(1.3
)0.
7716
(2.1
)2.
2-
2093
O145
58HS
Pb6
(HSP
20)
165.
955
(38%
)16
2(2
.8)
2.3
-(1
.6)
1.1
9.0
(1.8
)1.
45.
913
06O4
3488
Afla
toxi
nre
duct
ase
406.
708
(30%
)22
7(2
.2)
2.1
-(1
.6)
2.02
-(1
.3)
.76
1923
7P0
8123
a2Ty
peIc
olla
gen
129
9.08
11(1
0%)
175
(2.6
)2.
0-
(1.0
0.08
039
(2.6
)2.
0-
1069
P122
77Cr
eatin
eki
nase
B42
5.34
15(3
0%)
609
2.1
2.0
1.0
1.2
0.71
321.
81.
416
870
P136
46Cy
toke
ratin
1349
4.87
19(3
4%)
514
(4.1
)1.
9-
(2.6
)2.
6-
(1.6
)0.
6123
1912
P092
11GS
Tp
235.
4310
(62%
)12
5(2
.1)
1.6
-(1
.2)
0.56
20(1
.7)
1.4
5.9
1609
Q063
23PA
28a
285.
7814
(54%
)99
2.3
1.6
2.8
(1.3
)0.
6232
1.8
1.0
2320
06P0
4179
Man
gane
seSO
D22
6.86
7(3
7%)
891.
30.
4016
2.3
3.3
-(1
.8)
1.5
4.7
612
Q5TC
J3La
min
A/C
656.
4019
(30%
)80
(1.6
)1.
05.
3(2
.6)
2.6
-1.
61.
219
1141
P307
40Se
rpin
B1(e
last
ase
inhi
bito
r)42
5.90
18(4
4%)
402
(1.2
)1.
31.
9(2
.1)
2.4
-1.
90.
4745
1103
Q8IX
I3Se
rpin
B2(S
CCA1
)44
6.35
16(5
2%)
546
(1.7
)0.
2916
(2.0
)2.
2-
1.2
1.5
1614
64P1
3645
Cyto
kera
tin10
595.
0914
(22%
)12
2(2
.1)
1.3
1.9
(2.1
)2.
1-
(1.0
)0.
044
4975
3P0
2538
Cyto
kera
tin6A
607.
5918
(31%
)27
4(1
.8)
0.88
6.7
(2.5
)1.
81.
61.
40.
5643
801
P233
81Tr
p-tR
NA
synt
heta
se53
6.03
6(3
5%)
235
1.7
0.97
13(1
.4)
0.98
132.
42.
37.
1
a)S
po
tsw
ere
ran
ked
ino
rder
of
dec
reas
ing
abso
lute
valu
eo
fd
sco
reas
det
erm
ined
by
SA
Mal
go
rith
m.D
ark
gre
ysh
adin
gd
eno
tes
up
-reg
ula
tio
nin
the
ind
icat
edco
mp
aris
on
,lig
ht
gre
ysh
adin
gd
eno
tes
do
wn
-reg
ula
tio
n,l
ack
ofs
had
ing
den
ote
sn
ots
ign
ific
ant.
Sp
otn
um
ber
sar
eas
they
app
ear
on
the
mas
ter
anal
ytic
alg
el.P
rote
inac
cess
ion
nu
mb
ers
are
fro
mth
eS
wis
s-P
rot
dat
abas
e.P
red
icte
dp
rote
inm
asse
san
dp
Iare
bas
edo
nco
nce
ptu
altr
ansl
atio
n.
CN
:co
mp
aris
on
of
can
cer
and
no
rmal
.H
N:c
om
par
iso
no
fH
SIL
and
no
rmal
.C
H:
com
par
iso
no
fcan
cer
and
HS
IL.
b)
Nu
mb
ero
fpep
tid
esth
atm
atch
edth
eid
enti
fied
pro
tein
seq
uen
ce,f
ollo
wed
by
per
cen
tseq
uen
ceco
vera
ge.
c)M
AS
CO
Tsc
ore
bas
edo
nco
mb
ined
PM
Fan
dm
asse
so
fCID
pep
tid
esd
)Fo
ldch
ang
ein
exp
ress
ion
.Val
ues
inp
aren
thes
esar
ed
ecre
ases
,oth
erva
lues
are
incr
ease
s.e)
Ab
solu
teva
lue
ofd
(i)f
rom
SA
Mca
lcu
lati
on
.f)
Fals
ed
isco
very
rate
fro
mS
AM
calc
ula
tio
n.
© 2009 WILEY-VCH Verlag GmbH & Co. KGaA, Weinheim www.clinical.proteomics-journal.com
522 H. Arnouk et al. Proteomics Clin. Appl. 2009, 3, 516–527
Figure 4. Immunohistochemistry of selected samples within the original cohort. Immunostaining was performed as described in Section 2using representative frozen sections from patients in the indicated experimental groups. (A), Anti-cornulin, (B), anti- PA28b, (C), anti-Hsp27(HSPB1), (D), anti-manganese superoxide dismutase. Graphs at left in each panel represent results of scoring on a standard 0–3 scale. Redsymbols correspond to the images shown. Images at right are labeled according to sample code number. Brown chromogen representspositive staining.
able than in the original cohort. This was particularly true ofgrade 3 cancers, where HSPB1 was present either in highamounts or not at all.
4 Discussion
The purpose of this study was to identify biomarkers thatcorrelate with progression to neoplasia in cervical cancer.Possibly, such markers could be used to increase the positivepredictive value of current screening modalities. In addition,they may provide insights into the biology of cervical cancerand thus provide leads for the development of nonsurgicaltherapies. To identify biomarkers, we analyzed proteomicpatterns from samples representing normal, premalignant,
and cancer tissue. We used a dedicated patient sample col-lection system, LCM to separate lesional tissue from sur-rounding normal tissue, and a sensitive analytical method-ology to allow profiling with only a few micrograms of pro-tein. To our knowledge, it is the first study to simultaneouslycompare normal cervical tissue, cervical intraepithelial neo-plasia, and invasive cervical cancer tissue using the sameproteomic methodology.
There were significant changes in expression of manyproteins, of which 23 have so far been identified at the mo-lecular level (Table 1). Twelve have been seen before in HSILor cancer, and results are generally concordant with the priorliterature. Eleven proteins are novel. Initial (technical) vali-dation was performed by randomly sampling a small num-ber of specimens from the original cohort. Results agreed
© 2009 WILEY-VCH Verlag GmbH & Co. KGaA, Weinheim www.clinical.proteomics-journal.com

Proteomics Clin. Appl. 2009, 3, 516–527 523
Figure 5. Immunohistochemistry with tissue microarray. Commercial microarray with samples drawn from an independent patient cohort.Scoring was as in Fig. 4. (A, B) Histograms of staining intensity. (C) Representative sections stained with anti-cornulin, demonstratingintense staining in normal and inflamed tissue, moderate staining in CIN, and reduced staining in cancer. (D) Representative sectionsstained with anti-HSPB1, demonstrating intense staining in normal, inflamed, and CIN, and large variance in cancer.
with the 2-D DIGE analysis, lending confidence in the tech-nical quality of the 2-D DIGE and MS data. We also carriedout a more extensive immunohistochemistry study for twoproteins of particular interest, cornulin and HSPB1, whichdrew on a different patient cohort with larger numbers ofspecimens and additional disease states.
The results emphasize the power of using matched patientsamples. In the 2-D DIGE experiments, we identified severalproteins where there was a significant change in expression be-tween individual normal-HSIL pairs, even though the range ofexpression values for the normal and HSIL groups as a wholeoverlapped. These pairings were preserved in the technical vali-dation study using the frozen sections. In the tissue microarrayshowever, samples were not patient-matched. Although thismakes the tissue microarray somewhat less powerful, results(discussed in more detail in the following sections) extended theinitial 2-D DIGE findings.
We focus here on overall patterns apparent in the data. Inprinciple, there are at least three processes that have the
potential to change the proteomic profile during cervicalcancer progression: (i) effects resulting from direct interac-tion of HPV oncoproteins with cellular proteins, (ii) stochas-tic effects resulting from the combination of cell prolifera-tion, genomic instability, and selective pressure during thelatency period that is required for development of HSIL andcancer, and (iii) emergent properties resulting from interac-tions of lesional tissue with the tissue microenvironment.Patterns ascribable to all three processes appear to be presentin the proteomic data.
4.1 Markers that potentially arise from direct
interactions of HPV oncoproteins with cellular
proteins
HPV E6 and E7 bind directly to p53, Rb, and a number ofother cellular proteins (reviewed in [10, 11]). Effects poten-tially attributable to direct interactions of HPV oncoproteinswith these and other cellular proteins account for at least a
© 2009 WILEY-VCH Verlag GmbH & Co. KGaA, Weinheim www.clinical.proteomics-journal.com

524 H. Arnouk et al. Proteomics Clin. Appl. 2009, 3, 516–527
quarter of the changes in the study. Serpin B1, a member of alarge family of serine protease inhibitors, binds directly to E7in a pull-down assay [32]. It is down-regulated in vitro in E7-transfected cells [33], consistent with the down-regulationobserved here in HSIL. GST similarly decreases in E7-trans-fected cells, although it is unknown if this reflects a directprotein-protein interaction [34]. Three other proteins identi-fied in this study are known products of p53 target genes.Creatine kinase B and tryptophanyl tRNA synthetase arep53-repressible enzymes [35, 36] that increased significantlyin cancer. Although expression of these proteins may beinfluenced by factors in addition to p53, the direction of thechanges in expression, in both cases, is consistent with HPVE6-mediated loss of p53 function.
Other identified proteins may be regulated indirectly as aresult of compromised Rb function in E7-expressing cells,which fosters continued proliferation of cells in the upperlayers of squamous epithelium, reducing or blocking termi-nal differentiation and cornification. The differentiationmarker, cornulin, declines in HSIL and further declines incancer. Cornulin is a member of the “fused gene” family,binds calcium, and is up-regulated in response to deoxy-cholate-induced stress [37, 33]. It is normally expressed lateduring epidermal differentiation, but its function is otherwiseunknown, and it has not previously been described as a cervi-cal cancer marker. Cornulin was the only protein that showedstatistically significant differences in all three pairwise 2-DDIGE comparisons. This, taken with the result of the immu-nohistochemistry experiments, suggests that cornulin mightbe uniquely useful as a diagnostic marker of disease state.
Changes in cytokeratin expression can also be ascribed toloss of the differentiated state. Expression of three cytoker-atins (6A, 10, and 13) decreased in HSIL and cancer relativeto normal tissue. These three proteins are known markers ofkeratinocyte differentiation, and the decline is consistentboth with loss of the differentiated state and with previousstudies of cervical cancer [15]. Cytokeratin 8 was increased incancer relative to normal tissue, again consistent with pre-vious work [38].
HSPB1 apparently falls into the same category of differ-entiation markers. The observed decline in cancer specimenswas paradoxical, in that expression of this and other HSP havebeen widely observed to increase in proteomic studies of can-cer cells. Although there are conflicting prior reports aboutexpression in HPV-induced lesions [14, 31, 39], it is believedthat HSPB1 may have a specialized function as a cornificationchaperone, and it is expressed at high levels in the upper levelsof normal stratified epithelium and in in vitro differentiatedkeratinocytes (Fig. 4 and references [29, 39]). We saw relativelyhigh levels in normal cervix, a slight decline in HSIL, and amarked decline in cancer, especially in some specimens. Adecline in expression in less-differentiated lesions plausiblyreflects their inability to undergo terminal differentiation inthe presence of HPV oncoproteins. Consistent with this, inthe tissue microarray, the highest frequency of HSPB1-nega-tive specimens was in the least-differentiated (grade 3)
tumors. It will be of interest to investigate the mechanism ofheterogeneity in high-grade cancers and to determine whe-ther HSPB1 status has independent prognostic or predictivevalue. This will require a separate study, as clinical outcomedata are not available for the subjects used here.
Expression of another small heat shock protein, Hspb6(Hsp20) also declined in HSIL and cancer. We did notobserve any examples of HSP that increased significantly inHSIL or cancer.
4.2 Markers that are potentially selected during the
latency period
Like other human cancers, cervical cancer typically developsonly after a long latency period. Effects attributable to varia-tion and selection for growth advantage are expected to occurstochastically during latency; that is, both the timing andwhether a given change occurs at all will vary betweenpatients. The oncoprotein, DJ-1, may fall into this category.DJ-1 significantly increased in cancer versus normal tissue,whereas expression values in HSIL showed considerabledispersion. DJ-1 transforms mouse NIH3T3 cells in vitro andis overexpressed in many cancers including: breast, lung,pancreatic, ovarian, and prostate [40–44]. Mechanistic stud-ies show that DJ-1 is a negative regulator of the tumor sup-pressor, PTEN [45]. Interestingly, although down-regulationof PTEN expression is a negative prognostic indicator in cer-vical cancer [46, 47], direct mutation or loss of heterozygosityat the PTEN locus is rare [46]. Overexpression of DJ-1 couldprovide a mechanism for down-regulation in the absence ofdirect mutation or loss of the PTEN gene. It is well estab-lished that deficiency of DJ-1 (also known as PARK7) sensi-tizes dopaminergic neurons to stress-mediated apoptosis inhereditary Parkinson’s disease (reviewed in [48]). Regulationof apoptosis appears to be the common link explaining therole of DJ-1 in these disparate diseases. Interestingly,expression of Serpin B1, another biomarker discovered inthis study, has previously been shown to be PTEN dependent[49]. Thus, down-regulation of PTEN in HSIL could provideanother explanation for the observed down regulation ofSerpin B1 (in addition to direct interaction of HPV E7 withSerpin B1).
Several other proteins may fall into the category of pro-teins that are selected during the latency period. Manganesesuperoxide dismutase, which increased in HSIL, protectsagainst free radical toxicity. High expression has previouslybeen correlated with poor outcomes in cervical cancer [50].Serpin B3 (SCCA1) declined in HSIL, and Chloride intracel-lular channel 1 protein increased in cancer; both results arenovel in the context of cervical disease.
4.3 Markers that are potentially influenced by
interaction of lesions with the microenvironment
Three interferon (IFN)-g-inducible proteins were identifiedas up-regulated in cancer. Unlike IFN-a and IFN-b, which
© 2009 WILEY-VCH Verlag GmbH & Co. KGaA, Weinheim www.clinical.proteomics-journal.com

Proteomics Clin. Appl. 2009, 3, 516–527 525
are expressed by many cell types, IFN-g is expressed only byT cells and NK cells. Thus, expression of IFN-g-induciblegenes in cancers cells is expected to occur only as a con-sequence of cell-cell interactions within the tissue micro-environment. Two of the IFN-g-inducible proteins, PA28 aand PA28 b, activate the 20S proteasome complex, whichpresents antigens via the MHC I pathway. Although the up-regulation of these proteins is novel in cervical cancer, up-regulation of PA 28 a has been described previously in infil-trating ductal breast carcinoma [51]. Another IFN-g-induci-ble tryptophanyl protein, tRNA synthetase, has been hypo-thesized to protect cells from tryptophan starvation followingIFN-g-mediated induction of the catabolic enzyme, indolea-mine 2,3 dioxygenase [52].
Other proteins that may fall into the category of changesattributable to host-lesion interactions include the serumtransporter, transthyretin, which was decreased in cancerand HSIL. Transthyretin is a negative acute-phase serumprotein that decreases in inflammatory conditions includingmany cancers [53]. Transferrin, another serum transporterthat decreased in cancer, has been reported to decrease inovarian cancer [54]. The decrease in extracellular matrix pro-tein, a2-type 1 collagen that occurred in HSIL may be an in-direct effect of IFN-g, mediated via stimulation of the IRF-1transcription factor [55].
4.4 Potential for clinical translation
Cervical cancer differs from many other common epithelialcancers in that a successful population screening method(the Pap test) has been widely adopted. Given this success,we assume that molecular biomarkers will be used to aug-ment, rather than replace, the current screening regime.Molecular markers that objectively distinguish low and high-grade lesions have the potential to improve upon classifica-tion based on cell morphology alone. Reducing subjectivityshould increase both positive and negative predictive value.Additionally, biomarkers may reflect molecular progressionnot observable cytologically. Markers that better representdisease progression have the potential to decrease theresources devoted to clinical follow-up and reduce the risk ofovertreatment.
Although proof of clinical utility in these settings is wellbeyond the scope of the present study, several of the proteinsidentified here appear promising. The 2-D DIGE datashowed that cornulin expression differs very significantly innormal and cancer, with intermediate expression in cervicalintraepithelial neoplasia. A similar pattern of results wasseen by immunohistochemistry, both in the initial cohortand in a larger validation cohort. DJ-1 provides anotherexample of a protein that differs significantly in normal andcancer, with intermediate (and variable) levels in pre-neoplasia. Although immunohistochemistry results for DJ-1are not available (staining was inconclusive, possibly becauseof poor quality of the commercial antibody), the biology ofthe protein suggests a possible mechanistic link with carci-
nogenesis. Our results lead to a testable hypothesis thatquantitation of cornulin or DJ-1 levels might be used to pre-dict risk of progression of low-grade lesions. HSPB1 providesan example of a different expression pattern, where levels areuniformly high in normal tissue and HSIL, but vary widelyin cancer. The results support a hypothesis that HSPB1-negative cancers may have a different prognosis or responseto treatment. Testing these hypotheses will require largerpatient cohorts, outcomes data, and further development ofmethods for protein quantification in very small samplesavailable from clinical screening.
We thank Drs. Carlos Santos, Carlos Velarde, and OscarGaldos at the Departamento de Ginecología, Instituto de Enfer-medades Neoplásicas, Lima, Peru, and Dr. Eileen Dickman,Medical College of Georgia, for invaluable assistance in sampleacquisition and selection; Dr. Olga Roberts for contributions tothe design of the experiments to measure technical variation(Supporting Information Fig. 1); and Eric Miller of the MedicalCollege of Georgia proteomics core for data collection.
The authors have declared no conflict of interest.
5 References
[1] Sankaranarayanan, R., Ferlay, J., Worldwide burden ofgynaecological cancer: the size of the problem. Best. Pract.Res. Clin. Obstet. Gynaecol. 2006, 20, 207–225.
[2] Bray, F., Loos, A. H., McCarron, P., Weiderpass, E. et al., Trendsin cervical squamous cell carcinoma incidence in 13 Europe-an countries: changing risk and the effects of screening. Can-cer Epidemiol. Biomarkers Prev. 2005, 14, 677–686.
[3] Landis, S. H., Murray, T., Bolden, S., Wingo, P. A., Cancer sta-tistics, 1999. CA Cancer J. Clin. 1999, 49, 8–31.
[4] Solomon, D., Davey, D., Kurman, R., Moriarty, A. et al., The2001 Bethesda System: terminology for reporting results ofcervical cytology. JAMA 2002, 287, 2114–2119.
[5] Nanda, K., McCrory, D. C., Myers, E. R., Bastian, L. A. et al.,Accuracy of the Papanicolaou test in screening for and fol-low-up of cervical cytologic abnormalities: a systematicreview. Ann. Intern. Med. 2000, 132, 810–819.
[6] Malpica, A., Matisic, J. P., Niekirk, D. V., Crum, C. P. et al.,Kappa statistics to measure interrater and intrarater agree-ment for 1790 cervical biopsy specimens among twelvepathologists: qualitative histopathologic analysis and meth-odologic issues. Gynecol. Oncol. 2005, 99, S38–52.
[7] Cantor, S. B., Atkinson, E. N., Cardenas-Turanzas, M., Bene-det, J. L. et al., Natural history of cervical intraepithelial neo-plasia: a meta-analysis. Acta Cytol. 2005, 49, 405–415.
[8] Sadler, L., Saftlas, A., Wang, W., Exeter, M. et al., Treatmentfor cervical intraepithelial neoplasia and risk of pretermdelivery. JAMA 2004, 291, 2100–2106.
[9] Samson, S. L., Bentley, J. R., Fahey, T. J., McKay, D. J., Gill, G.H., The effect of loop electrosurgical excision procedure onfuture pregnancy outcome. Obstet. Gynecol. 2005, 105, 325–332.
© 2009 WILEY-VCH Verlag GmbH & Co. KGaA, Weinheim www.clinical.proteomics-journal.com
526 H. Arnouk et al. Proteomics Clin. Appl. 2009, 3, 516–527
[10] Doorbar, J., Molecular biology of human papillomavirusinfection and cervical cancer. Clin. Sci. (Lond) 2006, 110,525–541.
[11] Munger, K., Basile, J. R., Duensing, S., Eichten, A. et al.,Biological activities and molecular targets of the humanpapillomavirus E7 oncoprotein. Oncogene 2001, 20, 7888–7898.
[12] Arbyn, M., Buntinx, F., Van Ranst, M., Paraskevaidis, E. et al.,Virologic versus cytologic triage of women with equivocalPap smears: a meta-analysis of the accuracy to detect high-grade intraepithelial neoplasia. J. Natl. Cancer Inst. 2004, 96,280–293.
[13] Kong, C. S., Balzer, B. L., Troxell, M. L., Patterson, B. K.,Longacre, T. A., p16INK4A immunohistochemistry is supe-rior to HPV in situ hybridization for the detection of high-riskHPV in atypical squamous metaplasia. Am. J. Surg. Pathol.2007, 31, 33–43.
[14] El-Ghobashy, A. A., Shaaban, A. M., Innes, J., Prime, W.,Herrington, C. S., Differential expression of cyclin-depend-ent kinase inhibitors and apoptosis-related proteins inendocervical lesions. Eur. J. Cancer 2007, 43, 2011–2018.
[15] Baak, J. P., Kruse, A. J., Robboy, S. J., Janssen, E. A. et al.,Dynamic behavioural interpretation of cervical intraepithe-lial neoplasia with molecular biomarkers. J. Clin. Pathol.2006, 59, 1017–-1028.
[16] Dunne, E. F., Unger, E. R., Sternberg, M., McQuillan, G. et al.,Prevalence of HPV infection among females in the UnitedStates. JAMA 2007, 297, 813–819.
[17] Bae, S. M., Lee, C. H., Cho, Y. L., Nam, K. H. et al., Two-dimensional gel analysis of protein expression profile insquamous cervical cancer patients. Gynecol. Oncol. 2005,99, 26–35.
[18] Choi, Y. P., Kang, S., Hong, S., Xie, X., Cho, N. H., Proteomicanalysis of progressive factors in uterine cervical cancer.Proteomics 2005, 5, 1481–1493.
[19] Gu, Y., Wu, S. L., Meyer, J. L., Hancock, W. S. et al., Prote-omic analysis of high-grade dysplastic cervical cellsobtained from ThinPrep slides using laser capture micro-dissection and mass spectrometry. J. Proteome Res. 2007.
[20] Melnikow, J., Nuovo, J., Willan, A. R., Chan, B. K., Howell, L.P., Natural history of cervical squamous intraepitheliallesions: a meta-analysis. Obstet. Gynecol. 1998, 92, 727–735.
[21] Shaw, J., Rowlinson, R., Nickson, J., Stone, T. et al., Evalua-tion of saturation labelling two-dimensional difference gelelectrophoresis fluorescent dyes. Proteomics 2003, 3, 1181–1195.
[22] Sitek, B., Potthoff, S., Schulenborg, T., Stegbauer, J. et al.,Novel approaches to analyse glomerular proteins fromsmallest scale murine and human samples using DIGEsaturation labelling. Proteomics 2006, 6, 4337–4345.
[23] Greengauz-Roberts, O., Stoppler, H., Nomura, S., Yama-guchi, H. et al., Saturation labeling with cysteine-reactivecyanine fluorescent dyes provides increased sensitivity forprotein expression profiling of laser-microdissected clinicalspecimens. Proteomics 2005, 5, 1746–1757.
[24] Wilson, K. E., Marouga, R., Prime, J. E., Pashby, D. P. et al.,Comparative proteomic analysis using samples obtainedwith laser microdissection and saturation dye labelling.Proteomics 2005, 5, 3851–3858.
[25] Shekouh, A. R., Thompson, C. C., Prime, W., Campbell, F. etal., Application of laser capture microdissection combined
with two-dimensional electrophoresis for the discovery ofdifferentially regulated proteins in pancreatic ductal adeno-carcinoma. Proteomics 2003, 3, 1988–2001.
[26] Seike, M., Kondo, T., Fujii, K., Yamada, T. et al., Proteomicsignature of human cancer cells. Proteomics 2004, 4, 2776–2788.
[27] Alban, A., David, S. O., Bjorkesten, L., Andersson, C. et al., Anovel experimental design for comparative two-dimen-sional gel analysis: two-dimensional difference gel electro-phoresis incorporating a pooled internal standard. Prote-omics 2003, 3, 36–44.
[28] Tusher, V. G., Tibshirani, R., Chu, G., Significance analysis ofmicroarrays applied to the ionizing radiation response. Proc.Natl. Acad. Sci. USA 2001, 98, 5116–5121.
[29] Jonak, C., Klosner, G., Kokesch, C., Födinger, D. et al., Sub-corneal colocalization of the small heat shock protein,hsp27, with keratins and proteins of the cornified cell envel-ope. Br. J. Dermatol. 2002, 147, 13–19.
[30] O’Shaughnessy, R. F., Welti, J. C., Cooke, J. C., Avilion, A. A.et al., AKT-dependent HspB1 (Hsp27) activity in epidermaldifferentiation. J. Biol. Chem. 2007, 282, 17297–17305.
[31] Ciocca, D. R., Lo Castro, G., Alonio, L. V., Cobo, M. F. et al.,Effect of human papillomavirus infection on estrogenreceptor and heat shock protein hsp27 phenotype in humancervix and vagina. Int. J. Gynecol. Pathol. 1992, 11, 113–121.
[32] Lee, K. A., Kang, J. W., Shim, J. H., Kho, C. W. et al., Proteinprofiling and identification of modulators regulated by hu-man papillomavirus 16 E7 oncogene in HaCaT keratinocytesby proteomics. Gynecol. Oncol. 2005, 99, 142–152.
[33] Lee, K. A., Shim, J. H., Kho, C. W., Park, S. G. et al., Proteinprofiling and identification of modulators regulated by theE7 oncogene in the C33A cell line by proteomics and geno-mics. Proteomics 2004, 4, 839–848.
[34] Darragh, J., Hunter, M., Pohler, E., Nelson, L. et al., The cal-cium-binding domain of the stress protein SEP53 is requiredfor survival in response to deoxycholic acid-mediated injury.FEBS J. 2006, 273, 1930–1947.
[35] Rahman-Roblick, R., Roblick, U. J., Hellman, U., Conrotto, P.et al., p53 targets identified by protein expression profiling.Proc. Natl. Acad. Sci. USA 2007, 104, 5401–5406.
[36] Zhao, J., Schmieg, F. I., Simmons, D. T., Molloy, G. R., Mousep53 represses the rat brain creatine kinase gene but acti-vates the rat muscle creatine kinase gene. Mol. Cell. Biol.1994, 14, 8483–8492.
[37] Contzler, R., Favre, B., Huber, M., Hohl, D., Cornulin, a newmember of the “fused gene” family, is expressed duringepidermal differentiation. J. Invest. Dermatol. 2005, 124,990–997.
[38] Manavi, M., Hudelist, G., Fink-Retter, A., Gschwandtler-Kau-lich, D. et al., Gene profiling in Pap-cell smears of high-riskhuman papillomavirus-positive squamous cervical carci-noma. Gynecol. Oncol. 2007, 105, 418–426.
[39] Trautinger, F., Kindas-Mugge, I., Dekrout, B., Knobler, R. M.,Metze, D., Expression of the 27-kDa heat shock protein inhuman epidermis and in epidermal neoplasms: an immu-nohistological study. Br. J. Dermatol. 1995, 133, 194–202.
[40] Nagakubo, D., Taira, T., Kitaura, H., Ikeda, M. et al., DJ-1, anovel oncogene which transforms mouse NIH3T3 cells incooperation with ras. Biochem. Biophys. Res. Commun.1997, 231, 509–513.
© 2009 WILEY-VCH Verlag GmbH & Co. KGaA, Weinheim www.clinical.proteomics-journal.com

Proteomics Clin. Appl. 2009, 3, 516–527 527
[41] Le Naour, F., Misek, D. E., Krause, M. C., Deneux, L. et al.,Proteomics-based identification of RS/DJ-1 as a novel circu-lating tumor antigen in breast cancer. Clin. Cancer Res. 2001,7, 3328–3335.
[42] MacKeigan, J. P., Clements, C. M., Lich, J. D., Pope, R. M. etal., Proteomic profiling drug-induced apoptosis in non-small cell lung carcinoma: identification of RS/DJ-1 andRhoGDIalpha. Cancer Res. 2003, 63, 6928–6934.
[43] Hod, Y., Differential control of apoptosis by DJ-1 in prostatebenign and cancer cells. J. Cell. Biochem. 2004, 92, 1221–1233.
[44] Davidson, B., Hadar, R., Schlossberg, A., Sternlicht, T. et al.,Expression and clinical role of DJ-1, a negative regulator ofPTEN, in ovarian carcinoma. Hum. Pathol. 2008, 39, 87–95.
[45] Kim, R. H., Peters, M., Jang, Y., Shi, W. et al., DJ-1, a novelregulator of the tumor suppressor PTEN. Cancer Cell 2005, 7,263–273.
[46] Cheung, T. H., Lo, K. W., Yim, S. F., Chan, L. K. et al., Epige-netic and genetic alternation of PTEN in cervical neoplasm.Gynecol. Oncol. 2004, 93, 621–627.
[47] Lee, J. S., Choi, Y. D., Lee, J. H., Nam, J. H. et al., Expressionof PTEN in the progression of cervical neoplasia and itsrelation to tumor behavior and angiogenesis in invasivesquamous cell carcinoma. J. Surg. Oncol. 2006, 93, 233–240.
[48] Morris, H. R., Genetics of Parkinson’s disease. Ann. Med.2005, 37, 86–96.
[49] Hong, T. M., Yang, P. C., Peck, K., Chen, J. J. et al., Profilingthe downstream genes of tumor suppressor PTEN in lungcancer cells by complementary DNA microarray. Am. J.Respir. Cell. Mol. Biol. 2000, 23, 355–363.
[50] Nakano, T., Oka, K., Taniguchi, N., Manganese superoxidedismutase expression correlates with p53 status and localrecurrence of cervical carcinoma treated with radiationtherapy. Cancer Res. 1996, 56, 2771–2775.
[51] Somiari, R. I., Sullivan, A., Russell, S., Somiari, S. et al.,High-throughput proteomic analysis of human infiltratingductal carcinoma of the breast. Proteomics 2003, 3, 1863–1873.
[52] Boasso, A., Herbeuval, J. P., Hardy, A. W., Winkler, C.,Shearer, G. M., Regulation of indoleamine 2,3-dioxygenaseand tryptophanyl-tRNA-synthetase by CTLA-4-Fc in humanCD41 T cells. Blood 2005, 105, 1574–1581.
[53] Gabay, C., Kushner, I., Acute-phase proteins and other sys-temic responses to inflammation. N. Engl. J. Med. 1999, 340,448–454.
[54] Kozak, K. R., Su, F., Whitelegge, J. P., Faull, K. et al., Charac-terization of serum biomarkers for detection of early stageovarian cancer. Proteomics 2005, 5, 4589–4596.
[55] Tanaka, S., Ramirez, F., The first intron of the humanalpha2(I) collagen gene (COL1A2) contains a novel inter-feron-gamma responsive element. Matrix Biol. 2007, 26,185–189.
© 2009 WILEY-VCH Verlag GmbH & Co. KGaA, Weinheim www.clinical.proteomics-journal.com