Embed Size (px)
Citation preview
Characterization of Multilocus Linkage Disequilibrium
Alessandro Rinaldo,1 Silviu-Alin Bacanu,2 B. Devlin,2 Vibhor Sonpar,2 Larry Wasserman,1
and Kathryn Roeder1n
1Department of Statistics, Carnegie Mellon University, Pittsburgh, Pennsylvania2Department of Psychiatry, University of Pittsburgh, Pittsburgh, Pennsylvania
Linkage disequilibrium (LD) in the human genome, often measured as pairwise correlation between adjacent markers, showssubstantial spatial heterogeneity. Congruent with these results, studies have found that certain regions of the genome havefar less haplotype diversity than expected if the alleles at multiple markers were independent, while other sets of adjacentmarkers behave almost independently. Regions with limited haplotype diversity have been described as ‘‘blocked’’ or‘‘haplotype blocks.’’ In this article, we propose a new method that aims to distinguish between blocked and unblockedregions in the genome. Like some other approaches, the method analyses haplotype diversity. Unlike other methods, itallows for adjacent, distinct blocks and also multiple, independent single nucleotide polymorphisms (SNPs) separatingblocks. Based on an approximate likelihood model and a parsimony criterion to penalize for model complexity, the methodpartitions a genomic region into blocks relatively quickly, and simulations suggest that its partitions are accurate. We alsopropose a new, efficient method to select SNPs for association analysis, namely tag SNPs. These methods compare favorablyto similar blocking and tagging methods using simulations. Genet. Epidemiol. 28:193–206, 2005. & 2005 Wiley-Liss, Inc.
Key words: ancestry; haplotype block; information theory; model selection; tag SNP
Contract grant sponsor: NIH; Contract grant number: MH057881.nCorrespondence to: Kathryn Roeder, Department of Statistics, Carnegie Mellon University, 5000 Forbes Avenue, Pittsburgh, PA 15213.E-mail: [email protected] 25 June 2004; Accepted 3 October 2004Published online 6 January 2005 in Wiley InterScience (www.interscience.wiley.com)DOI: 10.1002/gepi.20056
INTRODUCTION
Recent studies of linkage disequilibrium (LD) inhuman genome [Daly et al., 2001; Reich et al.,2001; Patil et al., 2001; Abecasis et al., 2001; Gabrielet al., 2002; Clark et al., 2003; McVean et al., 2004]have demonstrated definitively what earlier stu-dies seemed to suggest [Jorde, 1995, 2000], that thestructure of LD in the genome is highly idiosyn-cratic. Alleles at polymorphisms separated by aslittle as a few base pairs can exhibit complete LDor none at all, and this is true regardless of thepopulation examined [Crawford et al., 2004].When multilocus LD is computed in terms ofhaplotype distributions, LD is also unpredictable.Certain genomic regions show a diversity ofhaplotypes close to that expected if alleles atproximate loci were independent, while othersshow a striking dearth of haplotypes (i.e., highLD). Regions of high LD have been dubbedhaplotype blocks. Unfortunately, because LD canbe defined in many ways, and because LD is itselfthe result of stochastic processes, the meaning and
extent of blocks depend on how we define them[Cardon and Abecasis, 2003].Given the complexity of human evolution,
including migration, gene flow, bottlenecks, andselection, it is unsurprising that the extent ofhaplotype blocks varies among populations. Forexample, haplotype blocks appear to be muchmore extensive in peoples of European ancestrythan they are in peoples of African origin. Theorigin of haplotype blocks, in general, is unclear.They could arise as the result of hot and cold spotsof recombination in the genome. Indeed, thatappears to explain the LD structure of the HLAregion on chromosome 6p [Jeffreys et al., 2001,McVean et al., 2004], and other well-studiedregions of the genome [Lien et al., 2000; Mayet al., 2002; Schneider et al., 2002]. On the otherhand, it is well known that strictly randomprocesses can generate clumping, and so randomprocesses have been evoked to explain observedblocks [Phillips et al., 2003]. The truth must liesomewhere in between [McVean et al., 2004]. Data
Genetic Epidemiology 28: 193–206 (2005)
& 2005 Wiley-Liss, Inc.
from the HapMap [Gibbs et al., 2003] projectshould lend more insight into their origin.Clearly, local patterns of LD in the genome can
tell us much about evolution. Patterns of LD arealso useful for deciphering the etiology of complexdisease via association studies. It has long beennoted that the level of LD in a candidate gene helpsto determine the density of genetic markersrequired to detect association between a liabilityallele (LA) and phenotype. More recently, it hasbecome apparent that strong irregularities in thesepatterns play a key role in the choice of whichsingle nucleotide polymorphisms (SNPs) to geno-type [Meng et al., 2003]. Within a haplotype block,the correlation between neighboring SNPs may besufficiently high to ensure that one or two ‘‘tagSNPs’’ describe the common haplotypes over asubstantial region. Alternatively, in other regions,neighboring SNPs may be essentially uncorrelatedand thus careful study of the region requiresgenotyping of nearly all the SNPs in these intervals.Even the position of a LA within the correlationstructure of a region can help to determine theoptimal method of data analysis [e.g., Roeder et al.,2005]. For instance, if the LA is located within ahaplotype block, methods that exploit the patternof the signal within a block can be more powerfulthan others that ignore the spatial pattern of themarkers. Alternatively, methods that target spatialsignals fare poorly if the LA occurs within arecombination hotspot. Clearly, statistical methodsthat explain the local pattern of LD and carefullyselect tag SNPs are critical to successful studies ofgenetic epidemiology.
BLOCKING METHODS
Numerous methods for finding haplotypeblocks have been proposed thus far. Thesemethods can be loosely classified based upontheir objective. (1) Methods designed to minimizehaplotype diversity within a block. These includethe method of Zhang et al. [2002a], which is basedon minimizing a measure of haplotype diversity,and the method of Patil et al. [2001], whichchooses blocks with an aim to limit the numberof so-called haplotype tagging SNPs (htSNPs)[Johnson et al., 2001] required to identify the mostcommonly observed haplotypes in a sample.These two methods differ in their implementa-tions: a greedy algorithm [Patil et al., 2001] versusa dynamic programming algorithm [Zhang et al.,2002a, 2004]. (2) Methods designed to locaterecombinational hotspots, such as the method
devised by Wang et al. [2002], which uses anadaptation of the four-gamete-test (FGT) [Hudsonand Kaplan, 1985]. Also in this category are themethods based on the minimum-description-length principle [Anderson and Novembre, 2003;Koivisto et al., 2003]. This principle, while oftenexplained in terms of coding theory, is essentiallyequivalent to a model selection method, such asthe Aikake Information criterion (AIC) and theBayesian Information criterion (BIC) [Rissanen,1989]. These approaches seek a model for the datathat maximizes the likelihood of the data, subjectto a penalty for model complexity. (3) Methodsdesigned to locate only those blocks with suffi-cient LD to be almost irrefutable. This includes themethod of Gabriel et al. [2002], which assesses thestrength of the pairwise LD of all loci within aproposed block.Gabriel et al.’s [2002] approach seems true to
nature in the sense that they aim to find blocks insome regions of the genome but no blocks inothers, and that the unblocked portion of thegenome can be substantial. Their results arecorroborated by Wall and Pritchard [2003] andMcVean et al. [2004]. By comparing simulated dataand existing SNP samples, Wall and Pritchard[2003] conclude that the recombination rateheterogeneity must be extremely pronounced toproduce realistic data, and a substantial portion ofthe genome is not contained in blocks. This iscontrary to most haplotype blocking routines,many of which assume that all sequence shouldbe assigned to a block. On the other hand, themethod of Gabriel et al. [2002] depends onconfidence intervals for pairwise LD and is,therefore, inherently highly dependent on thesample size. With greater sample sizes, theprecision of the confidence intervals will increase,more pairs of markers will be in ‘‘strong LD’’ orwill exhibit ‘‘historical evidence of recombina-tion,’’ and consequently the coverage of sequencein blocks can change, possibly substantially basedupon the sample size. For small sample sizes,confidence intervals can be quite wide andconsequently very few pairwise comparisons willbe categorized definitively.In this article, we propose a new haplotype
blocking method, called EB for Entropy Blocker,that aims to identify only those blocks that exhibitsubstantial multilocus disequilibrium and rangeover a greater number of SNPs. In addition,although discovered blocks may be physicallyadjacent, EB allows for one or more SNPsseparating blocks. For this reason, EB can be
Rinaldo et al.194
classified in category (3), like that of Gabriel et al.[2002]. As a statistical procedure, however, EB ismost similar to the minimum-description blockingprocedure (MDB) of Anderson and Novembre[2003]. Like the MDB approach, we evaluate amodel by computing the likelihood of the data,minus a penalty for model complexity. The bestmodels are defined as those that describe the datawell, but require few parameters to do so. Inparticular, a model is favored if it selects ablocking structure that satisfies both of the usualcriterion for blocks: the resulting blocks have verylow diversity and the LD with SNPs outside theblock is low. By design, this method is likely toperform well for modest sized samples. For thisreason, we see it as a complement to the Gabrielet al. [2002] method.
TAGGING METHODS
To avoid genotyping all the SNPs in a region,several approaches have been developed forselecting a subset of highly informative SNPs.These are often called haplotype tagging SNPs(htSNPs). A good set of htSNPs aims to predict theexisting haplotypes in the region [Zhang et al.,2002a; Ackerman et al., 2003; Ke and Cardon,2003; Meng et al., 2003; Sebastiani et al., 2003].Several approaches appeared almost simulta-neously with algorithms directed at this purpose.Chapman et al. [2003] and Stram et al. [2003]independently proposed methods to assess thecoefficient of determination, or R2, for predictingan individuals1 pair of haplotypes from themultilocus genotypes of the htSNPs assessed. Astepwise selection technique is suggested forselecting the htSNPs that achieve a preset R2
across the region under investigation with aminimum of SNPs. While the motivation for theseapproaches is commendable, the algorithm isquite sensitive to the level of correlation in thegene and other features.Rather than choosing the SNPs to predict
haplotypes, the goal might be to choose a subsetof tag SNPs that successfully predict unmeasuredSNPs. Carlson et al. [2004] developed a simplealgorithm based on the r2 measure of LD [Devlinand Risch, 1995]. Their algorithm ensures that forany SNP not measured there exists a SNP in thetag SNP set that has an r2 of at least a preset valueZ. Although this method performs quite well, itdoes have one shortcoming. It requires theimputation of haplotype phase for each pair ofSNPs in the region to compute r2. We developan alternative based on hierarchical clustering
procedures, which we call H-clust. This simplemethod can be implemented with standardstatistical software, and does not require haplo-types. By comparing the H-clust method to the r2
method of Carlson et al. using simulations, weshow that the two are virtually indistinguishableeven though H-clust analyses genotype data andthe r2 method is based on known haplotypes (i.e.,no haplotype uncertainty).
METHODS
DESCRIPTIVE TOOLS
Let S be the number of SNPs in the genomicregion of interest. Each SNP is modeled as aBernoulli random variable for which pi � 0:5denotes the probability of observing the majorallele and 1� pi is the probability of observing theminor allele in the i’th SNP. The correspondinghaplotype is an S-dimensional binary randomvector. The haplotypes encode the joint distribu-tion of the SNPs.Pairwise LD measures such as r2 or jrj [Devlin
and Risch, 1995] are frequently displayed in amatrix to illustrate multilocus LD structure.Although such a representation is useful, it cannotdirectly capture the full multilocus associations ofa genomic region. Nothnagel et al. [2003] sug-gested that higher level association can becaptured by the entropy of the relative frequenciesof the multilocus haplotypes. (Consistent withstatistical usage, we will call this set of relativefrequencies the ‘‘haplotype distribution.’’) Theintuition is as follows: when the haplotypedistribution for a set of consecutive SNPs haslow entropy, it is usually deviating substantiallyfrom randomness and hence the set of SNPs likelycomprise a block.To discover block structure, we investigate sets
of m � S consecutive SNPs. A haplotype consist-ing of m SNPs can potentially take on 2m forms.For notational simplicity, we define T � 2m, wherem is implicitly understood. For any haplotypedistribution consisting of m SNPs taking on h ¼1; . . . ;T distinct forms with probabilities q1; . . . ; qT,the entropy is defined as H ¼ �
PTh¼1 qh log2ðqhÞ.
Under the assumption of linkage equilibrium, theentropy HE is computed using the equilibrium
haplotype frequencies, qh ¼Qm
j¼1 pIj
h
j ð1� pjÞ1�Ij
h ,where I
jh is an indicator function that assumes
the value 1 if in the haplotype indexed by h thej-th SNP exhibits its common type and 0 other-wise. The standardized entropy is computed as
Characterization of Linkage Disequilibrium 195
E ¼ HE�HHE
. This measure varies from zero, forperfect equilibrium, to close to ðm� 1Þ=m, for ahaplotype block consisting largely of a single
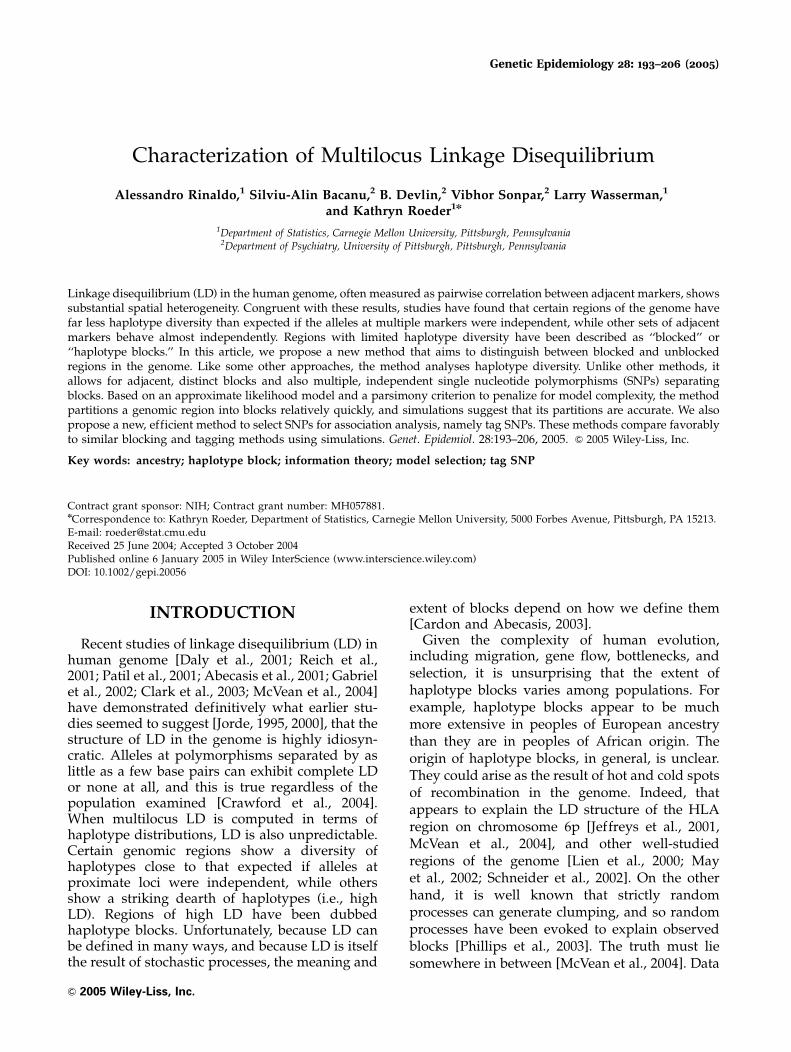
haplotype. Heuristically, the measure can be usedto detect genomic regions with unusually lowentropy, as follows: (1) Compute E for blocks
Fig. 1. Standardized Entropy and pairwise LD (jrj) for two genes from the SeattleSNP database: IL21R, the interleukin 21 receptor (a,b),
and JAK3, Janus kinase 3 (c,d). Red and blue bars in the entropy plots indicate haplotype blocks, and black bars indicate unblocked
SNPs. The absolute value of the pairwise correlation (jrj) between SNPs is depicted with a color gradient: white/yellow is high and redis low.
Rinaldo et al.196
consisting of m adjacent SNPs. (2) Plot E for amoving window across the gene (Fig. 1a,c). At theboundaries of the genotyped regions, the entropyis computed using a smaller window. (3) Searchfor regions for which E is closer to 1. These identifySNPs that possess high multivariate correlationand are more likely to be part of a block.
MODEL SELECTION
Figure 1 provides a heuristic way of locatingpotential haplotype blocks. Still we need a methodfor comparing competing partitions of the SNPsinto blocked and non-blocked regions. The pro-posed EB algorithm is based on a working modelthat treats blocks as mutually independent andallows for sequences of independent SNPs. Parti-tions of the sequence into blocked and unblockedregions are considered as descriptive models ofthe genomic region. The favored partition isselected using an AIC model selection procedurethat attempts to balance the competing criterion ofmodel fit and parsimony [Rissanen, 1989]. Inreality, SNPs in unblocked regions are seldomindependent. Indeed, they often possess a notablelevel of correlation; however, the strength ofcorrelation in unblocked regions it typically farlower than that observed in the blocked regions.Consequently, although the working model is anoversimplification of reality, it provides an effec-tive, parsimonious approximation to reality thatallows us to discover the principal block structurein the region.Formally, let N be the number of sampled
haplotypes and S be the number of SNPs, indexedin increasing order according to their positions inthe genomic region. The frequency of haplotypesof each possible kind form a T-dimensionalrandom vector z ¼ ðz1; . . . ; zTÞ, which is assumedto follow a Multinomial distribution with logprobability mass function:
log fðz1; . . . ; zTÞ ¼ logN!
z1!:::zT!
� �
þXTh¼1
zh log qh: ð1Þ
For a given partition P of f1; . . . ; Sg, let I �f1; ::::; Sg be the set containing the indexes for theSNPs assumed to be mutually independent and Mbe the number of disjoint blocks in the partition P.Each block can be identified by a consecutiveindex set bl such that bl � f1; . . . ; Sg � I andbl \ br ¼ ;, l; r ¼ 1; . . . ;M. Clearly, f1; . . . ; Sg ¼
I [ ðSM
l¼1 blÞ. The blocks bl are assumed to bemutually independent and independent from theSNPs in the set I. Therefore, the probability of eachpossible haplotype sequence h, h ¼ 1; . . . ;T, isequal to
qh ¼Yi2I
pIih
i ð1� piÞ1�Iih
YMl¼1
pblh ; ð2Þ
in which pblh is the probability of observinghaplotype h in the subregion bl. In reality themultinomial in (1) is often extremely sparse andzh ¼ 0 for all but k categories. Consequently, wereduce z to ðz1; z2; . . . ; zkÞ, where k is the number ofcategories with count of at least one.If haplotypes are measured directly, then calcu-
lation of the AIC requires only an estimate of theparameters in the probability model and a penaltyfor model dimension. These can be computed asfollows. (1) Let jAj denote the cardinality of a setA. Within each block bl, the number of distinct,observed haplotypes is jblj ¼ kl � k. (2) The para-meters y in the likelihood model are fpig for i 2 Iand fpblh g for h ¼ 1; . . . ; kl and l ¼ 1; . . . ;M. (3) Letxi be the sample frequency of the common allelefor SNP i. The maximum likelihood estimator(MLE) for pi, i 2 I, is ppi ¼ xi=N. (4) Let xblh be thesample frequency of haplotypes of type h in block
bl. The MLE for pblh is ppblh ¼ xblh =N. (5) Because thevalues of k and ðz1; . . . ; zkÞ do not depend on thespecific partition P, but on the whole region ofinterest, the term N!=z1!:::zk! in (1) is constantacross partitions and does not enter into thecalculation of the AIC. (6) From (1) and (2), itfollows that the log-likelihood LðyyÞ, evaluated atthe MLE of the parameters in the likelihoodmodel, equals
Ph zh log qqh. This quantity can be
re-expressed as a function of the sufficientstatistics for the model, fxig and fxblh g:
LðyyÞ ¼Xi2I
½xi logðppiÞ þ ðN � xiÞ logð1� ppiÞ�
þXMl¼1
Xklh¼1
xblh logðppblh Þ" #
:
The AIC formula for a model with d-dimen-sional parameter space is: �2LðyyÞ þ 2d. For agiven partition, the dimension of the model, d, isestimated as: d ¼ jIj þ
PMl¼1 ½2ðkl�1Þ � 1�. This data
dependent estimate of model dimension is moti-vated below. For any given partition, the AIC ofthe corresponding model is computed and themodel with minimal AIC is retained.
Characterization of Linkage Disequilibrium 197
Typically genotypes, not haplotypes, are mea-sured. Although it would be ideal to have agenotype-based blocking algorithm, it is possibleto utilize the haplotype-based method with somemodifications. Note that the input for the EBalgorithm is the frequency of haplotypes, ratherthan the particular phase for indiviual genotypes.The former quantity can be estimated much morereliably than the latter. For example, the haplotypefrequencies (pblh ) can be estimated with an algo-rithm such as PHASE [Stephens et al., 2001,Stephens and Donnelly, 2003] or HAPLOTYPER[Niu et al., 2002]. It is not difficult to infer thehaplotype frequencies within a block becausethere is limited haplotype diversity. Outside theblocks, the haplotypes are more challenging toestimate, but the EB algorithm will still functionwell because it is robust to some errors in thehaplotype frequencies when the true state ofnature is unblocked. Provided the algorithm infersthat there are a large number of distinct haplo-types present in this region, then the region will beproperly classified.If genotypes, not haplotypes, are measured,
then we modify the EB algorithm as follows. Weapproximate the haplotype count, xblh , by using theestimated haplotype frequencies Nppblh . A compli-cation occurs when estimating k. Many algorithmsdesigned to estimate haplotype frequencies assignsmall probabilities to numerous haplotype cate-gories that are consistent with the observations,but the haplotypes do not exist in the sample. Tohandle this problem, we suggest trimming thecount to those haplotypes that account for thebulk of the probability mass in the estimatedhaplotype distribution, say 95%. For instance,Daly et al. [2001] support the haplotype blocksin their sample by illustrating the number ofdistinct haplotype forms necessary to obtainapproximately 90% of the observations in eachblock [see also Patil et al., 2001].
MEASURE OF MODEL COMPLEXITY IN THEAIC
The parameter d in the AIC formula measuresmodel complexity and is crucial to obtain mean-ingful results. If the penalty for model complexitydescribing the blocks is too harsh, then thealgorithm will not include any blocks. Likewise,if the penalty is too lenient, then the algorithm willchoose a single inclusive block. Traditionally, forthe two major approaches to model selection, AICand BIC, the penalty is a function of the dimen-
sion of the parameter space. Statistically, thedimension of a multinomial on f0; 1gm is 2m � 1,which is typically much greater than N. Further-more, given the strength of the LD between SNPswithin a block, the full model space is unlikely tobe realized even if N ! 1. Therefore, a different,biologically relevant, description of the modeldimension is required. Ideally, the model dimen-sion should reflect a priori knowledge about thenature of the evolution of haplotypes in thepopulation.The proposed specification relates d to kl via an
evolutionay argument. The dimension is chosen tobe the minimal number of mutations or branchesin an evolutionary tree required to produce asample of kl haplotypes in the absence ofrecombination. Next, because the polymorphismsare binary, 2ðkl�1Þ � 1 is a natural measure of thedimension of the resulting multinomial for theblock. For the actual observed data, the requirednumber of branches and mutations could behigher, or lower, with recombination. We estimatethe dimension of the model using only the countof distinct haplotype forms.
HEURISTIC FOR HOW THE BLOCKINGALGORITHM WORKS
To understand how EB discovers block struc-ture, consider splitting the last SNP from a blockcalled A and add this SNP to the set of singletonSNPs. If this split does not collapse any of theexisting categories in A, then the log likelihoodadds a term of the form x log ppþ ðN � xÞ logð1�ppÞ and d increases by one. Consequently, the AICscore for this model is higher than the originalmodel and the block will not be split. On the otherhand, if the SNP at the contested position isapproximately independent of the SNPs withinblock A, then it is likely that one or morecategories will collapse causing an overall de-crease in the AIC. Specifically, for a collapse ofcategories (j; j0), terms like ðxAj þ xAj0 Þ logðpAj þpAj0 Þ replace terms like xAj log pAj þ xAj0 log pAj0 ,causing an increase in the likelihood for the block.This increase is counterbalanced by the decreasein likelihood introduced by the new term for theSNP of the form x log ppþ ðN � xÞ logð1� ppÞ. Over-all, the likelihood will either be unchanged, ormore likely decrease. Overall, the AIC tends todecrease because the dimension of the model willdecrease if one or more categories are combined.This heuristic explains why introducing a neces-sary split will decrease the AIC score. Overall, this
Rinaldo et al.198
suggests that an AIC criterion will identify the keyblock structure, provided the working model isapproximately correct.Another difficulty is how to approach this
massive computational problem. It is clearly notpossible to examine all possible block solutions. Tovisualize the data, we compute the standardizedentropy of consecutive sets of 5 SNPs and plot thisquantity versus the physical location of the centralmarker in the window. The peaks in the plotindicate the location and length of blocks. Thedips are suggestive of areas of historical recombi-nation (Fig. 1).The number of ways of partitioning the region
of interest into blocks and singleton SNPs growsextremely fast as the dimension S of the region ofinterest increases. The complexity of the searchingprocedure was reduced by designing a greedyiterative algorithm that searches only for parti-tions corresponding to regions with high standar-dized entropy. See the Appendix for details on theimplementation of the algorithm.
TAGGING
Because SNPs in a block are highly correlated,complete genotyping of all SNPs in a gene is oftennot practical. For a thorough analysis of thevariation in a gene and its potential effects on aphenotype, one would want to genotype a subsetof the highly correlated SNPs and all SNPs thatare only weakly correlated with other SNPs. Wedescribe how a simple clustering method can beused to rapidly identify the desired set of tagSNPs.Clustering methods partition observed data into
more homogeneous classes. Consequently, theyhave great potential as a tag SNP selection tool.Clustering methods can be applied directly togenotype data or they can be applied to linkagedisequilibrium (LD) matrices derived by estimat-ing the haplotype structure of the sample. Becauseestimating haplotype frequencies can be laboriousand error prone, especially for a large number ofSNPs, we favor selecting SNPs directly from thegenotype data. Moreover, the clustering approachyields essentially the same set of SNPs as methodsthat use the haplotype structure. By basing theclustering methods on the squared correlationmatrix of the genotype data, haplotype estimationcan be eliminated and the process of selectingSNPs becomes near-instantaneous.The proposed method, H-clust, consists of two
stages. The first stage uses hierarchical clustering
to determine the clusters. In the second stage, foreach cluster, the method chooses the SNP mostcorrelated with all the other SNPs in the cluster asthe tag SNP for that cluster. Code the genotypes as0, 1, 2 to denote the number of copies of aparticular variant. Let X be the coded genotypematrix for the sample of multilocus genotypes,and let S be the squared correlation matrixassociated with X. Each entry in the matrix isthe square of Pearson’s correlation coefficientbetween allele counts at pairs of SNPs. It isworth noting that the numerator of this correlationmeasure is identical to the disequilibriumcoefficient proposed by Weir [1979] andrecently studied by Schaid [2004] and Zaykin[2004].H-clust uses hierarchical clustering based on a
dissimilarity matrix D ¼ 1� S. Hierarchical clus-tering can be represented as a dendogram inwhich any two SNP groups diverge at a heightthat is a function of the dissimilarity betweenmembers of the two groups. The clusters areobtained by declaring SNPs to be in the samecluster when they are found in the same sub-treebelow a preset value, say 1� Z. Due to therelationship between height of divergence andthe squared correlation between observations, thecut-off value Z ensures that a minimum level ofpairwise correlation exists between each unmea-sured SNP and at least one tag SNP. The clusteringmethod yields SNPs that are in multiple SNPclusters and SNPs that form clusters of size one.The next step chooses the representative tag SNPfor each block. This is done by simply choosingthe SNP that is most correlated with all the otherSNPs in the block. If multiple SNPs show equalcorrelation, then the one in the middle is chosen asthe tag SNP.Hierarchical clustering can be achieved by
multiple methods, such as complete, single, andaverage linkage [Kauffman and Rousseeuw,1990]. We prefer the complete linkage methodbecause it finds compact, spherical clusters. Ititeratively merges the two clusters with thesmallest maximum pairwise dissimilarity betweenany two of their members. The single linkagemethod finds larger clusters. It iteratively mergesthe two clusters with the smallest minimumpairwise dissimilarity between any two of theirmembers. Average linkage can be regarded asyielding clusters with characteristics between thesingle and complete link methods. In all oursimulations, we used the R/Splus hclust func-tion with its default method, complete linkage
Characterization of Linkage Disequilibrium 199
[Venables and Ripley, 1994; Kauffman andRousseeuw, 1990].
RESULTS
EXAMPLES
The standardized entropy (with blocking) andpairwise correlation matrices (jrj) for the inter-leukin 21 receptor (IL21R) and Janus kinase 3(JAK3) genes from the SeattleSNPs compilation,African-American sample (NHLBI Program forGenomic Applications; see Electronic-Database),are shown in Figure 1. Notice how the peaks in thestandardized entropy correspond to the blocks ofhigh pairwise correlation in the correlation ma-trices. From these two diagnostic plots, some ofthe block boundaries are quite obvious, whileothers are not. The solution found by the EBalgorithm is depicted by the color coding of thestandardized entropy plot: red and blue sections
denote blocked intervals, while black denotesunblocked SNPs.IL21R has two clear-cut blocks on the left-hand
side and one somewhat ambiguous block directlyadjacent to a large region of high correlation onthe right-hand side of the matrix. The EBalgorithm splits this large unit of high correlationat SNP 35. In the correlation matrix, this appearsto be an outlier within a much larger block. In thestandardized entropy plot, the split into twoblocks appears to be supported by a dip in thelevel of standardized entropy. However, due tothe use of a moving window of size 5, this dipcould also be an artifact induced by an outlierSNP. Follow-up analysis without the suspect SNPsupports this conjecture. The algorithm chooses tomerge the two right-most blocks into a single largeblock.The H-clust plot provides further information
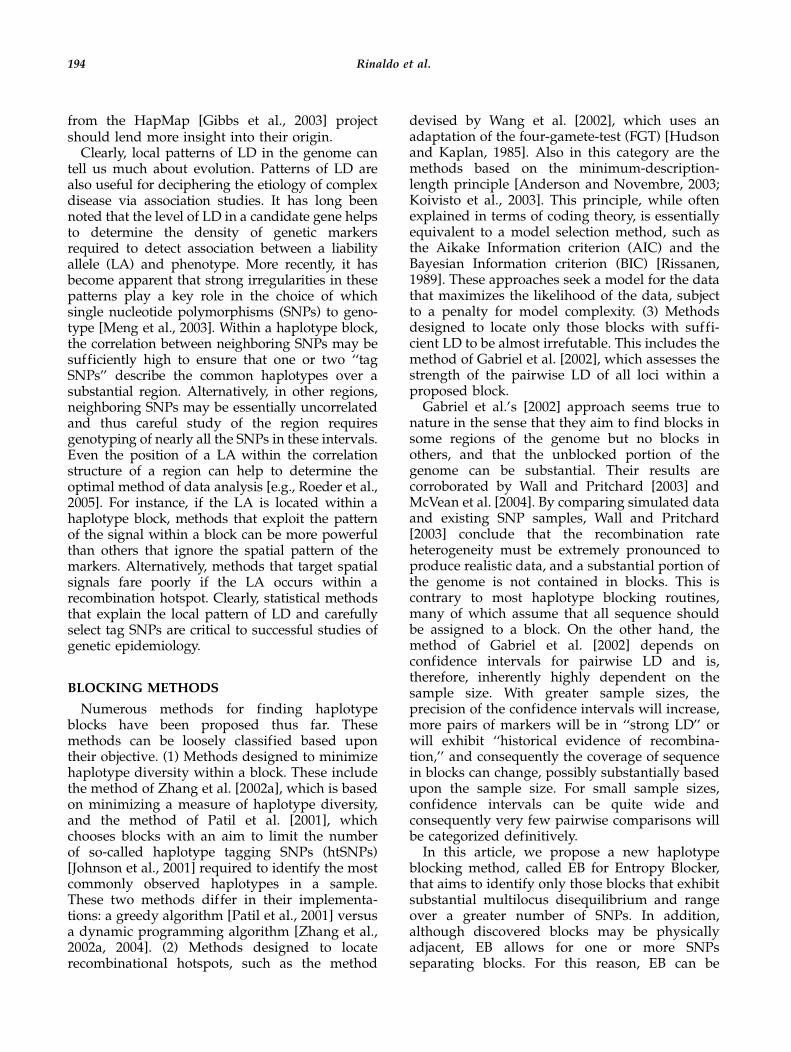
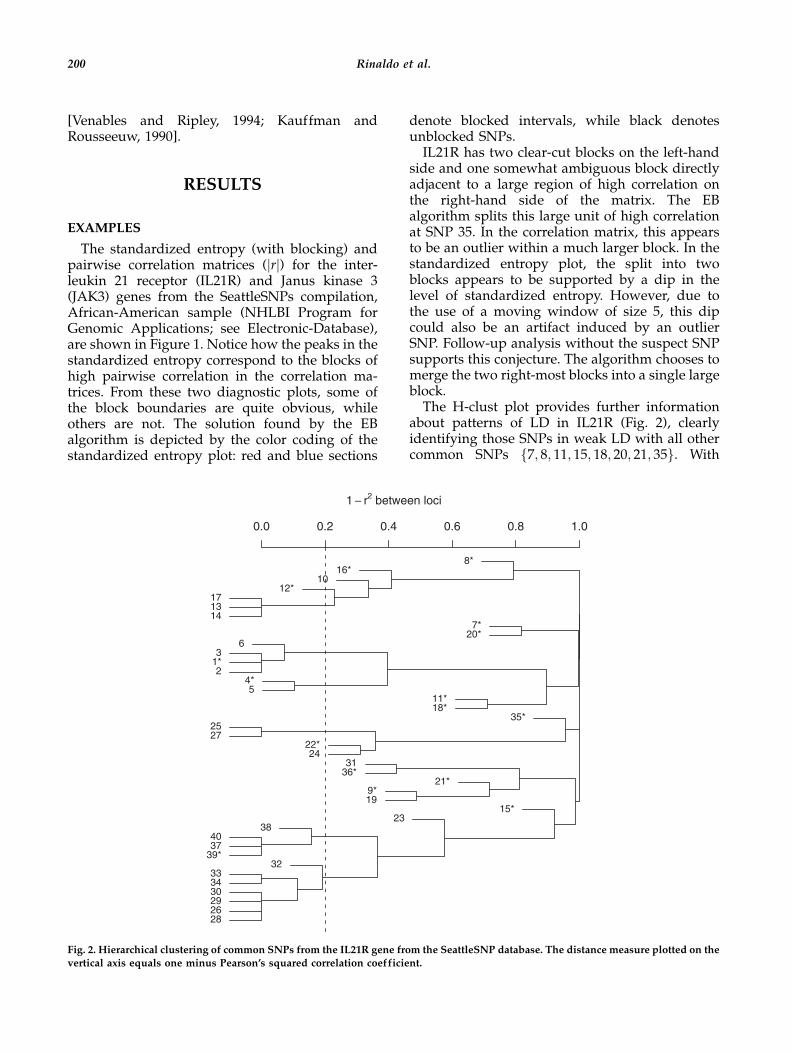
about patterns of LD in IL21R (Fig. 2), clearlyidentifying those SNPs in weak LD with all othercommon SNPs f7; 8; 11; 15; 18; 20; 21; 35g. With
8*16*
1012*
171314
7*20*
63
1*2
4*5
11*18*
35*2527
22*24
3136*
21*9*19
15*23
384037
39*32
333430292628
0.0 0.2 0.4 0.6 0.8 1.0
1 − r2 between loci
Fig. 2. Hierarchical clustering of common SNPs from the IL21R gene from the SeattleSNP database. The distance measure plotted on the
vertical axis equals one minus Pearson’s squared correlation coefficient.
Rinaldo et al.200
Z ¼ 0:50, the algorithm selects 15 tag SNPs; thosejust listed, plus one from each cluster occurringbelow the Z ¼ 0:5 line, f2; 13; 19; 23; 25; 31; 34g.SNPs 1–6, which form the first block (Fig. 1), areclustered together (Fig. 2), and a single tag SNPis recommended. Within the region of strongLD extending from SNPs 26–40, only SNPsf27; 31; 35; 36g are separated from a single largecluster. Of these, SNP 35 is clearly delineated as anoutlier. This SNP does not fit in with the LDstructure in the region, having Pearson’s squaredcorrelation coefficient less than 0:2 with all othercommon SNPs. Hence, it is included in anytagging scheme. Alternatively, SNP 27, which alsocreates an ‘‘orange stripe’’ in the pairwise correla-tion matrix (Fig. 1), clusters with some neighbor-ing SNPs in the adjacent block f22; 24; 25g.Although tightly related, tag SNPs do not directlycorrespond to block structure. To cover theremaining region encompassing SNPs 22–34,36–40, which appears to consist of two slightlyoverlapping blocks, 3 tag SNPs are needed. SNP25, selected from the cluster f22; 24; 25; 27g, ap-pears to help tag two blocks.For JAK3, the surprise in the blocking structure
is the relatively strong standardized entropiesdisplayed for the third and fourth blocks (Fig. 1).The presence of these blocks is barely evident inthe correlation matrix.
PERFORMANCE OF BLOCKING METHODSEVALUATED BY SIMULATIONS
We compare the EB blocking algorithm withMDB using data with known block structure. Thetest structure consists of genomic regions withvariable recombination rates. To generate haplo-type blocks, we used a modification of Hudson’s[2002] MS program [Wall and Pritchard, 2003] toproduce ‘‘hot spots’’ and ‘‘cold regions’’ forrecombination. For the first simulation, we simu-lated five cold regions, each of length 10 kb,separated by hot spots, each of length 1 kb. Themutation rate was chosen to bey ¼ 4Ne m ¼ 5:6�10�4=bp, where m is the perbasepair, per generation, mutation rate, and Ne ¼10; 000 is the effective population size; m waschosen to yield, on average, the number ofcommon SNPs per kb typically observed in theSeattleSNP database. The recombination rate waschosen to be r ¼ 4Ne d, where d ¼ 2:5�10�8 is theper generation, per basepair, recombination rate.This value was suggested in Nordborg and Tavare[2002]. The scaled recombination rate over the
entire region was r times the length of the region,in basepairs. The per basepair rate varied so that itwas Rh times greater in hot spots than in coldregions, for Rh ¼ 50; 100; 200. One hundred datasets were produced for each scenario. Then, theresulting ‘‘common SNPs’’ (with minor allelefrequency � 0:10) defined the haplotypes. Theresulting haplotypes had on average 12 SNPs percold spot and 0–2 SNPs per hot spot.The performance of the blocking algorithm was
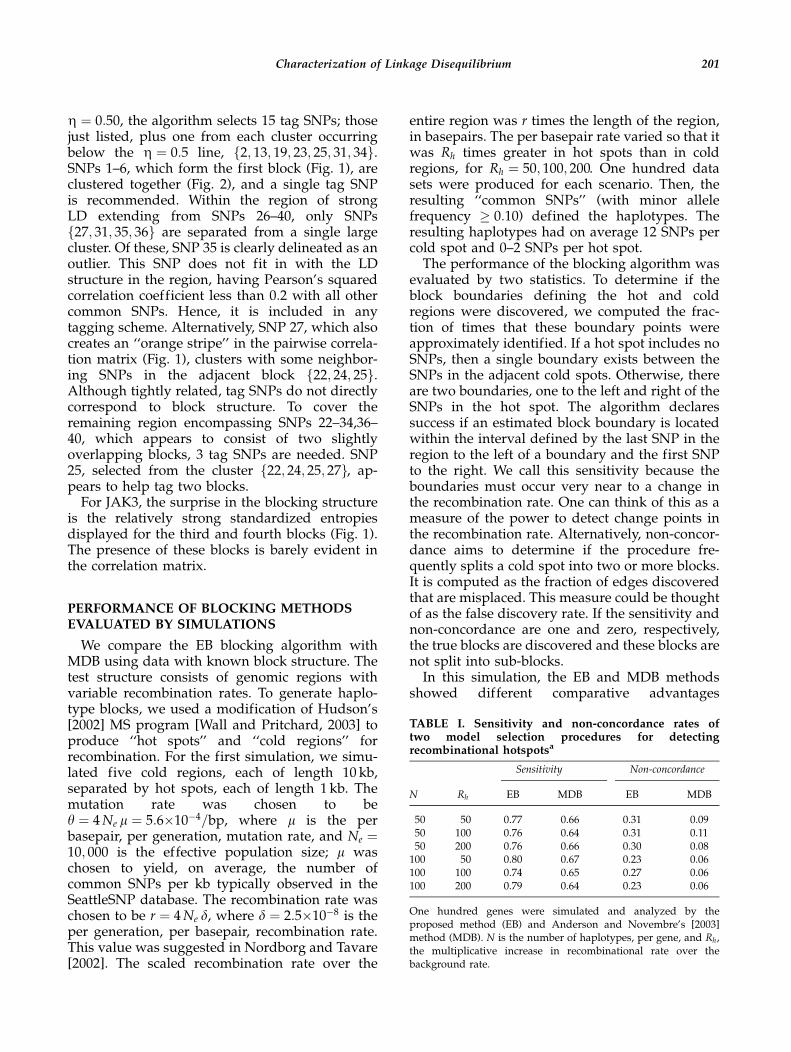
evaluated by two statistics. To determine if theblock boundaries defining the hot and coldregions were discovered, we computed the frac-tion of times that these boundary points wereapproximately identified. If a hot spot includes noSNPs, then a single boundary exists between theSNPs in the adjacent cold spots. Otherwise, thereare two boundaries, one to the left and right of theSNPs in the hot spot. The algorithm declaressuccess if an estimated block boundary is locatedwithin the interval defined by the last SNP in theregion to the left of a boundary and the first SNPto the right. We call this sensitivity because theboundaries must occur very near to a change inthe recombination rate. One can think of this as ameasure of the power to detect change points inthe recombination rate. Alternatively, non-concor-dance aims to determine if the procedure fre-quently splits a cold spot into two or more blocks.It is computed as the fraction of edges discoveredthat are misplaced. This measure could be thoughtof as the false discovery rate. If the sensitivity andnon-concordance are one and zero, respectively,the true blocks are discovered and these blocks arenot split into sub-blocks.In this simulation, the EB and MDB methods
showed different comparative advantages
TABLE I. Sensitivity and non-concordance rates oftwo model selection procedures for detectingrecombinational hotspotsa
Sensitivity Non-concordance
N Rh EB MDB EB MDB
50 50 0.77 0.66 0.31 0.0950 100 0.76 0.64 0.31 0.1150 200 0.76 0.66 0.30 0.08100 50 0.80 0.67 0.23 0.06100 100 0.74 0.65 0.27 0.06100 200 0.79 0.64 0.23 0.06
One hundred genes were simulated and analyzed by theproposed method (EB) and Anderson and Novembre’s [2003]method (MDB). N is the number of haplotypes, per gene, and Rh,the multiplicative increase in recombinational rate over thebackground rate.
Characterization of Linkage Disequilibrium 201
(Table I). EB is designed to discover interruptionsin blocks and, hence, this method has a highersensitivity than MDB. The cost of this sensitivity,however, is a higher non-concordance rate thanMDB. Alternatively, MDB has difficulty recogniz-ing that one or more SNPs have been observedwithin a hot spot. It often places a single changepoint where two were needed to describe thestructure of the haplotypes. Consequently, MDB’ssensitivity is reduced compared to EB. Finally, interms of computational time, EB runs much morequickly than MDB.To understand the nature of the false discoveries
(misplaced boundaries within blocks) detected byEB, we investigated these using H-clust. For thisinvestigation, we call a SNP an ‘‘outlier’’ when itis not clustered with the remainder of a contig-uous block by H-clust (at level Z ¼ 0:8). For eachmisplaced break, we determined if the break wasadjacent to an outlier and discovered that, indeed,the correspondence between the false breaks andpresence of an outlier was quite high. Under allsimulation conditions depicted in Table I, this wastrue 95% of the time or more. Furthermore, as inIL21R described above, removing the outlierusually leads to correct identification of the blockdelineated by the underlying cold spot.We also simulated data with cold regions
separated by regions (15 kb), not spots, of highrecombination. For these simulations we used d ¼9�10�8=bp for the baseline recombination rate.This choice led to overall patterns of LD moresimilar to those observed in the SeattleSNPdatabase. The resulting hot regions contained onaverage 19 common SNPs. Some clusters of SNPstend to retain a high degree of LD within a hotregion because the realized recombination eventshave been insufficient to break down LD through-out the region. This occurs even though therecombination rate is high within the entire hotregion. Consequently, most block-finding meth-ods are likely to detect some small blocks withinthe hot regions. Therefore, we compare the blocksfound by the EB and the MDB procedures.(Because the MDB procedure does not specificallylook for unblocked SNPs, we declare any clusterof two or more SNPs between discovered MDBblock boundaries to be blocks. This definition isnecessary because MDB ‘‘blocks’’ everything.Unblocked material can only be defined as thoseblocks of length one.)In an analysis of 100 simulated samples, each
with N ¼ 100, EB found no blocks in 15 samples.On average, 35% of the SNPs were blocked,
usually with two short blocks in the hot region.The length of the blocks ranged from 3–7 SNPswith 92% of them of length 3–4 SNPs. In contrast,the MDB method usually blocked most of theSNPs in the hot region. On average, it found 4–5blocks per sample. These blocks ranged in lengthfrom 2–12 SNPs, with 82% of them of length 2–5SNPs. For EB, the number of unblocked SNPs persample ranged from 2–30, with 86% havingbetween 6 and 17, whereas only 2% of the sampleshad 6 or more SNPs unblocked for MDB.To assess the nature of the discovered blocks, we
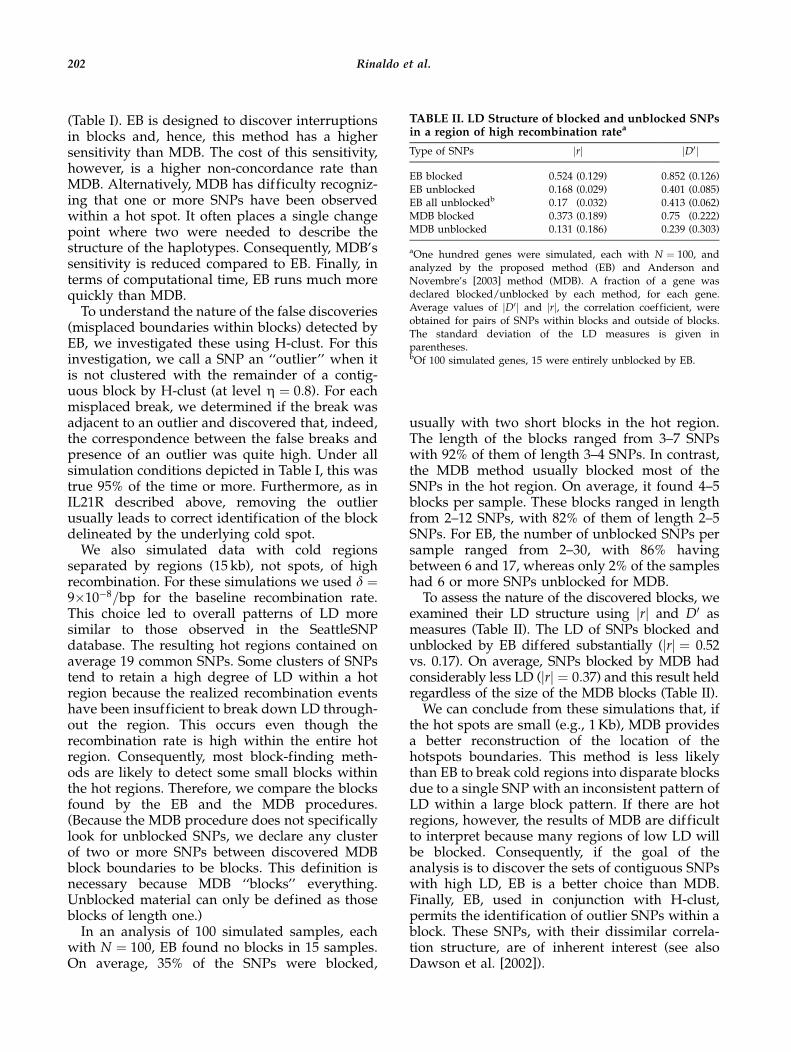
examined their LD structure using jrj and D0 asmeasures (Table II). The LD of SNPs blocked andunblocked by EB differed substantially (jrj ¼ 0.52vs. 0.17). On average, SNPs blocked by MDB hadconsiderably less LD (jrj ¼ 0:37) and this result heldregardless of the size of the MDB blocks (Table II).We can conclude from these simulations that, if
the hot spots are small (e.g., 1Kb), MDB providesa better reconstruction of the location of thehotspots boundaries. This method is less likelythan EB to break cold regions into disparate blocksdue to a single SNP with an inconsistent pattern ofLD within a large block pattern. If there are hotregions, however, the results of MDB are difficultto interpret because many regions of low LD willbe blocked. Consequently, if the goal of theanalysis is to discover the sets of contiguous SNPswith high LD, EB is a better choice than MDB.Finally, EB, used in conjunction with H-clust,permits the identification of outlier SNPs within ablock. These SNPs, with their dissimilar correla-tion structure, are of inherent interest (see alsoDawson et al. [2002]).
TABLE II. LD Structure of blocked and unblocked SNPsin a region of high recombination ratea
Type of SNPs jrj jD0j
EB blocked 0.524 (0.129) 0.852 (0.126)EB unblocked 0.168 (0.029) 0.401 (0.085)EB all unblockedb 0.17 (0.032) 0.413 (0.062)MDB blocked 0.373 (0.189) 0.75 (0.222)MDB unblocked 0.131 (0.186) 0.239 (0.303)
aOne hundred genes were simulated, each with N ¼ 100, andanalyzed by the proposed method (EB) and Anderson andNovembre’s [2003] method (MDB). A fraction of a gene wasdeclared blocked/unblocked by each method, for each gene.Average values of jD0j and jrj, the correlation coefficient, wereobtained for pairs of SNPs within blocks and outside of blocks.The standard deviation of the LD measures is given inparentheses.bOf 100 simulated genes, 15 were entirely unblocked by EB.
Rinaldo et al.202
COMPARISON OF TAGGING METHODS
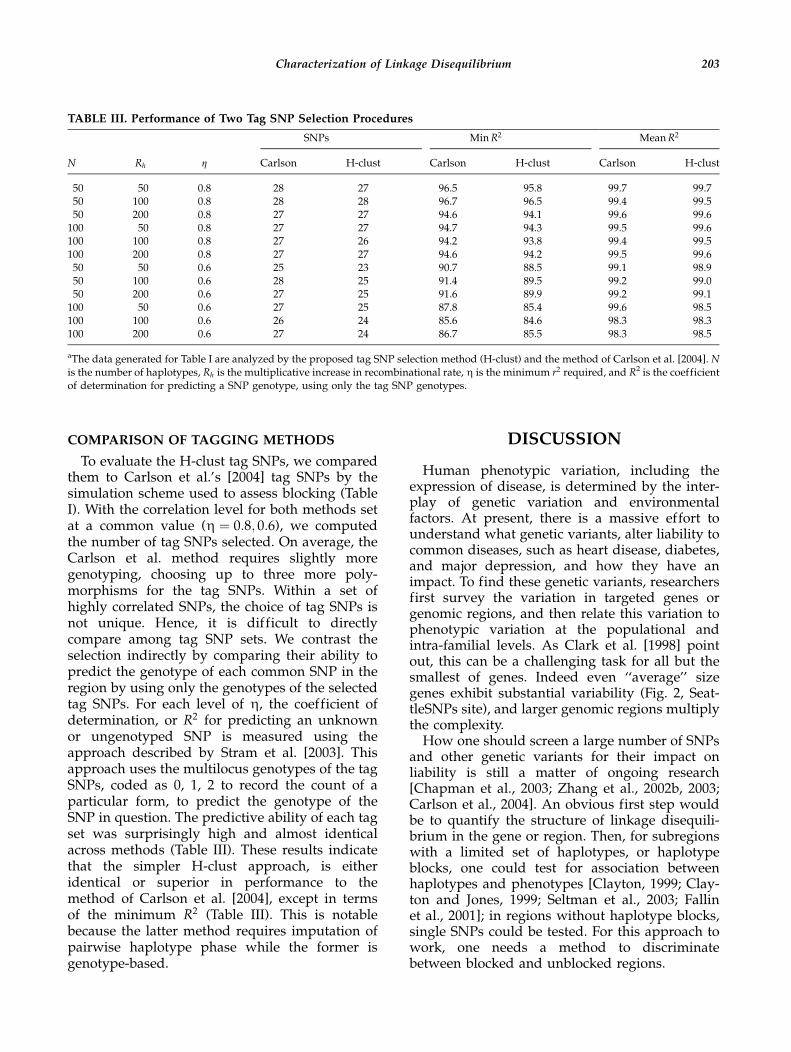
To evaluate the H-clust tag SNPs, we comparedthem to Carlson et al.’s [2004] tag SNPs by thesimulation scheme used to assess blocking (TableI). With the correlation level for both methods setat a common value (Z ¼ 0:8; 0:6), we computedthe number of tag SNPs selected. On average, theCarlson et al. method requires slightly moregenotyping, choosing up to three more poly-morphisms for the tag SNPs. Within a set ofhighly correlated SNPs, the choice of tag SNPs isnot unique. Hence, it is difficult to directlycompare among tag SNP sets. We contrast theselection indirectly by comparing their ability topredict the genotype of each common SNP in theregion by using only the genotypes of the selectedtag SNPs. For each level of Z, the coefficient ofdetermination, or R2 for predicting an unknownor ungenotyped SNP is measured using theapproach described by Stram et al. [2003]. Thisapproach uses the multilocus genotypes of the tagSNPs, coded as 0, 1, 2 to record the count of aparticular form, to predict the genotype of theSNP in question. The predictive ability of each tagset was surprisingly high and almost identicalacross methods (Table III). These results indicatethat the simpler H-clust approach, is eitheridentical or superior in performance to themethod of Carlson et al. [2004], except in termsof the minimum R2 (Table III). This is notablebecause the latter method requires imputation ofpairwise haplotype phase while the former isgenotype-based.
DISCUSSION
Human phenotypic variation, including theexpression of disease, is determined by the inter-play of genetic variation and environmentalfactors. At present, there is a massive effort tounderstand what genetic variants, alter liability tocommon diseases, such as heart disease, diabetes,and major depression, and how they have animpact. To find these genetic variants, researchersfirst survey the variation in targeted genes orgenomic regions, and then relate this variation tophenotypic variation at the populational andintra-familial levels. As Clark et al. [1998] pointout, this can be a challenging task for all but thesmallest of genes. Indeed even ‘‘average’’ sizegenes exhibit substantial variability (Fig. 2, Seat-tleSNPs site), and larger genomic regions multiplythe complexity.How one should screen a large number of SNPs
and other genetic variants for their impact onliability is still a matter of ongoing research[Chapman et al., 2003; Zhang et al., 2002b, 2003;Carlson et al., 2004]. An obvious first step wouldbe to quantify the structure of linkage disequili-brium in the gene or region. Then, for subregionswith a limited set of haplotypes, or haplotypeblocks, one could test for association betweenhaplotypes and phenotypes [Clayton, 1999; Clay-ton and Jones, 1999; Seltman et al., 2003; Fallinet al., 2001]; in regions without haplotype blocks,single SNPs could be tested. For this approach towork, one needs a method to discriminatebetween blocked and unblocked regions.
TABLE III. Performance of Two Tag SNP Selection Procedures
SNPs MinR2 MeanR2
N Rh Z Carlson H-clust Carlson H-clust Carlson H-clust
50 50 0.8 28 27 96.5 95.8 99.7 99.750 100 0.8 28 28 96.7 96.5 99.4 99.550 200 0.8 27 27 94.6 94.1 99.6 99.6100 50 0.8 27 27 94.7 94.3 99.5 99.6100 100 0.8 27 26 94.2 93.8 99.4 99.5100 200 0.8 27 27 94.6 94.2 99.5 99.650 50 0.6 25 23 90.7 88.5 99.1 98.950 100 0.6 28 25 91.4 89.5 99.2 99.050 200 0.6 27 25 91.6 89.9 99.2 99.1100 50 0.6 27 25 87.8 85.4 99.6 98.5100 100 0.6 26 24 85.6 84.6 98.3 98.3100 200 0.6 27 24 86.7 85.5 98.3 98.5
aThe data generated for Table I are analyzed by the proposed tag SNP selection method (H-clust) and the method of Carlson et al. [2004]. Nis the number of haplotypes, Rh is the multiplicative increase in recombinational rate, Z is the minimum r2 required, and R2 is the coefficientof determination for predicting a SNP genotype, using only the tag SNP genotypes.
Characterization of Linkage Disequilibrium 203
We propose one such method here, called EB,which is structurally related to the methodsproposed by Anderson and Novembre [2003] andis conceptually related to the methods of Gabriel etal. [2002]. Unlike most methods for discoveringhaplotype-blocks, EB does not aim to discover‘‘haplotype tagging SNPs’’ to be used to identifythe full underlying haplotypes. Rather, it aims todifferentiate between regions populated by weaklycorrelated SNPs and regions populated by at leastseveral SNPs in strong LD. As a result, it ‘‘blocks’’only those regions of minimal diversity in thehaplotype distribution, relative to the potentialdiversity expected from SNPs with little pairwisecorrelation. Viewed under a range of conditions,the method is quite successful in achieving thisgoal, relative to competing methods. In addition tobeing extremely simple to implement and fast todeliver its solution, simulations show that the EBmethod is quite successful at discriminatingbetween blocked and unblocked regions.We also propose an extremely simple method,
called H-clust, for choosing tag SNPs, which isbased on hierarchical clustering. H-clust does notutilize the inferred block structure of the regionunder investigation; instead, it analyses the dis-tribution of multilocus genotypes. In so doing, it ismore robust to the true underlying LD structure ofthe region. It should also be more robust to missinggenotype data than equivalent methods that useprinciple components. Compared to the method ofCarlson et al. [2004], H-clust predicts unmeasuredSNPs at least as well, using either the same or asmaller number of tagging SNPs. Because it tendsto be more parsimonious, it will also tend to bemore economical because it chooses fewer SNPs togenotype, and even results in slightly more powerfor association tests [Roeder et al., 2005]. Remark-ably, H-clust does this without knowledge ofhaplotype phase, which is required for manycompeting methods, including Carlson et al.’s[2004]. The method uses standard clustering soft-ware and the process can be depicted graphically. Inthis way, it allows for a more natural choice of thenumber of tag SNPs to genotype for an associationstudy by visualizing the clustering of SNPs.
ELECTRONIC-DATABASEINFORMATION
SeattleSNPs Database, NHLBI Program forGenomic Applications, UW-FHCRC, Seattle, WA,http://pga.gs.washington.edu/.
Software for EB, H-clust, and other descriptiveplots is posted at http://wpicr.wpic.pitt.edu/WPICCompGen/.
REFERENCES
Abecasis GR, Noguchi E, Heinzmann A, Traherne JA,Bhattacharyya S, Leaves NI, Anderson GG, Zhang Y, LenchNJ, Carey A, Cardon LR, Moffatt MF, Cookson WO. 2001.Extent and distribution of linkage disequilibrium in threegenomic regions. Am J Hum Genet 68:191–197.
Ackerman H, Usen S, Mott R, Richardson A, Sisay-Joof F, KatunduP, Taylor T, Ward R, Molyneux M, Pinder M, Kwiatkowski DP.2003. Haplotypic analysis of the TNF locus by associationefficiency and entropy. Genome Biol 4:R24.
Anderson EC, Novembre J. 2003. Finding haplotype blockboundaries by using the minimum-description-lengthprinciple. Am J Hum Genet 73:336–354.
Cardon LR, Abecasis GR. 2003. Using haplotype blocks to maphuman complex trait loci. Trends Genet 19:135–140.
Carlson CS, Eberle, AM, Rieder JM, Yi Q, Kruglyak L, NickersonDA. 2004. Selecting a maximally informative set of single-nucleotide polymorphisms for association analyses usinglinkage disequilibrium. Am J Hum Genet 74:106–120.
Chapman JM, Cooper JD, Todd JA, Clayton DG. 2003. Detectingdisease associations due to linkage disequilibrium usinghaplotype tags: a class of tests and the determinants ofstatistical power. Hum Hered 56:18–31.
Clark AG, Weiss KM, Nickerson DA, Taylor SL, Buchanan A,Stengard J, Salomaa V, Vartiainen E, Perola M, Boerwinkle E,Sing CF. 1998. Haplotype structure and population geneticinferences from nucleotide-sequence variation in humanlipoprotein lipase. Am J Hum Genet 63:595–612.
Clark AG, Nielsen R, Signorovitch J, Matise TC, Glanowski S,Heil J, Winn-Deen ES, Holden AL, Lai E. 2003. Linkagedisequilibrium and inference of ancestral recombination in 538single-nucleotide polymorphism clusters across the humangenome. Am J Hum Genet 73:285–300.
Clayton DG. 1999. A generalization of the transmission/disequilibrium test for uncertain-haplotype transmission. AmJ Hum Genet 65:1170–1177.
Clayton DG, Jones H. 1999. Transmission/disequilibrium tests forextended marker haplotypes. Am J Hum Genet 65:1161–1169.
Crawford DC, Carlson CS, Rieder MJ, Carrington DP, Yi Q, SmithJD, Eberle MA, Kruglyak L, Nickerson DA. 2004. Haplotypediversity across 100 candidate genes for inflammation, lipidmetabolism, and blood pressure regulation in two populations.Am J Hum Genet 74:610–622.
Daly MJ, Rioux JD, Schaffner SF, Hudson TH, Lander ES. 2001.High resolution haplotype structure in the human genome. NatGenet 29:229–232.
Dawson E, Abecasis GR, Bumpstead S, Chen Y, Hunt S, Beare DM,Pabial J, Dibling T, Tinsley E, Kirby S, Carter D, PapaspyridonosM, Livingstone S, Ganske R, Lohmussaar E, Zernant J, TonissonN, Remm M, Magi R, Puurand T, Vilo J, Kurg A, Rice K,Deloukas P, Mott R, Metspalu A, Bentley DR, Cardon LR,Dunham I. 2002. A first-generation linkage disequilibrium mapof human chromosome 22. Nature 418:544–548.
Devlin B, Risch N. 1995. A comparison of linkage disequilibriummeasures for fine-scale mapping. Genomics 29:311–322.
Fallin D, Cohen A, Essioux L, Chumakov I, Blumenfeld M, CohenD, Schork NJ. 2001. Genetic analysis of case/control data using
Rinaldo et al.204
estimated haplotype frequencies: application to APOE locusvariation and Alzheimer’s disease. Genome Res 11:143–151.
Gabriel SB, Schaffner SF, Nguyen H, Moore JM, Roy J, BlumenstielB, Higgins J, DeFelice M, Lochner A, Faggart M, Liu-CorderoSN, Rotimi C, Adeyemo A, Cooper R, Ward R, Lander ES, DalyMJ, Altshuler D. 2002. The structure of haplotype blocks in thehuman genome. Science 296:2225–2229.
Gibbs RA, Belmont JW, Hardenbol P, Willis TD, Yu F, Yang H,Ch’ang LY, et al. 2003. The International HapMap Project.Nature 426:789–796.
Hudson RR. 2002. Generating samples under a Wright-Fisherneutral model of genetic variation. Bioinformatics 18:337–338.
Hudson RR, Kaplan NL. 1985. Statistical properties of the numberof recombination events in the history of a sample of DNAsequences. Genetics 111:147–164.
Jeffreys AJ, Kauppi L, Neumann R. 2001. Intensely punctatemeiotic recombination in the class II region of the majorhistocompatibility complex. Nat Genet 29:217–222.
Johnson GC, Esposito L, Barratt BJ, Smith AN, Heward J, DiGenova G, Ueda H, Cordell HJ, Eaves IA, Dudbridge F, TwellsRC, Payne F, Hughes W, Nutland S, Stevens H, Carr P,Tuomilehto-Wolf E, Tuomilehto J, Gough SC, Clayton DG,Todd JA. 2001. Haplotype tagging for the identification ofcommon disease genes. Nat Genet 29:233–237.
Jorde LB. 1995. Linkage disequilibrium as a gene mapping tool.Am J Hum Genet 56:11–14.
Jorde LB. 2000. Linkage disequilibrium and the search for complexdisease genes. Genome Res 10:1435–1444.
Kauffman L, Rousseeuw PJ. 1990. Finding groups in data. Anintroduction to cluster analysis. New York: John Willey & Sons.
Ke X, Cardon LR. 2003. Efficient selective screening of haplotypetag SNPs. Bioinformatics 19:287–288.
Koivisto M, Perola M, Varilo T, Hennah W, Ekelund J,Lukk M, Peltonen L, Ukkonen E, Mannila H. 2003. An MDLmethod for finding haplotype blocks and for estimating thestrength of haplotype block boundaries. Pac Symp Biocomput502–513.
Lien S, Szyda J, Schechinger B, Rappold G, Arnheim N. 2000.Evidence for heterogeneity in recombination in the humanpseudoautosomal region: high resolution analysis by spermtyping and radiation-hybrid mapping. Am J Hum Genet 66:557–566.
May CA, Shone AC, Kalaydjieva L, Sajantila A, Jeffreys AJ. 2002.Crossover clustering and rapid decay of linkage disequilibriumin the Xp/Yp pseudoautosomal gene SHOX. Nat Genet 31:272–275.
McVean GA, Myers SR, Hunt S, Deloukas P, Bentley DR, DonnellyP. 2004. The fine-scale structure of recombination rate variationin the human genome. Science 304:581–584.
Meng Z, Zaykin DV, Xu CF, Wagner M, Ehm MG. 2003. Selectionof genetic markers for association analyses, using linkagedisequilibrium and haplotypes. Am J Hum Genet 73:115–130.
Niu T, Qin ZS, Xu X, Liu JS. 2002. Bayesian haplotype inference formultiple linked single-nucleotide polymorphisms. Am J HumGenet 70:157–169.
Nordborg M, Tavare S. 2002. Linkage disequilibrium: what historyhas to tell us. Trends Genet 18:83–90.
Nothnagel M, Furst R, Rohde K. 2002. Entropy as a measure forlinkage disequilibrium over multilocus haplotype blocks. HumHered 54:186–198.
Patil N, Berno AJ, Hinds DA, Barrett WA, Doshi JM, Hacker CR,Kautzer CR, Lee DH, Marjoribanks C, McDonough DP, NguyenBT, Norris MC, Sheehan JB, Shen N, Stern D, Stokowski RP,Thomas DJ, Trulson MO, Vyas KR, Frazer KA, Fodor SP andCox DR. 2001. Blocks of limited haplotype diversity revealed by
high-resolution scanning of human chromosome 21. Science294:1719–1723.
Phillips MS, Lawrence R, Sachidanandam R, Morris AP, BaldingDJ, Donaldson MA, Studebaker JF, et al. 2003. Chromosome-wide distribution of haplotype blocks and the role ofrecombination hot spots. Nat Genet 33:382–387.
Reich DE, Cargill M, Bolk S, Ireland J, Sabeti PC, Richter DJ,Lavery T, Kouyoumjian R, Farhadian SF, Ward R, Lander ES.2001. Linkage disequilibrium in the human genome. Nature411:199–204.
Rissanen R. 1989. Stochastic complexity in statistical inquiry.London: World Scientific.
Roeder K, Bacanu S-A, Sonpar V, Zhang X, Devlin B. 2005.Analysis of single-locus tests to detect gene/diseaseassociations. Genet Epidemiol 28:207–219 (this issue).
Schaid DJ. 2004. Linkage disequilibrium testing when linkagephase is unknown. Genetics 166:505–512.
Schneider JA, Peto TE, Boone RA, Boyce AJ, Clegg JB. 2002. Directmeasurement of the male recombination fraction in the humanbeta-globin hot spot. Hum Mol Genet 11:207–215.
Sebastiani P, Lazarus R, Weiss ST, Kunkel LM, Kohane IS, RamoniMF. 2003. Minimal haplotype tagging. Proc Natl Acad Sci USA100:9900–9905.
Seltman H, Roeder K, Devlin B. 2003. Evolutionary-basedassociation analysis using haplotype data. Genet Epidemiol25:48–58.
Stephens M, Donnelly P. 2003. A comparison of Bayesian methodsfor haplotype reconstruction from population genotype data.Am J Hum Genet 73:1162–1169.
Stephens M, Smith NJ, Donnelly P. 2001. A new statistical methodfor haplotype reconstruction from population data. Am J HumGenet 68:978–989.
Stram DO, Haiman CA, Hirschhorn JN, Altshuler D, Kolonel LN,Henderson BE, Pike MC. 2003. Choosing haplotype-taggingSNPS based on unphased genotype data using a preliminarysample of unrelated subjects with an example from theMultiethnic Cohort Study. Hum Hered 55:27–36.
Venables WN, Ripley BD. 1994. Modern applied statistics withSplus. New York: Springer Verlag.
Wall JD, Pritchard JK. 2003. Assessing the performance of thehaplotype block model of linkage disequilibrium. Am J HumGenet 73:502–516.
Wang N, Akey JM, Zhang K, Chakraborty R, Jin L.2002. Distribution of recombination crossovers and theorigin of haplotype blocks: the interplay of populationhistory, recombination, and mutation. Am J Hum Genet 71:1227–1234.
Weir BS. 1979. Inferences about linkage disequilibrium. Biometrics35:235–254.
Zaykin DV. 2004. Bounds and normalization of the compositelinkage disequilibrium coefficient. Genet Epidemiol 27(3):252–257.
Zhang K, Deng M, Chen T, Waterman MS, Sun F. 2002a. Adynamic programming algorithm for haplotype blockpartitioning. Proc Natl Acad Sci USA 99:7335–7339.
Zhang K, Calabrese P, Nordborg M, Sun F. 2002b. Haplotype blockstructure and its applications to association studies: power andstudy designs. Am J Hum Genet 71:1386–1394.
Zhang X, Roeder K, Wallstrom G, Devlin B. 2003. Integration ofassociation statistics over genomic regions using Bayesianadaptive regression splines. Human Genom 1:20–29.
Zhang K, Qin ZS, Liu JS, Chen T, Waterman M, Sun F. 2004.Haplotype block paritioning and tag SNP selection usinggenotype data and their applications to association studies.Genome Res 14:908–916.
Characterization of Linkage Disequilibrium 205
APPENDIX
MODEL SELECTION PROCEDURES:IMPLEMENTATION
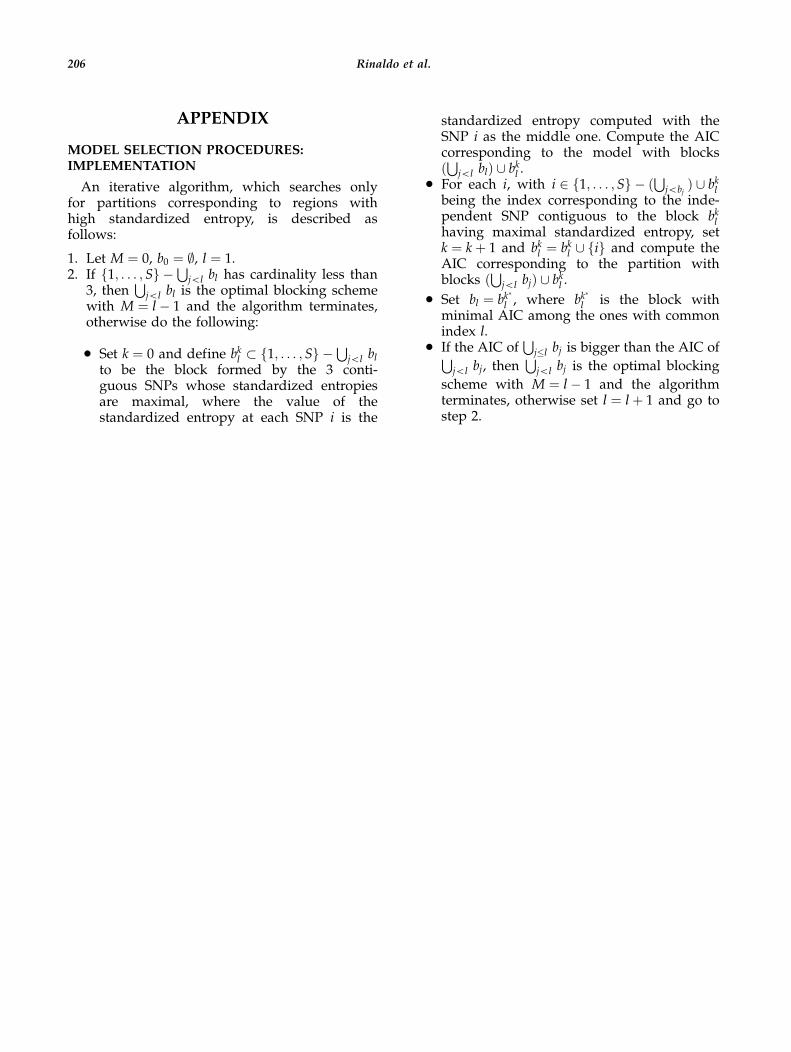
An iterative algorithm, which searches onlyfor partitions corresponding to regions withhigh standardized entropy, is described asfollows:
1. Let M ¼ 0, b0 ¼ ;, l ¼ 1.2. If f1; . . . ; Sg �
Sjol bl has cardinality less than
3, thenS
jol bl is the optimal blocking schemewith M ¼ l� 1 and the algorithm terminates,otherwise do the following:
* Set k ¼ 0 and define bkl � f1; . . . ; Sg �S
jol blto be the block formed by the 3 conti-guous SNPs whose standardized entropiesare maximal, where the value of thestandardized entropy at each SNP i is the
standardized entropy computed with theSNP i as the middle one. Compute the AICcorresponding to the model with blocksðS
jol blÞ [ bkl .* For each i, with i 2 f1; . . . ;Sg � ð
Sjobj
Þ [ bklbeing the index corresponding to the inde-pendent SNP contiguous to the block bklhaving maximal standardized entropy, setk ¼ kþ 1 and bkl ¼ bkl [ fig and compute theAIC corresponding to the partition withblocks ð
Sjol bjÞ [ bkl .
* Set bl ¼ bk
l , where bk
l is the block withminimal AIC among the ones with commonindex l.
* If the AIC ofS
j�l bj is bigger than the AIC ofSjol bj, then
Sjol bj is the optimal blocking
scheme with M ¼ l� 1 and the algorithmterminates, otherwise set l ¼ lþ 1 and go tostep 2.
Rinaldo et al.206


