Embed Size (px)
Citation preview
DaltonTransactions
PAPER
Cite this: Dalton Trans., 2013, 42, 12965
Received 30th May 2013,Accepted 3rd June 2013
DOI: 10.1039/c3dt51411k
www.rsc.org/dalton
Charge compensation assisted enhancedphotoluminescence derived from Li-codoped MgAl2O4:Eu3+ nanophosphors for solid state lightingapplications†
Subhajit Saha,a Swati Das,b Uttam Kumar Ghorai,a Nilesh Mazumder,b
Bipin Kumar Guptac and Kalyan Kumar Chattopadhyay*a,b
Highly-luminescent nanophosphors have a decisive role in solid-state lighting (SSL) as well as in field
emission display (FED) applications due to their potential use in fabrication of nanophosphor based FED
and solid state display devices. Herein, the red emitting highly-luminescent Eu3+–Li+ co-doped mag-
nesium aluminate (MgAl2O4) nanophosphors were synthesized by a customized sol–gel route with an
average particle size of 18 nm, which can be easily scaled up in a large quantity. The resulting nanophos-
phor exhibits hypersensitive red emission, peaking at 615 nm upon 394 nm excitation. Furthermore,
comparative photoluminescence (PL) studies have been carried out for Eu3+ doped and Eu3+ doped-Li+
co-doped magnesium aluminate (Li+ co-doped MgAl2O4:Eu3+) nanophosphors, which indicated that Li+
co-doping significantly improves luminescence intensity along with good crystallinity. Moreover, the
charge compensation by addition of Li+ co-activator in MgAl2O4:Eu3+ lattice led to the two fold enhance-
ment of PL intensity. The obtained results suggest that this nanophosphor could be an ultimate choice
for next generation advanced luminescent nanomaterials for solid state lighting and portable FED
devices.
1. Introduction
The huge demand of high performance displays and lampswith great energy saving capability has created a thrust amongthe scientific community to develop high quality phosphorshaving desirably high brightness and good efficiency. Due totheir unique physical properties, these phosphors can be usedin varied fields of applications like light emitting diodes(LEDs), field emission displays (FEDs) and plasma displaypanels (PDPs).1–3 Among these applications, phosphor con-verted white light emitting diodes are important candidatesfor solid state lighting. In this technology, the ultraviolet (UV)emission of an InGaN based chip is used to excite the phos-phor to generate white light. Blending of the three phosphors
(i.e. red, green and blue) to the right proportion is the mostconventional approach to realize warm white light. But, unfor-tunately, the efficiency of the red component is very poor ascompared to the other two components. Hence a special atten-tion has recently been paid to develop highly-luminescentphosphors having superior spectral qualities that can be acti-vated in near UV region.
The doping of rare-earth (RE) ions in a suitable host hasalways remained the most popular way to achieve excellentluminescence properties.4–6 Effective transfer of energy fromthe host to the RE ions can exhibit a rich optical phenomenon.Since the partially filled 4f electrons of RE ions are wellscreened from the surrounding chemical environment by the5s and 5p electrons, the luminescence arising from the 4f → 4ftransition is composed of a sharp line with relatively long life-time.7,8 Among all the RE activators, the characteristic 5D0 →7F2 transition of trivalent europium (Eu3+) is most commonlyused for many practical purposes in the lighting and displayfield. This transition is significantly dependent on the localenvironment and can be used to get information about thesite symmetry.
It is well known that size reduction of a crystalline systemcan remarkably amend the surface phenomena. Different
†Electronic supplementary information (ESI) available. See DOI: 10.1039/c3dt51411k
aSchool of Materials Science and Nanotechnology, Jadavpur University, Kolkata-
700032, IndiabDepartment of Physics, Jadavpur University, Kolkata-700032, India.
E-mail: [email protected] Physical Laboratory (CSIR), Dr. K. S. Krishnan Road, New Delhi 110012,
India
This journal is © The Royal Society of Chemistry 2013 Dalton Trans., 2013, 42, 12965–12974 | 12965
Publ
ishe
d on
10
June
201
3. D
ownl
oade
d by
Jad
avpu
r U
nive
rsity
on
05/1
2/20
14 1
1:33
:51.
View Article OnlineView Journal | View Issue
surface states formed in the nanocrystalline system may alterthe optical properties impressively. Again, from an applicationpoint of view, it is also true that, to obtain a desired thicknessof the phosphor film, nanophosphors can be coated moretimes than the bulk phosphor, which enriches the homogen-eity and uniformity of the film. Due to these reasons, the studyof nanophosphors has been carried out vigorously by differentresearch groups. Successful synthesis of the RE doped nano-phosphors with different hosts at relatively lower temperaturesas compared to their bulk counterparts stimulated thisresearch more intensely. The main focus of this study was toachieve highly-luminescent nanophosphors with greaterbrightness than previously and high stability. The transfer ofenergy from the host to the RE activator is one of the crucialparameters to determine the brightness of the nanophosphor.A host material having a wide band gap and low vibrationalenergy can cause significantly high host to activator energytransfer.9,10 Hence, not only the activator but the choice of thehost is also an important criterion to accomplish the richluminescence characteristics from the phosphor.
Among the broad variety of inorganic hosts, alkaline earthaluminates have attracted much attention of the researchersdue to several advantages, like lack of radioactive elements,lower chemical toxicity and higher chemical and thermal stabi-lity.11 Recently, MgAl2O4 has been of great interest due tomechanical strength, high resistance to chemical attacks, andexcellent dielectric and optical properties.12,13 Apart fromexcellent chemical and thermal stability, MgAl2O4 also pos-sesses some unique inherent qualities, which readily prove itscapability for using as a sensitizer in phosphor materials.Firstly, its wide band gap (∼8 eV) ensures superb transparencythroughout the entire visible region, which strongly discardsany possibility of absorption of light emitted by the rare earthactivators and thereby minimizes the possibility of any kind ofemission loss. Secondly, its low phonon energy (∼300 cm−1)14
reduces the chance of multi-phonon relaxation, which is a vitalparameter for obtaining highly efficient emission output. Theother advantage of MgAl2O4 as a host is related to its enrichedclass of stable crystal structure. In the spinel structuredMgAl2O4, O
2− form a cubic close packed array with one-eighthof the tetrahedral voids occupied by Mg2+ ions and half of theoctahedral voids occupied by Al3+ ions. Due to the lower sym-metry features, these Mg2+ sites are very suitable for 4f → 4ftransitions of the rare earth activators.15 The presence of inver-sion symmetric and non-inversion symmetric sites in MgAl2O4
spinel also affect the spectra of the RE dopant immensely.Being inspired by these excellent characteristics, severalresearchers have devoted their efforts to develop RE dopedMgAl2O4 nanophosphors by different synthesis methods.Omkaram et al.16 had adopted a solid state reaction toproduce Eu3+ doped MgAl2O4 phosphors. Wiglusz et al. haddeveloped MgAl2O4:Eu
3+ nanocrystals by hydrothermal as wellas sol–gel technique and investigated their photoluminescenceproperties extensively.17,18 But, all of them failed to improvethe PL brightness of RE doped MgAl2O4 nanophosphors to acertain extent, which could be realized through naked eyes.
It is found that the brightness of the rare-earth doped nano-phosphors is proportional to the concentration of the rareearth ion up to an optimum concentration and beyond thatconcentration doping creates a quenching problem.19,20
Increase of rare earth ions over the optimum concentrationgenerates impure phases as well as decreasing the lumines-cence intensity. Hence, it was a real challenge to develophighly intense nanophosphors keeping the concentration ofthe rare earth ion within the quenching limit.
Recent research reports reveal that the doping of RE ionsalong with the alkali metal ions (Li+, K+, Na+) emerged as aneffective way to enhance the PL brightness and efficiency ofthe nanophosphors. With the removal of the charge unbalanceproblem with a less defective crystal structure, alkali metalions not only enhance the efficiency of trivalent RE ions, butalso play a crucial role to control the crystallinity and mor-phology of the nanophosphors.21–23 This technique has beenemployed on several systems, like ZnB2O4:Eu
3+, CaWO4:Eu3+,
YBO3:Eu3+, YVO4:Eu
3+ etc. to achieve impressive luminescenceproperties.21,22,24,25 But so far, to the best of our knowledge,there is no research report available on the photoluminescenceproperties of MgAl2O4:Eu
3+ nanophosphors with Li+ co-doping. Accordingly, in this paper we have reported the photo-luminescence and cathodoluminescence properties ofMgAl2O4:Eu
3+, Li+ nanophosphor synthesized by customizedsol–gel type citrate–nitrate route. Effect of Li+ co-doping on thephotoluminescence properties has been studied extensively forwide range of Li+ concentration. Furthermore, after addition ofLi+ in the MgAl2O4:Eu
3+ crystal, a two fold increase of PL inten-sity was observed. The obtained excellent PL and CL featuresmake this nanophosphor suitable for next generation solidstate lighting as well as field emission display applications.
2. Experimental2.1. Synthesis of the MgAl2O4:Eu
3+ and Li+ co-dopedMgAl2O4:Eu
3+ nanophosphors
MgAl2O4:Eu3+ and MgAl2O4:Eu
3+, Li+ nanophosphors were syn-thesized by customized citrate–nitrate route. For Eux:Mg(1−x)-Al2O4 samples, the concentrations of Eu were varied from0% to 2% (x = 0, 0.005, 0.01, 0.015, 0.02) and for Mg(1−x−y)-Al2O4:Eux, Liy samples the concentrations of Li were variedfrom 0.5% to 2.5%, keeping the Eu concentration at 2% con-stant (x = 0.02, y = 0.005, 0.01, 0.015, 0.02, 0.025). Analyticalreagent grade Mg(NO3)2·6H2O (Merck, 99.9%), Al(NO3)3·9H2O(Merck, 99.9%), Eu(NO3)3 (prepared by dissolving Eu2O3,Sigma Aldrich 99.99% in HNO3 solution), LiNO3 (Merck,99.9%), citric acid (Merck, 99.9%) and ethylene-di-amine(Merck, 99.9%) were used as raw materials. The detailed syn-thesis procedure was as follows.
Initially, the stoichiometric amounts of magnesium nitrate,aluminium nitrate, europium nitrate and lithium nitrate weredissolved in 30 mL of deionized water (DI) and the solutionwas stirred in the magnetic stirrer for 30 min. Afterwards, inthe obtained metal nitrate solution, citric acid aqueous
Paper Dalton Transactions
12966 | Dalton Trans., 2013, 42, 12965–12974 This journal is © The Royal Society of Chemistry 2013
Publ
ishe
d on
10
June
201
3. D
ownl
oade
d by
Jad
avpu
r U
nive
rsity
on
05/1
2/20
14 1
1:33
:51.
View Article Online
solution was added in such a way that the molar ratio of Cit3−/(Mg2+ + Al3+) = 1 and the solution was stirred in a magneticstirrer for another 30 min, resulting in a homogeneous trans-parent solution. After that, ethylenediamine was added in thishomogeneous transparent solution and the pH of the solutionwas adjusted to 5. The final solution was then evaporatedslowly in the water bath to form a highly viscous colloidal gel.This gel was then dried in the oven at 120 °C for 12 h. Afterthat, the dried gel was calcined at 350 °C for 2 h to remove theorganics. Finally, the obtained porous material was ground ina mortar and heat treated at 1000 °C for 5 h in a box furnace toobtain ultrafine Eu3+, Li+ doped magnesium aluminatepowders. The synthesis procedure was same for Eu3+ dopedMgAl2O4 nanophosphors except in that case LiNO3 was nottaken into account.
2.2. Characterization
For gross structural analysis and phase identification, the as-synthesized nanopowders were characterized through X-raydiffraction (XRD), using a Rigaku-Ultima-III X-ray powder dif-fractometer with monochromatized Cu Kα radiation, (λ =1.5404 Å). The FTIR spectra were recorded in the mid IRregion, (i.e. 400–4000 cm−1) by using a Shimadzu IRPrestige-21spectrometer. Chemical composition, doping and the chemi-cal state of the elements were analyzed by X-ray photoelectronspectroscopy using a monochromatic Al Kα (hν = 1486.6 eV)X-ray source and a hemispherical analyzer (SPECS, HSA 3500).The recorded spectra were charge corrected using the C1 s lineof the adventitious carbon at 284.6 eV as a reference. Surfacemorphology of the nanophosphors was examined by a fieldemission scanning electron microscope (FESEM, HitachiS-4800). The crystalline structure of the samples was investi-gated with high resolution transmission electron microscopy(JEOL JEM 2100). PL spectra were taken on an Edinburgh,FLSP-920, equipped with steady state and time-resolved lumi-nescence spectrometer, using a time correlated single photoncounting technique with instrument and microsecond xenonflash lamp as the source of excitation. Room temperaturecathodoluminescence spectra were recorded with Gatan MonoCL3 equipment attached to the FESEM using a beam accelerat-ing voltage of 900 V.
3. Results and discussion3.1. Structural, compositional and microstructural analysis
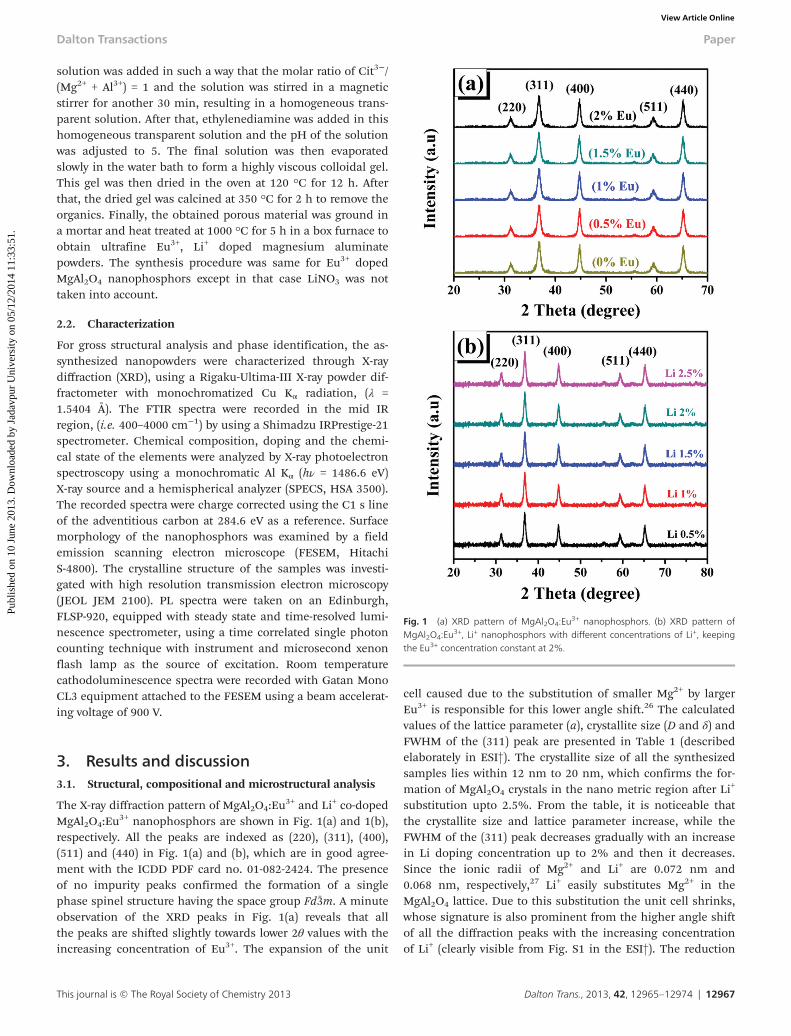
The X-ray diffraction pattern of MgAl2O4:Eu3+ and Li+ co-doped
MgAl2O4:Eu3+ nanophosphors are shown in Fig. 1(a) and 1(b),
respectively. All the peaks are indexed as (220), (311), (400),(511) and (440) in Fig. 1(a) and (b), which are in good agree-ment with the ICDD PDF card no. 01-082-2424. The presenceof no impurity peaks confirmed the formation of a singlephase spinel structure having the space group Fd3̄m. A minuteobservation of the XRD peaks in Fig. 1(a) reveals that allthe peaks are shifted slightly towards lower 2θ values with theincreasing concentration of Eu3+. The expansion of the unit
cell caused due to the substitution of smaller Mg2+ by largerEu3+ is responsible for this lower angle shift.26 The calculatedvalues of the lattice parameter (a), crystallite size (D and δ) andFWHM of the (311) peak are presented in Table 1 (describedelaborately in ESI†). The crystallite size of all the synthesizedsamples lies within 12 nm to 20 nm, which confirms the for-mation of MgAl2O4 crystals in the nano metric region after Li+
substitution upto 2.5%. From the table, it is noticeable thatthe crystallite size and lattice parameter increase, while theFWHM of the (311) peak decreases gradually with an increasein Li doping concentration up to 2% and then it decreases.Since the ionic radii of Mg2+ and Li+ are 0.072 nm and0.068 nm, respectively,27 Li+ easily substitutes Mg2+ in theMgAl2O4 lattice. Due to this substitution the unit cell shrinks,whose signature is also prominent from the higher angle shiftof all the diffraction peaks with the increasing concentrationof Li+ (clearly visible from Fig. S1 in the ESI†). The reduction
Fig. 1 (a) XRD pattern of MgAl2O4:Eu3+ nanophosphors. (b) XRD pattern of
MgAl2O4:Eu3+, Li+ nanophosphors with different concentrations of Li+, keeping
the Eu3+ concentration constant at 2%.
Dalton Transactions Paper
This journal is © The Royal Society of Chemistry 2013 Dalton Trans., 2013, 42, 12965–12974 | 12967
Publ
ishe
d on
10
June
201
3. D
ownl
oade
d by
Jad
avpu
r U
nive
rsity
on
05/1
2/20
14 1
1:33
:51.
View Article Online
of FWHM as well as the increase of sharpness of the peak(311) with Li+ incorporation indicates that Li+ acts as a self-promoting agent for the enhanced crystallization of the Eu3+:MgAl2O4 lattice.28–30 But substitution of Mg2+ by Li+ alwayscreates some oxygen vacancies in the MgAl2O4 lattice. Whenthe concentration of Li+ increases beyond 2%, a substantialnumber of oxygen vacancies are created in the system. Thesevacant sites in the oxygen ions expand the lattice with adecrease in crystal density. Due to this lattice expansion theLi–O bond strength is reduced, which in turn reduces the crys-tallinity. This phenomenon is also supported by earlier reportswith different hosts, which show the degradation of crystalli-nity may occur due to the substitution of Li+ with a highdegree of concentration.31–34 Formation of pure phaseMgAl2O4:Eu
3+ and Li+ co-doped MgAl2O4:Eu3+ nanophosphors
has also been confirmed by FTIR analysis, shown in ESI(Fig. S2†). The presence of two small and broad peaks at539 cm−1 and 695 cm−1 corresponding to the inorganicnetwork of the AlO6 group ensured the MgAl2O4 spinelformation.35,36
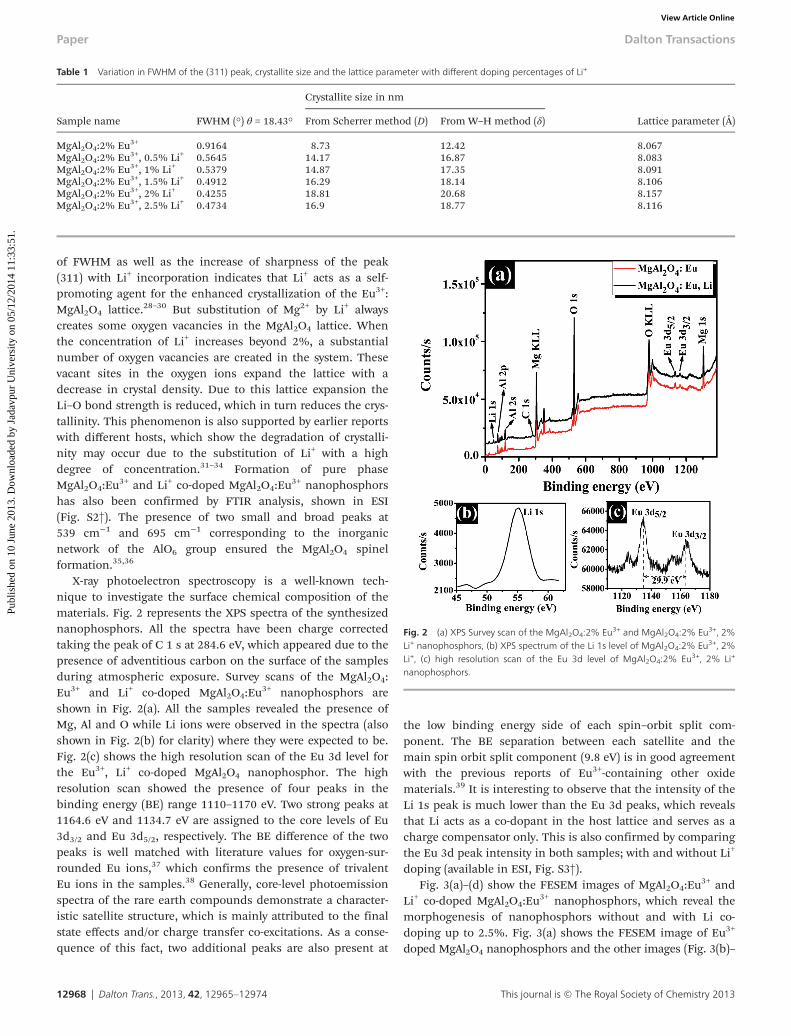
X-ray photoelectron spectroscopy is a well-known tech-nique to investigate the surface chemical composition of thematerials. Fig. 2 represents the XPS spectra of the synthesizednanophosphors. All the spectra have been charge correctedtaking the peak of C 1 s at 284.6 eV, which appeared due to thepresence of adventitious carbon on the surface of the samplesduring atmospheric exposure. Survey scans of the MgAl2O4:Eu3+ and Li+ co-doped MgAl2O4:Eu
3+ nanophosphors areshown in Fig. 2(a). All the samples revealed the presence ofMg, Al and O while Li ions were observed in the spectra (alsoshown in Fig. 2(b) for clarity) where they were expected to be.Fig. 2(c) shows the high resolution scan of the Eu 3d level forthe Eu3+, Li+ co-doped MgAl2O4 nanophosphor. The highresolution scan showed the presence of four peaks in thebinding energy (BE) range 1110–1170 eV. Two strong peaks at1164.6 eV and 1134.7 eV are assigned to the core levels of Eu3d3/2 and Eu 3d5/2, respectively. The BE difference of the twopeaks is well matched with literature values for oxygen-sur-rounded Eu ions,37 which confirms the presence of trivalentEu ions in the samples.38 Generally, core-level photoemissionspectra of the rare earth compounds demonstrate a character-istic satellite structure, which is mainly attributed to the finalstate effects and/or charge transfer co-excitations. As a conse-quence of this fact, two additional peaks are also present at
the low binding energy side of each spin–orbit split com-ponent. The BE separation between each satellite and themain spin orbit split component (9.8 eV) is in good agreementwith the previous reports of Eu3+-containing other oxidematerials.39 It is interesting to observe that the intensity of theLi 1s peak is much lower than the Eu 3d peaks, which revealsthat Li acts as a co-dopant in the host lattice and serves as acharge compensator only. This is also confirmed by comparingthe Eu 3d peak intensity in both samples; with and without Li+
doping (available in ESI, Fig. S3†).Fig. 3(a)–(d) show the FESEM images of MgAl2O4:Eu
3+ andLi+ co-doped MgAl2O4:Eu
3+ nanophosphors, which reveal themorphogenesis of nanophosphors without and with Li co-doping up to 2.5%. Fig. 3(a) shows the FESEM image of Eu3+
doped MgAl2O4 nanophosphors and the other images (Fig. 3(b)–
Table 1 Variation in FWHM of the (311) peak, crystallite size and the lattice parameter with different doping percentages of Li+
Sample name FWHM (°) θ = 18.43°
Crystallite size in nm
Lattice parameter (Å)From Scherrer method (D) From W–H method (δ)
MgAl2O4:2% Eu3+ 0.9164 8.73 12.42 8.067MgAl2O4:2% Eu3+, 0.5% Li+ 0.5645 14.17 16.87 8.083MgAl2O4:2% Eu3+, 1% Li+ 0.5379 14.87 17.35 8.091MgAl2O4:2% Eu3+, 1.5% Li+ 0.4912 16.29 18.14 8.106MgAl2O4:2% Eu3+, 2% Li+ 0.4255 18.81 20.68 8.157MgAl2O4:2% Eu3+, 2.5% Li+ 0.4734 16.9 18.77 8.116
Fig. 2 (a) XPS Survey scan of the MgAl2O4:2% Eu3+ and MgAl2O4:2% Eu3+, 2%Li+ nanophosphors, (b) XPS spectrum of the Li 1s level of MgAl2O4:2% Eu3+, 2%Li+, (c) high resolution scan of the Eu 3d level of MgAl2O4:2% Eu3+, 2% Li+
nanophosphors.
Paper Dalton Transactions
12968 | Dalton Trans., 2013, 42, 12965–12974 This journal is © The Royal Society of Chemistry 2013
Publ
ishe
d on
10
June
201
3. D
ownl
oade
d by
Jad
avpu
r U
nive
rsity
on
05/1
2/20
14 1
1:33
:51.
View Article Online
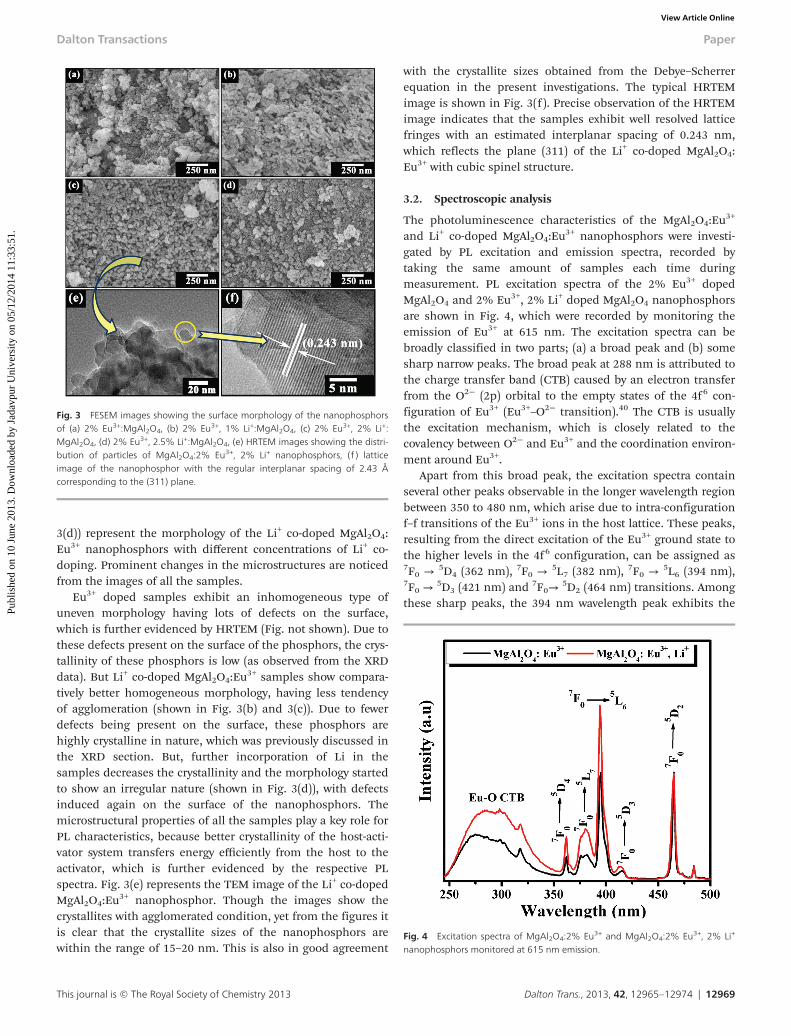
3(d)) represent the morphology of the Li+ co-doped MgAl2O4:Eu3+ nanophosphors with different concentrations of Li+ co-doping. Prominent changes in the microstructures are noticedfrom the images of all the samples.
Eu3+ doped samples exhibit an inhomogeneous type ofuneven morphology having lots of defects on the surface,which is further evidenced by HRTEM (Fig. not shown). Due tothese defects present on the surface of the phosphors, the crys-tallinity of these phosphors is low (as observed from the XRDdata). But Li+ co-doped MgAl2O4:Eu
3+ samples show compara-tively better homogeneous morphology, having less tendencyof agglomeration (shown in Fig. 3(b) and 3(c)). Due to fewerdefects being present on the surface, these phosphors arehighly crystalline in nature, which was previously discussed inthe XRD section. But, further incorporation of Li in thesamples decreases the crystallinity and the morphology startedto show an irregular nature (shown in Fig. 3(d)), with defectsinduced again on the surface of the nanophosphors. Themicrostructural properties of all the samples play a key role forPL characteristics, because better crystallinity of the host-acti-vator system transfers energy efficiently from the host to theactivator, which is further evidenced by the respective PLspectra. Fig. 3(e) represents the TEM image of the Li+ co-dopedMgAl2O4:Eu
3+ nanophosphor. Though the images show thecrystallites with agglomerated condition, yet from the figures itis clear that the crystallite sizes of the nanophosphors arewithin the range of 15–20 nm. This is also in good agreement
with the crystallite sizes obtained from the Debye–Scherrerequation in the present investigations. The typical HRTEMimage is shown in Fig. 3(f ). Precise observation of the HRTEMimage indicates that the samples exhibit well resolved latticefringes with an estimated interplanar spacing of 0.243 nm,which reflects the plane (311) of the Li+ co-doped MgAl2O4:Eu3+ with cubic spinel structure.
3.2. Spectroscopic analysis
The photoluminescence characteristics of the MgAl2O4:Eu3+
and Li+ co-doped MgAl2O4:Eu3+ nanophosphors were investi-
gated by PL excitation and emission spectra, recorded bytaking the same amount of samples each time duringmeasurement. PL excitation spectra of the 2% Eu3+ dopedMgAl2O4 and 2% Eu3+, 2% Li+ doped MgAl2O4 nanophosphorsare shown in Fig. 4, which were recorded by monitoring theemission of Eu3+ at 615 nm. The excitation spectra can bebroadly classified in two parts; (a) a broad peak and (b) somesharp narrow peaks. The broad peak at 288 nm is attributed tothe charge transfer band (CTB) caused by an electron transferfrom the O2− (2p) orbital to the empty states of the 4f6 con-figuration of Eu3+ (Eu3+–O2− transition).40 The CTB is usuallythe excitation mechanism, which is closely related to thecovalency between O2− and Eu3+ and the coordination environ-ment around Eu3+.
Apart from this broad peak, the excitation spectra containseveral other peaks observable in the longer wavelength regionbetween 350 to 480 nm, which arise due to intra-configurationf–f transitions of the Eu3+ ions in the host lattice. These peaks,resulting from the direct excitation of the Eu3+ ground state tothe higher levels in the 4f6 configuration, can be assigned as7F0 → 5D4 (362 nm), 7F0 → 5L7 (382 nm), 7F0 → 5L6 (394 nm),7F0 →
5D3 (421 nm) and 7F0→5D2 (464 nm) transitions. Among
these sharp peaks, the 394 nm wavelength peak exhibits the
Fig. 3 FESEM images showing the surface morphology of the nanophosphorsof (a) 2% Eu3+:MgAl2O4, (b) 2% Eu3+, 1% Li+:MgAl2O4, (c) 2% Eu3+, 2% Li+:MgAl2O4, (d) 2% Eu3+, 2.5% Li+:MgAl2O4, (e) HRTEM images showing the distri-bution of particles of MgAl2O4:2% Eu3+, 2% Li+ nanophosphors, (f ) latticeimage of the nanophosphor with the regular interplanar spacing of 2.43 Åcorresponding to the (311) plane.
Fig. 4 Excitation spectra of MgAl2O4:2% Eu3+ and MgAl2O4:2% Eu3+, 2% Li+
nanophosphors monitored at 615 nm emission.
Dalton Transactions Paper
This journal is © The Royal Society of Chemistry 2013 Dalton Trans., 2013, 42, 12965–12974 | 12969
Publ
ishe
d on
10
June
201
3. D
ownl
oade
d by
Jad
avpu
r U
nive
rsity
on
05/1
2/20
14 1
1:33
:51.
View Article Online
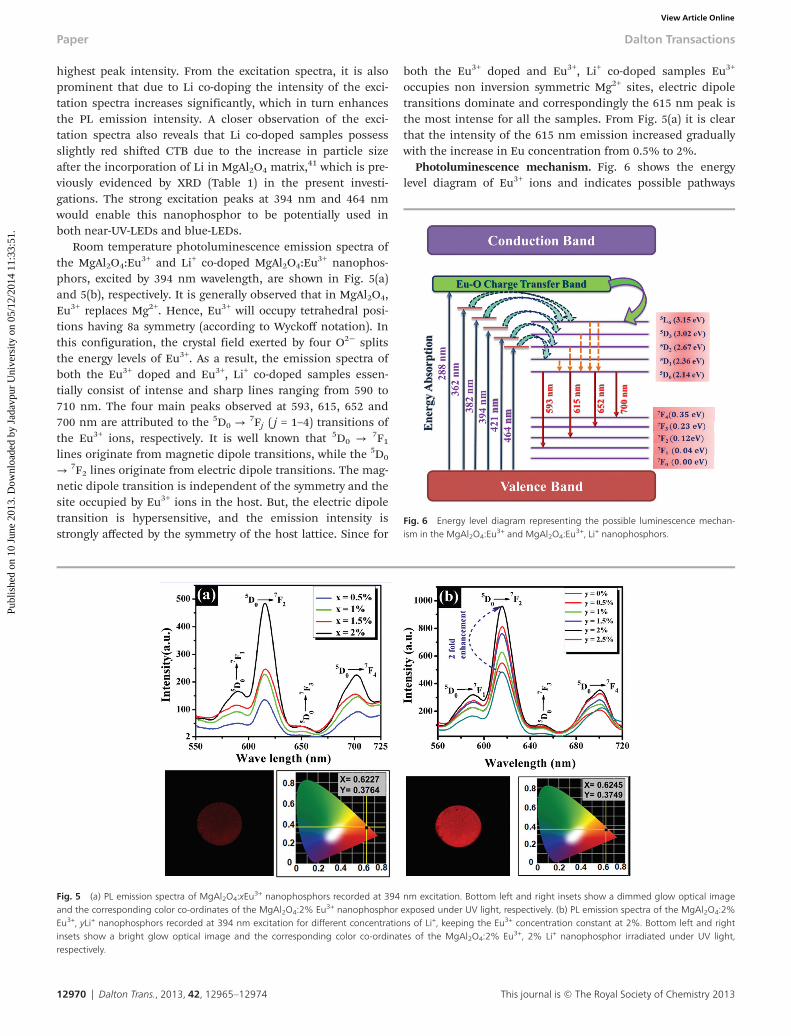
highest peak intensity. From the excitation spectra, it is alsoprominent that due to Li co-doping the intensity of the exci-tation spectra increases significantly, which in turn enhancesthe PL emission intensity. A closer observation of the exci-tation spectra also reveals that Li co-doped samples possessslightly red shifted CTB due to the increase in particle sizeafter the incorporation of Li in MgAl2O4 matrix,41 which is pre-viously evidenced by XRD (Table 1) in the present investi-gations. The strong excitation peaks at 394 nm and 464 nmwould enable this nanophosphor to be potentially used inboth near-UV-LEDs and blue-LEDs.
Room temperature photoluminescence emission spectra ofthe MgAl2O4:Eu
3+ and Li+ co-doped MgAl2O4:Eu3+ nanophos-
phors, excited by 394 nm wavelength, are shown in Fig. 5(a)and 5(b), respectively. It is generally observed that in MgAl2O4,Eu3+ replaces Mg2+. Hence, Eu3+ will occupy tetrahedral posi-tions having 8a symmetry (according to Wyckoff notation). Inthis configuration, the crystal field exerted by four O2− splitsthe energy levels of Eu3+. As a result, the emission spectra ofboth the Eu3+ doped and Eu3+, Li+ co-doped samples essen-tially consist of intense and sharp lines ranging from 590 to710 nm. The four main peaks observed at 593, 615, 652 and700 nm are attributed to the 5D0 →
7Fj ( j = 1–4) transitions ofthe Eu3+ ions, respectively. It is well known that 5D0 → 7F1lines originate from magnetic dipole transitions, while the 5D0
→ 7F2 lines originate from electric dipole transitions. The mag-netic dipole transition is independent of the symmetry and thesite occupied by Eu3+ ions in the host. But, the electric dipoletransition is hypersensitive, and the emission intensity isstrongly affected by the symmetry of the host lattice. Since for
both the Eu3+ doped and Eu3+, Li+ co-doped samples Eu3+
occupies non inversion symmetric Mg2+ sites, electric dipoletransitions dominate and correspondingly the 615 nm peak isthe most intense for all the samples. From Fig. 5(a) it is clearthat the intensity of the 615 nm emission increased graduallywith the increase in Eu concentration from 0.5% to 2%.
Photoluminescence mechanism. Fig. 6 shows the energylevel diagram of Eu3+ ions and indicates possible pathways
Fig. 5 (a) PL emission spectra of MgAl2O4:xEu3+ nanophosphors recorded at 394 nm excitation. Bottom left and right insets show a dimmed glow optical image
and the corresponding color co-ordinates of the MgAl2O4:2% Eu3+ nanophosphor exposed under UV light, respectively. (b) PL emission spectra of the MgAl2O4:2%Eu3+, yLi+ nanophosphors recorded at 394 nm excitation for different concentrations of Li+, keeping the Eu3+ concentration constant at 2%. Bottom left and rightinsets show a bright glow optical image and the corresponding color co-ordinates of the MgAl2O4:2% Eu3+, 2% Li+ nanophosphor irradiated under UV light,respectively.
Fig. 6 Energy level diagram representing the possible luminescence mechan-ism in the MgAl2O4:Eu
3+ and MgAl2O4:Eu3+, Li+ nanophosphors.
Paper Dalton Transactions
12970 | Dalton Trans., 2013, 42, 12965–12974 This journal is © The Royal Society of Chemistry 2013
Publ
ishe
d on
10
June
201
3. D
ownl
oade
d by
Jad
avpu
r U
nive
rsity
on
05/1
2/20
14 1
1:33
:51.
View Article Online
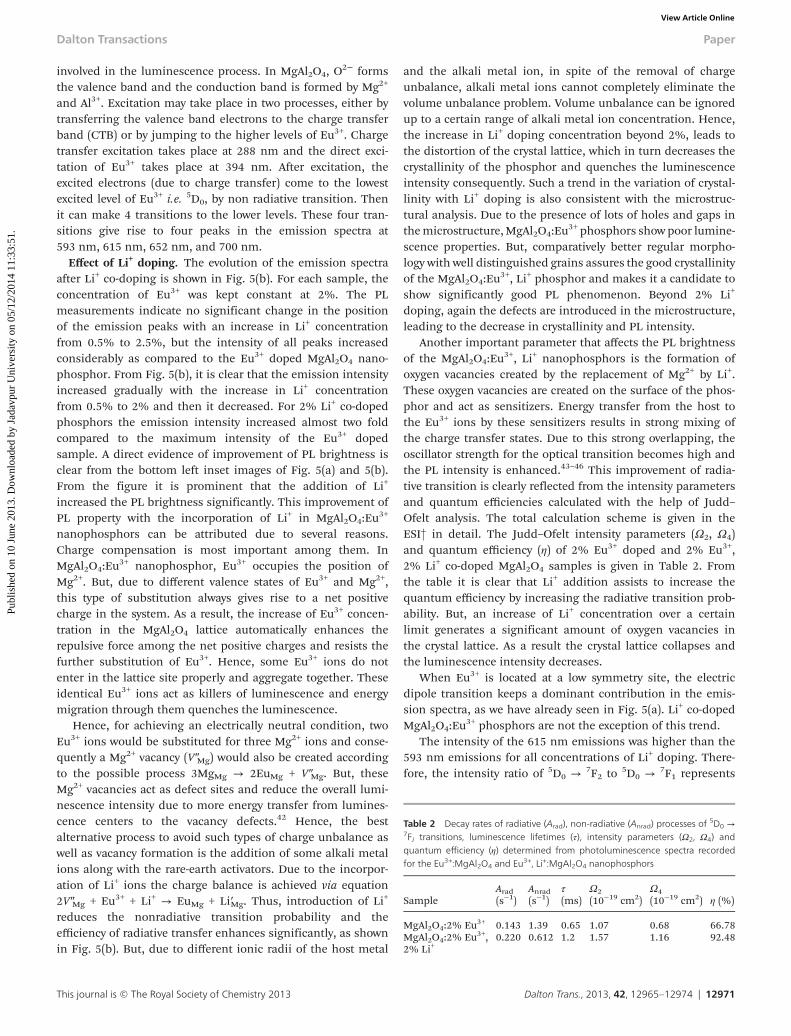
involved in the luminescence process. In MgAl2O4, O2− forms
the valence band and the conduction band is formed by Mg2+
and Al3+. Excitation may take place in two processes, either bytransferring the valence band electrons to the charge transferband (CTB) or by jumping to the higher levels of Eu3+. Chargetransfer excitation takes place at 288 nm and the direct exci-tation of Eu3+ takes place at 394 nm. After excitation, theexcited electrons (due to charge transfer) come to the lowestexcited level of Eu3+ i.e. 5D0, by non radiative transition. Thenit can make 4 transitions to the lower levels. These four tran-sitions give rise to four peaks in the emission spectra at593 nm, 615 nm, 652 nm, and 700 nm.
Effect of Li+ doping. The evolution of the emission spectraafter Li+ co-doping is shown in Fig. 5(b). For each sample, theconcentration of Eu3+ was kept constant at 2%. The PLmeasurements indicate no significant change in the positionof the emission peaks with an increase in Li+ concentrationfrom 0.5% to 2.5%, but the intensity of all peaks increasedconsiderably as compared to the Eu3+ doped MgAl2O4 nano-phosphor. From Fig. 5(b), it is clear that the emission intensityincreased gradually with the increase in Li+ concentrationfrom 0.5% to 2% and then it decreased. For 2% Li+ co-dopedphosphors the emission intensity increased almost two foldcompared to the maximum intensity of the Eu3+ dopedsample. A direct evidence of improvement of PL brightness isclear from the bottom left inset images of Fig. 5(a) and 5(b).From the figure it is prominent that the addition of Li+
increased the PL brightness significantly. This improvement ofPL property with the incorporation of Li+ in MgAl2O4:Eu
3+
nanophosphors can be attributed due to several reasons.Charge compensation is most important among them. InMgAl2O4:Eu
3+ nanophosphor, Eu3+ occupies the position ofMg2+. But, due to different valence states of Eu3+ and Mg2+,this type of substitution always gives rise to a net positivecharge in the system. As a result, the increase of Eu3+ concen-tration in the MgAl2O4 lattice automatically enhances therepulsive force among the net positive charges and resists thefurther substitution of Eu3+. Hence, some Eu3+ ions do notenter in the lattice site properly and aggregate together. Theseidentical Eu3+ ions act as killers of luminescence and energymigration through them quenches the luminescence.
Hence, for achieving an electrically neutral condition, twoEu3+ ions would be substituted for three Mg2+ ions and conse-quently a Mg2+ vacancy (V″Mg) would also be created accordingto the possible process 3MgMg → 2EuMg + V″Mg. But, theseMg2+ vacancies act as defect sites and reduce the overall lumi-nescence intensity due to more energy transfer from lumines-cence centers to the vacancy defects.42 Hence, the bestalternative process to avoid such types of charge unbalance aswell as vacancy formation is the addition of some alkali metalions along with the rare-earth activators. Due to the incorpor-ation of Li+ ions the charge balance is achieved via equation2V″Mg + Eu3+ + Li+ → EuMg + Li′Mg. Thus, introduction of Li+
reduces the nonradiative transition probability and theefficiency of radiative transfer enhances significantly, as shownin Fig. 5(b). But, due to different ionic radii of the host metal
and the alkali metal ion, in spite of the removal of chargeunbalance, alkali metal ions cannot completely eliminate thevolume unbalance problem. Volume unbalance can be ignoredup to a certain range of alkali metal ion concentration. Hence,the increase in Li+ doping concentration beyond 2%, leads tothe distortion of the crystal lattice, which in turn decreases thecrystallinity of the phosphor and quenches the luminescenceintensity consequently. Such a trend in the variation of crystal-linity with Li+ doping is also consistent with the microstruc-tural analysis. Due to the presence of lots of holes and gaps inthemicrostructure,MgAl2O4:Eu
3+ phosphors show poor lumine-scence properties. But, comparatively better regular morpho-logy with well distinguished grains assures the good crystallinityof the MgAl2O4:Eu
3+, Li+ phosphor and makes it a candidate toshow significantly good PL phenomenon. Beyond 2% Li+
doping, again the defects are introduced in the microstructure,leading to the decrease in crystallinity and PL intensity.
Another important parameter that affects the PL brightnessof the MgAl2O4:Eu
3+, Li+ nanophosphors is the formation ofoxygen vacancies created by the replacement of Mg2+ by Li+.These oxygen vacancies are created on the surface of the phos-phor and act as sensitizers. Energy transfer from the host tothe Eu3+ ions by these sensitizers results in strong mixing ofthe charge transfer states. Due to this strong overlapping, theoscillator strength for the optical transition becomes high andthe PL intensity is enhanced.43–46 This improvement of radia-tive transition is clearly reflected from the intensity parametersand quantum efficiencies calculated with the help of Judd–Ofelt analysis. The total calculation scheme is given in theESI† in detail. The Judd–Ofelt intensity parameters (Ω2, Ω4)and quantum efficiency (η) of 2% Eu3+ doped and 2% Eu3+,2% Li+ co-doped MgAl2O4 samples is given in Table 2. Fromthe table it is clear that Li+ addition assists to increase thequantum efficiency by increasing the radiative transition prob-ability. But, an increase of Li+ concentration over a certainlimit generates a significant amount of oxygen vacancies inthe crystal lattice. As a result the crystal lattice collapses andthe luminescence intensity decreases.
When Eu3+ is located at a low symmetry site, the electricdipole transition keeps a dominant contribution in the emis-sion spectra, as we have already seen in Fig. 5(a). Li+ co-dopedMgAl2O4:Eu
3+ phosphors are not the exception of this trend.The intensity of the 615 nm emissions was higher than the
593 nm emissions for all concentrations of Li+ doping. There-fore, the intensity ratio of 5D0 → 7F2 to 5D0 → 7F1 represents
Table 2 Decay rates of radiative (Arad), non-radiative (Anrad) processes of5D0 →
7FJ transitions, luminescence lifetimes (τ), intensity parameters (Ω2, Ω4) andquantum efficiency (η) determined from photoluminescence spectra recordedfor the Eu3+:MgAl2O4 and Eu3+, Li+:MgAl2O4 nanophosphors
SampleArad(s−1)
Anrad(s−1)
τ(ms)
Ω2(10−19 cm2)
Ω4(10−19 cm2) η (%)
MgAl2O4:2% Eu3+ 0.143 1.39 0.65 1.07 0.68 66.78MgAl2O4:2% Eu3+,2% Li+
0.220 0.612 1.2 1.57 1.16 92.48
Dalton Transactions Paper
This journal is © The Royal Society of Chemistry 2013 Dalton Trans., 2013, 42, 12965–12974 | 12971
Publ
ishe
d on
10
June
201
3. D
ownl
oade
d by
Jad
avpu
r U
nive
rsity
on
05/1
2/20
14 1
1:33
:51.
View Article Online
the degree of distortion from the inversion symmetry of thelocal environment around Eu3+ in the host matrix and isknown as the asymmetry ratio. This ratio for different concen-trations of Li+ doping has been calculated by considering thearea under the 615 nm and 593 nm peaks of the PL curve. Vari-ation of the asymmetric ratio for different concentrations ofLi+ content is shown in Fig. S5 of the ESI.† The figure clearlyreveals that Li+ co-doping in the MgAl2O4:Eu
3+ nanophosphorincreases the asymmetry ratio a considerable amount.Enhancement of PL brightness of the MgAl2O4:Eu
3+, Li+ nano-phosphors is also accompanied by the improvement of colourcoordinates, which can be clearly seen from the CIE chroma-ticity diagram shown in the bottom right inset of Fig. 5(a) and5(b). Decrease in the y coordinate along with the increase in xcoordinate in the chromaticity diagram confirms the bettercolour purity of the Li+ co-doped samples. This red shift ofcolour coordinates suggests that Li+ co-doped nanophosphorsare more suitable for use in lighting and display purposes.
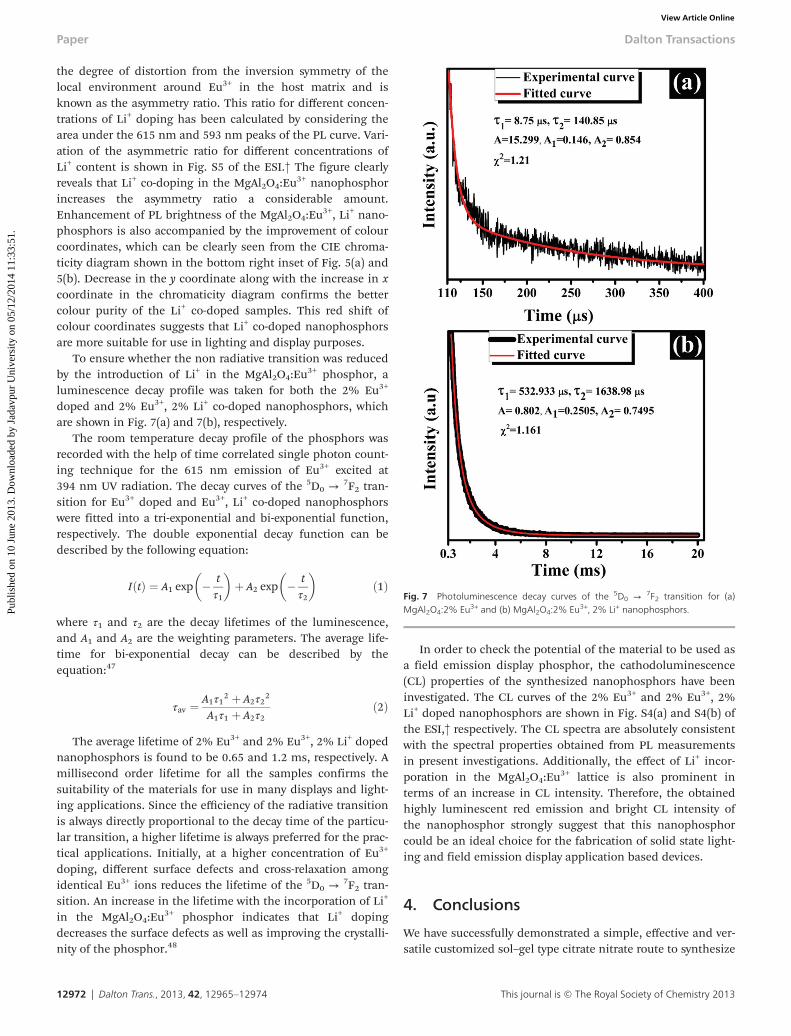
To ensure whether the non radiative transition was reducedby the introduction of Li+ in the MgAl2O4:Eu
3+ phosphor, aluminescence decay profile was taken for both the 2% Eu3+
doped and 2% Eu3+, 2% Li+ co-doped nanophosphors, whichare shown in Fig. 7(a) and 7(b), respectively.
The room temperature decay profile of the phosphors wasrecorded with the help of time correlated single photon count-ing technique for the 615 nm emission of Eu3+ excited at394 nm UV radiation. The decay curves of the 5D0 → 7F2 tran-sition for Eu3+ doped and Eu3+, Li+ co-doped nanophosphorswere fitted into a tri-exponential and bi-exponential function,respectively. The double exponential decay function can bedescribed by the following equation:
IðtÞ ¼ A1 exp � tτ1
� �þ A2 exp � t
τ2
� �ð1Þ
where τ1 and τ2 are the decay lifetimes of the luminescence,and A1 and A2 are the weighting parameters. The average life-time for bi-exponential decay can be described by theequation:47
τav ¼ A1τ12 þ A2τ22
A1τ1 þ A2τ2ð2Þ
The average lifetime of 2% Eu3+ and 2% Eu3+, 2% Li+ dopednanophosphors is found to be 0.65 and 1.2 ms, respectively. Amillisecond order lifetime for all the samples confirms thesuitability of the materials for use in many displays and light-ing applications. Since the efficiency of the radiative transitionis always directly proportional to the decay time of the particu-lar transition, a higher lifetime is always preferred for the prac-tical applications. Initially, at a higher concentration of Eu3+
doping, different surface defects and cross-relaxation amongidentical Eu3+ ions reduces the lifetime of the 5D0 → 7F2 tran-sition. An increase in the lifetime with the incorporation of Li+
in the MgAl2O4:Eu3+ phosphor indicates that Li+ doping
decreases the surface defects as well as improving the crystalli-nity of the phosphor.48
In order to check the potential of the material to be used asa field emission display phosphor, the cathodoluminescence(CL) properties of the synthesized nanophosphors have beeninvestigated. The CL curves of the 2% Eu3+ and 2% Eu3+, 2%Li+ doped nanophosphors are shown in Fig. S4(a) and S4(b) ofthe ESI,† respectively. The CL spectra are absolutely consistentwith the spectral properties obtained from PL measurementsin present investigations. Additionally, the effect of Li+ incor-poration in the MgAl2O4:Eu
3+ lattice is also prominent interms of an increase in CL intensity. Therefore, the obtainedhighly luminescent red emission and bright CL intensity ofthe nanophosphor strongly suggest that this nanophosphorcould be an ideal choice for the fabrication of solid state light-ing and field emission display application based devices.
4. Conclusions
We have successfully demonstrated a simple, effective and ver-satile customized sol–gel type citrate nitrate route to synthesize
Fig. 7 Photoluminescence decay curves of the 5D0 → 7F2 transition for (a)MgAl2O4:2% Eu3+ and (b) MgAl2O4:2% Eu3+, 2% Li+ nanophosphors.
Paper Dalton Transactions
12972 | Dalton Trans., 2013, 42, 12965–12974 This journal is © The Royal Society of Chemistry 2013
Publ
ishe
d on
10
June
201
3. D
ownl
oade
d by
Jad
avpu
r U
nive
rsity
on
05/1
2/20
14 1
1:33
:51.
View Article Online
Eu3+ doped and Eu3+, Li+ co-doped MgAl2O4 nanophosphorswith a wide range of Eu3+ and Li+ concentrations. The resultingnanophosphors exhibit hypersensitive red emission peaking at615 nm upon 394 nm excitation. All the samples showed thecharacteristic emission of Eu3+, i.e. 5D0 → 7Fj ( j = 1–4), underUV and low voltage electron beam (900 V) excitation. Further-more, we have examined the comparative photoluminescence(PL) of the Eu3+ doped and Eu3+ doped-Li+ co-doped mag-nesium aluminate (Li+ co-doped MgAl2O4:Eu
3+) nanopho-sphors, which established that Li+ co-doping enhances thebrightness of the phosphors with good crystallinity. Moreover,the addition of a Li+ co-activator in the MgAl2O4:Eu
3+ latticedemonstrates the charge compensation, which led to thedouble enhancement of PL intensity. Therefore, the obtainedhighly luminescent and stable emission of these nanopho-sphors could be an ultimate choice for solid state lightingbased on the InGaN LED chips and field emission displayapplications.
Acknowledgements
The authors acknowledge the financial support from theCouncil of Scientific and Industrial Research (CSIR), theGovernment of India, for awarding a Senior Research Fellow-ship during the execution of the work. We also wish to thankthe Department of Science & Technology (DST), the UniversityGrants Commission for ‘University with Potential for Excel-lence scheme (UPE-II)’ the Government of India for financialhelp.
Notes and references
1 W. N. Wang, F. Iskandar, K. Okuyama and Y. Shinomiya,Adv. Mater., 2008, 20, 3422.
2 F. Du, R. Zhu, Y. Huang, Y. Tao and H. Jin Seo, DaltonTrans., 2011, 40, 11433.
3 J. Choi, T. K. Tseng, M. Davidson and P. H. Holloway,J. Mater. Chem., 2011, 21, 3113.
4 C. Feldmann, T. Jüstel, C. Ronda and P. Schmidt, Adv.Funct. Mater., 2003, 13, 511.
5 T. Justel, Nanoscale, 2011, 3, 1947.6 H. A. Hoppe, Angew. Chem., Int. Ed., 2009, 48, 3572.7 Y. Liu, D. Tu, H. Zhu, R. Li, W. Luo and X. Chen, Adv.
Mater., 2010, 22, 3266.8 L. Li, Y. Su and G. Li, J. Mater. Chem., 2010, 20, 459.9 C. X. Li, P. A. Ma, P. P. Yang, Z. H. Xu, G. G. Li, D. M. Yang,
C. Peng and J. Lin, CrystEngComm, 2011, 13, 1003.10 S. Wang, R. Deng, H. Guo, S. Song, F. Cao, X. Li, S. Su and
H. Zhang, Dalton Trans., 2010, 39, 9153.11 X. Y. Chen, C. Ma, X. X. Li, C. W. Shi, X. L. Li and D. R. Lu,
J. Phys. Chem. C, 2009, 113, 2685.12 R. J. Wiglusz and T. Grzyb, Opt. Mater., 2011, 33, 1506.13 S. Saha, B. Das, N. Mazumder, A. Bharati and
K. K. Chattopadhyay, J. Sol-Gel Sci. Technol., 2012, 61, 526.
14 K. S. Bartwal, H. Ryu, M. G. Brik and I. Sildos, Opt. Mater.,2010, 32, 1329.
15 X. M. Han, J. Lin, R. B. Xing, J. Fu, S. B. Wang andY. C. Han, J. Phys.: Condens. Matter, 2003, 15, 2115.
16 B. Omkaram, V. Rao and S. Buddhudu, J. Alloys Compd.,2009, 474, 565.
17 R. J. Wiglusz, T. Grzyb, S. Lis and W. Strek, J. Lumin., 2010,130, 434.
18 R. J. Wiglusz, T. Grzyb, S. Lis and W. Strek, J. Nanosci.Nanotechnol., 2009, 9, 5803.
19 D. Geng, G. Li, M. Shang, C. Peng, Y. Zhang, Z. Cheng andJ. Lin, Dalton Trans., 2012, 41, 3078.
20 D. Geng, M. Shang, D. Yang, Y. Zhang, Z. Cheng and J. Lin,Dalton Trans., 2012, 41, 14042.
21 R. Balakrishnaiah, S. S. Yi, K. Jang, H. S. Lee, B. K. Moonand J. H. Jeong, Mater. Res. Bull., 2011, 46, 621.
22 H. K. Yang, H. Choi, B. K. Moon, B. C. Choi, J. H. Jeong,J. H. Kim and K. H. Kim, Solid State Sci., 2010, 12, 1445.
23 N. Dhananjaya, H. Nagabhushana, B. M. Nagabhushana,B. Rudraswamy, C. Shivakumara and R. P. S. Chakradhar,J. Alloys Compd., 2011, 509, 2368.
24 Z. Mu, Y. Hu, L. Chen and X. Wang,Opt. Mater., 2011, 34, 89.25 Y. Chen, H. K. Yang, S. W. Park, B. K. Moon, B. C. Choi,
J. H. Jeong and K. H. Kim, J. Alloys Compd., 2012, 511, 123.26 J. Y. Han, W. B. Im, G. Y. Lee and D. Y. Jeon, J. Mater.
Chem., 2012, 22, 8793.27 W. D. Callister, Materials science and engineering—an intro-
duction, Wiley, New York, 2007.28 F. Gu, C. Z. Li and H. B. Jiang, J. Cryst. Growth, 2006, 289,
400.29 F. Gu, S. F. Wang, M. K. Lu, G. J. Zhou, D. Xu and
D. R. Yuan, Langmuir, 2004, 20, 3528.30 J. Y. Cho, Y. R. Do and Y. D. Huh, Appl. Phys. Lett., 2006, 89,
131915.31 S. H. Shin, J. H. Kang, D. Y. Jeon and D. S. Zang, J. Lumin.,
2005, 114, 275.32 W. Li and J. Lee, J. Phys. Chem. C, 2008, 112, 11679.33 H. H. Yang, H. Cheng, Y. G. Tang and Z. G. Lu, J. Am.
Ceram. Soc., 2009, 92, 931.34 X. Liu, B. Liu, M. Gu, L. Xiao and X. Xu, Solid State
Commun., 2006, 137, 162.35 J. Guo, H. Lou, H. Zhao, X. Wang and X. Zheng, Mater.
Lett., 2004, 58, 1920.36 M. F. Zawrah, Mater. Sci. Eng., A, 2004, 382, 362.37 F. Mercier, C. Alliot, L. Bion, N. Thromat and P. Toulhoat,
J. Electron Spectrosc. Relat. Phenom., 2006, 150, 21.38 F. Zhao, H. L. Sun, S. Gao and G. Su, J. Mater. Chem., 2005,
15, 4209.39 J. Yang, X. Li, J. Lang, L. Yang, M. Wei, M. Gao, X. Liu,
H. Zhai, R. Wang, Y. Liu and J. Cao, Mater. Sci. Semicond.Process., 2011, 14, 247.
40 G. Blasse, J. Chem. Phys., 1966, 45, 2356.41 T. Igrashi, M. Ihara, T. Kusunoki and K. Ohno, Appl. Phys.
Lett., 2000, 76, 1549.42 R. F. Qiang, S. Xiao, J. W. Ding, W. Yuan and C. Zhu,
J. Lumin., 2009, 129, 826.
Dalton Transactions Paper
This journal is © The Royal Society of Chemistry 2013 Dalton Trans., 2013, 42, 12965–12974 | 12973
Publ
ishe
d on
10
June
201
3. D
ownl
oade
d by
Jad
avpu
r U
nive
rsity
on
05/1
2/20
14 1
1:33
:51.
View Article Online
43 J. H. Jeong, H. K. Yang, K. S. Shim, Y. R. Jeong, B. K. Moon,B. C. Choi, J. S. Bae, S. S. Yi and J. H. Kim, Appl. Surf. Sci.,2007, 253, 8273.
44 Q. Ma, Y. Zhou, A. Zhang, M. Lu, G. Zhou and C. Li, SolidState Sci., 2009, 11, 1124.
45 J. S. Bae, S. B. Kim, J. H. Jeong, J. C. Park, D. K. Kim,S. H. Byeon and S. S. Yi, ThinSolid Films, 2005, 471, 224.
46 S. S. Yi, J. S. Bae, K. S. Shim, J. H. Jeong and J. C. Park,Appl. Phys. Lett., 2004, 84, 353.
47 B. K. Gupta, V. R. Tharangattu, N. Narayanan,P. Thanikaivelan, A. Saha, Govind, S. P. Singh, V. Shanker,A. A. Marti, Pulickel andM. Ajayan, Small, 2011, 7(13), 1767.
48 J. Choi, T. K. Tseng, M. Davidson and P. H. Holloway,J. Mater. Chem., 2011, 21, 3113.
Paper Dalton Transactions
12974 | Dalton Trans., 2013, 42, 12965–12974 This journal is © The Royal Society of Chemistry 2013
Publ
ishe
d on
10
June
201
3. D
ownl
oade
d by
Jad
avpu
r U
nive
rsity
on
05/1
2/20
14 1
1:33
:51.
View Article Online


