Embed Size (px)
Citation preview
ChDc/1; DRAUGHTSMANSHIP AND CARTOGRAPHY BEFORE HISTORY THE 1457 WORLD MAP, GENOESE, YES! PAR EXAMPLI.
AbstractThere are few cartographers writing today about historical maps. Practically all papers we read in journals are by historians, with attendance at, plus subjectivity of conferences which purport to concern cartographical matters, by historians only.
Thus by using a single text concerning the 1457 World Map, ( dated 2013), and reviewing it with a draughtsman’s perspective a revised view of the Map is obtained which in fact negates the symbolism of the original text and underlinesits geographical origination. 1. INTRODUCTION
All too often research texts’ concerning early maps concentrate upon the visual feast that the cartographer has provided as adornment or the storyline of the text cartouches.This can be acceptable research as from it we learn of the knowledge available at the time of the maps conception, how travellers have described landscapes and how the cartographer has incorporated that knowledge. But, in virtually every text written, including the most respected tome regarding cartography, -The History of Cartography- published by Chicago University, there is no definitive forensic examination of howmaps were drawn, thus, a full understanding of the process required to draw the basic map is missing.
If the basic map was not drawn, constructed by geometric means, both simple and complicated, there would be no -canvas-to add those cartouches, animal or human sketches or fanciful grotesques from the historical record and mythology. This myopia may be likened to the adage, -cannot see the wood for the trees. 2. A Basic Theory for Cartographic ResearchOne of the foremost geographers of the 20th century, Professor
1
Gaetano Ferro1 (1925-2003), late Professor of Geography and President of the Italian Geographical Society, wrote in 1996 the following (abstracted) text, and even found a methodology to highlight his main concern by the use of [brackets] in accentuating a portion of the text. I quote there from:
“Cartography and geography in particular are closely connected, as various examples will show, since the former, as everyone knows, is concerned with depicting the facts that the latter studies.”
“Nowadays there is often talk (possibly too often, in my opinion) of the image of the territory created by the people who live there or travel through it, and much space is given to the related discussions about the means through which such an image is formed and passed on by way of the most diverse experiences”.
“I personally do not believe, however, in a typology of exceedingly specialized geography, nor in the mania for novelty, nor in the resulting abstractions, distilled inone’s study with such elaborate sophistication”.
“On the contrary, I am convinced that cartographic documents of the past cannot be adequately studied and understood unless one first takes into account theculture that they express [and the methods by which they were constructed], on the one hand, and the aims and objectives for which they were intended, on the other”
1 Gaetano Ferro, The Genoese Cartographic Tradition and Christopher Columbus. Trans. TheOhio State University (Rome. Istituto Poligrafico E Zecca Dello Stato, Libreria Dello Stato, 1996). pp 8-9
2
.
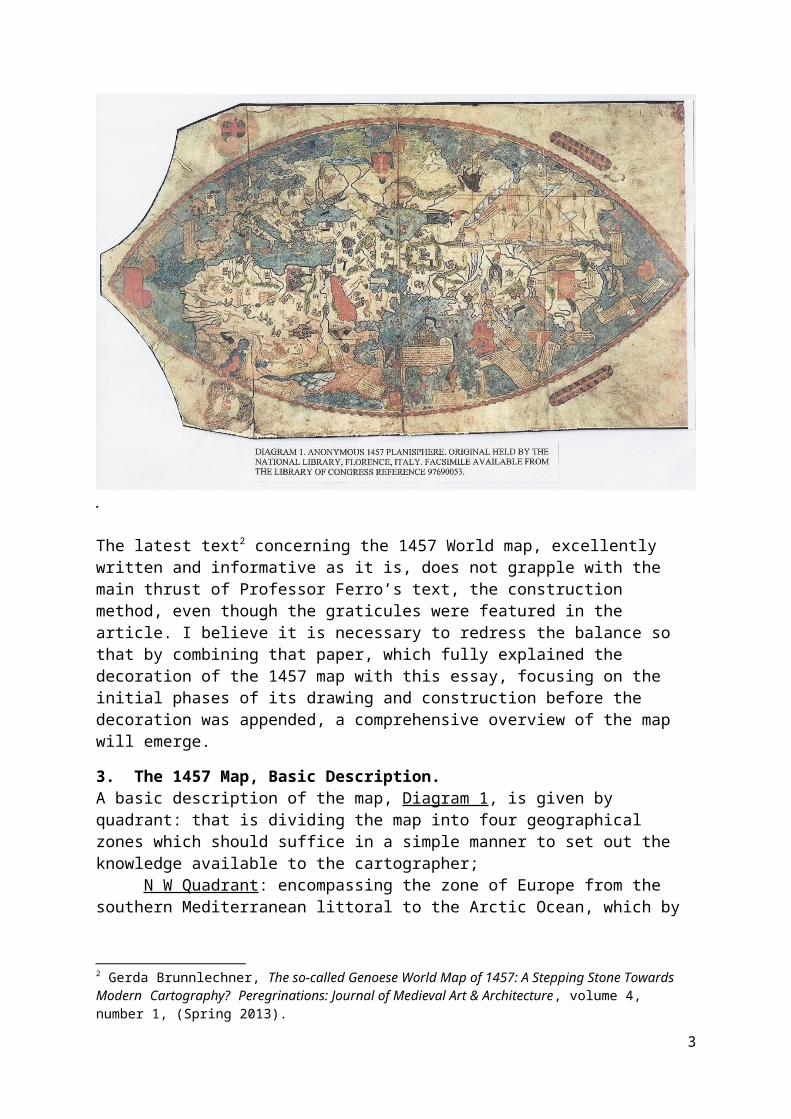
The latest text2 concerning the 1457 World map, excellently written and informative as it is, does not grapple with the main thrust of Professor Ferro’s text, the construction method, even though the graticules were featured in the article. I believe it is necessary to redress the balance so that by combining that paper, which fully explained the decoration of the 1457 map with this essay, focusing on the initial phases of its drawing and construction before the decoration was appended, a comprehensive overview of the map will emerge.
3. The 1457 Map, Basic Description.A basic description of the map, Diagram 1, is given by quadrant: that is dividing the map into four geographical zones which should suffice in a simple manner to set out the knowledge available to the cartographer;
N W Quadrant: encompassing the zone of Europe from the southern Mediterranean littoral to the Arctic Ocean, which by
2 Gerda Brunnlechner, The so-called Genoese World Map of 1457: A Stepping Stone Towards Modern Cartography? Peregrinations: Journal of Medieval Art & Architecture, volume 4, number 1, (Spring 2013).
3
1457 had been mapped for two centuries and Portolan Charts3 exist to amply illustrate this point.
S W Quadrant: encompassing Africa to its extremities, butit is obviously a quadrant of two parts. The north, which is the Mediterranean littoral, and the north east, the Red Sea and the Indian Ocean which were documented well before our common era. The west coast was explored from the Pillars of Hercules to at least Cape Verde by 1448 as evidenced by the chart of Andrea Bianco4 and in all probability to the eastern turn of the coastline and the Gulf of Guinea or Bight of Benin5.The southern half of Africa, however, was still terra incognito, that is, if the text of the Voyage of Hanno the Carthaginian (570-450BC), or Herodotus of Halicarnassus (490-425BC)6 is to be believed.
N E Quadrant: encompasses wild and largely uncharted, unexplored lands, but the southern portion includes the Silk Road to Xian China, which was known to the Romans who importedsilk. Part of this route was taken by Alexander the Great and is of course the subject of the texts of Marco Polo (1254?-1324) and Niccolo De Conti (c1395-1469) the Venetian travelleror merchant-adventurer who reached southern China. The dividing line of this quadrant is formed by the Imaus Mountains, now the Himalayas, which Claudius Ptolemy places correctly at 36N.
S E Quadrant: extends from the Red Sea to China and from the Imaus Mountains to below the Equator. It is basically the Indian Sub-Continent and the Far East. What has been drawn in the 1457 map undoubtedly reflects the co-ordinates of ClaudiusPtolemy, Book 7, Chapter 1, “India, this side of the Ganges”.
3 Ramon J Pujades, “Les Cartes Portolanes”, (Barcelona, Institut Cartografic de Catalunya,2007) pp410-522.4 Andrea Bianco, 1448, Atlante Nautico. (Venice,Arsenale Editrice per Banco SanMarco, 1993).5 J H Parry, “The Age of Reconnaisance”.(London. Weidenfeld and Nicolson) pp 146-161 S A Bedini, ed. Christopher Columbus and the Age of Exploration, An Encyclopedia. (NewYork, Da Capo Press, 1964). pp 249-266.6 Herodotus, The Histories, (trans. A. de Selincourt). (London, Penguin Books, 1976) section 4:42 pp282-285.
4
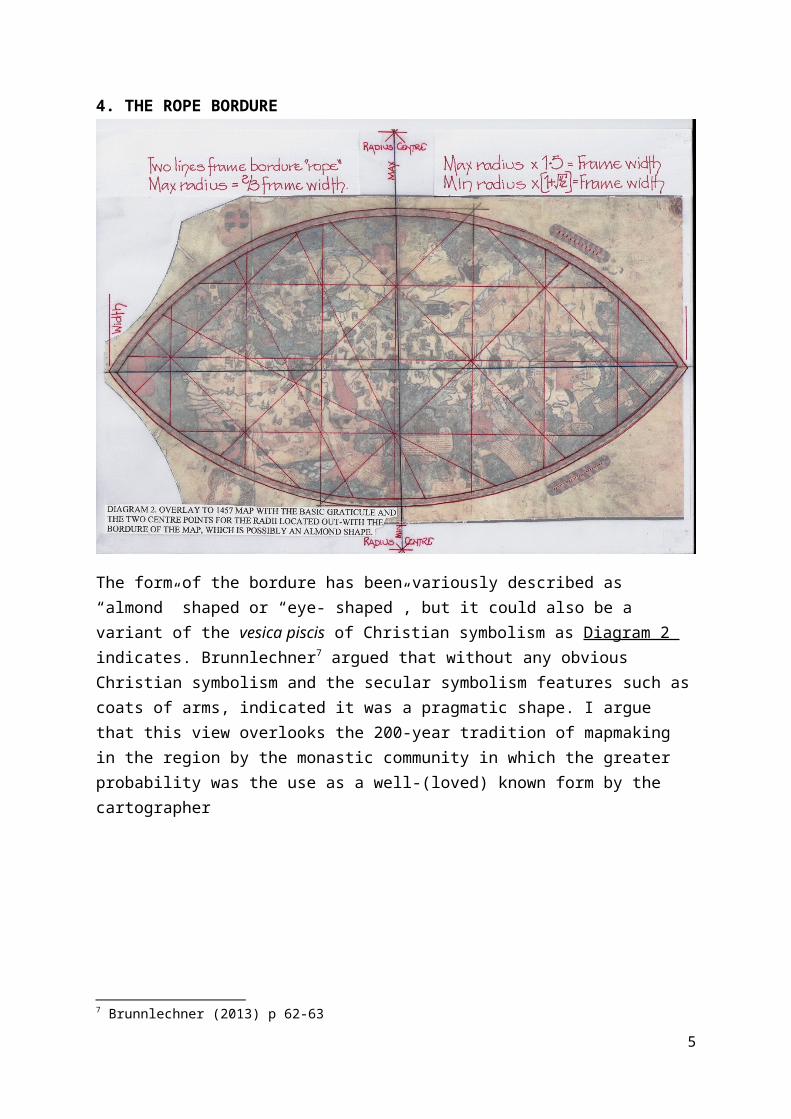
4. THE ROPE BORDURE
The form of the bordure has been variously described as “almond” shaped or “eye- shaped”, but it could also be a variant of the vesica piscis of Christian symbolism as Diagram 2 indicates. Brunnlechner7 argued that without any obvious Christian symbolism and the secular symbolism features such ascoats of arms, indicated it was a pragmatic shape. I argue that this view overlooks the 200-year tradition of mapmaking in the region by the monastic community in which the greater probability was the use as a well-(loved) known form by the cartographer
7 Brunnlechner (2013) p 62-63
5
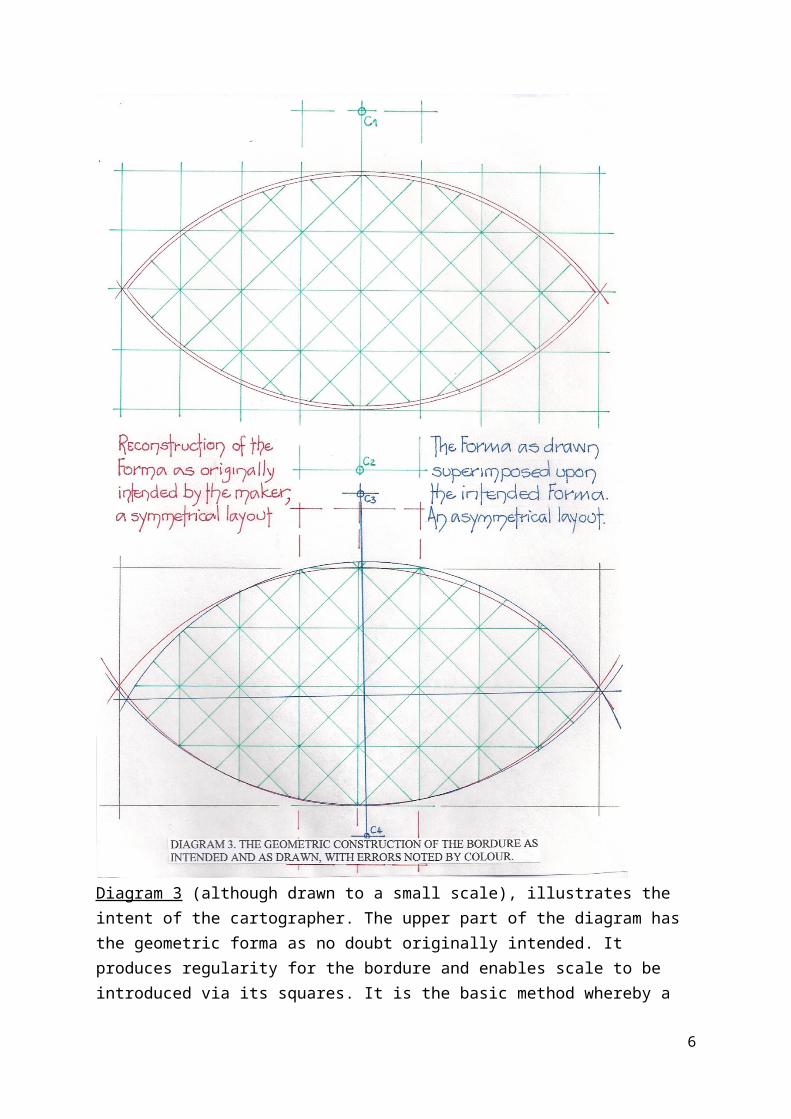
Diagram 3 (although drawn to a small scale), illustrates the intent of the cartographer. The upper part of the diagram has the geometric forma as no doubt originally intended. It produces regularity for the bordure and enables scale to be introduced via its squares. It is the basic method whereby a
6
shape can be set out and the scale controlled.The second part of Diagram 3 is a comparison of the putative forma and the actual forma for the –almond- shape bordure. Theproblem, as can immediately be seen, is one of an error in draughtsmanship. It is obvious from the size of the vellum used that the centre points for the design shape were not located upon the vellum or parchment sheet, which would in allprobability be affixed to a table or similar for the drawing exercise.
5. ORIGINAL ARTICLEIn her article, figure 2, Brunnlechner illustrated the “So-called Genoese World map, with rhumb lines retraced by the author.” But, unfortunately, this obscured the logic of the original format, the necessary order of drawing, hiding the real purpose of this graticule and its implications. Of course, this was not the purpose of her article, which studiedthe map’s spatial conception. Nonetheless the interpretation could be strengthened and better portrayed by understanding that space had to be determined both geographically and by measurement, that is the graticule.
To make this evident, Diagrams 2 and 3 herein have the simplified graticules.To explicate where the misunderstanding might have occurred, it is necessary at this juncture to quote directly from Brunnlechner’s article.
“Map Scales and Rhumb lines; On the way to Modern Cartography ““The mapmaker painted two scales outside the map’s frame, one indicating 100- and the other 50-mile increments. Whether the mapmaker took
measured distances as the basis for his scales or whether he painted scales as pretence is irrelevant to a study of the map’s spatial conception. The important thing is his purpose, about which we can only hypothesize. Naturally, scalessuggest space defined purely by measurement, not space defined by meaning. But this does not automatically imply a homogeneous conception of space. Did the mapmaker want to give every point on this map equal value? Or do the scales just indicate that he valued a near- natural depiction of the world.
The system of rhumb lines the mapmaker used is clearly reminiscent of
7
Portolan Charts, whose coastlines are shown on the Genoese map as well. Theinclusion of this system could be interpreted as an attempt at spatial
accuracy. Connecting the frame of the map and its rhumb system, Osvaldo Baldacci suggests that the mapmaker tried to unite Strabo’s scallop form of the world and Marinus of Tyre’s grid. In Figure 2, the lines, still partly visible on a digitized reproduction in possession of the author, are retraced. Even if these lines are connected to Marinus’s projection, there is not much known about Marinus’s grid due to the lack of source material. However, on the Genoese World map, no projection method was used, and the rhumb line system seems unfinished- either this or it is deliberately concentrated on Europe, West Asia, and the Indian Ocean. If the map is unfinished, this indicates that these lines were not important for the construction or the use of the map. If, on the other hand, the map is finished as it stands, one might expect the rhumb lines to
concentrate on the areas modelled on portolan charts. But this is not the case, as the node in the Indian Ocean, about which no measurements were known, is the most prominent one. Moreover, the lines cover much ground onshore, whichmakes its use for navigational purposes seem unlikely. But, then, perhaps the mapmaker simply wanted to emphasize certain regions.
As with the frame of the map, its scales and rhumb system does not point clearly to a homogeneous or a heterogeneous conception of space, yet the mapmaker valued a near-natural depiction of the world. He explicitly declares this,using golden letters on red background, in the most elaborate cartouche of the map (in the extreme west). ‘This is the true [vera] description in agreement with Marinos, having rejected the frivolous tales of certain cosmographers. 1457.”
The mapmaker not only writes that he takes his description of the world to be true, but that he eliminated tales he thought untrue. It is most interesting to note that, for him, tales, narrations, are an important part of the map, and that those he included he took to be true.” 8
8 Brunnlechner, 2013, p68.
8
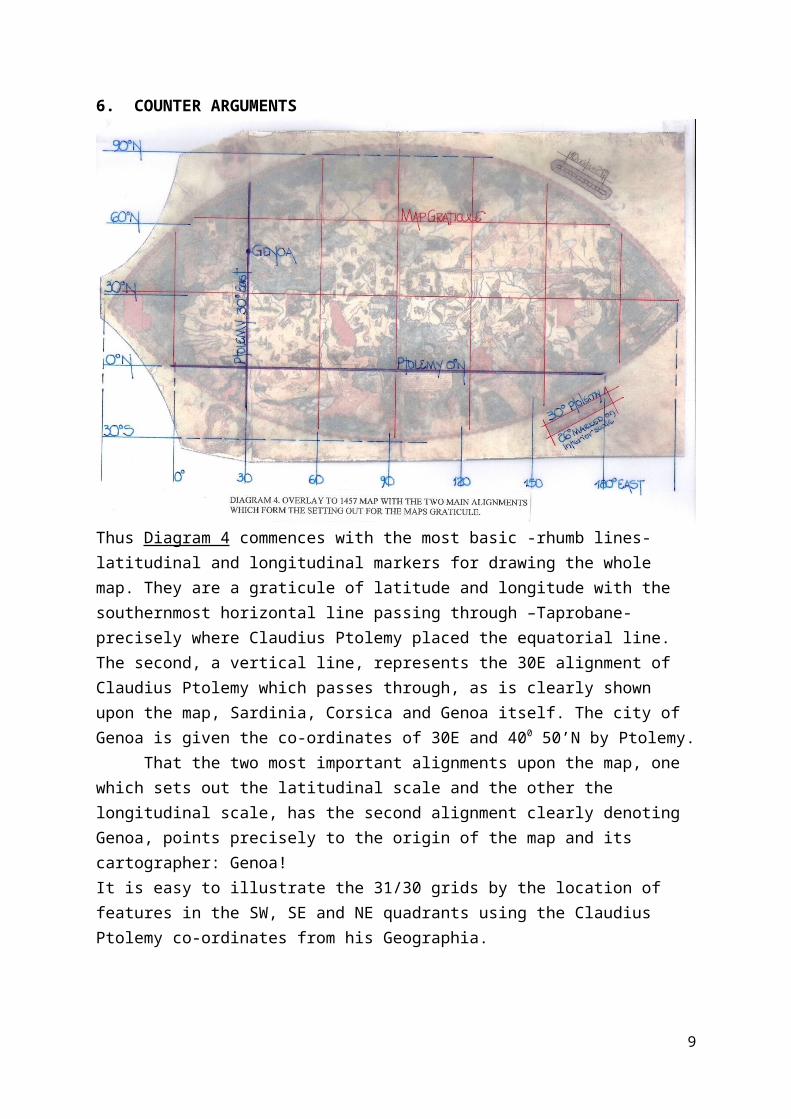
6. COUNTER ARGUMENTS
Thus Diagram 4 commences with the most basic -rhumb lines- latitudinal and longitudinal markers for drawing the whole map. They are a graticule of latitude and longitude with the southernmost horizontal line passing through –Taprobane- precisely where Claudius Ptolemy placed the equatorial line. The second, a vertical line, represents the 30E alignment of Claudius Ptolemy which passes through, as is clearly shown upon the map, Sardinia, Corsica and Genoa itself. The city of Genoa is given the co-ordinates of 30E and 400 50’N by Ptolemy.
That the two most important alignments upon the map, one which sets out the latitudinal scale and the other the longitudinal scale, has the second alignment clearly denoting Genoa, points precisely to the origin of the map and its cartographer: Genoa!It is easy to illustrate the 31/30 grids by the location of features in the SW, SE and NE quadrants using the Claudius Ptolemy co-ordinates from his Geographia.
9
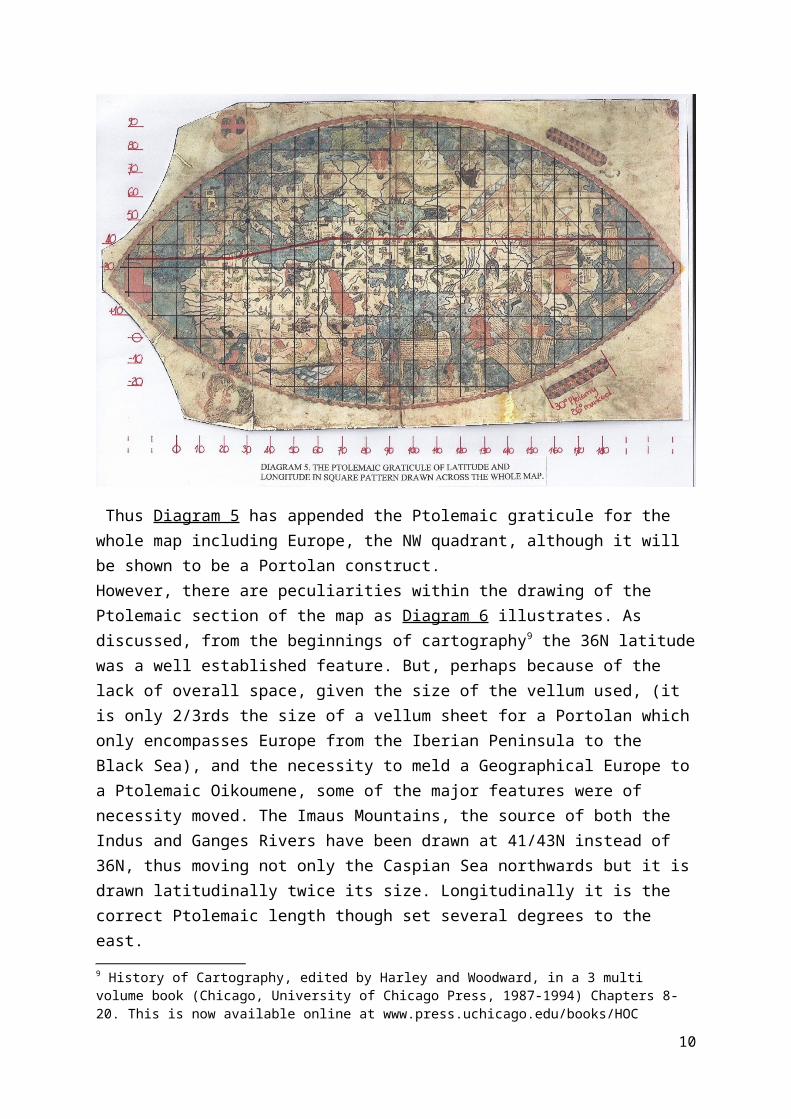
Thus Diagram 5 has appended the Ptolemaic graticule for the whole map including Europe, the NW quadrant, although it will be shown to be a Portolan construct.However, there are peculiarities within the drawing of the Ptolemaic section of the map as Diagram 6 illustrates. As discussed, from the beginnings of cartography9 the 36N latitudewas a well established feature. But, perhaps because of the lack of overall space, given the size of the vellum used, (it is only 2/3rds the size of a vellum sheet for a Portolan whichonly encompasses Europe from the Iberian Peninsula to the Black Sea), and the necessity to meld a Geographical Europe toa Ptolemaic Oikoumene, some of the major features were of necessity moved. The Imaus Mountains, the source of both the Indus and Ganges Rivers have been drawn at 41/43N instead of 36N, thus moving not only the Caspian Sea northwards but it isdrawn latitudinally twice its size. Longitudinally it is the correct Ptolemaic length though set several degrees to the east.9 History of Cartography, edited by Harley and Woodward, in a 3 multi volume book (Chicago, University of Chicago Press, 1987-1994) Chapters 8-20. This is now available online at www.press.uchicago.edu/books/HOC
10
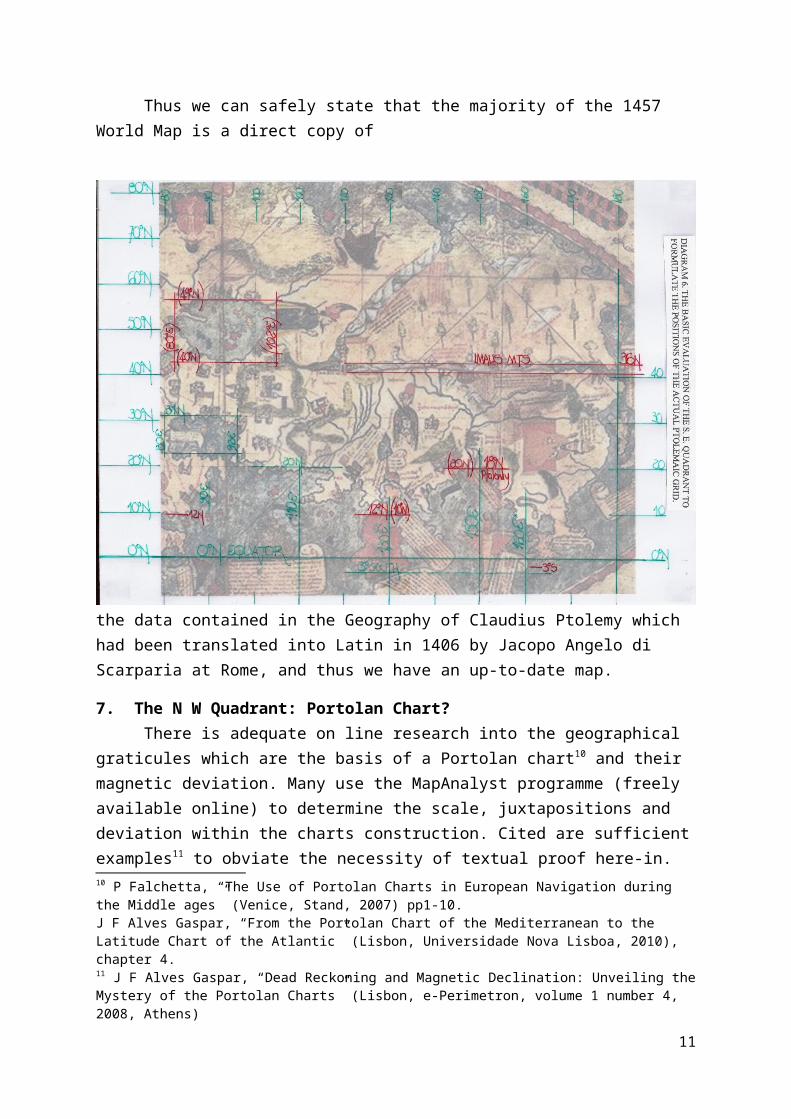
Thus we can safely state that the majority of the 1457 World Map is a direct copy of
the data contained in the Geography of Claudius Ptolemy which had been translated into Latin in 1406 by Jacopo Angelo di Scarparia at Rome, and thus we have an up-to-date map.
7. The N W Quadrant: Portolan Chart?There is adequate on line research into the geographical
graticules which are the basis of a Portolan chart10 and their magnetic deviation. Many use the MapAnalyst programme (freely available online) to determine the scale, juxtapositions and deviation within the charts construction. Cited are sufficientexamples11 to obviate the necessity of textual proof here-in.10 P Falchetta, “The Use of Portolan Charts in European Navigation during the Middle ages” (Venice, Stand, 2007) pp1-10.J F Alves Gaspar, “From the Portolan Chart of the Mediterranean to the Latitude Chart of the Atlantic” (Lisbon, Universidade Nova Lisboa, 2010), chapter 4.11 J F Alves Gaspar, “Dead Reckoning and Magnetic Declination: Unveiling theMystery of the Portolan Charts” (Lisbon, e-Perimetron, volume 1 number 4, 2008, Athens)
11
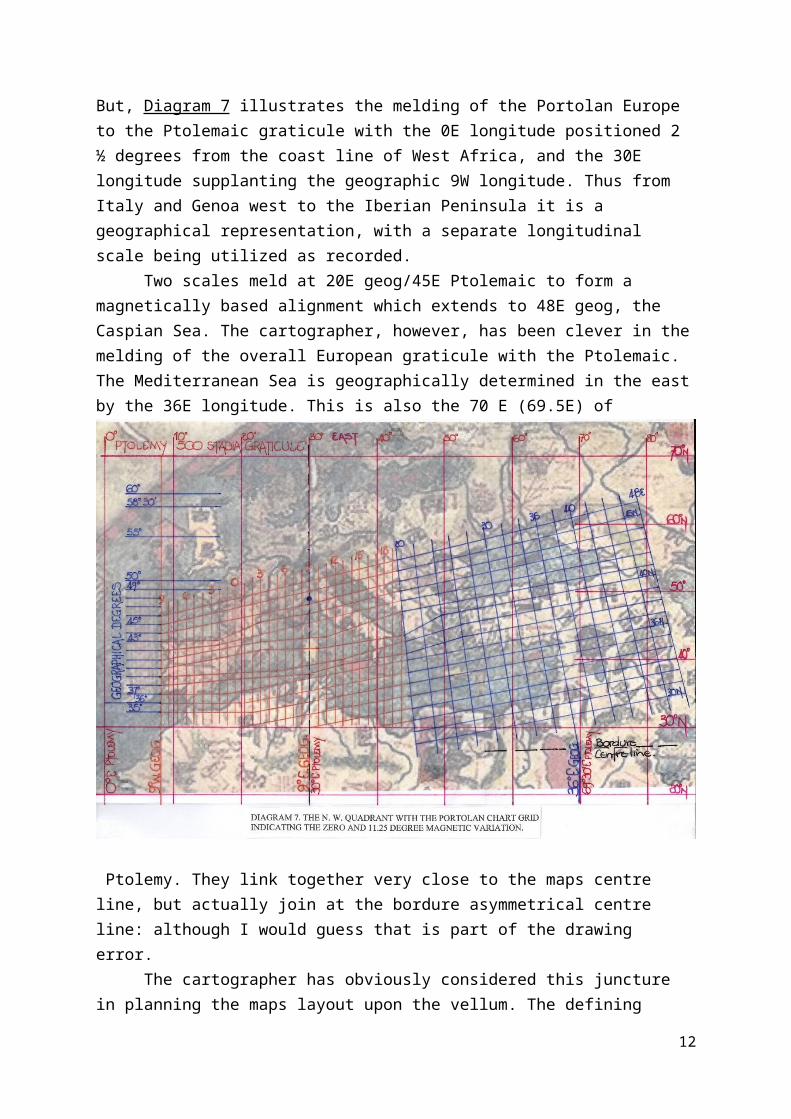
But, Diagram 7 illustrates the melding of the Portolan Europe to the Ptolemaic graticule with the 0E longitude positioned 2 ½ degrees from the coast line of West Africa, and the 30E longitude supplanting the geographic 9W longitude. Thus from Italy and Genoa west to the Iberian Peninsula it is a geographical representation, with a separate longitudinal scale being utilized as recorded.
Two scales meld at 20E geog/45E Ptolemaic to form a magnetically based alignment which extends to 48E geog, the Caspian Sea. The cartographer, however, has been clever in themelding of the overall European graticule with the Ptolemaic. The Mediterranean Sea is geographically determined in the eastby the 36E longitude. This is also the 70 E (69.5E) of
Ptolemy. They link together very close to the maps centre line, but actually join at the bordure asymmetrical centre line: although I would guess that is part of the drawing error.
The cartographer has obviously considered this juncture in planning the maps layout upon the vellum. The defining
12
feature of the eastern Mediterranean is the Gulf of Issus at 36E. The length of the Mediterranean is not determined by the Portolan Chart, as the Portolan Chart has a much shorter length longitudinally than the Ptolemaic map. Thus we see the 36E geographical equals the 69.5 (70)E of Ptolemy and the cartographer can just fill the void of the Mediterranean Sea area with a map of suitable scale. Thus, with from 2.5E to 69.5E Ptolemaic degrees, that is 67 degrees longitude to utilize and only a geographic length of 9W to 36E or 45 degrees of longitude to accommodate, the cartographer could expand the scale of the Portolan portion of the map to suit. It leads to the conclusion that there was a large amount of preplanning before the map was drawn particularly to align thePtolemaic 30E to the geographical 9W and thus pin-point Genoa.
8. CONCLUSIONThus perhaps it is not wise to consider maps portraying
mostly a spatial model when in not being able to dissect theirinner workings the fundamentals of the map, its scale and geometry, authors project their limited (albeit useful in other contexts) view, or the view they consider applicable from the maps decoration. The cartographer may have had to fulfil the requirements of a client, for what would he have drawn left to his own devices?Examination of cartographical draughtsmanship before historical text is therefore necessary.
13


![Funkcjonowanie Wielkiego Refektarza w czasach krzyżackich (do 1457), [w:] Wielki Refektarz](https://img.pdfslide.net/doc/110x75/63576c1f5108319c8703c32d/funkcjonowanie-wielkiego-refektarza-w-czasach-krzyzackich-do-1457-w-wielki.jpg)


