Embed Size (px)
Citation preview

lable at ScienceDirect
Building and Environment 46 (2011) 999e1010
Contents lists avai
Building and Environment
journal homepage: www.elsevier .com/locate/bui ldenv
Chemical and microbial effects of atmospheric particles on the performance ofsteep-slope roofing materials
Meng-Dawn Cheng a,*, Susan M. Pfiffner a,b, William A. Miller a, Paul Berdahl c
aOak Ridge National Laboratory, PO Box 2008, MS 6038, Oak Ridge, TN 37831, United StatesbUniversity of Tennessee, Center for Environmental Biotechnology, Knoxville, TN 37996, United Statesc Lawrence Berkeley National Laboratory, Berkeley, CA 94720, United States
a r t i c l e i n f o
Article history:Received 2 September 2010Received in revised form12 October 2010Accepted 27 October 2010Available online 11 November 2010
Keywords:AerosolCarbonCompositionDepositionEmittanceLipids
* Corresponding author. Tel.: þ1 865 241 5918.E-mail address: [email protected] (M.-D. Cheng)
0360-1323/$ e see front matter � 2010 Elsevier Ltd.doi:10.1016/j.buildenv.2010.10.025
a b s t r a c t
The reflectivity of a roof is a critical component in design of strategy to reduce overall building energyusage. Airborne particulate matter that settles on a roof can either reflect or absorb incoming solarradiation. The light scattering and absorption processes occur within a few microns of the surface thataffects the solar reflectance of the roof. The long-term loss of roof reflectivity appears driven by theability of the atmospheric particulate matter to cling onto the roof and resist being washed off by windand or rain. Contaminants collected from samples of roof products exposed at seven California sites forabout one and a half years were analysed for major and trace elements and carbons to assist charac-terization of the chemical profile of the atmospheric particles that soil each roof sample. The chemicalcomposition of the accumulated particles was very similar across the state of California; there was noclear distinction from one region to another. Elemental carbon did not contribute significantly to the lossof solar reflectance as initially expected. Dust particles and organic carbon compensated for the loss ofsolar reflectance due to elemental carbon possibly because some crystalline forms of these elementswere light reflecting and contributed to the solar reflectance. Differences in microbial communities andbiomass were seen between the various materials. Abundance of microbial biomass on roof tiles appearsto be related to the composition/surface structure of the tile. Cyanobacteria or fungi represent thedominant player.
� 2010 Elsevier Ltd. All rights reserved.
1. Introduction
Having a roof over someone’s head represents an importantshelter function; however, roof also has several practical functions toa building. For example, awhite roof reflects light better than a blackroof; thus, the former tends to cool the building better then the later.In other words, roof reflectivity is an important factor keeping theroof from heating up by the Sun. A cool roof can save energy used tocool the building, which is critical to energy conservation.
Roofing materials lost solar reflectance over time. Depending onthe compositionof the coating, the lostover threeyears canbeashighas 50% as shown in Fig.1. Therefore the reductionof roof reflectance isclosely related to the composition of the roof. Samples of bare metaland PVC roofing weathered for 18 years and were found that the“the long-term change of solar reflectance appears to be determinedby theabilityofdeposited soot toadhere to the roof, resistingwashout
.
All rights reserved.
by rain” [1]. Soot, black carbon and/or elemental carbon wereconsidered tobe theprimarycauseof long-term reflectance loss [1]. Itis likely that the properties of the layer of environmental particlesdeposited on the roof material also contribute to the degradation ofreflectivity in addition to the weathering of the roofing materials byUV light, moisture, and temperature variation.
The objectives of this study are to establish the relationshipbetween the deposited particulate matter and reduction of solarreflectance and to quantify the contributions of the chemicaland microbial composition of the particulate matter on the solarreflectance.
2. Materials and methods
2.1. Weathering sites in California
Seven ambient sites were selected for exposing painted metal,clay and concrete tile roof products with and without coolcolor pigments in California (Table 1). Custom-BiltMetal, Steelscape,BASF, MonierLifetile, US Tile, Maruhachi Ceramics of America, theShepherd Color Company, American Rooftile Coatings and Elk

Nomenclature
CIMIS California Irrigation Management InformationSystem
CMRC Cool Metal Roof CoalitionAISI American Institute of Steel IndustriesNamZac Galvalume Sheet Producers of North AmericaMBMA Metal Building Manufacturers AssociationMCA Metal Construction AssociationNCCA National Coil Coaters AssociationPVC polyvinylchloride thermoplastic membranesSR solar reflectanceTE thermal emittancePM particulate matterPLFA phospholipid fatty acidNsat normal saturatesTbsat terminally branched saturatesMbsat mid-chain branched saturatesMono monounsaturatesBmono branched monounsaturatesCyclo cyclopropyl fatty acidsPoly polyunsaturates
Table 1Weathering sites for exposing roof products with and without cool color pigments.
Company City (designatedcode for thisanalysis)
County Climatezone
Roof orgroundmount
Department of waterresources CIMIS
El Centro (RS01) Imperial 15 Ground
Maruhachi ceramicsof America
Corona (RS02) Riverside 10 Ground
BASF Colton (RS03) SanBernardino
10 Roof
ELK Corp. Shafter (RS04) Kern 13 GroundSteelscape Richmond (RS05) Contra Costa 3 RoofCustom-Biit Sacramento (RS06) Sacramento 12 RoofDepartment of
water resourcesCIMIS
McArthur (RS07) Shasta 16 Ground
M.-D. Cheng et al. / Building and Environment 46 (2011) 999e10101000
Corporation supported the initiative by either field testing roofsamples at their respective manufacturing facilities (Table 1) and/orby providing roof products for natural exposure testing. These sitesare located at several climate zones. Fig. 2 shows the location of the 7sampling sites in theStateofCalifornia onamap.Note that the7 sitesphysically spread from the North to the South of the state repre-senting a wide geographical distribution and climate zone. Theproximityof a site to ametropolitan area also suggests thepossibilityof different properties of atmospheric particles. The CIMIS web sitehttp://www.cimis.water.ca.gov/ has current weather data for thesezones, which contains 118 computerizedweather stations acquiringhourly, daily, weekly and/or monthly solar irradiance, ambient airtemperature and relative humidity as well as wind speed, winddirection and precipitation.
Fig. 1. Loss of solar reflectance for thermoplastic membrane, white ceramic coating and painR64E83 is White Painted PVDF, R83E88 is White Ceramic Coating, R86E90 is Membranes A
Table 2 shows the coordinates of the seven sites and the samplematerials collected at these sites. For example, the sample coupontaken at El Centro (or RS01) site is PVDFmetal coated with HartfordGreen, and that taken at McArthur (or RS07) site is PVDF metalcoated with Rawhide. As the sample ID in Table 2 shown, some siteshave more than 1 coupon, which were aggregated in the samplepreparation step to make 1 sample for that site. The solar reflec-tance at the beginning and the end of 1.63-year study are alsoshown in the table for reference.
2.2. Ambient exposure racks
All roof samples were installed in exposure rack assemblies,which are 1.68-m high by 2.74-m long, and divided into three sub-frames having respective slopes of 9.5�, 18.4� and 33.7�. Each sub-frame can hold two “Sure-Grip” sub-assemblies, which aredesigned to have 6 rows of samples with 34-in of usable space ineach row. Sample size is 8.9-cm by 8.9-cm, a size that LawrenceBerkeley National Lab’s PerkineElmer Lambda 900 spectropho-tometer can easily accommodate for measuring the solar reflec-tance at discrete wavelengths.
ted PVDF metal and bare Galvalume� roofs after three years of exposure. Roof materials:, G, K, and M, while R69E06 is Unpainted Galvalume.

Fig. 2. Locations of the Seven Sampling Sites in the State of California.
M.-D. Cheng et al. / Building and Environment 46 (2011) 999e1010 1001
2.3. Solar reflectance (SR) and thermal emittance (TE) instruments
A Device and Services solar spectrum reflectometer was used tomeasure the solar reflectance (total hemispherical reflectance overspectrum of sun’s energy) of the roof samples. The device usesa tungsten halogen lamp to diffusely illuminate a sample. Fourdetectors, each fitted with differently colored filters, measure thereflected light in different wavelength ranges. The four signals areweighted in appropriateproportions toyield the total hemispherical
Table 2Identification of coupons, location nearest CIMIS station and solar reflectance data.
El Centro(RS01)
Corona(RS02)
Colton(RS03)
Closest CIMIS Site ID 87 44 44Latitude (north) 32.80666667 33.8813831 34.049796Longitude (west) 115.4461111 117.5378439 117.329042Sample for
elemental analysisGray Articconcrete tile
Gray Arcticconcrete tile
PVDF metalcharcoal gray
Sample ID 976 676 517e519Sample area (m2) 7.90E-03 7.90E-03 2.40E-02SR initial 0.265 0.252 0.308SR after 1.63 years 0.275 0.233 0.297Sample for
biomass analysisPVDF metalHartford green
PVDF metalcharcoal gray
Gray Arcticconcrete tile
Sample ID 920e923 616 576Sample area (m2) 3.20E-02 7.90E-03 7.90E-03SR initial 0.272 0.309 0.246SR after 1.63 years 0.277 0.297 0.241
reflectance. The device was proven accurate to within �0.003 units[2] throughvalidationagainst theASTME-903method [3]. However,because the CRCMs exhibit high infrared reflectance, some of thefield samples were also measured at LBNL using a spectrometer tocheck the portable reflectometer. The average absolute differencebetween the Device and Services reflectometer and the spectrom-eter was about 0.02 points of reflectance with the spectrometerconsistently reading lower than the reflectometer (as example, thereflectometer measured a solar reflectance of 0.741 for a IR painted
Shafter(RS04)
Richmond(RS05)
Sacramento(RS06)
McArthur(RS07)
5 157 131 & 155 4335.53305556 37.99166667 38.59944444 41.06472222119.2811111 122.47 121.5402778 121.4544444PVDFmetal rawhide
PVDF metalrawhide
Gray Arcticconcrete tile
PVDF metalrawhide
704e707 404, 406 378 805, 8063.20E-02 1.60E-02 7.90E-03 1.60E-020.571 0.569 0.269 0.570.524 0.545 0.248 0.548Buff blendclay tile
PVDF metalrawhide
Brown Arcticconcrete tile
PVDF metalrawhide
779, 780 405 372 804, 8071.60E-02 7.90E-03 7.90E-03 1.60E-020.527 0.569 0.261 0.5710.484 0.544 0.254 0.549

M.-D. Cheng et al. / Building and Environment 46 (2011) 999e10101002
metalwhile the spectrometermeasured 0.73). Solar reflectance (SR)of the new and aged samples is provided in Table 2 for the differentsamples used for elemental contaminant and for biomass determi-nations, while Table 3 shows the values of TE on the roof materials.
2.4. Procedure for elemental analysis
The couponswere exposed for 1.63 years prior to the removal forsample collection. The roof samples froma single sitewere removedfrom the exposure racks, wrapped in aluminum foil, stored in a zip-plug bag and sent airfreight back to Oak Ridge National Laboratory(ORNL). A standard operating procedure was developed forremoving thedeposited particulatematerials from the roof samples,which is described as follows: Each sample was placed in a soni-cating bath filled with 800 mL of distilled water held at roomtemperature. After 20 min, the sample was removed from the bathusing sterilized stainless steel forceps. The water suspension wasthen poured into a filtration apparatus and vacuum applied to filterthe suspended PMonto thefilters. The solutionwas divided into two400-mLaliquots. One400-mL sub-samplewasfiltered through a47-mmdiameter nylon filter (OSMONIC, Inc., 0.1 mmpore size) thatwassubsequently analysed for selectedmetal composition by a certifiedanalytical lab at the Y12 facilities in Oak Ridge, Tennessee. The other400-mL sub-sample was passed through the same filtration appa-ratus through a 47-mm diameter glass fiber filter (Whatman 934-GF). About 100 mL of additional deionized (DI) water was used torinse off any PM that remained on the samples. However, very littlePMwas foundvisually in the rinsedportion indicating the sonicatingtaskwas reasonably thorough. As quality control, 400mLofDIwaterwas filtered through a nylon filter to create an analytical blank formetal species. A glass fiber blank was created similarly for carbonanalysis. The filtration apparatus was rinsed three times using DIwater in between different filtration runs.
Inductively Coupled Plasma (ICP) e Atomic Emission Spectrom-etry (AES) was used for the analysis by the Y12 lab. The EPA 6010protocol for filter analysis was followed for analysis of metal contenton the filters. The following elements were detected: aluminum,antimony, arsenic, barium, beryllium, boron, cadmium, calcium,chromium, cobalt, copper, iron, lead, lithium, magnesium, manga-nese, molybdenum, nickel, niobium, phosphorus, potassium, sele-nium, silicon, silver, sodium, strontium, sulfur, thallium, thorium,titanium, uranium, vanadium, zinc, and zirconium. Most of theelements were below themethod’s detection limits, indicating theirabsence in the deposited PM, and are not reported. For thosereported, their concentrations are above the blank values that areabove or equal to the detection limits.
An instrument (Sunset Laboratory, Inc., Portland, OR) was usedfor total, elemental, and organic carbon analysis following theNIOSH (National Institute for Occupational Safety and Health) 5040
Table 3Thermal emittance measured for roof coupons at different sites over time ofexposure.
Roof sample Site Thermal emittance at exposuretimes (Years)
0.000 0.748 0.962 1.630
Charcoal gray PVDF metal Corona 0.825 0.820 0.875 0.825Richmond 0.840 0.821 0.821 0.826
Rawhide PVDF metal Corona 0.835 0.830 0.880 0.840Richmond 0.815 0.824 0.824 0.820
Apricot buff clay tile Corona 0.859 0.849 0.918 0.820Richmond 0.859 0.817 0.817 0.825
Gray Artic concrete tile Corona 0.854Richmond 0.854 0.854
protocol. Three samples, each 1 cm2, were punched out from a 47-mm diameter quartz filter and analysed by the instrument, and theaverage of the triplicate was assigned as the carbon concentrationfor the sample. If the coefficient of variation of the triplicateconcentration is greater than�5%, the sample is considered as non-uniformdeposition and the resultmay be discarded. All the samplesmet the precision requirement and retained in the subsequent dataanalysis. The instrument analyses carbon content of a filter sampleusing the temperature and oxidation profiles of particulate carbo-naceous species to define organic vs. elemental carbon (i.e., OC vs.EC). The total sum of OC and EC is the total carbon of a sample.
2.5. Membrane lipid characterization and biomass determination
Another set of collocated roof tiles and painted metals, separatefrom samples used in the elemental analysis (Section 2.4), wereshipped overnight for biomass analysis. Samples were swapped forphospholipid and respiratory quinone analyses and frozen at�80 �C until extraction. Muffled glass fiber filters and sodiumphosphate buffer were used to gently rub and retrieve depositionalmaterial from the roof samples. The recovered filters were extrac-ted for microbial membrane lipids using a modified Bligh and Dyerextraction and subsequently fractionated into neutral, glyco andpolar lipid classes [4,5]. Quinones, present in the neutral lipidfraction, were analysed on the liquid chromatographyemassspectrometry [6]. Polar lipid fraction was subjected to a sequentialsaponification/acid hydrolysis/esterification. The resulting phos-pholipid fatty acid (PLFA) methyl esters were separated, quantifiedand identified by gas chromatographyemass spectrometry [7].
Fatty acid nomenclature is based on the fatty acid abbreviated bythe number of carbon atoms (a) a colon, the number of unsaturatedCeC bonds (b) followed by ‘u’ followed by the number of carbons (c)from the methyl end of the molecule to the position of the unsatu-ration (e.g., a:buc). For monoenoic fatty acids, the a:buc molecule isfollowed by the suffix “c” for the cis- or “t” for trans-configuration.Branched fatty acids are described by iso (i) or anteiso (a), if themethyl branch is one or two carbon from the methyl end or by theposition of the methyl group from the carboxylic end of the mole-cule. Quinones are designated as ubiquinones (UQ) and menaqui-nones (MK) with a number (4e14) that indicates the number ofisoprene units.
The PLFA results are presented as biomass in pmol/sq cm or ascells/sq cm using the conversion factor of 2.5 � 104 cells per pmol[8]. Community compositions are represented as mole percentagefor individual PLFA or for PLFA structural groups. Structural groupsare indicated as normal saturates (Nsat), terminally branchedsaturates (Tbsat), mid-chain branched saturates (Mbsat), mono-unsaturates (Mono), branched monounsaturates (Bmono), cyclo-propyl fatty acids (Cyclo), and polyunsaturates (Poly).
3. Results
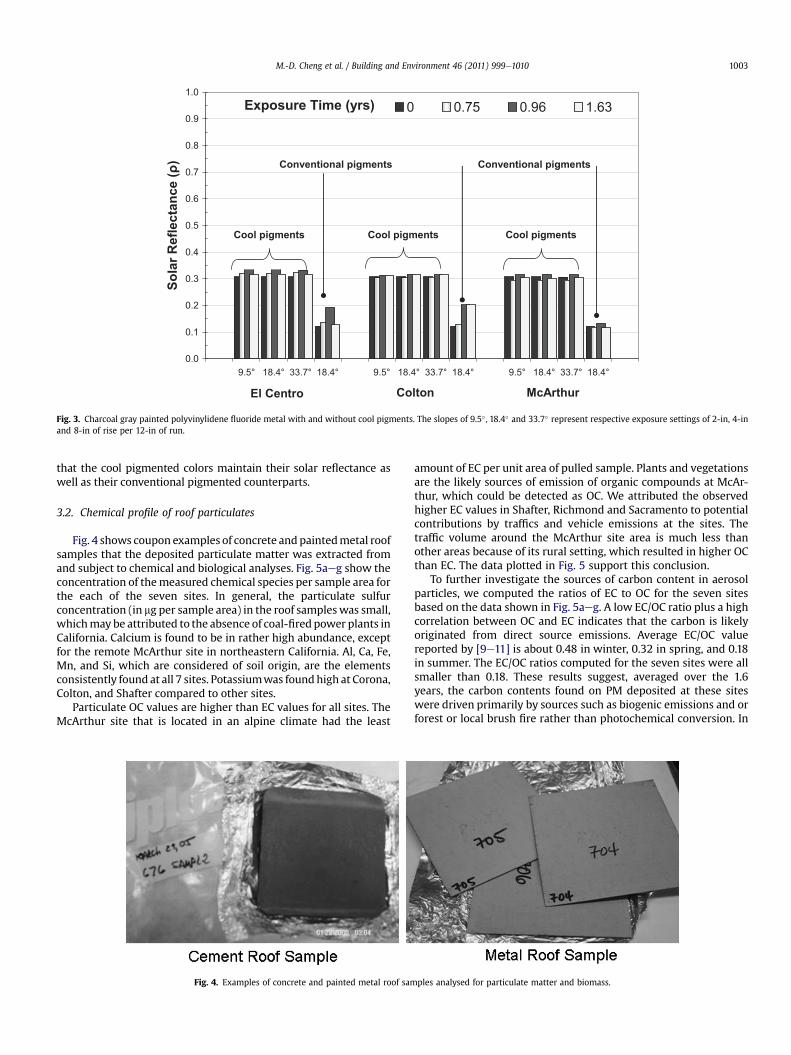
3.1. Effects of roof slope on solar reflectance
The effect of roof slope becomes somewhat significant forcoupons exceeding an initial solar reflectance of 0.50, as observed forthe off-white painted metal coupons displayed in Fig. 3. The darkercharcoal gray coupon shows slight increases in solar reflectancewithtime in El Centro and in Colton because of the accumulation of duststhat tend to lighten a darker color (Fig. 3). The dusting effect is moreevident on the conventional pigmented coupons than on thosepaintedwith cool pigments (Fig. 3). As shown in the figure the effectof roof slope on solar reflectance appears minor as compared to thesoiling by airborne dust debris. It is also important to again point out
0.0
0.1
0.2
0.3
0.4
0.5
0.6
0.7
0.8
0.9
1.0
9.5° 18.4° 33.7° 18.4° 9.5° 18.4° 33.7° 18.4° 9.5° 18.4° 33.7° 18.4°
So
lar
Re
fle
cta
nc
e (
ρ)
0 0.75 0.96 1.63
Cool pigmentsCool pigments Cool pigments
El Centro McArthurColton
Conventional pigments Conventional pigments
Exposure Time (yrs)
Fig. 3. Charcoal gray painted polyvinylidene fluoride metal with and without cool pigments. The slopes of 9.5� , 18.4� and 33.7� represent respective exposure settings of 2-in, 4-inand 8-in of rise per 12-in of run.
M.-D. Cheng et al. / Building and Environment 46 (2011) 999e1010 1003
that the cool pigmented colors maintain their solar reflectance aswell as their conventional pigmented counterparts.
3.2. Chemical profile of roof particulates
Fig. 4 shows coupon examples of concrete andpaintedmetal roofsamples that the deposited particulate matter was extracted fromand subject to chemical and biological analyses. Fig. 5aeg show theconcentration of themeasured chemical species per sample area forthe each of the seven sites. In general, the particulate sulfurconcentration (in mg per sample area) in the roof sampleswas small,whichmay be attributed to the absence of coal-fired power plants inCalifornia. Calcium is found to be in rather high abundance, exceptfor the remote McArthur site in northeastern California. Al, Ca, Fe,Mn, and Si, which are considered of soil origin, are the elementsconsistently found at all 7 sites. Potassiumwas foundhigh at Corona,Colton, and Shafter compared to other sites.
Particulate OC values are higher than EC values for all sites. TheMcArthur site that is located in an alpine climate had the least
Fig. 4. Examples of concrete and painted metal roof sam
amount of EC per unit area of pulled sample. Plants and vegetationsare the likely sources of emission of organic compounds at McAr-thur, which could be detected as OC. We attributed the observedhigher EC values in Shafter, Richmond and Sacramento to potentialcontributions by traffics and vehicle emissions at the sites. Thetraffic volume around the McArthur site area is much less thanother areas because of its rural setting, which resulted in higher OCthan EC. The data plotted in Fig. 5 support this conclusion.
To further investigate the sources of carbon content in aerosolparticles, we computed the ratios of EC to OC for the seven sitesbased on the data shown in Fig. 5aeg. A low EC/OC ratio plus a highcorrelation between OC and EC indicates that the carbon is likelyoriginated from direct source emissions. Average EC/OC valuereported by [9e11] is about 0.48 in winter, 0.32 in spring, and 0.18in summer. The EC/OC ratios computed for the seven sites were allsmaller than 0.18. These results suggest, averaged over the 1.6years, the carbon contents found on PM deposited at these siteswere driven primarily by sources such as biogenic emissions and orforest or local brush fire rather than photochemical conversion. In
ples analysed for particulate matter and biomass.

Fig. 5. Chemical profile of particulate matter deposited on roof sample at [a] El Centro site, [b] Corona site, [c] Colton site, [d] Shafter site, [e] Richmond site, [f] Sacramento site, [g]McArthur site. Also shown in gray color in each figure is the chemical profile of the blank filter.

Table 4Spearman rank correlation coefficients for the seven sites included in the study.
El Centro Corona Colton Shafter Richmond Sacramento Macarthur
El Centro 1.00Corona 0.96 1.00Colton 0.93 0.97 1.00Shafter 0.86 0.92 0.85 1.00Richmond 0.92 0.91 0.91 0.83 1.00Sacramento 0.62 0.71 0.61 0.88 0.55 1.00McArthur 0.75 0.76 0.65 0.86 0.62 0.87 1.00
M.-D. Cheng et al. / Building and Environment 46 (2011) 999e1010 1005
other words, the particulate carbons left on the roof samples appearto be a result of direct source emissions rather than of secondaryorigin. Many of themetals analysed for all sites are of crustal originssuch as road dusts, soil, and or rock debris.
The pair-wise Spearman rank correlation coefficients among theseven weathering sites were calculated using StatGraphics� andtabulated in Table 4. The Spearman rank correlation is a nonpara-metric (distribution-free) rank statistic used as a measure of thestrength of the associations between two variables; refer to [12] forreview of the formula used for calculating the Spearman rankcorrelation coefficient. The rank correlation yielded coefficients allgreater than 0.93 for El Centro, Corona, and Colton. These threesites are in the southern California, and the high ranking indicatesparticles of similar chemical compositionwere deposited at these 3sites. This is reasonable considering that these three sites are in thesame region. Composition of particles deposited at the Shafter siteappears to correlate well with the northern and southern sites. Thethree northern California sites (McArthur, Sacramento, and Rich-mond), however, do not have strong correlation among themselvessimilar to the three southern sites. The coefficient for the Sacra-mentoeRichmond pair is 0.55, and the RichmondeMcArthur is0.62. Both values do not suggest strong similarity. The Sacra-mentoeMcArthur pair however has a coefficient of value 0.87 thatis reasonably high. McArthur, being a rural site in northern Cal-ifornia, only mildly correlates with the sites in southern California.The inland site in Sacramento only correlates well with Shafter, andshows statistically weak correlation with any southern sites andRichmond, which is located near the San Francisco bay area.
3.3. Effect of particulate matter on solar reflectance of roofmaterials
The time-integrated solar reflectance measurement data over1.63 years from the seven sites were mapped onto the chemicalprofiles shown in Fig. 5aeg by a linear function [Eq. (1)] in anattempt to determine important chemical elements to the
Table 5Least squares optimization showing regression coefficients for detected elements.
1 Al (Aluminum) L0.00102 Ca (Calcium) 0.00013 Cr (Chromium) 0.00004 Cu (Copper) 0.00005 Fe (Iron) 0.00046 Mn (Manganese) 0.00007 Mg (Magnesium) 0.00008 Ni (Nickel) 0.00009 K (Potassium) 0.000310 Si (Silicon) 0.000311 Na (Sodium) 0.000012 S (Sulfur) 0.000013 V (Vanadium) 0.000014 Zn (Zinc) 0.000615 OC (Organic Carbon) �0.001416 EC (Elemental Carbon) 0.0000
degradation of roof reflectance. The degradation of roof solarreflectance for each site was computed as the difference betweenthe reflectance measured at 1.63 years and at time zero. The linearfunction was defined by the formulation:
R(n, 1) ¼ C(n, p) � w(p, 1) (1)
where R is a n by 1 vector of time-integrated reduction of solarreflectance, n is the number of sites, C is the chemical profiles ofdeposited particles obtained from the sites using a n by p matrix, pis the number of chemical species in a profile, and w is the weightsfor the chemical species in a p by 1 vector.
A smaller set of elements containing the following 16 variables:Al, Ca, Cr, Cu, Fe, Mn, Mg, Ni, K, Si, Na, S, V, Zn, OC, and EC wereanalysed and used for solving Eq. (1) above. A variable is removedentirely fromEq. (1) if its concentrationwas zero. The contributionofeach of the selected elements to the 1.6-year integrated solarreflectance reduction values was estimated by performing a con-strained least-square optimization operation (constrained to gothrough a zero intercept) [13]. A positive value in Table 5 indicatesthe element might contribute to the reduction of solar reflectance,while a negative value indicates the opposite that the element couldcontribute to the increase of solar reflectance. Statistically, Cr, Cu,Mn, Mg, Ni, Na, S, V, and EC have no contributions to the change ofsolar reflectancevaluesbasedon the coefficients shown inTable 5. Aland OC contributed to the increase of solar reflectance values foundat the sites, and Ca, Fe, K, Si, and Zn could contribute to the degra-dation of solar reflectance measured on the roof samples.
Aluminum metal has a refractive index of about 1.7. If it was inhydrated oxide form, then it is reflective in the visible to infraredregion. OC is a highly complex mixture of material sand it is wellknown to be the reflective component of aerosol particles [14] dueto its ability to scatter light. OC absorbs at short wavelengths (UV
Fig. 6. Expected values for the soiled roof reflectance, divided by the unsoiledreflectance as a function of elemental carbon (soot) concentration.

Table 6Derived OC and EC amounts per unit area on the roof samples collected at the sevensites (detection limit of carbon is 0.2 mg).
Site ID Organic carbon (mg/m2) Elemental carbon (mg/m2)
Blank filter 0.257 0.007El Centro 8.31 0.24Corona 5.36 0.24Colton 6.15 0.17Shafter 5.59 0.40Richmond 11.09 1.34Sacramento 4.46 0.22McArthur 1.32 0.02
M.-D. Cheng et al. / Building and Environment 46 (2011) 999e10101006
and blue), but are reflective at longer wavelengths. Fe2O3 hematitehas a very large refractive index (about 3), and thus the result ofa decreased reflectance attributed to iron could indicate otherforms of iron in the roof dusts. Calcium is likely to be associatedwith earth and/or crustal particles, and in the form of CaCO3 whichis highly reflective of long wavelength light but not in the visiblewavelength region. If the light translucent zincite is the dominantform of Zn in the deposited particles, it could also have the potentialto increase roof reflectance but the regression result indicated
0
Pm
ol P
LF
A/cm
sq
.
10
20
30
40
50
60
70
80
Clay
0
10
20
30
40
50
60
70a
b
Hartford Green
Charcoal Gray
Rawhide-1
pm
ol P
LF
A/cm
sq
.
Co
Rawhide-2
Biomass estimates based on PLFA concentra
Biomass estimates based on PLFA concentr
Fig. 7. Biomass estimates based on phospholipid fatty acid (PLFA) (a) for all roof samples a
otherwise. EC is commonly referred to as black carbon or soot and isbelieved to be a significant factor in the loss of a roof’s solarreflectance [1]. Our regression result here does not indicate thesignificance of EC in contributing to the degradation of roof solarreflectance (Fig. 6).
To obtain a semi-quantitative estimate of themaximumpossibleoptical absorption of the iron,we assume that 60mg/m2 are presentin the form of small (e.g., 0.27-mm diameter) hematite (Fe2O3)pigment particles [15]. Hematite is a strong absorber of the shortwavelength part of the solar spectrum (300e550 nm) and a hema-tite layer could absorb a measurable portion (w20%) of the shortwavelength component. However, the reported Fe result did notsupport the hypothesis on short wavelength absorption. Theassumption of a hematite layer covering the entire roof sample isunlikely. The complexmixtureof atmospheric particles is somewhatconfounding the light extinction process as described by the simplelinear model of chemical elements. It might be desirable to analysethe crystalline structure of all potential elements in future research.
The role of elemental carbon (i.e., soot) if in significant content inaerosols can be dramatic. Fig. 6 shows the expected solar reflectanceand visible reflectance as a function of soot concentration, asa fraction of the initial high reflectance, Ro [15]. The OC and EC
Metalncrete
Brown ArticBuff Blend-2Buff Blend-1Gray Artic
tion (pmol PLFA/cm2) averaged by material type.
ation (pmol PLFA/cm2) for each roof sample.
nd (b) averaged for the type of roof material; estimate units are pmol PLFA per sq cm.

0.00
0.05
0.10
0.15
0.20
0.25
0.30b
a
Clay Concrete M etal
Biomass estimates based on respiratory quinone concentration (pmol/cm2)averaged by material type.
Biomass estimates based on respiratory quinone concentration (pmol/cm2) for each roof sample.
0.00
0.05
0.10
0.15
0.20
0.25
0.30
Hartford Green
Charcoal Gray
Rawhide-1 Rawhide-2 Gray Artic Buff Blend-1 Buff Blend-2 Brown Artic
pm
ol
qu
ino
ne
/cm
. s
q.
pm
ol
qu
ino
ne
/cm
. s
q.
Fig. 8. Biomass estimates based on respiratory quinone estimates (a) for all roof samples and (b) averaged for the type of roof material; estimate units are pmol Quinone per sq cm.
M.-D. Cheng et al. / Building and Environment 46 (2011) 999e1010 1007
amounts measured in mg per unit area in meter squared at theseseven sites are shown in Table 6. The largest EC per unit area wasfound at Richmond,while the blankfilter had no detectable EC. Notethat the detection limit for carbon is 0.2 mg. For the sample exposedat Richmond, with 1.34mg/m2 of elemental carbon, ECwas found tohave contributed only 2e3% degradation of its original reflectance.Most of the sampleswere not greatly affected in reflectance by EC orthe soot (<10%), and the sample fromMcArthur is virtually unsoiledby soot. In other words, EC was not found to be a significantcontributor in reducing surface reflectance at all seven sites in Cal-ifornia. The optimization result shown previously also indicatedabout 3.1% of reduction in solar reflectance was contributed by EC,which is consistent with the analysis shown in this section.
3.4. Characterization of membrane lipid and determination ofbiomass
To quantify microbial biomass and determine microbial commu-nity structure, membrane lipid analyses were performed. The viablebiomass as represented by PLFA profiles is shown in Fig. 7. Estimatedbiomass ranged from 1.46 to 63.35 pmol PLFA per sq cm (Fig. 7a). The
McArthur sample (PVDFmetal Rawhide-1 shown in Fig. 7a) taken ina rural environment had the lowest biomass compared to the sample(e.g., also same PVDF metal Rawhide-2 shown in Fig. 7a) taken atShafter about 125 miles North of Los Angeles where it is a majormetropolitan area and source of traffic emissions. An additional plot(Fig.7b)shows theaveragePLFAbiomass foreachroofmaterial.Whenthese biomass values were converted to cells based on factorsdescribedby [8], clay tiles averaged1.2�106 cells per sqcmcomparedto 5.8 and 1.4 � 105 cells per sq cm for concrete and metal, respec-tively. Analysis of the PLFAprofiles revealed that 18:2u6was themostprominent PLFA ranging from 21 to 44 mol%. Other major PLFAwere16:0, 18:1u9c, 18:1u7c, 18:0 in decreasing relative abundances of11e21mol%,9e23mol%,4e16mol%and5e13mol%, respectively. Theclay samples exhibited higher PLFA diversity that the concrete ormetal roof material (Fig. 7b). When examining selected PLFA ratios,which indicated exposure to toxic conditions or limited nutrients, theMcArthur metal sample reflected significant ratios of cyclopropyl tomonounsaturated fatty acid (0.14) and trans:cismonounsaturated 16carbon-length fatty acid (0.23). Three other sites, Shafter (higherbiomass sample), Colton and Sacramento had trans:cis ratios of 0.24,0.15, and 0.13 respectively.

a
b
Fig. 9. Microbial community composition based on respiratory quinones (a) forubiquinones and (b) for menaquinones. Units expressed as quinone mole percent.
M.-D. Cheng et al. / Building and Environment 46 (2011) 999e10101008
A secondmembrane lipidmoiety, respiratory quinones, was alsoused to estimate microbial biomass (Fig. 8). Estimated biomassranged from 0.01 to 0.26 pmol quinones per sq cm (Fig. 8a). Anadditional plot (Fig. 8b) shows the average quinone biomass foreach roof material. When biomass values were converted to cellusing the conversion factor of 1 pmol quinone represents 3 � 106
0%
20%
40%
60%
80%
100%
Shaf
ter
Shaf
ter
Colto
nSa
cram
ento
Rich
mon
dM
cArth
ur
PL
FA
M
ol%
Fig. 10. Microbial community composi
cells [6], clay tiles averaged 6.9 � 105 cells per sq cm compared to1.2 � 105 cells per sq cm for metal tiles and 3.1 �104 cells per sq cmfor concrete tiles. Analysis of the respiratory quinone profilesrevealed dramatic differences in community composition (Fig. 9).The Colton (concrete), Sacramento (concrete) and McArthur(metal) samples showed the presence of only ubiquinones (UQ).The Richmond and El Centro samples had less than 50% of the totalquinone profile as one or two types of menaquinones (MK).However the Shafter (clay) and Corona (metal) samples exhibitedmenaquinone profiles at greater than 75% of the total quinoneprofile. When the UQ/MK ratios were compared the Shafter andCorona samples had values less than 0.35 and the rest of thesamples had values of 1 or greater.
4. Discussion
Membrane lipidswere investigated togainabetterunderstandingof themicrobial community compositionandbiodensity deposited orresiding on these roof samples in the different California environ-ments. Phospholipid fatty acid methyl esters have been used asbiomarkers ofmicrobial communities formany years. PLFA analysis isa direct real timemonitoring analysis for viable biomass of microbialcommunities because they degrade rapidly upon cell death [5]. Alleukaryotes and bacterial cell membranes have PLFA that providea non-selective means to assay changes in microbial communities[16e19]. PLFA ratiosmayalso provide insight onmetabolic status andstress of a community [20,21]. Numerous studies used PLFA analysisto aid in determining microbial community composition and theimpact of environmental factors like contamination by hydrocarbons[22,23] or metals [24,25].
Microbial biomass was estimated based on two types ofmembrane lipids. The PLFA provide an estimate of viable biomassresulting in 105e106 cells per sq cm for the various roof materials.These biomass values could overestimate total cell counts becausethe conversion factor is based on bacteria cell sizes rather thanfungal or spore sizes. On the other hand the PLFA analysis representmembrane lipids recovered from eukaryotes and bacteria cells and
Coro
naEl
Cen
tro
Eukaryotes (Poly)Proteobacteria (Mono)Anaerobic metal reducers (Bmono)Actinomycetes (Mbsat)Firmicutes (Tbsat)General (Nsat)
tion based on PLFA mole percent.

M.-D. Cheng et al. / Building and Environment 46 (2011) 999e1010 1009
does not account for Archaea cell, thus possibly underestimatedtotal cell counts. We speculate that the differences seen in biomassestimates may correspond to the texture of the tiles (metals weresmooth and had less biomass, while clay tiles were rough andexhibited more biomass). When comparing biomass estimatesbased on quinone composition (Fig. 8a), we did not see a similartrend with the PLFA biomass (Figs. 7b and 8b). When biomassvalues were converted to cell using the conversion factor of 1 pmolquinone represents 3 � 106 cells [6], the quinones cell estimatesranged from 104 to 105 cells. These biomass estimates were lessthan those calculated by PLFA. This lower value may be based onthe fact that the cells used [6] were grown in the laboratory andrepresent larger cell size than expected for environmental samples.Likewise the neutral lipids (quinones) do not degrade as quickly asPLFA. We speculate that the overall biomass may relate to thematerial composition of the tiles, i.e., concrete is more alkaline andto surface roughness which may have provided more pockets forparticle or bacterial accumulation. When comparing PLFA biomasswith solar reflectance, we found that the loss in solar reflectance at1.63 years was weakly correlated to the organic carbon estimatesfrom the PLFA biomass (R2 ¼ 0.6893), which is consistent withfinding from the chemical analysis discussed previously thatshowed OC to increase reflectance. The organic carbon from thePLFA biomass had a 0.7134 correlation with the OC from theelemental analysis. In general, a microbial biomass of less than30 pmol PLFA per sq cm exhibited less than 5% loss in solarreflectance, while biomass of greater than 30 pmol PLFA per sq cmexhibited more than 5% loss of solar reflectance.
When interpreting the PLFA profiles, 18:2u6 was the mostprominent and is indicative of cyanobacteria and fungi [26]. Of theother major PLFA species, the normal saturated fatty acids, 16:0 and18:0, are ubiquitous and are generally seen in all PLFA profileswhereas the 18:1’s are indicative of Gram-negative bacteria [18].Anti-iso15:0 and iso16:0 were found in clay and concrete tile, whileonly clay tiles showed br17:0 and br18:0. These terminally andmid-chain branched saturates are generally found in Gram-positivebacteria. To better translate the PLFA results tomicrobial communitycomposition the PLFA were group based on specific fatty acidsassociated with certain classes of microorganisms. These groupingare shown in Fig.10.Most profilesweredominatedbyPLFA indicativeof eukaryotes and Proteobacteria. The clay tiles (Shafter) had themost diverse profiles to include significant indicators for Fimicutesand Actinomycetes and to a lesser extent metal reducing bacteria.
PLFA profiles were examined for indications of physiologicalstress. Under stress conditions for Gram-negative bacteria, mono-enioc fatty acids 16:1u7c and 18:1u7c are converted to cyclopropylfatty acids cy17:0 and cy19:0 tomaintainmembrane fluidity (Whiteet al., 1996). A ratio less than 0.1 indicates log phase of activemetabolism while a ratio of more than 0.1 indicates a stationaryphase or a phase where the population is adapting to environ-mentally induced stress [27,28]. The type of PLFA stress indicatorwas seen in the alpine climate [29]. Another mechanism that Gram-negative bacteria use to protect against stress is to produce moretrans- than cis-configuration of fatty acids. An increase in the ratio oftrans/cis in cells indicates a membrane response to greater envi-ronmental stress such as metal toxicity or oxidizing environment[27,28]. Ratios less than 0.05 suggest favorable conditions formicrobial growth while ratios greater than 0.1 suggest [27,28]. Foursites, Shafter, Colton,McArthur, and Sacramento had a trans/cis ratiothat indicated this second type of physiological stress. There was nocorrelation seen between this stress and the elemental analyses. It isspeculated that the stress may be related to the extreme environ-mental conditions on the roof tile surface that include UV exposureand the extreme heating and subsequent cooling that occurs on theroof tiles.
Quinone composition may be used to quantify biomass andassess respiratory potential of the microbial community [6]. WhenGram-negative bacteria and eukaryotes are growing with oxygen,ubiquinones are produced. Under reduced oxygen conditions,Gram-negative produce menaquinones. Gram-positive bacteriaand Archaea produce menaquinones under aerobic and anaerobicconditions. In Fig. 9, the ubiquinone and menaquinone profiles areshown. Concrete tiles and the PVDF metal from McArthur had nomenaquinones, which suggest an aerobic environment and a lack ofGram-positive bacteria or Archaea. Clay and PVDF metals fromCorona and El Centro showed diverse quinones profiles suggestingthe potential for various microorganisms and corresponding withsimilar trends in the PLFA profiles. The higher percentages ofmenaquinones in the Shafter clay tiles correspond with the pres-ence of PLFA profiles indicative of Fimicutes and Actinomycetes.Clay (Shafter) and PVDF metal samples (Corona) had UQ/MK ratioof 0.19e0.44 and may indicate a significant Gram-positive bacteriaor Archaeal community or the presence of microphilic to anaerobicniches. The analyses of membrane lipids revealed changes inmicrobial community composition with respect to the differentroof materials and climate.
5. Conclusions
Seven sites in California were selected for exposing paintedPVDF metal, clay and concrete tile coupons with and without coolpigmented colors. The loss in solar reflectance for painted metaland clay and concrete tile coupons was of the order 6% of the initialreflectance for the 1.63-year time limited study. Solar reflectance ofthe cool pigmented coupons always exceeded that of the conven-tion pigmented coupons. Climatic soiling did not cause the coolpigmented roof coupons to lose any more solar reflectance pointsthan their conventional pigmented counterparts. The effect of roofslope appears to have more of an affect on lighter color roofs whosesolar reflectance exceeds at least 0.5 and visual shows the accu-mulation of airborne contaminants. However, precipitation and orwind sweeping helps restore most of the initial solar reflectance.The thermal emittance remains invariant with time and locationand was therefore not affected by climatic soiling.
Analysis of cross-correlation of the seven chemical profilesshows little separation between the rural and urban/industrial sites.The results also showed elemental or black carbon did notcontribute significantly to the degradation of reflectance, but dustparticles (characterized by Al) and organic carbon had a statisticallysignificant effect on balancing the degradation over the course of1.63 years. Differences in the microbial communities and biomasswere seen between the various tile types and climate zones.Abundance of microbial biomass on roof tiles appears to be relatedto the composition/surface structure of the tile, not the locationwhere the roof samples were taken. When examined by PLFA andquinone analyses, some tiles showed diverse microbial communi-ties. Cyanobacteria or fungi represent the dominant player. Futureresearch includes nucleic acid analysis for community compositionand phylogenetic identification is ongoing. DNA has been extractedand will be analysed using selected kingdom gene probes forbacteria and eukaryotes and specific gene probes for cyanobacteriafollowedbydenaturing gradient gel electrophoresis and sequencingof selected bands for phylogenetic identification.
6. Disclaimers
Mention of the trade names, instrument model and modelnumber, and any commercial products in the manuscript does notrepresent the endorsement of the authors nor their employer, theOak Ridge National Laboratory or the US Department of Energy.

M.-D. Cheng et al. / Building and Environment 46 (2011) 999e10101010
Acknowledgements
Funding for this project was provided by the California EnergyCommission’s Public Interest Energy Research program through theU. S.Departmentof Energyunder contractDE-AC03-76SF00098. Theelemental composition of particles was analysed by the analyticalchemistry services at the DOE Y12 complex using ICP-AES instru-ment. OakRidgeNational Laboratory ismanagedbyUT-Battelle, LLC,for the U.S. Dept. of Energy under contract DE-AC05-00OR22725.
References
[1] Berdahl P, Akbari H, Rose LS. Aging of reflective roofs: soot deposition. ApplOpt 2002;41:2355e60.
[2] Petrie TW, Desjarlais AO, Robertson RH, Parker DS. Comparison of techniquesfor in-situ, non-damaging measurement of solar reflectance of low-slope roofmembrane. Int J Thermophysics 2000;22:1613e28.
[3] ASTM. Designation E903-96: standard test method for solar absorption,reflectance, and transmittance of materials using integrating spheres. WestConshohocken, PA: American Society for Testing and Materials; 1996.
[4] Bligh EG, Dyer WJ. A rapid method of total lipid extraction and purification.Can J Biochem Phys 1959;37:911e7.
[5] White DC, Davis WM, Nickels JS, King JD, Bobbie RJ. Determination of thesedimentary microbial biodensity by extractable lipid phosphate. Oecologia1979;40:51e62.
[6] Geyer R, Peacock AD, White DC, Lytle C, Van Berkel GJ. Atmospheric pressurechemical ionization and atmospheric pressure photoionization for simulta-neous mass spectrometric analysis of microbial respiratory ubiquinones andmenaquinones. J Mass Spectrom 2004;39:922e9.
[7] White DC, Ringelberg DB. Signature lipid biomarker analysis. In: Burlage RS,Atlas R, Stahl D, Geesey G, Sayler G, editors. Techniques in microbial ecology.New York, NY: Oxford University Press; 1998. p. 255e72.
[8] Balkwill DL, Leach FR, Wilson JT, McNabb JF, White DC. Equivalence ofmicrobial biodensity measures based on membrane lipid and cell wallcomponents, adenosine triphosphate, and direct counts in subsurface sedi-ments. Microb Ecol 1988;16:73e84.
[9] Appel BR, Colodny P, Wesolowski JJ. Analysis of carbonaceous materials insouthern California atmospheric aerosols. Environ Sci Technol 1998;10:359e63.
[10] Turprin BJ, Huntzicker JJ. Identification of secondary organic aerosol episodesand quantitation of primary and secondary organic aerosol concentrationsduring SCAQS. Atmos Environ 1995;29:3527e44.
[11] Strader R, Lurmann P, Pandis SP. Evaluation of secondary organic aerosolformation in winter. Atmos Environ 1999;33:4849e63.
[12] Lehmann EL, D’Abrera HJM. In: Nonparametrics: statistical methods based onranks. Englewood Cliffs, NJ: Prentice-Hall; 1998. pp. 292, 300, and 323.
[13] Cheng M-D, Hopke PK. Identification of markers for chemical mass balancereceptor model. Atmos Environ 1989;23:1373e84.
[14] Novakov T, Penner JE. Large contribution of organic aerosols to cloud-condensation-nuclei concentrations. Nature 1993;365:823e6.
[15] Berdahl P, Akbari H, Levinson R, Miller WA. Weathering of roofing materials-an overview. Construct Build Mater 2006;22:423e33.
[16] Tunlid A, White DC. Biochemical analysis of biomass, community structure,nutritional status and metabolic activity of the microbial community in soil.In: Bollag J-M, Stotzky G, editors. Soil Biochem, 7; 1992. p. 229e62.
[17] Federle TW, Dobbins DC, Thornton-Manning JR, Jones DD. Microbial biomass,activity, and community structure in subsurface soils. Ground Water1986;24:365e74.
[18] Findlay RH, Dobbs FC. Quantitative description of microbial communitiesusing lipid analysis. In: Kemp PF, Sherr BF, Sherr EB, Cole JJ, editors. Handbookof methods in aquatic microbial ecology. Boca Raton, FL: Lewis Publishers;1993. p. p271e84.
[19] Pfiffner SM, Cantu JM, Smithgall A, Peacock AD, White DC, Moser DP, et al.Deep subsurface microbial biomass and community structure in Witwa-tersrand Basin mines. Geomicrobiol J 2006;23:431e42.
[20] Kieft TL, Ringelberg DB, White DC. Changes in ester-linked phospholipid fattyacid profiles of subsurface bacteria during starvation and desiccation ina porous medium. Appl Environ Microbiol 1994;60:3292e9.
[21] Frostegård Å, Tunlid A, Bååth E. Changes in microbial community structureduring long-term incubation in two soils experimentally contaminated withmetals. Soil Biol Biochem 1996;28:55e63.
[22] Pfiffner SM, Palumbo AV, Gibon T, Ringelberg DB, McCarthy JF. Relatinggroundwater and sediment chemistry to microbial characterization at BTEX-contaminated site. Appl Biochem Biotechnol 1997;63e65:775e88.
[23] Stephen JR, Chang Y-J, Gan YD, Peacock A, Pfiffner SM, Barcelona MJ, et al.Microbial characterization of PJ-4 fuel contaminated site using a combinedlipid biomarker/PCR-DGGE based approach. Enivron Microbiol 1998;1:231e41.
[24] Brandt CC, Schryver JC, Pfiffner SM, Palumbo AV, Macnaughton S. Usingartificial neural networks to assess changes in microbial communities. In:Leeson A, Alleman BC, editors. Bioremediation of metals and inorganiccompounds. Columbus: Battelle Press; 1999. p. 1e6.
[25] Bååth E, Diaz-Ravina M, Frostegård Å, Campbell CD. Effect of metal-rich sludgeamendments on the soil microbial community. Appl Environ Microbiol1998;64:238e45.
[26] Weete JD. Fungal lipid biochemistry: distribution and metabolism. New York:Plenum Press; 1974.
[27] White DC, Stair JO, Ringelberg DB. Quantitative comparisons of in situmicrobial biodiversity by signature biomarker analysis. J Ind Microbiol1996;17:185e96.
[28] White DC, Ringelberg DB, MacNaughton SJ. Review of PHA and signature lipidbiomarker analysis for quantitative assessment of in situ environmentalmicrobial ecology. In: Eggnik G, Steinbuchel A, Poier Y, Witholt B, editors.1996 International symposium of bacterial polyhydroxyalkanoates. Ottawa(Canada): NRC Research Press; 1997. p. 161e70.
[29] Guckert JB, Hood MA, White DC. Phospholipid, ester-linked fatty acid profilechanges during nutrient depletion of Vibrio cholerae: increases in the trans/cis and proportions of cyclopropyl fatty acids. Appl Environ Microbiol1986;52:794e801.