Embed Size (px)
Citation preview
European J. Appk Microbiol. Biotechnol. 9 ,261--274 (1980)
European J .... ,o, Apphed Microbiology and Biotechnology �9 by Springer-Verlag - 1980
Chemical Oxygen Demand Reduction in a Whey Fermentation
Mauro Moresi, Alberto Colicchio, Fabio Sansovini, and Enzo Sebastiani
Instituto di Chimica Appticata e lndustriale, Facolta' di Ingegneria, Universita' eli Roma, Rome, Italy
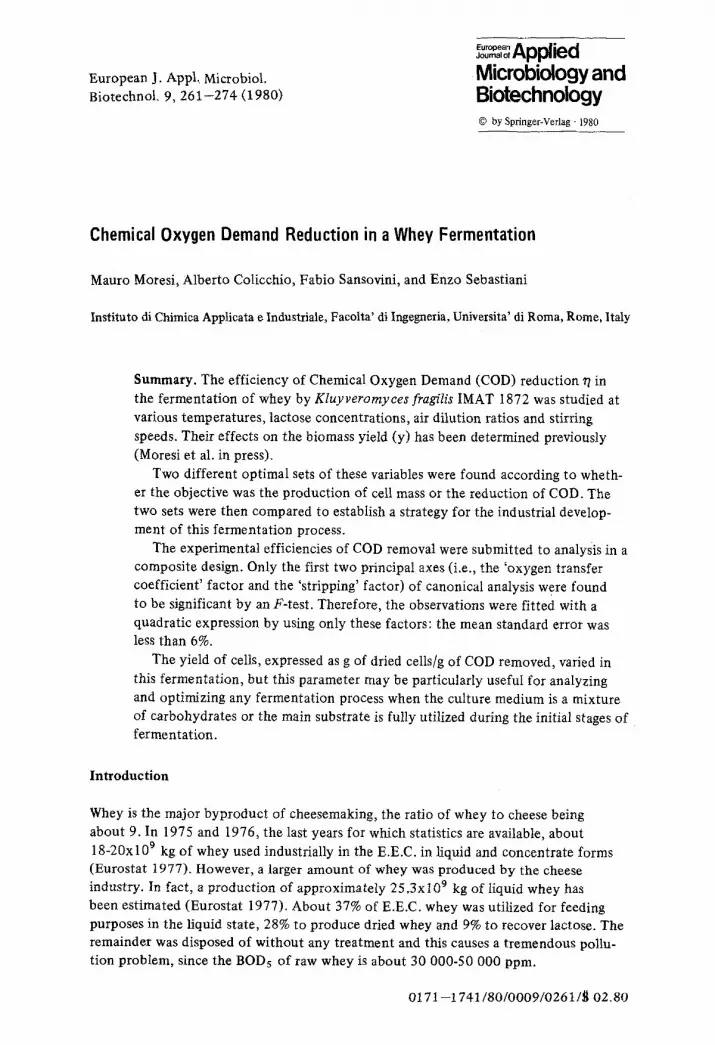
Summary. The efficiency of Chemical Oxygen Demand (COD) reduction r/in the fermentation of whey by Kluyveromyces fragilis IMAT 1872 was studied at various temperatures, lactose concentrations, air dilution ratios and stirring speeds. Their effects on the biomass yield (y) has been determined previously (Moresi et al. in press).
Two different optimal sets of these variables were found according to wheth- er the objective was the production of cell mass or the reduction of COD. The two sets were then compared to establish a strategy for the industrial develop- ment of this fermentation process.
The experimental efficiencies of COD removal were submitted to analysis in a composite design. Only the first two principal axes (i.e., the 'oxygen transfer coefficient' factor and the 'stripping' factor) of canonical analysis were found to be significant by an F-test. Therefore, the observations were fitted with a quadratic expression by using only these factors: the mean standard error was less than 6%.
The yield of cells, expressed as g of dried cells/g of COD removed, varied in this fermentation, but this parameter may be particularly useful for analyzing and optimizing any fermentation process when the culture medium is a mixture of carbohydrates or the main substrate is fully utilized during the initial stages of fermentation.
Introduction
Whey is the major byproduct of cheesemaking, the ratio of whey to cheese being about 9. In 1975 and 1976, the last years for which statistics are available, about 18-20x 109 kg of whey used industrially in the E.E.C. in liquid and concentrate forms (Eurostat 1977). However, a larger amount of whey was produced by the cheese industry. In fact, a production of approximately 25.3x 10⁹ kg of liquid whey has been estimated (Eurostat 1977). About 37% of E.E.C. whey was utitized for feeding purposes in the liquid state, 28% to produce dried whey and 9% to recover lactose. The remainder was disposed of without any treatment and this causes a tremendous pollu- tion problem, since the BODs of raw whey is about 30 000-50 000 ppm.
0171 --1741/80/0009/0261/ti 02.80

262 M. Moresi et al.
Whey may be treated in several ways, e.g., condensed, dried, ultrafiltered or demi- neralized to recover the protein, lactose and minerals which are its most valuable con- stituents.
However, the huge volumes of raw whey cause problems owing to the large capital investments required for the processing and because the market price of the finished products only just covers the processing costs.
At present, the animal feed industry utilizes both liquid and dried wheys. The amounts of these products used daily are, however, limited since lactose is metabo- lized only with difficulty by animals such as pigs and chickens. Therefore, lactose reduces the market price of liquid or dried wheys compared to that of other inex- pensive carbohydrates, such as molasses and corn.
There is great interest in the proteic constituents of whey especially as these can be increased via fermentation which converts the lactose into single-cell protein.
Fermentation of whey by various microorganisms has been known and studied for years 1 and the two important advantages are that lactose is converted into yeast cellular material (SCP) and that environmental contamination by the culture fluid after cell recovery is reduced and this simplifies its disposal and treatment. For in- stance, this allows the utilization of the conventional activated sludge process, trickling filters or anaerobic digestion for methane generation.
The fermentation of a typical cheese whey by Kluyveromyces fragilis IMAT 1872 was formerly optimized, by determining the optimal values of the following varia-
bles: temperature, pH, air flow and stirring rates, salts and yeast extract supple- mentation and lactose concentration (Moresi and Sebastiani 1979; Moresi et al. in press).
The purpose of this paper is to report the study of the other aspect of whey fer- mentation, that is, the reduction of BODs. In particular, we examined the reduction of COD, as the COD: BODs ratio was generally found to be about 2, by assessing
the influence of the above variables on the COD reduction and determining the opera- ting conditions yielding the maximum efficiency of COD reduction.
Moreover, a comparison between the operating conditions yielding the maximum
values of biomass and COD removal was carried out to suggest a strategy for the industrial development of this fermentation process.
1 (Stimpson and Young 1957; Devos 1960; Wassermann 1960; Tomis~k and Gregr 1961 ; Socidtd des Alcools du Vexin 1963; Robe 1974; Amundson 1967; Vernois 1960; Beehte and Claydon 1971; Fonden and Pettersson 1974; Moulin and Galzy 1976; Muller 1976; Bernstein and Tzeng 1977)

Chemical Oxygen Demand Reduction in a Whey Fermentat ion 263
Materials and Methods
Microorganism
Kluyveromyces fragilis 1872 I.M.A.T. (Perugia, I taly) was used.
Apparatus A 15-1 autoclavable fermenter (LKB 1601-013) was used. Medium composit ion, preparation, pasteurization and inoculation were described by (Moresi and Sebastiani 1979; Moresi et al. in press).
Results
Each sample (70-100 ml) was aseptically withdrawn and centrifuged, as reported by Moresi et al., (in press). The supernatant was collected for lactose (Fehling method) and COD (ASTM Standards 1964) analysis.
The difference between the initial and final COD values of the culture fluid divided by its initial COD value was the COD reduction efficiency (4).
The levels of each experimental variable are shown in Table 1. Table 2 shows the combination of t reatment, the initial COD values of the culture media and the observed COD reduction efficiencies.
Salts, nutrient supplementat ion and pH were maintained at the previously deter- mined optimal levels (Moresi and Sebastiani 1979).
Statistical Analysis of Results
2k Factorial Design
To maximize the COD reduction efficiency in the fermentation of whey by K. fragilis IMAT 1872, temperature (T), initial concentration of lactose (L), air dilution ratio (A) and stirring speed (N) were submitted to analysis in a 'composi te ' design, as described in (Davies 1956; Himmelblau 1970). These factors were used in a dimensionless form as reported in (Moresi et al. in press).
x~ = (T - 32.5)[2.5
x2 = ( t - 25)/5 (1) x3 = ( A - 0.975)/0.39 x4 = (N - 600)/100
The first part of Table 2 (trials 1-8) shows a complete 23 factorial design, which involves the first three factors (T,L and A) at constant stirring speed (N=500 min -~ ). Table 3 reports the analysis of the data as indicated by Yates (1937).
Table I. Factor levels for the 'composite' design experiment
Factor Factor Level Unit - c ~ - 1 0 +1 + ~
T 27.5 30 32.5 35 37.5 o C L 15 20 25 30 35 g1-1 A 0.195 0.585 0.975 1.365 1.755 wm N 400 500 600 700 800 mm

264 M. Moresi e t al.
Table 2. Composite design used in the experiment, the initial COD values of culture fluid (CODo)
and the observed COD reduction efficiencies (r
Trial Factor level
X1 Xl X 3 X4
COD Reduction Initial
efficiency COD value
r/(%) COD o (g/I)
1 - 1
2 + 1
3 - 1
4 + 1
5 - 1
6 + 1
7
8 +
9 +
10
11
1 2 +
13 0
14 - 2
15 + 2
16 0
17 0
18 0
19 0
20 0
21 0
- 1 ( - 1 . 0 0 0 ) - 1 - 1
- 1 ( - 1 . 0 1 2 ) - 1 - 1
+ 1 ( + 1.250) - i - 1
+ 1 ( + 1.480) - 1 - 1
- 1 ( - 0 . 8 3 2 ) + 1 - 1
- 1 ( - 1.118) + 1 - 1
+ 1 (+ 1.116) + 1 - 1
+ 1 (+ 1.014) + 1 - 1
- 1 ( - 1 . 0 9 0 ) - 1 + 1
+ 1 (+ 1.028) - 1 + 1
- 1 ( - 0 . 9 3 0 ) + 1 + I
+ 1 ( + 1.158) + 1 + 1
0 ( - 0.216) 0 0
0 ( - 0.034) 0 0
0 ( - 0.028) 0 0
- 2 ( - 1.744) 0 0
+ 2 (+ 1.514) 0 0
0 ( - 0.128) - 2 0
0 (+ 0.024) + 2 0
0 ( - 0.066) 0 - 2
0 ( - 0.170) 0 + 2
80.07 37.63
81.65 32.70
56.31 51.50
63.07 49.55
87.80 32.80
86.96 34.50
57.53 46.50
79.49 48.75
87.75 29.39
84.71 42.50
87.41 28.60
86.34 41.74
89.59 32.65
91.44 35.05
88.76 35.60
87.01 23. t0
74.09 50.71
72.25 42.04
87.62 40.40
50.13 38.50
89.31 39.31
Table 3. Analysis of variance of a 23 factorial design
Effect Total Effect Degrees Mean square of s 2
freedom
s : / o ~
T 29.46 7.37 1 108.49
L -80 .08 -20 .02 1 801.60
A 30.68 7.67 1 117.66
TL 27.98 7.00 1 97.86
TA 12.78 3.20 1 20.42
LA 4.6 1.15 1 2.65
TLA 17.62 4.41 1 38.81
5.26
38.86a 5.7 b
4.74
aHighly significant (Probability 1% < P " (5%) bSignificant (Probability 5 % < P < 10%)

Chemical Oxygen Demand Reduction in a Whey Fermentation 265
To estimate the error variance (r 2 of nonreplicated factorial designs, two and three
factor interactions, except interaction T-L, were combined to estimate (r 2 , thus obtain- ing a 2 = 20.63 with 3 degrees of freedom. Since for 1 and 3 degrees of freedom the 5%
value of F is 10.13, the last column of Table 2 shown that factor L is highly significant (at the 99% confidence level), factor A is significant (at the 90% confidence level) and
factor T and interaction TL are not significant. To examine the influence of N, we carried out another set of experiments (see
Table 2: trials 9-12) in order to construct a half replicate 24 factorial design, derived
from a 23 design for T, L and A, by equating factor N to the interaction TLA.
The experimental results were first put in a standard order (1,9,10,4,11,6,7,12)
and then analysed as indicated in Yates (1937) and shown in Table 4. The new error variance was obtained by combing interactions TL and TN
((r 2 = 6.84 with 2 degrees of freedom). Since for 1 and 2 d~grees of freedom F
at the 95% confidence level is 18.51, we conclude (see last column of Table 4)
that factors L and N and interaction LN are significant (at 95% confidence level)
and factors T and A are not significant.
The low influence of T on COD reduction efficiency is confirmed. The effect
of A is not immediately obvious, because it is significant at constant level of N, but
is not affected significantly by variation in stirrer speed. However, this effect will
be considered further below.
Composite Design
The determination of the second order effects was carried out by performing 9 further
experiments (trials 13-21 of Table 2), as suggested by (Davies 1956; Himmelblau
1970). All the experimental results were then correlated by:
n n n-1 n 2 + 2 ~ i ~ j xixj 7? = b o + I~ i bi xi + ~ ib i i x i bij
1 1 1 i+1 (2)
Table 4. Analysis of variance of a half-replicate 24 factorial design
Effect Total Effect Degrees Mean square s2/a 2 of s 2
freedom
T(LAN) 14.40 3.6 1 25.92 3.79
L(TAN) -50.54 - 12.64 1 319.29 46.68a A(TLN) 2.64 0.66 1 0.87 0.13 N(TLA) 58.58 14.65 1 428.95 62.71a TL(AN) - 0.06 - 0.02 1 0.0005 - TA(LN) 42.32 10.58 1 223.87 32.73 a TN(LA) -10.46 - 2.62 1 13.68 -
aSignificant (Probability 1% < ~P< 5%)

266 M. Moresi et al
Table 5. Regression coefficients of Eq. (2) and their standard errors
Coefficient Value SE
b o 87.40 • 2.340
bl 0.932 • 0.646
b2 - 5.035 • 0.676
b3 1.957 • 0.639
b4 7.340 • 0.598
b l l 0.982 • 0.692
b22 - 1.852 • 0.898
b 3 3 -- 1.577 • 0.689
b44 - 4.131 • 0.692
b12 2.628 • 0.784
b13 1.048 • 0.877
b14 - 1.752 • 0.869
b23 - 0.042 • 0.797
b24 3.101 • 0.833
b34 - 2.207 • 0.870
Table 6. Coordinate of the maximum point (M)
Factor XiM Factor value Unit
(Dimensionless)
T 0.5039 33.76 o C
L - 0.6887 21.56 gl d
A 0.5304 1.18 w m
N 0.3814 638 min d
Predicted COD reduction efficiency
at stationary point M, nM 91.29 %
Table 7. Coefficients of the canonical form
Coefficient Value
B l l - 5.4079
B22 - 2.1033
B33 - 0.6771
B44 + 1.6109

Chemical Oxygen Demand Reduction in a Whey Fermentation 267
Table 8. Parameters ofthe prin~pal axes
Principal axis x 1 x 2 x 3 x4
V 1 0.1893 - 0.4396 0.2167 0.8508
V2 -0.3179 0.5797 0.7271 0.1850 V3 0.0324 - 0.6123 0.6252 -0.4828
V4 -0.9285 - 0.3094 -,0.1829 -0.0932
Table 9. Analysis of variance of the data of Table 2, by using regressions with one or more than one axis
Regression with axes N. 1 12 13 14 23 24 34
Variance, s 2 26.09 21.2.2 25.67 29.51 269.50 329.05 356.29 Degrees of freedom, 4~ 19 18 18 18 18 18 18 S~ /s216 1.53 1.25 1.51 1.73 15.82 19.32 20.92
123 124 134 234 1234
23.28 17.84 26.65 324.54 17.04 17 17 17 17 16
1.37 1.05 1.56 19.05 1.0
where n is the number of variables. The regression coefficients of Eq. (2) were eval-
uated by the method of least squares. These coefficients and their standard errors are shown in Table 5: the mean standard error is 5.1%
Canonical Analysis
The canonical form of Eq. (2) is
n 2
~ / - ~ ? M = N i Bii V i 1
with n
Vi = ~1 j Pij (x j - XjM)
(3)
(4)
where V i is a generic principal axis of Eq. (2) and M is the centre of the system under study. The coefficients Bii of Eq. (3) and the parameters Pij of each principal axis V i are, respectively, the eigenvalues of the matrix of coefficients bij and the com- ponents of the corresponding eigenvectors, as shown by Davies (1956).
Table 6 shows the coordinates of M in both dimensionless and original forms and the COD reduction efficiency r/M predicted at the stationary point M.

268 M. Moresi et al.
Table 7 shows the coefficients Bii and Table 8 reports the parameters Pij of the eigenvector V i associated with each eigenvalue Bii.
The values of these factors were calculated for any given combination of the dependent variables x i and the efficiency of COD reduction ~/was calculated by usin Eqs. (3) and (4) and the coefficients Bii given in Table 7 with n ranging from 1 to 4.
Table 9 shows the analysis of variance of the data of Table 2, by taking into account one or more than one axis in Eq. (3). The significance of these models was analysed by means of an F-test.
To determine whether the variance s~ of each model of Table 9 is significantly greater than the value s~6of model 1234, we calculated the ratio s~/s~6and referred this ratio to the critical value of F with ~ and 16 degrees of freedom, respectively.
A great number of models of Table 9, except models 23, 24, 34 and 234, referred to model 1234 gave a ratio s~/s~6inferior to the corresponding critical value of the F-test at a 95% confidence level.
Usually these situations are dealt with by choosing the model with the smallest value of s~ or choosing the model with the minimal number of parameters.
Model 12 was assumed as the 'best ' model, because it had both characteristics. Model 124 with the minimal variance among the models with n=3 was discarded, because V4 is a ' temperature' factor, being highly biased by T (see Table 8), and the effect of temperature on r/was found to be negligible (see Tables 3 and 4).
Furthermore, axes V1 and V2 are associated with the most relevant eigenvalues B11 and B2: of the system under study (see Table 7).
The efficiency of COD reduction coupled to a fermentation of whey by K. fragilis IMAT 1872 can be therefore fitted by using the following expression:
77-91.29 = - 5.4079 V~- 2.1033 V] (5)
Figure 1 compares the experimental and calculated values of n : the mean standard error is 5.8% and the standard deviation is 4.6 I.
Table 8 shows that VI is highly biased by N (stirrer speed) and to a minor extent by L (lactose concentration). Therefore, V1 may be considered an 'oxygen transfer coefficient' factor, since N has a marked effect on the volumetric oxygen transfer
coefficient. Factor V2 is influenced mainly by A (air dilution ratio) and secondly by L and
T and is therefore a 'stripping' factor. The stripping of the volatile metabolites (ethanol, acetone) produced during the fermentation process can be increased by increasing the air dilution ratio. This reduces the concentration of total carbon in the culture fluid and, consequently, its COD value.
To maximize the efficiency of COD reduction, V1 and V2 have to be equal to zero. This involves the following:
T - I . 1 6 1 L + 7 . 3 3 8 A + 0 . 1 1 2 N - 8 8 . 8 4 = 0 (6) T - 0.912L - 14.662A- 0.015N + 12.77 = 0
obtained by substituting back the coefficients of V1 and V2 (see Table.8), the coordinates of S (see Table 6) and Eqs. (1). This approximation can be expected to apply only locally to the experimental design. It allows the evaluation of the

Chemical Oxygen Demand Reduction in a Whey Fermentation 269
100
s 50
-10~ / / /+10'/,
0 50 100
Calculated ,~, (*/.1
Fig. 1 Comparison between the calculated and observed efficiencies of COD reduction
new levels of two operating parameters, when the other two variables are changed in order to maintain the COD removal at the maximum value.
Discussion
The operating condition (M) associated with the maximum reduction of COD r/M is different from that (S) yielding a maximum value of biomass Ys (gram of dry cell
weight per gram of initial lactose), as shown in Table 6 of this work and in Table 6 of Moresi et al. (in press). These results are compared in Table 10.
To establish a comparison between these two conditions, M and S, it is necessary to define a relationship between the initial concentration of lactose (L) and COD
(CODo) in the culture broth, by using the data of Table 2. These data were plotted in Fig. 2 and correlated by using the method of the least squares, as follows:
COD o = 3.461 + 1.406 L (7)
with a correlation coefficient r 2 = 0.833.

270 M. Moresi et al
60
50
40
= 30
20
whey
/ /
/ /
/ /
/
0 0
�9 / /
/ /
/ /
/
/ /~ �9 ~ /
/ /
~ater-lactose / solutions
/
0 ~ / I I t
0 10 20 30 40
Lactose concentration, (g/I)
Fig. 2. COD of a typical cheese whey and its lactose concentration. The dashed line refers to puz lactose solutions
Table 10 shows the results of the fermentation of whey, when the above operatin
conditions are used and the initial COD concentration of the culture fluid is eva-
luated by using Eq. (7). These results can be explained as follows. The yeast metabolic pathway involves both aerobic and anaerobic steps. The latter can minimized, but not eliminated, by increasing the aeration and agitation levels of the
culture fluid. Small amounts of ethanol and acetone will therefore be produced by the yeast, even if a high optimal oxygenation level is used throughout the fermen-
tation. The lower biomass yield (and therefore the greater amount of volatile meta- bolites) and the greater COD removal of condition M may be due to the higher fer- mentat ion temperature with respect to condition S. In fact, an increase of tempera- ture increases the vapour pressure of each metabolite, thus atlowing an easier strip-
ping of these compounds even with a lower air flow. Condition M may be considered more remunerative than S, because a reduction
of 10% in the biomass yield is accompanied by an increase of 8.2% in the COD
Chemical Oxygen Demand Reduction in a Whey Fermentation 271
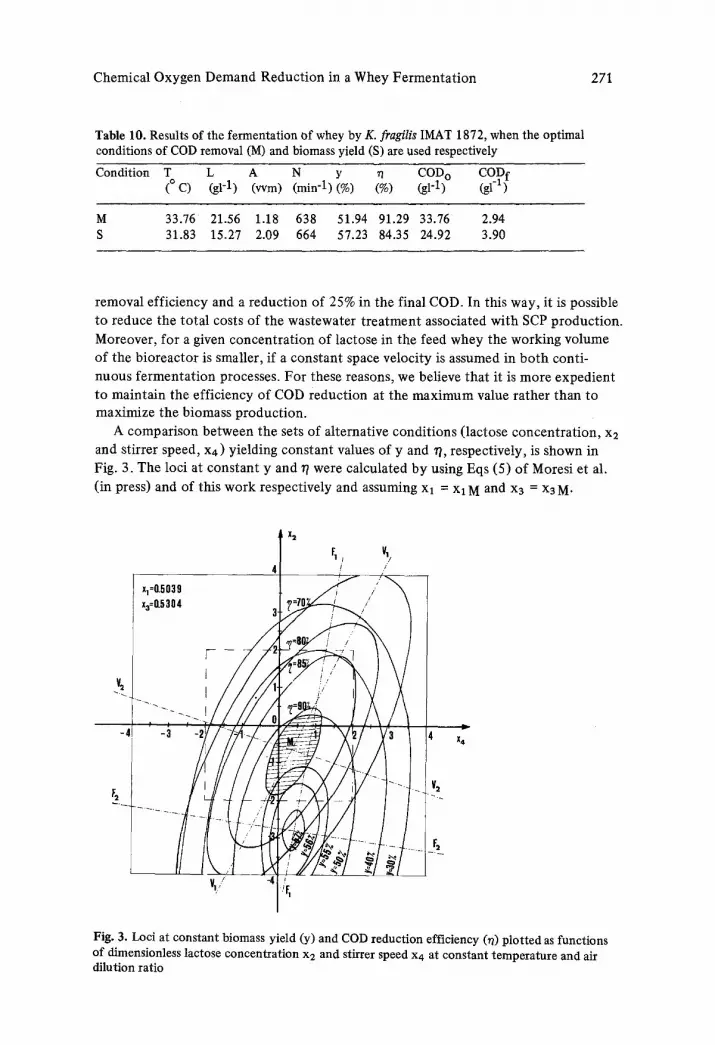
Table 10. Results of the fermentation of whey by K. fragilis IMAT 1872, when the optimal conditions of COD removal (M) and biomass yield (S) are used respectively
Condition T_ L A N y ~ COD o CODf (o C) (g1-1) (wm) (rain -1) (%) (%) (g1-1) (g1-1)
M 33.76 21.56 1 .18 638 51.94 91.29 33.76 2.94 S 31.83 15.27 2.09 664 57.23 84.35 24.92 3.90
removal efficiency and a reduction of 25% in the final COD. In this way, it is possible
to reduce the total costs of the wastewater treatment associated with SCP production.
Moreover, for a given concentration of lactose in the feed whey the working volume of the bioreactor is smaller, if a constant space velocity is assumed in both conti-
nuous fermentation processes. For these reasons, we believe that it is more expedient to maintain the efficiency of COD reduction at the maximum value rather than to maximize the biomass production.
A comparison between the sets of alternative conditions (lactose concentration, x2 and stirrer speed, x4) yielding constant values of y and r/, respectively, is shown in Fig. 3. The loci at constant y and r/were calculated by using Eqs (5) of Moresi et al.
(in press) and of this work respectively and assuming xl = xl M and x3 = x3 M.
Ix, r, , V,
41 / //
I ,
-.~ I
] - _, 1 2 _ i
V1/' ] �9 I 1:~
X4
Fig. 3. Loci at constant biomass yield (y) and COD reduction efficiency (7) plotted as functions of dimensionless lactose concentration x2 and stirrer speed x4 at constant temperature and air dilution ratio

272 M. Moresi et al
The dashed region in Fig. 3 shows the values of the operating variables x2 and x4 wi a COD removal higher than 90% and a biomass yield ranging from 50 to 56%.
The above loci can be related in the following manner:
zx c x = YG ( " zxCOD) (8)
where Ac x is the net biomass accumulation, expressed in g/l, (-zxCOD) the substrate consumption per unit volume of liquid, devoted to cell growth and expressed as g/1 of COD concentration, and YG the overall yield for cell growth.
As previously stated,
Ac x ( -A COD) (91
Y= L ;77= CODo
By back-substi tuting Eqs. (9) into Eq. (8), YG is given by:
YG = L y (10) CODo
For a large number of fermentation processes the value of YG is usually assumed be constant, but in our study YG was found to vary from .0.25-0.44 g of dried celIs/~ of COD removed and was influenced by all the mentioned experimental variables.
Parameter YG may characterize more strictly the yield of cell growth, relating the increase of cell mass concentrat ion to the decrease of total organic carbon per unit volume of fermentat ion medium. In fact, in a large number of fermentation processes i t is difficult to define firstly a main substrate because the fermentat ion medium may be a mixture of carbohydrates and secondly the increase of cell mass r gram of the main substrate as when it is completely utilized and the microorganism still grows linearly. The first applies to the fermentat ion of hydrolyzed starch slurrie
by Candida utilis. The saccharified starch is a mixture of short chain or oligoglucosi~ and can be classified according to its Content of reducing sugar, expressed as D-glucose. The biomass yield of this fermentat ion process can then be referred to th
concentrat ion of glucose by evaluating parameter y. However, the significance of y i
small because the starch conversion may be low and the oligosaccharides (e.g. dextri are not measured as reducing sugar. Their effect on y is therefore unknown and the~ are not taken into account by using this parameter.
The fermentat ion of whey by Kluyveromyces fragilis may be cited as an example of the second point. Lactose is the main substrate of this fermentat ion but the pat tern of substrate consumption shows a quick decrease during the initial stages of fei mentat ion and we have found that the concentrat ion of lactose was zero after 6 h a l oblained by Bernstein and Tzeng (1977); this prevented the evaluation of parametel
YG with respect to lactose consumed by the yeast. In conclusion, parameters YG and ~/can be used as 'objective functions ' in the
analysis and optimizat ion of a great number of SCP product ion processes from wastes (e.g. beet cane molasses, sulphite liquors, whey, forest wastes and pota to starch) as these 2 parameters incorporate information on bo th cell growth yield
and COD removal.

Chemical Oxygen Demand Reduction in a Whey Fermentat ion 273
Acknowledgements. The authors are grateful to the Italian Ministry of Public Instruction for its financial support, to Professor LauraFrontali for the use of the equipment of the Laboratories of the Istituto di Fisiologia Generale (University of Rome, Italy) and to Professor N. Blakebrough (University of Reading, Weybridge, England) for his helpful criticism.
Nomenclature
A �84
bij Bii COD L N
pij S 2
T
Vi X1
X2
X3
X4
Y YG
Air dilution ratio, l i tre/min of air per litre of liquid, w m Generic coefficient of Eq. (2) Generic eigenvalue of the matrix of coefficients bij Chemical oxygen demand, g/1 Initial lactose concentration, g/1 stirrer speed, rain -1
Direction cosine of xj and V i variance of regression Temperature, ~ Generic eigenvector of the matrix of coefficients bij Dimensionless temperature Dimensionless lactose concentration Dimensionless air dilution ratio Dimensionless stirrer speed Biomass yield, g of dried cellsfg of initial lactose Overall yield for cell growth, g of dried cells/g of COD removed
Greek letters
A Cx Net biomass accumulation, g/1 A COD COD reduction per unit volume of liquid, g/1 z/ Efficiency of COD reduction, (CODo-COD f)/CODo, dimensionless r/M Maximum efficiency of COD reduction, dimensionless ~b Degrees of freedom 02 Error variance of factorial design
Subscripts
f Final o Initial
References
Amundson C H (1967) Amer. Dairy Rev 29 : 22 ASTM Standards (1964) Industrial water: atmospheric analysis', Part 23. p 233,
D 1252-60 Bechte R M, Claydon T J (1971) J Dairy Sci 54 : 1595 Bernstein S, Tzeng C H Commercial product ion of protein by the fermentat ion of acid
and/or sweet whey. Enviromental Protection Technology Series, EPA-600/2-77-133, July 1977

274 M. Moresi et al.
Davies O L (1956) The design and analysis of industrial experiments. Imperial Chemical Industries Limited, London
Devos P (1960) French Pat No 1,213,446 Eurostat (1977) Milk and milk products, pp 36-37 Fonden R, Pettersson L (1974) XIX Int. Dairy Congress, 1 E: 816 Himmelblau D M (1970) Process analysis by statistical methods. J. Wiley, New York Moresi M, Colicchio A, Sansovini F (1979 accepted for publication) Optimization
of whey fermentation in a jar fermenter. Eur J Appl Microbiol Biotechnol in press Moresi M, Sebastiani E (1979) Eur J Appl Microbiol Biotechnol 8 : 63 Moulin G, Galzy P (1976) Ind. Aliment Agr 93 : 1337 Muller H (1976) US Pat. No 3,968,257 Robe K (1964) Food processing, Chicago 25 : 95 Soci&~ des Alcools du Vexin (2963) French Pat No 80, 198 Stimpson E.G., Young H. (1957) US pat. No 2,809,113 Tomisek J, Gregr V (1961) Kvasny Prumysl 7 : 130 Vernois G (1970) Le Lait 493-494 : 137 Wasserman A E (1960) Dairy Eng 77 : 374 Yates F (1937) Design and analysis of factorial experiments. Imperial Bureau of
Soil Science, London
Received July 27, 1979


