Embed Size (px)
Citation preview

Chemical Weathering Across APassive Margin Escarpment,
southeastern Australia
Benjamin Burke, Arjun M. HeimsathDartmouth College Earth Sciences Hanover, New Hampshire
Pardee Keynote Symposium 2004 GSA National Convention, Denver

2004 GSA Pardee Symposium, Denver2004 GSA Pardee Symposium, Denver
IntroductionIntroduction Hypothesis:Hypothesis: As a landscape is unzipped by a As a landscape is unzipped by a
propagating escarpment, chemical weatheringpropagating escarpment, chemical weatheringsignatures above and below the escarpmentsignatures above and below the escarpmentshould be different: more mature and moreshould be different: more mature and moreweathered above, less mature and lessweathered above, less mature and lessweathered below.weathered below.
Data from soil pits and borings.Data from soil pits and borings. Weathering above and below escarpmentWeathering above and below escarpment
Strain, mineral depletion, bulk weathering intensitiesStrain, mineral depletion, bulk weathering intensitiesand rates.and rates.

2004 GSA Pardee Symposium, Denver2004 GSA Pardee Symposium, Denver
LocationsLocations The Great Escarpment ofThe Great Escarpment of
southeastern Australia.southeastern Australia. 50 km50 km fr fr Pacific coast:Pacific coast: 50 km/100Ma = 500 m/Ma50 km/100Ma = 500 m/Ma Escarpment retreat rateEscarpment retreat rate……?!?! No PleistoceneNo Pleistocene glaciation glaciation No No aolian aolian depositiondeposition Minimal vegetation changesMinimal vegetation changes
““Characteristic formCharacteristic form”” of linear of lineartransport lawtransport law……
3 sites - Frog3 sites - Frog’’s Hollow (FH),s Hollow (FH),Nunnock River (NR), andNunnock River (NR), andSnugburra Snugburra (SN)(SN)

2004 GSA Pardee Symposium, Denver2004 GSA Pardee Symposium, Denver
LocationsLocationsAbove escarpment (FH)Above escarpment (FH) 500-700 mm rain annually500-700 mm rain annually Lithology:Lithology: granodiorite granodiorite.. Many tors present.Many tors present. Periglacial Periglacial effects present.effects present. FrogFrog’’s Hollow granite (s Hollow granite (AnemboAnembo
granodioritegranodiorite) ) ““texturally homogenous,texturally homogenous,””but but ““xenoliths up to 20 sq. cm.xenoliths up to 20 sq. cm.commoncommon””. (Black, 1967). (Black, 1967)
Below escarpment (NR and SN)Below escarpment (NR and SN) 800-1200 mm rain annually800-1200 mm rain annually Lithology: Lithology: granodioritegranodiorite Nunnock River granite characterized asNunnock River granite characterized as
““very homogenous,very homogenous,”” coarse grained, no coarse grained, noinclusions. (Chappell and Williams,inclusions. (Chappell and Williams,1991)1991)

2004 GSA Pardee Symposium, Denver2004 GSA Pardee Symposium, Denver
Framework for SoilFramework for SoilProductionProduction
Conceptual framework
Mass Balance Model•P = soil production•Q = transport flux
dz/dt = soil production= divergence of flux (in steady-state)

2004 GSA Pardee Symposium, Denver2004 GSA Pardee Symposium, Denver
Soil Production Across EscarpmentSoil Production Across Escarpment Determined by Heimsath etDetermined by Heimsath et
al. (1999, 2000,2004)al. (1999, 2000,2004) Lowland (NR)Lowland (NR) ε(ε(HH) = 53±3) = 53±3ee-(0.020±0.001)*H-(0.020±0.001)*H
Highland (FH)Highland (FH)ε(ε(HH) = 65±15) = 65±15ee-(0.020±0.003)*H-(0.020±0.003)*H
Different tectonic andDifferent tectonic andclimate histories, yetclimate histories, yetoverlapping soil productionoverlapping soil productionfunctionsfunctions

2004 GSA Pardee Symposium, Denver2004 GSA Pardee Symposium, Denver
FieldworkFieldwork

2004 GSA Pardee Symposium, Denver2004 GSA Pardee Symposium, Denver
DataData
Frog’s Hollow pit. View of S wall.
Nunnock River pit. View of W wall.
NRFH

2004 GSA Pardee Symposium, Denver2004 GSA Pardee Symposium, Denver

2004 GSA Pardee Symposium, Denver2004 GSA Pardee Symposium, Denver
Measuring ChemicalMeasuring ChemicalWeatheringWeathering
Two types of data:Two types of data:spatial from soil pitsspatial from soil pitsand depth from drilland depth from drillcores.cores.
Spatial data for CIA:Spatial data for CIA:
Intensity measured by ChemicalIntensity measured by ChemicalIndex of Alteration (Kirkwood &Index of Alteration (Kirkwood &Nesbitt, 1982, 1991):Nesbitt, 1982, 1991):
(Al(Al22OO33 / [Al / [Al22OO33 + Na + Na22O + O + CaO CaO ++KK22O])*100 = CIAO])*100 = CIA
Chemical weathering rateChemical weathering ratecalculation (calculation (Brimhall Brimhall et al, 1992,et al, 1992,Riebe Riebe et al., 2001, 2003):et al., 2001, 2003):
ρρsaprolitesaprolite*SPR*(1-(*SPR*(1-(ZrZrrockrock / Zr / Zr saprolitesaprolite))0.010.04
N = 25CV
0.82.7STDEV68.868.5MeanNRFH

2004 GSA Pardee Symposium, Denver2004 GSA Pardee Symposium, Denver
StrainStrain
Strain - SN B2
0.00
200.00
400.00
600.00
800.00
1000.00
1200.00
1400.00
1600.00
1800.00
2000.00
-1.50 -0.50 0.50 1.50 2.50 3.50 4.50
Volume change, ! j,w
Dep
th (
cm)
Zr
Ce
Th
Strain - SN B1
0.00
100.00
200.00
300.00
400.00
500.00
600.00
700.00
800.00
900.00
1000.00
-1.50 -0.50 0.50 1.50 2.50 3.50 4.50
Volume change, ! j,w
Dep
th (
cm)
Zr
Ce
Th
Strain - NR B1
0.00
200.00
400.00
600.00
800.00
1000.00
1200.00
1400.00
1600.00
1800.00
2000.00
-1.50 -0.50 0.50 1.50 2.50 3.50 4.50
Volume change, ! j,w
Dep
th (
cm)
Zr
Ti
Ce
Th
Strain - FH B1
0.00
200.00
400.00
600.00
800.00
1000.00
1200.00
1400.00
-1.50 -0.50 0.50 1.50 2.50 3.50 4.50
Volume change, ! j,w
Dep
th (
cm)
Zr
Ti
Ce
Th

2004 GSA Pardee Symposium, Denver2004 GSA Pardee Symposium, Denver
Elemental LossElemental Loss
Elemental Loss, NR B1
0.000
200.000
400.000
600.000
800.000
1000.000
1200.000
1400.000
1600.000
1800.000
2000.000
-1.000 -0.750 -0.500 -0.250 0.000 0.250 0.500 0.750 1.000
tau
Dep
th (
cm)
MgO tau
CaO tau
Na2O
K2O
Elemental Loss, NR B1
0.000
200.000
400.000
600.000
800.000
1000.000
1200.000
1400.000
1600.000
1800.000
2000.000
-1.000 0.000 1.000
Tau
Dep
th (
cm)
SiO2
Al2O3
Fe2O3
Elemental Loss, FH B1
0.000
200.000
400.000
600.000
800.000
1000.000
1200.000
1400.000
-1.000 -0.500 0.000 0.500 1.000
Tau
Dep
th (
cm)
SiO2 tau
Al2O3 tau
Fe2O3
Elemental Loss, FH B1
0.000
200.000
400.000
600.000
800.000
1000.000
1200.000
1400.000
-1.000 -0.500 0.000 0.500 1.000
tau
Dep
th (
cm)
MgO tau
CaO tau
Na2O
K2O

2004 GSA Pardee Symposium, Denver2004 GSA Pardee Symposium, Denver
Chemical weathering ratesChemical weathering rates
• Mass balance weathering rate calculated using Zr, sampled from top ofsaprolite.• CW rates from 2 meter pits at FH and NR were both 20.6 m/M. (n = 25)
SPR and CWR at Oz Sites
1
10
100
0 20 40 60 80 100
Sample Depth (cm)
Rate
(m
/M
y)
NRFHSNNR CWRFH CWR
SPR and CWR- Zr at Point Reyes, CA
1
10
100
0 20 40 60 80 100
Soil Column Thickness
Rate
(m
/M
y)
CWR Zr
SPR

2004 GSA Pardee Symposium, Denver2004 GSA Pardee Symposium, Denver
Intensity of WeatheringIntensity of WeatheringCIA with Depth at FH
50
250
450
650
850
1050
1250
1450
1650
58.00 60.00 62.00 64.00 66.00 68.00 70.00 72.00 74.00
CIA
Dep
th (
cm) B1
B2
B3
B4
B5
CIA with Depth at NR
50
250
450
650
850
1050
1250
1450
1650
1850
58 60 62 64 66 68 70 72 74
CIAD
ep
th (
cm)
B1
• X error bars = 1 STDEV• FH shows lower cw intensitythan NR.• FH - statistical significanceIn trends of individual borings, little in mean profile. NR - no trend. Higher cw intensity.

2004 GSA Pardee Symposium, Denver2004 GSA Pardee Symposium, Denver
Weathering and FracturesWeathering and Fractures Twidale Twidale (1982) notes the(1982) notes the
importance of fractureimportance of fracturesystems in systems in tor tor creation.creation.
Areas with tors at theAreas with tors at thesurface, therefore havesurface, therefore have““channellizedchannellized””groundwater flow -->groundwater flow -->lower bulk weatheringlower bulk weatheringintensities away fromintensities away fromthose fractures.those fractures.
We believe this is theWe believe this is thecase at FHcase at FH
Not the case at NRNot the case at NR
2004 GSA Pardee Symposium, Denver2004 GSA Pardee Symposium, Denver
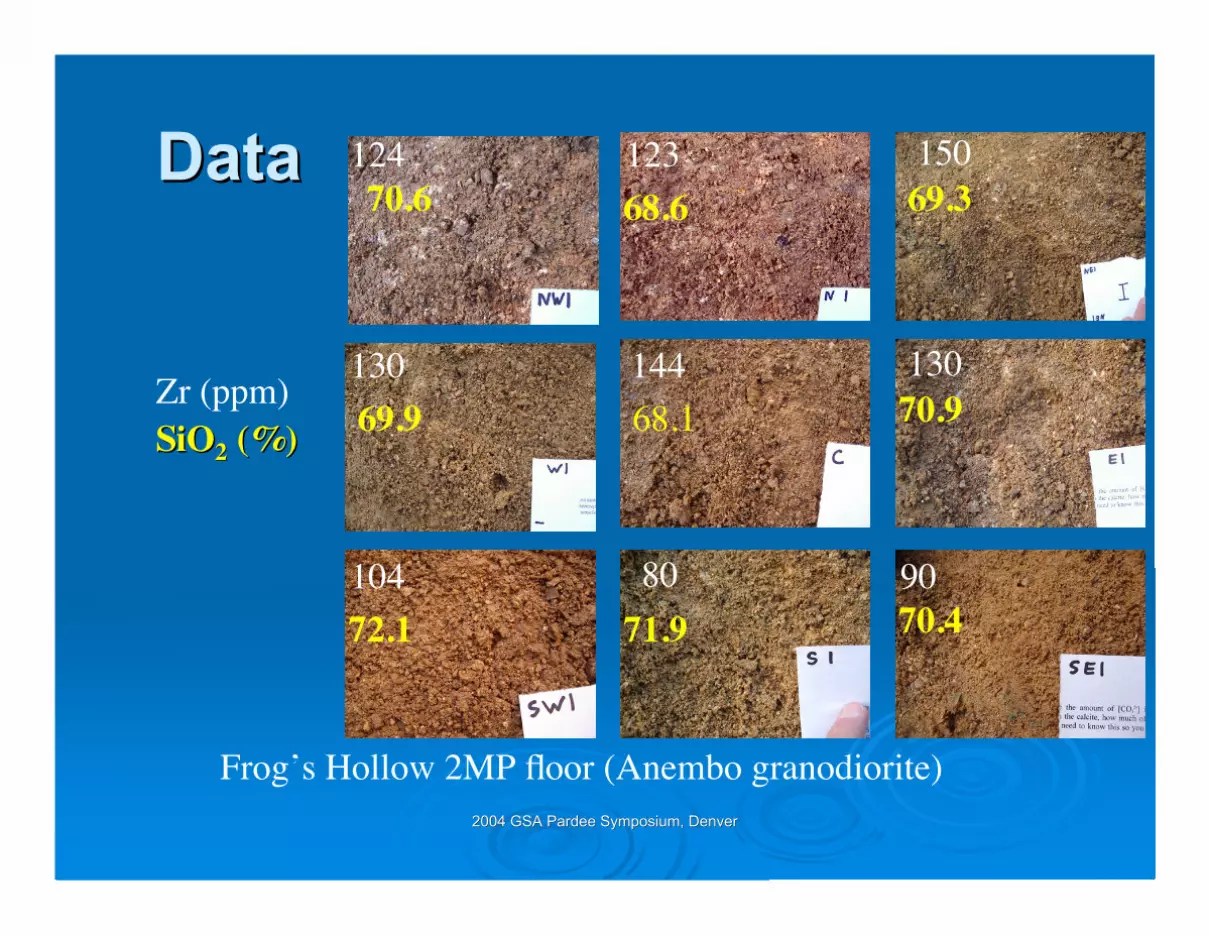
DataData 124
130
104
Zr (ppm)
80
144
123 150
130
90
SiOSiO22 (%) (%)
70.6 68.6 69.3
69.9 68.1 70.9
72.1 71.9 70.4
Frog’s Hollow 2MP floor (Anembo granodiorite)
2004 GSA Pardee Symposium, Denver2004 GSA Pardee Symposium, Denver
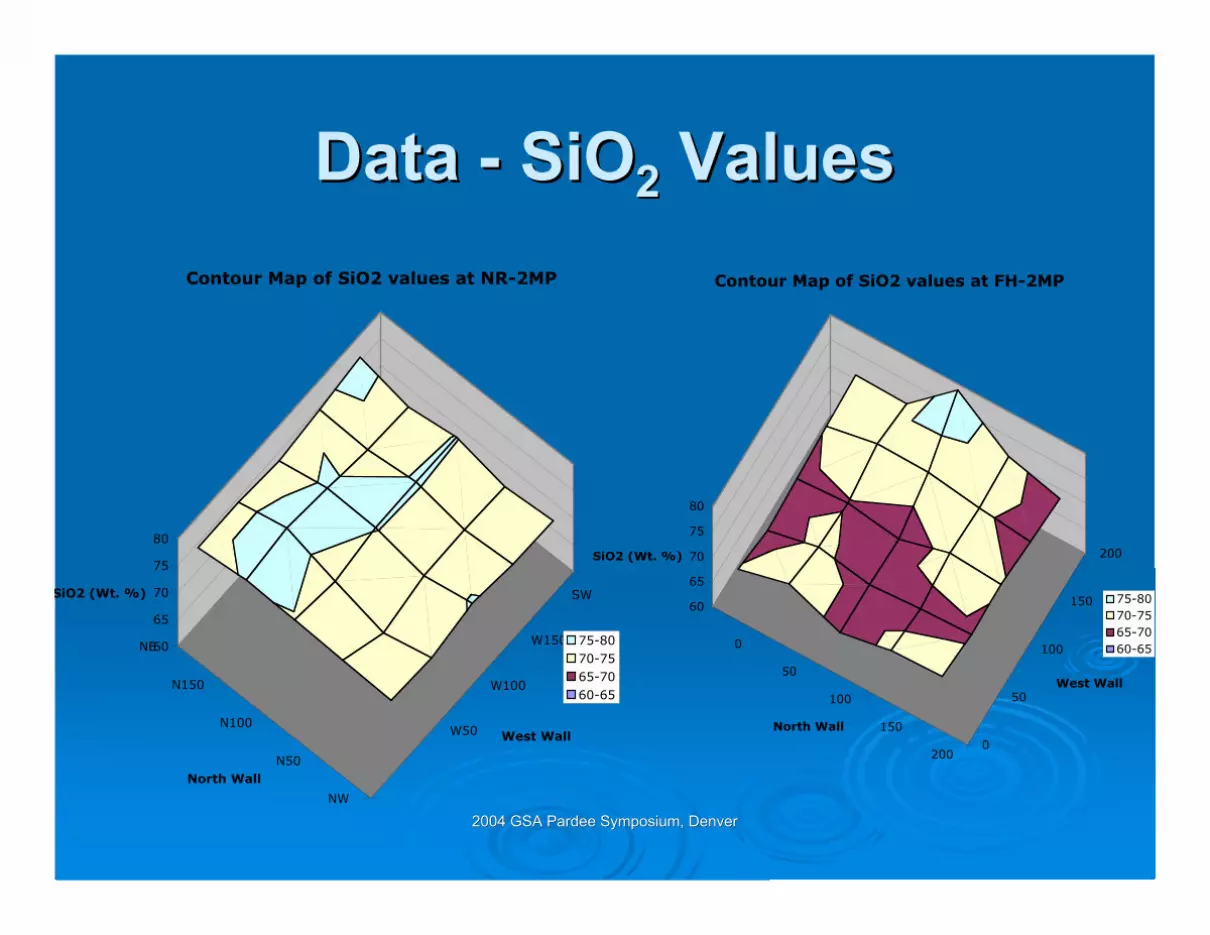
Data - SiOData - SiO22 Values Values
W50
W100
W150
SW
NW
N50
N100
N150
NE60
65
70
75
80
SiO2 (Wt. %)
West Wall
North Wall
Contour Map of SiO2 values at NR-2MP
75-8070-7565-7060-65
0
50
100
150
2000
50
100
150
200
60
65
70
75
80
SiO2 (Wt. %)
North Wall
West Wall
Contour Map of SiO2 values at FH-2MP
75-8070-7565-7060-65

2004 GSA Pardee Symposium, Denver2004 GSA Pardee Symposium, Denver
Data - CIAData - CIA
0
50
100
150
200
NW
N50
N100
N150
NE
64.0
65.0
66.0
67.0
68.0
69.0
70.0
71.0
72.0
73.0
CIA
West Wall
North Wall
Contour Display of Chemical Index of Alteration at NR-2MP
72.0-73.071.0-72.070.0-71.069.0-70.068.0-69.067.0-68.066.0-67.065.0-66.064.0-65.0
• Homogeneity of CIA at NR versus FH, cv at FH = 0.04, NR = 0.01
0
50
100
150
200
NW
N50
N100
N150
NE
64
65
66
67
68
69
70
71
72
73
CIA
West Wall
North Wall
Contour Display of Chemical Index of Alteration at FH-2MP
72-7371-7270-7169-7068-6967-6866-6765-6664-65

2004 GSA Pardee Symposium, Denver2004 GSA Pardee Symposium, Denver
ConclusionsConclusions New relationships found between cosmogenic age datesNew relationships found between cosmogenic age dates
above and below escarpment.above and below escarpment. Mineral depletion: Mineral depletion: ““MatureMature”” weathering signature weathering signature
established at FH, and not at NR. SN is a middle case.established at FH, and not at NR. SN is a middle case. Strain values are expected, including NR erroneousStrain values are expected, including NR erroneous
strain below the strain below the watertablewatertable.. Weathering intensity: signature at FH, not at NR.Weathering intensity: signature at FH, not at NR. Relation to physical weathering:Relation to physical weathering:
Chemical weathering signature differences despite lack ofChemical weathering signature differences despite lack ofvariation in soil production functions at the hillslope scale.variation in soil production functions at the hillslope scale.
Higher Higher exumation exumation rates at NR may influence higher chemicalrates at NR may influence higher chemicalweathering intensities.weathering intensities.

2004 GSA Pardee Symposium,Denver
Acknowledgements
• Dartmouth College Earth Science Department• Australian National University
– Damien Kelleher, John Chappell• National Science Foundation• Geological Society of America


