Embed Size (px)
Citation preview
Chemorheology of a Highly Filled Epoxy Compound
A. B. SPOELSTRA, G. W. M. PETERS, and H. E. H. MEIJER
Centre for Polymers and CompositesEindhoven University of Technology
5600 MB Eindhoven, The Netherlands
Based on measurements of the dynamic viscosity, a strategy is proposed to findan expression that relates the viscosity of an epoxy compound during curing, to thetemperature, shear rate, and degree of reaction. It appeared that the dynamicviscosity is a unique function of the effective shear rate (i.e. the product of frequencyand strain) over a wide range of frequencies and strains after being corrected for thetemperature. The effective shear rate dependence of the viscosity is described witha power law with an exponent that depends on the conversion. The effect oftemperature is described with an Arrhenius-type equation with conversion depen-dent parameters. Differential scanning calorimetry is applied to determine thekinetic equation that is used, in combination with the thermal history, to obtain theconversion during the rheological measurements. The description of the viscositygives a good prediction of the measured viscosity in the region between melting andgelation of the compound. The theories proposed in the literature to detect the gelpoint from dynamic experiments are examined. It is found that neither the G�-G�crossover, investigated by e.g. Tung and Dynes (1), nor the frequency-independenceof tan(�), described by Winter (2, 3), can be used to determine the gel point of thegiven material. In contrast, the curves of G� against conversion for measurementsperformed at equal strain but with different thermal histories appear to converge ata conversion of �18%, which agrees with the gel point determined through extrac-tion experiments.
INTRODUCTION
The materials studied are epoxy compounds usedfor the encapsulation of Integrated Circuits via a
transfer molding process. Highly filled epoxy resinssatisfy encapsulation requirements and are, there-fore, almost universally accepted. For mathematicalmodeling of the processing of reactive materials, oneneeds, apart from the reaction heat and the kinetics,an expression that relates viscosity to temperature,shear rate, and degree of reaction. Furthermore, thegel point, which states a no-flow condition, needs to bedetermined.
In the literature only limited information can befound concerning the effect of curing on viscosity es-pecially for highly filled (epoxy) compounds. Therefore,in this research a strategy is investigated to find therequired expression.
MATERIALS
The epoxy compound studied is a fast-curing com-mercial compound, supplied by Synres-Almoco, basedon a phenol novolac epoxy and hardener. A diglyci-dylether of tetra bromo bisphenol-A is added to im-prove the fire-resistance properties. The compound isfilled with a combination of crushed silica and quartz
for 69 wt%, resulting in a solid volume content of 50%.Further, it contains release agents, carbon black, andother common additives.
REACTION KINETICS
Strategy
For the cure reaction of thermosets, various rateexpressions have been proposed in the literature (4–6). To account for the autocatalytic curing of thermo-sets, Kamal and Sourour (6) suggested the followingexpression:
� �d�
dt� (K1 � K2�m)(1 � �)n (1)
in which n and m represent reaction orders. The rateconstants K1 and K2 depend on the temperature, ac-cording to an Arrhenius expression:
K1 � k1exp�–�E1
RT � , K2 � k2exp�–�E2
RT � (2)
where k1 and k2 are pre-exponential factors, �E1 and�E2 are activation energies, R is the gas constant andT is the absolute temperature.
2153POLYMER ENGINEERING AND SCIENCE, AUGUST 1996, Vol. 36, No. 16

For kinetic studies by means of differential scan-ning calorimetry (DSC), it is usually assumed that thetotal heat of reaction, dH, is proportional to the con-version, �, of the reactants. The reaction rate then caneasily be calculated from calorimetric measurementswith:
� �d�
dt�
1�H
dH
dt(3)
where � is the rate of reaction, � is the conversion,�H is the total heat production at complete cure anddH/dt is the differential heat flow during cure.
To study the cure kinetics by means of DSC, mea-surements can be conducted under isothermal (time-sweep) or dynamic (temperature-scan) modes [Prime(7)]. For fast curing thermosets, isothermal experi-ments are inadequate since part of the reaction al-ready takes place during heating of the sample. There-fore, in this study dynamic experiments are performedat different heating rates. By integration of Eq 3 overthe total cure-time, the heat of reaction (�H) is deter-mined. The fractional conversion �(�) is likewise cal-culated by integrating from t � 0 to t � �. In ouranalysis the trapezoidal-rule is used for numericalintegration. For each heating rate a set of data isobtained, containing T, �, and �.
The kinetic parameters k1, k2, �E1, �E2, n, and mcan be determined by fitting � to the autocatalyticfunction of � and T, see Eq 1, by a nonlinear leastsquares program. The results of all dynamic exper-iments are fitted simultaneously. First, the data arefitted to a simple nth-order reaction (k2 � 0). Accord-ingly, these results are used to initiate the programto fit to the autocatalytic expression.
With the kinetic equation obtained, it is possible topredict the reaction rate and conversion for any tem-perature-history by numerical integration. In ouranalysis a 2nd-order Runge-Kutta integration methodis used.
Experimental
DSC-measurements are carried out in a Perkin-Elmer DSC-7. Calibration of the calorimeter is con-ducted for each run, using indium (temperature, en-thalpy) and zinc (temperature). Each samplecontained 5 to 7 mg of compound, sealed in a samplepan. Measurements at constant heating rate are per-formed at 5, 10, 20, and 40°C/min, in a temperaturerange of 50 to 250°C.
Results and Discussion
The heat evolved during the reaction of the com-pound, �H, is directly determined by integration of theexothermal peaks from the DSC-measurementsshown in Fig. 1 and is found to be 60 J/g. The con-version, calculated according to the method discussedabove, is shown in Fig. 2. In Table 1 the final results ofthe fit are summarized. Since m and n are not integersit is very likely that all variables represent an averageof a number of different reactions. With the kinetic
variables obtained, the kinetic data are recalculated tocheck the fit, with satisfactory results (Fig. 3).
RHEOLOGY
Strategy
The main problem with highly filled, fast curingcompounds, is the difficulty to measure steady stateviscosities. Capillary viscometry is not possible fordifferent reasons. The most important one is that thismethod requires the same material all over the capil-
Fig. 1. Heat flow measured by DSC during cure at constantheating rate: 5, 10, 20, and 40°C/min.
Fig. 2. Calculated conversion at constant heating rate: 5, 10,20, and 40°C/min.
Table 1. Kinetic Parameters.
k1 � 6.84*105 s�1 k2 � 1.60*107 s�1
�E1 � 102 kJ/mol �E2 � 72.4 kJ/moln � 1.09 m � 0.45
A. B. Spoelstra, G. W. M. Peters, and H. E. H. Meijer
2154 POLYMER ENGINEERING AND SCIENCE, AUGUST 1996, Vol. 36, No. 16

lary tube, which is not fulfilled owing to time- andplace-dependent cure. For rotational viscometers, thesample will curl up during a steady state experimentdue to the paste-like behavior of highly filled com-pounds. As a consequence, in this study, the dynamicviscosity (�d ), with deformations restricted to smallamplitude oscillations, is measured instead of thesteady state viscosity (�s). To develop a proper viscos-ity model for flow simulations it is necessary, however,to translate the measured dynamic viscosities tosteady state viscosities.
Roller (8) reported that for some unfilled thermosetsthe Cox-Merz rule (9) can be applied for conversionsbelow the gel point:
�d(�) � �s( � �) (4)
The validity of this law also for filled systems is implic-itly assumed by different investigators. Kitano et al.(10) observed, however, that for polyethylene andpolypropylene melts filled with various solid particles,the Cox-Merz rule failed when solid volume fractionswere larger than 0.1 to 0.2. The dynamic viscositymeasured at frequency �, is lower than the steadystate viscosity measured at a shear rate � �. Apply-ing Cox-Merz would result in a too strong shear thin-ning behavior. This result is confirmed by Bigg (11)who reported that even at low strains dense suspen-sions exhibit a large strain dependency. A constitutiverelation for highly filled dispersions, a model with ayield stress described by Hookean behavior below andby a Herschel-Bulkley relation above the criticalstress, was reported by Doraiswamy et al. (12) whostudied a 70 vol% suspension of silicon in polyethyl-ene. Independently, Van den Brule (13) proposedthree similar, but more general, constitutive relationscontaining a yield stress. One of the results of thistype of constitutive model is that the dynamic viscos-ity at different strain levels may, approximately, be
made to superimpose if plotted against an effectiveshear rate, defined as the product of frequency (�) andmaximum strain (0). Furthermore, an equivalencebetween the steady state viscosity and the dynamicviscosity is predicted:
�s() � �d(�0) (5)
The experimental results, reported by Doraiswamyet al. (12), that support this prediction are only avail-able at low shear rates. In this study it is assumed,however, that Eq 5 can be applied in the total region ofinterest for process modeling, i.e. the region betweenmelting and gelation when high shear rates occur.Consequently, the dynamic viscosity will be modeledas a function of effective shear rate, temperature andconversion.
Early, simple, chemorheological models, as e.g. re-viewed by Roller (8), related viscosity (�) to time (t) andtemperature (T), but could only describe viscosity un-der isothermal conditions. The later, somewhat moresophisticated models, as, for example, the models ofTungare et al. (14) and Martin et al. (15), extendedthese equations, using an integral formulation, allow-ing the whole temperature history to be taken intoaccount. No knowledge about, or control over, theconversion (�) as a function of time (t) is assumed.Using independently measured kinetic data, �(t) canbe converted into �(�). Lipschitz (16) and Macosko (17)reported a molecular model, using a branching theory,which relates the conversion, �, to the molecularweight (Mw ). These molecular models can only be usedwhen sufficient information is available concerningthe components of the compound and the actual re-actions that occur during cure.
Unfortunately, commercial molding compoundscontain several epoxies and hardeners, and a highcontent of various additives that might affect the re-actions. Therefore, a model based on a molecularanalyses is often found to be impracticable.
Another class of models relates viscosity directly toconversion [Castro et al. (18), Frutiger (19), Manzioneet al. (20)]. In these models, an Arrhenius type oftemperature dependency is assumed with two adjust-able parameters. The models differ in their treatmentof this curing dependency but all assume that it canbe separated from the temperature dependency. Fur-thermore, these models do not include a shear ratedependency. For filled systems, however, pronouncedshear thinning has been observed, by, for example,Macosko et al. (17).
The nonlinear behavior of the viscosity as a functionof the shear rate can often be described by means of apower law. We use such an expression to model theeffective shear rate dependence. Temperature depen-dence is described by an Arrhenius equation, and,therefore, the following expression for the dynamicviscosity is adopted:
�(T, �0) � �0eE�/RT�(�0)n (6)
Fig. 3. Experimental data (symbols) and calculated reactionrate (full line); heating rates: 5, 10, 20, and 40°C/min.
Chemorheology of a Highly Filled Epoxy Compound
2155POLYMER ENGINEERING AND SCIENCE, AUGUST 1996, Vol. 36, No. 16

The material parameters, �0, E�, and n, represent thepre-exponential factor, the flow activation energy andthe power law exponent, respectively. In case of react-ing materials, these material parameters will be, ingeneral, a function of the conversion. Thus, Eq 6 iswritten as:
�(�, T, �0) � �0(�)�eE�(�)/RT�(�0)n(�) (7)
The dynamic viscosity is measured at different heat-ing rates and various frequencies and strains, produc-ing a set of data containing viscosity, temperature,frequency, strain, and time. With the measured ther-mal history, and using the kinetic equation, obtainedfrom the dynamic DSC-experiments, the conversion ateach time can be calculated. Accordingly, the materialparameters are determined as a function of conver-sion by analyzing the data at equal conversion.
Experimental
Dynamic viscosity measurements are performed on aRheometrics Mechanical Spectrometer (RDS II), using a25-mm-diameter plate-plate geometry. Pellets of thecompound are ground into a fine powder, and, subse-quently, pressed into 25 mm diameter discs with aheight of 1.2 mm. Care is taken not to heat the sampleduring milling. The pressure used is such that, in thefinal discs, a specific weight of 1.7 g/cm3 is obtained,equal to the density of the preforms used in the encap-sulation process. This proved to be rather importantsince the density has a large influence on the valuesmeasured for the dynamic viscosity. The viscosities aremeasured at constant heating rates of 2, 5, 10, and20°C/min at various frequencies and strains.
Results and Discussion
In Fig. 4 the dynamic viscosity is plotted vs. temper-ature, measured at a heating rate of 2°C/min, a max-
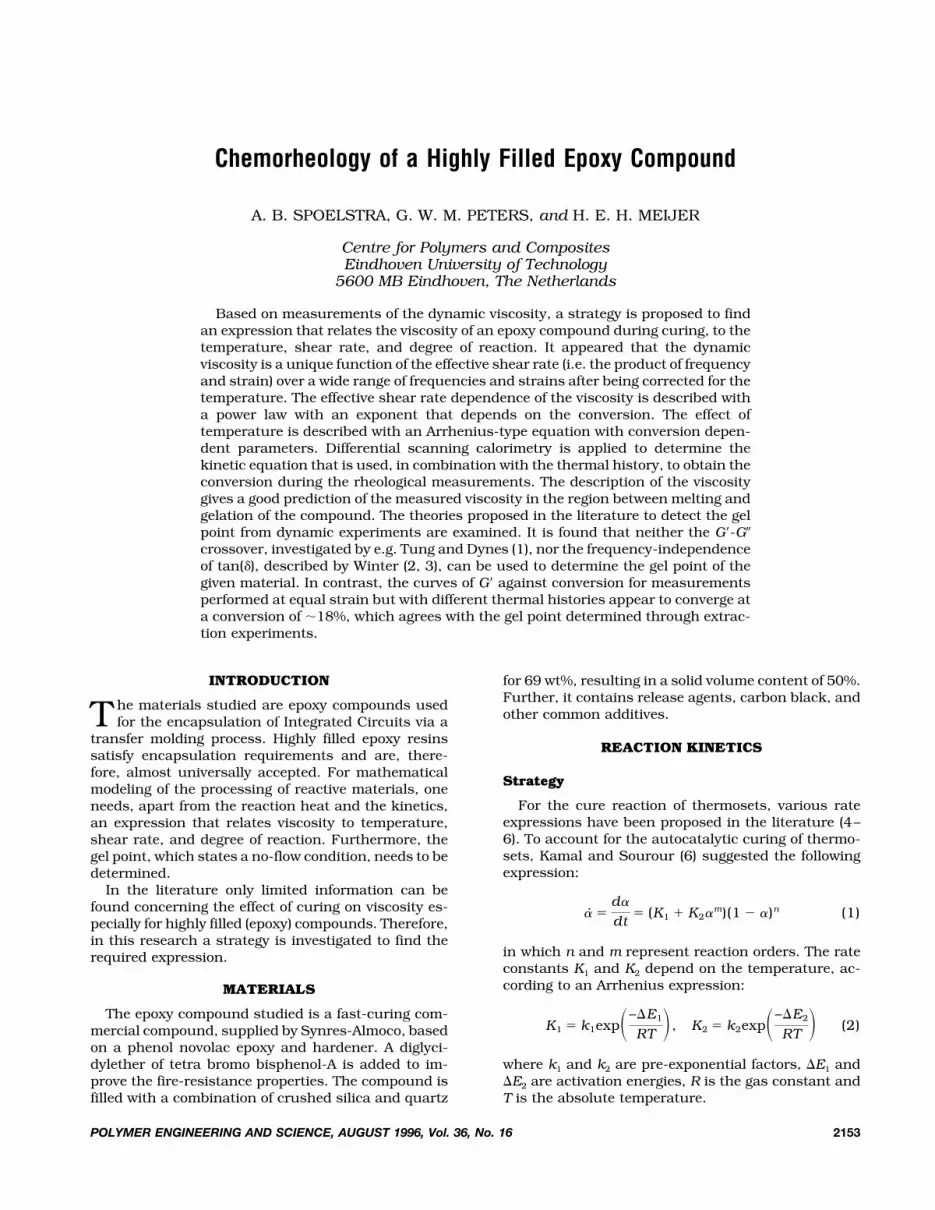
imum strain of 0.25% and frequencies of 1, 10, and100 rad/s. In Fig. 5 the dynamic viscosity is plotted asa function of temperature, at 20°C/min, 100 rad/s,and strains of 0.25 and 1%. It is clear that the materialnot only shows a frequency dependence but also apronounced strain dependence. At a heating rate of5°C/min, experiments are performed at various fre-quencies and strains, to determine whether the mate-rial follows the predictions of the model of Do-raiswamy et al. (12), implying that curves with thesame effective shear rate superimpose. In Fig. 6 thedynamic viscosity is plotted against temperature forconstant effective shear rate (�0), and indeed, thedata for each effective shear rate form a single mastercurve, in the range between melting and gelation. It isimportant to note that other predictions of the consti-tutive model, as proposed by Doraiswamy et al. (12),are not fulfilled. For example, the phase shift � shouldbe a function of the imposed strain: � � cos�1[1 �(2c/0], where c is the strain at yielding. This is notconfirmed for the material under consideration.
Using the kinetic equation obtained in section 2.2,at each point of the �(T, �0, T ) curves the conversioncan be calculated, and points of equal conversion canbe determined. In Fig. 7 the results are shown for theexperiments performed at a heating rate of 5°C/min.Over a range of conversions, the dynamic viscosity isplotted against the effective shear rate in Fig. 8. Theslope of the isoconversion lines in the double logarith-mic plot provides the value of the power law exponentfrom Eq 7. It is clear that the exponent is not a con-stant, since it decreases with conversion. The powerlaw exponent is determined as a function of the con-version at each heating rate, see Fig. 9. The differ-ences, due to different heating rates, are neglectedand a third order polynomial is fitted on the averagevalues to obtain a description of the power law expo-nent as a function of the conversion, see Table 2.
Fig. 4. Dynamic viscosity as a function of temperature, mea-sured at a heating rate of 2°C/min, 0 � 0.25%, and � � 1, 10,and 100 rad/s.
Fig. 5. Dynamic viscosity measured as a function of temper-ature, at a heating rate of 20°C/min, � � 100 rad/s and 0 �0.25 (�) and 1% (�).
A. B. Spoelstra, G. W. M. Peters, and H. E. H. Meijer
2156 POLYMER ENGINEERING AND SCIENCE, AUGUST 1996, Vol. 36, No. 16
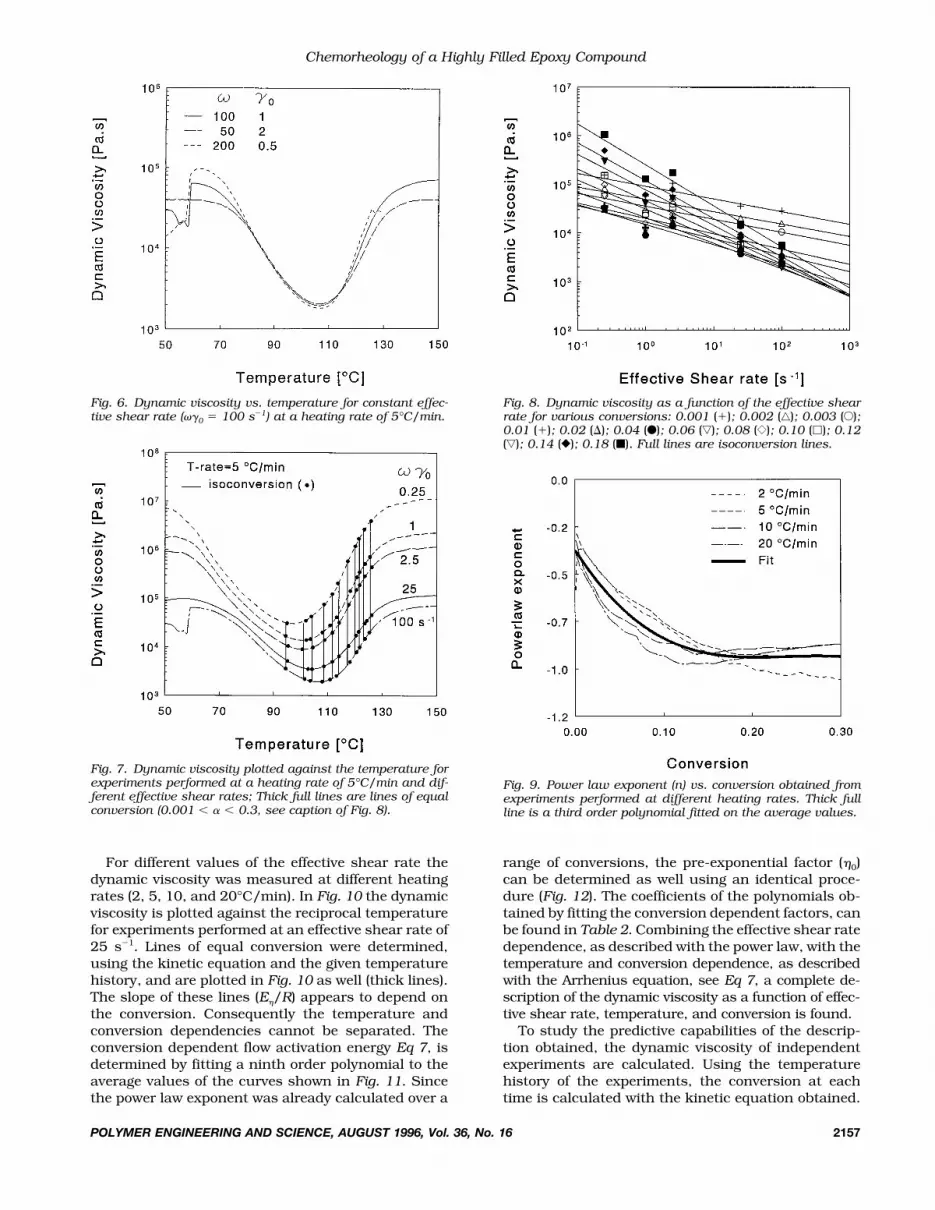
For different values of the effective shear rate thedynamic viscosity was measured at different heatingrates (2, 5, 10, and 20°C/min). In Fig. 10 the dynamicviscosity is plotted against the reciprocal temperaturefor experiments performed at an effective shear rate of25 s�1. Lines of equal conversion were determined,using the kinetic equation and the given temperaturehistory, and are plotted in Fig. 10 as well (thick lines).The slope of these lines (E�/R) appears to depend onthe conversion. Consequently the temperature andconversion dependencies cannot be separated. Theconversion dependent flow activation energy Eq 7, isdetermined by fitting a ninth order polynomial to theaverage values of the curves shown in Fig. 11. Sincethe power law exponent was already calculated over a
range of conversions, the pre-exponential factor (�0)can be determined as well using an identical proce-dure (Fig. 12). The coefficients of the polynomials ob-tained by fitting the conversion dependent factors, canbe found in Table 2. Combining the effective shear ratedependence, as described with the power law, with thetemperature and conversion dependence, as describedwith the Arrhenius equation, see Eq 7, a complete de-scription of the dynamic viscosity as a function of effec-tive shear rate, temperature, and conversion is found.
To study the predictive capabilities of the descrip-tion obtained, the dynamic viscosity of independentexperiments are calculated. Using the temperaturehistory of the experiments, the conversion at eachtime is calculated with the kinetic equation obtained.
Fig. 6. Dynamic viscosity vs. temperature for constant effec-tive shear rate (�0 � 100 s�1) at a heating rate of 5°C/min.
Fig. 7. Dynamic viscosity plotted against the temperature forexperiments performed at a heating rate of 5°C/min and dif-ferent effective shear rates; Thick full lines are lines of equalconversion (0.001 � � � 0.3, see caption of Fig. 8).
Fig. 8. Dynamic viscosity as a function of the effective shearrate for various conversions: 0.001 (�); 0.002 (Ç); 0.003 (E);0.01 (�); 0.02 (�); 0.04 (F); 0.06 (É); 0.08 ({); 0.10 (�); 0.12(É); 0.14 (}); 0.18 (■). Full lines are isoconversion lines.
Fig. 9. Power law exponent (n) vs. conversion obtained fromexperiments performed at different heating rates. Thick fullline is a third order polynomial fitted on the average values.
Chemorheology of a Highly Filled Epoxy Compound
2157POLYMER ENGINEERING AND SCIENCE, AUGUST 1996, Vol. 36, No. 16

The calculation of the dynamic viscosity is startedafter melting and before gelation of the material (�gel �0.18, see below). The measured viscosity is comparedwith the calculated viscosity in Fig. 13, and agreeswell.
GEL POINT
Theory
Gelation is of critical importance in the processingof thermosets, since beyond this point the polymerdoes not flow and is, consequently, no longer process-able. Gelation does not inhibit the curing kinetics and,therefore, cannot be detected by techniques that areonly sensitive to the chemical reaction, such as DSC.The gel point is defined by the conversion at which aninfinite molecular network is formed. Prior to gelation,the polymer is soluble, but after gelation both soluble(sol fraction) and insoluble (gel fraction) materials arepresent [Bidstrup (21)].
As a result of the infinite molecular network formed,the steady state viscosity would become infinite at the
gel point. The dynamic viscosity per definition neverbecomes infinite, however, even after gelation. In theliterature various methods have been proposed to de-termine the gel point, for unfilled amorphous poly-mers, from dynamic measurements. Tung and Dynes(1) suggested that the G�-G� crossover point corre-sponds to the gel point. Winter et al. (2, 3), however,argued that the correspondence is only valid for alimited class of network polymers. Different classesare distinguished by their stress relaxation behaviornear the gel point. As a consequence, Chambon andWinter (22) proposed a general method for detectinggelation from dynamic experiments. According to thistheory, tan(�) is independent of the frequency at gela-tion, the gel point may be determined by performingexperiments at different frequencies. Another methodfor detecting the gel point from dynamic experimentsis proposed by Harran et al. (23). They found thatgelation may be detected by the appearance of ashoulder in the G� curve. Further, they observed thatthe position of this shoulder is not influenced by fre-quency or strain, supporting the statement of Winter.
In the following, the gel point is determined first bymeasuring the soluble fraction of samples with a dif-
Table 2. Coefficients of Polynomial Fits on the Parameters E�(�), ln �0(�) and n(�) in the Viscosity Model.
P(�)�c0 � c1� � c2�2 � c3�3 � c4�4 � c5�5 � c6�6 � c7�7 � c8�8 � c9�9
coefficients E� ln �0 n
c9 –2.8944736e�11 7.7970068e�08 0c8 3.85088790e�11 –1.0439793e�09 0c7 –2.1489223e�11 5.8797321e�08 0c6 6.6218237e�10 –1.8352803e�08 0c5 –1.2642624e�10 3.5610406e�07 0c4 1.6141442e�09 –4.6181142e�06 0c3 –1.4453929e�08 4.1683219e�05 –4.2140983e�01c2 9.0527915e�06 –2.6059090e�04 3.0273505e�01c1 –4.2472636e�05 1.2246353e�03 –7.1070750e�00c0 1.7367610e�04 –3.7808040e�01 –3.5431100e�01
Fig. 10. Dynamic viscosity plotted vs. the reciprocal tempera-ture, for experiments performed at 0 � 0.25%, and � � 100rad/s and different heating rates (2, 5, 10, 20°C/min); Thickfull lines are lines of equal conversion.
Fig. 11. Flow activation energy vs. conversion, obtained fromexperiments performed at different effective shear rates. Thickfull line: ninth order polynomial fit on the average values.
A. B. Spoelstra, G. W. M. Peters, and H. E. H. Meijer
2158 POLYMER ENGINEERING AND SCIENCE, AUGUST 1996, Vol. 36, No. 16

ferent degree of cure. The conversion of these samplesis determined by measuring the heat of reaction left,using DSC. Next, the theories proposed in literature todetermine the gel point from rheological measure-ments are examined.
Soxhlet Extraction
The amount of sol fraction can be determinedthrough extraction. When the sample is merged into asuitable solvent, all finite molecules will dissolve anddiffuse out of the sample. By applying Soxhlet extrac-tion, the solvent is exchanged continuously and even-tually no sol fraction will remain. Samples are pre-pared by curing small amounts of compound on ametal plate in an oven at 90°C for various times. The
reaction is stopped by quenching. A small amount ofthese samples are fully cured in the DSC to determinethe degree of reaction. Following the procedure of Bid-strup (21), cellulose thimbles are extracted for 72 h intetrahydrofuran and then dried under vacuum. Thesamples with various curing times are placed in apre-extracted thimble and extracted in tetrahydrofu-ran for 96 h and dried under vacuum until no furtherweight loss can be detected. The weight fraction ofsoluble components (Ws) is calculated as follows:
Ws �Wbefore extraction � Wafter extraction
Wbefore extraction(8)
In Fig. 14 the soluble fraction of the samples, curedfor different times, are shown as a function of theconversion, as determined with DSC-experiments. Inthe pre-gel region, all molecules are finite and dissolveduring extraction. The value for the soluble fraction of33 wt%, measured in this region, is in reasonableagreement with the fact that, according to the specifi-cations of the compound, 69 wt% of the compoundconsists of insoluble silica. In the post-gel stage, thesoluble fraction decreases with conversion until nomore solubles are present. Samples were preparedwith a conversion around the point of gelation untilthe difference in conversion of the last pre-gel sampleand the first post-gel sample is less than 5%. The gelpoint is then defined as the average of the conversionof these two samples, and is found to be located at aconversion of 0.18.
Viscoelastic Properties Near the Gel Point
To examine if the theories, proposed in the litera-ture to detect the gel point from dynamic experiments,hold for the material under consideration, the dy-namic viscosity is studied. Tung and Dynes (1) sug-gested that the G�-G� crossover corresponds to the gel
Fig. 12. Pre-exponential factor vs. conversion, obtained fromexperiments performed at different effective shear rates. Thickfull line: ninth order polynomial fit on the average values.
Fig. 13. Independent data on the dynamic viscosity vs. tem-perature, for a heating rate of 2°C/min, 0 � 0.25%, and � �1, 10, and 100 rad/s; (--): measured, (-): predicted.
Fig. 14. Soluble fraction of samples cured for different timesplotted against the conversion.
Chemorheology of a Highly Filled Epoxy Compound
2159POLYMER ENGINEERING AND SCIENCE, AUGUST 1996, Vol. 36, No. 16
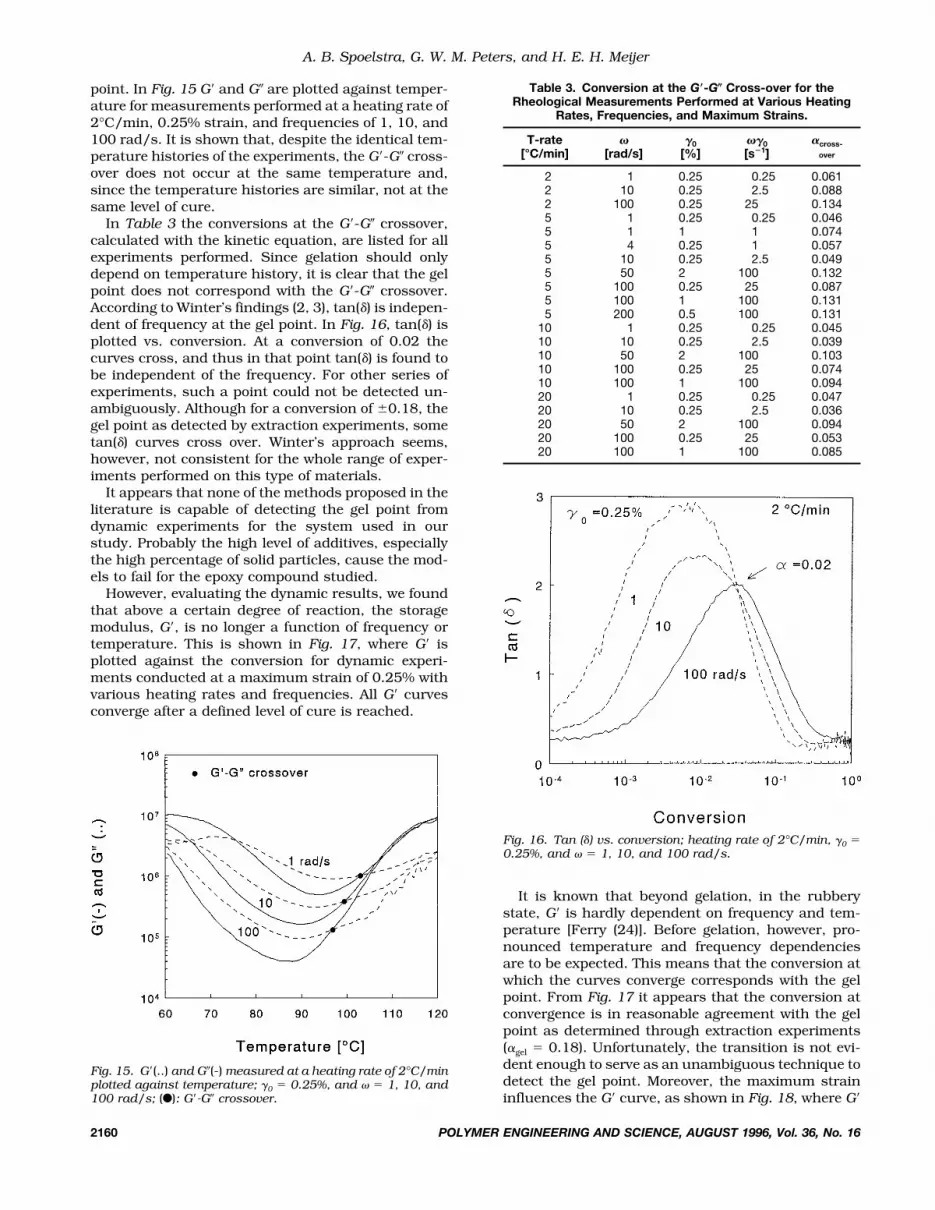
point. In Fig. 15 G� and G� are plotted against temper-ature for measurements performed at a heating rate of2°C/min, 0.25% strain, and frequencies of 1, 10, and100 rad/s. It is shown that, despite the identical tem-perature histories of the experiments, the G�-G� cross-over does not occur at the same temperature and,since the temperature histories are similar, not at thesame level of cure.
In Table 3 the conversions at the G�-G� crossover,calculated with the kinetic equation, are listed for allexperiments performed. Since gelation should onlydepend on temperature history, it is clear that the gelpoint does not correspond with the G�-G� crossover.According to Winter’s findings (2, 3), tan(�) is indepen-dent of frequency at the gel point. In Fig. 16, tan(�) isplotted vs. conversion. At a conversion of 0.02 thecurves cross, and thus in that point tan(�) is found tobe independent of the frequency. For other series ofexperiments, such a point could not be detected un-ambiguously. Although for a conversion of 0.18, thegel point as detected by extraction experiments, sometan(�) curves cross over. Winter’s approach seems,however, not consistent for the whole range of exper-iments performed on this type of materials.
It appears that none of the methods proposed in theliterature is capable of detecting the gel point fromdynamic experiments for the system used in ourstudy. Probably the high level of additives, especiallythe high percentage of solid particles, cause the mod-els to fail for the epoxy compound studied.
However, evaluating the dynamic results, we foundthat above a certain degree of reaction, the storagemodulus, G�, is no longer a function of frequency ortemperature. This is shown in Fig. 17, where G� isplotted against the conversion for dynamic experi-ments conducted at a maximum strain of 0.25% withvarious heating rates and frequencies. All G� curvesconverge after a defined level of cure is reached.
It is known that beyond gelation, in the rubberystate, G� is hardly dependent on frequency and tem-perature [Ferry (24)]. Before gelation, however, pro-nounced temperature and frequency dependenciesare to be expected. This means that the conversion atwhich the curves converge corresponds with the gelpoint. From Fig. 17 it appears that the conversion atconvergence is in reasonable agreement with the gelpoint as determined through extraction experiments(�gel � 0.18). Unfortunately, the transition is not evi-dent enough to serve as an unambiguous technique todetect the gel point. Moreover, the maximum straininfluences the G� curve, as shown in Fig. 18, where G�
Fig. 15. G�(..) and G�(-) measured at a heating rate of 2°C/minplotted against temperature; 0 � 0.25%, and � � 1, 10, and100 rad/s; (F): G�-G� crossover.
Table 3. Conversion at the G�-G� Cross-over for theRheological Measurements Performed at Various Heating
Rates, Frequencies, and Maximum Strains.
T-rate[°C/min]
�[rad/s]
�0[%]
��0[s�1]
�cross-over
2 1 0.25 0.25 0.0612 10 0.25 2.5 0.0882 100 0.25 25 0.1345 1 0.25 0.25 0.0465 1 1 1 0.0745 4 0.25 1 0.0575 10 0.25 2.5 0.0495 50 2 100 0.1325 100 0.25 25 0.0875 100 1 100 0.1315 200 0.5 100 0.131
10 1 0.25 0.25 0.04510 10 0.25 2.5 0.03910 50 2 100 0.10310 100 0.25 25 0.07410 100 1 100 0.09420 1 0.25 0.25 0.04720 10 0.25 2.5 0.03620 50 2 100 0.09420 100 0.25 25 0.05320 100 1 100 0.085
Fig. 16. Tan (�) vs. conversion; heating rate of 2°C/min, 0 �0.25%, and � � 1, 10, and 100 rad/s.
A. B. Spoelstra, G. W. M. Peters, and H. E. H. Meijer
2160 POLYMER ENGINEERING AND SCIENCE, AUGUST 1996, Vol. 36, No. 16

is plotted against conversion for experiments per-formed at different strains. The strain dependencyillustrates the nonlinear behavior of this crosslinkedsystem.
CONCLUSION
A procedure is proposed to find an expression relat-ing the viscosity of a complex epoxy compound duringcure, to the temperature, shear rate, and degree ofreaction. It appeared that at a constant value of theeffective shear rate (i.e. the product of frequency andstrain) the dynamic viscosity is identical over a widerange of frequencies, strains, and temperatures. Theeffective shear rate dependence of the viscosity is de-scribed with a power law with an exponent that de-pends on the conversion. The effect of temperature is
described with an Arrhenius-type equation with con-version dependent parameters. Differential scanningcalorimetry is applied to determine the kinetic equa-tion, which is used in combination with the thermalhistory to obtain the conversion during the rheologicalmeasurements. The description of the viscosity gives agood prediction of the measured viscosity in the regionbetween melting and gelation of the compound.
The gel point of the highly filled epoxy system isstudied using extraction experiments, and by exam-ining the viscoelastic properties near the gel point. Inthe theories proposed in the literature to detect the gelpoint from dynamic experiments, it is observed thatneither the G�-G� crossover nor the frequency-inde-pendency of the loss angle tan(�) can be used to de-termine the gel point of the system studied. This couldbe due to the high filling content of solid additives inthis compound. However, the curves of G� againstconversion for measurements performed at an equalmaximum strain appear to converge after a conver-sion is reached of �0.18, which agrees with the gelpoint determined through extraction experiments.
In this study it is assumed that in the region ofinterest of process modeling, i.e. the region betweenmelting and gelation of the epoxy compound, anequivalence exists between the steady state viscosity�s() and the dynamic viscosity �d(�0). This assump-tion can be validated by using the obtained viscositymodel in a numerical simulation of flows that can becompared with experimental results. Such a studywas done by Peters et al. (25). They found that thebehavior of this material is even more complex thanthe dynamical measurements show. From this com-bined numerical/experimental study, it appeared thatthe material already behaved as if it was gelled at aconversion level of 0.03. As this gelling was only seenin flow visualization experiments and not in DSC,DMTA, or extraction experiments, it was called a rheo-logical gelpoint, to contrast with the clearly foundchemical gelpoint.
NOMENCLATURE
Reaction Kinetics
E1, E2 � Activation energies.�H � Total heat production during cure.
K1, K2 � Rate constants.k1, k2 � Pre-exponential factors.
Mw � Molecular weight.m, n � Reaction orders.
R � Gas constant.T � Temperature.t � Time.
� � Conversion.� � Conversion rate.
Rheology
E� � Flow activation energy.G� � Storage modulus.G� � Loss modulus.
Fig. 17. G� vs. the conversion for dynamic experiments per-formed at 0 � 0.25%, and at various combinations of frequen-cies and heating rates.
Fig. 18. G� vs. conversion for dynamic experiments performedat 0 � 0.25% (..) and 1% (-).
Chemorheology of a Highly Filled Epoxy Compound
2161POLYMER ENGINEERING AND SCIENCE, AUGUST 1996, Vol. 36, No. 16

n � Powerlaw exponent.T � Temperature rate.� � Phase shift.� � Viscosity.
�0 � Pre-exponential factor.�d � Dynamic viscosity.�s � Steady state viscosity. � Strain.
0 � Maximum strain.c � Strain at yielding. � Strain rate.� � Frequency.
REFERENCES
1. C. Y. M. Tung and P. J. Dynes, J. Appl. Polym. Sci., 27,569 (1982).
2. H. H. Winter, SPE ANTEC Tech. Papers, 33, 300 (1987).3. H. H. Winter and F. Chambon, J. Rheol., 30, 367 (1986).4. A. Hale, M. Garcia, C. W. Macosko, and L. T. Manzione,
SPE ANTEC Tech. Papers, 35, 796 (1989).5. T. H. Hsieh and A. C. Su, J. Appl. Polym. Sci., 41, 1271
(1990).6. M. R. Kamal and S. Sourour, Polym. Eng. Sci., 13, 59
(1973).7. R. B. Prime, Thermal Characterization of Polymeric Mate-
rials, E. A. Turi, ed., Academic Press, New York (1981).8. M. B. Roller, Polym. Eng. Sci., 26, 432 (1986).9. W. P. Cox and E. H. Merz, J. Polym. Sci., 28, 619 (1958).
10. T. Kitano, T. Nishamura, T. Kataoka, and T. Sakai,Rheol. Acta, 19, 671 (1980).
11. D. M. Bigg, Polym. Eng. Sci, 23, 206 (1983).12. D. Doraiswamy, I.-L. Tsao, S. C. Danforth, A. N. Beris,
and A. B. Metzner, Proc. Xth Int. Congress on Rheology,1, 300 (1988).
13. B. J. van den Brule, J. F. Dijksman, and P. J. Zander,Rheol. Acta, 26, 186 (1988).
14. A. V. Tungare, G. C. Martin, and J. T. Gotro, Polym. Eng.Sci., 28, 1071 (1989).
15. G. C. Martin, A. V. Tungare, and J. T. Gotro, Polym. Eng.Sci., 29, 1279 (1989).
16. S. D. Lipschitz and C. W. Macosko, Polym. Eng. Sci., 16,803 (1976).
17. C. W. Macosko, Brit. Polym., 17, 239 (1985).18. J. M. Castro and C. W. Macosko, SPE ANTEC Tech. Pa-
pers, 26, 434 (1980).19. R. L. Frutiger, Polym. Eng. Sci., 26, 243 (1986).20. L. T. Manzione, G. W. Poelzing, and R. C. Progelhof,
Polym. Eng. Sci., 28, 1056 (1988).21. S. A. Bidstrup, PhD thesis, Univ. Minnesota (1986).22. F. Chambon and H. H. Winter, J. Rheol., 31, 683 (1987).23. D. Harran, A. C. Senhaji, and G. Marin, Proc. Xth Int.
Congress on Rheology, 1, 300 (1988).24. J. D. Ferry, Viscoelastic Properties of Polymers, John
Wiley & Sons, New York (1978).25. G. W. M. Peters, A. B. Spoelstra, M. H. H. Meuwissen, R.
Corbey, and H. E. H. Meijer, Topics in Applied Mechanics,pp. 331–38, J. F. Dijksman and F. T. M. Nieuwstadt,eds., Kluwer Academic Publishers, The Netherlands(1993).
Revision received December 1995
A. B. Spoelstra, G. W. M. Peters, and H. E. H. Meijer
2162 POLYMER ENGINEERING AND SCIENCE, AUGUST 1996, Vol. 36, No. 16


